| | |
| UNITED STATES
SECURITIES AND EXCHANGE COMMISSION |
| | |
| CERTIFIED SHAREHOLDER REPORT OF REGISTERED
MANAGEMENT INVESTMENT COMPANIES
|
| | |
| Investment Company Act file number: | (811-00058) |
| | |
| Exact name of registrant as specified in charter: | The George Putnam Fund of Boston |
| | |
| Address of principal executive offices: | One Post Office Square, Boston, Massachusetts 02109 |
| | |
| Name and address of agent for service: | Robert T. Burns, Vice President
One Post Office Square
Boston, Massachusetts 02109 |
| | |
| Copy to: | John W. Gerstmayr, Esq.
Ropes & Gray LLP
800 Boylston Street
Boston, Massachusetts 02199-3600 |
| | |
| Registrant’s telephone number, including area code: | (617) 292-1000 |
| | |
| Date of fiscal year end: | July 31, 2012 |
| | |
| Date of reporting period: | August 1, 2011 — January 31, 2012 |
| | |
|
Item 1. Report to Stockholders: | |
| | |
| The following is a copy of the report transmitted to stockholders pursuant to Rule 30e-1 under the Investment Company Act of 1940: | |
George Putnam
Balanced
Fund
Semiannual report
1 | 31 | 12
| | | |
| Message from the Trustees | 1 | | |
| | |
| About the fund | 2 | | |
| | |
| Performance snapshot | 4 | | |
| | |
| Interview with your fund’s portfolio managers | 5 | | |
| | |
| Your fund’s performance | 10 | | |
| | |
| Your fund’s expenses | 12 | | |
| | |
| Terms and definitions | 14 | | |
| | |
| Other information for shareholders | 15 | | |
| | |
| Financial statements | 16 | | |
| | |
Message from the Trustees
Dear Fellow Shareholder:
Markets in early 2012 have signaled a more consistently positive direction, supported by strengthening fundamentals. In the United States, where corporate earnings have been strong for more than a year, the employment picture has also brightened in recent months. The Federal Reserve has pledged to leave rates at historic lows at least through the end of 2014, and the beleaguered U.S. housing market has finally shown signs of recovery. The European debt situation and likely recession in that region continue to weigh heavily on markets, of course, alongside high unemployment here at home. However, we are encouraged by the change in investor sentiment.
We believe there are numerous investment opportunities resulting from the many market dislocations in recent years. Putnam’s rigorous bottom-up, fundamental investment approach is well suited to this environment, and the Putnam team is committed to uncovering returns for our shareholders, while seeking to guard against downside risk.
Please join us in welcoming the return of Elizabeth T. Kennan to the Board of Trustees. Dr. Kennan, who served as a Trustee from 1992 until 2010, has rejoined the Board, effective January 1, 2012. Dr. Kennan is a Partner of Cambus-Kenneth Farm (thoroughbred horse breeding and general farming), and is also President Emeritus of Mount Holyoke College.
We would also like to take this opportunity to welcome new shareholders to the fund and to thank all of our investors for your continued confidence in Putnam.

About the fund
Providing the benefits of balanced investing since 1937
The fund launched in 1937 when George Putnam, a Boston investment manager, decided to introduce an innovative approach — a balance of stocks to seek capital appreciation and bonds to help provide current income. The original portfolio featured industrial stocks and railroad bonds.
This balanced approach made sense then, and we believe it continues to make sense now. In the late 1930s, the stock market experienced dramatic swings as businesses struggled to recover from the Great Depression and the shadow of war began to spread across Europe and Asia. Today, economic uncertainties continue to challenge investors.
Although the fund has experienced volatility at times, its balanced approach has kept it on course. When stocks were weak, the fund’s bonds helped results. Similarly, stocks often performed better when bonds were hurt by rising interest rates or inflation.
In a letter to shareholders dated July 12, 1938, George Putnam articulated the strategy this way: “Successful investing calls not so much for some clairvoyant ability to read the future as for the courage to stick to tested, commonsense policies in the face of the unreliable emotional stresses and strains that constantly sweep the market place.” Today, Putnam remains committed to this prudent approach.
Consider these risks before investing: The fund may invest a portion of its assets in small and/or midsize companies. Such investments increase the risk of greater price fluctuations. The use of derivatives involves additional risks, such as the potential inability to terminate or sell derivatives positions and the potential failure of the other party to the instrument to meet its obligations. Value stocks may fail to rebound, and the market may not favor value-style investing. Funds that invest in bonds are subject to certain risks including interest-rate risk, credit risk, and inflation risk. As interest rates rise, the prices of bonds fall. Long-term bonds are more exposed to interest-rate risk than short-term bonds. Unlike bonds, bond funds have ongoing fees and expenses.
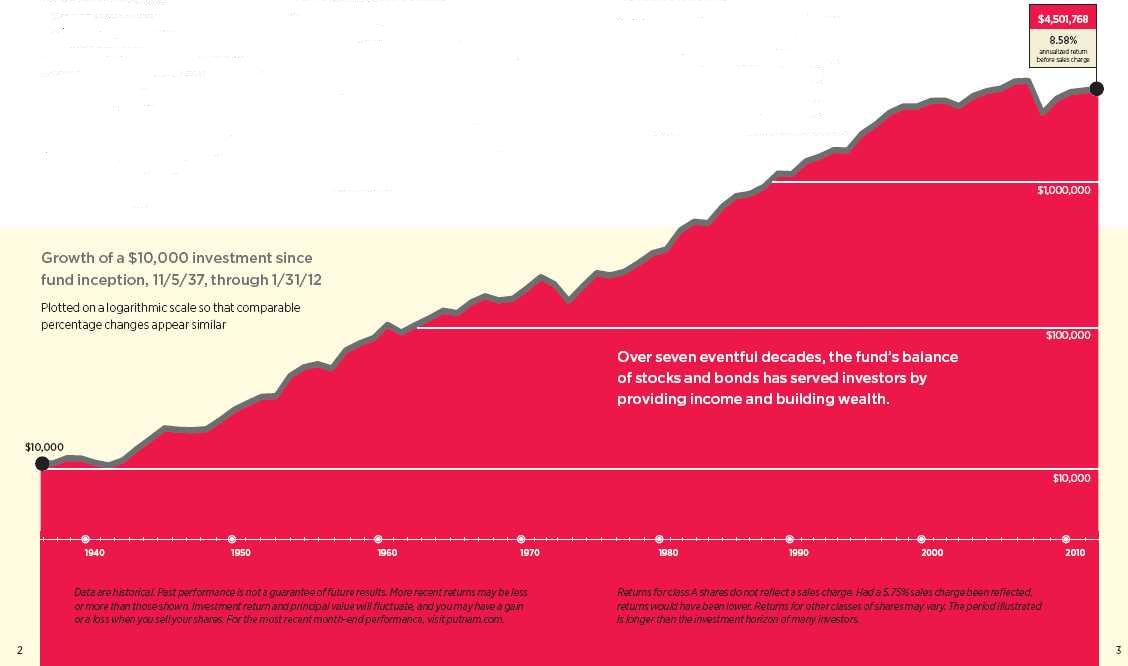
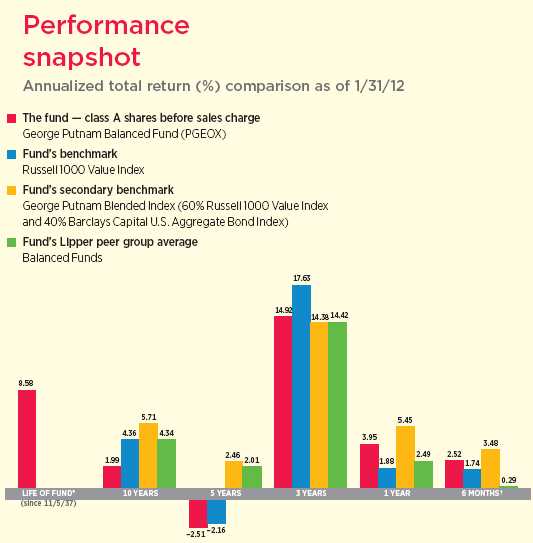
Current performance may be lower or higher than the quoted past performance, which cannot guarantee future results. Share price, principal value, and return will fluctuate, and you may have a gain or a loss when you sell your shares. Performance of class A shares assumes reinvestment of distributions and does not account for taxes. Fund returns in the bar chart do not reflect a sales charge of 5.75%; had they, returns would have been lower. See pages 5 and 10–12 for additional performance information. For a portion of the periods, the fund had expense limitations, without which returns would have been lower. A short-term trading fee of 1% may apply to redemptions or exchanges from certain funds within the time period specified in the fund’s prospectus. To obtain the most recent month-end performance, visit putnam.com.
* The fund’s benchmarks (Russell 1000 Value Index and George Putnam Blended Index) were introduced on 12/31/78 and its Lipper group (Balanced Funds) was introduced on 12/31/59; they all post-date the inception of the fund’s class A shares.
† Returns for the six-month period are not annualized, but cumulative.
George Putnam Blended Index is an unmanaged index administered by Putnam Investment Management, LLC, 60% of which is the Russell 1000 Value Index and 40% of which is the Barclays Capital U.S. Aggregate Bond Index.
4
Interview with your fund’s portfolio managers

The fiscal year began last August on the eve of the first-ever U.S. credit downgrade. Did this affect your strategy?
David: The process of deleveraging, both in the United States and abroad, prompted caution, but that fits the nature of this fund. We manage this as a fairly conservative, balanced fund, favoring high-quality stocks and bonds with the dual goals of current income and capital appreciation.
Equity prices tumbled in August and September, but the fund’s bond holdings helped to soften the impact. Fortunately, the U.S. economy also demonstrated resilience, and as month after month showed continued growth, equity prices recovered, generally rising from October through January.
Were you concerned that the economy would go back into recession?
Raman: Our baseline scenario at the start of the period was that the economy’s recovery was sustainable, and that proved to be correct. Of course, there were reasons for concern. Political gridlock in Washington and the worsening sovereign debt crisis in Europe are events that can influence consumer and business behavior. Fear could have prompted a general pullback in spending, which would have been quite damaging. Fortunately there was strength in many sectors. As an example, the automobile sector was in the midst of recovery from the supply disruptions that had followed Japan’s earthquake in March, and this trend was not derailed by macroeconomic concerns.
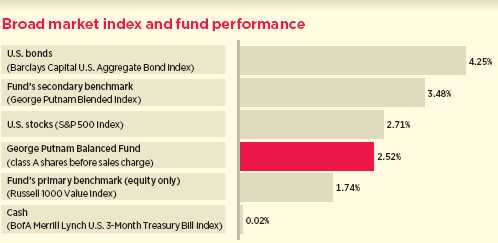
This comparison shows your fund’s performance in the context of broad market indexes for the six months ended 1/31/12. See pages 4 and 10–12 for additional fund performance information. Index descriptions can be found on pages 14–15.
5
How did the fund’s equity style fare?
David: I invest with a conservative value style, favoring large, well-established, mostly dividend-paying companies with high-quality balance sheets, and whose stocks are undervalued. Stock dividends add to the fund’s income generated primarily by bonds. During this six-month period, value-style investing had modest results, below the average of the overall market. This was primarily due to the relatively large proportion of financial stocks in value indexes such as the fund’s primary benchmark, the Russell 1000 Value Index. Segments of the financials sector, especially banks, continue to struggle with a weak housing market, high foreclosure rates, and degrees of exposure to European financial markets, which were under the stress of mounting sovereign debt risk. I maintained underweight exposure to the financials sector during the period.
What were the fixed-income strategies?
Raman: The fixed-income portion seeks to provide current income with a mix of government and investment-grade corporate bonds. In this period, we believed conditions would be apt to favor corporate bonds because their yield advantage over government bonds was greater than normal. We also tactically adjusted exposures to government agency mortgages and, to a lesser extent, certain high-quality commercial mortgage-backed securities, with the goal of enhancing returns. In addition to these sector tactics, we adjusted the portfolio’s yield-curve positioning and duration, with the goal of benefiting from changes in yields for bonds of different maturities.
Did the strategies perform as you had expected?
Raman: We experienced disappointments in the corporate strategy. The bonds performed well on a fundamental basis in that the major risk in this strategy — credit risk — did not worsen, because corporate defaults were no greater than expected. However, this risk was unrewarded, which was a bit unusual, especially in light of better equity performance. Credit risk is in many ways similar to equity risk, because it is sensitive to economic
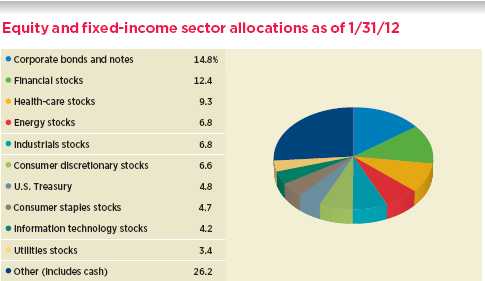
Allocations are represented as a percentage of the fund’s net assets. Summary information may differ from the portfolio schedule included in the financial statements due to the inclusion of derivative securities and the exclusion of as-of trades, if any, and the use of different classifications of securities for presentation purposes. Holdings and allocations may vary over time.
6
conditions and corporate earnings. In this period, there was a special factor at work —pending federal regulation associated with the Volcker Rule, named after former Fed Chairman Paul Volcker. This regulation might limit the degree to which banking institutions can commit capital to trading corporate securities. During the period it appears that many institutions prepared to reduce their capital commitments, which reduced liquidity in the market. While the peculiar underperformance of corporate bonds held back the portfolio’s results during the period, the silver lining is that these holdings now carry a higher return premium, in our view, which can add to fund performance in the future.

Turning back to the equity holdings, where did you see better and worse results?
David: Security selection played the largest role in our results, though a significant underweight position in the financials sector was beneficial. I regarded financials to be generally unattractive because many had potential exposure to Europe’s sovereign debt crisis. Although many financial stocks had attractive valuations, they did not carry the low-volatility characteristics that I prefer. There were some well-known companies in the fund, such as Citigroup and Wells Fargo, but they were underweight positions relative to the primary benchmark. Toward the end of the period, with valuations in the sector even lower and improved stability in Europe, I began to add to these positions, but for the reporting period the fund had an underweight position in the sector.
What holdings helped results?
David: The fund had an overweight position in Kimberly-Clark, a large consumer products company. With a strong market position in 80 different countries, the company generates a lot of free cash flow. It also offers an attractive dividend — a feature in strong demand in the market. The stock has been rewarded with appreciation.
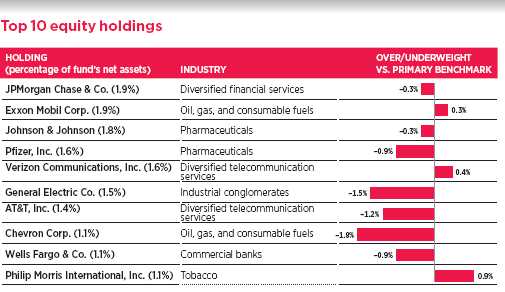
This table shows the fund’s top 10 equity holdings by percentage of the fund’s net assets as of 1/31/12. Short-term holdings are excluded. Holdings will vary over time.
7
Another holding that attracted investors with a high dividend, also likely to be sustainable, is Philip Morris International. This company has a growing franchise in overseas markets, where regulatory conditions are less of an issue than they appear to be in the United States. The company’s cash flows and dividend are generally not influenced by the economic cycle.
We held a position in a retailer that adroitly navigated trends in consumer spending during the period. TJX, which operates store chains such as T.J.Maxx and Marshalls, is not a part of the benchmark, but we believe that TJX has a great franchise selling off-price apparel and other items, and has seized the opportunity presented by consumers’ price consciousness. The holding contributed better-than-benchmark results for the fund.
In the health-care sector, pharmaceuticals company Pfizer also appreciated significantly in the period. Despite some of its strongest products facing patent expirations, Pfizer continues to develop a range of new products while, in our view, managing its cost structure well. The company also pays an attractive dividend. Aetna, the third-largest managed-care organization in the United States, also performed well. During 2011, Aetna delivered earnings growth of 40%, which was above expectations. I find the health-care sector attractive in general, because stock prices are discounting a negative impact from gradual implementation of the 2010 health reform. However, I believe the market is not acknowledging the positive revenue trends likely to take shape in the sector as Americans age and spend more on health care.
What is your outlook for the second half of the fiscal year?
Raman: We believe that market and economic conditions are unlikely to change drastically, and neither will the basic balance and investment characteristics of this fund. That said, we expect to be active in trying to add to performance above what a passive index might deliver. With the bond portion, this will involve tactics such as adjusting our sector positions in investment-grade
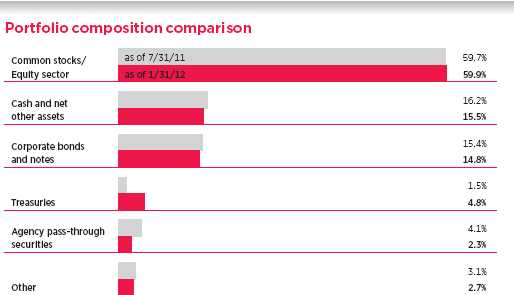
This chart shows how the fund’s top weightings have changed over the past six months. Weightings are shown as a percentage of net assets. Summary information may differ from the portfolio schedule included in the financial statements due to the inclusion of derivative securities and the exclusion of as-of trades, if any, and the use of different classifications of securities for presentation purposes. Holdings will vary over time.
8
corporate, Treasury, agency, and agency mortgage-backed securities.
We believe opportunities are likely to emerge in this economic scenario. While GDP growth at a modest rate of about 2% cheers those who worry about a recession, we expect that job growth will remain fairly weak and inflationary pressures subdued. In fact, we expect that headline inflation will decline in the early months of 2012. This could cause the yield curve to flatten. As a consequence, the Fed is likely, we think, to seize on the combination of weak growth and lower inflation as an instance to attempt additional stimulus aimed at accelerating economic activity and job creation. As the market grapples with emerging data, as well as evolving Fed policies, we expect to see some movement in the yield curve and in sector opportunities, and we will try to pursue opportunities for additional returns from these movements.
David: We believe that stocks continue to look relatively attractive in this environment. Valuations have remained reasonable near the end of the fiscal period, in our view, in part because corporations delivered strong earnings growth while prices did not move much. Businesses have found ways to grow profits even in a weak economy, and in our estimation, this makes it more likely for the market to appreciate in coming years. I will continue to be selective, favoring quality companies with solid balance sheets, and undervalued earnings and cash flow.
Thank you, David and Raman, for your time and insights today.
The views expressed in this report are exclusively those of Putnam Management and are subject to change. They are not meant as investment advice.
Please note that the holdings discussed in this report may not have been held by the fund for the entire period. Portfolio composition is subject to review in accordance with the fund’s investment strategy and may vary in the future. Current and future portfolio holdings are subject to risk.
Portfolio Manager David M. Calabro holds a B.A. from Williams College. David joined Putnam in 2008 and has been in the investment industry since 1982.
Portfolio Manager Raman Srivastava has an M.S. in Computational Finance from Carnegie Mellon University and a B.S. from the University of Waterloo. A CFA charterholder, he joined Putnam in 1999 and has been in the investment industry since 1997.
IN THE NEWS
The U.S. unemployment rate fell to 8.3% in January, with the nation’s employers adding 243,000 jobs, according to the Labor Department. This was the fastest pace of job growth since April 2011 and was the fifth straight month of unemployment rate declines. The nation’s jobless rate is still above the 5.2%-to-6% range that Federal Reserve (Fed) officials say is consistent with maximum employment. According to the Labor Department, 12.8 million Americans remain unemployed. In testimony before the Senate Budget Committee in early February, Fed Chairman Ben S. Bernanke said that the U.S. job market is far from “operating normally.” The Fed chairman reiterated that the Fed’s benchmark interest rate will remain near zero at least through late 2014, and again called on U.S. lawmakers to reduce the federal deficit.
9
Your fund’s performance
This section shows your fund’s performance, price, and distribution information for periods ended January 31, 2012, the end of the first half of its current fiscal year. In accordance with regulatory requirements for mutual funds, we also include performance as of the most recent calendar quarter-end and expense information taken from the fund’s current prospectus. Performance should always be considered in light of a fund’s investment strategy. Data represent past performance. Past performance does not guarantee future results. More recent returns may be less or more than those shown. Investment return and principal value will fluctuate, and you may have a gain or a loss when you sell your shares. Performance information does not reflect any deduction for taxes a shareholder may owe on fund distributions or on the redemption of fund shares. For the most recent month-end performance, please visit the Individual Investors section at putnam.com or call Putnam at 1-800-225-1581. Class R and class Y shares are not available to all investors. See the Terms and Definitions section in this report for definitions of the share classes offered by your fund.
Fund performance Total return for periods ended 1/31/12
| | | | | | | | | | |
| | Class A | Class B | Class C | Class M | Class R | Class Y |
| (inception dates) | (11/5/37) | (4/27/92) | (7/26/99) | (12/1/94) | (1/21/03) | (3/31/94) |
|
| | Before | After | | | | | Before | After | Net | Net |
| | sales | sales | Before | After | Before | After | sales | sales | asset | asset |
| | charge | charge | CDSC | CDSC | CDSC | CDSC | charge | charge | value | value |
|
| Annual average | | | | | | | | | | |
| (life of fund) | 8.58% | 8.49% | 7.57% | 7.57% | 7.76% | 7.76% | 7.84% | 7.79% | 8.31% | 8.65% |
|
| 10 years | 21.77 | 14.75 | 12.77 | 12.77 | 12.91 | 12.91 | 15.84 | 11.78 | 18.91 | 24.88 |
| Annual average | 1.99 | 1.39 | 1.21 | 1.21 | 1.22 | 1.22 | 1.48 | 1.12 | 1.75 | 2.25 |
|
| 5 years | –11.92 | –16.97 | –15.28 | –16.64 | –15.18 | –15.18 | –14.08 | –17.07 | –12.94 | –10.78 |
| Annual average | –2.51 | –3.65 | –3.26 | –3.57 | –3.24 | –3.24 | –2.99 | –3.67 | –2.73 | –2.26 |
|
| 3 years | 51.77 | 43.00 | 48.27 | 45.27 | 48.43 | 48.43 | 49.56 | 44.25 | 50.68 | 52.87 |
| Annual average | 14.92 | 12.66 | 14.03 | 13.26 | 14.07 | 14.07 | 14.36 | 12.99 | 14.64 | 15.20 |
|
| 1 year | 3.95 | –2.02 | 3.06 | –1.94 | 3.10 | 2.10 | 3.38 | –0.20 | 3.60 | 4.12 |
|
| 6 months | 2.52 | –3.34 | 2.04 | –2.96 | 2.05 | 1.05 | 2.19 | –1.41 | 2.31 | 2.56 |
|
Current performance may be lower or higher than the quoted past performance, which cannot guarantee future results. After-sales-charge returns for class A and M shares reflect the deduction of the maximum 5.75% and 3.50% sales charge, respectively, levied at the time of purchase. Class B share returns after contingent deferred sales charge (CDSC) reflect the applicable CDSC, which is 5% in the first year, declining over time to 1% in the sixth year, and is eliminated thereafter. Class C share returns after CDSC reflect a 1% CDSC for the first year that is eliminated thereafter. Class R and Y shares have no initial sales charge or CDSC. Performance for class B, C, M, R, and Y shares before their inception is derived from the historical performance of class A shares, adjusted for the applicable sales charge (or CDSC) and the higher operating expenses for such shares, except for class Y shares, for which 12b-1 fees are not applicable.
For a portion of the periods, the fund had expense limitations, without which returns would have been lower.
Class B share performance does not reflect conversion to class A shares.
10
Comparative index returns For periods ended 1/31/12
| | | | |
| | | Barclays Capital | | Lipper Balanced |
| | Russell 1000 | U.S. Aggregate | George Putnam | Funds category |
| | Value Index | Bond Index | Blended Index† | average ‡ |
|
| Annual average (life of fund) | —* | —* | —* | —* |
|
| 10 years | 53.25% | 75.47% | 74.18% | 53.89% |
| Annual average | 4.36 | 5.78 | 5.71 | 4.34 |
|
| 5 years | –10.34 | 38.27 | 12.92 | 10.68 |
| Annual average | –2.16 | 6.70 | 2.46 | 2.01 |
|
| 3 years | 62.75 | 23.87 | 49.65 | 49.94 |
| Annual average | 17.63 | 7.40 | 14.38 | 14.42 |
|
| 1 year | 1.88 | 8.66 | 5.45 | 2.49 |
|
| 6 months | 1.74 | 4.25 | 3.48 | 0.29 |
|
Index and Lipper results should be compared with fund performance before sales charge, before CDSC, or at net asset value.
* The fund’s benchmarks (Russell 1000 Value Index and George Putnam Blended Index) were introduced on 12/31/78. The Barclays Capital U.S. Aggregate Bond Index was introduced on 12/31/75, and the fund’s Lipper group (Balanced Funds) was introduced on 12/31/59. They all post-date the inception of the fund’s class A shares.
† George Putnam Blended Index is an unmanaged index administered by Putnam Management, 60% of which is the Russell 1000 Value Index and 40% of which is the Barclays Capital U.S. Aggregate Bond Index.
‡ Over the 6-month, 1-year, 3-year, 5-year, and 10-year periods ended 1/31/12, there were 732, 728, 690, 625, and 270 funds, respectively, in this Lipper category.
Fund price and distribution information For the six-month period ended 1/31/12
| | | | | | | | |
| Distributions | Class A | Class B | Class C | Class M | Class R | Class Y |
|
| Number | 2 | 2 | 2 | 2 | 2 | 2 |
|
| Income | $0.100 | $0.052 | $0.055 | $0.069 | $0.085 | $0.115 |
|
| Capital gains | — | — | — | — | — | — |
|
| Total | $0.100 | $0.052 | $0.055 | $0.069 | $0.085 | $0.115 |
|
| | Before | After | Net | Net | Before | After | Net | Net |
| | sales | sales | asset | asset | sales | sales | asset | asset |
| Share value | charge | charge | value | value | charge | charge | value | value |
|
| 7/31/11 | $12.21 | $12.95 | $12.08 | $12.14 | $12.06 | $12.50 | $12.18 | $12.26 |
|
| 1/31/12 | 12.41 | 13.17 | 12.27 | 12.33 | 12.25 | 12.69 | 12.37 | 12.45 |
|
| | Before | After | Net | Net | Before | After | Net | Net |
| | sales | sales | asset | asset | sales | sales | asset | asset |
| Current yield (end of period) | charge | charge | value | value | charge | charge | value | value |
|
| Current dividend rate 1 | 1.61% | 1.52% | 0.88% | 0.91% | 1.14% | 1.10% | 1.39% | 1.83% |
|
| Current 30-day SEC yield 2,3 | N/A | 1.50 | 0.86 | 0.86 | N/A | 1.07 | 1.35 | 1.84 |
|
The classification of distributions, if any, is an estimate. Before-sales-charge share value and current dividend rate for class A and M shares, if applicable, do not take into account any sales charge levied at the time of purchase. After-sales-charge share value, current dividend rate, and current 30-day SEC yield, if applicable, are calculated assuming that the maximum sales charge (5.75% for class A shares and 3.50% for class M shares) was levied at the time of purchase. Final distribution information will appear on your year-end tax forms.
1 Most recent distribution, excluding capital gains, annualized and divided by share price before or after sales charge at end of period.
2 For a portion of the period, this fund’s expenses were limited, without which yields would have been lower.
3 Based only on investment income and calculated using the maximum offering price for each share class, in accordance with SEC guidelines.
11
Fund performance as of most recent calendar quarter
Total return for periods ended 12/31/11
| | | | | | | | | | |
| | Class A | Class B | Class C | Class M | Class R | Class Y |
| (inception dates) | (11/5/37) | (4/27/92) | (7/26/99) | (12/1/94) | (1/21/03) | (3/31/94) |
|
| | Before | After | | | | | Before | After | Net | Net |
| | sales | sales | Before | After | Before | After | sales | sales | asset | asset |
| | charge | charge | CDSC | CDSC | CDSC | CDSC | charge | charge | value | value |
|
| Annual average | | | | | | | | | | |
| (life of fund) | 8.55% | 8.46% | 7.53% | 7.53% | 7.73% | 7.73% | 7.81% | 7.76% | 8.28% | 8.61% |
|
| 10 years | 17.68 | 10.91 | 9.03 | 9.03 | 9.12 | 9.12 | 12.00 | 8.09 | 15.00 | 20.77 |
| Annual average | 1.64 | 1.04 | 0.87 | 0.87 | 0.88 | 0.88 | 1.14 | 0.78 | 1.41 | 1.91 |
|
| 5 years | –13.48 | –18.45 | –16.78 | –18.11 | –16.67 | –16.67 | –15.55 | –18.52 | –14.42 | –12.36 |
| Annual average | –2.85 | –4.00 | –3.61 | –3.92 | –3.58 | –3.58 | –3.32 | –4.01 | –3.07 | –2.60 |
|
| 3 years | 43.62 | 35.38 | 40.17 | 37.17 | 40.37 | 40.37 | 41.38 | 36.50 | 42.52 | 44.69 |
| Annual average | 12.82 | 10.62 | 11.91 | 11.11 | 11.97 | 11.97 | 12.24 | 10.93 | 12.54 | 13.10 |
|
| 1 year | 2.71 | –3.21 | 1.90 | –3.10 | 1.86 | 0.86 | 2.13 | –1.47 | 2.45 | 2.97 |
|
| 6 months | –2.06 | –7.71 | –2.49 | –7.34 | –2.45 | –3.42 | –2.35 | –5.73 | –2.19 | –1.92 |
|
Your fund’s expenses
As a mutual fund investor, you pay ongoing expenses, such as management fees, distribution fees (12b-1 fees), and other expenses. Using the following information, you can estimate how these expenses affect your investment and compare them with the expenses of other funds. You may also pay one-time transaction expenses, including sales charges (loads) and redemption fees, which are not shown in this section and would have resulted in higher total expenses. For more information, see your fund’s prospectus or talk to your financial representative.
Expense ratios
| | | | | | |
| | Class A | Class B | Class C | Class M | Class R | Class Y |
|
| Total annual fund operating expenses for the fiscal | | | | | | |
| year ended 7/31/11 | 1.05% | 1.80% | 1.80% | 1.55% | 1.30% | 0.80% |
|
| Annualized expense ratio for the six-month period | | | | | | |
| ended 1/31/12 | 1.05% | 1.80% | 1.80% | 1.55% | 1.30% | 0.80% |
|
Fiscal-year expense information in this table is taken from the most recent prospectus, is subject to change, and may differ from that shown for the annualized expense ratio and in the financial highlights of this report. Expenses are shown as a percentage of average net assets.
12
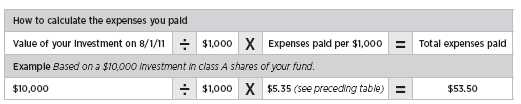
Expenses per $1,000
The following table shows the expenses you would have paid on a $1,000 investment in the fund from August 1, 2011, to January 31, 2012. It also shows how much a $1,000 investment would be worth at the close of the period, assuming actual returns and expenses.
| | | | | | |
| | Class A | Class B | Class C | Class M | Class R | Class Y |
|
| Expenses paid per $1,000*† | $5.35 | $9.14 | $9.14 | $7.88 | $6.61 | $4.07 |
|
| Ending value (after expenses) | $1,025.20 | $1,020.40 | $1,020.50 | $1,021.90 | $1,023.10 | $1,025.60 |
|
* Expenses for each share class are calculated using the fund’s annualized expense ratio for each class, which represents the ongoing expenses as a percentage of average net assets for the six months ended 1/31/12. The expense ratio may differ for each share class.
† Expenses are calculated by multiplying the expense ratio by the average account value for the period; then multiplying the result by the number of days in the period; and then dividing that result by the number of days in the year.
Estimate the expenses you paid
To estimate the ongoing expenses you paid for the six months ended January 31, 2012, use the following calculation method. To find the value of your investment on August 1, 2011, call Putnam at 1-800-225-1581.
Compare expenses using the SEC’s method
The Securities and Exchange Commission (SEC) has established guidelines to help investors assess fund expenses. Per these guidelines, the following table shows your fund’s expenses based on a $1,000 investment, assuming a hypothetical 5% annualized return. You can use this information to compare the ongoing expenses (but not transaction expenses or total costs) of investing in the fund with those of other funds. All mutual fund shareholder reports will provide this information to help you make this comparison. Please note that you cannot use this information to estimate your actual ending account balance and expenses paid during the period.
| | | | | | |
| | Class A | Class B | Class C | Class M | Class R | Class Y |
|
| Expenses paid per $1,000*† | $5.33 | $9.12 | $9.12 | $7.86 | $6.60 | $4.06 |
|
| Ending value (after expenses) | $1,019.86 | $1,016.09 | $1,016.09 | $1,017.34 | $1,018.60 | $1,021.11 |
|
* Expenses for each share class are calculated using the fund’s annualized expense ratio for each class, which represents the ongoing expenses as a percentage of average net assets for the six months ended 1/31/12. The expense ratio may differ for each share class.
† Expenses are calculated by multiplying the expense ratio by the average account value for the period; then multiplying the result by the number of days in the period; and then dividing that result by the number of days in the year.
13
Terms and definitions
Important terms
Total return shows how the value of the fund’s shares changed over time, assuming you held the shares through the entire period and reinvested all distributions in the fund.
Before sales charge, or net asset value, is the price, or value, of one share of a mutual fund, without a sales charge. Before-sales-charge figures fluctuate with market conditions, and are calculated by dividing the net assets of each class of shares by the number of outstanding shares in the class.
After sales charge is the price of a mutual fund share plus the maximum sales charge levied at the time of purchase. After-sales-charge performance figures shown here assume the 5.75% maximum sales charge for class A shares and 3.50% for class M shares.
Contingent deferred sales charge (CDSC) is generally a charge applied at the time of the redemption of class B or C shares and assumes redemption at the end of the period. Your fund’s class B CDSC declines over time from a 5% maximum during the first year to 1% during the sixth year. After the sixth year, the CDSC no longer applies. The CDSC for class C shares is 1% for one year after purchase.
Current yield is the annual rate of return earned from dividends or interest of an investment. Current yield is expressed as a percentage of the price of a security, fund share, or principal investment.
Share classes
Class A shares are generally subject to an initial sales charge and no CDSC (except on certain redemptions of shares bought without an initial sales charge).
Class B shares are not subject to an initial sales charge. They may be subject to a CDSC.
Class C shares are not subject to an initial sales charge and are subject to a CDSC only if the shares are redeemed during the first year.
Class M shares have a lower initial sales charge and a higher 12b-1 fee than class A shares and no CDSC (except on certain redemptions of shares bought without an initial sales charge).
Class R shares are not subject to an initial sales charge or CDSC and are available only to certain defined contribution plans.
Class Y shares are not subject to an initial sales charge or CDSC, and carry no 12b-1 fee. They are generally only available to corporate and institutional clients and clients in other approved programs.
Comparative indexes
Barclays Capital U.S. Aggregate Bond Index is an unmanaged index of U.S. investment-grade fixed-income securities.
BofA (Bank of America) Merrill Lynch U.S. 3-Month Treasury Bill Index is an unmanaged index that seeks to measure the performance of U.S. Treasury bills available in the marketplace.
George Putnam Blended Index is an unmanaged index administered by Putnam Investment Management, LLC, 60% of which is based on the Russell 1000 Value Index and 40% of which is based on the Barclays Capital U.S. Aggregate Bond Index.
Russell 1000 Value Index is an unmanaged index of those companies in the large-cap Russell 1000 Index chosen for their value orientation.
S&P 500 Index is an unmanaged index of common stock performance.
Indexes assume reinvestment of all distributions and do not account for fees. Securities and performance of a fund and an index will differ. You cannot invest directly in an index.
Lipper is a third-party industry-ranking entity that ranks mutual funds. Its rankings do not
14
reflect sales charges. Lipper rankings are based on total return at net asset value relative to other funds that have similar current investment styles or objectives as determined by Lipper. Lipper may change a fund’s category assignment at its discretion. Lipper category averages reflect performance trends for funds within a category.
Other information for shareholders
Important notice regarding delivery of shareholder documents
In accordance with Securities and Exchange Commission (SEC) regulations, Putnam sends a single copy of annual and semiannual shareholder reports, prospectuses, and proxy statements to Putnam shareholders who share the same address, unless a shareholder requests otherwise. If you prefer to receive your own copy of these documents, please call Putnam at 1-800-225-1581, and Putnam will begin sending individual copies within 30 days.
Proxy voting
Putnam is committed to managing our mutual funds in the best interests of our shareholders. The Putnam funds’ proxy voting guidelines and procedures, as well as information regarding how your fund voted proxies relating to portfolio securities during the 12-month period ended June 30, 2011, are available in the Individual Investors section of putnam.com, and on the SEC’s website, www.sec.gov. If you have questions about finding forms on the SEC’s website, you may call the SEC at 1-800-SEC-0330. You may also obtain the Putnam funds’ proxy voting guidelines and procedures at no charge by calling Putnam’s Shareholder Services at 1-800-225-1581.
Fund portfolio holdings
The fund will file a complete schedule of its portfolio holdings with the SEC for the first and third quarters of each fiscal year on Form N-Q. Shareholders may obtain the fund’s Forms N-Q on the SEC’s website at www.sec.gov. In addition, the fund’s Forms N-Q may be reviewed and copied at the SEC’s Public Reference Room in Washington, D.C. You may call the SEC at 1-800-SEC-0330 for information about the SEC’s website or the operation of the Public Reference Room.
Trustee and employee fund ownership
Putnam employees and members of the Board of Trustees place their faith, confidence, and, most importantly, investment dollars in Putnam mutual funds. As of January 31, 2012, Putnam employees had approximately $325,000,000 and the Trustees had approximately $75,000,000 invested in Putnam mutual funds. These amounts include investments by the Trustees’ and employees’ immediate family members as well as investments through retirement and deferred compensation plans.
15
Financial statements
A guide to financial statements
These sections of the report, as well as the accompanying Notes, constitute the fund’s financial statements.
The fund’s portfolio lists all the fund’s investments and their values as of the last day of the reporting period. Holdings are organized by asset type and industry sector, country, or state to show areas of concentration and diversification.
Statement of assets and liabilities shows how the fund’s net assets and share price are determined. All investment and non-investment assets are added together. Any unpaid expenses and other liabilities are subtracted from this total. The result is divided by the number of shares to determine the net asset value per share, which is calculated separately for each class of shares. (For funds with preferred shares, the amount subtracted from total assets includes the liquidation preference of preferred shares.)
Statement of operations shows the fund’s net investment gain or loss. This is done by first adding up all the fund’s earnings — from dividends and interest income — and subtracting its operating expenses to determine net investment income (or loss). Then, any net gain or loss the fund realized on the sales of its holdings — as well as any unrealized gains or losses over the period — is added to or subtracted from the net investment result to determine the fund’s net gain or loss for the fiscal period.
Statement of changes in net assets shows how the fund’s net assets were affected by the fund’s net investment gain or loss, by distributions to shareholders, and by changes in the number of the fund’s shares. It lists distributions and their sources (net investment income or realized capital gains) over the current reporting period and the most recent fiscal year-end. The distributions listed here may not match the sources listed in the Statement of operations because the distributions are determined on a tax basis and may be paid in a different period from the one in which they were earned. Dividend sources are estimated at the time of declaration. Actual results may vary. Any non-taxable return of capital cannot be determined until final tax calculations are completed after the end of the fund’s fiscal year.
Financial highlights provide an overview of the fund’s investment results, per-share distributions, expense ratios, net investment income ratios, and portfolio turnover in one summary table, reflecting the five most recent reporting periods. In a semiannual report, the highlights table also includes the current reporting period.
16
The fund’s portfolio 1/31/12 (Unaudited)
| | |
| COMMON STOCKS (57.5%)* | Shares | Value |
|
| Banking (5.0%) | | |
| Bank of New York Mellon Corp. (The) | 155,000 | $3,120,150 |
|
| BB&T Corp. | 55,500 | 1,509,045 |
|
| Comerica, Inc. | 80,600 | 2,230,202 |
|
| Fifth Third Bancorp | 56,800 | 738,968 |
|
| JPMorgan Chase & Co. | 606,700 | 22,629,910 |
|
| PNC Financial Services Group, Inc. | 28,900 | 1,702,788 |
|
| State Street Corp. | 163,600 | 6,409,848 |
|
| U.S. Bancorp | 290,200 | 8,189,444 |
|
| Wells Fargo & Co. | 438,100 | 12,796,901 |
|
| | | 59,327,256 |
| Basic materials (1.9%) | | |
| Alcoa, Inc. | 194,400 | 1,975,104 |
|
| Dow Chemical Co. (The) | 56,048 | 1,878,168 |
|
| E.I. du Pont de Nemours & Co. | 132,400 | 6,737,836 |
|
| Freeport-McMoRan Copper & Gold, Inc. Class B (Indonesia) | 32,100 | 1,483,341 |
|
| Nucor Corp. | 83,500 | 3,714,915 |
|
| PPG Industries, Inc. | 44,200 | 3,959,436 |
|
| Rio Tinto PLC ADR (United Kingdom) | 29,100 | 1,759,386 |
|
| Weyerhaeuser Co. R | 35,072 | 702,141 |
|
| | | 22,210,327 |
| Capital goods (3.4%) | | |
| Eaton Corp. | 83,100 | 4,074,393 |
|
| Emerson Electric Co. | 54,200 | 2,784,796 |
|
| Illinois Tool Works, Inc. | 76,800 | 4,072,704 |
|
| Ingersoll-Rand PLC | 49,400 | 1,726,036 |
|
| KBR, Inc. | 46,900 | 1,507,366 |
|
| Lockheed Martin Corp. | 19,300 | 1,588,776 |
|
| Northrop Grumman Corp. | 82,200 | 4,771,710 |
|
| Parker Hannifin Corp. | 60,400 | 4,873,072 |
|
| Raytheon Co. | 85,500 | 4,103,145 |
|
| Staples, Inc. | 236,300 | 3,457,069 |
|
| United Technologies Corp. | 86,100 | 6,745,935 |
|
| | | 39,705,002 |
| Communication services (4.6%) | | |
| AT&T, Inc. | 563,982 | 16,586,711 |
|
| Comcast Corp. Class A | 328,500 | 8,734,815 |
|
| DIRECTV Class A † | 16,300 | 733,663 |
|
| Juniper Networks, Inc. † | 86,800 | 1,816,724 |
|
| Time Warner Cable, Inc. | 49,200 | 3,627,024 |
|
| Verizon Communications, Inc. | 488,200 | 18,385,612 |
|
| Vodafone Group PLC ADR (United Kingdom) | 159,300 | 4,315,437 |
|
| | | 54,199,986 |
| Conglomerates (2.3%) | | |
| 3M Co. | 34,200 | 2,965,482 |
|
| General Electric Co. | 935,000 | 17,493,850 |
|
| Tyco International, Ltd. | 128,100 | 6,526,695 |
|
| | | 26,986,027 |
17
| | |
| COMMON STOCKS (57.5%)* cont. | Shares | Value |
|
| Consumer cyclicals (5.4%) | | |
| Bed Bath & Beyond, Inc. † | 28,100 | $1,705,670 |
|
| Carnival Corp. | 71,200 | 2,150,240 |
|
| Ford Motor Co. † | 201,400 | 2,501,388 |
|
| Hasbro, Inc. | 80,500 | 2,810,255 |
|
| Home Depot, Inc. (The) | 69,500 | 3,085,105 |
|
| Johnson Controls, Inc. | 61,400 | 1,950,678 |
|
| Kimberly-Clark Corp. | 61,700 | 4,415,252 |
|
| Marriott International, Inc. Class A | 78,820 | 2,715,349 |
|
| News Corp. Class A | 89,700 | 1,689,051 |
|
| Omnicom Group, Inc. | 32,400 | 1,477,764 |
|
| Stanley Black & Decker, Inc. | 15,700 | 1,101,826 |
|
| Target Corp. | 116,300 | 5,909,203 |
|
| Time Warner, Inc. | 226,900 | 8,408,914 |
|
| TJX Cos., Inc. (The) | 113,900 | 7,761,146 |
|
| Viacom, Inc. Class B | 110,200 | 5,183,808 |
|
| Wal-Mart Stores, Inc. | 45,900 | 2,816,424 |
|
| Walt Disney Co. (The) | 204,500 | 7,955,050 |
|
| | | 63,637,123 |
| Consumer finance (0.4%) | | |
| American Express Co. | 98,900 | 4,958,846 |
|
| | | 4,958,846 |
| Consumer staples (4.6%) | | |
| Avon Products, Inc. | 109,400 | 1,944,038 |
|
| Coca-Cola Co. (The) | 26,300 | 1,776,039 |
|
| Coca-Cola Enterprises, Inc. | 151,000 | 4,045,290 |
|
| Colgate-Palmolive Co. | 20,400 | 1,850,688 |
|
| CVS Caremark Corp. | 181,300 | 7,569,275 |
|
| General Mills, Inc. | 56,500 | 2,250,395 |
|
| Hertz Global Holdings, Inc. † | 223,400 | 3,038,240 |
|
| Kellogg Co. | 33,000 | 1,634,160 |
|
| Kraft Foods, Inc. Class A | 78,562 | 3,008,925 |
|
| Lorillard, Inc. | 17,200 | 1,847,108 |
|
| Newell Rubbermaid, Inc. | 175,500 | 3,241,485 |
|
| PepsiCo, Inc. | 35,000 | 2,298,450 |
|
| Philip Morris International, Inc. | 167,000 | 12,486,590 |
|
| Procter & Gamble Co. (The) | 87,600 | 5,522,304 |
|
| SYSCO Corp. | 41,100 | 1,237,521 |
|
| | | 53,750,508 |
| Energy (6.5%) | | |
| Anadarko Petroleum Corp. | 14,100 | 1,138,152 |
|
| Chevron Corp. | 116,000 | 11,957,280 |
|
| ConocoPhillips | 48,200 | 3,287,722 |
|
| Devon Energy Corp. | 46,000 | 2,935,260 |
|
| Exxon Mobil Corp. | 267,500 | 22,400,450 |
|
| Hess Corp. | 47,600 | 2,679,880 |
|
| National Oilwell Varco, Inc. | 29,200 | 2,160,216 |
|
| Newfield Exploration Co. † | 43,300 | 1,637,173 |
|
| Noble Corp. (Switzerland) | 104,600 | 3,644,264 |
|
18
| | |
| COMMON STOCKS (57.5%)* cont. | Shares | Value |
|
| Energy cont. | | |
| Occidental Petroleum Corp. | 63,200 | $6,305,464 |
|
| Royal Dutch Shell PLC ADR (United Kingdom) | 68,700 | 4,902,432 |
|
| Schlumberger, Ltd. | 67,995 | 5,111,184 |
|
| Total SA ADR (France) | 137,800 | 7,299,266 |
|
| Valero Energy Corp. | 60,300 | 1,446,597 |
|
| | | 76,905,340 |
| Financials (3.4%) | | |
| Aflac, Inc. | 81,600 | 3,935,568 |
|
| Citigroup, Inc. | 312,450 | 9,598,464 |
|
| Goldman Sachs Group, Inc. (The) | 77,410 | 8,628,893 |
|
| MetLife, Inc. | 85,000 | 3,003,050 |
|
| Progressive Corp. (The) | 231,200 | 4,688,736 |
|
| Prudential Financial, Inc. | 176,200 | 10,085,688 |
|
| | | 39,940,399 |
| Health care (9.3%) | | |
| Abbott Laboratories | 28,200 | 1,527,030 |
|
| Aetna, Inc. | 160,600 | 7,018,220 |
|
| Baxter International, Inc. | 136,900 | 7,595,212 |
|
| Bristol-Myers Squibb Co. | 81,900 | 2,640,456 |
|
| Celgene Corp. † | 22,700 | 1,650,290 |
|
| CIGNA Corp. | 88,200 | 3,954,006 |
|
| Covidien PLC (Ireland) | 66,812 | 3,440,818 |
|
| Johnson & Johnson | 314,900 | 20,755,059 |
|
| Medtronic, Inc. | 90,000 | 3,471,300 |
|
| Merck & Co., Inc. | 317,300 | 12,139,898 |
|
| Novartis AG ADR (Switzerland) | 40,500 | 2,201,580 |
|
| Pfizer, Inc. | 898,558 | 19,229,141 |
|
| Quest Diagnostics, Inc. | 80,700 | 4,687,056 |
|
| St. Jude Medical, Inc. | 116,100 | 4,842,531 |
|
| Stryker Corp. | 89,200 | 4,944,356 |
|
| Teva Pharmaceutical Industries, Ltd. ADR (Israel) | 53,700 | 2,423,481 |
|
| Thermo Fisher Scientific, Inc. † | 140,100 | 7,411,290 |
|
| | | 109,931,724 |
| Insurance (2.1%) | | |
| Allstate Corp. (The) | 179,900 | 5,190,115 |
|
| Chubb Corp. (The) | 64,600 | 4,354,686 |
|
| Marsh & McLennan Cos., Inc. | 193,800 | 6,122,142 |
|
| RenaissanceRe Holdings, Ltd. | 17,000 | 1,242,870 |
|
| Sun Life Financial, Inc. (Canada) | 62,700 | 1,255,254 |
|
| Travelers Cos., Inc. (The) | 112,600 | 6,564,580 |
|
| | | 24,729,647 |
| Investment banking/Brokerage (0.3%) | | |
| Charles Schwab Corp. (The) | 156,200 | 1,819,730 |
|
| Morgan Stanley | 102,740 | 1,916,101 |
|
| | | 3,735,831 |
| Real estate (0.5%) | | |
| CreXus Investment Corp. R | 73,100 | 809,217 |
|
| Equity Residential Trust R | 26,048 | 1,551,158 |
|
19
| | |
| COMMON STOCKS (57.5%)* cont. | Shares | Value |
|
| Real estate cont. | | |
| Prologis, Inc. R | 56,481 | $1,791,013 |
|
| Simon Property Group, Inc. R | 10,562 | 1,434,953 |
|
| | | 5,586,341 |
| Technology (4.8%) | | |
| Adobe Systems, Inc. † | 100,700 | 3,116,665 |
|
| Apple, Inc. † | 4,300 | 1,962,864 |
|
| Cisco Systems, Inc. | 395,800 | 7,769,554 |
|
| EMC Corp. † | 233,800 | 6,022,688 |
|
| Hewlett-Packard Co. | 133,800 | 3,743,724 |
|
| Honeywell International, Inc. | 150,800 | 8,752,432 |
|
| IBM Corp. | 21,500 | 4,140,900 |
|
| Intel Corp. | 153,600 | 4,058,112 |
|
| KLA-Tencor Corp. | 22,500 | 1,150,425 |
|
| Microsoft Corp. | 205,300 | 6,062,509 |
|
| Oracle Corp. | 65,100 | 1,835,820 |
|
| Qualcomm, Inc. | 49,800 | 2,929,236 |
|
| SanDisk Corp. † | 43,300 | 1,986,604 |
|
| Texas Instruments, Inc. | 56,000 | 1,813,280 |
|
| Yahoo!, Inc. † | 89,800 | 1,389,206 |
|
| | | 56,734,019 |
| Transportation (0.4%) | | |
| FedEx Corp. | 15,400 | 1,408,946 |
|
| United Parcel Service, Inc. Class B | 38,400 | 2,904,960 |
|
| | | 4,313,906 |
| Utilities and power (2.6%) | | |
| Ameren Corp. | 139,200 | 4,404,288 |
|
| American Electric Power Co., Inc. | 98,000 | 3,876,880 |
|
| Dominion Resources, Inc. | 27,300 | 1,366,092 |
|
| Duke Energy Corp. | 76,300 | 1,625,953 |
|
| Edison International | 120,500 | 4,945,320 |
|
| Entergy Corp. | 83,000 | 5,758,540 |
|
| Exelon Corp. | 20,400 | 811,512 |
|
| NextEra Energy, Inc. | 39,600 | 2,370,060 |
|
| PG&E Corp. | 119,550 | 4,860,903 |
|
| | | 30,019,548 |
| | | |
| Total common stocks (cost $603,552,248) | | $676,671,830 |
|
| |
| CORPORATE BONDS AND NOTES (16.4%)* | Principal amount | Value |
|
| Basic materials (1.0%) | | |
| Allegheny Technologies, Inc. sr. unsec. | | |
| unsub. notes 9 3/8s, 2019 | $275,000 | $354,404 |
|
| ArcelorMittal sr. unsec. unsub. 9.85s, 2019 (France) | 1,545,000 | 1,821,732 |
|
| Dow Chemical Co. (The) sr. unsec. notes 5 1/4s, 2041 | 550,000 | 598,426 |
|
| Freeport-McMoRan Copper & Gold, Inc. sr. unsec. notes 8 3/8s, | | |
| 2017 (Indonesia) | 1,450,000 | 1,527,938 |
|
| Georgia-Pacific, LLC sr. unsec. unsub. notes 7 3/4s, 2029 | 850,000 | 1,092,447 |
|
| International Paper Co. sr. unsec. notes 9 3/8s, 2019 | 1,018,000 | 1,337,844 |
|
| International Paper Co. sr. unsec. notes 8.7s, 2038 | 10,000 | 13,961 |
|
20
| | |
| CORPORATE BONDS AND NOTES (16.4%)* cont. | Principal amount | Value |
|
| Basic materials cont. | | |
| International Paper Co. sr. unsec. notes 7.95s, 2018 | $221,000 | $275,806 |
|
| International Paper Co. sr. unsec. unsub. notes 7.3s, 2039 | 20,000 | 25,060 |
|
| Mosaic Co. (The) sr. unsec. notes 3 3/4s, 2021 | 200,000 | 209,128 |
|
| PPG Industries, Inc. sr. unsec. unsub. debs. 7.4s, 2019 | 350,000 | 437,488 |
|
| Rio Tinto Finance USA, Ltd. company guaranty sr. unsec. notes 9s, | | |
| 2019 (Australia) | 450,000 | 626,235 |
|
| Rio Tinto Finance USA, Ltd. company guaranty sr. unsec. notes 5.2s, | | |
| 2040 (Australia) | 570,000 | 667,768 |
|
| Rohm & Haas Co. sr. unsec. unsub. notes 7.85s, 2029 | 385,000 | 513,903 |
|
| Sealed Air Corp. sr. notes 7 7/8s, 2017 | 585,000 | 622,675 |
|
| Teck Resources Limited sr. notes 10 3/4s, 2019 (Canada) | 35,000 | 42,786 |
|
| Teck Resources Limited sr. notes 10 1/4s, 2016 (Canada) | 51,000 | 58,599 |
|
| Teck Resources Limited sr. notes 9 3/4s, 2014 (Canada) | 16,000 | 18,860 |
|
| Temple-Inland, Inc. sr. unsec. unsub. notes 6 5/8s, 2018 | 195,000 | 225,646 |
|
| Union Carbide Corp. sr. unsec. unsub. bonds 7 3/4s, 2096 | 180,000 | 194,767 |
|
| Xstrata Finance Canada, Ltd. 144A company guaranty | | |
| sr. unsec. unsub. bonds 5.8s, 2016 (Canada) | 735,000 | 820,442 |
|
| Xstrata Finance Canada, Ltd. 144A company guaranty sr. unsec. | | |
| notes 6s, 2041 (Canada) | 5,000 | 5,320 |
|
| | | 11,491,235 |
| Capital goods (0.4%) | | |
| Allied Waste North America, Inc. company guaranty sr. unsec. notes | | |
| 6 7/8s, 2017 | 1,595,000 | 1,680,731 |
|
| Legrand SA unsec. unsub. debs. 8 1/2s, 2025 (France) | 767,000 | 915,300 |
|
| Parker Hannifin Corp. sr. unsec. unsub. notes Ser. MTN, 6 1/4s, 2038 | 975,000 | 1,218,815 |
|
| Republic Services, Inc. company guaranty sr. unsec. unsub. notes | | |
| 5 1/2s, 2019 | 240,000 | 276,972 |
|
| United Technologies Corp. sr. unsec. notes 5.7s, 2040 | 100,000 | 125,082 |
|
| | | 4,216,900 |
| Communication services (1.6%) | | |
| America Movil SAB de CV company guaranty sr. unsec. unsub. notes | | |
| 6 1/8s, 2040 (Mexico) | 200,000 | 243,513 |
|
| America Movil SAB de CV company guaranty unsec. unsub. notes | | |
| 2 3/8s, 2016 (Mexico) | 280,000 | 284,448 |
|
| American Tower REIT, Inc. sr. unsec. notes 7 1/4s, 2019 R | 800,000 | 908,462 |
|
| American Tower REIT, Inc. sr. unsec. unsub. notes 4 5/8s, 2015 R | 555,000 | 581,165 |
|
| AT&T, Inc. sr. unsec. unsub. bonds 5 1/2s, 2018 | 705,000 | 835,814 |
|
| AT&T, Inc. sr. unsec. unsub. notes 6.3s, 2038 | 1,194,000 | 1,456,087 |
|
| Bellsouth Capital Funding unsec. notes 7 7/8s, 2030 | 1,380,000 | 1,865,822 |
|
| CenturyLink, Inc. sr. unsec. debs. Ser. G, 6 7/8s, 2028 | 715,000 | 692,474 |
|
| CenturyLink, Inc. sr. unsec. unsub. notes Ser. P, 7.6s, 2039 | 305,000 | 309,929 |
|
| Comcast Cable Communications company guaranty sr. unsub. notes | | |
| 8 7/8s, 2017 | 290,000 | 377,646 |
|
| Comcast Corp. company guaranty sr. unsec. unsub. notes | | |
| 6.95s, 2037 | 225,000 | 291,778 |
|
| Corning, Inc. sr. unsec. unsub. notes 5 3/4s, 2040 | 165,000 | 193,232 |
|
| Cox Communications, Inc. 144A notes 5 7/8s, 2016 | 289,000 | 334,366 |
|
| Crown Castle Towers, LLC 144A company guaranty sr. notes | | |
| 4.883s, 2020 | 710,000 | 739,314 |
|
21
| | |
| CORPORATE BONDS AND NOTES (16.4%)* cont. | Principal amount | Value |
|
| Communication services cont. | | |
| France Telecom sr. unsec. unsub. notes 8 1/2s, 2031 (France) | $250,000 | $352,497 |
|
| France Telecom sr. unsec. unsub. notes 5 3/8s, 2019 (France) | 255,000 | 284,203 |
|
| France Telecom sr. unsec. unsub. notes 4 1/8s, 2021 (France) | 283,000 | 293,948 |
|
| Koninklijke (Royal) KPN NV sr. unsec. unsub. bonds 8 3/8s, | | |
| 2030 (Netherlands) | 70,000 | 92,205 |
|
| NBC Universal Media, LLC sr. unsec. unsub. notes 5.15s, 2020 | 295,000 | 337,888 |
|
| NBC Universal Media, LLC sr. unsec. unsub. notes 6.4s, 2040 | 380,000 | 481,808 |
|
| Qwest Corp. notes 6 3/4s, 2021 | 462,000 | 514,466 |
|
| Rogers Communications, Inc. company guaranty sr. unsec. bonds | | |
| 8 3/4s, 2032 (Canada) | 95,000 | 123,500 |
|
| Rogers Communications, Inc. sec. notes 6 3/8s, 2014 (Canada) | 122,000 | 135,319 |
|
| SBA Tower Trust 144A company guaranty sr. notes 5.101s, 2017 | 1,125,000 | 1,204,587 |
|
| TCI Communications, Inc. company guaranty sr. unsec. unsub. debs. | | |
| 7 7/8s, 2026 | 610,000 | 803,330 |
|
| Telecom Italia Capital SA company guaranty sr. unsec. unsub. notes | | |
| 6.175s, 2014 (Italy) | 300,000 | 301,500 |
|
| Telefonica Emisiones SAU company guaranty sr. unsec. unsub. notes | | |
| 6.221s, 2017 (Spain) | 845,000 | 903,255 |
|
| Time Warner Cable, Inc. company guaranty sr. notes 7.3s, 2038 | 640,000 | 807,091 |
|
| Time Warner Cable, Inc. company guaranty sr. unsec. notes | | |
| 7 1/2s, 2014 | 150,000 | 169,389 |
|
| Time Warner Cable, Inc. company guaranty sr. unsec. unsub. notes | | |
| 6 3/4s, 2039 | 355,000 | 426,546 |
|
| Verizon Communications, Inc. sr. unsec. unsub. notes 8 3/4s, 2018 | 110,000 | 153,164 |
|
| Verizon New Jersey, Inc. debs. 8s, 2022 | 770,000 | 979,293 |
|
| Verizon Pennsylvania, Inc. debs. 8.35s, 2030 | 980,000 | 1,249,653 |
|
| | | 18,727,692 |
| Consumer cyclicals (1.0%) | | |
| Advance Auto Parts, Inc. company guaranty sr. unsec. notes | | |
| 5 3/4s, 2020 | 475,000 | 532,715 |
|
| CBS Corp. company guaranty sr. unsec. notes 7 7/8s, 2030 | 730,000 | 943,724 |
|
| Choice Hotels International, Inc. company guaranty sr. unsec. unsub. | | |
| notes 5.7s, 2020 | 430,000 | 463,100 |
|
| DIRECTV Holdings, LLC/DIRECTV Financing Co., Inc. company | | |
| guaranty sr. unsec. notes 6.35s, 2040 | 370,000 | 427,632 |
|
| DIRECTV Holdings, LLC/DIRECTV Financing Co., Inc. company | | |
| guaranty sr. unsec. unsub. notes 5 7/8s, 2019 | 820,000 | 935,991 |
|
| Ecolab, Inc. sr. unsec. unsub. notes 5 1/2s, 2041 | 90,000 | 104,738 |
|
| Ecolab, Inc. sr. unsec. unsub. notes 4.35s, 2021 | 210,000 | 231,705 |
|
| Expedia, Inc. company guaranty sr. unsec. notes 7.456s, 2018 | 325,000 | 364,000 |
|
| Expedia, Inc. company guaranty sr. unsec. unsub. notes 5.95s, 2020 | 555,000 | 564,109 |
|
| FUEL Trust 144A company guaranty asset backed notes | | |
| 4.207s, 2016 | 1,245,000 | 1,278,510 |
|
| Grupo Televisa, S.A.B sr. unsec. bonds 6 5/8s, 2040 (Mexico) | 300,000 | 340,849 |
|
| Grupo Televisa, S.A.B sr. unsec. notes 6s, 2018 (Mexico) | 290,000 | 329,490 |
|
| Lender Processing Services, Inc. company guaranty sr. unsec. unsub. | | |
| notes 8 1/8s, 2016 | 846,000 | 833,310 |
|
| Macy’s Retail Holdings, Inc. company guaranty sr. unsec. notes | | |
| 5 1/8s, 2042 | 70,000 | 72,599 |
|
22
| | |
| CORPORATE BONDS AND NOTES (16.4%)* cont. | Principal amount | Value |
|
| Consumer cyclicals cont. | | |
| Macy’s Retail Holdings, Inc. company guaranty sr. unsec. notes | | |
| 3 7/8s, 2022 | $110,000 | $112,766 |
|
| News America Holdings, Inc. company guaranty sr. unsec. debs. | | |
| 7 3/4s, 2024 | 1,045,000 | 1,304,180 |
|
| Owens Corning company guaranty sr. unsec. notes 9s, 2019 | 324,000 | 389,610 |
|
| Time Warner Entertainment Co., LP debs. 8 3/8s, 2023 | 170,000 | 227,932 |
|
| Time Warner, Inc. company guaranty sr. unsec. bonds 7.7s, 2032 | 520,000 | 690,192 |
|
| Time Warner, Inc. company guaranty sr. unsec. notes 4.7s, 2021 | 120,000 | 133,198 |
|
| Time Warner, Inc. debs. 9.15s, 2023 | 340,000 | 468,609 |
|
| Toyota Motor Credit Corp. sr. unsec. unsub. notes 3.3s, 2022 | 630,000 | 640,579 |
|
| | | 11,389,538 |
| Consumer staples (0.9%) | | |
| Altria Group, Inc. company guaranty sr. unsec. notes 9.7s, 2018 | 375,000 | 516,450 |
|
| Altria Group, Inc. company guaranty sr. unsec. notes 9 1/4s, 2019 | 595,000 | 810,041 |
|
| Anheuser-Busch InBev Worldwide, Inc. company guaranty sr. unsec. | | |
| unsub. notes 8.2s, 2039 | 165,000 | 259,411 |
|
| Bacardi, Ltd. 144A unsec. notes 4 1/2s, 2021 (Bermuda) | 495,000 | 540,540 |
|
| Campbell Soup Co. debs. 8 7/8s, 2021 | 855,000 | 1,257,496 |
|
| Corrections Corporation of America company guaranty sr. notes | | |
| 7 3/4s, 2017 | 279,000 | 302,715 |
|
| CVS Pass-Through Trust 144A company guaranty sr. notes 7.507s, 2032 | 736,076 | 874,715 |
|
| CVS Pass-Through Trust 144A pass-through certificates 6.117s, 2013 | 135,447 | 139,482 |
|
| Darden Restaurants, Inc. sr. unsec. unsub. notes 6.8s, 2037 | 810,000 | 922,171 |
|
| Diageo Investment Corp. company guaranty sr. unsec. debs. 8s, | | |
| 2022 (Canada) | 820,000 | 1,140,911 |
|
| General Mills, Inc. sr. unsec. notes 5.65s, 2019 | 130,000 | 155,868 |
|
| H.J. Heinz Finance Co. 144A company guaranty sr. unsec. notes | | |
| 7 1/8s, 2039 | 360,000 | 479,607 |
|
| Kraft Foods, Inc. sr. unsec. unsub. notes 6 1/2s, 2040 | 309,000 | 394,710 |
|
| Kroger Co. company guaranty sr. unsec. unsub. notes 6 3/4s, 2012 | 275,000 | 278,342 |
|
| Kroger Co. company guaranty sr. unsec. unsub. notes 6.4s, 2017 | 500,000 | 601,298 |
|
| McDonald’s Corp. sr. unsec. Ser. MTN, 6.3s, 2038 | 535,000 | 748,667 |
|
| McDonald’s Corp. sr. unsec. notes 5.7s, 2039 | 600,000 | 784,111 |
|
| SABMiller Holdings, Inc. 144A company guaranty sr. unsec. notes | | |
| 4.95s, 2042 | 200,000 | 212,669 |
|
| WPP Finance UK company guaranty sr. unsec. notes 8s, 2014 | | |
| (United Kingdom) | 690,000 | 777,671 |
|
| | | 11,196,875 |
| Energy (1.0%) | | |
| Anadarko Finance Co. company guaranty sr. unsec. unsub. notes | | |
| Ser. B, 7 1/2s, 2031 | 985,000 | 1,236,038 |
|
| BG Energy Capital PLC 144A company guaranty sr. unsec. notes | | |
| 4s, 2021 (United Kingdome) | 250,000 | 267,979 |
|
| BP Capital Markets PLC company guaranty sr. unsec. unsub. notes | | |
| 4.742s, 2021 (United Kingdom) | 655,000 | 751,830 |
|
| BP Capital Markets PLC company guaranty sr. unsec. unsub. notes | | |
| 4 1/2s, 2020 (United Kingdom) | 175,000 | 195,962 |
|
| Chesapeake Energy Corp. sr. unsec. notes 7 5/8s, 2013 | 10,000 | 10,525 |
|
| DCP Midstream, LLC 144A sr. unsec. notes 5.35s, 2020 | 375,000 | 407,008 |
|
23
| | |
| CORPORATE BONDS AND NOTES (16.4%)* cont. | Principal amount | Value |
|
| Energy cont. | | |
| El Paso Pipeline Partners Operating Co., LP company guaranty | | |
| sr. unsec. notes 6 1/2s, 2020 | $235,000 | $261,438 |
|
| Ente Nazionale Idrocarburi (ENI) SpA 144A sr. unsec. notes 4.15s, | | |
| 2020 (Italy) | 825,000 | 830,699 |
|
| EOG Resources, Inc. sr. unsec. notes 5 5/8s, 2019 | 205,000 | 246,064 |
|
| Kerr-McGee Corp. company guaranty sr. unsec. unsub. notes | | |
| 7 7/8s, 2031 | 340,000 | 442,486 |
|
| Marathon Petroleum Corp. sr. unsec. unsub. notes 6 1/2s, 2041 | 175,000 | 194,357 |
|
| Motiva Enterprises, LLC 144A sr. unsec. unsub. notes 5.2s, 2012 | 225,000 | 229,741 |
|
| Motiva Enterprises, LLC 144A sr. unsec. notes 6.85s, 2040 | 220,000 | 284,512 |
|
| Newfield Exploration Co. sr. sub. notes 6 5/8s, 2016 | 650,000 | 666,250 |
|
| Noble Holding International, Ltd. company guaranty sr. unsec. notes | | |
| 6.05s, 2041 | 390,000 | 439,566 |
|
| Petrobras International Finance Co. company guaranty sr. unsec. | | |
| notes 6 3/4s, 2041 (Brazil) | 300,000 | 341,614 |
|
| Petrobras International Finance Co. company guaranty sr. unsec. | | |
| notes 5 3/8s, 2021 (Brazil) | 825,000 | 864,555 |
|
| Petrobras International Finance Co. company guaranty sr. unsec. | | |
| notes 3 7/8s, 2016 (Brazil) | 355,000 | 363,479 |
|
| Pride International, Inc. sr. unsec. notes 7 7/8s, 2040 | 760,000 | 1,033,545 |
|
| Ras Laffan Liquefied Natural Gas Co., Ltd. 144A company guaranty | | |
| sr. notes 5 1/2s, 2014 (Qatar) | 675,000 | 720,563 |
|
| Spectra Energy Partners LP sr. unsec. notes 4.6s, 2021 | 245,000 | 258,885 |
|
| Statoil ASA company guaranty sr. unsec. notes 5.1s, 2040 (Norway) | 480,000 | 574,901 |
|
| Weatherford Bermuda company guaranty sr. unsec. notes 9 5/8s, 2019 | 180,000 | 241,155 |
|
| Weatherford International, Inc. company guaranty sr. unsec. unsub. | | |
| notes 6.8s, 2037 | 245,000 | 278,737 |
|
| Weatherford International, Inc. company guaranty sr. unsec. unsub. | | |
| notes 6.35s, 2017 | 280,000 | 319,590 |
|
| Weatherford International, Ltd. sr. notes 5 1/2s, 2016 (Switzerland) | 455,000 | 504,088 |
|
| | | 11,965,567 |
| Financials (6.8%) | | |
| ABN Amro Bank NV 144A sr. unsec. notes 4 1/4s, 2017 (Netherlands) | 3,030,000 | 3,029,166 |
|
| Aflac, Inc. sr. unsec. notes 6.9s, 2039 | 500,000 | 574,748 |
|
| Aflac, Inc. sr. unsec. notes 6.45s, 2040 | 345,000 | 378,142 |
|
| American Express Bank FSB notes Ser. BKN1, 5.55s, 2012 | 1,160,000 | 1,194,945 |
|
| American Express Bank FSB sr. unsec. FRN Ser. BKNT, 0.596s, 2017 | 545,000 | 501,551 |
|
| American International Group, Inc. jr. sub. bonds FRB 8.175s, 2058 | 300,000 | 289,500 |
|
| American International Group, Inc. sr. unsec. Ser. MTN, 5.85s, 2018 | 665,000 | 694,113 |
|
| AON Corp. jr. unsec. sub. notes 8.205s, 2027 | 1,150,000 | 1,355,538 |
|
| Assurant, Inc. sr. unsec. notes 6 3/4s, 2034 | 525,000 | 555,678 |
|
| Bank Nederlandse Gemeenten 144A bonds 1 3/4s, 2015 (Netherlands) | 12,100,000 | 12,127,700 |
|
| Bank of America Corp. sr. unsec. unsub. notes 6 1/2s, 2016 | 1,405,000 | 1,498,137 |
|
| Bank of America NA sub. notes Ser. BKNT, 5.3s, 2017 | 315,000 | 313,435 |
|
| Barclays Bank PLC jr. unsec. sub. notes FRN 6.278s, 2049 | | |
| (United Kingdom) | 145,000 | 114,550 |
|
| Barclays Bank PLC 144A sub. notes 10.179s, 2021 (United Kingdom) | 804,000 | 922,172 |
|
| Barclays Bank PLC 144A unsec. sub. notes 6.05s, 2017 | | |
| (United Kingdom) | 1,415,000 | 1,426,534 |
|
24
| | |
| CORPORATE BONDS AND NOTES (16.4%)* cont. | Principal amount | Value |
|
| Financials cont. | | |
| Bear Stearns Cos., Inc. (The) sr. notes 6.4s, 2017 | $500,000 | $570,569 |
|
| Bear Stearns Cos., Inc. (The) sr. unsec. notes 7 1/4s, 2018 | 331,000 | 395,797 |
|
| Bosphorus Financial Services, Ltd. 144A sr. notes FRN 2.257s, 2012 | 148,625 | 148,597 |
|
| Camden Property Trust sr. unsec. notes 4 7/8s, 2023 R | 1,040,000 | 1,114,345 |
|
| Capital One Bank USA NA sub. notes 8.8s, 2019 | 385,000 | 464,081 |
|
| Capital One Capital III company guaranty jr. unsec. sub. notes | | |
| 7.686s, 2036 | 320,000 | 323,200 |
|
| Capital One Capital V company guaranty jr. unsec. sub. notes | | |
| 10 1/4s, 2039 | 450,000 | 470,813 |
|
| Citigroup, Inc. sr. unsec. sub. FRN 0.81s, 2016 | 123,000 | 100,331 |
|
| Citigroup, Inc. sub. notes 5s, 2014 | 1,369,000 | 1,407,810 |
|
| Citigroup, Inc. unsec. sub. notes 6 1/8s, 2036 | 200,000 | 192,985 |
|
| Citigroup, Inc. unsec. sub. notes 5 5/8s, 2012 | 290,000 | 295,538 |
|
| CNA Financial Corp. sr. unsec. unsub. notes 5 3/4s, 2021 | 210,000 | 221,758 |
|
| CNA Financial Corp. unsec. notes 6 1/2s, 2016 | 435,000 | 474,384 |
|
| Commonwealth Bank of Australia 144A sr. unsec. notes 3 3/4s, | | |
| 2014 (Australia) | 1,220,000 | 1,268,785 |
|
| Credit Suisse Guernsey sr. unsec. notes 5.3s, 2019 | 475,000 | 509,240 |
|
| DDR Corp. sr. unsec. unsub. notes 7 7/8s, 2020 R | 605,000 | 715,630 |
|
| Deutsche Bank AG/London sr. unsec. notes 3 7/8s, 2014 | | |
| (United Kingdom) | 635,000 | 660,843 |
|
| Deutsche Bank Capital Funding Trust VII 144A jr. unsec. sub. bonds | | |
| FRB 5.628s, 2016 | 470,000 | 357,200 |
|
| Duke Realty LP sr. unsec. notes 6 1/2s, 2018 R | 361,000 | 413,453 |
|
| Duke Realty LP sr. unsec. notes 6 1/4s, 2013 R | 19,000 | 19,882 |
|
| Erac USA Finance, Co. 144A sr. notes 4 1/2s, 2021 | 785,000 | 809,316 |
|
| GATX Financial Corp. notes 5.8s, 2016 | 560,000 | 605,211 |
|
| GE Capital Trust I unsec. sub. bonds FRB 6 3/8s, 2067 | 355,000 | 353,704 |
|
| General Electric Capital Corp. sr. unsec. 5 5/8s, 2018 | 260,000 | 298,094 |
|
| General Electric Capital Corp. sr. unsec. FRN Ser. MTN, 0.653s, 2016 | 455,000 | 422,399 |
|
| General Electric Capital Corp. sr. unsec. notes 6 3/4s, 2032 | 40,000 | 47,899 |
|
| General Electric Capital Corp. sr. unsec. notes 6.15s, 2037 | 1,200,000 | 1,360,045 |
|
| Genworth Financial, Inc. sr. unsec. unsub. notes 7 5/8s, 2021 | 1,410,000 | 1,398,540 |
|
| Goldman Sachs Group, Inc. (The) sr. notes 7 1/2s, 2019 | 805,000 | 917,852 |
|
| Goldman Sachs Group, Inc. (The) sub. notes 6 3/4s, 2037 | 745,000 | 739,751 |
|
| Hartford Financial Services Group, Inc. (The) sr. unsec. unsub. notes | | |
| 6 5/8s, 2040 | 1,540,000 | 1,572,593 |
|
| HBOS PLC 144A sr. unsec. sub. notes 6 3/4s, 2018 (United Kingdom) | 360,000 | 316,725 |
|
| HBOS PLC 144A unsec. sub. bonds 6s, 2033 (United Kingdom) | 890,000 | 625,925 |
|
| Highwood Realty LP sr. unsec. bonds 5.85s, 2017 R | 1,005,000 | 1,082,454 |
|
| HSBC Finance Capital Trust IX FRN 5.911s, 2035 | 2,000,000 | 1,730,000 |
|
| HSBC Holdings PLC sub. notes 6 1/2s, 2037 (United Kingdom) | 905,000 | 962,519 |
|
| ING Bank NV 144A sr. unsec. notes FRN 1.596s, 2013 (Netherlands) | 1,535,000 | 1,514,726 |
|
| International Lease Finance Corp. sr. unsec. notes 6 1/4s, 2019 | 275,000 | 270,531 |
|
| JPMorgan Chase Bank NA sub. notes Ser. BKNT, 6s, 2017 | 1,000,000 | 1,110,463 |
|
| JPMorgan Chase Capital XVIII bonds Ser. R, 6.95s, 2036 | 499,000 | 504,511 |
|
| JPMorgan Chase Capital XXIII company guaranty jr. unsec. sub. notes | | |
| FRN 1.457s, 2047 | 2,443,000 | 1,712,414 |
|
25
| | |
| CORPORATE BONDS AND NOTES (16.4%)* cont. | Principal amount | Value |
|
| Financials cont. | | |
| JPMorgan Chase Capital XXV bonds Ser. Y, 6.8s, 2037 | $523,000 | $527,636 |
|
| Liberty Mutual Insurance Co. 144A notes 7.697s, 2097 | 1,060,000 | 993,636 |
|
| Lloyds TSB Bank PLC bank guaranty sr. unsec. unsub. notes 6 3/8s, | | |
| 2021 (United Kingdom) | 280,000 | 299,524 |
|
| Lloyds TSB Bank PLC company guaranty sr. unsec. sub. notes | | |
| Ser. MTN, 6 1/2s, 2020 (United Kingdom) | 1,080,000 | 1,007,463 |
|
| Macquarie Bank Ltd. 144A unsec. sub. notes 6 5/8s, 2021 (Australia) | 1,020,000 | 970,860 |
|
| Massachusetts Mutual Life Insurance Co. 144A notes 8 7/8s, 2039 | 815,000 | 1,199,924 |
|
| Merrill Lynch & Co., Inc. jr. sub. bonds 7 3/4s, 2038 | 1,565,000 | 1,646,547 |
|
| MetLife Capital Trust IV 144A jr. sub. debs. 7 7/8s, 2037 | 1,300,000 | 1,387,750 |
|
| MetLife, Inc. jr. unsec. sub. notes 6.4s, 2036 | 590,000 | 574,916 |
|
| Metropolitan Life Global Funding I 144A notes 3.65s, 2018 | 100,000 | 104,979 |
|
| Nationwide Financial Services, Inc. notes 5 5/8s, 2015 | 465,000 | 491,805 |
|
| Nationwide Mutual Insurance Co. 144A notes 8 1/4s, 2031 | 415,000 | 453,142 |
|
| Nordea Bank AB 144A jr. unsec. sub. notes FRN 5.424s, 2015 | | |
| (Sweden) | 525,000 | 498,750 |
|
| Nordea Bank AB 144A sub. notes 4 7/8s, 2021 (Sweden) | 1,300,000 | 1,225,844 |
|
| OneAmerica Financial Partners, Inc. 144A bonds 7s, 2033 | 370,000 | 380,407 |
|
| Pacific LifeCorp 144A sr. notes 6s, 2020 | 365,000 | 397,610 |
|
| Progressive Corp. (The) jr. unsec. sub. notes FRN 6.7s, 2037 | 2,020,000 | 2,070,500 |
|
| Prudential Financial, Inc. sr. notes 7 3/8s, 2019 | 600,000 | 730,031 |
|
| Prudential Financial, Inc. sr. notes 6.2s, 2015 | 190,000 | 210,453 |
|
| Prudential Holdings, LLC sr. notes FRN Ser. AGM, 1.434s, 2017 | 210,000 | 200,245 |
|
| Royal Bank of Scotland Group PLC sr. unsec. unsub. notes 6.4s, | | |
| 2019 (United Kingdom) | 355,000 | 365,084 |
|
| Santander Issuances S.A. Unipersonal 144A bank guaranty unsec. | | |
| sub. notes 5.911s, 2016 (Spain) | 900,000 | 796,266 |
|
| Societe Generale SA 144A jr. unsec. sub. bonds FRN 1.333s, | | |
| 2017 (France) | 385,000 | 187,949 |
|
| Standard Chartered PLC 144A jr. sub. bonds FRB 7.014s, 2049 | | |
| (United Kingdom) | 800,000 | 772,794 |
|
| State Street Capital Trust IV company guaranty jr. unsec. sub. bonds | | |
| FRB 1.546s, 2037 | 1,790,000 | 1,205,738 |
|
| Tanger Properties, LP sr. unsec. notes 6 1/8s, 2020 R | 265,000 | 299,480 |
|
| TD Ameritrade Holding Corp. company guaranty sr. unsec. unsub. | | |
| notes 5.6s, 2019 | 480,000 | 520,939 |
|
| Teachers Insurance & Annuity Association of America 144A notes | | |
| 6.85s, 2039 | 750,000 | 987,665 |
|
| Ventas Realty LP/Capital Corp. sr. notes 6 3/4s, 2017 R | 470,000 | 486,995 |
|
| Vornado Realty LP sr. unsec. unsub. notes 4 1/4s, 2015 R | 555,000 | 579,543 |
|
| Wachovia Bank NA sub. notes Ser. BKNT, 6s, 2017 | 1,060,000 | 1,205,855 |
|
| Wachovia Corp. sr. unsec. notes 5 3/4s, 2017 | 145,000 | 166,631 |
|
| WEA Finance, LLC/ WT Finance Aust. Pty. Ltd. 144A company | | |
| guaranty sr. unsec. notes 6 3/4s, 2019 | 570,000 | 673,488 |
|
| Wells Fargo Bank NA unsec. sub. notes FRN 0.671s, 2016 | 710,000 | 643,480 |
|
| Westpac Capital Trust III 144A unsec. sub. notes FRN 5.819s, | | |
| 2013 (Australia) | 1,010,000 | 975,387 |
|
26
| | |
| CORPORATE BONDS AND NOTES (16.4%)* cont. | Principal amount | Value |
|
| Financials cont. | | |
| Willis Group Holdings Ltd. company guaranty sr. unsec. unsub. | | |
| notes 5 3/4s, 2021 (United Kingdom) | $710,000 | $769,983 |
|
| ZFS Finance USA Trust V 144A bonds FRB 6 1/2s, 2037 | 159,000 | 146,280 |
|
| | | 79,612,401 |
| Government (0.5%) | | |
| International Bank for Reconstruction & Development unsec. | | |
| unsub. bonds 7 5/8s, 2023 | 4,000,000 | 5,870,192 |
|
| | | 5,870,192 |
| Health care (0.2%) | | |
| Aetna, Inc. sr. unsec. unsub. notes 6 3/4s, 2037 | 95,000 | 121,768 |
|
| CIGNA Corp. sr. unsec. unsub. notes 5 3/8s, 2042 | 205,000 | 217,786 |
|
| Coventry Health Care, Inc. sr. unsec. notes 5.45s, 2021 | 450,000 | 500,079 |
|
| Quest Diagnostics, Inc. company guaranty sr. unsec. notes | | |
| 6.95s, 2037 | 335,000 | 427,808 |
|
| Quest Diagnostics, Inc. company guaranty sr. unsec. notes | | |
| 4 3/4s, 2020 | 121,000 | 132,062 |
|
| UnitedHealth Group, Inc. sr. unsec. unsub. notes 4 5/8s, 2041 | 300,000 | 319,021 |
|
| WellPoint, Inc. notes 7s, 2019 | 155,000 | 191,256 |
|
| | | 1,909,780 |
| Technology (0.2%) | | |
| Computer Sciences Corp. sr. unsec. notes 6 1/2s, 2018 | 281,000 | 286,620 |
|
| Dell, Inc. sr. unsec. notes 5 7/8s, 2019 | 715,000 | 852,329 |
|
| KLA-Tencor Corp. sr. unsec. notes 6.9s, 2018 | 915,000 | 1,081,832 |
|
| Xerox Corp. sr. unsec. notes 4 1/2s, 2021 | 395,000 | 405,417 |
|
| | | 2,626,198 |
| Transportation (0.4%) | | |
| American Airlines 2011-2 Class A Pass Through Trust company | | |
| guaranty secured airplanes 8 5/8s, 2021 | 340,000 | 360,400 |
|
| Burlington Northern Santa Fe Corp. sr. unsec. notes 4.7s, 2019 | 176,000 | 202,147 |
|
| Burlington Northern Santa Fe, LLC sr. unsec. notes 5.4s, 2041 | 605,000 | 703,272 |
|
| Burlington Northern Santa Fe, LLC sr. unsec. unsub. notes | | |
| 5 3/4s, 2040 | 145,000 | 177,885 |
|
| Continental Airlines, Inc. pass-through certificates Ser. 97-4A, | | |
| 6.9s, 2018 | 152,607 | 162,526 |
|
| Continental Airlines, Inc. pass-through certificates Ser. 98-1A, | | |
| 6.648s, 2017 | 388,751 | 404,301 |
|
| CSX Corp. sr. unsec. unsub. notes 4 3/4s, 2042 | 205,000 | 215,249 |
|
| Norfolk Southern Corp. sr. unsec. notes 6s, 2111 | 390,000 | 461,909 |
|
| Northwest Airlines Corp. pass-through certificates Ser. 00-1, | | |
| 7.15s, 2019 | 1,283,791 | 1,264,534 |
|
| Southwest Airlines Co. pass-through certificates Ser. 07-1, | | |
| 6.15s, 2022 | 727,442 | 785,638 |
|
| Union Pacific Corp. 144A pass-through certificates 5.214s, 2014 | 590,000 | 645,962 |
|
| | | 5,383,823 |
| Utilities and power (2.4%) | | |
| AEP Texas North Co. sr. notes Ser. B, 5 1/2s, 2013 | 500,000 | 520,643 |
|
| Appalachian Power Co. sr. notes Ser. L, 5.8s, 2035 | 510,000 | 600,927 |
|
| Arizona Public Services Co. sr. unsec. notes 4 1/2s, 2042 | 120,000 | 122,227 |
|
| Atmos Energy Corp. sr. unsub. notes 6.35s, 2017 | 1,230,000 | 1,462,931 |
|
| Beaver Valley Funding Corp. sr. bonds 9s, 2017 | 493,000 | 515,732 |
|
| Boardwalk Pipelines LP company guaranty sr. unsec. notes | | |
| 5 7/8s, 2016 | 975,000 | 1,102,227 |
|
27
| | |
| CORPORATE BONDS AND NOTES (16.4%)* cont. | Principal amount | Value |
|
| Utilities and power cont. | | |
| Bruce Mansfield Unit pass-through certificates 6.85s, 2034 | $1,308,125 | $1,401,329 |
|
| Commonwealth Edison Co. 1st mtge. 6.15s, 2017 | 275,000 | 333,868 |
|
| Commonwealth Edison Co. 1st mtge. sec. bonds 5 7/8s, 2033 | 500,000 | 615,285 |
|
| Consolidated Natural Gas Co. sr. notes Ser. A, 5s, 2014 | 530,000 | 581,639 |
|
| Dominion Resources, Inc. jr. sub. notes FRN Ser. 06-B, 2.879s, 2066 | 2,310,000 | 2,000,430 |
|
| Dominion Resources, Inc. sr. unsec. unsub. notes Ser. 07-A, 6s, 2017 | 10,000 | 12,060 |
|
| Duke Energy Carolinas, LLC sr. mtge. notes 4 1/4s, 2041 | 450,000 | 477,832 |
|
| EDP Finance BV 144A sr. unsec. unsub. notes 6s, 2018 | | |
| (Netherlands) | 685,000 | 596,556 |
|
| El Paso Natural Gas Co. sr. unsec. unsub. bonds 8 3/8s, 2032 | 490,000 | 608,314 |
|
| Electricite de France 144A notes 6.95s, 2039 (France) | 655,000 | 776,278 |
|
| Electricite de France 144A sr. notes 5.6s, 2040 (France) | 640,000 | 662,127 |
|
| Electricite de France 144A sr. notes 4.6s, 2020 (France) | 440,000 | 457,765 |
|
| Enel Finance International SA 144A company guaranty sr. unsec. | | |
| notes 5 1/8s, 2019 (Luxembourg) | 360,000 | 329,314 |
|
| Energy Transfer Partners LP sr. unsec. unsub. notes 6 1/2s, 2042 | 280,000 | 301,508 |
|
| Energy Transfer Partners LP sr. unsec. unsub. notes 6.05s, 2041 | 410,000 | 417,336 |
|
| Energy Transfer Partners LP sr. unsec. unsub. notes 5.2s, 2022 | 240,000 | 253,348 |
|
| Enterprise Products Operating, LLC company guaranty sr. unsec. | | |
| unsub. notes 5.7s, 2042 | 365,000 | 405,108 |
|
| Enterprise Products Operating, LLC company guaranty sr. unsec. | | |
| unsub. notes 3.2s, 2016 | 610,000 | 635,812 |
|
| Iberdrola International BV company guaranty sr. unsec. unsub. | | |
| notes 6 3/4s, 2036 | 185,000 | 207,544 |
|
| ITC Holdings Corp. 144A notes 5 7/8s, 2016 | 270,000 | 308,408 |
|
| ITC Holdings Corp. 144A sr. unsec. notes 6.05s, 2018 | 365,000 | 427,737 |
|
| Kansas Gas and Electric Co. bonds 5.647s, 2021 | 306,512 | 335,327 |
|
| KCP&L Greater Missouri Operations Co. sr. unsec. unsub. notes | | |
| 11 7/8s, 2012 | 735,000 | 766,322 |
|
| Nevada Power Co. mtge. sec. notes 7 1/8s, 2019 | 295,000 | 375,217 |
|
| Pacific Gas & Electric Co. sr. unsec. notes 6.35s, 2038 | 350,000 | 458,593 |
|
| Pacific Gas & Electric Co. sr. unsub. 5.8s, 2037 | 140,000 | 172,587 |
|
| Potomac Edison Co. 144A 1st mtge. 5.8s, 2016 | 331,000 | 380,550 |
|
| PPL WEM Holdings PLC 144A sr. unsec. notes 5 3/8s, 2021 | | |
| (United Kingdom) | 1,285,000 | 1,388,963 |
|
| Puget Sound Energy, Inc. jr. sub. FRN Ser. A, 6.974s, 2067 | 656,000 | 656,000 |
|
| Spectra Energy Capital, LLC company guaranty sr. unsec. unsub. | | |
| notes 6.2s, 2018 | 1,080,000 | 1,253,527 |
|
| Spectra Energy Capital, LLC sr. notes 8s, 2019 | 820,000 | 1,047,479 |
|
| Teco Finance, Inc. company guaranty sr. unsec. unsub. notes | | |
| 6.572s, 2017 | 110,000 | 131,155 |
|
| Texas-New Mexico Power Co. 144A 1st mtge. sec. 9 1/2s, 2019 | 1,024,000 | 1,345,237 |
|
| Trans-Canada Pipelines, Ltd. jr. unsec. sub. notes FRN 6.35s, | | |
| 2067 (Canada) | 975,000 | 985,621 |
|
| Union Electric Co. 1st mtge. sr. sec. bonds 6.7s, 2019 | 960,000 | 1,175,667 |
|
| Wisconsin Energy Corp. jr. unsec. sub. notes FRN 6 1/4s, 2067 | 1,945,000 | 1,988,763 |
|
| | | 28,595,293 |
| | | |
| Total corporate bonds and notes (cost $179,218,124) | | $192,985,494 |
28
| | |
| CONVERTIBLE PREFERRED STOCKS (1.3%)* | Shares | Value |
|
| Apache Corp. Ser. D, $3.00 cv. pfd. | 51,305 | $2,946,831 |
|
| General Motors Co. Ser. B, $2.375 cv. pfd. | 89,334 | 3,578,943 |
|
| MetLife, Inc. $3.75 cv. pfd. | 48,800 | 3,343,288 |
|
| PPL Corp. $4.75 cv. pfd. | 55,331 | 2,991,747 |
|
| PPL Corp. $4.375 cv. pfd. | 43,000 | 2,256,210 |
|
| Total convertible preferred stocks (cost $16,299,510) | | $15,117,019 |
|
| |
| INVESTMENT COMPANIES (1.1%)* | Shares | Value |
|
| Financial Select Sector SPDR Fund | 298,100 | $4,191,286 |
|
| Market Vectors Gold Miners ETF | 15,400 | 790,328 |
|
| Utilities Select Sector SPDR Fund | 141,300 | 4,900,284 |
|
| Vanguard MSCI Emerging Markets ETF | 72,400 | 3,063,968 |
|
| Total investment companies (cost $11,620,020) | | $12,945,866 |
|
| |
| MORTGAGE-BACKED SECURITIES (0.6%)* | Principal amount | Value |
|
| CS First Boston Mortgage Securities Corp. Ser. 04-C1, Class B, | | |
| 4.855s, 2037 | $1,407,000 | $1,442,175 |
|
| Federal Home Loan Mortgage Corp. | | |
| Ser. T-56, Class A, IO, 0.524s, 2043 | 5,675,409 | 102,867 |
| Ser. T-56, Class 3, IO, 0.474s, 2043 | 6,710,899 | 3,146 |
| Ser. T-56, Class 1, IO, 0.294s, 2043 | 8,899,926 | 5,562 |
| Ser. T-56, Class 2, IO, 0.124s, 2043 | 8,087,768 | 7,582 |
|
| Federal National Mortgage Association Ser. 01-79, Class BI, IO, | | |
| 0.31s, 2045 | 1,888,141 | 16,521 |
|
| GMAC Commercial Mortgage Securities, Inc. 144A Ser. 99-C3, | | |
| Class G, 6.974s, 2036 | 197,236 | 171,595 |
|
| GS Mortgage Securities Corp. II 144A Ser. 98-C1, Class F, 6s, 2030 | 882,873 | 891,701 |
|
| LB Commercial Conduit Mortgage Trust 144A | | |
| Ser. 99-C1, Class F, 6.41s, 2031 | 715,303 | 683,114 |
| Ser. 99-C1, Class G, 6.41s, 2031 | 765,731 | 673,843 |
| Ser. 98-C4, Class H, 5.6s, 2035 | 1,074,000 | 1,176,044 |
|
| Morgan Stanley Capital I | | |
| FRB Ser. 07-HQ12, Class A2, 5.783s, 2049 | 809,252 | 825,426 |
| FRB Ser. 07-HQ12, Class A2FL, 0.545s, 2049 | 721,546 | 678,253 |
|
| PNC Mortgage Acceptance Corp. 144A Ser. 00-C1, Class J, | | |
| 6 5/8s, 2033 | 456,000 | 22,800 |
|
| Structured Asset Securities Corp. 144A FRB Ser. 04-NP2, | | |
| Class A, 0.626s, 2034 | 397,853 | 318,282 |
|
| Total mortgage-backed securities (cost $6,677,214) | | $7,018,911 |
|
| |
| MUNICIPAL BONDS AND NOTES (0.2%)* | Principal amount | Value |
|
| CA State G.O. Bonds (Build America Bonds), 7 1/2s, 4/1/34 | $215,000 | $280,951 |
|
| IL State G.O. Bonds | | |
| 4.421s, 1/1/15 | 420,000 | 442,390 |
| 4.071s, 1/1/14 | 1,250,000 | 1,296,613 |
|
| North TX, Thruway Auth. Rev. Bonds (Build America Bonds), | | |
| 6.718s, 1/1/49 | 350,000 | 452,540 |
|
| OH State U. Rev. Bonds (Build America Bonds), 4.91s, 6/1/40 | 275,000 | 317,688 |
|
| Total municipal bonds and notes (cost $2,511,495) | | $2,790,182 |
29
| | |
| ASSET-BACKED SECURITIES (0.1%)* | Principal amount | Value |
|
| First Plus Home Loan Trust Ser. 97-3, Class B1, 7.79s, 2023 | | |
| (In default) † | $194,241 | $19 |
|
| G-Star, Ltd. 144A FRB Ser. 02-2A, Class BFL, 2.276s, 2037 | 308,000 | 244,860 |
|
| GE Business Loan Trust 144A Ser. 04-2, Class D, 3.035s, 2032 | 376,257 | 150,126 |
|
| Structured Asset Securities Corp. 144A Ser. 98-RF3, Class A, IO, | | |
| 6.1s, 2028 | 1,147,177 | 163,976 |
|
| TIAA Real Estate CDO, Ltd. Ser. 03-1A, Class E, 8s, 2038 | 1,874,214 | 224,906 |
|
| Total asset-backed securities (cost $775,865) | | $783,887 |
|
| |
| FOREIGN GOVERNMENT BONDS AND NOTES (0.1%)* | Principal amount | Value |
|
| Hungary (Republic of) sr. unsec. unsub. notes 7 5/8s, 2041 | $226,000 | $207,705 |
|
| Korea Development Bank sr. unsec. unsub. notes 4s, 2016 | 450,000 | 458,699 |
|
| Total foreign government bonds and notes (cost $684,039) | | $666,404 |
|
| |
| U.S. GOVERNMENT AND AGENCY | | |
| MORTGAGE OBLIGATIONS (11.4%)* | Principal amount | Value |
|
| U.S. Government Guaranteed Mortgage Obligations (1.7%) | | |
| Government National Mortgage Association | | |
| Pass-Through Certificates | | |
| 4s, February 20, 2041 | $10,435,844 | $11,254,406 |
| 3 1/2s, TBA, February 1, 2042 | 8,000,000 | 8,405,625 |
|
| | | 19,660,031 |
| U.S. Government Agency Mortgage Obligations (9.7%) | | |
| Federal Home Loan Mortgage Corporation | | |
| Pass-Through Certificates | | |
| 6s, March 1, 2035 | 9,296 | 10,368 |
| 3 1/2s, January 1, 2041 | 534,648 | 554,886 |
|
| Federal National Mortgage Association | | |
| Pass-Through Certificates | | |
| 6s, TBA, February 1, 2042 | 24,000,000 | 26,377,500 |
| 5 1/2s, with due dates from July 1, 2033 to November 1, 2038 | 8,449,463 | 9,190,457 |
| 5s, with due dates from August 1, 2033 to January 1, 2039 | 4,378,840 | 4,726,589 |
| 4 1/2s, August 1, 2033 ∆ | 11 | 11,655 |
| 4 1/2s, April 1, 2041 ∆ | 559,073 | 589,822 |
| 4 1/2s, TBA, February 1, 2042 | 47,000,000 | 50,223,909 |
| 3 1/2s, December 1, 2040 | 914,366 | 950,762 |
| 3 1/2s, TBA, February 1, 2042 | 21,000,000 | 21,818,672 |
|
| | | 114,454,620 |
| | |
| Total U.S. government and agency mortgage obligations (cost $131,906,804) | $134,114,651 |
|
| |
| U.S. GOVERNMENT AGENCY OBLIGATIONS (0.1%)* | Principal amount | Value |
|
| Wells Fargo & Co. 2 1/8s, FDIC guaranteed notes, June 15, 2012 | $1,400,000 | $1,410,234 |
|
| Total U.S. government agency obligations (cost $1,401,552) | | $1,410,234 |
30
| | |
| U.S. TREASURY OBLIGATIONS (4.7%)* | Principal amount | Value |
|
| U.S. Treasury Bonds 4 1/2s, February 15, 2036 | $30,000 | $39,134 |
|
| U.S. Treasury Notes | | |
| 3 1/2s, May 31, 2013 | 16,500,000 | 17,227,998 |
| 3 1/8s, May 15, 2021 | 600,000 | 674,508 |
| U.S. Treasury Notes | | |
| 2 5/8s, February 29, 2016 | 31,600,000 | 34,309,454 |
| 1 1/4s, April 15, 2014 | 3,100,000 | 3,169,387 |
|
| Total U.S. treasury obligations (cost $55,064,048) | | $55,420,481 |
|
| |
| SHORT-TERM INVESTMENTS (15.1%)* | Principal amount/shares | Value |
|
| Putnam Money Market Liquidity Fund 0.08% e | 123,463,197 | $123,463,197 |
|
| Federal Home Loan Discount Notes with an effective yield | | |
| of 0.030%, February 3, 2012 | $9,866,000 | 9,865,984 |
|
| Straight-A Funding, LLC commercial paper with an effective | | |
| yield of 0.128%, February 16, 2012 | 8,650,000 | 8,649,531 |
|
| Straight-A Funding, LLC commercial paper with an effective | | |
| yield of 0.037%, April 16, 2012 | 16,000,000 | 15,997,122 |
|
| Straight-A Funding, LLC commercial paper with an effective | | |
| yield of 0.188%, February 1, 2012 | 10,203,000 | 10,203,000 |
|
| U.S. Treasury Bills with an effective yield of 0.013%, | | |
| February 16, 2012 | 7,000,000 | 6,999,962 |
|
| U.S. Treasury Bills with an effective yield of 0.010%, | | |
| February 9, 2012 | 3,000,000 | 2,999,993 |
|
| Total short-term investments (cost $178,175,334) | | $178,178,789 |
|
| |
| TOTAL INVESTMENTS | | |
|
| Total investments (cost $1,187,886,253) | | $1,278,103,748 |
| |
| Key to holding’s abbreviations |
| ADR | American Depository Receipts: represents ownership of foreign securities on deposit with a |
| | custodian bank |
| ASC 820 | Accounting Standards Codification ASC 820 Fair Value Measurements and Disclosures |
| ETF | Exchange Traded Fund |
| FRB | Floating Rate Bonds: the rate shown is the current interest rate at the close of the reporting period |
| FRN | Floating Rate Notes: the rate shown is the current interest rate at the close of the reporting period |
| G.O. Bonds | General Obligation Bonds |
| IO | Interest Only |
| MTN | Medium Term Notes |
| SPDR | S&P Depository Receipts |
| TBA | To Be Announced Commitments |
31
Notes to the fund’s portfolio
Unless noted otherwise, the notes to the fund’s portfolio are for the close of the fund’s reporting period, which ran from August 1, 2011 through January 31, 2012 (the reporting period).
* Percentages indicated are based on net assets of $1,176,232,892.
† Non-income-producing security.
∆ Forward commitment, in part or in entirety (Note 1).
e See Note 5 to the financial statements regarding investments in Putnam Money Market Liquidity Fund. The rate quoted in the security description is the annualized 7-day yield of the fund at the close of the reporting period.
R Real Estate Investment Trust.
At the close of the reporting period, the fund maintained liquid assets totaling $79,922,734 to cover certain TBA contracts.
Debt obligations are considered secured unless otherwise indicated.
144A after the name of an issuer represents securities exempt from registration under Rule 144A under the Securities Act of 1933, as amended. These securities may be resold in transactions exempt from registration, normally to qualified institutional buyers.
See Note 1 to the financial statements regarding TBA’s.
The fund had the following sector concentration greater than 10% at the close of the reporting period (as a percentage of net assets):
| | | | |
| TBA SALE COMMITMENTS OUTSTANDING at 1/31/12 (proceeds receivable $26,415,938) (Unaudited) | |
| | Principal | | Settlement | |
| Agency | amount | | date | Value |
|
| FNMA, 6s, February 1, 2042 | $24,000,000 | | 2/13/12 | $26,377,500 |
|
| Total | | | | $26,377,500 |
32
ASC 820 establishes a three-level hierarchy for disclosure of fair value measurements. The valuation hierarchy is based upon the transparency of inputs to the valuation of the fund’s investments. The three levels are defined as follows:
Level 1: Valuations based on quoted prices for identical securities in active markets.
Level 2: Valuations based on quoted prices in markets that are not active or for which all significant inputs are observable, either directly or indirectly.
Level 3: Valuations based on inputs that are unobservable and significant to the fair value measurement.
The following is a summary of the inputs used to value the fund’s net assets as of the close of the reporting period:
| | | |
| | | Valuation inputs | |
|
| Investments in securities: | Level 1 | Level 2 | Level 3 |
|
| Common stocks: | | | |
|
| Basic materials | $22,210,327 | $— | $— |
|
| Capital goods | 39,705,002 | — | — |
|
| Communication services | 54,199,986 | — | — |
|
| Conglomerates | 26,986,027 | — | — |
|
| Consumer cyclicals | 63,637,123 | — | — |
|
| Consumer staples | 53,750,508 | — | — |
|
| Energy | 76,905,340 | — | — |
|
| Financials | 138,278,320 | — | — |
|
| Health care | 109,931,724 | — | — |
|
| Technology | 56,734,019 | — | — |
|
| Transportation | 4,313,906 | — | — |
|
| Utilities and power | 30,019,548 | — | — |
|
| Total common stocks | 676,671,830 | — | — |
| | | | |
| Asset-backed securities | — | 783,887 | — |
|
| Convertible preferred stocks | — | 15,117,019 | — |
|
| Corporate bonds and notes | — | 192,985,494 | — |
|
| Foreign government bonds and notes | — | 666,404 | — |
|
| Investment companies | 12,945,866 | — | — |
|
| Mortgage-backed securities | — | 7,018,911 | — |
|
| Municipal bonds and notes | — | 2,790,182 | — |
|
| U.S. government agency obligations | — | 1,410,234 | — |
|
| U.S. government and agency mortgage obligations | — | 134,114,651 | — |
|
| U.S. Treasury obligations | — | 55,420,481 | — |
|
| Short-term investments | 123,463,197 | 54,715,592 | — |
|
| Totals by level | $813,080,893 | $465,022,855 | $— |
| | | | |
| | | Valuation inputs | |
|
| Other financial instruments: | Level 1 | Level 2 | Level 3 |
|
| TBA sale commitments | $— | $(26,377,500) | $— |
|
| Totals by level | $— | $(26,377,500) | $— |
The accompanying notes are an integral part of these financial statements.
33
Statement of assets and liabilities 1/31/12 (Unaudited)
| |
| ASSETS | |
|
| Investment in securities, at value (Note 1): | |
| Unaffiliated issuers (identified cost $1,064,423,056) | $1,154,640,551 |
| Affiliated issuers (identified cost $123,463,197) (Notes 1 and 5) | 123,463,197 |
|
| Cash | 1 |
|
| Dividends, interest and other receivables | 4,979,977 |
|
| Receivable for shares of the fund sold | 333,603 |
|
| Receivable for investments sold | 9,751,235 |
|
| Receivable for sales of delayed delivery securities (Note 1) | 26,463,938 |
|
| Total assets | 1,319,632,502 |
| |
| LIABILITIES | |
|
| Payable for investments purchased | 6,094,735 |
|
| Payable for purchases of delayed delivery securities (Note 1) | 107,523,204 |
|
| Payable for shares of the fund repurchased | 1,713,424 |
|
| Payable for compensation of Manager (Note 2) | 532,632 |
|
| Payable for investor servicing fees (Note 2) | 191,084 |
|
| Payable for custodian fees (Note 2) | 16,094 |
|
| Payable for Trustee compensation and expenses (Note 2) | 460,687 |
|
| Payable for administrative services (Note 2) | 2,332 |
|
| Payable for distribution fees (Note 2) | 300,140 |
|
| TBA sale commitments, at value (proceeds receivable, at value $26,415,938) (Note 1) | 26,377,500 |
|
| Other accrued expenses | 187,778 |
|
| Total liabilities | 143,399,610 |
| | |
| Net assets | $1,176,232,892 |
|
| |
| REPRESENTED BY | |
|
| Paid-in capital (Unlimited shares authorized) (Notes 1 and 4) | $2,009,568,826 |
|
| Undistributed net investment income (Note 1) | 2,531,880 |
|
| Accumulated net realized loss on investments and foreign currency transactions (Note 1) | (926,123,747) |
|
| Net unrealized appreciation of investments | 90,255,933 |
|
| Total — Representing net assets applicable to capital shares outstanding | $1,176,232,892 |
(Continued on next page)
34
Statement of assets and liabilities (Continued)
| |
| COMPUTATION OF NET ASSET VALUE AND OFFERING PRICE | |
|
| Net asset value and redemption price per class A share | |
| ($983,744,326 divided by 79,296,093 shares) | $12.41 |
|
| Offering price per class A share (100/94.25 of $12.41)* | $13.17 |
|
| Net asset value and offering price per class B share ($33,165,955 divided by 2,703,275 shares)** | $12.27 |
|
| Net asset value and offering price per class C share ($21,548,369 divided by 1,747,178 shares)** | $12.33 |
|
| Net asset value and redemption price per class M share ($71,603,423 divided by 5,845,761 shares) | $12.25 |
|
| Offering price per class M share (100/96.50 of $12.25)* | $12.69 |
|
| Net asset value, offering price and redemption price per class R share | |
| ($1,211,157 divided by 97,893 shares) | $12.37 |
|
| Net asset value, offering price and redemption price per class Y share | |
| ($64,959,662 divided by 5,218,193 shares) | $12.45 |
|
* On single retail sales of less than $50,000. On sales of $50,000 or more the offering price is reduced.
** Redemption price per share is equal to net asset value less any applicable contingent deferred sales charge.
The accompanying notes are an integral part of these financial statements.
35
Statement of operations Six months ended 1/31/12 (Unaudited)
| |
| INVESTMENT INCOME | |
|
| Dividends (net of foreign tax of $24,916) | $10,483,654 |
|
| Interest (including interest income of $40,674 from investments in affiliated issuers) (Note 5) | 6,935,401 |
|
| Total investment income | 17,419,055 |
| |
| EXPENSES | |
|
| Compensation of Manager (Note 2) | 3,122,207 |
|
| Investor servicing fees (Note 2) | 1,176,123 |
|
| Custodian fees (Note 2) | 19,499 |
|
| Trustee compensation and expenses (Note 2) | 48,657 |
|
| Administrative services (Note 2) | 16,766 |
|
| Distribution fees — Class A (Note 2) | 1,217,284 |
|
| Distribution fees — Class B (Note 2) | 172,023 |
|
| Distribution fees — Class C (Note 2) | 105,828 |
|
| Distribution fees — Class M (Note 2) | 266,457 |
|
| Distribution fees — Class R (Note 2) | 2,920 |
|
| Other | 263,763 |
|
| Total expenses | 6,411,527 |
| | |
| Expense reduction (Note 2) | (4,987) |
|
| Net expenses | 6,406,540 |
| | |
| Net investment income | 11,012,515 |
|
| |
| Net realized gain on investments (Notes 1 and 3) | 29,335,828 |
|
| Net realized gain on foreign currency transactions (Note 1) | 93 |
|
| Net unrealized depreciation of investments and TBA sale commitments during the period | (14,973,735) |
|
| Net gain on investments | 14,362,186 |
| | |
| Net increase in net assets resulting from operations | $25,374,701 |
|
The accompanying notes are an integral part of these financial statements.
36
Statement of changes in net assets
| | |
| DECREASE IN NET ASSETS | Six months ended 1/31/12* | Year ended 7/31/11 |
|
| Operations: | | |
| Net investment income | $11,012,515 | $19,699,183 |
|
| Net realized gain on investments | | |
| and foreign currency transactions | 29,335,921 | 106,963,794 |
|
| Net unrealized appreciation (depreciation) of investments | (14,973,735) | 23,125,657 |
|
| Net increase in net assets resulting from operations | 25,374,701 | 149,788,634 |
|
| Distributions to shareholders (Note 1): | | |
| From ordinary income | | |
| Net investment income | | |
|
| Class A | (8,244,397) | (18,171,051) |
|
| Class B | (154,429) | (451,746) |
|
| Class C | (98,452) | (216,716) |
|
| Class M | (419,896) | (967,653) |
|
| Class R | (8,448) | (20,173) |
|
| Class Y | (621,166) | (1,374,319) |
|
| Increase in capital from settlement payments (Note 6) | — | 476,149 |
|
| Redemption fees (Note 1) | — | 1 |
|
| Decrease from capital share transactions (Note 4) | (79,433,823) | (196,021,434) |
|
| Total decrease in net assets | (63,605,910) | (66,958,308) |
| |
| NET ASSETS | | |
|
| Beginning of period | 1,239,838,802 | 1,306,797,110 |
|
| End of period (including undistributed net investment | | |
| income of $2,531,880, and $1,066,153, respectively) | $1,176,232,892 | $1,239,838,802 |
|
* Unaudited
The accompanying notes are an integral part of these financial statements.
37
Financial highlights (For a common share outstanding throughout the period)
| | | | | | | | | | | | | | | | | |
| INVESTMENT OPERATIONS: | | LESS DISTRIBUTIONS: | | RATIOS AND SUPPLEMENTAL DATA: |
|
| | | | | | | | | | | | | | | | Ratio | | |
| | | | | | | | | | | | | | | | of expenses | Ratio of net | |
| | | | | | | | | | | | | | | Ratio | to average | investment | |
| | Net asset | Net | Net realized | | | | | | | | | | | of expenses | net assets | income (loss) | |
| | value, | investment | and unrealized | Total from | From | From | From | Total | | Non-recurring | Net asset | Total return | Net assets, | to average | excluding | to average | Portfolio |
| | beginning | income | gain (loss) | investment | net investment | net realized gain | return | distribu- | Redemption | reimburse- | value, end | at net asset | end of period | net assets | interest | net assets | turnover |
| Period ended | of period | (loss)a | on investments | operations | income | on investments | of capital | tions | fees | ments | of period | value (%)b | (in thousands) | (%)c | expense (%)c | (%) | (%)d |
|
| Class A | | | | | | | | | | | | | | | | | |
| January 31, 2012** | $12.21 | .12 | .18 | .30 | (.10) | — | — | (.10) | — | — | $12.41 | 2.52* | $983,744 | .53* | .53* | .98* | 47* |
| July 31, 2011 | 11.08 | .19 | 1.14 | 1.33 | (.20) | — | — | (.20) | —e | —f | 12.21 | 12.09 | 1,034,828 | 1.05 | 1.05 | 1.57 | 176 |
| July 31, 2010 | 10.14 | .25 | .93 | 1.18 | (.22) | — | (.02) | (.24) | —e | — | 11.08 | 11.83 | 1,077,209 | 1.13h | 1.13h | 2.27 | 341 |
| July 31, 2009 | 13.99 | .27 | (3.49) | (3.22) | (.44) | (.09) | (.10) | (.63) | —e | —g | 10.14 | (22.58) | 1,146,770 | 1.34i,j | 1.14j | 2.61j | 233 |
| July 31, 2008 | 18.10 | .61 | (2.55) | (1.94) | (.64) | (1.53) | — | (2.17) | —e | — | 13.99 | (11.84) | 2,173,291 | 1.00j | 1.00j | 3.80j | 124 |
| July 31, 2007 | 18.21 | .48 | 1.46 | 1.94 | (.52) | (1.53) | — | (2.05) | —e | — | 18.10 | 10.99 | 3,184,271 | .96j | .96j | 2.61j | 144 |
|
| Class B | | | | | | | | | | | | | | | | | |
| January 31, 2012** | $12.08 | .07 | .17 | .24 | (.05) | — | — | (.05) | — | — | $12.27 | 2.04* | $33,166 | .90* | .90* | .60* | 47* |
| July 31, 2011 | 10.96 | .10 | 1.13 | 1.23 | (.11) | — | — | (.11) | —e | —f | 12.08 | 11.24 | 39,031 | 1.80 | 1.80 | .82 | 176 |
| July 31, 2010 | 10.02 | .17 | .94 | 1.11 | (.15) | — | (.02) | (.17) | —e | — | 10.96 | 11.09 | 56,880 | 1.88h | 1.88h | 1.54 | 341 |
| July 31, 2009 | 13.83 | .19 | (3.46) | (3.27) | (.37) | (.09) | (.08) | (.54) | —e | —g | 10.02 | (23.23) | 86,981 | 2.09i,j | 1.89 j | 1.85j | 233 |
| July 31, 2008 | 17.90 | .48 | (2.52) | (2.04) | (.50) | (1.53) | — | (2.03) | —e | — | 13.83 | (12.50) | 206,269 | 1.75j | 1.75 j | 2.99j | 124 |
| July 31, 2007 | 18.02 | .33 | 1.46 | 1.79 | (.38) | (1.53) | — | (1.91) | —e | — | 17.90 | 10.15 | 413,532 | 1.71j | 1.71 j | 1.82j | 144 |
|
| Class C | | | | | | | | | | | | | | | | | |
| January 31, 2012** | $12.14 | .07 | .18 | .25 | (.06) | — | — | (.06) | — | — | $12.33 | 2.05* | $21,548 | .90* | .90* | .60* | 47* |
| July 31, 2011 | 11.02 | .10 | 1.13 | 1.23 | (.11) | — | — | (.11) | —e | —f | 12.14 | 11.22 | 22,013 | 1.80 | 1.80 | .82 | 176 |
| July 31, 2010 | 10.08 | .16 | .95 | 1.11 | (.15) | — | (.02) | (.17) | —e | — | 11.02 | 11.06 | 22,814 | 1.88h | 1.88h | 1.52 | 341 |
| July 31, 2009 | 13.90 | .19 | (3.47) | (3.28) | (.37) | (.09) | (.08) | (.54) | —e | —g | 10.08 | (23.17) | 23,296 | 2.09i,j | 1.89j | 1.86j | 233 |
| July 31, 2008 | 17.97 | .49 | (2.52) | (2.03) | (.51) | (1.53) | — | (2.04) | —e | — | 13.90 | (12.41) | 46,134 | 1.75j | 1.75j | 3.03j | 124 |
| July 31, 2007 | 18.09 | .34 | 1.45 | 1.79 | (.38) | (1.53) | — | (1.91) | —e | — | 17.97 | 10.16 | 69,893 | 1.71j | 1.71j | 1.86j | 144 |
|
| Class M | | | | | | | | | | | | | | | | | |
| January 31, 2012** | $12.06 | .08 | .18 | .26 | (.07) | — | — | (.07) | — | — | $12.25 | 2.19* | $71,603 | .78* | .78* | .73* | 47* |
| July 31, 2011 | 10.94 | .13 | 1.13 | 1.26 | (.14) | — | — | (.14) | —e | —f | 12.06 | 11.60 | 75,160 | 1.55 | 1.55 | 1.07 | 176 |
| July 31, 2010 | 10.01 | .19 | .94 | 1.13 | (.18) | — | (.02) | (.20) | —e | — | 10.94 | 11.33 | 79,010 | 1.63h | 1.63h | 1.77 | 341 |
| July 31, 2009 | 13.82 | .21 | (3.44) | (3.23) | (.40) | (.09) | (.09) | (.58) | —e | —g | 10.01 | (22.99) | 81,025 | 1.84i,j | 1.64 j | 2.13j | 233 |
| July 31, 2008 | 17.89 | .53 | (2.52) | (1.99) | (.55) | (1.53) | — | (2.08) | —e | — | 13.82 | (12.23) | 128,094 | 1.50j | 1.50 j | 3.31j | 124 |
| July 31, 2007 | 18.02 | .38 | 1.45 | 1.83 | (.43) | (1.53) | — | (1.96) | —e | — | 17.89 | 10.42 | 176,993 | 1.46j | 1.46 j | 2.10j | 144 |
|
| Class R | | | | | | | | | | | | | | | | | |
| January 31, 2012** | $12.18 | .10 | .18 | .28 | (.09) | — | — | (.09) | — | — | $12.37 | 2.31* | $1,211 | .65* | .65* | .85* | 47* |
| July 31, 2011 | 11.05 | .16 | 1.14 | 1.30 | (.17) | — | — | (.17) | —e | —f | 12.18 | 11.84 | 1,216 | 1.30 | 1.30 | 1.32 | 176 |
| July 31, 2010 | 10.11 | .22 | .94 | 1.16 | (.20) | — | (.02) | (.22) | —e | — | 11.05 | 11.59 | 1,345 | 1.38h | 1.38h | 2.03 | 341 |
| July 31, 2009 | 13.94 | .24 | (3.47) | (3.23) | (.42) | (.09) | (.09) | (.60) | —e | —g | 10.11 | (22.71) | 1,493 | 1.59i,j | 1.39j | 2.30j | 233 |
| July 31, 2008 | 18.04 | .57 | (2.54) | (1.97) | (.60) | (1.53) | — | (2.13) | —e | — | 13.94 | (12.04) | 4,274 | 1.25j | 1.25j | 3.66j | 124 |
| July 31, 2007 | 18.15 | .44 | 1.46 | 1.90 | (.48) | (1.53) | — | (2.01) | —e | — | 18.04 | 10.76 | 2,044 | 1.21j | 1.21j | 2.38j | 144 |
|
| Class Y | | | | | | | | | | | | | | | | | |
| January 31, 2012** | $12.26 | .13 | .18 | .31 | (.12) | — | — | (.12) | — | — | $12.45 | 2.56* | $64,960 | .40* | .40* | 1.10* | 47* |
| July 31, 2011 | 11.12 | .22 | 1.15 | 1.37 | (.23) | — | — | (.23) | —e | —f | 12.26 | 12.42 | 67,590 | .80 | .80 | 1.82 | 176 |
| July 31, 2010 | 10.17 | .28 | .95 | 1.23 | (.25) | — | (.03) | (.28) | —e | — | 11.12 | 12.18 | 69,539 | .88h | .88h | 2.55 | 341 |
| July 31, 2009 | 14.04 | .29 | (3.50) | (3.21) | (.47) | (.09) | (.10) | (.66) | —e | —g | 10.17 | (22.42) | 103,251 | 1.09i,j | .89j | 2.87j | 233 |
| July 31, 2008 | 18.15 | .66 | (2.55) | (1.89) | (.69) | (1.53) | — | (2.22) | —e | — | 14.04 | (11.57) | 257,459 | .75j | .75j | 4.05j | 124 |
| July 31, 2007 | 18.26 | .53 | 1.46 | 1.99 | (.57) | (1.53) | — | (2.10) | —e | — | 18.15 | 11.24 | 385,361 | .71j | .71j | 2.86j | 144 |
|
See notes to financial highlights at the end of this section.
The accompanying notes are an integral part of these financial statements.
Financial highlights (Continued)
* Not annualized.
** Unaudited.
a Per share net investment income (loss) has been determined on the basis of the weighted average number of shares outstanding during the period.
b Total return assumes dividend reinvestment and does not reflect the effect of sales charges.
c Includes amounts paid through expense offset and brokerage/service arrangements (Note 2).
d Portfolio turnover excludes dollar roll transactions.
e Amount represents less than $0.01 per share.
f Reflects a non-recurring reimbursement related to restitution amounts in connection with a distribution plan approved by the Securities and Exchange Commission (the SEC), which amounted to less than $0.01 per share outstanding on July 21, 2011. Also reflects a non-recurring reimbursal related to short-term trading related lawsuits, which amounted to less than $0.01 per share outstanding on May 11, 2011 (Note 6).
g Reflects a non-recurring reimbursement pursuant to a settlement between the SEC and Bear Stearns & Co., Inc. and Bear Stearns Securities Corp., which amounted to less than $0.01 per share outstanding as of May 21, 2009.
h Excludes the impact of a current period reduction to interest expense related to the resolution of certain terminated derivatives contracts, which amounted to 0.02% of average net assets as of July 31, 2010.
i Includes interest accrued in connection with certain terminated derivative contracts, which amounted to 0.20% of average net assets as of July 31, 2009 (Note 2).
j Reflects an involuntary contractual expense limitation in effect during the period. For periods prior to July 31, 2009, certain fund expenses were waived in connection with the fund’s investment in Putnam Prime Money Market Fund. As a result of such limitation and/or waivers, the expenses of each class reflect a reduction of the following amounts:
| |
| | Percentage of |
| | average net assets |
|
| July 31, 2009 | 0.01% |
|
| July 31, 2008 | <0.01 |
|
| July 31, 2007 | <0.01 |
|
The accompanying notes are an integral part of these financial statements.
40
Notes to financial statements 1/31/12 (Unaudited)
Note 1: Significant accounting policies
Within the following Notes to financial statements, references to “State Street” represent State Street Bank and Trust Company, references to “the SEC” represent the Securities and Exchange Commission, and references to “Putnam Management” represent Putnam Investment Management, LLC, the fund’s manager, an indirect wholly-owned subsidiary of Putnam Investments, LLC.
The George Putnam Fund of Boston (d/b/a) George Putnam Balanced Fund (the fund) is a Massachusetts business trust registered under the Investment Company Act of 1940, as amended, as a diversified, open-end management investment company. The fund seeks a balanced investment producing both capital growth and current income by investing primarily in value-oriented stocks of large companies and government, corporate and mortgage-backed bonds. The fund may invest a significant portion of its assets in securitized debt instruments, including mortgage-backed and asset-backed investments. The yields and values of these investments are sensitive to changes in interest rates, the rate of principal payments on the underlying assets and the market’s perception of the issuers. The market for these investments may be volatile and limited, which may make them difficult to buy or sell.
The fund offers class A, class B, class C, class M, class R and class Y shares. Class A and class M shares are sold with a maximum front-end sales charge of 5.75% and 3.50%, respectively, and generally do not pay a contingent deferred sales charge. Class B shares, which convert to class A shares after approximately eight years, do not pay a front-end sales charge and are subject to a contingent deferred sales charge if those shares are redeemed within six years of purchase. Class C shares have a one-year 1.00% contingent deferred sales charge and do not convert to class A shares. Class R shares, which are not available to all investors, are sold at net asset value. The expenses for class A, class B, class C, class M and class R shares may differ based on the distribution fee of each class, which is identified in Note 2. Class Y shares, which are sold at net asset value, are generally subject to the same expenses as class A, class B, class C, class M and class R shares, but do not bear a distribution fee. Class Y shares are not available to all investors.
Prior to August 2, 2010, a 1.00% redemption fee applied to certain shares that were redeemed (either by selling or exchanging into another fund) within 7 days of purchase. The redemption fee was accounted for as an addition to paid-in-capital. Effective August 2, 2010, this redemption fee no longer applies to shares redeemed.
Investment income, realized and unrealized gains and losses and expenses of the fund are borne pro-rata based on the relative net assets of each class to the total net assets of the fund, except that each class bears expenses unique to that class (including the distribution fees applicable to such classes). Each class votes as a class only with respect to its own distribution plan or other matters on which a class vote is required by law or determined by the Trustees. If the fund were liquidated, shares of each class would receive their pro-rata share of the net assets of the fund. In addition, the Trustees declare separate dividends on each class of shares.
In the normal course of business, the fund enters into contracts that may include agreements to indemnify another party under given circumstances. The fund’s maximum exposure under these arrangements is unknown as this would involve future claims that may be, but have not yet been, made against the fund. However, the fund’s management team expects the risk of material loss to be remote.
The following is a summary of significant accounting policies consistently followed by the fund in the preparation of its financial statements. The preparation of financial statements is in conformity with accounting principles generally accepted in the United States of America and requires management to make estimates and assumptions that affect the reported amounts of assets and liabilities in the financial statements and the reported amounts of increases and decreases in net assets from operations. Actual results could differ from those estimates. Subsequent events after the Statement of assets and liabilities date through the date that the financial statements were issued have been evaluated in the preparation of the financial statements. Unless otherwise noted, the “reporting period” represents the period from August 1, 2011 through January 1, 2012.
Security valuation Investments for which market quotations are readily available are valued at the last reported sales price on their principal exchange, or official closing price for certain markets, and are classified as Level 1 securities. If no sales are reported, as in the case of some securities traded over-the-counter, a security is valued at its last reported bid price and is generally categorized as a Level 2 security.
Investments in other open-end investment companies, which are classified as Level 1 securities, are based on their net asset value (NAV). The NAV of an investment company equals the total value of its assets less its liabilities and
41
divided by the number of its outstanding shares. Shares are only valued as of the close of regular trading on the New York Stock Exchange each day that the exchange is open.
Market quotations are not considered to be readily available for certain debt obligations and other investments; such investments are valued on the basis of valuations furnished by an independent pricing service approved by the Trustees or dealers selected by Putnam Management. Such services or dealers determine valuations for normal institutional-size trading units of such securities using methods based on market transactions for comparable securities and various relationships, generally recognized by institutional traders, between securities (which considers such factors as security prices, yields, maturities and ratings). These securities will generally be categorized as Level 2.
Many securities markets and exchanges outside the U.S. close prior to the close of the New York Stock Exchange and therefore the closing prices for securities in such markets or on such exchanges may not fully reflect events that occur after such close but before the close of the New York Stock Exchange. Accordingly, on certain days, the fund will fair value foreign equity securities taking into account multiple factors including movements in the U.S. securities markets, currency valuations and comparisons to the valuation of American Depository Receipts, exchange-traded funds and futures contracts. These securities, which will generally represent a transfer from a Level 1 to a Level 2 security, will be classified as Level 2. The number of days on which fair value prices will be used will depend on market activity and it is possible that fair value prices will be used by the fund to a significant extent. Securities quoted in foreign currencies, if any, are translated into U.S. dollars at the current exchange rate.
To the extent a pricing service or dealer is unable to value a security or provides a valuation that Putnam Management does not believe accurately reflects the security’s fair value, the security will be valued at fair value by Putnam Management. Certain investments, including certain restricted and illiquid securities and derivatives, are also valued at fair value following procedures approved by the Trustees. These valuations consider such factors as significant market or specific security events such as interest rate or credit quality changes, various relationships with other securities, discount rates, U.S. Treasury, U.S. swap and credit yields, index levels, convexity exposures and recovery rates. These securities are classified as Level 2 or as Level 3 depending on the priority of the significant inputs.
Such valuations and procedures are reviewed periodically by the Trustees. Certain securities may be valued on the basis of a price provided by a single source. The fair value of securities is generally determined as the amount that the fund could reasonably expect to realize from an orderly disposition of such securities over a reasonable period of time. By its nature, a fair value price is a good faith estimate of the value of a security in a current sale and does not reflect an actual market price, which may be different by a material amount.
Security transactions and related investment income Security transactions are recorded on the trade date (the date the order to buy or sell is executed). Gains or losses on securities sold are determined on the identified cost basis. Interest income is recorded on the accrual basis. Dividend income, net of applicable withholding taxes, is recognized on the ex-dividend date except that certain dividends from foreign securities, if any, are recognized as soon as the fund is informed of the ex-dividend date. Non-cash dividends, if any, are recorded at the fair market value of the securities received. Dividends representing a return of capital or capital gains, if any, are reflected as a reduction of cost and/or as a realized gain. All premiums/discounts are amortized/accreted on a yield-to-maturity basis.
Securities purchased or sold on a delayed delivery basis may be settled a month or more after the trade date; interest income is accrued based on the terms of the securities. Losses may arise due to changes in the market value of the underlying securities or if the counterparty does not perform under the contract.
Stripped securities The fund may invest in stripped securities which represent a participation in securities that may be structured in classes with rights to receive different portions of the interest and principal. Interest-only securities receive all of the interest and principal-only securities receive all of the principal. If the interest-only securities experience greater than anticipated prepayments of principal, the fund may fail to recoup fully its initial investment in these securities. Conversely, principal-only securities increase in value if prepayments are greater than anticipated and decline if prepayments are slower than anticipated. The market value of these securities is highly sensitive to changes in interest rates.
TBA purchase commitments The fund may enter into TBA (to be announced) commitments to purchase securities for a fixed unit price at a future date beyond customary settlement time. Although the unit price has been established, the principal value has not been finalized. However, it is anticipated that the amount of the commitments will not significantly differ from the principal amount. The fund holds, and maintains until settlement date, cash or
42
high-grade debt obligations in an amount sufficient to meet the purchase price, or the fund may enter into offsetting contracts for the forward sale of other securities it owns. Income on the securities will not be earned until settlement date. TBA purchase commitments may be considered securities themselves, and involve a risk of loss if the value of the security to be purchased declines prior to the settlement date, which risk is in addition to the risk of decline in the value of the fund’s other assets. Unsettled TBA purchase commitments are valued at fair value of the underlying securities, according to the procedures described under “Security valuation” above. The contract is marked to market daily and the change in market value is recorded by the fund as an unrealized gain or loss.
Although the fund will generally enter into TBA purchase commitments with the intention of acquiring securities for its portfolio or for delivery pursuant to options contracts it has entered into, the fund may dispose of a commitment prior to settlement if Putnam Management deems it appropriate to do so.
TBA sale commitments The fund may enter into TBA sale commitments to hedge its portfolio positions or to sell mortgage-backed securities it owns under delayed delivery arrangements. Proceeds of TBA sale commitments are not received until the contractual settlement date. During the time a TBA sale commitment is outstanding, equivalent deliverable securities, or an offsetting TBA purchase commitment deliverable on or before the sale commitment date, are held as “cover” for the transaction.
Unsettled TBA sale commitments are valued at the fair value of the underlying securities, generally according to the procedures described under “Security valuation” above. The contract is marked to market daily and the change in market value is recorded by the fund as an unrealized gain or loss. If the TBA sale commitment is closed through the acquisition of an offsetting TBA purchase commitment, the fund realizes a gain or loss. If the fund delivers securities under the commitment, the fund realizes a gain or a loss from the sale of the securities based upon the unit price established at the date the commitment was entered into. TBA sale commitments outstanding at period end, if any, are listed after the fund’s portfolio.
Interfund lending The fund, along with other Putnam funds, may participate in an interfund lending program pursuant to an exemptive order issued by the SEC. This program allows the fund to borrow from or lend to other Putnam funds that permit such transactions. Interfund lending transactions are subject to each fund’s investment policies and borrowing and lending limits. Interest earned or paid on the interfund lending transaction will be based on the average of certain current market rates. During the reporting period, the fund did not utilize the program.
Line of credit The fund participates, along with other Putnam funds, in a $325 million unsecured committed line of credit and a $185 million unsecured uncommitted line of credit, both provided by State Street. Borrowings may be made for temporary or emergency purposes, including the funding of shareholder redemption requests and trade settlements. Interest is charged to the fund based on the fund’s borrowing at a rate equal to the Federal Funds rate plus 1.25% for the committed line of credit and the Federal Funds rate plus 1.30% for the uncommitted line of credit. A closing fee equal to 0.02% of the committed line of credit and $50,000 for the uncommitted line of credit has been paid by the participating funds. In addition, a commitment fee of 0.13% per annum on any unutilized portion of the committed line of credit is allocated to the participating funds based on their relative net assets and paid quarterly. During the reporting period, the fund had no borrowings against these arrangements.
Federal taxes It is the policy of the fund to distribute all of its taxable income within the prescribed time period and otherwise comply with the provisions of the Internal Revenue Code of 1986, as amended (the Code), applicable to regulated investment companies. It is also the intention of the fund to distribute an amount sufficient to avoid imposition of any excise tax under Section 4982 of the Code. The fund is subject to the provisions of Accounting Standards Codification ASC 740 Income Taxes (ASC 740). ASC 740 sets forth a minimum threshold for financial statement recognition of the benefit of a tax position taken or expected to be taken in a tax return. The fund did not have a liability to record for any unrecognized tax benefits in the accompanying financial statements. No provision has been made for federal taxes on income, capital gains or unrealized appreciation on securities held nor for excise tax on income and capital gains. Each of the fund’s federal tax returns for the prior three fiscal years remains subject to examination by the Internal Revenue Service.
At July 31, 2011, the fund had a capital loss carryover of $949,794,002 available to the extent allowed by the Code to offset future net capital gain, if any. The amounts of the carryovers and the expiration dates are:
| | | |
| Loss carryover |
| Short-term | Long-term | Total | Expiration |
|
| $310,017,859 | $— | $310,017,859 | July 31, 2017 |
|
| 639,776,143 | — | 639,776,143 | July 31, 2018 |
|
43
Under the recently enacted Regulated Investment Company Modernization Act of 2010, the fund will be permitted to carry forward capital losses incurred in taxable years beginning after December 22, 2010 for an unlimited period. However, any losses incurred during those future years will be required to be utilized prior to the losses incurred in pre-enactment tax years. As a result of this ordering rule, pre-enactment capital loss carryforwards may be more likely to expire unused. Additionally, post-enactment capital losses that are carried forward will retain their character as either short-term or long-term capital losses rather than being considered all short-term as under previous law.
The aggregate identified cost on a tax basis is $1,193,551,920, resulting in gross unrealized appreciation and depreciation of $120,906,998 and $36,355,170, respectively, or net unrealized appreciation of $84,551,828.
Distributions to shareholders Distributions to shareholders from net investment income are recorded by the fund on the ex-dividend date. Distributions from capital gains, if any, are recorded on the ex-dividend date and paid at least annually. The amount and character of income and gains to be distributed are determined in accordance with income tax regulations, which may differ from generally accepted accounting principles. Dividend sources are estimated at the time of declaration. Actual results may vary. Any non-taxable return of capital cannot be determined until final tax calculations are completed after the end of the fund’s fiscal year. Reclassifications are made to the fund’s capital accounts to reflect income and gains available for distribution (or available capital loss carryovers) under income tax regulations.
Note 2: Management fee, administrative services and other transactions
The fund pays Putnam Management a management fee (based on the fund’s average net assets and computed and paid monthly) at annual rates that may vary based on the average of the aggregate net assets of most open-end funds, as defined in the fund’s management contract, sponsored by Putnam Management. Such annual rates may vary as follows:
| |
| 0.680% | of the first $5 billion, |
| 0.630% | of the next $5 billion, |
| 0.580% | of the next $10 billion, |
| 0.530% | of the next $10 billion, |
| 0.480% | of the next $50 billion, |
| 0.460% | of the next $50 billion, |
| 0.450% | of the next $100 billion and |
| 0.445% | of any excess thereafter. |
Putnam Management has contractually agreed, through June 30, 2012, to waive fees or reimburse the fund’s expenses to the extent necessary to limit the cumulative expenses of the fund, exclusive of brokerage, interest, taxes, investment-related expenses, extraordinary expenses and payments under the fund’s investor servicing contract, investment management contract and distribution plans, on a fiscal year-to-date basis to an annual rate of 0.20% of the fund’s average net assets over such fiscal year-to-date period. During the reporting period, the fund’s expenses were not reduced as a result of this limit.
Putnam Investments Limited (PIL), an affiliate of Putnam Management, is authorized by the Trustees to manage a separate portion of the assets of the fund as determined by Putnam Management from time to time. Putnam Management pays a quarterly sub-management fee to PIL for its services at an annual rate of 0.40% of the average net assets of the portion of the fund managed by PIL.
The fund reimburses Putnam Management an allocated amount for the compensation and related expenses of certain officers of the fund and their staff who provide administrative services to the fund. The aggregate amount of all such reimbursements is determined annually by the Trustees.
Custodial functions for the fund’s assets are provided by State Street. Custody fees are based on the fund’s asset level, the number of its security holdings and transaction volumes.
Putnam Investor Services, Inc., an affiliate of Putnam Management, provides investor servicing agent functions to the fund. Putnam Investor Services, Inc. received fees for investor servicing based on the fund’s retail asset level, the number of shareholder accounts in the fund and the level of defined contribution plan assets in the fund. Investor servicing fees will not exceed an annual rate of 0.375% of the fund’s average net assets. The amounts incurred for investor servicing agent functions during the reporting period are included in Investor servicing fees in the Statement of operations.
44
The fund has entered into expense offset arrangements with Putnam Investor Services, Inc. and State Street whereby Putnam Investor Services, Inc.’s and State Street’s fees are reduced by credits allowed on cash balances. The fund also reduced expenses through brokerage/service arrangements. For the reporting period, the fund’s expenses were reduced by $1,891 under the expense offset arrangements and by $3,096 under the brokerage/service arrangements.
Each independent Trustee of the fund receives an annual Trustee fee, of which $891, as a quarterly retainer, has been allocated to the fund, and an additional fee for each Trustees meeting attended. Trustees also are reimbursed for expenses they incur relating to their services as Trustees.
The fund has adopted a Trustee Fee Deferral Plan (the Deferral Plan) which allows the Trustees to defer the receipt of all or a portion of Trustees fees payable on or after July 1, 1995. The deferred fees remain invested in certain Putnam funds until distribution in accordance with the Deferral Plan.
The fund has adopted an unfunded noncontributory defined benefit pension plan (the Pension Plan) covering all Trustees of the fund who have served as a Trustee for at least five years and were first elected prior to 2004. Benefits under the Pension Plan are equal to 50% of the Trustee’s average annual attendance and retainer fees for the three years ended December 31, 2005. The retirement benefit is payable during a Trustee’s lifetime, beginning the year following retirement, for the number of years of service through December 31, 2006. Pension expense for the fund is included in Trustee compensation and expenses in the Statement of operations. Accrued pension liability is included in Payable for Trustee compensation and expenses in the Statement of assets and liabilities. The Trustees have terminated the Pension Plan with respect to any Trustee first elected after 2003.
The fund has adopted distribution plans (the Plans) with respect to its class A, class B, class C, class M and class R shares pursuant to Rule 12b–1 under the Investment Company Act of 1940. The purpose of the Plans is to compensate Putnam Retail Management Limited Partnership, a wholly-owned subsidiary of Putnam Investments, LLC and Putnam Retail Management GP, Inc., for services provided and expenses incurred in distributing shares of the fund. The Plans provide for payments by the fund to Putnam Retail Management Limited Partnership at an annual rate of up to 0.35%, 1.00%, 1.00%, 1.00% and 1.00% of the average net assets attributable to class A, class B, class C, class M and class R shares, respectively. The Trustees have approved payment by the fund at an annual rate of 0.25%, 1.00%, 1.00%, 0.75% and 0.50% of the average net assets attributable to class A, class B, class C, class M and class R shares, respectively.
For the reporting period, Putnam Retail Management Limited Partnership, acting as underwriter, received net commissions of $24,321 and $185 from the sale of class A and class M shares, respectively, and received $12,585 and $428 in contingent deferred sales charges from redemptions of class B and class C shares, respectively.
A deferred sales charge of up to 1.00% and 0.65% is assessed on certain redemptions of class A and class M shares, respectively. For the reporting period, Putnam Retail Management Limited Partnership, acting as underwriter, received $19 and no monies on class A and class M redemptions, respectively.
Note 3: Purchases and sales of securities
During the reporting period, cost of purchases and proceeds from sales of investment securities other than short-term investments and TBA transactions aggregated $471,489,598 and $520,733,734, respectively. These figures include the cost of purchases and proceeds from sales of long-term U.S. government securities of $182,528,377 and $144,911,664, respectively.
Note 4: Capital shares
At the close of the reporting period, there was an unlimited number of shares of beneficial interest authorized. Transactions in capital shares were as follows:
| | | | |
| | Six months ended 1/31/12 | Year ended 7/31/11 |
|
| Class A | Shares | Amount | Shares | Amount |
|
| Shares sold | 2,063,234 | $24,383,452 | 5,472,625 | $65,405,057 |
|
| Shares issued in connection with | | | | |
| reinvestment of distributions | 648,612 | 7,474,936 | 1,397,797 | 16,355,108 |
|
| | 2,711,846 | 31,858,388 | 6,870,422 | 81,760,165 |
|
| Shares repurchased | (8,138,736) | (96,207,635) | (19,352,341) | (230,270,993) |
|
| Net decrease | (5,426,890) | $(64,349,247) | (12,481,919) | $(148,510,828) |
|
45
| | | | |
| | Six months ended 1/31/12 | Year ended 7/31/11 |
|
| Class B | Shares | Amount | Shares | Amount |
|
| Shares sold | 112,191 | $1,317,608 | 243,230 | $2,864,261 |
|
| Shares issued in connection with | | | | |
| reinvestment of distributions | 13,038 | 148,826 | 37,617 | 432,516 |
|
| | 125,229 | 1,466,434 | 280,847 | 3,296,777 |
|
| Shares repurchased | (654,031) | (7,654,749) | (2,240,199) | (26,420,196) |
|
| Net decrease | (528,802) | $(6,188,315) | (1,959,352) | $(23,123,419) |
|
| |
| | Six months ended 1/31/12 | Year ended 7/31/11 |
|
| Class C | Shares | Amount | Shares | Amount |
|
| Shares sold | 126,637 | $1,491,380 | 179,473 | $2,124,913 |
|
| Shares issued in connection with | | | | |
| reinvestment of distributions | 7,961 | 91,352 | 17,193 | 200,066 |
|
| | 134,598 | 1,582,732 | 196,666 | 2,324,979 |
|
| Shares repurchased | (200,465) | (2,366,965) | (454,627) | (5,374,980) |
|
| Net decrease | (65,867) | $(784,233) | (257,961) | $(3,050,001) |
|
| |
| | Six months ended 1/31/12 | Year ended 7/31/11 |
|
| Class M | Shares | Amount | Shares | Amount |
|
| Shares sold | 315,696 | $3,659,648 | 541,294 | $6,360,649 |
|
| Shares issued in connection with | | | | |
| reinvestment of distributions | 36,486 | 415,569 | 82,446 | 952,265 |
|
| | 352,182 | 4,075,217 | 623,740 | 7,312,914 |
|
| Shares repurchased | (739,350) | (8,620,658) | (1,610,861) | (19,063,596) |
|
| Net decrease | (387,168) | $(4,545,441) | (987,121) | $(11,750,682) |
|
| |
| | Six months ended 1/31/12 | Year ended 7/31/11 |
|
| Class R | Shares | Amount | Shares | Amount |
|
| Shares sold | 13,313 | $156,962 | 22,170 | $263,068 |
|
| Shares issued in connection with | | | | |
| reinvestment of distributions | 735 | 8,448 | 1,730 | 20,173 |
|
| | 14,048 | 165,410 | 23,900 | 283,241 |
|
| Shares repurchased | (15,998) | (187,338) | (45,784) | (555,084) |
|
| Net decrease | (1,950) | $(21,928) | (21,884) | $(271,843) |
|
| |
| | Six months ended 1/31/12 | Year ended 7/31/11 |
|
| Class Y | Shares | Amount | Shares | Amount |
|
| Shares sold | 133,191 | $1,590,465 | 714,819 | $8,287,925 |
|
| Shares issued in connection with | | | | |
| reinvestment of distributions | 53,388 | 617,403 | 116,179 | 1,362,985 |
|
| | 186,579 | 2,207,868 | 830,998 | 9,650,910 |
|
| Shares repurchased | (483,086) | (5,752,527) | (1,570,037) | (18,965,571) |
|
| Net decrease | (296,507) | $(3,544,659) | (739,039) | $(9,314,661) |
|
46
Note 5: Investment in Putnam Money Market Liquidity Fund
The fund invested in Putnam Money Market Liquidity Fund, an open-end management investment company managed by Putnam Management. Investments in Putnam Money Market Liquidity Fund are valued at its closing net asset value each business day. Income distributions earned by the fund are recorded as interest income in the Statement of operations and totaled $40,674 for the reporting period. During the reporting period, cost of purchases and proceeds of sales of investments in Putnam Money Market Liquidity Fund aggregated $148,207,072 and $220,467,764, respectively. Management fees charged to Putnam Money Market Liquidity Fund have been waived by Putnam Management.
Note 6: Regulatory matters and litigation
In late 2003 and 2004, Putnam Management settled charges brought by the SEC and the Massachusetts Securities Division in connection with excessive short-term trading in Putnam funds. In July 2011, the fund recorded a receivable of $465,203 related to restitution amounts in connection with a distribution plan approved by the SEC. This amount, which was received by the fund in December 2011, is reported as part of Increase in capital from settlement payments on the Statement of changes in net assets. These allegations and related matters have served as the general basis for certain lawsuits, including purported class action lawsuits against Putnam Management and, in a limited number of cases, some Putnam funds. In May 2011, the fund received a payment of $10,946 related to settlement of those lawsuits. This amount is reported as a part of Increase in capital from settlement payments on the Statement of changes in net assets. Putnam Management has agreed to bear any costs incurred by the Putnam funds as a result of these matters.
Note 7: Market and credit risk
In the normal course of business, the fund trades financial instruments and enters into financial transactions where risk of potential loss exists due to changes in the market (market risk) or failure of the contracting party to the transaction to perform (credit risk). The fund may be exposed to additional credit risk that an institution or other entity with which the fund has unsettled or open transactions will default.
Note 8: New accounting pronouncement
In May 2011, the Financial Accounting Standards Board (FASB) issued Accounting Standards Update (ASU) 2011–04 “Fair Value Measurements and Disclosures (Topic 820) — Amendments to Achieve Common Fair Value Measurement and Disclosure Requirements in U.S. GAAP and IFRS”. ASU 2011–04 amends FASB Topic 820 “Fair Value Measurement” and seeks to develop common requirements for measuring fair value and for disclosing information about fair value measurements in accordance with GAAP. ASU 2011–04 is effective for fiscal years and interim periods beginning after December 15, 2011. Putnam Management is currently evaluating the application of ASU 2011–04 and its impact, if any, on the fund’s financial statements.
47
The Putnam family of funds
The following is a list of Putnam’s open-end mutual funds offered to the public. Investors should carefully consider the investment objective, risks, charges, and expenses of a fund before investing. For a prospectus, or a summary prospectus if available, containing this and other information for any Putnam fund or product, call your financial advisor at 1-800-225-1581 and ask for a prospectus. Please read the prospectus carefully before investing.
| |
| Growth | Income |
| Growth Opportunities Fund | American Government Income Fund |
| International Growth Fund | Diversified Income Trust |
| Multi-Cap Growth Fund | Floating Rate Income Fund |
| Small Cap Growth Fund | Global Income Trust |
| Voyager Fund | High Yield Advantage Fund |
| | High Yield Trust |
| Blend | Income Fund |
| Asia Pacific Equity Fund | Money Market Fund* |
| Capital Opportunities Fund | Short Duration Income Fund |
| Capital Spectrum Fund | U.S. Government Income Trust |
| Emerging Markets Equity Fund | |
| Equity Spectrum Fund | Tax-free income |
| Europe Equity Fund | AMT-Free Municipal Fund |
| Global Equity Fund | Tax Exempt Income Fund |
| International Capital Opportunities Fund | Tax Exempt Money Market Fund* |
| International Equity Fund | Tax-Free High Yield Fund |
| Investors Fund | |
| Multi-Cap Core Fund | State tax-free income funds: |
| Research Fund | Arizona, California, Massachusetts, Michigan, |
| | Minnesota, New Jersey, New York, Ohio, |
| Value | and Pennsylvania. |
| Convertible Securities Fund | |
| Equity Income Fund | Absolute Return |
| George Putnam Balanced Fund | Absolute Return 100 Fund |
| The Putnam Fund for Growth and Income | Absolute Return 300 Fund |
| International Value Fund | Absolute Return 500 Fund |
| Multi-Cap Value Fund | Absolute Return 700 Fund |
| Small Cap Value Fund | |
* An investment in a money market fund is not insured or guaranteed by the Federal Deposit Insurance Corporation or any other government agency. Although the fund seeks to preserve the value of your investment at $1.00 per share, it is possible to lose money by investing in the fund.
48
| |
| Global Sector | Putnam RetirementReady Funds — portfolios |
| Global Consumer Fund | with automatically adjusting allocations to |
| Global Energy Fund | stocks, bonds, and money market instruments, |
| Global Financials Fund | becoming more conservative over time. |
| Global Health Care Fund | |
| Global Industrials Fund | RetirementReady 2055 Fund |
| Global Natural Resources Fund | RetirementReady 2050 Fund |
| Global Sector Fund | RetirementReady 2045 Fund |
| Global Technology Fund | RetirementReady 2040 Fund |
| Global Telecommunications Fund | RetirementReady 2035 Fund |
| Global Utilities Fund | RetirementReady 2030 Fund |
| | RetirementReady 2025 Fund |
| Asset Allocation | RetirementReady 2020 Fund |
| Putnam Global Asset Allocation Funds — | RetirementReady 2015 Fund |
| portfolios with allocations to stocks, bonds, | |
| and money market instruments that are | Putnam Retirement Income Lifestyle |
| adjusted dynamically within specified ranges | Funds — portfolios with managed |
| as market conditions change. | allocations to stocks, bonds, and money |
| | market investments to generate |
| Dynamic Asset Allocation Balanced Fund | retirement income. |
| Prior to November 30, 2011, this fund was known as | |
| Putnam Asset Allocation: Balanced Portfolio. | Retirement Income Fund Lifestyle 1 |
| Dynamic Asset Allocation | Prior to June 16, 2011, this fund was known as |
| Conservative Fund | Putnam RetirementReady Maturity Fund. |
| Prior to November 30, 2011, this fund was known as | Retirement Income Fund Lifestyle 2 |
| Putnam Asset Allocation: Conservative Portfolio. | Retirement Income Fund Lifestyle 3 |
| Dynamic Asset Allocation Growth Fund | Prior to June 16, 2011, this fund was known as |
| Prior to November 30, 2011, this fund was known as | Putnam Income Strategies Fund. |
| Putnam Asset Allocation: Growth Portfolio. | |
| Dynamic Risk Allocation Fund | |
A short-term trading fee of 1% may apply to redemptions or exchanges from certain funds within the time period specified in the fund's prospectus.
Check your account balances and the most recent month-end performance in the Individual Investors section at putnam.com.
49
Services for shareholders
Investor services
Systematic investment plan Tell us how much you wish to invest regularly — weekly, semimonthly, or monthly — and the amount you choose will be transferred automatically from your checking or savings account. There’s no additional fee for this service, and you can suspend it at any time. This plan may be a great way to save for college expenses or to plan for your retirement.
Please note that regular investing does not guarantee a profit or protect against loss in a declining market. Before arranging a systematic investment plan, consider your financial ability to continue making purchases in periods when prices are low.
Systematic exchange You can make regular transfers from one Putnam fund to another Putnam fund. There are no additional fees for this service, and you can cancel or change your options at any time.
Dividends PLUS You can choose to have the dividend distributions from one of your Putnam funds automatically reinvested in another Putnam fund at no additional charge.
Free exchange privilege You can exchange money between Putnam funds free of charge, as long as they are the same class of shares. A signature guarantee is required if you are exchanging more than $500,000. The fund reserves the right to revise or terminate the exchange privilege.
Reinstatement privilege If you’ve sold Putnam shares or received a check for a dividend or capital gain, you may reinvest the proceeds with Putnam within 90 days of the transaction and they will be reinvested at the fund’s current net asset value — with no sales charge. However, reinstatement of class B shares may have special tax consequences. Ask your financial or tax representative for details.
Check-writing service You have ready access to many Putnam accounts. It’s as simple as writing a check, and there are no special fees or service charges. For more information about the check-writing service, call Putnam or visit our website.
Dollar cost averaging When you’re investing for long-term goals, it’s time, not timing, that counts. Investing on a systematic basis is a better strategy than trying to figure out when the markets will go up or down. This means investing the same amount of money regularly over a long period. This method of investing is called dollar cost averaging. When a fund’s share price declines, your investment dollars buy more shares at lower prices. When it increases, they buy fewer shares. Over time, you will pay a lower average price per share.
For more information
Visit the Individual Investors section at putnam.com A secure section of our website contains complete information on your account, including balances and transactions, updated daily. You may also conduct transactions, such as exchanges, additional investments, and address changes. Log on today to get your password.
Call us toll free at 1-800-225-1581 Ask a helpful Putnam representative or your financial advisor for details about any of these or other services, or see your prospectus.
50
Putnam’s commitment to confidentiality
In order to conduct business with our shareholders, we must obtain certain personal information such as account holders’ names, addresses, Social Security numbers, and dates of birth. Using this information, we are able to maintain accurate records of accounts and transactions.
It is our policy to protect the confidentiality of our shareholder information, whether or not a shareholder currently owns shares of our funds. In particular, it is our policy not to sell information about you or your accounts to outside marketing firms. We have safeguards in place designed to prevent unauthorized access to our computer systems and procedures to protect personal information from unauthorized use.
Within the Putnam organization, your information is shared with those who need it to service your account or provide you with information about other Putnam products or services. Under certain circumstances, we must also share account information with outside vendors who provide services to us, such as mailings and proxy solicitations. In these cases, the service providers enter into confidentiality agreements with us, and we provide only the information necessary to process transactions and perform other services related to your account. It is also our policy to share account information with your financial advisor, if you've provided us with information about your advisor and that person is listed on your Putnam account.
If you would like clarification about our confidentiality policies or have any questions or concerns, please don't hesitate to contact us at 1-800-225-1581, Monday through Friday, 8:00 a.m. to 8:00 p.m. Eastern Time.
51
Fund information
Founded over 70 years ago, Putnam Investments was built around the concept that a balance between risk and reward is the hallmark of a well-rounded financial program. We manage over 100 funds across income, value, blend, growth, asset allocation, absolute return, and global sector categories.
| | |
| Investment Manager | Elizabeth T. Kennan | Mark C. Trenchard |
| Putnam Investment | Kenneth R. Leibler | Vice President and |
| Management, LLC | Robert E. Patterson | BSA Compliance Officer |
| One Post Office Square | George Putnam, III | |
| Boston, MA 02109 | Robert L. Reynolds | Robert T. Burns |
| | W. Thomas Stephens | Vice President and |
| Investment Sub-Manager | | Chief Legal Officer |
| Putnam Investments Limited | Officers | |
| 57–59 St James’s Street | Robert L. Reynolds | James P. Pappas |
| London, England SW1A 1LD | President | Vice President |
| | | |
| Marketing Services | Jonathan S. Horwitz | Judith Cohen |
| Putnam Retail Management | Executive Vice President, | Vice President, Clerk and |
| One Post Office Square | Principal Executive | Assistant Treasurer |
| Boston, MA 02109 | Officer, Treasurer and | |
| | Compliance Liaison | Michael Higgins |
| Custodian | | Vice President, Senior Associate |
| State Street Bank | Steven D. Krichmar | Treasurer and Assistant Clerk |
| and Trust Company | Vice President and | |
| | Principal Financial Officer | Nancy E. Florek |
| Legal Counsel | | Vice President, Assistant Clerk, |
| Ropes & Gray LLP | Janet C. Smith | Assistant Treasurer and |
| | Vice President, Assistant | Proxy Manager |
| Trustees | Treasurer and Principal | |
| Jameson A. Baxter, Chair | Accounting Officer | Susan G. Malloy |
| Ravi Akhoury | | Vice President and |
| Barbara M. Baumann | Robert R. Leveille | Assistant Treasurer |
| Charles B. Curtis | Vice President and | |
| Robert J. Darretta | Chief Compliance Officer | |
| John A. Hill | | |
| Paul L. Joskow | | |
This report is for the information of shareholders of George Putnam Balanced Fund. It may also be used as sales literature when preceded or accompanied by the current prospectus, the most recent copy of Putnam’s Quarterly Performance Summary, and Putnam’s Quarterly Ranking Summary. For more recent performance, please visit putnam.com. Investors should carefully consider the investment objectives, risks, charges, and expenses of a fund, which are described in its prospectus. For this and other information or to request a prospectus or summary prospectus, call 1-800-225-1581 toll free. Please read the prospectus carefully before investing. The fund’s Statement of Additional Information contains additional information about the fund’s Trustees and is available without charge upon request by calling 1-800-225-1581.
52
| |
| Item 3. Audit Committee Financial Expert: |
| |
| Item 4. Principal Accountant Fees and Services: |
| |
| Item 5. Audit Committee of Listed Registrants |
| |
| Item 6. Schedule of Investments: |
| |
| The registrant’s schedule of investments in unaffiliated issuers is included in the report to shareholders in Item 1 above. |
| |
| Item 7. Disclosure of Proxy Voting Policies and Procedures For Closed-End Management Investment Companies: |
| |
| Item 8. Portfolio Managers of Closed-End Investment Companies |
| |
| Item 9. Purchases of Equity Securities by Closed-End Management Investment Companies and Affiliated Purchasers: |
| |
| Item 10. Submission of Matters to a Vote of Security Holders: |
| |
| Item 11. Controls and Procedures: |
| |
| (a) The registrant’s principal executive officer and principal financial officer have concluded, based on their evaluation of the effectiveness of the design and operation of the registrant’s disclosure controls and procedures as of a date within 90 days of the filing date of this report, that the design and operation of such procedures are generally effective to provide reasonable assurance that information required to be disclosed by the registrant in this report is recorded, processed, summarized and reported within the time periods specified in the Commission’s rules and forms. |
| |
| (b) Changes in internal control over financial reporting: Not applicable |
| |
| (a)(2) Separate certifications for the principal executive officer and principal financial officer of the registrant as required by Rule 30a-2(a) under the Investment Company Act of 1940, as amended, are filed herewith. |
| |
| (b) The certifications required by Rule 30a-2(b) under the Investment Company Act of 1940, as amended, are filed herewith. |
| |
| The George Putnam Fund of Boston |
| |
| By (Signature and Title): |
| |
| /s/Janet C. Smith
Janet C. Smith
Principal Accounting Officer
|
| |
| Pursuant to the requirements of the Securities Exchange Act of 1934 and the Investment Company Act of 1940, this report has been signed below by the following persons on behalf of the registrant and in the capacities and on the dates indicated. |
| |
| By (Signature and Title): |
| |
| /s/Jonathan S. Horwitz
Jonathan S. Horwitz
Principal Executive Officer
|
| |
| By (Signature and Title): |
| |
| /s/Steven D. Krichmar
Steven D. Krichmar
Principal Financial Officer
|