| | |
| UNITED STATES
SECURITIES AND EXCHANGE COMMISSION |
| | |
| CERTIFIED SHAREHOLDER REPORT OF REGISTERED
MANAGEMENT INVESTMENT COMPANIES
|
| | |
| Investment Company Act file number: | (811-00058) |
| | |
| Exact name of registrant as specified in charter: | The George Putnam Fund of Boston |
| | |
| Address of principal executive offices: | One Post Office Square, Boston, Massachusetts 02109 |
| | |
| Name and address of agent for service: | Robert T. Burns, Vice President
One Post Office Square
Boston, Massachusetts 02109 |
| | |
| Copy to: | John W. Gerstmayr, Esq.
Ropes & Gray LLP
800 Boylston Street
Boston, Massachusetts 02199-3600 |
| | |
| Registrant’s telephone number, including area code: | (617) 292-1000 |
| | |
| Date of fiscal year end: | July 31, 2013 |
| | |
| Date of reporting period: | August 1, 2012 — January 31, 2013 |
| | |
|
Item 1. Report to Stockholders: | |
| | |
| The following is a copy of the report transmitted to stockholders pursuant to Rule 30e-1 under the Investment Company Act of 1940: | |
George Putnam
Balanced
Fund
Semiannual report
1 | 31 | 13
| | | |
| Message from the Trustees | 1 | | |
| | |
| About the fund | 2 | | |
| | |
| Performance snapshot | 4 | | |
| | |
| Interview with your fund’s portfolio managers | 5 | | |
| | |
| Your fund’s performance | 11 | | |
| | |
| Your fund’s expenses | 13 | | |
| | |
| Terms and definitions | 15 | | |
| | |
| Other information for shareholders | 16 | | |
| | |
| Financial statements | 17 | | |
| | |
Consider these risks before investing: The fund may invest a portion of its assets in small and/or midsize companies. Such investments increase the risk of greater price fluctuations. Derivatives involve the risk, in the case of many over-the-counter instruments, of the potential inability to terminate or sell derivatives positions and the potential failure of the other party to the instrument to meet its obligations. Value stocks may fail to rebound, and the market may not favor value-style investing. Bond investments are subject to interest-rate risk, which means the prices of the fund’s bond investments are likely to fall if interest rates rise. Bond investments also are subject to credit risk, which is the risk that the issuer of the bond may default on payment of interest or principal. Interest-rate risk is generally greater for longer-term bonds, and credit risk is generally greater for below-investment-grade bonds, which may be considered speculative. Unlike bonds, funds that invest in bonds have ongoing fees and expenses. The prices of stocks and bonds in the fund’s portfolio may fall or fail to rise over extended periods of time for a variety of reasons, including both general financial market conditions and factors related to a specific company or industry.
Message from the Trustees
Dear Fellow Shareholder:
Stock markets around the world have continued to show strength into 2013, with the S&P 500 Index delivering its best January return since 1997. Investors witnessed several positive developments, including the U.S. fiscal cliff bill that Congress passed on January 1, 2013; the improving employment and housing situations; a more stable Europe; and China’s “soft landing” and positive growth.
Today’s market environment is one of slow and steady improvement, but uncertainties linger. Questions remain about potential economic fallout from the upcoming debt ceiling and budget sequestration debates in the United States. And the sovereign debt situation in Europe, while stabilized, is far from resolved.
At Putnam, our investment team is focused on actively managing risk and pursuing returns in today’s volatile global market. As always, it is important to rely on the guidance of your financial advisor to help you manage your investment portfolio in accordance with your goals and risk tolerance.
We would also like to extend a welcome to new shareholders of the fund and to thank all of our investors for your continued confidence in Putnam.

About the fund
Providing the benefits of balanced investing since 1937
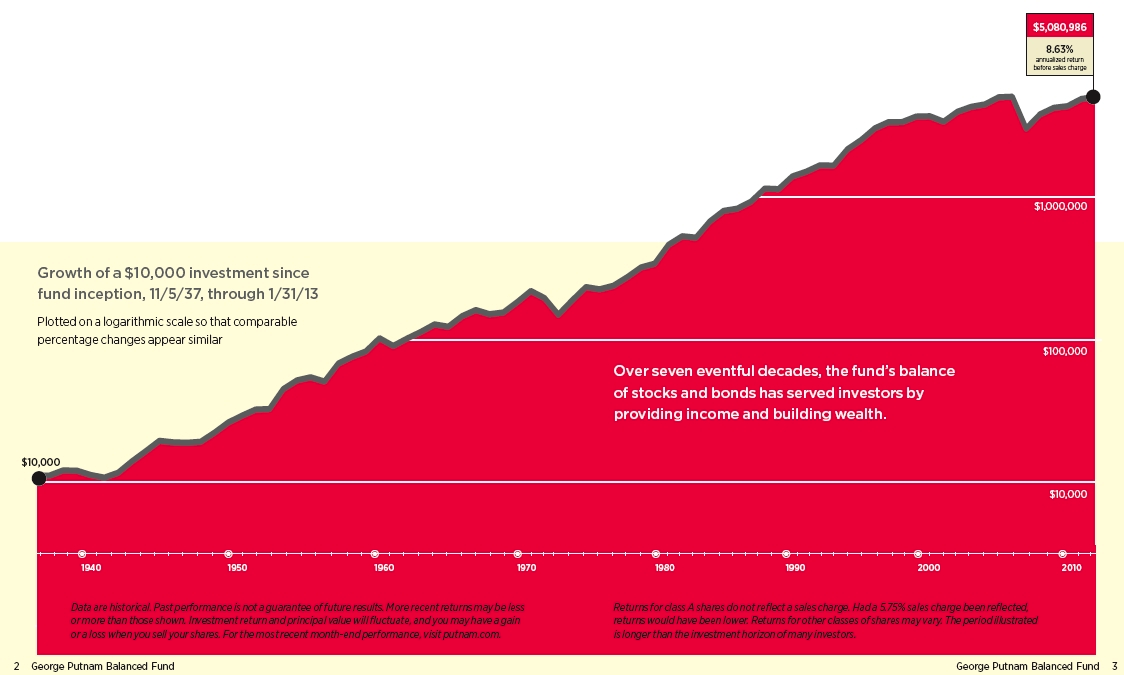
The fund launched in 1937 when George Putnam, a Boston investment manager, decided to introduce an innovative approach — a balance of stocks to seek capital appreciation and bonds to help provide current income. The original portfolio featured industrial stocks and railroad bonds.
This balanced approach made sense then, and we believe it continues to make sense now. In the late 1930s, the stock market experienced dramatic swings as businesses struggled to recover from the Great Depression and the shadow of war began to spread across Europe and Asia. Today, economic uncertainties continue to challenge investors.
Although the fund has experienced volatility at times, its balanced approach has kept it on course. When stocks were weak, the fund’s bonds helped results. Similarly, stocks often performed better when bonds were hurt by rising interest rates or inflation.
In a letter to shareholders dated July 12, 1938, George Putnam articulated the strategy this way: “Successful investing calls not so much for some clairvoyant ability to read the future as for the courage to stick to tested, commonsense policies in the face of the unreliable emotional stresses and strains that constantly sweep the market place.” Today, Putnam remains committed to this prudent approach.
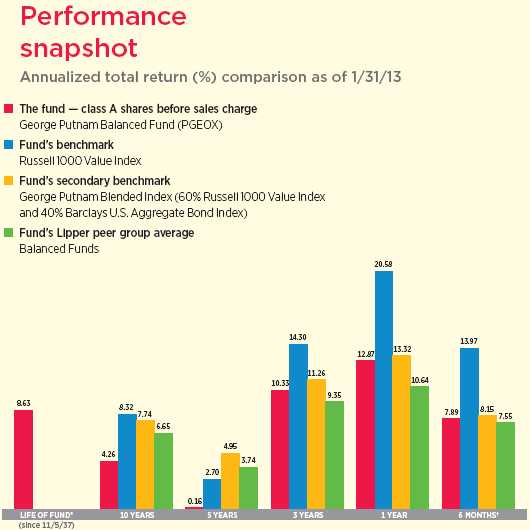
Current performance may be lower or higher than the quoted past performance, which cannot guarantee future results. Share price, principal value, and return will fluctuate, and you may have a gain or a loss when you sell your shares. Performance of class A shares assumes reinvestment of distributions and does not account for taxes. Fund returns in the bar chart do not reflect a sales charge of 5.75%; had they, returns would have been lower. See pages 5 and 11–13 for additional performance information. For a portion of the periods, the fund had expense limitations, without which returns would have been lower. To obtain the most recent month-end performance, visit putnam.com.
* The fund’s benchmarks (Russell 1000 Value Index and George Putnam Blended Index) were introduced on 12/31/78 and its Lipper group (Balanced Funds) was introduced on 12/31/59; they all post-date the inception of the fund’s class A shares.
† Returns for the six-month period are not annualized, but cumulative.
George Putnam Blended Index is an unmanaged index administered by Putnam Management, 60% of which is the Russell 1000 Value Index and 40% of which is the Barclays U.S. Aggregate Bond Index.
| |
| 4 | George Putnam Balanced Fund |
Interview with your fund’s portfolio managers

From the period August 1, 2012, through January 31, 2013, monetary policy affected conditions in stock and bond markets in which the fund invests. Can you give us an update?
Kevin: Two big steps in monetary policy occurred early in the period and contributed to favorable environments for both stocks and bonds. In August, the European Central Bank [ECB] announced an expansive bond-purchasing program to relieve pressure on European banks and governments. Then, in September, the U.S. Federal Reserve expanded its bond-purchasing program and outlined its goal of bringing down the unemployment rate.
The Fed is holding interest rates artificially low by managing the overnight federal funds rate and by purchasing large amounts of long-term Treasury and agency mortgage-backed securities each month. The newest version of this quantitative easing strategy is considered “QE unlimited” because the Fed committed to purchases of Treasury and mortgage securities for as long as it takes to lower the unemployment rate to 6.5%.
How did these policies influence bond market results?
Kevin: The Fed stopped using specific limits on the timing and amounts of bond purchases as it had with previous policies, and gave a better definition of its policy goal. This

This comparison shows your fund’s performance in the context of broad market indexes for the six months ended 1/31/13. See pages 4 and 11–13 for additional fund performance information. Index descriptions can be found on pages 15–16.
| |
| George Putnam Balanced Fund | 5 |
gave the market additional assurance that the Fed was committed to keeping interest rates low for an extended period of time. As a result, investors moved out of assets being purchased by the Fed and into assets that would benefit from lower rates, such as corporate bonds.
In this context, how did the portfolio’s fixed-income holdings perform during the period?
Kevin: Our bond holdings had positive results, and our performance exceeded that of the fund’s fixed-income benchmark, the Barclays U.S. Aggregate Bond Index, through sector and interest-rate positioning. Our decisions were based on our view that the economy has fundamental strength in the private sector that is temporarily obscured by a contracting public sector. We think this condition causes greater risk of rising interest rates rather than falling rates. We have managed the duration of the bond portfolio — which means the sensitivity of bond prices to changes in interest rates — to be generally lower than the duration of the benchmark. This helped results.
With regard to sector positioning, we preferred underweight exposure in sectors where the Fed was purchasing bonds. Instead of Treasuries and agencies, we favored corporate bonds, which offered attractive yield spreads. Within corporates, positioning favored banks, insurance, utility, and wireless communications sectors. This helped performance during the period.
How do you characterize the period for stocks?
David: Stocks rallied for the period as a whole largely because the economic recovery remained on track, supported by the policy actions that reduced concerns about a financial crisis in Europe. The fund’s equity benchmark, the Russell 1000 Value Index, rose almost 14% during the period.
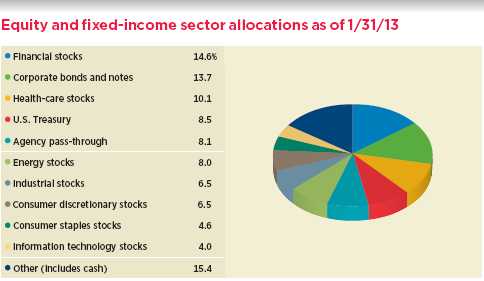
Allocations are represented as a percentage of the fund’s net assets. Summary information may differ from the portfolio schedule included in the financial statements due to the inclusion of derivative securities, any interest accruals, the exclusion of as-of trades, if any, and the use of different classifications of securities for presentation purposes. Holdings and allocations may vary over time.
| |
| 6 | George Putnam Balanced Fund |

However, progress was not steady across the entire period. The stock advance ended abruptly when the U.S. election in November maintained a divided government and heightened fears that the fiscal cliff would cause a damaging combination of tax increases and spending cuts. Stocks retreated in the final weeks of calendar year 2012, until the enactment of new legislation addressed tax issues. A new, even more powerful rally then followed in January. Companies more sensitive to the economic cycle began to perform better than stocks with more defensive qualities.
How did the fund’s equity holdings perform during the period?
David: The fund’s stock holdings did nearly as well as the equity benchmark. Several of the fund’s top contributors were in the financials and consumer cyclicals sectors, which were the two best-performing sectors in the benchmark. The ECB’s policy action helped financials by easing fear of a bank collapse in Europe that could have ripple effects for U.S. multinationals. Also, the U.S. housing market’s sustained recovery in late 2012 helped banks. The health-care sector also performed well, as steady cash flows became more appealing to investors as the period progressed.
On the other hand, more defensive sectors such as utilities and telecommunications, lagged the index, and several portfolio holdings in these sectors had subpar results. During the period, investors showed more inclination to take risks on stocks that could get an earnings boost from stronger economic growth.
Could you talk about some of the individual holdings that helped performance?
David: Citigroup, Travelers, Prudential, and State Street were top contributors. Each was
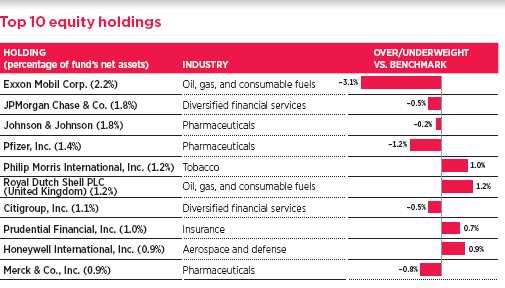
This table shows the fund’s top 10 equity holdings by percentage of the fund’s net assets as of 1/31/13. Short-term holdings are excluded. Holdings will vary over time.
| |
| George Putnam Balanced Fund | 7 |
a large holding for the fund and an overweight position relative to the equity benchmark. The companies operate in different industries, a reflection of the financials sector’s broad strength. Citigroup is a large diversified global money center bank, Travelers is a property/casualty insurer, Prudential is a life insurer, and State Street is a diversified asset manager and asset custodian.
In the consumer cyclicals sector, we favored media companies such as Time Warner and Viacom. These companies operate stable revenue-generating cable television franchises, but they also faced uncertainties that earnings might drop off or that an economic downturn might reduce spending on consumer ads. However, over the course of the period both companies reported stabilizing and growing cash flows, reassuring the market and helping the stocks appreciate. We think the valuations of these stocks remain attractive.
What were some of the health-care holdings that added to the portfolio’s performance?
David: We have found opportunities in this sector because uncertainty under the new law caused many stocks to become undervalued. However, at the same time we believed that demand for health care would increase steadily. We took positions in several stocks that we believed could appreciate merely by posting moderate single-digit earnings growth rates.
During the period, Thermo Fisher Scientific, a medical device company that was an overweight position versus the benchmark, contributed positively to results. Its fundamental performance was steady, helping the stock recover from a relatively weak
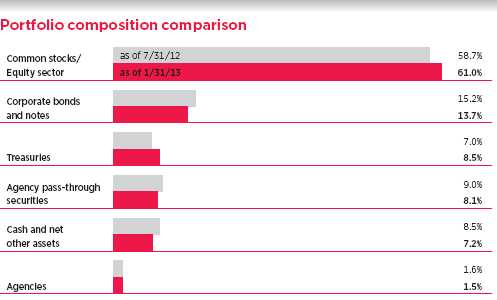
This chart shows how the fund’s top weightings have changed over the past six months. Allocations are represented as a percentage of the fund’s net assets. Cash and net other assets, if any, represent the market value weights of cash, derivatives, short-term securities, unclassified assets, and other assets in the portfolio not otherwise shown in this chart. Current period summary information may differ from the portfolio schedule included in the financial statements due to the inclusion of derivative securities, any interest accruals, the exclusion of as-of trades, if any, and the use of different classifications of securities for presentation purposes. Holdings and allocations may vary over time.
| |
| 8 | George Putnam Balanced Fund |
price at the start of the period. Insurance and HMO company CIGNA also performed well. We also have a smaller position in UnitedHealth Group.
Which stocks held back performance?
David: Telecommunications stocks Verizon and AT&T delivered lackluster results, but not because of any fundamental disappointments. Instead, industry rival Sprint attracted much greater investor demand because of merger speculation involving MetroPCS and T-Mobile.
In the technology sector, EMC and Microsoft also did not fare well. In the case of EMC, this appears to be a case of a solid, undervalued company simply being overlooked by the market. For Microsoft, however, weak results stemmed from unimpressive new products — the Windows 8 operating system and its new tablet computer. We continue to own both stocks because we believe they remain undervalued.
Philip Morris also underperformed the index during the period. This classic defensive stock came off a period of leadership earlier in 2012, during which its valuation increased significantly. However, we believe the stock continues to offer attractive value and it remains a top position.
What is your outlook for stocks?
David: We generally believe that the stock market can continue to deliver positive growth, but at a slower pace than in the first half of the fiscal year. We are less optimistic about the bond market.
What is your outlook and strategy for bonds?
Kevin: We believe the economy has fundamental strength. Strong balance sheets should allow both households and businesses to spend money. However, public sector spending is contracting, and the federal government’s political brinksmanship adds to uncertainty. While we believe a recession is unlikely, uneven economic reports may obscure the strength of the economy until the second half of the calendar year. As a result, we expect the Fed will remain involved in the economy throughout 2013, holding interest rates near current levels.
While interest rate movements are likely to remain subdued, we still believe that rising rates are more probable than falling rates. In either scenario, government bond returns are likely to be lackluster, in our view. We continue to favor corporate bonds, which we believe still offer attractive yield spreads, though at lower levels than previous years.
Kevin and David, thanks for discussing the fund today.
The views expressed in this report are exclusively those of Putnam Management and are subject to change. They are not meant as investment advice.
Please note that the holdings discussed in this report may not have been held by the fund for the entire period. Portfolio composition is subject to review in accordance with the fund’s investment strategy and may vary in the future. Current and future portfolio holdings are subject to risk.
Portfolio Manager David M. Calabro holds a B.A. from Williams College. David joined Putnam in 2008 and has been in the investment industry since 1982.
Portfolio Manager Kevin F. Murphy holds a B.S. from Columbia University. He joined Putnam in 1999 and has been in the investment industry since 1988.
| |
| George Putnam Balanced Fund | 9 |
IN THE NEWS
Mixed signals are coming from the U.S. economy. On the positive side, the unemployment rate continues to tick down, the housing sector is recovering, and the stock market has reached multi-year highs. But uncertainty remains. The nation’s GDP was essentially flat in the fourth quarter of 2012, after several consecutive quarters of expansion. A precipitous drop in military spending contributed to the slowdown, and many questions remain about government spending and its impact on GDP going forward. Consumer confidence recently dropped following the tax increases resulting from the fiscal cliff resolution, as people anticipate the pinch of less take-home pay. The next few months should provide clearer direction for the markets on government spending and the resilience of the recovery.
| |
| 10 | George Putnam Balanced Fund |
Your fund’s performance
This section shows your fund’s performance, price, and distribution information for periods ended January 31, 2013, the end of the first half of its current fiscal year. In accordance with regulatory requirements for mutual funds, we also include performance information as of the most recent calendar quarter-end and expense information taken from the fund’s current prospectus. Performance should always be considered in light of a fund’s investment strategy. Data represent past performance. Past performance does not guarantee future results. More recent returns may be less or more than those shown. Investment return and principal value will fluctuate, and you may have a gain or a loss when you sell your shares. Performance information does not reflect any deduction for taxes a shareholder may owe on fund distributions or on the redemption of fund shares. For the most recent month-end performance, please visit the Individual Investors section at putnam.com or call Putnam at 1-800-225-1581. Class R and class Y shares are not available to all investors. See the Terms and Definitions section in this report for definitions of the share classes offered by your fund.
Fund performance Total return for periods ended 1/31/13
| | | | | | | | | | |
| | Class A | Class B | Class C | Class M | Class R | Class Y |
| (inception dates) | (11/5/37) | (4/27/92) | (7/26/99) | (12/1/94) | (1/21/03) | (3/31/94) |
|
| | Before | After | | | | | Before | After | Net | Net |
| | sales | sales | Before | After | Before | After | sales | sales | asset | asset |
| | charge | charge | CDSC | CDSC | CDSC | CDSC | charge | charge | value | value |
|
| Annual average | | | | | | | | | | |
| (life of fund) | 8.63% | 8.55% | 7.63% | 7.63% | 7.82% | 7.82% | 7.90% | 7.85% | 8.36% | 8.70% |
|
| 10 years | 51.71 | 42.98 | 40.59 | 40.59 | 40.79 | 40.79 | 44.39 | 39.36 | 48.20 | 55.49 |
| Annual average | 4.26 | 3.64 | 3.47 | 3.47 | 3.48 | 3.48 | 3.74 | 3.37 | 4.01 | 4.51 |
|
| 5 years | 0.79 | –5.02 | –3.00 | –4.73 | –2.85 | –2.85 | –1.65 | –5.10 | –0.34 | 2.03 |
| Annual average | 0.16 | –1.02 | –0.61 | –0.96 | –0.58 | –0.58 | –0.33 | –1.04 | –0.07 | 0.40 |
|
| 3 years | 34.30 | 26.56 | 31.20 | 28.20 | 31.37 | 31.37 | 32.20 | 27.54 | 33.26 | 35.19 |
| Annual average | 10.33 | 8.17 | 9.47 | 8.63 | 9.52 | 9.52 | 9.75 | 8.45 | 10.04 | 10.57 |
|
| 1 year | 12.87 | 6.35 | 12.05 | 7.05 | 12.10 | 11.10 | 12.30 | 8.41 | 12.63 | 13.11 |
|
| 6 months | 7.89 | 1.65 | 7.48 | 2.48 | 7.52 | 6.52 | 7.64 | 3.88 | 7.78 | 7.99 |
|
Current performance may be lower or higher than the quoted past performance, which cannot guarantee future results. After-sales-charge returns for class A and M shares reflect the deduction of the maximum 5.75% and 3.50% sales charge, respectively, levied at the time of purchase. Class B share returns after contingent deferred sales charge (CDSC) reflect the applicable CDSC, which is 5% in the first year, declining over time to 1% in the sixth year, and is eliminated thereafter. Class C share returns after CDSC reflect a 1% CDSC for the first year that is eliminated thereafter. Class R and Y shares have no initial sales charge or CDSC. Performance for class B, C, M, R, and Y shares before their inception is derived from the historical performance of class A shares, adjusted for the applicable sales charge (or CDSC) and the higher operating expenses for such shares, except for class Y shares, for which 12b-1 fees are not applicable.
For a portion of the periods, the fund had expense limitations, without which returns would have been lower.
Class B share performance does not reflect conversion to class A shares.
| |
| George Putnam Balanced Fund | 11 |
Comparative index returns For periods ended 1/31/13
| | | | |
| | | Barclays | | Lipper |
| | Russell 1000 | U.S. Aggregate | George Putnam | Balanced Funds |
| | Value Index | Bond Index | Blended Index† | category average‡ |
|
| Annual average (life of fund) | —* | —* | —* | —* |
|
| 10 years | 122.45% | 64.45% | 110.85% | 91.47% |
| Annual average | 8.32 | 5.10 | 7.74 | 6.65 |
|
| 5 years | 14.26 | 30.36 | 27.30 | 20.35 |
| Annual average | 2.70 | 5.45 | 4.95 | 3.74 |
|
| 3 years | 49.32 | 17.11 | 37.74 | 30.82 |
| Annual average | 14.30 | 5.41 | 11.26 | 9.35 |
|
| 1 year | 20.58 | 2.59 | 13.32 | 10.64 |
|
| 6 months | 13.97 | –0.29 | 8.15 | 7.55 |
|
Index and Lipper results should be compared with fund performance before sales charge, before CDSC, or at net asset value.
* The fund’s benchmarks (Russell 1000 Value Index and George Putnam Blended Index) were introduced on 12/31/78. The Barclays U.S. Aggregate Bond Index was introduced on 12/31/75, and the fund’s Lipper group (Balanced Funds) was introduced on 12/31/59. They all post-date the inception of the fund’s class A shares.
† George Putnam Blended Index is an unmanaged index administered by Putnam Management, 60% of which is the Russell 1000 Value Index and 40% of which is the Barclays U.S. Aggregate Bond Index.
‡ Over the 6-month, 1-year, 3-year, 5-year, and 10-year periods ended 1/31/13, there were 701, 674, 646, 608, and 298 funds, respectively, in this Lipper category.
Fund price and distribution information For the six-month period ended 1/31/13
| | | | | | | | |
| Distributions | Class A | Class B | Class C | Class M | Class R | Class Y |
|
| Number | 2 | 2 | 2 | 2 | 2 | 2 |
|
| Income | $0.100 | $0.050 | $0.050 | $0.067 | $0.084 | $0.116 |
|
| Capital gains | — | — | — | — | — | — |
|
| Total | $0.100 | $0.050 | $0.050 | $0.067 | $0.084 | $0.116 |
|
| | Before | After | Net | Net | Before | After | Net | Net |
| | sales | sales | asset | asset | sales | sales | asset | asset |
| Share value | charge | charge | value | value | charge | charge | value | value |
|
| 7/31/12 | $12.88 | $13.67 | $12.74 | $12.80 | $12.71 | $13.17 | $12.84 | $12.92 |
|
| 1/31/13 | 13.79 | 14.63 | 13.64 | 13.71 | 13.61 | 14.10 | 13.75 | 13.83 |
|
| | Before | After | Net | Net | Before | After | Net | Net |
| | sales | sales | asset | asset | sales | sales | asset | asset |
| Current rate (end of period) | charge | charge | value | value | charge | charge | value | value |
|
| Current dividend rate 1 | 1.45% | 1.37% | 0.73% | 0.73% | 0.97% | 0.94% | 1.22% | 1.68% |
|
| Current 30-day SEC yield 2,3 | N/A | 1.17 | 0.51 | 0.51 | N/A | 0.72 | 1.00 | 1.49 |
|
The classification of distributions, if any, is an estimate. Before-sales-charge share value and current dividend rate for class A and M shares, if applicable, do not take into account any sales charge levied at the time of purchase. After-sales-charge share value, current dividend rate and current 30-day SEC yield, if applicable, are calculated assuming that the maximum sales charge (5.75% for class A shares and 3.50% for class M shares) was levied at the time of purchase. Final distribution information will appear on your year-end tax forms.
1 Most recent distribution, excluding capital gains, annualized and divided by NAV or POP at end of period.
2 For a portion of the period, this fund’s expenses were limited, without which yields would have been lower.
3 Based only on investment income and calculated using the maximum offering price for each share class, in accordance with SEC guidelines.
| |
| 12 | George Putnam Balanced Fund |
Fund performance as of most recent calendar quarter
Total return for periods ended 12/31/12
| | | | | | | | | | |
| | Class A | Class B | Class C | Class M | Class R | Class Y |
| (inception dates) | (11/5/37) | (4/27/92) | (7/26/99) | (12/1/94) | (1/21/03) | (3/31/94) |
|
| | Before | After | | | | | Before | After | Net | Net |
| | sales | sales | Before | After | Before | After | sales | sales | asset | asset |
| | charge | charge | CDSC | CDSC | CDSC | CDSC | charge | charge | value | value |
|
| Annual average | | | | | | | | | | |
| (life of fund) | 8.59% | 8.51% | 7.59% | 7.59% | 7.78% | 7.78% | 7.86% | 7.81% | 8.33% | 8.66% |
|
| 10 years | 44.38 | 36.10 | 33.74 | 33.74 | 34.05 | 34.05 | 37.43�� | 32.63 | 41.13 | 48.09 |
| Annual average | 3.74 | 3.13 | 2.95 | 2.95 | 2.97 | 2.97 | 3.23 | 2.86 | 3.51 | 4.00 |
|
| 5 years | –3.67 | –9.21 | –7.32 | –8.98 | –7.21 | –7.21 | –6.04 | –9.36 | –4.74 | –2.47 |
| Annual average | –0.75 | –1.91 | –1.51 | –1.86 | –1.49 | –1.49 | –1.24 | –1.95 | –0.97 | –0.50 |
|
| 3 years | 28.27 | 20.87 | 25.34 | 22.34 | 25.42 | 25.42 | 26.29 | 21.88 | 27.36 | 29.15 |
| Annual average | 8.65 | 6.52 | 7.82 | 6.95 | 7.84 | 7.84 | 8.09 | 6.82 | 8.40 | 8.90 |
|
| 1 year | 12.36 | 5.86 | 11.54 | 6.54 | 11.58 | 10.58 | 11.78 | 7.88 | 12.11 | 12.60 |
|
| 6 months | 5.85 | –0.21 | 5.42 | 0.42 | 5.47 | 4.47 | 5.57 | 1.91 | 5.73 | 5.96 |
|
See the discussion following the Fund performance table on page 11 for information about the calculation of fund performance.
Your fund’s expenses
As a mutual fund investor, you pay ongoing expenses, such as management fees, distribution fees (12b-1 fees), and other expenses. Using the following information, you can estimate how these expenses affect your investment and compare them with the expenses of other funds. You may also pay one-time transaction expenses, including sales charges (loads) and redemption fees, which are not shown in this section and would have resulted in higher total expenses. For more information, see your fund’s prospectus or talk to your financial representative.
Expense ratios
| | | | | | |
| | Class A | Class B | Class C | Class M | Class R | Class Y |
|
| Total annual operating expenses | | | | | | |
| for the fiscal year ended 7/31/12 | 1.04% | 1.79% | 1.79% | 1.54% | 1.29% | 0.79% |
|
| Annualized expense ratio for the | | | | | | |
| six-month period ended 1/31/13 | 1.01% | 1.76% | 1.76% | 1.51% | 1.26% | 0.76% |
|
Fiscal-year expense information in this table is taken from the most recent prospectus, is subject to change, and may differ from that shown for the annualized expense ratio and in the financial highlights of this report. Expenses are shown as a percentage of average net assets.
| |
| George Putnam Balanced Fund | 13 |
Expenses per $1,000
The following table shows the expenses you would have paid on a $1,000 investment in the fund from August 1, 2012, to January 31, 2013. It also shows how much a $1,000 investment would be worth at the close of the period, assuming actual returns and expenses.
| | | | | | |
| | Class A | Class B | Class C | Class M | Class R | Class Y |
|
| Expenses paid per $1,000*† | $5.29 | $9.20 | $9.21 | $7.90 | $6.60 | $3.98 |
|
| Ending value (after expenses) | $1,078.90 | $1,074.80 | $1,075.20 | $1,076.40 | $1,077.80 | $1,079.90 |
|
* Expenses for each share class are calculated using the fund’s annualized expense ratio for each class, which represents the ongoing expenses as a percentage of average net assets for the six months ended 1/31/13. The expense ratio may differ for each share class.
† Expenses are calculated by multiplying the expense ratio by the average account value for the period; then multiplying the result by the number of days in the period; and then dividing that result by the number of days in the year.
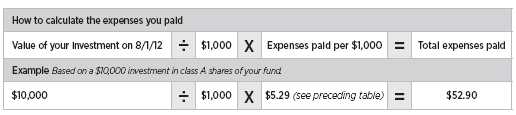
Estimate the expenses you paid
To estimate the ongoing expenses you paid for the six months ended January 31, 2013, use the following calculation method. To find the value of your investment on August 1, 2012, call Putnam at 1-800-225-1581.
Compare expenses using the SEC’s method
The Securities and Exchange Commission (SEC) has established guidelines to help investors assess fund expenses. Per these guidelines, the following table shows your fund’s expenses based on a $1,000 investment, assuming a hypothetical 5% annualized return. You can use this information to compare the ongoing expenses (but not transaction expenses or total costs) of investing in the fund with those of other funds. All mutual fund shareholder reports will provide this information to help you make this comparison. Please note that you cannot use this information to estimate your actual ending account balance and expenses paid during the period.
| | | | | | |
| | Class A | Class B | Class C | Class M | Class R | Class Y |
|
| Expenses paid per $1,000*† | $5.14 | $8.94 | $8.94 | $7.68 | $6.41 | $3.87 |
|
| Ending value (after expenses) | $1,020.11 | $1,016.33 | $1,016.33 | $1,017.59 | $1,018.85 | $1,021.37 |
|
* Expenses for each share class are calculated using the fund’s annualized expense ratio for each class, which represents the ongoing expenses as a percentage of average net assets for the six months ended 1/31/13. The expense ratio may differ for each share class.
† Expenses are calculated by multiplying the expense ratio by the average account value for the period; then multiplying the result by the number of days in the period; and then dividing that result by the number of days in the year.
| |
| 14 | George Putnam Balanced Fund |
Terms and definitions
Important terms
Total return shows how the value of the fund’s shares changed over time, assuming you held the shares through the entire period and reinvested all distributions in the fund.
Before sales charge, or net asset value, is the price, or value, of one share of a mutual fund, without a sales charge. Before-sales-charge figures fluctuate with market conditions, and are calculated by dividing the net assets of each class of shares by the number of outstanding shares in the class.
After sales charge is the price of a mutual fund share plus the maximum sales charge levied at the time of purchase. After-sales-charge performance figures shown here assume the 5.75% maximum sales charge for class A shares and 3.50% for class M shares.
Contingent deferred sales charge (CDSC) is generally a charge applied at the time of the redemption of class B or C shares and assumes redemption at the end of the period. Your fund’s class B CDSC declines over time from a 5% maximum during the first year to 1% during the sixth year. After the sixth year, the CDSC no longer applies. The CDSC for class C shares is 1% for one year after purchase.
Current yield is the annual rate of return earned from dividends or interest of an investment. Current yield is expressed as a percentage of the price of a security, fund share, or principal investment.
Share classes
Class A shares are generally subject to an initial sales charge and no CDSC (except on certain redemptions of shares bought without an initial sales charge).
Class B shares are not subject to an initial sales charge. They may be subject to a CDSC.
Class C shares are not subject to an initial sales charge and are subject to a CDSC only if the shares are redeemed during the first year.
Class M shares have a lower initial sales charge and a higher 12b-1 fee than class A shares and no CDSC (except on certain redemptions of shares bought without an initial sales charge).
Class R shares are not subject to an initial sales charge or CDSC and are available only to certain defined contribution plans.
Class Y shares are not subject to an initial sales charge or CDSC, and carry no 12b-1 fee. They are generally only available to corporate and institutional clients and clients in other approved programs.
Comparative indexes
Barclays U.S. Aggregate Bond Index is an unmanaged index of U.S. investment-grade fixed-income securities.
BofA (Bank of America) Merrill Lynch U.S. 3-Month Treasury Bill Index is an unmanaged index that seeks to measure the performance of U.S. Treasury bills available in the marketplace.
George Putnam Blended Index is an unmanaged index administered by Putnam Management, LLC, 60% of which is the Russell 1000 Value Index and 40% of which is the Barclays U.S. Aggregate Bond Index.
Russell 1000 Value Index is an unmanaged index of those companies in the large-cap Russell 1000 Index chosen for their value orientation.
S&P 500 Index is an unmanaged index of common stock performance.
Indexes assume reinvestment of all distributions and do not account for fees. Securities and performance of a fund and an index will differ. You cannot invest directly in an index.
| |
| George Putnam Balanced Fund | 15 |
Lipper is a third-party industry-ranking entity that ranks mutual funds. Its rankings do not reflect sales charges. Lipper rankings are based on total return at net asset value relative to other funds that have similar current investment styles or objectives as determined by Lipper. Lipper may change a fund’s category assignment at its discretion. Lipper category averages reflect performance trends for funds within a category.
Other information for shareholders
Important notice regarding delivery of shareholder documents
In accordance with Securities and Exchange Commission (SEC) regulations, Putnam sends a single copy of annual and semiannual shareholder reports, prospectuses, and proxy statements to Putnam shareholders who share the same address, unless a shareholder requests otherwise. If you prefer to receive your own copy of these documents, please call Putnam at 1-800-225-1581, and Putnam will begin sending individual copies within 30 days.
Proxy voting
Putnam is committed to managing our mutual funds in the best interests of our shareholders. The Putnam funds’ proxy voting guidelines and procedures, as well as information regarding how your fund voted proxies relating to portfolio securities during the 12-month period ended June 30, 2012, are available in the Individual Investors section of putnam.com, and on the SEC’s website, www.sec.gov. If you have questions about finding forms on the SEC’s website, you may call the SEC at 1-800-SEC-0330. You may also obtain the Putnam funds’ proxy voting guidelines and procedures at no charge by calling Putnam’s Shareholder Services at 1-800-225-1581.
Fund portfolio holdings
The fund will file a complete schedule of its portfolio holdings with the SEC for the first and third quarters of each fiscal year on Form N-Q. Shareholders may obtain the fund’s Forms N-Q on the SEC’s website at www.sec.gov. In addition, the fund’s Forms N-Q may be reviewed and copied at the SEC’s Public Reference Room in Washington, D.C. You may call the SEC at 1-800-SEC-0330 for information about the SEC’s website or the operation of the Public Reference Room.
Trustee and employee fund ownership
Putnam employees and members of the Board of Trustees place their faith, confidence, and, most importantly, investment dollars in Putnam mutual funds. As of January 31, 2013, Putnam employees had approximately $364,000,000 and the Trustees had approximately $87,000,000 invested in Putnam mutual funds. These amounts include investments by the Trustees’ and employees’ immediate family members as well as investments through retirement and deferred compensation plans.
| |
| 16 | George Putnam Balanced Fund |
Financial statements
A guide to financial statements
These sections of the report, as well as the accompanying Notes, constitute the fund’s financial statements.
The fund’s portfolio lists all the fund’s investments and their values as of the last day of the reporting period. Holdings are organized by asset type and industry sector, country, or state to show areas of concentration and diversification.
Statement of assets and liabilities shows how the fund’s net assets and share price are determined. All investment and non-investment assets are added together. Any unpaid expenses and other liabilities are subtracted from this total. The result is divided by the number of shares to determine the net asset value per share, which is calculated separately for each class of shares. (For funds with preferred shares, the amount subtracted from total assets includes the liquidation preference of preferred shares.)
Statement of operations shows the fund’s net investment gain or loss. This is done by first adding up all the fund’s earnings — from dividends and interest income — and subtracting its operating expenses to determine net investment income (or loss). Then, any net gain or loss the fund realized on the sales of its holdings — as well as any unrealized gains or losses over the period — is added to or subtracted from the net investment result to determine the fund’s net gain or loss for the fiscal period.
Statement of changes in net assets shows how the fund’s net assets were affected by the fund’s net investment gain or loss, by distributions to shareholders, and by changes in the number of the fund’s shares. It lists distributions and their sources (net investment income or realized capital gains) over the current reporting period and the most recent fiscal year-end. The distributions listed here may not match the sources listed in the Statement of operations because the distributions are determined on a tax basis and may be paid in a different period from the one in which they were earned. Dividend sources are estimated at the time of declaration. Actual results may vary. Any non-taxable return of capital cannot be determined until final tax calculations are completed after the end of the fund’s fiscal year.
Financial highlights provide an overview of the fund’s investment results, per-share distributions, expense ratios, net investment income ratios, and portfolio turnover in one summary table, reflecting the five most recent reporting periods. In a semiannual report, the highlights table also includes the current reporting period.
| |
| George Putnam Balanced Fund | 17 |
The fund’s portfolio 1/31/13 (Unaudited)
| | |
| COMMON STOCKS (58.7%)* | Shares | Value |
|
| Banking (3.7%) | | |
| Bank of New York Mellon Corp. (The) | 195,200 | $5,301,631 |
|
| BB&T Corp. | 88,500 | 2,679,780 |
|
| Capital One Financial Corp. | 115,500 | 6,504,960 |
|
| Comerica, Inc. | 70,900 | 2,436,124 |
|
| PNC Financial Services Group, Inc. | 60,400 | 3,732,720 |
|
| State Street Corp. | 163,100 | 9,076,515 |
|
| U.S. Bancorp | 157,200 | 5,203,320 |
|
| Wells Fargo & Co. | 282,000 | 9,822,060 |
|
| | | 44,757,110 |
| Basic materials (1.3%) | | |
| Alcoa, Inc. | 136,400 | 1,205,776 |
|
| Dow Chemical Co. (The) | 61,048 | 1,965,746 |
|
| E.I. du Pont de Nemours & Co. | 79,800 | 3,786,510 |
|
| Freeport-McMoRan Copper & Gold, Inc. Class B (Indonesia) | 56,600 | 1,995,150 |
|
| Nucor Corp. | 53,900 | 2,479,939 |
|
| PPG Industries, Inc. | 20,900 | 2,881,483 |
|
| Rio Tinto PLC ADR (United Kingdom) | 15,500 | 875,285 |
|
| Weyerhaeuser Co. R | 35,072 | 1,056,369 |
|
| | | 16,246,258 |
| Capital goods (2.5%) | | |
| Cummins, Inc. | 20,000 | 2,296,600 |
|
| Eaton Corp PLC | 98,000 | 5,581,099 |
|
| Emerson Electric Co. | 36,500 | 2,089,625 |
|
| Illinois Tool Works, Inc. | 60,500 | 3,801,215 |
|
| Ingersoll-Rand PLC | 29,000 | 1,490,310 |
|
| Lockheed Martin Corp. | 19,300 | 1,676,591 |
|
| Northrop Grumman Corp. | 42,300 | 2,751,192 |
|
| Parker Hannifin Corp. | 40,400 | 3,755,988 |
|
| Raytheon Co. | 60,800 | 3,202,944 |
|
| Staples, Inc. | 45,800 | 617,384 |
|
| United Technologies Corp. | 33,100 | 2,898,567 |
|
| | | 30,161,515 |
| Communication services (3.0%) | | |
| AT&T, Inc. | 251,882 | 8,762,975 |
|
| Comcast Corp. Class A | 237,100 | 9,028,767 |
|
| Juniper Networks, Inc. † | 38,400 | 859,392 |
|
| Time Warner Cable, Inc. | 31,800 | 2,841,012 |
|
| Verizon Communications, Inc. | 198,800 | 8,669,668 |
|
| Vodafone Group PLC ADR (United Kingdom) | 221,500 | 6,051,380 |
|
| | | 36,213,194 |
| Conglomerates (1.5%) | | |
| 3M Co. | 19,800 | 1,990,890 |
|
| General Electric Co. | 479,800 | 10,689,943 |
|
| Tyco International, Ltd. | 179,400 | 5,423,262 |
|
| | | 18,104,095 |
| Consumer cyclicals (5.6%) | | |
| ADT Corp. (The) | 54,050 | 2,567,375 |
|
| Bed Bath & Beyond, Inc. † | 82,700 | 4,854,490 |
|
| |
| 18 | George Putnam Balanced Fund |
| | |
| COMMON STOCKS (58.7%)* cont. | Shares | Value |
|
| Consumer cyclicals cont. | | |
| Carnival Corp. | 42,300 | $1,637,856 |
|
| Ford Motor Co. | 201,400 | 2,608,130 |
|
| Hasbro, Inc. | 43,100 | 1,610,647 |
|
| Home Depot, Inc. (The) | 37,100 | 2,482,732 |
|
| J.C. Penney Co., Inc. | 84,400 | 1,715,852 |
|
| Johnson Controls, Inc. | 161,100 | 5,008,599 |
|
| Kimberly-Clark Corp. | 31,700 | 2,837,467 |
|
| Macy’s, Inc. | 113,800 | 4,496,238 |
|
| Marriott International, Inc. Class A | 51,220 | 2,047,776 |
|
| News Corp. Class A | 143,500 | 3,980,690 |
|
| Owens Corning, Inc. † | 53,000 | 2,208,510 |
|
| Stanley Black & Decker, Inc. | 15,500 | 1,190,865 |
|
| Target Corp. | 113,900 | 6,880,699 |
|
| Time Warner, Inc. | 213,800 | 10,801,175 |
|
| TJX Cos., Inc. (The) | 40,300 | 1,820,754 |
|
| Viacom, Inc. Class B | 61,500 | 3,711,525 |
|
| Wal-Mart Stores, Inc. | 15,900 | 1,112,205 |
|
| Walt Disney Co. (The) | 90,500 | 4,876,140 |
|
| | | 68,449,725 |
| Consumer staples (4.7%) | | |
| Avon Products, Inc. | 96,300 | 1,635,174 |
|
| Coca-Cola Co. (The) | 52,600 | 1,958,824 |
|
| Coca-Cola Enterprises, Inc. | 122,400 | 4,268,088 |
|
| Colgate-Palmolive Co. | 18,000 | 1,932,660 |
|
| CVS Caremark Corp. | 132,800 | 6,799,360 |
|
| General Mills, Inc. | 70,700 | 2,965,158 |
|
| Kellogg Co. | 34,300 | 2,006,550 |
|
| Lorillard, Inc. | 60,500 | 2,363,735 |
|
| McDonald’s Corp. | 44,600 | 4,249,934 |
|
| Newell Rubbermaid, Inc. | 52,800 | 1,239,744 |
|
| PepsiCo, Inc. | 23,900 | 1,741,115 |
|
| Philip Morris International, Inc. | 168,900 | 14,890,223 |
|
| Procter & Gamble Co. (The) | 108,300 | 8,139,828 |
|
| Walgreen Co. | 81,000 | 3,236,760 |
|
| | | 57,427,153 |
| Energy (8.0%) | | |
| Anadarko Petroleum Corp. | 44,300 | 3,544,886 |
|
| Chevron Corp. | 70,900 | 8,164,135 |
|
| ConocoPhillips | 66,600 | 3,862,800 |
|
| Exxon Mobil Corp. | 298,000 | 26,811,059 |
|
| Halliburton Co. | 131,500 | 5,349,420 |
|
| Hess Corp. | 31,900 | 2,142,404 |
|
| Marathon Oil Corp. | 177,900 | 5,979,219 |
|
| Noble Corp. | 54,500 | 2,207,250 |
|
| Occidental Petroleum Corp. | 71,100 | 6,275,997 |
|
| Phillips 66 | 24,100 | 1,459,737 |
|
| Royal Dutch Shell PLC ADR (United Kingdom) | 198,880 | 14,025,018 |
|
| Schlumberger, Ltd. | 62,895 | 4,908,955 |
|
| |
| George Putnam Balanced Fund | 19 |
| | |
| COMMON STOCKS (58.7%)* cont. | Shares | Value |
|
| Energy cont. | | |
| Southwestern Energy Co. † | 82,200 | $2,819,460 |
|
| Suncor Energy, Inc. (Canada) | 125,800 | 4,279,716 |
|
| Total SA ADR (France) | 73,900 | 4,012,031 |
|
| Valero Energy Corp. | 33,100 | 1,447,463 |
|
| | | 97,289,550 |
| Financials (6.8%) | | |
| Aflac, Inc. | 129,700 | 6,881,882 |
|
| American Express Co. | 50,300 | 2,958,143 |
|
| American International Group, Inc. † | 77,700 | 2,939,391 |
|
| Bank of America Corp. | 669,500 | 7,578,740 |
|
| Citigroup, Inc. | 309,050 | 13,029,548 |
|
| Goldman Sachs Group, Inc. (The) | 58,810 | 8,695,647 |
|
| JPMorgan Chase & Co. | 462,300 | 21,751,214 |
|
| MetLife, Inc. | 165,800 | 6,190,972 |
|
| Progressive Corp. (The) | 57,700 | 1,297,673 |
|
| Prudential Financial, Inc. | 201,000 | 11,633,880 |
|
| | | 82,957,090 |
| Health care (10.1%) | | |
| Baxter International, Inc. | 95,100 | 6,451,584 |
|
| Bristol-Myers Squibb Co. | 72,500 | 2,620,150 |
|
| CareFusion Corp. † | 87,500 | 2,716,000 |
|
| CIGNA Corp. | 107,300 | 6,259,882 |
|
| Covidien PLC | 93,812 | 5,848,240 |
|
| Eli Lilly & Co. | 58,000 | 3,114,020 |
|
| GlaxoSmithKline PLC ADR (United Kingdom) | 68,300 | 3,115,163 |
|
| Johnson & Johnson | 290,500 | 21,473,759 |
|
| Medtronic, Inc. | 91,500 | 4,263,900 |
|
| Merck & Co., Inc. | 254,600 | 11,011,450 |
|
| Novartis AG ADR (Switzerland) | 64,000 | 4,340,480 |
|
| Pfizer, Inc. | 627,558 | 17,119,782 |
|
| St. Jude Medical, Inc. | 130,700 | 5,319,490 |
|
| Stryker Corp. | 75,000 | 4,698,750 |
|
| Teva Pharmaceutical Industries, Ltd. ADR (Israel) | 89,000 | 3,381,110 |
|
| Thermo Fisher Scientific, Inc. | 141,500 | 10,207,810 |
|
| UnitedHealth Group, Inc. | 121,300 | 6,696,973 |
|
| Zimmer Holdings, Inc. | 52,200 | 3,894,120 |
|
| | | 122,532,663 |
| Insurance (2.1%) | | |
| Allstate Corp. (The) | 57,800 | 2,537,420 |
|
| Chubb Corp. (The) | 61,000 | 4,898,910 |
|
| Marsh & McLennan Cos., Inc. | 173,400 | 6,152,232 |
|
| RenaissanceRe Holdings, Ltd. | 9,800 | 839,272 |
|
| Sun Life Financial, Inc. (Canada) | 63,900 | 1,862,046 |
|
| Travelers Cos., Inc. (The) | 116,000 | 9,101,359 |
|
| | | 25,391,239 |
| |
| 20 | George Putnam Balanced Fund |
| | |
| COMMON STOCKS (58.7%)* cont. | Shares | Value |
|
| Investment banking/Brokerage (0.6%) | | |
| Blackstone Group LP (The) | 123,900 | $2,292,150 |
|
| Charles Schwab Corp. (The) | 215,200 | 3,557,256 |
|
| Morgan Stanley | 74,940 | 1,712,379 |
|
| | | 7,561,785 |
| Real estate (0.3%) | | |
| Equity Residential Trust R | 21,448 | $1,188,005 |
|
| Prologis, Inc. R | 32,781 | 1,307,962 |
|
| Simon Property Group, Inc. R | 8,362 | 1,339,425 |
|
| | | 3,835,392 |
| Technology (5.4%) | | |
| Apple, Inc. | 6,500 | 2,959,515 |
|
| Cisco Systems, Inc. | 390,000 | 8,022,300 |
|
| EMC Corp. † | 266,900 | 6,568,409 |
|
| Hewlett-Packard Co. | 82,800 | 1,367,028 |
|
| Honeywell International, Inc. | 163,800 | 11,177,711 |
|
| IBM Corp. | 22,400 | 4,548,768 |
|
| Intel Corp. | 95,400 | 2,007,216 |
|
| KLA-Tencor Corp. | 16,400 | 900,524 |
|
| L-3 Communications Holdings, Inc. | 75,400 | 5,724,368 |
|
| Microsoft Corp. | 205,200 | 5,636,844 |
|
| NetApp, Inc. † | 44,100 | 1,587,600 |
|
| Oracle Corp. | 81,400 | 2,890,514 |
|
| Qualcomm, Inc. | 51,000 | 3,367,530 |
|
| SanDisk Corp. † | 51,700 | 2,584,483 |
|
| Texas Instruments, Inc. | 142,200 | 4,703,976 |
|
| Yahoo!, Inc. † | 52,900 | 1,038,427 |
|
| | | 65,085,213 |
| Transportation (0.4%) | | |
| FedEx Corp. | 25,800 | 2,617,410 |
|
| United Parcel Service, Inc. Class B | 24,500 | 1,942,605 |
|
| | | 4,560,015 |
| Utilities and power (2.7%) | | |
| Ameren Corp. | 82,700 | 2,682,788 |
|
| American Electric Power Co., Inc. | 89,200 | 4,039,868 |
|
| Calpine Corp. † | 96,300 | 1,899,999 |
|
| Dominion Resources, Inc. | 32,400 | 1,753,164 |
|
| Duke Energy Corp. | 38,133 | 2,621,262 |
|
| Edison International | 91,500 | 4,409,385 |
|
| Entergy Corp. | 81,000 | 5,232,599 |
|
| FirstEnergy Corp. | 50,100 | 2,028,549 |
|
| NextEra Energy, Inc. | 39,600 | 2,853,180 |
|
| PG&E Corp. | 111,350 | 4,747,964 |
|
| | | 32,268,758 |
| | | |
| Total common stocks (cost $598,977,845) | | $712,840,755 |
| |
| George Putnam Balanced Fund | 21 |
| | |
| CORPORATE BONDS AND NOTES (14.8%)* | Principal amount | Value |
|
| Basic materials (0.9%) | | |
| Agrium, Inc. sr. unsec. notes 3.15s, 2022 (Canada) | $245,000 | $237,922 |
|
| Allegheny Technologies, Inc. sr. unsec. unsub. notes | | |
| 9 3/8s, 2019 | 275,000 | 358,401 |
|
| ArcelorMittal sr. unsec. bonds 10.35s, 2019 (France) | 400,000 | 503,076 |
|
| CF Industries, Inc. company guaranty sr. unsec. unsub. notes | | |
| 7 1/8s, 2020 | 290,000 | 363,118 |
|
| CF Industries, Inc. company guaranty sr. unsec. unsub. notes | | |
| 6 7/8s, 2018 | 380,000 | 462,976 |
|
| Eastman Chemical Co. sr. unsec. notes 4.8s, 2042 | 470,000 | 483,883 |
|
| Eastman Chemical Co. sr. unsec. notes 3.6s, 2022 | 335,000 | 345,824 |
|
| Eastman Chemical Co. sr. unsec. unsub. notes 6.3s, 2018 | 200,000 | 237,539 |
|
| Eastman Chemical Co. sr. unsec. unsub. notes 2.4s, 2017 | 110,000 | 113,371 |
|
| Georgia-Pacific, LLC sr. unsec. unsub. notes 7 3/4s, 2029 | 850,000 | 1,140,859 |
|
| International Paper Co. sr. unsec. notes 9 3/8s, 2019 | 1,018,000 | 1,379,046 |
|
| International Paper Co. sr. unsec. notes 8.7s, 2038 | 10,000 | 14,594 |
|
| International Paper Co. sr. unsec. notes 7.95s, 2018 | 221,000 | 283,863 |
|
| Methanex Corp. sr. unsec. unsub. notes 3 1/4s, 2019 (Canada) | 357,000 | 357,413 |
|
| Mosaic Co. (The) sr. unsec. notes 3 3/4s, 2021 | 200,000 | 209,056 |
|
| Packaging Corp. of America sr. unsec. unsub. notes 3.9s, 2022 | 285,000 | 291,257 |
|
| PPG Industries, Inc. sr. unsec. unsub. debs. 7.4s, 2019 | 350,000 | 426,119 |
|
| Rio Tinto Finance USA, Ltd. company guaranty sr. unsec. notes | | |
| 5.2s, 2040 (Australia) | 570,000 | 652,209 |
|
| Rock-Tenn Co. 144A sr. unsec. notes 4.9s, 2022 | 167,000 | 177,879 |
|
| Rock-Tenn Co. 144A sr. unsec. notes 4.45s, 2019 | 168,000 | 179,617 |
|
| Rohm & Haas Co. sr. unsec. unsub. notes 7.85s, 2029 | 385,000 | 529,652 |
|
| Sealed Air Corp. sr. notes 7 7/8s, 2017 | 585,000 | 620,100 |
|
| Temple-Inland, Inc. sr. unsec. unsub. notes 6 5/8s, 2018 | 195,000 | 234,079 |
|
| Union Carbide Corp. sr. unsec. unsub. bonds 7 3/4s, 2096 | 180,000 | 207,639 |
|
| Westvaco Corp. company guaranty sr. unsec. unsub. notes | | |
| 7.95s, 2031 | 550,000 | 694,492 |
|
| Xstrata Finance Canada, Ltd. 144A company guaranty sr. unsec. | | |
| unsub. bonds 5.8s, 2016 (Canada) | 735,000 | 835,050 |
|
| | | 11,339,034 |
| Capital goods (0.4%) | | |
| Legrand SA unsec. unsub. debs. 8 1/2s, 2025 (France) | 767,000 | 1,000,513 |
|
| Parker Hannifin Corp. sr. unsec. unsub. notes Ser. MTN, | | |
| 6 1/4s, 2038 | 975,000 | 1,285,496 |
|
| Republic Services, Inc. company guaranty sr. unsec. unsub. | | |
| notes 5 1/2s, 2019 | 240,000 | 284,227 |
|
| Staples, Inc. sr. unsec. unsub. notes 2 3/4s, 2018 | 1,075,000 | 1,078,415 |
|
| United Technologies Corp. sr. unsec. notes 5.7s, 2040 | 100,000 | 125,236 |
|
| United Technologies Corp. sr. unsec. unsub. notes 4 1/2s, 2042 | 225,000 | 241,708 |
|
| United Technologies Corp. sr. unsec. unsub. notes 3.1s, 2022 | 135,000 | 139,590 |
|
| | | 4,155,185 |
| Communication services (1.4%) | | |
| America Movil SAB de CV company guaranty sr. unsec. unsub. | | |
| notes 6 1/8s, 2040 (Mexico) | 200,000 | 248,302 |
|
| America Movil SAB de CV company guaranty unsec. unsub. | | |
| notes 2 3/8s, 2016 (Mexico) | 280,000 | 289,215 |
|
| American Tower Corp. sr. unsec. unsub. notes 3 1/2s, 2023 | 750,000 | 733,552 |
|
| |
| 22 | George Putnam Balanced Fund |
| | |
| CORPORATE BONDS AND NOTES (14.8%)* cont. | Principal amount | Value |
|
| Communication services cont. | | |
| American Tower REIT, Inc. sr. unsec. unsub. notes 4 5/8s, 2015 R | $555,000 | $595,691 |
|
| AT&T, Inc. sr. unsec. unsub. bonds 5 1/2s, 2018 | 705,000 | 828,487 |
|
| AT&T, Inc. sr. unsec. unsub. notes 6.3s, 2038 | 1,194,000 | 1,457,970 |
|
| AT&T, Inc. 144A sr. unsec. unsub. notes 4.35s, 2045 | 1,490,000 | 1,407,430 |
|
| CC Holdings GS V, LLC 144A company guaranty sr. notes | | |
| 3.849s, 2023 | 240,000 | 239,281 |
|
| CenturyLink, Inc. sr. unsec. debs. Ser. G, 6 7/8s, 2028 | 715,000 | 741,394 |
|
| CenturyLink, Inc. sr. unsec. unsub. notes Ser. P, 7.6s, 2039 | 305,000 | 311,513 |
|
| Comcast Corp. company guaranty sr. unsec. unsub. notes | | |
| 6.95s, 2037 | 225,000 | 292,965 |
|
| Corning, Inc. sr. unsec. unsub. notes 5 3/4s, 2040 | 165,000 | 190,642 |
|
| Crown Castle Towers, LLC 144A company guaranty sr. notes | | |
| 4.883s, 2020 | 710,000 | 805,883 |
|
| France Telecom sr. unsec. unsub. notes 5 3/8s, 2019 (France) | 255,000 | 297,569 |
|
| France Telecom sr. unsec. unsub. notes 4 1/8s, 2021 (France) | 283,000 | 305,539 |
|
| Koninklijke (Royal) KPN NV sr. unsec. unsub. bonds 8 3/8s, | | |
| 2030 (Netherlands) | 70,000 | 91,465 |
|
| NBCUniversal Media, LLC sr. unsec. unsub. notes 6.4s, 2040 | 380,000 | 468,881 |
|
| NBCUniversal Media, LLC sr. unsec. unsub. notes 5.15s, 2020 | 295,000 | 343,576 |
|
| Qwest Corp. sr. unsec. notes 6 3/4s, 2021 | 353,000 | 409,584 |
|
| Rogers Communications, Inc. company guaranty sr. unsec. | | |
| bonds 8 3/4s, 2032 (Canada) | 95,000 | 141,550 |
|
| SBA Tower Trust 144A company guaranty sr. notes 5.101s, 2017 | 1,125,000 | 1,249,182 |
|
| TCI Communications, Inc. company guaranty sr. unsec. unsub. | | |
| debs. 7 7/8s, 2026 | 610,000 | 832,049 |
|
| Telecom Italia Capital SA company guaranty sr. unsec. unsub. | | |
| notes 6.175s, 2014 (Italy) | 300,000 | 317,878 |
|
| Telefonica Emisiones SAU company guaranty sr. unsec. unsub. | | |
| notes 6.221s, 2017 (Spain) | 845,000 | 945,082 |
|
| Time Warner Cable, Inc. company guaranty sr. notes 7.3s, 2038 | 640,000 | 812,872 |
|
| Time Warner Cable, Inc. company guaranty sr. unsec. unsub. | | |
| notes 6 3/4s, 2039 | 355,000 | 430,872 |
|
| Verizon Communications, Inc. sr. unsec. unsub. notes | | |
| 8 3/4s, 2018 | 71,000 | 96,948 |
|
| Verizon New Jersey, Inc. debs. 8s, 2022 | 770,000 | 1,022,884 |
|
| Verizon Pennsylvania, Inc. debs. 8.35s, 2030 | 980,000 | 1,306,659 |
|
| | | 17,214,915 |
| Consumer cyclicals (1.0%) | | |
| ADT Corp. (The) 144A company guaranty sr. unsec. notes | | |
| 4 7/8s, 2042 | 279,000 | 258,914 |
|
| ADT Corp. (The) 144A company guaranty sr. unsec. notes | | |
| 3 1/2s, 2022 | 391,000 | 379,190 |
|
| Advance Auto Parts, Inc. company guaranty sr. unsec. notes | | |
| 5 3/4s, 2020 | 341,000 | 374,008 |
|
| CBS Corp. company guaranty sr. unsec. debs. notes | | |
| 7 7/8s, 2030 | 730,000 | 984,774 |
|
| Choice Hotels International, Inc. company guaranty sr. unsec. | | |
| unsub. notes 5.7s, 2020 | 430,000 | 470,313 |
|
| DIRECTV Holdings, LLC/DIRECTV Financing Co., Inc. company | | |
| guaranty sr. unsec. notes 6.35s, 2040 | 370,000 | 413,232 |
|
| |
| George Putnam Balanced Fund | 23 |
| | |
| CORPORATE BONDS AND NOTES (14.8%)* cont. | Principal amount | Value |
|
| Consumer cyclicals cont. | | |
| DIRECTV Holdings, LLC/DIRECTV Financing Co., Inc. company | | |
| guaranty sr. unsec. unsub. notes 5 7/8s, 2019 | $820,000 | $971,452 |
|
| Expedia, Inc. company guaranty sr. unsec. unsub. notes | | |
| 5.95s, 2020 | 495,000 | 545,539 |
|
| Ford Motor Co. sr. unsec. unsub. notes 7.4s, 2046 | 200,000 | 255,000 |
|
| Ford Motor Credit Co., LLC sr. unsec. notes 4.207s, 2016 | 1,245,000 | 1,325,050 |
|
| Grupo Televisa, S.A.B sr. unsec. bonds 6 5/8s, 2040 (Mexico) | 300,000 | 378,850 |
|
| Grupo Televisa, S.A.B sr. unsec. notes 6s, 2018 (Mexico) | 290,000 | 341,420 |
|
| Macy’s Retail Holdings, Inc. company guaranty sr. unsec. notes | | |
| 5 1/8s, 2042 | 70,000 | 72,488 |
|
| Macy’s Retail Holdings, Inc. company guaranty sr. unsec. notes | | |
| 3 7/8s, 2022 | 110,000 | 114,387 |
|
| Marriott International, Inc. sr. unsec. unsub notes 3s, 2019 | 310,000 | 323,830 |
|
| News America Holdings, Inc. company guaranty sr. unsec. debs. | | |
| 7 3/4s, 2024 | 1,045,000 | 1,335,718 |
|
| NVR, Inc. sr. unsec. unsub. notes 3.95s, 2022 | 435,000 | 445,310 |
|
| Owens Corning company guaranty sr. unsec. notes 9s, 2019 | 55,000 | 68,888 |
|
| Time Warner Entertainment Co., LP company guaranty sr. | | |
| unsec. bonds 8 3/8s, 2033 | 155,000 | 218,628 |
|
| Time Warner Entertainment Co., LP debs. 8 3/8s, 2023 | 170,000 | 237,662 |
|
| Time Warner, Inc. company guaranty sr. unsec. bonds 7.7s, 2032 | 520,000 | 714,926 |
|
| Time Warner, Inc. company guaranty sr. unsec. notes 4.7s, 2021 | 120,000 | 134,910 |
|
| Time Warner, Inc. debs. 9.15s, 2023 | 340,000 | 491,613 |
|
| Toyota Motor Credit Corp. sr. unsec. unsub. notes 3.3s, 2022 | 630,000 | 664,188 |
|
| | | 11,520,290 |
| Consumer staples (1.1%) | | |
| Altria Group, Inc. company guaranty sr. unsec. notes 9.7s, 2018 | 127,000 | 175,280 |
|
| Altria Group, Inc. company guaranty sr. unsec. notes | | |
| 9 1/4s, 2019 | 201,000 | 277,559 |
|
| Altria Group, Inc. company guaranty sr. unsec. unsub. notes | | |
| 2.85s, 2022 | 1,055,000 | 1,021,135 |
|
| Anheuser-Busch InBev Worldwide, Inc. company guaranty sr. | | |
| unsec. unsub. notes 8.2s, 2039 | 165,000 | 261,636 |
|
| Bacardi, Ltd. 144A unsec. notes 4 1/2s, 2021 (Bermuda) | 495,000 | 540,363 |
|
| Campbell Soup Co. debs. 8 7/8s, 2021 | 855,000 | 1,219,583 |
|
| Corrections Corporation of America company guaranty sr. notes | | |
| 7 3/4s, 2017 | 279,000 | 294,694 |
|
| Costco Wholesale Corp. sr. unsec. unsub. notes 1.7s, 2019 | 315,000 | 313,565 |
|
| CVS Pass-Through Trust 144A company guaranty sr. notes | | |
| 7.507s, 2032 | 719,227 | 935,172 |
|
| Darden Restaurants, Inc. sr. unsec. unsub. notes 6.8s, 2037 | 810,000 | 943,443 |
|
| Delhaize Group company guaranty sr. unsec. notes 5.7s, | | |
| 2040 (Belgium) | 665,000 | 641,299 |
|
| Delhaize Group company guaranty sr. unsec. notes 4 1/8s, | | |
| 2019 (Belgium) | 260,000 | 270,388 |
|
| Diageo Investment Corp. company guaranty sr. unsec. | | |
| debs. 8s, 2022 | 820,000 | 1,159,674 |
|
| General Mills, Inc. sr. unsec. notes 5.65s, 2019 | 130,000 | 156,895 |
|
| Kraft Foods Group, Inc. sr. unsec. unsub. notes 6 1/2s, 2040 | 309,000 | 393,380 |
|
| Kraft Foods Group, Inc. sr. unsec. unsub. notes 5s, 2042 | 1,185,000 | 1,286,192 |
|
| Kroger Co. company guaranty sr. unsec. unsub. notes 6.4s, 2017 | 500,000 | 596,883 |
|
| |
| 24 | George Putnam Balanced Fund |
| | |
| CORPORATE BONDS AND NOTES (14.8%)* cont. | Principal amount | Value |
|
| Consumer staples cont. | | |
| McDonald’s Corp. sr. unsec. notes Ser. MTN, 6.3s, 2038 | $535,000 | $722,001 |
|
| McDonald’s Corp. sr. unsec. notes 5.7s, 2039 | 600,000 | 756,637 |
|
| Molson Coors Brewing Co. company guaranty sr. unsec. unsub. | | |
| notes 5s, 2042 | 180,000 | 192,284 |
|
| SABMiller Holdings, Inc. 144A company guaranty sr. unsec. | | |
| notes 4.95s, 2042 | 200,000 | 220,908 |
|
| Tyson Foods, Inc. company guaranty sr. unsec. unsub. | | |
| notes 6.6s, 2016 | 460,000 | 528,581 |
|
| WPP Finance UK company guaranty sr. unsec. notes 8s, 2014 | | |
| (United Kingdom) | 690,000 | 759,665 |
|
| | | 13,667,217 |
| Energy (1.2%) | | |
| Anadarko Finance Co. company guaranty sr. unsec. unsub. | | |
| notes Ser. B, 7 1/2s, 2031 | 985,000 | 1,282,346 |
|
| BG Energy Capital PLC 144A company guaranty sr. unsec. notes | | |
| 4s, 2021 (United Kingdom) | 250,000 | 270,292 |
|
| BP Capital Markets PLC company guaranty sr. unsec. unsub. | | |
| notes 4.742s, 2021 (United Kingdom) | 655,000 | 756,089 |
|
| BP Capital Markets PLC company guaranty sr. unsec. unsub. | | |
| notes 4 1/2s, 2020 (United Kingdom) | 175,000 | 199,179 |
|
| Cenovus Energy, Inc. sr. unsec. unsub. notes 4.45s, | | |
| 2042 (Canada) | 475,000 | 474,672 |
|
| DCP Midstream, LLC 144A sr. unsec. notes 5.35s, 2020 | 375,000 | 407,621 |
|
| Ente Nazionale Idrocarburi (ENI) SpA 144A sr. unsec. notes | | |
| 4.15s, 2020 (Italy) | 825,000 | 844,041 |
|
| EOG Resources, Inc. sr. unsec. notes 5 5/8s, 2019 | 205,000 | 250,119 |
|
| Hess Corp. sr. unsec. unsub. notes 7.3s, 2031 | 325,000 | 402,646 |
|
| Kerr-McGee Corp. company guaranty sr. unsec. unsub. notes | | |
| 7 7/8s, 2031 | 340,000 | 444,493 |
|
| Marathon Petroleum Corp. sr. unsec. unsub. notes 6 1/2s, 2041 | 175,000 | 213,616 |
|
| Motiva Enterprises, LLC 144A sr. unsec. notes 6.85s, 2040 | 220,000 | 294,163 |
|
| Noble Holding International, Ltd. company guaranty sr. unsec. | | |
| notes 6.05s, 2041 | 390,000 | 447,273 |
|
| Petrobras International Finance Co. company guaranty sr. unsec. | | |
| notes 6 3/4s, 2041 (Brazil) | 300,000 | 350,645 |
|
| Petrobras International Finance Co. company guaranty sr. unsec. | | |
| notes 5 3/8s, 2021 (Brazil) | 825,000 | 903,885 |
|
| Petrobras International Finance Co. company guaranty sr. unsec. | | |
| notes 3 7/8s, 2016 (Brazil) | 355,000 | 371,796 |
|
| Petrohawk Energy Corp. company guaranty sr. unsec. notes | | |
| 7 1/4s, 2018 | 910,000 | 1,024,982 |
|
| Pride International, Inc. sr. unsec. notes 7 7/8s, 2040 | 760,000 | 1,082,694 |
|
| Ras Laffan Liquefied Natural Gas Co., Ltd. 144A company | | |
| guaranty sr. notes 5 1/2s, 2014 (Qatar) | 675,000 | 718,875 |
|
| Spectra Energy Capital, LLC company guaranty sr. unsec. unsub. | | |
| notes 6.2s, 2018 | 1,080,000 | 1,311,500 |
|
| Spectra Energy Capital, LLC sr. notes 8s, 2019 | 820,000 | 1,081,873 |
|
| Spectra Energy Partners LP sr. unsec. notes 4.6s, 2021 | 245,000 | 259,008 |
|
| Statoil ASA company guaranty sr. unsec. notes 5.1s, | | |
| 2040 (Norway) | 480,000 | 560,174 |
|
| |
| George Putnam Balanced Fund | 25 |
| | |
| CORPORATE BONDS AND NOTES (14.8%)* cont. | Principal amount | Value |
|
| Energy (1.2%) | | |
| Weatherford Bermuda company guaranty sr. unsec. notes | | |
| 9 5/8s, 2019 | $93,000 | $121,231 |
|
| Weatherford International, Inc. company guaranty sr. unsec. | | |
| unsub. notes 6.8s, 2037 | 245,000 | 267,112 |
|
| Weatherford International, Inc. company guaranty sr. unsec. | | |
| unsub. notes 6.35s, 2017 | 280,000 | 322,616 |
|
| | | 14,662,941 |
| Financials (6.5%) | | |
| ABN Amro Bank NV 144A sr. unsec. notes 4 1/4s, | | |
| 2017 (Netherlands) | 1,515,000 | 1,642,821 |
|
| Aflac, Inc. sr. unsec. notes 6.9s, 2039 | 500,000 | 647,198 |
|
| Aflac, Inc. sr. unsec. notes 6.45s, 2040 | 345,000 | 427,524 |
|
| American Express Co. sr. unsec. notes 7s, 2018 | 545,000 | 677,266 |
|
| American International Group, Inc. jr. sub. FRB bonds | | |
| 8.175s, 2058 | 781,000 | 1,015,300 |
|
| Aon PLC 144A company guaranty sr. unsec. bonds 4 1/4s, 2042 | 1,150,000 | 1,100,453 |
|
| Assurant, Inc. sr. unsec. notes 6 3/4s, 2034 | 525,000 | 570,763 |
|
| AXA SA 144A jr. unsec. sub. FRN notes 6.463s, perpetual | | |
| maturity (France) | 550,000 | 544,500 |
|
| Banco del Estado de Chile 144A sr. unsec. notes 2s, 2017 (Chile) | 400,000 | 398,984 |
|
| Bank Nederlandse Gemeenten 144A bonds 1 3/4s, | | |
| 2015 (Netherlands) | 12,100,000 | 12,421,975 |
|
| Bank of America Corp. sr. unsec. unsub. notes 6 1/2s, 2016 | 1,405,000 | 1,624,544 |
|
| Bank of America NA sub. notes Ser. BKNT, 5.3s, 2017 | 315,000 | 351,703 |
|
| Barclays Bank PLC unsec. sub. notes 7 5/8s, 2022 | | |
| (United Kingdom) | 500,000 | 493,831 |
|
| Barclays Bank PLC 144A sub. notes 10.179s, 2021 | | |
| (United Kingdom) | 804,000 | 1,088,954 |
|
| Barclays Bank PLC 144A unsec. sub. notes 6.05s, 2017 | | |
| (United Kingdom) | 1,415,000 | 1,579,866 |
|
| Bear Stearns Cos., Inc. (The) sr. notes 6.4s, 2017 | 500,000 | 599,328 |
|
| Bear Stearns Cos., Inc. (The) sr. unsec. notes 7 1/4s, 2018 | 331,000 | 411,126 |
|
| BNP Paribas SA 144A jr. unsec. sub. FRN notes 7.195s, | | |
| perpetual maturity (France) | 100,000 | 104,050 |
|
| BNP Paribas SA 144A jr. unsec. sub. FRN notes 5.186s, | | |
| perpetual maturity (France) | 850,000 | 811,750 |
|
| Camden Property Trust sr. unsec. notes 4 7/8s, 2023 R | 1,040,000 | 1,157,608 |
|
| Capital One Bank USA NA sub. notes 8.8s, 2019 | 385,000 | 526,313 |
|
| Citigroup, Inc. sr. unsec. notes 6 1/8s, 2018 | 14,000 | 16,676 |
|
| Citigroup, Inc. sr. unsec. sub. FRN notes 0.581s, 2016 | 123,000 | 117,504 |
|
| Citigroup, Inc. sub. notes 5s, 2014 | 914,000 | 962,617 |
|
| CNA Financial Corp. sr. unsec. unsub. notes 5 3/4s, 2021 | 210,000 | 243,651 |
|
| CNA Financial Corp. unsec. notes 6 1/2s, 2016 | 435,000 | 501,693 |
|
| Commonwealth Bank of Australia 144A sr. unsec. notes 3 3/4s, | | |
| 2014 (Australia) | 1,220,000 | 1,282,641 |
|
| Credit Suisse Guernsey sr. unsec. notes 5.3s, 2019 | 475,000 | 558,582 |
|
| DDR Corp. sr. unsec. unsub. notes 7 7/8s, 2020 R | 605,000 | 768,853 |
|
| Duke Realty LP sr. unsec. notes 6 1/2s, 2018 R | 361,000 | 426,620 |
|
| Duke Realty LP sr. unsec. notes 6 1/4s, 2013 R | 19,000 | 19,294 |
|
| Erac USA Finance, Co. 144A sr. notes 4 1/2s, 2021 | 785,000 | 855,448 |
|
| |
| 26 | George Putnam Balanced Fund |
| | |
| CORPORATE BONDS AND NOTES (14.8%)* cont. | Principal amount | Value |
|
| Financials cont. | | |
| GATX Financial Corp. notes 5.8s, 2016 | $560,000 | $616,710 |
|
| GE Capital Trust I unsec. sub. FRB bonds 6 3/8s, 2067 | 355,000 | 374,774 |
|
| General Electric Capital Corp. sr. unsec. 5 5/8s, 2018 | 260,000 | 305,912 |
|
| General Electric Capital Corp. sr. unsec. FRN notes Ser. MTN, | | |
| 0.51s, 2016 | 455,000 | 449,811 |
|
| General Electric Capital Corp. sr. unsec. notes 6 3/4s, 2032 | 40,000 | 50,534 |
|
| General Electric Capital Corp. sr. unsec. notes 6.15s, 2037 | 1,200,000 | 1,450,828 |
|
| Genworth Financial, Inc. sr. unsec. unsub. notes 7 5/8s, 2021 | 725,000 | 869,203 |
|
| Goldman Sachs Group, Inc. (The) sr. notes 7 1/2s, 2019 | 805,000 | 1,009,409 |
|
| Goldman Sachs Group, Inc. (The) sub. notes 6 3/4s, 2037 | 282,000 | 317,527 |
|
| Hartford Financial Services Group, Inc. (The) sr. unsec. unsub. | | |
| notes 6 5/8s, 2040 | 1,540,000 | 1,897,754 |
|
| HBOS PLC 144A sr. unsec. sub. notes 6 3/4s, 2018 | | |
| (United Kingdom) | 360,000 | 394,650 |
|
| HBOS PLC 144A unsec. sub. bonds 6s, 2033 (United Kingdom) | 890,000 | 841,050 |
|
| Health Care REIT, Inc. sr. unsec. unsub. notes 3 3/4s, 2023 R | 410,000 | 409,413 |
|
| Highwood Realty LP sr. unsec. bonds 5.85s, 2017 R | 1,005,000 | 1,130,205 |
|
| HSBC Bank USA, N.A. unsec. sub. notes 7s, 2039 | 342,000 | 454,563 |
|
| HSBC Finance Capital Trust IX FRN notes 5.911s, 2035 | 2,000,000 | 2,030,000 |
|
| HSBC USA Capital Trust I 144A jr. bank guaranty unsec. notes | | |
| 7.808s, 2026 | 450,000 | 457,313 |
|
| ING Bank NV 144A unsec. notes 3 3/4s, 2017 (Netherlands) | 785,000 | 838,732 |
|
| International Lease Finance Corp. sr. unsec. notes 6 1/4s, 2019 | 275,000 | 302,500 |
|
| JPMorgan Chase & Co. jr. unsec. sub. FRN notes 7.9s, | | |
| perpetual maturity | 780,000 | 897,312 |
|
| JPMorgan Chase Bank NA sub. notes Ser. BKNT, 6s, 2017 | 1,000,000 | 1,178,305 |
|
| JPMorgan Chase Capital XXIII company guaranty jr. unsec. sub. | | |
| FRN notes 1.31s, 2047 | 2,443,000 | 1,881,110 |
|
| Liberty Mutual Insurance Co. 144A notes 7.697s, 2097 | 340,000 | 370,328 |
|
| Lloyds TSB Bank PLC company guaranty sr. unsec. sub. notes | | |
| Ser. MTN, 6 1/2s, 2020 (United Kingdom) | 1,080,000 | 1,199,072 |
|
| Macquarie Bank Ltd. 144A unsec. sub. notes 6 5/8s, | | |
| 2021 (Australia) | 1,020,000 | 1,131,496 |
|
| Massachusetts Mutual Life Insurance Co. 144A notes | | |
| 8 7/8s, 2039 | 815,000 | 1,255,623 |
|
| Merrill Lynch & Co., Inc. jr. sub. bonds 7 3/4s, 2038 | 1,565,000 | 2,094,325 |
|
| MetLife Capital Trust IV 144A jr. sub. debs. 7 7/8s, 2037 | 1,300,000 | 1,612,000 |
|
| MetLife, Inc. jr. unsec. sub. notes 6.4s, 2036 | 590,000 | 638,728 |
|
| Metropolitan Life Global Funding I 144A notes 3.65s, 2018 | 100,000 | 109,351 |
|
| Nationwide Financial Services, Inc. notes 5 5/8s, 2015 | 465,000 | 500,067 |
|
| Nationwide Mutual Insurance Co. 144A notes 8 1/4s, 2031 | 415,000 | 526,908 |
|
| Nordea Bank AB 144A sub. notes 4 7/8s, 2021 (Sweden) | 1,300,000 | 1,388,660 |
|
| OneAmerica Financial Partners, Inc. 144A bonds 7s, 2033 | 370,000 | 373,423 |
|
| Pacific LifeCorp 144A sr. notes 6s, 2020 | 365,000 | 415,599 |
|
| Primerica, Inc. sr. unsec. unsub. notes 4 3/4s, 2022 | 213,000 | 234,883 |
|
| Progressive Corp. (The) jr. unsec. sub. FRN notes 6.7s, 2037 | 2,020,000 | 2,191,700 |
|
| Prudential Financial, Inc. jr. unsec. sub. FRN notes 5 5/8s, 2043 | 680,000 | 698,700 |
|
| Prudential Holdings, LLC sr. FRN notes Ser. AGM, 1.183s, 2017 | 210,000 | 202,141 |
|
| Rabobank Nederland 144A jr. unsec. sub. FRN notes 11s, | | |
| perpetual maturity (Netherlands) | 465,000 | 623,100 |
|
| |
| George Putnam Balanced Fund | 27 |
| | |
| CORPORATE BONDS AND NOTES (14.8%)* cont. | Principal amount | Value |
|
| Financials cont. | | |
| Rayonier, Inc. company guaranty sr. unsec. unsub. notes | | |
| 3 3/4s, 2022 R | $270,000 | $271,136 |
|
| Royal Bank of Scotland PLC (The) sr. sub. FRN notes 9 1/2s, | | |
| 2022 (United Kingdom) | 560,000 | 660,688 |
|
| Royal Bank of Scotland PLC (The) sr. unsec. unsub. notes 6.4s, | | |
| 2019 (United Kingdom) | 355,000 | 423,288 |
|
| Santander Issuances S.A. Unipersonal 144A bank guaranty | | |
| unsec. sub. notes 5.911s, 2016 (Spain) | 900,000 | 925,486 |
|
| Standard Chartered PLC 144A jr. sub. FRB bonds 7.014s, | | |
| perpetual maturity (United Kingdom) | 600,000 | 643,471 |
|
| Standard Chartered PLC 144A unsec. sub. notes 3.95s, 2023 | | |
| (United Kingdom) | 300,000 | 295,509 |
|
| State Street Capital Trust IV company guaranty jr. unsec. sub. | | |
| FRB bonds 1.308s, 2037 | 1,790,000 | 1,440,595 |
|
| Tanger Properties, LP sr. unsec. notes 6 1/8s, 2020 R | 265,000 | 317,812 |
|
| TD Ameritrade Holding Corp. company guaranty sr. unsec. | | |
| unsub. notes 5.6s, 2019 | 480,000 | 574,043 |
|
| Teachers Insurance & Annuity Association of America 144A | | |
| notes 6.85s, 2039 | 263,000 | 351,514 |
|
| Vornado Realty LP sr. unsec. unsub. notes 4 1/4s, 2015 R | 555,000 | 586,926 |
|
| Wachovia Bank NA sub. notes Ser. BKNT, 6s, 2017 | 1,060,000 | 1,269,249 |
|
| WEA Finance, LLC/WT Finance Aust. Pty. Ltd. 144A company | | |
| guaranty sr. unsec. notes 6 3/4s, 2019 | 570,000 | 703,104 |
|
| Wells Fargo Bank NA unsec. sub. FRN notes 0.52s, 2016 | 710,000 | 697,688 |
|
| Westpac Capital Trust III 144A unsec. sub. FRN notes 5.819s, | | |
| perpetual maturity | 1,010,000 | 1,013,767 |
|
| Willis Group Holdings Ltd. company guaranty sr. unsec. unsub. | | |
| notes 5 3/4s, 2021 | 710,000 | 791,925 |
|
| ZFS Finance USA Trust V 144A FRB bonds 6 1/2s, 2037 | 214,000 | 226,840 |
|
| | | 78,866,196 |
| Health care (0.2%) | | |
| Aetna, Inc. sr. unsec. unsub. notes 6 3/4s, 2037 | 95,000 | 126,712 |
|
| CIGNA Corp. sr. unsec. unsub. notes 5 3/8s, 2042 | 205,000 | 228,905 |
|
| Coventry Health Care, Inc. sr. unsec. notes 5.45s, 2021 | 450,000 | 525,724 |
|
| Quest Diagnostics, Inc. company guaranty sr. unsec. notes | | |
| 6.95s, 2037 | 335,000 | 421,275 |
|
| Quest Diagnostics, Inc. company guaranty sr. unsec. notes | | |
| 4 3/4s, 2020 | 121,000 | 131,828 |
|
| UnitedHealth Group, Inc. sr. unsec. unsub. notes 4 5/8s, 2041 | 300,000 | 312,248 |
|
| Watson Pharmaceuticals, Inc. sr. unsec. notes 4 5/8s, 2042 | 195,000 | 195,338 |
|
| Watson Pharmaceuticals, Inc. sr. unsec. notes 3 1/4s, 2022 | 155,000 | 154,424 |
|
| Watson Pharmaceuticals, Inc. sr. unsec. notes 1 7/8s, 2017 | 40,000 | 40,132 |
|
| WellPoint, Inc. notes 7s, 2019 | 155,000 | 193,698 |
|
| Zoetis Inc. 144A sr. unsec. notes 3 1/4s, 2023 | 114,000 | 113,952 |
|
| Zoetis Inc. 144A sr. unsec. notes 1 7/8s, 2018 | 114,000 | 114,131 |
|
| | | 2,558,367 |
| Technology (—%) | | |
| Xerox Corp. sr. unsec. notes 4 1/2s, 2021 | 395,000 | 410,899 |
|
| | | 410,899 |
| |
| 28 | George Putnam Balanced Fund |
| | |
| CORPORATE BONDS AND NOTES (14.8%)* cont. | Principal amount | Value |
|
| Transportation (0.3%) | | |
| Burlington Northern Santa Fe, LLC sr. unsec. notes 5.4s, 2041 | $605,000 | $695,498 |
|
| Burlington Northern Santa Fe, LLC sr. unsec. unsub. notes | | |
| 5 3/4s, 2040 | 145,000 | 173,697 |
|
| Continental Airlines, Inc. pass-through certificates | | |
| Ser. 97-4A, 6.9s, 2018 | 140,271 | 152,895 |
|
| Continental Airlines, Inc. pass-through certificates Ser. 98-1A, | | |
| 6.648s, 2017 | 334,402 | 358,646 |
|
| CSX Corp. sr. unsec. unsub. notes 4 3/4s, 2042 | 205,000 | 211,122 |
|
| Norfolk Southern Corp. sr. unsec. notes 6s, 2111 | 390,000 | 467,912 |
|
| Ryder System, Inc. sr. unsec. unsub. notes 2 1/2s, 2018 | 185,000 | 188,714 |
|
| Southwest Airlines Co. pass-through certificates Ser. 07-1, | | |
| 6.15s, 2022 | 694,398 | 815,918 |
|
| Union Pacific Corp. 144A pass-through certificates 5.214s, 2014 | 590,000 | 625,339 |
|
| | | 3,689,741 |
| Utilities and power (1.8%) | | |
| AEP Texas North Co. sr. notes Ser. B, 5 1/2s, 2013 | 500,000 | 501,831 |
|
| Appalachian Power Co. sr. notes Ser. L, 5.8s, 2035 | 510,000 | 582,700 |
|
| Arizona Public Services Co. sr. unsec. notes 4 1/2s, 2042 | 120,000 | 125,108 |
|
| Atmos Energy Corp. sr. unsub. notes 6.35s, 2017 | 1,230,000 | 1,474,445 |
|
| Beaver Valley Funding Corp. sr. bonds 9s, 2017 | 314,000 | 318,566 |
|
| Boardwalk Pipelines LP company guaranty sr. unsec. notes | | |
| 5 7/8s, 2016 | 975,000 | 1,100,294 |
|
| Bruce Mansfield Unit pass-through certificates 6.85s, 2034 | 1,247,822 | 1,369,485 |
|
| Commonwealth Edison Co. 1st mtge. bonds 5 7/8s, 2033 | 500,000 | 623,112 |
|
| Consolidated Edison Co. of New York sr. unsec. unsub. | | |
| notes 4.2s, 2042 | 220,000 | 225,833 |
|
| Dominion Resources, Inc. sr. unsec. unsub. notes | | |
| Ser. 07-A, 6s, 2017 | 10,000 | 11,991 |
|
| Duke Energy Carolinas, LLC sr. mtge. notes 4 1/4s, 2041 | 450,000 | 462,587 |
|
| EDP Finance BV 144A sr. unsec. unsub. notes 6s, | | |
| 2018 (Netherlands) | 685,000 | 724,388 |
|
| El Paso Natural Gas Co. sr. unsec. unsub. bonds 8 3/8s, 2032 | 490,000 | 688,662 |
|
| El Paso Pipeline Partners Operating Co., LP company guaranty | | |
| sr. unsec. notes 6 1/2s, 2020 | 235,000 | 280,825 |
|
| Electricite de France SA 144A unsec. sub. FRN notes 5 1/4s, | | |
| perpetual maturity (France) | 252,000 | 247,905 |
|
| Electricite de France SA (EDF) 144A notes 6.95s, 2039 (France) | 655,000 | 851,784 |
|
| Electricite de France SA (EDF) 144A sr. notes 5.6s, | | |
| 2040 (France) | 640,000 | 726,056 |
|
| Enel Finance International SA 144A company guaranty sr. unsec. | | |
| notes 5 1/8s, 2019 (Netherlands) | 360,000 | 386,823 |
|
| Energy Transfer Partners LP sr. unsec. unsub. notes 6 1/2s, 2042 | 690,000 | 797,878 |
|
| Energy Transfer Partners LP sr. unsec. unsub. notes 5.2s, 2022 | 240,000 | 267,608 |
|
| Enterprise Products Operating, LLC company guaranty sr. | | |
| unsec. unsub. notes 4.85s, 2042 | 370,000 | 373,224 |
|
| Iberdrola International BV company guaranty sr. unsec. unsub. | | |
| notes 6 3/4s, 2036 (Spain) | 185,000 | 200,761 |
|
| ITC Holdings Corp. 144A notes 5 7/8s, 2016 | 270,000 | 306,119 |
|
| ITC Holdings Corp. 144A sr. unsec. notes 6.05s, 2018 | 365,000 | 426,096 |
|
| Kansas Gas and Electric Co. bonds 5.647s, 2021 | 282,829 | 317,155 |
|
| |
| George Putnam Balanced Fund | 29 |
| | |
| CORPORATE BONDS AND NOTES (14.8%)* cont. | Principal amount | Value |
|
| Utilities and power cont. | | |
| Narragansett Electric Co./The 144A sr. unsec. notes 4.17s, 2042 | $395,000 | $385,484 |
|
| Nevada Power Co. mtge. notes 7 1/8s, 2019 | 295,000 | 375,500 |
|
| Pacific Gas & Electric Co. sr. unsec. notes 6.35s, 2038 | 350,000 | 450,779 |
|
| Pacific Gas & Electric Co. sr. unsub. 5.8s, 2037 | 140,000 | 171,201 |
|
| Potomac Edison Co. 144A sr. bonds 5.8s, 2016 | 331,000 | 372,120 |
|
| PPL Capital Funding, Inc. company guaranty sr. unsec. unsub. | | |
| notes 4.2s, 2022 | 145,000 | 153,335 |
|
| PPL WEM Holdings PLC 144A sr. unsec. notes 5 3/8s, 2021 | | |
| (United Kingdom) | 1,285,000 | 1,438,029 |
|
| Puget Sound Energy, Inc. jr. sub. FRN notes Ser. A, 6.974s, 2067 | 656,000 | 692,900 |
|
| Teco Finance, Inc. company guaranty sr. unsec. unsub. notes | | |
| 6.572s, 2017 | 110,000 | 132,560 |
|
| Texas-New Mexico Power Co. 144A 1st mtge. bonds 9 1/2s, 2019 | 889,000 | 1,204,912 |
|
| Trans-Canada Pipelines, Ltd. jr. unsec. sub. FRN notes 6.35s, | | |
| 2067 (Canada) | 975,000 | 1,039,303 |
|
| Westar Energy, Inc. sr. mtge. notes 4 1/8s, 2042 | $210,000 | $213,973 |
|
| Wisconsin Energy Corp. jr. unsec. sub. FRN notes 6 1/4s, 2067 | 1,945,000 | 2,115,188 |
|
| | | 22,136,520 |
| | | |
| Total corporate bonds and notes (cost $161,101,463) | | $180,221,305 |
| | |
| U.S. GOVERNMENT AND AGENCY | | |
| MORTGAGE OBLIGATIONS (10.2%)* | Principal amount | Value |
|
| U.S. Government Guaranteed Mortgage Obligations (2.0%) | | |
| Government National Mortgage Association Pass-Through Certificates | | |
| 3s, TBA, February 1, 2043 | $17,000,000 | $17,734,452 |
| 3s, TBA, February 1, 2043 | 7,000,000 | 7,305,157 |
|
| | | 25,039,609 |
| U.S. Government Agency Mortgage Obligations (8.2%) | | |
| Federal Home Loan Mortgage Corporation Pass-Through Certificates | | |
| 6s, March 1, 2035 | 6,501 | 7,157 |
| 4s, July 1, 2042 | 9,340,840 | 9,959,670 |
| 3s, TBA, February 1, 2043 | 3,000,000 | 3,084,844 |
|
| Federal National Mortgage Association Pass-Through Certificates | | |
| 5 1/2s, with due dates from July 1, 2033 to November 1, 2038 | 5,105,656 | 5,552,709 |
| 5s, with due dates from August 1, 2033 to January 1, 2039 | 2,288,587 | 2,472,867 |
| 4 1/2s, with due dates from August 1, 2041 to July 1, 2042 | 21,268,935 | 22,829,428 |
| 4 1/2s, TBA, February 1, 2043 | 10,000,000 | 10,733,594 |
| 3s, TBA, January 1, 2043 | 210,041 | 219,722 |
| 3s, TBA, March 1, 2043 | 18,000,000 | 18,537,188 |
| 3s, TBA, February 1, 2043 | 25,000,000 | 25,820,313 |
|
| | | 99,217,492 |
| | |
| Total U.S. government and agency mortgage obligations (cost $124,945,956) | $124,257,101 |
| |
| 30 | George Putnam Balanced Fund |
| | |
| U.S. TREASURY OBLIGATIONS (8.5%)* | Principal amount | Value |
|
| U.S. Treasury Notes | | |
| 2 5/8s, February 29, 2016 | $14,970,000 | $15,971,119 |
| 2 3/8s, August 31, 2014 | 4,750,000 | 4,909,608 |
| 1 1/4s, April 15, 2014 | 21,300,000 | 21,567,083 |
| 0 1/4s, August 31, 2014 | 60,300,000 | 60,318,844 |
|
| Total U.S. treasury obligations (cost $102,663,573) | | $102,766,654 |
|
| |
| INVESTMENT COMPANIES (1.5%)* | Shares | Value |
|
| Financial Select Sector SPDR Fund | 684,900 | $11,903,562 |
|
| Utilities Select Sector SPDR Fund | 55,400 | 2,026,532 |
|
| Vanguard MSCI Emerging Markets ETF | 90,100 | 4,014,856 |
|
| Total investment companies (cost $15,199,459) | | $17,944,950 |
|
| |
| CONVERTIBLE PREFERRED STOCKS (0.9%)* | Shares | Value |
|
| General Motors Co. Ser. B, $2.375 cv. pfd. | 47,616 | $2,068,320 |
|
| PPL Corp. $4.75 cv. pfd. | 47,308 | 2,566,459 |
|
| PPL Corp. $4.375 cv. pfd. | 43,000 | 2,355,970 |
|
| United Technologies Corp. $3.75 cv. pfd. | 63,939 | 3,640,687 |
|
| Total convertible preferred stocks (cost $10,446,491) | | $10,631,436 |
|
| |
| MORTGAGE-BACKED SECURITIES (0.7%)* | Principal amount | Value |
|
| Banc of America Commercial Mortgage Trust FRB Ser. 05-1, | | |
| Class A4, 5.079s, 2042 | $2,327,000 | $2,410,330 |
|
| Federal Home Loan Mortgage Corp. | | |
| Ser. T-56, Class A, IO, 0.524s, 2043 | 5,075,162 | 88,022 |
| Ser. T-56, Class 3, IO, 0.416s, 2043 | 6,151,799 | 80,502 |
| Ser. T-56, Class 1, IO, 0.214s, 2043 | 7,839,410 | 58,796 |
| Ser. T-56, Class 2, IO, 0.126s, 2043 | 7,294,106 | 22,509 |
|
| Federal National Mortgage Association Ser. 01-79, Class BI, IO, | | |
| 0.312s, 2045 | 1,608,088 | 15,013 |
|
| First Plus Home Loan Trust Ser. 97-3, Class B1, 7.79s, 2023 | | |
| (In default) † | 194,241 | 19 |
|
| GS Mortgage Securities Corp. II 144A Ser. 98-C1, | | |
| Class F, 6s, 2030 | 460,034 | 460,034 |
|
| G-Star, Ltd. 144A FRB Ser. 02-2A, Class BFL, 2.204s, 2037 | | |
| (Cayman Islands) | 308,000 | 280,280 |
|
| GE Business Loan Trust 144A Ser. 04-2, Class D, 2.956s, 2032 F | 292,613 | 170,430 |
|
| LB Commercial Conduit Mortgage Trust 144A | | |
| Ser. 99-C1, Class F, 6.41s, 2031 | 715,303 | 725,809 |
| Ser. 99-C1, Class G, 6.41s, 2031 | 765,731 | 773,290 |
| Ser. 98-C4, Class H, 5.6s, 2035 | 1,074,000 | 1,167,054 |
|
| Morgan Stanley Capital I Trust | | |
| FRB Ser. 07-HQ12, Class A2FX, 5.592s, 2049 F | 974,187 | 1,007,431 |
| FRB Ser. 07-HQ12, Class A2, 5.592s, 2049 | 1,121,011 | 1,163,049 |
|
| Structured Asset Securities Corp. 144A Ser. 98-RF3, | | |
| Class A, IO, 6.1s, 2028 | 758,726 | 117,603 |
|
| TIAA Real Estate CDO, Ltd. Ser. 03-1A, Class E, 8s, 2038 | 2,006,350 | 300,953 |
|
| Total mortgage-backed securities (cost $7,922,448) | | $8,841,124 |
| |
| George Putnam Balanced Fund | 31 |
| | |
| MUNICIPAL BONDS AND NOTES (0.2%)* | Principal amount | Value |
|
| CA State G.O. Bonds (Build America Bonds), | | |
| 7 1/2s, 4/1/34 | $215,000 | $303,518 |
|
| IL State G.O. Bonds | | |
| 4.421s, 1/1/15 | 420,000 | 443,772 |
| 4.071s, 1/1/14 | 1,250,000 | 1,282,788 |
|
| North TX, Thruway Auth. Rev. Bonds (Build | | |
| America Bonds), 6.718s, 1/1/49 | 350,000 | 468,020 |
|
| OH State U. Rev. Bonds (Build America Bonds), | | |
| 4.91s, 6/1/40 | 275,000 | 318,865 |
|
| Total municipal bonds and notes (cost $2,511,466) | | $2,816,963 |
|
| |
| FOREIGN GOVERNMENT AND AGENCY | | |
| BONDS AND NOTES (0.6%)* | Principal amount | Value |
|
| Croatia (Republic of) 144A unsec. notes 6 1/4s, 2017 | $350,000 | $383,737 |
|
| International Bank for Reconstruction & Development unsec. | | |
| unsub. bonds 7 5/8s, 2023 | 4,000,000 | 5,856,360 |
|
| Korea Development Bank sr. unsec. unsub. notes 4s, 2016 | 450,000 | 490,173 |
|
| Total foreign government and agency bonds and notes (cost $5,585,541) | $6,730,270 |
|
| |
| SHORT-TERM INVESTMENTS (10.6%)* | Principal amount/shares | Value |
|
| Putnam Money Market Liquidity Fund 0.10% L | 91,648,970 | $91,648,970 |
|
| Straight-A Funding LLC 144A discounted commercial paper | | |
| with an effective yield of 0.188%, April 4, 2013 | $18,000,000 | 17,994,897 |
|
| Straight-A Funding LLC 144A discounted commercial paper | | |
| with an effective yield of 0.188%, March 6, 2013 | 9,818,000 | 9,816,290 |
|
| Straight-A Funding LLC 144A discounted commercial paper | | |
| with an effective yield of 0.178%, February 5, 2013 | 9,500,000 | 9,499,810 |
|
| Total short-term investments (cost $128,959,180) | | $128,959,967 |
|
| |
| TOTAL INVESTMENTS | | |
|
| Total investments (cost $1,158,313,422) | | $1,296,010,525 |
Key to holding’s abbreviations
ADR American Depository Receipts: represents ownership of foreign securities on deposit with a custodian bank
BKNT Bank Note
ETF Exchange Traded Fund
FRB Floating Rate Bonds: the rate shown is the current interest rate at the close of the reporting period
FRN Floating Rate Notes: the rate shown is the current interest rate at the close of the reporting period
G.O. Bonds General Obligation Bonds
IO Interest Only
MTN Medium Term Notes
SPDR S&P Depository Receipts
TBA To Be Announced Commitments
Notes to the fund’s portfolio
Unless noted otherwise, the notes to the fund’s portfolio are for the close of the fund’s reporting period, which ran from August 1, 2012 through January 31, 2013 (the reporting period). Within the following notes to the portfolio, references to “ASC 820” represent Accounting Standards Codification ASC 820 Fair Value Measurements and Disclosures and references to “OTC”, if any, represent over-the-counter.
| |
| 32 | George Putnam Balanced Fund |
* Percentages indicated are based on net assets of $1,214,596,554.
† Non-income-producing security.
F Is valued at fair value following procedures approved by the Trustees. Securities may be classified as Level 2 or Level 3 for ASC 820 based on the securities’ valuation inputs.
L Affiliated company (Note 5). The rate quoted in the security description is the annualized 7-day yield of the fund at the close of the reporting period.
R Real Estate Investment Trust.
At the close of the reporting period, the fund maintained liquid assets totaling $57,859,492 to cover certain derivatives contracts.
Debt obligations are considered secured unless otherwise indicated.
144A after the name of an issuer represents securities exempt from registration under Rule 144A under the Securities Act of 1933, as amended. These securities may be resold in transactions exempt from registration, normally to qualified institutional buyers.
See Note 1 to the financial statements regarding TBA’s.
| | | | |
| TBA SALE COMMITMENTS OUTSTANDING at 1/31/13 (proceeds receivable $26,020,156) (Unaudited) | |
| | Principal | | Settlement | |
| Agency | amount | | date | Value |
|
| Federal National Mortgage Association, 3s, | | | | |
| February 1, 2043 | $25,000,000 | | 2/12/13 | $25,820,313 |
|
| Total | | | | $25,820,313 |
| |
| George Putnam Balanced Fund | 33 |
ASC 820 establishes a three-level hierarchy for disclosure of fair value measurements. The valuation hierarchy is based upon the transparency of inputs to the valuation of the fund’s investments. The three levels are defined as follows:
Level 1: Valuations based on quoted prices for identical securities in active markets.
Level 2: Valuations based on quoted prices in markets that are not active or for which all significant inputs are observable, either directly or indirectly.
Level 3: Valuations based on inputs that are unobservable and significant to the fair value measurement.
The following is a summary of the inputs used to value the fund’s net assets as of the close of the reporting period:
| | | |
| | | Valuation inputs | |
|
| Investments in securities: | Level 1 | Level 2 | Level 3 |
|
| Common stocks: | | | |
|
| Basic materials | $16,246,258 | $— | $— |
|
| Capital goods | 30,161,515 | — | — |
|
| Communication services | 36,213,194 | — | — |
|
| Conglomerates | 18,104,095 | — | — |
|
| Consumer cyclicals | 68,449,725 | — | — |
|
| Consumer staples | 57,427,153 | — | — |
|
| Energy | 97,289,550 | — | — |
|
| Financials | 164,502,616 | — | — |
|
| Health care | 122,532,663 | — | — |
|
| Technology | 65,085,213 | — | — |
|
| Transportation | 4,560,015 | — | — |
|
| Utilities and power | 32,268,758 | — | — |
|
| Total common stocks | 712,840,755 | — | — |
| | | | |
| | | Valuation inputs | |
|
| Investments in securities: | Level 1 | Level 2 | Level 3 |
|
| Convertible preferred stocks | $3,640,687 | $6,990,749 | $— |
|
| Corporate bonds and notes | — | 180,221,305 | — |
|
| Foreign government and agency bonds and notes | — | 6,730,270 | — |
|
| Investment companies | 17,944,950 | — | — |
|
| Mortgage-backed securities | — | 8,841,124 | — |
|
| Municipal bonds and notes | — | 2,816,963 | — |
|
| U.S. government and agency mortgage obligations | — | 124,257,101 | — |
|
| U.S. Treasury obligations | — | 102,766,654 | — |
|
| Short-term investments | 91,648,970 | 37,310,997 | — |
|
| Totals by level | $826,075,362 | $469,935,163 | $— |
| | | | |
| | | Valuation inputs | |
|
| Other financial instruments: | Level 1 | Level 2 | Level 3 |
|
| TBA sale commitments | $— | $(25,820,313) | $— |
|
| Totals by level | $— | $(25,820,313) | $— |
The accompanying notes are an integral part of these financial statements.
| |
| 34 | George Putnam Balanced Fund |
Statement of assets and liabilities 1/31/13 (Unaudited)
| |
| ASSETS | |
|
| Investment in securities, at value (Note 1): | |
| Unaffiliated issuers (identified cost $1,066,664,452) | $1,204,361,555 |
| Affiliated issuers (identified cost $91,648,970) (Note 5) | 91,648,970 |
|
| Dividends, interest and other receivables | 4,346,222 |
|
| Receivable for shares of the fund sold | 569,502 |
|
| Receivable for investments sold | 5,893,770 |
|
| Receivable for sales of delayed delivery securities (Note 1) | 26,043,073 |
|
| Total assets | 1,332,863,092 |
| |
| LIABILITIES | |
|
| Payable for investments purchased | 4,895,585 |
|
| Payable for purchases of delayed delivery securities (Note 1) | 84,191,515 |
|
| Payable for shares of the fund repurchased | 1,624,375 |
|
| Payable for compensation of Manager (Note 2) | 547,239 |
|
| Payable for custodian fees (Note 2) | 13,664 |
|
| Payable for investor servicing fees (Note 2) | 179,957 |
|
| Payable for Trustee compensation and expenses (Note 2) | 506,723 |
|
| Payable for administrative services (Note 2) | 11,903 |
|
| Payable for distribution fees (Note 2) | 296,986 |
|
| TBA sale commitments, at value (proceeds receivable $26,020,156) (Note 1) | 25,820,313 |
|
| Other accrued expenses | 178,278 |
|
| Total liabilities | 118,266,538 |
| | |
| Net assets | $1,214,596,554 |
|
| |
| REPRESENTED BY | |
|
| Paid-in capital (Unlimited shares authorized) (Notes 1 and 4) | $1,922,067,124 |
|
| Undistributed net investment income (Note 1) | 3,693,098 |
|
| Accumulated net realized loss on investments and foreign currency transactions (Note 1) | (849,060,614) |
|
| Net unrealized appreciation of investments | 137,896,946 |
|
| Total — Representing net assets applicable to capital shares outstanding | $1,214,596,554 |
| |
| (Continued on next page) | |
| |
| George Putnam Balanced Fund | 35 |
Statement of assets and liabilities (Continued)
| |
| COMPUTATION OF NET ASSET VALUE AND OFFERING PRICE | |
|
| Net asset value and redemption price per class A share | |
| ($992,935,661 divided by 72,022,658 shares) | $13.79 |
|
| Offering price per class A share (100/94.25 of $13.79)* | $14.63 |
|
| Net asset value and offering price per class B share ($28,010,887 divided by 2,054,265 shares)** | $13.64 |
|
| Net asset value and offering price per class C share ($21,866,299 divided by 1,595,428 shares)** | $13.71 |
|
| Net asset value and redemption price per class M share ($69,793,123 divided by 5,128,120 shares) | $13.61 |
|
| Offering price per class M share (100/96.50 of $13.61)* | $14.10 |
|
| Net asset value, offering price and redemption price per class R share | |
| ($1,033,584 divided by 75,183 shares) | $13.75 |
|
| Net asset value, offering price and redemption price per class Y share | |
| ($100,957,000 divided by 7,297,440 shares) | $13.83 |
|
* On single retail sales of less than $50,000. On sales of $50,000 or more the offering price is reduced.
** Redemption price per share is equal to net asset value less any applicable contingent deferred sales charge.
The accompanying notes are an integral part of these financial statements.
| |
| 36 | George Putnam Balanced Fund |
Statement of operations Six months ended 1/31/13 (Unaudited)
| |
| INVESTMENT INCOME | |
|
| Dividends (net of foreign tax of $38,194) | $10,142,596 |
|
| Interest (net of foreign tax of $73) (including interest income of $83,940 from investments | |
| in affiliated issuers) (Note 5) | 5,753,550 |
|
| Total investment income | 15,896,146 |
| |
| EXPENSES | |
|
| Compensation of Manager (Note 2) | 3,230,871 |
|
| Investor servicing fees (Note 2) | 1,054,982 |
|
| Custodian fees (Note 2) | 16,086 |
|
| Trustee compensation and expenses (Note 2) | 63,526 |
|
| Administrative services (Note 2) | 20,805 |
|
| Distribution fees (Note 2) | 1,752,068 |
|
| Other | 246,883 |
|
| Total expenses | 6,385,221 |
| | |
| Expense reduction (Note 2) | (14,960) |
|
| Net expenses | 6,370,261 |
| | |
| Net investment income | 9,525,885 |
|
| |
| Net realized gain on investments (Notes 1 and 3) | 33,459,147 |
|
| Net increase from payments by affiliates (Note 2) | 54,576 |
|
| Net realized gain on foreign currency transactions (Note 1) | 39 |
|
| Net unrealized appreciation of investments and TBA sale commitments during the period | 47,591,925 |
|
| Net gain on investments | 81,105,687 |
| | |
| Net increase in net assets resulting from operations | $90,631,572 |
|
The accompanying notes are an integral part of these financial statements.
| |
| George Putnam Balanced Fund | 37 |
Statement of changes in net assets
| | |
| INCREASE IN NET ASSETS | Six months ended 1/31/13* | Year ended 7/31/12 |
|
| Operations: | | |
| Net investment income | $9,525,885 | $20,352,590 |
|
| Net realized gain on investments | | |
| and foreign currency transactions | 33,513,762 | 72,963,740 |
|
| Net unrealized appreciation (depreciation) of investments | 47,591,925 | (14,924,647) |
|
| Net increase in net assets resulting from operations | 90,631,572 | 78,391,683 |
|
| Distributions to shareholders (Note 1): | | |
| From ordinary income | | |
| Net investment income | | |
|
| Class A | (7,416,371) | (16,021,856) |
|
| Class B | (109,336) | (282,747) |
|
| Class C | (81,836) | (188,592) |
|
| Class M | (361,653) | (815,956) |
|
| Class R | (7,820) | (16,639) |
|
| Class Y | (766,773) | (1,261,401) |
|
| Decrease from capital share transactions (Note 4) | (32,719,798) | (134,214,725) |
|
| Total increase (decrease) in net assets | 49,167,985 | (74,410,233) |
| |
| NET ASSETS | | |
|
| Beginning of period | 1,165,428,569 | 1,239,838,802 |
|
| End of period (including undistributed net investment | | |
| income of $3,693,098 and $2,911,002, respectively) | $1,214,596,554 | $1,165,428,569 |
|
* Unaudited
The accompanying notes are an integral part of these financial statements.
| |
| 38 | George Putnam Balanced Fund |
|
| This page left blank intentionally. |
| |
| George Putnam Balanced Fund | 39 |
Financial highlights (For a common share outstanding throughout the period)
| | | | | | | | | | | | | | | | |
| INVESTMENT OPERATIONS: | | LESS DISTRIBUTIONS: | | RATIOS AND SUPPLEMENTAL DATA: |
|
| | | | | | | | | | | | | | | | Ratio | |
| | Net asset | Net | Net realized | | From | From | | | | | | | | Ratio | of net investment | |
| | value, | investment | and unrealized | Total from | net | net realized | From | | | | | | Net assets, | of expenses | income (loss) | Portfolio |
| | beginning | income | gain (loss) | investment | investment | gain | return | Total | Redemption | Non-recurring | Net asset value, | Total return at net | end of period | to average | to average | turnover |
| Period ended | of period | (loss) a | on investments | operations | income | on investments | of capital | distributions | fees | reimbursements | end of period | asset value (%) b | (in thousands) | net assets (%) c | net assets (%) | (%) d |
|
| Class A | | | | | | | | | | | | | | | | |
| January 31, 2013** | $12.88 | .11 | .90 | 1.01 | (.10) | — | — | (.10) | — | — | $13.79 | 7.89* | $992,936 | .51* | .81* | 44* |
| July 31, 2012 | 12.21 | .22 | .65 | .87 | (.20) | — | — | (.20) | — | — | 12.88 | 7.26 | 973,318 | 1.03 | 1.80 | 99 |
| July 31, 2011 | 11.08 | .19 | 1.14 | 1.33 | (.20) | — | — | (.20) | — e | — f | 12.21 | 12.09 | 1,034,828 | 1.05 | 1.57 | 176 |
| July 31, 2010 | 10.14 | .25 | .93 | 1.18 | (.22) | — | (.02) | (.24) | — e | — | 11.08 | 11.83 | 1,077,209 | 1.13 h | 2.27 | 341 |
| July 31, 2009 | 13.99 | .27 | (3.49) | (3.22) | (.44) | (.09) | (.10) | (.63) | — e | — g | 10.14 | (22.58) | 1,146,770 | 1.34 i,j | 2.61 j | 233 |
| July 31, 2008 | 18.10 | .61 | (2.55) | (1.94) | (.64) | (1.53) | — | (2.17) | — e | — | 13.99 | (11.84) | 2,173,291 | 1.00 j | 3.80 j | 124 |
|
| Class B | | | | | | | | | | | | | | | | |
| January 31, 2013** | $12.74 | .06 | .89 | .95 | (.05) | — | — | (.05) | — | — | $13.64 | 7.48* | $28,011 | .89* | .44* | 44* |
| July 31, 2012 | 12.08 | .13 | .63 | .76 | (.10) | — | — | (.10) | — | — | 12.74 | 6.38 | 29,272 | 1.78 | 1.06 | 99 |
| July 31, 2011 | 10.96 | .10 | 1.13 | 1.23 | (.11) | — | — | (.11) | — e | — f | 12.08 | 11.24 | 39,031 | 1.80 | .82 | 176 |
| July 31, 2010 | 10.02 | .17 | .94 | 1.11 | (.15) | — | (.02) | (.17) | — e | — | 10.96 | 11.09 | 56,880 | 1.88 h | 1.54 | 341 |
| July 31, 2009 | 13.83 | .19 | (3.46) | (3.27) | (.37) | (.09) | (.08) | (.54) | — e | — g | 10.02 | (23.23) | 86,981 | 2.09 i,j | 1.85 j | 233 |
| July 31, 2008 | 17.90 | .48 | (2.52) | (2.04) | (.50) | (1.53) | — | (2.03) | — e | — | 13.83 | (12.50) | 206,269 | 1.75 j | 2.99 j | 124 |
|
| Class C | | | | | | | | | | | | | | | | |
| January 31, 2013** | $12.80 | .06 | .90 | .96 | (.05) | — | — | (.05) | — | — | $13.71 | 7.52* | $21,866 | .89* | .44* | 44* |
| July 31, 2012 | 12.14 | .13 | .64 | .77 | (.11) | — | — | (.11) | — | — | 12.80 | 6.39 | 21,223 | 1.78 | 1.05 | 99 |
| July 31, 2011 | 11.02 | .10 | 1.13 | 1.23 | (.11) | — | — | (.11) | — e | — f | 12.14 | 11.22 | 22,013 | 1.80 | .82 | 176 |
| July 31, 2010 | 10.08 | .16 | .95 | 1.11 | (.15) | — | (.02) | (.17) | — e | — | 11.02 | 11.06 | 22,814 | 1.88 h | 1.52 | 341 |
| July 31, 2009 | 13.90 | .19 | (3.47) | (3.28) | (.37) | (.09) | (.08) | (.54) | — e | — g | 10.08 | (23.17) | 23,296 | 2.09 i,j | 1.86 j | 233 |
| July 31, 2008 | 17.97 | .49 | (2.52) | (2.03) | (.51) | (1.53) | — | (2.04) | — e | — | 13.90 | (12.41) | 46,134 | 1.75 j | 3.03 j | 124 |
|
| Class M | | | | | | | | | | | | | | | | |
| January 31, 2013** | $12.71 | .07 | .90 | .97 | (.07) | — | — | (.07) | — | — | $13.61 | 7.64* | $69,793 | .76* | .56* | 44* |
| July 31, 2012 | 12.06 | .16 | .63 | .79 | (.14) | — | — | (.14) | — | — | 12.71 | 6.62 | 70,317 | 1.53 | 1.30 | 99 |
| July 31, 2011 | 10.94 | .13 | 1.13 | 1.26 | (.14) | — | — | (.14) | — e | — f | 12.06 | 11.60 | 75,160 | 1.55 | 1.07 | 176 |
| July 31, 2010 | 10.01 | .19 | .94 | 1.13 | (.18) | — | (.02) | (.20) | — e | — | 10.94 | 11.33 | 79,010 | 1.63 h | 1.77 | 341 |
| July 31, 2009 | 13.82 | .21 | (3.44) | (3.23) | (.40) | (.09) | (.09) | (.58) | — e | — g | 10.01 | (22.99) | 81,025 | 1.84 i,j | 2.13 j | 233 |
| July 31, 2008 | 17.89 | .53 | (2.52) | (1.99) | (.55) | (1.53) | — | (2.08) | — e | — | 13.82 | (12.23) | 128,094 | 1.50 j | 3.31 j | 124 |
|
| Class R | | | | | | | | | | | | | | | | |
| January 31, 2013** | $12.84 | .09 | .90 | .99 | (.08) | — | — | (.08) | — | — | $13.75 | 7.78* | $1,034 | .64* | .69* | 44* |
| July 31, 2012 | 12.18 | .19 | .64 | .83 | (.17) | — | — | (.17) | — | — | 12.84 | 6.92 | 1,209 | 1.28 | 1.54 | 99 |
| July 31, 2011 | 11.05 | .16 | 1.14 | 1.30 | (.17) | — | — | (.17) | — e | — f | 12.18 | 11.84 | 1,216 | 1.30 | 1.32 | 176 |
| July 31, 2010 | 10.11 | .22 | .94 | 1.16 | (.20) | — | (.02) | (.22) | — e | — | 11.05 | 11.59 | 1,345 | 1.38 h | 2.03 | 341 |
| July 31, 2009 | 13.94 | .24 | (3.47) | (3.23) | (.42) | (.09) | (.09) | (.60) | — e | — g | 10.11 | (22.71) | 1,493 | 1.59 i,j | 2.30 j | 233 |
| July 31, 2008 | 18.04 | .57 | (2.54) | (1.97) | (.60) | (1.53) | — | (2.13) | — e | — | 13.94 | (12.04) | 4,274 | 1.25 j | 3.66 j | 124 |
|
| Class Y | | | | | | | | | | | | | | | | |
| January 31, 2013** | $12.92 | .13 | .90 | 1.03 | (.12) | — | — | (.12) | — | — | $13.83 | 7.99* | $100,957 | .39* | .94* | 44* |
| July 31, 2012 | 12.26 | .25 | .64 | .89 | (.23) | — | — | (.23) | — | — | 12.92 | 7.42 | 70,090 | .78 | 2.04 | 99 |
| July 31, 2011 | 11.12 | .22 | 1.15 | 1.37 | (.23) | — | — | (.23) | — e | — f | 12.26 | 12.42 | 67,590 | .80 | 1.82 | 176 |
| July 31, 2010 | 10.17 | .28 | .95 | 1.23 | (.25) | — | (.03) | (.28) | — e | — | 11.12 | 12.18 | 69,539 | .88 h | 2.55 | 341 |
| July 31, 2009 | 14.04 | .29 | (3.50) | (3.21) | (.47) | (.09) | (.10) | (.66) | — e | — g | 10.17 | (22.42) | 103,251 | 1.09 i,j | 2.87 j | 233 |
| July 31, 2008 | 18.15 | .66 | (2.55) | (1.89) | (.69) | (1.53) | — | (2.22) | — e | — | 14.04 | (11.57) | 257,459 | .75 j | 4.05 j | 124 |
|
See notes to financial highlights at the end of this section.
The accompanying notes are an integral part of these financial statements.
| | | |
| 40 | George Putnam Balanced Fund | George Putnam Balanced Fund | 41 |
Financial highlights (Continued)
* Not annualized.
** Unaudited.
a Per share net investment income (loss) has been determined on the basis of the weighted average number of shares outstanding during the period.
b Total return assumes dividend reinvestment and does not reflect the effect of sales charges.
c Includes amounts paid through expense offset and brokerage/service arrangements (Note 2).
d Portfolio turnover excludes dollar roll transactions.
e Amount represents less than $0.01 per share.
f Reflects a non-recurring reimbursement related to restitution amounts in connection with a distribution plan approved by the Securities and Exchange Commission (the SEC), which amounted to less than $0.01 per share outstanding on July 21, 2011. Also reflects a non-recurring reimbursal related to short-term trading related lawsuits, which amounted to less than $0.01 per share outstanding on May 11, 2011.
g Reflects a non-recurring reimbursement pursuant to a settlement between the SEC and Bear Stearns & Co., Inc. and Bear Stearns Securities Corp., which amounted to less than $0.01 per share outstanding as of May 21, 2009.
h Excludes the impact of a reduction to interest expense related to the resolution of certain terminated derivatives contracts, which amounted to 0.02% of average net assets as of July 31, 2010.
i Includes interest accrued in connection with certain terminated derivative contracts, which amounted to 0.20% of average net assets as of July 31, 2009 (Note 2).
j Reflects an involuntary contractual expense limitation in effect during the period. For periods prior to July 31, 2009, certain fund expenses were waived in connection with the fund’s investment in Putnam Prime Money Market Fund. As a result of such limitation and/or waivers, the expenses of each class reflect a reduction of the following amounts:
| |
| | Percentage of |
| | average net assets |
|
| July 31, 2009 | 0.01% |
|
| July 31, 2008 | <0.01 |
|
The accompanying notes are an integral part of these financial statements.
| |
| 42 | George Putnam Balanced Fund |
Notes to financial statements 1/31/13 (Unaudited)
Within the following Notes to financial statements, references to “State Street” represent State Street Bank and Trust Company, references to “the SEC” represent the Securities and Exchange Commission, references to “Putnam Management” represent Putnam Investment Management, LLC, the fund’s manager, an indirect wholly-owned subsidiary of Putnam Investments, LLC and references to “OTC”, if any, represent over-the-counter. Unless otherwise noted, the “reporting period” represents the period from August 1, 2012 through January 31, 2013.
The George Putnam Fund of Boston d/b/a George Putnam Balanced Fund (the fund) is a Massachusetts business trust, which is registered under the Investment Company Act of 1940, as amended, as a diversified open-end management investment company. The investment objective of the fund is to provide a balanced investment composed of a well-diversified portfolio of stocks and bonds which produce both capital growth and current income. The fund pursues this goal by investing mainly in a combination of bonds and value stocks of large and midsized U.S. companies with a greater focus on value stocks. Value stocks are those that Putnam Management believes are currently undervalued by the market. The fund buys bonds of governments and private companies that are mostly investment-grade in quality with intermediate- to long-term maturities (three years or longer). Putnam Management may consider, among other factors, a company’s valuation, financial strength, growth potential, competitive position in its industry, projected future earnings, cash flows and dividends when deciding whether to buy or sell equity investments, and, among other factors, credit, interest rate and prepayment risks, as well as general market conditions, when deciding whether to buy or sell fixed income investments. The fund may also use derivatives, such as futures, options, warrants and swap contracts, for both hedging and non-hedging purposes.
The fund offers class A, class B, class C, class M, class R and class Y shares. Class A and class M shares are sold with a maximum front-end sales charge of 5.75% and 3.50%, respectively, and generally do not pay a contingent deferred sales charge. Class B shares, which convert to class A shares after approximately eight years, do not pay a front-end sales charge and are subject to a contingent deferred sales charge if those shares are redeemed within six years of purchase. Class C shares have a one-year 1.00% contingent deferred sales charge and do not convert to class A shares. Class R shares, which are not available to all investors, are sold at net asset value. The expenses for class A, class B, class C, class M and class R shares may differ based on the distribution fee of each class, which is identified in Note 2. Class Y shares, which are sold at net asset value, are generally subject to the same expenses as class A, class B, class C, class M and class R shares, but do not bear a distribution fee. Class Y shares are not available to all investors.
In the normal course of business, the fund enters into contracts that may include agreements to indemnify another party under given circumstances. The fund’s maximum exposure under these arrangements is unknown as this would involve future claims that may be, but have not yet been, made against the fund. However, the fund’s management team expects the risk of material loss to be remote.
Note 1: Significant accounting policies
The following is a summary of significant accounting policies consistently followed by the fund in the preparation of its financial statements. The preparation of financial statements is in conformity with accounting principles generally accepted in the United States of America and requires management to make estimates and assumptions that affect the reported amounts of assets and liabilities in the financial statements and the reported amounts of increases and decreases in net assets from operations. Actual results could differ from those estimates. Subsequent events after the Statement of assets and liabilities date through the date that the financial statements were issued have been evaluated in the preparation of the financial statements.
Investment income, realized and unrealized gains and losses and expenses of the fund are borne pro-rata based on the relative net assets of each class to the total net assets of the fund, except that each class bears expenses unique to that class (including the distribution fees applicable to such classes). Each class votes as a class only with respect to its own distribution plan or other matters on which a class vote is required by law or determined by the Trustees. If the fund were liquidated, shares of each class would receive their pro-rata share of the net assets of the fund. In addition, the Trustees declare separate dividends on each class of shares.
Security valuation Investments for which market quotations are readily available are valued at the last reported sales price on their principal exchange, or official closing price for certain markets, and are classified as Level 1 securities under Accounting Standards Codification ASC 820 Fair Value Measurements and Disclosures (ASC 820). If no sales are reported, as in the case of some securities that are traded OTC, a security is valued at its last reported bid price and is generally categorized as a Level 2 security.
| |
| George Putnam Balanced Fund | 43 |
Investments in open-end investment companies (excluding exchange traded funds), if any, which can be classified as Level 1 or Level 2 securities, are based on their net asset value. The net asset value of such investment companies equals the total value of their assets less their liabilities and divided by the number of their outstanding shares.
Market quotations are not considered to be readily available for certain debt obligations and other investments; such investments are valued on the basis of valuations furnished by an independent pricing service approved by the Trustees or dealers selected by Putnam Management. Such services or dealers determine valuations for normal institutional-size trading units of such securities using methods based on market transactions for comparable securities and various relationships, generally recognized by institutional traders, between securities (which considers such factors as security prices, yields, maturities and ratings). These securities will generally be categorized as Level 2.
Many securities markets and exchanges outside the U.S. close prior to the close of the New York Stock Exchange and therefore the closing prices for securities in such markets or on such exchanges may not fully reflect events that occur after such close but before the close of the New York Stock Exchange. Accordingly, on certain days, the fund will fair value foreign equity securities taking into account multiple factors including movements in the U.S. securities markets, currency valuations and comparisons to the valuation of American Depository Receipts, exchange-traded funds and futures contracts. These securities, which would generally be classified as Level 1 securities, will be transferred to Level 2 of the fair value hierarchy when they are valued at fair value. The number of days on which fair value prices will be used will depend on market activity and it is possible that fair value prices will be used by the fund to a significant extent. Securities quoted in foreign currencies, if any, are translated into U.S. dollars at the current exchange rate.
To the extent a pricing service or dealer is unable to value a security or provides a valuation that Putnam Management does not believe accurately reflects the security’s fair value, the security will be valued at fair value by Putnam Management. Certain investments, including certain restricted and illiquid securities and derivatives, are also valued at fair value following procedures approved by the Trustees. These valuations consider such factors as significant market or specific security events such as interest rate or credit quality changes, various relationships with other securities, discount rates, U.S. Treasury, U.S. swap and credit yields, index levels, convexity exposures and recovery rates. These securities are classified as Level 2 or as Level 3 depending on the priority of the significant inputs.
Such valuations and procedures are reviewed periodically by the Trustees. The fair value of securities is generally determined as the amount that the fund could reasonably expect to realize from an orderly disposition of such securities over a reasonable period of time. By its nature, a fair value price is a good faith estimate of the value of a security in a current sale and does not reflect an actual market price, which may be different by a material amount.
Security transactions and related investment income Security transactions are recorded on the trade date (the date the order to buy or sell is executed). Gains or losses on securities sold are determined on the identified cost basis. Interest income, net of any applicable withholding taxes, is recorded on the accrual basis. Dividend income, net of any applicable withholding taxes, is recognized on the ex-dividend date except that certain dividends from foreign securities, if any, are recognized as soon as the fund is informed of the ex-dividend date. Non-cash dividends, if any, are recorded at the fair market value of the securities received. Dividends representing a return of capital or capital gains, if any, are reflected as a reduction of cost and/or as a realized gain. All premiums/discounts are amortized/accreted on a yield-to-maturity basis. Securities purchased or sold on a delayed delivery basis may be settled a month or more after the trade date; interest income is accrued based on the terms of the securities. Losses may arise due to changes in the market value of the underlying securities or if the counterparty does not perform under the contract.
Stripped securities The fund may invest in stripped securities which represent a participation in securities that may be structured in classes with rights to receive different portions of the interest and principal. Interest-only securities receive all of the interest and principal-only securities receive all of the principal. If the interest-only securities experience greater than anticipated prepayments of principal, the fund may fail to recoup fully its initial investment in these securities. Conversely, principal-only securities increase in value if prepayments are greater than anticipated and decline if prepayments are slower than anticipated. The market value of these securities is highly sensitive to changes in interest rates.
Foreign currency translation The accounting records of the fund are maintained in U.S. dollars. The market value of foreign securities, currency holdings, and other assets and liabilities is recorded in the books and records of the fund after translation to U.S. dollars based on the exchange rates on that day. The cost of each security is determined using historical exchange rates. Income and withholding taxes are translated at prevailing exchange
| |
| 44 | George Putnam Balanced Fund |
rates when earned or incurred. The fund does not isolate that portion of realized or unrealized gains or losses resulting from changes in the foreign exchange rate on investments from fluctuations arising from changes in the market prices of the securities. Such gains and losses are included with the net realized and unrealized gain or loss on investments. Net realized gains and losses on foreign currency transactions represent net realized exchange gains or losses on closed forward currency contracts, disposition of foreign currencies, currency gains and losses realized between the trade and settlement dates on securities transactions and the difference between the amount of investment income and foreign withholding taxes recorded on the fund’s books and the U.S. dollar equivalent amounts actually received or paid. Net unrealized appreciation and depreciation of assets and liabilities in foreign currencies arise from changes in the value of open forward currency contracts and assets and liabilities other than investments at the period end, resulting from changes in the exchange rate.
TBA purchase commitments The fund may enter into TBA (to be announced) commitments to purchase securities for a fixed unit price at a future date beyond customary settlement time. Although the unit price has been established, the principal value has not been finalized. However, it is anticipated that the amount of the commitments will not significantly differ from the principal amount. The fund holds, and maintains until settlement date, cash or high-grade debt obligations in an amount sufficient to meet the purchase price, or the fund may enter into offsetting contracts for the forward sale of other securities it owns. Income on the securities will not be earned until settlement date. TBA purchase commitments may be considered securities themselves, and involve a risk of loss if the value of the security to be purchased declines prior to the settlement date, which risk is in addition to the risk of decline in the value of the fund’s other assets. Unsettled TBA purchase commitments are valued at fair value of the underlying securities, according to the procedures described under “Security valuation” above. The contract is marked to market daily and the change in market value is recorded by the fund as an unrealized gain or loss.
Although the fund will generally enter into TBA purchase commitments with the intention of acquiring securities for its portfolio or for delivery pursuant to options contracts it has entered into, the fund may dispose of a commitment prior to settlement if Putnam Management deems it appropriate to do so.
TBA sale commitments The fund may enter into TBA sale commitments to hedge its portfolio positions or to sell mortgage-backed securities it owns under delayed delivery arrangements. Proceeds of TBA sale commitments are not received until the contractual settlement date. During the time a TBA sale commitment is outstanding, equivalent deliverable securities, or an offsetting TBA purchase commitment deliverable on or before the sale commitment date, are held as “cover” for the transaction.
Unsettled TBA sale commitments are valued at the fair value of the underlying securities, generally according to the procedures described under “Security valuation” above. The contract is marked to market daily and the change in market value is recorded by the fund as an unrealized gain or loss. If the TBA sale commitment is closed through the acquisition of an offsetting TBA purchase commitment, the fund realizes a gain or loss. If the fund delivers securities under the commitment, the fund realizes a gain or a loss from the sale of the securities based upon the unit price established at the date the commitment was entered into. TBA sale commitments outstanding at period end, if any, are listed after the fund’s portfolio.
Interfund lending The fund, along with other Putnam funds, may participate in an interfund lending program pursuant to an exemptive order issued by the SEC. This program allows the fund to borrow from or lend to other Putnam funds that permit such transactions. Interfund lending transactions are subject to each fund’s investment policies and borrowing and lending limits. Interest earned or paid on the interfund lending transaction will be based on the average of certain current market rates. During the reporting period, the fund did not utilize the program.
Line of credit The fund participates, along with other Putnam funds, in a $315 million unsecured committed line of credit and a $185 million unsecured uncommitted line of credit, both provided by State Street. Borrowings may be made for temporary or emergency purposes, including the funding of shareholder redemption requests and trade settlements. Interest is charged to the fund based on the fund’s borrowing at a rate equal to the Federal Funds rate plus 1.25% for the committed line of credit and the Federal Funds rate plus 1.30% for the uncommitted line of credit. A closing fee equal to 0.02% of the committed line of credit and $50,000 for the uncommitted line of credit has been paid by the participating funds. In addition, a commitment fee of 0.11% per annum on any unutilized portion of the committed line of credit is allocated to the participating funds based on their relative net assets and paid quarterly. During the reporting period, the fund had no borrowings against these arrangements.
Federal taxes It is the policy of the fund to distribute all of its taxable income within the prescribed time period and otherwise comply with the provisions of the Internal Revenue Code of 1986, as amended (the Code), applicable to regulated investment companies. It is also the intention of the fund to distribute an amount sufficient to avoid imposition of any excise tax under Section 4982 of the Code.
| |
| George Putnam Balanced Fund | 45 |
The fund is subject to the provisions of Accounting Standards Codification ASC 740 Income Taxes (ASC 740). ASC 740 sets forth a minimum threshold for financial statement recognition of the benefit of a tax position taken or expected to be taken in a tax return. The fund did not have a liability to record for any unrecognized tax benefits in the accompanying financial statements. No provision has been made for federal taxes on income, capital gains or unrealized appreciation on securities held nor for excise tax on income and capital gains. Each of the fund’s federal tax returns for the prior three fiscal years remains subject to examination by the Internal Revenue Service.
The fund may also be subject to taxes imposed by governments of countries in which it invests. Such taxes are generally based on either income or gains earned or repatriated. The fund accrues and applies such taxes to net investment income, net realized gains and net unrealized gains as income and/or capital gains are earned. In some cases, the fund may be entitled to reclaim all or a portion of such taxes, and such reclaim amounts, if any, are reflected as an asset on the fund’s books. In many cases, however, the fund may not receive such amounts for an extended period of time, depending on the country of investment.
At July 31, 2012, the fund had a capital loss carryover of $878,741,426 available to the extent allowed by the Code to offset future net capital gain, if any. The amounts of the carryovers and the expiration dates are:
| | | |
| | Loss carryover | |
|
| Short-term | Long-term | Total | Expiration |
|
| $238,965,283 | N/A | $238,965,283 | July 31, 2017 |
|
| 639,776,143 | N/A | 639,776,143 | July 31, 2018 |
|
Under the Regulated Investment Company Modernization Act of 2010, the fund will be permitted to carry forward capital losses incurred in taxable years beginning after December 22, 2010 for an unlimited period. However, any losses incurred will be required to be utilized prior to the losses incurred in pre-enactment tax years. As a result of this ordering rule, pre-enactment capital loss carryforwards may be more likely to expire unused. Additionally, post-enactment capital losses that are carried forward will retain their character as either short-term or long-term capital losses rather than being considered all short-term as under previous law.
The aggregate identified cost on a tax basis is $1,162,146,372, resulting in gross unrealized appreciation and depreciation of $152,119,799 and $18,255,646, respectively, or net unrealized appreciation of $133,864,153.
Distributions to shareholders Distributions to shareholders from net investment income are recorded by the fund on the ex-dividend date. Distributions from capital gains, if any, are recorded on the ex-dividend date and paid at least annually. The amount and character of income and gains to be distributed are determined in accordance with income tax regulations, which may differ from generally accepted accounting principles. Dividend sources are estimated at the time of declaration. Actual results may vary. Any non-taxable return of capital cannot be determined until final tax calculations are completed after the end of the fund’s fiscal year. Reclassifications are made to the fund’s capital accounts to reflect income and gains available for distribution (or available capital loss carryovers) under income tax regulations.
Note 2: Management fee, administrative services and other transactions
The fund pays Putnam Management a management fee (based on the fund’s average net assets and computed and paid monthly) at annual rates that may vary based on the average of the aggregate net assets of most open-end funds, as defined in the fund’s management contract, sponsored by Putnam Management. Such annual rates may vary as follows:
| | | | |
| 0.680% | of the first $5 billion, | | 0.480% | of the next $50 billion, |
| |
|
| 0.630% | of the next $5 billion, | | 0.460% | of the next $50 billion, |
| |
|
| 0.580% | of the next $10 billion, | | 0.450% | of the next $100 billion, and |
| |
|
| 0.530% | of the next $10 billion, | | 0.445% | of any excess thereafter. |
| |
|
|
Putnam Management has contractually agreed, through June 30, 2013, to waive fees or reimburse the fund’s expenses to the extent necessary to limit the cumulative expenses of the fund, exclusive of brokerage, interest, taxes, investment-related expenses, extraordinary expenses, acquired fund fees and expenses and payments under the fund’s investor servicing contract, investment management contract and distribution plans, on a fiscal
| |
| 46 | George Putnam Balanced Fund |
year-to-date basis to an annual rate of 0.20% of the fund’s average net assets over such fiscal year-to-date period. During the reporting period, the fund’s expenses were not reduced as a result of this limit.
Putnam Investments Limited (PIL), an affiliate of Putnam Management, is authorized by the Trustees to manage a separate portion of the assets of the fund as determined by Putnam Management from time to time. Putnam Management pays a quarterly sub-management fee to PIL for its services at an annual rate of 0.40% of the average net assets of the portion of the fund managed by PIL.
Putnam Management voluntarily reimbursed the fund $54,576 for a trading error which occurred during the reporting period. The effect of the loss incurred and the reimbursement by Putnam Management of such amounts had no impact on total return.
The fund reimburses Putnam Management an allocated amount for the compensation and related expenses of certain officers of the fund and their staff who provide administrative services to the fund. The aggregate amount of all such reimbursements is determined annually by the Trustees.
Custodial functions for the fund’s assets are provided by State Street. Custody fees are based on the fund’s asset level, the number of its security holdings and transaction volumes.
Putnam Investor Services, Inc., an affiliate of Putnam Management, provides investor servicing agent functions to the fund. Putnam Investor Services, Inc. received fees for investor servicing based on the fund’s retail asset level, the number of shareholder accounts in the fund and the level of defined contribution plan assets in the fund. Investor servicing fees will not exceed an annual rate of 0.32% of the fund’s average net assets. Prior to March 1, 2012, investor servicing fees could not exceed an annual rate of 0.375% of the fund’s average net assets. During the reporting period, the expenses for each class of shares related to investor servicing fees were as follows:
| | | | |
| Class A | $862,924 | | Class R | 1,082 |
| |
|
| Class B | 24,975 | | Class Y | 85,268 |
| |
|
| Class C | 18,927 | | Total | $1,054,982 |
| |
|
| Class M | 61,806 | | | |
| | |
The fund has entered into expense offset arrangements with Putnam Investor Services, Inc. and State Street whereby Putnam Investor Services, Inc.’s and State Street’s fees are reduced by credits allowed on cash balances. The fund also reduced expenses through brokerage/service arrangements. For the reporting period, the fund’s expenses were reduced by $723 under the expense offset arrangements and by $14,237 under the brokerage/service arrangements.
Each independent Trustee of the fund receives an annual Trustee fee, of which $919, as a quarterly retainer, has been allocated to the fund, and an additional fee for each Trustees meeting attended. Trustees also are reimbursed for expenses they incur relating to their services as Trustees.
The fund has adopted a Trustee Fee Deferral Plan (the Deferral Plan) which allows the Trustees to defer the receipt of all or a portion of Trustees fees payable on or after July 1, 1995. The deferred fees remain invested in certain Putnam funds until distribution in accordance with the Deferral Plan.
The fund has adopted an unfunded noncontributory defined benefit pension plan (the Pension Plan) covering all Trustees of the fund who have served as a Trustee for at least five years and were first elected prior to 2004. Benefits under the Pension Plan are equal to 50% of the Trustee’s average annual attendance and retainer fees for the three years ended December 31, 2005. The retirement benefit is payable during a Trustee’s lifetime, beginning the year following retirement, for the number of years of service through December 31, 2006. Pension expense for the fund is included in Trustee compensation and expenses in the Statement of operations. Accrued pension liability is included in Payable for Trustee compensation and expenses in the Statement of assets and liabilities. The Trustees have terminated the Pension Plan with respect to any Trustee first elected after 2003.
The fund has adopted distribution plans (the Plans) with respect to its class A, class B, class C, class M and class R shares pursuant to Rule 12b–1 under the Investment Company Act of 1940. The purpose of the Plans is to compensate Putnam Retail Management Limited Partnership, an indirect wholly-owned subsidiary of Putnam Investments, LLC, for services provided and expenses incurred in distributing shares of the fund. The Plans provide for payments by the fund to Putnam Retail Management Limited Partnership at an annual rate of up to 0.35%, 1.00%, 1.00%, 1.00% and 1.00% of the average net assets attributable to class A, class B, class C, class M and class R shares, respectively. The Trustees have approved payment by the fund at an annual rate of 0.25%, 1.00%, 1.00%, 0.75% and
| |
| George Putnam Balanced Fund | 47 |
0.50% of the average net assets attributable to class A, class B, class C, class M and class R shares, respectively. During the reporting period, the class specific expenses related to distribution fees were as follows:
| | | | |
| Class A | $1,232,885 | | Class M | 265,070 |
| |
|
| Class B | 142,815 | | Class R | 3,093 |
| |
|
| Class C | 108,205 | | Total | $1,752,068 |
| |
|
|
For the reporting period, Putnam Retail Management Limited Partnership, acting as underwriter, received net commissions of $38,937 and $349 from the sale of class A and class M shares, respectively, and received $8,533 and $309 in contingent deferred sales charges from redemptions of class B and class C shares, respectively.
A deferred sales charge of up to 1.00% and 0.65% is assessed on certain redemptions of class A and class M shares, respectively. For the reporting period, Putnam Retail Management Limited Partnership, acting as underwriter, received $37 and no monies on class A and class M redemptions, respectively.
Note 3: Purchases and sales of securities
During the reporting period, cost of purchases and proceeds from sales of investment securities other than short-term investments and TBA transactions aggregated $477,207,812 and $460,909,022, respectively. These figures include the cost of purchases and proceeds from sales of long-term U.S. government securities of $64,973,441 and $42,794,209, respectively.
Note 4: Capital shares
At the close of the reporting period, there was an unlimited number of shares of beneficial interest authorized. Transactions in capital shares were as follows:
| | | | |
| | Six months ended 1/31/13 | Year ended 7/31/12 |
|
| Class A | Shares | Amount | Shares | Amount |
|
| Shares sold | 2,161,463 | $28,784,905 | 4,176,401 | $51,105,145 |
|
| Shares issued in connection with | | | | |
| reinvestment of distributions | 518,075 | 6,778,188 | 1,210,965 | 14,521,259 |
|
| | 2,679,538 | 35,563,093 | 5,387,366 | 65,626,404 |
|
| Shares repurchased | (6,239,935) | (82,848,681) | (14,527,294) | (177,131,293) |
|
| Net decrease | (3,560,397) | $(47,285,588) | (9,139,928) | $(111,504,889) |
|
| |
| | Six months ended 1/31/13 | Year ended 7/31/12 |
|
| Class B | Shares | Amount | Shares | Amount |
|
| Shares sold | 101,236 | $1,331,700 | 236,098 | $2,871,876 |
|
| Shares issued in connection with | | | | |
| reinvestment of distributions | 8,240 | 106,724 | 22,966 | 272,062 |
|
| | 109,476 | 1,438,424 | 259,064 | 3,143,938 |
|
| Shares repurchased | (353,488) | (4,634,031) | (1,192,864) | (14,417,278) |
|
| Net decrease | (244,012) | $(3,195,607) | (933,800) | $(11,273,340) |
|
| |
| | Six months ended 1/31/13 | Year ended 7/31/12 |
|
| Class C | Shares | Amount | Shares | Amount |
|
| Shares sold | 89,327 | $1,180,949 | 202,878 | $2,447,332 |
|
| Shares issued in connection with | | | | |
| reinvestment of distributions | 5,869 | 76,438 | 14,628 | 174,519 |
|
| | 95,196 | 1,257,387 | 217,506 | 2,621,851 |
|
| Shares repurchased | (157,542) | (2,083,832) | (372,777) | (4,537,690) |
|
| Net decrease | (62,346) | $(826,445) | (155,271) | $(1,915,839) |
|
| |
| 48 | George Putnam Balanced Fund |
| | | | |
| | Six months ended 1/31/13 | Year ended 7/31/12 |
|
| Class M | Shares | Amount | Shares | Amount |
|
| Shares sold | 250,803 | $3,290,198 | 632,492 | $7,630,386 |
|
| Shares issued in connection with | | | | |
| reinvestment of distributions | 27,733 | 358,351 | 68,110 | 807,182 |
|
| | 278,536 | 3,648,549 | 700,602 | 8,437,568 |
|
| Shares repurchased | (681,417) | (8,944,046) | (1,402,530) | (16,944,743) |
|
| Net decrease | (402,881) | $(5,295,497) | (701,928) | $(8,507,175) |
|
| |
| | Six months ended 1/31/13 | Year ended 7/31/12 |
|
| Class R | Shares | Amount | Shares | Amount |
|
| Shares sold | 11,427 | $151,190 | 30,235 | $371,945 |
|
| Shares issued in connection with | | | | |
| reinvestment of distributions | 575 | 7,520 | 1,366 | 16,349 |
|
| | 12,002 | 158,710 | 31,601 | 388,294 |
|
| Shares repurchased | (30,938) | (419,298) | (37,325) | (455,995) |
|
| Net decrease | (18,936) | $(260,588) | (5,724) | $(67,701) |
|
| |
| | Six months ended 1/31/13 | Year ended 7/31/12 |
|
| Class Y | Shares | Amount | Shares | Amount |
|
| Shares sold | 2,839,397 | $37,123,547 | 688,476 | $8,632,348 |
|
| Shares issued in connection with | | | | |
| reinvestment of distributions | 54,746 | 719,415 | 100,727 | 1,211,947 |
|
| | 2,894,143 | 37,842,962 | 789,203 | 9,844,295 |
|
| Shares repurchased | (1,020,926) | (13,699,035) | (879,680) | (10,790,076) |
|
| Net increase (decrease) | 1,873,217 | $24,143,927 | (90,477) | $(945,781) |
|
Note 5: Transactions with affiliated issuer
Transactions during the reporting period with Putnam Money Market Liquidity Fund, which is under common ownership and control, were as follows:
| | | | | |
| | Market value at | | | | Market value |
| | the beginning | | | | at the end of |
| | of the reporting | | | Investment | the reporting |
| Name of affiliate | period | Purchase cost | Sale proceeds | income | period |
|
| Putnam Money Market | | | | | |
| Liquidity Fund* | $145,927,690 | $117,529,962 | $171,808,682 | $83,940 | $91,648,970 |
|
* Management fees charged to Putnam Money Market Liquidity Fund have been waived by Putnam Management.
Note 6: Market, credit and other risks
In the normal course of business, the fund trades financial instruments and enters into financial transactions where risk of potential loss exists due to changes in the market (market risk) or failure of the contracting party to the transaction to perform (credit risk). The fund may be exposed to additional credit risk that an institution or other entity with which the fund has unsettled or open transactions will default. Investments in foreign securities involve certain risks, including those related to economic instability, unfavorable political developments, and currency fluctuations. The fund may invest a significant portion of its assets in securitized debt instruments, including mortgage-backed and asset-backed investments. The yields and values of these investments are sensitive to changes in interest rates, the rate of principal payments on the underlying assets and the market’s perception of the issuers. The market for these investments may be volatile and limited, which may make them difficult to buy or sell.
| |
| George Putnam Balanced Fund | 49 |
Note 7: New accounting pronouncement
In December 2011, the FASB issued ASU No. 2011–11 “Disclosures about Offsetting Assets and Liabilities”. The update creates new disclosure requirements requiring entities to disclose both gross and net information for derivatives and other financial instruments that are either offset in the Statement of assets and liabilities or subject to an enforceable master netting arrangement or similar agreement. The disclosure requirements are effective for annual reporting periods beginning on or after January 1, 2013 and interim periods within those annual periods. Putnam Management is currently evaluating the application of ASU 2011–11 and its impact, if any, on the fund’s financial statements.
| |
| 50 | George Putnam Balanced Fund |
The Putnam family of funds
The following is a list of Putnam’s open-end mutual funds offered to the public. Investors should carefully consider the investment objective, risks, charges, and expenses of a fund before investing. For a prospectus, or a summary prospectus if available, containing this and other information for any Putnam fund or product, call your financial advisor at 1-800-225-1581 and ask for a prospectus. Please read the prospectus carefully before investing.
| |
| Growth | Income |
| Growth Opportunities Fund | American Government Income Fund |
| International Growth Fund | Diversified Income Trust |
| Multi-Cap Growth Fund | Floating Rate Income Fund |
| Small Cap Growth Fund | Global Income Trust |
| Voyager Fund | High Yield Advantage Fund |
| | High Yield Trust |
| Blend | Income Fund |
| Asia Pacific Equity Fund | Money Market Fund* |
| Capital Opportunities Fund | Short Duration Income Fund |
| Capital Spectrum Fund | U.S. Government Income Trust |
| Emerging Markets Equity Fund | |
| Equity Spectrum Fund | Tax-free income |
| Europe Equity Fund | AMT-Free Municipal Fund |
| Global Equity Fund | Tax Exempt Income Fund |
| International Capital Opportunities Fund | Tax Exempt Money Market Fund* |
| International Equity Fund | Tax-Free High Yield Fund |
| Investors Fund | |
| Multi-Cap Core Fund | State tax-free income funds: |
| Research Fund | Arizona, California, Massachusetts, Michigan, |
| | Minnesota, New Jersey, New York, Ohio, |
| Value | and Pennsylvania. |
| Convertible Securities Fund | |
| Equity Income Fund | Absolute Return |
| George Putnam Balanced Fund | Absolute Return 100 Fund® |
| The Putnam Fund for Growth and Income | Absolute Return 300 Fund® |
| International Value Fund | Absolute Return 500 Fund® |
| Multi-Cap Value Fund | Absolute Return 700 Fund® |
| Small Cap Value Fund | |
* An investment in a money market fund is not insured or guaranteed by the Federal Deposit Insurance Corporation or any other government agency. Although the fund seeks to preserve the value of your investment at $1.00 per share, it is possible to lose money by investing in the fund.
| |
| George Putnam Balanced Fund | 51 |
| |
| Global Sector | Putnam RetirementReady® Funds — portfolios |
| Global Consumer Fund | with automatically adjusting allocations to |
| Global Energy Fund | stocks, bonds, and money market instruments, |
| Global Financials Fund | becoming more conservative over time. |
| Global Health Care Fund | |
| Global Industrials Fund | RetirementReady 2055 Fund |
| Global Natural Resources Fund | RetirementReady 2050 Fund |
| Global Sector Fund | RetirementReady 2045 Fund |
| Global Technology Fund | RetirementReady 2040 Fund |
| Global Telecommunications Fund | RetirementReady 2035 Fund |
| Global Utilities Fund | RetirementReady 2030 Fund |
| | RetirementReady 2025 Fund |
| Asset Allocation | RetirementReady 2020 Fund |
| Putnam Global Asset Allocation Funds — | RetirementReady 2015 Fund |
| portfolios with allocations to stocks, bonds, | |
| and money market instruments that are | Putnam Retirement Income Lifestyle |
| adjusted dynamically within specified ranges | Funds — portfolios with managed |
| as market conditions change. | allocations to stocks, bonds, and money |
| | market investments to generate |
| Dynamic Asset Allocation Balanced Fund | retirement income. |
| Dynamic Asset Allocation | |
| Conservative Fund | Retirement Income Fund Lifestyle 1 |
| Dynamic Asset Allocation Growth Fund | Retirement Income Fund Lifestyle 2 |
| Dynamic Risk Allocation Fund | Retirement Income Fund Lifestyle 3 |
| | |
| |
A short-term trading fee of 1% may apply to redemptions or exchanges from certain funds within the time period specified in the fund's prospectus.
Check your account balances and the most recent month-end performance in the Individual Investors section at putnam.com.
| |
| 52 | George Putnam Balanced Fund |
Fund information
Founded over 75 years ago, Putnam Investments was built around the concept that a balance between risk and reward is the hallmark of a well-rounded financial program. We manage over 100 funds across income, value, blend, growth, asset allocation, absolute return, and global sector categories.
| | |
| Investment Manager | Trustees | Robert R. Leveille |
| Putnam Investment | Jameson A. Baxter, Chair | Vice President and |
| Management, LLC | Liaquat Ahamed | Chief Compliance Officer |
| One Post Office Square | Ravi Akhoury | |
| Boston, MA 02109 | Barbara M. Baumann | Michael J. Higgins |
| | Charles B. Curtis | Vice President and Treasurer |
| Investment Sub-Manager | Robert J. Darretta | |
| Putnam Investments Limited | Katinka Domotorffy | Janet C. Smith |
| 57–59 St James’s Street | John A. Hill | Vice President, |
| London, England SW1A 1LD | Paul L. Joskow | Principal Accounting Officer, |
| | Elizabeth T. Kennan | and Assistant Treasurer |
| Marketing Services | Kenneth R. Leibler | |
| Putnam Retail Management | Robert E. Patterson | Susan G. Malloy |
| One Post Office Square | George Putnam, III | Vice President and |
| Boston, MA 02109 | Robert L. Reynolds | Assistant Treasurer |
| | W. Thomas Stephens | |
| Custodian | | James P. Pappas |
| State Street Bank | Officers | Vice President |
| and Trust Company | Robert L. Reynolds | |
| | President | Mark C. Trenchard |
| Legal Counsel | | Vice President and |
| Ropes & Gray LLP | Jonathan S. Horwitz | BSA Compliance Officer |
| | Executive Vice President, | |
| | Principal Executive Officer, and | Judith Cohen |
| | Compliance Liaison | Vice President, Clerk, and |
| | | Associate Treasurer |
| | Steven D. Krichmar | |
| | Vice President and | Nancy E. Florek |
| | Principal Financial Officer | Vice President, Proxy |
| | | Manager, Assistant Clerk, and |
| | Robert T. Burns | Associate Treasurer |
| | Vice President and | |
| | Chief Legal Officer | |
This report is for the information of shareholders of George Putnam Balanced Fund. It may also be used as sales literature when preceded or accompanied by the current prospectus, the most recent copy of Putnam’s Quarterly Performance Summary, and Putnam’s Quarterly Ranking Summary. For more recent performance, please visit putnam.com. Investors should carefully consider the investment objectives, risks, charges, and expenses of a fund, which are described in its prospectus. For this and other information or to request a prospectus or summary prospectus, call 1-800-225-1581 toll free. Please read the prospectus carefully before investing. The fund’s Statement of Additional Information contains additional information about the fund’s Trustees and is available without charge upon request by calling 1-800-225-1581.
| |
| Item 3. Audit Committee Financial Expert: |
| |
| Item 4. Principal Accountant Fees and Services: |
| |
| Item 5. Audit Committee of Listed Registrants |
| |
| Item 6. Schedule of Investments: |
| |
| The registrant’s schedule of investments in unaffiliated issuers is included in the report to shareholders in Item 1 above. |
| |
| Item 7. Disclosure of Proxy Voting Policies and Procedures For Closed-End Management Investment Companies: |
| |
| Item 8. Portfolio Managers of Closed-End Investment Companies |
| |
| Item 9. Purchases of Equity Securities by Closed-End Management Investment Companies and Affiliated Purchasers: |
| |
| Item 10. Submission of Matters to a Vote of Security Holders: |
| |
| Item 11. Controls and Procedures: |
| |
| (a) The registrant’s principal executive officer and principal financial officer have concluded, based on their evaluation of the effectiveness of the design and operation of the registrant’s disclosure controls and procedures as of a date within 90 days of the filing date of this report, that the design and operation of such procedures are generally effective to provide reasonable assurance that information required to be disclosed by the registrant in this report is recorded, processed, summarized and reported within the time periods specified in the Commission’s rules and forms. |
| |
| (b) Changes in internal control over financial reporting: Not applicable |
| |
| (a)(2) Separate certifications for the principal executive officer and principal financial officer of the registrant as required by Rule 30a-2(a) under the Investment Company Act of 1940, as amended, are filed herewith. |
| |
| (b) The certifications required by Rule 30a-2(b) under the Investment Company Act of 1940, as amended, are filed herewith. |
| |
| The George Putnam Fund of Boston |
| |
| By (Signature and Title): |
| |
| /s/Janet C. Smith
Janet C. Smith
Principal Accounting Officer
|
| |
| Pursuant to the requirements of the Securities Exchange Act of 1934 and the Investment Company Act of 1940, this report has been signed below by the following persons on behalf of the registrant and in the capacities and on the dates indicated. |
| |
| By (Signature and Title): |
| |
| /s/Jonathan S. Horwitz
Jonathan S. Horwitz
Principal Executive Officer
|
| |
| By (Signature and Title): |
| |
| /s/Steven D. Krichmar
Steven D. Krichmar
Principal Financial Officer
|