| | |
| UNITED STATES
SECURITIES AND EXCHANGE COMMISSION |
| | |
| CERTIFIED SHAREHOLDER REPORT OF REGISTERED
MANAGEMENT INVESTMENT COMPANIES
|
| | |
| Investment Company Act file number: | (811-00058) |
| | |
| Exact name of registrant as specified in charter: | George Putnam Balanced Fund |
| | |
| Address of principal executive offices: | One Post Office Square, Boston, Massachusetts 02109 |
| | |
| Name and address of agent for service: | Robert T. Burns, Vice President
One Post Office Square
Boston, Massachusetts 02109 |
| | |
| Copy to: | Bryan Chegwidden, Esq.
Ropes & Gray LLP
1211 Avenue of the Americas
New York, New York 10036 |
| | |
| Registrant's telephone number, including area code: | (617) 292-1000 |
| | |
| Date of fiscal year end: | July 31, 2016 |
| | |
| Date of reporting period: | August 1, 2015 — January 31, 2016 |
| | |
|
Item 1. Report to Stockholders: | |
| | |
| The following is a copy of the report transmitted to stockholders pursuant to Rule 30e-1 under the Investment Company Act of 1940: | |

George Putnam
Balanced
Fund
Semiannual report
1 | 31 | 16
| | |
| Message from the Trustees | 1 | |
| |
| About the fund | 2 | |
| |
| Performance snapshot | 4 | |
| |
| Interview with your fund’s portfolio managers | 5 | |
| |
| Your fund’s performance | 12 | |
| |
| Your fund’s expenses | 14 | |
| |
| Terms and definitions | 16 | |
| |
| Other information for shareholders | 17 | |
| |
| Financial statements | 18 | |
| |
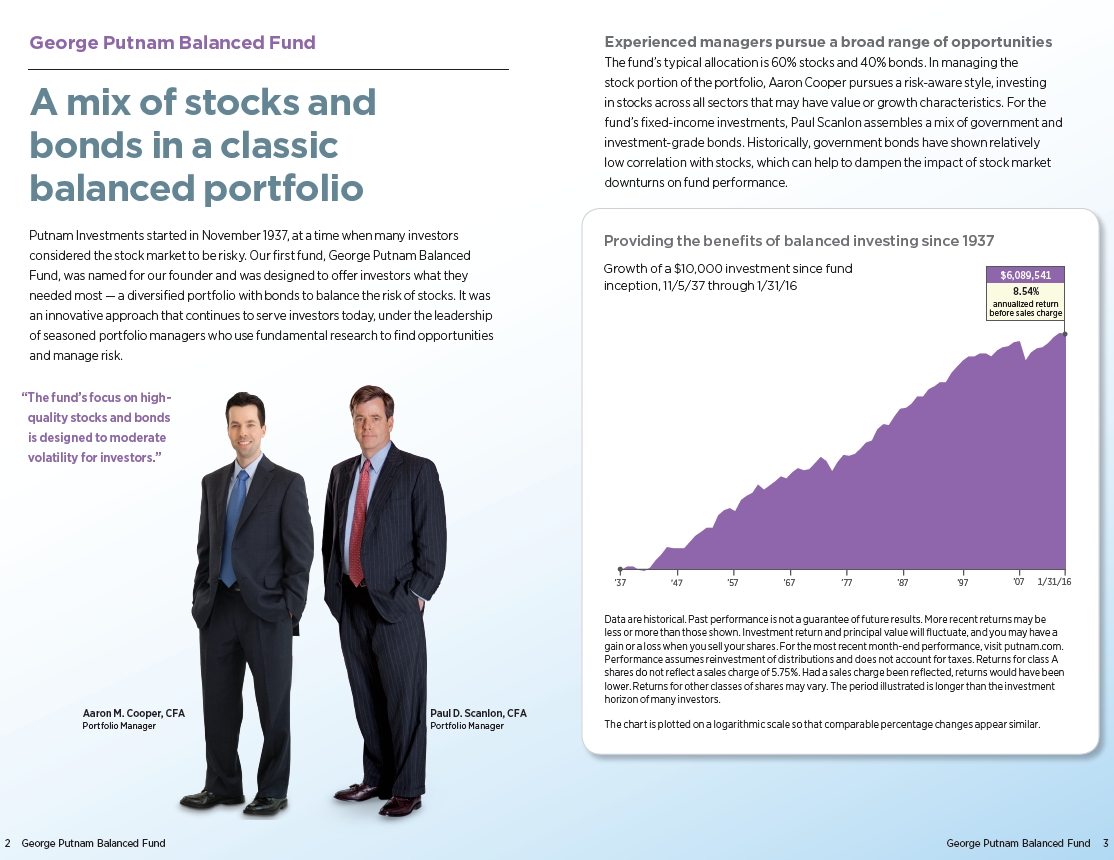
Consider these risks before investing: Stock and bond prices may fall or fail to rise over time for several reasons, including general financial market conditions, factors related to a specific issuer or industry and, with respect to bond prices, changing market perceptions of the risk of default and changes in government intervention. These factors may also lead to increased volatility and reduced liquidity in the bond markets. Growth stocks may be more susceptible to earnings disappointments, and value stocks may fail to rebound. Bond investments are subject to interest-rate risk (the risk of bond prices falling if interest rates rise) and credit risk (the risk of an issuer defaulting on interest or principal payments). Interest-rate risk is greater for longer-term bonds, and credit risk is greater for below-investment-grade bonds. Risks associated with derivatives include increased investment exposure (which may be considered leverage) and, in the case of over-the-counter instruments, the potential inability to terminate or sell derivatives positions and the potential failure of the other party to the instrument to meet its obligations. You can lose money by investing in the fund.
Message from the Trustees
Dear Fellow Shareholder:
In markets around the world, 2016 began with a sharp downturn, driven mainly by fears of weak global growth. Equity and fixed-income markets are again showing some of the negative trends seen during late summer of 2015. Generally speaking, only high-quality bonds appear to be weathering the storm. Of course, as in any downturn, attractive valuation opportunities may be emerging.
While economic growth may be muted in many parts of the world, notably in China and in emerging markets, the U.S. economy appears to be among the more resilient. The unemployment rate has fallen below 5%, with some signs of moderate wage growth and solid housing market conditions. Low energy prices, while a negative for energy companies, mean more money in consumers’ pockets, helping to buoy consumption. Moreover, divergent economic policies among central banks around the globe may create potential opportunities for capturing growth.
Although no one can predict where markets will head going forward, Putnam’s experienced portfolio managers are actively seeking fundamental insights to maneuver in all types of conditions, relying on a proprietary global research framework to help guide their investment decisions. The interview on the following pages provides an overview of your fund’s performance for the reporting period ended January 31, 2016, as well as an outlook for the coming months.
For questions on market turbulence, it may be helpful for you to consult your financial advisor to ensure that your portfolio is aligned with your investment goals, time horizon, and risk tolerance.
As always, thank you for investing with Putnam.

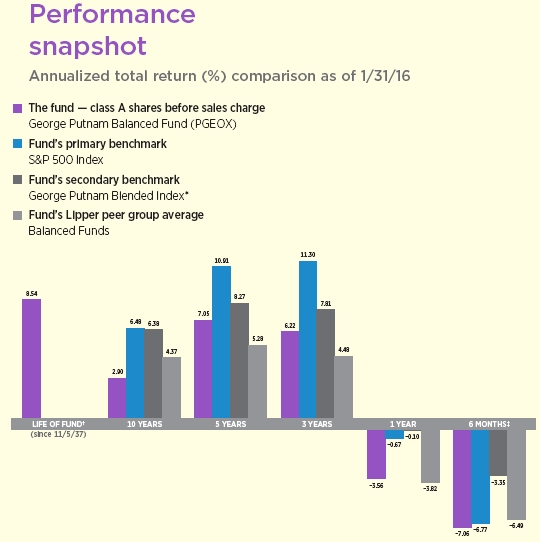
Current performance may be lower or higher than the quoted past performance, which cannot guarantee future results. Share price, principal value, and return will fluctuate, and you may have a gain or a loss when you sell your shares. Performance of class A shares assumes reinvestment of distributions and does not account for taxes. Fund returns in the bar chart do not reflect a sales charge of 5.75%; had they, returns would have been lower. See pages 3, 5, and 12–14 for additional performance information. For a portion of the periods, the fund had expense limitations, without which returns would have been lower. To obtain the most recent month-end performance, visit putnam.com.
* George Putnam Blended Index is an unmanaged index administered by Putnam Management, 60% of which is the S&P 500 Index and 40% of which is the Barclays U.S. Aggregate Bond Index.
† The fund’s benchmarks (S&P 500 Index and George Putnam Blended Index) were introduced on 12/31/69 and 12/31/78, respectively, and its Lipper group (Balanced Funds) was introduced on 12/31/59; they all post-date the inception of the fund’s class A shares.
‡ Returns for the six-month period are not annualized, but cumulative.
| |
| 4 | George Putnam Balanced Fund |
Interview with
your fund’s
portfolio managers

Market volatility rattled investors during the six months ended January 31, 2016. What were some of the most difficult aspects of navigating this market, and how did George Putnam Balanced Fund fare?
Aaron: Stock market volatility picked up at the start of the fund’s semiannual fiscal period due to a variety of global macroeconomic factors. The fourth calendar quarter of 2015 saw stocks bounce back from their third-quarter lows, but a variety of headwinds — from China’s economic weakness to depressed commodity markets — made for a relatively difficult backdrop for investors. This situation worsened at the start of 2016, as January opened with extreme volatility, primarily as concerns over China led investors to wonder whether the risks of a global recession were increasing.
For the period, the fund slightly underperformed its all-stock primary benchmark, the S&P 500 Index, and trailed its blended stock/ bond benchmark. The key factor driving the underperformance was disappointing security selection results in the equity portion of the portfolio, particularly in the energy and consumer sectors.
Paul: The environment was challenging for the bond market, as well. Although bond prices bounced back from a volatile third calendar quarter in 2015, investors became increasingly risk averse. The anticipation of
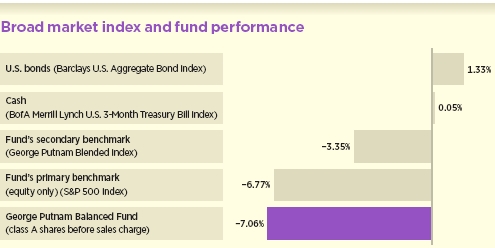
This comparison shows your fund’s performance in the context of broad market indexes for the six months ended 1/31/16. See pages 3, 4, and 12–14 for additional fund performance information. Index descriptions can be found on page 16.
| |
| George Putnam Balanced Fund | 5 |
the Federal Reserve’s interest-rate hike had a significant effect on market sentiment. While most investors expected an increase, there was still uncertainty for much of the period about whether the Fed would opt to wait until 2016 to tighten monetary policy.
Overall, higher-quality government and corporate bonds — which make up the core of the fund’s bond portfolio — faced fewer challenges, while at times, riskier assets experienced tumultuous conditions. In the end, the bond market was 1.33% higher on January 31, 2016, than where it stood on July 31, 2015, based on the Barclays U.S. Aggregate Bond Index.
With energy, did you expect some stabilization or reversion in oil and gas prices?
Aaron: During the period, we did become slightly more bullish on energy stocks, though it appears we did so too soon. Although energy sector stock selection hurt relative results, we maintain our conviction in companies that we believe are low-cost energy players with strong balance sheets. In our view, these companies are well suited to survive the downturn in energy prices and well positioned to thrive if stabilization and rebound occur in oil and gas markets.
Paul: I would also note that within the energy sector, exploration and production companies and the businesses that service them have been the most affected by lower oil prices. Defaults in this group have risen among higher-cost producers with strained balance sheets that are insufficiently hedged. However, there are many other types of energy concerns, such as refiners and pipeline companies, that are somewhat insulated from the effects of lower oil and commodity prices because the economics of their businesses are driven by other factors. So the
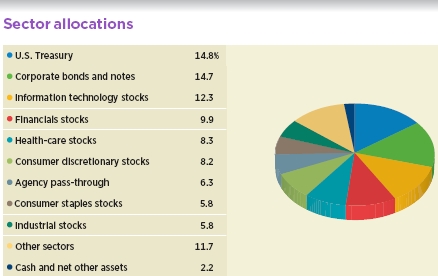
Allocations are shown as a percentage of the fund’s net assets as of 1/31/16. Cash and net other assets, if any, represent the market value weights of cash, derivatives, short-term securities, and other unclassified assets in the portfolio. Summary information may differ from the portfolio schedule included in the financial statements due to the inclusion of derivative securities, any interest accruals, the exclusion of as-of trades, if any, and the use of different classifications of securities for presentation purposes. Holdings and allocations may vary over time.
| |
| 6 | George Putnam Balanced Fund |
risk of default among these types of energy companies remains low, in our view.
How did China’s economic situation continue to affect global markets?
Aaron: China’s economic slowdown and the buildup of leverage in the financial system there intensified in the third and fourth calendar quarters of 2015, and we think China may pose even bigger risks to the global economy and markets as time passes. Some of the Chinese government’s actions to stabilize markets have been unsuccessful, which calls into question the government’s ability to manage through an economic crisis. In our estimation, economic signals from China are relatively weaker, and multinational companies’ businesses in China and other emerging markets have generally been weak as well.
Paul: Economic weakness in China combined with other factors to make bond investors jittery in the final weeks of 2015 and through January 2016. One of these factors was the decision by the Fed to raise the federal funds rate. As had been widely expected, the Fed took the first step on the path of gradual normalization of interest rates and raised its short-term benchmark rate to a range between 0.25% and 0.50% on December 16. Investors initially cheered the rate hike, which reflected the Fed’s confidence in the U.S. economy. However, the final weeks of 2015 saw increased volatility and a “risk-off” flight to safe havens, as investors considered the slump in commodity prices, troubles in the
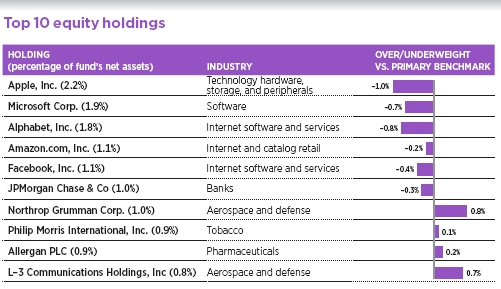
This table shows the fund’s top 10 holdings by percentage of the fund’s net assets as of 1/31/16. Short-term investments and derivatives, if any, are excluded. Holdings may vary over time.
| |
| George Putnam Balanced Fund | 7 |
high-yield market, continued weakness in China and emerging markets, and the future pace of Fed rate increases.
Aaron, what is your take on recent earnings results and near-term earnings potential? Are companies still in good health, in your view?
Aaron: Looking back over 2015, earnings growth was generally flat. However, when we exclude the energy sector, earnings growth was closer to the mid-single digits, which, in our view, is an indicator of some strength. Headwinds developed during the year, including emerging-market weakness as well as a tightening of credit for companies that rely on the securities markets to fund their growth, but this did not derail the earnings outlook for everyone.
Looking forward, we remain positive about e-commerce and Internet stocks, in particular. In health care, we are on the lookout for incremental pricing risks driven by political and regulatory questions. In energy, we are more positive — and perhaps we are contrarian in this view. It seems to us that the energy market is self-correcting over time. As the supply side responds to oversupplied conditions and demand picks up, commodity prices tend to increase. In financials, we are also relatively positive. The early stage of Federal Reserve interest-rate hikes, for example, should, in our view, help set positive conditions for most of the sector, but particularly for banks, brokers, and asset managers.
What were some of the largest detractors from the fund’s relative return for the period?
Aaron: In light of the challenging environment for commodities such as oil and gas, the stocks of natural resource-related companies tended to suffer during the period. This was the case for several of the fund’s holdings,
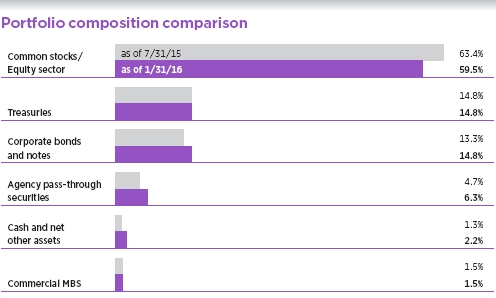
This chart shows how the fund’s top weightings have changed over the past six months. Allocations are shown as a percentage of the fund’s net assets. Current period summary information may differ from the portfolio schedule included in the financial statements due to the inclusion of derivative securities, any interest accruals, the exclusion of as-of trades, if any, and the use of different classifications of securities for presentation purposes. Holdings and allocations may vary over time.
| |
| 8 | George Putnam Balanced Fund |
including the stock of oil and gas exploration and production companies Anadarko and Genel Energy, and the electricity generation and distribution company NRG Energy.
In the case of Genel, which has operations in Iraq, our thesis was that the company owned and operated substantial oil and gas fields at the very low end of the cost curve, so it could generate profits and cash flow even at low oil prices. Notwithstanding this, its shares were not immune to the rapid and substantial drop in the price of crude oil. Given that the company operates in Iraqi Kurdistan, it also faces various political risks. Indeed, factors associated with these risks recently appear to have compromised the company’s ability to invest in its assets, leading to production declines and the potential for write-downs. As we have recognized that our original thesis was undermined by these developments, we have reduced our holdings of the stock.
Bombardier, an out-of-benchmark holding, was also a large detractor from the fund’s relative performance. This company is a leading manufacturer of aircraft and trains. In early 2015, Bombardier announced the need to raise $2 billion to cover the cost of a new fuel-efficient passenger jet airliner, the CSeries, which had been delayed for two years and was over budget. The company also announced the replacement of its chief executive officer and suspended its dividend. We sensed positive change following these financing and leadership announcements, but we may have been too early.
Which strategies or holdings contributed to the fund’s relative return?
Aaron: Northrop Grumman, which is one of the largest defense conglomerates in the world, was a top contributor for the period. The company, which specializes in unmanned aerial vehicle manufacturing and defense systems, continued to win franchise programs and saw higher-than-expected earnings, which led to share price appreciation. L-3 Communications Holdings also contributed. This aerospace contractor saw solid earnings and penetrated new markets during the period. In addition, the company strengthened its communication systems segment with an acquisition and returned cash to shareholders through share buybacks and dividends, all of which acted as tailwinds for the stock.
Ctrip, China’s largest online travel agency, also contributed positively to relative returns. Although, in our view, the economic slowdown in China is a serious risk for the global economy, we believe there are pockets of opportunity there, and Ctrip is a good example, in our view. As the middle class expands in China, an increasing number of consumers have sufficient disposable income to spend on travel, particularly within Mainland China, which is where Ctrip focuses its efforts. Companies like Ctrip are reaping the rewards of this development in the domestic Chinese economy, in terms of better earnings and improved long-term growth potential.
After the market’s generally flat performance in 2015 and the volatile market decline in January 2016, are you concerned that we are entering bear market territory?
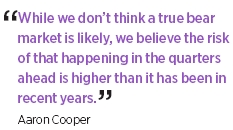
Aaron: While we don’t think a true bear market is likely, we believe the risk of that happening in the quarters ahead is higher than it has been in recent years. We believe there are perhaps a couple of years left in the current economic expansion for the United States; accordingly, looking forward into 2016, we think it is plausible that markets will see low- to mid-single-digit earnings growth.
We believe this is a realistic and positive view of future earnings growth, and on the basis of this perspective, we think the market could achieve attractive positive returns. We believe there are important risks associated with this view. Now that the Fed has embarked on its rate-raising campaign, we
| |
| George Putnam Balanced Fund | 9 |
think interest rates may begin rising across different parts of the yield curve, meaning that borrowing costs could begin to go up for companies. In addition, the recently booming M&A [mergers and acquisitions] cycle may be past its peak. For 2016, it remains to be seen how much of a headwind this becomes, but we believe it is a sign of the maturity of the economic cycle — as well as a signal of the risk that the cycle could end prematurely.
Paul: We continue to think corporate fundamentals remain solid. Investment-grade corporate balance sheets and profit growth may have peaked, but there does not seem to have been a major deterioration in credit, in our view. Leverage within investment-grade corporates is rising, but it is mostly increasing at higher-quality companies and in specific sectors.
On the whole, we think the stock and bond markets will be supported in the months ahead by continued economic recovery in the United States. We expect that the U.S. economy will grow around 2% over the course of 2016, and that the Fed will continue to raise interest rates during the year. We believe the moves will occur at a slower pace than in past tightening cycles, however, and that the magnitude of any tightening will depend on the factors that the Fed has been monitoring, such as employment, inflation, dollar strength, oil prices, and financial market volatility.
Thank you, Aaron and Paul, for your time and insights today.
The views expressed in this report are exclusively those of Putnam Management and are subject to change. They are not meant as investment advice.
Please note that the holdings discussed in this report may not have been held by the fund for the entire period. Portfolio composition is subject to review in accordance with the fund’s investment strategy and may vary in the future. Current and future portfolio holdings are subject to risk.
Of special interest
Effective November 1, 2015, George Putnam Balanced Fund increased its quarterly distribution rate to $0.052 from $0.045, as a result of higher levels of income earned by the portfolio.
Portfolio Manager Aaron M. Cooper, CFA, is Director of Global Equity Research at Putnam. He holds an A.B. from Harvard University. Aaron joined Putnam in 2011 and has been in the investment industry since 1999.
Portfolio Manager Paul D. Scanlon, CFA, is Co-Head of Fixed Income at Putnam. He has an M.B.A. from the University of Chicago Booth School of Business and a B.A. from Colgate University. Paul joined Putnam in 1999 and has been in the investment industry since 1986.
|
| 10 George Putnam Balanced Fund |
IN THE NEWS
The world may be awash in more oil than previously thought — and low oil prices may remain with us for the near term, according to the International Energy Agency (IEA). In January, the per-barrel price of crude dropped below $30, hitting a 12-year low. As Organization of Petroleum Exporting Countries (OPEC) members Iran and Iraq boost oil production and global demand growth slows, supply may exceed consumption by an average of 1.75 million barrels a day in the first six months of 2016, compared with the IEA’s estimate in January of 1.5 million barrels per day. The excess in supply could swell even further if OPEC adds output, the Paris-based IEA noted in its February market report. In January, Iran ramped up oil production following the removal of international oil sanctions, Iraqi volumes notched a record high, and Saudi Arabia, OPEC’s largest producer, “turned up the taps,” the IEA said. For 2016, the IEA has lowered its global oil demand estimates by 100,000 barrels per day, leaving the level of growth for this year unchanged at 1.2 million barrels per day.
| |
| George Putnam Balanced Fund | 11 |
Your fund’s performance
This section shows your fund’s performance, price, and distribution information for periods ended January 31, 2016, the end of the first half of its current fiscal year. In accordance with regulatory requirements for mutual funds, we also include performance information as of the most recent calendar quarter-end and expense information taken from the fund’s current prospectus. Performance should always be considered in light of a fund’s investment strategy. Data represent past performance. Past performance does not guarantee future results. More recent returns may be less or more than those shown. Investment return and principal value will fluctuate, and you may have a gain or a loss when you sell your shares. Performance information does not reflect any deduction for taxes a shareholder may owe on fund distributions or on the redemption of fund shares. For the most recent month-end performance, please visit the Individual Investors section at putnam.com or call Putnam at 1-800-225-1581. Class R, R5, R6, and Y shares are not available to all investors. See the Terms and Definitions section in this report for definitions of the share classes offered by your fund.
Fund performance Total return for periods ended 1/31/16
| | | | | | | | | | | | |
| | Class A | Class B | Class C | Class M | Class R | Class R5 | Class R6 | Class Y |
| (inception dates) | (11/5/37) | (4/27/92) | (7/26/99) | (12/1/94) | (1/21/03) | (12/2/13) | (12/2/13) | (3/31/94) |
|
| | Before | After | | | | | Before | After | Net | Net | Net | Net |
| | sales | sales | Before | After | Before | After | sales | sales | asset | asset | asset | asset |
| | charge | charge | CDSC | CDSC | CDSC | CDSC | charge | charge | value | value | value | value |
|
| Annual average | | | | | | | | | | | | |
| (life of fund) | 8.54% | 8.46% | 8.43% | 8.43% | 7.72% | 7.72% | 7.81% | 7.77% | 8.27% | 8.62% | 8.62% | 8.62% |
|
| 10 years | 33.15 | 25.50 | 25.23 | 25.23 | 23.50 | 23.50 | 26.65 | 22.21 | 29.90 | 36.59 | 36.87 | 36.49 |
| Annual average | 2.90 | 2.30 | 2.28 | 2.28 | 2.13 | 2.13 | 2.39 | 2.03 | 2.65 | 3.17 | 3.19 | 3.16 |
|
| 5 years | 40.62 | 32.53 | 35.33 | 33.33 | 35.35 | 35.35 | 37.06 | 32.27 | 38.71 | 42.31 | 42.61 | 42.22 |
| Annual average | 7.05 | 5.79 | 6.24 | 5.92 | 6.24 | 6.24 | 6.51 | 5.75 | 6.76 | 7.31 | 7.36 | 7.30 |
|
| 3 years | 19.85 | 12.96 | 17.18 | 14.18 | 17.12 | 17.12 | 18.06 | 13.93 | 18.88 | 20.84 | 21.10 | 20.76 |
| Annual average | 6.22 | 4.15 | 5.43 | 4.52 | 5.41 | 5.41 | 5.69 | 4.44 | 5.93 | 6.51 | 6.59 | 6.49 |
|
| 1 year | –3.56 | –9.10 | –4.27 | –9.04 | –4.33 | –5.28 | –4.08 | –7.44 | –3.87 | –3.29 | –3.19 | –3.36 |
|
| 6 months | –7.06 | –12.41 | –7.39 | –12.01 | –7.45 | –8.37 | –7.33 | –10.58 | –7.22 | –6.92 | –6.87 | –6.98 |
|
Current performance may be lower or higher than the quoted past performance, which cannot guarantee future results. After-sales-charge returns for class A and M shares reflect the deduction of the maximum 5.75% and 3.50% sales charge, respectively, levied at the time of purchase. Class B share returns after contingent deferred sales charge (CDSC) reflect the applicable CDSC, which is 5% in the first year, declining over time to 1% in the sixth year, and is eliminated thereafter. Class C share returns after CDSC reflect a 1% CDSC for the first year that is eliminated thereafter. Class R, R5, R6, and Y shares have no initial sales charge or CDSC. Performance for class B, C, M, R, and Y shares before their inception is derived from the historical performance of class A shares, adjusted for the applicable sales charge (or CDSC) and the higher operating expenses for such shares, except for class Y shares, for which 12b-1 fees are not applicable. Performance for class R5 and R6 shares prior to their inception is derived from the historical performance of class Y shares and has not been adjusted for the lower investor servicing fees applicable to class R5 and R6 shares; had it, returns would have been higher.
For a portion of the periods, the fund had expense limitations, without which returns would have been lower.
Class B share performance reflects conversion to class A shares after eight years.
|
| 12 George Putnam Balanced Fund |
Comparative index returns For periods ended 1/31/16
| | | | |
| | | Barclays | | Lipper |
| | | U.S. Aggregate | George Putnam | Balanced Funds |
| | S&P 500 Index | Bond Index | Blended Index† | category average‡ |
|
| Annual average (life of fund) | —* | —* | —* | —* |
|
| 10 years | 87.41% | 57.65% | 85.58% | 54.32% |
| Annual average | 6.48 | 4.66 | 6.38 | 4.37 |
|
| 5 years | 67.80 | 18.80 | 48.77 | 29.68 |
| Annual average | 10.91 | 3.51 | 8.27 | 5.28 |
|
| 3 years | 37.88 | 6.57 | 25.31 | 14.19 |
| Annual average | 11.30 | 2.14 | 7.81 | 4.48 |
|
| 1 year | –0.67 | –0.16 | –0.10 | –3.82 |
|
| 6 months | –6.77 | 1.33 | –3.35 | –6.49 |
|
Index and Lipper results should be compared with fund performance before sales charge, before CDSC, or at net asset value.
* The fund’s benchmarks (S&P 500 Index and George Putnam Blended Index) were introduced on 12/31/69 and 12/31/78, respectively, the Barclays U.S. Aggregate Bond Index was introduced on 12/31/75, and the fund’s Lipper group (Balanced Funds) was introduced on 12/31/59; they all post-date the inception of the fund’s class A shares.
† George Putnam Blended Index is an unmanaged index administered by Putnam Management, 60% of which is the S&P 500 Index and 40% of which is the Barclays U.S. Aggregate Bond Index.
‡ Over the 6-month, 1-year, 3-year, 5-year, and 10-year periods ended 1/31/16, there were 652, 637, 595, 545, and 393 funds, respectively, in this Lipper category.
Fund performance as of most recent calendar quarter
Total return for periods ended 12/31/15
| | | | | | | | | | | | |
| | Class A | Class B | Class C | Class M | Class R | Class R5 | Class R6 | Class Y |
| (inception dates) | (11/5/37) | (4/27/92) | (7/26/99) | (12/1/94) | (1/21/03) | (12/2/13) | (12/2/13) | (3/31/94) |
|
| | Before | After | | | | | Before | After | Net | Net | Net | Net |
| | sales | sales | Before | After | Before | After | sales | sales | asset | asset | asset | asset |
| | charge | charge | CDSC | CDSC | CDSC | CDSC | charge | charge | value | value | value | value |
|
| Annual average | | | | | | | | | | | | |
| (life of fund) | 8.60% | 8.52% | 8.49% | 8.49% | 7.79% | 7.79% | 7.88% | 7.83% | 8.33% | 8.68% | 8.68% | 8.68% |
|
| 10 years | 40.41 | 32.34 | 32.04 | 32.04 | 30.37 | 30.37 | 33.65 | 28.97 | 37.08 | 44.00 | 44.31 | 44.00 |
| Annual average | 3.45 | 2.84 | 2.82 | 2.82 | 2.69 | 2.69 | 2.94 | 2.58 | 3.20 | 3.71 | 3.74 | 3.71 |
|
| 5 years | 48.49 | 39.95 | 42.99 | 40.99 | 43.04 | 43.04 | 44.81 | 39.74 | 46.59 | 50.37 | 50.69 | 50.36 |
| Annual average | 8.23 | 6.95 | 7.41 | 7.11 | 7.42 | 7.42 | 7.69 | 6.92 | 7.95 | 8.50 | 8.55 | 8.50 |
|
| 3 years | 28.66 | 21.27 | 25.80 | 22.80 | 25.85 | 25.85 | 26.84 | 22.40 | 27.63 | 29.70 | 29.97 | 29.69 |
| Annual average | 8.76 | 6.64 | 7.95 | 7.09 | 7.97 | 7.97 | 8.25 | 6.97 | 8.47 | 9.05 | 9.13 | 9.05 |
|
| 1 year | –1.11 | –6.79 | –1.86 | –6.75 | –1.81 | –2.79 | –1.55 | –5.00 | –1.36 | –0.84 | –0.74 | –0.85 |
|
| 6 months | –2.37 | –7.98 | –2.77 | –7.62 | –2.73 | –3.70 | –2.59 | –5.99 | –2.51 | –2.23 | –2.24 | –2.24 |
|
See the discussion following the fund performance table on page 12 for information about the calculation of fund performance.
|
| George Putnam Balanced Fund 13 |
Fund price and distribution information For the six-month period ended 1/31/16
| | | | | | | | | | |
| Distributions | Class A | Class B | Class C | Class M | Class R | Class R5 | Class R6 | Class Y |
|
| Number | 2 | 2 | 2 | 2 | 2 | 2 | 2 | 2 |
|
| Income | $0.097 | $0.034 | $0.038 | $0.056 | $0.064 | $0.119 | $0.128 | $0.118 |
|
| Capital gains | — | — | — | — | — | — | — | — |
|
| Total | $0.097 | $0.034 | $0.038 | $0.056 | $0.064 | $0.119 | $0.128 | $0.118 |
|
| | Before | After | Net | Net | Before | After | Net | Net | Net | Net |
| | sales | sales | asset | asset | sales | sales | asset | asset | asset | asset |
| Share value | charge | charge | value | value | charge | charge | value | value | value | value |
|
| 7/31/15 | $17.22 | $18.27 | $17.02 | $17.10 | $16.99 | $17.61 | $17.16 | $17.28 | $17.28 | $17.28 |
|
| 1/31/16 | 15.91 | 16.88 | 15.73 | 15.79 | 15.69 | 16.26 | 15.86 | 15.97 | 15.97 | 15.96 |
|
| | Before | After | Net | Net | Before | After | Net | Net | Net | Net |
| Current rate | sales | sales | asset | asset | sales | sales | asset | asset | asset | asset |
| (end of period) | charge | charge | value | value | charge | charge | value | value | value | value |
|
| Current | | | | | | | | | | |
| dividend rate 1 | 1.31% | 1.23% | 0.53% | 0.61% | 0.82% | 0.79% | 0.73% | 1.58% | 1.70% | 1.55% |
|
| Current 30-day | | | | | | | | | | |
| SEC yield 2 | N/A | 1.16 | 0.49 | 0.49 | N/A | 0.72 | 0.97 | 1.49 | 1.59 | 1.48 |
|
The classification of distributions, if any, is an estimate. Before-sales-charge share value and current dividend rate for class A and M shares, if applicable, do not take into account any sales charge levied at the time of purchase. After-sales-charge share value, current dividend rate, and current 30-day SEC yield, if applicable, are calculated assuming that the maximum sales charge (5.75% for class A shares and 3.50% for class M shares) was levied at the time of purchase. Final distribution information will appear on your year-end tax forms.
1 Most recent distribution, including any return of capital and excluding capital gains, annualized and divided by share price before or after sales charge at period-end.
2 Based only on investment income and calculated using the maximum offering price for each share class, in accordance with SEC guidelines.
Your fund’s expenses
As a mutual fund investor, you pay ongoing expenses, such as management fees, distribution fees (12b-1 fees), and other expenses. Using the following information, you can estimate how these expenses affect your investment and compare them with the expenses of other funds. You may also pay one-time transaction expenses, including sales charges (loads) and redemption fees, which are not shown in this section and would have resulted in higher total expenses. For more information, see your fund’s prospectus or talk to your financial representative.
Expense ratios
| | | | | | | | |
| | Class A | Class B | Class C | Class M | Class R | Class R5 | Class R6 | Class Y |
|
| Total annual operating expenses for | | | | | | | | |
| the fiscal year ended 7/31/15 | 0.97% | 1.72% | 1.72% | 1.47% | 1.22% | 0.72% | 0.62% | 0.72% |
|
| Annualized expense ratio for the | | | | | | | | |
| six-month period ended 1/31/16 | 0.99% | 1.74% | 1.74% | 1.49% | 1.24% | 0.73% | 0.63% | 0.74% |
|
Fiscal-year expense information in this table is taken from the most recent prospectus, is subject to change, and may differ from that shown for the annualized expense ratio and in the financial highlights of this report.Expenses are shown as a percentage of average net assets.
|
| 14 George Putnam Balanced Fund |
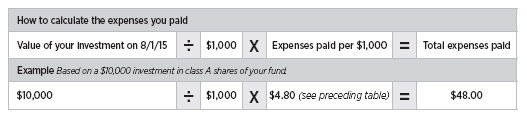
Expenses per $1,000
The following table shows the expenses you would have paid on a $1,000 investment in each class of the fund from 8/1/15 to 1/31/16. It also shows how much a $1,000 investment would be worth at the close of the period, assuming actual returns and expenses.
| | | | | | | | |
| | Class A | Class B | Class C | Class M | Class R | Class R5 | Class R6 | Class Y |
|
| Expenses paid per $1,000*† | $4.80 | $8.42 | $8.42 | $7.22 | $6.01 | $3.54 | $3.06 | $3.59 |
|
| Ending value (after expenses) | $929.40 | $926.10 | $925.50 | $926.70 | $927.80 | $930.80 | $931.30 | $930.20 |
|
* Expenses for each share class are calculated using the fund’s annualized expense ratio for each class, which represents the ongoing expenses as a percentage of average net assets for the six months ended 1/31/16. The expense ratio may differ for each share class.
† Expenses are calculated by multiplying the expense ratio by the average account value for the period; then multiplying the result by the number of days in the period; and then dividing that result by the number of days in the year.
Estimate the expenses you paid
To estimate the ongoing expenses you paid for the six months ended 1/31/16, use the following calculation method. To find the value of your investment on 8/1/15, call Putnam at 1-800-225-1581.
Compare expenses using the SEC’s method
The Securities and Exchange Commission (SEC) has established guidelines to help investors assess fund expenses. Per these guidelines, the following table shows your fund’s expenses based on a $1,000 investment, assuming a hypothetical 5% annualized return . You can use this information to compare the ongoing expenses (but not transaction expenses or total costs) of investing in the fund with those of other funds. All mutual fund shareholder reports will provide this information to help you make this comparison. Please note that you cannot use this information to estimate your actual ending account balance and expenses paid during the period.
| | | | | | | | |
| | Class A | Class B | Class C | Class M | Class R | Class R5 | Class R6 | Class Y |
|
| Expenses paid per $1,000*† | $5.03 | $8.82 | $8.82 | $7.56 | $6.29 | $3.71 | $3.20 | $3.76 |
|
| Ending value (after expenses) | $1,020.16 | $1,016.39 | $1,016.39 | $1,017.65 | $1,018.90 | $1,021.47 | $1,021.97 | $1,021.42 |
|
* Expenses for each share class are calculated using the fund’s annualized expense ratio for each class, which represents the ongoing expenses as a percentage of average net assets for the six months ended 1/31/16. The expense ratio may differ for each share class.
† Expenses are calculated by multiplying the expense ratio by the average account value for the six-month period; then multiplying the result by the number of days in the six-month period; and then dividing that result by the number of days in the year.
|
| George Putnam Balanced Fund 15 |
Terms and definitions
Important terms
Total return shows how the value of the fund’s shares changed over time, assuming you held the shares through the entire period and reinvested all distributions in the fund.
Before sales charge, or net asset value , is the price, or value, of one share of a mutual fund, without a sales charge. Before-sales-charge figures fluctuate with market conditions, and are calculated by dividing the net assets of each class of shares by the number of outstanding shares in the class.
After sales charge is the price of a mutual fund share plus the maximum sales charge levied at the time of purchase. After-sales-charge performance figures shown here assume the 5.75% maximum sales charge for class A shares and 3.50% for class M shares.
Contingent deferred sales charge (CDSC) is generally a charge applied at the time of the redemption of class B or C shares and assumes redemption at the end of the period. Your fund’s class B CDSC declines over time from a 5% maximum during the first year to 1% during the sixth year. After the sixth year, the CDSC no longer applies. The CDSC for class C shares is 1% for one year after purchase.
Current rate is the annual rate of return earned from dividends or interest of an investment. Current rate is expressed as a percentage of the price of a security, fund share, or principal investment.
Share classes
Class A shares are generally subject to an initial sales charge and no CDSC (except on certain redemptions of shares bought without an initial sales charge).
Class B shares are not subject to an initial sales charge and may be subject to a CDSC.
Class C shares are not subject to an initial sales charge and are subject to a CDSC only if the shares are redeemed during the first year.
Class M shares have a lower initial sales charge and a higher 12b-1 fee than class A shares and no CDSC.
Class R shares are not subject to an initial sales charge or CDSC and are available only to employer-sponsored retirement plans.
Class R5 and R6 shares are not subject to an initial sales charge or CDSC, and carry no 12b-1 fee. They are only available to employer-sponsored retirement plans.
Class Y shares are not subject to an initial sales charge or CDSC, and carry no 12b-1 fee. They are generally only available to corporate and institutional clients and clients in other approved programs.
Comparative indexes
Barclays U.S. Aggregate Bond Index is an unmanaged index of U.S. investment-grade fixed-income securities.
BofA Merrill Lynch U.S. 3-Month Treasury Bill Index is an unmanaged index that seeks to measure the performance of U.S. Treasury bills available in the marketplace.
George Putnam Blended Index is an unmanaged index administered by Putnam Management, LLC, 60% of which is the S&P 500 Index and 40% of which is the Barclays U.S. Aggregate Bond Index.
S&P 500 Index is an unmanaged index of common stock performance.
Indexes assume reinvestment of all distributions and do not account for fees. Securities and performance of a fund and an index will differ. You cannot invest directly in an index.
Lipper is a third-party industry-ranking entity that ranks mutual funds. Its rankings do not reflect sales charges. Lipper rankings are based
|
| 16 George Putnam Balanced Fund |
on total return at net asset value relative to other funds that have similar current investment styles or objectives as determined by Lipper. Lipper may change a fund’s category assignment at its discretion. Lipper category averages reflect performance trends for funds within a category.
Other information for shareholders
Important notice regarding delivery of shareholder documents
In accordance with Securities and Exchange Commission (SEC) regulations, Putnam sends a single copy of annual and semiannual shareholder reports, prospectuses, and proxy statements to Putnam shareholders who share the same address, unless a shareholder requests otherwise. If you prefer to receive your own copy of these documents, please call Putnam at 1-800-225-1581, and Putnam will begin sending individual copies within 30 days.
Proxy voting
Putnam is committed to managing our mutual funds in the best interests of our shareholders. The Putnam funds’ proxy voting guidelines and procedures, as well as information regarding how your fund voted proxies relating to portfolio securities during the 12-month period ended June 30, 2015, are available in the Individual Investors section of putnam.com, and on the SEC’s website, www.sec.gov. If you have questions about finding forms on the SEC’s website, you may call the SEC at 1-800-SEC-0330. You may also obtain the Putnam funds’ proxy voting guidelines and procedures at no charge by calling Putnam’s Shareholder Services at 1-800-225-1581.
Fund portfolio holdings
The fund will file a complete schedule of its portfolio holdings with the SEC for the first and third quarters of each fiscal year on Form N-Q. Shareholders may obtain the fund’s Form N-Q on the SEC’s website at www.sec.gov. In addition, the fund’s Form N-Q may be reviewed and copied at the SEC’s Public Reference Room in Washington, D.C. You may call the SEC at 1-800-SEC-0330 for information about the SEC’s website or the operation of the Public Reference Room.
Trustee and employee fund ownership
Putnam employees and members of the Board of Trustees place their faith, confidence, and, most importantly, investment dollars in Putnam mutual funds. As of January 31, 2016, Putnam employees had approximately $463,000,000 and the Trustees had approximately $124,000,000 invested in Putnam mutual funds. These amounts include investments by the Trustees’ and employees’ immediate family members as well as investments through retirement and deferred compensation plans.
|
| George Putnam Balanced Fund 17 |
Financial statements
A guide to financial statements
These sections of the report, as well as the accompanying Notes, constitute the fund’s financial statements.
The fund’s portfolio lists all the fund’s investments and their values as of the last day of the reporting period. Holdings are organized by asset type and industry sector, country, or state to show areas of concentration and diversification.
Statement of assets and liabilities shows how the fund’s net assets and share price are determined. All investment and non-investment assets are added together. Any unpaid expenses and other liabilities are subtracted from this total. The result is divided by the number of shares to determine the net asset value per share, which is calculated separately for each class of shares. (For funds with preferred shares, the amount subtracted from total assets includes the liquidation preference of preferred shares.)
Statement of operations shows the fund’s net investment gain or loss. This is done by first adding up all the fund’s earnings — from dividends and interest income — and subtracting its operating expenses to determine net investment income (or loss). Then, any net gain or loss the fund realized on the sales of its holdings — as well as any unrealized gains or losses over the period — is added to or subtracted from the net investment result to determine the fund’s net gain or loss for the fiscal period.
Statement of changes in net assets shows how the fund’s net assets were affected by the fund’s net investment gain or loss, by distributions to shareholders, and by changes in the number of the fund’s shares. It lists distributions and their sources (net investment income or realized capital gains) over the current reporting period and the most recent fiscal year-end. The distributions listed here may not match the sources listed in the Statement of operations because the distributions are determined on a tax basis and may be paid in a different period from the one in which they were earned. Dividend sources are estimated at the time of declaration. Actual results may vary. Any non-taxable return of capital cannot be determined until final tax calculations are completed after the end of the fund’s fiscal year.
Financial highlights provide an overview of the fund’s investment results, per-share distributions, expense ratios, net investment income ratios, and portfolio turnover in one summary table, reflecting the five most recent reporting periods. In a semiannual report, the highlights table also includes the current reporting period.
|
| 18 George Putnam Balanced Fund |
The fund’s portfolio 1/31/16 (Unaudited)
| | |
| COMMON STOCKS (59.8%)* | Shares | Value |
|
| Basic materials (2.6%) | | |
| Air Products & Chemicals, Inc. | 12,801 | $1,622,015 |
|
| Albemarle Corp. | 7,186 | 378,271 |
|
| Alcoa, Inc. | 37,645 | 274,432 |
|
| Axalta Coating Systems, Ltd. † | 56,452 | 1,344,122 |
|
| Axiall Corp. | 12,302 | 220,575 |
|
| Barrick Gold Corp. (Canada) | 16,187 | 160,413 |
|
| CF Industries Holdings, Inc. | 49,941 | 1,498,230 |
|
| Dow Chemical Co. (The) | 86,256 | 3,622,752 |
|
| E.I. du Pont de Nemours & Co. | 66,334 | 3,499,782 |
|
| Fortune Brands Home & Security, Inc. | 36,624 | 1,779,560 |
|
| Martin Marietta Materials, Inc. | 3,150 | 395,577 |
|
| Newmont Mining Corp. | 32,376 | 646,225 |
|
| Nucor Corp. | 16,981 | 663,448 |
|
| PPG Industries, Inc. | 29,806 | 2,835,147 |
|
| Praxair, Inc. | 13,610 | 1,361,000 |
|
| Sealed Air Corp. | 34,853 | 1,412,592 |
|
| Sherwin-Williams Co. (The) | 21,192 | 5,418,147 |
|
| Smurfit Kappa Group PLC (Ireland) | 24,209 | 525,507 |
|
| Steel Dynamics, Inc. | 6,389 | 117,238 |
|
| Symrise AG (Germany) | 47,400 | 3,058,323 |
|
| 30,833,356 |
| Capital goods (2.7%) | | |
| Airbus Group SE (France) | 13,692 | 861,199 |
|
| Allegion PLC (Ireland) | 7,943 | 481,028 |
|
| Bombardier, Inc. Class B (Canada) † | 3,244,367 | 2,269,598 |
|
| Embraer SA ADR (Brazil) | 32,060 | 922,687 |
|
| General Dynamics Corp. | 56,937 | 7,616,462 |
|
| Northrop Grumman Corp. | 67,264 | 12,447,876 |
|
| Raytheon Co. | 29,713 | 3,810,395 |
|
| United Technologies Corp. | 46,835 | 4,106,961 |
|
| 32,516,206 |
| Communication services (3.0%) | | |
| American Tower Corp. R | 60,971 | 5,752,004 |
|
| AT&T, Inc. | 249,400 | 8,993,364 |
|
| Charter Communications, Inc. Class A † | 15,808 | 2,708,859 |
|
| Comcast Corp. Class A | 81,903 | 4,562,816 |
|
| DISH Network Corp. Class A † | 29,229 | 1,410,884 |
|
| Equinix, Inc. R | 5,182 | 1,609,374 |
|
| Level 3 Communications, Inc. † | 101,093 | 4,934,349 |
|
| Liberty Global PLC Ser. A (United Kingdom) † | 115,490 | 3,974,011 |
|
| Time Warner Cable, Inc. | 13,394 | 2,437,842 |
|
| 36,383,503 |
| Communications equipment (0.6%) | | |
| Cisco Systems, Inc. | 313,699 | 7,462,899 |
|
| 7,462,899 |
| Computers (2.7%) | | |
| Apple, Inc. | 267,904 | 26,077,775 |
|
| Castlight Health, Inc. Class B † | 252,121 | 834,521 |
|
|
| George Putnam Balanced Fund 19 |
| | |
| COMMON STOCKS (59.8%)* cont. | Shares | Value |
|
| Computers cont. | | |
| EMC Corp. | 176,779 | $4,378,816 |
|
| HP, Inc. | 122,561 | 1,190,067 |
|
| 32,481,179 |
| Conglomerates (0.8%) | | |
| Danaher Corp. | 42,808 | 3,709,313 |
|
| Tyco International PLC | 170,660 | 5,868,997 |
|
| 9,578,310 |
| Consumer cyclicals (7.4%) | | |
| Advance Auto Parts, Inc. | 20,979 | 3,189,857 |
|
| Amazon.com, Inc. † | 22,917 | 13,452,279 |
|
| Brunswick Corp. | 20,096 | 800,826 |
|
| CaesarStone Sdot-Yam, Ltd. (Israel) † | 39,081 | 1,469,055 |
|
| Criteo SA ADR (France) † | 13,237 | 391,550 |
|
| Ctrip.com International, Ltd. ADR (China) † | 59,540 | 2,541,167 |
|
| Dollar General Corp. | 47,416 | 3,559,045 |
|
| Five Below, Inc. † | 63,035 | 2,220,723 |
|
| Gap, Inc. (The) | 74,032 | 1,830,071 |
|
| GNC Holdings, Inc. Class A | 14,364 | 402,336 |
|
| Hanesbrands, Inc. | 88,487 | 2,705,048 |
|
| Hilton Worldwide Holdings, Inc. | 148,493 | 2,644,660 |
|
| Home Depot, Inc. (The) | 53,183 | 6,688,294 |
|
| Live Nation Entertainment, Inc. † | 247,737 | 5,623,630 |
|
| Marriott International, Inc./MD Class A | 17,646 | 1,081,347 |
|
| MasterCard, Inc. Class A | 43,797 | 3,899,247 |
|
| Michaels Cos., Inc. (The) † | 54,195 | 1,181,451 |
|
| NIKE, Inc. Class B | 90,292 | 5,599,007 |
|
| PayPal Holdings, Inc. † | 62,808 | 2,269,881 |
|
| Penn National Gaming, Inc. † | 127,091 | 1,795,796 |
|
| Priceline Group, Inc. (The) † | 4,538 | 4,832,834 |
|
| PulteGroup, Inc. | 49,808 | 834,782 |
|
| RE/MAX Holdings, Inc. Class A | 66,873 | 2,328,518 |
|
| Rollins, Inc. | 59,023 | 1,626,084 |
|
| Tiffany & Co. | 11,600 | 740,544 |
|
| Time Warner, Inc. | 46,640 | 3,285,322 |
|
| TJX Cos., Inc. (The) | 60,148 | 4,284,944 |
|
| Wal-Mart Stores, Inc. | 41,893 | 2,780,019 |
|
| Walt Disney Co. (The) | 36,904 | 3,536,141 |
|
| Wynn Resorts, Ltd. | 29,505 | 1,986,867 |
|
| 89,581,325 |
| Consumer staples (6.3%) | | |
| Avon Products, Inc. | 321,872 | 1,091,146 |
|
| Blue Buffalo Pet Products, Inc. † | 101,780 | 1,732,296 |
|
| Bright Horizons Family Solutions, Inc. † | 23,655 | 1,659,871 |
|
| Chipotle Mexican Grill, Inc. † | 2,275 | 1,030,507 |
|
| Costco Wholesale Corp. | 26,562 | 4,014,049 |
|
| Coty, Inc. Class A | 410,597 | 10,104,792 |
|
| CVS Health Corp. | 66,449 | 6,418,309 |
|
| Delivery Hero Holding GmbH (acquired 6/12/15 cost $446,716) | | |
(Private) (Germany) † ∆∆ F | 58 | 387,005 |
|
|
| 20 George Putnam Balanced Fund |
| | |
| COMMON STOCKS (59.8%)* cont. | Shares | Value |
|
| Consumer staples cont. | | |
| Dr. Pepper Snapple Group, Inc. | 39,974 | $3,751,160 |
|
| Edgewell Personal Care Co. | 64,762 | 4,793,036 |
|
| Groupon, Inc. † | 62,248 | 169,315 |
|
| GrubHub, Inc. † | 8,880 | 167,388 |
|
| JM Smucker Co. (The) | 18,947 | 2,431,279 |
|
| Kraft Heinz Co. (The) | 40,504 | 3,161,742 |
|
| Molson Coors Brewing Co. Class B | 55,941 | 5,061,542 |
|
| Mondelez International, Inc. Class A | 97,694 | 4,210,611 |
|
| Netflix, Inc. † | 7,650 | 702,576 |
|
| Nomad Foods, Ltd. (United Kingdom) † | 51,680 | 452,200 |
|
| PepsiCo, Inc. | 27,284 | 2,709,301 |
|
| Philip Morris International, Inc. | 118,450 | 10,661,685 |
|
| Pinnacle Foods, Inc. | 10,836 | 464,756 |
|
| Restaurant Brands International LP (Units) (Canada) | 173 | 5,791 |
|
| Restaurant Brands International, Inc. (Canada) | 53,339 | 1,791,124 |
|
| TreeHouse Foods, Inc. † | 23,087 | 1,832,184 |
|
| Walgreens Boots Alliance, Inc. | 59,517 | 4,744,695 |
|
| Yum! Brands, Inc. | 40,112 | 2,902,905 |
|
| 76,451,265 |
| Electronics (2.8%) | | |
| Agilent Technologies, Inc. | 81,367 | 3,063,468 |
|
| Analog Devices, Inc. | 18,581 | 1,000,773 |
|
| Avago Technologies, Ltd. | 25,534 | 3,414,151 |
|
| Cavium, Inc. † | 33,313 | 1,924,492 |
|
| Honeywell International, Inc. | 40,684 | 4,198,589 |
|
| Intel Corp. | 39,552 | 1,226,903 |
|
| L-3 Communications Holdings, Inc. | 87,252 | 10,194,524 |
|
| Micron Technology, Inc. † | 157,396 | 1,736,078 |
|
| ON Semiconductor Corp. † | 65,321 | 559,148 |
|
| QUALCOMM, Inc. | 54,152 | 2,455,252 |
|
| TE Connectivity, Ltd. | 38,587 | 2,205,633 |
|
| Texas Instruments, Inc. | 28,069 | 1,485,692 |
|
| 33,464,703 |
| Energy (3.7%) | | |
| Anadarko Petroleum Corp. | 134,654 | 5,263,625 |
|
| Apache Corp. | 40,268 | 1,713,001 |
|
| Baker Hughes, Inc. | 55,285 | 2,405,450 |
|
| Cabot Oil & Gas Corp. | 26,143 | 542,467 |
|
| Cenovus Energy, Inc. (Canada) | 106,154 | 1,307,886 |
|
| Chevron Corp. | 20,876 | 1,805,148 |
|
| Cimarex Energy Co. | 4,880 | 453,840 |
|
| Concho Resources, Inc. † | 1,771 | 168,475 |
|
| ConocoPhillips | 73,513 | 2,872,888 |
|
| Devon Energy Corp. | 40,248 | 1,122,919 |
|
| Diamondback Energy, Inc. † | 4,254 | 321,390 |
|
| EOG Resources, Inc. | 31,930 | 2,267,669 |
|
| Exxon Mobil Corp. | 41,241 | 3,210,612 |
|
| FMC Technologies, Inc. † | 20,436 | 513,965 |
|
| Frank’s International NV (Netherlands) | 9,995 | 146,227 |
|
|
| George Putnam Balanced Fund 21 |
| | |
| COMMON STOCKS (59.8%)* cont. | Shares | Value |
|
| Energy cont. | | |
| Genel Energy PLC (United Kingdom) † | 175,819 | $265,183 |
|
| Gulfport Energy Corp. † | 4,798 | 141,781 |
|
| Halliburton Co. | 31,040 | 986,762 |
|
| Marathon Oil Corp. | 79,130 | 769,935 |
|
| MPLX LP | 21,887 | 673,463 |
|
| Occidental Petroleum Corp. | 52,014 | 3,580,124 |
|
| Oceaneering International, Inc. | 4,420 | 149,617 |
|
| Pioneer Natural Resources Co. | 20,572 | 2,549,899 |
|
| Royal Dutch Shell PLC Class A (United Kingdom) | 242,728 | 5,311,774 |
|
| Schlumberger, Ltd. | 18,283 | 1,321,312 |
|
| Suncor Energy, Inc. (Canada) | 191,522 | 4,510,343 |
|
| Weatherford International PLC † | 60,562 | 408,188 |
|
| 44,783,943 |
| Financials (9.5%) | | |
| AllianceBernstein Holding LP | 86,530 | 1,595,613 |
|
| American International Group, Inc. | 108,999 | 6,156,264 |
|
| Ameriprise Financial, Inc. | 19,897 | 1,803,663 |
|
| Assured Guaranty, Ltd. | 105,014 | 2,497,233 |
|
| AvalonBay Communities, Inc. R | 11,672 | 2,001,631 |
|
| Bank of America Corp. | 639,297 | 9,039,660 |
|
| Bank of New York Mellon Corp. (The) | 126,796 | 4,592,551 |
|
| Berkshire Hathaway, Inc. Class B † | 40,291 | 5,228,563 |
|
| Boston Properties, Inc. R | 15,992 | 1,858,430 |
|
| Capital One Financial Corp. | 10,621 | 696,950 |
|
| Carlyle Group LP (The) | 81,655 | 1,117,040 |
|
| CBRE Group, Inc. Class A † | 12,272 | 343,248 |
|
| Charles Schwab Corp. (The) | 208,434 | 5,321,320 |
|
| Citigroup, Inc. | 57,850 | 2,463,253 |
|
| Equity Lifestyle Properties, Inc. R | 15,607 | 1,028,813 |
|
| Essex Property Trust, Inc. R | 3,739 | 796,818 |
|
| Federal Realty Investment Trust R | 6,668 | 1,005,734 |
|
| Gaming and Leisure Properties, Inc. R | 61,778 | 1,611,170 |
|
| General Growth Properties R | 58,849 | 1,650,126 |
|
| Genworth Financial, Inc. Class A † | 302,791 | 841,759 |
|
| Hartford Financial Services Group, Inc. (The) | 83,643 | 3,360,776 |
|
| Invesco, Ltd. | 56,425 | 1,688,800 |
|
| JPMorgan Chase & Co. | 212,497 | 12,643,572 |
|
| KeyCorp | 252,020 | 2,812,543 |
|
| Kimco Realty Corp. R | 18,211 | 495,157 |
|
| KKR & Co. LP | 200,100 | 2,727,363 |
|
| Morgan Stanley | 109,540 | 2,834,895 |
|
| Oaktree Capital Group, LLC (Units) | 10,806 | 472,871 |
|
| Oportun Financial Corp. (acquired 6/23/15, cost $386,984) | | |
(Private) † ∆∆ F | 135,784 | 348,286 |
|
| Pebblebrook Hotel Trust R | 12,333 | 301,172 |
|
| Prudential PLC (United Kingdom) | 160,520 | 3,155,227 |
|
| Public Storage R | 7,965 | 2,019,605 |
|
| Regions Financial Corp. | 327,946 | 2,662,922 |
|
|
| 22 George Putnam Balanced Fund |
| | |
| COMMON STOCKS (59.8%)* cont. | Shares | Value |
|
| Financials cont. | | |
| Seritage Growth Properties R | 4,327 | $168,710 |
|
| Simon Property Group, Inc. R | 11,961 | 2,228,095 |
|
| Synchrony Financial † | 143,853 | 4,088,302 |
|
| U.S. Bancorp | 120,970 | 4,846,058 |
|
| Visa, Inc. Class A | 109,344 | 8,145,035 |
|
| Vornado Realty Trust R | 8,097 | 716,261 |
|
| Wells Fargo & Co. | 149,176 | 7,493,110 |
|
| 114,858,599 |
| Health care (8.2%) | | |
| Abbott Laboratories | 22,493 | 851,360 |
|
| Aetna, Inc. | 10,145 | 1,033,167 |
|
| Allergan PLC † | 36,709 | 10,441,141 |
|
| AMAG Pharmaceuticals, Inc. † | 21,442 | 491,236 |
|
| Amgen, Inc. | 35,601 | 5,437,341 |
|
| Anthem, Inc. | 4,088 | 533,443 |
|
| Baxter International, Inc. | 63,818 | 2,335,739 |
|
| Biogen, Inc. † | 17,423 | 4,757,524 |
|
| Boston Scientific Corp. † | 108,661 | 1,904,827 |
|
| Bristol-Myers Squibb Co. | 99,393 | 6,178,269 |
|
| C.R. Bard, Inc. | 15,012 | 2,751,249 |
|
| Cardinal Health, Inc. | 36,532 | 2,972,609 |
|
| Celgene Corp. † | 58,823 | 5,901,123 |
|
| Cigna Corp. | 18,766 | 2,507,138 |
|
| Cooper Cos., Inc. (The) | 10,697 | 1,402,912 |
|
| DexCom, Inc. † | 8,187 | 583,569 |
|
| Diplomat Pharmacy, Inc. † | 21,572 | 586,974 |
|
| Edwards Lifesciences Corp. † | 28,335 | 2,216,080 |
|
| Eli Lilly & Co. | 60,744 | 4,804,850 |
|
| Express Scripts Holding Co. † | 19,333 | 1,389,463 |
|
| Gilead Sciences, Inc. | 93,222 | 7,737,426 |
|
| Henry Schein, Inc. † | 6,436 | 974,668 |
|
| HTG Molecular Diagnostics, Inc. † | 8,028 | 24,807 |
|
| Intuitive Surgical, Inc. † | 5,170 | 2,796,195 |
|
| Jazz Pharmaceuticals PLC † | 6,444 | 829,601 |
|
| Johnson & Johnson | 33,582 | 3,507,304 |
|
| McKesson Corp. | 4,245 | 683,360 |
|
| Medtronic PLC | 24,359 | 1,849,335 |
|
| Merck & Co., Inc. | 60,707 | 3,076,024 |
|
| Mylan NV † | 86,202 | 4,541,983 |
|
| Perrigo Co. PLC | 36,535 | 5,282,230 |
|
| Pfizer, Inc. | 149,636 | 4,562,402 |
|
| Press Ganey Holdings, Inc. † | 14,485 | 428,032 |
|
| Service Corp. International/US | 40,077 | 969,463 |
|
| TESARO, Inc. † | 29,089 | 1,004,734 |
|
| Ventas, Inc. R | 26,100 | 1,443,852 |
|
| 98,791,430 |
| Semiconductor (0.2%) | | |
| Lam Research Corp. | 37,869 | 2,718,616 |
|
| | | 2,718,616 |
|
| George Putnam Balanced Fund 23 |
| | |
| COMMON STOCKS (59.8%)* cont. | Shares | Value |
|
| Software (2.4%) | | |
| Activision Blizzard, Inc. | 39,667 | $1,381,205 |
|
| Adobe Systems, Inc. † | 34,570 | 3,081,224 |
|
| Microsoft Corp. | 409,154 | 22,540,294 |
|
| Tencent Holdings, Ltd. (China) | 73,981 | 1,397,655 |
|
| TubeMogul, Inc. † | 48,896 | 551,058 |
|
| 28,951,436 |
| Technology services (4.0%) | | |
| Alibaba Group Holding, Ltd. ADR (China) † | 16,890 | 1,132,137 |
|
| Alphabet, Inc. Class A † | 28,414 | 21,632,999 |
|
| Computer Sciences Corp. | 51,931 | 1,665,427 |
|
| Facebook, Inc. Class A † | 119,126 | 13,367,128 |
|
| Fidelity National Information Services, Inc. | 34,604 | 2,066,897 |
|
| GoDaddy, Inc. Class A † | 15,759 | 480,492 |
|
| Hewlett Packard Enterprise Co. | 122,561 | 1,686,439 |
|
| salesforce.com, Inc. † | 60,048 | 4,086,867 |
|
| Yahoo!, Inc. † | 68,620 | 2,024,976 |
|
| 48,143,362 |
| Transportation (0.9%) | | |
| American Airlines Group, Inc. | 79,012 | 3,080,678 |
|
| Genesee & Wyoming, Inc. Class A † | 21,126 | 1,047,427 |
|
| Union Pacific Corp. | 90,538 | 6,518,736 |
|
| 10,646,841 |
| Utilities and power (2.0%) | | |
| American Electric Power Co., Inc. | 25,095 | 1,530,042 |
|
| American Water Works Co., Inc. | 24,136 | 1,566,668 |
|
| Calpine Corp. † | 183,443 | 2,808,512 |
|
| Edison International | 19,119 | 1,181,554 |
|
| Exelon Corp. | 129,173 | 3,819,646 |
|
| Kinder Morgan, Inc. | 92,027 | 1,513,844 |
|
| NextEra Energy Partners LP | 27,157 | 732,967 |
|
| NextEra Energy, Inc. | 32,414 | 3,620,968 |
|
| NRG Energy, Inc. | 199,615 | 2,123,904 |
|
| NRG Yield, Inc. Class C | 65,064 | 861,447 |
|
| PG&E Corp. | 54,748 | 3,006,213 |
|
| Sempra Energy | 19,625 | 1,859,469 |
|
| | | 24,625,234 |
| | | |
| Total common stocks (cost $742,972,842) | | $722,272,207 |
| | |
| U.S. GOVERNMENT AND AGENCY | | |
| MORTGAGE OBLIGATIONS (7.6%)* | Principal amount | Value |
|
| U.S. Government Guaranteed Mortgage Obligations (1.7%) | | |
| Government National Mortgage Association Pass-Through Certificates | | |
| 3 1/2s, TBA, February 1, 2046 | $12,000,000 | $12,656,250 |
| 3s, TBA, February 1, 2046 | 7,000,000 | 7,216,563 |
|
| |
| U.S. Government Agency Mortgage Obligations (5.9%) | | 19,872,813 |
| Federal Home Loan Mortgage Corporation Pass-Through Certificates | | |
| 6s, March 1, 2035 | 2,523 | 2,893 |
| 4s, with due dates from July 1, 2042 to June 1, 2043 | 5,713,086 | 6,120,014 |
| 3 1/2s, with due dates from December 1, 2042 to April 1, 2043 | 797,807 | 840,533 |
|
| 24 George Putnam Balanced Fund |
| | |
| U.S. GOVERNMENT AND AGENCY | | |
| MORTGAGE OBLIGATIONS (7.6%)* cont. | Principal amount | Value |
|
| U.S. Government Agency Mortgage Obligations cont. | | |
| Federal Home Loan Mortgage Corporation Pass-Through Certificates | | |
| 3 1/2s, TBA, February 1, 2046 | $4,000,000 | $4,180,000 |
| 3s, with due dates from March 1, 2043 to July 1, 2043 | 2,815,137 | 2,874,733 |
|
| Federal National Mortgage Association Pass-Through Certificates | | |
| 5 1/2s, with due dates from July 1, 2033 to November 1, 2038 | 3,383,139 | 3,805,595 |
| 5s, with due dates from August 1, 2033 to January 1, 2039 | 917,416 | 1,014,177 |
| 4 1/2s, November 1, 2044 | 8,000,000 | 8,706,250 |
| 4 1/2s, TBA, February 1, 2046 | 13,000,000 | 14,131,406 |
| 4s, with due dates from January 1, 2041 to September 1, 2045 ## | 3,091,688 | 3,328,390 |
| 4s, TBA, February 1, 2046 | 3,000,000 | 3,204,609 |
| 3 1/2s, with due dates from May 1, 2043 to March 1, 2045 | 4,175,929 | 4,378,769 |
| 3 1/2s, TBA, March 1, 2046 | 1,000,000 | 1,044,375 |
| 3 1/2s, TBA, February 1, 2046 | 2,000,000 | 2,094,570 |
| 3s, with due dates from February 1, 2043 to May 1, 2043 | 1,657,233 | 1,694,767 |
| 3s, TBA, March 1, 2046 | 6,000,000 | 6,109,453 |
| 3s, TBA, February 1, 2046 | 8,000,000 | 8,164,375 |
|
| | | 71,694,909 |
| | |
| Total U.S. government and agency mortgage obligations (cost $90,775,949) | $91,567,722 |
|
| |
| U.S. TREASURY OBLIGATIONS (14.8%)* | Principal amount | Value |
|
| U.S. Treasury Bonds | | |
| 3 3/4s, November 15, 2043 Δ | $2,220,000 | $2,686,445 |
| 2 3/4s, August 15, 2042 | 11,380,000 | 11,439,966 |
|
| U.S. Treasury Inflation Protected Securities 0.625%, February 15, 2043 i | 120,812 | 106,136 |
|
| U.S. Treasury Notes | | |
| 2 3/8s, August 15, 2024 | 7,540,000 | 7,848,728 |
| 2s, November 30, 2020 | 39,190,000 | 40,366,617 |
| 1 3/4s, May 31, 2016 | 7,930,000 | 7,964,198 |
| 1 3/8s, September 30, 2018 | 29,620,000 | 29,964,101 |
| 1 1/8s, December 31, 2019 | 24,210,000 | 24,144,936 |
| 1s, August 31, 2016 | 13,290,000 | 13,324,418 |
| 0 3/4s, March 31, 2018 | 33,020,000 | 32,961,442 |
| 0 3/4s, December 31, 2017 | 8,160,000 | 8,152,605 |
|
| Total U.S. treasury obligations (cost $176,868,758) | | $178,959,592 |
|
| |
| CORPORATE BONDS AND NOTES (15.4%)* | Principal amount | Value |
|
| Basic materials (0.8%) | | |
| Agrium, Inc. sr. unsec. notes 3 3/8s, 2025 (Canada) | $310,000 | $281,331 |
|
| Agrium, Inc. sr. unsec. unsub. notes 7 1/8s, 2036 (Canada) | 365,000 | 412,077 |
|
| ArcelorMittal SA sr. unsec. unsub. bonds 10.85s, 2019 (France) | 400,000 | 372,000 |
|
| CF Industries, Inc. company guaranty sr. unsec. notes | | |
| 5 3/8s, 2044 | 330,000 | 278,028 |
|
| CF Industries, Inc. company guaranty sr. unsec. notes | | |
| 5.15s, 2034 | 408,000 | 349,232 |
|
| CF Industries, Inc. company guaranty sr. unsec. unsub. notes | | |
| 7 1/8s, 2020 | 78,000 | 87,638 |
|
|
| George Putnam Balanced Fund 25 |
| | |
| CORPORATE BONDS AND NOTES (15.4%)* cont. | Principal amount | Value |
|
| Basic materials cont. | | |
| Corp Nacional del Cobre de Chile (CODELCO) 144A sr. unsec. | | |
| unsub. notes 3 7/8s, 2021 (Chile) | $500,000 | $489,178 |
|
| Cytec Industries, Inc. sr. unsec. unsub. notes 3 1/2s, 2023 | 215,000 | 206,545 |
|
| Eastman Chemical Co. sr. unsec. notes 3.8s, 2025 | 235,000 | 223,146 |
|
| Eastman Chemical Co. sr. unsec. unsub. notes 6.3s, 2018 | 200,000 | 219,461 |
|
| Georgia-Pacific, LLC sr. unsec. unsub. notes 7 3/4s, 2029 | 850,000 | 1,109,018 |
|
| Glencore Funding, LLC 144A company guaranty sr. unsec. | | |
| unsub. notes 4 5/8s, 2024 | 941,000 | 638,939 |
|
| Glencore Funding, LLC 144A company guaranty sr. unsec. | | |
| unsub. notes 4s, 2025 | 638,000 | 416,424 |
|
| Glencore Funding, LLC 144A company guaranty sr. unsec. | | |
| unsub. notes 2 7/8s, 2020 | 682,000 | 487,630 |
|
| International Paper Co. sr. unsec. notes 8.7s, 2038 | 10,000 | 12,984 |
|
| LyondellBasell Industries NV sr. unsec. unsub. notes | | |
| 4 5/8s, 2055 | 515,000 | 404,096 |
|
| Mosaic Co. (The) sr. unsec. unsub. notes 5 5/8s, 2043 | 188,000 | 172,458 |
|
| Mosaic Co. (The) sr. unsec. unsub. notes 5.45s, 2033 | 77,000 | 75,573 |
|
| Mosaic Co. (The) sr. unsec. unsub. notes 3 3/4s, 2021 | 200,000 | 200,979 |
|
| Union Carbide Corp. sr. unsec. unsub. bonds 7 3/4s, 2096 | 180,000 | 206,555 |
|
| Westrock (RKT) Co. company guaranty sr. unsec. unsub. notes | | |
| 4.45s, 2019 | 168,000 | 177,162 |
|
| Westrock MWV, LLC company guaranty sr. unsec. unsub. | | |
| notes 8.2s, 2030 | 1,265,000 | 1,603,185 |
|
| Westrock MWV, LLC company guaranty sr. unsec. unsub. notes | | |
| 7.95s, 2031 | 187,000 | 238,398 |
|
| Weyerhaeuser Co. sr. unsec. unsub. notes 7 3/8s, 2032 R | 553,000 | 655,226 |
|
| 9,317,263 |
| Capital goods (0.3%) | | |
| Delphi Corp. company guaranty sr. unsec. notes 5s, 2023 | 125,000 | 130,625 |
|
| Legrand France SA sr. unsec. unsub. notes 8 1/2s, 2025 (France) | 767,000 | 1,034,869 |
|
| Medtronic, Inc. company guaranty sr. unsec. sub. notes | | |
| 4 3/8s, 2035 | 328,000 | 334,811 |
|
| Medtronic, Inc. company guaranty sr. unsec. sub. notes | | |
| 3 1/2s, 2025 | 327,000 | 335,751 |
|
| Northrop Grumman Corp. company guaranty sr. unsec. unsub. | | |
| notes 7 7/8s, 2026 | 265,000 | 356,666 |
|
| Parker Hannifin Corp. sr. unsec. unsub. notes Ser. MTN, | | |
| 6 1/4s, 2038 | 975,000 | 1,257,828 |
|
| Republic Services, Inc. company guaranty sr. unsec. unsub. | | |
| notes 5 1/2s, 2019 | 240,000 | 265,137 |
|
| United Technologies Corp. sr. unsec. unsub. notes 5.7s, 2040 | 100,000 | 118,643 |
|
| United Technologies Corp. sr. unsec. unsub. notes 4 1/2s, 2042 | 225,000 | 229,594 |
|
| 4,063,924 |
| Communication services (1.4%) | | |
| America Movil SAB de CV company guaranty sr. unsec. unsub. | | |
| notes 6 1/8s, 2040 (Mexico) | 200,000 | 217,571 |
|
| America Movil SAB de CV company guaranty sr. unsec. unsub. | | |
| notes 2 3/8s, 2016 (Mexico) | 280,000 | 281,727 |
|
| American Tower Corp. sr. unsec. notes 4s, 2025 R | 335,000 | 331,447 |
|
| American Tower Corp. sr. unsec. notes 3.4s, 2019 R | 735,000 | 753,060 |
|
| AT&T, Inc. sr. unsec. unsub. notes 4 3/4s, 2046 | 122,000 | 108,175 |
|
|
| 26 George Putnam Balanced Fund |
| | |
| CORPORATE BONDS AND NOTES (15.4%)* cont. | Principal amount | Value |
|
| Communication services cont. | | |
| AT&T, Inc. sr. unsec. unsub. notes 3.4s, 2025 | $123,000 | $117,837 |
|
| CC Holdings GS V, LLC/Crown Castle GS III Corp. company | | |
| guaranty sr. notes 3.849s, 2023 | 240,000 | 241,225 |
|
| CCO Safari II, LLC 144A company guaranty sr. notes | | |
| 6.484s, 2045 | 714,000 | 718,811 |
|
| CCO Safari II, LLC 144A company guaranty sr. notes | | |
| 4.908s, 2025 | 356,000 | 356,353 |
|
| Comcast Cable Communications Holdings, Inc. company | | |
| guaranty sr. unsec. notes 9.455s, 2022 | 645,000 | 904,649 |
|
| Comcast Corp. company guaranty sr. unsec. unsub. notes | | |
| 6 1/2s, 2035 | 268,000 | 333,841 |
|
| Crown Castle International Corp. sr. unsec. notes 5 1/4s, 2023 R | 30,000 | 31,950 |
|
| Crown Castle International Corp. sr. unsec. notes 4 7/8s, 2022 R | 313,000 | 327,476 |
|
| Crown Castle International Corp. sr. unsec. unsub. bonds | | |
| 4.45s, 2026 R | 45,000 | 45,278 |
|
| Crown Castle Towers, LLC 144A company guaranty sr. notes | | |
| 4.883s, 2020 | 710,000 | 772,523 |
|
| Koninklijke KPN NV sr. unsec. unsub. bonds 8 3/8s, | | |
| 2030 (Netherlands) | 70,000 | 91,059 |
|
| NBCUniversal Media, LLC company guaranty sr. unsec. unsub. | | |
| notes 6.4s, 2040 | 380,000 | 465,448 |
|
| Rogers Communications, Inc. company guaranty sr. unsec. | | |
| bonds 8 3/4s, 2032 (Canada) | 95,000 | 131,320 |
|
| Rogers Communications, Inc. company guaranty sr. unsec. | | |
| unsub. notes 4 1/2s, 2043 (Canada) | 215,000 | 204,411 |
|
| SBA Tower Trust 144A sr. notes 5.101s, 2017 | 1,125,000 | 1,142,782 |
|
| SES SA 144A company guaranty sr. unsec. notes 5.3s, | | |
| 2043 (France) | 275,000 | 267,823 |
|
| TCI Communications, Inc. sr. unsec. unsub. notes 7 7/8s, 2026 | 610,000 | 844,767 |
|
| Telecom Italia SpA 144A sr. unsec. notes 5.303s, 2024 (Italy) | 1,000,000 | 975,000 |
|
| Telefonica Emisiones SAU company guaranty sr. unsec. notes | | |
| 4.57s, 2023 (Spain) | 1,000,000 | 1,056,134 |
|
| Telefonica Emisiones SAU company guaranty sr. unsec. unsub. | | |
| notes 7.045s, 2036 (Spain) | 355,000 | 418,907 |
|
| Telefonica Emisiones SAU company guaranty sr. unsec. unsub. | | |
| notes 5.462s, 2021 (Spain) | 845,000 | 940,226 |
|
| Verizon Communications, Inc. sr. unsec. unsub. notes 5.9s, | | |
| 2054 (units) | 5,200 | 138,164 |
|
| Verizon Communications, Inc. sr. unsec. unsub. notes | | |
| 5.05s, 2034 | 270,000 | 263,249 |
|
| Verizon Communications, Inc. sr. unsec. unsub. notes | | |
| 4.522s, 2048 | 1,309,000 | 1,146,838 |
|
| Verizon Communications, Inc. sr. unsec. unsub. notes 4.4s, 2034 | 595,000 | 541,960 |
|
| Verizon New Jersey, Inc. company guaranty sr. unsec. unsub. | | |
| bonds 8s, 2022 | 770,000 | 955,811 |
|
| Verizon Pennsylvania, Inc. company guaranty sr. unsec. bonds | | |
| 8.35s, 2030 | 980,000 | 1,208,485 |
|
| 16,334,307 |
| Conglomerates (0.1%) | | |
| General Electric Co. jr. unsec. sub. FRB Ser. D, 5s, | | |
| perpetual maturity | 1,111,000 | 1,144,330 |
|
| | | 1,144,330 |
|
| George Putnam Balanced Fund 27 |
| | |
| CORPORATE BONDS AND NOTES (15.4%)* cont. | Principal amount | Value |
|
| Consumer cyclicals (1.7%) | | |
| 21st Century Fox America, Inc. company guaranty sr. unsec. | | |
| notes 7.85s, 2039 | $190,000 | $244,240 |
|
| 21st Century Fox America, Inc. company guaranty sr. unsec. | | |
| notes 7 3/4s, 2024 | 1,045,000 | 1,312,762 |
|
| Autonation, Inc. company guaranty sr. unsec. notes | | |
| 4 1/2s, 2025 | 330,000 | 337,976 |
|
| Autonation, Inc. company guaranty sr. unsec. unsub. notes | | |
| 5 1/2s, 2020 | 847,000 | 924,667 |
|
| Bed Bath & Beyond, Inc. sr. unsec. sub. notes 5.165s, 2044 | 705,000 | 605,903 |
|
| CBS Corp. company guaranty sr. unsec. debs. 7 7/8s, 2030 | 1,187,000 | 1,490,254 |
|
| Dollar General Corp. sr. unsec. sub. notes 3 1/4s, 2023 | 625,000 | 609,050 |
|
| Expedia, Inc. company guaranty sr. unsec. unsub. notes | | |
| 5.95s, 2020 | 579,000 | 632,690 |
|
| Expedia, Inc. 144A company guaranty sr. unsec. unsub. | | |
| notes 5s, 2026 | 375,000 | 370,274 |
|
| Ford Motor Co. sr. unsec. unsub. notes 9.98s, 2047 | 135,000 | 189,128 |
|
| Ford Motor Co. sr. unsec. unsub. notes 7 3/4s, 2043 | 1,290,000 | 1,475,511 |
|
| Ford Motor Co. sr. unsec. unsub. notes 7.45s, 2031 | 24,000 | 29,181 |
|
| Ford Motor Co. sr. unsec. unsub. notes 7.4s, 2046 | 200,000 | 249,527 |
|
| Ford Motor Credit Co., LLC sr. unsec. unsub. notes 5 7/8s, 2021 | 795,000 | 877,613 |
|
| General Motors Co. sr. unsec. notes 5.2s, 2045 | 830,000 | 737,472 |
|
| General Motors Financial Co., Inc. company guaranty sr. unsec. | | |
| unsub. notes 4.3s, 2025 | 395,000 | 375,719 |
|
| General Motors Financial Co., Inc. company guaranty sr. unsec. | | |
| unsub. notes 4s, 2025 | 250,000 | 233,650 |
|
| General Motors Financial Co., Inc. company guaranty sr. unsec. | | |
| unsub. notes 3.45s, 2022 | 685,000 | 657,881 |
|
| GLP Capital LP/GLP Financing II, Inc. company guaranty sr. | | |
| unsec. sub. notes 4 3/8s, 2018 | 185,000 | 185,902 |
|
| Grupo Televisa SAB sr. unsec. unsub. bonds 6 5/8s, | | |
| 2040 (Mexico) | 300,000 | 308,747 |
|
| Grupo Televisa SAB sr. unsec. unsub. notes 5s, 2045 (Mexico) | 355,000 | 299,660 |
|
| Historic TW, Inc. company guaranty sr. unsec. unsub. bonds | | |
| 9.15s, 2023 | 460,000 | 609,866 |
|
| Host Hotels & Resorts LP sr. unsec. unsub. notes 6s, 2021 R | 320,000 | 362,765 |
|
| Host Hotels & Resorts LP sr. unsec. unsub. notes 5 1/4s, 2022 R | 150,000 | 162,103 |
|
| Hyatt Hotels Corp. sr. unsec. unsub. notes 3 3/8s, 2023 | 200,000 | 191,271 |
|
| INVISTA Finance, LLC 144A company guaranty sr. notes | | |
| 4 1/4s, 2019 | 356,000 | 344,430 |
|
| L Brands, Inc. company guaranty sr. unsec. notes 6 5/8s, 2021 | 435,000 | 484,481 |
|
| Macy’s Retail Holdings, Inc. company guaranty sr. unsec. | | |
| notes 6.9s, 2029 | 781,000 | 852,080 |
|
| Macy’s Retail Holdings, Inc. company guaranty sr. unsec. | | |
| notes 6.7s, 2034 | 310,000 | 303,355 |
|
| Macy’s Retail Holdings, Inc. company guaranty sr. unsec. notes | | |
| 6.65s, 2024 | 123,000 | 135,468 |
|
| Macy’s Retail Holdings, Inc. company guaranty sr. unsec. notes | | |
| 5 1/8s, 2042 | 70,000 | 60,226 |
|
| Macy’s Retail Holdings, Inc. company guaranty sr. unsec. unsub. | | |
| notes 7s, 2028 | 78,000 | 86,532 |
|
|
| 28 George Putnam Balanced Fund |
| | |
| CORPORATE BONDS AND NOTES (15.4%)* cont. | Principal amount | Value |
|
| Consumer cyclicals cont. | | |
| McGraw Hill Financial, Inc. company guaranty sr. unsec. unsub. | | |
| notes 4.4s, 2026 | $670,000 | $693,662 |
|
| Nordstrom, Inc. sr. unsec. notes 5s, 2044 | 310,000 | 305,745 |
|
| NVR, Inc. sr. unsec. notes 3.95s, 2022 | 435,000 | 442,737 |
|
| O’Reilly Automotive, Inc. company guaranty sr. unsec. notes | | |
| 3.85s, 2023 | 195,000 | 201,576 |
|
| Owens Corning company guaranty sr. unsec. sub. notes 9s, 2019 | 880,000 | 1,025,680 |
|
| Priceline Group, Inc. (The) sr. unsec. notes 3.65s, 2025 | 164,000 | 162,523 |
|
| QVC, Inc. company guaranty sr. notes 4.85s, 2024 | 390,000 | 377,566 |
|
| Tiffany & Co. sr. unsec. unsub. notes 4.9s, 2044 | 460,000 | 436,857 |
|
| Time Warner, Inc. company guaranty sr. unsec. bonds 7.7s, 2032 | 520,000 | 634,417 |
|
| Viacom, Inc. sr. unsec. unsub. notes 5.85s, 2043 | 450,000 | 378,277 |
|
| Vulcan Materials Co. sr. unsec. unsub. notes 4 1/2s, 2025 | 175,000 | 173,688 |
|
| 20,573,112 |
| Consumer staples (1.1%) | | |
| Anheuser-Busch Cos., Inc. company guaranty sr. unsec. unsub. | | |
| notes 5 1/2s, 2018 | 885,000 | 949,428 |
|
| Anheuser-Busch InBev Finance, Inc. company guaranty sr. | | |
| unsec. unsub. bonds 4.9s, 2046 | 427,000 | 442,190 |
|
| Anheuser-Busch InBev Finance, Inc. company guaranty sr. | | |
| unsec. unsub. bonds 3.65s, 2026 | 428,000 | 433,772 |
|
| Anheuser-Busch InBev Worldwide, Inc. company guaranty sr. | | |
| unsec. unsub. notes 8.2s, 2039 | 165,000 | 237,717 |
|
| Bacardi, Ltd. 144A unsec. notes 4 1/2s, 2021 (Bermuda) | 495,000 | 532,839 |
|
| Campbell Soup Co. sr. unsec. unsub. notes 8 7/8s, 2021 | 855,000 | 1,095,801 |
|
| ConAgra Foods, Inc. sr. unsec. notes 7s, 2019 | 297,000 | 336,650 |
|
| CVS Health Corp. 144A sr. unsec. sub. notes 4 3/4s, 2022 | 715,000 | 780,728 |
|
| CVS Pass-Through Trust 144A sr. mtge. notes 7.507s, 2032 | 660,410 | 794,050 |
|
| CVS Pass-Through Trust 144A sr. mtge. notes 4.704s, 2036 | 661,908 | 679,403 |
|
| Diageo Investment Corp. company guaranty sr. unsec. | | |
| notes 8s, 2022 | 820,000 | 1,055,611 |
|
| ERAC USA Finance, LLC 144A company guaranty sr. unsec. | | |
| notes 7s, 2037 | 1,434,000 | 1,762,888 |
|
| ERAC USA Finance, LLC 144A company guaranty sr. unsec. | | |
| notes 5 5/8s, 2042 | 553,000 | 594,754 |
|
| ERAC USA Finance, LLC 144A company guaranty sr. unsec. | | |
| notes 3.85s, 2024 | 211,000 | 213,018 |
|
| Grupo Bimbo SAB de CV 144A company guaranty sr. unsec. | | |
| unsub. notes 4 7/8s, 2044 (Mexico) | 350,000 | 301,812 |
|
| Kraft Foods Group, Inc. company guaranty sr. unsec. notes | | |
| Ser. 144A, 6 7/8s, 2039 | 625,000 | 754,629 |
|
| Kraft Foods Group, Inc. company guaranty sr. unsec. unsub. | | |
| notes 6 1/2s, 2040 | 309,000 | 365,856 |
|
| McDonald’s Corp. sr. unsec. unsub. notes 5.7s, 2039 | 600,000 | 673,917 |
|
| McDonald’s Corp. sr. unsec. unsub. notes Ser. MTN, 6.3s, 2038 | 535,000 | 626,896 |
|
| SABMiller Holdings, Inc. 144A company guaranty sr. unsec. | | |
| unsub. notes 4.95s, 2042 | 200,000 | 203,846 |
|
| Tyson Foods, Inc. company guaranty sr. unsec. bonds 4 7/8s, 2034 | 134,000 | 135,904 |
|
| Tyson Foods, Inc. company guaranty sr. unsec. unsub. bonds | | |
| 5.15s, 2044 | 191,000 | 199,540 |
|
| | | 13,171,249 |
|
| George Putnam Balanced Fund 29 |
| | |
| CORPORATE BONDS AND NOTES (15.4%)* cont. | Principal amount | Value |
|
| Energy (0.7%) | | |
| BG Energy Capital PLC 144A company guaranty sr. unsec. | | |
| unsub. notes 4s, 2021 (United Kingdom) | $250,000 | $256,949 |
|
| DCP Midstream Operating LP company guaranty sr. unsec. | | |
| notes 2.7s, 2019 | 225,000 | 180,583 |
|
| EOG Resources, Inc. sr. unsec. unsub. notes 5 5/8s, 2019 | 205,000 | 221,575 |
|
| EQT Midstream Partners LP company guaranty sr. unsec. sub. | | |
| notes 4s, 2024 | 575,000 | 444,787 |
|
| Freeport-McMoran Oil & Gas, LLC/FCX Oil & Gas, Inc. company | | |
| guaranty sr. unsec. notes 6 3/4s, 2022 | 95,000 | 45,363 |
|
| Hess Corp. sr. unsec. unsub. notes 7.3s, 2031 | 388,000 | 347,898 |
|
| Kerr-McGee Corp. company guaranty sr. unsec. unsub. notes | | |
| 7 7/8s, 2031 | 1,070,000 | 1,045,862 |
|
| Lukoil International Finance BV 144A company guaranty sr. | | |
| unsec. notes 4.563s, 2023 (Russia) | 315,000 | 281,138 |
|
| Marathon Petroleum Corp. sr. unsec. unsub. notes 6 1/2s, 2041 | 175,000 | 160,626 |
|
| Motiva Enterprises, LLC 144A sr. unsec. notes 6.85s, 2040 | 220,000 | 230,525 |
|
| Noble Holding International, Ltd. company guaranty sr. unsec. | | |
| unsub. notes 6.05s, 2041 | 390,000 | 159,900 |
|
| Petrobras Global Finance BV company guaranty sr. unsec. | | |
| unsub. notes 6.85s, 2115 (Brazil) | 925,000 | 582,750 |
|
| Petrobras Global Finance BV company guaranty sr. unsec. | | |
| unsub. notes 6 3/4s, 2041 (Brazil) | 300,000 | 188,535 |
|
| Petrobras Global Finance BV company guaranty sr. unsec. | | |
| unsub. notes 5 3/8s, 2021 (Brazil) | 825,000 | 619,781 |
|
| Petrobras Global Finance BV company guaranty sr. unsec. | | |
| unsub. notes 4 3/8s, 2023 (Brazil) | 180,000 | 118,564 |
|
| Petroleos Mexicanos 144A company guaranty sr. unsec. unsub. | | |
| notes 4 1/2s, 2026 (Mexico) | 535,000 | 460,563 |
|
| Pride International, Inc. company guaranty sr. unsec. unsub. | | |
| notes 7 7/8s, 2040 | 760,000 | 478,541 |
|
| Spectra Energy Capital, LLC company guaranty sr. unsec. sub. | | |
| notes 6.2s, 2018 | 580,000 | 612,646 |
|
| Spectra Energy Capital, LLC company guaranty sr. unsec. unsub. | | |
| notes 8s, 2019 | 820,000 | 928,689 |
|
| Statoil ASA company guaranty sr. unsec. notes 5.1s, | | |
| 2040 (Norway) | 480,000 | 490,441 |
|
| Tosco Corp. company guaranty sr. unsec. notes 8 1/8s, 2030 | 600,000 | 672,973 |
|
| Williams Partners LP sr. unsec. sub. notes 5.4s, 2044 | 323,000 | 212,373 |
|
| Williams Partners LP sr. unsec. sub. notes 4.3s, 2024 | 322,000 | 239,085 |
|
| 8,980,147 |
| Financials (6.8%) | | |
| Aflac, Inc. sr. unsec. notes 6.45s, 2040 | 314,000 | 382,244 |
|
| Aflac, Inc. sr. unsec. unsub. notes 6.9s, 2039 | 747,000 | 966,484 |
|
| Air Lease Corp. sr. unsec. notes 3 3/4s, 2022 | 410,000 | 404,882 |
|
| Ally Financial, Inc. sub. unsec. notes 5 3/4s, 2025 | 705,000 | 703,238 |
|
| American Express Co. jr. unsec. sub. FRN Ser. C, 4.9s, | | |
| perpetual maturity | 310,000 | 290,035 |
|
| American Express Co. sr. unsec. notes 7s, 2018 | 650,000 | 720,717 |
|
| American International Group, Inc. jr. unsec. sub. FRB | | |
| 8.175s, 2058 | 856,000 | 1,113,870 |
|
| Aon PLC company guaranty sr. unsec. unsub. notes 4 1/4s, 2042 | 1,150,000 | 1,068,275 |
|
|
| 30 George Putnam Balanced Fund |
| | |
| CORPORATE BONDS AND NOTES (15.4%)* cont. | Principal amount | Value |
|
| Financials cont. | | |
| ARC Properties Operating Partnership LP/Clark Acquisition, LLC | | |
| company guaranty sr. unsec. notes 4.6s, 2024 R | $720,000 | $677,700 |
|
| Assurant, Inc. sr. unsec. notes 6 3/4s, 2034 | 525,000 | 628,752 |
|
| AXA SA 144A jr. unsec. sub. FRN 6.463s, perpetual | | |
| maturity (France) | 550,000 | 561,688 |
|
| AXA SA 144A jr. unsec. sub. FRN 6.379s, perpetual | | |
| maturity (France) | 135,000 | 143,775 |
|
| Banco del Estado de Chile 144A sr. unsec. notes 2s, 2017 (Chile) | 400,000 | 398,109 |
|
| Bank of America Corp. jr. unsec. sub. FRN Ser. AA, 6.1s, | | |
| perpetual maturity | 644,000 | 644,000 |
|
| Bank of America, NA unsec. sub. notes Ser. BKNT, 5.3s, 2017 | 315,000 | 326,494 |
|
| Barclays Bank PLC 144A unsec. sub. notes 10.179s, 2021 | | |
| (United Kingdom) | 1,724,000 | 2,284,703 |
|
| Bear Stearns Cos., Inc. (The) sr. unsec. notes 6.4s, 2017 | 500,000 | 536,361 |
|
| Bear Stearns Cos., LLC (The) sr. unsec. unsub. notes | | |
| 7 1/4s, 2018 | 331,000 | 364,023 |
|
| Berkshire Hathaway Finance Corp. company guaranty sr. unsec. | | |
| notes 4.3s, 2043 | 703,000 | 686,902 |
|
| BNP Paribas SA 144A jr. unsec. sub. FRN 7.195s, perpetual | | |
| maturity (France) | 100,000 | 112,500 |
|
| BPCE SA 144A unsec. sub. notes 5.7s, 2023 (France) | 370,000 | 384,895 |
|
| BPCE SA 144A unsec. sub. notes 5.15s, 2024 (France) | 810,000 | 811,110 |
|
| Camden Property Trust sr. unsec. unsub. notes 4 7/8s, 2023 R | 1,213,000 | 1,333,129 |
|
| Cantor Fitzgerald LP 144A unsec. notes 6 1/2s, 2022 | 1,020,000 | 1,067,174 |
|
| Capital One Bank USA NA unsec. sub. notes 3 3/8s, 2023 | 462,000 | 451,346 |
|
| Capital One Financial Corp. unsec. sub. notes 4.2s, 2025 | 295,000 | 295,499 |
|
| CBRE Services, Inc. company guaranty sr. unsec. notes | | |
| 5 1/4s, 2025 | 257,000 | 265,494 |
|
| CBRE Services, Inc. company guaranty sr. unsec. unsub. notes | | |
| 4 7/8s, 2026 | 708,000 | 718,727 |
|
| Citigroup, Inc. jr. unsec. sub. FRB Ser. P, 5.95s, | | |
| perpetual maturity | 956,000 | 927,607 |
|
| Citigroup, Inc. jr. unsec. sub. FRN 5 7/8s, perpetual maturity | 402,000 | 390,443 |
|
| Citigroup, Inc. unsec. sub. FRN 0.747s, 2016 | 123,000 | 122,798 |
|
| CNO Financial Group, Inc. sr. unsec. unsub. notes 5 1/4s, 2025 | 345,000 | 348,450 |
|
| Cooperatieve Centrale Raiffeisen-Boerenleenbank BA/ | | |
| Netherlands company guaranty unsec. sub. notes 4 5/8s, | | |
| 2023 (Netherlands) | 250,000 | 259,046 |
|
| Cooperatieve Centrale Raiffeisen-Boerenleenbank BA/ | | |
| Netherlands unsec. sub. notes 5 1/4s, 2045 (Netherlands) | 285,000 | 297,859 |
|
| Cooperatieve Centrale Raiffeisen-Boerenleenbank BA/ | | |
| Netherlands 144A jr. unsec. sub. FRN 11s, perpetual | | |
| maturity (Netherlands) | 718,000 | 874,309 |
|
| Credit Agricole SA 144A unsec. sub. notes 4 3/8s, 2025 (France) | 255,000 | 247,432 |
|
| Credit Suisse AG/New York, NY sr. unsec. notes 5.3s, 2019 | 475,000 | 524,297 |
|
| Credit Suisse Group AG 144A unsec. sub. notes 6 1/2s, | | |
| 2023 (Switzerland) | 729,000 | 775,232 |
|
| DDR Corp. sr. unsec. unsub. notes 7 7/8s, 2020 R | 302,000 | 365,830 |
|
| Deutsche Bank AG unsec. sub. notes 4 1/2s, 2025 (Germany) | 985,000 | 873,677 |
|
| Duke Realty LP company guaranty sr. unsec. unsub. notes | | |
| 4 3/8s, 2022 R | 1,117,000 | 1,170,061 |
|
|
| George Putnam Balanced Fund 31 |
| | |
| CORPORATE BONDS AND NOTES (15.4%)* cont. | Principal amount | Value |
|
| Financials cont. | | |
| EPR Properties company guaranty sr. unsec. sub. notes | | |
| 5 1/4s, 2023 R | $345,000 | $356,593 |
|
| Fairfax US, Inc. 144A company guaranty sr. unsec. notes | | |
| 4 7/8s, 2024 | 300,000 | 295,125 |
|
| Fifth Third Bancorp jr. unsec. sub. FRB 5.1s, perpetual maturity | 217,000 | 194,622 |
|
| Five Corners Funding Trust 144A sr. unsec. bonds 4.419s, 2023 | 425,000 | 443,156 |
|
| GE Capital International Funding Co. 144A company guaranty | | |
| sr. unsec. notes 4.418s, 2035 (Ireland) | 1,521,000 | 1,561,349 |
|
| GE Capital Trust I company guaranty unsec. sub. FRB | | |
| 6 3/8s, 2067 | 355,000 | 381,847 |
|
| General Electric Capital Corp. company guaranty sr. unsec. | | |
| notes 6 3/4s, 2032 | 441,000 | 578,464 |
|
| Goldman Sachs Group, Inc. (The) sr. unsec. notes 7 1/2s, 2019 | 805,000 | 916,945 |
|
| Goldman Sachs Group, Inc. (The) unsec. sub. notes 6 3/4s, 2037 | 282,000 | 325,673 |
|
| Hartford Financial Services Group, Inc. (The) sr. unsec. unsub. | | |
| notes 6 5/8s, 2040 | 1,495,000 | 1,896,331 |
|
| Healthcare Realty Trust, Inc. sr. unsec. unsub. notes | | |
| 3 7/8s, 2025 R | 555,000 | 549,543 |
|
| Highwood Realty LP sr. unsec. unsub. notes 5.85s, 2017 R | 1,005,000 | 1,047,742 |
|
| Hospitality Properties Trust sr. unsec. unsub. notes | | |
| 4 1/2s, 2025 R | 250,000 | 241,582 |
|
| HSBC Bank USA NA/New York NY unsec. sub. notes Ser. BKNT, | | |
| 5 5/8s, 2035 (United Kingdom) | 250,000 | 280,410 |
|
| HSBC Bank USA, NA unsec. sub. notes 7s, 2039 | 342,000 | 438,803 |
|
| HSBC Holdings PLC unsec. sub. notes 6 1/2s, 2036 | | |
| (United Kingdom) | 800,000 | 915,282 |
|
| HSBC Holdings PLC unsec. sub. notes 4 1/4s, 2025 | | |
| (United Kingdom) | 910,000 | 897,381 |
|
| HSBC USA, Inc. sr. unsec. unsub. notes 3 1/2s, 2024 | 105,000 | 106,251 |
|
| ING Bank NV 144A unsec. sub. notes 5.8s, 2023 (Netherlands) | 2,225,000 | 2,393,882 |
|
| ING Groep NV jr. unsec. sub. FRN 6s, perpetual | | |
| maturity (Netherlands) | 640,000 | 620,800 |
|
| International Lease Finance Corp. sr. unsec. unsub. notes | | |
| 6 1/4s, 2019 | 275,000 | 287,375 |
|
| Intesa Sanpaolo SpA 144A unsec. sub. notes 5.71s, 2026 (Italy) | 650,000 | 638,634 |
|
| JPMorgan Chase & Co. jr. unsec. sub. FRN 7.9s, | | |
| perpetual maturity | 780,000 | 787,313 |
|
| JPMorgan Chase Bank, NA unsec. sub. notes Ser. BKNT, 6s, 2017 | 1,250,000 | 1,331,150 |
|
| KKR Group Finance Co., LLC 144A company guaranty sr. unsec. | | |
| unsub. notes 6 3/8s, 2020 | 555,000 | 645,507 |
|
| Liberty Mutual Group, Inc. 144A company guaranty jr. unsec. | | |
| sub. bonds 7.8s, 2037 | 785,000 | 894,900 |
|
| Liberty Mutual Insurance Co. 144A unsec. sub. notes | | |
| 7.697s, 2097 | 340,000 | 437,588 |
|
| Liberty Property LP sr. unsec. unsub. notes 3 3/8s, 2023 R | 100,000 | 96,249 |
|
| Lloyds Bank PLC company guaranty sr. unsec. unsub. notes | | |
| 2.7s, 2020 (United Kingdom) | 220,000 | 222,794 |
|
| Lloyds Banking Group PLC unsec. sub. notes 4 1/2s, 2024 | | |
| (United Kingdom) | 530,000 | 543,553 |
|
| Lloyds Banking Group PLC 144A unsec. sub. notes 5.3s, 2045 | | |
| (United Kingdom) | 1,404,000 | 1,427,777 |
|
|
| 32 George Putnam Balanced Fund |
| | |
| CORPORATE BONDS AND NOTES (15.4%)* cont. | Principal amount | Value |
|
| Financials cont. | | |
| Massachusetts Mutual Life Insurance Co. 144A unsec. sub. notes | | |
| 8 7/8s, 2039 | $1,290,000 | $1,907,675 |
|
| Merrill Lynch & Co., Inc. unsec. sub. FRN 1.272s, 2026 | 275,000 | 236,833 |
|
| Merrill Lynch & Co., Inc. unsec. sub. notes 6.11s, 2037 | 600,000 | 675,418 |
|
| MetLife Capital Trust IV 144A jr. unsec. sub. notes 7 7/8s, 2037 | 2,564,000 | 3,076,800 |
|
| Mid-America Apartments LP sr. unsec. notes 4.3s, 2023 R | 285,000 | 296,750 |
|
| Nationwide Mutual Insurance Co. 144A unsec. sub. notes | | |
| 8 1/4s, 2031 | 415,000 | 551,518 |
|
| Neuberger Berman Group, LLC/Neuberger Berman Finance | | |
| Corp. 144A sr. unsec. notes 4 7/8s, 2045 | 840,000 | 720,300 |
|
| Nordea Bank AB 144A unsec. sub. notes 4 7/8s, 2021 (Sweden) | 1,300,000 | 1,406,335 |
|
| OneAmerica Financial Partners, Inc. 144A sr. unsec. | | |
| notes 7s, 2033 | 370,000 | 411,456 |
|
| Pacific LifeCorp 144A sr. unsec. notes 6s, 2020 | 365,000 | 410,668 |
|
| Peachtree Corners Funding Trust 144A company guaranty sr. | | |
| unsec. unsub. bonds 3.976s, 2025 | 140,000 | 140,474 |
|
| Primerica, Inc. sr. unsec. notes 4 3/4s, 2022 | 213,000 | 230,879 |
|
| Progressive Corp. (The) jr. unsec. sub. FRN 6.7s, 2037 | 1,939,000 | 1,929,305 |
|
| Prudential Financial, Inc. jr. unsec. sub. FRN 5 5/8s, 2043 | 359,000 | 362,590 |
|
| Prudential Financial, Inc. jr. unsec. sub. FRN 5.2s, 2044 | 1,153,000 | 1,121,293 |
|
| Realty Income Corp. sr. unsec. notes 4.65s, 2023 R | 1,045,000 | 1,099,702 |
|
| Royal Bank of Canada unsec. sub. notes Ser. GMTN, 4.65s, | | |
| 2026 (Canada) | 420,000 | 420,678 |
|
| Royal Bank of Scotland Group PLC jr. unsec. sub. FRB 8s, | | |
| perpetual maturity (United Kingdom) | 1,815,000 | 1,869,450 |
|
| Royal Bank of Scotland Group PLC unsec. sub. bonds 5 1/8s, | | |
| 2024 (United Kingdom) | 425,000 | 426,658 |
|
| Royal Bank of Scotland PLC (The) unsec. sub. FRN Ser. REGS, | | |
| 9 1/2s, 2022 (United Kingdom) | 1,510,000 | 1,608,150 |
|
| Santander Issuances SAU company guaranty unsec. sub. notes | | |
| 5.179s, 2025 (Spain) | 1,200,000 | 1,137,966 |
|
| Santander Issuances SAU 144A company guaranty unsec. sub. | | |
| notes 5.911s, 2016 (Spain) | 1,100,000 | 1,112,942 |
|
| Santander UK PLC 144A unsec. sub. notes 5s, 2023 | | |
| (United Kingdom) | 630,000 | 659,665 |
|
| Select Income REIT sr. unsec. unsub. notes 3.6s, 2020 R | 290,000 | 292,815 |
|
| Select Income REIT sr. unsec. unsub. notes 2.85s, 2018 R | 290,000 | 290,093 |
|
| Standard Chartered PLC 144A jr. unsec. sub. FRB 7.014s, | | |
| perpetual maturity (United Kingdom) | 1,400,000 | 1,484,000 |
|
| State Street Capital Trust IV company guaranty jr. unsec. sub. | | |
| FRB 1.512s, 2037 | 2,021,000 | 1,576,380 |
|
| Sumitomo Mitsui Financial Group, Inc. 144A unsec. sub. bonds | | |
| 4.436s, 2024 (Japan) | 825,000 | 862,701 |
|
| Teachers Insurance & Annuity Association of America 144A | | |
| unsec. sub. notes 6.85s, 2039 | 263,000 | 328,330 |
|
| TIERS Trust/United States 144A sr. bonds stepped-coupon | | |
| zero % (8 1/8s, 3/15/18), 2046 †† | 570,000 | 595,650 |
|
| Travelers Property Casualty Corp. company guaranty sr. unsec. | | |
| unsub. bonds 7 3/4s, 2026 | 295,000 | 395,790 |
|
| UBS AG/Stamford, CT unsec. sub. notes 7 5/8s, 2022 | 2,640,000 | 2,988,586 |
|
|
| George Putnam Balanced Fund 33 |
| | |
| CORPORATE BONDS AND NOTES (15.4%)* cont. | Principal amount | Value |
|
| Financials cont. | | |
| Wachovia Bank NA unsec. sub. notes Ser. BKNT, 6s, 2017 | $1,060,000 | $1,138,921 |
|
| Wells Fargo & Co. jr. unsec. sub. FRB Ser. U, 5 7/8s, | | |
| perpetual maturity | 580,000 | 610,450 |
|
| Willis Towers Watson PLC company guaranty sr. unsec. unsub. | | |
| notes 5 3/4s, 2021 | 710,000 | 792,467 |
|
| WP Carey, Inc. sr. unsec. unsub. notes 4.6s, 2024 R | 1,050,000 | 1,050,679 |
|
| ZFS Finance USA Trust V 144A jr. unsec. sub. FRB 6 1/2s, 2037 | 214,000 | 215,070 |
|
| 81,709,225 |
| Government (0.4%) | | |
| International Bank for Reconstruction & Development sr. unsec. | | |
| unsub. bonds 7 5/8s, 2023 (Supra-Nation) | 4,000,000 | 5,477,896 |
|
| 5,477,896 |
| Health care (0.3%) | | |
| AbbVie, Inc. sr. unsec. notes 3.6s, 2025 | 194,000 | 194,119 |
|
| Actavis Funding SCS company guaranty sr. unsec. notes 4 3/4s, | | |
| 2045 (Luxembourg) | 373,000 | 372,978 |
|
| Actavis Funding SCS company guaranty sr. unsec. notes 3.45s, | | |
| 2022 (Luxembourg) | 186,000 | 188,744 |
|
| Aetna, Inc. sr. unsec. notes 6 3/4s, 2037 | 95,000 | 118,094 |
|
| Anthem, Inc. sr. unsec. unsub. notes 4 5/8s, 2042 | 205,000 | 191,893 |
|
| HCA, Inc. company guaranty sr. sub. notes 5s, 2024 | 430,000 | 435,375 |
|
| Omega Healthcare Investors, Inc. company guaranty sr. unsec. | | |
| bonds 5 1/4s, 2026 R | 510,000 | 529,125 |
|
| Omega Healthcare Investors, Inc. company guaranty sr. unsec. | | |
| notes 4 1/2s, 2027 R | 145,000 | 138,656 |
|
| Omega Healthcare Investors, Inc. company guaranty sr. unsec. | | |
| unsub. notes 4.95s, 2024 R | 659,000 | 668,905 |
|
| Quest Diagnostics, Inc. company guaranty sr. unsec. notes | | |
| 4 3/4s, 2020 | 121,000 | 130,305 |
|
| UnitedHealth Group, Inc. sr. unsec. unsub. notes 4 5/8s, 2041 | 300,000 | 310,548 |
|
| 3,278,742 |
| Technology (0.2%) | | |
| Apple, Inc. sr. unsec. notes 3.45s, 2024 | 215,000 | 222,829 |
|
| Apple, Inc. sr. unsec. unsub. notes 4 3/8s, 2045 | 297,000 | 289,554 |
|
| Apple, Inc. sr. unsec. unsub. notes 3.85s, 2043 | 421,000 | 377,925 |
|
| Fidelity National Information Services, Inc. company guaranty sr. | | |
| unsec. unsub. notes 5s, 2022 | 948,000 | 980,703 |
|
| Jabil Circuit, Inc. sr. unsec. sub. notes 8 1/4s, 2018 | 162,000 | 176,175 |
|
| SoftBank Corp. 144A company guaranty sr. unsec. unsub. notes | | |
| 4 1/2s, 2020 (Japan) | 245,000 | 242,550 |
|
| 2,289,736 |
| Transportation (0.2%) | | |
| Aviation Capital Group Corp. 144A sr. unsec. unsub. notes | | |
| 7 1/8s, 2020 | 265,000 | 298,788 |
|
| Burlington Northern Santa Fe, LLC sr. unsec. notes 5.4s, 2041 | 605,000 | 661,089 |
|
| Burlington Northern Santa Fe, LLC sr. unsec. unsub. notes | | |
| 5 3/4s, 2040 | 145,000 | 166,297 |
|
| Continental Airlines, Inc. pass-through certificates | | |
| Ser. 97-4A, 6.9s, 2018 | 31,443 | 32,128 |
|
| Continental Airlines, Inc. pass-through certificates Ser. 98-1A, | | |
| 6.648s, 2017 | 112,941 | 115,058 |
|
| Norfolk Southern Corp. sr. unsec. unsub. bonds 6s, 2111 | 390,000 | 414,342 |
|
|
| 34 George Putnam Balanced Fund |
| | |
| CORPORATE BONDS AND NOTES (15.4%)* cont. | Principal amount | Value |
|
| Transportation cont. | | |
| Southwest Airlines Co. pass-through certificates Ser. 07-1, | | |
| 6.15s, 2022 | $601,089 | $667,209 |
|
| United Airlines 2014-2 Class A Pass Through Trust sr. notes | | |
| Ser. A, 3 3/4s, 2026 | 225,000 | 227,813 |
|
| 2,582,724 |
| Utilities and power (1.4%) | | |
| Appalachian Power Co. sr. unsec. unsub. notes Ser. L, 5.8s, 2035 | 510,000 | 580,353 |
|
| Arizona Public Services Co. sr. unsec. notes 4 1/2s, 2042 | 138,000 | 146,908 |
|
| Beaver Valley II Funding Corp. sr. bonds 9s, 2017 | 35,000 | 37,100 |
|
| Commonwealth Edison Co. sr. mtge. bonds 5 7/8s, 2033 | 595,000 | 715,460 |
|
| Consolidated Edison Co. of New York, Inc. sr. unsec. unsub. | | |
| notes 4.2s, 2042 | 220,000 | 217,255 |
|
| Duke Energy Carolinas, LLC sr. mtge. notes 4 1/4s, 2041 | 450,000 | 459,573 |
|
| EDP Finance BV 144A sr. unsec. unsub. notes 6s, | | |
| 2018 (Netherlands) | 685,000 | 720,483 |
|
| EDP Finance BV 144A sr. unsec. unsub. notes 5 1/4s, | | |
| 2021 (Netherlands) | 365,000 | 374,683 |
|
| El Paso Natural Gas Co., LLC company guaranty sr. unsec. | | |
| unsub. notes 8 3/8s, 2032 | 490,000 | 471,812 |
|
| Electricite de France (EDF) 144A jr. unsec. sub. FRN 5 5/8s, | | |
| perpetual maturity (France) | 360,000 | 324,000 |
|
| Electricite de France (EDF) 144A jr. unsec. sub. FRN 5 1/4s, | | |
| perpetual maturity (France) | 252,000 | 224,280 |
|
| Electricite de France (EDF) 144A sr. unsec. notes 6.95s, | | |
| 2039 (France) | 784,000 | 983,503 |
|
| Electricite de France (EDF) 144A sr. unsec. unsub. notes 6s, | | |
| 2114 (France) | 200,000 | 205,550 |
|
| Electricite de France (EDF) 144A sr. unsec. unsub. notes 5.6s, | | |
| 2040 (France) | 640,000 | 705,225 |
|
| Enel Finance International SA 144A company guaranty sr. unsec. | | |
| unsub. notes 5 1/8s, 2019 (Netherlands) | 360,000 | 393,444 |
|
| Energy Transfer Partners LP sr. unsec. unsub. notes 7.6s, 2024 | 470,000 | 453,846 |
|
| Energy Transfer Partners LP sr. unsec. unsub. notes 6 1/2s, 2042 | 766,000 | 590,580 |
|
| Energy Transfer Partners LP sr. unsec. unsub. notes 5.2s, 2022 | 240,000 | 214,970 |
|
| Enterprise Products Operating, LLC company guaranty sr. | | |
| unsec. unsub. notes 4.85s, 2042 | 370,000 | 302,906 |
|
| FirstEnergy Transmission, LLC 144A sr. unsec. unsub. notes | | |
| 5.45s, 2044 | 1,120,000 | 1,170,388 |
|
| Iberdrola International BV company guaranty sr. unsec. unsub. | | |
| bonds 6 3/4s, 2036 (Spain) | 185,000 | 229,842 |
|
| ITC Holdings Corp. 144A sr. unsec. notes 6.05s, 2018 | 365,000 | 395,033 |
|
| Kansas Gas and Electric Co. sr. bonds 5.647s, 2021 | 200,028 | 201,028 |
|
| Kinder Morgan Energy Partners LP company guaranty sr. unsec. | | |
| notes 5.4s, 2044 | 179,000 | 134,366 |
|
| Kinder Morgan Energy Partners LP company guaranty sr. unsec. | | |
| notes 3 1/2s, 2021 | 420,000 | 371,487 |
|
| Kinder Morgan, Inc. company guaranty sr. unsec. unsub. notes | | |
| 3.05s, 2019 | 235,000 | 217,526 |
|
| Oncor Electric Delivery Co., LLC sr. notes 7s, 2022 | 445,000 | 540,088 |
|
| Oncor Electric Delivery Co., LLC sr. notes 4.1s, 2022 | 441,000 | 469,531 |
|
| Pacific Gas & Electric Co. sr. unsec. notes 6.35s, 2038 | 418,000 | 524,332 |
|
|
| George Putnam Balanced Fund 35 |
| | |
| CORPORATE BONDS AND NOTES (15.4%)* cont. | Principal amount | Value |
|
| Utilities and power cont. | | |
| Pacific Gas & Electric Co. sr. unsec. unsub. notes 5.8s, 2037 | $140,000 | $168,358 |
|
| Potomac Edison Co. (The) 144A sr. bonds 5.8s, 2016 | 331,000 | 338,925 |
|
| PPL Capital Funding, Inc. company guaranty sr. unsec. unsub. | | |
| notes 4.2s, 2022 | 145,000 | 153,764 |
|
| Puget Sound Energy, Inc. jr. unsec. sub. FRN Ser. A, | | |
| 6.974s, 2067 | 656,000 | 501,020 |
|
| Texas-New Mexico Power Co. 144A 1st sr. bonds Ser. A, | | |
| 9 1/2s, 2019 | 889,000 | 1,070,201 |
|
| TransCanada PipeLines, Ltd. jr. unsec. sub. FRN 6.35s, | | |
| 2067 (Canada) | 1,145,000 | 764,288 |
|
| WEC Energy Group jr. unsec. sub. FRN 6 1/4s, 2067 | 1,945,000 | 1,400,400 |
|
| Westar Energy, Inc. sr. mtge. notes 4 1/8s, 2042 | 210,000 | 214,719 |
|
| | | 16,987,227 |
| | | |
| Total corporate bonds and notes (cost $183,315,539) | | $185,909,882 |
|
| |
| MORTGAGE-BACKED SECURITIES (1.5%)* | Principal amount | Value |
|
| Citigroup Commercial Mortgage Trust | | |
| FRB Ser. 07-C6, Class A4, 5.898s, 2049 | $2,500,000 | $2,553,363 |
| Ser. 14-GC21, Class AS, 4.026s, 2047 | 508,000 | 540,995 |
|
| COMM Mortgage Trust | | |
| FRB Ser. 12-LC4, Class C, 5.82s, 2044 | 500,000 | 542,470 |
| FRB Ser. 14-CR18, Class C, 4.896s, 2047 | 3,089,000 | 3,091,284 |
| Ser. 13-CR13, Class AM, 4.449s, 2023 | 614,000 | 658,101 |
| Ser. 12-LC4, Class AM, 4.063s, 2044 | 730,000 | 775,844 |
| Ser. 12-CR1, Class AM, 3.912s, 2045 | 1,046,000 | 1,078,830 |
|
| Federal Home Loan Mortgage Corporation | | |
| FRB Ser. T-56, Class A, IO, 0.524s, 2043 F | 3,718,202 | 62,272 |
| FRB Ser. T-56, Class 2, IO, zero %, 2043 F | 5,466,557 | — |
|
| Federal National Mortgage Association Ser. 01-79, Class BI, IO, | | |
| 0.305s, 2045 F | 1,094,104 | 10,185 |
|
| FIRSTPLUS Home Loan Owner Trust Ser. 97-3, Class B1, 7.79s, | | |
| 2023 (In default) † | 194,241 | 19 |
|
| GE Business Loan Trust 144A FRB Ser. 04-2, Class D, | | |
| 3.176s, 2032 | 75,134 | 67,260 |
|
| JPMBB Commercial Mortgage Securities Trust Ser. 13-C14, | | |
| Class AS, 4.409s, 2046 | 493,000 | 530,465 |
|
| JPMorgan Chase Commercial Mortgage Securities Trust | | |
| Ser. 06-LDP8, Class A4, 5.399s, 2045 F | 571,981 | 575,007 |
| FRB Ser. 12-C6, Class D, 5.365s, 2045 | 772,000 | 777,095 |
| Ser. 04-LN2, Class A2, 5.115s, 2041 | 19,436 | 19,451 |
| FRB Ser. 13-C13, Class C, 4.189s, 2046 | 450,000 | 431,901 |
|
| JPMorgan Chase Commercial Mortgage Securities Trust 144A | | |
| FRB Ser. 12-C8, Class D, 4.814s, 2045 | 524,000 | 495,128 |
|
| LB Commercial Mortgage Trust 144A | | |
| Ser. 99-C1, Class G, 6.41s, 2031 | 254,267 | 262,985 |
| Ser. 98-C4, Class H, 5.6s, 2035 | 552,751 | 565,165 |
|
| ML-CFC Commercial Mortgage Trust FRB Ser. 06-2, Class AM, | | |
| 6.082s, 2046 | 935,000 | 942,592 |
|
|
| 36 George Putnam Balanced Fund |
| | |
| MORTGAGE-BACKED SECURITIES (1.5%)* cont. | Principal amount | Value |
|
| Morgan Stanley Capital I Trust 144A FRB Ser. 12-C4, Class D, | | |
| 5.709s, 2045 | $1,794,000 | $1,917,965 |
|
| Structured Asset Securities Corp. 144A Ser. 98-RF3, Class A, | | |
| IO, 6.1s, 2028 | 53,054 | 5,770 |
|
| TIAA Real Estate CDO, Ltd. 144A Ser. 03-1A, Class E, 8s, 2038 | 2,189,091 | 547,273 |
|
| UBS-Barclays Commercial Mortgage Trust 144A FRB Ser. 12-C4, | | |
| Class XA, IO, 1.809s, 2045 | 13,014,038 | 1,118,790 |
|
| WF-RBS Commercial Mortgage Trust Ser. 14-C19, Class C, | | |
| 4.646s, 2047 F | 394,000 | 398,612 |
|
| Total mortgage-backed securities (cost $18,243,738) | | $17,968,822 |
|
| |
| CONVERTIBLE PREFERRED STOCKS (0.1%)* | Shares | Value |
|
| Oportun Financial Corp. Ser. A-1, 8.00% cv. pfd. (acquired 6/23/15, | | |
cost $1,057) (Private) † ∆∆ F | 371 | $952 |
|
| Oportun Financial Corp. Ser. B-1, 8.00% cv. pfd. (acquired 6/23/15, | | |
cost $20,210) (Private) † ∆∆ F | 6,416 | 18,189 |
|
| Oportun Financial Corp. Ser. C-1, 8.00% cv. pfd. (acquired 6/23/15, | | |
cost $47,464) (Private) † ∆∆ F | 9,325 | 42,718 |
|
| Oportun Financial Corp. Ser. D-1, 8.00% cv. pfd. (acquired 6/23/15, | | |
cost $68,847) (Private) † ∆∆ F | 13,526 | 61,963 |
|
| Oportun Financial Corp. Ser. E-1, 8.00% cv. pfd. (acquired 6/23/15, | | |
cost $38,611) (Private) † ∆∆ F | 7,033 | 34,750 |
|
| Oportun Financial Corp. Ser. F, 8.00% cv. pfd. (acquired 6/23/15, cost | | |
$116,544) (Private) † ∆∆ F | 15,175 | 104,890 |
|
| Oportun Financial Corp. Ser. F-1, 8.00% cv. pfd. (acquired 6/23/15, | | |
cost $326,895) (Private) † ∆∆ F | 114,700 | 294,206 |
|
| Oportun Financial Corp. Ser. G, 8.00% cv. pfd. (acquired 6/23/15, cost | | |
$413,355) (Private) † ∆∆ F | 145,037 | 372,020 |
|
| Oportun Financial Corp. Ser. H, 8.00% cv. pfd. (acquired 2/6/15, cost | | |
$633,655) (Private) † ∆∆ F | 222,546 | 570,290 |
|
| Total convertible preferred stocks (cost $1,666,638) | | $1,499,978 |
|
| |
| MUNICIPAL BONDS AND NOTES (0.1%)* | Principal amount | Value |
|
| CA State G.O. Bonds (Build America Bonds), 7 1/2s, 4/1/34 | $215,000 | $304,468 |
|
| North TX, Tollway Auth. Rev. Bonds (Build America Bonds), | | |
| 6.718s, 1/1/49 | 350,000 | 497,301 |
|
| OH State U. Rev. Bonds (Build America Bonds), 4.91s, 6/1/40 | 275,000 | 322,055 |
|
| Total municipal bonds and notes (cost $841,369) | | $1,123,824 |
| | | |
| PURCHASED OPTIONS | Expiration date/ | Contract | |
| OUTSTANDING (0.0%)* | strike price | amount | Value |
|
| General Dynamics Corp. (Call) | Feb-16/$140.00 | $232,778 | $134,753 |
|
| Total purchased options outstanding (cost $51,211) | | | $134,753 |
|
| George Putnam Balanced Fund 37 |
| | | |
| SHORT-TERM INVESTMENTS (6.1%)* | Principal amount/shares | Value |
|
| Putnam Short Term Investment Fund 0.39% L | Shares | 72,356,242 | $72,356,242 |
|
| SSgA Prime Money Market Fund Class N 0.31% P | Shares | 780,000 | 780,000 |
|
| U.S. Treasury Bills 0.17%, February 18, 2016 | | $130,000 | 129,987 |
|
| U.S. Treasury Bills 0.16%, February 11, 2016 | | 109,000 | 108,994 |
|
| Total short-term investments (cost $73,375,227) | | | $73,375,223 |
|
| |
| TOTAL INVESTMENTS | | | |
|
| Total investments (cost $1,288,111,271) | | | $1,272,812,003 |
| |
| Key to holding’s abbreviations |
| ADR | American Depository Receipts: represents ownership of foreign securities on deposit with a custodian bank |
| BKNT | Bank Note |
| FRB | Floating Rate Bonds: the rate shown is the current interest rate at the close of the reporting period |
| FRN | Floating Rate Notes: the rate shown is the current interest rate or yield at the close of the reporting period |
| GMTN | Global Medium Term Notes |
| G.O. Bonds | General Obligation Bonds |
| IO | Interest Only |
| MTN | Medium Term Notes |
| REGS | Securities sold under Regulation S may not be offered, sold or delivered within the United States except pursuant to an exemption from, or in a transaction not subject to, the registration requirements of the Securities Act of 1933. |
| TBA | To Be Announced Commitments |
Notes to the fund’s portfolio
Unless noted otherwise, the notes to the fund’s portfolio are for the close of the fund’s reporting period, which ran from August 1, 2015 through January 31, 2016 (the reporting period). Within the following notes to the portfolio, references to “ASC 820” represent Accounting Standards Codification 820 Fair Value Measurements and Disclosures and references to “OTC”, if any, represent over-the-counter.
* Percentages indicated are based on net assets of $1,208,343,587.
† This security is non-income-producing.
†† The interest rate and date shown parenthetically represent the new interest rate to be paid and the date the fund will begin accruing interest at this rate.
∆∆ This security is restricted with regard to public resale. The total fair value of this security and any other restricted securities (excluding 144A securities), if any, held at the close of the reporting period was $2,235,269, or 0.2% of net assets.
∆ This security, in part or in entirety, was pledged and segregated with the custodian for collateral on certain derivative contracts at the close of the reporting period.
## Forward commitment, in part or in entirety (Note 1).
F This security is valued by Putnam Management at fair value following procedures approved by the Trustees. Securities may be classified as Level 2 or Level 3 for ASC 820 based on the securities’ valuation inputs. At the close of the reporting period, fair value pricing was also used for certain foreign securities in the portfolio (Note 1).
i This security was pledged, or purchased with cash that was pledged, to the fund for collateral on certain derivative contracts (Note 1).
L Affiliated company (Note 5). The rate quoted in the security description is the annualized 7-day yield of the fund at the close of the reporting period.
|
| 38 George Putnam Balanced Fund |
P This security was pledged, or purchased with cash that was pledged, to the fund for collateral on certain derivative contracts. The rate quoted in the security description is the annualized 7-day yield of the fund at the close of the reporting period (Note 1).
R Real Estate Investment Trust.
At the close of the reporting period, the fund maintained liquid assets totaling $43,288,760 to cover certain derivative contracts and delayed delivery securities.
Unless otherwise noted, the rates quoted in Short-term investments security descriptions represent the weighted average yield to maturity.
Debt obligations are considered secured unless otherwise indicated.
144A after the name of an issuer represents securities exempt from registration under Rule 144A under the Securities Act of 1933, as amended. These securities may be resold in transactions exempt from registration, normally to qualified institutional buyers.
See Note 1 to the financial statements regarding TBA commitments.
The dates shown on debt obligations are the original maturity dates.
| | | | | | |
| FORWARD CURRENCY CONTRACTS at 1/31/16 (aggregate face value $40,604,250) (Unaudited) | |
| | | | | | Unrealized |
| | Contract | Delivery | | Aggregate | appreciation/ |
| Counterparty | Currency | type | date | Value | face value | (depreciation) |
|
| Barclays Bank PLC | | | | | |
| Canadian Dollar | Sell | 4/20/16 | $2,655,316 | $2,708,591 | $53,275 |
|
| Citibank, N.A. | | | | | |
| Euro | Sell | 3/16/16 | 3,946,768 | 3,877,110 | (69,658) |
|
| Credit Suisse International | | | | | |
| British Pound | Sell | 3/16/16 | 7,649,566 | 8,096,329 | 446,763 |
|
| Canadian Dollar | Sell | 4/20/16 | 1,752,840 | 1,767,149 | 14,309 |
|
| Deutsche Bank AG | | | | | |
| British Pound | Sell | 3/16/16 | 6,146,329 | 6,503,896 | 357,567 |
|
| HSBC Bank USA, National Association | | | | |
| British Pound | Sell | 3/16/16 | 79,515 | 84,165 | 4,650 |
|
| Euro | Sell | 3/16/16 | 1,095,656 | 1,076,444 | (19,212) |
|
| JPMorgan Chase Bank N.A. | | | | | |
| British Pound | Buy | 3/16/16 | 1,853,931 | 1,892,115 | (38,184) |
|
| Canadian Dollar | Sell | 4/20/16 | 4,052,719 | 4,085,029 | 32,310 |
|
| State Street Bank and Trust Co. | | | | | |
| Euro | Buy | 3/16/16 | 2,797,647 | 2,824,826 | (27,179) |
|
| Israeli Shekel | Sell | 4/20/16 | 2,144,298 | 2,164,226 | 19,928 |
|
| UBS AG | | | | | |
| Euro | Sell | 3/16/16 | 2,663,388 | 2,616,197 | (47,191) |
|
| WestPac Banking Corp. | | | | | |
| Canadian Dollar | Sell | 4/20/16 | 2,886,182 | 2,908,173 | 21,991 |
|
| Total | | | | | $749,369 |
|
| George Putnam Balanced Fund 39 |
| | | | |
| TBA SALE COMMITMENTS OUTSTANDING at 1/31/16 (proceeds receivable $15,374,922) (Unaudited) | |
| | Principal | | Settlement | |
| Agency | amount | | date | Value |
|
| |
| Federal Home Loan Mortgage Corporation, 3 1/2s, | | | | |
| February 1, 2046 | $4,000,000 | | 2/11/46 | $4,180,000 |
|
| Federal National Mortgage Association, 3 1/2s, | | | | |
| March 1, 2046 | 1,000,000 | | 3/14/46 | 1,044,375 |
|
| Federal National Mortgage Association, 3 1/2s, | | | | |
| February 1, 2046 | 2,000,000 | | 2/11/46 | 2,094,570 |
|
| Federal National Mortgage Association, 3s, | | | | |
| February 1, 2046 | 8,000,000 | | 2/11/46 | 8,164,375 |
|
| Total | | | | $15,483,320 |
| | | | | | | |
| OTC TOTAL RETURN SWAP CONTRACTS OUTSTANDING at 1/31/16 (Unaudited) | | |
| | | Upfront | | | Payments | Total return | Unrealized |
| Swap counterparty/ | premium | Termination | | received (paid) by | received by | appreciation/ |
| Notional amount | received (paid) | date | | fund per annum | or paid by fund | (depreciation) |
|
| JPMorgan Chase Bank N.A. | | | | | |
| baskets | 24,187 | $— | 7/16/16 | | (3 month USD- | A basket | $46,102 |
| | | | | | LIBOR-BBA plus | (JPCMPTMD) of | |
| | | | | | 0.30%) | common stocks | |
|
| Total | | $— | | | | | $46,102 |
|
| 40 George Putnam Balanced Fund |
ASC 820 establishes a three-level hierarchy for disclosure of fair value measurements. The valuation hierarchy is based upon the transparency of inputs to the valuation of the fund’s investments. The three levels are defined as follows:
Level 1: Valuations based on quoted prices for identical securities in active markets.
Level 2: Valuations based on quoted prices in markets that are not active or for which all significant inputs are observable, either directly or indirectly.
Level 3: Valuations based on inputs that are unobservable and significant to the fair value measurement.
The following is a summary of the inputs used to value the fund’s net assets as of the close of the reporting period:
| | | |
| | | Valuation inputs |
|
| Investments in securities: | Level 1 | Level 2 | Level 3 |
|
| Common stocks*: | | | |
|
| Basic materials | $27,249,526 | $3,583,830 | $— |
|
| Capital goods | 31,655,007 | 861,199 | — |
|
| Communication services | 36,383,503 | — | — |
|
| Conglomerates | 9,578,310 | — | — |
|
| Consumer cyclicals | 89,581,325 | — | — |
|
| Consumer staples | 76,064,260 | — | 387,005 |
|
| Energy | 39,206,986 | 5,576,957 | — |
|
| Financials | 111,355,086 | 3,155,227 | 348,286 |
|
| Health care | 98,791,430 | — | — |
|
| Technology | 151,824,540 | 1,397,655 | — |
|
| Transportation | 10,646,841 | — | — |
|
| Utilities and power | 24,625,234 | — | — |
|
| Total common stocks | 706,962,048 | 14,574,868 | 735,291 |
| | | | |
| Convertible preferred stocks | $— | $— | $1,499,978 |
|
| Corporate bonds and notes | — | 185,314,232 | 595,650 |
|
| Mortgage-backed securities | — | 17,421,530 | 547,292 |
|
| Municipal bonds and notes | — | 1,123,824 | — |
|
| Purchased options outstanding | — | 134,753 | — |
|
| U.S. government and agency mortgage obligations | — | 91,567,722 | — |
|
| U.S. treasury obligations | — | 178,959,592 | — |
|
| Short-term investments | 73,136,242 | 238,981 | — |
|
| Totals by level | $780,098,290 | $489,335,502 | $3,378,211 |
| | | |
| | | Valuation inputs |
|
| Other financial instruments: | Level 1 | Level 2 | Level 3 |
|
| Forward currency contracts | $— | $749,369 | $— |
|
| TBA sale commitments | — | (15,483,320) | — |
|
| Total return swap contracts | — | 46,102 | — |
|
| Totals by level | $— | $(14,687,849) | $— |
* Common stock classifications are presented at the sector level, which may differ from the fund’s portfolio presentation.
During the reporting period, transfers within the fair value hierarchy, if any, (other than certain transfers involving non-U.S. equity securities as described in Note 1) did not represent, in the aggregate, more than 1% of the fund’s net assets measured as of the end of the period. Transfers are accounted for using the end of period pricing valuation method.
At the start and close of the reporting period, Level 3 investments in securities represented less than 1% of the fund’s net assets and were not considered a significant portion of the fund’s portfolio.
The accompanying notes are an integral part of these financial statements.
|
| George Putnam Balanced Fund 41 |
Statement of assets and liabilities 1/31/16 (Unaudited)
| |
| ASSETS | |
|
| Investment in securities, at value (Note 1): | |
| Unaffiliated issuers (identified cost $1,215,755,029) | $1,200,455,761 |
| Affiliated issuers (identified cost $72,356,242) (Notes 1 and 5) | 72,356,242 |
|
| Dividends, interest and other receivables | 4,594,066 |
|
| Receivable for shares of the fund sold | 562,579 |
|
| Receivable for investments sold | 27,938,056 |
|
| Receivable for sales of delayed delivery securities (Note 1) | 12,941,084 |
|
| Unrealized appreciation on forward currency contracts (Note 1) | 950,793 |
|
| Unrealized appreciation on OTC swap contracts (Note 1) | 46,102 |
|
| Prepaid assets | 59,057 |
|
| Total assets | 1,319,903,740 |
| |
| LIABILITIES | |
|
| Payable for investments purchased | 35,488,484 |
|
| Payable for purchases of delayed delivery securities (Note 1) | 55,834,235 |
|
| Payable for shares of the fund repurchased | 1,774,577 |
|
| Payable for compensation of Manager (Note 2) | 536,281 |
|
| Payable for custodian fees (Note 2) | 24,905 |
|
| Payable for investor servicing fees (Note 2) | 303,793 |
|
| Payable for Trustee compensation and expenses (Note 2) | 562,605 |
|
| Payable for administrative services (Note 2) | 11,992 |
|
| Payable for distribution fees (Note 2) | 282,537 |
|
| Unrealized depreciation on forward currency contracts (Note 1) | 201,424 |
|
| TBA sale commitments, at value (proceeds receivable $15,374,922) (Note 1) | 15,483,320 |
|
| Collateral on certain derivative contracts, at value (Note 1) | 886,136 |
|
| Other accrued expenses | 169,864 |
|
| Total liabilities | 111,560,153 |
| | |
| Net assets | $1,208,343,587 |
|
| |
| REPRESENTED BY | |
|
| Paid-in capital (Unlimited shares authorized) (Notes 1 and 4) | $1,732,208,209 |
|
| Undistributed net investment income (Note 1) | 11,464,520 |
|
| Accumulated net realized loss on investments and foreign currency transactions (Note 1) | (520,721,537) |
|
| Net unrealized depreciation of investments and assets and liabilities in foreign currencies | (14,607,605) |
|
| Total — Representing net assets applicable to capital shares outstanding | $1,208,343,587 |
(Continued on next page)
|
| 42 George Putnam Balanced Fund |
Statement of assets and liabilities (Continued)
| |
| COMPUTATION OF NET ASSET VALUE AND OFFERING PRICE | |
|
| Net asset value and redemption price per class A share | |
| ($897,489,448 divided by 56,421,272 shares) | $15.91 |
|
| Offering price per class A share (100/94.25 of $15.91)* | $16.88 |
|
| Net asset value and offering price per class B share ($20,830,315 divided by 1,324,645 shares)** | $15.73 |
|
| Net asset value and offering price per class C share ($39,372,469 divided by 2,492,910 shares)** | $15.79 |
|
| Net asset value and redemption price per class M share ($65,344,775 divided by 4,164,384 shares) | $15.69 |
|
| Offering price per class M share (100/96.50 of $15.69)* | $16.26 |
|
| Net asset value, offering price and redemption price per class R share | |
| ($387,162 divided by 24,404 shares) | $15.86 |
|
| Net asset value, offering price and redemption price per class R5 share | |
| ($66,133,793 divided by 4,141,843 shares) | $15.97 |
|
| Net asset value, offering price and redemption price per class R6 share | |
| ($36,422,824 divided by 2,280,943 shares) | $15.97 |
|
| Net asset value, offering price and redemption price per class Y share | |
| ($82,362,801 divided by 5,158,979 shares) | $15.96 |
|
* On single retail sales of less than $50,000. On sales of $50,000 or more the offering price is reduced.
** Redemption price per share is equal to net asset value less any applicable contingent deferred sales charge.
The accompanying notes are an integral part of these financial statements.
|
| George Putnam Balanced Fund 43 |
Statement of operations Six months ended 1/31/16 (Unaudited)
| |
| INVESTMENT INCOME | |
|
| Interest (including interest income of $82,254 from investments in affiliated issuers) (Note 5) | $7,084,116 |
|
| Dividends (net of foreign tax of $32,331) | 6,895,378 |
|
| Total investment income | 13,979,494 |
| |
| EXPENSES | |
|
| Compensation of Manager (Note 2) | 3,307,382 |
|
| Investor servicing fees (Note 2) | 1,005,611 |
|
| Custodian fees (Note 2) | 34,556 |
|
| Trustee compensation and expenses (Note 2) | 49,068 |
|
| Distribution fees (Note 2) | 1,753,225 |
|
| Administrative services (Note 2) | 19,731 |
|
| Other | 257,472 |
|
| Total expenses | 6,427,045 |
| | |
| Expense reduction (Note 2) | (36,276) |
|
| Net expenses | 6,390,769 |
| | |
| Net investment income | 7,588,725 |
|
| |
| Net realized loss on investments (Notes 1 and 3) | (3,637,548) |
|
| Net increase from payments by affiliates (Note 2) | 1,040 |
|
| Net realized loss on swap contracts (Note 1) | (711,993) |
|
| Net realized loss on futures contracts (Note 1) | (424,206) |
|
| Net realized gain on foreign currency transactions (Note 1) | 1,592,090 |
|
| Net realized gain on written options (Notes 1 and 3) | 37,460 |
|
| Net unrealized appreciation of assets and liabilities in foreign currencies during the period | 555,480 |
|
| Net unrealized depreciation of investments, futures contracts, swap contracts, written options, | |
| and TBA sale commitments during the period | (98,738,650) |
|
| Net loss on investments | (101,326,327) |
| | |
| Net decrease in net assets resulting from operations | $(93,737,602) |
|
The accompanying notes are an integral part of these financial statements.
|
| 44 George Putnam Balanced Fund |
Statement of changes in net assets
| | |
| INCREASE (DECREASE) IN NET ASSETS | Six months ended 1/31/16* | Year ended 7/31/15 |
|
| Operations: | | |
| Net investment income | $7,588,725 | $14,483,589 |
|
| Net realized gain (loss) on investments | | |
| and foreign currency transactions | (3,143,157) | 97,366,655 |
|
| Net unrealized depreciation of investments and assets | | |
| and liabilities in foreign currencies | (98,183,170) | (9,196,272) |
|
| Net increase (decrease) in net assets resulting | | |
| from operations | (93,737,602) | 102,653,972 |
|
| Distributions to shareholders (Note 1): | | |
| From ordinary income | | |
| Net investment income | | |
|
| Class A | (5,561,479) | (11,916,224) |
|
| Class B | (46,531) | (102,407) |
|
| Class C | (84,553) | (136,312) |
|
| Class M | (242,333) | (516,374) |
|
| Class R | (2,718) | (9,433) |
|
| Class R5 | (491,489) | (462,840) |
|
| Class R6 | (183,418) | (114,367) |
|
| Class Y | (686,847) | (1,598,783) |
|
| Decrease from capital share transactions (Note 4) | (22,606,406) | (58,104,377) |
|
| Total increase (decrease) in net assets | (123,643,376) | 29,692,855 |
| |
| NET ASSETS | | |
|
| Beginning of period | 1,331,986,963 | 1,302,294,108 |
|
| End of period (including undistributed net investment | | |
| income of $11,464,520 and $11,175,163, respectively) | $1,208,343,587 | $1,331,986,963 |
|
* Unaudited.
The accompanying notes are an integral part of these financial statements.
|
| George Putnam Balanced Fund 45 |
Financial highlights (For a common share outstanding throughout the period)
| | | | | | | | | | | | | | | | | | | | | | | | | | | | |
| INVESTMENT OPERATIONS: | | | | | | | | LESS DISTRIBUTIONS: | | | | | | | | | | RATIOS AND SUPPLEMENTAL DATA: | | |
|
| | | | | | | | | | | | | | | | | | | | | | | | | | | Ratio | | |
| | | | | | | Net realized | | | | | | | | | | | | | | | | | | Ratio | | of net investment | | |
| | | Net asset value, | | | | and unrealized | | Total from | | From | | | | | | | | | | Total return | | Net assets, | | of expenses | | income (loss) | | Portfolio |
| | | beginning | | Net investment | | gain (loss) | | investment | | net investment | | Total | | Redemption | | Non-recurring | | Net asset value, | | at net asset | | end of period | | to average | | to average | | turnover |
| Period ended | | of period | | income (loss) a | | on investments | | operations | | income | | distributions | | fees | | reimbursements | | end of period | | value (%) b | | (in thousands) | | net assets (%) c | | net assets (%) | | (%) d |
|
| Class A | | | | | | | | | | | | | | | | | | | | | | | | | | | | |
| January 31, 2016** | | $17.22 | | .10 | | (1.31) | | (1.21) | | (.10) | | (.10) | | — | | — | | $15.91 | | (7.06)* | | $897,489 | | .50* | | .61* | | 84* |
| July 31, 2015 | | 16.12 | | .19 | | 1.10 | | 1.29 | | (.19) | | (.19) | | — | | — | | 17.22 | | 8.04 | | 999,928 | | .97 | | 1.11 | | 130 |
| July 31, 2014 | | 14.81 | | .23 | | 1.29 | | 1.52 | | (.21) | | (.21) | | — | | — | | 16.12 | | 10.37 | | 1,051,287 | | .99 | | 1.52 | | 98 |
| July 31, 2013 | | 12.88 | | .21 | | 1.92 | | 2.13 | | (.20) | | (.20) | | — | | — | | 14.81 | | 16.68 | | 1,030,545 | | 1.01 | | 1.56 | | 86 |
| July 31, 2012 | | 12.21 | | .22 | | .65 | | .87 | | (.20) | | (.20) | | — | | — | | 12.88 | | 7.26 | | 973,318 | | 1.03 | | 1.80 | | 99 |
| July 31, 2011 | | 11.08 | | .19 | | 1.14 | | 1.33 | | (.20) | | (.20) | | — e | | — f | | 12.21 | | 12.09 | | 1,034,828 | | 1.05 | | 1.57 | | 176 |
|
| Class B | | | | | | | | | | | | | | | | | | | | | | | | | | | | |
| January 31, 2016** | | $17.02 | | .04 | | (1.30) | | (1.26) | | (.03) | | (.03) | | — | | — | | $15.73 | | (7.39)* | | $20,830 | | .87* | | .24* | | 84* |
| July 31, 2015 | | 15.94 | | .06 | | 1.09 | | 1.15 | | (.07) | | (.07) | | — | | — | | 17.02 | | 7.21 | | 24,133 | | 1.72 | | .36 | | 130 |
| July 31, 2014 | | 14.65 | | .12 | | 1.27 | | 1.39 | | (.10) | | (.10) | | — | | — | | 15.94 | | 9.51 | | 24,881 | | 1.74 | | .77 | | 98 |
| July 31, 2013 | | 12.74 | | .11 | | 1.90 | | 2.01 | | (.10) | | (.10) | | — | | — | | 14.65 | | 15.83 | | 26,541 | | 1.76 | | .82 | | 86 |
| July 31, 2012 | | 12.08 | | .13 | | .63 | | .76 | | (.10) | | (.10) | | — | | — | | 12.74 | | 6.38 | | 29,272 | | 1.78 | | 1.06 | | 99 |
| July 31, 2011 | | 10.96 | | .10 | | 1.13 | | 1.23 | | (.11) | | (.11) | | — e | | — f | | 12.08 | | 11.24 | | 39,031 | | 1.80 | | .82 | | 176 |
|
| Class C | | | | | | | | | | | | | | | | | | | | | | | | | | | | |
| January 31, 2016** | | $17.10 | | .04 | | (1.31) | | (1.27) | | (.04) | | (.04) | | — | | — | | $15.79 | | (7.45)* | | $39,372 | | .87* | | .23* | | 84* |
| July 31, 2015 | | 16.01 | | .06 | | 1.10 | | 1.16 | | (.07) | | (.07) | | — | | — | | 17.10 | | 7.26 | | 36,720 | | 1.72 | | .36 | | 130 |
| July 31, 2014 | | 14.72 | | .12 | | 1.27 | | 1.39 | | (.10) | | (.10) | | — | | — | | 16.01 | | 9.50 | | 29,091 | | 1.74 | | .76 | | 98 |
| July 31, 2013 | | 12.80 | | .11 | | 1.91 | | 2.02 | | (.10) | | (.10) | | — | | — | | 14.72 | | 15.85 | | 23,534 | | 1.76 | | .81 | | 86 |
| July 31, 2012 | | 12.14 | | .13 | | .64 | | .77 | | (.11) | | (.11) | | — | | — | | 12.80 | | 6.39 | | 21,223 | | 1.78 | | 1.05 | | 99 |
| July 31, 2011 | | 11.02 | | .10 | | 1.13 | | 1.23 | | (.11) | | (.11) | | — e | | — f | | 12.14 | | 11.22 | | 22,013 | | 1.80 | | .82 | | 176 |
|
| Class M | | | | | | | | | | | | | | | | | | | | | | | | | | | | |
| January 31, 2016** | | $16.99 | | .06 | | (1.30) | | (1.24) | | (.06) | | (.06) | | — | | — | | $15.69 | | (7.33)* | | $65,345 | | .75* | | .36* | | 84* |
| July 31, 2015 | | 15.90 | | .10 | | 1.10 | | 1.20 | | (.11) | | (.11) | | — | | — | | 16.99 | | 7.56 | | 75,297 | | 1.47 | | .61 | | 130 |
| July 31, 2014 | | 14.62 | | .16 | | 1.26 | | 1.42 | | (.14) | | (.14) | | — | | — | | 15.90 | | 9.75 | | 77,338 | | 1.49 | | 1.02 | | 98 |
| July 31, 2013 | | 12.71 | | .14 | | 1.90 | | 2.04 | | (.13) | | (.13) | | — | | — | | 14.62 | | 16.17 | | 74,636 | | 1.51 | | 1.06 | | 86 |
| July 31, 2012 | | 12.06 | | .16 | | .63 | | .79 | | (.14) | | (.14) | | — | | — | | 12.71 | | 6.62 | | 70,317 | | 1.53 | | 1.30 | | 99 |
| July 31, 2011 | | 10.94 | | .13 | | 1.13 | | 1.26 | | (.14) | | (.14) | | — e | | — f | | 12.06 | | 11.60 | | 75,160 | | 1.55 | | 1.07 | | 176 |
|
| Class R | | | | | | | | | | | | | | | | | | | | | | | | | | | | |
| January 31, 2016** | | $17.16 | | .09 | | (1.33) | | (1.24) | | (.06) | | (.06) | | — | | — | | $15.86 | | (7.22)* | | $387 | | .62* | | .53* | | 84* |
| July 31, 2015 | | 16.07 | | .15 | | 1.09 | | 1.24 | | (.15) | | (.15) | | — | | — | | 17.16 | | 7.74 | | 1,102 | | 1.22 | | .86 | | 130 |
| July 31, 2014 | | 14.77 | | .20 | | 1.28 | | 1.48 | | (.18) | | (.18) | | — | | — | | 16.07 | | 10.08 | | 983 | | 1.24 | | 1.27 | | 98 |
| July 31, 2013 | | 12.84 | | .18 | | 1.92 | | 2.10 | | (.17) | | (.17) | | — | | — | | 14.77 | | 16.44 | | 960 | | 1.26 | | 1.32 | | 86 |
| July 31, 2012 | | 12.18 | | .19 | | .64 | | .83 | | (.17) | | (.17) | | — | | — | | 12.84 | | 6.92 | | 1,209 | | 1.28 | | 1.54 | | 99 |
| July 31, 2011 | | 11.05 | | .16 | | 1.14 | | 1.30 | | (.17) | | (.17) | | — e | | — f | | 12.18 | | 11.84 | | 1,216 | | 1.30 | | 1.32 | | 176 |
|
| Class R5 | | | | | | | | | | | | | | | | | | | | | | | | | | | | |
| January 31, 2016** | | $17.28 | | .12 | | (1.31) | | (1.19) | | (.12) | | (.12) | | — | | — | | $15.97 | | (6.92)* | | $66,134 | | .37* | | .74* | | 84* |
| July 31, 2015 | | 16.18 | | .23 | | 1.11 | | 1.34 | | (.24) | | (.24) | | — | | — | | 17.28 | | 8.28 | | 71,647 | | .72 | | 1.34 | | 130 |
| July 31, 2014† | | 15.28 | | .18 | | .85 | | 1.03 | | (.13) | | (.13) | | — | | — | | 16.18 | | 6.76* | | 11 | | .48* | | 1.15* | | 98 |
|
| Class R6 | | | | | | | | | | | | | | | | | | | | | | | | | | | | |
| January 31, 2016** | | $17.28 | | .13 | | (1.31) | | (1.18) | | (.13) | | (.13) | | — | | — | | $15.97 | | (6.87)* | | $36,423 | | .32* | | .76* | | 84* |
| July 31, 2015 | | 16.18 | | .25 | | 1.10 | | 1.35 | | (.25) | | (.25) | | — | | — | | 17.28 | | 8.39 | | 8,239 | | .62 | | 1.46 | | 130 |
| July 31, 2014† | | 15.28 | | .19 | | .85 | | 1.04 | | (.14) | | (.14) | | — | | — | | 16.18 | | 6.81* | | 7,100 | | .42* | | 1.19* | | 98 |
|
See notes to financial highlights at the end of this section.
The accompanying notes are an integral part of these financial statements.
| |
| 46 George Putnam Balanced Fund | George Putnam Balanced Fund 47 |
Financial highlights (Continued)
| | | | | | | | | | | | | | | | | | | | | | | | | | | | |
| INVESTMENT OPERATIONS: | | | | | | | | LESS DISTRIBUTIONS: | | | | | | | | | | RATIOS AND SUPPLEMENTAL DATA: | | |
|
| | | | | | | | | | | | | | | | | | | | | | | | | | | Ratio | | |
| | | | | | | Net realized | | | | | | | | | | | | | | | | | | Ratio | | of net investment | | |
| | | Net asset value, | | | | and unrealized | | Total from | | From | | | | | | | | | | Total return | | Net assets, | | of expenses | | income (loss) | | Portfolio |
| | | beginning | | Net investment | | gain (loss) | | investment | | net investment | | Total | | Redemption | | Non-recurring | | Net asset value, | | at net asset | | end of period | | to average | | to average | | turnover |
| Period ended | | of period | | income (loss) a | | on investments | | operations | | income | | distributions | | fees | | reimbursements | | end of period | | value (%) b | | (in thousands) | | net assets (%) c | | net assets (%) | | (%) d |
|
| Class Y | | | | | | | | | | | | | | | | | | | | | | | | | | | | |
| January 31, 2016** | | $17.28 | | .12 | | (1.32) | | (1.20) | | (.12) | | (.12) | | — | | — | | $15.96 | | (6.98)* | | $82,363 | | .37* | | .75* | | 84* |
| July 31, 2015 | | 16.17 | | .23 | | 1.11 | | 1.34 | | (.23) | | (.23) | | — | | — | | 17.28 | | 8.34 | | 114,920 | | .72 | | 1.36 | | 130 |
| July 31, 2014 | | 14.86 | | .27 | | 1.29 | | 1.56 | | (.25) | | (.25) | | — | | — | | 16.17 | | 10.61 | | 111,604 | | .74 | | 1.77 | | 98 |
| July 31, 2013 | | 12.92 | | .25 | | 1.92 | | 2.17 | | (.23) | | (.23) | | — | | — | | 14.86 | | 16.99 | | 106,794 | | .76 | | 1.81 | | 86 |
| July 31, 2012 | | 12.26 | | .25 | | .64 | | .89 | | (.23) | | (.23) | | — | | — | | 12.92 | | 7.42 | | 70,090 | | .78 | | 2.04 | | 99 |
| July 31, 2011 | | 11.12 | | .22 | | 1.15 | | 1.37 | | (.23) | | (.23) | | — e | | — f | | 12.26 | | 12.42 | | 67,590 | | .80 | | 1.82 | | 176 |
|
* Not annualized.
** Unaudited.
† For the period December 2, 2013 (commencement of operations) to July 31, 2014.
a Per share net investment income (loss) has been determined on the basis of the weighted average number of shares outstanding during the period.
b Total return assumes dividend reinvestment and does not reflect the effect of sales charges.
c Includes amounts paid through expense offset and/or brokerage/service arrangements, if any (Note 2). Also excludes acquired fund fees and expenses, if any.
d Portfolio turnover excludes TBA purchase and sales transactions.
e Amount represents less than $0.01 per share.
f Reflects a non-recurring reimbursement related to restitution amounts in connection with a distribution plan approved by the Securities and Exchange Commission (the SEC), which amounted to less than $0.01 per share outstanding on July 21, 2011. Also reflects a non-recurring reimbursal related to short-term trading related lawsuits, which amounted to less than $0.01 per share outstanding on May 11, 2011.
The accompanying notes are an integral part of these financial statements.
| |
| 48 George Putnam Balanced Fund | George Putnam Balanced Fund 49 |
Notes to financial statements 1/31/16 (Unaudited)
Within the following Notes to financial statements, references to “State Street” represent State Street Bank and Trust Company, references to “the SEC” represent the Securities and Exchange Commission, references to “Putnam Management” represent Putnam Investment Management, LLC, the fund’s manager, an indirect wholly-owned subsidiary of Putnam Investments, LLC and references to “OTC”, if any, represent over-the-counter. Unless otherwise noted, the “reporting period” represents the period from August 1, 2015 through January 31, 2016.
George Putnam Balanced Fund (the fund) is a Massachusetts business trust, which is registered under the Investment Company Act of 1940, as amended, as a diversified open-end management investment company. The goal of the fund is to seek to provide a balanced investment composed of a well-diversified portfolio of stocks and bonds which produce both capital growth and current income. The fund invests mainly in a combination of bonds and common stocks (growth or value stocks or both) of large U.S. companies, with a greater focus on common stocks. For example, Putnam Management may purchase stocks of companies with stock prices that reflect a value lower than that which Putnam Management places on the company. Putnam Management may also consider other factors that Putnam Management believes will cause the stock price to rise. The fund buys bonds of governments and private companies that are mostly investment-grade in quality with intermediate- to long-term maturities (three years or longer). Putnam Management may consider, among other factors, a company’s valuation, financial strength, growth potential, competitive position in its industry, projected future earnings, cash flows and dividends when deciding whether to buy or sell equity investments, and, among other factors, credit, interest rate and prepayment risks, as well as general market conditions, when deciding whether to buy or sell fixed-income investments. The fund may also use derivatives, such as futures, options, warrants and swap contracts, for both hedging and non-hedging purposes.
The fund offers class A, class B, class C, class M, class R, class R5, class R6 and class Y shares. Class A and class M shares are sold with a maximum front-end sales charge of 5.75% and 3.50%, respectively. Class A shares generally do not pay a contingent deferred sales charge and class M shares do not pay a contingent deferred sales charge. Prior to November 1, 2015, class M shares were able to pay a contingent deferred sales charge. Class B shares, which convert to class A shares after approximately eight years, do not pay a front-end sales charge and are subject to a contingent deferred sales charge if those shares are redeemed within six years of purchase. Class C shares have a one-year 1.00% contingent deferred sales charge and do not convert to class A shares. Class R shares, which are not available to all investors, are sold at net asset value. The expenses for class A, class B, class C, class M and class R shares may differ based on the distribution fee of each class, which is identified in Note 2. Class R5, class R6 and class Y shares, which are sold at net asset value, are generally subject to the same expenses as class A, class B, class C, class M and class R shares, but do not bear a distribution fee and in the case of class R5 and class R6 shares, bear a lower investor servicing fee, which is identified in Note 2. Class R5, class R6 and class Y shares are not available to all investors.
In the normal course of business, the fund enters into contracts that may include agreements to indemnify another party under given circumstances. The fund’s maximum exposure under these arrangements is unknown as this would involve future claims that may be, but have not yet been, made against the fund. However, the fund’s management team expects the risk of material loss to be remote.
Note 1: Significant accounting policies
The following is a summary of significant accounting policies consistently followed by the fund in the preparation of its financial statements. The preparation of financial statements is in conformity with accounting principles generally accepted in the United States of America and requires management to make estimates and assumptions that affect the reported amounts of assets and liabilities in the financial statements and the reported amounts of increases and decreases in net assets from operations. Actual results could differ from those estimates. Subsequent events after the Statement of assets and liabilities date through the date that the financial statements were issued have been evaluated in the preparation of the financial statements.
Investment income, realized and unrealized gains and losses and expenses of the fund are borne pro-rata based on the relative net assets of each class to the total net assets of the fund, except that each class bears expenses unique to that class (including the distribution fees applicable to such classes). Each class votes as a class only with respect to its own distribution plan or other matters on which a class vote is required by law or determined by the Trustees. If the fund were liquidated, shares of each class would receive their pro-rata share of the net assets of the fund. In addition, the Trustees declare separate dividends on each class of shares.
|
| 50 George Putnam Balanced Fund |
Security valuation Portfolio securities and other investments are valued using policies and procedures adopted by the Board of Trustees. The Trustees have formed a Pricing Committee to oversee the implementation of these procedures and have delegated responsibility for valuing the fund’s assets in accordance with these procedures to Putnam Management. Putnam Management has established an internal Valuation Committee that is responsible for making fair value determinations, evaluating the effectiveness of the pricing policies of the fund and reporting to the Pricing Committee.
Investments for which market quotations are readily available are valued at the last reported sales price on their principal exchange, or official closing price for certain markets, and are classified as Level 1 securities under Accounting Standards Codification 820 Fair Value Measurements and Disclosures (ASC 820). If no sales are reported, as in the case of some securities that are traded OTC, a security is valued at its last reported bid price and is generally categorized as a Level 2 security.
Investments in open-end investment companies (excluding exchange-traded funds), if any, which can be classified as Level 1 or Level 2 securities, are valued based on their net asset value. The net asset value of such investment companies equals the total value of their assets less their liabilities and divided by the number of their outstanding shares.
Market quotations are not considered to be readily available for certain debt obligations and other investments; such investments are valued on the basis of valuations furnished by an independent pricing service approved by the Trustees or dealers selected by Putnam Management. Such services or dealers determine valuations for normal institutional-size trading units of such securities using methods based on market transactions for comparable securities and various relationships, generally recognized by institutional traders, between securities (which consider such factors as security prices, yields, maturities and ratings). These securities will generally be categorized as Level 2. Short-term securities with remaining maturities of 60 days or less may be valued at amortized cost, which approximates fair value, and are classified as Level 2 securities.
Many securities markets and exchanges outside the U.S. close prior to the close of the New York Stock Exchange and therefore the closing prices for securities in such markets or on such exchanges may not fully reflect events that occur after such close but before the close of the New York Stock Exchange. Accordingly, on certain days, the fund will fair value foreign equity securities taking into account multiple factors including movements in the U.S. securities markets, currency valuations and comparisons to the valuation of American Depository Receipts, exchange-traded funds and futures contracts. These securities, which would generally be classified as Level 1 securities, will be transferred to Level 2 of the fair value hierarchy when they are valued at fair value. The number of days on which fair value prices will be used will depend on market activity and it is possible that fair value prices will be used by the fund to a significant extent. At the close of the reporting period, fair value pricing was used for certain foreign securities in the portfolio. Securities quoted in foreign currencies, if any, are translated into U.S. dollars at the current exchange rate.
To the extent a pricing service or dealer is unable to value a security or provides a valuation that Putnam Management does not believe accurately reflects the security’s fair value, the security will be valued at fair value by Putnam Management in accordance with policies and procedures approved by the Trustees. Certain investments, including certain restricted and illiquid securities and derivatives, are also valued at fair value following procedures approved by the Trustees. These valuations consider such factors as significant market or specific security events such as interest rate or credit quality changes, various relationships with other securities, discount rates, U.S. Treasury, U.S. swap and credit yields, index levels, convexity exposures, recovery rates, sales and other multiples and resale restrictions. These securities are classified as Level 2 or as Level 3 depending on the priority of the significant inputs.
To assess the continuing appropriateness of fair valuations, the Valuation Committee reviews and affirms the reasonableness of such valuations on a regular basis after considering all relevant information that is reasonably available. Such valuations and procedures are reviewed periodically by the Trustees. Certain securities may be valued on the basis of a price provided by a single source. The fair value of securities is generally determined as the amount that the fund could reasonably expect to realize from an orderly disposition of such securities over a reasonable period of time. By its nature, a fair value price is a good faith estimate of the value of a security in a current sale and does not reflect an actual market price, which may be different by a material amount.
Security transactions and related investment income Security transactions are recorded on the trade date (the date the order to buy or sell is executed). Gains or losses on securities sold are determined on the identified cost basis.
Interest income, net of any applicable withholding taxes, is recorded on the accrual basis. Dividend income, net of any applicable withholding taxes, is recognized on the ex-dividend date except that certain dividends from foreign
|
| George Putnam Balanced Fund 51 |
securities, if any, are recognized as soon as the fund is informed of the ex-dividend date. Non-cash dividends, if any, are recorded at the fair value of the securities received. Dividends representing a return of capital or capital gains, if any, are reflected as a reduction of cost and/or as a realized gain. All premiums/discounts are amortized/accreted on a yield-to-maturity basis. Securities purchased or sold on a delayed delivery basis may be settled at a future date beyond customary settlement time; interest income is accrued based on the terms of the securities. Losses may arise due to changes in the fair value of the underlying securities or if the counterparty does not perform under the contract.
Stripped securities The fund may invest in stripped securities which represent a participation in securities that may be structured in classes with rights to receive different portions of the interest and principal. Interest-only securities receive all of the interest and principal-only securities receive all of the principal. If the interest-only securities experience greater than anticipated prepayments of principal, the fund may fail to recoup fully its initial investment in these securities. Conversely, principal-only securities increase in value if prepayments are greater than anticipated and decline if prepayments are slower than anticipated. The fair value of these securities is highly sensitive to changes in interest rates.
Foreign currency translation The accounting records of the fund are maintained in U.S. dollars. The fair value of foreign securities, currency holdings, and other assets and liabilities is recorded in the books and records of the fund after translation to U.S. dollars based on the exchange rates on that day. The cost of each security is determined using historical exchange rates. Income and withholding taxes are translated at prevailing exchange rates when earned or incurred. The fund does not isolate that portion of realized or unrealized gains or losses resulting from changes in the foreign exchange rate on investments from fluctuations arising from changes in the market prices of the securities. Such gains and losses are included with the net realized and unrealized gain or loss on investments. Net realized gains and losses on foreign currency transactions represent net realized exchange gains or losses on closed forward currency contracts, disposition of foreign currencies, currency gains and losses realized between the trade and settlement dates on securities transactions and the difference between the amount of investment income and foreign withholding taxes recorded on the fund’s books and the U.S. dollar equivalent amounts actually received or paid. Net unrealized appreciation and depreciation of assets and liabilities in foreign currencies arise from changes in the value of open forward currency contracts and assets and liabilities other than investments at the period end, resulting from changes in the exchange rate.
Options contracts The fund uses options contracts to hedge against changes in values of securities it owns, owned or expects to own, to enhance returns on securities owned, and to manage downside risks.
The potential risk to the fund is that the change in value of options contracts may not correspond to the change in value of the hedged instruments. In addition, losses may arise from changes in the value of the underlying instruments if there is an illiquid secondary market for the contracts, if interest or exchange rates move unexpectedly or if the counterparty to the contract is unable to perform. Realized gains and losses on purchased options are included in realized gains and losses on investment securities. If a written call option is exercised, the premium originally received is recorded as an addition to sales proceeds. If a written put option is exercised, the premium originally received is recorded as a reduction to the cost of investments.
Exchange-traded options are valued at the last sale price or, if no sales are reported, the last bid price for purchased options and the last ask price for written options. OTC traded options are valued using prices supplied by dealers.
Options on swaps are similar to options on securities except that the premium paid or received is to buy or grant the right to enter into a previously agreed upon interest rate or credit default contract. Forward premium swap option contracts include premiums that have extended settlement dates. The delayed settlement of the premiums is factored into the daily valuation of the option contracts. In the case of interest rate cap and floor contracts, in return for a premium, ongoing payments between two parties are based on interest rates exceeding a specified rate, in the case of a cap contract, or falling below a specified rate in the case of a floor contract.
Written option contracts outstanding at period end, if any, are listed after the fund’s portfolio.
Futures contracts The fund uses futures contracts to equitize cash.
The potential risk to the fund is that the change in value of futures contracts may not correspond to the change in value of the hedged instruments. In addition, losses may arise from changes in the value of the underlying instruments, if there is an illiquid secondary market for the contracts, if interest or exchange rates move unexpectedly or if the counterparty to the contract is unable to perform. With futures, there is minimal counterparty credit risk to the fund since futures are exchange traded and the exchange’s clearinghouse, as counterparty to all exchange traded futures, guarantees the futures against default. Risks may exceed amounts recognized on the Statement
|
| 52 George Putnam Balanced Fund |
of assets and liabilities. When the contract is closed, the fund records a realized gain or loss equal to the difference between the value of the contract at the time it was opened and the value at the time it was closed.
Futures contracts are valued at the quoted daily settlement prices established by the exchange on which they trade. The fund and the broker agree to exchange an amount of cash equal to the daily fluctuation in the value of the futures contract. Such receipts or payments are known as “variation margin.” Futures contracts outstanding at period end, if any, are listed after the fund’s portfolio.
Forward currency contracts The fund buys and sells forward currency contracts, which are agreements between two parties to buy and sell currencies at a set price on a future date. These contracts are used to hedge foreign exchange risk.
The U.S. dollar value of forward currency contracts is determined using current forward currency exchange rates supplied by a quotation service. The fair value of the contract will fluctuate with changes in currency exchange rates. The contract is marked to market daily and the change in fair value is recorded as an unrealized gain or loss. The fund records a realized gain or loss equal to the difference between the value of the contract at the time it was opened and the value at the time it was closed when the contract matures or by delivery of the currency. The fund could be exposed to risk if the value of the currency changes unfavorably, if the counterparties to the contracts are unable to meet the terms of their contracts or if the fund is unable to enter into a closing position. Risks may exceed amounts recognized on the Statement of assets and liabilities.
Forward currency contracts outstanding at period end, if any, are listed after the fund’s portfolio.
Total return swap contracts The fund entered into OTC total return swap contracts, which are arrangements to exchange a market-linked return for a periodic payment, both based on a notional principal amount, to gain exposure to a basket of securities.
To the extent that the total return of the security, index or other financial measure underlying the transaction exceeds or falls short of the offsetting interest rate obligation, the fund will receive a payment from or make a payment to the counterparty. OTC total return swap contracts are marked to market daily based upon quotations from an independent pricing service or market makers and the change, if any, is recorded as an unrealized gain or loss. Payments received or made are recorded as realized gains or losses. Certain OTC total return swap contracts may include extended effective dates. Payments related to these swap contracts are accrued based on the terms of the contract. The fund could be exposed to credit or market risk due to unfavorable changes in the fluctuation of interest rates or in the price of the underlying security or index, the possibility that there is no liquid market for these agreements or that the counterparty may default on its obligation to perform. The fund’s maximum risk of loss from counterparty risk is the fair value of the contract. This risk may be mitigated by having a master netting arrangement between the fund and the counterparty. Risk of loss may exceed amounts recognized on the Statement of assets and liabilities.
OTC total return swap contracts outstanding, including their respective notional amounts at period end, if any, are listed after the fund’s portfolio.
TBA commitments The fund may enter into TBA (to be announced) commitments to purchase securities for a fixed unit price at a future date beyond customary settlement time. Although the unit price and par amount have been established, the actual securities have not been specified. However, it is anticipated that the amount of the commitments will not significantly differ from the principal amount. The fund holds, and maintains until settlement date, cash or high-grade debt obligations in an amount sufficient to meet the purchase price, or the fund may enter into offsetting contracts for the forward sale of other securities it owns. Income on the securities will not be earned until settlement date.
The fund may also enter into TBA sale commitments to hedge its portfolio positions, to sell mortgage-backed securities it owns under delayed delivery arrangements or to take a short position in mortgage-backed securities. Proceeds of TBA sale commitments are not received until the contractual settlement date. During the time a TBA sale commitment is outstanding, either equivalent deliverable securities or an offsetting TBA purchase commitment deliverable on or before the sale commitment date are held as “cover” for the transaction, or other liquid assets in an amount equal to the notional value of the TBA sale commitment are segregated. If the TBA sale commitment is closed through the acquisition of an offsetting TBA purchase commitment, the fund realizes a gain or loss. If the fund delivers securities under the commitment, the fund realizes a gain or a loss from the sale of the securities based upon the unit price established at the date the commitment was entered into.
|
| George Putnam Balanced Fund 53 |
TBA commitments, which are accounted for as purchase and sale transactions, may be considered securities themselves, and involve a risk of loss due to changes in the value of the security prior to the settlement date as well as the risk that the counterparty to the transaction will not perform its obligations. Counterparty risk is mitigated by having a master agreement between the fund and the counterparty.
Unsettled TBA commitments are valued at their fair value according to the procedures described under “Security valuation” above. The contract is marked to market daily and the change in fair value is recorded by the fund as an unrealized gain or loss. Based on market circumstances, Putnam Management will determine whether to take delivery of the underlying securities or to dispose of the TBA commitments prior to settlement.
TBA purchase commitments outstanding at period end, if any, are listed within the fund’s portfolio and TBA sale commitments outstanding at period end, if any, are listed after the fund’s portfolio.
Master agreements The fund is a party to ISDA (International Swaps and Derivatives Association, Inc.) Master Agreements that govern OTC derivative and foreign exchange contracts and Master Securities Forward Transaction Agreements that govern transactions involving mortgage-backed and other asset-backed securities that may result in delayed delivery (Master Agreements) with certain counterparties entered into from time to time. The Master Agreements may contain provisions regarding, among other things, the parties’ general obligations, representations, agreements, collateral requirements, events of default and early termination. With respect to certain counterparties, in accordance with the terms of the Master Agreements, collateral posted to the fund is held in a segregated account by the fund’s custodian and, with respect to those amounts which can be sold or repledged, are presented in the fund’s portfolio.
Collateral pledged by the fund is segregated by the fund’s custodian and identified in the fund’s portfolio. Collateral can be in the form of cash or debt securities issued by the U.S. Government or related agencies or other securities as agreed to by the fund and the applicable counterparty. Collateral requirements are determined based on the fund’s net position with each counterparty.
With respect to ISDA Master Agreements, termination events applicable to the fund may occur upon a decline in the fund’s net assets below a specified threshold over a certain period of time. Termination events applicable to counterparties may occur upon a decline in the counterparty’s long-term or short-term credit ratings below a specified level. In each case, upon occurrence, the other party may elect to terminate early and cause settlement of all derivative and foreign exchange contracts outstanding, including the payment of any losses and costs resulting from such early termination, as reasonably determined by the terminating party. Any decision by one or more of the fund’s counterparties to elect early termination could impact the fund’s future derivative activity.
At the close of the reporting period, the fund had a net liability position of $138,662 on open derivative contracts subject to the Master Agreements. Collateral posted by the fund at period end for these agreements totaled $131,902 and may include amounts related to unsettled agreements.
Interfund lending The fund, along with other Putnam funds, may participate in an interfund lending program pursuant to an exemptive order issued by the SEC. This program allows the fund to borrow from or lend to other Putnam funds that permit such transactions. Interfund lending transactions are subject to each fund’s investment policies and borrowing and lending limits. Interest earned or paid on the interfund lending transaction will be based on the average of certain current market rates. During the reporting period, the fund did not utilize the program.
Lines of credit The fund participates, along with other Putnam funds, in a $392.5 million syndicated unsecured committed line of credit provided by State Street ($292.5 million) and Northern Trust Company ($100 million) and a $235.5 million unsecured uncommitted line of credit provided by State Street. Borrowings may be made for temporary or emergency purposes, including the funding of shareholder redemption requests and trade settlements. Interest is charged to the fund based on the fund’s borrowing at a rate equal to the higher of (1) the Federal Funds rate and (2) the overnight LIBOR plus 1.25% for the committed line of credit and the Federal Funds rate plus 1.30% for the uncommitted line of credit. A closing fee equal to 0.04% of the committed line of credit and 0.04% of the uncommitted line of credit has been paid by the participating funds. In addition, a commitment fee of 0.16% per annum on any unutilized portion of the committed line of credit is allocated to the participating funds based on their relative net assets and paid quarterly. During the reporting period, the fund had no borrowings against these arrangements.
Federal taxes It is the policy of the fund to distribute all of its taxable income within the prescribed time period and otherwise comply with the provisions of the Internal Revenue Code of 1986, as amended (the Code), applicable to regulated investment companies. It is also the intention of the fund to distribute an amount sufficient to avoid imposition of any excise tax under Section 4982 of the Code.
|
| 54 George Putnam Balanced Fund |
The fund is subject to the provisions of Accounting Standards Codification 740 Income Taxes (ASC 740). ASC 740 sets forth a minimum threshold for financial statement recognition of the benefit of a tax position taken or expected to be taken in a tax return. The fund did not have a liability to record for any unrecognized tax benefits in the accompanying financial statements. No provision has been made for federal taxes on income, capital gains or unrealized appreciation on securities held nor for excise tax on income and capital gains. Each of the fund’s federal tax returns for the prior three fiscal years remains subject to examination by the Internal Revenue Service.
The fund may also be subject to taxes imposed by governments of countries in which it invests. Such taxes are generally based on either income or gains earned or repatriated. The fund accrues and applies such taxes to net investment income, net realized gains and net unrealized gains as income and/or capital gains are earned. In some cases, the fund may be entitled to reclaim all or a portion of such taxes, and such reclaim amounts, if any, are reflected as an asset on the fund’s books. In many cases, however, the fund may not receive such amounts for an extended period of time, depending on the country of investment.
At July 31, 2015, the fund had a capital loss carryover of $514,304,259 available to the extent allowed by the Code to offset future net capital gain, if any. The amounts of the carryovers and the expiration dates are:
| | | |
| | Loss carryover | |
|
| Short-term | Long-term | Total | Expiration |
|
| $514,304,259 | N/A | $514,304,259 | July 31, 2018 |
|
Under the Regulated Investment Company Modernization Act of 2010, the fund will be permitted to carry forward capital losses incurred in taxable years beginning after December 22, 2010 for an unlimited period. However, any losses incurred will be required to be utilized prior to the losses incurred in pre-enactment tax years. As a result of this ordering rule, pre-enactment capital loss carryforwards may be more likely to expire unused. Additionally, post-enactment capital losses that are carried forward will retain their character as either short-term or long-term capital losses rather than being considered all short-term as under previous law.
The aggregate identified cost on a tax basis is $1,291,343,981, resulting in gross unrealized appreciation and depreciation of $74,730,392 and $93,262,370, respectively, or net unrealized depreciation of $18,531,978.
Distributions to shareholders Distributions to shareholders from net investment income are recorded by the fund on the ex-dividend date. Distributions from capital gains, if any, are recorded on the ex-dividend date and paid at least annually. The amount and character of income and gains to be distributed are determined in accordance with income tax regulations, which may differ from generally accepted accounting principles. Dividend sources are estimated at the time of declaration. Actual results may vary. Any non-taxable return of capital cannot be determined until final tax calculations are completed after the end of the fund’s fiscal year. Reclassifications are made to the fund’s capital accounts to reflect income and gains available for distribution (or available capital loss carryovers) under income tax regulations.
Note 2: Management fee, administrative services and other transactions
The fund pays Putnam Management a management fee (based on the fund’s average net assets and computed and paid monthly) at annual rates that may vary based on the average of the aggregate net assets of most open-end funds, as defined in the fund’s management contract, sponsored by Putnam Management. Such annual rates may vary as follows:
| | | | |
| 0.680% | of the first $5 billion, | | 0.480% | of the next $50 billion, |
| |
|
| 0.630% | of the next $5 billion, | | 0.460% | of the next $50 billion, |
| |
|
| 0.580% | of the next $10 billion, | | 0.450% | of the next $100 billion and |
| |
|
| 0.530% | of the next $10 billion, | | 0.445% | of any excess thereafter. |
| |
|
Putnam Management has contractually agreed, through November 30, 2016, to waive fees or reimburse the fund’s expenses to the extent necessary to limit the cumulative expenses of the fund, exclusive of brokerage, interest, taxes, investment-related expenses, extraordinary expenses, acquired fund fees and expenses and payments under the fund’s investor servicing contract, investment management contract and distribution plans, on a fiscal year-to-date basis to an annual rate of 0.20% of the fund’s average net assets over such fiscal year-to-date period. During the reporting period, the fund’s expenses were not reduced as a result of this limit.
|
| George Putnam Balanced Fund 55 |
Putnam Investments Limited (PIL), an affiliate of Putnam Management, is authorized by the Trustees to manage a separate portion of the assets of the fund as determined by Putnam Management from time to time. Putnam Management pays a quarterly sub-management fee to PIL for its services at an annual rate of 0.40% of the average net assets of the portion of the fund managed by PIL.
Putnam Management has agreed to reimburse the fund $1,040 for a compliance exception which occurred during the reporting period. The effect of the loss incurred and the reimbursement by Putnam Management of such amounts had no material impact on total return.
The fund reimburses Putnam Management an allocated amount for the compensation and related expenses of certain officers of the fund and their staff who provide administrative services to the fund. The aggregate amount of all such reimbursements is determined annually by the Trustees.
Custodial functions for the fund’s assets are provided by State Street. Custody fees are based on the fund’s asset level, the number of its security holdings and transaction volumes.
Putnam Investor Services, Inc., an affiliate of Putnam Management, provides investor servicing agent functions to the fund. Putnam Investor Services, Inc. received fees for investor servicing (except for class R5 and R6 shares) that included (1) a per account fee for each direct and underlying non-defined contribution account (“retail account”) of the fund and each of the other funds in its specified category, which was totaled and then allocated to each fund in the category based on its average daily net assets; (2) a specified rate of the fund’s assets attributable to defined contribution plan accounts; and (3) a specified rate based on the average net assets in retail accounts. Putnam Investor Services has agreed that the aggregate investor servicing fees for each fund’s retail and defined contribution accounts will not exceed an annual rate of 0.320% of the fund’s average assets attributable to such accounts. Class R5 shares paid a monthly fee based on the average net assets of class R5 shares at an annual rate of 0.15%. Class R6 shares paid a monthly fee based on the average net assets of class R6 shares at an annual rate of 0.05%. During the reporting period, the expenses for each class of shares related to investor servicing fees were as follows:
| | | | |
| Class A | $767,134 | | Class R5 | 51,294 |
| |
|
| Class B | 18,046 | | Class R6 | 6,894 |
| |
|
| Class C | 30,174 | | Class Y | 74,764 |
| |
|
| Class M | 56,924 | | Total | $1,005,611 |
| |
|
| Class R | 381 | | | |
| | |
The fund has entered into expense offset arrangements with Putnam Investor Services, Inc. and State Street whereby Putnam Investor Services, Inc.’s and State Street’s fees are reduced by credits allowed on cash balances. The fund also reduced expenses through brokerage/service arrangements. For the reporting period, the fund’s expenses were reduced by $1,135 under the expense offset arrangements and by $35,141 under the brokerage/ service arrangements.
Each Independent Trustee of the fund receives an annual Trustee fee, of which $880, as a quarterly retainer, has been allocated to the fund, and an additional fee for each Trustees meeting attended. Trustees also are reimbursed for expenses they incur relating to their services as Trustees.
The fund has adopted a Trustee Fee Deferral Plan (the Deferral Plan) which allows the Trustees to defer the receipt of all or a portion of Trustees fees payable on or after July 1, 1995. The deferred fees remain invested in certain Putnam funds until distribution in accordance with the Deferral Plan.
The fund has adopted an unfunded noncontributory defined benefit pension plan (the Pension Plan) covering all Trustees of the fund who have served as a Trustee for at least five years and were first elected prior to 2004. Benefits under the Pension Plan are equal to 50% of the Trustee’s average annual attendance and retainer fees for the three years ended December 31, 2005. The retirement benefit is payable during a Trustee’s lifetime, beginning the year following retirement, for the number of years of service through December 31, 2006. Pension expense for the fund is included in Trustee compensation and expenses in the Statement of operations. Accrued pension liability is included in Payable for Trustee compensation and expenses in the Statement of assets and liabilities. The Trustees have terminated the Pension Plan with respect to any Trustee first elected after 2003.
The fund has adopted distribution plans (the Plans) with respect to its class A, class B, class C, class M and class R shares pursuant to Rule 12b–1 under the Investment Company Act of 1940. The purpose of the Plans is to compensate Putnam Retail Management Limited Partnership, an indirect wholly-owned subsidiary of Putnam Investments, LLC, for services provided and expenses incurred in distributing shares of the fund. The Plans provide for payments
|
| 56 George Putnam Balanced Fund |
by the fund to Putnam Retail Management Limited Partnership at an annual rate of up to 0.35%, 1.00%, 1.00%, 1.00% and 1.00% of the average net assets attributable to class A, class B, class C, class M and class R shares, respectively. The Trustees have approved payment by the fund at an annual rate of 0.25%, 1.00%, 1.00%, 0.75% and 0.50% of the average net assets attributable to class A, class B, class C, class M and class R shares, respectively. During the reporting period, the class specific expenses related to distribution fees were as follows:
| | | | |
| Class A | $1,188,681 | | Class M | 264,661 |
| |
|
| Class B | 111,873 | | Class R | 1,189 |
| |
|
| Class C | 186,821 | | Total | $1,753,225 |
| |
|
For the reporting period, Putnam Retail Management Limited Partnership, acting as underwriter, received net commissions of $42,656 and $1,190 from the sale of class A and class M shares, respectively, and received $10,887 and $2,405 in contingent deferred sales charges from redemptions of class B and class C shares, respectively.
A deferred sales charge of up to 1.00% and 0.65% (no longer applicable effective November 1, 2015) is assessed on certain redemptions of class A and class M shares, respectively. For the reporting period, Putnam Retail Management Limited Partnership, acting as underwriter, received $19 and no monies on class A and class M redemptions, respectively.
Note 3: Purchases and sales of securities
During the reporting period, the cost of purchases and the proceeds from sales, excluding short-term investments, were as follows:
| | |
| | Cost of purchases | Proceeds from sales |
|
| Investments in securities, including TBA commitments | | |
| (Long-term) | $1,000,460,295 | $1,004,087,384 |
|
| U.S. government securities (Long-term) | 34,784,339 | 54,435,704 |
|
| Total | $1,035,244,634 | $1,058,523,088 |
|
The fund may purchase or sell investments from or to other Putnam funds in the ordinary course of business, which can reduce the fund’s transaction costs, at prices determined in accordance with SEC requirements and policies approved by the Trustees. During the reporting period, purchases or sales from or to other Putnam funds, if any, did not represent more than 5% of the fund’s total cost of purchases and/or total proceeds from sales.
| | |
| | Written option | Written option |
| | contract amounts | premiums |
|
| Written options outstanding at the | | |
| beginning of the reporting period | $— | $— |
|
| Options opened | 87,117 | 37,460 |
| Options exercised | — | — |
| Options expired | (87,117) | (37,460) |
| Options closed | — | — |
|
| Written options outstanding at the | | |
| end of the reporting period | $— | $— |
|
|
| George Putnam Balanced Fund 57 |
Note 4: Capital shares
At the close of the reporting period, there were an unlimited number of shares of beneficial interest authorized. Transactions in capital shares were as follows:
| | | | |
| | Six months ended 1/31/16 | Year ended 7/31/15 |
|
| Class A | Shares | Amount | Shares | Amount |
|
| Shares sold | 1,401,464 | $23,030,726 | 3,270,518 | $55,029,240 |
|
| Shares issued in connection with | | | | |
| reinvestment of distributions | 308,667 | 5,100,180 | 645,928 | 10,967,040 |
|
| | 1,710,131 | 28,130,906 | 3,916,446 | 65,996,280 |
|
| Shares repurchased | (3,364,741) | (55,367,541) | (11,074,223) | (185,609,366) |
|
| Net decrease | (1,654,610) | $(27,236,635) | (7,157,777) | $(119,613,086) |
|
| |
| | Six months ended 1/31/16 | Year ended 7/31/15 |
|
| Class B | Shares | Amount | Shares | Amount |
|
| Shares sold | 82,497 | $1,344,293 | 224,313 | $3,749,144 |
|
| Shares issued in connection with | | | | |
| reinvestment of distributions | 2,692 | 44,173 | 5,839 | 97,697 |
|
| | 85,189 | 1,388,466 | 230,152 | 3,846,841 |
|
| Shares repurchased | (178,358) | (2,890,159) | (373,604) | (6,233,023) |
|
| Net decrease | (93,169) | $(1,501,693) | (143,452) | $(2,386,182) |
|
| |
| | Six months ended 1/31/16 | Year ended 7/31/15 |
|
| Class C | Shares | Amount | Shares | Amount |
|
| Shares sold | 581,297 | $9,597,883 | 546,183 | $9,206,428 |
|
| Shares issued in connection with | | | | |
| reinvestment of distributions | 4,529 | 74,692 | 7,514 | 126,661 |
|
| | 585,826 | 9,672,575 | 553,697 | 9,333,089 |
|
| Shares repurchased | (240,406) | (3,906,676) | (223,040) | (3,748,088) |
|
| Net increase | 345,420 | $5,765,899 | 330,657 | $5,585,001 |
|
| |
| | Six months ended 1/31/16 | Year ended 7/31/15 |
|
| Class M | Shares | Amount | Shares | Amount |
|
| Shares sold | 158,565 | $2,570,599 | 330,826 | $5,521,369 |
|
| Shares issued in connection with | | | | |
| reinvestment of distributions | 14,754 | 241,032 | 30,678 | 513,563 |
|
| | 173,319 | 2,811,631 | 361,504 | 6,034,932 |
|
| Shares repurchased | (441,808) | (7,151,917) | (791,602) | (13,193,832) |
|
| Net decrease | (268,489) | $(4,340,286) | (430,098) | $(7,158,900) |
|
| |
| | Six months ended 1/31/16 | Year ended 7/31/15 |
|
| Class R | Shares | Amount | Shares | Amount |
|
| Shares sold | 14,953 | $245,015 | 12,266 | $206,483 |
|
| Shares issued in connection with | | | | |
| reinvestment of distributions | 167 | 2,717 | 556 | 9,433 |
|
| | 15,120 | 247,732 | 12,822 | 215,916 |
|
| Shares repurchased | (54,946) | (894,856) | (9,773) | (164,983) |
|
| Net increase (decrease) | (39,826) | $(647,124) | 3,049 | $50,933 |
|
|
| 58 George Putnam Balanced Fund |
| | | | |
| | Six months ended 1/31/16 | Year ended 7/31/15 |
|
| Class R5 | Shares | Amount | Shares | Amount |
|
| Shares sold | 401,979 | $6,643,356 | 4,571,235 | $76,316,699 |
|
| Shares issued in connection with | | | | |
| reinvestment of distributions | 29,642 | 491,489 | 26,608 | 462,840 |
|
| | 431,621 | 7,134,845 | 4,597,843 | 76,779,539 |
|
| Shares repurchased | (435,357) | (7,184,223) | (452,924) | (7,793,994) |
|
| Net increase (decrease) | (3,736) | $(49,378) | 4,144,919 | $68,985,545 |
|
| |
| | Six months ended 1/31/16 | Year ended 7/31/15 |
|
| Class R6 | Shares | Amount | Shares | Amount |
|
| Shares sold | 1,855,404 | $29,908,457 | 59,021 | $1,007,097 |
|
| Shares issued in connection with | | | | |
| reinvestment of distributions | 10,944 | 183,418 | 6,704 | 114,367 |
|
| | 1,866,348 | 30,091,875 | 65,725 | 1,121,464 |
|
| Shares repurchased | (62,090) | (1,034,249) | (27,929) | (476,237) |
|
| Net increase | 1,804,258 | $29,057,626 | 37,796 | $645,227 |
|
| |
| | Six months ended 1/31/16 | Year ended 7/31/15 |
|
| Class Y | Shares | Amount | Shares | Amount |
|
| Shares sold | 986,081 | $16,456,089 | 645,544 | $10,883,901 |
|
| Shares issued in connection with | | | | |
| reinvestment of distributions | 40,392 | 667,787 | 92,941 | 1,584,356 |
|
| | 1,026,473 | 17,123,876 | 738,485 | 12,468,257 |
|
| Shares repurchased | (2,517,816) | (40,778,691) | (988,568) | (16,681,172) |
|
| Net decrease | (1,491,343) | $(23,654,815) | (250,083) | $(4,212,915) |
|
At the close of the reporting period, Putnam Investments, LLC owned the following shares of the fund:
| | | |
| | Shares owned | Percentage of ownership | Value |
|
| Class R5 | 674 | 0.02% | $10,764 |
|
| Class R6 | 675 | 0.03 | 10,780 |
|
Note 5: Affiliated transactions
Transactions during the reporting period with Putnam Short Term Investment Fund, which is under common ownership and control, were as follows:
| | | | | |
| | Fair value at the | | | | Fair value at |
| | beginning of | | | | the end of |
| | the reporting | | | Investment | the reporting |
| Name of affiliate | period | Purchase cost | Sale proceeds | income | period |
|
| Putnam Short Term | | | | | |
| Investment Fund* | $48,223,912 | $137,614,092 | $113,481,762 | $82,254 | $72,356,242 |
|
* Management fees charged to Putnam Short Term Investment Fund have been waived by Putnam Management.
Note 6: Market, credit and other risks
In the normal course of business, the fund trades financial instruments and enters into financial transactions where risk of potential loss exists due to changes in the market (market risk) or failure of the contracting party to the transaction to perform (credit risk). The fund may be exposed to additional credit risk that an institution or other entity with which the fund has unsettled or open transactions will default. The fund may invest a significant portion
|
| George Putnam Balanced Fund 59 |
of its assets in securitized debt instruments, including mortgage-backed and asset-backed investments. The yields and values of these investments are sensitive to changes in interest rates, the rate of principal payments on the underlying assets and the market’s perception of the issuers. The market for these investments may be volatile and limited, which may make them difficult to buy or sell.
Note 7: Summary of derivative activity
The volume of activity for the reporting period for any derivative type that was held during the period is listed below and was based on an average of the holdings at the end of each fiscal quarter:
| |
| Purchased equity option contracts (contract amount) | $100,000 |
|
| Written equity option contracts (contract amount) (Note 3) | $—* |
|
| Futures contracts (number of contracts) | 7 |
|
| Forward currency contracts (contract amount) | $46,600,000 |
|
| OTC total return swap contracts (notional) | $2,500,000 |
|
* For the reporting period there were no holdings at the end of each fiscal quarter and the transactions were considered minimal.
The following is a summary of the fair value of derivative instruments as of the close of the reporting period:
Fair value of derivative instruments as of the close of the reporting period
| | | | |
| | Asset derivatives | | Liability derivatives | |
|
| Derivatives not | | | | |
| accounted for as | Statement of | | Statement of | |
| hedging instruments | assets and | | assets and | |
| under ASC 815 | liabilities location | Fair value | liabilities location | Fair value |
|
| Foreign exchange | | | | |
| contracts | Receivables | $950,793 | Payables | $201,424 |
|
| | Investments, | | | |
| | Receivables, Net | | | |
| | assets — Unrealized | | | |
| Equity contracts | appreciation | 180,855 | Payables | — |
|
| Total | | $1,131,648 | | $201,424 |
|
The following is a summary of realized and change in unrealized gains or losses of derivative instruments in the Statement of operations for the reporting period (see Note 1):
Amount of realized gain or (loss) on derivatives recognized in net gain or (loss) on investments
| | | | | |
| Derivatives not accounted | | | Forward | | |
| for as hedging instruments | | | currency | | |
| under ASC 815 | Options | Futures | contracts | Swaps | Total |
|
| Foreign exchange | | | | | |
| contracts | $— | $— | $1,576,101 | $— | $1,576,101 |
|
| Equity contracts | (121,991) | (424,206) | — | (711,993) | (1,258,190) |
|
| Total | $(121,991) | $(424,206) | $1,576,101 | $(711,993) | $317,911 |
|
Change in unrealized appreciation or (depreciation) on derivatives recognized in net gain or (loss) on investments
| | | | | |
| Derivatives not accounted | | | Forward | | |
| for as hedging instruments | | | currency | | |
| under ASC 815 | Options | Futures | contracts | Swaps | Total |
|
| Foreign exchange | | | | | |
| contracts | $— | $— | $550,403 | $— | $550,403 |
|
| Equity contracts | 95,611 | (27,786) | — | 165,398 | 233,223 |
|
| Total | $95,611 | $(27,786) | $550,403 | $165,398 | $783,626 |
|
|
| 60 George Putnam Balanced Fund |
|
| This page left blank intentionally. |
|
| George Putnam Balanced Fund 61 |
Note 8: Offsetting of financial and derivative assets and liabilities
The following table summarizes any derivatives, repurchase agreements and reverse repurchase agreements, at the end of the reporting period, that are subject to an enforceable master netting agreement or similar agreement. For securities lending transactions or borrowing transactions associated with securities sold short, if any, see Note 1. For financial reporting purposes, the fund does not offset financial assets and financial liabilities that are subject to the master netting agreements in the Statement of assets and liabilities.
| | | | | | | | | | | | | | | | | | | | | | |
| | | Barclays Bank PLC | | Citibank, N.A. | | Credit Suisse International | | Deutsche Bank AG | | Goldman Sachs International | | HSBC Bank USA, National Association | | JPMorgan Chase Bank N.A. | | State Street Bank and Trust Co. | | UBS AG | | WestPac Banking Corp. | | Total |
|
| Assets: | | | | | | | | | | | | | | | | | | | | | | |
|
| OTC Total return swap contracts*# | | $— | | $— | | $— | | $— | | $— | | $— | | $46,102 | | $— | | $— | | $— | | $46,102 |
|
| Forward currency contracts# | | 53,275 | | — | | 461,072 | | 357,567 | | — | | 4,650 | | 32,310 | | 19,928 | | — | | 21,991 | | 950,793 |
|
| Purchased options**# | | — | | — | | — | | — | | 134,753 | | — | | — | | — | | — | | — | | 134,753 |
|
| Total Assets | | $53,275 | | $— | | $461,072 | | $357,567 | | $134,753 | | $4,650 | | $78,412 | | $19,928 | | $— | | $21,991 | | $1,131,648 |
|
| Liabilities: | | | | | | | | | | | | | | | | | | | | | | |
|
| OTC Total return swap contracts*# | | — | | — | | — | | — | | — | | — | | — | | — | | — | | — | | — |
|
| Forward currency contracts# | | — | | 69,658 | | — | | — | | — | | 19,212 | | 38,184 | | 27,179 | | 47,191 | | — | | 201,424 |
|
| Written options# | | — | | — | | — | | — | | — | | — | | — | | — | | — | | — | | — |
|
| Total Liabilities | | $— | | $69,658 | | $— | | $— | | $— | | $19,212 | | $38,184 | | $27,179 | | $47,191 | | $— | | $201,424 |
|
| Total Financial and Derivative Net Assets | | $53,275 | | $(69,658) | | $461,072 | | $357,567 | | $134,753 | | $(14,562) | | $40,228 | | $(7,251) | | $(47,191) | | $21,991 | | $930,224 |
|
| Total collateral received (pledged)†## | | $53,275 | | $(69,658) | | $461,072 | | $310,000 | | $— | | $— | | $— | | $— | | $— | | $— | | |
|
| Net amount | | $— | | $— | | $— | | $47,567 | | $134,753 | | $(14,562) | | $40,228 | | $(7,251) | | $(47,191) | | $21,991 | | |
|
* Excludes premiums, if any. Included in unrealized appreciation and depreciation on OTC swap contracts on the Statement of assets and liabilities.
** Included with Investments in securities on the Statement of assets and liabilities.
† Additional collateral may be required from certain brokers based on individual agreements.
# Covered by master netting agreement (Note 1).
## Any over-collateralization of total financial and derivative net assets is not shown. Collateral may include amounts related to unsettled agreements.
| |
| 62 George Putnam Balanced Fund | George Putnam Balanced Fund 63 |
Putnam family of funds
The following is a list of Putnam’s open-end mutual funds offered to the public. Investors should carefully consider the investment objective, risks, charges, and expenses of a fund before investing. For a prospectus, or a summary prospectus if available, containing this and other information for any Putnam fund or product, contact your financial advisor or call Putnam Investor Services at 1-800-225-1581. Please read the prospectus carefully before investing.
| |
| Growth | International Value Fund |
| Growth Opportunities Fund | Multi-Cap Value Fund |
| International Growth Fund | Small Cap Value Fund |
| Multi-Cap Growth Fund | |
| Small Cap Growth Fund | Income |
| Voyager Fund | American Government Income Fund |
| | Diversified Income Trust |
| Blend | Emerging Markets Income Fund |
| Asia Pacific Equity Fund | Floating Rate Income Fund |
| Capital Opportunities Fund | Global Income Trust |
| Capital Spectrum Fund | High Yield Advantage Fund |
| Emerging Markets Equity Fund | High Yield Trust |
| Equity Spectrum Fund | Income Fund |
| Europe Equity Fund | Money Market Fund* |
| Global Equity Fund | Short Duration Income Fund |
| International Capital Opportunities Fund | U.S. Government Income Trust |
| International Equity Fund | |
| Investors Fund | Tax-free Income |
| Low Volatility Equity Fund | AMT-Free Municipal Fund |
| Multi-Cap Core Fund | Intermediate-Term Municipal Income Fund |
| Research Fund | Short-Term Municipal Income Fund |
| Strategic Volatility Equity Fund | Tax Exempt Income Fund |
| | Tax-Free High Yield Fund |
| Value | |
| Convertible Securities Fund | State tax-free income funds†: |
| Equity Income Fund | Arizona, California, Massachusetts, Michigan, |
| Global Dividend Fund | Minnesota, New Jersey, New York, Ohio, |
| The Putnam Fund for Growth and Income | and Pennsylvania. |
| |
|
| 64 George Putnam Balanced Fund |
| |
| Absolute Return | Retirement Income Lifestyle Funds — |
| Absolute Return 100 Fund® | portfolios with managed allocations to |
| Absolute Return 300 Fund® | stocks, bonds, and money market |
| Absolute Return 500 Fund® | investments to generate retirement income. |
| Absolute Return 700 Fund® | |
| | Retirement Income Fund Lifestyle 1 |
| Global Sector | Retirement Income Fund Lifestyle 2 |
| Global Consumer Fund | Retirement Income Fund Lifestyle 3 |
| Global Energy Fund | |
| Global Financials Fund | RetirementReady® Funds — portfolios with |
| Global Health Care Fund | adjusting allocations to stocks, bonds, and |
| Global Industrials Fund | money market instruments, becoming more |
| Global Natural Resources Fund | conservative over time. |
| Global Sector Fund | |
| Global Technology Fund | RetirementReady® 2060 Fund |
| Global Telecommunications Fund | RetirementReady® 2055 Fund |
| Global Utilities Fund | RetirementReady® 2050 Fund |
| | RetirementReady® 2045 Fund |
| Asset Allocation | RetirementReady® 2040 Fund |
| George Putnam Balanced Fund | RetirementReady® 2035 Fund |
| Global Asset Allocation Funds — four | RetirementReady® 2030 Fund |
| investment portfolios that spread your | RetirementReady® 2025 Fund |
| money across a variety of stocks, bonds, and | RetirementReady® 2020 Fund |
| money market instruments. | |
| | |
| Dynamic Asset Allocation Balanced Fund | |
| Dynamic Asset Allocation Conservative Fund | |
| Dynamic Asset Allocation Growth Fund | |
| Dynamic Risk Allocation Fund | |
* An investment in a money market fund is not insured or guaranteed by the Federal Deposit Insurance Corporation or any other government agency. Although the fund seeks to preserve the value of your investment at $1.00 per share, it is possible to lose money by investing in the fund.
† Not available in all states.
Check your account balances and the most recent month-end performance in the Individual Investors section at putnam.com.
|
| George Putnam Balanced Fund 65 |
Services for shareholders
Investor services
Systematic investment plan Tell us how much you wish to invest regularly — weekly, semimonthly, or monthly — and the amount you choose will be transferred automatically from your checking or savings account. There’s no additional fee for this service, and you can suspend it at any time. This plan may be a great way to save for college expenses or to plan for your retirement.
Please note that regular investing does not guarantee a profit or protect against loss in a declining market. Before arranging a systematic investment plan, consider your financial ability to continue making purchases in periods when prices are low.
Systematic exchange You can make regular transfers from one Putnam fund to another Putnam fund. There are no additional fees for this service, and you can cancel or change your options at any time.
Dividends PLUS You can choose to have the dividend distributions from one of your Putnam funds automatically reinvested in another Putnam fund at no additional charge.
Free exchange privilege You can exchange money between Putnam funds free of charge, as long as they are the same class of shares. A signature guarantee is required if you are exchanging more than $500,000. The fund reserves the right to revise or terminate the exchange privilege.
Reinstatement privilege If you’ve sold Putnam shares or received a check for a dividend or capital gain, you may reinvest the proceeds with Putnam within 90 days of the transaction and they will be reinvested at the fund’s current net asset value — with no sales charge. However, reinstatement of class B shares may have special tax consequences. Ask your financial or tax representative for details.
Check-writing service You have ready access to many Putnam accounts. It’s as simple as writing a check, and there are no special fees or service charges. For more information about the check-writing service, call Putnam or visit our website.
Dollar cost averaging When you’re investing for long-term goals, it’s time, not timing, that counts. Investing on a systematic basis is a better strategy than trying to figure out when the markets will go up or down. This means investing the same amount of money regularly over a long period. This method of investing is called dollar cost averaging. When a fund’s share price declines, your investment dollars buy more shares at lower prices. When it increases, they buy fewer shares. Over time, you will pay a lower average price per share.
For more information
Visit the Individual Investors section at putnam.com A secure section of our website contains complete information on your account, including balances and transactions, updated daily. You may also conduct transactions, such as exchanges, additional investments, and address changes. Log on today to get your password.
Call us toll free at 1-800-225-1581 Ask a helpful Putnam representative or your financial advisor for details about any of these or other services, or see your prospectus.
|
| 66 George Putnam Balanced Fund |
Putnam’s commitment to confidentiality
In order to conduct business with our shareholders, we must obtain certain personal information such as account holders’ names, addresses, Social Security numbers, and dates of birth. Using this information, we are able to maintain accurate records of accounts and transactions.
It is our policy to protect the confidentiality of our shareholder information, whether or not a shareholder currently owns shares of our funds. In particular, it is our policy not to sell information about you or your accounts to outside marketing firms. We have safeguards in place designed to prevent unauthorized access to our computer systems and procedures to protect personal information from unauthorized use.
Within the Putnam organization, your information is shared with those who need it to service your account or provide you with information about other Putnam products or services. Under certain circumstances, we must also share account information with outside vendors who provide services to us, such as mailings and proxy solicitations. In these cases, the service providers enter into confidentiality agreements with us, and we provide only the information necessary to process transactions and perform other services related to your account. It is also our policy to share account information with your financial advisor, if you've provided us with information about your advisor and that person is listed on your Putnam account.
If you would like clarification about our confidentiality policies or have any questions or concerns, please don't hesitate to contact us at 1-800-225-1581, Monday through Friday, 8:00 a.m. to 8:00 p.m. Eastern Time.
|
| George Putnam Balanced Fund 67 |
Fund information
Founded over 75 years ago, Putnam Investments was built around the concept that a balance between risk and reward is the hallmark of a well-rounded financial program. We manage over 100 funds across income, value, blend, growth, asset allocation, absolute return, and global sector categories.
| | |
| Investment Manager | Trustees | Robert T. Burns |
| Putnam Investment | Jameson A. Baxter, Chair | Vice President and |
| Management, LLC | Liaquat Ahamed | Chief Legal Officer |
| One Post Office Square | Ravi Akhoury | |
| Boston, MA 02109 | Barbara M. Baumann | James F. Clark |
| | Robert J. Darretta | Chief Compliance Officer |
| Investment Sub-Manager | Katinka Domotorffy | |
| Putnam Investments Limited | John A. Hill | Michael J. Higgins |
| 57–59 St James’s Street | Paul L. Joskow | Vice President, Treasurer, |
| London, England SW1A 1LD | Kenneth R. Leibler | and Clerk |
| | Robert E. Patterson | |
| Marketing Services | George Putnam, III | Janet C. Smith |
| Putnam Retail Management | Robert L. Reynolds | Vice President, |
| One Post Office Square | W. Thomas Stephens | Principal Accounting Officer, |
| Boston, MA 02109 | | and Assistant Treasurer |
| | Officers | |
| Custodian | Robert L. Reynolds | Susan G. Malloy |
| State Street Bank | President | Vice President and |
| and Trust Company | | Assistant Treasurer |
| | Jonathan S. Horwitz | |
| Legal Counsel | Executive Vice President, | James P. Pappas |
| Ropes & Gray LLP | Principal Executive Officer, and | Vice President |
| | Compliance Liaison | |
| | | Mark C. Trenchard |
| | Steven D. Krichmar | Vice President and |
| | Vice President and | BSA Compliance Officer |
| | Principal Financial Officer | |
| | | Nancy E. Florek |
| | | Vice President, Director of |
| | | Proxy Voting and Corporate |
| | | Governance, Assistant Clerk, |
| | and Associate Treasurer |
|
| 68 George Putnam Balanced Fund |
This report is for the information of shareholders of George Putnam Balanced Fund. It may also be used as sales literature when preceded or accompanied by the current prospectus, the most recent copy of Putnam’s Quarterly Performance Summary, and Putnam’s Quarterly Ranking Summary. For more recent performance, please visit putnam.com. Investors should carefully consider the investment objectives, risks, charges, and expenses of a fund, which are described in its prospectus. For this and other information or to request a prospectus or summary prospectus, call 1-800-225-1581 toll free. Please read the prospectus carefully before investing. The fund’s Statement of Additional Information contains additional information about the fund’s Trustees and is available without charge upon request by calling 1-800-225-1581.
| |
| Item 3. Audit Committee Financial Expert: |
| |
| Item 4. Principal Accountant Fees and Services: |
| |
| Item 5. Audit Committee of Listed Registrants |
| |
| Item 6. Schedule of Investments: |
| |
| The registrant's schedule of investments in unaffiliated issuers is included in the report to shareholders in Item 1 above. |
| |
| Item 7. Disclosure of Proxy Voting Policies and Procedures For Closed-End Management Investment Companies: |
| |
| Item 8. Portfolio Managers of Closed-End Investment Companies |
| |
| Item 9. Purchases of Equity Securities by Closed-End Management Investment Companies and Affiliated Purchasers: |
| |
| Item 10. Submission of Matters to a Vote of Security Holders: |
| |
| Item 11. Controls and Procedures: |
| |
| (a) The registrant's principal executive officer and principal financial officer have concluded, based on their evaluation of the effectiveness of the design and operation of the registrant's disclosure controls and procedures as of a date within 90 days of the filing date of this report, that the design and operation of such procedures are generally effective to provide reasonable assurance that information required to be disclosed by the registrant in this report is recorded, processed, summarized and reported within the time periods specified in the Commission's rules and forms. |
| |
| (b) Changes in internal control over financial reporting: Not applicable |
| |
| (a)(2) Separate certifications for the principal executive officer and principal financial officer of the registrant as required by Rule 30a-2(a) under the Investment Company Act of 1940, as amended, are filed herewith. |
| |
| (b) The certifications required by Rule 30a-2(b) under the Investment Company Act of 1940, as amended, are filed herewith. |
| |
| George Putnam Balanced Fund |
| |
| By (Signature and Title): |
| |
| /s/ Janet C. Smith
Janet C. Smith
Principal Accounting Officer
|
| |
| Pursuant to the requirements of the Securities Exchange Act of 1934 and the Investment Company Act of 1940, this report has been signed below by the following persons on behalf of the registrant and in the capacities and on the dates indicated. |
| |
| By (Signature and Title): |
| |
| /s/ Jonathan S. Horwitz
Jonathan S. Horwitz
Principal Executive Officer
|
| |
| By (Signature and Title): |
| |
| /s/ Steven D. Krichmar
Steven D. Krichmar
Principal Financial Officer
|