| | |
| UNITED STATES
SECURITIES AND EXCHANGE COMMISSION |
| | |
| CERTIFIED SHAREHOLDER REPORT OF REGISTERED
MANAGEMENT INVESTMENT COMPANIES
|
| | |
| Investment Company Act file number: | (811-00058) |
| | |
| Exact name of registrant as specified in charter: | George Putnam Balanced Fund |
| | |
| Address of principal executive offices: | One Post Office Square, Boston, Massachusetts 02109 |
| | |
| Name and address of agent for service: | Robert T. Burns, Vice President
One Post Office Square
Boston, Massachusetts 02109 |
| | |
| Copy to: | Bryan Chegwidden, Esq.
Ropes & Gray LLP
1211 Avenue of the Americas
New York, New York 10036 |
| | |
| Registrant's telephone number, including area code: | (617) 292-1000 |
| | |
| Date of fiscal year end: | July 31, 2017 |
| | |
| Date of reporting period: | August 1, 2016 — January 31, 2017 |
| | |
|
Item 1. Report to Stockholders: | |
| | |
| The following is a copy of the report transmitted to stockholders pursuant to Rule 30e-1 under the Investment Company Act of 1940: | |
George Putnam
Balanced
Fund
Semiannual report
1 | 31 | 17
Consider these risks before investing: Stock and bond prices may fall or fail to rise over time for several reasons, including general financial market conditions, factors related to a specific issuer or industry and, with respect to bond prices, changing market perceptions of the risk of default and changes in government intervention. These factors may also lead to increased volatility and reduced liquidity in the bond markets. Growth stocks may be more susceptible to earnings disappointments, and value stocks may fail to rebound. Bond investments are subject to interest-rate risk (the risk of bond prices falling if interest rates rise) and credit risk (the risk of an issuer defaulting on interest or principal payments). Interest-rate risk is generally greater for longer-term bonds, and credit risk is generally greater for below-investment-grade bonds. Risks associated with derivatives include increased investment exposure (which may be considered leverage) and, in the case of over-the-counter instruments, the potential inability to terminate or sell derivatives positions and the potential failure of the other party to the instrument to meet its obligations. You can lose money by investing in the fund.
Message from the Trustees
March 15, 2017
Dear Fellow Shareholder:
In the early weeks of 2017, investor sentiment generally brightened at the prospect of moving beyond the challenges of the past year, when political uncertainty, among other issues, tested global financial markets. As stock markets delivered modest gains, the exuberance that greeted the new year calmed somewhat as investors reconsidered a number of ongoing macroeconomic risks. In addition, many bond investors remained cautious as the potential for inflation increased.
As always, we believe investors should continue to focus on time-tested strategies: maintain a well-diversified portfolio, keep a long-term view, and do not overreact to short-term market fluctuations. To help ensure that your portfolio is aligned with your individual goals, time horizon, and tolerance for risk, we also believe it is a good idea to speak regularly with your financial advisor.
In today’s environment, we favor the investment approach practiced at Putnam — active strategies based on fundamental research. Putnam portfolio managers, backed by a network of global analysts, bring years of experience to navigating changing market conditions and pursuing investment opportunities. In the following pages, you will find an overview of your fund’s performance for the reporting period ended January 31, 2017, as well as an outlook for the coming months.
Thank you for investing with Putnam.

Current performance may be lower or higher than the quoted past performance, which cannot guarantee future results. Share price, principal value, and return will fluctuate, and you may have a gain or a loss when you sell your shares. Performance of class A shares assumes reinvestment of distributions and does not account for taxes. Fund returns in the bar chart do not reflect a sales charge of 5.75%; had they, returns would have been lower. See below and pages 3 and 10–12 for additional performance information. For a portion of the periods, the fund had expense limitations, without which returns would have been lower. To obtain the most recent month-end performance, visit putnam.com.
* George Putnam Blended Index is an unmanaged index administered by Putnam Management, 60% of which is the S&P 500 Index and 40% of which is the Bloomberg Barclays U.S. Aggregate Bond Index.
† The fund’s benchmarks (S&P 500 Index and George Putnam Blended Index) were introduced on 12/31/69 and 12/31/78, respectively, and its Lipper group (Balanced Funds) was introduced on 12/31/59; they all post-date the inception of the fund’s class A shares.
‡ Returns for the six-month period are not annualized, but cumulative.
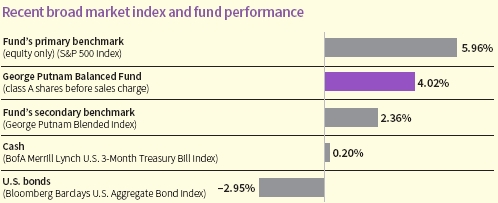
This comparison shows your fund’s performance in the context of broad market indexes for the six months ended 1/31/17. See above and pages 3 and 10–12 for additional fund performance information. Index descriptions can be found on page 15.
|
| 4 George Putnam Balanced Fund |


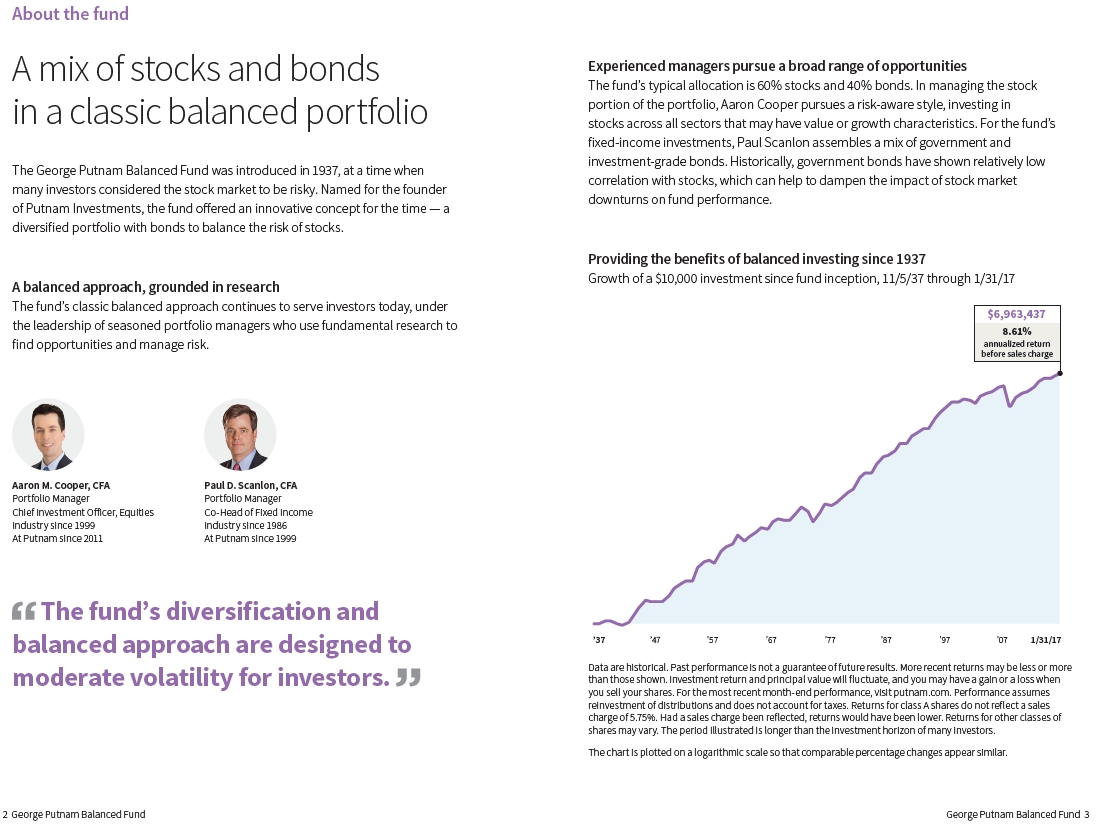
Aaron is Chief Investment Officer, Equities, at Putnam. He holds an A.B. from Harvard University. Aaron joined Putnam in 2011 and has been in the investment industry since 1999.

Paul is Co-Head of Fixed Income at Putnam. He has an M.B.A. from the University of Chicago Booth School of Business and a B.A. from Colgate University. Paul joined Putnam in 1999 and has been in the investment industry since 1986.
How would you describe the market environment during the six-month period ended January 31, 2017?
AARON At the outset of the period, we began to see the bubbling up of inflationary pressures, including from wage inflation and rising commodity prices. These conditions generally set a benign backdrop for stocks through the summer months. Then, in the weeks leading up to the U.S. presidential election, we saw the market shift its focus from stable-seeming stocks to sectors that could be beneficiaries of a reflationary macroeconomic trend, including riskier-seeming sectors such as financials, industrials, and natural resources. Technology stocks, interestingly, lost some of their luster with investors as they began to feel comfortable seeking growth in other areas of the market.
In the wake of the U.S. election, equity performance soared in anticipation of a new business-friendly administration. Led by energy, financials, and telecommunications, most non-defensive sectors turned in double-digit returns during the final calendar quarter of 2016, while major U.S. equity indexes hit record highs and delivered solid positive returns for the year overall. In the final month
|
| George Putnam Balanced Fund 5 |
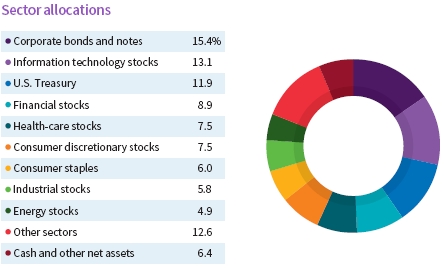
Allocations are shown as a percentage of the fund’s net assets as of 1/31/17. Cash and net other assets, if any, represent the market value weights of cash, derivatives, short-term securities, and other unclassified assets in the portfolio. Summary information may differ from the portfolio schedule included in the financial statements due to the inclusion of derivative securities, any interest accruals, the exclusion of as-of trades, if any, the use of different classifications of securities for presentation purposes, and rounding. Holdings and allocations may vary over time.
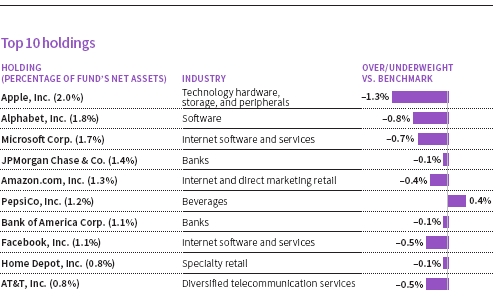
This table shows the fund’s top 10 holdings by percentage of the fund’s net assets as of 1/31/17. Short-term investments and derivatives, if any, are excluded. Holdings may vary over time.
|
| 6 George Putnam Balanced Fund |
of the period, investor optimism continued to fuel the market’s performance, particularly in eager anticipation of the Trump administration making good on promises for tax reform, infrastructure development, and financial market deregulation.
In this context, how did George Putnam Balanced Fund perform?
AARON We are pleased to report that the fund outperformed its blended stock/bond secondary benchmark, the George Putnam Blended Index, for the six-month reporting period. We attribute this result primarily to positive stock selection outcomes across a wide range of sectors — from energy and financials to health care, information technology, and telecommunications. Relative to the fund’s all-equity primary benchmark, the S&P 500 Index, the fund fell short of the mark. In light of the strong stock market rally that occurred in the last months of the period, this underperformance was not unexpected given that the fund balances its investments between stocks and bonds.
How did the fund’s corporate bond allocation perform?
PAUL Our corporate-credit investment strategy generally performed well during the period, buoyed by solid fundamentals among investment-grade bonds. Demand for these bonds was robust during the period, particularly on the part of international investors. While this led valuation to become tighter toward the end of 2016, it was not exceptionally so versus historical trends. Importantly for investment-grade bonds, we see the current environment as providing tailwinds for financials, in particular, which comprises a large segment of the opportunity set.
Within different sectors, how would you characterize the fund’s positioning during the reporting period?
AARON Within a variety of sectors, George Putnam Balanced Fund has been positioned with a modestly pro-cyclical bias, which means that some parts of the portfolio were positioned to perform in line with the overall economy. In financials, for example, the fund was biased toward more interest-rate-sensitive stocks, which we thought would benefit if interest rates should rise — which they did do through much of the period. In natural resources, the fund had a pro-cyclical tilt as well, and we believe this may continue to offer characteristics of relative strength as the Trump administration seeks to establish its policy agenda in the coming months.
How would you describe U.S. corporate health at period-end?
AARON U.S. corporations generally appeared to have turned a corner during the period. A telling signal in this regard can be seen in corporate earnings growth in the fourth calendar quarter of 2016. At 8% for the market overall — and a notch above the third-quarter result of 6% (ex energy) — corporate earnings growth showed undeniable strength as the year came to a close. When we consider corporate prospects for 2017, we expect that continued solid underlying growth in the U.S. economy, augmented by generally higher energy prices than we saw at the start of 2016, could lead to double-digit earnings growth for the U.S. market overall.
What were some of the stocks that contributed most to the fund’s relative performance?
AARON In the wake of the U.S. election on November 8, 2016, the stock markets strongly favored more cyclical and industrial areas of the market, and one of the leading sectors was financials. Consequently, our larger-than-benchmark positions in Bank of America, Keycorp, and Charles Schwab produced strong relative results for the fund. Generally speaking, investors anticipated that higher interest rates and the increased likelihood of financial market deregulation under President Trump would provide a strong boost to the bottom lines of financial companies.
|
| George Putnam Balanced Fund 7 |
Our decision to hold a smaller-than-benchmark position in the stock of Johnson & Johnson (J&J) gave another boost to relative results. This stock generally declined during the period, as investors appeared to lose interest in businesses like J&J that are perceived by investors to be safe and stable, with predictable, but often sluggish, earnings growth. We viewed many of these stocks, including J&J, as too expensive and maintained underweight exposure to them through the period.
A third contributor was the stock of Charter Communications, one of the largest cable TV operators and telephone line providers in the United States. Shortly before the period began, Charter acquired Time Warner Cable and Bright House Networks for a combined $65.5 billion, making Charter the third-largest pay television company in the United States. We believe Charter is also well positioned to add mobile technologies to its platform. If and when that happens, we think Charter stands to do well against a competitor like Verizon Communications and other providers who still rely on a DSL platform, which we believe is inferior to cable and fiber networks.
Which stocks or strategies detracted from the fund’s relative performance?
AARON The largest detractor for the period was the stock of Allergan. The stock’s decline was due almost entirely to ongoing investor disappointment after Allergan’s planned merger with U.S. pharmaceutical giant Pfizer was terminated in April 2016. Toward the end of the period, we became less convinced that Allergan’s drug pipeline could support strong growth prospects for the company over the long term. Consequently, we sold the stock.
In line with the late-period rally in financial stocks, the stock of Citigroup performed well for the period overall. However, because we held a smaller-than-benchmark position in this stock, that detracted from benchmark-relative performance.
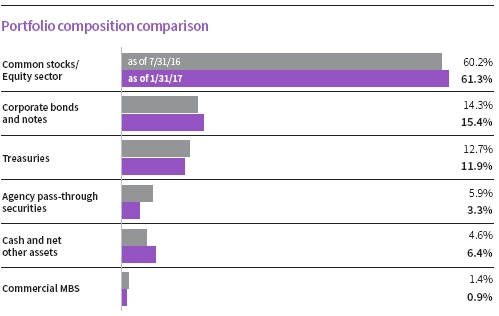
This chart shows how the fund’s top weightings have changed over the past six months. Allocations are shown as a percentage of the fund’s net assets. Current period summary information may differ from the portfolio schedule included in the financial statements due to the inclusion of derivative securities, any interest accruals, the exclusion of as-of trades, if any, the use of different classifications of securities for presentation purposes, and rounding. Holdings and allocations may vary over time.
|
| 8 George Putnam Balanced Fund |
Our benchmark-relative overweight position in the stock of Coty, a large-cap beauty products manufacturer, also detracted from the fund’s relative performance result. We had been encouraged by what we perceived to be the company’s effective cost-cutting strategies, and in late 2015, Coty bought the beauty brands of Procter & Gamble. While we believe this deal will be beneficial for Coty’s profitability over time, the company has struggled with the acquisition, which is now estimated to cost considerably more than investors initially anticipated. We sold the stock by the end of the period.
What is your outlook for the bond market?
PAUL Looking forward, we think that strong U.S. corporate fundamentals may support the profit margins of investment-grade companies. Moreover, for the financials sector, the combination of potentially less onerous regulation and a potential increase in interest rates may bolster fundamentals. Overall, we have found current spread levels — or the general yield advantage offered by investment-grade bonds over Treasuries of similar maturity — to be modestly attractive versus their underlying risks.
What is your outlook for U.S. stocks?
AARON We are optimistic about a number of business-building initiatives that President Trump has claimed will be priorities under his administration. At this early stage, we think it is likely that U.S. consumers will benefit from tax reform, and we believe that we can expect to see some measure of infrastructure spending get under way. We also believe that a number of promised reductions in regulatory burdens could give a boost to several areas, most notably financials. Overall, we think the regime change from President Obama to President Trump will shift the market in favor of sectors that may stand to benefit from pro-growth policies, higher interest rates, and inflationary conditions.

That said, in our view there are heightened risks related to the new administration and whether the legislative agenda will be executed according to well-laid plans or delayed due to a variety of potential complexities. In our view, tax reform is likely, but important details are in question. Moreover, a foreign policy misstep, while not the most likely case, in our view, is a risk factor. Finally, the market has digested much early political uncertainty in stride, but valuations on a near-term basis have been getting richer and, consequently, in our view, leave less margin for error.
Thank you, Aaron and Paul, for this update on the fund.
The views expressed in this report are exclusively those of Putnam Management and are subject to change. They are not meant as investment advice.
Please note that the holdings discussed in this report may not have been held by the fund for the entire period. Portfolio composition is subject to review in accordance with the fund’s investment strategy and may vary in the future. Current and future portfolio holdings are subject to risk.
|
| George Putnam Balanced Fund 9 |
Your fund’s performance
This section shows your fund’s performance, price, and distribution information for periods ended January 31, 2017, the end of the first half of its current fiscal year. In accordance with regulatory requirements for mutual funds, we also include performance information as of the most recent calendar quarter-end and expense information taken from the fund’s current prospectus. Performance should always be considered in light of a fund’s investment strategy. Data represent past performance. Past performance does not guarantee future results. More recent returns may be less or more than those shown. Investment return and principal value will fluctuate, and you may have a gain or a loss when you sell your shares. Performance information does not reflect any deduction for taxes a shareholder may owe on fund distributions or on the redemption of fund shares. For the most recent month-end performance, please visit the Individual Investors section at putnam.com or call Putnam at 1-800-225-1581. Class R, R5, R6, and Y shares are not available to all investors. See the Terms and Definitions section in this report for definitions of the share classes offered by your fund.
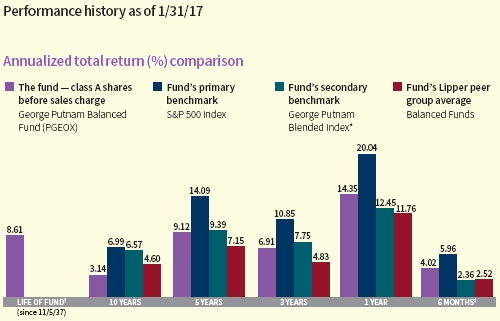
Fund performance Total return for periods ended 1/31/17
| | | | | | | | | |
| | Annual | | | | | | | | |
| | average | | Annual | | Annual | | Annual | | |
| | (life of fund) | 10 years | average | 5 years | average | 3 years | average | 1 year | 6 months |
|
| Class A (11/5/37) | | | | | | | | | |
| Before sales charge | 8.61% | 36.25% | 3.14% | 54.69% | 9.12% | 22.21% | 6.91% | 14.35% | 4.02% |
|
| After sales charge | 8.53 | 28.42 | 2.53 | 45.79 | 7.83 | 15.18 | 4.82 | 7.78 | –1.97 |
|
| Class B (4/27/92) | | | | | | | | | |
| Before CDSC | 8.50 | 28.15 | 2.51 | 49.00 | 8.30 | 19.48 | 6.11 | 13.47 | 3.62 |
|
| After CDSC | 8.50 | 28.15 | 2.51 | 47.00 | 8.01 | 16.48 | 5.22 | 8.47 | –1.38 |
|
| Class C (7/26/99) | | | | | | | | | |
| Before CDSC | 7.80 | 26.38 | 2.37 | 49.00 | 8.30 | 19.47 | 6.11 | 13.49 | 3.54 |
|
| After CDSC | 7.80 | 26.38 | 2.37 | 49.00 | 8.30 | 19.47 | 6.11 | 12.49 | 2.54 |
|
| Class M (12/1/94) | | | | | | | | | |
| Before sales charge | 7.89 | 29.63 | 2.63 | 50.88 | 8.57 | 20.38 | 6.38 | 13.80 | 3.70 |
|
| After sales charge | 7.84 | 25.09 | 2.26 | 45.60 | 7.80 | 16.17 | 5.12 | 9.81 | 0.07 |
|
| Class R (1/21/03) | | | | | | | | | |
| Net asset value | 8.34 | 32.98 | 2.89 | 52.76 | 8.84 | 21.29 | 6.64 | 14.09 | 3.86 |
|
| Class R5 (12/2/13) | | | | | | | | | |
| Net asset value | 8.69 | 39.76 | 3.40 | 56.65 | 9.39 | 23.15 | 7.19 | 14.61 | 4.08 |
|
| Class R6 (12/2/13) | | | | | | | | | |
| Net asset value | 8.70 | 40.25 | 3.44 | 57.19 | 9.47 | 23.50 | 7.29 | 14.77 | 4.20 |
|
| Class Y (3/31/94) | | | | | | | | | |
| Net asset value | 8.69 | 39.72 | 3.40 | 56.60 | 9.39 | 23.12 | 7.18 | 14.65 | 4.07 |
Current performance may be lower or higher than the quoted past performance, which cannot guarantee future results. After-sales-charge returns for class A and M shares reflect the deduction of the maximum 5.75% and 3.50% sales charge, respectively, levied at the time of purchase. Class B share returns after contingent deferred sales charge (CDSC) reflect the applicable CDSC, which is 5% in the first year, declining over time to 1% in the sixth year, and is eliminated thereafter. Class C share returns after CDSC reflect a 1% CDSC for the first year that is eliminated thereafter. Class R, R5, R6, and Y shares have no initial sales charge or CDSC. Performance for class B, C, M, R, and Y shares before their inception is derived from the historical performance of class A shares, adjusted for the applicable sales charge (or CDSC) and the higher operating expenses for such shares, except for class Y shares, for which 12b-1 fees are not applicable. Performance for class R5 and R6 shares prior to their inception is derived from the historical performance of class Y shares and has not been adjusted for the lower investor servicing fees applicable to class R5 and R6 shares; had it, returns would have been higher.
For a portion of the periods, the fund had expense limitations, without which returns would have been lower.
Class B share performance reflects conversion to class A shares after eight years.
|
| 10 George Putnam Balanced Fund |
Comparative index returns For periods ended 1/31/17
| | | | | | | | | |
| | Annual | | | | | | | | |
| | average | | Annual | | Annual | | Annual | | |
| | (life of fund) | 10 years | average | 5 years | average | 3 years | average | 1 year | 6 months |
|
| S&P 500 Index | —* | 96.46% | 6.99% | 93.28% | 14.09% | 36.20% | 10.85% | 20.04% | 5.96% |
|
| Bloomberg | | | | | | | | | |
| Barclays U.S. | | | | | | | | | |
| Aggregate Bond | —* | 53.37 | 4.37 | 10.92 | 2.09 | 7.99 | 2.59 | 1.45 | –2.95 |
| Index | | | | | | | | | |
|
| George Putnam | | | | | | | | | |
| Blended Index† | —* | 88.98 | 6.57 | 56.63 | 9.39 | 25.09 | 7.75 | 12.45 | 2.36 |
|
| Lipper Balanced | | | | | | | | | |
| Funds category | —* | 57.62 | 4.60 | 41.66 | 7.15 | 15.29 | 4.83 | 11.76 | 2.52 |
| average‡ | | | | | | | | | |
Index and Lipper results should be compared with fund performance before sales charge, before CDSC, or at net asset value.
* The fund’s benchmarks (S&P 500 Index and George Putnam Blended Index) were introduced on 12/31/69 and 12/31/78, respectively, the Bloomberg Barclays U.S. Aggregate Bond Index was introduced on 12/31/75, and the fund’s Lipper group (Balanced Funds) was introduced on 12/31/59; they all post-date the inception of the fund’s class A shares.
† George Putnam Blended Index is an unmanaged index administered by Putnam Management, 60% of which is the S&P 500 Index and 40% of which is the Bloomberg Barclays U.S. Aggregate Bond Index.
‡ Over the 6-month, 1-year, 3-year, 5-year, and 10-year periods ended 1/31/17, there were 647, 635, 595, 540, and 443 funds, respectively, in this Lipper category.
Fund price and distribution information For the six-month period ended 1/31/17
| | | | | | | | | | |
| Distributions | Class A | Class B | Class C | Class M | Class R | ClassR5 | ClassR6 | Class Y |
|
| Number | 2 | 2 | 2 | 2 | 2 | 2 | 2 | 2 |
|
| Income | $0.104 | $0.040 | $0.039 | $0.062 | $0.086 | $0.128 | $0.137 | $0.126 |
|
| Capital gains | — | — | — | — | — | — | — | — |
|
| Total | $0.104 | $0.040 | $0.039 | $0.062 | $0.086 | $0.128 | $0.137 | $0.126 |
|
| | Before | After | Net | Net | Before | After | Net | Net | Net | Net |
| | sales | sales | asset | asset | sales | sales | asset | asset | asset | asset |
| Share value | charge | charge | value | value | charge | charge | value | value | value | value |
|
| 7/31/16 | $17.38 | $18.44 | $17.18 | $17.26 | $17.15 | $17.77 | $17.33 | $17.45 | $17.45 | $17.45 |
|
| 1/31/17 | 17.97 | 19.07 | 17.76 | 17.83 | 17.72 | 18.36 | 17.91 | 18.03 | 18.04 | 18.03 |
|
| Current rate | Before | After | Net | Net | Before | After | Net | Net | Net | Net |
| (end of | sales | sales | asset | asset | sales | sales | asset | asset | asset | asset |
| period) | charge | charge | value | value | charge | charge | value | value | value | value |
|
| Current | | | | | | | | | | |
| dividend rate1 | 1.16% | 1.09% | 0.45% | 0.45% | 0.70% | 0.68% | 0.94% | 1.42% | 1.53% | 1.42% |
|
| Current | | | | | | | | | | |
| 30-day SEC | | | | | | | | | | |
| yield2 | N/A | 1.01 | 0.33 | 0.33 | N/A | 0.56 | 0.82 | 0.91 | 1.44 | 1.31 |
The classification of distributions, if any, is an estimate. Before-sales-charge share value and current dividend rate for class A and M shares, if applicable, do not take into account any sales charge levied at the time of purchase. After-sales-charge share value, current dividend rate, and current 30-day SEC yield, if applicable, are calculated assuming that the maximum sales charge (5.75% for class A shares and 3.50% for class M shares) was levied at the time of purchase. Final distribution information will appear on your year-end tax forms.
1 Most recent distribution, including any return of capital and excluding capital gains, annualized and divided by share price before or after sales charge at period-end.
2 Based only on investment income and calculated using the maximum offering price for each share class, in accordance with SEC guidelines.
|
| George Putnam Balanced Fund 11 |
Fund performance as of most recent calendar quarter Total return for periods ended 12/31/16
| | | | | | | | | |
| | Annual | | | | | | | | |
| | average | | Annual | | Annual | | Annual | | |
| | (life of fund) | 10 years | average | 5 years | average | 3 years | average | 1 year | 6 months |
|
| Class A (11/5/37) | | | | | | | | | |
| Before sales charge | 8.59% | 35.00% | 3.05% | 56.03% | 9.30% | 17.92% | 5.65% | 7.93% | 4.77% |
|
| After sales charge | 8.51 | 27.24 | 2.44 | 47.05 | 8.02 | 11.14 | 3.58 | 1.72 | –1.26 |
|
| Class B (4/27/92) | | | | | | | | | |
| Before CDSC | 8.48 | 27.01 | 2.42 | 50.26 | 8.49 | 15.22 | 4.84 | 7.08 | 4.31 |
|
| After CDSC | 8.48 | 27.01 | 2.42 | 48.26 | 8.19 | 12.22 | 3.92 | 2.08 | –0.69 |
|
| Class C (7/26/99) | | | | | | | | | |
| Before CDSC | 7.78 | 25.28 | 2.28 | 50.34 | 8.50 | 15.30 | 4.86 | 7.06 | 4.35 |
|
| After CDSC | 7.78 | 25.28 | 2.28 | 50.34 | 8.50 | 15.30 | 4.86 | 6.06 | 3.35 |
|
| Class M (12/1/94) | | | | | | | | | |
| Before sales charge | 7.87 | 28.49 | 2.54 | 52.16 | 8.76 | 16.16 | 5.12 | 7.31 | 4.45 |
|
| After sales charge | 7.82 | 24.00 | 2.17 | 46.83 | 7.99 | 12.10 | 3.88 | 3.56 | 0.80 |
|
| Class R (1/21/03) | | | | | | | | | |
| Net asset value | 8.32 | 31.83 | 2.80 | 54.04 | 9.03 | 17.00 | 5.37 | 7.66 | 4.67 |
|
| Class R5 (12/2/13) | | | | | | | | | |
| Net asset value | 8.67 | 38.48 | 3.31 | 58.00 | 9.58 | 18.84 | 5.92 | 8.19 | 4.89 |
|
| Class R6 (12/2/13) | | | | | | | | | |
| Net asset value | 8.68 | 38.88 | 3.34 | 58.46 | 9.64 | 19.19 | 6.03 | 8.28 | 4.95 |
|
| Class Y (3/31/94) | | | | | | | | | |
| Net asset value | 8.67 | 38.44 | 3.31 | 57.96 | 9.57 | 18.81 | 5.91 | 8.16 | 4.88 |
See the discussion following the fund performance table on page 10 for information about the calculation of fund performance.
|
| 12 George Putnam Balanced Fund |
Your fund’s expenses
As a mutual fund investor, you pay ongoing expenses, such as management fees, distribution fees (12b-1 fees), and other expenses. Using the following information, you can estimate how these expenses affect your investment and compare them with the expenses of other funds. You may also pay one-time transaction expenses, including sales charges (loads) and redemption fees, which are not shown in this section and would have resulted in higher total expenses. For more information, see your fund’s prospectus or talk to your financial representative.
Expense ratios
| | | | | | | | |
| | Class A | Class B | Class C | Class M | Class R | Class R5 | Class R6 | Class Y |
|
| Total annual operating | | | | | | | | |
| expenses for the fiscal year | | | | | | | | |
| ended 7/31/16 | 1.02%* | 1.77%* | 1.77%* | 1.52%* | 1.27%* | 0.73% | 0.63% | 0.77%* |
|
| Annualized expense ratio for | | | | | | | | |
| the six-month period ended | | | | | | | | |
| 1/31/17 | 1.01% | 1.76% | 1.76% | 1.51% | 1.26% | 0.73% | 0.63% | 0.76% |
Fiscal-year expense information in this table is taken from the most recent prospectus, is subject to change, and may differ from that shown for the annualized expense ratio and in the financial highlights of this report.
Expenses are shown as a percentage of average net assets.
* Restated to reflect current fees resulting from a change to the fund’s investor servicing arrangements effective September 1, 2016.
Expenses per $1,000
The following table shows the expenses you would have paid on a $1,000 investment in each class of the fund from 8/1/16 to 1/31/17. It also shows how much a $1,000 investment would be worth at the close of the period, assuming actual returns and expenses.
| | | | | | | | |
| | Class A | Class B | Class C | Class M | Class R | Class R5 | Class R6 | Class Y |
|
| Expenses paid per $1,000*† | $5.19 | $9.03 | $9.03 | $7.75 | $6.47 | $3.76 | $3.24 | $3.91 |
|
| Ending value (after expenses) | $1,040.20 | $1,036.20 | $1,035.40 | $1,037.00 | $1,038.60 | $1,040.80 | $1,042.00 | $1,040.70 |
* Expenses for each share class are calculated using the fund’s annualized expense ratio for each class, which represents the ongoing expenses as a percentage of average net assets for the six months ended 1/31/17. The expense ratio may differ for each share class.
† Expenses are calculated by multiplying the expense ratio by the average account value for the period; then multiplying the result by the number of days in the period; and then dividing that result by the number of days in the year.
|
| George Putnam Balanced Fund 13 |
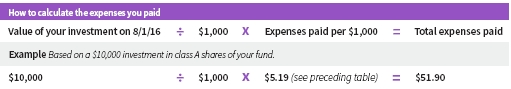
Estimate the expenses you paid
To estimate the ongoing expenses you paid for the six months ended 1/31/17, use the following calculation method. To find the value of your investment on 8/1/16, call Putnam at 1-800-225-1581.
Compare expenses using the SEC’s method
The Securities and Exchange Commission (SEC) has established guidelines to help investors assess fund expenses. Per these guidelines, the following table shows your fund’s expenses based on a $1,000 investment, assuming a hypothetical 5% annualized return. You can use this information to compare the ongoing expenses (but not transaction expenses or total costs) of investing in the fund with those of other funds. All mutual fund shareholder reports will provide this information to help you make this comparison. Please note that you cannot use this information to estimate your actual ending account balance and expenses paid during the period.
| | | | | | | | |
| | Class A | Class B | Class C | Class M | Class R | Class R5 | Class R6 | Class Y |
|
| Expenses paid per $1,000*† | $5.14 | $8.94 | $8.94 | $7.68 | $6.41 | $3.72 | $3.21 | $3.87 |
|
| Ending value (after expenses) | $1,020.11 | $1,016.33 | $1,016.33 | $1,017.59 | $1,018.85 | $1,021.53 | $1,022.03 | $1,021.37 |
* Expenses for each share class are calculated using the fund’s annualized expense ratio for each class, which represents the ongoing expenses as a percentage of average net assets for the six months ended 1/31/17. The expense ratio may differ for each share class.
† Expenses are calculated by multiplying the expense ratio by the average account value for the six-month period; then multiplying the result by the number of days in the six-month period; and then dividing that result by the number of days in the year.
|
| 14 George Putnam Balanced Fund |
Terms and definitions
Important terms
Total return shows how the value of the fund’s shares changed over time, assuming you held the shares through the entire period and reinvested all distributions in the fund.
Before sales charge, or net asset value, is the price, or value, of one share of a mutual fund, without a sales charge. Before-sales-charge figures fluctuate with market conditions, and are calculated by dividing the net assets of each class of shares by the number of outstanding shares in the class.
After sales charge is the price of a mutual fund share plus the maximum sales charge levied at the time of purchase. After-sales-charge performance figures shown here assume the 5.75% maximum sales charge for class A shares and 3.50% for class M shares.
Contingent deferred sales charge (CDSC) is generally a charge applied at the time of the redemption of class B or C shares and assumes redemption at the end of the period. Your fund’s class B CDSC declines over time from a 5% maximum during the first year to 1% during the sixth year. After the sixth year, the CDSC no longer applies. The CDSC for class C shares is 1% for one year after purchase.
Current rate is the annual rate of return earned from dividends or interest of an investment. Current rate is expressed as a percentage of the price of a security, fund share, or principal investment.
Share classes
Class A shares are generally subject to an initial sales charge and no CDSC (except on certain redemptions of shares bought without an initial sales charge).
Class B shares are not subject to an initial sales charge and may be subject to a CDSC.
Class C shares are not subject to an initial sales charge and are subject to a CDSC only if the shares are redeemed during the first year.
Class M shares have a lower initial sales charge and a higher 12b-1 fee than class A shares and no CDSC.
Class R shares are not subject to an initial sales charge or CDSC and are only available to employer-sponsored retirement plans.
Class R5 and R6 shares are not subject to an initial sales charge or CDSC, and carry no 12b-1 fee. They are only available to employer-sponsored retirement plans.
Class Y shares are not subject to an initial sales charge or CDSC, and carry no 12b-1 fee. They are generally only available to corporate and institutional clients and clients in other approved programs.
Comparative indexes
Bloomberg Barclays U.S. Aggregate Bond Index is an unmanaged index of U.S. investment-grade fixed-income securities.
BofA Merrill Lynch U.S. 3-Month Treasury Bill Index is an unmanaged index that seeks to measure the performance of U.S. Treasury bills available in the marketplace.
George Putnam Blended Index is an unmanaged index administered by Putnam Management, LLC, 60% of which is the S&P 500 Index and 40% of which is the Bloomberg Barclays U.S. Aggregate Bond Index.
S&P 500 Index is an unmanaged index of common stock performance.
Indexes assume reinvestment of all distributions and do not account for fees. Securities and performance of a fund and an index will differ. You cannot invest directly in an index.
Lipper is a third-party industry-ranking entity that ranks mutual funds. Its rankings do not
|
| George Putnam Balanced Fund 15 |
reflect sales charges. Lipper rankings are based on total return at net asset value relative to other funds that have similar current investment styles or objectives as determined by Lipper. Lipper may change a fund’s category assignment at its discretion. Lipper category averages reflect performance trends for funds within a category.
Other information for shareholders
Important notice regarding delivery of shareholder documents
In accordance with Securities and Exchange Commission (SEC) regulations, Putnam sends a single copy of annual and semiannual shareholder reports, prospectuses, and proxy statements to Putnam shareholders who share the same address, unless a shareholder requests otherwise. If you prefer to receive your own copy of these documents, please call Putnam at 1-800-225-1581, and Putnam will begin sending individual copies within 30 days.
Proxy voting
Putnam is committed to managing our mutual funds in the best interests of our shareholders. The Putnam funds’ proxy voting guidelines and procedures, as well as information regarding how your fund voted proxies relating to portfolio securities during the 12-month period ended June 30, 2016, are available in the Individual Investors section of putnam.com, and on the SEC’s website, www.sec.gov. If you have questions about finding forms on the SEC’s website, you may call the SEC at 1-800-SEC-0330. You may also obtain the Putnam funds’ proxy voting guidelines and procedures at no charge by calling Putnam’s Shareholder Services at 1-800-225-1581.
Fund portfolio holdings
The fund will file a complete schedule of its portfolio holdings with the SEC for the first and third quarters of each fiscal year on Form N-Q. Shareholders may obtain the fund’s Form N-Q on the SEC’s website at www.sec.gov. In addition, the fund’s Form N-Q may be reviewed and copied at the SEC’s Public Reference Room in Washington, D.C. You may call the SEC at 1-800-SEC-0330 for information about the SEC’s website or the operation of the Public Reference Room.
Trustee and employee fund ownership
Putnam employees and members of the Board of Trustees place their faith, confidence, and, most importantly, investment dollars in Putnam mutual funds. As of January 31, 2017, Putnam employees had approximately $465,000,000 and the Trustees had approximately $135,000,000 invested in Putnam mutual funds. These amounts include investments by the Trustees’ and employees’ immediate family members as well as investments through retirement and deferred compensation plans.
|
| 16 George Putnam Balanced Fund |
Financial statements
These sections of the report, as well as the accompanying Notes, constitute the fund’s financial statements.
The fund’s portfolio lists all the fund’s investments and their values as of the last day of the reporting period. Holdings are organized by asset type and industry sector, country, or state to show areas of concentration and diversification.
Statement of assets and liabilities shows how the fund’s net assets and share price are determined. All investment and non-investment assets are added together. Any unpaid expenses and other liabilities are subtracted from this total. The result is divided by the number of shares to determine the net asset value per share, which is calculated separately for each class of shares. (For funds with preferred shares, the amount subtracted from total assets includes the liquidation preference of preferred shares.)
Statement of operations shows the fund’s net investment gain or loss. This is done by first adding up all the fund’s earnings — from dividends and interest income — and subtracting its operating expenses to determine net investment income (or loss). Then, any net gain or loss the fund realized on the sales of its holdings — as well as any unrealized gains or losses over the period — is added to or subtracted from the net investment result to determine the fund’s net gain or loss for the fiscal period.
Statement of changes in net assets shows how the fund’s net assets were affected by the fund’s net investment gain or loss, by distributions to shareholders, and by changes in the number of the fund’s shares. It lists distributions and their sources (net investment income or realized capital gains) over the current reporting period and the most recent fiscal year-end. The distributions listed here may not match the sources listed in the Statement of operations because the distributions are determined on a tax basis and may be paid in a different period from the one in which they were earned. Dividend sources are estimated at the time of declaration. Actual results may vary. Any non-taxable return of capital cannot be determined until final tax calculations are completed after the end of the fund’s fiscal year.
Financial highlights provide an overview of the fund’s investment results, per-share distributions, expense ratios, net investment income ratios, and portfolio turnover in one summary table, reflecting the five most recent reporting periods. In a semiannual report, the highlights table also includes the current reporting period.
|
| George Putnam Balanced Fund 17 |
The fund’s portfolio 1/31/17 (Unaudited)
| | |
| COMMON STOCKS (60.6%)* | Shares | Value |
|
| Basic materials (2.2%) | | |
|
| Air Products & Chemicals, Inc. | 8,902 | $1,244,144 |
|
| Albemarle Corp. | 21,117 | 1,956,279 |
|
| ArcelorMittal SA (France) † | 47,846 | 372,265 |
|
| Axalta Coating Systems, Ltd. † | 27,037 | 784,073 |
|
| Barrick Gold Corp. (Canada) | 11,461 | 211,341 |
|
| CF Industries Holdings, Inc. S | 60,825 | 2,146,514 |
|
| Dow Chemical Co. (The) | 29,696 | 1,770,772 |
|
| E. I. du Pont de Nemours & Co. | 7,796 | 588,598 |
|
| Fortune Brands Home & Security, Inc. | 19,842 | 1,093,889 |
|
| Freeport-McMoRan, Inc. (Indonesia) † | 21,714 | 361,538 |
|
| KapStone Paper and Packaging Corp. | 68,121 | 1,633,542 |
|
| LANXESS AG (Germany) | 14,158 | 1,026,523 |
|
| Martin Marietta Materials, Inc. | 4,231 | 971,438 |
|
| Newmont Mining Corp. | 20,724 | 751,867 |
|
| Nucor Corp. | 10,228 | 594,145 |
|
| RPC Group PLC (United Kingdom) | 51,019 | 688,092 |
|
| Sealed Air Corp. | 33,842 | 1,641,337 |
|
| Sherwin-Williams Co. (The) | 11,607 | 3,526,323 |
|
| Sociedad Quimica y Minera de Chile SA ADR (Chile) | 25,428 | 821,833 |
|
| Steel Dynamics, Inc. | 4,634 | 156,676 |
|
| Syngenta AG (Switzerland) | 2,547 | 1,082,791 |
|
| United States Steel Corp. | 6,957 | 227,563 |
|
| W.R. Grace & Co. | 18,166 | 1,259,630 |
|
| Yara International ASA (Norway) | 2,032 | 85,827 |
|
| | | 24,997,000 |
|
| Capital goods (3.9%) | | |
|
| Airbus Group SE (France) | 60,916 | 4,136,618 |
|
| Ball Corp. | 11,693 | 891,708 |
|
| Dover Corp. | 39,300 | 3,055,575 |
|
| Fortive Corp. | 74,200 | 4,104,002 |
|
| Johnson Controls International PLC | 159,087 | 6,996,646 |
|
| KION Group AG (Germany) | 34,776 | 2,115,240 |
|
| Komatsu, Ltd. (Japan) | 181,700 | 4,335,310 |
|
| Northrop Grumman Corp. | 23,373 | 5,354,287 |
|
| Raytheon Co. | 38,021 | 5,481,107 |
|
| Stericycle, Inc. † | 12,988 | 1,001,894 |
|
| United Technologies Corp. | 37,611 | 4,124,798 |
|
| Waste Connections, Inc. (Canada) | 50,051 | 4,019,095 |
|
| | | 45,616,280 |
|
| Communication services (3.4%) | | |
|
| American Tower Corp. R | 22,539 | 2,332,787 |
|
| AT&T, Inc. | 227,433 | 9,588,575 |
|
| Charter Communications, Inc. Class A † | 17,142 | 5,553,151 |
|
| Comcast Corp. Class A | 113,539 | 8,563,111 |
|
| DISH Network Corp. Class A † | 30,419 | 1,799,892 |
|
| Equinix, Inc. R | 5,251 | 2,021,530 |
|
| T-Mobile US, Inc. † | 92,579 | 5,764,894 |
|
|
| 18 George Putnam Balanced Fund |
| | |
| COMMON STOCKS (60.6%)* cont. | Shares | Value |
|
| Communication services cont. | | |
|
| Verizon Communications, Inc. | 45,537 | $2,231,768 |
|
| Zayo Group Holdings, Inc. † | 46,761 | 1,494,482 |
|
| | | 39,350,190 |
|
| Communications equipment (0.2%) | | |
|
| Cisco Systems, Inc. | 90,637 | 2,784,369 |
|
| | | 2,784,369 |
|
| Components (0.2%) | | |
|
| Oclaro, Inc. † | 222,508 | 2,182,803 |
|
| | | 2,182,803 |
|
| Computers (2.3%) | | |
|
| Apple, Inc. | 194,632 | 23,618,593 |
|
| Castlight Health, Inc. Class B † S | 77,337 | 239,745 |
|
| HP, Inc. | 59,487 | 895,279 |
|
| ServiceNow, Inc. † | 10,742 | 973,440 |
|
| Western Digital Corp. | 9,900 | 789,327 |
|
| | | 26,516,384 |
|
| Conglomerates (0.9%) | | |
|
| Danaher Corp. | 51,639 | 4,333,545 |
|
| Siemens AG (Germany) † | 44,864 | 5,626,379 |
|
| | | 9,959,924 |
|
| Consumer cyclicals (6.7%) | | |
|
| Amazon.com, Inc. † | 18,670 | 15,374,372 |
|
| Brunswick Corp. | 18,086 | 1,082,628 |
|
| CaesarStone Sdot-Yam, Ltd. (Israel) † | 12,944 | 392,850 |
|
| Criteo SA ADR (France) † S | 17,698 | 797,649 |
|
| Ctrip.com International, Ltd. ADR (China) † S | 50,918 | 2,200,167 |
|
| Expedia, Inc. | 16,756 | 2,037,362 |
|
| Five Below, Inc. † S | 24,076 | 959,429 |
|
| Hanesbrands, Inc. | 127,208 | 3,016,102 |
|
| Hilton Worldwide Holdings, Inc. | 41,725 | 2,402,526 |
|
| Home Depot, Inc. (The) | 71,822 | 9,881,271 |
|
| Live Nation Entertainment, Inc. † | 91,593 | 2,621,392 |
|
| MasterCard, Inc. Class A | 36,748 | 3,907,415 |
|
| O’Reilly Automotive, Inc. † S | 11,486 | 3,012,433 |
|
| Penn National Gaming, Inc. † | 135,642 | 1,869,147 |
|
| Priceline Group, Inc. (The) † | 2,966 | 4,671,836 |
|
| Rollins, Inc. S | 85,828 | 3,026,295 |
|
| TJX Cos., Inc. (The) | 54,084 | 4,051,973 |
|
| United Rentals, Inc. † | 24,412 | 3,088,362 |
|
| Vulcan Materials Co. | 8,075 | 1,036,265 |
|
| Wal-Mart Stores, Inc. | 32,156 | 2,146,091 |
|
| Walt Disney Co. (The) | 82,267 | 9,102,844 |
|
| Wynn Resorts, Ltd. S | 17,946 | 1,820,263 |
|
| | | 78,498,672 |
|
| Consumer staples (6.3%) | | |
|
| Altria Group, Inc. | 71,427 | 5,084,174 |
|
| Bright Horizons Family Solutions, Inc. † | 20,499 | 1,452,559 |
|
| Campbell Soup Co. | 42,839 | 2,665,871 |
|
| Costco Wholesale Corp. | 31,549 | 5,172,459 |
|
|
| George Putnam Balanced Fund 19 |
| | |
| COMMON STOCKS (60.6%)* cont. | Shares | Value |
|
| Consumer staples cont. | | |
|
| CVS Health Corp. | 37,923 | $2,988,712 |
|
| Delivery Hero Holding GmbH (acquired 6/12/15 cost $446,716) (Private) | | |
| (Germany) † ∆∆ F | 58 | 385,647 |
|
| Dr. Pepper Snapple Group, Inc. | 62,965 | 5,742,408 |
|
| Edgewell Personal Care Co. † | 4,469 | 352,336 |
|
| JM Smucker Co. (The) | 11,266 | 1,530,486 |
|
| Kraft Heinz Co. (The) | 75,649 | 6,754,699 |
|
| Kroger Co. (The) | 76,998 | 2,614,852 |
|
| LKQ Corp. † | 22,530 | 718,932 |
|
| Mead Johnson Nutrition Co. | 9,517 | 670,568 |
|
| Molson Coors Brewing Co. Class B | 48,210 | 4,653,229 |
|
| Mondelez International, Inc. Class A | 45,583 | 2,018,415 |
|
| Monster Beverage Corp. † | 17,802 | 758,365 |
|
| Nomad Foods, Ltd. (United Kingdom) † | 55,541 | 570,406 |
|
| PepsiCo, Inc. | 136,123 | 14,126,845 |
|
| Philip Morris International, Inc. | 19,141 | 1,840,024 |
|
| Pinnacle Foods, Inc. | 10,368 | 551,474 |
|
| Procter & Gamble Co. (The) | 39,463 | 3,456,959 |
|
| Restaurant Brands International, Inc. (Canada) S | 29,747 | 1,459,983 |
|
| Walgreens Boots Alliance, Inc. | 76,934 | 6,303,972 |
|
| Yum China Holdings, Inc. (China) † | 29,688 | 815,826 |
|
| | | 72,689,201 |
|
| Electronics (2.9%) | | |
|
| Agilent Technologies, Inc. | 50,345 | 2,465,395 |
|
| Analog Devices, Inc. | 11,375 | 852,443 |
|
| Broadcom, Ltd. | 25,825 | 5,152,088 |
|
| Micron Technology, Inc. † | 68,939 | 1,662,119 |
|
| NVIDIA Corp. | 10,778 | 1,176,742 |
|
| NXP Semiconductor NV † | 18,324 | 1,793,003 |
|
| Qorvo, Inc. † S | 111,700 | 7,172,257 |
|
| Qualcomm, Inc. | 30,631 | 1,636,614 |
|
| Rockwell Automation, Inc. | 19,349 | 2,863,459 |
|
| Skyworks Solutions, Inc. | 16 | 1,468 |
|
| Sumco Corp. (Japan) | 35,200 | 552,114 |
|
| Texas Instruments, Inc. | 71,719 | 5,417,653 |
|
| Xilinx, Inc. | 45,208 | 2,631,106 |
|
| | | 33,376,461 |
|
| Energy (4.8%) | | |
|
| Anadarko Petroleum Corp. | 86,638 | 6,023,940 |
|
| Arch Coal, Inc. Class A † | 1,631 | 117,416 |
|
| Baker Hughes, Inc. | 16,923 | 1,067,503 |
|
| Cenovus Energy, Inc. (Canada) | 141,800 | 1,935,345 |
|
| Cheniere Energy, Inc. † | 70,172 | 3,343,696 |
|
| Chevron Corp. | 18,900 | 2,104,515 |
|
| Cimarex Energy Co. | 4,026 | 544,355 |
|
| ConocoPhillips | 128,370 | 6,259,321 |
|
| Devon Energy Corp. | 8,115 | 369,557 |
|
| EnCana Corp. (Canada) | 90,629 | 1,156,847 |
|
| EOG Resources, Inc. | 37,530 | 3,812,297 |
|
|
| 20 George Putnam Balanced Fund |
| | |
| COMMON STOCKS (60.6%)* cont. | Shares | Value |
|
| Energy cont. | | |
|
| Exxon Mobil Corp. | 24,337 | $2,041,631 |
|
| Halliburton Co. | 106,797 | 6,041,506 |
|
| Hess Corp. | 10,145 | 549,656 |
|
| Keane Group, Inc. † | 28,557 | 630,824 |
|
| Marathon Oil Corp. | 60,637 | 1,015,670 |
|
| Noble Energy, Inc. | 74,926 | 2,979,058 |
|
| ONEOK, Inc. | 7,665 | 422,418 |
|
| Pioneer Natural Resources Co. | 11,799 | 2,126,534 |
|
| Plains All American Pipeline LP | 42,879 | 1,345,972 |
|
| Royal Dutch Shell PLC Class A (United Kingdom) | 165,480 | 4,487,876 |
|
| Schlumberger, Ltd. | 37,597 | 3,147,245 |
|
| Seven Generations Energy, Ltd. (Canada) † | 48,773 | 974,898 |
|
| Suncor Energy, Inc. (Canada) | 101,518 | 3,148,716 |
|
| Williams Cos., Inc. (The) | 18,990 | 547,672 |
|
| | | 56,194,468 |
|
| Financials (10.0%) | | |
|
| American International Group, Inc. | 92,480 | 5,942,765 |
|
| Assured Guaranty, Ltd. | 167,174 | 6,504,740 |
|
| AvalonBay Communities, Inc. R | 10,450 | 1,811,090 |
|
| Bank of America Corp. | 578,442 | 13,095,927 |
|
| Boston Properties, Inc. R | 13,993 | 1,831,684 |
|
| CBRE Group, Inc. Class A † | 18,900 | 573,804 |
|
| Charles Schwab Corp. (The) | 157,389 | 6,490,722 |
|
| Chubb, Ltd. | 38,462 | 5,057,368 |
|
| Douglas Emmett, Inc. R | 16,256 | 615,127 |
|
| E*Trade Financial Corp. † | 47,865 | 1,792,544 |
|
| Equity Lifestyle Properties, Inc. R | 13,205 | 976,378 |
|
| Essex Property Trust, Inc. R | 3,207 | 719,330 |
|
| Federal Realty Investment Trust R | 6,122 | 859,712 |
|
| Gaming and Leisure Properties, Inc. R | 41,120 | 1,300,626 |
|
| GGP, Inc. R | 45,812 | 1,137,970 |
|
| Goldman Sachs Group, Inc. (The) | 32,842 | 7,531,327 |
|
| Gores Holdings II, Inc. (Units) † | 51,253 | 528,418 |
|
| Hartford Financial Services Group, Inc. (The) | 52,189 | 2,542,126 |
|
| Invesco, Ltd. | 102,991 | 2,978,500 |
|
| JPMorgan Chase & Co. | 186,373 | 15,772,747 |
|
| KeyCorp | 284,207 | 5,107,200 |
|
| Kimco Realty Corp. R | 14,396 | 358,316 |
|
| KKR & Co. LP | 281,172 | 4,881,146 |
|
| MetLife, Inc. | 92,218 | 5,017,581 |
|
| Oportun Financial Corp. (acquired 6/23/15, cost $386,984) (Private) † ∆∆ F | 135,784 | 348,286 |
|
| Pebblebrook Hotel Trust R S | 15,122 | 452,299 |
|
| Prudential PLC (United Kingdom) | 278,475 | 5,383,663 |
|
| Public Storage R | 7,613 | 1,636,795 |
|
| Simon Property Group, Inc. R | 10,471 | 1,924,256 |
|
| Synchrony Financial | 154,111 | 5,520,256 |
|
| Visa, Inc. Class A | 92,495 | 7,650,261 |
|
| | | 116,342,964 |
|
| George Putnam Balanced Fund 21 |
| | |
| COMMON STOCKS (60.6%)* cont. | Shares | Value |
|
| Health care (7.2%) | | |
|
| Abbott Laboratories | 19,503 | $814,640 |
|
| Aetna, Inc. | 5,143 | 610,011 |
|
| Allergan PLC † | 34,499 | 7,551,486 |
|
| Amgen, Inc. | 42,014 | 6,582,754 |
|
| Becton Dickinson and Co. | 18,057 | 3,201,326 |
|
| Biogen, Inc. † | 16,838 | 4,668,167 |
|
| Boston Scientific Corp. † | 105,965 | 2,549,518 |
|
| Bristol-Myers Squibb Co. | 59,368 | 2,918,531 |
|
| C.R. Bard, Inc. | 11,166 | 2,650,027 |
|
| Cardinal Health, Inc. | 3,574 | 267,907 |
|
| Celgene Corp. † | 66,957 | 7,777,056 |
|
| Cigna Corp. | 22,042 | 3,222,981 |
|
| Edwards Lifesciences Corp. † | 2,349 | 226,068 |
|
| Eli Lilly & Co. | 51,471 | 3,964,811 |
|
| Express Scripts Holding Co. † | 17,399 | 1,198,443 |
|
| Gilead Sciences, Inc. | 91,585 | 6,635,333 |
|
| Henry Schein, Inc. † | 5,781 | 924,151 |
|
| HTG Molecular Diagnostics, Inc. † | 6,668 | 11,669 |
|
| Humana, Inc. | 10,572 | 2,098,542 |
|
| Illumina, Inc. † | 7,103 | 1,137,190 |
|
| Intuitive Surgical, Inc. † S | 3,520 | 2,438,269 |
|
| Jazz Pharmaceuticals PLC † | 5,799 | 707,014 |
|
| Johnson & Johnson | 26,218 | 2,969,189 |
|
| Medtronic PLC | 19,908 | 1,513,406 |
|
| Merck & Co., Inc. | 87,502 | 5,424,249 |
|
| Mylan NV † | 52,096 | 1,982,253 |
|
| Pfizer, Inc. | 169,464 | 5,377,093 |
|
| Service Corp. International/US | 85,415 | 2,488,139 |
|
| UnitedHealth Group, Inc. | 4,954 | 803,043 |
|
| Ventas, Inc. R | 24,176 | 1,490,934 |
|
| | | 84,204,200 |
|
| Miscellaneous (0.1%) | | |
|
| Conyers Park Acquisition Corp. (Units) † | 63,307 | 688,147 |
|
| | | 688,147 |
|
| Semiconductor (0.4%) | | |
|
| Applied Materials, Inc. | 135,505 | 4,641,046 |
|
| | | 4,641,046 |
|
| Software (2.6%) | | |
|
| Activision Blizzard, Inc. | 6,463 | 259,877 |
|
| Adobe Systems, Inc. † | 36,629 | 4,152,978 |
|
| Electronic Arts, Inc. † | 28,749 | 2,398,529 |
|
| Everbridge, Inc. † | 22,866 | 422,335 |
|
| Microsoft Corp. | 332,066 | 21,468,067 |
|
| Tencent Holdings, Ltd. (China) | 60,681 | 1,598,577 |
|
| | | 30,300,363 |
|
| Technology services (3.9%) | | |
|
| Alibaba Group Holding, Ltd. ADR (China) † S | 28,050 | 2,841,746 |
|
| Alphabet, Inc. Class A † | 24,047 | 19,723,109 |
|
| Cognizant Technology Solutions Corp. Class A † | 12,264 | 644,964 |
|
|
| 22 George Putnam Balanced Fund |
| | |
| COMMON STOCKS (60.6%)* cont. | Shares | Value |
|
| Technology services cont. | | |
|
| Computer Sciences Corp. | 42,481 | $2,642,318 |
|
| Facebook, Inc. Class A † | 97,497 | 12,705,809 |
|
| Fidelity National Information Services, Inc. | 39,652 | 3,149,162 |
|
| GoDaddy, Inc. Class A † S | 33,337 | 1,191,131 |
|
| salesforce.com, Inc. † | 25,138 | 1,988,416 |
|
| Wix.com, Ltd. (Israel) † | 19,052 | 1,001,183 |
|
| | | 45,887,838 |
|
| Transportation (0.6%) | | |
|
| American Airlines Group, Inc. S | 28,598 | 1,265,462 |
|
| Norfolk Southern Corp. | 33,752 | 3,964,510 |
|
| United Parcel Service, Inc. Class B | 11,830 | 1,291,008 |
|
| | | 6,520,980 |
|
| Utilities and power (2.0%) | | |
|
| Ameren Corp. | 25,507 | 1,342,944 |
|
| American Electric Power Co., Inc. | 22,585 | 1,446,795 |
|
| American Water Works Co., Inc. | 31,670 | 2,325,845 |
|
| Calpine Corp. † | 158,733 | 1,873,049 |
|
| Edison International | 29,564 | 2,154,624 |
|
| Exelon Corp. | 109,663 | 3,934,708 |
|
| Kinder Morgan, Inc. | 39,461 | 881,559 |
|
| NextEra Energy, Inc. | 17,246 | 2,133,675 |
|
| NRG Energy, Inc. | 201,108 | 3,326,326 |
|
| PG&E Corp. | 53,014 | 3,281,036 |
|
| Sempra Energy | 9,156 | 937,483 |
|
| | | 23,638,044 |
|
| Total common stocks (cost $627,455,887) | | $704,389,334 |
|
| | |
| U.S. GOVERNMENT AND AGENCY | Principal | |
| MORTGAGE OBLIGATIONS (12.7%)* | amount | Value |
|
| U.S. Government Guaranteed Mortgage Obligations (1.9%) | | |
|
| Government National Mortgage Association Pass-Through Certificates | | |
|
| 4.50%, TBA, 2/1/47 | $7,000,000 | $7,509,141 |
|
| 3.50%, with due dates from 2/20/43 to 11/20/45 | 3,746,598 | 3,885,359 |
|
| 3.50%, TBA, 2/1/47 | 3,000,000 | 3,108,281 |
|
| 3.00%, with due dates from 8/20/46 to 10/20/46 | 1,986,656 | 2,004,071 |
|
| 3.00%, TBA, 2/1/47 | 5,000,000 | 5,042,188 |
|
| | | 21,549,040 |
|
| U.S. Government Agency Mortgage Obligations (10.8%) | | |
|
| Federal Home Loan Mortgage Corporation Pass-Through Certificates | | |
|
| 6.00%, 3/1/35 | 1,980 | 2,259 |
|
| 4.00%, with due dates from 7/1/42 to 9/1/45 | 5,073,441 | 5,351,067 |
|
| 3.50%, with due dates from 12/1/42 to 4/1/43 | 700,543 | 722,244 |
|
| 3.00%, with due dates from 3/1/43 to 7/1/43 | 2,455,046 | 2,439,286 |
|
| Federal National Mortgage Association Pass-Through Certificates | | |
|
| 5.50%, with due dates from 7/1/33 to 11/1/38 | 2,605,359 | 2,907,377 |
|
| 5.00%, with due dates from 8/1/33 to 1/1/39 | 710,666 | 780,944 |
|
| 4.50%, 11/1/44 | 6,403,743 | 6,980,330 |
|
| 4.50%, TBA, 3/1/47 | 13,000,000 | 13,957,226 |
|
| 4.50%, TBA, 2/1/47 | 13,000,000 | 13,980,078 |
|
|
| George Putnam Balanced Fund 23 |
| | |
| U.S. GOVERNMENT AND AGENCY | Principal | |
| MORTGAGE OBLIGATIONS (12.7%)* cont. | amount | Value |
|
| U.S. Government Agency Mortgage Obligations cont. | | |
|
| Federal National Mortgage Association Pass-Through Certificates | | |
|
| 4.00%, 9/1/45 | $2,795,780 | $2,962,871 |
|
| 3.50%, with due dates from 5/1/43 to 1/1/47 | 7,168,324 | 7,353,575 |
|
| 3.50%, TBA, 3/1/47 | 27,000,000 | 27,536,836 |
|
| 3.50%, TBA, 2/1/47 | 29,000,000 | 29,636,640 |
|
| 3.00%, with due dates from 2/1/43 to 6/1/46 | 3,425,186 | 3,402,963 |
|
| 3.00%, TBA, 3/1/47 | 4,000,000 | 3,951,094 |
|
| 3.00%, TBA, 2/1/47 | 4,000,000 | 3,958,750 |
|
| | | 125,923,540 |
|
| Total U.S. government and agency mortgage obligations (cost $147,938,610) | $147,472,580 |
|
| | |
| | Principal | |
| U.S. TREASURY OBLIGATIONS (11.8%)* | amount | Value |
|
| U.S. Treasury Bonds 2.75%, 8/15/42 ∆ | $19,090,000 | $18,093,741 |
|
| U.S. Treasury Notes | | |
|
| 2.00%, 2/15/22 ∆ | 5,880,000 | 5,896,423 |
|
| 2.00%, 11/30/20 | 44,660,000 | 45,144,543 |
|
| 1.875%, 11/30/21 | 6,480,000 | 6,470,445 |
|
| 1.375%, 9/30/18 | 23,230,000 | 23,332,540 |
|
| 1.125%, 3/31/20 | 7,770,000 | 7,675,303 |
|
| 1.125%, 12/31/19 | 31,470,000 | 31,173,125 |
|
| Total U.S. treasury obligations (cost $138,847,759) | | $137,786,120 |
|
| | |
| | Principal | |
| CORPORATE BONDS AND NOTES (15.8%)* | amount | Value |
|
| Basic materials (0.8%) | | |
|
| Agrium, Inc. sr. unsec. unsub. notes 7.125%, 5/23/36 (Canada) | $182,000 | $230,247 |
|
| Celanese US Holdings, LLC company guaranty sr. unsec. unsub. | | |
| notes 4.625%, 11/15/22 (Germany) | 668,000 | 703,070 |
|
| Cytec Industries, Inc. sr. unsec. unsub. notes 3.50%, 4/1/23 | 215,000 | 214,230 |
|
| Eastman Chemical Co. sr. unsec. notes 3.80%, 3/15/25 | 235,000 | 238,586 |
|
| Freeport-McMoRan, Inc. 144A company guaranty sr. unsec. notes | | |
| 6.75%, 2/1/22 (Indonesia) | 95,000 | 99,038 |
|
| Georgia-Pacific, LLC sr. unsec. unsub. notes 7.75%, 11/15/29 | 850,000 | 1,141,935 |
|
| Glencore Funding, LLC 144A company guaranty sr. unsec. unsub. | | |
| notes 4.625%, 4/29/24 | 941,000 | 973,700 |
|
| Glencore Funding, LLC 144A company guaranty sr. unsec. unsub. | | |
| notes 4.00%, 4/16/25 | 638,000 | 634,927 |
|
| International Paper Co. sr. unsec. notes 8.70%, 6/15/38 | 10,000 | 14,377 |
|
| INVISTA Finance, LLC 144A company guaranty sr. notes | | |
| 4.25%, 10/15/19 | 356,000 | 357,866 |
|
| LyondellBasell Industries NV sr. unsec. unsub. notes | | |
| 4.625%, 2/26/55 | 515,000 | 482,255 |
|
| Union Carbide Corp. sr. unsec. unsub. bonds 7.75%, 10/1/96 | 180,000 | 223,005 |
|
| Westlake Chemical Corp. 144A company guaranty sr. unsec. | | |
| unsub. bonds 3.60%, 8/15/26 | 1,610,000 | 1,561,679 |
|
| WestRock MWV, LLC company guaranty sr. unsec. unsub. notes | | |
| 8.20%, 1/15/30 | 1,265,000 | 1,693,671 |
|
| WestRock MWV, LLC company guaranty sr. unsec. unsub. notes | | |
| 7.95%, 2/15/31 | 187,000 | 247,764 |
|
|
| 24 George Putnam Balanced Fund |
| | |
| | Principal | |
| CORPORATE BONDS AND NOTES (15.8%)* cont. | amount | Value |
|
| Basic materials cont. | | |
|
| WestRock RKT Co. company guaranty sr. unsec. unsub. notes | | |
| 4.45%, 3/1/19 | $168,000 | $175,095 |
|
| Weyerhaeuser Co. sr. unsec. unsub. notes 7.375%, 3/15/32 R | 553,000 | 713,806 |
|
| | | 9,705,251 |
|
| Capital goods (0.4%) | | |
|
| L3 Technologies, Inc. company guaranty sr. unsec. bonds | | |
| 3.85%, 12/15/26 | 235,000 | 235,593 |
|
| Legrand France SA sr. unsec. unsub. notes 8.50%, 2/15/25 (France) | 767,000 | 986,793 |
|
| Medtronic, Inc. company guaranty sr. unsec. sub. notes | | |
| 4.375%, 3/15/35 | 307,000 | 321,106 |
|
| Medtronic, Inc. company guaranty sr. unsec. sub. notes | | |
| 3.50%, 3/15/25 | 327,000 | 334,206 |
|
| Northrop Grumman Systems Corp. company guaranty sr. unsec. | | |
| unsub. notes 7.875%, 3/1/26 | 265,000 | 351,298 |
|
| Parker Hannifin Corp. sr. unsec. unsub. notes Ser. MTN, | | |
| 6.25%, 5/15/38 | 975,000 | 1,242,703 |
|
| Republic Services, Inc. company guaranty sr. unsec. unsub. notes | | |
| 5.50%, 9/15/19 | 240,000 | 260,927 |
|
| United Technologies Corp. sr. unsec. unsub. notes 5.70%, 4/15/40 | 100,000 | 122,576 |
|
| United Technologies Corp. sr. unsec. unsub. notes 4.50%, 6/1/42 | 225,000 | 236,675 |
|
| | | 4,091,877 |
|
| Communication services (1.1%) | | |
|
| America Movil SAB de CV company guaranty sr. unsec. unsub. | | |
| notes 6.125%, 3/30/40 (Mexico) | 200,000 | 226,703 |
|
| American Tower Corp. sr. unsec. notes 4.00%, 6/1/25 R | 335,000 | 335,648 |
|
| American Tower Corp. sr. unsec. notes 3.40%, 2/15/19 R | 735,000 | 753,135 |
|
| American Tower Corp. sr. unsec. unsub. bonds 3.375%, 10/15/26 R | 500,000 | 474,363 |
|
| AT&T, Inc. sr. unsec. unsub. notes 4.75%, 5/15/46 | 122,000 | 111,437 |
|
| CC Holdings GS V, LLC/Crown Castle GS III Corp. company guaranty | | |
| sr. notes 3.849%, 4/15/23 | 240,000 | 245,375 |
|
| Charter Communications Operating, LLC/Charter | | |
| Communications Operating Capital Corp. company guaranty sr. | | |
| sub. bonds 6.484%, 10/23/45 | 1,159,000 | 1,317,491 |
|
| Charter Communications Operating, LLC/Charter | | |
| Communications Operating Capital Corp. company guaranty sr. | | |
| sub. notes 4.908%, 7/23/25 | 356,000 | 374,338 |
|
| Comcast Cable Communications Holdings, Inc. company | | |
| guaranty sr. unsec. notes 9.455%, 11/15/22 | 645,000 | 868,607 |
|
| Comcast Corp. company guaranty sr. unsec. unsub. notes | | |
| 6.50%, 11/15/35 | 268,000 | 344,590 |
|
| Comcast Corp. company guaranty sr. unsec. unsub. notes | | |
| 3.15%, 3/1/26 | 610,000 | 596,773 |
|
| Crown Castle International Corp. sr. unsec. notes 5.25%, 1/15/23 R | 75,000 | 81,473 |
|
| Crown Castle International Corp. sr. unsec. notes 4.875%, 4/15/22 R | 313,000 | 336,475 |
|
| Crown Castle Towers, LLC 144A company guaranty sr. notes | | |
| 4.883%, 8/15/20 | 710,000 | 756,417 |
|
| NBCUniversal Media, LLC company guaranty sr. unsec. unsub. | | |
| notes 6.40%, 4/30/40 | 380,000 | 488,414 |
|
| Rogers Communications, Inc. company guaranty sr. unsec. bonds | | |
| 8.75%, 5/1/32 (Canada) | 95,000 | 129,196 |
|
|
| George Putnam Balanced Fund 25 |
| | |
| | Principal | |
| CORPORATE BONDS AND NOTES (15.8%)* cont. | amount | Value |
|
| Communication services cont. | | |
|
| Rogers Communications, Inc. company guaranty sr. unsec. unsub. | | |
| notes 4.50%, 3/15/43 (Canada) | $215,000 | $214,617 |
|
| Sprint Spectrum Co., LLC/Sprint Spectrum Co. II, LLC/ | | |
| Sprint Spectrum Co. III, LL 144A company guaranty sr. notes | | |
| 3.36%, 9/20/21 | 955,000 | 956,194 |
|
| Telecom Italia SpA 144A sr. unsec. notes 5.303%, 5/30/24 (Italy) | 1,000,000 | 1,005,500 |
|
| Telefonica Emisiones SAU company guaranty sr. unsec. unsub. | | |
| notes 7.045%, 6/20/36 (Spain) | 355,000 | 416,030 |
|
| Verizon Communications, Inc. sr. unsec. unsub. notes 5.90%, | | |
| 2/15/54 (units) | 5,200 | 136,968 |
|
| Verizon Communications, Inc. sr. unsec. unsub. notes | | |
| 5.05%, 3/15/34 | 270,000 | 277,123 |
|
| Verizon Communications, Inc. sr. unsec. unsub. notes | | |
| 4.522%, 9/15/48 | 982,000 | 892,242 |
|
| Verizon Communications, Inc. sr. unsec. unsub. notes | | |
| 4.40%, 11/1/34 | 595,000 | 567,213 |
|
| Verizon New Jersey, Inc. company guaranty sr. unsec. unsub. | | |
| bonds 8.00%, 6/1/22 | 770,000 | 931,154 |
|
| | | 12,837,476 |
|
| Conglomerates (0.1%) | | |
|
| General Electric Co. jr. unsec. sub. FRB Ser. D, 5.00%, | | |
| perpetual maturity | 1,111,000 | 1,158,218 |
|
| | | 1,158,218 |
|
| Consumer cyclicals (1.7%) | | |
|
| 21st Century Fox America, Inc. company guaranty sr. unsec. notes | | |
| 7.85%, 3/1/39 | 190,000 | 256,537 |
|
| 21st Century Fox America, Inc. company guaranty sr. unsec. notes | | |
| 7.75%, 1/20/24 | 1,045,000 | 1,292,182 |
|
| Autonation, Inc. company guaranty sr. unsec. notes 4.50%, 10/1/25 | 330,000 | 336,161 |
|
| Autonation, Inc. company guaranty sr. unsec. unsub. notes | | |
| 5.50%, 2/1/20 | 847,000 | 913,102 |
|
| CBS Corp. company guaranty sr. unsec. debs. 7.875%, 7/30/30 | 579,000 | 778,577 |
|
| CBS Corp. company guaranty sr. unsec. unsub. bonds | | |
| 2.90%, 1/15/27 | 851,000 | 780,985 |
|
| Dollar General Corp. sr. unsec. sub. notes 3.25%, 4/15/23 | 625,000 | 619,355 |
|
| Expedia, Inc. company guaranty sr. unsec. unsub. notes | | |
| 5.00%, 2/15/26 | 375,000 | 393,291 |
|
| Ford Motor Co. sr. unsec. unsub. notes 9.98%, 2/15/47 | 135,000 | 202,485 |
|
| Ford Motor Co. sr. unsec. unsub. notes 7.75%, 6/15/43 | 1,290,000 | 1,619,587 |
|
| Ford Motor Co. sr. unsec. unsub. notes 7.45%, 7/16/31 | 24,000 | 30,047 |
|
| Ford Motor Co. sr. unsec. unsub. notes 7.40%, 11/1/46 | 200,000 | 258,124 |
|
| Ford Motor Credit Co., LLC sr. unsec. unsub. notes 5.875%, 8/2/21 | 318,000 | 353,734 |
|
| Ford Motor Credit Co., LLC sr. unsec. unsub. notes 4.134%, 8/4/25 | 477,000 | 476,430 |
|
| General Motors Co. sr. unsec. notes 5.20%, 4/1/45 | 844,000 | 830,162 |
|
| General Motors Financial Co., Inc. company guaranty sr. unsec. | | |
| notes 4.00%, 10/6/26 | 680,000 | 658,891 |
|
| General Motors Financial Co., Inc. company guaranty sr. unsec. | | |
| unsub. notes 4.30%, 7/13/25 | 395,000 | 393,613 |
|
| General Motors Financial Co., Inc. company guaranty sr. unsec. | | |
| unsub. notes 4.00%, 1/15/25 | 250,000 | 246,830 |
|
|
| 26 George Putnam Balanced Fund |
| | |
| | Principal | |
| CORPORATE BONDS AND NOTES (15.8%)* cont. | amount | Value |
|
| Consumer cyclicals cont. | | |
|
| General Motors Financial Co., Inc. company guaranty sr. unsec. | | |
| unsub. notes 3.45%, 4/10/22 | $900,000 | $896,992 |
|
| General Motors Financial Co., Inc. company guaranty sr. unsec. | | |
| unsub. notes 3.45%, 1/14/22 | 200,000 | 199,744 |
|
| Grupo Televisa SAB sr. unsec. unsub. bonds 6.625%, | | |
| 1/15/40 (Mexico) | 300,000 | 312,075 |
|
| Grupo Televisa SAB sr. unsec. unsub. notes 5.00%, 5/13/45 (Mexico) | 355,000 | 303,640 |
|
| Hilton Domestic Operating Co., Inc. 144A sr. unsec. sub. notes | | |
| 4.25%, 9/1/24 | 205,000 | 201,156 |
|
| Historic TW, Inc. company guaranty sr. unsec. unsub. bonds | | |
| 9.15%, 2/1/23 | 460,000 | 594,399 |
|
| Host Hotels & Resorts LP sr. unsec. unsub. notes 6.00%, 10/1/21 R | 320,000 | 356,740 |
|
| Host Hotels & Resorts LP sr. unsec. unsub. notes 5.25%, 3/15/22 R | 150,000 | 162,270 |
|
| Hyatt Hotels Corp. sr. unsec. unsub. notes 3.375%, 7/15/23 | 200,000 | 199,542 |
|
| L Brands, Inc. company guaranty sr. unsec. notes 6.625%, 4/1/21 | 435,000 | 476,869 |
|
| Lear Corp. company guaranty sr. unsec. unsub. notes | | |
| 5.375%, 3/15/24 | 375,000 | 394,688 |
|
| NVR, Inc. sr. unsec. notes 3.95%, 9/15/22 | 435,000 | 447,920 |
|
| O’Reilly Automotive, Inc. company guaranty sr. unsec. notes | | |
| 3.85%, 6/15/23 | 195,000 | 200,829 |
|
| O’Reilly Automotive, Inc. company guaranty sr. unsec. sub. notes | | |
| 3.55%, 3/15/26 | 480,000 | 475,278 |
|
| Omnicom Group, Inc. company guaranty sr. unsec. unsub. notes | | |
| 3.60%, 4/15/26 | 540,000 | 535,179 |
|
| Owens Corning company guaranty sr. unsec. sub. notes | | |
| 9.00%, 6/15/19 | 880,000 | 999,841 |
|
| Priceline Group, Inc. (The) sr. unsec. notes 3.65%, 3/15/25 | 164,000 | 163,445 |
|
| QVC, Inc. company guaranty sr. notes 4.85%, 4/1/24 | 390,000 | 392,361 |
|
| S&P Global, Inc. company guaranty sr. unsec. unsub. notes | | |
| 4.40%, 2/15/26 | 670,000 | 702,372 |
|
| Tiffany & Co. sr. unsec. unsub. notes 4.90%, 10/1/44 | 460,000 | 425,744 |
|
| Time Warner, Inc. company guaranty sr. unsec. unsub. bonds | | |
| 2.95%, 7/15/26 | 79,000 | 72,933 |
|
| Vulcan Materials Co. sr. unsec. unsub. notes 4.50%, 4/1/25 | 175,000 | 183,628 |
|
| | | 19,137,738 |
|
| Consumer staples (1.3%) | | |
|
| Anheuser-Busch InBev Finance, Inc. company guaranty sr. unsec. | | |
| unsub. bonds 4.90%, 2/1/46 | 1,947,000 | 2,083,494 |
|
| Anheuser-Busch InBev Finance, Inc. company guaranty sr. unsec. | | |
| unsub. bonds 3.65%, 2/1/26 | 428,000 | 429,226 |
|
| Anheuser-Busch InBev Worldwide, Inc. company guaranty sr. | | |
| unsec. unsub. bonds 4.95%, 1/15/42 | 200,000 | 217,163 |
|
| Anheuser-Busch InBev Worldwide, Inc. company guaranty sr. | | |
| unsec. unsub. notes 8.20%, 1/15/39 | 165,000 | 250,815 |
|
| Bacardi, Ltd. 144A unsec. notes 4.50%, 1/15/21 (Bermuda) | 495,000 | 526,109 |
|
| Constellation Brands, Inc. company guaranty sr. unsec. unsub. | | |
| bonds 3.70%, 12/6/26 | 525,000 | 519,850 |
|
| CVS Health Corp. sr. unsec. notes 4.75%, 12/1/22 | 715,000 | 776,965 |
|
| CVS Pass-Through Trust 144A sr. mtge. notes 7.507%, 1/10/32 | 637,681 | 777,273 |
|
| CVS Pass-Through Trust 144A sr. mtge. notes 4.704%, 1/10/36 | 641,478 | 675,623 |
|
|
| George Putnam Balanced Fund 27 |
| | |
| | Principal | |
| CORPORATE BONDS AND NOTES (15.8%)* cont. | amount | Value |
|
| Consumer staples cont. | | |
|
| Diageo Investment Corp. company guaranty sr. unsec. notes | | |
| 8.00%, 9/15/22 | $820,000 | $1,025,590 |
|
| ERAC USA Finance, LLC 144A company guaranty sr. unsec. notes | | |
| 7.00%, 10/15/37 | 1,434,000 | 1,819,002 |
|
| ERAC USA Finance, LLC 144A company guaranty sr. unsec. notes | | |
| 5.625%, 3/15/42 | 553,000 | 609,483 |
|
| ERAC USA Finance, LLC 144A company guaranty sr. unsec. notes | | |
| 3.85%, 11/15/24 | 211,000 | 214,329 |
|
| Grupo Bimbo SAB de CV 144A company guaranty sr. unsec. unsub. | | |
| notes 4.875%, 6/27/44 (Mexico) | 350,000 | 320,989 |
|
| Kraft Heinz Foods Co. company guaranty sr. unsec. notes | | |
| Ser. 144A, 6.875%, 1/26/39 | 625,000 | 794,943 |
|
| Kraft Heinz Foods Co. company guaranty sr. unsec. unsub. notes | | |
| 6.50%, 2/9/40 | 309,000 | 378,180 |
|
| Kraft Heinz Foods Co. company guaranty sr. unsec. bonds | | |
| 4.375%, 6/1/46 | 670,000 | 626,371 |
|
| Lamb Weston Holdings, Inc. 144A company guaranty sr. unsec. | | |
| unsub. notes 4.875%, 11/1/26 | 1,166,000 | 1,167,458 |
|
| Newell Brands, Inc. sr. unsec. unsub. notes 4.20%, 4/1/26 | 1,030,000 | 1,066,934 |
|
| Tyson Foods, Inc. company guaranty sr. unsec. bonds | | |
| 4.875%, 8/15/34 | 134,000 | 137,037 |
|
| Walgreens Boots Alliance, Inc. sr. unsec. bonds 3.45%, 6/1/26 | 765,000 | 745,832 |
|
| | | 15,162,666 |
|
| Energy (1.2%) | | |
|
| BG Energy Capital PLC 144A company guaranty sr. unsec. unsub. | | |
| notes 4.00%, 10/15/21 (United Kingdom) | 250,000 | 265,318 |
|
| BP Capital Markets PLC company guaranty sr. unsec. bonds | | |
| 3.119%, 5/4/26 (United Kingdom) | 670,000 | 648,336 |
|
| Concho Resources, Inc. company guaranty sr. unsec. notes | | |
| 4.375%, 1/15/25 | 925,000 | 945,813 |
|
| DCP Midstream Operating LP company guaranty sr. unsec. notes | | |
| 2.70%, 4/1/19 | 225,000 | 222,188 |
|
| Devon Energy Corp. sr. unsec. unsub. notes 3.25%, 5/15/22 | 276,000 | 276,946 |
|
| EOG Resources, Inc. sr. unsec. unsub. notes 5.625%, 6/1/19 | 205,000 | 222,116 |
|
| EQT Midstream Partners LP company guaranty sr. unsec. sub. | | |
| notes 4.00%, 8/1/24 | 575,000 | 570,559 |
|
| Hess Corp. sr. unsec. unsub. notes 7.30%, 8/15/31 | 388,000 | 462,697 |
|
| Kerr-McGee Corp. company guaranty sr. unsec. unsub. notes | | |
| 7.875%, 9/15/31 | 1,070,000 | 1,386,129 |
|
| Lukoil International Finance BV 144A company guaranty sr. unsec. | | |
| notes 4.563%, 4/24/23 (Russia) | 315,000 | 317,363 |
|
| Marathon Petroleum Corp. sr. unsec. unsub. notes 6.50%, 3/1/41 | 175,000 | 190,123 |
|
| Nabors Industries, Inc. company guaranty sr. unsec. unsub. notes | | |
| 4.625%, 9/15/21 | 600,000 | 612,000 |
|
| Noble Holding International, Ltd. company guaranty sr. unsec. | | |
| unsub. notes 6.05%, 3/1/41 | 390,000 | 302,250 |
|
| Petroleos Mexicanos company guaranty sr. unsec. unsub. notes | | |
| 4.50%, 1/23/26 (Mexico) | 535,000 | 486,583 |
|
| Pride International, Inc. company guaranty sr. unsec. unsub. notes | | |
| 7.875%, 8/15/40 | 760,000 | 712,500 |
|
| Sabine Pass Liquefaction, LLC 144A sr. bonds 5.00%, 3/15/27 | 1,280,000 | 1,342,400 |
|
|
| 28 George Putnam Balanced Fund |
| | |
| | Principal | |
| CORPORATE BONDS AND NOTES (15.8%)* cont. | amount | Value |
|
| Energy cont. | | |
|
| Spectra Energy Capital, LLC company guaranty sr. unsec. sub. | | |
| notes 6.20%, 4/15/18 | $580,000 | $607,157 |
|
| Spectra Energy Capital, LLC company guaranty sr. unsec. unsub. | | |
| notes 8.00%, 10/1/19 | 820,000 | 928,691 |
|
| Statoil ASA company guaranty sr. unsec. notes 5.10%, | | |
| 8/17/40 (Norway) | 480,000 | 540,908 |
|
| Tosco Corp. company guaranty sr. unsec. notes 8.125%, 2/15/30 | 600,000 | 823,451 |
|
| Valero Energy Partners LP sr. unsec. unsub. notes | | |
| 4.375%, 12/15/26 | 427,000 | 432,153 |
|
| Williams Partners LP sr. unsec. sub. notes 4.30%, 3/4/24 | 1,022,000 | 1,054,015 |
|
| Williams Partners LP sr. unsec. sub. notes 3.60%, 3/15/22 | 250,000 | 254,006 |
|
| Williams Partners LP/ACMP Finance Corp. sr. unsec. sub. notes | | |
| 4.875%, 3/15/24 | 342,000 | 353,589 |
|
| | | 13,957,291 |
|
| Financials (6.1%) | | |
|
| Aflac, Inc. sr. unsec. notes 6.45%, 8/15/40 | 82,000 | 107,040 |
|
| Air Lease Corp. sr. unsec. notes 3.75%, 2/1/22 | 410,000 | 420,847 |
|
| Air Lease Corp. sr. unsec. unsub. notes 3.375%, 6/1/21 | 630,000 | 639,381 |
|
| Ally Financial, Inc. sub. unsec. notes 5.75%, 11/20/25 | 705,000 | 715,575 |
|
| American Express Co. jr. unsec. sub. FRN Ser. C, 4.90%, | | |
| perpetual maturity | 310,000 | 303,025 |
|
| American Express Co. sr. unsec. notes 7.00%, 3/19/18 | 650,000 | 687,750 |
|
| American International Group, Inc. jr. unsec. sub. FRB | | |
| 8.175%, 5/15/58 | 856,000 | 1,095,680 |
|
| Aon PLC company guaranty sr. unsec. unsub. notes | | |
| 4.25%, 12/12/42 | 1,150,000 | 1,069,325 |
|
| Assurant, Inc. sr. unsec. notes 6.75%, 2/15/34 | 198,000 | 233,602 |
|
| Australia & New Zealand Banking Group, Ltd./United | | |
| Kingdom 144A jr. unsec. sub. FRB 6.75%, perpetual maturity | | |
| (United Kingdom) | 200,000 | 212,200 |
|
| Aviation Capital Group Corp. 144A sr. unsec. unsub. notes | | |
| 7.125%, 10/15/20 | 265,000 | 304,750 |
|
| AXA SA 144A jr. unsec. sub. FRN 6.463%, perpetual | | |
| maturity (France) | 550,000 | 549,659 |
|
| AXA SA 144A jr. unsec. sub. FRN 6.379%, perpetual | | |
| maturity (France) | 135,000 | 145,209 |
|
| Banco del Estado de Chile 144A sr. unsec. notes 2.00%, | | |
| 11/9/17 (Chile) | 400,000 | 399,982 |
|
| Bank of America Corp. jr. unsec. sub. FRN Ser. AA, 6.10%, | | |
| perpetual maturity | 314,000 | 326,953 |
|
| Bank of America Corp. unsec. sub. FRN 1.723%, 9/15/26 | 275,000 | 251,009 |
|
| Bank of America Corp. unsec. sub. notes 6.11%, 1/29/37 | 600,000 | 697,632 |
|
| Barclays Bank PLC 144A unsec. sub. notes 10.179%, 6/12/21 | | |
| (United Kingdom) | 869,000 | 1,081,941 |
|
| Bear Stearns Cos., Inc. (The) sr. unsec. notes 6.40%, 10/2/17 | 500,000 | 516,173 |
|
| Bear Stearns Cos., LLC (The) sr. unsec. unsub. notes 7.25%, 2/1/18 | 331,000 | 348,847 |
|
| Berkshire Hathaway Finance Corp. company guaranty sr. unsec. | | |
| notes 4.30%, 5/15/43 | 703,000 | 727,593 |
|
| BGC Partners, Inc. sr. unsec. notes 5.125%, 5/27/21 | 155,000 | 157,439 |
|
| BPCE SA 144A unsec. sub. notes 5.70%, 10/22/23 (France) | 370,000 | 395,204 |
|
| BPCE SA 144A unsec. sub. notes 5.15%, 7/21/24 (France) | 810,000 | 827,535 |
|
|
| George Putnam Balanced Fund 29 |
| | |
| | Principal | |
| CORPORATE BONDS AND NOTES (15.8%)* cont. | amount | Value |
|
| Financials cont. | | |
|
| Camden Property Trust sr. unsec. unsub. notes 4.875%, 6/15/23 R | $1,213,000 | $1,314,407 |
|
| Cantor Fitzgerald LP 144A unsec. notes 6.50%, 6/17/22 | 1,020,000 | 1,109,646 |
|
| Capital One Bank USA NA unsec. sub. notes 3.375%, 2/15/23 | 462,000 | 462,089 |
|
| Capital One Financial Corp. unsec. sub. notes 4.20%, 10/29/25 | 295,000 | 295,686 |
|
| CBRE Services, Inc. company guaranty sr. unsec. notes | | |
| 5.25%, 3/15/25 | 257,000 | 265,327 |
|
| CBRE Services, Inc. company guaranty sr. unsec. unsub. notes | | |
| 4.875%, 3/1/26 | 708,000 | 716,834 |
|
| Citigroup, Inc. jr. unsec. sub. FRB Ser. P, 5.95%, perpetual maturity | 956,000 | 972,491 |
|
| Citigroup, Inc. jr. unsec. sub. FRN 5.875%, perpetual maturity | 402,000 | 413,055 |
|
| CNO Financial Group, Inc. sr. unsec. unsub. notes 5.25%, 5/30/25 | 345,000 | 347,273 |
|
| Cooperatieve Centrale Raiffeisen-Boerenleenbank BA/ | | |
| Netherlands company guaranty unsec. sub. notes 4.625%, | | |
| 12/1/23 (Netherlands) | 250,000 | 264,066 |
|
| Cooperatieve Rabobank UA 144A jr. unsec. sub. FRN 11.00%, | | |
| perpetual maturity (Netherlands) | 718,000 | 840,060 |
|
| Cooperative Rabobank UA company guaranty unsec. sub. notes | | |
| 3.75%, 7/21/26 (Netherlands) | 285,000 | 277,483 |
|
| Credit Agricole SA 144A unsec. sub. notes 4.375%, 3/17/25 (France) | 255,000 | 252,818 |
|
| Credit Suisse Group AG 144A sr. unsec. bonds 4.282%, | | |
| 1/9/28 (Switzerland) | 1,770,000 | 1,761,109 |
|
| Credit Suisse Group AG 144A unsec. sub. notes 6.50%, | | |
| 8/8/23 (Switzerland) | 729,000 | 782,263 |
|
| DDR Corp. sr. unsec. unsub. notes 7.875%, 9/1/20 R | 302,000 | 351,506 |
|
| Duke Realty LP company guaranty sr. unsec. unsub. notes | | |
| 4.375%, 6/15/22 R | 1,117,000 | 1,192,738 |
|
| EPR Properties company guaranty sr. unsec. sub. notes | | |
| 5.25%, 7/15/23 R | 345,000 | 360,819 |
|
| Fairfax US, Inc. 144A company guaranty sr. unsec. notes | | |
| 4.875%, 8/13/24 | 300,000 | 303,375 |
|
| Fifth Third Bancorp jr. unsec. sub. FRB 5.10%, perpetual maturity | 217,000 | 207,344 |
|
| Five Corners Funding Trust 144A sr. unsec. bonds 4.419%, 11/15/23 | 425,000 | 450,329 |
|
| GE Capital International Funding Co. Unlimited Co. company | | |
| guaranty sr. unsec. bonds 4.418%, 11/15/35 (Ireland) | 1,962,000 | 2,057,959 |
|
| Goldman Sachs Group, Inc. (The) sr. unsec. unsub. notes | | |
| 3.85%, 1/26/27 | 1,835,000 | 1,831,069 |
|
| Goldman Sachs Group, Inc. (The) unsec. sub. notes 6.75%, 10/1/37 | 282,000 | 347,122 |
|
| Hartford Financial Services Group, Inc. (The) sr. unsec. unsub. | | |
| notes 6.625%, 3/30/40 | 1,495,000 | 1,847,307 |
|
| Healthcare Realty Trust, Inc. sr. unsec. unsub. notes | | |
| 3.875%, 5/1/25 R | 555,000 | 543,812 |
|
| Highwood Realty LP sr. unsec. unsub. notes 5.85%, 3/15/17 R | 1,005,000 | 1,010,052 |
|
| Hospitality Properties Trust sr. unsec. unsub. notes | | |
| 4.50%, 3/15/25 R | 250,000 | 244,306 |
|
| HSBC Bank USA NA/New York NY unsec. sub. notes Ser. BKNT, | | |
| 5.625%, 8/15/35 (United Kingdom) | 250,000 | 286,877 |
|
| HSBC Bank USA, NA unsec. sub. notes 7.00%, 1/15/39 | 342,000 | 453,824 |
|
| HSBC Holdings PLC unsec. sub. notes 6.50%, 5/2/36 | | |
| (United Kingdom) | 800,000 | 973,951 |
|
| HSBC Holdings PLC unsec. sub. notes 4.25%, 8/18/25 | | |
| (United Kingdom) | 455,000 | 455,274 |
|
|
| 30 George Putnam Balanced Fund |
| | |
| | Principal | |
| CORPORATE BONDS AND NOTES (15.8%)* cont. | amount | Value |
|
| Financials cont. | | |
|
| HSBC USA, Inc. sr. unsec. unsub. notes 3.50%, 6/23/24 | $105,000 | $105,963 |
|
| ING Bank NV 144A unsec. sub. notes 5.80%, 9/25/23 (Netherlands) | 2,225,000 | 2,460,002 |
|
| International Lease Finance Corp. sr. unsec. unsub. notes | | |
| 6.25%, 5/15/19 | 275,000 | 296,313 |
|
| JPMorgan Chase & Co. jr. unsec. sub. FRB Ser. Z, 5.30%, | | |
| perpetual maturity | 330,000 | 339,587 |
|
| JPMorgan Chase & Co. jr. unsec. sub. FRN 7.90%, | | |
| perpetual maturity | 780,000 | 803,400 |
|
| JPMorgan Chase Bank, NA unsec. sub. notes Ser. BKNT, | | |
| 6.00%, 10/1/17 | 1,250,000 | 1,286,854 |
|
| KKR Group Finance Co., LLC 144A company guaranty sr. unsec. | | |
| unsub. notes 6.375%, 9/29/20 | 555,000 | 626,857 |
|
| Liberty Mutual Group, Inc. 144A company guaranty jr. unsec. sub. | | |
| bonds 7.80%, 3/15/37 | 785,000 | 896,863 |
|
| Liberty Mutual Insurance Co. 144A unsec. sub. notes | | |
| 7.697%, 10/15/97 | 340,000 | 417,966 |
|
| Liberty Property LP sr. unsec. unsub. notes 3.375%, 6/15/23 R | 100,000 | 99,840 |
|
| Lloyds Bank PLC company guaranty sr. unsec. unsub. notes 2.70%, | | |
| 8/17/20 (United Kingdom) | 220,000 | 221,136 |
|
| Lloyds Banking Group PLC unsec. sub. bonds 5.30%, 12/1/45 | | |
| (United Kingdom) | 1,404,000 | 1,478,617 |
|
| Lloyds Banking Group PLC unsec. sub. notes 4.50%, 11/4/24 | | |
| (United Kingdom) | 530,000 | 539,630 |
|
| Massachusetts Mutual Life Insurance Co. 144A unsec. sub. notes | | |
| 8.875%, 6/1/39 | 1,290,000 | 1,981,679 |
|
| MetLife Capital Trust IV 144A jr. unsec. sub. notes 7.875%, 12/15/37 | 2,564,000 | 3,192,180 |
|
| Mid-America Apartments LP sr. unsec. notes 4.30%, 10/15/23 R | 285,000 | 298,246 |
|
| Mitsubishi UFJ Financial Group, Inc. sr. unsec. unsub. notes 3.85%, | | |
| 3/1/26 (Japan) | 640,000 | 652,371 |
|
| Nationwide Mutual Insurance Co. 144A unsec. sub. notes | | |
| 8.25%, 12/1/31 | 415,000 | 579,196 |
|
| Neuberger Berman Group, LLC/Neuberger Berman Finance Corp. | | |
| 144A sr. unsec. notes 4.875%, 4/15/45 | 840,000 | 664,650 |
|
| OneAmerica Financial Partners, Inc. 144A sr. unsec. notes | | |
| 7.00%, 10/15/33 | 370,000 | 418,264 |
|
| Pacific LifeCorp 144A sr. unsec. notes 6.00%, 2/10/20 | 365,000 | 393,733 |
|
| Peachtree Corners Funding Trust 144A company guaranty sr. | | |
| unsec. unsub. bonds 3.976%, 2/15/25 | 140,000 | 137,890 |
|
| Primerica, Inc. sr. unsec. notes 4.75%, 7/15/22 | 213,000 | 228,440 |
|
| Progressive Corp. (The) jr. unsec. sub. FRN 6.70%, 6/15/37 | 1,939,000 | 1,919,610 |
|
| Prudential Financial, Inc. jr. unsec. sub. FRN 5.625%, 6/15/43 | 359,000 | 378,296 |
|
| Prudential Financial, Inc. jr. unsec. sub. FRN 5.20%, 3/15/44 | 1,153,000 | 1,163,031 |
|
| Realty Income Corp. sr. unsec. notes 4.65%, 8/1/23 R | 1,045,000 | 1,132,924 |
|
| Royal Bank of Canada unsec. sub. notes Ser. GMTN, 4.65%, | | |
| 1/27/26 (Canada) | 420,000 | 442,023 |
|
| Royal Bank of Scotland Group PLC sr. unsec. unsub. notes 3.875%, | | |
| 9/12/23 (United Kingdom) | 200,000 | 194,369 |
|
| Santander Issuances SAU company guaranty unsec. sub. notes | | |
| 5.179%, 11/19/25 (Spain) | 1,200,000 | 1,214,082 |
|
| Santander UK PLC 144A unsec. sub. notes 5.00%, 11/7/23 | | |
| (United Kingdom) | 430,000 | 444,801 |
|
|
| George Putnam Balanced Fund 31 |
| | |
| | Principal | |
| CORPORATE BONDS AND NOTES (15.8%)* cont. | amount | Value |
|
| Financials cont. | | |
|
| Select Income REIT sr. unsec. unsub. notes 3.60%, 2/1/20 R | $290,000 | $291,917 |
|
| Select Income REIT sr. unsec. unsub. notes 2.85%, 2/1/18 R | 290,000 | 291,021 |
|
| State Street Corp. jr. unsec. sub. FRB 1.963%, 6/15/37 | 1,693,000 | 1,491,533 |
|
| Sumitomo Mitsui Financial Group, Inc. 144A unsec. sub. bonds | | |
| 4.436%, 4/2/24 (Japan) | 412,000 | 430,614 |
|
| Teachers Insurance & Annuity Association of America 144A unsec. | | |
| sub. notes 6.85%, 12/16/39 | 263,000 | 343,284 |
|
| TIERS Trust/United States 144A sr. bonds stepped-coupon zero % | | |
| (8.125%, 9/15/17), 3/15/46 †† | 570,000 | 602,775 |
|
| Toronto-Dominion Bank (The) unsec. sub. FRB 3.625%, | | |
| 9/15/31 (Canada) | 659,000 | 640,812 |
|
| Travelers Property Casualty Corp. company guaranty sr. unsec. | | |
| unsub. bonds 7.75%, 4/15/26 | 295,000 | 384,705 |
|
| UBS AG unsec. sub. notes 5.125%, 5/15/24 (Switzerland) | 2,640,000 | 2,705,630 |
|
| VEREIT Operating Partnership LP company guaranty sr. unsec. | | |
| notes 4.60%, 2/6/24 R | 720,000 | 732,542 |
|
| Wells Fargo & Co. jr. unsec. sub. FRB Ser. U, 5.875%, | | |
| perpetual maturity | 580,000 | 615,525 |
|
| Willis Towers Watson PLC company guaranty sr. unsec. unsub. | | |
| notes 5.75%, 3/15/21 | 710,000 | 779,188 |
|
| WP Carey, Inc. sr. unsec. unsub. notes 4.60%, 4/1/24 R | 787,000 | 804,238 |
|
| ZFS Finance USA Trust V 144A jr. unsec. sub. FRB 6.50%, 5/9/37 | 214,000 | 214,535 |
|
| | | 70,543,754 |
|
| Government (0.4%) | | |
|
| International Bank for Reconstruction & Development sr. unsec. | | |
| unsub. bonds 7.625%, 1/19/23 (Supra-Nation) | 4,000,000 | 5,172,128 |
|
| | | 5,172,128 |
|
| Health care (0.4%) | | |
|
| AbbVie, Inc. sr. unsec. notes 3.60%, 5/14/25 | 194,000 | 190,925 |
|
| Actavis Funding SCS company guaranty sr. unsec. notes 4.75%, | | |
| 3/15/45 (Luxembourg) | 373,000 | 367,836 |
|
| Actavis Funding SCS company guaranty sr. unsec. notes 3.45%, | | |
| 3/15/22 (Luxembourg) | 186,000 | 188,263 |
|
| Anthem, Inc. sr. unsec. unsub. notes 4.625%, 5/15/42 | 205,000 | 204,695 |
|
| HCA, Inc. company guaranty sr. bonds 5.25%, 6/15/26 | 185,000 | 192,863 |
|
| HCA, Inc. company guaranty sr. sub. notes 5.00%, 3/15/24 | 430,000 | 447,738 |
|
| Omega Healthcare Investors, Inc. company guaranty sr. unsec. | | |
| bonds 5.25%, 1/15/26 R | 510,000 | 524,025 |
|
| Omega Healthcare Investors, Inc. company guaranty sr. unsec. | | |
| notes 4.50%, 4/1/27 R | 145,000 | 140,288 |
|
| Omega Healthcare Investors, Inc. company guaranty sr. unsec. | | |
| unsub. notes 4.95%, 4/1/24 R | 659,000 | 670,560 |
|
| Quest Diagnostics, Inc. company guaranty sr. unsec. notes | | |
| 4.75%, 1/30/20 | 121,000 | 129,391 |
|
| Shire Acquisitions Investments Ireland DAC company guaranty sr. | | |
| unsec. unsub. notes 3.20%, 9/23/26 (Ireland) | 290,000 | 270,662 |
|
| Teva Pharmaceutical Finance Netherlands III BV company | | |
| guaranty sr. unsec. unsub. bonds 3.15%, 10/1/26 (Netherlands) | 1,062,000 | 962,760 |
|
| UnitedHealth Group, Inc. sr. unsec. unsub. notes 4.625%, 11/15/41 | 300,000 | 319,435 |
|
| | | 4,609,441 |
|
| 32 George Putnam Balanced Fund |
| | |
| | Principal | |
| CORPORATE BONDS AND NOTES (15.8%)* cont. | amount | Value |
|
| Technology (0.7%) | | |
|
| Apple, Inc. sr. unsec. notes 3.45%, 5/6/24 | $215,000 | $220,819 |
|
| Apple, Inc. sr. unsec. unsub. notes 4.375%, 5/13/45 | 297,000 | 303,327 |
|
| Apple, Inc. sr. unsec. unsub. notes 3.85%, 5/4/43 | 421,000 | 398,870 |
|
| Broadcom Corp./Broadcom Cayman Finance, Ltd. 144A company | | |
| guaranty sr. unsec. unsub. notes 3.875%, 1/15/27 | 1,365,000 | 1,354,591 |
|
| Diamond 1 Finance Corp./Diamond 2 Finance Corp. 144A | | |
| company guaranty sr. unsec. notes 7.125%, 6/15/24 | 813,000 | 890,137 |
|
| Diamond 1 Finance Corp./Diamond 2 Finance Corp. 144A sr. bonds | | |
| 8.35%, 7/15/46 | 271,000 | 338,370 |
|
| Diamond 1 Finance Corp./Diamond 2 Finance Corp. 144A sr. notes | | |
| 5.45%, 6/15/23 | 1,231,000 | 1,322,296 |
|
| Fidelity National Information Services, Inc. company guaranty sr. | | |
| unsec. unsub. notes 5.00%, 3/15/22 | 948,000 | 973,276 |
|
| Jabil Circuit, Inc. sr. unsec. sub. notes 8.25%, 3/15/18 | 162,000 | 172,653 |
|
| Microsoft Corp. sr. unsec. unsub. bonds 2.40%, 8/8/26 | 925,000 | 863,104 |
|
| Oracle Corp. sr. unsec. unsub. notes 2.65%, 7/15/26 | 1,475,000 | 1,386,370 |
|
| | | 8,223,813 |
|
| Transportation (0.2%) | | |
|
| Burlington Northern Santa Fe, LLC sr. unsec. notes 5.40%, 6/1/41 | 454,000 | 537,934 |
|
| Burlington Northern Santa Fe, LLC sr. unsec. unsub. notes | | |
| 5.75%, 5/1/40 | 109,000 | 133,514 |
|
| Continental Airlines, Inc. Pass-Through Trust pass-through | | |
| certificates Ser. 97-4, Class A, 6.90%, 7/2/19 | 7,120 | 7,191 |
|
| Continental Airlines, Inc. Pass-Through Trust pass-through | | |
| certificates Ser. 98-1, Class A, 6.648%, 3/15/19 | 61,733 | 62,505 |
|
| Norfolk Southern Corp. sr. unsec. unsub. bonds 6.00%, 5/23/11 | 390,000 | 456,163 |
|
| Penske Truck Leasing Co. Lp/PTL Finance Corp. 144A sr. unsec. | | |
| bonds 3.40%, 11/15/26 | 540,000 | 517,417 |
|
| Southwest Airlines Co. 2007-1 Pass-Through Trust pass-through | | |
| certificates Ser. 07-1, 6.15%, 8/1/22 | 571,370 | 632,792 |
|
| United Airlines, Inc. Pass-Through Trust pass-through certificates | | |
| Ser. 14-2, Class A, 3.75%, 3/3/28 | 212,023 | 214,938 |
|
| | | 2,562,454 |
|
| Utilities and power (1.4%) | | |
|
| Appalachian Power Co. sr. unsec. unsub. notes Ser. L, | | |
| 5.80%, 10/1/35 | 510,000 | 596,532 |
|
| Arizona Public Services Co. sr. unsec. notes 4.50%, 4/1/42 | 138,000 | 146,576 |
|
| Beaver Valley II Funding Corp. sr. bonds 9.00%, 6/1/17 | 6,000 | 6,000 |
|
| Boardwalk Pipelines LP company guaranty sr. unsec. unsub. FRB | | |
| 4.45%, 7/15/27 | 240,000 | 239,898 |
|
| Commonwealth Edison Co. sr. mtge. bonds 5.875%, 2/1/33 | 595,000 | 721,192 |
|
| Consolidated Edison Co. of New York, Inc. sr. unsec. unsub. notes | | |
| 4.20%, 3/15/42 | 220,000 | 222,541 |
|
| Duke Energy Carolinas, LLC sr. mtge. notes 4.25%, 12/15/41 | 450,000 | 462,474 |
|
| EDP Finance BV 144A sr. unsec. unsub. notes 5.25%, | | |
| 1/14/21 (Netherlands) | 365,000 | 388,493 |
|
| El Paso Natural Gas Co., LLC company guaranty sr. unsec. unsub. | | |
| notes 8.375%, 6/15/32 | 490,000 | 619,952 |
|
| Emera US Finance LP company guaranty sr. unsec. notes | | |
| 3.55%, 6/15/26 | 437,000 | 428,344 |
|
| Enbridge, Inc. sr. unsec. unsub. bonds 4.25%, 12/1/26 (Canada) | 540,000 | 555,699 |
|
|
| George Putnam Balanced Fund 33 |
| | |
| | Principal | |
| CORPORATE BONDS AND NOTES (15.8%)* cont. | amount | Value |
|
| Utilities and power cont. | | |
|
| Enel Finance International SA 144A company guaranty sr. unsec. | | |
| unsub. notes 5.125%, 10/7/19 (Netherlands) | $360,000 | $385,110 |
|
| Energy Transfer Partners LP sr. unsec. unsub. bonds | | |
| 4.20%, 4/15/27 | 115,000 | 114,086 |
|
| Energy Transfer Partners LP sr. unsec. unsub. notes 7.60%, 2/1/24 | 470,000 | 530,652 |
|
| Energy Transfer Partners LP sr. unsec. unsub. notes 6.50%, 2/1/42 | 766,000 | 861,336 |
|
| Energy Transfer Partners LP sr. unsec. unsub. notes 5.20%, 2/1/22 | 240,000 | 258,951 |
|
| FirstEnergy Transmission, LLC 144A sr. unsec. unsub. notes | | |
| 5.45%, 7/15/44 | 1,120,000 | 1,224,069 |
|
| Iberdrola International BV company guaranty sr. unsec. unsub. | | |
| bonds 6.75%, 7/15/36 (Spain) | 185,000 | 226,168 |
|
| ITC Holdings Corp. 144A sr. unsec. notes 6.05%, 1/31/18 | 365,000 | 379,829 |
|
| Kinder Morgan Energy Partners LP company guaranty sr. unsec. | | |
| notes 5.40%, 9/1/44 | 179,000 | 185,693 |
|
| Kinder Morgan Energy Partners LP company guaranty sr. unsec. | | |
| notes 3.50%, 3/1/21 | 420,000 | 428,408 |
|
| Kinder Morgan, Inc. company guaranty sr. unsec. unsub. notes | | |
| 3.05%, 12/1/19 | 235,000 | 239,239 |
|
| Oncor Electric Delivery Co., LLC sr. notes 7.00%, 9/1/22 | 445,000 | 541,956 |
|
| Oncor Electric Delivery Co., LLC sr. notes 4.10%, 6/1/22 | 441,000 | 470,409 |
|
| Pacific Gas & Electric Co. sr. unsec. notes 6.35%, 2/15/38 | 418,000 | 544,688 |
|
| Pacific Gas & Electric Co. sr. unsec. unsub. notes 5.80%, 3/1/37 | 140,000 | 171,879 |
|
| PPL Capital Funding, Inc. company guaranty sr. unsec. unsub. | | |
| notes 4.20%, 6/15/22 | 145,000 | 153,159 |
|
| Puget Sound Energy, Inc. jr. unsec. sub. FRN Ser. A, 6.974%, 6/1/67 | 656,000 | 590,400 |
|
| Texas Gas Transmission, LLC 144A sr. unsec. notes 4.50%, 2/1/21 | 623,000 | 650,720 |
|
| Texas-New Mexico Power Co. 144A 1st sr. bonds Ser. A, | | |
| 9.50%, 4/1/19 | 889,000 | 1,014,728 |
|
| TransCanada PipeLines, Ltd. jr. unsec. sub. FRN 6.35%, | | |
| 5/15/67 (Canada) | 1,145,000 | 1,050,538 |
|
| WEC Energy Group jr. unsec. sub. FRN 6.25%, 5/15/67 | 1,945,000 | 1,745,638 |
|
| | | 16,155,357 |
|
| Total corporate bonds and notes (cost $176,196,621) | | $183,317,464 |
|
| | |
| | Principal | |
| MORTGAGE-BACKED SECURITIES (0.9%)* | amount | Value |
|
| Citigroup Commercial Mortgage Trust Ser. 14-GC21, Class AS, | | |
| 4.026%, 5/10/47 | $508,000 | $519,349 |
|
| COMM Mortgage Trust | | |
|
| FRB Ser. 12-LC4, Class C, 5.622%, 12/10/44 | 500,000 | 544,250 |
|
| FRB Ser. 14-CR18, Class C, 4.737%, 7/15/47 | 3,089,000 | 3,211,633 |
|
| Ser. 13-CR13, Class AM, 4.449%, 12/10/23 | 777,000 | 835,741 |
|
| Ser. 12-CR1, Class AM, 3.912%, 5/15/45 | 1,046,000 | 1,099,137 |
|
| Federal Home Loan Mortgage Corporation Structured Agency | | |
| Credit Risk Debt FRN Ser. 16-HQA2, Class M1, 1.971%, 11/25/28 | 194,365 | 194,804 |
|
| Federal National Mortgage Association | | |
|
| Connecticut Avenue Securities FRB Ser. 16-C05, Class 2M1, | | |
| 2.121%, 1/25/29 | 18,360 | 18,459 |
|
| Ser. 01-79, Class BI, IO, 0.303%, 3/25/45 | 943,513 | 8,809 |
|
|
| 34 George Putnam Balanced Fund |
| | |
| | Principal | |
| MORTGAGE-BACKED SECURITIES (0.9%)* cont. | amount | Value |
|
| FIRSTPLUS Home Loan Owner Trust Ser. 97-3, Class B1, 7.79%, | | |
| 11/10/23 (In default) † | $194,241 | $19 |
|
| JPMorgan Chase Commercial Mortgage Securities Trust | | |
|
| FRB Ser. 12-C6, Class D, 5.156%, 5/15/45 | 772,000 | 816,236 |
|
| Ser. 04-LN2, Class A2, 5.115%, 7/15/41 | 10,501 | 10,516 |
|
| FRB Ser. 13-C13, Class C, 4.053%, 1/15/46 | 450,000 | 444,155 |
|
| JPMorgan Chase Commercial Mortgage Securities Trust 144A FRB | | |
| Ser. 12-C8, Class D, 4.66%, 10/15/45 | 524,000 | 515,144 |
|
| LB Commercial Mortgage Trust 144A | | |
|
| Ser. 99-C1, Class G, 6.41%, 6/15/31 | 154,065 | 158,408 |
|
| Ser. 98-C4, Class H, 5.60%, 10/15/35 | 96,021 | 96,083 |
|
| Morgan Stanley Capital I Trust 144A FRB Ser. 12-C4, Class D, | | |
| 5.437%, 3/15/45 | 1,794,000 | 1,823,960 |
|
| TIAA Real Estate CDO, Ltd. 144A Ser. 03-1A, Class E, | | |
| 8.00%, 12/28/38 | 2,066,043 | 154,953 |
|
| WF-RBS Commercial Mortgage Trust Ser. 14-C19, Class C, | | |
| 4.646%, 3/15/47 | 394,000 | 402,116 |
|
| Total mortgage-backed securities (cost $11,411,472) | | $10,853,772 |
|
| | |
| INVESTMENT COMPANIES (0.6%)* | Shares | Value |
|
| SPDR S&P Regional Banking ETF S | 128,397 | $7,113,194 |
|
| Total investment companies (cost $7,164,553) | | $7,113,194 |
|
| | |
| CONVERTIBLE PREFERRED STOCKS (0.1%)* | Shares | Value |
|
| Oportun Financial Corp. Ser. A-1, 8.00% cv. pfd. (acquired 6/23/15, cost | | |
| $1,057) (Private) † ∆∆ F | 371 | $952 |
|
| Oportun Financial Corp. Ser. B-1, 8.00% cv. pfd. (acquired 6/23/15, cost | | |
| $20,210) (Private) † ∆∆ F | 6,416 | 18,189 |
|
| Oportun Financial Corp. Ser. C-1, 8.00% cv. pfd. (acquired 6/23/15, cost | | |
| $47,464) (Private) † ∆∆ F | 9,325 | 42,718 |
|
| Oportun Financial Corp. Ser. D-1, 8.00% cv. pfd. (acquired 6/23/15, cost | | |
| $68,847) (Private) † ∆∆ F | 13,526 | 61,963 |
|
| Oportun Financial Corp. Ser. E-1, 8.00% cv. pfd. (acquired 6/23/15, cost | | |
| $38,611) (Private) † ∆∆ F | 7,033 | 34,750 |
|
| Oportun Financial Corp. Ser. F, 8.00% cv. pfd. (acquired 6/23/15, cost | | |
| $116,544) (Private) † ∆∆ F | 15,175 | 104,890 |
|
| Oportun Financial Corp. Ser. F-1, 8.00% cv. pfd. (acquired 6/23/15, cost | | |
| $326,895) (Private) † ∆∆ F | 114,700 | 294,206 |
|
| Oportun Financial Corp. Ser. G, 8.00% cv. pfd. (acquired 6/23/15, cost | | |
| $413,355) (Private) † ∆∆ F | 145,037 | 372,020 |
|
| Oportun Financial Corp. Ser. H, 8.00% cv. pfd. (acquired 2/6/15, cost | | |
| $633,655) (Private) † ∆∆ F | 222,546 | 570,290 |
|
| Total convertible preferred stocks (cost $1,666,638) | | $1,499,978 |
|
| | |
| | Principal | |
| MUNICIPAL BONDS AND NOTES (0.1%)* | amount | Value |
|
| CA State G.O. Bonds (Build America Bonds), 7.50%, 4/1/34 | $215,000 | $302,488 |
|
| North TX, Tollway Auth. Rev. Bonds (Build America Bonds), | | |
| 6.718%, 1/1/49 | 350,000 | 490,539 |
|
| OH State U. Rev. Bonds (Build America Bonds), 4.91%, 6/1/40 | 275,000 | 314,597 |
|
| Total municipal bonds and notes (cost $841,332) | | $1,107,624 |
|
|
| George Putnam Balanced Fund 35 |
| | |
| SHORT-TERM INVESTMENTS (9.1%)* | Shares | Value |
|
| Putnam Cash Collateral Pool, LLC 0.94% d | 28,675,485 | $28,675,485 |
|
| Putnam Short Term Investment Fund 0.74% L | 77,567,469 | 77,567,469 |
|
| Total short-term investments (cost $106,242,954) | | $106,242,954 |
|
| TOTAL INVESTMENTS | | |
|
| Total investments (cost $1,217,765,826) | | $1,299,783,020 |
|
Key to holding’s abbreviations
| |
| ADR | American Depository Receipts: represents ownership of foreign securities on deposit with a custodian bank |
| BKNT | Bank Note |
| DAC | Designated Activity Company |
| ETF | Exchange Traded Fund |
| FRB | Floating Rate Bonds: the rate shown is the current interest rate at the close of the reporting period |
| FRN | Floating Rate Notes: the rate shown is the current interest rate or yield at the close of the reporting period |
| GMTN | Global Medium Term Notes |
| G.O. Bonds | General Obligation Bonds |
| IO | Interest Only |
| MTN | Medium Term Notes |
| SPDR | S&P Depository Receipts |
| TBA | To Be Announced Commitments |
Notes to the fund’s portfolio
Unless noted otherwise, the notes to the fund’s portfolio are for the close of the fund’s reporting period, which ran from August 1, 2016 through January 31, 2017 (the reporting period). Within the following notes to the portfolio, references to “ASC 820” represent Accounting Standards Codification 820 Fair Value Measurements and Disclosures and references to “OTC”, if any, represent over-the-counter.
* Percentages indicated are based on net assets of $1,162,948,581.
† This security is non-income-producing.
†† The interest rate and date shown parenthetically represent the new interest rate to be paid and the date the fund will begin accruing interest at this rate.
∆∆ This security is restricted with regard to public resale. The total fair value of this security and any other restricted securities (excluding 144A securities), if any, held at the close of the reporting period was $2,233,911, or 0.2% of net assets.
∆ This security, in part or in entirety, was pledged and segregated with the custodian for collateral on certain derivative contracts at the close of the reporting period.
d Affiliated company. See Notes 1 and 5 to the financial statements regarding securities lending. The rate quoted in the security description is the annualized 7-day yield of the fund at the close of the reporting period.
F This security is valued by Putnam Management at fair value following procedures approved by the Trustees. Securities may be classified as Level 2 or Level 3 for ASC 820 based on the securities’ valuation inputs. At the close of the reporting period, fair value pricing was also used for certain foreign securities in the portfolio (Note 1).
L Affiliated company (Note 5). The rate quoted in the security description is the annualized 7-day yield of the fund at the close of the reporting period.
R Real Estate Investment Trust.
S Security on loan, in part or in entirety, at the close of the reporting period (Note 1).
At the close of the reporting period, the fund maintained liquid assets totaling $54,463,851 to cover certain derivative contracts and delayed delivery securities.
|
| 36 George Putnam Balanced Fund |
Unless otherwise noted, the rates quoted in Short-term investments security descriptions represent the weighted average yield to maturity.
Debt obligations are considered secured unless otherwise indicated.
144A after the name of an issuer represents securities exempt from registration under Rule 144A of the Securities Act of 1933, as amended. These securities may be resold in transactions exempt from registration, normally to qualified institutional buyers.
See Note 1 to the financial statements regarding TBA commitments.
The dates shown on debt obligations are the original maturity dates.
| | | | | | |
| FORWARD CURRENCY CONTRACTS at 1/31/17 (aggregate face value $56,824,421) (Unaudited) |
|
| | | | | | | Unrealized |
| | | Contract | Delivery | | Aggregate | appreciation/ |
| Counterparty | Currency | type | date | Value | face value | (depreciation) |
|
| Bank of America N.A. | | | | | | |
|
| | British Pound | Sell | 3/16/17 | $4,038,714 | $3,951,840 | $(86,874) |
|
| | Canadian Dollar | Sell | 4/19/17 | 534,302 | 517,415 | (16,887) |
|
| Barclays Bank PLC | | | | | | |
|
| | Canadian Dollar | Sell | 4/19/17 | 2,860,788 | 2,769,886 | (90,902) |
|
| Citibank, N.A. | | | | | | |
|
| | Euro | Sell | 3/16/17 | 11,802,380 | 11,593,914 | (208,466) |
|
| Credit Suisse International | | | | | |
|
| | British Pound | Sell | 3/16/17 | 5,557,623 | 5,595,374 | 37,751 |
|
| | Canadian Dollar | Sell | 4/19/17 | 1,705,966 | 1,651,546 | (54,420) |
|
| Goldman Sachs International | | | | | |
|
| | Japanese Yen | Buy | 2/16/17 | 5,689,479 | 5,649,488 | 39,991 |
|
| | Japanese Yen | Sell | 2/16/17 | 5,689,479 | 5,851,012 | 161,533 |
|
| | Japanese Yen | Sell | 5/17/17 | 5,712,683 | 5,674,112 | (38,571) |
|
| JPMorgan Chase Bank N.A. | | | | | |
|
| | Canadian Dollar | Sell | 4/19/17 | 7,076,519 | 6,851,898 | (224,621) |
|
| | Swiss Franc | Sell | 3/16/17 | 2,197,986 | 2,162,849 | (35,137) |
|
| State Street Bank and Trust Co. | | | | | |
|
| | Israeli Shekel | Sell | 4/19/17 | 2,252,859 | 2,203,416 | (49,443) |
|
| UBS AG | | | | | | |
|
| | Euro | Sell | 3/16/17 | 2,334,110 | 2,351,671 | 17,561 |
|
| Total | | | | | | $(548,485) |
|
| | | | |
| TBA SALE COMMITMENTS OUTSTANDING at 1/31/17 (proceeds receivable $54,982,031) (Unaudited) |
|
| | Principal | | Settlement | |
| Agency | amount | | date | Value |
|
| Federal National Mortgage Association, 4.50%, 2/1/47 | $13,000,000 | | 2/13/17 | $13,980,078 |
|
| Federal National Mortgage Association, 3.50%, 2/1/47 | 29,000,000 | | 2/13/17 | 29,636,640 |
|
| Federal National Mortgage Association, 3.00%, 2/1/47 | 4,000,000 | | 2/13/17 | 3,958,750 |
|
| Government National Mortgage Association, 4.50%, 2/1/47 | 7,000,000 | | 2/21/17 | 7,509,141 |
|
| Total | | | | $55,084,609 |
|
|
| George Putnam Balanced Fund 37 |
ASC 820 establishes a three-level hierarchy for disclosure of fair value measurements. The valuation hierarchy is based upon the transparency of inputs to the valuation of the fund’s investments. The three levels are defined as follows:
Level 1: Valuations based on quoted prices for identical securities in active markets.
Level 2: Valuations based on quoted prices in markets that are not active or for which all significant inputs are observable, either directly or indirectly.
Level 3: Valuations based on inputs that are unobservable and significant to the fair value measurement.
The following is a summary of the inputs used to value the fund’s net assets as of the close of the reporting period:
| | | | |
| | | | | Valuation inputs | |
|
| Investments in securities: | | Level 1 | Level 2 | Level 3 |
|
| Common stocks*: | | | | |
|
| Basic materials | | $21,741,502 | $3,255,498 | $— |
|
| Capital goods | | 39,364,422 | 6,251,858 | — |
|
| Communication services | | 39,350,190 | — | — |
|
| Conglomerates | | 4,333,545 | 5,626,379 | — |
|
| Consumer cyclicals | | 78,498,672 | — | — |
|
| Consumer staples | | 72,303,554 | — | 385,647 |
|
| Energy | | 51,706,592 | 4,487,876 | — |
|
| Financials | | 110,611,015 | 5,383,663 | 348,286 |
|
| Health care | | 84,204,200 | — | — |
|
| Miscellaneous | | 688,147 | — | — |
|
| Technology | | 145,689,264 | — | — |
|
| Transportation | | 6,520,980 | — | — |
|
| Utilities and power | | 23,638,044 | — | — |
|
| Total common stocks | | 678,650,127 | 25,005,274 | 733,933 |
| | | | | |
| Convertible preferred stocks | | — | — | 1,499,978 |
|
| Corporate bonds and notes | | — | 182,714,689 | 602,775 |
|
| Investment companies | | 7,113,194 | — | — |
|
| Mortgage-backed securities | | — | 10,853,772 | — |
|
| Municipal bonds and notes | | — | 1,107,624 | — |
|
| U.S. government and agency mortgage obligations | | — | 147,472,580 | — |
|
| U.S. treasury obligations | | — | 137,786,120 | — |
|
| Short-term investments | | 77,567,469 | 28,675,485 | — |
|
| Totals by level | | $763,330,790 | $533,615,544 | $2,836,686 |
| |
| | | | | Valuation inputs | |
|
| Other financial instruments: | | Level 1 | Level 2 | Level 3 |
|
| Forward currency contracts | | $— | $(548,485) | $— |
|
| TBA sale commitments | | — | (55,084,609) | — |
|
| Totals by level | | $— | $(55,633,094) | $— |
* Common stock classifications are presented at the sector level, which may differ from the fund’s portfolio presentation.
During the reporting period, transfers within the fair value hierarchy, if any (other than certain transfers involving non-U.S. equity securities as described in Note 1), did not represent, in the aggregate, more than 1% of the fund’s net assets measured as of the end of the period. Transfers are accounted for using the end of period pricing valuation method.
At the start and close of the reporting period, Level 3 investments in securities represented less than 1% of the fund’s net assets and were not considered a significant portion of the fund’s portfolio.
|
| The accompanying notes are an integral part of these financial statements. |
|
| 38 George Putnam Balanced Fund |
Statement of assets and liabilities 1/31/17 (Unaudited)
| |
| ASSETS | |
|
| Investment in securities, at value, including $28,009,808 of securities on loan (Note 1): | |
| Unaffiliated issuers (identified cost $1,111,522,872) | $1,193,540,066 |
| Affiliated issuers (identified cost $106,242,954) (Notes 1 and 5) | 106,242,954 |
|
| Foreign currency (cost $22) (Note 1) | 22 |
|
| Dividends, interest and other receivables | 4,135,652 |
|
| Receivable for shares of the fund sold | 366,415 |
|
| Receivable for investments sold | 3,455,993 |
|
| Receivable for sales of delayed delivery securities (Note 1) | 32,093,919 |
|
| Unrealized appreciation on forward currency contracts (Note 1) | 256,836 |
|
| Prepaid assets | 75,297 |
|
| Total assets | 1,340,167,154 |
|
| LIABILITIES | |
|
| Payable for investments purchased | 3,620,221 |
|
| Payable for purchases of delayed delivery securities (Note 1) | 85,841,953 |
|
| Payable for shares of the fund repurchased | 1,151,368 |
|
| Payable for compensation of Manager (Note 2) | 520,958 |
|
| Payable for custodian fees (Note 2) | 40,599 |
|
| Payable for investor servicing fees (Note 2) | 351,757 |
|
| Payable for Trustee compensation and expenses (Note 2) | 623,765 |
|
| Payable for administrative services (Note 2) | 12,651 |
|
| Payable for distribution fees (Note 2) | 299,544 |
|
| Unrealized depreciation on forward currency contracts (Note 1) | 805,321 |
|
| TBA sale commitments, at value (proceeds receivable $54,982,031) (Note 1) | 55,084,609 |
|
| Collateral on securities loaned, at value (Note 1) | 28,675,485 |
|
| Other accrued expenses | 190,342 |
|
| Total liabilities | 177,218,573 |
| | |
| Net assets | $1,162,948,581 |
|
| REPRESENTED BY | |
|
| Paid-in capital (Unlimited shares authorized) (Notes 1 and 4) | $1,539,528,689 |
|
| Undistributed net investment income (Note 1) | 13,907,979 |
|
| Accumulated net realized loss on investments and foreign currency transactions (Note 1) | (471,854,023) |
|
| Net unrealized appreciation of investments and assets and liabilities in foreign currencies | 81,365,936 |
|
| Total — Representing net assets applicable to capital shares outstanding | $1,162,948,581 |
|
(Continued on next page)
|
| George Putnam Balanced Fund 39 |
Statement of assets and liabilities cont.
| |
| COMPUTATION OF NET ASSET VALUE AND OFFERING PRICE | |
|
| Net asset value and redemption price per class A share | |
| ($947,653,114 divided by 52,748,471 shares) | $17.97 |
|
| Offering price per class A share (100/94.25 of $17.97)* | $19.07 |
|
| Net asset value and offering price per class B share ($21,355,430 divided by 1,202,599 shares)** | $17.76 |
|
| Net asset value and offering price per class C share ($43,989,939 divided by 2,466,612 shares)** | $17.83 |
|
| Net asset value and redemption price per class M share | |
| ($68,124,094 divided by 3,844,919 shares) | $17.72 |
|
| Offering price per class M share (100/96.50 of $17.72)* | $18.36 |
|
| Net asset value, offering price and redemption price per class R share | |
| ($694,186 divided by 38,759 shares) | $17.91 |
|
| Net asset value, offering price and redemption price per class R5 share | |
| ($12,335 divided by 684 shares) | $18.03 |
|
| Net asset value, offering price and redemption price per class R6 share | |
| ($13,206,009 divided by 732,077 shares) | $18.04 |
|
| Net asset value, offering price and redemption price per class Y share | |
| ($67,913,474 divided by 3,766,033 shares) | $18.03 |
*On single retail sales of less than $50,000. On sales of $50,000 or more the offering price is reduced.
**Redemption price per share is equal to net asset value less any applicable contingent deferred sales charge.
The accompanying notes are an integral part of these financial statements.
|
| 40 George Putnam Balanced Fund |
Statement of operations Six months ended 1/31/17 (Unaudited)
| |
| INVESTMENT INCOME | |
|
| Dividends (net of foreign tax of $37,917) | $7,577,003 |
|
| Interest (including interest income of $212,485 from investments in affiliated issuers) (Note 5) | 6,711,278 |
|
| Securities lending (net of expenses) (Note 1 and 5) | 58,194 |
|
| Total investment income | 14,346,475 |
|
| EXPENSES | |
|
| Compensation of Manager (Note 2) | 3,206,195 |
|
| Investor servicing fees (Note 2) | 1,073,258 |
|
| Custodian fees (Note 2) | 30,518 |
|
| Trustee compensation and expenses (Note 2) | 30,317 |
|
| Distribution fees (Note 2) | 1,752,647 |
|
| Administrative services (Note 2) | 21,753 |
|
| Other | 274,872 |
|
| Total expenses | 6,389,560 |
| | |
| Expense reduction (Note 2) | (7,459) |
|
| Net expenses | 6,382,101 |
| |
| Net investment income | 7,964,374 |
|
| Net realized gain on investments (Notes 1 and 3) | 37,712,760 |
|
| Net realized gain on foreign currency transactions (Note 1) | 1,819,194 |
|
| Net unrealized depreciation of assets and liabilities in foreign currencies during the period | (1,162,928) |
|
| Net unrealized appreciation of investments, and TBA sale commitments during the period | 112,826 |
|
| Net gain on investments | 38,481,852 |
| |
| Net increase in net assets resulting from operations | $46,446,226 |
|
The accompanying notes are an integral part of these financial statements.
|
| George Putnam Balanced Fund 41 |
Statement of changes in net assets
| | |
| DECREASE IN NET ASSETS | Six months ended 1/31/17* | Year ended 7/31/16 |
|
| Operations | | |
|
| Net investment income | $7,964,374 | $16,191,101 |
|
| Net realized gain on investments | | |
| and foreign currency transactions | 39,531,954 | 6,509,085 |
|
| Net unrealized depreciation of investments and assets | | |
| and liabilities in foreign currencies | (1,050,102) | (1,159,527) |
|
| Net increase in net assets resulting from operations | 46,446,226 | 21,540,659 |
|
| Distributions to shareholders (Note 1): | | |
| From ordinary income | | |
| Net investment income | | |
|
| Class A | (5,615,431) | (11,362,355) |
|
| Class B | (49,592) | (102,384) |
|
| Class C | (94,280) | (196,107) |
|
| Class M | (238,651) | (502,000) |
|
| Class R | (2,170) | (5,030) |
|
| Class R5 | (565,755) | (1,028,461) |
|
| Class R6 | (61,724) | (366,668) |
|
| Class Y | (444,482) | (1,303,237) |
|
| Decrease from capital share transactions (Note 4) | (103,431,060)�� | (111,655,880) |
|
| Total decrease in net assets | (64,056,919) | (104,981,463) |
|
| NET ASSETS | | |
|
| Beginning of period | 1,227,005,500 | 1,331,986,963 |
|
| End of period (including undistributed net investment | | |
| income of $13,907,979 and $13,015,690, respectively) | $1,162,948,581 | $1,227,005,500 |
*Unaudited.
The accompanying notes are an integral part of these financial statements.
|
| 42 George Putnam Balanced Fund |
|
| This page left blank intentionally. |
|
| George Putnam Balanced Fund 43 |
Financial highlights (For a common share outstanding throughout the period)
| | | | | | | | | | | | |
| | INVESTMENT OPERATIONS | | | LESS DISTRIBUTIONS | | | RATIOS AND SUPPLEMENTAL DATA | |
| |
|
| | | | | | | | | | | | Ratio | |
| | | | Net realized | | | | | | | | of net investment | |
| | Net asset value, | | and unrealized | Total from | From | | | Total return | Net assets, | Ratio of expenses | income (loss) | |
| | beginning | Net investment | gain (loss) | investment | net investment | Total | Net asset value, | at net asset value | end of period | to average | to average | Portfolio |
| Period ended | of period | income (loss)a | on investments | operations | income | distributions | end of period | (%)b | (in thousands) | net assets (%)c | net assets (%) | turnover (%) |
|
| Class A | | | | | | | | | | | | |
|
| January 31, 2017** | $17.38 | .12 | .57 | .69 | (.10) | (.10) | $17.97 | 4.02* | $947,653 | .51* | .67* | 89*d |
|
| July 31, 2016 | 17.22 | .22 | .14 | .36 | (.20) | (.20) | 17.38 | 2.17 | 953,549 | 1.00e | 1.33e | 154d |
|
| July 31, 2015 | 16.12 | .19 | 1.10 | 1.29 | (.19) | (.19) | 17.22 | 8.04 | 999,928 | .97 | 1.11 | 130d |
|
| July 31, 2014 | 14.81 | .23 | 1.29 | 1.52 | (.21) | (.21) | 16.12 | 10.37 | 1,051,287 | .99 | 1.52 | 98f |
|
| July 31, 2013 | 12.88 | .21 | 1.92 | 2.13 | (.20) | (.20) | 14.81 | 16.68 | 1,030,545 | 1.01 | 1.56 | 86f |
|
| July 31, 2012 | 12.21 | .22 | .65 | .87 | (.20) | (.20) | 12.88 | 7.26 | 973,318 | 1.03 | 1.80 | 99f |
|
| Class B | | | | | | | | | | | | |
|
| January 31, 2017** | $17.18 | .05 | .57 | .62 | (.04) | (.04) | $17.76 | 3.62* | $21,355 | .89* | .30 * | 89*d |
|
| July 31, 2016 | 17.02 | .10 | .14 | .24 | (.08) | (.08) | 17.18 | 1.42 | 21,592 | 1.75e | .58e | 154d |
|
| July 31, 2015 | 15.94 | .06 | 1.09 | 1.15 | (.07) | (.07) | 17.02 | 7.21 | 24,133 | 1.72 | .36 | 130d |
|
| July 31, 2014 | 14.65 | .12 | 1.27 | 1.39 | (.10) | (.10) | 15.94 | 9.51 | 24,881 | 1.74 | .77 | 98f |
|
| July 31, 2013 | 12.74 | .11 | 1.90 | 2.01 | (.10) | (.10) | 14.65 | 15.83 | 26,541 | 1.76 | .82 | 86f |
|
| July 31, 2012 | 12.08 | .13 | .63 | .76 | (.10) | (.10) | 12.74 | 6.38 | 29,272 | 1.78 | 1.06 | 99f |
|
| Class C | | | | | | | | | | | | |
|
| January 31, 2017** | $17.26 | .05 | .56 | .61 | (.04) | (.04) | $17.83 | 3.54* | $43,990 | .89* | .30* | 89*d |
|
| July 31, 2016 | 17.10 | .09 | .15 | .24 | (.08) | (.08) | 17.26 | 1.45 | 41,700 | 1.75e | .58e | 154d |
|
| July 31, 2015 | 16.01 | .06 | 1.10 | 1.16 | (.07) | (.07) | 17.10 | 7.26 | 36,720 | 1.72 | .36 | 130d |
|
| July 31, 2014 | 14.72 | .12 | 1.27 | 1.39 | (.10) | (.10) | 16.01 | 9.50 | 29,091 | 1.74 | .76 | 98f |
|
| July 31, 2013 | 12.80 | .11 | 1.91 | 2.02 | (.10) | (.10) | 14.72 | 15.85 | 23,534 | 1.76 | .81 | 86f |
|
| July 31, 2012 | 12.14 | .13 | .64 | .77 | (.11) | (.11) | 12.80 | 6.39 | 21,223 | 1.78 | 1.05 | 99f |
|
| Class M | | | | | | | | | | | | |
|
| January 31, 2017** | $17.15 | .07 | .56 | .63 | (.06) | (.06) | $17.72 | 3.70* | $68,124 | .76* | .42* | 89*d |
|
| July 31, 2016 | 16.99 | .14 | .14 | .28 | (.12) | (.12) | 17.15 | 1.69 | 66,779 | 1.50e | .83e | 154d |
|
| July 31, 2015 | 15.90 | .10 | 1.10 | 1.20 | (.11) | (.11) | 16.99 | 7.56 | 75,297 | 1.47 | .61 | 130d |
|
| July 31, 2014 | 14.62 | .16 | 1.26 | 1.42 | (.14) | (.14) | 15.90 | 9.75 | 77,338 | 1.49 | 1.02 | 98f |
|
| July 31, 2013 | 12.71 | .14 | 1.90 | 2.04 | (.13) | (.13) | 14.62 | 16.17 | 74,636 | 1.51 | 1.06 | 86f |
|
| July 31, 2012 | 12.06 | .16 | .63 | .79 | (.14) | (.14) | 12.71 | 6.62 | 70,317 | 1.53 | 1.30 | 99f |
|
| Class R | | | | | | | | | | | | |
|
| January 31, 2017** | $17.33 | .09 | .58 | .67 | (.09) | (.09) | $17.91 | 3.86* | $694 | .64* | .52* | 89*d |
|
| July 31, 2016 | 17.16 | .19 | .13 | .32 | (.15) | (.15) | 17.33 | 1.93 | 409 | 1.25e | 1.13e | 154d |
|
| July 31, 2015 | 16.07 | .15 | 1.09 | 1.24 | (.15) | (.15) | 17.16 | 7.74 | 1,102 | 1.22 | .86 | 130d |
|
| July 31, 2014 | 14.77 | .20 | 1.28 | 1.48 | (.18) | (.18) | 16.07 | 10.08 | 983 | 1.24 | 1.27 | 98f |
|
| July 31, 2013 | 12.84 | .18 | 1.92 | 2.10 | (.17) | (.17) | 14.77 | 16.44 | 960 | 1.26 | 1.32 | 86f |
|
| July 31, 2012 | 12.18 | .19 | .64 | .83 | (.17) | (.17) | 12.84 | 6.92 | 1,209 | 1.28 | 1.54 | 99f |
See notes to financial highlights at the end of this section.
The accompanying notes are an integral part of these financial statements.
| |
| 44 George Putnam Balanced Fund | George Putnam Balanced Fund 45 |
Financial highlights cont.
| | | | | | | | | | | | |
| | INVESTMENT OPERATIONS | | | LESS DISTRIBUTIONS | | | RATIOS AND SUPPLEMENTAL DATA | |
| |
|
| | | | | | | | | | | | Ratio | |
| | | | Net realized | | | | | | | | of net investment | |
| | Net asset value, | | and unrealized | Total from | From | | | Total return | Net assets, | Ratio of expenses | income (loss) | |
| | beginning | Net investment | gain (loss) | investment | net investment | Total | Net asset value, | at net asset value | end of period | to average | to average | Portfolio |
| Period ended | of period | income (loss)a | on investments | operations | income | distributions | end of period | (%)b | (in thousands) | net assets (%)c | net assets (%) | turnover (%) |
|
| Class R5 | | | | | | | | | | | | |
|
| January 31, 2017** | $17.45 | .15 | .56 | .71 | (.13) | (.13) | $18.03 | 4.08* | $13 | .37* | .86* | 89*d |
|
| July 31, 2016 | 17.28 | .26 | .16 | .42 | (.25) | (.25) | 17.45 | 2.49 | 76,674 | .73e | 1.59e | 154d |
|
| July 31, 2015 | 16.18 | .23 | 1.11 | 1.34 | (.24) | (.24) | 17.28 | 8.28 | 71,647 | .72 | 1.34 | 130d |
|
| July 31, 2014† | 15.28 | .18 | .85 | 1.03 | (.13) | (.13) | 16.18 | 6.76* | 11 | .48* | 1.15* | 98f |
|
| Class R6 | | | | | | | | | | | | |
|
| January 31, 2017** | $17.45 | .14 | .59 | .73 | (.14) | (.14) | $18.04 | 4.20* | $13,206 | .32* | .83* | 89*d |
|
| July 31, 2016 | 17.28 | .28 | .15 | .43 | (.26) | (.26) | 17.45 | 2.58 | 8,013 | .63e | 1.71e | 154d |
|
| July 31, 2015 | 16.18 | .25 | 1.10 | 1.35 | (.25) | (.25) | 17.28 | 8.39 | 8,239 | .62 | 1.46 | 130d |
|
| July 31, 2014† | 15.28 | .19 | .85 | 1.04 | (.14) | (.14) | 16.18 | 6.81* | 7,100 | .42* | 1.19* | 98f |
|
| Class Y | | | | | | | | | | | | |
|
| January 31, 2017** | $17.45 | .14 | .57 | .71 | (.13) | (.13) | $18.03 | 4.07* | $67,913 | .38* | .80* | 89*d |
|
| July 31, 2016 | 17.28 | .26 | .15 | .41 | (.24) | (.24) | 17.45 | 2.48 | 58,289 | .75e | 1.60e | 154d |
|
| July 31, 2015 | 16.17 | .23 | 1.11 | 1.34 | (.23) | (.23) | 17.28 | 8.34 | 114,920 | .72 | 1.36 | 130d |
|
| July 31, 2014 | 14.86 | .27 | 1.29 | 1.56 | (.25) | (.25) | 16.17 | 10.61 | 111,604 | .74 | 1.77 | 98f |
|
| July 31, 2013 | 12.92 | .25 | 1.92 | 2.17 | (.23) | (.23) | 14.86 | 16.99 | 106,794 | .76 | 1.81 | 86f |
|
| July 31, 2012 | 12.26 | .25 | .64 | .89 | (.23) | (.23) | 12.92 | 7.42 | 70,090 | .78 | 2.04 | 99f |
* Not annualized.
** Unaudited.
† For the period December 2, 2013 (commencement of operations) to July 31, 2014.
a Per share net investment income (loss) has been determined on the basis of the weighted average number of shares outstanding during the period.
b Total return assumes dividend reinvestment and does not reflect the effect of sales charges.
c Includes amounts paid through expense offset and/or brokerage/service arrangements, if any (Note 2). Also excludes acquired fund fees and expenses, if any.
d Portfolio turnover includes TBA purchase and sales transactions.
e Reflects a voluntary waiver of certain fund expenses in effect during the period. As a result of such waivers, the expenses of each class reflect a reduction of less than .01% as a percentage of average net assets per share for each class (Note 2).
f Portfolio turnover excludes TBA purchase and sale commitments. Including TBA purchase and sale commitments to conform with current year presentation, the portfolio turnover would have been the following:
| |
|
| July 31, 2014 | 142% |
|
| July 31, 2013 | 186% |
|
| July 31, 2012 | 266% |
|
The accompanying notes are an integral part of these financial statements.
| |
| 46 George Putnam Balanced Fund | George Putnam Balanced Fund 47 |
Notes to financial statements 1/31/17 (Unaudited)
Within the following Notes to financial statements, references to “State Street” represent State Street Bank and Trust Company, references to “the SEC” represent the Securities and Exchange Commission, references to “Putnam Management” represent Putnam Investment Management, LLC, the fund’s manager, an indirect wholly-owned subsidiary of Putnam Investments, LLC and references to “OTC”, if any, represent over-the-counter. Unless otherwise noted, the “reporting period” represents the period from August 1, 2016 through January 31, 2017.
George Putnam Balanced Fund (the fund) is a Massachusetts business trust, which is registered under the Investment Company Act of 1940, as amended, as a diversified open-end management investment company. The goal of the fund is to seek to provide a balanced investment composed of a well-diversified portfolio of stocks and bonds which produce both capital growth and current income. The fund invests mainly in a combination of bonds and common stocks (growth or value stocks or both) of large U.S. companies, with a greater focus on common stocks. For example, Putnam Management may purchase stocks of companies with stock prices that reflect a value lower than that which Putnam Management places on the company. Putnam Management may also consider other factors that Putnam Management believes will cause the stock price to rise. The fund buys bonds of governments and private companies that are mostly investment-grade in quality with intermediate- to long-term maturities (three years or longer). Putnam Management may consider, among other factors, a company’s valuation, financial strength, growth potential, competitive position in its industry, projected future earnings, cash flows and dividends when deciding whether to buy or sell equity investments, and, among other factors, credit, interest rate and prepayment risks, as well as general market conditions, when deciding whether to buy or sell fixed-income investments. The fund may also use derivatives, such as futures, options, warrants and swap contracts, for both hedging and non-hedging purposes.
The fund offers class A, class B, class C, class M, class R, class R5, class R6 and class Y shares. Effective April 1, 2017, purchases of class B shares will be closed to new and existing investors except by exchange from class B shares of another Putnam fund or through dividend and/or capital gains reinvestment. Class A and class M shares are sold with a maximum front-end sales charge of 5.75% and 3.50%, respectively. Class A shares generally are not subject to a contingent deferred sales charge, and class M, class R, class R5, class R6 and class Y shares are not subject to a contingent deferred sales charge. Class B shares, which convert to class A shares after approximately eight years, are not subject to a front-end sales charge and are subject to a contingent deferred sales charge if those shares are redeemed within six years of purchase. Class C shares are subject to a one-year 1.00% contingent deferred sales charge and do not convert to class A shares. Class R shares, which are not available to all investors, are sold at net asset value. The expenses for class A, class B, class C, class M and class R shares may differ based on the distribution fee of each class, which is identified in Note 2. Class R5, class R6 and class Y shares, which are sold at net asset value, are generally subject to the same expenses as class A, class B, class C, class M and class R shares, but do not bear a distribution fee and in the case of class R5 and class R6 shares, bear a lower investor servicing fee, which is identified in Note 2. Class R5 class R6 and class Y shares are not available to all investors.
In the normal course of business, the fund enters into contracts that may include agreements to indemnify another party under given circumstances. The fund’s maximum exposure under these arrangements is unknown as this would involve future claims that may be, but have not yet been, made against the fund. However, the fund’s management team expects the risk of material loss to be remote.
The fund has entered into contractual arrangements with an investment adviser, administrator, distributor, shareholder servicing agent and custodian, who each provide services to the fund. Unless expressly stated otherwise, shareholders are not parties to, or intended beneficiaries of these contractual arrangements, and these contractual arrangements are not intended to create any shareholder right to enforce them against the service providers or to seek any remedy under them against the service providers, either directly or on behalf of the fund.
Under the fund’s Declaration of Trust, any claims asserted against or on behalf of the Putnam Funds, including claims against Trustees and Officers, must be brought in state and federal courts located within the Commonwealth of Massachusetts.
Note 1: Significant accounting policies
The following is a summary of significant accounting policies consistently followed by the fund in the preparation of its financial statements. The preparation of financial statements is in conformity with accounting principles generally accepted in the United States of America and requires management to make estimates and assumptions that affect the reported amounts of assets and liabilities in the financial statements and the reported amounts of increases and decreases in net assets from operations. Actual results could differ from those
|
| 48 George Putnam Balanced Fund |
estimates. Subsequent events after the Statement of assets and liabilities date through the date that the financial statements were issued have been evaluated in the preparation of the financial statements.
Investment income, realized and unrealized gains and losses and expenses of the fund are borne pro-rata based on the relative net assets of each class to the total net assets of the fund, except that each class bears expenses unique to that class (including the distribution fees applicable to such classes). Each class votes as a class only with respect to its own distribution plan or other matters on which a class vote is required by law or determined by the Trustees. If the fund were liquidated, shares of each class would receive their pro-rata share of the net assets of the fund. In addition, the Trustees declare separate dividends on each class of shares.
Security valuation Portfolio securities and other investments are valued using policies and procedures adopted by the Board of Trustees. The Trustees have formed a Pricing Committee to oversee the implementation of these procedures and have delegated responsibility for valuing the fund’s assets in accordance with these procedures to Putnam Management. Putnam Management has established an internal Valuation Committee that is responsible for making fair value determinations, evaluating the effectiveness of the pricing policies of the fund and reporting to the Pricing Committee.
Investments for which market quotations are readily available are valued at the last reported sales price on their principal exchange, or official closing price for certain markets, and are classified as Level 1 securities under Accounting Standards Codification 820 Fair Value Measurements and Disclosures (ASC 820). If no sales are reported, as in the case of some securities that are traded OTC, a security is valued at its last reported bid price and is generally categorized as a Level 2 security.
Investments in open-end investment companies (excluding exchange-traded funds), if any, which can be classified as Level 1 or Level 2 securities, are valued based on their net asset value. The net asset value of such investment companies equals the total value of their assets less their liabilities and divided by the number of their outstanding shares.
Market quotations are not considered to be readily available for certain debt obligations (including short-term investments with remaining maturities of 60 days or less) and other investments; such investments are valued on the basis of valuations furnished by an independent pricing service approved by the Trustees or dealers selected by Putnam Management. Such services or dealers determine valuations for normal institutional-size trading units of such securities using methods based on market transactions for comparable securities and various relationships, generally recognized by institutional traders, between securities (which consider such factors as security prices, yields, maturities and ratings). These securities will generally be categorized as Level 2.
Many securities markets and exchanges outside the U.S. close prior to the scheduled close of the New York Stock Exchange and therefore the closing prices for securities in such markets or on such exchanges may not fully reflect events that occur after such close but before the scheduled close of the New York Stock Exchange. Accordingly, on certain days, the fund will fair value certain foreign equity securities taking into account multiple factors including movements in the U.S. securities markets, currency valuations and comparisons to the valuation of American Depository Receipts, exchange-traded funds and futures contracts. The foreign equity securities, which would generally be classified as Level 1 securities, will be transferred to Level 2 of the fair value hierarchy when they are valued at fair value. The number of days on which fair value prices will be used will depend on market activity and it is possible that fair value prices will be used by the fund to a significant extent. At the close of the reporting period, fair value pricing was used for certain foreign securities in the portfolio. Securities quoted in foreign currencies, if any, are translated into U.S. dollars at the current exchange rate.
To the extent a pricing service or dealer is unable to value a security or provides a valuation that Putnam Management does not believe accurately reflects the security’s fair value, the security will be valued at fair value by Putnam Management in accordance with policies and procedures approved by the Trustees. Certain investments, including certain restricted and illiquid securities and derivatives, are also valued at fair value following procedures approved by the Trustees. These valuations consider such factors as significant market or specific security events such as interest rate or credit quality changes, various relationships with other securities, discount rates, U.S. Treasury, U.S. swap and credit yields, index levels, convexity exposures, recovery rates, sales and other multiples and resale restrictions. These securities are classified as Level 2 or as Level 3 depending on the priority of the significant inputs.
To assess the continuing appropriateness of fair valuations, the Valuation Committee reviews and affirms the reasonableness of such valuations on a regular basis after considering all relevant information that is reasonably available. Such valuations and procedures are reviewed periodically by the Trustees. Certain securities may be valued on the basis of a price provided by a single source. The fair value of securities is generally determined as
|
| George Putnam Balanced Fund 49 |
the amount that the fund could reasonably expect to realize from an orderly disposition of such securities over a reasonable period of time. By its nature, a fair value price is a good faith estimate of the value of a security in a current sale and does not reflect an actual market price, which may be different by a material amount.
Security transactions and related investment income Security transactions are recorded on the trade date (the date the order to buy or sell is executed). Gains or losses on securities sold are determined on the identified cost basis.
Interest income, net of any applicable withholding taxes, is recorded on the accrual basis. Dividend income, net of any applicable withholding taxes, is recognized on the ex-dividend date except that certain dividends from foreign securities, if any, are recognized as soon as the fund is informed of the ex-dividend date. Non-cash dividends, if any, are recorded at the fair value of the securities received. Dividends representing a return of capital or capital gains, if any, are reflected as a reduction of cost and/or as a realized gain. All premiums/discounts are amortized/accreted on a yield-to-maturity basis.
Securities purchased or sold on a delayed delivery basis may be settled at a future date beyond customary settlement time; interest income is accrued based on the terms of the securities. Losses may arise due to changes in the fair value of the underlying securities or if the counterparty does not perform under the contract.
Stripped securities The fund may invest in stripped securities which represent a participation in securities that may be structured in classes with rights to receive different portions of the interest and principal. Interest-only securities receive all of the interest and principal-only securities receive all of the principal. If the interest-only securities experience greater than anticipated prepayments of principal, the fund may fail to recoup fully its initial investment in these securities. Conversely, principal-only securities increase in value if prepayments are greater than anticipated and decline if prepayments are slower than anticipated. The fair value of these securities is highly sensitive to changes in interest rates.
Foreign currency translation The accounting records of the fund are maintained in U.S. dollars. The fair value of foreign securities, currency holdings, and other assets and liabilities is recorded in the books and records of the fund after translation to U.S. dollars based on the exchange rates on that day. The cost of each security is determined using historical exchange rates. Income and withholding taxes are translated at prevailing exchange rates when earned or incurred. The fund does not isolate that portion of realized or unrealized gains or losses resulting from changes in the foreign exchange rate on investments from fluctuations arising from changes in the market prices of the securities. Such gains and losses are included with the net realized and unrealized gain or loss on investments. Net realized gains and losses on foreign currency transactions represent net realized exchange gains or losses on closed forward currency contracts, disposition of foreign currencies, currency gains and losses realized between the trade and settlement dates on securities transactions and the difference between the amount of investment income and foreign withholding taxes recorded on the fund’s books and the U.S. dollar equivalent amounts actually received or paid. Net unrealized appreciation and depreciation of assets and liabilities in foreign currencies arise from changes in the value of open forward currency contracts and assets and liabilities other than investments at the period end, resulting from changes in the exchange rate.
Forward currency contracts The fund buys and sells forward currency contracts, which are agreements between two parties to buy and sell currencies at a set price on a future date. These contracts are used to hedge foreign exchange risk, for hedging currency exposures and to gain exposure to currencies.
The U.S. dollar value of forward currency contracts is determined using current forward currency exchange rates supplied by a quotation service. The fair value of the contract will fluctuate with changes in currency exchange rates. The contract is marked to market daily and the change in fair value is recorded as an unrealized gain or loss. The fund records a realized gain or loss equal to the difference between the value of the contract at the time it was opened and the value at the time it was closed when the contract matures or by delivery of the currency. The fund could be exposed to risk if the value of the currency changes unfavorably, if the counterparties to the contracts are unable to meet the terms of their contracts or if the fund is unable to enter into a closing position. Risks may exceed amounts recognized on the Statement of assets and liabilities.
Forward currency contracts outstanding at period end, if any, are listed after the fund’s portfolio.
TBA commitments The fund may enter into TBA (to be announced) commitments to purchase securities for a fixed unit price at a future date beyond customary settlement time. Although the unit price and par amount have been established, the actual securities have not been specified. However, it is anticipated that the amount of the commitments will not significantly differ from the principal amount. The fund holds, and maintains until settlement date, cash or high-grade debt obligations in an amount sufficient to meet the purchase price, or the
|
| 50 George Putnam Balanced Fund |
fund may enter into offsetting contracts for the forward sale of other securities it owns. Income on the securities will not be earned until settlement date.
The fund may also enter into TBA sale commitments to hedge its portfolio positions, to sell mortgage-backed securities it owns under delayed delivery arrangements or to take a short position in mortgage-backed securities. Proceeds of TBA sale commitments are not received until the contractual settlement date. During the time a TBA sale commitment is outstanding, either equivalent deliverable securities or an offsetting TBA purchase commitment deliverable on or before the sale commitment date are held as “cover” for the transaction, or other liquid assets in an amount equal to the notional value of the TBA sale commitment are segregated. If the TBA sale commitment is closed through the acquisition of an offsetting TBA purchase commitment, the fund realizes a gain or loss. If the fund delivers securities under the commitment, the fund realizes a gain or a loss from the sale of the securities based upon the unit price established at the date the commitment was entered into.
TBA commitments, which are accounted for as purchase and sale transactions, may be considered securities themselves, and involve a risk of loss due to changes in the value of the security prior to the settlement date as well as the risk that the counterparty to the transaction will not perform its obligations. Counterparty risk is mitigated by having a master agreement between the fund and the counterparty.
Unsettled TBA commitments are valued at their fair value according to the procedures described under “Security valuation” above. The contract is marked to market daily and the change in fair value is recorded by the fund as an unrealized gain or loss. Based on market circumstances, Putnam Management will determine whether to take delivery of the underlying securities or to dispose of the TBA commitments prior to settlement.
TBA purchase commitments outstanding at period end, if any, are listed within the fund’s portfolio and TBA sale commitments outstanding at period end, if any, are listed after the fund’s portfolio.
Master agreements The fund is a party to ISDA (International Swaps and Derivatives Association, Inc.) Master Agreements that govern OTC derivative and foreign exchange contracts and Master Securities Forward Transaction Agreements that govern transactions involving mortgage-backed and other asset-backed securities that may result in delayed delivery (Master Agreements) with certain counterparties entered into from time to time. The Master Agreements may contain provisions regarding, among other things, the parties’ general obligations, representations, agreements, collateral requirements, events of default and early termination. With respect to certain counterparties, in accordance with the terms of the Master Agreements, collateral posted to the fund is held in a segregated account by the fund’s custodian and, with respect to those amounts which can be sold or repledged, are presented in the fund’s portfolio. Collateral posted to the fund which cannot be sold or repledged totaled $379,078 at the close of the reporting period.
Collateral pledged by the fund is segregated by the fund’s custodian and identified in the fund’s portfolio. Collateral can be in the form of cash or debt securities issued by the U.S. Government or related agencies or other securities as agreed to by the fund and the applicable counterparty. Collateral requirements are determined based on the fund’s net position with each counterparty.
With respect to ISDA Master Agreements, termination events applicable to the fund may occur upon a decline in the fund’s net assets below a specified threshold over a certain period of time. Termination events applicable to counterparties may occur upon a decline in the counterparty’s long-term or short-term credit ratings below a specified level. In each case, upon occurrence, the other party may elect to terminate early and cause settlement of all derivative and foreign exchange contracts outstanding, including the payment of any losses and costs resulting from such early termination, as reasonably determined by the terminating party. Any decision by one or more of the fund’s counterparties to elect early termination could impact the fund’s future derivative activity.
At the close of the reporting period, the fund had a net liability position of $728,999 on open derivative contracts subject to the Master Agreements. Collateral posted by the fund at period end for these agreements totaled $361,409 and may include amounts related to unsettled agreements.
Securities lending The fund may lend securities, through its agent, to qualified borrowers in order to earn additional income. The loans are collateralized by cash in an amount at least equal to the fair value of the securities loaned. The fair value of securities loaned is determined daily and any additional required collateral is allocated to the fund on the next business day. The remaining maturities of the securities lending transactions are considered overnight and continuous. The risk of borrower default will be borne by the fund’s agent; the fund will bear the risk of loss with respect to the investment of the cash collateral. Income from securities lending, net of expenses, is included in investment income on the Statement of operations. Cash collateral is invested in Putnam Cash Collateral Pool, LLC, a limited liability company managed by an affiliate of Putnam Management. Investments in Putnam Cash Collateral Pool, LLC are valued at its closing net asset value each business day. There
|
| George Putnam Balanced Fund 51 |
are no management fees charged to Putnam Cash Collateral Pool, LLC. At the close of the reporting period, the fund received cash collateral of$28,675,485 and the value of securities loaned amounted to $28,009,808.
Interfund lending The fund, along with other Putnam funds, may participate in an interfund lending program pursuant to an exemptive order issued by the SEC. This program allows the fund to borrow from or lend to other Putnam funds that permit such transactions. Interfund lending transactions are subject to each fund’s investment policies and borrowing and lending limits. Interest earned or paid on the interfund lending transaction will be based on the average of certain current market rates. During the reporting period, the fund did not utilize the program.
Lines of credit The fund participates, along with other Putnam funds, in a $317.5 million unsecured committed line of credit and a $235.5 million unsecured uncommitted line of credit, both provided by State Street. Borrowings may be made for temporary or emergency purposes, including the funding of shareholder redemption requests and trade settlements. Interest is charged to the fund based on the fund’s borrowing at a rate equal to the higher of (1) the Federal Funds rate and (2) the overnight LIBOR plus 1.25% for the committed line of credit and the Federal Funds rate plus 1.30% for the uncommitted line of credit. A closing fee equal to 0.04% of the committed line of credit plus a $25,000 flat fee and 0.04% of the uncommitted line of credit has been paid by the participating funds. In addition, a commitment fee of 0.21% per annum on any unutilized portion of the committed line of credit is allocated to the participating funds based on their relative net assets and paid quarterly. During the reporting period, the fund had no borrowings against these arrangements.
Federal taxes It is the policy of the fund to distribute all of its taxable income within the prescribed time period and otherwise comply with the provisions of the Internal Revenue Code of 1986, as amended (the Code), applicable to regulated investment companies. It is also the intention of the fund to distribute an amount sufficient to avoid imposition of any excise tax under Section 4982 of the Code.
The fund is subject to the provisions of Accounting Standards Codification 740 Income Taxes (ASC 740). ASC 740 sets forth a minimum threshold for financial statement recognition of the benefit of a tax position taken or expected to be taken in a tax return. The fund did not have a liability to record for any unrecognized tax benefits in the accompanying financial statements. No provision has been made for federal taxes on income, capital gains or unrealized appreciation on securities held nor for excise tax on income and capital gains. Each of the fund’s federal tax returns for the prior three fiscal years remains subject to examination by the Internal Revenue Service.
The fund may also be subject to taxes imposed by governments of countries in which it invests. Such taxes are generally based on either income or gains earned or repatriated. The fund accrues and applies such taxes to net investment income, net realized gains and net unrealized gains as income and/or capital gains are earned. In some cases, the fund may be entitled to reclaim all or a portion of such taxes, and such reclaim amounts, if any, are reflected as an asset on the fund’s books. In many cases, however, the fund may not receive such amounts for an extended period of time, depending on the country of investment.
At July 31, 2016, the fund had a capital loss carryover of $499,248,912 available to the extent allowed by the Code to offset future net capital gain, if any. For any carryover, the amount of the carryover and that carryover’s expiration date is:
| | | |
| Loss carryover |
|
| Short-term | Long-term | Total | Expiration |
|
| $499,248,912 | N/A | $499,248,912 | July 31, 2018 |
|
Under the Regulated Investment Company Modernization Act of 2010, the fund will be permitted to carry forward capital losses incurred in taxable years beginning after December 22, 2010 for an unlimited period. However, any losses incurred will be required to be utilized prior to the losses incurred in pre-enactment tax years. As a result of this ordering rule, pre-enactment capital loss carryforwards may be more likely to expire unused. Additionally, post-enactment capital losses that are carried forward will retain their character as either short-term or long-term capital losses rather than being considered all short-term as under previous law.
Pursuant to federal income tax regulations applicable to regulated investment companies, the fund has elected to defer certain capital losses of $9,744,154 recognized during the period between November 1, 2015 and July 31, 2016 to its fiscal year ending July 31, 2017.
The aggregate identified cost on a tax basis is $1,220,147,506, resulting in gross unrealized appreciation and depreciation of $108,138,723 and $28,503,209, respectively, or net unrealized appreciation of $79,635,514.
|
| 52 George Putnam Balanced Fund |
Distributions to shareholders Distributions to shareholders from net investment income are recorded by the fund on the ex-dividend date. Distributions from capital gains, if any, are recorded on the ex-dividend date and paid at least annually. The amount and character of income and gains to be distributed are determined in accordance with income tax regulations, which may differ from generally accepted accounting principles. Dividend sources are estimated at the time of declaration. Actual results may vary. Any non-taxable return of capital cannot be determined until final tax calculations are completed after the end of the fund’s fiscal year. Reclassifications are made to the fund’s capital accounts to reflect income and gains available for distribution (or available capital loss carryovers) under income tax regulations.
Note 2: Management fee, administrative services and other transactions
The fund pays Putnam Management a management fee (based on the fund’s average net assets and computed and paid monthly) at annual rates that may vary based on the average of the aggregate net assets of all open-end mutual funds sponsored by Putnam Management (excluding net assets of funds that are invested in, or that are invested in by, other Putnam funds to the extent necessary to avoid “double counting” of those assets). Such annual rates may vary as follows:
| | | | |
| 0.680% | of the first $5 billion, | | 0.480% | of the next $50 billion, |
| |
|
| 0.630% | of the next $5 billion, | | 0.460% | of the next $50 billion, |
| |
|
| 0.580% | of the next $10 billion, | | 0.450% | of the next $100 billion and |
| |
|
| 0.530% | of the next $10 billion, | | 0.445% | of any excess thereafter. |
For the reporting period, the management fee represented an effective rate (excluding the impact from any expense waivers in effect) of 0.265% of the fund’s average net assets.
Putnam Management has contractually agreed, through November 30, 2017, to waive fees or reimburse the fund’s expenses to the extent necessary to limit the cumulative expenses of the fund, exclusive of brokerage, interest, taxes, investment-related expenses, extraordinary expenses, acquired fund fees and expenses and payments under the fund’s investor servicing contract, investment management contract and distribution plans, on a fiscal year-to-date basis to an annual rate of 0.20% of the fund’s average net assets over such fiscal year-to-date period. During the reporting period, the fund’s expenses were not reduced as a result of this limit.
Putnam Investments Limited (PIL), an affiliate of Putnam Management, is authorized by the Trustees to manage a separate portion of the assets of the fund as determined by Putnam Management from time to time. PIL did not manage any portion of the assets of the fund during the reporting period. If Putnam Management were to engage the services of PIL, Putnam Management would pay a quarterly sub-management fee to PIL for its services at an annual rate of 0.40% of the average net assets of the portion of the fund managed by PIL.
The fund reimburses Putnam Management an allocated amount for the compensation and related expenses of certain officers of the fund and their staff who provide administrative services to the fund. The aggregate amount of all such reimbursements is determined annually by the Trustees.
Custodial functions for the fund’s assets are provided by State Street. Custody fees are based on the fund’s asset level, the number of its security holdings and transaction volumes. These fees are being paid by Putnam Management as part of the management contract.
Custodial functions for the fund’s assets are provided by State Street. Custody fees are based on the fund’s asset level, the number of its security holdings and transaction volumes.
Putnam Investor Services, Inc., an affiliate of Putnam Management, provides investor servicing agent functions to the fund. Putnam Investor Services, Inc. received fees for investor servicing for class A, class B, class C, class M, class R and class Y shares that included (1) a per account fee for each direct and underlying non-defined contribution account (“retail account”) of the fund; (2) a specified rate of the fund’s assets attributable to defined contribution plan accounts; and (3) a specified rate based on the average net assets in retail accounts. Putnam Investor Services, Inc. has agreed that the aggregate investor servicing fees for each fund’s retail and defined contribution accounts for these share classes will not exceed an annual rate of 0.25% of the fund’s average assets attributable to such accounts.
Class R5 shares paid a monthly fee based on the average net assets of class R5 shares at an annual rate of 0.15%. Class R6 shares paid a monthly fee based on the average net assets of class R6 shares at an annual rate of 0.05%.
|
| George Putnam Balanced Fund 53 |
Prior to September 1, 2016, Putnam Investor Services, Inc. received fees for investor servicing for class A, class B, class C, class M, class R and class Y shares that included (1) a per account fee for each retail account of the fund and each of the other funds in its specified category, which was totaled and then allocated to each fund in the category based on its average daily net assets; (2) a specified rate of the fund’s assets attributable to defined contribution plan accounts; and (3) a specified rate based on the average net assets in retail accounts. Prior to September 1, 2016, Putnam Investor Services, Inc. had agreed that the aggregate investor servicing fees for each fund’s retail and defined contribution accounts for these share classes would not exceed an annual rate of 0.320% of the fund’s average assets attributable to such accounts.
During the reporting period, the expenses for each class of shares related to investor servicing fees were as follows:
| | | | |
| Class A | $847,915 | | Class R5 | 48,691 |
| |
|
| Class B | 19,186 | | Class R6 | 2,516 |
| |
|
| Class C | 38,028 | | Class Y | 56,712 |
| |
|
| Class M | 59,757 | | Total | $1,073,258 |
| | | |
| Class R | 453 | | | |
| | | |
The fund has entered into expense offset arrangements with Putnam Investor Services, Inc. and State Street whereby Putnam Investor Services, Inc.’s and State Street’s fees are reduced by credits allowed on cash balances. The fund also reduced expenses through brokerage/service arrangements. For the reporting period, the fund’s expenses were reduced by $963 under the expense offset arrangements and by $6,496 under the brokerage/service arrangements.
Each Independent Trustee of the fund receives an annual Trustee fee, of which $953, as a quarterly retainer, has been allocated to the fund, and an additional fee for each Trustees meeting attended. Trustees also are reimbursed for expenses they incur relating to their services as Trustees.
The fund has adopted a Trustee Fee Deferral Plan (the Deferral Plan) which allows the Trustees to defer the receipt of all or a portion of Trustees fees payable on or after July 1, 1995. The deferred fees remain invested in certain Putnam funds until distribution in accordance with the Deferral Plan.
The fund has adopted an unfunded noncontributory defined benefit pension plan (the Pension Plan) covering all Trustees of the fund who have served as a Trustee for at least five years and were first elected prior to 2004. Benefits under the Pension Plan are equal to 50% of the Trustee’s average annual attendance and retainer fees for the three years ended December 31, 2005. The retirement benefit is payable during a Trustee’s lifetime, beginning the year following retirement, for the number of years of service through December 31, 2006. Pension expense for the fund is included in Trustee compensation and expenses in the Statement of operations. Accrued pension liability is included in Payable for Trustee compensation and expenses in the Statement of assets and liabilities. The Trustees have terminated the Pension Plan with respect to any Trustee first elected after 2003.
The fund has adopted distribution plans (the “Plans”) with respect to the following class shares pursuant to Rule 12b–1 under the Investment Company Act of 1940. The purpose of the Plans is to compensate Putnam Retail Management Limited Partnership, an indirect wholly-owned subsidiary of Putnam Investments, LLC, for services provided and expenses incurred in distributing shares of the fund. The Plans provide payments by the fund to Putnam Retail Management Limited Partnership at an annual rate of up to the following amounts (“Maximum %”) of the average net assets attributable to each class. The Trustees have approved payment by the fund at the following annual rate (“Approved %”) of the average net assets attributable to each class. During the reporting period, the class-specific expenses related to distribution fees were as follows:
| | | |
| | Maximum % | Approved % | Amount |
|
| Class A | 0.35% | 0.25% | $1,182,358 |
|
| Class B | 1.00% | 1.00% | 107,013 |
|
| Class C | 1.00% | 1.00% | 212,028 |
|
| Class M | 1.00% | 0.75% | 249,986 |
|
| Class R | 1.00% | 0.50% | 1,262 |
|
| Total | | | $1,752,647 |
|
| 54 George Putnam Balanced Fund |
For the reporting period, Putnam Retail Management Limited Partnership, acting as underwriter, received net commissions of $34,422 and $704 from the sale of class A and class M shares, respectively, and received $4,721 and $739 in contingent deferred sales charges from redemptions of class B and class C shares, respectively.
A deferred sales charge of up to 1.00% is assessed on certain redemptions of class A shares. For the reporting period, Putnam Retail Management Limited Partnership, acting as underwriter, received $32 on class A redemptions.
Note 3: Purchases and sales of securities
During the reporting period, the cost of purchases and the proceeds from sales, excluding short-term investments, were as follows:
| | |
| | Cost of purchases | Proceeds from sales |
|
| Investments in securities, including TBA commitments (Long-term) | $990,657,486 | $1,045,845,360 |
|
| U.S. government securities (Long-term) | 49,285,287 | 61,403,383 |
|
| Total | $1,039,942,773 | $1,107,248,743 |
The fund may purchase or sell investments from or to other Putnam funds in the ordinary course of business, which can reduce the fund’s transaction costs, at prices determined in accordance with SEC requirements and policies approved by the Trustees. During the reporting period, purchases or sales of long-term securities from or to other Putnam funds, if any, did not represent more than 5% of the fund’s total cost of purchases and/or total proceeds from sales.
Note 4: Capital shares
At the close of the reporting period, there were an unlimited number of shares of beneficial interest authorized. Transactions in capital shares were as follows:
| | | | |
| | SIX MONTHS ENDED 1/31/17 | YEAR ENDED 7/31/16 |
| Class A | Shares | Amount | Shares | Amount |
|
| Shares sold | 1,046,456 | $18,305,920 | 2,585,466 | $42,620,286 |
|
| Shares issued in connection with | | | | |
| reinvestment of distributions | 298,199 | 5,175,170 | 635,462 | 10,433,690 |
|
| | 1,344,655 | 23,481,090 | 3,220,928 | 53,053,976 |
|
| Shares repurchased | (3,448,496) | (60,225,141) | (6,444,498) | (106,322,090) |
|
| Net decrease | (2,103,841) | $(36,744,051) | (3,223,570) | $(53,268,114) |
| |
| | SIX MONTHS ENDED 1/31/17 | YEAR ENDED 7/31/16 |
| Class B | Shares | Amount | Shares | Amount |
|
| Shares sold | 95,721 | $1,652,726 | 200,145 | $3,264,784 |
|
| Shares issued in connection with | | | | |
| reinvestment of distributions | 2,741 | 47,086 | 5,963 | 97,029 |
|
| | 98,462 | 1,699,812 | 206,108 | 3,361,813 |
|
| Shares repurchased | (152,337) | (2,631,822) | (367,448) | (5,977,728) |
|
| Net decrease | (53,875) | $(932,010) | (161,340) | $(2,615,915) |
|
| George Putnam Balanced Fund 55 |
| | | | |
| | SIX MONTHS ENDED 1/31/17 | YEAR ENDED 7/31/16 |
| Class C | Shares | Amount | Shares | Amount |
|
| Shares sold | 276,879 | $4,824,450 | 885,692 | $14,594,654 |
|
| Shares issued in connection with | | | | |
| reinvestment of distributions | 4,720 | 81,455 | 10,397 | 169,838 |
|
| | 281,599 | 4,905,905 | 896,089 | 14,764,492 |
|
| Shares repurchased | (231,268) | (4,014,832) | (627,298) | (10,291,137) |
|
| Net increase | 50,331 | $891,073 | 268,791 | $4,473,355 |
| |
| | SIX MONTHS ENDED 1/31/17 | YEAR ENDED 7/31/16 |
| Class M | Shares | Amount | Shares | Amount |
|
| Shares sold | 223,242 | $3,870,446 | 291,292 | $4,736,923 |
|
| Shares issued in connection with | | | | |
| reinvestment of distributions | 13,853 | 237,364 | 30,784 | 499,259 |
|
| | 237,095 | 4,107,810 | 322,076 | 5,236,182 |
|
| Shares repurchased | (286,703) | (4,931,928) | (860,422) | (13,953,965) |
|
| Net decrease | (49,608) | $(824,118) | (538,346) | $(8,717,783) |
| |
| | SIX MONTHS ENDED 1/31/17 | YEAR ENDED 7/31/16 |
| Class R | Shares | Amount | Shares | Amount |
|
| Shares sold | 24,918 | $435,002 | 24,807 | $410,071 |
|
| Shares issued in connection with | | | | |
| reinvestment of distributions | 118 | 2,051 | 305 | 4,969 |
|
| | 25,036 | 437,053 | 25,112 | 415,040 |
|
| Shares repurchased | (9,867) | (172,172) | (65,752) | (1,077,168) |
|
| Net increase (decrease) | 15,169 | $264,881 | (40,640) | $(662,128) |
| |
| | SIX MONTHS ENDED 1/31/17 | YEAR ENDED 7/31/16 |
| Class R5 | Shares | Amount | Shares | Amount |
|
| Shares sold | 301,980 | $5,272,799 | 959,785 | $15,911,788 |
|
| Shares issued in connection with | | | | |
| reinvestment of distributions | 32,487 | 565,755 | 62,403 | 1,028,461 |
|
| | 334,467 | 5,838,554 | 1,022,188 | 16,940,249 |
|
| Shares repurchased | (4,727,648) | (83,905,117) | (773,902) | (12,818,389) |
|
| Net increase (decrease) | (4,393,181) | $(78,066,563) | 248,286 | $4,121,860 |
| |
| | SIX MONTHS ENDED 1/31/17 | YEAR ENDED 7/31/16 |
| Class R6 | Shares | Amount | Shares | Amount |
|
| Shares sold | 477,727 | $8,315,850 | 1,894,887 | $30,556,270 |
|
| Shares issued in connection with | | | | |
| reinvestment of distributions | 3,544 | 61,724 | 22,331 | 366,668 |
|
| | 481,271 | 8,377,574 | 1,917,218 | 30,922,938 |
|
| Shares repurchased | (208,260) | (3,721,732) | (1,934,837) | (32,250,486) |
|
| Net increase (decrease) | 273,011 | $4,655,842 | (17,619) | $(1,327,548) |
|
| 56 George Putnam Balanced Fund |
| | | | |
| | SIX MONTHS ENDED 1/31/17 | YEAR ENDED 7/31/16 |
| Class Y | Shares | Amount | Shares | Amount |
|
| Shares sold | 810,116 | $14,088,845 | 1,659,173 | $27,671,572 |
|
| Shares issued in connection with | | | | |
| reinvestment of distributions | 24,622 | 428,837 | 76,694 | 1,262,449 |
|
| | 834,738 | 14,517,682 | 1,735,867 | 28,934,021 |
|
| Shares repurchased | (409,299) | (7,193,796) | (5,045,595) | (82,593,628) |
|
| Net increase (decrease) | 425,439 | $7,323,886 | (3,309,728) | $(53,659,607) |
At the close of the reporting period, Putnam Investments, LLC owned the following shares of the fund:
| | | |
| | Shares owned | Percentage of ownership | Value |
|
| Class R5 | 684 | 100% | $12,335 |
|
| Class R6 | 686 | 0.09 | 12,375 |
Note 5: Affiliated transactions
Transactions during the reporting period with any company which is under common ownership or control were as follows:
| | | | | |
| | Fair value at | | | | |
| | the beginning | | | | Fair value at |
| | of the | | | | the end of the |
| | reporting | | | Investment | reporting |
| Name of affiliate | period | Purchase cost | Sale proceeds | income | period |
|
| Putnam Cash Collateral | | | | | |
| Pool, LLC* | $— | $122,563,826 | $93,888,341 | $54,542 | $28,675,485 |
|
| Putnam Short Term | | | | | |
| Investment Fund** | 85,041,084 | 127,053,427 | 134,527,042 | 212,485 | 77,567,469 |
|
| Totals | $85,041,084 | $249,617,253 | $228,415,383 | $267,027 | $106,242,954 |
* No management fees are charged to Putnam Cash Collateral Pool, LLC (Note 1).
** Management fees charged to Putnam Short Term Investment Fund have been waived by Putnam Management.
Note 6: Market, credit and other risks
In the normal course of business, the fund trades financial instruments and enters into financial transactions where risk of potential loss exists due to changes in the market (market risk) or failure of the contracting party to the transaction to perform (credit risk). The fund may be exposed to additional credit risk that an institution or other entity with which the fund has unsettled or open transactions will default. Investments in foreign securities involve certain risks, including those related to economic instability, unfavorable political developments, and currency fluctuations. The fund may invest a significant portion of its assets in securitized debt instruments, including mortgage-backed and asset-backed investments. The yields and values of these investments are sensitive to changes in interest rates, the rate of principal payments on the underlying assets and the market’s perception of the issuers. The market for these investments may be volatile and limited, which may make them difficult to buy or sell.
Note 7: Summary of derivative activity
The volume of activity for the reporting period for any derivative type that was held during the period is listed below and was based on an average of the holdings at the end of each fiscal quarter:
| |
| Forward currency contracts (contract amount) | $42,600,000 |
|
|
| George Putnam Balanced Fund 57 |
The following is a summary of the fair value of derivative instruments as of the close of the reporting period:
| | | | |
| Fair value of derivative instruments as of the close of the reporting period | |
|
| | ASSET DERIVATIVES | LIABILITY DERIVATIVES |
|
| Derivatives not | | | | |
| accounted for as | Statement of | | Statement of | |
| hedging instruments | assets and | | assets and | |
| under ASC 815 | liabilities location | Fair value | liabilities location | Fair value |
|
| Foreign exchange | | | | |
| contracts | Receivables | $256,836 | Payables | $805,321 |
|
| Total | | $256,836 | | $805,321 |
The following is a summary of realized and change in unrealized gains or losses of derivative instruments in the Statement of operations for the reporting period (Note 1):
| | |
| Amount of realized gain or (loss) on derivatives recognized in net gain or (loss) on investments | |
|
| Derivatives not accounted for as | Forward currency | |
| hedging instruments under ASC 815 | contracts | Total |
|
| Foreign exchange contracts | $1,810,094 | $1,810,094 |
|
| Total | $1,810,094 | $1,810,094 |
| | |
| Change in unrealized appreciation or (depreciation) on derivatives recognized in net gain or (loss) |
| on investments | | |
|
| Derivatives not accounted for as | Forward currency | |
| hedging instruments under ASC 815 | contracts | Total |
|
| Foreign exchange contracts | $(1,163,996) | $(1,163,996) |
|
| Total | $(1,163,996) | $(1,163,996) |
Note 8: New pronouncements
In October 2016, the SEC adopted amendments to rules under the Investment Company Act of 1940 (“final rules”) intended to modernize the reporting and disclosure of information by registered investment companies. The final rules amend Regulation S-X and require funds to provide standardized, enhanced derivative disclosure in fund financial statements in a format designed for individual investors. The amendments to Regulation S-X also update the disclosures for other investments and investments in and advances to affiliates and amend the rules regarding the general form and content of fund financial statements. The compliance date for the amendments to Regulation S-X is August 1, 2017. Putnam Management is currently evaluating the amendments and their impact, if any, on the fund’s financial statements.
|
| 58 George Putnam Balanced Fund |
Note 9: Offsetting of financial and derivative assets and liabilities
The following table summarizes any derivatives, repurchase agreements and reverse repurchase agreements, at the end of the reporting period, that are subject to an enforceable master netting agreement or similar agreement. For securities lending transactions or borrowing transactions associated with securities sold short, if any, see Note 1. For financial reporting purposes, the fund does not offset financial assets and financial liabilities that are subject to the master netting agreements in the Statement of assets and liabilities.
| | | | | | | | | |
| | | | | | Goldman | JPMorgan | State Street | | |
| | Bank of | Barclays Bank | | Credit Suisse | Sachs | Chase Bank | Bank and | | |
| | America N.A. | PLC | Citibank, N.A. | International | International | N.A. | Trust Co. | UBS AG | Total |
|
| Assets: | | | | | | | | | |
|
| Forward currency contracts # | — | — | — | 37,751 | 201,524 | — | — | 17,561 | 256,836 |
|
| Total Assets | $— | $— | $— | $37,751 | $201,524 | $— | $— | $17,561 | $256,836 |
|
| Liabilities: | | | | | | | | | |
|
| Forward currency contracts # | 103,761 | 90,902 | 208,466 | 54,420 | 38,571 | 259,758 | 49,443 | — | 805,321 |
|
| Total Liabilities | $103,761 | $90,902 | $208,466 | $54,420 | $38,571 | $259,758 | $49,443 | $— | $805,321 |
|
| Total Financial and Derivative | $(103,761) | $(90,902) | $(208,466) | $(16,669) | $162,953 | $(259,758) | $(49,443) | $17,561 | $(548,485) |
| Net Assets | | | | | | | | | |
|
| Total collateral received (pledged)†## | $(103,761) | $— | $(111,842) | $— | $162,953 | $(123,215) | $— | $17,561 | |
|
| Net amount | $— | $(90,902) | $(96,624) | $(16,669) | $— | $(136,543) | $(49,443) | $— | |
† Additional collateral may be required from certain brokers based on individual agreements.
# Covered by master netting agreement (Note 1).
## Any over-collateralization of total financial and derivative net assets is not shown. Collateral may include amounts related to unsettled agreements.
|
| George Putnam Balanced Fund 59 |
Services for shareholders
Investor services
Systematic investment plan Tell us how much you wish to invest regularly — weekly, semimonthly, or monthly — and the amount you choose will be transferred automatically from your checking or savings account. There’s no additional fee for this service, and you can suspend it at any time. This plan may be a great way to save for college expenses or to plan for your retirement.
Please note that regular investing does not guarantee a profit or protect against loss in a declining market. Before arranging a systematic investment plan, consider your financial ability to continue making purchases in periods when prices are low.
Systematic exchange You can make regular transfers from one Putnam fund to another Putnam fund. There are no additional fees for this service, and you can cancel or change your options at any time.
Dividends PLUS You can choose to have the dividend distributions from one of your Putnam funds automatically reinvested in another Putnam fund at no additional charge.
Free exchange privilege You can exchange money between Putnam funds free of charge, as long as they are the same class of shares. A signature guarantee is required if you are exchanging more than $500,000. The fund reserves the right to revise or terminate the exchange privilege.
Reinstatement privilege If you’ve sold Putnam shares or received a check for a dividend or capital gain, you may reinvest the proceeds with Putnam within 90 days of the transaction and they will be reinvested at the fund’s current net asset value — with no sales charge. However, reinstatement of class B shares may have special tax consequences. Ask your financial or tax representative for details.
Check-writing service You have ready access to many Putnam accounts. It’s as simple as writing a check, and there are no special fees or service charges. For more information about the check-writing service, call Putnam or visit our website.
Dollar cost averaging When you’re investing for long-term goals, it’s time, not timing, that counts. Investing on a systematic basis is a better strategy than trying to figure out when the markets will go up or down. This means investing the same amount of money regularly over a long period. This method of investing is called dollar cost averaging. When a fund’s share price declines, your investment dollars buy more shares at lower prices. When it increases, they buy fewer shares. Over time, you will pay a lower average price per share.
For more information
Visit the Individual Investors section at putnam.com A secure section of our website contains complete information on your account, including balances and transactions, updated daily. You may also conduct transactions, such as exchanges, additional investments, and address changes. Log on today to get your password.
Call us toll free at 1-800-225-1581 Ask a helpful Putnam representative or your financial advisor for details about any of these or other services, or see your prospectus.
|
| 60 George Putnam Balanced Fund |
Fund information
Founded over 75 years ago, Putnam Investments was built around the concept that a balance between risk and reward is the hallmark of a well-rounded financial program. We manage over 100 funds across income, value, blend, growth, asset allocation, absolute return, and global sector categories.
| | |
| Investment Manager | Trustees | James F. Clark |
| Putnam Investment | Jameson A. Baxter, Chair | Vice President and |
| Management, LLC | Kenneth R. Leibler, Vice Chair | Chief Compliance Officer |
| One Post Office Square | Liaquat Ahamed | |
| Boston, MA 02109 | Ravi Akhoury | Michael J. Higgins |
| | Barbara M. Baumann | Vice President, Treasurer, |
| Investment Sub-Advisor | Robert J. Darretta | and Clerk |
| Putnam Investments Limited | Katinka Domotorffy | |
| 57–59 St James’s Street | Catharine Hill | Janet C. Smith |
| London, England SW1A 1LD | John A. Hill | Vice President, |
| | Paul L. Joskow | Principal Financial Officer, |
| Marketing Services | Robert E. Patterson | Principal Accounting Officer, |
| Putnam Retail Management | George Putnam, III | and Assistant Treasurer |
| One Post Office Square | Robert L. Reynolds | |
| Boston, MA 02109 | Manoj Singh | Susan G. Malloy |
| | W. Thomas Stephens | Vice President and |
| Custodian | | Assistant Treasurer |
| State Street Bank | Officers | |
| and Trust Company | Robert L. Reynolds | Mark C. Trenchard |
| | President | Vice President and |
| Legal Counsel | | BSA Compliance Officer |
| Ropes & Gray LLP | Jonathan S. Horwitz | |
| | Executive Vice President, | Nancy E. Florek |
| | Principal Executive Officer, | Vice President, Director of |
| | and Compliance Liaison | Proxy Voting and Corporate |
| | | Governance, Assistant Clerk, |
| | Robert T. Burns | and Associate Treasurer |
| | Vice President and | |
| | Chief Legal Officer | |
This report is for the information of shareholders of George Putnam Balanced Fund. It may also be used as sales literature when preceded or accompanied by the current prospectus, the most recent copy of Putnam’s Quarterly Performance Summary, and Putnam’s Quarterly Ranking Summary. For more recent performance, please visit putnam.com. Investors should carefully consider the investment objectives, risks, charges, and expenses of a fund, which are described in its prospectus. For this and other information or to request a prospectus or summary prospectus, call 1-800-225-1581 toll free. Please read the prospectus carefully before investing. The fund’s Statement of Additional Information contains additional information about the fund’s Trustees and is available without charge upon request by calling 1-800-225-1581.

| |
|
Item 3. Audit Committee Financial Expert: |
| |
|
Item 4. Principal Accountant Fees and Services: |
| |
|
Item 5. Audit Committee of Listed Registrants |
| |
|
Item 6. Schedule of Investments: |
| |
| The registrant's schedule of investments in unaffiliated issuers is included in the report to shareholders in Item 1 above. |
| |
|
Item 7. Disclosure of Proxy Voting Policies and Procedures For Closed-End Management Investment Companies: |
| |
|
Item 8. Portfolio Managers of Closed-End Investment Companies |
| |
|
Item 9. Purchases of Equity Securities by Closed-End Management Investment Companies and Affiliated Purchasers: |
| |
|
Item 10. Submission of Matters to a Vote of Security Holders: |
| |
|
Item 11. Controls and Procedures: |
| |
| (a) The registrant's principal executive officer and principal financial officer have concluded, based on their evaluation of the effectiveness of the design and operation of the registrant's disclosure controls and procedures as of a date within 90 days of the filing date of this report, that the design and operation of such procedures are generally effective to provide reasonable assurance that information required to be disclosed by the registrant in this report is recorded, processed, summarized and reported within the time periods specified in the Commission's rules and forms. |
| |
| (b) Changes in internal control over financial reporting: Not applicable |
| |
| (a)(2) Separate certifications for the principal executive officer and principal financial officer of the registrant as required by Rule 30a-2(a) under the Investment Company Act of 1940, as amended, are filed herewith. |
| |
| (b) The certifications required by Rule 30a-2(b) under the Investment Company Act of 1940, as amended, are filed herewith. |
| |
| Pursuant to the requirements of the Securities Exchange Act of 1934 and the Investment Company Act of 1940, the registrant has duly caused this report to be signed on its behalf by the undersigned, thereunto duly authorized. |
| |
| George Putnam Balanced Fund |
| |
| By (Signature and Title): |
| |
| /s/ Janet C. Smith
Janet C. Smith
Principal Accounting Officer
|
| |
| Pursuant to the requirements of the Securities Exchange Act of 1934 and the Investment Company Act of 1940, this report has been signed below by the following persons on behalf of the registrant and in the capacities and on the dates indicated. |
| |
| By (Signature and Title): |
| |
| /s/ Jonathan S. Horwitz
Jonathan S. Horwitz
Principal Executive Officer
|
| |
| By (Signature and Title): |
| |
| /s/ Janet C. Smith
Janet C. Smith
Principal Financial Officer
|