| | | |
| UNITED STATES |
| SECURITIES AND EXCHANGE COMMISSION |
| Washington, D.C. 20549 |
| |
| FORM N-CSR |
|
| CERTIFIED SHAREHOLDER REPORT OF REGISTERED |
| MANAGEMENT INVESTMENT COMPANIES |
| |
| Investment Company Act file number: (811-00058) |
| |
| Exact name of registrant as specified in charter: | George Putnam Balanced Fund | |
| |
| Address of principal executive offices: One Post Office Square, Boston, Massachusetts 02109 |
| |
| Name and address of agent for service: | Beth S. Mazor, Vice President |
| | One Post Office Square |
| | Boston, Massachusetts 02109 |
| | |
| Copy to: | John W. Gerstmayr, Esq. |
| | Ropes & Gray LLP |
| | One International Place |
| | Boston, Massachusetts 02110 |
| | |
| Registrant’s telephone number, including area code: | (617) 292-1000 | | |
| |
| Date of fiscal year end: July 31, 2010 | |
| | |
| Date of reporting period: August 1, 2009—July 31, 2010 |
Item 1. Report to Stockholders:
The following is a copy of the report transmitted to stockholders pursuant to Rule 30e-1 under the Investment Company Act of 1940:
George Putnam
Balanced
Fund*
Annual report
7 | 31 | 10
| | | |
| Message from the Trustees | 1 | | |
| | |
| About the fund | 2 | | |
| | |
| Performance snapshot | 4 | | |
| | |
| Interview with your fund’s portfolio managers | 5 | | |
| | |
| Your fund’s performance | 10 | | |
| | |
| Your fund’s expenses | 13 | | |
| | |
| Terms and definitions | 15 | | |
| | |
| Trustee approval of management contract | 16 | | |
| | |
| Other information for shareholders | 21 | | |
| | |
| Financial statements | 22 | | |
| | |
| Federal tax information | 60 | | |
| | |
| Shareholder meeting results | 61 | | |
| | |
| About the Trustees | 62 | | |
| | |
| Officers | 64 | | |
| | |
* The George Putnam Fund of Boston d/b/a George Putnam Balanced Fund.
Message from the Trustees
Dear Fellow Shareholder:
The U.S. economic recovery continues to face head winds, constrained by a lack of new jobs, weak housing sales, and tight credit markets. While fixed-income securities have enjoyed strong performance so far in 2010, volatility has returned to the equity markets. Patient investors understand that such periods of uncertainty can also present opportunities. In July, for instance, the S&P 500 Index rebounded 6.9%, delivering its best monthly performance in a year and reversing two straight months of declines.
Compared with 2009’s bull market, today’s investment climate requires a greater degree of investment skill, innovation, and expertise. We believe Putnam’s risk-focused, active-management approach is well-suited for conditions like these.
In developments affecting oversight of your fund, Barbara M. Baumann has been elected to the Board of Trustees of the Putnam Funds, effective July 1, 2010. Ms. Baumann is president and owner of Cross Creek Energy Corporation of Denver, Colorado, a strategic consultant to domestic energy firms and direct investor in energy assets. We also want to thank Elizabeth T. Kennan, who has retired from the Board of Trustees, for her many years of dedicated and thoughtful leadership.
Lastly, we would like to take this opportunity to welcome new shareholders to the fund and to thank all of our investors for your continued confidence in Putnam.

About the fund
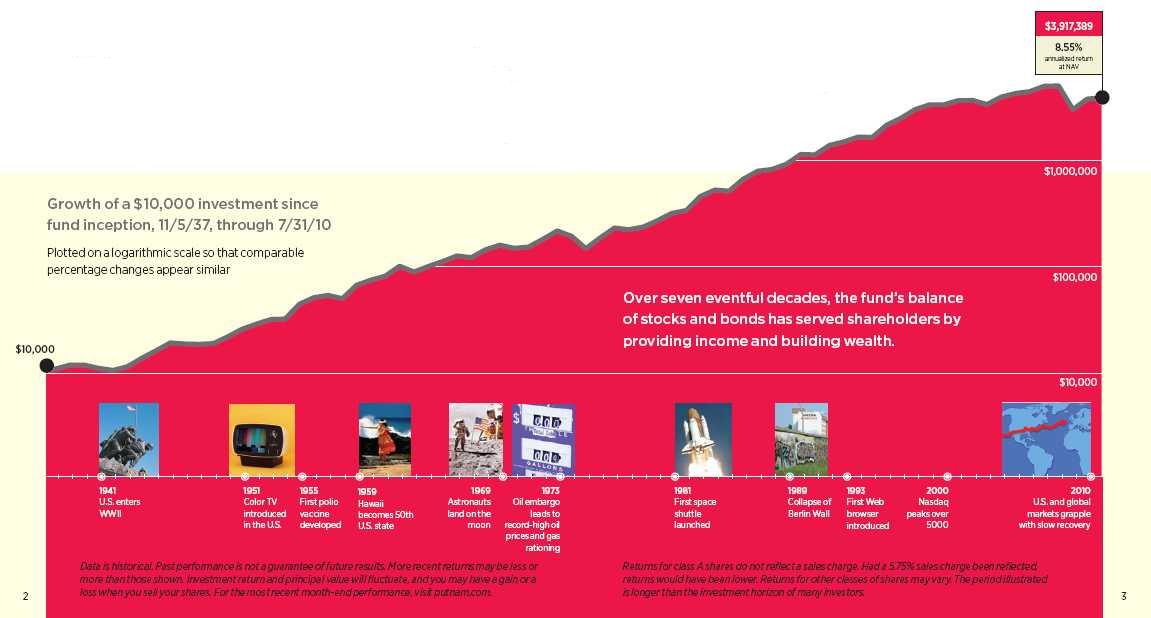
Providing the benefits of balanced investing for over 70 years
The fund launched in 1937 when George Putnam, a Boston investment manager, decided to introduce an innovative approach — a balance of stocks to seek capital appreciation and bonds to help provide current income. The original portfolio featured industrial stocks, such as U.S. Smelting, Refining, & Mining Co., and railroad bonds.
This balanced approach made sense then, and we believe it continues to make sense now. In the late 1930s, the stock market experienced dramatic swings as businesses struggled to recover from the Great Depression and the shadow of war began to spread across Europe and Asia. Today, the credit crisis and economic uncertainties also challenge investors.
Although the fund has experienced volatility at times, its balanced approach has kept it on course. When stocks were weak, the fund’s bonds helped results. Similarly, stocks have often performed better when bonds were hurt by rising interest rates or inflation.
In a letter to shareholders dated July 12, 1938, George Putnam articulated the balanced strategy this way: “Successful investing calls not so much for some clairvoyant ability to read the future as for the courage to stick to tested, commonsense policies in the face of the unreliable emotional stresses and strains that constantly sweep the market place.”
Putnam remains committed to this prudent approach to investing today.
Consider these risks before investing: The fund may invest a portion of its assets in small and/or midsize companies. Such investments increase the risk of greater price fluctuations. Funds that invest in government securities are not guaranteed. Mortgage-backed securities are subject to prepayment risk. The use of derivatives involves special risks and may result in losses. Value stocks may fail to rebound, and the market may not favor value-style investing. Funds that invest in bonds are subject to certain risks including interest-rate risk, credit risk, and inflation risk. As interest rates rise, the prices of bonds fall. Long-term bonds are more exposed to interest-rate risk than short-term bonds. Unlike bonds, bond funds have ongoing fees and expenses.
Current performance may be lower or higher than the quoted past performance, which cannot guarantee future results. Share price, principal value, and return will fluctuate, and you may have a gain or a loss when you sell your shares. Performance of class A shares assumes reinvestment of distributions and does not account for taxes. Fund returns in the bar chart do not reflect a sales charge of 5.75%; had they, returns would have been lower. See pages 5 and 10–12 for additional performance information. For a portion of the periods, the fund had expense limitations, without which returns would have been lower. To obtain the most recent month-end performance, visit putnam.com.
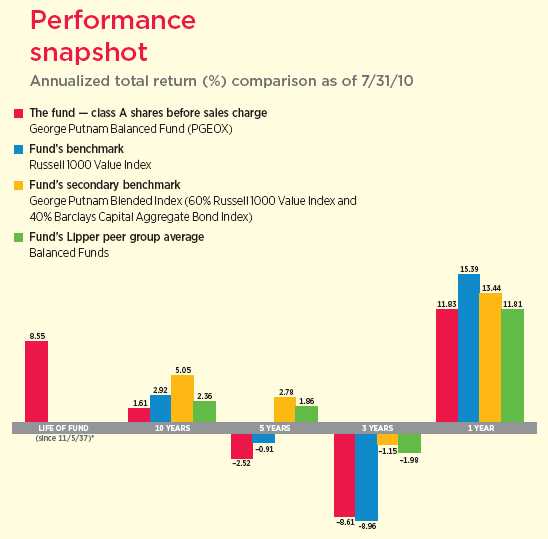
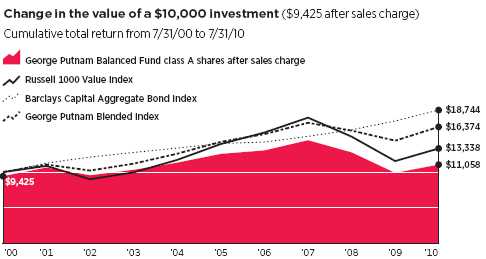
George Putnam Blended Index is an unmanaged index administered by Putnam Management, 60% of which is based on the Russell 1000 Value Index and 40% of which is based on the Barclays Capital Aggregate Bond Index.
* The fund’s benchmarks (Russell 1000 Value Index and George Putnam Blended Index) were introduced on 12/31/78, and its Lipper group (Balanced Funds) was introduced on 12/31/59; they all post-date the inception of the fund’s class A shares.
4
Interview with your fund’s portfolio managers
David Calabro and Raman Srivastava
How did George Putnam Balanced Fund perform over the fiscal year?
David: For the 12 months ended July 31, 2010, George Putnam Balanced Fund’s class A shares posted a gain of 11.83%, which was in line with the 11.81% return of the average fund in the Lipper Balanced Funds category. Although the past year was generally a strong period for stocks, the fund lagged the 15.39% return of the Russell 1000 Value Index as well as the 13.44% return of the fund’s custom blended benchmark.
How was the stock market environment during the period?
David: The stock market continued to rebound in the second half of 2009 and into the beginning of 2010. Valuations appeared unreasonably low at the time, given the strong cash flows companies were posting over the past 12 months. However, in April and May a number of significant structural challenges facing the market came to a head, including a sovereign debt crisis in Europe and a realization that the global economic recovery was losing some of its steam. The United States is facing record federal budget deficits, and consumers are still coping with high unemployment and a weak housing market. Although on the whole the past 12 months were solidly positive for equities, since April, there has been a great deal more volatility in the stock market, and I would expect that trend to continue until the economy finds more solid footing.
What was the mood in the bond markets?
Raman: Performance in the fixed-income markets was solid throughout the fiscal year. There was high demand in certain sectors, particularly in Treasuries and certain mortgage-backed securities, driven in no small part by the Federal Reserve’s targeted purchase programs and the general expansion of its balance sheet. Factors that David mentioned — the return of
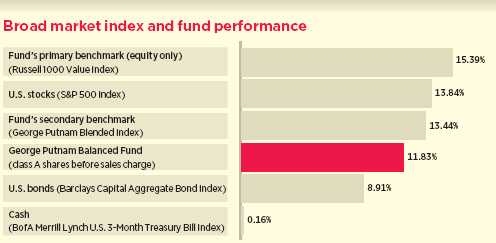
This comparison shows your fund’s performance in the context of broad market indexes for the 12 months ended 7/31/10. See pages 4 and 10–12 for additional fund performance information. Index descriptions can be found on page 15.
5
volatility to the stock markets and the selloff in European debt — further increased demand for high-quality U.S. fixed-income securities. The fund had concentrated investments in those types of bonds, and this helped performance.
Can you tell us more about how the portfolio is constructed and the fund’s overall investment philosophy?
Raman: As one of the first balanced funds in the mutual fund industry, the fund has a decades-long commitment to the strategy of diversification across stocks and bonds, which allows us to pursue both capital growth and current income. The fixed-income portion of the fund, which typically represents about 40% of net assets, is designed to counterbalance the risk entailed in the equity side of the portfolio. We’re not looking specifically for bonds that offer the potential for capital appreciation, but rather we focus on high-quality securities with attractive income characteristics that can help make the fund less volatile over time than an all-stock portfolio. That said, we believe our investment process can identify opportunities to add value to the fund beyond what would be achieved by an allocation to the broad-based bond market, as represented by the Barclay s Capital Aggregate Bond Index. We use sector rotation and security selection to seek to enhance returns in our corporate bond holdings, meaning we’ll target different types of companies depending on where in the cycle the economy is. We’ll also emphasize different areas of the yield curve — meaning an increase or decrease in the fund’s exposure to securities of certain maturities — depending on where we find the most attractive valuations. During the past fiscal year, both of these strategies contributed positively to returns, and also increased the fund’s turnover.
David: On the equity side of the portfolio we seek out large-company stocks with attractive valuations, strong balance sheets, healthy cash flows, and, whenever possible, compelling dividend yields. Recently, we’ve been focusing on multinational companies that in our view offer the potential to weather these challenging economic conditions better than their competition. With consumer spending as uneven and unpredictable as it’s been, we favor companies that are dominant
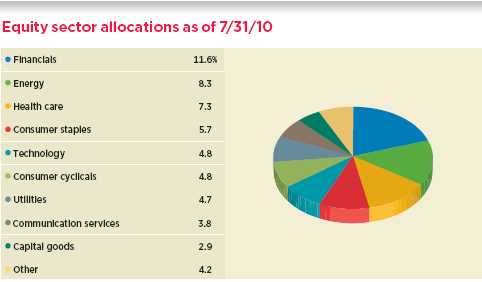
Allocations are represented as a percentage of the fund’s net assets. Holdings and allocations may vary over time.
Within the past six months, the methodology used for the calculation and disclosure of this data has changed.
6

players in their respective industries and have the potential to continue to grow earnings without being dependent on an acceleration in the pace of the current economic recovery.
What specific stocks helped performance?
David: PNC Financial Services was one of the fund’s top contributors. Financial stocks in general posted strong performance over the year and regional banks like PNC were among the sector’s top performers. The company improved its earnings considerably during the period, and the market took notice.
United Technologies was another strong performer. The company is an industrial conglomerate that makes capital goods and owns such brands as Carrier, the heating and air-conditioning company, and Pratt & Whitney, the aircraft engine manufacturer.
Capital goods was the best-performing sector in the benchmark index over the period, in many ways reflecting the strong financial condition of corporations globally, which contrasts with the more challenging outlook for consumers. Our overweight position in United Technologies, which also saw improved earnings over the past year, boosted returns.
Finally, Equity Residential, a property development and management company, contributed positively to performance. The company focuses on apartment properties in large metropolitan areas. Despite this attractive real estate portfolio, the stock sold off dramatically with the rest of the real estate sector in late 2008 and early 2009. We established our position in the company at these depressed prices throughout the first half of 2009, and the stock has rallied considerably since then. We’ve trimmed our position at these higher price levels to lock in profits for the fund.
Which holdings detracted from returns?
David: Many of the fund’s biggest detractors were names in the health-care industry, including Baxter International, a medical
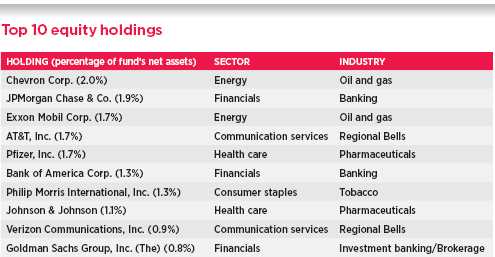
This table shows the fund’s top 10 equity holdings and the percentage of the fund’s net assets that each represented as of 7/31/10. Short-term holdings are excluded. Holdings will vary over time.
7
products and pharmaceuticals company, and Boston Scientific, a medical devices manufacturer. The health-care sector generally lagged the market, particularly in the second half of 2009, as investors sold out of this relatively defensive industry and moved into more cyclical, economically sensitive areas that offered bigger potential gains. In March 2010, after months of debate, Congress passed sweeping health-care reform, which ultimately will mean increased regulation for the industry. We felt that prices of health-care stocks already tended to reflect these changes, but beginning in April the sector trended lower as valuations continued to compress.
The oil and gas industry was another area that detracted from returns. Companies in the sector sold off dramatically after the Gulf oil spill, and our positions in BP and Total declined. We still hold Total, but sold our position in BP before the end of the period.
How does the fund use derivatives, if at all?
David: Derivatives generally aren’t used on the equity side of the portfolio. We believe we can achieve the fund’s objectives by owning stocks directly.
Raman: Certain derivatives were used over the period as a means of risk management. However, looking ahead, we generally do not expect to use derivatives in the fixed-income portion of the fund.
What is your outlook?
Raman: The structural challenges facing economies in the United States and abroad are significant and shouldn’t be discounted. While we believe a “double-dip” recession is doubtful, the recovery in the United States is likely to be slow and uncertain. The unemployment rate could remain high for quite some time as companies continue to favor the flexibility that comes with having large volumes of cash on hand. Within the bond markets, yields — which move in the opposite direction of bond prices — are unlikely to get significantly lower in the coming months. Adding value in such an environment will hinge on our ability to successfully navigate non-government-supported sectors of the market to uncover opportunities.
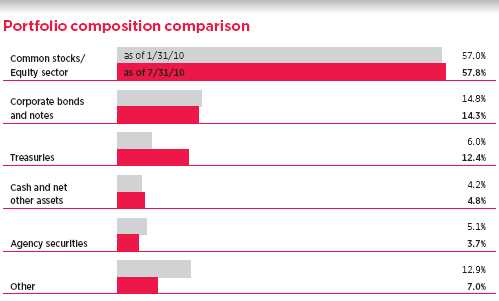
This chart shows how the fund’s top weightings have changed over the past six months. Weightings are shown as a percentage of net assets. Holdings will vary over time.
8
We believe the fund’s research-intensive approach allows us to do this quite well.
David: Within the equity portfolio, we’re seeking companies with stable, relatively predictable cash flows to counter what’s likely to remain an uncertain and volatile economic environment. The stocks we own represent long-term investments. We’re not looking to position the fund for quick gains through aggressive buying and selling, but rather for sustained growth over the next one to three years. Identifying undervalued companies with attractive fundamentals is a key component of our research-driven approach, and it’s one we believe will serve our shareholders well over the long term. In addition, the fund’s balance of stock and bond holdings can provide attractive diversification in an unpredictable market.
Thank you, gentlemen, for bringing us up to date.
The views expressed in this report are exclusively those of Putnam Management. They are not meant as investment advice.
Please note that the holdings discussed in this report may not have been held by the fund for the entire period. Portfolio composition is subject to review in accordance with the fund’s investment strategy and may vary in the future. Current and future portfolio holdings are subject to risk.
Of special interest
In November 2009, the fund reduced its class A share dividend rate from 0.098 cents per share to 0.050 cents per share. The reduction was a result of moving a portion of fund assets from higher-yielding but more volatile mortgage- and asset-backed securities to more stable government and corporate securities.

Portfolio Manager David Calabro holds a B.A. from Williams College. David joined Putnam in 2008 and has been in the investment industry since 1982.

Portfolio Manager Raman Srivastava is Team Leader of Portfolio Construction and Quantitative Research at Putnam. He has an M.S. in Computational Finance from Carnegie Mellon University and a B.S. from the University of Waterloo. A CFA charterholder, he joined Putnam in 1999 and has been in the investment industry since 1997.
IN THE NEWS
Despite headlines about market volatility and a slow economic recovery, cash on U.S. corporate balance sheets has hit a record high. In June, the Federal Reserve reported that non-financial companies were holding nearly $2 trillion in cash and other liquid assets. The amount of cash is up 26% from a year ago, the largest increase on record, according to the central bank. Many firms implemented cost-cutting measures and other efficiencies in 2009. Concerned about the strength of the economic recovery and the debt crisis in Europe, companies have been reluctant to spend in recent months. Ultimately, that cash may be deployed on hiring, dividends, mergers, stock repurchases, and other shareholder-friendly activities.
9
Your fund’s performance
This section shows your fund’s performance, price, and distribution information for periods ended July 31, 2010, the end of its most recent fiscal year. In accordance with regulatory requirements for mutual funds, we also include performance as of the most recent calendar quarter-end and expense information taken from the fund’s current prospectus. Performance should always be considered in light of a fund’s investment strategy. Data represents past performance. Past performance does not guarantee future results. More recent returns may be less or more than those shown. Investment return and principal value will fluctuate, and you may have a gain or a loss when you sell your shares. Performance information does not reflect any deduction for taxes a shareholder may owe on fund distributions or on the redemption of fund shares. For the most recent month-end performance, please visit the Individual Investors section at putnam.com or call Pu tnam at 1-800-225-1581. Class Y shares are generally only available to corporate and institutional clients and clients in other approved programs. See the Terms and Definitions section in this report for definitions of the share classes offered by your fund.
Fund performance Total return for periods ended 7/31/10
| | | | | | | | | | |
| | Class A | Class B | Class C | Class M | Class R | Class Y |
| (inception dates) | (11/5/37) | (4/27/92) | (7/26/99) | (12/1/94) | (1/21/03) | (3/31/94) |
|
| | NAV | POP | NAV | CDSC | NAV | CDSC | NAV | POP | NAV | NAV |
|
| Annual average | | | | | | | | | | |
| (life of fund) | 8.55% | 8.47% | 7.54% | 7.54% | 7.74% | 7.74% | 7.82% | 7.76% | 8.29% | 8.62% |
|
| 10 years | 17.31 | 10.58 | 8.80 | 8.80 | 8.93 | 8.93 | 11.67 | 7.75 | 14.59 | 20.41 |
| Annual average | 1.61 | 1.01 | 0.85 | 0.85 | 0.86 | 0.86 | 1.11 | 0.75 | 1.37 | 1.87 |
|
| 5 years | –11.99 | –17.04 | –15.30 | –16.51 | –15.19 | –15.19 | –14.13 | –17.13 | –12.98 | –10.89 |
| Annual average | –2.52 | –3.67 | –3.27 | –3.54 | –3.24 | –3.24 | –3.00 | –3.69 | –2.74 | –2.28 |
|
| 3 years | –23.67 | –28.04 | –25.38 | –27.22 | –25.27 | –25.27 | –24.75 | –27.39 | –24.14 | –23.04 |
| Annual average | –8.61 | –10.39 | –9.30 | –10.05 | –9.25 | –9.25 | –9.04 | –10.12 | –8.80 | –8.36 |
|
| 1 year | 11.83 | 5.39 | 11.09 | 6.09 | 11.06 | 10.06 | 11.33 | 7.47 | 11.59 | 12.18 |
|
Current performance may be lower or higher than the quoted past performance, which cannot guarantee future results. After-sales-charge returns (public offering price, or POP) for class A and M shares reflect a maximum 5.75% and 3.50% load, respectively. Class B share returns reflect the applicable contingent deferred sales charge (CDSC), which is 5% in the first year, declining to 1% in the sixth year, and is eliminated thereafter. Class C shares reflect a 1% CDSC for the first year that is eliminated thereafter. Class R and Y shares have no initial sales charge or CDSC. Performance for class B, C, M, R, and Y shares before their inception is derived from the historical performance of class A shares, adjusted for the applicable sales charge (or CDSC) and, except for class Y shares, the higher operating expenses for such shares.
For a portion of the periods, the fund had expense limitations, without which returns would have been lower.
Class B share performance does not assume conversion to class A shares.
10
Past performance does not indicate future results. At the end of the same time period, a $10,000 investment in the fund’s class B and class C shares would have been valued at $10,880 and $10,893, respectively, and no contingent deferred sales charges would apply. A $10,000 investment in the fund’s class M shares ($9,650 after sales charge) would have been valued at $10,775 at public offering price. A $10,000 investment in the fund’s class R and class Y shares would have been valued at $11,459 and $12,041, respectively.
Comparative index returns For periods ended 7/31/10
| | | | |
| | | Barclays Capital | | Lipper Balanced |
| | Russell 1000 | Aggregate | George Putnam | Funds category |
| | Value Index | Bond Index | Blended Index† | average‡ |
|
| Annual average (life of fund) | —* | —* | —* | —* |
|
| 10 years | 33.38% | 87.44% | 63.74% | 27.91% |
| Annual average | 2.92 | 6.48 | 5.05 | 2.36 |
|
| 5 years | –4.46 | 33.55 | 14.72 | 9.91 |
| Annual average | –0.91 | 5.96 | 2.78 | 1.86 |
|
| 3 years | –24.55 | 24.68 | –3.42 | –5.68 |
| Annual average | –8.96 | 7.63 | –1.15 | –1.98 |
|
| 1 year | 15.39 | 8.91 | 13.44 | 11.81 |
|
Index and Lipper results should be compared to fund performance at net asset value.
* The fund’s benchmarks (Russell 1000 Value Index and George Putnam Blended Index) were introduced on 12/31/78. The Barclays Capital Aggregate Bond Index was introduced on 12/31/75, and the fund’s Lipper group (Balanced Funds) was introduced on 12/31/59. They all post-date the inception of the fund’s class A shares.
† George Putnam Blended Index is an unmanaged index administered by Putnam Management, 60% of which is based on the Russell 1000 Value Index and 40% of which is based on the Barclays Capital Aggregate Bond Index.
‡ Over the 1-year, 3-year, 5-year, and 10-year periods ended 7/31/10, there were 782, 712, 545, and 264 funds, respectively, in this Lipper category.
11
Fund price and distribution information For the 12-month period ended 7/31/10
| | | | | | | | |
| Distributions | Class A | Class B | Class C | Class M | Class R | Class Y |
|
| Number | 4 | 4 | 4 | 4 | 4 | 4 |
|
| Income | $0.2240 | $0.1473 | $0.1509 | $0.1762 | $0.1996 | $0.2484 |
|
| Capital gains | — | — | — | — | — | — |
|
| Return of capital | 0.0240 | 0.0157 | 0.0161 | 0.0188 | 0.0214 | 0.0266 |
|
| Total | $0.2480 | $0.1630 | $0.1670 | $0.1950 | $0.2210 | $0.2750 |
|
| Share value | NAV | POP | NAV | NAV | NAV | POP | NAV | NAV |
|
| 7/31/09 | $10.14 | $10.76 | $10.02 | $10.08 | $10.01 | $10.37 | $10.11 | $10.17 |
|
| 7/31/10 | 11.08 | 11.76 | 10.96 | 11.02 | 10.94 | 11.34 | 11.05 | 11.12 |
|
| Current yield (end of period) | NAV | POP | NAV | NAV | NAV | POP | NAV | NAV |
|
| Current dividend rate 1 | 1.81% | 1.70% | 0.99% | 1.05% | 1.32% | 1.27% | 1.56% | 2.05% |
|
| Current 30-day SEC yield 2,3 | N/A | 2.33 | 1.74 | 1.74 | N/A | 1.92 | 2.23 | 2.72 |
|
The classification of distributions, if any, is an estimate. Final distribution information will appear on your year-end tax forms.
1 Most recent distribution, excluding capital gains, annualized and divided by NAV or POP at end of period.
2 For a portion of the period, this fund had expense limitations, without which yields would have been lower.
3 Based only on investment income and calculated using the maximum offering price for each share class, in accordance with SEC guidelines.
Fund performance as of most recent calendar quarter
Total return for periods ended 6/30/10
| | | | | | | | | | |
| | Class A | Class B | Class C | Class M | Class R | Class Y |
| (inception dates) | (11/5/37) | (4/27/92) | (7/26/99) | (12/1/94) | (1/21/03) | (3/31/94) |
|
| | NAV | POP | NAV | CDSC | NAV | CDSC | NAV | POP | NAV | NAV |
|
| Annual average | | | | | | | | | | |
| (life of fund) | 8.50% | 8.41% | 7.48% | 7.48% | 7.68% | 7.68% | 7.76% | 7.71% | 8.23% | 8.56% |
|
| 10 years | 11.63 | 5.19 | 3.51 | 3.51 | 3.66 | 3.66 | 6.40 | 2.67 | 9.14 | 14.60 |
| Annual average | 1.11 | 0.51 | 0.35 | 0.35 | 0.36 | 0.36 | 0.62 | 0.26 | 0.88 | 1.37 |
|
| 5 years | –14.53 | –19.43 | –17.75 | –18.92 | –17.63 | –17.63 | –16.54 | –19.46 | –15.47 | –13.41 |
| Annual average | –3.09 | –4.23 | –3.83 | –4.11 | –3.80 | –3.80 | –3.55 | –4.24 | –3.31 | –2.84 |
|
| 3 years | –28.93 | –33.00 | –30.55 | –32.26 | –30.46 | –30.46 | –29.91 | –32.37 | –29.32 | –28.32 |
| Annual average | –10.76 | –12.50 | –11.44 | –12.18 | –11.40 | –11.40 | –11.17 | –12.22 | –10.92 | –10.50 |
|
| 1 year | 12.08 | 5.64 | 11.22 | 6.22 | 11.30 | 10.30 | 11.68 | 7.73 | 11.94 | 12.43 |
|
12
Your fund’s expenses
As a mutual fund investor, you pay ongoing expenses, such as management fees, distribution fees (12b-1 fees), and other expenses. In the most recent six-month period, your fund limited these expenses; had it not done so, expenses would have been higher. Using the following information, you can estimate how these expenses affect your investment and compare them with the expenses of other funds. You may also pay one-time transaction expenses, including sales charges (loads) and redemption fees, which are not shown in this section and would have resulted in higher total expenses. For more information, see your fund’s prospectus or talk to your financial representative.
Expense ratios
| | | | | | |
| | Class A | Class B | Class C | Class M | Class R | Class Y |
|
| Total annual operating expenses for the fiscal year | | | | | | |
| ended 7/31/09* | 1.18% | 1.93% | 1.93% | 1.68% | 1.43% | 0.93% |
|
| Annualized expense ratio for the six-month period | | | | | | |
| ended 7/31/10†‡ | 1.12% | 1.87% | 1.87% | 1.62% | 1.37% | 0.87% |
|
Fiscal-year expense information in this table is taken from the most recent prospectus, is subject to change, and may differ from that shown for the annualized expense ratio and in the financial highlights of this report. Expenses are shown as a percentage of average net assets.
* Annual fund operating expenses are based on a new expense arrangement and the fund’s 8/31/09 asset level. Expenses shown exclude estimated interest expense accruing in connection with the termination of certain derivatives contracts.
† For the fund’s most recent fiscal half year; may differ from expense ratios based on one-year data in the financial highlights.
‡ Excludes the impact of a reduction in expenses during the six months ended July 31, 2010, related to the resolution of certain terminated derivatives contracts.
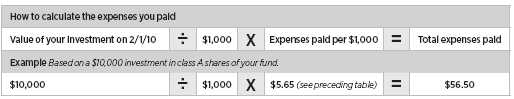
Expenses per $1,000
The following table shows the expenses you would have paid on a $1,000 investment in George Putnam Balanced Fund from February 1, 2010, to July 31, 2010. It also shows how much a $1,000 investment would be worth at the close of the period, assuming actual returns and expenses.
| | | | | | |
| | Class A | Class B | Class C | Class M | Class R | Class Y |
|
| Expenses paid per $1,000*† | $5.65 | $9.42 | $9.42 | $8.16 | $6.91 | $4.39 |
|
| Ending value (after expenses) | $1,035.40 | $1,031.50 | $1,032.60 | $1,032.20 | $1,034.10 | $1,036.60 |
|
* Expenses for each share class are calculated using the fund’s annualized expense ratio for each class, which represents the ongoing expenses as a percentage of average net assets for the six months ended 7/31/10. The expense ratio may differ for each share class.
† Expenses are calculated by multiplying the expense ratio by the average account value for the period; then multiplying the result by the number of days in the period; and then dividing that result by the number of days in the year.
13
Estimate the expenses you paid
To estimate the ongoing expenses you paid for the six months ended July 31, 2010, use the following calculation method. To find the value of your investment on February 1, 2010, call Putnam at 1-800-225-1581.
Compare expenses using the SEC’s method
The Securities and Exchange Commission (SEC) has established guidelines to help investors assess fund expenses. Per these guidelines, the following table shows your fund’s expenses based on a $1,000 investment, assuming a hypothetical 5% annualized return. You can use this information to compare the ongoing expenses (but not transaction expenses or total costs) of investing in the fund with those of other funds. All mutual fund shareholder reports will provide this information to help you make this comparison. Please note that you cannot use this information to estimate your actual ending account balance and expenses paid during the period.
| | | | | | |
| | Class A | Class B | Class C | Class M | Class R | Class Y |
|
| Expenses paid per $1,000*† | $5.61 | $9.35 | $9.35 | $8.10 | $6.85 | $4.36 |
|
| Ending value (after expenses) | $1,019.24 | $1,015.52 | $1,015.52 | $1,016.76 | $1,018.00 | $1,020.48 |
|
* Expenses for each share class are calculated using the fund’s annualized expense ratio for each class, which represents the ongoing expenses as a percentage of average net assets for the six months ended 7/31/10. The expense ratio may differ for each share class.
† Expenses are calculated by multiplying the expense ratio by the average account value for the period; then multiplying the result by the number of days in the period; and then dividing that result by the number of days in the year.
14
Terms and definitions
Important terms
Total return shows how the value of the fund’s shares changed over time, assuming you held the shares through the entire period and reinvested all distributions in the fund.
Net asset value (NAV) is the price, or value, of one share of a mutual fund, without a sales charge. NAVs fluctuate with market conditions. NAV is calculated by dividing the net assets of each class of shares by the number of outstanding shares in the class.
Public offering price (POP) is the price of a mutual fund share plus the maximum sales charge levied at the time of purchase. POP performance figures shown here assume the 5.75% maximum sales charge for class A shares and 3.50% for class M shares.
Contingent deferred sales charge (CDSC) is generally a charge applied at the time of the redemption of class B or C shares and assumes redemption at the end of the period. Your fund’s class B CDSC declines from a 5% maximum during the first year to 1% during the sixth year. After the sixth year, the CDSC no longer applies. The CDSC for class C shares is 1% for one year after purchase.
Current yield is the annual rate of return earned from dividends or interest of an investment. Current yield is expressed as a percentage of the price of a security, fund share, or principal investment.
Share classes
Class A shares are generally subject to an initial sales charge and no CDSC (except on certain redemptions of shares bought without an initial sales charge).
Class B shares are not subject to an initial sales charge. They may be subject to a CDSC.
Class C shares are not subject to an initial sales charge and are subject to a CDSC only if the shares are redeemed during the first year.
Class M shares have a lower initial sales charge and a higher 12b-1 fee than class A shares and no CDSC (except on certain redemptions of shares bought without an initial sales charge).
Class R shares are not subject to an initial sales charge or CDSC and are available only to certain defined contribution plans.
Class Y shares are not subject to an initial sales charge or CDSC, and carry no 12b-1 fee. They are generally only available to corporate and institutional clients and clients in other approved programs.
Comparative indexes
Barclays Capital Aggregate Bond Index is an unmanaged index of U.S. investment-grade fixed-income securities.
BofA (Bank of America) Merrill Lynch U.S. 3-Month Treasury Bill Index is an unmanaged index that seeks to measure the performance of U.S. Treasury bills available in the marketplace.
George Putnam Blended Index is an unmanaged index administered by Putnam Management, 60% of which is based on the Russell 1000 Value Index and 40% of which is based on the Barclays Capital Aggregate Bond Index.
Russell 1000 Value Index is an unmanaged index of those companies in the large-cap Russell 1000 Index chosen for their value orientation.
S&P 500 Index is an unmanaged index of common stock performance.
Indexes assume reinvestment of all distributions and do not account for fees. Securities and performance of a fund and an index will differ. You cannot invest directly in an index.
Lipper is a third-party industry-ranking entity that ranks mutual funds. Its rankings do not reflect sales charges. Lipper rankings are based on total return at net asset value relative to other funds that have similar current investment styles or objectives as determined by Lipper. Lipper may change a fund’s category assignment at its discretion. Lipper category averages reflect performance trends for funds within a category.
15
Trustee approval of management contract
General conclusions
The Board of Trustees of the Putnam funds oversees the management of each fund and, as required by law, determines annually whether to approve the continuance of your fund’s management contract with Putnam Investment Management (“Putnam Management”) and the sub-management contract with respect to your fund between Putnam Management and its affiliate, Putnam Investments Limited (“PIL”).
In this regard, the Board of Trustees, with the assistance of its Contract Committee consisting solely of Trustees who are not “interested persons” (as this term is defined in the Investment Company Act of 1940, as amended) of the Putnam funds (the “Independent Trustees”), requests and evaluates all information it deems reasonably necessary under the circumstances. Over the course of several months ending in June 2010, the Contract Committee met several times with representatives of Putnam Management and in executive session to consider the information provided by Putnam Management and other information developed with the assistance of the Board’s independent counsel and independent staff. The Contract Committee reviewed and discussed key aspects of this information with all of the Independent Trustees. At the Trustees’ June 11, 2010 meeting, the Contract Committee recommended, and the Independent Trustees approved, the co ntinuance of your fund’s management and sub-management contracts, effective July 1, 2010. (Because PIL is an affiliate of Putnam Management and Putnam Management remains fully responsible for all services provided by PIL, the Trustees have not evaluated PIL as a separate entity, and all subsequent references to Putnam Management below should be deemed to include reference to PIL as necessary or appropriate in the context.)
The Independent Trustees’ approval was based on the following conclusions:
• That the fee schedule in effect for your fund represented reasonable compensation in light of the nature and quality of the services being provided to the fund, the fees paid by competitive funds, and the costs incurred by Putnam Management in providing such services, and
• That the fee schedule represented an appropriate sharing between fund shareholders and Putnam Management of such economies of scale as may exist in the management of the fund at current asset levels.
These conclusions were based on a comprehensive consideration of all information provided to the Trustees and were not the result of any single factor. Some of the factors that figured particularly in the Trustees’ deliberations and how the Trustees considered these factors are described below, although individual Trustees may have evaluated the information presented differently, giving different weights to various factors. It is also important to recognize that the fee arrangements for your fund and the other Putnam funds are the result of many years of review and discussion between the Independent Trustees and Putnam Management, that certain aspects of the arrangements may receive greater scrutiny in some years than others, and that the Trustees’ conclusions may be based, in part, on their consideration of fee arrangements in prior years.
Consideration of implementation of strategic pricing initiative
The Trustees were mindful that new management contracts had been implemented for all but a few funds at the beginning of 2010 as part of Putnam Management’s strategic pricing initiative. These new management contracts reflected the implementation of more competitive fee levels for many funds, complex-wide breakpoints
16
for the open-end funds and performance fees for certain funds. The Trustees had approved these new management contracts on July 10, 2009 and submitted them to shareholder meetings of the affected funds in late 2009, where the contracts were in all cases approved by overwhelming majorities of the shares voted.
Because the management contracts had been implemented only recently, the Contract Committee had limited practical experience with the operation of the new fee structures. The financial data available to the Committee reflected actual operations under the prior contracts; information was also available on a pro forma basis, adjusted to reflect the fees payable under the new management contracts. In light of the limited information available regarding operations under the new management contracts, in recommending the continuation of the new management contracts in June 2010, the Contract Committee relied to a considerable extent on its review of the financial information and analysis that formed the basis of the Board’s approval of the new management contracts on July 10, 2009.
Management fee schedules and categories; total expenses
The Trustees reviewed the management fee schedules in effect for all Putnam funds, including fee levels and breakpoints. In reviewing management fees, the Trustees generally focus their attention on material changes in circumstances — for example, changes in assets under management or investment style, changes in Putnam Management’s operating costs, or changes in competitive practices in the mutual fund industry — that suggest that consideration of fee changes might be warranted. The Trustees concluded that the circumstances did not warrant changes to the management fee structure of your fund.
As in the past, the Trustees continued to focus on the competitiveness of the total expense ratio of each fund. In order to ensure that expenses of the Putnam funds continue to meet evolving competitive standards, the Trustees and Putnam Management agreed in 2009 to implement: (i) a contractual expense limitation applicable to all retail open-end funds of 37.5 basis points on investor servicing fees and expenses and (ii) a contractual expense limitation applicable to all open-end funds of 20 basis points on so-called “other expenses” (i.e., all expenses exclusive of management fees, investor servicing fees, distribution fees, taxes, brokerage commissions and extraordinary expenses). These expense limitations serve in particular to maintain competitive expense levels for funds with large numbers of small shareholder accounts and funds with relatively small net assets.
The Trustees reviewed comparative fee and expense information for competitive funds, which indicated that, in a custom peer group of competitive funds selected by Lipper Inc., your fund ranked in the 45th percentile in effective management fees (determined for your fund and the other funds in the custom peer group based on fund asset size and the applicable contractual management fee schedule) and in the 52nd percentile in total expenses (less any applicable 12b-1 fees) as of December 31, 2009 (the first percentile representing the least expensive funds and the 100th percentile the most expensive funds). The Trustees also considered that your fund ranked in the 38th percentile in effective management fees, on a pro forma basis adjusted to reflect the impact of the strategic pricing initiative discussed above, as of December 31, 2009.
Your fund currently has the benefit of breakpoints in its management fee that provide shareholders with significant economies of scale in the form of reduced fee levels as assets under management in the Putnam family of funds increase. The Contract Committee observed that the complex-wide breakpoints
17
of the open-end funds have only been in place for a short while, and the Trustees will examine the operation of this new breakpoint structure in future years in light of actual experience.
In connection with their review of the management fees and total expenses of the Putnam funds, the Trustees also reviewed the costs of the services provided and profits realized by Putnam Management and its affiliates from their contractual relationships with the funds. This information included trends in revenues, expenses and profitability of Putnam Management and its affiliates relating to the investment management, investor servicing and distribution services provided to the funds. In this regard, the Trustees also reviewed an analysis of Putnam Management’s revenues, expenses and profitability, allocated on a fund-by-fund basis, with respect to the funds’ management, distribution, and investor servicing contracts. For each fund, the analysis presented information about revenues, expenses and profitability for each of the agreements separately and for the agreements taken together on a combined basis. The Trustees concluded that, at curre nt asset levels, the fee schedules currently in place represented an appropriate sharing of economies of scale at that time.
The information examined by the Trustees as part of their annual contract review for the Putnam funds has included for many years information regarding fees charged by Putnam Management and its affiliates to institutional clients such as defined benefit pension plans, college endowments, and the like. This information included comparisons of such fees with fees charged to the funds, as well as a detailed assessment of the differences in the services provided to these two types of clients. The Trustees observed, in this regard, that the differences in fee rates between institutional clients and mutual funds are by no means uniform when examined by individual asset sectors, suggesting that differences in the pricing of investment management services to these types of clients may reflect historical competitive forces operating in separate market places. The Trustees considered the fact that fee rates across different as set classes are typically higher on average for mutual funds than for institutional clients, as well as the differences between the services that Putnam Management provides to the Putnam funds and those that it provides to institutional clients of the firm, and did not rely on these comparisons to any significant extent in concluding that the management fees paid by your fund are reasonable.
Investment performance
The quality of the investment process provided by Putnam Management represented a major factor in the Trustees’ evaluation of the quality of services provided by Putnam Management under your fund’s management contract. The Trustees were assisted in their review of the Putnam funds’ investment process and performance by the work of the Investment Oversight Coordinating Committee of the Trustees and the Investment Oversight Committees of the Trustees, which met on a regular monthly basis with the funds’ portfolio teams throughout the year. The Trustees concluded that Putnam Management generally provides a high-quality investment process — as measured by the experience and skills of the individuals assigned to the management of fund portfolios, the resources made available to such personnel, and in general the ability of Putnam Management to attract and retain high-quality personnel — but also recognized that this does not gu arantee favorable investment results for every fund in every time period. The Trustees considered the investment performance of each fund over multiple time periods and considered information comparing each fund’s performance with various benchmarks and with the performance of competitive funds.
18
The Committee noted the substantial improvement in the performance of most Putnam funds during 2009. The Committee also noted the disappointing investment performance of a number of the funds for periods ended December 31, 2009 and considered information provided by Putnam Management regarding the factors contributing to the underperformance and actions being taken to improve performance. The Trustees recognized that, in recent years, Putnam Management has taken steps to strengthen its investment personnel and processes to address areas of underperformance, including Putnam Management’s continuing efforts to strengthen the equity research function, recent changes in portfolio managers, increased accountability of individual managers rather than teams, recent changes in Putnam Management’s approach to incentive compensation, including emphasis on top quartile performance over a rolling three-year period, and the recent arrival of a new chief i nvestment officer. The Trustees indicated their intention to continue to monitor performance trends to assess the effectiveness of these efforts and to evaluate whether additional changes to address areas of underperformance are warranted.
In the case of your fund, the Trustees considered that your fund’s class A share cumulative total return performance at net asset value was in the following percentiles of its Lipper Inc. peer group (Lipper Balanced Funds) for the one-year, three-year and five-year periods ended December 31, 2009 (the first percentile representing the best-performing funds and the 100th percentile the worst-performing funds):
| | | |
| One-year period | 31st | | |
| | |
| Three-year period | 99th | | |
| | |
| Five-year period | 99th | | |
| | |
Over the one-year, three-year and five-year periods ended December 31, 2009, there were 782, 697 and 528 funds, respectively, in your fund’s Lipper peer group. (When considering performance information, shareholders should be mindful that past performance is not a guarantee of future results.)
The Trustees took note of your fund’s 4th quartile performance for the three-year and five-year periods ended December 31, 2009 and considered the circumstances that may have contributed to the disappointing performance as well as any actions taken by Putnam Management intended to improve performance, including that in November 2008, a new portfolio manager was added to the fund’s management team. The Trustees also considered that Putnam Management has taken the following actions:
• Increased accountability and reduced complexity in the portfolio management process for the Putnam equity funds by replacing a team management structure with a decision-making process that vests full authority and responsibility with individual portfolio managers. Putnam Management has also taken other steps, such as eliminating sleeves in certain Putnam equity funds, to reduce process complexity in the portfolio management of these funds;
• Clarified its investment process by affirming a fundamental-driven approach to investing, with quantitative analysis providing additional input for investment decisions;
• Strengthened its large-cap equity research capability by adding multiple new investment personnel to the team and by bringing U.S. and international research under common leadership; and
• Realigned the compensation structure for portfolio managers and research analysts so that only those who achieve top-quartile returns over a rolling three-year basis are eligible for full bonuses.
As a general matter, the Trustees believe that cooperative efforts between the Trustees and Putnam Management represent the most effective way to address investment
19
performance problems. The Trustees noted that investors in the Putnam funds have, in effect, placed their trust in the Putnam organization, under the oversight of the funds’ Trustees, to make appropriate decisions regarding the management of the funds. Based on the responsiveness of Putnam Management in the recent past to Trustee concerns about investment performance, the Trustees concluded that it is preferable to seek change within Putnam Management to address performance shortcomings. In the Trustees’ view, the alternative of engaging a new investment adviser for an underperforming fund would entail significant disruptions and would not provide any greater assurance of improved investment performance.
Brokerage and soft-dollar allocations; investor servicing; distribution
The Trustees considered various potential benefits that Putnam Management may receive in connection with the services it provides under the management contract with your fund. These include benefits related to brokerage and soft-dollar allocations, whereby a portion of the commissions paid by a fund for brokerage may be used to acquire research services that are expected to be useful to Putnam Management in managing the assets of the fund and of other clients. The Trustees considered a change made, at Putnam Management’s request, to the Putnam funds’ brokerage allocation policies commencing in 2010, which increased the permitted soft dollar allocation to third-party services over what had been authorized in previous years. The Trustees noted that a portion of available soft dollars continues to be allocated to the payment of fund expenses. The Trustees indicated their continued intent to monitor regulatory developments in this area with the assistance of their Brokerage Committee and also indicated their continued intent to monitor the potential benefits associated with fund brokerage and soft-dollar allocations and trends in industry practices to ensure that the principle of seeking best price and execution remains paramount in the portfolio trading process.
Putnam Management may also receive benefits from payments that the funds make to Putnam Management’s affiliates for investor or distribution services. In conjunction with the annual review of your fund’s management contract, the Trustees reviewed your fund’s investor servicing agreement with Putnam Investor Services, Inc. (“PSERV”) and its distributor’s contracts and distribution plans with Putnam Retail Management Limited Partnership (“PRM”), both of which are affiliates of Putnam Management. The Trustees concluded that the fees payable by the funds to PSERV and PRM, as applicable, for such services are reasonable in relation to the nature and quality of such services.
20
Other information for shareholders
Important notice regarding Putnam’s privacy policy
In order to conduct business with our shareholders, we must obtain certain personal information such as account holders’ names, addresses, Social Security numbers, and dates of birth. Using this information, we are able to maintain accurate records of accounts and transactions.
It is our policy to protect the confidentiality of our shareholder information, whether or not a shareholder currently owns shares of our funds. In particular, it is our policy not to sell information about you or your accounts to outside marketing firms. We have safeguards in place designed to prevent unauthorized access to our computer systems and procedures to protect personal information from unauthorized use.
Under certain circumstances, we must share account information with outside vendors who provide services to us, such as mailings and proxy solicitations. In these cases, the service providers enter into confidentiality agreements with us, and we provide only the information necessary to process transactions and perform other services related to your account. Finally, it is our policy to share account information with your financial representative, if you’ve listed one on your Putnam account.
Proxy voting
Putnam is committed to managing our mutual funds in the best interests of our shareholders. The Putnam funds’ proxy voting guidelines and procedures, as well as information regarding how your fund voted proxies relating to portfolio securities during the 12-month period ended June 30, 2010, are available in the Individual Investors section at putnam.com, and on the SEC’s Web site, www.sec.gov. If you have questions about finding forms on the SEC’s Web site, you may call the SEC at 1-800-SEC-0330. You may also obtain the Putnam funds’ proxy voting guidelines and procedures at no charge by calling Putnam’s Shareholder Services at 1-800-225-1581.
Fund portfolio holdings
The fund will file a complete schedule of its portfolio holdings with the SEC for the first and third quarters of each fiscal year on Form N-Q. Shareholders may obtain the fund’s Forms N-Q on the SEC’s Web site at www.sec.gov. In addition, the fund’s Forms N-Q may be reviewed and copied at the SEC’s Public Reference Room in Washington, D.C. You may call the SEC at 1-800-SEC-0330 for information about the SEC’s Web site or the operation of the Public Reference Room.
Trustee and employee fund ownership
Putnam employees and members of the Board of Trustees place their faith, confidence, and, most importantly, investment dollars in Putnam mutual funds. As of July 31, 2010, Putnam employees had approximately $315,000,000 and the Trustees had approximately $58,000,000 invested in Putnam mutual funds. These amounts include investments by the Trustees’ and employees’ immediate family members as well as investments through retirement and deferred compensation plans.
21
Financial statements
These sections of the report, as well as the accompanying Notes, preceded by the Report of Independent Registered Public Accounting Firm, constitute the fund’s financial statements.
The fund’s portfolio lists all the fund’s investments and their values as of the last day of the reporting period. Holdings are organized by asset type and industry sector, country, or state to show areas of concentration and diversification.
Statement of assets and liabilities shows how the fund’s net assets and share price are determined. All investment and non-investment assets are added together. Any unpaid expenses and other liabilities are subtracted from this total. The result is divided by the number of shares to determine the net asset value per share, which is calculated separately for each class of shares. (For funds with preferred shares, the amount subtracted from total assets includes the liquidation preference of preferred shares.)
Statement of operations shows the fund’s net investment gain or loss. This is done by first adding up all the fund’s earnings — from dividends and interest income — and subtracting its operating expenses to determine net investment income (or loss). Then, any net gain or loss the fund realized on the sales of its holdings — as well as any unrealized gains or losses over the period — is added to or subtracted from the net investment result to determine the fund’s net gain or loss for the fiscal year.
Statement of changes in net assets shows how the fund’s net assets were affected by the fund’s net investment gain or loss, by distributions to shareholders, and by changes in the number of the fund’s shares. It lists distributions and their sources (net investment income or realized capital gains) over the current reporting period and the most recent fiscal year-end. The distributions listed here may not match the sources listed in the Statement of operations because the distributions are determined on a tax basis and may be paid in a different period from the one in which they were earned.
Financial highlights provide an overview of the fund’s investment results, per-share distributions, expense ratios, net investment income ratios, and portfolio turnover in one summary table, reflecting the five most recent reporting periods. In a semiannual report, the highlights table also includes the current reporting period.
22
Report of Independent Registered Public Accounting Firm
To the Trustees and Shareholders of The George Putnam Fund
of Boston:
In our opinion, the accompanying statement of assets and liabilities, including the portfolio, and the related statements of operations and of changes in net assets and the financial highlights present fairly, in all material respects, the financial position of The George Putnam Fund of Boston (the “fund”) at July 31, 2010, and the results of its operations, the changes in its net assets and the financial highlights for each of the periods indicated, in conformity with accounting principles generally accepted in the United States of America. These financial statements and financial highlights (hereafter referred to as “financial statements”) are the responsibility of the fund’s management. Our responsibility is to express an opinion on these financial statements based on our audits. We conducted our audits of these financial statements in accordance with the standards of the Public Company Accounting Oversight Board (United Sta tes). Those standards require that we plan and perform the audit to obtain reasonable assurance about whether the financial statements are free of material misstatement. An audit includes examining, on a test basis, evidence supporting the amounts and disclosures in the financial statements, assessing the accounting principles used and significant estimates made by management, and evaluating the overall financial statement presentation. We believe that our audits, which included confirmation of investments owned at July 31, 2010 by correspondence with the custodian provide a reasonable basis for our opinion.
PricewaterhouseCoopers LLP
Boston, Massachusetts
September 14, 2010
23
The fund’s portfolio 7/31/10
| | |
| COMMON STOCKS (56.9%)* | Shares | Value |
|
| Banking (6.1%) | | |
| Bank of America Corp. | 1,189,753 | $16,704,132 |
|
| Bank of New York Mellon Corp. (The) | 356,100 | 8,927,427 |
|
| JPMorgan Chase & Co. | 603,600 | 24,313,008 |
|
| PNC Financial Services Group, Inc. | 80,500 | 4,780,895 |
|
| State Street Corp. | 182,400 | 7,099,008 |
|
| SunTrust Banks, Inc. | 77,900 | 2,021,505 |
|
| U.S. Bancorp | 260,100 | 6,216,390 |
|
| Wells Fargo & Co. | 347,800 | 9,644,494 |
|
| | | 79,706,859 |
| Basic materials (1.8%) | | |
| Alcoa, Inc. | 253,900 | 2,836,063 |
|
| Dow Chemical Co. (The) | 98,100 | 2,681,073 |
|
| E.I. du Pont de Nemours & Co. | 175,500 | 7,137,585 |
|
| Nucor Corp. | 120,100 | 4,700,714 |
|
| PPG Industries, Inc. | 71,700 | 4,980,999 |
|
| Weyerhaeuser Co. | 37,600 | 609,872 |
|
| | | 22,946,306 |
| Capital goods (2.9%) | | |
| Avery Dennison Corp. | 23,100 | 828,135 |
|
| Boeing Co. (The) | 21,900 | 1,492,266 |
|
| Deere (John) & Co. | 33,600 | 2,240,448 |
|
| Emerson Electric Co. | 98,500 | 4,879,690 |
|
| Lockheed Martin Corp. | 74,800 | 5,621,220 |
|
| Northrop Grumman Corp. | 68,600 | 4,022,704 |
|
| Parker Hannifin Corp. | 104,900 | 6,516,388 |
|
| Raytheon Co. | 102,930 | 4,762,571 |
|
| United Technologies Corp. | 109,400 | 7,778,340 |
|
| | | 38,141,762 |
| Communication services (3.8%) | | |
| AT&T, Inc. | 846,582 | 21,960,337 |
|
| Comcast Corp. Class A | 324,800 | 6,323,856 |
|
| DIRECTV Class A † | 73,700 | 2,738,692 |
|
| Time Warner Cable, Inc. | 70,100 | 4,007,617 |
|
| Verizon Communications, Inc. | 419,300 | 12,184,858 |
|
| Vodafone Group PLC ADR (United Kingdom) | 95,400 | 2,239,992 |
|
| | | 49,455,352 |
| Conglomerates (2.0%) | | |
| 3M Co. | 80,200 | 6,860,308 |
|
| General Electric Co. | 503,000 | 8,108,360 |
|
| Honeywell International, Inc. | 88,700 | 3,801,682 |
|
| Tyco International, Ltd. | 207,400 | 7,939,272 |
|
| | | 26,709,622 |
| Consumer cyclicals (4.6%) | | |
| DISH Network Corp. Class A | 71,600 | 1,437,728 |
|
| Ford Motor Co. † | 222,900 | 2,846,433 |
|
| Home Depot, Inc. (The) | 140,800 | 4,014,208 |
|
| Marriott International, Inc. Class A | 47,620 | 1,614,794 |
|
| Omnicom Group, Inc. | 112,100 | 4,176,846 |
|
24
| | |
| COMMON STOCKS (56.9%)* cont. | Shares | Value |
|
| Consumer cyclicals cont. | | |
| Staples, Inc. | 197,800 | $4,021,274 |
|
| Target Corp. | 136,800 | 7,020,576 |
|
| Time Warner, Inc. | 321,100 | 10,101,806 |
|
| TJX Cos., Inc. (The) | 134,000 | 5,563,680 |
|
| Viacom, Inc. Class B | 270,200 | 8,927,408 |
|
| Wal-Mart Stores, Inc. | 81,900 | 4,192,461 |
|
| Walt Disney Co. (The) | 157,100 | 5,292,699 |
|
| Whirlpool Corp. | 7,900 | 658,070 |
|
| | | 59,867,983 |
| Consumer staples (5.7%) | | |
| Avis Budget Group, Inc. † | 254,000 | 3,134,360 |
|
| Avon Products, Inc. | 106,600 | 3,318,458 |
|
| Clorox Co. | 94,200 | 6,111,696 |
|
| Coca-Cola Co. (The) | 130,200 | 7,175,322 |
|
| CVS Caremark Corp. | 258,800 | 7,942,572 |
|
| General Mills, Inc. | 24,200 | 827,640 |
|
| Kellogg Co. | 134,800 | 6,746,740 |
|
| Kimberly-Clark Corp. | 108,100 | 6,931,372 |
|
| Kraft Foods, Inc. Class A | 157,562 | 4,602,386 |
|
| Lorillard, Inc. | 40,100 | 3,057,224 |
|
| Newell Rubbermaid, Inc. | 310,700 | 4,815,850 |
|
| Philip Morris International, Inc. | 322,800 | 16,475,712 |
|
| Procter & Gamble Co. (The) | 62,400 | 3,816,384 |
|
| | | 74,955,716 |
| Energy (8.3%) | | |
| Anadarko Petroleum Corp. | 20,800 | 1,022,528 |
|
| Apache Corp. | 54,200 | 5,180,436 |
|
| Chevron Corp. | 339,600 | 25,880,916 |
|
| ConocoPhillips | 73,700 | 4,069,714 |
|
| Devon Energy Corp. | 34,700 | 2,168,403 |
|
| EOG Resources, Inc. | 28,000 | 2,730,000 |
|
| Exxon Mobil Corp. | 381,200 | 22,750,016 |
|
| Halliburton Co. | 138,000 | 4,123,440 |
|
| Hess Corp. | 45,400 | 2,432,986 |
|
| Marathon Oil Corp. | 290,900 | 9,730,605 |
|
| Newfield Exploration Co. † | 50,700 | 2,710,422 |
|
| Noble Corp. (Switzerland) † | 97,600 | 3,172,000 |
|
| Occidental Petroleum Corp. | 121,500 | 9,468,495 |
|
| Smith International, Inc. | 45,500 | 1,887,340 |
|
| Total SA ADR (France) | 150,900 | 7,640,067 |
|
| Valero Energy Corp. | 174,400 | 2,963,056 |
|
| | | 107,930,424 |
| Financials (2.5%) | | |
| Chubb Corp. (The) | 150,800 | 7,936,604 |
|
| Goldman Sachs Group, Inc. (The) | 68,110 | 10,272,350 |
|
| MetLife, Inc. | 131,500 | 5,530,890 |
|
| Travelers Cos., Inc. (The) | 181,800 | 9,171,810 |
|
| | | 32,911,654 |
25
| | |
| COMMON STOCKS (56.9%)* cont. | Shares | Value |
|
| Health care (7.4%) | | |
| Abbott Laboratories | 165,800 | $8,137,464 |
|
| Aetna, Inc. | 269,400 | 7,502,790 |
|
| Baxter International, Inc. | 186,000 | 8,141,220 |
|
| Bristol-Myers Squibb Co. | 90,200 | 2,247,784 |
|
| Covidien PLC (Ireland) | 143,612 | 5,359,600 |
|
| Genzyme Corp. † | 29,700 | 2,065,932 |
|
| Johnson & Johnson | 238,100 | 13,831,229 |
|
| McKesson Corp. | 27,800 | 1,746,396 |
|
| Medtronic, Inc. | 187,600 | 6,935,572 |
|
| Merck & Co., Inc. | 228,500 | 7,874,110 |
|
| Omnicare, Inc. | 80,400 | 1,980,252 |
|
| Pfizer, Inc. | 1,444,058 | 21,660,870 |
|
| Thermo Fisher Scientific, Inc. † | 147,600 | 6,621,336 |
|
| WellPoint, Inc. † | 45,300 | 2,297,616 |
|
| | | 96,402,171 |
| Insurance (1.2%) | | |
| ACE, Ltd. | 62,800 | 3,333,424 |
|
| Allstate Corp. (The) | 133,600 | 3,772,864 |
|
| Everest Re Group, Ltd. | 16,900 | 1,311,778 |
|
| Marsh & McLennan Cos., Inc. | 216,900 | 5,101,488 |
|
| RenaissanceRe Holdings, Ltd. | 38,000 | 2,174,360 |
|
| | | 15,693,914 |
| Investment banking/Brokerage (0.9%) | | |
| Morgan Stanley | 349,640 | 9,436,784 |
|
| T. Rowe Price Group, Inc. | 47,900 | 2,310,217 |
|
| | | 11,747,001 |
| Real estate (0.7%) | | |
| Equity Residential Trust R | 88,348 | 4,050,756 |
|
| ProLogis Trust R | 107,800 | 1,170,708 |
|
| Simon Property Group, Inc. R | 38,662 | 3,449,424 |
|
| | | 8,670,888 |
| Technology (4.7%) | | |
| Atmel Corp. † | 441,500 | 2,309,045 |
|
| BMC Software, Inc. † | 52,500 | 1,867,950 |
|
| Cisco Systems, Inc. † | 146,000 | 3,368,220 |
|
| Electronic Arts, Inc. † | 78,100 | 1,244,133 |
|
| EMC Corp. † | 238,000 | 4,710,020 |
|
| IBM Corp. | 58,100 | 7,460,040 |
|
| Intel Corp. | 190,300 | 3,920,180 |
|
| KLA-Tencor Corp. | 186,100 | 5,893,787 |
|
| Microsoft Corp. | 216,900 | 5,598,189 |
|
| Motorola, Inc. † | 488,700 | 3,660,363 |
|
| Oracle Corp. | 106,400 | 2,515,296 |
|
| Qualcomm, Inc. | 231,100 | 8,800,288 |
|
| Texas Instruments, Inc. | 179,900 | 4,441,731 |
|
| Yahoo!, Inc. † | 437,200 | 6,068,336 |
|
| | | 61,857,578 |
26
| | |
| COMMON STOCKS (56.9%)* cont. | Shares | Value |
|
| Transportation (0.4%) | | |
| FedEx Corp. | 37,400 | $3,087,370 |
|
| United Parcel Service, Inc. Class B | 24,300 | 1,579,500 |
|
| | | 4,666,870 |
| Utilities and power (3.9%) | | |
| Ameren Corp. | 174,200 | 4,419,454 |
|
| American Electric Power Co., Inc. | 162,300 | 5,839,554 |
|
| CMS Energy Corp. | 131,500 | 2,093,480 |
|
| Dominion Resources, Inc. | 31,800 | 1,335,282 |
|
| Duke Energy Corp. | 103,400 | 1,768,140 |
|
| Edison International | 213,200 | 7,067,580 |
|
| El Paso Corp. | 201,214 | 2,478,956 |
|
| Entergy Corp. | 104,400 | 8,092,044 |
|
| Exelon Corp. | 29,900 | 1,250,717 |
|
| NextEra Energy, Inc. | 17,600 | 920,480 |
|
| PG&E Corp. | 214,350 | 9,517,140 |
|
| PPL Corp. | 143,200 | 3,907,928 |
|
| Wisconsin Energy Corp. | 49,100 | 2,665,148 |
|
| | | 51,355,903 |
| | | |
| Total common stocks (cost $664,980,771) | | $743,020,003 |
| |
| |
| U.S. GOVERNMENT AND AGENCY | | |
| MORTGAGE OBLIGATIONS (2.9%)* | Principal amount | Value |
|
| Federal Home Loan Mortgage Corporation Pass-Through | | |
| Certificates 6s, March 1, 2035 | $14,301 | $15,718 |
|
| Federal National Mortgage Association | | |
| Pass-Through Certificates | | |
| 5 1/2s, with due dates from July 1, 2033 to November 1, 2038 | 13,904,249 | 15,000,370 |
| 5s, with due dates from August 1, 2033 to January 1, 2039 | 8,942,853 | 9,556,488 |
| 5s, TBA, May 1, 2040 | 13,000,000 | 13,975,000 |
|
| Total U.S. government and agency mortgage obligations (cost $37,004,973) | $38,547,576 |
| |
| |
| U.S. GOVERNMENT AGENCY OBLIGATIONS (2.0%)* | Principal amount | Value |
|
| General Electric Capital Corp. 1 5/8s, FDIC guaranteed | | |
| notes, January 7, 2011 | $6,750,000 | $6,789,305 |
|
| Goldman Sachs Group, Inc (The) 1 5/8s, FDIC guaranteed | | |
| notes, July 15, 2011 | 6,750,000 | 6,830,028 |
|
| JPMorgan Chase & Co. 2 5/8s, FDIC guaranteed, | | |
| December 1, 2010 | 6,750,000 | 6,803,474 |
|
| Morgan Stanley 2s, FDIC guaranteed notes, September 22, 2011 | 2,500,000 | 2,541,653 |
|
| Wells Fargo & Co. | | |
| 3s, FDIC guaranteed notes, December 9, 2011 | 1,100,000 | 1,137,824 |
| 2 1/8s, FDIC guaranteed notes, June 15, 2012 | 1,400,000 | 1,438,370 |
|
| Total U.S. government agency obligations (cost $25,298,830) | | $25,540,654 |
27
| | |
| U.S. TREASURY OBLIGATIONS (12.3%)* | Principal amount | Value |
|
| U.S. Treasury Bonds | | |
| 6 7/8s, August 15, 2025 | $7,490,000 | $10,452,061 |
| 6s, February 15, 2026 | 1,000 | 1,296 |
| 5 1/2s, August 15, 2028 | 4,990,000 | 6,189,159 |
|
| U.S. Treasury Notes | | |
| 5 1/8s, May 15, 2016 | 13,450,000 | 15,814,257 |
| 4 7/8s, July 31, 2011 | 31,370,000 | 32,781,038 |
| 4 1/4s, November 15, 2014 | 15,500,000 | 17,405,410 |
| 3 3/4s, November 15, 2018 | 19,000,000 | 20,694,414 |
| 2 3/8s, August 31, 2014 | 10,110,000 | 10,562,186 |
| 0 3/4s, May 31, 2012 | 47,000,000 | 47,199,200 |
|
| Total U.S. treasury obligations (cost $158,179,897) | | $161,099,021 |
| |
| |
| CORPORATE BONDS AND NOTES (15.7%)* | Principal amount | Value |
|
| Basic materials (0.9%) | | |
| ArcelorMittal sr. unsec. unsub. 9.85s, 2019 (Luxembourg) | $1,545,000 | $1,996,004 |
|
| Dow Chemical Co. (The) sr. unsec. unsub. notes 8.55s, 2019 | 1,190,000 | 1,486,159 |
|
| Dow Chemical Co. (The) sr. unsec. unsub. notes 5.9s, 2015 | 880,000 | 975,542 |
|
| Freeport-McMoRan Copper & Gold, Inc. sr. unsec. | | |
| notes 8 3/8s, 2017 | 1,450,000 | 1,624,000 |
|
| International Paper Co. bonds 7.95s, 2018 | 221,000 | 266,761 |
|
| International Paper Co. sr. unsec. notes 9 3/8s, 2019 | 1,188,000 | 1,535,490 |
|
| Mosaic Co. (The) 144A sr. unsec. unsub. notes 7 5/8s, 2016 | 733,000 | 792,146 |
|
| Rio Tinto Finance USA LTD company guaranty sr. unsec. | | |
| notes 9s, 2019 (Australia) | 450,000 | 602,436 |
|
| Rohm & Haas Co. sr. unsec. unsub. notes 7.85s, 2029 | 385,000 | 428,999 |
|
| Sealed Air Corp. 144A sr. notes 7 7/8s, 2017 | 585,000 | 621,529 |
|
| Teck Resources, Ltd. sr. notes 10 3/4s, 2019 (Canada) | 35,000 | 43,708 |
|
| Teck Resources, Ltd. sr. notes 10 1/4s, 2016 (Canada) | 51,000 | 61,710 |
|
| Teck Resources, Ltd. sr. notes 9 3/4s, 2014 (Canada) | 43,000 | 52,270 |
|
| Teck Resources, Ltd. sr. unsec. unsub. notes 7s, 2012 (Canada) | 30,000 | 32,308 |
|
| Xstrata Finance Canada, Ltd. 144A company guaranty 5.8s, | | |
| 2016 (Canada) | 735,000 | 795,190 |
|
| | | 11,314,252 |
| Capital goods (0.3%) | | |
| Allied Waste North America, Inc. company | | |
| guaranty sr. unsec. notes 6 7/8s, 2017 | 1,595,000 | 1,760,481 |
|
| Ball Corp. company guaranty sr. unsec. notes 7 1/8s, 2016 | 1,000 | 1,075 |
|
| Legrand SA unsec. unsub. debs. 8 1/2s, 2025 (France) | 767,000 | 919,754 |
|
| Parker Hannifin Corp. sr. unsec. unsub. notes Ser. MTN, | | |
| 6 1/4s, 2038 | 975,000 | 1,150,259 |
|
| Republic Services, Inc. 144A sr. unsec. notes 5 1/2s, 2019 | 240,000 | 263,089 |
|
| United Technologies Corp. sr. unsec. notes 6 1/8s, 2038 | 215,000 | 251,576 |
|
| United Technologies Corp. sr. unsec. notes 5.7s, 2040 | 100,000 | 111,432 |
|
| | | 4,457,666 |
| Communication services (1.5%) | | |
| American Tower Corp. sr. unsec. notes 7 1/4s, 2019 | 800,000 | 934,000 |
|
| American Tower Corp. sr. unsec. unsub. notes 4 5/8s, 2015 | 555,000 | 587,721 |
|
| AT&T Wireless Services, Inc. sr. notes 8 3/4s, 2031 | 285,000 | 397,927 |
|
| AT&T, Inc. sr. unsec. unsub. bonds 5 1/2s, 2018 | 705,000 | 795,380 |
|
28
| | |
| CORPORATE BONDS AND NOTES (15.7%)* cont. | Principal amount | Value |
|
| Communication services cont. | | |
| AT&T, Inc. sr. unsec. unsub. notes 6.3s, 2038 | $1,194,000 | $1,328,569 |
|
| Bellsouth Capital Funding unsec. notes 7 7/8s, 2030 | 1,380,000 | 1,707,008 |
|
| Comcast Cable Communications company | | |
| guaranty sr. unsub. notes 8 7/8s, 2017 | 290,000 | 364,252 |
|
| Comcast Corp. company guaranty sr. unsec. | | |
| unsub. notes 6.95s, 2037 | 225,000 | 264,686 |
|
| Cox Communications, Inc. 144A notes 5 7/8s, 2016 | 289,000 | 327,456 |
|
| Crown Castle Towers, LLC 144A company | | |
| guaranty sr. notes 4.883s, 2020 | 710,000 | 714,807 |
|
| France Telecom notes 8 1/2s, 2031 (France) | 180,000 | 250,571 |
|
| Rogers Wireless, Inc. sec. notes 6 3/8s, 2014 (Canada) | 122,000 | 139,250 |
|
| SBA Tower Trust 144A company guaranty asset backed | | |
| notes 5.101s, 2017 | 1,125,000 | 1,203,470 |
|
| TCI Communications, Inc. company guaranty 7 7/8s, 2026 | 2,395,000 | 2,890,751 |
|
| TCI Communications, Inc. debs. 9.8s, 2012 | 547,000 | 612,731 |
|
| Telefonica Emisones SAU company guaranty 6.221s, 2017 (Spain) | 845,000 | 946,681 |
|
| Time Warner Cable, Inc. company guaranty sr. notes 7.3s, 2038 | 640,000 | 763,903 |
|
| Time Warner Cable, Inc. company guaranty sr. unsec. | | |
| notes 7 1/2s, 2014 | 150,000 | 176,183 |
|
| Time Warner Cable, Inc. company guaranty sr. unsec. | | |
| unsub. notes 6 3/4s, 2039 | 355,000 | 404,300 |
|
| Verizon Communications, Inc. sr. unsec. unsub. notes 8 3/4s, 2018 | 110,000 | 145,376 |
|
| Verizon New England, Inc. sr. notes 6 1/2s, 2011 | 742,000 | 781,931 |
|
| Verizon New Jersey, Inc. debs. 8s, 2022 | 770,000 | 942,678 |
|
| Verizon Pennsylvania, Inc. debs. 8.35s, 2030 | 980,000 | 1,101,923 |
|
| Verizon Wireless, Inc. sr. unsec. unsub. notes 5.55s, 2014 | 2,170,000 | 2,452,293 |
|
| | | 20,233,847 |
| Conglomerates (0.1%) | | |
| Siemens Financieringsmaatschappij 144A notes 5 3/4s, | | |
| 2016 (Netherlands) | 680,000 | 782,307 |
|
| | | 782,307 |
| Consumer cyclicals (1.0%) | | |
| Advance Auto Parts, Inc. company guaranty sr. unsec. | | |
| notes 5 3/4s, 2020 | 475,000 | 496,203 |
|
| Corrections Corporation of America company | | |
| guaranty sr. notes 7 3/4s, 2017 | 279,000 | 296,089 |
|
| Daimler AG company guaranty 6 1/2s, 2013 (Germany) | 565,000 | 638,850 |
|
| Daimler AG company guaranty sr. unsec. unsub. notes 5 7/8s, | | |
| 2011 (Germany) | 312,000 | 321,204 |
|
| Daimler AG company guaranty unsec. unsub. notes Ser. MTN, | | |
| 5 3/4s, 2011 (Germany) | 630,000 | 658,669 |
|
| DIRECTV Holdings, LLC company guaranty sr. unsec. | | |
| notes 6.35s, 2040 | 370,000 | 400,429 |
|
| DIRECTV Holdings, LLC company guaranty sr. unsec. | | |
| unsub. notes 5 7/8s, 2019 | 820,000 | 911,812 |
|
| Grupo Televisa SA sr. unsec. bonds 6 5/8s, 2040 (Mexico) | 300,000 | 323,222 |
|
| Grupo Televisa SA sr. unsec. notes 6s, 2018 (Mexico) | 290,000 | 318,127 |
|
| Lender Processing Services, Inc. company | | |
| guaranty sr. unsec. unsub. notes 8 1/8s, 2016 | 846,000 | 896,760 |
|
29
| | |
| CORPORATE BONDS AND NOTES (15.7%)* cont. | Principal amount | Value |
|
| Consumer cyclicals cont. | | |
| Macy’s Retail Holdings, Inc. company guaranty sr. unsec. | | |
| notes 6 5/8s, 2011 | $265,000 | $271,294 |
|
| NBC Universal, Inc. 144A notes 6.4s, 2040 | 380,000 | 413,267 |
|
| NBC Universal, Inc. 144A notes 5.15s, 2020 | 295,000 | 312,141 |
|
| News America Holdings, Inc. company guaranty 7 3/4s, 2024 | 1,045,000 | 1,289,416 |
|
| News America Holdings, Inc. debs. 7 3/4s, 2045 | 1,064,000 | 1,293,619 |
|
| Nissan Motor Acceptance Corp. 144A sr. unsec. notes | | |
| 4 1/2s, 2015 | 860,000 | 898,089 |
|
| Omnicom Group, Inc. sr. notes 5.9s, 2016 | 635,000 | 725,482 |
|
| Owens Corning, Inc. company guaranty unsec. | | |
| unsub. notes 9s, 2019 | 324,000 | 382,320 |
|
| Staples, Inc. sr. unsec. notes 9 3/4s, 2014 | 445,000 | 548,204 |
|
| Time Warner Entertainment Co., LP debs. 8 3/8s, 2023 | 170,000 | 220,070 |
|
| Time Warner, Inc. company guaranty sr. unsec. notes 6.1s, 2040 | 525,000 | 552,683 |
|
| Time Warner, Inc. company guaranty sr. unsec. notes 4.7s, 2021 | 120,000 | 123,912 |
|
| Time Warner, Inc. debs. 9.15s, 2023 | 340,000 | 463,889 |
|
| Viacom, Inc. company guaranty 5 5/8s, 2012 | 158,000 | 169,228 |
|
| Viacom, Inc. company guaranty sr. unsec. notes 8 5/8s, 2012 | 32,000 | 35,426 |
|
| Viacom, Inc. unsec. sr. company guaranty 7 7/8s, 2030 | 490,000 | 583,310 |
|
| Wal-Mart Stores, Inc. sr. unsec. unsub. notes 4 7/8s, 2040 | 290,000 | 285,306 |
|
| Whirlpool Corp. sr. unsec. notes 8.6s, 2014 | 110,000 | 131,223 |
|
| | | 13,960,244 |
| Consumer staples (1.4%) | | |
| Altria Group, Inc. company guaranty sr. unsec. | | |
| notes 9 1/4s, 2019 | 220,000 | 283,058 |
|
| Altria Group, Inc. company guaranty sr. unsec. | | |
| unsub. notes 8 1/2s, 2013 | 275,000 | 326,640 |
|
| Anheuser-Busch InBev Worldwide, Inc. 144A company | | |
| guaranty sr. notes 8.2s, 2039 | 165,000 | 225,085 |
|
| Anheuser-Busch InBev Worldwide, Inc. 144A company | | |
| guaranty sr. unsec. unsub. notes 7 3/4s, 2019 | 1,730,000 | 2,154,526 |
|
| Campbell Soup Co. debs. 8 7/8s, 2021 | 855,000 | 1,219,693 |
|
| CVS Caremark Corp. jr. unsec. sub. bonds FRB 6.302s, 2037 | 2,293,000 | 2,109,560 |
|
| CVS Caremark Corp. 144A company guaranty notes 7.507s, 2032 | 759,098 | 874,557 |
|
| CVS Caremark Corp. 144A pass-through certificates 6.117s, 2013 | 159,079 | 169,013 |
|
| Diageo PLC company guaranty 8s, 2022 (Canada) | 820,000 | 1,047,917 |
|
| Fortune Brands, Inc. sr. unsec. unsub. notes 3s, 2012 | 850,000 | 864,616 |
|
| General Mills, Inc. sr. unsec. notes 5.65s, 2019 | 130,000 | 148,820 |
|
| H.J. Heinz Finance Co. 144A company guaranty 7 1/8s, 2039 | 360,000 | 436,478 |
|
| Kraft Foods, Inc. notes 6 1/8s, 2018 | 765,000 | 881,142 |
|
| Kraft Foods, Inc. sr. unsec. unsub. notes 6 1/2s, 2040 | 2,009,000 | 2,317,071 |
|
| Kroger Co. company guaranty 6 3/4s, 2012 | 275,000 | 298,774 |
|
| Kroger Co. company guaranty 6.4s, 2017 | 500,000 | 589,503 |
|
| McDonald’s Corp. sr. unsec. Ser. MTN, 6.3s, 2038 | 535,000 | 644,890 |
|
| McDonald’s Corp. sr. unsec. notes 5.7s, 2039 | 600,000 | 690,563 |
|
| SABMiller PLC 144A notes 6 1/2s, 2018 (United Kingdom) | 540,000 | 628,841 |
|
| Tesco PLC 144A sr. unsec. unsub. notes 6.15s, 2037 | | |
| (United Kingdom) | 640,000 | 725,632 |
|
30
| | |
| CORPORATE BONDS AND NOTES (15.7%)* cont. | Principal amount | Value |
|
| Consumer staples cont. | | |
| Tyson Foods, Inc. sr. unsec. notes 8 1/4s, 2011 | $285,000 | $303,881 |
|
| WPP Finance UK company guaranty sr. unsec. notes 8s, 2014 | | |
| (United Kingdom) | 690,000 | 818,524 |
|
| Wrigley (Wm.) Jr. Co. 144A company guaranty sr. notes 3.7s, 2014 | 355,000 | 363,300 |
|
| | | 18,122,084 |
| Energy (0.7%) | | |
| Chesapeake Energy Corp. sr. unsec. notes 7 5/8s, 2013 | 10,000 | 10,725 |
|
| Devon Energy Corp. sr. notes 6.3s, 2019 | 265,000 | 311,225 |
|
| El Paso Pipeline Partners Operating Co., LP company | | |
| guaranty sr. unsec. notes 6 1/2s, 2020 | 235,000 | 246,163 |
|
| EnCana Corp. sr. unsec. notes 6 1/2s, 2019 (Canada) | 175,000 | 206,729 |
|
| EOG Resources, Inc. sr. unsec. notes 5 5/8s, 2019 | 205,000 | 235,185 |
|
| Forest Oil Corp. sr. notes 8s, 2011 | 610,000 | 643,550 |
|
| Motiva Enterprises, LLC 144A sr. notes 5.2s, 2012 | 225,000 | 241,598 |
|
| Motiva Enterprises, LLC 144A sr. unsec. notes 6.85s, 2040 | 220,000 | 260,881 |
|
| Newfield Exploration Co. sr. sub. notes 6 5/8s, 2016 | 650,000 | 679,250 |
|
| Nexen, Inc. sr. unsec. unsub. notes 7 1/2s, 2039 (Canada) | 325,000 | 400,529 |
|
| Peabody Energy Corp. sr. notes 5 7/8s, 2016 | 805,000 | 817,075 |
|
| Ras Laffan Liquefied Natural Gas Co., Ltd. 144A company | | |
| guaranty sr. notes 5 1/2s, 2014 (Qatar) | 675,000 | 735,013 |
|
| Total Capital SA company guaranty sr. unsec. | | |
| unsub. notes 4.45s, 2020 (France) | 460,000 | 487,994 |
|
| Weatherford International, Inc. company guaranty sr. unsec. | | |
| unsub. bonds 6.8s, 2037 | 245,000 | 247,701 |
|
| Weatherford International, Inc. company guaranty sr. unsec. | | |
| unsub. bonds 6.35s, 2017 | 280,000 | 305,754 |
|
| Weatherford International, Ltd. company guaranty sr. unsec. | | |
| notes 9 5/8s, 2019 (Switzerland) | 180,000 | 227,945 |
|
| Weatherford International, Ltd. sr. notes 5 1/2s, 2016 | | |
| (Switzerland) | 455,000 | 486,618 |
|
| Williams Partners LP sr. unsec. notes 6.3s, 2040 | 545,000 | 582,758 |
|
| Williams Partners LP sr. unsec. notes 5 1/4s, 2020 | 910,000 | 971,754 |
|
| Woodside Finance Ltd. 144A notes 4 1/2s, 2014 (Australia) | 325,000 | 338,456 |
|
| XTO Energy, Inc. sr. unsec. unsub. notes 6 1/2s, 2018 | 180,000 | 221,643 |
|
| | | 8,658,546 |
| Financials (5.0%) | | |
| Aflac, Inc. sr. unsec. notes 6.9s, 2039 | 300,000 | 312,720 |
|
| American Express Bank FSB notes Ser. BKN1, 5.55s, 2012 | 1,160,000 | 1,251,928 |
|
| American Express Bank FSB sr. unsec. FRN Ser. BKNT, 0.643s, 2017 | 545,000 | 498,884 |
|
| American Express Travel Related Services Co., Inc. | | |
| sr. unsec. unsub. notes FRN Ser. EMTN, 0.546s, 2011 | 385,000 | 379,352 |
|
| AON Corp. jr. unsec. sub. notes 8.205s, 2027 | 620,000 | 651,310 |
|
| Bank of America NA sub. notes Ser. BKNT, 5.3s, 2017 | 315,000 | 321,712 |
|
| Bank One Corp. unsec. unsub. notes 5.9s, 2011 | 1,000,000 | 1,049,473 |
|
| BankAmerica Capital III bank guaranty jr. unsec. sub. FRN 1.096s, 2027 | 2,755,000 | 1,825,469 |
|
| Barclays Bank PLC sr. unsec. unsub. notes 5s, 2016 | 270,000 | 289,342 |
|
| Barclays Bank PLC 144A sub. notes 10.179s, 2021 | 804,000 | 1,056,938 |
|
| Barclays Bank PLC 144A unsec. sub. notes 6.05s, 2017 | 1,415,000 | 1,479,421 |
|
| Bear Stearns Cos., Inc. (The) sr. notes 6.4s, 2017 | 500,000 | 575,607 |
|
31
| | |
| CORPORATE BONDS AND NOTES (15.7%)* cont. | Principal amount | Value |
|
| Financials cont. | | |
| Bear Stearns Cos., Inc. (The) sr. unsec. notes 7 1/4s, 2018 | $331,000 | $394,370 |
|
| Bosphorus Financial Services, Ltd. 144A sr. notes FRN 2.236s, 2012 | 1,040,375 | 1,019,654 |
|
| Capital One Bank USA NA sub. notes 8.8s, 2019 | 385,000 | 490,164 |
|
| Capital One Capital III company guaranty 7.686s, 2036 | 320,000 | 318,400 |
|
| Capital One Capital V company guaranty jr. unsec. | | |
| sub. notes 10 1/4s, 2039 | 450,000 | 487,125 |
|
| Chubb Corp. (The) sr. notes 6 1/2s, 2038 | 765,000 | 896,383 |
|
| Citigroup, Inc. sr. unsec. sub. FRN 0.807s, 2016 | 123,000 | 102,279 |
|
| Citigroup, Inc. sr. unsec. unsub. notes 5 1/4s, 2012 | 1,270,000 | 1,324,709 |
|
| Citigroup, Inc. sr. unsec. unsub. notes FRN 0.573s, 2010 | 905,000 | 905,060 |
|
| Citigroup, Inc. sub. notes 5s, 2014 | 1,369,000 | 1,395,813 |
|
| Citigroup, Inc. unsec. sub. notes 6 5/8s, 2032 | 31,000 | 30,504 |
|
| CNA Financial Corp. unsec. notes 6s, 2011 | 730,000 | 758,144 |
|
| Commonwealth Bank of Australia 144A sr. unsec. | | |
| notes 3 3/4s, 2014 (Australia) | 1,220,000 | 1,279,457 |
|
| Credit Suisse Guernsey, Ltd. jr. sub. FRN 5.86s, 2049 | | |
| (United Kingdom) | 934,000 | 849,940 |
|
| Credit Suisse USA, Inc. sr. unsec. notes 5.3s, 2019 | 475,000 | 520,913 |
|
| Deutsche Bank AG/London sr. unsec. notes 3 7/8s, 2014 | | |
| (United Kingdom) | 635,000 | 668,684 |
|
| Deutsche Bank Capital Funding Trust VII 144A FRB 5.628s, 2049 | 285,000 | 226,575 |
|
| Duke Realty LP sr. unsec. notes 6 1/2s, 2018 R | 361,000 | 386,235 |
|
| Duke Realty LP sr. unsec. notes 6 1/4s, 2013 R | 19,000 | 20,509 |
|
| Erac USA Finance LLC 144A company | | |
| guaranty sr. notes 5 1/4s, 2020 | 270,000 | 274,070 |
|
| Erac USA Finance LLC 144A company | | |
| guaranty sr. notes 2 3/4s, 2013 | 10,000 | 10,155 |
|
| Fleet Capital Trust V bank guaranty jr. sub. FRN 1.539s, 2028 | 1,057,000 | 773,487 |
|
| Fund American Cos., Inc. notes 5 7/8s, 2013 | 347,000 | 363,861 |
|
| GATX Financial Corp. notes 5.8s, 2016 | 560,000 | 600,571 |
|
| GE Capital Trust I unsec. sub. bonds FRB 6 3/8s, 2067 | 355,000 | 337,250 |
|
| General Electric Capital Corp. sr. unsec. 5 5/8s, 2018 | 260,000 | 283,546 |
|
| General Electric Capital Corp. sr. unsec. FRN Ser. MTN, | | |
| 0.628s, 2016 | 455,000 | 414,712 |
|
| General Electric Capital Corp. sr. unsec. FRN Ser. MTN, | | |
| 0.474s, 2012 | 1,720,000 | 1,684,814 |
|
| General Electric Capital Corp. sr. unsec. notes Ser. MTN, | | |
| 6 7/8s, 2039 | 1,589,000 | 1,794,211 |
|
| Goldman Sachs Group, Inc. (The) sr. notes 7 1/2s, 2019 | 805,000 | 937,348 |
|
| Goldman Sachs Group, Inc. (The) sub. notes 6 3/4s, 2037 | 745,000 | 761,857 |
|
| HCP, Inc. sr. unsec. Ser. MTN, 6.7s, 2018 R | 15,000 | 16,157 |
|
| Health Care Property Investors, Inc. sr. unsec. notes 6s, 2017 | 295,000 | 306,101 |
|
| Highwood Properties, Inc. sr. unsec. bonds 5.85s, 2017 R | 1,005,000 | 1,010,997 |
|
| HSBC Finance Capital Trust IX FRN 5.911s, 2035 | 2,000,000 | 1,750,000 |
|
| HSBC Holdings PLC sub. notes 6 1/2s, 2037 (United Kingdom) | 905,000 | 980,523 |
|
| JPMorgan Chase Bank NA sub. notes Ser. BKNT, 6s, 2017 | 1,000,000 | 1,123,911 |
|
| JPMorgan Chase Capital XVIII bonds Ser. R, 6.95s, 2036 | 499,000 | 503,991 |
|
32
| | |
| CORPORATE BONDS AND NOTES (15.7%)* cont. | Principal amount | Value |
|
| Financials cont. | | |
| JPMorgan Chase Capital XXIII company guaranty jr. unsec. | | |
| sub. notes FRN 1.436s, 2047 | $2,443,000 | $1,748,059 |
|
| JPMorgan Chase Capital XXV bonds Ser. Y, 6.8s, 2037 | 523,000 | 532,274 |
|
| Liberty Mutual Group 144A company guaranty jr. | | |
| sub. notes FRB 10 3/4s, 2058 | 1,285,000 | 1,441,112 |
|
| Liberty Mutual Insurance 144A notes 7.697s, 2097 | 1,060,000 | 910,440 |
|
| Massachusetts Mutual Life Insurance Co. 144A notes 8 7/8s, 2039 | 495,000 | 652,777 |
|
| Merrill Lynch & Co., Inc. jr. sub. bonds 7 3/4s, 2038 | 1,565,000 | 1,775,489 |
|
| Merrill Lynch & Co., Inc. notes FRN Ser. MTN, 0.698s, 2011 | 835,000 | 832,397 |
|
| MetLife Capital Trust IV 144A jr. sub. debs. 7 7/8s, 2067 | 1,300,000 | 1,300,000 |
|
| MetLife, Inc. jr. unsec. sub. notes 6.4s, 2036 | 590,000 | 547,225 |
|
| Nationwide Financial Services, Inc. notes 5 5/8s, 2015 | 465,000 | 490,712 |
|
| Nationwide Health Properties, Inc. notes 6 1/2s, 2011 R | 680,000 | 709,480 |
|
| Nationwide Mutual Insurance Co. 144A notes 8 1/4s, 2031 | 415,000 | 435,963 |
|
| OneAmerica Financial Partners, Inc. 144A bonds 7s, 2033 | 370,000 | 335,863 |
|
| Pacific LifeCorp 144A sr. notes 6s, 2020 | 365,000 | 385,049 |
|
| Progressive Corp. (The) jr. unsec. sub. unsec. deb. FRN 6.7s, 2037 | 2,020,000 | 1,936,776 |
|
| Prudential Financial, Inc. sr. notes 7 3/8s, 2019 | 600,000 | 709,297 |
|
| Prudential Financial, Inc. sr. notes 6.2s, 2015 | 190,000 | 210,724 |
|
| Prudential Holdings LLC sr. notes FRN Ser. AGM, 1.414s, 2017 | 210,000 | 172,044 |
|
| Royal Bank of Scotland Group PLC sr. unsec. unsub. notes 6.4s, 2019 | | |
| (United Kingdom) | 355,000 | 375,005 |
|
| Simon Property Group LP sr. unsec. notes 6 3/4s, 2014 R | 876,000 | 995,899 |
|
| Simon Property Group LP sr. unsec. unsub. notes 5.65s, 2020 R | 566,000 | 620,926 |
|
| State Street Capital Trust IV company guaranty jr. unsec. | | |
| sub. bond FRB 1.537s, 2037 | 1,790,000 | 1,275,096 |
|
| Tanger Properties, Ltd. sr. unsec. notes 6 1/8s, 2020 | 265,000 | 279,919 |
|
| TD Ameritrade Holding Corp. company guaranty sr. unsec. | | |
| unsub. notes 5.6s, 2019 | 480,000 | 513,745 |
|
| Teachers Insurance & Annuity Association of America 144A | | |
| notes 6.85s, 2039 | 750,000 | 880,626 |
|
| Travelers Cos., Inc. (The) sr. unsec. notes 5.9s, 2019 | 130,000 | 146,680 |
|
| Vornado Realty LP sr. unsec. unsub. notes 4 1/4s, 2015 R | 555,000 | 560,894 |
|
| Wachovia Bank NA sub. notes Ser. BKNT, 6s, 2017 | 1,060,000 | 1,174,230 |
|
| Wachovia Capital Trust V 144A bank guaranty jr. unsec. | | |
| sub. note 7.965s, 2027 | 1,035,000 | 1,027,066 |
|
| Wachovia Corp. sr. unsec. notes 5 3/4s, 2017 | 145,000 | 159,991 |
|
| Wachovia Corp. sr. unsec. notes Ser. MTN, 5 1/2s, 2013 | 1,140,000 | 1,251,566 |
|
| WEA Finance LLC /WT Finance Aust. Pty. Ltd. 144A company | | |
| guaranty sr. unsec. notes 7 1/2s, 2014 | 895,000 | 1,034,405 |
|
| WEA Finance LLC/ WT Finance Aust. Pty. Ltd. 144A company | | |
| guaranty sr. unsec. notes 6 3/4s, 2019 | 900,000 | 1,032,372 |
|
| Wells Fargo Bank NA unsec. sub. notes FRN 0.646s, 2016 | 710,000 | 652,630 |
|
| Wells Fargo Capital XV jr. sub. unsec. company guaranty FRN | | |
| 9 3/4s, 2049 | 435,000 | 469,800 |
|
| Westpac Capital Trust III 144A unsec. sub. notes FRN | | |
| 5.819s, 2049 (Australia) | 1,010,000 | 967,580 |
|
| ZFS Finance USA Trust I 144A bonds FRB 6 1/2s, 2037 | 159,000 | 142,703 |
|
| ZFS Finance USA Trust III 144A jr. sub. bonds FRB 1.687s, 2065 | 700,000 | 658,000 |
|
| | | 65,039,450 |
33
| | |
| CORPORATE BONDS AND NOTES (15.7%)* cont. | Principal amount | Value |
|
| Government (1.7%) | | |
| European Investment Bank sr. unsec. unsub. notes 4 7/8s, | | |
| 2036 (Supra-Nation) | $4,000,000 | $4,255,480 |
|
| International Bank for Reconstruction & Development unsec. | | |
| unsub. bonds 7 5/8s, 2023 (Supra-Nation) | 4,000,000 | 5,599,156 |
|
| Kreditanstalt fuer Wiederaufbau govt. guaranty sr. unsec. | | |
| notes 3 1/2s, 2014 (Germany) | 12,000,000 | 12,818,304 |
|
| | | 22,672,940 |
| Health care (0.2%) | | |
| Aetna, Inc. sr. unsec. unsub. notes 6 3/4s, 2037 | 95,000 | 107,705 |
|
| Eli Lilly & Co. sr. unsec. unsub. notes 5.95s, 2037 | 50,000 | 57,247 |
|
| Express Scripts, Inc. sr. unsec. notes 7 1/4s, 2019 | 110,000 | 135,170 |
|
| Express Scripts, Inc. sr. unsec. notes 6 1/4s, 2014 | 275,000 | 313,186 |
|
| GlaxoSmith Kline Capital, Inc. company | | |
| guaranty sr. notes 5.65s, 2018 | 460,000 | 532,134 |
|
| Hospira, Inc. sr. notes 6.05s, 2017 | 25,000 | 28,206 |
|
| Quest Diagnostics, Inc. company guaranty sr. unsec. | | |
| notes 5 3/4s, 2040 | 224,000 | 219,962 |
|
| Quest Diagnostics, Inc. company guaranty sr. unsec. | | |
| notes 4 3/4s, 2020 | 121,000 | 123,326 |
|
| UnitedHealth Group, Inc. sr. unsec. notes 5.8s, 2036 | 180,000 | 183,374 |
|
| Ventas Realty LP/Capital Corp. sr. notes 6 3/4s, 2017 R | 470,000 | 484,211 |
|
| Watson Pharmaceuticals, Inc. sr. unsec. notes 6 1/8s, 2019 | 310,000 | 352,214 |
|
| WellPoint, Inc. notes 7s, 2019 | 155,000 | 184,511 |
|
| | | 2,721,246 |
| Technology (0.2%) | | |
| Amphenol Corp. sr. unsec. notes 4 3/4s, 2014 | 610,000 | 650,535 |
|
| Dell, Inc. sr. unsec. notes 5 7/8s, 2019 | 715,000 | 814,757 |
|
| Xerox Corp. sr. unsec. notes 6 3/4s, 2039 | 485,000 | 543,673 |
|
| Xerox Corp. sr. unsec. unsub. notes 5 5/8s, 2019 | 188,000 | 203,128 |
|
| Xerox Corp. sr. unsec. unsub. notes 4 1/4s, 2015 | 237,000 | 250,388 |
|
| | | 2,462,481 |
| Transportation (0.3%) | | |
| American Airlines, Inc. pass-through certificates | | |
| Ser. 01-1, 6.817s, 2011 | 100,000 | 101,250 |
|
| Burlington Northern Santa Fe Corp. sr. unsec. notes 7s, 2014 | 275,000 | 320,662 |
|
| Burlington Northern Santa Fe Corp. sr. unsec. notes 4.7s, 2019 | 425,000 | 451,667 |
|
| Burlington Northern Santa Fe, LLC debs. 5 3/4s, 2040 | 145,000 | 154,041 |
|
| Continental Airlines, Inc. pass-through certificates | | |
| Ser. 97-4A, 6.9s, 2018 | 121,818 | 124,864 |
|
| Continental Airlines, Inc. pass-through certificates | | |
| Ser. 98-1A, 6.648s, 2017 | 359,006 | 366,186 |
|
| Northwest Airlines Corp. pass-through certificates | | |
| Ser. 00-1, 7.15s, 2019 | 1,427,081 | 1,377,134 |
|
| Southwest Airlines Co. pass-through certificates Ser. 07-1, | | |
| 6.15s, 2022 | 778,062 | 823,649 |
|
| Union Pacific Corp. 144A pass-through certificates 5.214s, 2014 | 590,000 | 649,136 |
|
| | | 4,368,589 |
| Utilities and power (2.4%) | | |
| AEP Texas North Co. sr. notes Ser. B, 5 1/2s, 2013 | 500,000 | 544,030 |
|
| Appalachian Power Co. sr. notes Ser. L, 5.8s, 2035 | 510,000 | 525,238 |
|
| Aquila, Inc. sr. unsec. unsub. notes 11 7/8s, 2012 | 735,000 | 845,351 |
|
34
| | |
| CORPORATE BONDS AND NOTES (15.7%)* cont. | Principal amount | Value |
|
| Utilities and power cont. | | |
| Atmos Energy Corp. sr. unsub. notes 6.35s, 2017 | $1,230,000 | $1,377,877 |
|
| Beaver Valley II Funding debs. 9s, 2017 | 639,000 | 714,281 |
|
| Boardwalk Pipelines LP company guaranty 5 7/8s, 2016 | 975,000 | 1,085,097 |
|
| Bruce Mansfield Unit pass-through certificates 6.85s, 2034 | 2,255,563 | 2,367,890 |
|
| CenterPoint Energy Resources Corp. notes 7 3/4s, 2011 | 45,000 | 46,553 |
|
| Commonwealth Edison Co. 1st mtge. 6.15s, 2017 | 275,000 | 318,488 |
|
| Commonwealth Edison Co. 1st mtge. sec. bonds 5 7/8s, 2033 | 500,000 | 546,056 |
|
| Commonwealth Edison Co. 1st mtge. sec. bonds 5.8s, 2018 | 495,000 | 569,178 |
|
| Consolidated Natural Gas Co. sr. notes Ser. A, 5s, 2014 | 530,000 | 585,193 |
|
| DCP Midstream, LLC 144A sr. unsec. notes 5.35s, 2020 | 375,000 | 387,536 |
|
| Dominion Resources, Inc. jr. sub. notes FRN Ser. 06-B, 6.3s, 2066 | 2,310,000 | 2,174,288 |
|
| Dominion Resources, Inc. sr. unsec. unsub. notes Ser. 07-A, 6s, 2017 | 10,000 | 11,597 |
|
| El Paso Natural Gas Co. sr. unsec. unsub. bonds 8 3/8s, 2032 | 490,000 | 584,902 |
|
| Electricite de France 144A notes 6.95s, 2039 (France) | 655,000 | 836,315 |
|
| Electricite de France 144A sr. notes 5.6s, 2040 (France) | 640,000 | 692,948 |
|
| Electricite de France 144A sr. notes 4.6s, 2020 (France) | 440,000 | 466,827 |
|
| Enel Finance Intl. SA 144A company guaranty sr. unsec. | | |
| notes 5 1/8s, 2019 (Luxembourg) | 360,000 | 373,180 |
|
| Entergy Gulf States, Inc. 1st mtge. 5 1/4s, 2015 | 454,000 | 454,662 |
|
| FirstEnergy Corp. notes Ser. B, 6.45s, 2011 | 164,000 | 172,524 |
|
| Illinois Power Co. 1st mtge. sr. bond 9 3/4s, 2018 | 725,000 | 952,771 |
|
| ITC Holdings Corp. 144A notes 5 7/8s, 2016 | 272,000 | 297,133 |
|
| ITC Holdings Corp. 144A sr. unsec. notes 6.05s, 2018 | 365,000 | 407,736 |
|
| Kansas Gas & Electric bonds 5.647s, 2021 | 349,857 | 363,473 |
|
| National Fuel Gas Co. notes 5 1/4s, 2013 | 30,000 | 31,860 |
|
| Nevada Power Co. mtge. sec. notes 7 1/8s, 2019 | 295,000 | 357,790 |
|
| NiSource Finance Corp. company guaranty sr. unsec. | | |
| notes 10 3/4s, 2016 | 360,000 | 468,684 |
|
| NiSource Finance Corp. company guaranty sr. unsec. | | |
| unsub. notes 7 7/8s, 2010 | 2,440,000 | 2,483,010 |
|
| Pacific Gas & Electric Co. sr. unsec. notes 6.35s, 2038 | 350,000 | 412,626 |
|
| Pacific Gas & Electric Co. sr. unsub. 5.8s, 2037 | 140,000 | 153,533 |
|
| Potomac Edison Co. 144A 1st mtge. 5.8s, 2016 | 331,000 | 352,971 |
|
| Power Receivable Finance, LLC 144A sr. notes 6.29s, 2012 | 1,067,078 | 1,067,441 |
|
| PPL Energy Supply LLC bonds Ser. A, 5.7s, 2015 | 50,000 | 55,567 |
|
| Public Service Co. of Colorado 1st mtge. sec. bonds 5 1/8s, 2019 | 175,000 | 197,030 |
|
| Puget Sound Energy, Inc. jr. sub. FRN Ser. A, 6.974s, 2067 | 656,000 | 610,933 |
|
| Southern California Edison Co. 1st mtge. bonds 5 1/2s, 2040 | 840,000 | 921,164 |
|
| Spectra Energy Capital, LLC company guaranty sr. unsec. | | |
| unsub. notes 6.2s, 2018 | 1,080,000 | 1,206,836 |
|
| Spectra Energy Capital, LLC sr. notes 8s, 2019 | 820,000 | 1,018,821 |
|
| Texas-New Mexico Power Co. 144A 1st mtge. sec. 9 1/2s, 2019 | 1,019,000 | 1,300,001 |
|
| TransAlta Corp. sr. notes 6 1/2s, 2040 (Canada) | 200,000 | 208,995 |
|
| TransAlta Corp. sr. unsec. notes 5 3/4s, 2013 (Canada) | 665,000 | 734,631 |
|
| TransCanada Pipelines, Ltd. jr. sub. FRN 6.35s, 2067 (Canada) | 520,000 | 473,200 |
|
| Union Electric Co. 1st mtge. sr. sec. bond 6.7s, 2019 | 960,000 | 1,125,530 |
|
| | | 30,881,747 |
| | | |
| Total corporate bonds and notes (cost $191,227,151) | | $205,675,399 |
35
| | |
| MORTGAGE-BACKED SECURITIES (2.7%)* | Principal amount | Value |
|
| Banc of America Commercial Mortgage, Inc. 144A Ser. 05-1, | | |
| Class XW, IO, 0.097s, 2042 | $207,477,036 | $272,334 |
|
| Banc of America Large Loan 144A FRB Ser. 05-MIB1, Class J, | | |
| 1.391s, 2022 | 1,400,000 | 818,580 |
|
| Bayview Commercial Asset Trust 144A | | |
| Ser. 07-5A, IO, 3.047s, 2037 | 8,281,325 | 886,102 |
| Ser. 04-2, IO, 2.97s, 2034 | 3,247,759 | 83,467 |
| Ser. 05-1A, IO, 2.87s, 2035 | 3,736,101 | 137,115 |
| Ser. 04-3, IO, 2.87s, 2035 | 2,514,421 | 83,730 |
| Ser. 06-2A, IO, 2.416s, 2036 | 2,234,037 | 142,978 |
| Ser. 05-3A, IO, 2.15s, 2035 | 11,499,727 | 561,187 |
|
| Bear Stearns Commercial Mortgage Securities, Inc. | | |
| FRB Ser. 00-WF2, Class F, 8.192s, 2032 | 456,000 | 387,740 |
| Ser. 04-PR3I, Class X1, IO, 0.318s, 2041 | 11,350,197 | 183,147 |
| Ser. 05-PWR9, Class X1, IO, 0.191s, 2042 | 39,025,496 | 297,765 |
|
| Bear Stearns Commercial Mortgage Securities, Inc. 144A | | |
| Ser. 06-PW14, Class X1, IO, 0.137s, 2038 F | 19,014,854 | 303,845 |
| Ser. 07-PW15, Class X1, IO, 0.105s, 2044 | 63,383,059 | 441,780 |
| Ser. 05-PW10, Class X1, IO, 0.06s, 2040 | 60,927,845 | 27,418 |
|
| Citigroup/Deutsche Bank Commercial Mortgage Trust 144A | | |
| Ser. 07-CD4, Class XW, IO, 0.374s, 2049 | 26,471,952 | 456,906 |
| Ser. 06-CD2, Class X, IO, 0.085s, 2046 | 74,982,501 | 232,690 |
|
| Commercial Mortgage Pass-Through Certificates 144A | | |
| Ser. 03-LB1A, Class X1, IO, 1.55s, 2038 F | 7,790,493 | 269,069 |
| Ser. 05-LP5, Class XC, IO, 0.186s, 2043 | 49,907,311 | 467,267 |
| Ser. 06-C8, Class XS, IO, 0.147s, 2046 | 55,383,370 | 585,418 |
| Ser. 05-C6, Class XC, IO, 0.072s, 2044 | 55,433,860 | 312,835 |
|
| Countrywide Home Loans 144A IFB Ser. 05-R2, Class 2A3, 8s, 2035 | 691,671 | 629,421 |
|
| Credit Suisse Mortgage Capital Certificates Ser. 06-C5, | | |
| Class AX, IO, 0.148s, 2039 F | 35,935,389 | 528,962 |
|
| CRESI Finance Limited Partnership 144A | | |
| FRB Ser. 06-A, Class D, 1.129s, 2017 | 232,000 | 101,384 |
| FRB Ser. 06-A, Class C, 0.929s, 2017 | 688,000 | 364,846 |
|
| Criimi Mae Commercial Mortgage Trust 144A Ser. 98-C1, | | |
| Class B, 7s, 2033 | 403,340 | 403,743 |
|
| Federal Home Loan Mortgage Corp. Structured | | |
| Pass-Through Securities | | |
| Ser. T-56, Class A, IO, 0.398s, 2043 | 6,406,308 | 138,544 |
| Ser. T-56, Class 1, IO, zero %, 2043 | 9,952,480 | 80,016 |
| Ser. T-56, Class 2, IO, zero %, 2043 | 9,122,167 | 681 |
| Ser. T-56, Class 3, IO, zero %, 2043 | 7,439,674 | 53,990 |
|
| Federal National Mortgage Association | | |
| IFB Ser. 04-12, Class WS, IO, 6.821s, 2033 | 70,304 | 9,861 |
| Ser. 03-W3, Class 2IO1, IO, 0.673s, 2042 | 2,308,506 | 59,701 |
| Ser. 03-W6, Class 51, IO, 0.658s, 2042 | 7,211,808 | 170,856 |
| Ser. 03-W2, Class 1, IO, 0.466s, 2042 | 13,445,188 | 186,709 |
| Ser. 02-T4, IO, 0.445s, 2041 | 5,387,882 | 84,186 |
| Ser. 03-W3, Class 1, IO, 0.443s, 2042 | 17,831,641 | 241,580 |
| Ser. 02-T1, Class IO, IO, 0.423s, 2031 | 14,574,802 | 249,518 |
| Ser. 03-W6, Class 3, IO, 0.368s, 2042 | 10,075,928 | 135,612 |
36
| | |
| MORTGAGE-BACKED SECURITIES (2.7%)* cont. | Principal amount | Value |
|
| Federal National Mortgage Association | | |
| Ser. 03-W6, Class 23, IO, 0.351s, 2042 | $10,611,115 | $139,738 |
| Ser. 01-79, Class BI, IO, 0.317s, 2045 | 2,424,715 | 31,028 |
| Ser. 03-W4, Class 3A, IO, 0.088s, 2042 | 9,855,603 | 46,817 |
|
| First Union National Bank-Bank of America Commercial | | |
| Mortgage 144A Ser. 01-C1, Class 3, IO, 1.643s, 2033 | 21,321,146 | 59,100 |
|
| First Union-Lehman Brothers Commercial Mortgage Trust II | | |
| Ser. 97-C2, Class G, 7 1/2s, 2029 | 832,000 | 891,420 |
|
| Freddie Mac IFB Ser. 3476, Class S, IO, 5.759s, 2038 | 272,598 | 22,339 |
|
| GE Capital Commercial Mortgage Corp. 144A | | |
| Ser. 07-C1, Class XC, IO, 0.099s, 2049 | 180,811,251 | 878,869 |
| Ser. 05-C3, Class XC, IO, 0.057s, 2045 | 175,505,305 | 920,460 |
|
| GMAC Commercial Mortgage Securities, Inc. Ser. 05-C1, | | |
| Class X1, IO, 0.311s, 2043 | 60,918,297 | 794,685 |
|
| GMAC Commercial Mortgage Securities, Inc. 144A | | |
| Ser. 99-C3, Class G, 6.974s, 2036 | 467,884 | 360,271 |
| Ser. 06-C1, Class XC, IO, 0.072s, 2045 | 119,232,719 | 617,137 |
|
| Government National Mortgage Association | | |
| IFB Ser. 10-14, Class SA, IO, 7.662s, 2032 | 103,662 | 15,260 |
| IFB Ser. 06-16, Class GS, IO, 6.652s, 2036 | 479,859 | 61,139 |
| IFB Ser. 07-16, Class PU, IO, 6.312s, 2037 | 65,155 | 8,199 |
| IFB Ser. 06-34, Class PS, IO, 6.252s, 2036 | 51,956 | 6,057 |
| IFB Ser. 07-35, Class KY, IO, 6.109s, 2037 | 200,595 | 20,948 |
| IFB Ser. 10-14, Class SC, IO, 4.454s, 2035 | 164,996 | 24,514 |
| FRB Ser. 07-73, Class KI, IO, zero %, 2037 | 2,616,337 | 28,152 |
|
| GS Mortgage Securities Corp. II 144A Ser. 98-C1, Class F, | | |
| 6s, 2030 | 1,165,018 | 1,174,338 |
|
| GSMPS Mortgage Loan Trust | | |
| Ser. 05-RP3, Class 1A4, 8 1/2s, 2035 | 183,866 | 174,880 |
| Ser. 05-RP3, Class 1A3, 8s, 2035 | 588,800 | 529,920 |
| Ser. 05-RP3, Class 1A2, 7 1/2s, 2035 | 490,955 | 446,769 |
|
| GSMPS Mortgage Loan Trust 144A | | |
| Ser. 05-RP2, Class 1A3, 8s, 2035 | 702,933 | 632,640 |
| Ser. 05-RP1, Class 1A3, 8s, 2035 | 94,577 | 92,383 |
| Ser. 05-RP2, Class 1A2, 7 1/2s, 2035 | 790,207 | 719,089 |
|
| HASCO NIM Trust 144A Ser. 05-OP1A, Class A, 6 1/4s, | | |
| 2035 (In default) † | 242,459 | 25 |
|
| JPMorgan Chase Commercial Mortgage | | |
| Securities Corp. 144A | | |
| Ser. 05-CB12, Class X1, IO, 0.146s, 2037 | 52,440,631 | 415,765 |
| Ser. 06-LDP6, Class X1, IO, 0.062s, 2043 | 64,844,130 | 218,492 |
|
| LB Commercial Conduit Mortgage Trust 144A | | |
| Ser. 99-C1, Class F, 6.41s, 2031 | 715,303 | 604,605 |
| Ser. 99-C1, Class G, 6.41s, 2031 | 765,731 | 481,513 |
| Ser. 98-C4, Class H, 5.6s, 2035 | 1,074,000 | 912,900 |
|
| Lehman Brothers Floating Rate Commercial Mortgage Trust | | |
| 144A FRB Ser. 04-LLFA, Class H, 1.291s, 2017 | 733,000 | 646,048 |
|
| MASTR Reperforming Loan Trust 144A | | |
| Ser. 05-2, Class 1A3, 7 1/2s, 2035 | 530,302 | 493,181 |
| Ser. 05-1, Class 1A4, 7 1/2s, 2034 | 1,290,810 | 1,187,545 |
|
37
| | |
| MORTGAGE-BACKED SECURITIES (2.7%)* cont. | Principal amount | Value |
|
| Merit Securities Corp. 144A FRB Ser. 11PA, Class 3A1, | | |
| 0.945s, 2027 | $3,613,263 | $2,983,331 |
|
| Merrill Lynch Floating Trust 144A FRB Ser. 06-1, Class TM, | | |
| 0.841s, 2022 | 1,019,621 | 881,972 |
|
| Merrill Lynch Mortgage Investors, Inc. FRB Ser. 98-C3, | | |
| Class E, 6.848s, 2030 | 644,000 | 677,288 |
|
| Mezz Cap Commercial Mortgage Trust 144A | | |
| Ser. 04-C1, Class X, IO, 8.487s, 2037 | 2,468,621 | 234,519 |
| Ser. 04-C2, Class X, IO, 6.162s, 2040 | 2,356,195 | 199,098 |
| Ser. 05-C3, Class X, IO, 5.234s, 2044 | 2,683,843 | 214,707 |
|
| Morgan Stanley Capital 144A Ser. 05-RR6, Class X, IO, | | |
| 1.542s, 2043 | 8,652,527 | 185,078 |
|
| Mortgage Capital Funding, Inc. FRB Ser. 98-MC2, Class E, | | |
| 7.068s, 2030 | 1,020,000 | 1,032,750 |
|
| Nomura Asset Acceptance Corp. Ser. 04-R3, Class PT, 0.367s, 2035 | 336,936 | 313,350 |
|
| Nomura Asset Acceptance Corp. 144A Ser. 04-R2, Class PT, | | |
| 9.087s, 2034 | 253,561 | 235,811 |
|
| PNC Mortgage Acceptance Corp. 144A Ser. 00-C1, Class J, | | |
| 6 5/8s, 2033 | 456,000 | 22,800 |
|
| STRIPS 144A | | |
| Ser. 03-1A, Class L, 5s, 2018 | 757,000 | 643,450 |
| Ser. 03-1A, Class M, 5s, 2018 | 513,000 | 359,100 |
| Ser. 04-1A, Class L, 5s, 2018 | 79,429 | 55,601 |
|
| Structured Adjustable Rate Mortgage Loan Trust 144A | | |
| Ser. 04-NP2, Class A, 0.697s, 2034 | 429,657 | 343,726 |
|
| Wachovia Bank Commercial Mortgage Trust Ser. 06-C29, IO, | | |
| 0 3/8s, 2048 | 97,482,443 | 1,819,461 |
|
| Wachovia Bank Commercial Mortgage Trust 144A | | |
| FRB Ser. 05-WL5A, Class L, 3.641s, 2018 | 771,000 | 393,210 |
| Ser. 06-C23, Class XC, IO, 0.059s, 2045 | 88,321,651 | 425,710 |
| Ser. 06-C26, Class XC, IO, 0.041s, 2045 | 33,897,253 | 96,946 |
|
| Total mortgage-backed securities (cost $31,137,791) | | $35,165,117 |
| |
| |
| ASSET-BACKED SECURITIES (1.8%)* | Principal amount | Value |
|
| Accredited Mortgage Loan Trust | | |
| FRB Ser. 05-1, Class M2, 1.019s, 2035 | $161,723 | $58,714 |
| FRB Ser. 05-4, Class A2C, 0.539s, 2035 | 158,253 | 151,424 |
|
| AFC Home Equity Loan Trust Ser. 99-2, Class 1A, 0.757s, 2029 | 1,644,268 | 713,551 |
|
| Ameriquest Mortgage Securities, Inc. FRB Ser. 03-8, | | |
| Class M2, 2.954s, 2033 | 436,439 | 144,538 |
|
| Arcap REIT, Inc. 144A | | |
| Ser. 03-1A, Class E, 7.11s, 2038 | 1,283,000 | 230,940 |
| Ser. 04-1A, Class E, 6.42s, 2039 | 1,112,000 | 177,920 |
|
| Argent Securities, Inc. FRB Ser. 03-W3, Class M3, 2.599s, 2033 | 53,237 | 16,566 |
|
| Asset Backed Funding Certificates FRB Ser. 04-OPT2, | | |
| Class M2, 1.329s, 2033 | 217,440 | 170,222 |
|
| Bayview Financial Acquisition Trust | | |
| Ser. 04-B, Class A1, 1.325s, 2039 | 3,337,316 | 1,101,314 |
| FRB Ser. 04-D, Class A, 0.91s, 2044 | 659,666 | 594,902 |
|
38
| | |
| ASSET-BACKED SECURITIES (1.8%)* cont. | Principal amount | Value |
|
| Bayview Financial Acquisition Trust 144A FRN Ser. 04-B, | | |
| Class M2, 4 1/8s, 2039 | $158,486 | $74,964 |
|
| Bayview Financial Asset Trust 144A FRB Ser. 03-SSRA, | | |
| Class M, 1.679s, 2038 | 418,071 | 317,734 |
|
| Bear Stearns Asset Backed Securities, Inc. FRB Ser. 05-HE1, | | |
| Class M3, 1.259s, 2035 | 489,000 | 149,500 |
|
| Citigroup Mortgage Loan Trust, Inc. FRB Ser. 05-OPT1, | | |
| Class M1, 0.749s, 2035 | 324,987 | 253,722 |
|
| Countrywide Asset Backed Certificates | | |
| FRB Ser. 05-BC3, Class M1, 0.849s, 2035 | 285,340 | 265,132 |
| FRB Ser. 05-14, Class 3A2, 0.569s, 2036 | 116,993 | 108,033 |
|
| Credit-Based Asset Servicing and Securitization 144A | | |
| Ser. 06-MH1, Class B1, 6 1/4s, 2036 | 359,000 | 233,350 |
| Ser. 06-MH1, Class M2, 6 1/4s, 2036 | 214,000 | 201,160 |
|
| Crest, Ltd. 144A Ser. 03-2A, Class D2, 6.723s, 2038 | 1,617,000 | 404,250 |
|
| CS First Boston Mortgage Securities Corp. 144A | | |
| Ser. 04-FR1N, Class A, 5s, 2034 (In default) † | 152,004 | 16 |
|
| Equifirst Mortgage Loan Trust FRB Ser. 05-1, Class M5, | | |
| 0.999s, 2035 | 141,539 | 46,742 |
|
| Fieldstone Mortgage Investment Corp. FRB Ser. 05-1, | | |
| Class M3, 1.139s, 2035 | 149,684 | 149,071 |
|
| First Plus Home Loan Trust Ser. 97-3, Class B1, 7.79s, 2023 | 194,241 | — |
|
| Fort Point CDO, Ltd. FRB Ser. 03-2A, Class A2, 1.586s, 2038 | 616,000 | 3,080 |
|
| Foxe Basin, Ltd. 144A FRB Ser. 03-1A, Class A1, 1.037s, 2015 | 555,152 | 524,374 |
|
| G-Star, Ltd. 144A FRB Ser. 02-2A, Class BFL, 2.329s, 2037 | 308,000 | 52,396 |
|
| GEBL 144A | | |
| Ser. 04-2, Class D, 3.091s, 2032 | 484,710 | 21,812 |
| Ser. 04-2, Class C, 1.191s, 2032 | 181,619 | 18,162 |
|
| Green Tree Financial Corp. Ser. 95-8, Class B1, 7.3s, 2026 | 362,579 | 333,527 |
|
| Guggenheim Structured Real Estate Funding, Ltd. 144A | | |
| FRB Ser. 05-2A, Class D, 1.879s, 2030 | 1,164,031 | 116,403 |
| FRB Ser. 05-1A, Class D, 1.859s, 2030 | 497,786 | 62,223 |
|
| High Income Trust Securities 144A FRB Ser. 03-1A, Class A, | | |
| 0.874s, 2036 | 1,174,374 | 469,750 |
|
| Lehman Manufactured Housing Ser. 98-1, Class 1, IO, 0.807s, 2028 | 9,039,612 | 429,382 |
|
| LNR CDO, Ltd. 144A | | |
| FRB Ser. 03-1A, Class EFL, 3.331s, 2036 | 2,585,000 | 180,950 |
| FRB Ser. 02-1A, Class FFL, 3.079s, 2037 | 5,220,000 | 678,600 |
|
| Local Insight Media Finance, LLC Ser. 07-1W, Class A1, | | |
| 5.53s, 2012 | 3,862,127 | 2,394,519 |
|
| Long Beach Mortgage Loan Trust FRB Ser. 05-2, Class M4, | | |
| 0.949s, 2035 | 558,000 | 341,397 |
|
| Madison Avenue Manufactured Housing Contract | | |
| FRB Ser. 02-A, Class B1, 3.579s, 2032 | 4,059,503 | 3,815,933 |
| FRB Ser. 02-A, Class M2, 2.579s, 2032 | 278,000 | 247,420 |
| Ser. 02-A IO, 0.3s, 2032 | 96,873,470 | 1,695,286 |
|
| Marriott Vacation Club Owner Trust 144A | | |
| Ser. 04-2A, Class D, 5.389s, 2026 | 47,848 | 25,689 |
| Ser. 04-2A, Class C, 4.741s, 2026 | 44,020 | 28,096 |
| FRB Ser. 02-1A, Class A1, 1.038s, 2024 | 245,180 | 234,856 |
|
39
| | |
| ASSET-BACKED SECURITIES (1.8%)* cont. | Principal amount | Value |
|
| Mid-State Trust | | |
| Ser. 11, Class B, 8.221s, 2038 | $297,458 | $288,257 |
| Ser. 10, Class B, 7.54s, 2036 | 541,464 | 508,925 |
|
| Morgan Stanley ABS Capital I | | |
| FRB Ser. 05-HE2, Class M5, 1.009s, 2035 | 236,671 | 122,013 |
| FRB Ser. 05-HE1, Class M3, 0.849s, 2034 | 349,000 | 280,568 |
| FRB Ser. 06-NC4, Class M2, 0.629s, 2036 | 464,452 | 2,838 |
|
| N-Star Real Estate CDO, Ltd. 144A FRB Ser. 04-2A, Class C1, | | |
| 2.325s, 2039 | 544,000 | 108,800 |
|
| Navigator CDO, Ltd. 144A FRB Ser. 03-1A, Class A1, 0.926s, 2015 | 23,369 | 22,785 |
|
| New Century Home Equity Loan Trust FRB Ser. 03-4, Class M3, | | |
| 3.404s, 2033 | 24,429 | 14,231 |
|
| Oakwood Mortgage Investors, Inc. Ser. 02-C, Class A1, | | |
| 5.41s, 2032 | 2,916,350 | 2,624,715 |
|
| Oakwood Mortgage Investors, Inc. 144A | | |
| Ser. 01-B, Class A4, 7.21s, 2030 | 388,088 | 373,534 |
| Ser. 01-B, Class A3, 6.535s, 2023 | 112,347 | 106,753 |
|
| Park Place Securities, Inc. FRB Ser. 05-WCH1, Class M4, | | |
| 1.159s, 2036 | 227,000 | 69,545 |
|
| Residential Asset Securities Corp. FRB Ser. 05-EMX1, | | |
| Class M2, 1.059s, 2035 | 552,627 | 383,793 |
|
| SAIL Net Interest Margin Notes 144A Ser. 04-4A, Class B, | | |
| 7 1/2s, 2034 (In default) † | 214,965 | — |
|
| Securitized Asset Backed Receivables, LLC FRB Ser. 05-HE1, | | |
| Class M2, 0.979s, 2035 | 247,504 | 1,266 |
|
| South Coast Funding 144A FRB Ser. 3A, Class A2, 1.574s, | | |
| 2038 (In default) † | 470,000 | 2,350 |
|
| Structured Asset Securities Corp. 144A Ser. 98-RF3, | | |
| Class A, IO, 6.1s, 2028 | 1,767,254 | 332,832 |
|
| TIAA Real Estate CDO, Ltd. Ser. 03-1A, Class E, 8s, 2038 | 1,698,000 | 203,760 |
|
| Wells Fargo Home Equity Trust FRB Ser. 07-1, Class A3, | | |
| 0.649s, 2037 | 359,000 | 124,091 |
|
| Whinstone Capital Management, Ltd. 144A FRB Ser. 1A, | | |
| Class B3, 2.298s, 2044 (United Kingdom) | 591,276 | 195,111 |
|
| Total asset-backed securities (cost $43,066,509) | | $23,003,787 |
| |
| |
| INVESTMENT COMPANIES (0.7%)* | Shares | Value |
|
| Utilities Select Sector SPDR Fund | 312,600 | $9,493,662 |
|
| Total investment companies (cost $7,853,658) | | $9,493,662 |
| |
| |
| CONVERTIBLE PREFERRED STOCKS (0.4%)* | Shares | Value |
|
| Apache Corp. Ser. D, $3.00 cv. pfd. | 24,700 | $1,345,903 |
|
| Hartford Financial Services Group, Inc. (The) | | |
| $1.182 cv. pfd. | 145,819 | 3,572,566 |
|
| Total convertible preferred stocks (cost $4,640,636) | | $4,918,469 |
40
| | |
| MUNICIPAL BONDS AND NOTES (0.3%)* | Principal amount | Value |
|
| CA State G.O. Bonds (Build America Bonds), 7 1/2s, 4/1/34 | $215,000 | $239,368 |
|
| IL State G.O. Bonds | | |
| 4.421s, 1/1/15 | 420,000 | 420,000 |
| 4.071s, 1/1/14 | 1,250,000 | 1,259,113 |
|
| MI Tobacco Settlement Fin. Auth. Rev. Bonds, Ser. A, | | |
| 7.309s, 6/1/34 | 1,025,000 | 787,887 |
|
| North TX, Thruway Auth. Rev. Bonds (Build America Bonds), | | |
| 6.718s, 1/1/49 | 350,000 | 360,381 |
|
| Tobacco Settlement Fin. Auth. of WVA Rev. Bonds, Ser. A, | | |
| 7.467s, 6/1/47 | 1,385,000 | 1,027,144 |
|
| TX State, Trans. Comm. Rev. Bonds (Build America Bonds), | | |
| Ser. B, 5.178s, 4/1/30 | 400,000 | 409,912 |
|
| Total municipal bonds and notes (cost $5,022,836) | | $4,503,805 |
| |
| |
| SHORT-TERM INVESTMENTS (5.2%)* | Shares | Value |
|
| Putnam Money Market Liquidity Fund 0.12% e | 67,554,253 | $67,554,253 |
|
| Total short-term investments (cost $67,554,253) | | $67,554,253 |
| |
| |
| TOTAL INVESTMENTS | | |
|
| Total investments (cost $1,235,967,305) | | $1,318,521,746 |
Key to holding’s abbreviations
| |
| ADR | American Depository Receipts |
| EMTN | Euro Medium Term Notes |
| FDIC Guaranteed | Federal Deposit Insurance Corp. Guaranteed |
| FRB | Floating Rate Bonds |
| FRN | Floating Rate Notes |
| G.O. Bonds | General Obligation Bonds |
| IFB | Inverse Floating Rate Bonds |
| IO | Interest Only |
| MTN | Medium Term Notes |
| TBA | To Be Announced Commitments |
41
Notes to the fund’s portfolio
Unless noted otherwise, the notes to the fund’s portfolio are for the close of the fund’s reporting period, which ran from August 1, 2009 through July 31, 2010 (the reporting period).
* Percentages indicated are based on net assets of $1,306,797,110.
† Non-income-producing security.
e See Note 6 to the financial statements regarding investments in Putnam Money Market Liquidity Fund. The rate quoted in the security description is the annualized 7-day yield of the fund at the close of the reporting period.
F Is valued at fair value following procedures approved by the Trustees. Securities may be classified as Level 2 or Level 3 for Accounting Standards Codification ASC 820 Fair Value Measurements and Disclosures (ASC 820) based on the securities valuation inputs.
R Real Estate Investment Trust.
At the close of the reporting period, the fund maintained liquid assets totaling $104,609 to cover certain derivatives contracts.
Debt obligations are considered secured unless otherwise indicated.
144A after the name of an issuer represents securities exempt from registration under Rule 144A under the Securities Act of 1933, as amended. These securities may be resold in transactions exempt from registration, normally to qualified institutional buyers.
ADR after the name of a foreign holding represents ownership of foreign securities on deposit with a custodian bank.
See Note 1 to the financial statements regarding TBA’s.
The rates shown on FRB and FRN are the current interest rates at the close of the reporting period.
The dates shown on debt obligations are the original maturity dates.
IFB are securities that pay interest rates that vary inversely to changes in the market interest rates. As interest rates rise, inverse floaters produce less current income. The interest rates shown are the current interest rates at the close of the reporting period.
| | | | |
| TBA SALE COMMITMENTS OUTSTANDING at 7/31/10 (proceeds receivable $13,524,570) | |
|
| | Principal | | Settlement | |
| Agency | amount | | date | Value |
|
| FNMA, 5s, May 1, 2040 | $13,000,000 | | 5-13-10 | $13,975,000 |
|
| Total | | | | $13,975,000 |
42
ASC 820 establishes a three-level hierarchy for disclosure of fair value measurements. The valuation hierarchy is based upon the transparency of inputs to the valuation of the fund’s investments. The three levels are defined as follows:
Level 1 — Valuations based on quoted prices for identical securities in active markets.
Level 2 — Valuations based on quoted prices in markets that are not active or for which all significant inputs are observable, either directly or indirectly.
Level 3 — Valuations based on inputs that are unobservable and significant to the fair value measurement.
The following is a summary of the inputs used to value the fund’s net assets as of the close of the reporting period:
| | | | |
| | | Valuation inputs | |
|
| Investments in securities: | Level 1 | Level 2 | Level 3 |
|
| Common stocks: | | | |
|
| Basic materials | $22,946,306 | $— | $— |
|
| Capital goods | 38,141,762 | — | — |
|
| Communication services | 49,455,352 | — | — |
|
| Conglomerates | 26,709,622 | — | — |
|
| Consumer cyclicals | 59,867,983 | — | — |
|
| Consumer staples | 74,955,716 | — | — |
|
| Energy | 107,930,424 | — | — |
|
| Financials | 148,730,316 | — | — |
|
| Health care | 96,402,171 | — | — |
|
| Technology | 61,857,578 | — | — |
|
| Transportation | 4,666,870 | — | — |
|
| Utilities and power | 51,355,903 | — | — |
|
| Total common stocks | 743,020,003 | — | — |
| | | | |
| Asset-backed securities | — | 23,003,787 | — |
|
| Convertible preferred stocks | — | 4,918,469 | — |
|
| Corporate bonds and notes | — | 205,675,399 | — |
|
| Investment Companies | 9,493,662 | — | — |
|
| Mortgage-backed securities | — | 34,063,241 | 1,101,876 |
|
| Municipal bonds and notes | — | 4,503,805 | — |
|
| U.S. Government Agency Obligations | — | 25,540,654 | — |
|
| U.S. Government and Agency Mortgage Obligations | — | 38,547,576 | — |
|
| U.S. Treasury Obligations | — | 161,099,021 | — |
|
| Short-term investments | 67,554,253 | — | — |
|
| Totals by level | $820,067,918 | $497,351,952 | $1,101,876 |
| | | | |
| | | Valuation inputs | |
|
| Other financial instruments: | Level 1 | Level 2 | Level 3 |
|
| TBA sale commitments | $— | $(13,975,000) | $— |
|
| Totals by level | $— | $(13,975,000) | $— |
At the start and/or close of the reporting period, Level 3 investments in securities and other financial instruments were not considered a significant portion of the fund’s portfolio.
The accompanying notes are an integral part of these financial statements.
43
Statement of assets and liabilities 7/31/10
| |
| ASSETS | |
|
| Investment in securities, at value (Note 1): | |
| Unaffiliated issuers (identified cost $1,168,413,052) | $1,250,967,493 |
| Affiliated issuers (identified cost $67,554,253) (Note 6) | 67,554,253 |
|
| Dividends, interest and other receivables | 7,996,664 |
|
| Receivable for shares of the fund sold | 362,946 |
|
| Receivable for investments sold | 22,108,048 |
|
| Receivable for sales of delayed delivery securities (Note 1) | 30,218,529 |
|
| Total assets | 1,379,207,933 |
| |
| LIABILITIES | |
|
| Payable to custodian (Note 2) | 187,559 |
|
| Payable for investments purchased | 21,459,378 |
|
| Payable for purchases of delayed delivery securities (Note 1) | 30,113,920 |
|
| Payable for shares of the fund repurchased | 4,602,335 |
|
| Payable for compensation of Manager (Note 2) | 588,949 |
|
| Payable for investor servicing fees (Note 2) | 252,515 |
|
| Payable for custodian fees (Note 2) | 17,284 |
|
| Payable for Trustee compensation and expenses (Note 2) | 429,279 |
|
| Payable for administrative services (Note 2) | 8,654 |
|
| Payable for distribution fees (Note 2) | 344,271 |
|
| TBA sale commitments, at value (proceeds receivable $13,524,570) (Note 1) | 13,975,000 |
|
| Other accrued expenses | 431,679 |
|
| Total liabilities | 72,410,823 |
| |
| Net assets | $1,306,797,110 |
|
| |
| REPRESENTED BY | |
|
| Paid-in capital (Unlimited shares authorized) (Notes 1 and 4) | $2,285,118,802 |
|
| Accumulated net realized loss on investments and foreign currency transactions (Note 1) | (1,060,425,703) |
|
| Net unrealized appreciation of investments | 82,104,011 |
|
| Total — Representing net assets applicable to capital shares outstanding | $1,306,797,110 |
| |
| |
| COMPUTATION OF NET ASSET VALUE AND OFFERING PRICE | |
|
| Net asset value and redemption price per class A share | |
| ($1,077,209,261 divided by 97,204,902 shares) | $11.08 |
|
| Offering price per class A share (100/94.25 of $11.08)* | $11.76 |
|
| Net asset value and offering price per class B share ($56,879,623 divided by 5,191,429 shares)** | $10.96 |
|
| Net asset value and offering price per class C share ($22,813,696 divided by 2,071,006 shares)** | $11.02 |
|
| Net asset value and redemption price per class M share ($79,010,271 divided by 7,220,050 shares) | $10.94 |
|
| Offering price per class M share (100/96.50 of $10.94)* | $11.34 |
|
| Net asset value, offering price and redemption price per class R share | |
| ($1,345,245 divided by 121,727 shares) | $11.05 |
|
| Net asset value, offering price and redemption price per class Y share | |
| ($69,539,014 divided by 6,253,739 shares) | $11.12 |
|
* On single retail sales of less than $50,000. On sales of $50,000 or more the offering price is reduced.
** Redemption price per share is equal to net asset value less any applicable contingent deferred sales charge.
The accompanying notes are an integral part of these financial statements.
44
Statement of operations Year ended 7/31/10
| |
| INVESTMENT INCOME | |
|
| Interest (including interest income of $330,465 from investments in affiliated issuers) (Note 6) | $26,399,265 |
|
| Dividends (net of foreign tax of $108,338) | 21,729,016 |
|
| Total investment income | 48,128,281 |
| |
| |
| EXPENSES | |
|
| Compensation of Manager (Note 2) | 7,803,237 |
|
| Investor servicing fees (Note 2) | 3,569,357 |
|
| Custodian fees (Note 2) | 21,594 |
|
| Trustee compensation and expenses (Note 2) | 109,458 |
|
| Administrative services (Note 2) | 67,872 |
|
| Distribution fees — Class A (Note 2) | 2,861,727 |
|
| Distribution fees — Class B (Note 2) | 732,118 |
|
| Distribution fees — Class C (Note 2) | 236,308 |
|
| Distribution fees — Class M (Note 2) | 621,441 |
|
| Distribution fees — Class R (Note 2) | 7,291 |
|
| Other | 933,069 |
|
| Total expenses | 16,963,472 |
| | |
| Interest expense (Note 2) | (267,313) |
|
| Expense reduction (Note 2) | (50,723) |
|
| Net expenses | 16,645,436 |
| |
| Net investment income | 31,482,845 |
|
| |
| Net realized gain on investments (Notes 1 and 3) | 57,811,386 |
|
| Net realized loss on swap contracts (Note 1) | (135,696) |
|
| Net realized gain on futures contracts (Note 1) | 223,611 |
|
| Net unrealized appreciation of assets and liabilities in foreign currencies during the year | 388 |
|
| Net unrealized appreciation of investments, futures contracts, swap contracts, | |
| TBA sale commitments and receivable purchase agreements during the year | 74,204,174 |
|
| Net gain on investments | 132,103,863 |
| |
| Net increase in net assets resulting from operations | $163,586,708 |
|
The accompanying notes are an integral part of these financial statements.
45
Statement of changes in net assets
| | |
| DECREASE IN NET ASSETS | Year ended 7/31/10 | Year ended 7/31/09 |
|
| Operations: | | |
| Net investment income | $31,482,845 | $43,546,986 |
|
| Net realized gain (loss) on investments and | | |
| foreign currency transactions | 57,899,301 | (1,053,498,364) |
|
| Net unrealized appreciation of investments and | | |
| assets and liabilities in foreign currencies | 74,204,562 | 327,778,271 |
|
| Net increase (decrease) in net assets resulting from operations | 163,586,708 | (682,173,107) |
|
| Distributions to shareholders (Note 1): | | |
| From ordinary income | | |
| Net investment income | | |
|
| Class A | (23,990,906) | (59,641,849) |
|
| Class B | (1,095,926) | (4,464,032) |
|
| Class C | (334,513) | (1,055,552) |
|
| Class M | (1,379,889) | (3,454,174) |
|
| Class R | (27,793) | (98,882) |
|
| Class Y | (2,304,612) | (7,444,273) |
|
| From net realized long-term gain on investments | | |
| Class A | — | (13,098,235) |
|
| Class B | — | (1,164,432) |
|
| Class C | — | (272,167) |
|
| Class M | — | (814,268) |
|
| Class R | — | (27,165) |
|
| Class Y | — | (1,610,915) |
|
| From return of capital | | |
| Class A | (2,565,707) | (13,146,238) |
|
| Class B | (117,204) | (983,961) |
|
| Class C | (35,775) | (232,665) |
|
| Class M | (147,572) | (761,368) |
|
| Class R | (2,972) | (21,795) |
|
| Class Y | (246,467) | (1,640,864) |
|
| Increase in capital from settlement payments | — | 3,562 |
|
| Redemption fees (Note 1) | 1,216 | 8,924 |
|
| Decrease from capital share transactions (Note 4) | (267,358,125) | (580,611,145) |
|
| Total decrease in net assets | (136,019,537) | (1,372,704,601) |
|
| |
| NET ASSETS | | |
|
| Beginning of year | 1,442,816,647 | 2,815,521,248 |
|
| End of year (including undistributed net investment | | |
| income of $0 and $71,968, respectively) | $1,306,797,110 | $1,442,816,647 |
|
The accompanying notes are an integral part of these financial statements.
46
|
| This page left blank intentionally. |
47
Financial highlights (For a common share outstanding throughout the period)
| | | | | | | | | | | | | | | | | | | | | | | | | | | | | | | | | | |
| INVESTMENT OPERATIONS: | | | | | | LESS DISTRIBUTIONS: | | | | | | | | | | | | RATIOS AND SUPPLEMENTAL DATA: | | |
|
| | | | | | | | | | | | | | | | | | | | | | | | | | | | | | | Ratio | | | | |
| | | | | | | | | | | | | | | | | | | | | | | | | | | | | | | of expenses | | | | |
| | | | | | | | | | | | | | | | | | | | | | | | | | | | | | | to average | | Ratio of net | | |
| | | Net asset | | Net | | Net realized | | | | From | | From | | | | | | | | | | | | | | | | Ratio | | net assets | | investment | | |
| | value, | | investment | | and unrealized | | Total from | | net | | net realized | | From | | Total | | | | Non-recurring | | Net asset | | Total return | | Net assets, | | of expenses | | excluding | | income (loss) | | Portfolio |
| | | beginning | | income | | gain (loss) | | investment | | investment | | gain on | | return | | distribu- | | Redemption | | reimburse- | | value, end | | at net asset | | end of period | | to average | | interest | | to average | | turnover |
| Period ended | | of period | | (loss)a | | on investments | | operations | | income | | investments | | of capital | | tions | | feesb | | ments | | of period | | value (%)c | | (in thousands) | | net assets (%)d | | expense (%)d | | net assets (%) | | (%)e |
|
| Class A | | | | | | | | | | | | | | | | | | | | | | | | | | | | | | | | | | |
| July 31, 2010 | | $10.14 | | .25 | | .93 | | 1.18 | | (.22) | | — | | (.02) | | (.24) | | — | | — | | $11.08 | | 11.83 | | $1,077,209 | | 1.13 j | | 1.13 j | | 2.27 | | 341.47 |
| July 31, 2009 | | 13.99 | | .27 | | (3.49) | | (3.22) | | (.44) | | (.09) | | (.10) | | (.63) | | — | | — h | | 10.14 | | (22.58) | | 1,146,770 | | 1.34 f,g | | 1.14 g | | 2.61 g | | 233.21 |
| July 31, 2008 | | 18.10 | | .61 | | (2.55) | | (1.94) | | (.64) | | (1.53) | | — | | (2.17) | | — | | — | | 13.99 | | (11.84) | | 2,173,291 | | 1.00 g | | 1.00 g | | 3.80 g | | 123.75 |
| July 31, 2007 | | 18.21 | | .48 | | 1.46 | | 1.94 | | (.52) | | (1.53) | | — | | (2.05) | | — | | — | | 18.10 | | 10.99 | | 3,184,271 | | .96 g | | .96 g | | 2.61 g | | 144.33 |
| July 31, 2006 | | 18.40 | | .42 i | | .27 | | .69 | | (.50) | | (.38) | | — | | (.88) | | — | | — | | 18.21 | | 3.89 i | | 3,155,761 | | .90 g,i | | .90 g,i | | 2.31 g,i | | 117.11 |
|
| Class B | | | | | | | | | | | | | | | | | | | | | | | | | | | | | | | | | | |
| July 31, 2010 | | $10.02 | | .17 | | .94 | | 1.11 | | (.15) | | — | | (.02) | | (.17) | | — | | — | | $10.96 | | 11.09 | | $56,880 | | 1.88 j | | 1.88 j | | 1.54 | | 341.47 |
| July 31, 2009 | | 13.83 | | .19 | | (3.46) | | (3.27) | | (.37) | | (.09) | | (.08) | | (.54) | | — | | — h | | 10.02 | | (23.23) | | 86,981 | | 2.09 f,g | | 1.89 g | | 1.85 g | | 233.21 |
| July 31, 2008 | | 17.90 | | .48 | | (2.52) | | (2.04) | | (.50) | | (1.53) | | — | | (2.03) | | — | | — | | 13.83 | | (12.50) | | 206,269 | | 1.75 g | | 1.75 g | | 2.99 g | | 123.75 |
| July 31, 2007 | | 18.02 | | .33 | | 1.46 | | 1.79 | | (.38) | | (1.53) | | — | | (1.91) | | — | | — | | 17.90 | | 10.15 | | 413,532 | | 1.71 g | | 1.71 g | | 1.82 g | | 144.33 |
| July 31, 2006 | | 18.22 | | .28 i | | .26 | | .54 | | (.36) | | (.38) | | — | | (.74) | | — | | — | | 18.02 | | 3.05 i | | 624,026 | | 1.65 g,i | | 1.65 g,i | | 1.58 g,i | | 117.11 |
|
| Class C | | | | | | | | | | | | | | | | | | | | | | | | | | | | | | | | | | |
| July 31, 2010 | | $10.08 | | .16 | | .95 | | 1.11 | | (.15) | | — | | (.02) | | (.17) | | — | | — | | $11.02 | | 11.06 | | $22,814 | | 1.88 j | | 1.88 j | | 1.52 | | 341.47 |
| July 31, 2009 | | 13.90 | | .19 | | (3.47) | | (3.28) | | (.37) | | (.09) | | (.08) | | (.54) | | — | | — h | | 10.08 | | (23.17) | | 23,296 | | 2.09 f,g | | 1.89 g | | 1.86 g | | 233.21 |
| July 31, 2008 | | 17.97 | | .49 | | (2.52) | | (2.03) | | (.51) | | (1.53) | | — | | (2.04) | | — | | — | | 13.90 | | (12.41) | | 46,134 | | 1.75 g | | 1.75 g | | 3.03 g | | 123.75 |
| July 31, 2007 | | 18.09 | | .34 | | 1.45 | | 1.79 | | (.38) | | (1.53) | | — | | (1.91) | | — | | — | | 17.97 | | 10.16 | | 69,893 | | 1.71 g | | 1.71 g | | 1.86 g | | 144.33 |
| July 31, 2006 | | 18.30 | | .28 i | | .25 | | .53 | | (.36) | | (.38) | | — | | (.74) | | — | | — | | 18.09 | | 3.01 i | | 70,192 | | 1.65 g,i | | 1.65 g,i | | 1.56 g,i | | 117.11 |
|
| Class M | | | | | | | | | | | | | | | | | | | | | | | | | | | | | | | | | | |
| July 31, 2010 | | $10.01 | | .19 | | .94 | | 1.13 | | (.18) | | — | | (.02) | | (.20) | | — | | — | | $10.94 | | 11.33 | | $79,010 | | 1.63 j | | 1.63 j | | 1.77 | | 341.47 |
| July 31, 2009 | | 13.82 | | .21 | | (3.44) | | (3.23) | | (.40) | | (.09) | | (.09) | | (.58) | | — | | — h | | 10.01 | | (22.99) | | 81,025 | | 1.84 f,g | | 1.64 g | | 2.13 g | | 233.21 |
| July 31, 2008 | | 17.89 | | .53 | | (2.52) | | (1.99) | | (.55) | | (1.53) | | — | | (2.08) | | — | | — | | 13.82 | | (12.23) | | 128,094 | | 1.50 g | | 1.50 g | | 3.31 g | | 123.75 |
| July 31, 2007 | | 18.02 | | .38 | | 1.45 | | 1.83 | | (.43) | | (1.53) | | — | | (1.96) | | — | | — | | 17.89 | | 10.42 | | 176,993 | | 1.46 g | | 1.46 g | | 2.10 g | | 144.33 |
| July 31, 2006 | | 18.22 | | .33 i | | .26 | | .59 | | (.41) | | (.38) | | — | | (.79) | | — | | — | | 18.02 | | 3.34 i | | 187,338 | | 1.40 g,i | | 1.40 g,i | | 1.81 g,i | | 117.11 |
|
| Class R | | | | | | | | | | | | | | | | | | | | | | | | | | | | | | | | | | |
| July 31, 2010 | | $10.11 | | .22 | | .94 | | 1.16 | | (.20) | | — | | (.02) | | (.22) | | — | | — | | $11.05 | | 11.59 | | $1,345 | | 1.38 j | | 1.38 j | | 2.03 | | 341.47 |
| July 31, 2009 | | 13.94 | | .24 | | (3.47) | | (3.23) | | (.42) | | (.09) | | (.09) | | (.60) | | — | | — h | | 10.11 | | (22.71) | | 1,493 | | 1.59 f,g | | 1.39 g | | 2.30 g | | 233.21 |
| July 31, 2008 | | 18.04 | | .57 | | (2.54) | | (1.97) | | (.60) | | (1.53) | | — | | (2.13) | | — | | — | | 13.94 | | (12.04) | | 4,274 | | 1.25 g | | 1.25 g | | 3.66 g | | 123.75 |
| July 31, 2007 | | 18.15 | | .44 | | 1.46 | | 1.90 | | (.48) | | (1.53) | | — | | (2.01) | | — | | — | | 18.04 | | 10.76 | | 2,044 | | 1.21 g | | 1.21 g | | 2.38 g | | 144.33 |
| July 31, 2006 | | 18.36 | | .36 i | | .27 | | .63 | | (.46) | | (.38) | | — | | (.84) | | — | | — | | 18.15 | | 3.57 i | | 1,525 | | 1.15 g,i | | 1.15 g,i | | 2.00 g,i | | 117.11 |
|
| Class Y | | | | | | | | | | | | | | | | | | | | | | | | | | | | | | | | | | |
| July 31, 2010 | | $10.17 | | .28 | | .95 | | 1.23 | | (.25) | | — | | (.03) | | (.28) | | — | | — | | $11.12 | | 12.18 | | $69,539 | | .88 j | | .88 j | | 2.55 | | 341.47 |
| July 31, 2009 | | 14.04 | | .29 | | (3.50) | | (3.21) | | (.47) | | (.09) | | (.10) | | (.66) | | — | | — h | | 10.17 | | (22.42) | | 103,251 | | 1.09 f,g | | .89 g | | 2.87 g | | 233.21 |
| July 31, 2008 | | 18.15 | | .66 | | (2.55) | | (1.89) | | (.69) | | (1.53) | | — | | (2.22) | | — | | — | | 14.04 | | (11.57) | | 257,459 | | .75 g | | .75 g | | 4.05 g | | 123.75 |
| July 31, 2007 | | 18.26 | | .53 | | 1.46 | | 1.99 | | (.57) | | (1.53) | | — | | (2.10) | | — | | — | | 18.15 | | 11.24 | | 385,361 | | .71 g | | .71 g | | 2.86 g | | 144.33 |
| July 31, 2006 | | 18.46 | | .47 i | | .26 | | .73 | | (.55) | | (.38) | | — | | (.93) | | — | | — | | 18.26 | | 4.09 i | | 493,985 | | .65 g,i | | .65 g,i | | 2.59 g,i | | 117.11 |
|
See notes to financial highlights at the end of this section.
The accompanying notes are an integral part of these financial statements.
Financial highlights (Continued)
a Per share net investment income (loss) has been determined on the basis of the weighted average number of shares outstanding during the period.
b Amount represents less than $0.01 per share.
c Total return assumes dividend reinvestment and does not reflect the effect of sales charges.
d Includes amounts paid through expense offset and brokerage/service arrangements (Note 2).
e Portfolio turnover excludes dollar roll transactions.
f Includes interest accrued in connection with certain terminated derivative contracts, which amounted to 0.20% of average net assets as of July 31, 2009 (Note 2).
g Reflects an involuntary contractual expense limitation in effect during the period. For periods prior to July 31, 2009, certain fund expenses were waived in connection with the fund’s investment in Putnam Prime Money Market Fund. As a result of such limitation and/or waivers, the expenses of each class reflect a reduction of the following amounts (Note 2):
| |
| | Percentage of |
| | average net assets |
|
| July 31, 2009 | 0.01% |
|
| July 31, 2008 | <0.01 |
|
| July 31, 2007 | <0.01 |
|
| July 31, 2006 | 0.01 |
|
h Reflects a non-recurring reimbursement pursuant to a settlement between the Securities and Exchange Commission (the “SEC”) and Bear Stearns & Co., Inc. and Bear Stearns Securities Corp., which amounted to less than $0.01 per share outstanding as of May 21, 2009.
i Reflects a non-recurring reimbursement from Putnam Investments relating to the calculation of certain amounts paid by the fund to Putnam in previous years for transfer agent services, which amounted to $0.01 per share and 0.05% of average net assets for the period ended July 31, 2006.
j Excludes the impact of a current period reduction of interest expense related to the resolution of certain terminated derivatives contracts, which amounted to 0.02% of average net assets as of July 31, 2010 (Note 2).
The accompanying notes are an integral part of these financial statements.
50
Notes to financial statements 7/31/10
Note 1: Significant accounting policies
The George Putnam Fund of Boston d/b/a George Putnam Balanced Fund (the fund) (which changed its name on September 30, 2010), is a Massachusetts business trust, which is registered under the Investment Company Act of 1940, as amended, as a diversified, open-end management investment company. The fund seeks a balanced investment producing both capital growth and current income by investing primarily in value-oriented stocks of large companies and government, corporate and mortgage-backed bonds. The fund may invest a significant portion of its assets in securitized debt instruments, including mortgage-backed and asset-backed investments. The yields and values of these investments are sensitive to changes in interest rates, the rate of principal payments on the underlying assets and the market’s perception of the issuers. The market for these investments may be volatile and limited, which may make them difficult to buy or sell.
The fund offers class A, class B, class C, class M, class R and class Y shares. Class A and class M shares are sold with a maximum front-end sales charge of 5.75% and 3.50%, respectively, and generally do not pay a contingent deferred sales charge. Class B shares, which convert to class A shares after approximately eight years, do not pay a front-end sales charge and are subject to a contingent deferred sales charge, if those shares are redeemed within six years of purchase. Class C shares have a one-year 1.00% contingent deferred sales charge and do not convert to class A shares. Class R shares, which are offered to qualified employee-benefit plans, are sold at net asset value. The expenses for class A, class B, class C, class M and class R shares may differ based on the distribution fee of each class, which is identified in Note 2. Class Y shares, which are sold at net asset value, are generally subject to the same expenses as class A, class B, class C, class M and class R shares, but do not bear a distribution fee. Class Y shares are generally only available to corporate and institutional clients and clients in other approved programs.
A 1.00% redemption fee applied on certain shares that were redeemed (either by selling or exchanging into another fund) within 7 days of purchase. The redemption fee is accounted for as an addition to paid-in-capital. Effective August 2, 2010, a redemption fee will no longer apply to shares redeemed.
Investment income, realized and unrealized gains and losses and expenses of the fund are borne pro-rata based on the relative net assets of each class to the total net assets of the fund, except that each class bears expenses unique to that class (including the distribution fees applicable to such classes). Each class votes as a class only with respect to its own distribution plan or other matters on which a class vote is required by law or determined by the Trustees. If the fund were liquidated, shares of each class would receive their pro-rata share of the net assets of the fund. In addition, the Trustees declare separate dividends on each class of shares.
In the normal course of business, the fund enters into contracts that may include agreements to indemnify another party under given circumstances. The fund’s maximum exposure under these arrangements is unknown as this would involve future claims that may be, but have not yet been, made against the fund. However, the fund’s management team expects the risk of material loss to be remote.
The following is a summary of significant accounting policies consistently followed by the fund in the preparation of its financial statements. The preparation of financial statements is in conformity with accounting principles generally accepted in the United States of America and requires management to make estimates and assumptions that affect the reported amounts of assets and liabilities in the financial statements and the reported amounts of increases and decreases in net assets from operations during the period from August 1, 2009 through July 31, 2010 (the reporting period). Actual results could differ from those estimates. Subsequent events after the Statement of assets and liabilities date through the date that the financial statements were issued have been evaluated in the preparation of the financial statements.
A) Security valuation Investments for which market quotations are readily available are valued at the last reported sales price on their principal exchange, or official closing price for certain markets and are classified as Level 1 securities. If no sales are reported — as in the case of some securities traded over-the-counter — a security is valued at its last reported bid price and is generally categorized as a Level 2 security.
Market quotations are not considered to be readily available for certain debt obligations; such investments are valued on the basis of valuations furnished by an independent pricing service approved by the Trustees or dealers selected by Putnam Investment Management, LLC (Putnam Management), the fund’s manager, an indirect wholly-owned subsidiary of Putnam Investments, LLC. Such services or dealers determine valuations for normal institutional-size trading units of such securities using methods based on market transactions for comparable securities and various
51
relationships, generally recognized by institutional traders, between securities (which considers such factors as security prices, yields, maturities and ratings). These securities will generally be categorized as Level 2.
Many securities markets and exchanges outside the U.S. close prior to the close of the New York Stock Exchange and therefore the closing prices for securities in such markets or on such exchanges may not fully reflect events that occur after such close but before the close of the New York Stock Exchange. Accordingly, on certain days, the fund will fair value foreign equity securities taking into account multiple factors including movements in the U.S. securities markets, currency valuations and comparisons to the valuation of American Depository Receipts, exchange-traded funds and futures contracts. These securities, which will generally represent a transfer from a Level 1 to a Level 2 security, will be classified as Level 2. The number of days on which fair value prices will be used will depend on market activity and it is possible that fair value prices will be used by the fund to a significant extent. Securities quoted in foreign currencies, if any, are translated into U.S. dollars at the current exchange rate.
To the extent a pricing service or dealer is unable to value a security or provides a valuation that Putnam Management does not believe accurately reflects the security’s fair value, the security will be valued at fair value by Putnam Management. Certain investments, including certain restricted and illiquid securities and derivatives, are also valued at fair value following procedures approved by the Trustees. These valuations consider such factors as significant market or specific security events such as interest rate or credit quality changes, various relationships with other securities, discount rates, U.S. Treasury, U.S. swap and credit yields, index levels, convexity exposures and recovery rates. These securities are classified as Level 2 or as Level 3 depending on the priority of the significant inputs.
Such valuations and procedures are reviewed periodically by the Trustees. Certain securities may be valued on the basis of a price provided by a single source. The fair value of securities is generally determined as the amount that the fund could reasonably expect to realize from an orderly disposition of such securities over a reasonable period of time. By its nature, a fair value price is a good faith estimate of the value of a security in a current sale and does not reflect an actual market price, which may be different by a material amount.
Tax-exempt bonds and notes are generally valued on the basis of valuations provided by an independent pricing service approved by the Trustees. Such services use information with respect to transactions in bonds, quotations from bond dealers, market transactions in comparable securities and various relationships between securities in determining value. These securities will generally be categorized as Level 2.
B) Joint trading account Pursuant to an exemptive order from the SEC, the fund may transfer uninvested cash balances, including cash collateral received under security lending arrangements, into a joint trading account along with the cash of other registered investment companies and certain other accounts managed by Putnam Management. These balances may be invested in issues of short-term investments having maturities of up to 397 days for collateral received under security lending arrangements and up to 90 days for other cash investments.
C) Repurchase agreements The fund, or any joint trading account, through its custodian, receives delivery of the underlying securities, the market value of which at the time of purchase is required to be in an amount at least equal to the resale price, including accrued interest. Collateral for certain tri-party repurchase agreements is held at the counterparty’s custodian in a segregated account for the benefit of the fund and the counterparty. Putnam Management is responsible for determining that the value of these underlying securities is at all times at least equal to the resale price, including accrued interest. In the event of default or bankruptcy by the other party to the agreement, retention of the collateral may be subject to legal proceedings.
D) Security transactions and related investment income Security transactions are recorded on the trade date (the date the order to buy or sell is executed). Gains or losses on securities sold are determined on the identified cost basis. Interest income is recorded on the accrual basis. Dividend income, net of applicable withholding taxes, is recognized on the ex-dividend date except that certain dividends from foreign securities, if any, are recognized as soon as the fund is informed of the ex-dividend date. Non-cash dividends, if any, are recorded at the fair market value of the securities received. Dividends representing a return of capital or capital gains, if any, are reflected as a reduction of cost and/or as a realized gain. All premiums/discounts are amortized/accreted on a yield-to-maturity basis.
Securities purchased or sold on a delayed delivery basis may be settled a month or more after the trade date; interest income is accrued based on the terms of the securities. Losses may arise due to changes in the market value of the underlying securities or if the counterparty does not perform under the contract.
E) Stripped securities The fund may invest in stripped securities which represent a participation in securities that may be structured in classes with rights to receive different portions of the interest and principal. Interest-only securities receive all of the interest and principal-only securities receive all of the principal. If the interest-only securities experience greater than anticipated prepayments of principal, the fund may fail to recoup fully its initial
52
investment in these securities. Conversely, principal-only securities increase in value if prepayments are greater than anticipated and decline if prepayments are slower than anticipated. The market value of these securities is highly sensitive to changes in interest rates.
F) Foreign currency translation The accounting records of the fund are maintained in U.S. dollars. The market value of foreign securities, currency holdings, and other assets and liabilities is recorded in the books and records of the fund after translation to U.S. dollars based on the exchange rates on that day. The cost of each security is determined using historical exchange rates. Income and withholding taxes are translated at prevailing exchange rates when earned or incurred. The fund does not isolate that portion of realized or unrealized gains or losses resulting from changes in the foreign exchange rate on investments from fluctuations arising from changes in the market prices of the securities. Such gains and losses are included with the net realized and unrealized gain or loss on investments. Net realized gains and losses on foreign currency transactions represent net realized exchange gains or losse s on closed forward currency contracts, disposition of foreign currencies, currency gains and losses realized between the trade and settlement dates on securities transactions and the difference between the amount of investment income and foreign withholding taxes recorded on the fund’s books and the U.S. dollar equivalent amounts actually received or paid. Net unrealized appreciation and depreciation of assets and liabilities in foreign currencies arise from changes in the value of open forward currency contracts and assets and liabilities other than investments at the period end, resulting from changes in the exchange rate. Investments in foreign securities involve certain risks, including those related to economic instability, unfavorable political developments, and currency fluctuations, not present with domestic investments.
G) Futures and options contracts The fund uses futures contracts to manage exposure to interest rate risk and to implement active views on term structure. The fund may also use options contracts to hedge against changes in the values of securities the fund owns, owned or expects to purchase, or for other investment purposes. The fund may also write options on swaps or securities it owns or in which it may invest to increase its current returns.
The potential risk to the fund is that the change in value of futures and options contracts may not correspond to the change in value of the hedged instruments. In addition, losses may arise from changes in the value of the underlying instruments, if there is an illiquid secondary market for the contracts, if interest or exchange rates move unexpectedly or if the counterparty to the contract is unable to perform. With futures, there is minimal counterparty credit risk to the fund since futures are exchange traded and the exchange’s clearinghouse, as counterparty to all exchange traded futures, guarantees the futures against default. Risks may exceed amounts recognized on the Statement of assets and liabilities. When the contract is closed, the fund records a realized gain or loss equal to the difference between the value of the contract at the time it was opened and the value at the time it was closed. Realized gains and losses on purchased option s are included in realized gains and losses on investment securities. If a written call option is exercised, the premium originally received is recorded as an addition to sales proceeds. If a written put option is exercised, the premium originally received is recorded as a reduction to the cost of investments.
Futures contracts are valued at the quoted daily settlement prices established by the exchange on which they trade. The fund and the broker agree to exchange an amount of cash equal to the daily fluctuation in the value of the futures contract. Such receipts or payments are known as “variation margin.” Exchange traded options are valued at the last sale price or, if no sales are reported, the last bid price for purchased options and the last ask price for written options. Options traded over-the-counter are valued using prices supplied by dealers. Futures and written option contracts outstanding at period end, if any, are listed after the fund’s portfolio. The fund had an average number of approximately 7 futures contracts for the reporting period.
H) Credit default contracts The fund enters into credit default contracts to hedge against credit risk. In a credit default contract, the protection buyer typically makes an up front payment and a periodic stream of payments to a counterparty, the protection seller, in exchange for the right to receive a contingent payment upon the occurrence of a credit event on the reference obligation or all other equally ranked obligations of the reference entity. Credit events are contract specific but may include bankruptcy, failure to pay, restructuring and obligation acceleration. An upfront payment received by the fund, as the protection seller, is recorded as a liability on the fund’s books. An upfront payment made by the fund, as the protection buyer, is recorded as an asset on the fund’s books. Periodic payments received or paid by the fund are recorded as realized gains or losses. The credit default cont racts are marked to market daily based upon quotations from an independent pricing service or market makers and the change, if any, is recorded as an unrealized gain or loss. Upon the occurrence of a credit event, the difference between the par value and market value of the reference obligation, net of any proportional amount of the upfront payment, is recorded as a realized gain or loss.
53
In addition to bearing the risk that the credit event will occur, the fund could be exposed to market risk due to unfavorable changes in interest rates or in the price of the underlying security or index or the possibility that the fund may be unable to close out its position at the same time or at the same price as if it had purchased the underlying reference obligations. In certain circumstances, the fund may enter into offsetting credit default contracts which would mitigate its risk of loss. Risks of loss may exceed amounts recognized on the Statement of assets and liabilities. The fund’s maximum risk of loss from counterparty risk, either as the protection seller or as the protection buyer, is the fair value of the contract. This risk may be mitigated by having a master netting arrangement between the fund and the counterparty. Where the fund is a seller of protection, the maximum potential amount of future payments the fund may be required t o make is equal to the notional amount of the relevant credit default contract. Credit default contracts outstanding, including their respective notional amounts at period end, if any, are listed after the fund’s portfolio. The fund had an average notional amount of approximately $300,000 on credit default swap contracts for the reporting period.
I) Master agreements The fund is a party to ISDA (International Swap and Derivatives Association, Inc.) Master Agreements (Master Agreements) with certain counterparties that govern over-the-counter derivative and foreign exchange contracts entered into from time to time. The Master Agreements may contain provisions regarding, among other things, the parties’ general obligations, representations, agreements, collateral requirements, events of default and early termination. With respect to certain counterparties, in accordance with the terms of the Master Agreements, collateral posted to the fund is held in a segregated account by the fund’s custodian and with respect to those amounts which can be sold or repledged, are presented in the fund’s portfolio. Collateral pledged by the fund is segregated by the fund’s custodian and identified in the fund’s portfolio. Collateral can be in the form of cash or debt securities issued by the U.S. Government or related agencies or other securities as agreed to by the fund and the applicable counterparty. Collateral requirements are determined based on the fund’s net position with each counterparty. Termination events applicable to the fund may occur upon a decline in the fund’s net assets below a specified threshold over a certain period of time. Termination events applicable to counterparties may occur upon a decline in the counterparty’s long-term and short-term credit ratings below a specified level. In each case, upon occurrence, the other party may elect to terminate early and cause settlement of all derivative and foreign exchange contracts outstanding, including the payment of any losses and costs resulting from such early termination, as reasonably determined by the terminating party. Any decision by one or more of the fund’s counterparties to elect early termination could impact the fund’s future derivative activity.
At the close of the reporting period, the fund did not have a net liability position on derivative contracts subject to the Master Agreements.
J) TBA purchase commitments The fund may enter into TBA (to be announced) commitments to purchase securities for a fixed unit price at a future date beyond customary settlement time. Although the unit price has been established, the principal value has not been finalized. However, it is anticipated that the amount of the commitments will not significantly differ from the principal amount. The fund holds, and maintains until settlement date, cash or high-grade debt obligations in an amount sufficient to meet the purchase price, or the fund may enter into offsetting contracts for the forward sale of other securities it owns. Income on the securities will not be earned until settlement date. TBA purchase commitments may be considered securities themselves, and involve a risk of loss if the value of the security to be purchased declines prior to the settlement date, which risk is in addition to the risk of decline in the value of the fund’s other assets. Unsettled TBA purchase commitments are valued at fair value of the underlying securities, according to the procedures described under “Security valuation” above. The contract is marked to market daily and the change in market value is recorded by the fund as an unrealized gain or loss.
Although the fund will generally enter into TBA purchase commitments with the intention of acquiring securities for its portfolio or for delivery pursuant to options contracts it has entered into, the fund may dispose of a commitment prior to settlement if Putnam Management deems it appropriate to do so.
K) TBA sale commitments The fund may enter into TBA sale commitments to hedge its portfolio positions or to sell mortgage-backed securities it owns under delayed delivery arrangements. Proceeds of TBA sale commitments are not received until the contractual settlement date. During the time a TBA sale commitment is outstanding, equivalent deliverable securities or an offsetting TBA purchase commitment deliverable on or before the sale commitment date, are held as “cover” for the transaction.
Unsettled TBA sale commitments are valued at the fair value of the underlying securities, generally according to the procedures described under “Security valuation” above. The contract is marked to market daily and the change in market value is recorded by the fund as an unrealized gain or loss. If the TBA sale commitment is closed through the acquisition of an offsetting TBA purchase commitment, the fund realizes a gain or loss. If the fund delivers
54
securities under the commitment, the fund realizes a gain or a loss from the sale of the securities based upon the unit price established at the date the commitment was entered into. TBA sale commitments outstanding at period end, if any, are listed after the fund’s portfolio.
L) Dollar rolls To enhance returns, the fund may enter into dollar rolls (principally using TBAs) in which the fund sells securities for delivery in the current month and simultaneously contracts to purchase similar securities on a specified future date. During the period between the sale and subsequent purchase, the fund will not be entitled to receive income and principal payments on the securities sold. The fund will, however, retain the difference between the initial sales price and the forward price for the future purchase. The fund will also be able to earn interest on the cash proceeds that are received from the initial sale, on settlement date. The fund may be exposed to market or credit risk if the price of the security changes unfavorably or the counterparty fails to perform under the terms of the agreement.
M) Interfund lending Effective July 2010, the fund, along with other Putnam funds, may participate in an interfund lending program pursuant to an exemptive order issued by the SEC. This program allows the fund to borrow from or lend to other Putnam funds that permit such transactions. Interfund lending transactions are subject to each fund’s investment policies and borrowing and lending limits. Interest earned or paid on the interfund lending transaction will be based on the average of certain current market rates. During the reporting period, the fund did not utilize the program.
N) Line of credit Effective July 2010, the fund participates, along with other Putnam funds, in a $285 million unsecured committed line of credit and a $165 million unsecured uncommitted line of credit, both provided by State Street Bank and Trust Company (State Street). Borrowings may be made for temporary or emergency purposes, including the funding of shareholder redemption requests and trade settlements. Interest is charged to the fund based on the fund’s borrowing at a rate equal to the Federal Funds rate plus 1.25% for the committed line of credit and the Federal Funds rate plus 1.30% for the uncommitted line of credit. A closing fee equal to 0.03% of the committed line of credit and $100,000 for the uncommitted line of credit has been paid by the participating funds. In addition, a commitment fee of 0.15% per annum on any unutilized portion of the committed line of credit is allocated to the partic ipating funds based on their relative net assets and paid quarterly.
During the period ended July 31, 2010, the fund had no borrowings against these arrangements.
O) Federal taxes It is the policy of the fund to distribute all of its taxable income within the prescribed time period and otherwise comply with the provisions of the Internal Revenue Code of 1986, as amended (the Code), applicable to regulated investment companies. It is also the intention of the fund to distribute an amount sufficient to avoid imposition of any excise tax under Section 4982 of the Code. The fund is subject to the provisions of Accounting Standards Codification ASC 740 Income Taxes (ASC 740). ASC 740 sets forth a minimum threshold for financial statement recognition of the benefit of a tax position taken or expected to be taken in a tax return. The fund did not have any unrecognized tax benefits in the accompanying financial statements. No provision has been made for federal taxes on income, capital gains or unrea lized appreciation on securities held nor for excise tax on income and capital gains. Each of the fund’s federal tax returns for the prior three fiscal years remains subject to examination by the Internal Revenue Service.
At July 31, 2010, the fund had a capital loss carryover of $1,040,773,484 available to the extent allowed by the Code to offset future net capital gain, if any. The amounts of the carryovers and the expiration dates are:
| |
| Loss carryover | Expiration |
|
| $17,850,960 | July 31, 2011 |
|
| 383,072,497 | July 31, 2017 |
|
| 639,850,027 | July 31, 2018 |
|
P) Distributions to shareholders Distributions to shareholders from net investment income are recorded by the fund on the ex-dividend date. Distributions from capital gains, if any, are recorded on the ex-dividend date and paid at least annually. The amount and character of income and gains to be distributed are determined in accordance with income tax regulations, which may differ from generally accepted accounting principles. These differences include temporary and/or permanent differences of losses on wash sale transactions, interest only securities and receivable purchase agreement reversal. Reclassifications are made to the fund’s capital accounts to reflect income and gains available for distribution (or available capital loss carryovers) under income tax regulations. For the
55
reporting period ended, the fund reclassified $2,421,174 to decrease undistributed net investment income and $2,560,770 to increase paid-in-capital, with an increase to accumulated net realized losses of $139,596.
The tax basis components of distributable earnings and the federal tax cost as of the close of the reporting period were as follows:
| |
| Unrealized appreciation | $141,086,888 |
| Unrealized depreciation | (78,184,666) |
|
| Net unrealized appreciation | 62,902,222 |
| Capital loss carryforward | (1,040,773,484) |
| Cost for federal income tax purposes | $1,255,619,524 |
Note 2: Management fee, administrative services and other transactions
The fund pays Putnam Management a management fee (based on the fund’s average net assets and computed and paid monthly) at annual rates that may vary based on the average of the aggregate net assets of most open-end funds, as defined in the fund’s management contract, sponsored by Putnam Management. Such annual rates may vary as follows: 0.680% of the first $5 billion, 0.630% of the next $5 billion, 0.580% of the next $10 billion, 0.530% of the next $10 billion, 0.480% of the next $50 billion, 0.460% of the next $50 billion, 0.450% of the next $100 billion and 0.445% of any excess thereafter.
Prior to January 1, 2010, the fund paid Putnam Management for management and investment advisory services quarterly based on the average net assets of the fund. Such fee was based on the following annual rates: 0.65% of the first $500 million of average net assets, 0.55% of the next $500 million, 0.50% of the next $500 million, 0.45% of the next $5 billion, 0.425% of the next $5 billion, 0.405% of the next $5 billion, 0.39% of the next $5 billion and 0.38% of any excess thereafter.
Effective August 1, 2009 through June 30, 2011, Putnam Management has contractually agreed to waive fees or reimburse the fund’s expenses to the extent necessary to limit the cumulative expenses of the fund, exclusive of brokerage, interest, taxes, investment-related expenses, extraordinary expenses and payments under the fund’s investor servicing contract, investment management contract and distribution plans, on a fiscal year-to-date basis, to an annual rate of 0.20% of the fund’s average net assets over such fiscal year-to-date period. During the reporting period, the fund’s expenses were not reduced as a result of this limit.
Putnam Investments Limited (PIL), an affiliate of Putnam Management, is authorized by the Trustees to manage a separate portion of the assets of the fund as determined by Putnam Management from time to time. Putnam Management pays a quarterly sub-management fee to PIL for its services at an annual rate of 0.40% of the average net assets of the portion of the fund managed by PIL.
On September 15, 2008, the fund terminated its outstanding derivatives contracts with Lehman Brothers Special Financing, Inc. (LBSF) in connection with the bankruptcy filing of LBSF’s parent company, Lehman Brothers Holdings, Inc. On September 26, 2008, the fund entered into receivable purchase agreements (Agreements) with other registered investment companies (each a Seller) managed by Putnam Management. Under the Agreements, the Sellers sold to the fund the right to receive, in the aggregate, $4,129,699 in net payments from LBSF in connection with certain terminated derivatives transactions (the Receivable), in exchange for an initial payment plus (or minus) additional amounts based on the fund’s ultimate realized gain (or loss) with respect to the Receivable. The Receivable offset against the fund’s net payable to LBSF. The fund paid $1,283,634 (exclusive of the initial payment) to the Sellers in accordance with the terms of the Agree ments and the fund paid $114,402,603, including interest, to LBSF in complete satisfaction of the fund’s obligations under the terminated contracts.
The fund reimburses Putnam Management an allocated amount for the compensation and related expenses of certain officers of the fund and their staff who provide administrative services to the fund. The aggregate amount of all such reimbursements is determined annually by the Trustees.
Custodial functions for the fund’s assets are provided by State Street. Custody fees are based on the fund’s asset level, the number of its security holdings and transaction volumes.
Putnam Investor Services, Inc., an affiliate of Putnam Management, provides investor servicing agent functions to the fund. Putnam Investor Services, Inc. received fees for investor servicing, subject to certain limitations, based on the fund’s retail asset level, the number of shareholder accounts in the fund and the level of defined contribution plan assets in the fund. The amounts incurred for investor servicing agent functions during the reporting period are included in Investor servicing fees in the Statement of operations.
56
Under the custodian contract between the fund and State Street, the custodian bank has a lien on the securities of the fund to the extent permitted by the fund’s investment restrictions to cover any advances made by the custodian bank for the settlement of securities purchased by the fund. At the close of the reporting period, the payable to the custodian bank represents the amount due for cash advanced for the settlement of securities purchased.
The fund has entered into expense offset arrangements with Putnam Investor Services, Inc. and State Street whereby Putnam Investor Services, Inc.’s and State Street’s fees are reduced by credits allowed on cash balances. The fund also reduced expenses through brokerage/service arrangements. For the reporting period, the fund’s expenses were reduced by $2,798 under the expense offset arrangements and by $47,925 under the brokerage/service arrangements.
Each independent Trustee of the fund receives an annual Trustee fee, of which $961, as a quarterly retainer, has been allocated to the fund, and an additional fee for each Trustees meeting attended. Trustees also are reimbursed for expenses they incur relating to their services as Trustees.
The fund has adopted a Trustee Fee Deferral Plan (the Deferral Plan) which allows the Trustees to defer the receipt of all or a portion of Trustees fees payable on or after July 1, 1995. The deferred fees remain invested in certain Putnam funds until distribution in accordance with the Deferral Plan.
The fund has adopted an unfunded noncontributory defined benefit pension plan (the Pension Plan) covering all Trustees of the fund who have served as a Trustee for at least five years and were first elected prior to 2004. Benefits under the Pension Plan are equal to 50% of the Trustee’s average annual attendance and retainer fees for the three years ended December 31, 2005. The retirement benefit is payable during a Trustee’s lifetime, beginning the year following retirement, for the number of years of service through December 31, 2006. Pension expense for the fund is included in Trustee compensation and expenses in the Statement of operations. Accrued pension liability is included in Payable for Trustee compensation and expenses in the Statement of assets and liabilities. The Trustees have terminated the Pension Plan with respect to any Trustee first elected after 2003.
The fund has adopted distribution plans (the Plans) with respect to its class A, class B, class C, class M and class R shares pursuant to Rule 12b-1 under the Investment Company Act of 1940. The purpose of the Plans is to compensate Putnam Retail Management Limited Partnership, a wholly-owned subsidiary of Putnam Investments, LLC and Putnam Retail Management GP, Inc., for services provided and expenses incurred in distributing shares of the fund. The Plans provide for payments by the fund to Putnam Retail Management Limited Partnership at an annual rate of up to 0.35%, 1.00%, 1.00%, 1.00% and 1.00% of the average net assets attributable to class A, class B, class C, class M and class R shares, respectively. The Trustees have approved payment by the fund at an annual rate of 0.25%, 1.00%, 1.00%, 0.75% and 0.50% of the average net assets attributable to class A, class B, class C, class M and class R shares, respectively.
For the reporting period, Putnam Retail Management Limited Partnership, acting as underwriter, received net commissions of $72,200 and $800 from the sale of class A and class M shares, respectively, and received $48,284 and $639 in contingent deferred sales charges from redemptions of class B and class C shares, respectively.
A deferred sales charge of up to 1.00% and 0.65% is assessed on certain redemptions of class A and class M shares, respectively. For the reporting period, Putnam Retail Management Limited Partnership, acting as underwriter, received $86 and no monies on class A and class M redemptions, respectively.
Note 3: Purchases and sales of securities
During the reporting period, cost of purchases and proceeds from sales of investment securities other than U.S. government securities and short-term investments aggregated $4,131,892,223 and $4,392,465,436, respectively. Purchases and proceeds from sales of long-term U.S. government securities aggregated $309,470,708 and $210,947,320, respectively.
57
Note 4: Capital shares
At the close of the reporting period, there was an unlimited number of shares of beneficial interest authorized.
Transactions in capital shares were as follows:
| | | | |
| | Year ended 7/31/10 | Year ended 7/31/09 |
|
| Class A | Shares | Amount | Shares | Amount |
|
| Shares sold | 7,157,334 | $78,048,797 | 10,864,135 | $117,793,046 |
|
| Shares issued in connection with | | | | |
| reinvestment of distributions | 2,245,104 | 23,924,226 | 8,127,627 | 68,204,534 |
|
| | 9,402,438 | 101,973,023 | 18,991,762 | 185,997,580 |
|
| Shares repurchased | (25,337,071) | (275,336,040) | (61,144,272) | (601,240,200) |
|
| Net decrease | (15,934,633) | $(173,363,017) | (42,152,510) | $(415,242,620) |
|
| |
| | Year ended 7/31/10 | Year ended 7/31/09 |
|
| Class B | Shares | Amount | Shares | Amount |
|
| Shares sold | 386,438 | $4,173,271 | 636,017 | $6,160,646 |
|
| Shares issued in connection with | | | | |
| reinvestment of distributions | 109,999 | 1,153,267 | 657,232 | 6,264,264 |
|
| | 496,437 | 5,326,538 | 1,293,249 | 12,424,910 |
|
| Shares repurchased | (3,984,205) | (42,971,075) | (7,523,910) | (75,327,957) |
|
| Net decrease | (3,487,768) | $(37,644,537) | (6,230,661) | $(62,903,047) |
|
| |
| | Year ended 7/31/10 | Year ended 7/31/09 |
|
| Class C | Shares | Amount | Shares | Amount |
|
| Shares sold | 253,971 | $2,769,571 | 192,005 | $1,913,275 |
|
| Shares issued in connection with | | | | |
| reinvestment of distributions | 31,584 | 333,793 | 146,683 | 1,397,800 |
|
| | 285,555 | 3,103,364 | 338,688 | 3,311,075 |
|
| Shares repurchased | (526,722) | (5,706,290) | (1,346,268) | (13,370,895) |
|
| Net decrease | (241,167) | $(2,602,926) | (1,007,580) | $(10,059,820) |
|
| |
| | Year ended 7/31/10 | Year ended 7/31/09 |
|
| Class M | Shares | Amount | Shares | Amount |
|
| Shares sold | 612,804 | $6,557,334 | 949,021 | $9,174,013 |
|
| Shares issued in connection with | | | | |
| reinvestment of distributions | 143,532 | 1,508,597 | 525,577 | 4,961,198 |
|
| | 756,336 | 8,065,931 | 1,474,598 | 14,135,211 |
|
| Shares repurchased | (1,629,586) | (17,541,774) | (2,648,958) | (26,293,344) |
|
| Net decrease | (873,250) | $(9,475,843) | (1,174,360) | $(12,158,133) |
|
| |
| | Year ended 7/31/10 | Year ended 7/31/09 |
|
| Class R | Shares | Amount | Shares | Amount |
|
| Shares sold | 32,634 | $353,434 | 43,414 | $431,643 |
|
| Shares issued in connection with | | | | |
| reinvestment of distributions | 2,899 | 30,765 | 15,191 | 147,841 |
|
| | 35,533 | 384,199 | 58,605 | 579,484 |
|
| Shares repurchased | (61,588) | (675,039) | (217,387) | (1,981,893) |
|
| Net decrease | (26,055) | $(290,840) | (158,782) | $(1,402,409) |
|
58
| | | | |
| | Year ended 7/31/10 | Year ended 7/31/09 |
|
| Class Y | Shares | Amount | Shares | Amount |
|
| Shares sold | 582,706 | $6,333,794 | 5,537,618 | $55,582,575 |
|
| Shares issued in connection with | | | | |
| reinvestment of distributions | 236,812 | 2,532,185 | 1,103,663 | 10,696,052 |
|
| | 819,518 | 8,865,979 | 6,641,281 | 66,278,627 |
|
| Shares repurchased | (4,718,963) | (52,846,941) | (14,825,955) | (145,123,743) |
|
| Net decrease | (3,899,445) | $(43,980,962) | (8,184,674) | $(78,845,116) |
|
Note 5: Summary of derivative activity
As of the close of the reporting period, the fund did not hold any derivative instruments.
The following is a summary of realized and change in unrealized gains or losses of derivative instruments on the Statement of operations for the reporting period (see Note 1):
Amount of Realized Gain or (Loss) on Derivatives Recognized in Income
| | | |
| Derivatives not accounted for as hedging | | | |
| instruments under ASC 815 | Futures | Swaps | Total |
|
| Credit contracts | $— | $(135,696) | $(135,696) |
|
| Interest rate contracts | 223,611 | — | $223,611 |
|
| Total | $223,611 | $(135,696) | $87,915 |
|
Change in Unrealized Appreciation or (Depreciation) on Derivatives Recognized in Income
| | | |
| Derivatives not accounted for as hedging | | | |
| instruments under ASC 815 | Futures | Swaps | Total |
|
| Credit contracts | $— | $74,102 | $74,102 |
|
| Interest rate contracts | (105,329) | — | (105,329) |
|
| Total | $(105,329) | $74,102 | $(31,227) |
|
Note 6: Investment in Putnam Money Market Liquidity Fund
The fund invested in Putnam Money Market Liquidity Fund, an open-end management investment company managed by Putnam Management. Investments in Putnam Money Market Liquidity Fund are valued at its closing net asset value each business day. Income distributions earned by the fund are recorded as interest income in the Statement of operations and totaled $330,465 for the reporting period. During the reporting period, cost of purchases and proceeds of sales of investments in Putnam Money Market Liquidity Fund aggregated $730,979,600 and $856,130,712, respectively. Management fees charged to Putnam Money Market Liquidity Fund have been waived by Putnam Management.
Note 7: Regulatory matters and litigation
In late 2003 and 2004, Putnam Management settled charges brought by the SEC and the Massachusetts Securities Division in connection with excessive short-term trading in Putnam funds. Distribution of payments from Putnam Management to certain open-end Putnam funds and their shareholders is expected to be completed in the next several months. These allegations and related matters have served as the general basis for certain lawsuits, including purported class action lawsuits against Putnam Management and, in a limited number of cases, some Putnam funds. Putnam Management believes that these lawsuits will have no material adverse effect on the funds or on Putnam Management’s ability to provide investment management services. In addition, Putnam Management has agreed to bear any costs incurred by the Putnam funds as a result of these matters.
Note 8: Market and credit risk
In the normal course of business, the fund trades financial instruments and enters into financial transactions where risk of potential loss exists due to changes in the market (market risk) or failure of the contracting party to the transaction to perform (credit risk). The fund may be exposed to additional credit risk that an institution or other entity with which the fund has unsettled or open transactions will default.
59
Federal tax information (Unaudited)
The fund designated 67.34% of ordinary income distributions as qualifying for the dividends received deduction for corporations.
For its tax year ended July 31, 2010, the fund hereby designates 71.86%, or the maximum amount allowable, of its taxable ordinary income distributions as qualified dividends taxed at the individual net capital gain rates.
For the tax year ended July 31, 2010, pursuant to §871(k) of the Internal Revenue Code, the fund hereby designates $15,476,145 of distributions paid as qualifying to be taxed as interest-related dividends, and no monies to be taxed as short-term capital gain dividends for nonresident alien shareholders.
60
Shareholder meeting results (Unaudited)
November 19, 2009 meeting
At the meeting, each of the nominees for Trustees was elected, as follows:
| | | |
| | | Votes for | Votes withheld |
|
| Ravi Akhoury | | 98,713,889 | 4,686,436 |
|
| Jameson A. Baxter | | 98,682,759 | 4,717,566 |
|
| Charles B. Curtis | | 98,695,770 | 4,704,555 |
|
| Robert J. Darretta | | 98,741,066 | 4,659,259 |
|
| Myra R. Drucker | | 98,690,905 | 4,709,420 |
|
| John A. Hill | | 98,651,083 | 4,749,242 |
|
| Paul L. Joskow | | 98,741,605 | 4,658,720 |
|
| Elizabeth T. Kennan* | | 98,649,728 | 4,750,597 |
|
| Kenneth R. Leibler | | 98,728,528 | 4,671,797 |
|
| Robert E. Patterson | | 98,646,448 | 4,753,877 |
|
| George Putnam, III | | 98,648,532 | 4,751,793 |
|
| Robert L. Reynolds | | 98,725,017 | 4,675,308 |
|
| W. Thomas Stephens | | 98,722,648 | 4,677,677 |
|
| Richard B. Worley | | 98,715,153 | 4,685,172 |
|
* Dr. Kennan retired from the Board of Trustees of the Putnam funds effective June 30, 2010.
A proposal to approve a new management contract between the fund and Putnam Management was approved as follows:
| | | |
| Votes | Votes | | Broker |
| for | against | Abstentions | non-votes |
|
| 77,195,407 | 2,012,557 | 3,842,047 | 20,350,314 |
|
A proposal to approve an amendment to the fund’s agreement and declaration of trust with respect to the duration of the trust was approved as follows:
| | | |
| Votes | Votes | | Broker |
| for | against | Abstentions | non-votes |
|
| 77,117,385 | 1,920,692 | 4,011,934 | 20,350,313 |
|
A proposal to approve an amendment to the fund’s agreement and declaration of trust with respect to redemption at the option of the trust was approved as follows:
| | | |
| Votes | Votes | | Broker |
| for | against | Abstentions | non-votes |
|
| 73,369,908 | 5,610,624 | 4,069,479 | 20,350,314 |
|
All tabulations are rounded to the nearest whole number.
61
About the Trustees
| | | | |
| Name | | | | |
| Year of birth | | | | |
| Position held | | Principal occupations during past five years | | Other directorships |
|
| Ravi Akhoury | | Advisor to New York Life Insurance Company. Trustee of | | Jacob Ballas Capital |
| Born 1947 | | American India Foundation and of the Rubin Museum. | | India, a non-banking |
| Trustee since 2009 | | From 1992 to 2007, was Chairman and CEO of MacKay | | finance company |
| | | Shields, a multi-product investment management firm | | focused on private |
| | | with over $40 billion in assets under management. | | equity advisory services |
|
| Barbara M. Baumann | | President and Owner of Cross Creek Energy Corporation, | | SM Energy Company, |
| Born 1955 | | a strategic consultant to domestic energy firms and direct | | a publicly held energy |
| Trustee since 2010 | | investor in energy assets. Trustee, and Co-Chair of the | | company focused on |
| | | Finance Committee, of Mount Holyoke College. Former | | natural gas and crude |
| | | Chair and current board member of Girls Incorporated of | | oil in the United States; |
| | | Metro Denver. Member of the Finance Committee, The | | Unisource Energy |
| | | Children’s Hospital. | | Corporation, a publicly |
| | | | | held provider of natural |
| | | | | gas and electric service |
| | | | | across Arizona; Cody |
| | | | | Resources Management, |
| | | | | LLP, a privately held |
| | | | | energy, ranching, and |
| | | | | commercial real estate |
| | | | | company |
|
| Jameson A. Baxter | | President of Baxter Associates, Inc., a private investment | | ASHTA Chemicals, Inc. |
| Born 1943 | | firm. Chairman of Mutual Fund Directors Forum. | | |
| Trustee since 1994 and | | Chairman Emeritus of the Board of Trustees of Mount | | |
| Vice Chairman since 2005 | | Holyoke College. | | |
|
| Charles B. Curtis | | President Emeritus of the Nuclear Threat Initiative, a | | Edison International; |
| Born 1940 | | private foundation dealing with national security issues. | | Southern California |
| Trustee since 2001 | | Senior Advisor to the United Nations Foundation. Senior | | Edison |
| | | Advisor to the Center for Strategic and International | | |
| | Studies. Member of the Council on Foreign Relations and | | |
| | | the National Petroleum Council. | | |
|
| Robert J. Darretta | | Health Care Industry Advisor to Permira, a global private | | United-Health |
| Born 1946 | | equity firm. Until April 2007, was Vice Chairman of the | | Group, a diversified |
| Trustee since 2007 | | Board of Directors of Johnson & Johnson. Served as | | health-care company |
| | Johnson & Johnson’s Chief Financial Officer for a decade. | | |
|
| Myra R. Drucker | | Vice Chair of the Board of Trustees of Sarah Lawrence | | Grantham, Mayo, |
| Born 1948 | | College, and a member of the Investment Committee of | | Van Otterloo & Co., |
| Trustee since 2004 | | the Kresge Foundation, a charitable trust. Advisor to the | | LLC, an investment |
| | | Employee Benefits Investment Committee of The Boeing | | management company |
| | Company. Retired in 2009 as Chair of the Board of Trustees | | |
| | of Commonfund, a not-for-profit firm that manages assets | | |
| | for educational endowments and foundations. Until July | | |
| | 2010, Advisor to RCM Capital Management and member of | | |
| | | the Board of Interactive Data Corporation. | | |
|
| John A. Hill | | Founder and Vice-Chairman of First Reserve | | Devon Energy |
| Born 1942 | | Corporation, the leading private equity buyout firm | | Corporation, a leading |
| Trustee since 1985 and | | focused on the worldwide energy industry. Serves as a | | independent natural gas |
| Chairman since 2000 | | Trustee and Chairman of the Board of Trustees of Sarah | | and oil exploration and |
| | | Lawrence College. Also a member of the Advisory Board | | production company |
| | | of the Millstein Center for Corporate Governance and | | |
| | | Performance at the Yale School of Management. | | |
|
62
| | | | |
| Name | | | | |
| Year of birth | | | | |
| Position held | | Principal occupations during past five years | | Other directorships |
|
| Paul L. Joskow | | Economist and President of the Alfred P. Sloan | | TransCanada |
| Born 1947 | | Foundation, a philanthropic institution focused primarily | | Corporation, an energy |
| Trustee since 1997 | | on research and education on issues related to science, | | company focused on |
| | | technology, and economic performance. Elizabeth and | | natural gas transmission |
| | | James Killian Professor of Economics and Management, | | and power services; |
| | | Emeritus at the Massachusetts Institute of Technology | | Exelon Corporation, an |
| | | (MIT). Prior to 2007, served as the Director of the Center | | energy company focused |
| | | for Energy and Environmental Policy Research at MIT. | | on power services |
|
| Kenneth R. Leibler | | Founder and former Chairman of Boston Options | | Ruder Finn Group, a |
| Born 1949 | | Exchange, an electronic marketplace for the trading | | global communications |
| Trustee since 2006 | | of derivative securities. Vice Chairman of the Board of | | and advertising firm; |
| | | Trustees of Beth Israel Deaconess Hospital in Boston, | | Northeast Utilities, |
| | | Massachusetts. | | which operates New |
| | | | | England’s largest energy |
| | | | | delivery system |
|
| Robert E. Patterson | | Senior Partner of Cabot Properties, LP and Co-Chairman | | None |
| Born 1945 | | of Cabot Properties, Inc., a private equity firm investing in | | |
| Trustee since 1984 | | commercial real estate. Past Chairman and Trustee of the | | |
| | | Joslin Diabetes Center. | | |
|
| George Putnam, III | | Chairman of New Generation Research, Inc., a publisher | | None |
| Born 1951 | | of financial advisory and other research services, and | | |
| Trustee since 1984 | | founder and President of New Generation Advisors, LLC, | | |
| | | a registered investment advisor to private funds. | | |
| | Director of The Boston Family Office, LLC, a registered | | |
| | | investment advisor. | | |
|
| Robert L. Reynolds* | | President and Chief Executive Officer of Putnam | | None |
| Born 1952 | | Investments since 2008. Prior to joining Putnam | | |
| Trustee since 2008 and | | Investments, served as Vice Chairman and Chief | | |
| President of the Putnam | | Operating Officer of Fidelity Investments from | | |
| Funds since July 2009 | | 2000 to 2007. | | |
|
| W. Thomas Stephens | | Retired as Chairman and Chief Executive Officer of Boise | | TransCanada |
| Born 1942 | | Cascade, LLC, a paper, forest products, and timberland | | Corporation, an energy |
| Trustee from 1997 to 2008 | | assets company, in December 2008. | | company focused on |
| and since 2009 | | | | natural gas transmission |
| | | | | and power services |
|
| Richard B. Worley | | Managing Partner of Permit Capital LLC, an investment | | Neuberger Berman, |
| Born 1945 | | management firm. Serves as a Trustee of the University of | | an investment |
| Trustee since 2004 | | Pennsylvania Medical Center, the Robert Wood Johnson | | management firm |
| | | Foundation, a philanthropic organization devoted to | | |
| | health-care issues, and the National Constitution Center. | | |
| | | Also serves as a Director of the Colonial Williamsburg | | |
| | Foundation, a historical preservation organization, and as | | |
| | | Chairman of the Philadelphia Orchestra Association. | | |
The address of each Trustee is One Post Office Square, Boston, MA 02109.
As of July 31, 2010, there were 105 Putnam funds. All Trustees serve as Trustees of all Putnam funds.
Each Trustee serves for an indefinite term, until his or her resignation, retirement at age 72, removal, or death.
* Mr. Reynolds is an “interested person” (as defined in the Investment Company Act of 1940) of the fund, Putnam Management, and/or Putnam Retail Management. He is President and Chief Executive Officer of Putnam Investments, as well as the President of your fund and each of the other Putnam funds.
63
Officers
In addition to Robert L. Reynolds, the other officers of the fund are shown below:
| |
| Jonathan S. Horwitz (Born 1955) | Francis J. McNamara, III (Born 1955) |
| Executive Vice President, Principal Executive | Vice President and Chief Legal Officer |
| Officer, Treasurer and Compliance Liaison | Since 2004 |
| Since 2004 | Senior Managing Director, Putnam Investments, |
| | Putnam Management and Putnam Retail |
| Steven D. Krichmar (Born 1958) | Management |
| Vice President and Principal Financial Officer | |
| Since 2002 | Robert R. Leveille (Born 1969) |
| Senior Managing Director, Putnam Investments | Vice President and Chief Compliance Officer |
| | Since 2007 |
| Janet C. Smith (Born 1965) | Managing Director, Putnam Investments, |
| Vice President, Principal Accounting Officer and | Putnam Management and Putnam |
| Assistant Treasurer | Retail Management |
| Since 2007 | |
| Managing Director, Putnam Investments and | Mark C. Trenchard (Born 1962) |
| Putnam Management | Vice President and BSA Compliance Officer |
| | Since 2002 |
| Susan G. Malloy (Born 1957) | Managing Director, Putnam Investments |
| Vice President and Assistant Treasurer | |
| Since 2007 | Judith Cohen (Born 1945) |
| Managing Director, Putnam Investments | Vice President, Clerk and Assistant Treasurer |
| | Since 1993 |
| Beth S. Mazor (Born 1958) | |
| Vice President | Michael Higgins (Born 1976) |
| Since 2002 | Vice President |
| Managing Director, Putnam Investments | Since 2010 |
| | |
| James P. Pappas (Born 1953) | Nancy E. Florek (Born 1957) |
| Vice President | Vice President, Assistant Clerk, |
| Since 2004 | Assistant Treasurer and Proxy Manager |
| Managing Director, Putnam Investments and | Since 2005 |
| Putnam Management | |
The principal occupations of the officers for the past five years have been with the employers as shown above although in some cases, they have held different positions with such employers. The address of each Officer is One Post Office Square, Boston, MA 02109.
64
Fund information
Founded over 70 years ago, Putnam Investments was built around the concept that a balance between risk and reward is the hallmark of a well-rounded financial program. We manage over 100 funds across income, value, blend, growth, asset allocation, absolute return, and global sector categories.
| | |
| Investment Manager | Charles B. Curtis | Susan G. Malloy |
| Putnam Investment | Robert J. Darretta | Vice President and |
| Management, LLC | Myra R. Drucker | Assistant Treasurer |
| One Post Office Square | Paul L. Joskow | |
| Boston, MA 02109 | Kenneth R. Leibler | Beth S. Mazor |
| | Robert E. Patterson | Vice President |
| Investment Sub-Manager | George Putnam, III | |
| Putnam Investments Limited | Robert L. Reynolds | James P. Pappas |
| 57–59 St James’s Street | W. Thomas Stephens | Vice President |
| London, England SW1A 1LD | Richard B. Worley | |
| | | Francis J. McNamara, III |
| Marketing Services | Officers | Vice President and |
| Putnam Retail Management | Robert L. Reynolds | Chief Legal Officer |
| One Post Office Square | President | |
| Boston, MA 02109 | | Robert R. Leveille |
| | Jonathan S. Horwitz | Vice President and |
| Custodian | Executive Vice President, | Chief Compliance Officer |
| State Street Bank | Principal Executive | |
| and Trust Company | Officer, Treasurer and | Mark C. Trenchard |
| Compliance Liaison | Vice President and |
| Legal Counsel | | BSA Compliance Officer |
| Ropes & Gray LLP | Steven D. Krichmar | |
| Vice President and | Judith Cohen |
| Independent Registered | Principal Financial Officer | Vice President, Clerk and |
| Public Accounting Firm | | Assistant Treasurer |
| PricewaterhouseCoopers LLP | Janet C. Smith | |
| | Vice President, Principal | Michael Higgins |
| Trustees | Accounting Officer and | Vice President |
| John A. Hill, Chairman | Assistant Treasurer | |
| Jameson A. Baxter, | | Nancy E. Florek |
| Vice Chairman | | Vice President, Assistant Clerk, |
| Ravi Akhoury | | Assistant Treasurer and |
| Barbara M. Baumann | | Proxy Manager |
| | |
This report is for the information of shareholders of George Putnam Balanced Fund. It may also be used as sales literature when preceded or accompanied by the current prospectus, the most recent copy of Putnam’s Quarterly Performance Summary, and Putnam’s Quarterly Ranking Summary. For more recent performance, please visit putnam.com. Investors should carefully consider the investment objective, risks, charges, and expenses of a fund, which are described in its prospectus. For this and other information or to request a prospectus, or a summary prospectus if available, call 1-800-225-1581 toll free. Please read the prospectus carefully before investing. The fund’s Statement of Additional Information contains additional information about the fund’s Trustees and is available without charge upon request by calling 1-800-225-1581.
Item 2. Code of Ethics:
(a) The fund’s principal executive, financial and accounting officers are employees of Putnam Investment Management, LLC, the Fund's investment manager. As such they are subject to a comprehensive Code of Ethics adopted and administered by Putnam Investments which is designed to protect the interests of the firm and its clients. The Fund has adopted a Code of Ethics which incorporates the Code of Ethics of Putnam Investments with respect to all of its officers and Trustees who are employees of Putnam Investment Management, LLC. For this reason, the Fund has not adopted a separate code of ethics governing its principal executive, financial and accounting officers.
(c) In May 2008, the Code of Ethics of Putnam Investment Management, LLC was updated in its entirety to include the amendments adopted in August 2007 as well as a several additional technical, administrative and non-substantive changes. In May of 2009, the Code of Ethics of Putnam Investment Management, LLC was amended to reflect that all employees will now be subject to a 90-day blackout restriction on holding Putnam open-end funds, except for portfolio managers and their supervisors (and each of their immediate family members), who will be subject to a one-year blackout restriction on the funds that they manage or supervise. In June 2010, the Code of Ethics of Putnam Investments was updated in its entirety to include the amendments adopted in May of 2009 and to change certain rules and limits contained in the Code of Ethics. In addition, the updated Code of Ethics included numerous technical, administrative and non - -substantive changes, which were intended primarily to make the document easier to navigate and understand.
Item 3. Audit Committee Financial Expert:
The Funds' Audit and Compliance Committee is comprised solely of Trustees who are "independent" (as such term has been defined by the Securities and Exchange Commission ("SEC") in regulations implementing Section 407 of the Sarbanes-Oxley Act (the "Regulations")). The Trustees believe that each of the members of the Audit and Compliance Committee also possess a combination of knowledge and experience with respect to financial accounting matters, as well as other attributes, that qualify them for service on the Committee. In addition, the Trustees have determined that each of Mr. Patterson, Mr. Leibler, Mr. Hill, Mr. Darretta and Ms. Baumann qualifies as an "audit committee financial expert" (as such term has been defined by the Regulations) based on their review of his or her pertinent experience and education. The SEC has stated that the designation or identification of a person as an audit committee financial expert pursuant to this Item 3 of Form N- CSR does not impose on such person any duties, obligations or liability that are greater than the duties, obligations and liability imposed on such person as a member of the Audit and Compliance Committee and the Board of Trustees in the absence of such designation or identification.
Item 4. Principal Accountant Fees and Services:
The following table presents fees billed in each of the last two fiscal years for services rendered to the fund by the fund’s independent auditor:
| | | | |
| Fiscal | | Audit- | | |
| year | Audit | Related | Tax | All Other |
| ended | Fees | Fees | Fees | Fees |
| July 31, 2010 | $219,196 | $-- | $9,166 | $1,921* |
| July 31, 2009 | $274,709 | $-- | $9,122 | $3,191* |
* Includes fees of $1,921 and $3,191 billed by the fund’s independent auditor to the fund for procedures necessitated by regulatory and litigation matters for the fiscal years ended July 31, 2010 and July 31, 2009, respectively. These fees were reimbursed to the fund by Putnam Investment Management, LLC (“Putnam Management”).
For the fiscal years ended July 31, 2010 and July 31, 2009, the fund’s independent auditor billed aggregate non-audit fees in the amounts of $416,246 and $ 533,197 respectively, to the fund, Putnam Management and any entity controlling, controlled by or under common control with Putnam Management that provides ongoing services to the fund.
Audit Fees represent fees billed for the fund's last two fiscal years relating to the audit and review of the financial statements included in annual reports and registration statements, and other services that are normally provided in connection with statutory and regulatory filings or engagements.
Audit-Related Fees represent fees billed in the fund’s last two fiscal years for services traditionally performed by the fund’s auditor, including accounting consultation for proposed transactions or concerning financial accounting and reporting standards and other audit or attest services not required by statute or regulation.
Tax Fees represent fees billed in the fund’s last two fiscal years for tax compliance, tax planning and tax advice services. Tax planning and tax advice services include assistance with tax audits, employee benefit plans and requests for rulings or technical advice from taxing authorities.
All Other Fees represent procedures necessitated by regulatory and litigation matters.
Pre-Approval Policies of the Audit and Compliance Committee. The Audit and Compliance Committee of the Putnam funds has determined that, as a matter of policy, all work performed for the funds by the funds’ independent auditors will be pre-approved by the Committee itself and thus will generally not be subject to pre-approval procedures.
The Audit and Compliance Committee also has adopted a policy to pre-approve the engagement by Putnam Management and certain of its affiliates of the funds’ independent auditors, even in circumstances where pre-approval is not required by applicable law. Any such requests by Putnam Management or certain of its affiliates are typically submitted in writing to the Committee and explain, among other things, the nature of the proposed engagement, the estimated fees, and why this work should be performed by that particular audit firm as opposed to another one. In reviewing such requests, the Committee considers, among other things, whether the provision of such services by the audit firm are compatible with the independence of the audit firm.
The following table presents fees billed by the fund’s independent auditor for services required to be approved pursuant to paragraph (c)(7)(ii) of Rule 2-01 of Regulation S-X.
| | | | |
| Fiscal | Audit- | | All | Total |
| year | Related | Tax | Other | Non-Audit |
| ended | Fees | Fees | Fees | Fees |
| July 31, 2010 | $ - | $ 249,107 | $ - | $ - |
| July 31, 2009 | $ - | $ 485,847 | $ - | $ - |
Item 5. Audit Committee of Listed Registrants
Not applicable
Item 6. Schedule of Investments:
The registrant’s schedule of investments in unaffiliated issuers is included in the report to shareholders in Item 1 above.
Item 7. Disclosure of Proxy Voting Policies and Procedures For Closed-End Management Investment Companies:
Not applicable
Item 8. Portfolio Managers of Closed-End Investment Companies
Not Applicable
Item 9. Purchases of Equity Securities by Closed-End Management Investment Companies and Affiliated Purchasers:
Not applicable
Item 10. Submission of Matters to a Vote of Security Holders:
Not applicable
Item 11. Controls and Procedures:
(a) The registrant's principal executive officer and principal financial officer have concluded, based on their evaluation of the effectiveness of the design and operation of the registrant's disclosure controls and procedures as of a date within 90 days of the filing date of this report, that the design and operation of such procedures are generally effective to provide reasonable assurance that information required to be disclosed by the registrant in this report is recorded, processed, summarized and reported within the time periods specified in the Commission's rules and forms.
(b) Changes in internal control over financial reporting: Not applicable
Item 12. Exhibits:
(a)(1) The Code of Ethics of The Putnam Funds, which incorporates the Code of Ethics of Putnam Investments, is filed herewith.
(a)(2) Separate certifications for the principal executive officer and principal financial officer of the registrant as required by Rule 30a-2(a) under the Investment Company Act of 1940, as amended, are filed herewith.
(b) The certifications required by Rule 30a-2(b) under the Investment Company Act of 1940, as amended, are filed herewith.
SIGNATURES
Pursuant to the requirements of the Securities Exchange Act of 1934 and the Investment Company Act of 1940, the registrant has duly caused this report to be signed on its behalf by the undersigned, thereunto duly authorized.
George Putnam Balanced Fund
By (Signature and Title):
/s/Janet C. Smith
Janet C. Smith
Principal Accounting Officer
Date: September 28, 2010
Pursuant to the requirements of the Securities Exchange Act of 1934 and the Investment Company Act of 1940, this report has been signed below by the following persons on behalf of the registrant and in the capacities and on the dates indicated.
By (Signature and Title):
/s/Jonathan S. Horwitz
Jonathan S. Horwitz
Principal Executive Officer
Date: September 28, 2010
By (Signature and Title):
/s/Steven D. Krichmar
Steven D. Krichmar
Principal Financial Officer
Date: September 28, 2010