| | |
| UNITED STATES
SECURITIES AND EXCHANGE COMMISSION |
| | |
| CERTIFIED SHAREHOLDER REPORT OF REGISTERED
MANAGEMENT INVESTMENT COMPANIES
|
| | |
| Investment Company Act file number: | (811-00058) |
| | |
| Exact name of registrant as specified in charter: | The George Putnam Fund of Boston |
| | |
| Address of principal executive offices: | One Post Office Square, Boston, Massachusetts 02109 |
| | |
| Name and address of agent for service: | Robert T. Burns, Vice President
One Post Office Square
Boston, Massachusetts 02109 |
| | |
| Copy to: | John W. Gerstmayr, Esq.
Ropes & Gray LLP
800 Boylston Street
Boston, Massachusetts 02199-3600 |
| | |
| Registrant’s telephone number, including area code: | (617) 292-1000 |
| | |
| Date of fiscal year end: | July 31, 2013 |
| | |
| Date of reporting period : | August 1, 2012 — July 31, 2013 |
| | |
|
Item 1. Report to Stockholders: | |
| | |
| The following is a copy of the report transmitted to stockholders pursuant to Rule 30e-1 under the Investment Company Act of 1940: | |
George Putnam
Balanced
Fund
Annual report
7 | 31 | 13
| | | |
| Message from the Trustees | 1 | | |
| | |
| About the fund | 2 | | |
| | |
| Performance snapshot | 4 | | |
| | |
| Interview with your fund’s portfolio managers | 5 | | |
| | |
| Your fund’s performance | 10 | | |
| | |
| Your fund’s expenses | 13 | | |
| | |
| Terms and definitions | 15 | | |
| | |
| Other information for shareholders | 16 | | |
| | |
| Important notice regarding Putnam’s privacy policy | 16 | | |
| | |
| Trustee approval of management contract | 17 | | |
| | |
| Financial statements | 23 | | |
| | |
| Federal tax information | 57 | | |
| | |
| About the Trustees | 58 | | |
| | |
| Officers | 60 | | |
| | |
Consider these risks before investing: Investments in small and/or midsize companies increase the risk of greater price fluctuations. Value stocks may fail to rebound, and the market may not favor value-style investing. Bond investments are subject to interest-rate risk (the risk of bond prices falling if interest rates rise) and credit risk (the risk of an issuer defaulting on interest or principal payments). Interest-rate risk is greater for longer-term bonds, and credit risk is greater for below-investment-grade bonds. Risks associated with derivatives include increased investment exposure (which may be considered leverage) and, in the case of over-the-counter instruments, the potential inability to terminate or sell derivatives positions and the potential failure of the other party to the instrument to meet its obligations. Unlike bonds, funds that invest in bonds have fees and expenses. Stock and bond prices may fall or fail to rise over time for several reasons, including general financial market conditions and factors related to a specific issuer or industry. You can lose money by investing in the fund.
Message from the Trustees
Dear Fellow Shareholder:
At the midpoint of 2013, U.S. equity market indexes were near record highs, and the overarching theme of the domestic economy appeared to be one of slow healing. Equity investors were encouraged by improving housing and jobs data, as well as by solid corporate earnings. In Europe, the worst of the financial crisis appears to have passed, with some economic forecasts predicting that the eurozone will return to positive growth later this year. Meanwhile, thanks to its government’s massive stimulus initiatives, Japan recently has experienced stronger economic growth after years of stagnation.
A primary question confronting markets is how the U.S. central bank will gradually reduce its $85 billion-a-month bond-buying program without derailing the fragile economic recovery. Investors have reacted positively to public reassurances by Fed Chairman Ben Bernanke, who said the central bank would not draw down stimulus until the economy finds itself on firm footing.
We cannot predict the pace at which economies will recover, nor can we forecast the full impact of the Fed’s tapering decisions. However, we believe that Putnam’s in-depth fundamental research, active investing, and risk management strategies can serve investors well through changing markets. Putnam’s investment professionals integrate innovative thinking with traditional and alternative approaches to address a diverse range of financial goals.
We also believe that investing in any market environment is most effective when combined with the guidance of a professional advisor who can help you develop a financial plan suited to your goals and risk tolerance.
We would like to welcome new shareholders of the fund and to thank you for investing with Putnam. We would also like to extend our thanks to Elizabeth Kennan, who recently retired from the Board of Trustees, for her 20 years of dedicated service.

About the fund
Providing the benefits of balanced investing since 1937
The fund launched in 1937 when George Putnam, a Boston investment manager, decided to introduce an innovative approach — a balance of stocks to seek capital appreciation and bonds to help provide current income. The original portfolio featured industrial stocks and railroad bonds.
This balanced approach made sense then, and we believe it continues to make sense now. In the late 1930s, the stock market experienced dramatic swings as businesses struggled to recover from the Great Depression and the shadow of war began to spread across Europe and Asia. Today, economic uncertainties continue to challenge investors.
Although the fund has experienced volatility at times, its balanced approach has kept it on course. When stocks were weak, the fund’s bonds helped results. Similarly, stocks often performed better when bonds were hurt by rising interest rates or inflation.
In a letter to shareholders dated July 12, 1938, George Putnam articulated the strategy this way: “Successful investing calls not so much for some clairvoyant ability to read the future as for the courage to stick to tested, commonsense policies in the face of the unreliable emotional stresses and strains that constantly sweep the market place.” Today, Putnam remains committed to this prudent approach.
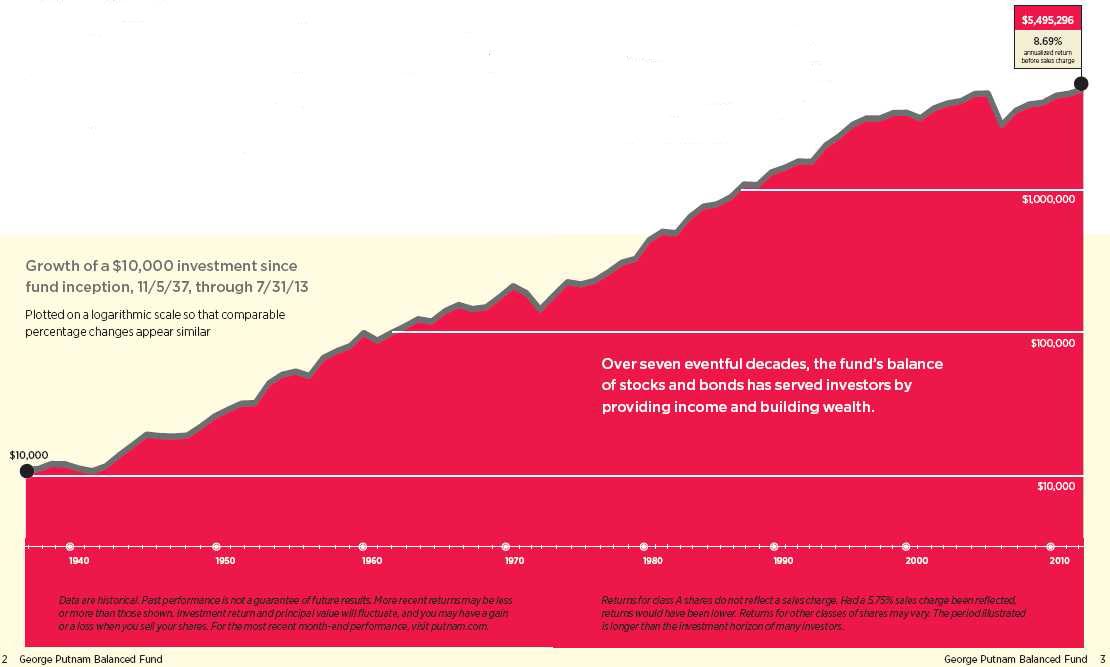
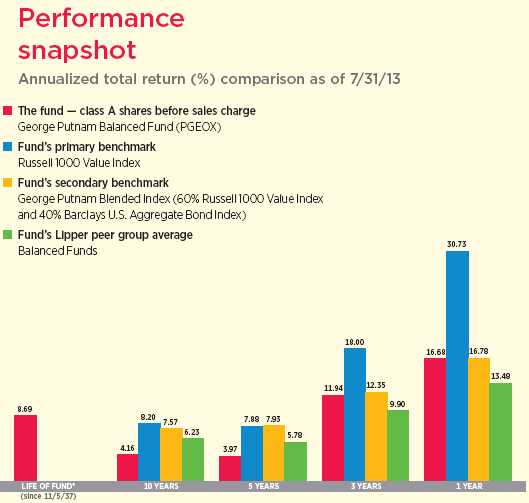
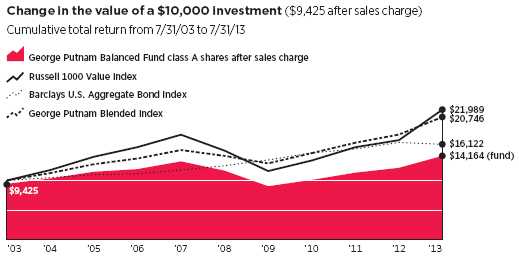
Current performance may be lower or higher than the quoted past performance, which cannot guarantee future results. Share price, principal value, and return will fluctuate, and you may have a gain or a loss when you sell your shares. Performance of class A shares assumes reinvestment of distributions and does not account for taxes. Fund returns in the bar chart do not reflect a sales charge of 5.75%; had they, returns would have been lower. See pages 5 and 10–12 for additional performance information. For a portion of the periods, the fund had expense limitations, without which returns would have been lower. To obtain the most recent month-end performance, visit putnam.com.
* The fund’s benchmarks (Russell 1000 Value Index and George Putnam Blended Index) were introduced on 12/31/78 and its Lipper group (Balanced Funds) was introduced on 12/31/59; they all post-date the inception of the fund’s class A shares.
George Putnam Blended Index is an unmanaged index administered by Putnam Management, 60% of which is the Russell 1000 Value Index and 40% of which is the Barclays U.S. Aggregate Bond Index.
| |
| 4 | George Putnam Balanced Fund |
Interview with your fund’s portfolio managers

Global monetary policy had a significant impact on the behavior of the equity and bond markets throughout the 12-month reporting period ended July 31, 2013. How did these policies influence the fund’s investment universe?
Kevin: Accommodative monetary policy across major world economies was supportive of the equity and bond markets for the first half of the 12-month period. In August 2012, the European Central Bank announced it would begin an expansive bond-buying program to help relieve pressure on struggling European banks and government debt issuers. Then, the following month, the U.S. Federal Reserve broadened its quantitative easing program, committing to continue its purchases of Treasury and mortgage securities for as long as it would take to reduce the domestic unemployment rate to 6.5%. The combination of these policies contributed to a favorable environment for stocks and bonds, which helped the fund’s equity and fixed-income portfolios to generate positive returns for most of the 12-month period. Stock prices, especially in the United States, moved ahead, with many major indexes touching milestone highs during the period.
By spring 2013, however, the investment environment began to change. As the U.S. economy continued its slow, but steady, growth trajectory, investors started to worry about the possibility of rising interest rates,
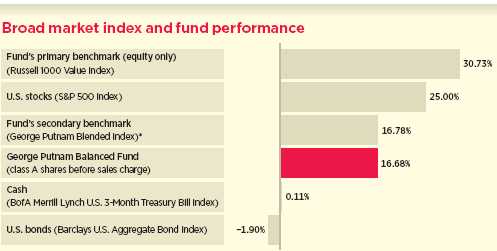
This comparison shows your fund’s performance in the context of broad market indexes for the 12 months ended 7/31/13. See pages 4 and 10–12 for additional fund performance information. Index descriptions can be found on page 15.
* 60% Russell 1000 Value Index and 40% Barclays U.S. Aggregate Bond Index.
| |
| George Putnam Balanced Fund | 5 |
wondering when and how the Fed might begin to pull back on its stimulative bond-buying program. Fears of rising interest rates were amplified in late May and June, when Fed Chairman Ben Bernanke announced that the central bank might begin to taper its bond purchases later in 2013 if the U.S. economy continued its upward growth path. The bond and equity markets both reacted swiftly to the Fed’s suggestions, with the bond market in particular selling off across most sectors. Stock prices also declined for several weeks before leveling off and regaining their previous highs. For the 12-month period as a whole, U.S. stocks posted solid double-digit gains, while the U.S. investment-grade bond market finished in single-digit negative territory.
How did the fund’s fixed-income portfolio fare during this dynamic 12-month period?
Kevin: During the period, our fixed-income portfolio consisted primarily of U.S. Treasuries, agency securities, and high-grade corporate bonds. While we’ve sought to configure the portfolio so as to de-emphasize Treasuries and agencies in favor of the more attractive yield spreads of high-quality corporates, the bond market’s recent struggles did not offer us a lot of compelling opportunities. We did, however, trim some of our overall bond exposure and kept the proceeds of those sales invested in cash. The cash position lowered our bond exposure relative to the George Putnam Blended Index, the fund’s secondary benchmark, which helped a bit, but the negligible returns offered by cash investments were a drag on the fund’s overall performance.
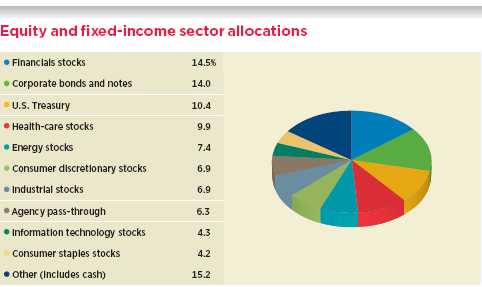
Allocations are shown as a percentage of the fund’s net assets as of 7/31/13. Short-term investments and net other assets, if any, represent the market value weights of cash, derivatives, short-term securities, and other unclassified assets in the portfolio. Summary information may differ from the portfolio schedule included in the financial statements due to the inclusion of derivative securities, any interest accruals, the exclusion of as-of trades, if any, and the use of different classifications of securities for presentation purposes. Holdings and allocations may vary over time.
| |
| 6 | George Putnam Balanced Fund |

How did the fund’s stock portfolio perform during the period?
David: In absolute terms, the stock portfolio had healthy double-digit returns for the 12-month period, with solid gains across all industry sectors. As the period progressed, we did raise our cash position in the fund. While this served to constrain returns a bit, the cash helped to reduce some of the volatility during the annual period.
The portfolio was generally overweight consumer discretionary and health-care stocks and underweight energy, financials, and utilities versus the fund’s primary benchmark, the Russell 1000 Value Index. An underweight position in financials proved to be a detractor from performance, but an underweight within the energy sector was a benefit. Many individual stocks were strong contributors to absolute performance, as the broad market indices all worked higher during the period.
Which individual holdings detracted from the stock portfolio’s relative performance to its primary benchmark during the period?
David: The financial services sector was the best-performing industry group within the Russell 1000 Value Index and, although the fund benefited from good overall stock picking in financial services, we chose not to match the index’s large weighting in the sector. For example, our relative underexposure to Bank of America made it the fund’s biggest detractor. Conversely, we chose to hold an overweight position in multinational tobacco
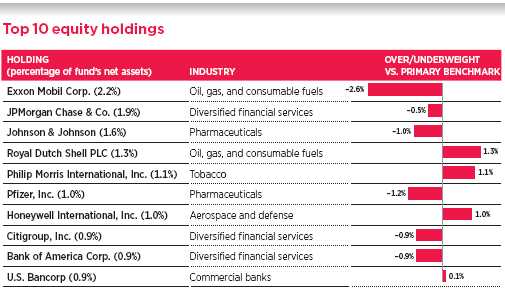
This table shows the fund’s top 10 holdings by percentage of the fund’s net assets as of 7/31/13. Short-term holdings and derivatives, if any, are excluded. Holdings may vary over time.
| |
| George Putnam Balanced Fund | 7 |
distributor Philip Morris International, a stock whose performance was flat-to-down over the past year based on the company’s lackluster earnings. An out-of-benchmark position in Royal Dutch Shell also detracted, as the Anglo-Dutch energy giant disappointed on lower-than-expected profits. Another poor performer in the portfolio was our position in consumer electronics behemoth Apple, a stock that traded down during the period based on worries that its product pipeline could be drying up and ceding gains to other manufacturers.
Where did the fund find stronger results versus the equity-only benchmark?
David: Two of the portfolio’s top-five contributors to relative results during the period were U.S.-based financial services stocks — Prudential Financial and State Street Corporation — both of which were overweights in the portfolio. The financials sector has been the performance leader over the past 12 months, based largely on the ongoing flow of generally positive U.S. economic news, and our sizable positions in these strong-performing names benefited the stock portfolio’s relative results.
Choosing to hold underweight positions in two other large, but underperforming index names — telecommunications stalwart AT&T and integrated energy company Exxon Mobil — also proved beneficial. AT&T’s share price has been under pressure due to concerns the company may be losing competitive market share in its cell phone business. Exxon Mobil underperformed based on lower-than-expected revenues and slimmer profit margins.
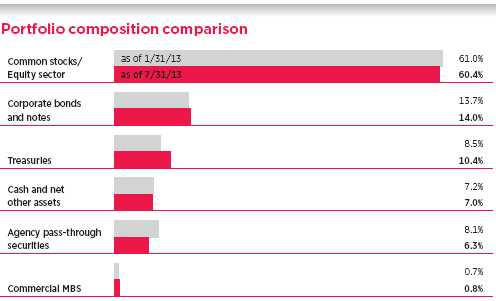
This chart shows how the fund’s top weightings have changed over the past six months. Allocations are shown as a percentage of the fund’s net assets. Cash and net other assets, if any, represent the market value weights of cash, derivatives, short-term securities, and other unclassified assets in the portfolio. Current period summary information may differ from the portfolio schedule included in the financial statements due to the inclusion of derivative securities, any interest accruals, the exclusion of as-of trades, if any, and the use of different classifications of securities for presentation purposes. Holdings and allocations may vary over time.
| |
| 8 | George Putnam Balanced Fund |
What is your outlook for stocks?
David: In terms of business and economic fundamentals, we are generally constructive in our view of the markets. At the same time, however, we’ve seen equity valuations run up for a long while, which might tend to make one somewhat less inclined to play thematic or macroeconomic strategies and, instead, focus more on fundamental, bottom-up, company-specific analysis now that valuations are so stretched. Since fundamental analysis is how we run the fund in the first place, there probably is not a lot we would do to alter our current positioning in the equity portfolio.
What is your outlook and strategy for bonds?
Kevin: While the threat of rising interest rates has injected some volatility into the bond markets recently, we don’t expect rates to spike suddenly but, more likely, to continue to be range-bound over the near term. As a result, we believe the environment for corporate credit and other spread-sector bond categories may continue to be more favorable than the rate-sensitive provinces of government and agency securities.
Kevin and David, thanks for sharing your insights.
The views expressed in this report are exclusively those of Putnam Management and are subject to change. They are not meant as investment advice.
Please note that the holdings discussed in this report may not have been held by the fund for the entire period. Portfolio composition is subject to review in accordance with the fund’s investment strategy and may vary in the future. Current and future portfolio holdings are subject to risk.
Portfolio Manager David M. Calabro holds a B.A. from Williams College. David joined Putnam in 2008 and has been in the investment industry since 1982.
Portfolio Manager Kevin F. Murphy holds a B.S. from Columbia University. He joined Putnam in 1999 and has been in the investment industry since 1988.
IN THE NEWS
Citing a lengthier economic slowdown in emerging-market economies, the deep recession in the eurozone, and the expected tapering of the U.S. Fed’s monetary stimulus, the International Monetary Fund (IMF) has downgraded its growth projections for economies worldwide. Economic growth around the world is projected to remain subdued at 3.1% in 2013, the same as it was in 2012, the IMF stated in a mid-year update. Worldwide growth in 2014 will be 3.8%, the IMF predicted. As for the IMF’s regional economic forecasts, growth in the United States is projected to rise from 1.75% in 2013 to 2.75% in 2014. In Japan, growth will average 2% this year, while slowing but remaining positive in 2014. The eurozone economy, however, had a slightly positive second quarter, at 0.3%, according to the European Union’s statistics office, bringing to an end six straight quarters of negative growth. Still, the IMF believes that the 17-nation currency bloc overall will remain mired in recession this year, with negative growth, and in 2014 growth will rise to just below 1%, which is weaker than previously reported.
| |
| George Putnam Balanced Fund | 9 |
Your fund’s performance
This section shows your fund’s performance, price, and distribution information for periods ended July 31, 2013, the end of its most recent fiscal year. In accordance with regulatory requirements for mutual funds, we also include performance information as of the most recent calendar quarter-end and expense information taken from the fund’s current prospectus. Performance should always be considered in light of a fund’s investment strategy. Data represent past performance. Past performance does not guarantee future results. More recent returns may be less or more than those shown. Investment return and principal value will fluctuate, and you may have a gain or a loss when you sell your shares. Performance information does not reflect any deduction for taxes a shareholder may owe on fund distributions or on the redemption of fund shares. For the most recent month-end performance, please visit the Individual Investors section at putnam.com or call Putnam at 1-800-225-1581. Class R and class Y shares are not available to all investors. See the Terms and Definitions section in this report for definitions of the share classes offered by your fund.
Fund performance Total return for periods ended 7/31/13
| | | | | | | | | | |
| | Class A | Class B | Class C | Class M | Class R | Class Y |
| (inception dates) | (11/5/37) | (4/27/92) | (7/26/99) | (12/1/94) | (1/21/03) | (3/31/94) |
|
| | Before | After | | | | | Before | After | Net | Net |
| | sales | sales | Before | After | Before | After | sales | sales | asset | asset |
| | charge | charge | CDSC | CDSC | CDSC | CDSC | charge | charge | value | value |
|
| Annual average | | | | | | | | | | |
| (life of fund) | 8.69% | 8.60% | 7.68% | 7.68% | 7.87% | 7.87% | 7.95% | 7.90% | 8.42% | 8.76% |
|
| 10 years | 50.28 | 41.64 | 39.26 | 39.26 | 39.46 | 39.46 | 43.06 | 38.05 | 46.90 | 54.12 |
| Annual average | 4.16 | 3.54 | 3.37 | 3.37 | 3.38 | 3.38 | 3.65 | 3.28 | 3.92 | 4.42 |
|
| 5 years | 21.46 | 14.48 | 16.90 | 14.90 | 16.97 | 16.97 | 18.51 | 14.36 | 20.07 | 22.96 |
| Annual average | 3.97 | 2.74 | 3.17 | 2.82 | 3.18 | 3.18 | 3.45 | 2.72 | 3.73 | 4.22 |
|
| 3 years | 40.28 | 32.22 | 37.08 | 34.08 | 37.08 | 37.08 | 38.23 | 33.39 | 39.22 | 41.29 |
| Annual average | 11.94 | 9.76 | 11.08 | 10.27 | 11.09 | 11.09 | 11.39 | 10.08 | 11.66 | 12.21 |
|
| 1 year | 16.68 | 9.97 | 15.83 | 10.83 | 15.85 | 14.85 | 16.17 | 12.10 | 16.44 | 16.99 |
|
Current performance may be lower or higher than the quoted past performance, which cannot guarantee future results. After-sales-charge returns for class A and M shares reflect the deduction of the maximum 5.75% and 3.50% sales charge, respectively, levied at the time of purchase. Class B share returns after contingent deferred sales charge (CDSC) reflect the applicable CDSC, which is 5% in the first year, declining over time to 1% in the sixth year, and is eliminated thereafter. Class C share returns after CDSC reflect a 1% CDSC for the first year that is eliminated thereafter. Class R and Y shares have no initial sales charge or CDSC. Performance for class B, C, M, R, and Y shares before their inception is derived from the historical performance of class A shares, adjusted for the applicable sales charge (or CDSC) and the higher operating expenses for such shares, except for class Y shares, for which 12b-1 fees are not applicable.
For a portion of the periods, the fund had expense limitations, without which returns would have been lower.
Class B share performance does not reflect conversion to class A shares.
| |
| 10 | George Putnam Balanced Fund |
Comparative index returns For periods ended 7/31/13
| | | | |
| | | Barclays | | Lipper |
| | Russell 1000 | U.S. Aggregate | George Putnam | Balanced Funds |
| | Value Index | Bond Index | Blended Index† | category average‡ |
|
| Annual average (life of fund) | —* | —* | —* | —* |
|
| 10 years | 119.89% | 61.22% | 107.46% | 84.17% |
| Annual average | 8.20 | 4.89 | 7.57 | 6.23 |
|
| 5 years | 46.10 | 29.06 | 46.49 | 32.76 |
| Annual average | 7.88 | 5.23 | 7.93 | 5.78 |
|
| 3 years | 64.31 | 9.88 | 41.83 | 32.91 |
| Annual average | 18.00 | 3.19 | 12.35 | 9.90 |
|
| 1 year | 30.73 | –1.90 | 16.78 | 13.48 |
|
Index and Lipper results should be compared with fund performance before sales charge, before CDSC, or at net asset value.
* The fund’s benchmarks (Russell 1000 Value Index and George Putnam Blended Index) were introduced on 12/31/78. The Barclays U.S. Aggregate Bond Index was introduced on 12/31/75, and the fund’s Lipper group (Balanced Funds) was introduced on 12/31/59. They all post-date the inception of the fund’s class A shares.
† George Putnam Blended Index is an unmanaged index administered by Putnam Management, 60% of which is the Russell 1000 Value Index and 40% of which is the Barclays U.S. Aggregate Bond Index.
‡ Over the 1-year, 3-year, 5-year, and 10-year periods ended 7/31/13, there were 678, 631, 593, and 296 funds, respectively, in this Lipper category.
Past performance does not indicate future results. At the end of the same time period, a $10,000 investment in the fund’s class B and class C shares would have been valued at $13,926 and $13,946, respectively, and no contingent deferred sales charges would apply. A $10,000 investment in the fund’s class M shares ($9,650 after sales charge) would have been valued at $13,805 after sales charge. A $10,000 investment in the fund’s class R and class Y shares would have been valued at $14,690 and $15,412, respectively.
| |
| George Putnam Balanced Fund | 11 |
Fund price and distribution information For the 12-month period ended 7/31/13
| | | | | | | | |
| Distributions | Class A | Class B | Class C | Class M | Class R | Class Y |
|
| Number | 4 | 4 | 4 | 4 | 4 | 4 |
|
| Income | $0.200 | $0.098 | $0.100 | $0.133 | $0.165 | $0.233 |
|
| Capital gains | — | — | — | — | — | — |
|
| Total | $0.200 | $0.098 | $0.100 | $0.133 | $0.165 | $0.233 |
|
| | Before | After | Net | Net | Before | After | Net | Net |
| | sales | sales | asset | asset | sales | sales | asset | asset |
| Share value | charge | charge | value | value | charge | charge | value | value |
|
| 7/31/12 | $12.88 | $13.67 | $12.74 | $12.80 | $12.71 | $13.17 | $12.84 | $12.92 |
|
| 7/31/13 | 14.81 | 15.71 | 14.65 | 14.72 | 14.62 | 15.15 | 14.77 | 14.86 |
|
| | Before | After | Net | Net | Before | After | Net | Net |
| | sales | sales | asset | asset | sales | sales | asset | asset |
| Current rate (end of period) | charge | charge | value | value | charge | charge | value | value |
|
| Current dividend rate 1 | 1.35% | 1.27% | 0.63% | 0.68% | 0.90% | 0.87% | 1.14% | 1.59% |
|
| Current 30-day SEC yield 2 | N/A | 1.21 | 0.55 | 0.55 | N/A | 0.77 | 1.04 | 1.53 |
|
The classification of distributions, if any, is an estimate. Before-sales-charge share value and current dividend rate for class A and M shares, if applicable, do not take into account any sales charge levied at the time of purchase. After-sales-charge share value, current dividend rate, and current 30-day SEC yield, if applicable, are calculated assuming that the maximum sales charge (5.75% for class A shares and 3.50% for class M shares) was levied at the time of purchase. Final distribution information will appear on your year-end tax forms.
1 Most recent distribution, including any return of capital and excluding capital gains, annualized and divided by share price before or after sales charge at period-end.
2 Based only on investment income and calculated using the maximum offering price for each share class, in accordance with SEC guidelines.
Fund performance as of most recent calendar quarter
Total return for periods ended 6/30/13
| | | | | | | | | | |
| | Class A | Class B | Class C | Class M | Class R | Class Y |
| (inception dates) | (11/5/37) | (4/27/92) | (7/26/99) | (12/1/94) | (1/21/03) | (3/31/94) |
|
| | Before | After | | | | | Before | After | Net | Net |
| | sales | sales | Before | After | Before | After | sales | sales | asset | asset |
| | charge | charge | CDSC | CDSC | CDSC | CDSC | charge | charge | value | value |
|
| Annual average | | | | | | | | | | |
| (life of fund) | 8.65% | 8.57% | 7.64% | 7.64% | 7.83% | 7.83% | 7.92% | 7.87% | 8.38% | 8.72% |
|
| 10 years | 44.30 | 36.01 | 33.67 | 33.67 | 33.89 | 33.89 | 37.31 | 32.51 | 40.96 | 48.02 |
| Annual average | 3.74 | 3.12 | 2.94 | 2.94 | 2.96 | 2.96 | 3.22 | 2.85 | 3.49 | 4.00 |
|
| 5 years | 17.02 | 10.30 | 12.58 | 10.58 | 12.75 | 12.75 | 14.20 | 10.21 | 15.67 | 18.57 |
| Annual average | 3.19 | 1.98 | 2.40 | 2.03 | 2.43 | 2.43 | 2.69 | 1.96 | 2.95 | 3.46 |
|
| 3 years | 42.02 | 33.85 | 38.75 | 35.75 | 38.75 | 38.75 | 39.79 | 34.90 | 40.82 | 43.02 |
| Annual average | 12.40 | 10.21 | 11.54 | 10.73 | 11.54 | 11.54 | 11.81 | 10.49 | 12.09 | 12.67 |
|
| 1 year | 14.59 | 8.00 | 13.72 | 8.72 | 13.75 | 12.75 | 14.05 | 10.06 | 14.25 | 14.90 |
|
See the discussion following the Fund performance table on page 10 for information about the calculation of fund performance.
| |
| 12 | George Putnam Balanced Fund |
Your fund’s expenses
As a mutual fund investor, you pay ongoing expenses, such as management fees, distribution fees (12b-1 fees), and other expenses. Using the following information, you can estimate how these expenses affect your investment and compare them with the expenses of other funds. You may also pay one-time transaction expenses, including sales charges (loads) and redemption fees, which are not shown in this section and would have resulted in higher total expenses. For more information, see your fund’s prospectus or talk to your financial representative.
Expense ratios
| | | | | | |
| | Class A | Class B | Class C | Class M | Class R | Class Y |
|
| Total annual operating expenses | | | | | | |
| for the fiscal year ended 7/31/12 | 1.04% | 1.79% | 1.79% | 1.54% | 1.29% | 0.79% |
|
| Annualized expense ratio for | | | | | | |
| the six-month period ended | | | | | | |
| 7/31/13* | 1.00% | 1.75% | 1.75% | 1.50% | 1.25% | 0.75% |
|
Fiscal-year expense information in this table is taken from the most recent prospectus, is subject to change, and may differ from that shown for the annualized expense ratio and in the financial highlights of this report. Expenses are shown as a percentage of average net assets.
* For the fund’s most recent fiscal half year; may differ from expense ratios based on one-year data in the financial highlights.
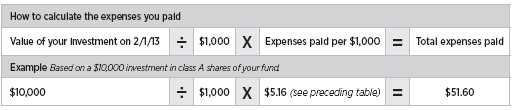
Expenses per $1,000
The following table shows the expenses you would have paid on a $1,000 investment in the fund from February 1, 2013, to July 31, 2013. It also shows how much a $1,000 investment would be worth at the close of the period, assuming actual returns and expenses.
| | | | | | |
| | Class A | Class B | Class C | Class M | Class R | Class Y |
|
| Expenses paid per $1,000*† | $5.16 | $9.02 | $9.01 | $7.73 | $6.45 | $3.87 |
|
| Ending value (after expenses) | $1,081.60 | $1,077.70 | $1,077.50 | $1,079.30 | $1,080.30 | $1,083.30 |
|
* Expenses for each share class are calculated using the fund’s annualized expense ratio for each class, which represents the ongoing expenses as a percentage of average net assets for the six months ended 7/31/13. The expense ratio may differ for each share class.
† Expenses are calculated by multiplying the expense ratio by the average account value for the period; then multiplying the result by the number of days in the period; and then dividing that result by the number of days in the year.
| |
| George Putnam Balanced Fund | 13 |
Estimate the expenses you paid
To estimate the ongoing expenses you paid for the six months ended July 31, 2013, use the following calculation method. To find the value of your investment on February 1, 2013, call Putnam at 1-800-225-1581.
Compare expenses using the SEC’s method
The Securities and Exchange Commission (SEC) has established guidelines to help investors assess fund expenses. Per these guidelines, the following table shows your fund’s expenses based on a $1,000 investment, assuming a hypothetical 5% annualized return. You can use this information to compare the ongoing expenses (but not transaction expenses or total costs) of investing in the fund with those of other funds. All mutual fund shareholder reports will provide this information to help you make this comparison. Please note that you cannot use this information to estimate your actual ending account balance and expenses paid during the period.
| | | | | | |
| | Class A | Class B | Class C | Class M | Class R | Class Y |
|
| Expenses paid per $1,000*† | $5.01 | $8.75 | $8.75 | $7.50 | $6.26 | $3.76 |
|
| Ending value (after expenses) | $1,019.84 | $1,016.12 | $1,016.12 | $1,017.36 | $1,018.60 | $1,021.08 |
|
* Expenses for each share class are calculated using the fund’s annualized expense ratio for each class, which represents the ongoing expenses as a percentage of average net assets for the six months ended 7/31/13. The expense ratio may differ for each share class.
† Expenses are calculated by multiplying the expense ratio by the average account value for the period; then multiplying the result by the number of days in the period; and then dividing that result by the number of days in the year.
| |
| 14 | George Putnam Balanced Fund |
Terms and definitions
Important terms
Total return shows how the value of the fund’s shares changed over time, assuming you held the shares through the entire period and reinvested all distributions in the fund.
Before sales charge, or net asset value, is the price, or value, of one share of a mutual fund, without a sales charge. Before-sales-charge figures fluctuate with market conditions, and are calculated by dividing the net assets of each class of shares by the number of outstanding shares in the class.
After sales charge is the price of a mutual fund share plus the maximum sales charge levied at the time of purchase. After-sales-charge performance figures shown here assume the 5.75% maximum sales charge for class A shares and 3.50% for class M shares.
Contingent deferred sales charge (CDSC) is generally a charge applied at the time of the redemption of class B or C shares and assumes redemption at the end of the period. Your fund’s class B CDSC declines over time from a 5% maximum during the first year to 1% during the sixth year. After the sixth year, the CDSC no longer applies. The CDSC for class C shares is 1% for one year after purchase.
Current rate is the annual rate of return earned from dividends or interest of an investment. Current rate is expressed as a percentage of the price of a security, fund share, or principal investment.
Share classes
Class A shares are generally subject to an initial sales charge and no CDSC (except on certain redemptions of shares bought without an initial sales charge).
Class B shares are not subject to an initial sales charge. They may be subject to a CDSC.
Class C shares are not subject to an initial sales charge and are subject to a CDSC only if the shares are redeemed during the first year.
Class M shares have a lower initial sales charge and a higher 12b-1 fee than class A shares and no CDSC (except on certain redemptions of shares bought without an initial sales charge).
Class R shares are not subject to an initial sales charge or CDSC and are available only to certain defined contribution plans.
Class Y shares are not subject to an initial sales charge or CDSC, and carry no 12b-1 fee. They are generally only available to corporate and institutional clients and clients in other approved programs.
Comparative indexes
Barclays U.S. Aggregate Bond Index is an unmanaged index of U.S. investment-grade fixed-income securities.
BofA Merrill Lynch U.S. 3-Month Treasury Bill Index is an unmanaged index that seeks to measure the performance of U.S. Treasury bills available in the marketplace.
George Putnam Blended Index is an unmanaged index administered by Putnam Management, LLC, 60% of which is the Russell 1000 Value Index and 40% of which is the Barclays U.S. Aggregate Bond Index.
Russell 1000 Value Index is an unmanaged index of those companies in the large-cap Russell 1000 Index chosen for their value orientation.
S&P 500 Index is an unmanaged index of common stock performance.
Indexes assume reinvestment of all distributions and do not account for fees. Securities and performance of a fund and an index will differ. You cannot invest directly in an index.
Lipper is a third-party industry-ranking entity that ranks mutual funds. Its rankings do not reflect sales charges. Lipper rankings are based on total return at net asset value relative to other funds that have similar current investment styles or objectives as determined by Lipper. Lipper may change a fund’s category assignment at its discretion. Lipper category averages reflect performance trends for funds within a category.
| |
| George Putnam Balanced Fund | 15 |
Other information for shareholders
Proxy voting
Putnam is committed to managing our mutual funds in the best interests of our shareholders. The Putnam funds’ proxy voting guidelines and procedures, as well as information regarding how your fund voted proxies relating to portfolio securities during the 12-month period ended June 30, 2013, are available in the Individual Investors section of putnam.com, and on the Securities and Exchange Commission (SEC) website, www.sec.gov. If you have questions about finding forms on the SEC’s website, you may call the SEC at 1-800-SEC-0330. You may also obtain the Putnam funds’ proxy voting guidelines and procedures at no charge by calling Putnam’s Shareholder Services at 1-800-225-1581.
Fund portfolio holdings
The fund will file a complete schedule of its portfolio holdings with the SEC for the first and third quarters of each fiscal year on Form N-Q. Shareholders may obtain the fund’s Forms N-Q on the SEC’s website at www.sec.gov. In addition, the fund’s Forms N-Q may be reviewed and copied at the SEC’s Public Reference Room in Washington, D.C. You may call the SEC at 1-800-SEC-0330 for information about the SEC’s website or the operation of the Public Reference Room.
Trustee and employee fund ownership
Putnam employees and members of the Board of Trustees place their faith, confidence, and, most importantly, investment dollars in Putnam mutual funds. As of July 31, 2013, Putnam employees had approximately $394,000,000 and the Trustees had approximately $94,000,000 invested in Putnam mutual funds. These amounts include investments by the Trustees’ and employees’ immediate family members as well as investments through retirement and deferred compensation plans.
Important notice regarding Putnam’s privacy policy
In order to conduct business with our shareholders, we must obtain certain personal information such as account holders’ names, addresses, Social Security numbers, and dates of birth. Using this information, we are able to maintain accurate records of accounts and transactions.
It is our policy to protect the confidentiality of our shareholder information, whether or not a shareholder currently owns shares of our funds. In particular, it is our policy not to sell information about you or your accounts to outside marketing firms. We have safeguards in place designed to prevent unauthorized access to our computer systems and procedures to protect personal information from unauthorized use.
Under certain circumstances, we must share account information with outside vendors who provide services to us, such as mailings and proxy solicitations. In these cases, the service providers enter into confidentiality agreements with us, and we provide only the information necessary to process transactions and perform other services related to your account. Finally, it is our policy to share account information with your financial representative, if you’ve listed one on your Putnam account.
| |
| 16 | George Putnam Balanced Fund |
Trustee approval of management contract
General conclusions
The Board of Trustees of the Putnam funds oversees the management of each fund and, as required by law, determines annually whether to approve the continuance of your fund’s management contract with Putnam Investment Management (“Putnam Management”) and the sub-management contract with respect to your fund between Putnam Management and its affiliate, Putnam Investments Limited (“PIL”). The Board of Trustees, with the assistance of its Contract Committee, requests and evaluates all information it deems reasonably necessary under the circumstances in connection with its annual contract review. The Contract Committee consists solely of Trustees who are not “interested persons” (as this term is defined in the Investment Company Act of 1940, as amended (the “1940 Act”)) of the Putnam funds (“Independent Trustees”).
At the outset of the review process, members of the Board’s independent staff and independent legal counsel met with representatives of Putnam Management to review the annual contract review materials furnished to the Contract Committee during the course of the previous year’s review and to discuss possible changes in these materials that might be necessary or desirable for the coming year. Following these discussions and in consultation with the Contract Committee, the Independent Trustees’ independent legal counsel requested that Putnam Management furnish specified information, together with any additional information that Putnam Management considered relevant, to the Contract Committee. Over the course of several months ending in June 2013, the Contract Committee met on a number of occasions with representatives of Putnam Management, and separately in executive session, to consider the information that Putnam Management provided. Throughout this process, the Contract Committee was assisted by the members of the Board’s independent staff and by independent legal counsel for the Putnam funds and the Independent Trustees.
In May 2013, the Contract Committee met in executive session to discuss and consider its preliminary recommendations with respect to the continuance of the contracts. At the Trustees’ June 20, 2013 meeting, the Contract Committee met in executive session with the other Independent Trustees to review a summary of the key financial data that the Contract Committee considered in the course of its review. The Contract Committee then presented its written report, which summarized the key factors that the Committee had considered and set forth its final recommendations. The Contract Committee then recommended, and the Independent Trustees approved, the continuance of your fund’s management and sub-management contracts, effective July 1, 2013, subject to certain changes in the sub-management contract noted below. (Because PIL is an affiliate of Putnam Management and Putnam Management remains fully responsible for all services provided by PIL, the Trustees have not evaluated PIL as a separate entity, and all subsequent references to Putnam Management below should be deemed to include reference to PIL as necessary or appropriate in the context.)
The Independent Trustees’ approval was based on the following conclusions:
• That the fee schedule in effect for your fund represented reasonable compensation in light of the nature and quality of the services being provided to the fund, the fees paid by competitive funds, and the costs incurred by Putnam Management in providing services to the fund, and
• That the fee schedule represented an appropriate sharing between fund
| |
| George Putnam Balanced Fund | 17 |
shareholders and Putnam Management of such economies of scale as may exist in the management of the fund at current asset levels.
These conclusions were based on a comprehensive consideration of all information provided to the Trustees and were not the result of any single factor. Some of the factors that figured particularly in the Trustees’ deliberations and how the Trustees considered these factors are described below, although individual Trustees may have evaluated the information presented differently, giving different weights to various factors. It is also important to recognize that the management arrangements for your fund and the other Putnam funds are the result of many years of review and discussion between the Independent Trustees and Putnam Management, that some aspects of the arrangements may receive greater scrutiny in some years than others, and that the Trustees’ conclusions may be based, in part, on their consideration of fee arrangements in previous years. For example, with some minor exceptions, the current fee arrangements in the management contracts for the Putnam funds were implemented at the beginning of 2010 following extensive review and discussion by the Trustees, as well as approval by shareholders.
As noted above, the Trustees considered certain administrative revisions to your fund’s sub-management contract. Putnam Management recommended that the sub-management contract be revised to reduce the sub-management fee that Putnam Management pays to PIL with respect to the portion of the portfolios of certain funds, but not your fund, that may be allocated to PIL from time to time. The Independent Trustees’ approval of this recommendation was based on their conclusion that these changes would have no practical effect on Putnam Management’s continued responsibility for the management of these funds or the costs borne by fund shareholders and would not result in any reduction in the nature and quality of services provided to the funds.
Management fee schedules and total expenses
The Trustees reviewed the management fee schedules in effect for all Putnam funds, including fee levels and breakpoints. The Trustees also reviewed the total expenses of each Putnam fund, recognizing that in most cases management fees represented the major, but not the sole, determinant of total costs to shareholders.
In reviewing fees and expenses, the Trustees generally focus their attention on material changes in circumstances — for example, changes in assets under management, changes in a fund’s investment style, changes in Putnam Management’s operating costs or profitability, or changes in competitive practices in the mutual fund industry — that suggest that consideration of fee changes might be warranted. The Trustees concluded that the circumstances did not warrant changes to the management fee structure of your fund.
Under its management contract, your fund has the benefit of breakpoints in its management fee schedule that provide shareholders with economies of scale in the form of reduced fee levels as assets under management in the Putnam family of funds increase. The Trustees concluded that the fee schedule in effect for your fund represented an appropriate sharing of economies of scale between fund shareholders and Putnam Management.
As in the past, the Trustees also focused on the competitiveness of each fund’s total expense ratio. In order to ensure that expenses of the Putnam funds continue to meet competitive standards, the Trustees and Putnam Management have implemented certain expense limitations. These expense limitations were: (i) a contractual expense limitation applicable to all retail open-end funds of 32 basis points on investor servicing fees and expenses and
| |
| 18 | George Putnam Balanced Fund |
(ii) a contractual expense limitation applicable to all open-end funds of 20 basis points on so-called “other expenses” (i.e., all expenses exclusive of management fees, investor servicing fees, distribution fees, investment-related expenses, interest, taxes, brokerage commissions, extraordinary expenses and acquired fund fees and expenses). These expense limitations serve in particular to maintain competitive expense levels for funds with large numbers of small shareholder accounts and funds with relatively small net assets. Most funds, including your fund, had sufficiently low expenses that these expense limitations did not apply. Putnam Management’s support for these expense limitations was an important factor in the Trustees’ decision to approve the continuance of your fund’s management and sub-management contracts.
The Trustees reviewed comparative fee and expense information for a custom group of competitive funds selected by Lipper Inc. This comparative information included your fund’s percentile ranking for effective management fees and total expenses (excluding any applicable 12b-1 fee), which provides a general indication of your fund’s relative standing. In the custom peer group, your fund ranked in the 2nd quintile in effective management fees (determined for your fund and the other funds in the custom peer group based on fund asset size and the applicable contractual management fee schedule) and in the 2nd quintile in total expenses (excluding any applicable 12b-1 fees) as of December 31, 2012 (the first quintile representing the least expensive funds and the fifth quintile the most expensive funds). The fee and expense data reported by Lipper as of December 31, 2012 reflected the most recent fiscal year-end data available in Lipper’s database at that time.
In connection with their review of the management fees and total expenses of the Putnam funds, the Trustees also reviewed the costs of the services provided and the profits realized by Putnam Management and its affiliates from their contractual relationships with the funds. This information included trends in revenues, expenses and profitability of Putnam Management and its affiliates relating to the investment management, investor servicing and distribution services provided to the funds. In this regard, the Trustees also reviewed an analysis of Putnam Management’s revenues, expenses and profitability, allocated on a fund-by-fund basis, with respect to the funds’ management, distribution, and investor servicing contracts. For each fund, the analysis presented information about revenues, expenses and profitability for each of the agreements separately and for the agreements taken together on a combined basis. The Trustees concluded that, at current asset levels, the fee schedules in place represented reasonable compensation for the services being provided and represented an appropriate sharing of such economies of scale as may exist in the management of the Putnam funds at that time.
The information examined by the Trustees as part of their annual contract review for the Putnam funds has included for many years information regarding fees charged by Putnam Management and its affiliates to institutional clients such as defined benefit pension plans, college endowments, and the like. This information included comparisons of those fees with fees charged to the funds, as well as an assessment of the differences in the services provided to these different types of clients. The Trustees observed that the differences in fee rates between institutional clients and mutual funds are by no means uniform when examined by individual asset sectors, suggesting that differences in the pricing of investment management services to these types of clients may reflect historical competitive forces operating in separate markets. The Trustees considered the fact that in many cases fee rates across different asset classes are higher on average
| |
| George Putnam Balanced Fund | 19 |
for mutual funds than for institutional clients, as well as the differences between the services that Putnam Management provides to the Putnam funds and those that it provides to its institutional clients. The Trustees did not rely on these comparisons to any significant extent in concluding that the management fees paid by your fund are reasonable.
Investment performance
The quality of the investment process provided by Putnam Management represented a major factor in the Trustees’ evaluation of the quality of services provided by Putnam Management under your fund’s management contract. The Trustees were assisted in their review of the Putnam funds’ investment process and performance by the work of the investment oversight committees of the Trustees, which meet on a regular basis with the funds’ portfolio teams and with the Chief Investment Officer and other senior members of Putnam Management’s Investment Division throughout the year. The Trustees concluded that Putnam Management generally provides a high-quality investment process — based on the experience and skills of the individuals assigned to the management of fund portfolios, the resources made available to them, and in general Putnam Management’s ability to attract and retain high-quality personnel — but also recognized that this does not guarantee favorable investment results for every fund in every time period.
The Trustees considered that 2012 was a year of strong competitive performance for many of the Putnam funds, with only a relatively small number of exceptions. They noted that this strong performance was exemplified by the fact that the Putnam funds were recognized by Barron’s as the best performing mutual fund complex for 2012 — the second time in four years that Putnam Management has achieved this distinction for the Putnam funds. They also noted, however, the disappointing investment performance of some funds for periods ended December 31, 2012 and considered information provided by Putnam Management regarding the factors contributing to the underperformance and actions being taken to improve the performance of these particular funds. The Trustees indicated their intention to continue to monitor performance trends to assess the effectiveness of these efforts and to evaluate whether additional actions to address areas of underperformance are warranted.
For purposes of evaluating investment performance, the Trustees generally focus on competitive industry rankings for the one-year, three-year, and five-year periods. For a number of Putnam funds with relatively unique investment mandates, the Trustees evaluated performance based on comparisons of their absolute gross returns with the returns of selected investment benchmarks or targeted annualized returns. In the case of your fund, the Trustees considered that its class A share cumulative total return performance at net asset value was in the following quartiles of its Lipper Inc. peer group (Lipper Balanced Funds) for the one-year, three-year and five-year periods ended December 31, 2012 (the first quartile representing the best-performing funds and the fourth quartile the worst-performing funds):
| | | |
| One-year period | 2nd | | |
| | |
| Three-year period | 1st | | |
| | |
| Five-year period | 4th | | |
| | |
Over the one-year, three-year and five-year periods ended December 31, 2012, there were 674, 645 and 607 funds, respectively, in your fund’s Lipper peer group. (When considering performance information, shareholders should be mindful that past performance is not a guarantee of future results.)
The Trustees, while noting that your fund’s investment performance over the one- and three-year periods ended December 31, 2012 had been favorable, expressed concern about your fund’s fourth quartile performance over
| |
| 20 | George Putnam Balanced Fund |
the five-year period then ended and considered the circumstances that may have contributed to this disappointing performance. The Trustees considered Putnam Management’s observation that the fund’s underperformance over this period was due in significant part to the fund’s particularly weak performance 2008, which was largely due to the fund’s exposure to mortgage-backed securities and collateralized mortgage obligations.
The Trustees considered steps that Putnam Management had taken to support improved performance, noting in particular that, in November 2008, a new portfolio manager replaced the three individuals on the portfolio management team with responsibility for the fund’s equity investments, and that the fund’s relative performance has improved under this portfolio manager, with the fund ranking in the second quartile for the one-year period ended December 31, 2012 and in the first quartile for the three-year period then ended. The Trustees also considered a number of other changes that Putnam Management had made in recent years in efforts to support and improve fund performance generally. These changes included Putnam Management’s efforts to increase accountability and to reduce complexity in the portfolio management process for the Putnam equity funds by moving generally from a portfolio management team structure to a decision-making process that vests full authority and responsibility with individual portfolio managers and by affirming its commitment to a fundamental-driven approach to investing. The Trustees noted that Putnam Management had also worked to strengthen its fundamental research capabilities by adding new investment personnel to the large-cap equities research team and by bringing U.S. and international research under common leadership. In addition, the Trustees recognized that Putnam Management has adjusted the compensation structure for portfolio managers and research analysts so that only those who achieve top-quartile returns over a rolling three-year basis are eligible for full bonuses.
As a general matter, the Trustees believe that cooperative efforts between the Trustees and Putnam Management represent the most effective way to address investment performance issues that may arise from time to time. The Trustees noted that investors in the Putnam funds have, in effect, placed their trust in the Putnam organization, under the oversight of the funds’ Trustees, to make appropriate decisions regarding the management of the funds. Based on past responsiveness of Putnam Management to Trustee concerns about investment performance, the Trustees concluded that it is preferable to seek change within Putnam Management to address performance shortcomings. In the Trustees’ view, the alternative of engaging a new investment adviser for an underperforming fund would entail significant disruptions and would not provide any greater assurance of improved investment performance.
Brokerage and soft-dollar allocations; investor servicing
The Trustees considered various potential benefits that Putnam Management may receive in connection with the services it provides under the management contract with your fund. These include benefits related to brokerage allocation and the use of soft dollars, whereby a portion of the commissions paid by a fund for brokerage may be used to acquire research services that are expected to be useful to Putnam Management in managing the assets of the fund and of other clients. Subject to policies established by the Trustees, soft dollars generated by these means are used primarily to acquire brokerage and research services that enhance Putnam Management’s investment capabilities and supplement Putnam Management’s internal research efforts. However, the Trustees noted that a portion of available soft dollars continues to be used to pay fund
| |
| George Putnam Balanced Fund | 21 |
expenses. The Trustees indicated their continued intent to monitor regulatory and industry developments in this area with the assistance of their Brokerage Committee and also indicated their continued intent to monitor the allocation of the Putnam funds’ brokerage in order to ensure that the principle of seeking best price and execution remains paramount in the portfolio trading process.
Putnam Management may also receive benefits from payments that the funds make to Putnam Management’s affiliates for investor or distribution services. In conjunction with the annual review of your fund’s management and sub-management contracts, the Trustees reviewed your fund’s investor servicing agreement with Putnam Investor Services, Inc. (“PSERV”) and its distributor’s contracts and distribution plans with Putnam Retail Management Limited Partnership (“PRM”), both of which are affiliates of Putnam Management. The Trustees concluded that the fees payable by the funds to PSERV and PRM, as applicable, for such services are reasonable in relation to the nature and quality of such services, the fees paid by competitive funds, and the costs incurred by PSERV and PRM, as applicable, in providing such services.
| |
| 22 | George Putnam Balanced Fund |
Financial statements
A note about your fund’s auditors
A non-U.S. member firm in PricewaterhouseCoopers LLP’s (“PwC”) global network of firms has an investment in certain non-U.S. funds now affiliated with Putnam Investments as a result of the July 2013 acquisition of the funds’ advisor by Putnam’s parent company, Great-West Lifeco Inc. The investment consists of pension plan assets for the benefit of the member firm’s personnel. The investment is inconsistent with the requirements of the Securities and Exchange Commission’s auditor independence rules. Your fund has been informed by PwC that to address this issue, the member firm is in the process of selecting different advisors not affiliated with Putnam to manage the relevant pension plans and transferring the plans’ assets to such advisors. None of the member firm’s personnel is on the PwC audit team for your fund, and none of the members of the audit team participates in the member firm’s pension plans. Based on its knowledge of the facts and its experience with PwC, the Audit and Compliance Committee of your fund’s Board of Trustees concluded that the investment by the PwC member firm would not affect PwC’s ability to render an objective audit opinion to your fund. Based on this conclusion and consideration of the potential risks that the disruption of a change of auditors could present, the Audit and Compliance Committee determined that PwC should continue to act as auditors for your fund.
These sections of the report, as well as the accompanying Notes, preceded by the Report of Independent Registered Public Accounting Firm, constitute the fund’s financial statements.
The fund’s portfolio lists all the fund’s investments and their values as of the last day of the reporting period. Holdings are organized by asset type and industry sector, country, or state to show areas of concentration and diversification.
Statement of assets and liabilities shows how the fund’s net assets and share price are determined. All investment and non-investment assets are added together. Any unpaid expenses and other liabilities are subtracted from this total. The result is divided by the number of shares to determine the net asset value per share, which is calculated separately for each class of shares. (For funds with preferred shares, the amount subtracted from total assets includes the liquidation preference of preferred shares.)
Statement of operations shows the fund’s net investment gain or loss. This is done by first adding up all the fund’s earnings — from dividends and interest income — and subtracting its operating expenses to determine net investment income (or loss). Then, any net gain or loss the fund realized on the sales of its holdings — as well as any unrealized gains or losses over the period — is added to or subtracted from the net investment result to determine the fund’s net gain or loss for the fiscal year.
Statement of changes in net assets shows how the fund’s net assets were affected by the fund’s net investment gain or loss, by distributions to shareholders, and by changes in the number of the fund’s shares. It lists distributions and their sources (net investment income or realized capital gains) over the current reporting period and the most recent fiscal year-end. The distributions listed here may not match the sources listed in the Statement of operations because the distributions are determined on a tax basis and may be paid in a different period from the one in which they were earned.
Financial highlights provide an overview of the fund’s investment results, per-share distributions, expense ratios, net investment income ratios, and portfolio turnover in one summary table, reflecting the five most recent reporting periods. In a semiannual report, the highlights table also includes the current reporting period.
| |
| George Putnam Balanced Fund | 23 |
Report of Independent Registered Public Accounting Firm
To the Trustees and Shareholders of
George Putnam Balanced Fund:
In our opinion, the accompanying statement of assets and liabilities, including the portfolio, and the related statements of operations and of changes in net assets and the financial highlights present fairly, in all material respects, the financial position of George Putnam Balanced Fund (the “fund”) at July 31, 2013, and the results of its operations, the changes in its net assets and the financial highlights for each of the periods indicated, in conformity with accounting principles generally accepted in the United States of America. These financial statements and financial highlights (hereafter referred to as “financial statements”) are the responsibility of the fund’s management. Our responsibility is to express an opinion on these financial statements based on our audits. We conducted our audits of these financial statements in accordance with the standards of the Public Company Accounting Oversight Board (United States). Those standards require that we plan and perform the audit to obtain reasonable assurance about whether the financial statements are free of material misstatement. An audit includes examining, on a test basis, evidence supporting the amounts and disclosures in the financial statements, assessing the accounting principles used and significant estimates made by management, and evaluating the overall financial statement presentation. We believe that our audits, which included confirmation of investments owned at July 31, 2013 by correspondence with the custodian and transfer agent, provide a reasonable basis for our opinion.
PricewaterhouseCoopers LLP
Boston, Massachusetts
September 13, 2013
| |
| 24 | George Putnam Balanced Fund |
The fund’s portfolio 7/31/13
| | |
| COMMON STOCKS (59.5%)* | Shares | Value |
|
| Banking (8.4%) | | |
| Bank of America Corp. | 773,400 | $11,291,640 |
|
| Bank of New York Mellon Corp. (The) | 165,400 | 5,201,830 |
|
| BB&T Corp. | 141,500 | 5,050,135 |
|
| Capital One Financial Corp. | 92,400 | 6,377,448 |
|
| Citigroup, Inc. | 225,550 | 11,760,177 |
|
| Comerica, Inc. | 107,700 | 4,581,558 |
|
| JPMorgan Chase & Co. | 431,700 | 24,058,640 |
|
| PNC Financial Services Group, Inc. | 60,300 | 4,585,815 |
|
| Regions Financial Corp. | 401,700 | 4,021,017 |
|
| State Street Corp. | 125,000 | 8,708,750 |
|
| U.S. Bancorp | 290,400 | 10,837,728 |
|
| Wells Fargo & Co. | 223,900 | 9,739,650 |
|
| | | 106,214,388 |
| Basic materials (1.4%) | | |
| Alcoa, Inc. | 104,500 | 830,775 |
|
| Dow Chemical Co. (The) | 61,048 | 2,139,122 |
|
| E.I. du Pont de Nemours & Co. | 52,300 | 3,017,187 |
|
| Freeport-McMoRan Copper & Gold, Inc. Class B (Indonesia) | 81,400 | 2,301,991 |
|
| HB Fuller Co. | 59,800 | 2,400,970 |
|
| International Paper Co. | 32,000 | 1,545,920 |
|
| Nucor Corp. | 46,400 | 2,170,592 |
|
| PPG Industries, Inc. | 13,900 | 2,230,116 |
|
| Rio Tinto PLC ADR (United Kingdom) | 15,500 | 697,345 |
|
| | | 17,334,018 |
| Capital goods (2.6%) | | |
| Cummins, Inc. | 16,600 | 2,011,754 |
|
| Eaton Corp PLC | 62,700 | 4,323,165 |
|
| Emerson Electric Co. | 22,000 | 1,350,140 |
|
| Illinois Tool Works, Inc. | 60,500 | 4,358,420 |
|
| Ingersoll-Rand PLC | 21,500 | 1,312,574 |
|
| Lockheed Martin Corp. | 15,100 | 1,813,812 |
|
| McDermott International, Inc. † | 125,800 | 1,088,170 |
|
| Northrop Grumman Corp. | 42,300 | 3,894,138 |
|
| Parker Hannifin Corp. | 29,100 | 3,005,448 |
|
| Raytheon Co. | 76,900 | 5,524,495 |
|
| Staples, Inc. | 45,800 | 779,516 |
|
| United Technologies Corp. | 33,100 | 3,494,367 |
|
| | | 32,955,999 |
| Communication services (2.5%) | | |
| AT&T, Inc. | 165,782 | 5,847,131 |
|
| Comcast Corp. Class A | 164,600 | 7,420,168 |
|
| Juniper Networks, Inc. † | 38,400 | 832,128 |
|
| Time Warner Cable, Inc. | 18,600 | 2,121,702 |
|
| Verizon Communications, Inc. | 166,400 | 8,233,471 |
|
| Vodafone Group PLC ADR (United Kingdom) | 249,000 | 7,457,550 |
|
| | | 31,912,150 |
| |
| George Putnam Balanced Fund | 25 |
| | |
| COMMON STOCKS (59.5%)* cont. | Shares | Value |
|
| Conglomerates (1.6%) | | |
| 3M Co. | 19,800 | $2,325,114 |
|
| General Electric Co. | 390,800 | 9,523,795 |
|
| Siemens AG ADR (Germany) | 16,300 | 1,800,498 |
|
| Tyco International, Ltd. | 179,400 | 6,244,914 |
|
| | | 19,894,321 |
| Consumer cyclicals (6.2%) | | |
| ADT Corp. (The) † ## | 42,450 | 1,701,396 |
|
| Bed Bath & Beyond, Inc. † | 82,700 | 6,324,068 |
|
| CBS Corp. Class B | 72,200 | 3,815,048 |
|
| D.R. Horton, Inc. | 104,400 | 2,098,440 |
|
| Ford Motor Co. | 355,700 | 6,004,216 |
|
| General Motors Co. † | 56,300 | 2,019,481 |
|
| Hasbro, Inc. | 26,700 | 1,228,200 |
|
| Home Depot, Inc. (The) | 32,300 | 2,552,669 |
|
| Johnson Controls, Inc. | 152,000 | 6,111,920 |
|
| Kimberly-Clark Corp. | 12,100 | 1,195,480 |
|
| Macy’s, Inc. | 113,800 | 5,501,092 |
|
| Marriott International, Inc. Class A | 70,820 | 2,943,987 |
|
| Owens Corning, Inc. † | 53,000 | 2,092,970 |
|
| PulteGroup, Inc. † | 153,300 | 2,549,379 |
|
| Target Corp. | 87,900 | 6,262,875 |
|
| Time Warner, Inc. | 171,800 | 10,696,267 |
|
| TJX Cos., Inc. (The) | 40,300 | 2,097,212 |
|
| Twenty-First Century Fox, Inc. | 82,800 | 2,474,064 |
|
| Viacom, Inc. Class B | 61,500 | 4,475,355 |
|
| Wal-Mart Stores, Inc. | 10,400 | 810,576 |
|
| Walt Disney Co. (The) | 84,800 | 5,482,320 |
|
| | | 78,437,015 |
| Consumer finance (0.3%) | | |
| American Express Co. | 44,000 | 3,245,880 |
|
| | | 3,245,880 |
| Consumer staples (4.3%) | | |
| Altria Group, Inc. | 100,600 | 3,527,036 |
|
| Avon Products, Inc. | 40,500 | 925,830 |
|
| Coca-Cola Co. (The) | 41,300 | 1,655,304 |
|
| Coca-Cola Enterprises, Inc. | 86,500 | 3,247,210 |
|
| Colgate-Palmolive Co. | 27,400 | 1,640,438 |
|
| CVS Caremark Corp. | 132,800 | 8,165,872 |
|
| General Mills, Inc. | 70,700 | 3,676,400 |
|
| Kellogg Co. | 44,100 | 2,921,184 |
|
| Lorillard, Inc. | 34,500 | 1,467,285 |
|
| McDonald’s Corp. | 33,400 | 3,275,872 |
|
| PepsiCo, Inc. | 23,900 | 1,996,606 |
|
| Philip Morris International, Inc. | 155,300 | 13,849,653 |
|
| Procter & Gamble Co. (The) | 74,300 | 5,966,290 |
|
| Walgreen Co. | 30,300 | 1,522,575 |
|
| | | 53,837,555 |
| |
| 26 | George Putnam Balanced Fund |
| | |
| COMMON STOCKS (59.5%)* cont. | Shares | Value |
|
| Energy (7.3%) | | |
| Anadarko Petroleum Corp. | 44,300 | $3,921,436 |
|
| Chevron Corp. | 65,500 | 8,245,795 |
|
| ConocoPhillips | 55,400 | 3,593,244 |
|
| Exxon Mobil Corp. | 298,000 | 27,937,500 |
|
| Halliburton Co. | 128,100 | 5,788,839 |
|
| Marathon Oil Corp. | 191,500 | 6,962,940 |
|
| Noble Corp. | 48,500 | 1,852,700 |
|
| Occidental Petroleum Corp. | 46,300 | 4,123,015 |
|
| Phillips 66 | 18,300 | 1,125,450 |
|
| Royal Dutch Shell PLC ADR (United Kingdom) | 231,785 | 15,842,504 |
|
| Schlumberger, Ltd. | 30,695 | 2,496,424 |
|
| Southwestern Energy Co. † | 54,900 | 2,129,571 |
|
| Suncor Energy, Inc. (Canada) | 161,600 | 5,111,408 |
|
| Total SA ADR (France) | 50,800 | 2,694,940 |
|
| | | 91,825,766 |
| Financial (0.3%) | | |
| CME Group, Inc. | 53,300 | 3,943,134 |
|
| | | 3,943,134 |
| Health care (9.9%) | | |
| AstraZeneca PLC ADR (United Kingdom) | 51,700 | 2,622,224 |
|
| Baxter International, Inc. | 95,100 | 6,946,104 |
|
| Bristol-Myers Squibb Co. | 51,200 | 2,213,888 |
|
| CareFusion Corp. † | 99,600 | 3,841,572 |
|
| CIGNA Corp. | 70,500 | 5,487,015 |
|
| Covidien PLC | 76,812 | 4,733,924 |
|
| Eli Lilly & Co. | 58,000 | 3,080,380 |
|
| GlaxoSmithKline PLC ADR (United Kingdom) | 96,800 | 4,932,928 |
|
| Johnson & Johnson | 210,700 | 19,700,450 |
|
| Medtronic, Inc. | 76,700 | 4,236,908 |
|
| Merck & Co., Inc. | 210,400 | 10,134,968 |
|
| Novartis AG ADR (Switzerland) | 51,400 | 3,680,754 |
|
| Pfizer, Inc. | 453,694 | 13,261,476 |
|
| Quest Diagnostics, Inc. | 40,300 | 2,349,893 |
|
| Sanofi ADR (France) | 71,100 | 3,660,228 |
|
| St. Jude Medical, Inc. | 80,300 | 4,206,917 |
|
| Stryker Corp. | 56,000 | 3,945,760 |
|
| Teva Pharmaceutical Industries, Ltd. ADR (Israel) | 89,000 | 3,533,300 |
|
| Thermo Fisher Scientific, Inc. | 67,300 | 6,131,703 |
|
| UnitedHealth Group, Inc. | 120,600 | 8,785,710 |
|
| Zimmer Holdings, Inc. | 62,100 | 5,184,108 |
|
| Zoetis, Inc. | 76,205 | 2,271,671 |
|
| | | 124,941,881 |
| Insurance (3.9%) | | |
| Aflac, Inc. | 29,900 | 1,844,232 |
|
| American International Group, Inc. † | 114,500 | 5,210,895 |
|
| Chubb Corp. (The) | 38,600 | 3,338,900 |
|
| Hartford Financial Services Group, Inc. (The) | 122,600 | 3,783,436 |
|
| Marsh & McLennan Cos., Inc. | 144,700 | 6,058,589 |
|
| MetLife, Inc. | 165,800 | 8,028,036 |
|
| |
| George Putnam Balanced Fund | 27 |
| | |
| COMMON STOCKS (59.5%)* cont. | Shares | Value |
|
| Insurance cont. | | |
| Progressive Corp. (The) | 32,000 | $832,320 |
|
| Prudential Financial, Inc. | 118,200 | 9,334,254 |
|
| Sun Life Financial, Inc. (Canada) | 63,900 | 2,073,555 |
|
| Travelers Cos., Inc. (The) | 97,400 | 8,137,770 |
|
| | | 48,641,987 |
| Investment banking/brokerage (1.2%) | | |
| Charles Schwab Corp. (The) | 178,600 | 3,945,274 |
|
| Goldman Sachs Group, Inc. (The) | 50,010 | 8,203,140 |
|
| Invesco, Ltd. | 53,000 | 1,706,070 |
|
| Morgan Stanley | 49,940 | 1,358,867 |
|
| | | 15,213,351 |
| Real estate (0.3%) | | |
| Equity Residential Trust R | 21,448 | 1,201,088 |
|
| Prologis, Inc. R | 32,781 | 1,257,479 |
|
| Public Storage R | 10,900 | 1,735,498 |
|
| | | 4,194,065 |
| Technology (5.8%) | | |
| Apple, Inc. | 9,400 | 4,253,500 |
|
| Cisco Systems, Inc. | 368,400 | 9,412,620 |
|
| EMC Corp. | 296,500 | 7,753,475 |
|
| Hewlett-Packard Co. | 59,600 | 1,530,528 |
|
| Honeywell International, Inc. | 146,300 | 12,139,974 |
|
| IBM Corp. | 20,900 | 4,076,336 |
|
| Intel Corp. | 95,400 | 2,222,820 |
|
| L-3 Communications Holdings, Inc. | 75,400 | 7,023,510 |
|
| Lam Research Corp. † | 34,000 | 1,673,480 |
|
| Micron Technology, Inc. † | 142,600 | 1,889,450 |
|
| Microsoft Corp. | 113,900 | 3,625,437 |
|
| NetApp, Inc. | 44,100 | 1,813,392 |
|
| Oracle Corp. | 63,400 | 2,050,990 |
|
| Qualcomm, Inc. | 51,000 | 3,292,050 |
|
| SanDisk Corp. † | 28,400 | 1,565,408 |
|
| Texas Instruments, Inc. | 73,500 | 2,881,200 |
|
| Xilinx, Inc. | 74,700 | 3,487,743 |
|
| Yahoo!, Inc. † | 87,500 | 2,457,875 |
|
| | | 73,149,788 |
| Transportation (0.7%) | | |
| Delta Air Lines, Inc. † | 130,800 | 2,776,884 |
|
| FedEx Corp. | 10,800 | 1,144,800 |
|
| United Continental Holdings, Inc. † | 85,800 | 2,990,130 |
|
| United Parcel Service, Inc. Class B | 29,300 | 2,543,240 |
|
| | | 9,455,054 |
| Utilities and power (2.8%) | | |
| Ameren Corp. | 82,700 | 2,961,487 |
|
| American Electric Power Co., Inc. | 72,600 | 3,365,010 |
|
| Calpine Corp. † | 107,500 | 2,151,075 |
|
| Dominion Resources, Inc. | 32,400 | 1,921,644 |
|
| Duke Energy Corp. | 38,133 | 2,707,443 |
|
| Edison International | 91,500 | 4,561,275 |
|
| Entergy Corp. | 43,300 | 2,922,750 |
|
| |
| 28 | George Putnam Balanced Fund |
| | |
| COMMON STOCKS (59.5%)* cont. | Shares | Value |
|
| Utilities and power cont. | | |
| FirstEnergy Corp. | 124,900 | $4,754,943 |
|
| NextEra Energy, Inc. | 32,700 | 2,832,147 |
|
| PG&E Corp. | 111,350 | 5,109,852 |
|
| PPL Corp. | 82,339 | 2,615,910 |
|
| | | 35,903,536 |
| | | |
| Total common stocks (cost $583,716,286) | | $751,099,888 |
| |
| |
| U.S. GOVERNMENT AND AGENCY | | |
| MORTGAGE OBLIGATIONS (6.8%)* | Principal amount | Value |
|
| U.S. Government Guaranteed Mortgage Obligations (0.1%) | | |
| Government National Mortgage Association Pass-Through Certificates | | |
| 3s, TBA, August 1, 2043 | $1,000,000 | $979,297 |
|
| | | 979,297 |
| U.S. Government Agency Mortgage Obligations (6.7%) | | |
| Federal Home Loan Mortgage Corporation Pass-Through Certificates | | |
| 6s, March 1, 2035 | 5,211 | 5,831 |
| 4s, with due dates from July 1, 2042 to June 1, 2043 | 14,125,587 | 14,610,101 |
| 3 1/2s, with due dates from December 1, 2042 to April 1, 2043 | 991,254 | 999,114 |
|
| Federal National Mortgage Association Pass-Through Certificates | | |
| 5 1/2s, with due dates from July 1, 2033 to November 1, 2038 | 3,731,011 | 4,066,499 |
| 5 1/2s, TBA, August 1, 2043 | 2,000,000 | 2,178,281 |
| 5s, with due dates from August 1, 2033 to January 1, 2039 | 1,723,093 | 1,860,013 |
| 4 1/2s, with due dates from May 1, 2041 to July 1, 2042 ## | 17,442,607 | 18,493,319 |
| 4 1/2s, TBA, August 1, 2043 | 10,000,000 | 10,593,750 |
| 4s, TBA, September 1, 2043 | 8,000,000 | 8,283,438 |
| 4s, TBA, August 1, 2043 | 5,000,000 | 5,192,578 |
| 3 1/2s, with due dates from May 1, 2043 to May 1, 2043 | 9,943,281 | 9,952,368 |
| 3 1/2s, TBA, August 1, 2043 | 3,000,000 | 3,023,672 |
| 3s, TBA, August 1, 2043 | 6,000,000 | 5,816,719 |
|
| | | 85,075,683 |
| | |
| Total U.S. government and agency mortgage obligations (cost $86,933,917) | $86,054,980 |
| |
| |
| U.S. TREASURY OBLIGATIONS (10.4%)* | Principal amount | Value |
|
| U.S. Treasury Notes | | |
| 3 1/2s, February 15, 2018 | $35,100,000 | $38,619,596 |
| 3s, September 30, 2016 | 13,690,000 | 14,677,712 |
| 1 3/4s, May 15, 2023 | 4,730,000 | 4,387,075 |
| 1 1/4s, April 15, 2014 | 21,300,000 | 21,469,985 |
| 1s, August 31, 2016 | 4,000,000 | 4,041,562 |
| 0 5/8s, April 30, 2018 | 21,550,000 | 20,863,768 |
| 0 1/4s, August 31, 2014 | 26,890,000 | 26,916,890 |
|
| Total U.S. treasury obligations (cost $132,479,747) | | $130,976,588 |
| |
| |
| CORPORATE BONDS AND NOTES (14.6%)* | Principal amount | Value |
|
| Basic materials (1.2%) | | |
| Agrium, Inc. sr. unsec. notes 4.9s, 2043 (Canada) | $273,000 | $255,707 |
|
| Agrium, Inc. sr. unsec. notes 3 1/2s, 2023 (Canada) | 92,000 | 88,556 |
|
| Agrium, Inc. sr. unsec. notes 3.15s, 2022 (Canada) | 245,000 | 228,741 |
|
| |
| George Putnam Balanced Fund | 29 |
| | |
| CORPORATE BONDS AND NOTES (14.6%)* cont. | Principal amount | Value |
|
| Basic materials cont. | | |
| ArcelorMittal sr. unsec. bonds 10.35s, 2019 (France) | $400,000 | $484,930 |
|
| CF Industries, Inc. company guaranty sr. unsec. unsub. notes | | |
| 7 1/8s, 2020 | 290,000 | 345,248 |
|
| CF Industries, Inc. company guaranty sr. unsec. unsub. notes | | |
| 6 7/8s, 2018 | 380,000 | 448,415 |
|
| Cytec Industries, Inc. sr. unsec. unsub. notes 3 1/2s, 2023 | 215,000 | 203,253 |
|
| Eastman Chemical Co. sr. unsec. notes 4.8s, 2042 | 470,000 | 451,147 |
|
| Eastman Chemical Co. sr. unsec. notes 3.6s, 2022 | 335,000 | 328,829 |
|
| Eastman Chemical Co. sr. unsec. unsub. notes 6.3s, 2018 | 200,000 | 231,020 |
|
| Eastman Chemical Co. sr. unsec. unsub. notes 2.4s, 2017 | 110,000 | 111,361 |
|
| FMC Corp. sr. unsec. unsub. notes 5.2s, 2019 | 350,000 | 386,989 |
|
| Georgia-Pacific, LLC sr. unsec. unsub. notes 7 3/4s, 2029 | 850,000 | 1,085,457 |
|
| International Paper Co. sr. unsec. notes 9 3/8s, 2019 | 461,000 | 609,613 |
|
| International Paper Co. sr. unsec. notes 8.7s, 2038 | 10,000 | 13,651 |
|
| International Paper Co. sr. unsec. notes 7.95s, 2018 | 221,000 | 275,326 |
|
| LyondellBasell Industries NV sr. unsec. notes 6s, 2021 | 1,550,000 | 1,774,356 |
|
| LyondellBasell Industries NV sr. unsec. unsub. notes | | |
| 5 3/4s, 2024 | 1,800,000 | 2,017,922 |
|
| Methanex Corp. sr. unsec. unsub. notes 3 1/4s, 2019 (Canada) | 412,000 | 403,048 |
|
| Mosaic Co. (The) sr. unsec. notes 3 3/4s, 2021 | 200,000 | 197,701 |
|
| Packaging Corp. of America sr. unsec. unsub. notes 3.9s, 2022 | 285,000 | 279,890 |
|
| PPG Industries, Inc. sr. unsec. unsub. debs. 7.4s, 2019 | 350,000 | 422,093 |
|
| Rio Tinto Finance USA, Ltd. company guaranty sr. unsec. notes | | |
| 5.2s, 2040 (Australia) | 570,000 | 565,451 |
|
| Rock-Tenn Co. company guaranty sr. unsec. unsub. | | |
| notes 4.9s, 2022 | 227,000 | 235,628 |
|
| Rock-Tenn Co. company guaranty sr. unsec. unsub. notes | | |
| 4.45s, 2019 | 168,000 | 177,964 |
|
| Rohm & Haas Co. sr. unsec. unsub. notes 7.85s, 2029 | 385,000 | 507,874 |
|
| Temple-Inland, Inc. sr. unsec. unsub. notes 6 5/8s, 2018 | 195,000 | 227,817 |
|
| Union Carbide Corp. sr. unsec. unsub. bonds 7 3/4s, 2096 | 180,000 | 202,512 |
|
| Westvaco Corp. company guaranty sr. unsec. unsub. notes | | |
| 7.95s, 2031 | 1,015,000 | 1,181,093 |
|
| Weyerhaeuser Co. sr. unsec. unsub. notes 7 3/8s, 2032 R | 553,000 | 664,454 |
|
| Xstrata Finance Canada, Ltd. 144A company guaranty sr. unsec. | | |
| unsub. bonds 5.8s, 2016 (Canada) | 735,000 | 804,879 |
|
| | | 15,210,925 |
| Capital goods (0.3%) | | |
| Legrand France SA sr. unsec. unsub. debs 8 1/2s, 2025 (France) | 767,000 | 963,520 |
|
| Parker Hannifin Corp. sr. unsec. unsub. notes Ser. MTN, | | |
| 6 1/4s, 2038 | 975,000 | 1,189,058 |
|
| Republic Services, Inc. company guaranty sr. unsec. unsub. | | |
| notes 5 1/2s, 2019 | 240,000 | 272,962 |
|
| Staples, Inc. sr. unsec. unsub. notes 2 3/4s, 2018 | 1,246,000 | 1,255,077 |
|
| United Technologies Corp. sr. unsec. notes 5.7s, 2040 | 100,000 | 118,082 |
|
| United Technologies Corp. sr. unsec. unsub. notes 4 1/2s, 2042 | 225,000 | 225,174 |
|
| United Technologies Corp. sr. unsec. unsub. notes 3.1s, 2022 | 135,000 | 133,829 |
|
| | | 4,157,702 |
| |
| 30 | George Putnam Balanced Fund |
| | |
| CORPORATE BONDS AND NOTES (14.6%)* cont. | Principal amount | Value |
|
| Communication services (1.3%) | | |
| America Movil SAB de CV company guaranty sr. unsec. unsub. | | |
| notes 6 1/8s, 2040 (Mexico) | $200,000 | $213,711 |
|
| America Movil SAB de CV company guaranty unsec. unsub. | | |
| notes 2 3/8s, 2016 (Mexico) | 280,000 | 288,161 |
|
| American Tower Corp. sr. unsec. unsub. notes 3 1/2s, 2023 | 750,000 | 682,021 |
|
| American Tower REIT, Inc. sr. unsec. unsub. notes 4 5/8s, 2015 R | 555,000 | 580,831 |
|
| AT&T, Inc. company guaranty sr. notes 2 5/8s, 2022 | 178,000 | 162,584 |
|
| AT&T, Inc. sr. unsec. unsub. notes 6.3s, 2038 | 1,194,000 | 1,345,024 |
|
| AT&T, Inc. sr. unsec. unsub. notes 4.35s, 2045 | 1,490,000 | 1,301,148 |
|
| CC Holdings GS V, LLC/Crown Castle GS III Corp. company | | |
| guaranty sr. notes 3.849s, 2023 | 240,000 | 226,138 |
|
| CenturyLink, Inc. sr. unsec. debs. notes Ser. G, 6 7/8s, 2028 | 715,000 | 679,250 |
|
| Comcast Corp. company guaranty sr. unsec. unsub. notes | | |
| 6 1/2s, 2035 | 268,000 | 322,233 |
|
| Corning, Inc. sr. unsec. unsub. notes 5 3/4s, 2040 | 165,000 | 175,973 |
|
| Crown Castle Towers, LLC 144A company guaranty sr. notes | | |
| 4.883s, 2020 | 710,000 | 755,399 |
|
| Koninklijke (Royal) KPN NV sr. unsec. unsub. bonds 8 3/8s, | | |
| 2030 (Netherlands) | 70,000 | 89,104 |
|
| NBCUniversal Media, LLC sr. unsec. unsub. notes 6.4s, 2040 | 380,000 | 451,948 |
|
| Orange S.A. sr. unsec. unsub. notes 5 3/8s, 2019 (France) | 255,000 | 283,386 |
|
| Orange S.A. sr. unsec. unsub. notes 4 1/8s, 2021 (France) | 283,000 | 288,697 |
|
| Qwest Corp. sr. unsec. notes 6 3/4s, 2021 | 353,000 | 395,285 |
|
| Rogers Communications, Inc. company guaranty sr. unsec. | | |
| bonds 8 3/4s, 2032 (Canada) | 95,000 | 127,916 |
|
| Rogers Communications, Inc. company guaranty sr. unsec. | | |
| unsub. notes 4 1/2s, 2043 (Canada) | 215,000 | 194,696 |
|
| SBA Tower Trust 144A company guaranty sr. notes 5.101s, 2017 | 1,125,000 | 1,210,734 |
|
| SES 144A company guaranty sr. unsec. notes 5.3s, | | |
| 2043 (France) | 275,000 | 271,505 |
|
| TCI Communications, Inc. company guaranty sr. unsec. unsub. | | |
| debs. 7 7/8s, 2026 | 610,000 | 806,663 |
|
| Telecom Italia Capital SA company guaranty sr. unsec. unsub. | | |
| notes 6.175s, 2014 (Italy) | 195,000 | 201,413 |
|
| Telefonica Emisiones SAU company guaranty sr. unsec. notes | | |
| 4.57s, 2023 (Spain) | 1,000,000 | 966,880 |
|
| Telefonica Emisiones SAU company guaranty sr. unsec. unsub. | | |
| notes 6.221s, 2017 (Spain) | 845,000 | 930,563 |
|
| Time Warner Cable, Inc. company guaranty sr. notes 7.3s, 2038 | 640,000 | 631,574 |
|
| Time Warner Cable, Inc. company guaranty sr. unsec. unsub. | | |
| notes 6 3/4s, 2039 | 355,000 | 343,809 |
|
| Time Warner Cable, Inc. sr. unsec. FRN notes 8 3/4s, 2019 | 205,000 | 242,891 |
|
| Verizon New Jersey, Inc. company guaranty sr. unsec. unsub. | | |
| bonds 8s, 2022 | 770,000 | 948,991 |
|
| Verizon Pennsylvania, Inc. company guaranty sr. unsec. bonds | | |
| 8.35s, 2030 | 980,000 | 1,234,211 |
|
| | | 16,352,739 |
| Consumer cyclicals (1.0%) | | |
| ADT Corp. (The) sr. unsec. unsub. notes 4 7/8s, 2042 | 279,000 | 211,839 |
|
| ADT Corp. (The) sr. unsec. unsub. notes 3 1/2s, 2022 | 391,000 | 326,894 |
|
| |
| George Putnam Balanced Fund | 31 |
| | |
| CORPORATE BONDS AND NOTES (14.6%)* cont. | Principal amount | Value |
|
| Consumer cyclicals cont. | | |
| CBS Corp. company guaranty sr. unsec. debs. notes | | |
| 7 7/8s, 2030 | $880,000 | $1,120,761 |
|
| Choice Hotels International, Inc. company guaranty sr. unsec. | | |
| unsub. notes 5.7s, 2020 | 430,000 | 453,650 |
|
| DIRECTV Holdings, LLC/DIRECTV Financing Co., Inc. company | | |
| guaranty sr. unsec. notes 6.35s, 2040 | 124,000 | 127,303 |
|
| DIRECTV Holdings, LLC/DIRECTV Financing Co., Inc. sr. unsec. | | |
| unsub. notes 5.2s, 2020 | 820,000 | 883,379 |
|
| Expedia, Inc. company guaranty sr. unsec. unsub. notes | | |
| 5.95s, 2020 | 579,000 | 606,594 |
|
| Ford Motor Co. sr. unsec. unsub. notes 7.4s, 2046 | 200,000 | 243,976 |
|
| Ford Motor Credit Co., LLC sr. unsec. notes 4.207s, 2016 | 1,245,000 | 1,312,145 |
|
| Ford Motor Credit Co., LLC sr. unsec. unsub. FRN notes 8s, 2016 | 500,000 | 586,590 |
|
| Grupo Televisa, S.A.B sr. unsec. bonds 6 5/8s, 2040 (Mexico) | 300,000 | 325,749 |
|
| Grupo Televisa, S.A.B sr. unsec. notes 6s, 2018 (Mexico) | 157,000 | 177,410 |
|
| Hyatt Hotels Corp. sr. unsec. unsub. notes 3 3/8s, 2023 | 200,000 | 186,933 |
|
| Historic TW, Inc. company guaranty sr. unsec. unsub. bonds | | |
| 9.15s, 2023 | 340,000 | 461,537 |
|
| Host Hotels & Resorts LP sr. unsec. unsub. notes 6s, 2021 R | 320,000 | 349,778 |
|
| Host Hotels & Resorts LP sr. unsec. unsub. notes 5 1/4s, 2022 R | 150,000 | 156,247 |
|
| Macy’s Retail Holdings, Inc. company guaranty sr. unsec. | | |
| notes 6.9s, 2029 | 100,000 | 115,766 |
|
| Macy’s Retail Holdings, Inc. company guaranty sr. unsec. notes | | |
| 6.65s, 2024 | 123,000 | 145,498 |
|
| Macy’s Retail Holdings, Inc. company guaranty sr. unsec. notes | | |
| 5 1/8s, 2042 | 70,000 | 69,678 |
|
| Macy’s Retail Holdings, Inc. company guaranty sr. unsec. notes | | |
| 3 7/8s, 2022 | 110,000 | 111,357 |
|
| Macy’s Retail Holdings, Inc. sr. unsec. unsub. FRN | | |
| notes 6.7s, 2034 | 310,000 | 352,358 |
|
| Marriott International, Inc. sr. unsec. unsub. notes 3s, 2019 | 310,000 | 314,859 |
|
| News America Holdings, Inc. company guaranty sr. unsec. debs. | | |
| 7 3/4s, 2024 | 1,045,000 | 1,251,925 |
|
| NVR, Inc. sr. unsec. unsub. notes 3.95s, 2022 | 435,000 | 421,905 |
|
| O’Reilly Automotive, Inc. company guaranty sr. unsec. unsub. | | |
| notes 3.85s, 2023 | 195,000 | 191,021 |
|
| Owens Corning company guaranty sr. unsec. notes 9s, 2019 | 55,000 | 67,513 |
|
| Time Warner Entertainment Co., LP company guaranty sr. | | |
| unsec. bonds 8 3/8s, 2033 | 194,000 | 216,050 |
|
| Time Warner Entertainment Co., LP sr. unsec. debs. 8 3/8s, 2023 | 131,000 | 153,532 |
|
| Time Warner, Inc. company guaranty sr. unsec. bonds 7.7s, 2032 | 520,000 | 675,525 |
|
| Time Warner, Inc. company guaranty sr. unsec. notes 4.7s, 2021 | 120,000 | 129,418 |
|
| TJX Cos., Inc. sr. unsec. notes 2 1/2s, 2023 | 305,000 | 281,997 |
|
| Toyota Motor Credit Corp. sr. unsec. unsub. notes 3.3s, 2022 | 630,000 | 628,000 |
|
| | | 12,657,187 |
| Consumer staples (1.4%) | | |
| Altria Group, Inc. company guaranty sr. unsec. notes 9.7s, 2018 | 127,000 | 170,036 |
|
| Altria Group, Inc. company guaranty sr. unsec. notes | | |
| 9 1/4s, 2019 | 201,000 | 267,699 |
|
| |
| 32 | George Putnam Balanced Fund |
| | |
| CORPORATE BONDS AND NOTES (14.6%)* cont. | Principal amount | Value |
|
| Consumer staples cont. | | |
| Altria Group, Inc. company guaranty sr. unsec. unsub. notes | | |
| 2.85s, 2022 | $1,209,000 | $1,120,010 |
|
| Anheuser-Busch Cos., LLC sr. unsec. FRN notes 5 1/2s, 2018 | 885,000 | 1,016,444 |
|
| Anheuser-Busch InBev Worldwide, Inc. company guaranty sr. | | |
| unsec. unsub. notes 8.2s, 2039 | 165,000 | 245,136 |
|
| Bacardi, Ltd. 144A unsec. notes 4 1/2s, 2021 (Bermuda) | 495,000 | 527,409 |
|
| Campbell Soup Co. sr. unsec. unsub. notes 8 7/8s, 2021 | 855,000 | 1,120,430 |
|
| CVS Pass-Through Trust 144A company guaranty sr. notes | | |
| 7.507s, 2032 | 710,318 | 859,689 |
|
| Darden Restaurants, Inc. sr. unsec. unsub. notes 6.8s, 2037 | 810,000 | 877,369 |
|
| Delhaize Group company guaranty sr. unsec. notes 5.7s, | | |
| 2040 (Belgium) | 665,000 | 639,671 |
|
| Delhaize Group company guaranty sr. unsec. notes 4 1/8s, | | |
| 2019 (Belgium) | 260,000 | 269,772 |
|
| Delhaize Group SA company guaranty sr. unsec. unsub. notes | | |
| 6 1/2s, 2017 (Belgium) | 620,000 | 698,260 |
|
| Diageo Investment Corp. company guaranty sr. unsec. | | |
| debs. 8s, 2022 | 820,000 | 1,088,816 |
|
| Erac USA Finance, LLC 144A sr. unsec. notes 4 1/2s, 2021 | 785,000 | 815,370 |
|
| Erac USA Finance, LLC 144A unsec. sub. notes 7s, 2037 | 890,000 | 1,066,659 |
|
| Kerry Group Financial Services 144A company guaranty sr. | | |
| unsec. notes 3.2s, 2023 (Ireland) | 437,000 | 404,392 |
|
| Kraft Foods Group, Inc. sr. unsec. unsub. notes 6 1/2s, 2040 | 309,000 | 373,258 |
|
| Kraft Foods Group, Inc. sr. unsec. unsub. notes 5s, 2042 | 1,185,000 | 1,198,556 |
|
| Kroger Co. (The) company guaranty sr. unsec. unsub. | | |
| notes 6.4s, 2017 | 500,000 | 579,654 |
|
| McDonald’s Corp. sr. unsec. Ser. MTN, 6.3s, 2038 | 535,000 | 684,265 |
|
| McDonald’s Corp. sr. unsec. notes 5.7s, 2039 | 600,000 | 713,147 |
|
| Molson Coors Brewing Co. company guaranty sr. unsec. unsub. | | |
| notes 5s, 2042 | 180,000 | 180,401 |
|
| Mondelez International, Inc. sr. unsec. unsub. notes 6 1/2s, 2040 | 975,000 | 1,172,897 |
|
| SABMiller Holdings, Inc. 144A company guaranty sr. unsec. | | |
| notes 4.95s, 2042 | 200,000 | 205,730 |
|
| Tyson Foods, Inc. company guaranty sr. unsec. unsub. | | |
| notes 6.6s, 2016 | 460,000 | 519,095 |
|
| WPP Finance UK company guaranty sr. unsec. notes 8s, 2014 | | |
| (United Kingdom) | 690,000 | 741,548 |
|
| | | 17,555,713 |
| Energy (1.2%) | | |
| Anadarko Finance Co. company guaranty sr. unsec. unsub. | | |
| notes Ser. B, 7 1/2s, 2031 | 985,000 | 1,243,325 |
|
| BG Energy Capital PLC 144A company guaranty sr. unsec. notes | | |
| 4s, 2021 (United Kingdom) | 250,000 | 259,311 |
|
| BP Capital Markets PLC company guaranty sr. unsec. unsub. | | |
| notes 4.742s, 2021 (United Kingdom) | 655,000 | 716,018 |
|
| BP Capital Markets PLC company guaranty sr. unsec. unsub. | | |
| notes 4 1/2s, 2020 (United Kingdom) | 175,000 | 189,868 |
|
| Cenovus Energy, Inc. sr. unsec. unsub. notes 4.45s, | | |
| 2042 (Canada) | 240,000 | 219,660 |
|
| DCP Midstream, LLC 144A sr. unsec. notes 5.35s, 2020 | 375,000 | 399,802 |
|
| |
| George Putnam Balanced Fund | 33 |
| | |
| CORPORATE BONDS AND NOTES (14.6%)* cont. | Principal amount | Value |
|
| Energy cont. | | |
| Ente Nazionale Idrocarburi (ENI) SpA 144A sr. unsec. notes | | |
| 4.15s, 2020 (Italy) | $825,000 | $845,858 |
|
| EOG Resources, Inc. sr. unsec. notes 5 5/8s, 2019 | 205,000 | 242,168 |
|
| Hess Corp. sr. unsec. unsub. notes 7.3s, 2031 | 388,000 | 479,720 |
|
| Kerr-McGee Corp. company guaranty sr. unsec. unsub. notes | | |
| 7 7/8s, 2031 | 340,000 | 437,138 |
|
| Lukoil International Finance B.V. 144A company guaranty sr. | | |
| unsec. notes 4.563s, 2023 (Russia) | 315,000 | 295,421 |
|
| Marathon Petroleum Corp. sr. unsec. unsub. notes 6 1/2s, 2041 | 175,000 | 198,815 |
|
| Motiva Enterprises, LLC 144A sr. unsec. notes 6.85s, 2040 | 220,000 | 274,248 |
|
| Noble Holding International, Ltd. company guaranty sr. unsec. | | |
| notes 6.05s, 2041 | 390,000 | 393,341 |
|
| Petrobras Global Finance BV company guaranty sr. unsec. | | |
| unsub. notes 4 3/8s, 2023 (Brazil) | 250,000 | 224,066 |
|
| Petrobras International Finance Co. company guaranty sr. unsec. | | |
| notes 6 3/4s, 2041 (Brazil) | 300,000 | 289,310 |
|
| Petrobras International Finance Co. company guaranty sr. unsec. | | |
| notes 5 3/8s, 2021 (Brazil) | 825,000 | 821,564 |
|
| Petrobras International Finance Co. company guaranty sr. unsec. | | |
| notes 3 7/8s, 2016 (Brazil) | 355,000 | 366,261 |
|
| Petrohawk Energy Corp. company guaranty sr. unsec. notes | | |
| 7 1/4s, 2018 | 910,000 | 996,450 |
|
| Plains Exploration & Production Co. company guaranty sr. | | |
| unsec. notes 6 3/4s, 2022 | 1,143,000 | 1,223,752 |
|
| Pride International, Inc. sr. unsec. notes 7 7/8s, 2040 | 760,000 | 1,037,381 |
|
| Ras Laffan Liquefied Natural Gas Co., Ltd. 144A company | | |
| guaranty sr. notes 5 1/2s, 2014 (Qatar) | 675,000 | 706,388 |
|
| Spectra Energy Capital, LLC company guaranty sr. unsec. unsub. | | |
| notes 6.2s, 2018 | 1,080,000 | 1,253,256 |
|
| Spectra Energy Capital, LLC sr. notes 8s, 2019 | 820,000 | 1,033,317 |
|
| Spectra Energy Partners LP sr. unsec. notes 4.6s, 2021 | 245,000 | 248,976 |
|
| Statoil ASA company guaranty sr. unsec. notes 5.1s, | | |
| 2040 (Norway) | 480,000 | 522,804 |
|
| Weatherford Bermuda company guaranty sr. unsec. notes | | |
| 9 5/8s, 2019 (Bermuda) | 93,000 | 119,316 |
|
| Weatherford International, Inc. company guaranty sr. unsec. | | |
| unsub. notes 6.8s, 2037 | 245,000 | 257,968 |
|
| Weatherford International, Inc. company guaranty sr. unsec. | | |
| unsub. notes 6.35s, 2017 | 280,000 | 316,441 |
|
| | | 15,611,943 |
| Financials (5.5%) | | |
| ABN Amro Bank NV 144A sr. unsec. notes 4 1/4s, | | |
| 2017 (Netherlands) | 1,773,000 | 1,893,990 |
|
| Aflac, Inc. sr. unsec. notes 6.9s, 2039 | 747,000 | 936,271 |
|
| Aflac, Inc. sr. unsec. notes 6.45s, 2040 | 314,000 | 376,596 |
|
| American Express Co. sr. unsec. notes 7s, 2018 | 650,000 | 787,305 |
|
| American International Group, Inc. jr. sub. FRB bonds | | |
| 8.175s, 2068 | 781,000 | 954,773 |
|
| Aon PLC company guaranty sr. unsec. unsub. notes 4 1/4s, 2042 | 1,150,000 | 993,390 |
|
| Assurant, Inc. sr. unsec. notes 6 3/4s, 2034 | 525,000 | 568,783 |
|
| |
| 34 | George Putnam Balanced Fund |
| | |
| CORPORATE BONDS AND NOTES (14.6%)* cont. | Principal amount | Value |
|
| Financials cont. | | |
| AXA SA 144A jr. unsec. sub. FRN notes 6.463s, perpetual | | |
| maturity (France) | $550,000 | $548,625 |
|
| AXA SA 144A jr. unsec. sub. FRN notes 6.379s, 2049 (France) | 135,000 | 134,325 |
|
| Banco del Estado de Chile 144A sr. unsec. notes 2s, 2017 (Chile) | 400,000 | 391,869 |
|
| Bank of America Corp. sr. unsec. unsub. notes 6 1/2s, 2016 | 1,660,000 | 1,881,077 |
|
| Bank of America NA sub. notes Ser. BKNT, 5.3s, 2017 | 315,000 | 344,453 |
|
| Barclays Bank PLC 144A sub. notes 10.179s, 2021 | | |
| (United Kingdom) | 1,724,000 | 2,209,513 |
|
| Barclays Bank PLC 144A unsec. sub. notes 6.05s, 2017 | | |
| (United Kingdom) | 1,415,000 | 1,559,271 |
|
| Bear Stearns Cos., Inc. (The) sr. notes 6.4s, 2017 | 500,000 | 577,719 |
|
| Bear Stearns Cos., Inc. (The) sr. unsec. notes 7 1/4s, 2018 | 331,000 | 396,726 |
|
| Berkshire Hathaway Finance Corp. company guaranty sr. unsec. | | |
| unsub. notes 4.3s, 2043 | 703,000 | 652,205 |
|
| BNP Paribas SA 144A jr. unsec. sub. FRN notes 7.195s, | | |
| 2049 (France) | 100,000 | 100,550 |
|
| BNP Paribas SA 144A jr. unsec. sub. FRN notes 5.186s, | | |
| perpetual maturity (France) | 850,000 | 850,850 |
|
| Camden Property Trust sr. unsec. notes 4 7/8s, 2023 R | 1,213,000 | 1,287,712 |
|
| Capital One Bank USA NA unsec. sub. notes 3 3/8s, 2023 | 462,000 | 436,381 |
|
| Citigroup, Inc. sr. unsec. notes 8 1/2s, 2019 | 50,000 | 63,791 |
|
| Citigroup, Inc. sr. unsec. sub. FRN notes 0.544s, 2016 | 123,000 | 118,664 |
|
| Citigroup, Inc. sub. notes 5s, 2014 | 914,000 | 950,046 |
|
| CNA Financial Corp. sr. unsec. unsub. notes 5 3/4s, 2021 | 210,000 | 238,518 |
|
| CNA Financial Corp. unsec. notes 6 1/2s, 2016 | 435,000 | 494,352 |
|
| Commonwealth Bank of Australia 144A sr. unsec. notes 3 3/4s, | | |
| 2014 (Australia) | 1,220,000 | 1,263,412 |
|
| Credit Suisse of New York sr. unsec. notes 5.3s, 2019 | 475,000 | 535,582 |
|
| DDR Corp. sr. unsec. unsub. notes 7 7/8s, 2020 R | 605,000 | 746,330 |
|
| Duke Realty LP sr. unsec. notes 6 1/2s, 2018 R | 428,000 | 494,877 |
|
| EPR Properties unsec. notes 5 1/4s, 2023 R | 345,000 | 337,815 |
|
| GATX Financial Corp. notes 5.8s, 2016 | 560,000 | 616,224 |
|
| GE Capital Trust I unsec. sub. FRB bonds 6 3/8s, 2067 | 355,000 | 376,744 |
|
| General Electric Capital Corp. sr. unsec. notes 6 3/4s, 2032 | 40,000 | 48,223 |
|
| General Electric Capital Corp. sr. unsec. unsub. notes | | |
| 3.15s, 2022 | 220,000 | 207,902 |
|
| General Electric Capital Corp. sr. unsec. unsub. notes Ser. MTN, | | |
| 5 7/8s, 2038 | 1,453,000 | 1,593,140 |
|
| Genworth Financial, Inc. sr. unsec. unsub. notes 7 5/8s, 2021 | 860,000 | 1,032,038 |
|
| Goldman Sachs Group, Inc. (The) sr. notes 7 1/2s, 2019 | 805,000 | 971,169 |
|
| Goldman Sachs Group, Inc. (The) sub. notes 6 3/4s, 2037 | 282,000 | 295,601 |
|
| Hartford Financial Services Group, Inc. (The) sr. unsec. unsub. | | |
| notes 6 5/8s, 2040 | 1,495,000 | 1,821,391 |
|
| HBOS PLC 144A sr. unsec. sub. notes 6 3/4s, 2018 | | |
| (United Kingdom) | 360,000 | 389,055 |
|
| HBOS PLC 144A unsec. sub. bonds 6s, 2033 (United Kingdom) | 890,000 | 823,250 |
|
| Health Care REIT, Inc. sr. unsec. unsub. notes 3 3/4s, 2023 R | 410,000 | 398,876 |
|
| Highwood Realty LP sr. unsec. bonds 5.85s, 2017 R | 1,005,000 | 1,108,049 |
|
| HSBC Bank USA, N.A. unsec. sub. notes 7s, 2039 | 342,000 | 409,949 |
|
| |
| George Putnam Balanced Fund | 35 |
| | |
| CORPORATE BONDS AND NOTES (14.6%)* cont. | Principal amount | Value |
|
| Financials cont. | | |
| HSBC Finance Capital Trust IX FRN notes 5.911s, 2035 | $2,300,000 | $2,346,000 |
|
| HSBC USA Capital Trust I 144A jr. bank guaranty unsec. notes | | |
| 7.808s, 2026 | 450,000 | 457,425 |
|
| ING Bank NV 144A unsec. notes 3 3/4s, 2017 (Netherlands) | 785,000 | 823,672 |
|
| International Lease Finance Corp. sr. unsec. notes 6 1/4s, 2019 | 275,000 | 292,875 |
|
| JPMorgan Chase & Co. jr. unsec. sub. FRN notes 7.9s, | | |
| perpetual maturity | 780,000 | 867,750 |
|
| JPMorgan Chase Bank NA sub. notes Ser. BKNT, 6s, 2017 | 1,250,000 | 1,430,051 |
|
| JPMorgan Chase Capital XXIII company guaranty jr. unsec. sub. | | |
| FRN notes 1.275s, 2047 | 2,443,000 | 1,881,110 |
|
| Liberty Mutual Group, Inc. 144A company guaranty jr. unsec. | | |
| sub. bonds 7.8s, 2037 | 265,000 | 308,063 |
|
| Liberty Mutual Insurance Co. 144A notes 7.697s, 2097 | 340,000 | 349,560 |
|
| Lloyds TSB Bank PLC company guaranty sr. unsec. sub. notes | | |
| Ser. MTN, 6 1/2s, 2020 (United Kingdom) | 1,080,000 | 1,171,098 |
|
| Macquarie Bank Ltd. 144A unsec. sub. notes 6 5/8s, | | |
| 2021 (Australia) | 1,020,000 | 1,111,351 |
|
| Massachusetts Mutual Life Insurance Co. 144A notes | | |
| 8 7/8s, 2039 | 815,000 | 1,201,590 |
|
| MetLife Capital Trust IV 144A jr. sub. debs. 7 7/8s, 2037 | 1,544,000 | 1,821,920 |
|
| MetLife, Inc. jr. unsec. sub. notes 6.4s, 2036 | 590,000 | 613,600 |
|
| Metropolitan Life Global Funding I 144A notes 3.65s, 2018 | 100,000 | 106,764 |
|
| Nationwide Financial Services, Inc. notes 5 5/8s, 2015 | 465,000 | 492,245 |
|
| Nationwide Mutual Insurance Co. 144A notes 8 1/4s, 2031 | 415,000 | 513,370 |
|
| Nordea Bank AB 144A sub. notes 4 7/8s, 2021 (Sweden) | 1,300,000 | 1,360,819 |
|
| OneAmerica Financial Partners, Inc. 144A bonds 7s, 2033 | 370,000 | 364,651 |
|
| Pacific LifeCorp 144A sr. notes 6s, 2020 | 365,000 | 405,540 |
|
| Primerica, Inc. sr. unsec. unsub. notes 4 3/4s, 2022 | 213,000 | 225,019 |
|
| Progressive Corp. (The) jr. unsec. sub. FRN notes 6.7s, 2037 | 2,364,000 | 2,576,760 |
|
| Prudential Financial, Inc. jr. unsec. sub. FRN notes 5 5/8s, 2043 | 359,000 | 346,884 |
|
| Prudential Financial, Inc. jr. unsec. sub. FRN notes 5.2s, 2044 | 253,000 | 234,658 |
|
| Prudential Holdings, LLC sr. FRN notes Ser. AGM, 1.148s, 2017 | 210,000 | 207,892 |
|
| Rabobank Nederland 144A jr. unsec. sub. FRN notes 11s, | | |
| perpetual maturity (Netherlands) | 465,000 | 599,850 |
|
| Rayonier, Inc. company guaranty sr. unsec. unsub. notes | | |
| 3 3/4s, 2022 R | 270,000 | 262,523 |
|
| Realty Income Corp. sr. unsec. notes 4.65s, 2023 R | 1,045,000 | 1,072,411 |
|
| Royal Bank of Scotland PLC (The) sr. sub. FRN notes 9 1/2s, | | |
| 2022 (United Kingdom) | 560,000 | 620,200 |
|
| Royal Bank of Scotland PLC (The) unsec. sub. notes 6.1s, 2023 | | |
| (United Kingdom) | 425,000 | 405,412 |
|
| Santander Holdings USA, Inc. sr. unsec. unsub. notes | | |
| 4 5/8s, 2016 | 940,000 | 998,875 |
|
| Santander Issuances S.A. Unipersonal 144A bank guaranty | | |
| unsec. sub. notes 5.911s, 2016 (Spain) | 1,100,000 | 1,149,077 |
|
| Standard Chartered PLC 144A jr. sub. FRB bonds 7.014s, 2049 | | |
| (United Kingdom) | 600,000 | 612,000 |
|
| Standard Chartered PLC 144A unsec. sub. notes 3.95s, 2023 | | |
| (United Kingdom) | 800,000 | 750,999 |
|
| |
| 36 | George Putnam Balanced Fund |
| | |
| CORPORATE BONDS AND NOTES (14.6%)* cont. | Principal amount | Value |
|
| Financials cont. | | |
| State Street Capital Trust IV company guaranty jr. unsec. sub. | | |
| FRB bonds 1.273s, 2037 | $2,021,000 | $1,662,832 |
|
| Tanger Properties, LP sr. unsec. notes 6 1/8s, 2020 R | 265,000 | 308,918 |
|
| TD Ameritrade Holding Corp. company guaranty sr. unsec. | | |
| unsub. notes 5.6s, 2019 | 480,000 | 557,322 |
|
| Teachers Insurance & Annuity Association of America 144A | | |
| notes 6.85s, 2039 | 263,000 | 326,859 |
|
| Travelers Property Casuality Corp. sr. unsec. unsub. bonds | | |
| 7 3/4s, 2026 | 295,000 | 388,840 |
|
| Wachovia Bank NA sub. notes Ser. BKNT, 6s, 2017 | 1,060,000 | 1,221,618 |
|
| WEA Finance, LLC/WT Finance Aust. Pty. Ltd. 144A company | | |
| guaranty sr. unsec. notes 6 3/4s, 2019 | 570,000 | 678,082 |
|
| Wells Fargo Bank NA unsec. sub. FRN notes 0.484s, 2016 | 710,000 | 701,476 |
|
| Westpac Capital Trust III 144A unsec. sub. FRN notes 5.819s, | | |
| perpetual maturity | 1,010,000 | 1,013,535 |
|
| Willis Group Holdings, Ltd. company guaranty sr. unsec. unsub. | | |
| notes 5 3/4s, 2021 | 710,000 | 772,188 |
|
| ZFS Finance USA Trust V 144A FRB bonds 6 1/2s, 2037 | 214,000 | 227,910 |
|
| | | 69,058,976 |
| Government (0.4%) | | |
| International Bank for Reconstruction & Development unsec. | | |
| unsub. bonds 7 5/8s, 2023 (Supra-Nation) | 4,000,000 | 5,536,136 |
|
| | | 5,536,136 |
| Health care (0.2%) | | |
| Actavis, Inc. sr. unsec. notes 4 5/8s, 2042 | 222,000 | 203,687 |
|
| Actavis, Inc. sr. unsec. notes 3 1/4s, 2022 | 155,000 | 147,607 |
|
| Actavis, Inc. sr. unsec. notes 1 7/8s, 2017 | 40,000 | 39,762 |
|
| Aetna, Inc. sr. unsec. unsub. notes 6 3/4s, 2037 | 95,000 | 116,794 |
|
| CIGNA Corp. sr. unsec. unsub. notes 5 3/8s, 2042 | 205,000 | 220,906 |
|
| Coventry Health Care, Inc. sr. unsec. notes 5.45s, 2021 | 450,000 | 503,815 |
|
| Mylan, Inc./PA 144A sr. unsec. notes 2.6s, 2018 | 110,000 | 110,024 |
|
| Quest Diagnostics, Inc. company guaranty sr. unsec. notes | | |
| 6.95s, 2037 | 335,000 | 383,759 |
|
| Quest Diagnostics, Inc. company guaranty sr. unsec. notes | | |
| 4 3/4s, 2020 | 121,000 | 129,033 |
|
| UnitedHealth Group, Inc. sr. unsec. unsub. notes 4 5/8s, 2041 | 300,000 | 290,740 |
|
| WellPoint, Inc. notes 7s, 2019 | 155,000 | 188,907 |
|
| | | 2,335,034 |
| Technology (0.1%) | | |
| Apple, Inc. sr. unsec. unsub. notes 3.85s, 2043 | 627,000 | 544,233 |
|
| Fidelity National Information Services, Inc. company guaranty sr. | | |
| unsec. unsub. notes 5s, 2022 | 498,000 | 509,205 |
|
| SoftBank Corp. 144A sr. unsec. notes 4 1/2s, 2020 (Japan) | 245,000 | 237,650 |
|
| Xerox Corp. sr. unsec. notes 6.35s, 2018 | 400,000 | 461,304 |
|
| | | 1,752,392 |
| Transportation (0.3%) | | |
| Burlington Northern Santa Fe, LLC sr. unsec. notes 5.4s, 2041 | 605,000 | 653,945 |
|
| Burlington Northern Santa Fe, LLC sr. unsec. unsub. notes | | |
| 5 3/4s, 2040 | 145,000 | 164,999 |
|
| Continental Airlines, Inc. pass-through certificates | | |
| Ser. 97-4A, 6.9s, 2019 | 135,641 | 143,441 |
|
| |
| George Putnam Balanced Fund | 37 |
| | |
| CORPORATE BONDS AND NOTES (14.6%)* cont. | Principal amount | Value |
|
| Transportation cont. | | |
| Continental Airlines, Inc. pass-through certificates Ser. 98-1A, | | |
| 6.648s, 2017 | $264,229 | $274,798 |
|
| CSX Corp. sr. unsec. unsub. notes 4 3/4s, 2042 | 205,000 | 200,088 |
|
| Kansas City Southern de Mexico SA de CV 144A sr. unsec. notes | | |
| 2.35s, 2020 (Mexico) | 45,000 | 43,027 |
|
| Kansas City Southern Railway Co. (The) 144A sr. unsec | | |
| notes 4.3s, 2043 | 85,000 | 76,399 |
|
| Norfolk Southern Corp. sr. unsec. notes 6s, 2111 | 390,000 | 430,304 |
|
| Southwest Airlines Co. pass-through certificates Ser. 07-1, | | |
| 6.15s, 2022 | 678,087 | 784,038 |
|
| Union Pacific Corp. 144A pass-through certificates 5.214s, 2014 | 590,000 | 614,653 |
|
| | | 3,385,692 |
| Utilities and power (1.7%) | | |
| Appalachian Power Co. sr. notes Ser. L, 5.8s, 2035 | 510,000 | 547,496 |
|
| Arizona Public Services Co. sr. unsec. notes 4 1/2s, 2042 | 138,000 | 131,877 |
|
| Beaver Valley Funding Corp. sr. bonds 9s, 2017 | 132,000 | 133,830 |
|
| Boardwalk Pipelines LP company guaranty sr. unsec. notes | | |
| 5 7/8s, 2016 | 975,000 | 1,095,200 |
|
| Bruce Mansfield Unit pass-through certificates 6.85s, 2034 | 1,174,805 | 1,265,362 |
|
| Commonwealth Edison Co. 1st mtge. sec. bonds 5 7/8s, 2033 | 595,000 | 697,454 |
|
| Consolidated Edison Co. of New York sr. unsec. unsub. | | |
| notes 4.2s, 2042 | 220,000 | 209,946 |
|
| Dominion Resources, Inc. sr. unsec. unsub. notes | | |
| Ser. 07-A, 6s, 2017 | 10,000 | 11,628 |
|
| Duke Energy Carolinas, LLC sr. mtge. notes 4 1/4s, 2041 | 450,000 | 431,654 |
|
| EDP Finance BV 144A sr. unsec. unsub. notes 6s, | | |
| 2018 (Netherlands) | 685,000 | 710,194 |
|
| El Paso Natural Gas Co. sr. unsec. unsub. bonds 8 3/8s, 2032 | 490,000 | 651,595 |
|
| El Paso Pipeline Partners Operating Co., LP company guaranty | | |
| sr. unsec. notes 6 1/2s, 2020 | 235,000 | 272,389 |
|
| Electricite de France SA 144A sr. unsec. notes 6.95s, | | |
| 2039 (France) | 784,000 | 964,329 |
|
| Electricite de France SA 144A sr. unsec. unsub. notes 5.6s, | | |
| 2040 (France) | 640,000 | 676,115 |
|
| Electricite de France SA 144A unsec. sub. FRN notes 5 1/4s, | | |
| perpetual maturity (France) | 252,000 | 242,550 |
|
| Enel Finance International SA 144A company guaranty sr. unsec. | | |
| notes 5 1/8s, 2019 (Netherlands) | 360,000 | 371,721 |
|
| Energy Transfer Partners LP sr. unsec. unsub. notes 6 1/2s, 2042 | 766,000 | 840,789 |
|
| Energy Transfer Partners LP sr. unsec. unsub. notes 5.2s, 2022 | 240,000 | 256,400 |
|
| Enterprise Products Operating, LLC company guaranty sr. | | |
| unsec. unsub. notes 4.85s, 2042 | 370,000 | 358,521 |
|
| Iberdrola International BV company guaranty sr. unsec. unsub. | | |
| notes 6 3/4s, 2036 (Spain) | 185,000 | 191,933 |
|
| ITC Holdings Corp. 144A notes 5 7/8s, 2016 | 270,000 | 300,967 |
|
| ITC Holdings Corp. 144A sr. unsec. notes 6.05s, 2018 | 365,000 | 412,361 |
|
| Kansas Gas and Electric Co. bonds 5.647s, 2021 | 256,901 | 272,563 |
|
| Korea Gas Corp. 144A sr. unsec. unsub. notes 6 1/4s, 2042 | | |
| (South Korea) | 385,000 | 438,124 |
|
| Narragansett Electric Co. (The) 144A sr. unsec. notes 4.17s, 2042 | 395,000 | 356,894 |
|
| Nevada Power Co. mtge. notes 7 1/8s, 2019 | 295,000 | 368,021 |
|
| |
| 38 | George Putnam Balanced Fund |
| | |
| CORPORATE BONDS AND NOTES (14.6%)* cont. | Principal amount | Value |
|
| Utilities and power cont. | | |
| Oncore Electric Delivery Co., LLC bank guaranty unsec. sub. | | |
| notes 4.55s, 2041 | $435,000 | $422,504 |
|
| Pacific Gas & Electric Co. sr. unsec. notes 6.35s, 2038 | 418,000 | 509,025 |
|
| Pacific Gas & Electric Co. sr. unsub. notes 5.8s, 2037 | 140,000 | 161,236 |
|
| Potomac Edison Co. 144A sr. bonds 5.8s, 2016 | 331,000 | 368,684 |
|
| PPL Capital Funding, Inc. company guaranty sr. unsec. unsub. | | |
| notes 4.2s, 2022 | 145,000 | 147,755 |
|
| PPL WEM Holdings PLC 144A sr. unsec. notes 5 3/8s, 2021 | | |
| (United Kingdom) | 1,285,000 | 1,393,218 |
|
| Puget Sound Energy, Inc. jr. sub. FRN notes Ser. A, 6.974s, 2067 | 656,000 | 683,060 |
|
| Teco Finance, Inc. company guaranty sr. unsec. unsub. notes | | |
| 6.572s, 2017 | 110,000 | 127,706 |
|
| Texas-New Mexico Power Co. 144A 1st mtge. bonds Ser. A, | | |
| 9 1/2s, 2019 | 889,000 | 1,173,606 |
|
| Trans-Canada Pipelines, Ltd. jr. unsec. sub. FRN notes 6.35s, | | |
| 2067 (Canada) | 1,145,000 | 1,201,924 |
|
| Westar Energy, Inc. sr. mtge. notes 4 1/8s, 2042 | 210,000 | 198,536 |
|
| Wisconsin Energy Corp. jr. unsec. sub. FRN notes 6 1/4s, 2067 | 1,945,000 | 2,047,113 |
|
| | | 20,644,280 |
| | | |
| Total corporate bonds and notes (cost $173,311,420) | | $184,258,719 |
| |
| |
| MORTGAGE-BACKED SECURITIES (0.8%)* | Principal amount | Value |
|
| Banc of America Commercial Mortgage Trust | | |
| FRB Ser. 07-4, Class A3, 5.81s, 2051 | $896,280 | $909,725 |
| Ser. 06-5, Class A3, 5.39s, 2047 | 1,628,000 | 1,679,893 |
| FRB Ser. 05-1, Class A4, 5.117s, 2042 | 1,249,107 | 1,295,861 |
|
| Federal Home Loan Mortgage Corp. | | |
| Ser. T-56, Class A, IO, 0.524s, 2043 | 4,809,180 | 83,033 |
| Ser. T-56, Class 1, IO, zero %, 2043 | 7,379,061 | 55,343 |
| Ser. T-56, Class 2, IO, zero %, 2043 | 6,952,230 | 21,726 |
| Ser. T-56, Class 3, IO, zero %, 2043 | 5,845,097 | 76,717 |
|
| Federal National Mortgage Association Ser. 01-79, Class BI, IO, | | |
| 0.312s, 2045 | 1,514,527 | 14,494 |
|
| First Plus Home Loan Trust Ser. 97-3, Class B1, 7.79s, 2023 | | |
| (In default) † | 194,241 | 19 |
|
| G-Star, Ltd. 144A FRB Ser. 02-2A, Class BFL, 2.19s, 2037 | | |
| (Cayman Islands) | 78,021 | 77,728 |
|
| GE Business Loan Trust 144A Ser. 04-2, Class D, 2.941s, 2032 | 265,192 | 140,552 |
|
| GS Mortgage Securities Trust 144A Ser. 98-C1, Class F, 6s, 2030 | 193,212 | 193,695 |
|
| LB Commercial Conduit Mortgage Trust 144A | | |
| Ser. 99-C1, Class F, 6.41s, 2031 | 374,401 | 375,337 |
| Ser. 99-C1, Class G, 6.41s, 2031 | 765,731 | 773,388 |
| Ser. 98-C4, Class H, 5.6s, 2035 | 1,074,000 | 1,142,768 |
|
| Morgan Stanley Capital I Trust | | |
| Ser. 07-IQ15, Class A2, 5.853s, 2049 | 590,542 | 590,542 |
| FRB Ser. 07-HQ12, Class A2, 5.579s, 2049 | 1,079,601 | 1,083,920 |
| FRB Ser. 07-HQ12, Class A2FX, 5.579s, 2049 | 938,201 | 957,247 |
|
| |
| George Putnam Balanced Fund | 39 |
| | |
| MORTGAGE-BACKED SECURITIES (0.8%)* cont. | Principal amount | Value |
|
| Structured Asset Securities Corp. 144A Ser. 98-RF3, Class A, | | |
| IO, 6.1s, 2028 | $593,792 | $97,976 |
|
| TIAA Real Estate CDO, Ltd. Ser. 03-1A, Class E, 8s, 2038 | 1,929,985 | 289,498 |
|
| Total mortgage-backed securities (cost $9,244,405) | | $9,859,462 |
| |
| |
| CONVERTIBLE PREFERRED STOCKS (0.6%)* | Shares | Value |
|
| PPL Corp. $4.375 cv. pfd. | 35,521 | $1,930,211 |
|
| United Technologies Corp. $3.75 cv. pfd. | 52,866 | 3,390,297 |
|
| Weyerhaeuser Co. Ser. A, zero % cv. pfd. † | 32,052 | 1,674,717 |
|
| Total convertible preferred stocks (cost $6,218,220) | | $6,995,225 |
| |
| |
| INVESTMENT COMPANIES (0.3%)* | Shares | Value |
|
| Vanguard MSCI Emerging Markets ETF | 96,700 | $3,779,036 |
|
| Total investment companies (cost $3,892,769) | | $3,779,036 |
| |
| |
| MUNICIPAL BONDS AND NOTES (0.2%)* | Principal amount | Value |
|
| CA State G.O. Bonds (Build America Bonds), 7 1/2s, 4/1/34 | $215,000 | $280,401 |
|
| IL State G.O. Bonds | | |
| 4.421s, 1/1/15 | 420,000 | 437,535 |
| 4.071s, 1/1/14 | 1,250,000 | 1,265,800 |
|
| North TX, Thruway Auth. Rev. Bonds (Build America Bonds), | | |
| 6.718s, 1/1/49 | 350,000 | 430,969 |
|
| OH State U. Rev. Bonds (Build America Bonds), 4.91s, 6/1/40 | 275,000 | 288,478 |
|
| Total municipal bonds and notes (cost $2,511,452) | | $2,703,183 |
| |
| |
| FOREIGN GOVERNMENT AND AGENCY | | |
| BONDS AND NOTES (0.1%)* | Principal amount | Value |
|
| Croatia (Republic of) 144A sr. unsec. notes 6 1/4s, | | |
| 2017 (Croatia) | $350,000 | $373,625 |
|
| Korea Development Bank sr. unsec. unsub. notes 4s, 2016 | | |
| (South Korea) | 450,000 | 478,812 |
|
| Total foreign government and agency bonds and notes (cost $797,267) | $852,437 |
| |
| |
| SHORT-TERM INVESTMENTS (9.1%)* | Shares | Value |
|
| Putnam Short Term Investment Fund 0.02% L | 115,283,694 | $115,283,694 |
|
| Total short-term investments (cost $115,283,694) | | $115,283,694 |
| |
| |
| TOTAL INVESTMENTS | | |
|
| Total investments (cost $1,114,389,177) | | $1,291,863,212 |
| |
| 40 | George Putnam Balanced Fund |
Key to holding’s abbreviations
| |
| ADR | American Depository Receipts: represents ownership of foreign securities on deposit with a custodian bank |
| BKNT | Bank Note |
| ETF | Exchange Traded Fund |
| FRB | Floating Rate Bonds: the rate shown is the current interest rate at the close of the reporting period |
| FRN | Floating Rate Notes: the rate shown is the current interest rate at the close of the reporting period |
| G.O. Bonds | General Obligation Bonds |
| IO | Interest Only |
| MTN | Medium Term Notes |
| TBA | To Be Announced Commitments |
Notes to the fund’s portfolio
Unless noted otherwise, the notes to the fund’s portfolio are for the close of the fund’s reporting period, which ran from August 1, 2012 through July 31, 2013 (the reporting period). Within the following notes to the portfolio, references to “ASC 820” represent Accounting Standards Codification 820 Fair Value Measurements and Disclosures and references to “OTC”, if any, represent over-the-counter.
* Percentages indicated are based on net assets of $1,263,010,053.
## Forward commitment, in part or in entirety (Note 1).
† Non-income-producing security.
L Affiliated company (Note 5). The rate quoted in the security description is the annualized 7-day yield of the fund at the close of the reporting period.
R Real Estate Investment Trust.
At the close of the reporting period, the fund maintained liquid assets totaling $29,860,547 to cover certain derivatives contracts.
Debt obligations are considered secured unless otherwise indicated.
144A after the name of an issuer represents securities exempt from registration under Rule 144A under the Securities Act of 1933, as amended. These securities may be resold in transactions exempt from registration, normally to qualified institutional buyers.
See Note 1 to the financial statements regarding TBA’s.
The dates shown on debt obligations are the original maturity dates.
| |
| George Putnam Balanced Fund | 41 |
TBA SALE COMMITMENTS OUTSTANDING at 7/31/13 (proceeds receivable $5,193,359)
| | | | |
| | Principal | | Settlement | |
| Agency | amount | | date | Value |
|
| Federal National Mortgage Association, 4s, August 1, 2043 | $5,000,000 | | 8/12/13 | $5,192,578 |
|
| Total | | | | $5,192,578 |
ASC 820 establishes a three-level hierarchy for disclosure of fair value measurements. The valuation hierarchy is based upon the transparency of inputs to the valuation of the fund’s investments. The three levels are defined as follows:
Level 1: Valuations based on quoted prices for identical securities in active markets.
Level 2: Valuations based on quoted prices in markets that are not active or for which all significant inputs are observable, either directly or indirectly.
Level 3: Valuations based on inputs that are unobservable and significant to the fair value measurement.
The following is a summary of the inputs used to value the fund’s net assets as of the close of the reporting period:
| | | | |
| | | | | Valuation inputs | |
|
| Investments in securities: | | Level 1 | Level 2 | Level 3 |
|
| Basic materials | | $17,334,018 | $— | $— |
|
| Capital goods | | 32,955,999 | — | — |
|
| Communication services | | 31,912,150 | — | — |
|
| Conglomerates | | 19,894,321 | — | — |
|
| Consumer cyclicals | | 78,437,015 | — | — |
|
| Consumer staples | | 53,837,555 | — | — |
|
| Energy | | 91,825,766 | — | — |
|
| Financials | | 181,452,805 | — | — |
|
| Health care | | 124,941,881 | — | — |
|
| Technology | | 73,149,788 | — | — |
|
| Transportation | | 9,455,054 | — | — |
|
| Utilities and power | | 35,903,536 | — | — |
|
| Total common stocks | | 751,099,888 | — | — |
| | | | | |
| Convertible preferred stocks | | 3,390,297 | 3,604,928 | — |
|
| Corporate bonds and notes | | — | 184,258,719 | — |
|
| Foreign government and agency bonds and notes | | — | 852,437 | |
|
| Investment companies | | 3,779,036 | — | — |
|
| Mortgage-backed securities | | — | 9,859,462 | — |
|
| Municipal bonds and notes | | — | 2,703,183 | — |
|
| U.S. government and agency mortgage obligations | | — | 86,054,980 | — |
|
| U.S. treasury obligations | | — | 130,976,588 | — |
|
| Short-term investments | | 115,283,694 | — | — |
|
| Totals by level | | $873,552,915 | $418,310,297 | $— |
| | | | | |
| | | | | Valuation inputs | |
|
| Other financial instruments: | | Level 1 | Level 2 | Level 3 |
|
| TBA sale commitments | | — | (5,192,578) | — |
|
| Totals by level | | $— | $(5,192,578) | $— |
The accompanying notes are an integral part of these financial statements.
| |
| 42 | George Putnam Balanced Fund |
Statement of assets and liabilities 7/31/13
| |
| ASSETS | |
|
| Investment in securities, at value (Note 1): | |
| Unaffiliated issuers (identified cost $999,105,483) | $1,176,579,518 |
| Affiliated issuers (identified cost $115,283,694) (Notes 1 and 6) | 115,283,694 |
|
| Dividends, interest and other receivables | 5,109,136 |
|
| Receivable for shares of the fund sold | 442,165 |
|
| Receivable for sales of delayed delivery securities (Note 1) | 9,036,484 |
|
| Receivable for investments sold | 11,043,832 |
|
| Total assets | 1,317,494,829 |
| |
| LIABILITIES | |
|
| Payable for investments purchased | 3,866,095 |
|
| Payable for purchases of delayed delivery securities (Note 1) | 42,307,133 |
|
| Payable for shares of the fund repurchased | 1,301,400 |
|
| Payable for compensation of Manager (Note 2) | 564,558 |
|
| Payable for custodian fees (Note 2) | 14,864 |
|
| Payable for investor servicing fees (Note 2) | 164,580 |
|
| Payable for Trustee compensation and expenses (Note 2) | 549,839 |
|
| Payable for administrative services (Note 2) | 2,040 |
|
| Payable for distribution fees (Note 2) | 307,300 |
|
| TBA sale commitments, at value (proceeds receivable $5,193,359) (Note 1) | 5,192,578 |
|
| Other accrued expenses | 214,389 |
|
| Total liabilities | 54,484,776 |
| | |
| Net assets | $1,263,010,053 |
|
| |
| REPRESENTED BY | |
|
| Paid-in capital (Unlimited shares authorized) (Notes 1 and 4) | $1,881,800,081 |
|
| Undistributed net investment income (Note 1) | 4,157,611 |
|
| Accumulated net realized loss on investments and foreign currency transactions (Note 1) | (800,422,455) |
|
| Net unrealized appreciation of investments | 177,474,816 |
|
| Total — Representing net assets applicable to capital shares outstanding | $1,263,010,053 |
| |
| COMPUTATION OF NET ASSET VALUE AND OFFERING PRICE | |
|
| Net asset value and redemption price per class A share | |
| ($1,030,545,271 divided by 69,581,953 shares) | $14.81 |
|
| Offering price per class A share (100/94.25 of $14.81)* | $15.71 |
|
| Net asset value and offering price per class B share ($26,540,733 divided by 1,812,034 shares)** | $14.65 |
|
| Net asset value and offering price per class C share ($23,533,906 divided by 1,598,706 shares)** | $14.72 |
|
| Net asset value and redemption price per class M share ($74,635,585 divided by 5,105,495 shares) | $14.62 |
|
| Offering price per class M share (100/96.50 of $14.62)* | $15.15 |
|
| Net asset value, offering price and redemption price per class R share | |
| ($960,247 divided by 65,014 shares) | $14.77 |
|
| Net asset value, offering price and redemption price per class Y share | |
| ($106,794,311 divided by 7,185,087 shares) | $14.86 |
|
* On single retail sales of less than $50,000. On sales of $50,000 or more the offering price is reduced.
** Redemption price per share is equal to net asset value less any applicable contingent deferred sales charge.
The accompanying notes are an integral part of these financial statements.
| |
| George Putnam Balanced Fund | 43 |
Statement of operations Year ended 7/31/13
| |
| INVESTMENT INCOME | |
|
| Dividends (net of foreign tax of $107,303) | $19,871,038 |
|
| Interest (net of foreign tax of $73) (including interest income of $120,569 from investments | |
| in affiliated issuers) (Note 6) | 11,397,882 |
|
| Total investment income | 31,268,920 |
| |
| EXPENSES | |
|
| Compensation of Manager (Note 2) | 6,488,744 |
|
| Investor servicing fees (Note 2) | 2,152,977 |
|
| Custodian fees (Note 2) | 30,239 |
|
| Trustee compensation and expenses (Note 2) | 115,118 |
|
| Distribution fees (Note 2) | 3,521,984 |
|
| Administrative services (Note 2) | 34,635 |
|
| Other | 434,565 |
|
| Total expenses | 12,778,262 |
| | |
| Expense reduction (Note 2) | (42,028) |
|
| Net expenses | 12,736,234 |
| | |
| Net investment income | 18,532,686 |
|
| |
| Net realized gain on investments (Notes 1 and 3) | 82,006,053 |
|
| Net realized gain on swap contracts (Note 1) | 236 |
|
| Net realized loss on foreign currency transactions (Note 1) | (875) |
|
| Net increase from payments by affiliates (Note 2) | 54,576 |
|
| Net unrealized appreciation of investments and TBA sale commitments during the year | 87,169,795 |
|
| Net gain on investments | 169,229,785 |
| | |
| Net increase in net assets resulting from operations | $187,762,471 |
|
The accompanying notes are an integral part of these financial statements.
| |
| 44 | George Putnam Balanced Fund |
Statement of changes in net assets
| | |
| INCREASE (DECREASE) IN NET ASSETS | Year ended 7/31/13 | Year ended 7/31/12 |
|
| Operations: | | |
| Net investment income | $18,532,686 | $20,352,590 |
|
| Net realized gain on investments | | |
| and foreign currency transactions | 82,059,990 | 72,963,740 |
|
| Net unrealized appreciation (depreciation) of investments | 87,169,795 | (14,924,647) |
|
| Net increase in net assets resulting from operations | 187,762,471 | 78,391,683 |
|
| Distributions to shareholders (Note 1): | | |
| From ordinary income | | |
| Net investment income | | |
|
| Class A | (14,505,745) | (16,021,856) |
|
| Class B | (202,130) | (282,747) |
|
| Class C | (161,012) | (188,592) |
|
| Class M | (699,585) | (815,956) |
|
| Class R | (13,812) | (16,639) |
|
| Class Y | (1,611,862) | (1,261,401) |
|
| Decrease from capital share transactions (Note 4) | (72,986,841) | (134,214,725) |
|
| Total increase (decrease) in net assets | 97,581,484 | (74,410,233) |
| |
| NET ASSETS | | |
|
| Beginning of year | 1,165,428,569 | 1,239,838,802 |
|
| End of year (including undistributed net investment income | | |
| of $4,157,611 and $2,911,002, respectively) | $1,263,010,053 | $1,165,428,569 |
|
The accompanying notes are an integral part of these financial statements.
| |
| George Putnam Balanced Fund | 45 |
Financial highlights (For a common share outstanding throughout the period)
| | | | | | | | | | | | | | | | |
| INVESTMENT OPERATIONS: | | | | LESS DISTRIBUTIONS: | | | | | | | RATIOS AND SUPPLEMENTAL DATA: | |
|
| | | | | | | | | | | | | | | | Ratio | |
| | Net asset | Net | Net realized | | From | From | | | | | | | | Ratio | of net investment | |
| | value, | investment | and unrealized | Total from | net | net realized | From | | | | | | Net assets, | of expenses | income (loss) | Portfolio |
| | beginning | income | gain (loss) | investment | investment | gain | return | Total | Redemption | Non-recurring | Net asset value, | Total return at net | end of period | to average | to average | turnover |
| Period ended | of period | (loss) a | on investments | operations | income | on investments | of capital | distributions | fees | reimbursements | end of period | asset value (%) b | (in thousands) | net assets (%) c | net assets (%) | (%) d |
|
| Class A | | | | | | | | | | | | | | | | |
| July 31, 2013 | $12.88 | .21 | 1.92 | 2.13 | (.20) | — | — | (.20) | — | — | $14.81 | 16.68 | $1,030,545 | 1.01 | 1.56 | 86 |
| July 31, 2012 | 12.21 | .22 | .65 | .87 | (.20) | — | — | (.20) | — | — | 12.88 | 7.26 | 973,318 | 1.03 | 1.80 | 99 |
| July 31, 2011 | 11.08 | .19 | 1.14 | 1.33 | (.20) | — | — | (.20) | — e | — f | 12.21 | 12.09 | 1,034,828 | 1.05 | 1.57 | 176 |
| July 31, 2010 | 10.14 | .25 | .93 | 1.18 | (.22) | — | (.02) | (.24) | — e | — | 11.08 | 11.83 | 1,077,209 | 1.13 h | 2.27 | 341 |
| July 31, 2009 | 13.99 | .27 | (3.49) | (3.22) | (.44) | (.09) | (.10) | (.63) | — e | — g | 10.14 | (22.58) | 1,146,770 | 1.34 i,j | 2.61 j | 233 |
|
| Class B | | | | | | | | | | | | | | | | |
| July 31, 2013 | $12.74 | .11 | 1.90 | 2.01 | (.10) | — | — | (.10) | — | — | $14.65 | 15.83 | $26,541 | 1.76 | .82 | 86 |
| July 31, 2012 | 12.08 | .13 | .63 | .76 | (.10) | — | — | (.10) | — | — | 12.74 | 6.38 | 29,272 | 1.78 | 1.06 | 99 |
| July 31, 2011 | 10.96 | .10 | 1.13 | 1.23 | (.11) | — | — | (.11) | — e | — f | 12.08 | 11.24 | 39,031 | 1.80 | .82 | 176 |
| July 31, 2010 | 10.02 | .17 | .94 | 1.11 | (.15) | — | (.02) | (.17) | — e | — | 10.96 | 11.09 | 56,880 | 1.88 h | 1.54 | 341 |
| July 31, 2009 | 13.83 | .19 | (3.46) | (3.27) | (.37) | (.09) | (.08) | (.54) | — e | — g | 10.02 | (23.23) | 86,981 | 2.09 i,j | 1.85 j | 233 |
|
| Class C | | | | | | | | | | | | | | | | |
| July 31, 2013 | $12.80 | .11 | 1.91 | 2.02 | (.10) | — | — | (.10) | — | — | $14.72 | 15.85 | $23,534 | 1.76 | .81 | 86 |
| July 31, 2012 | 12.14 | .13 | .64 | .77 | (.11) | — | — | (.11) | — | — | 12.80 | 6.39 | 21,223 | 1.78 | 1.05 | 99 |
| July 31, 2011 | 11.02 | .10 | 1.13 | 1.23 | (.11) | — | — | (.11) | — e | — f | 12.14 | 11.22 | 22,013 | 1.80 | .82 | 176 |
| July 31, 2010 | 10.08 | .16 | .95 | 1.11 | (.15) | — | (.02) | (.17) | — e | — | 11.02 | 11.06 | 22,814 | 1.88 h | 1.52 | 341 |
| July 31, 2009 | 13.90 | .19 | (3.47) | (3.28) | (.37) | (.09) | (.08) | (.54) | — e | — g | 10.08 | (23.17) | 23,296 | 2.09 i,j | 1.86 j | 233 |
|
| Class M | | | | | | | | | | | | | | | | |
| July 31, 2013 | $12.71 | .14 | 1.90 | 2.04 | (.13) | — | — | (.13) | — | — | $14.62 | 16.17 | $74,636 | 1.51 | 1.06 | 86 |
| July 31, 2012 | 12.06 | .16 | .63 | .79 | (.14) | — | — | (.14) | — | — | 12.71 | 6.62 | 70,317 | 1.53 | 1.30 | 99 |
| July 31, 2011 | 10.94 | .13 | 1.13 | 1.26 | (.14) | — | — | (.14) | — e | — f | 12.06 | 11.60 | 75,160 | 1.55 | 1.07 | 176 |
| July 31, 2010 | 10.01 | .19 | .94 | 1.13 | (.18) | — | (.02) | (.20) | — e | — | 10.94 | 11.33 | 79,010 | 1.63 h | 1.77 | 341 |
| July 31, 2009 | 13.82 | .21 | (3.44) | (3.23) | (.40) | (.09) | (.09) | (.58) | — e | — g | 10.01 | (22.99) | 81,025 | 1.84 i,j | 2.13 j | 233 |
|
| Class R | | | | | | | | | | | | | | | | |
| July 31, 2013 | $12.84 | .18 | 1.92 | 2.10 | (.17) | — | — | (.17) | — | — | $14.77 | 16.44 | $960 | 1.26 | 1.32 | 86 |
| July 31, 2012 | 12.18 | .19 | .64 | .83 | (.17) | — | — | (.17) | — | — | 12.84 | 6.92 | 1,209 | 1.28 | 1.54 | 99 |
| July 31, 2011 | 11.05 | .16 | 1.14 | 1.30 | (.17) | — | — | (.17) | — e | — f | 12.18 | 11.84 | 1,216 | 1.30 | 1.32 | 176 |
| July 31, 2010 | 10.11 | .22 | .94 | 1.16 | (.20) | — | (.02) | (.22) | — e | — | 11.05 | 11.59 | 1,345 | 1.38 h | 2.03 | 341 |
| July 31, 2009 | 13.94 | .24 | (3.47) | (3.23) | (.42) | (.09) | (.09) | (.60) | — e | — g | 10.11 | (22.71) | 1,493 | 1.59 i,j | 2.30 j | 233 |
|
| Class Y | | | | | | | | | | | | | | | | |
| July 31, 2013 | $12.92 | .25 | 1.92 | 2.17 | (.23) | — | — | (.23) | — | — | $14.86 | 16.99 | $106,794 | .76 | 1.81 | 86 |
| July 31, 2012 | 12.26 | .25 | .64 | .89 | (.23) | — | — | (.23) | — | — | 12.92 | 7.42 | 70,090 | .78 | 2.04 | 99 |
| July 31, 2011 | 11.12 | .22 | 1.15 | 1.37 | (.23) | — | — | (.23) | — e | — f | 12.26 | 12.42 | 67,590 | .80 | 1.82 | 176 |
| July 31, 2010 | 10.17 | .28 | .95 | 1.23 | (.25) | — | (.03) | (.28) | — e | — | 11.12 | 12.18 | 69,539 | .88 h | 2.55 | 341 |
| July 31, 2009 | 14.04 | .29 | (3.50) | (3.21) | (.47) | (.09) | (.10) | (.66) | — e | — g | 10.17 | (22.42) | 103,251 | 1.09 i,j | 2.87 j | 233 |
|
See notes to financial highlights at the end of this section.
The accompanying notes are an integral part of these financial statements.
| | | |
| 46 | George Putnam Balanced Fund | George Putnam Balanced Fund | 47 |
Financial highlights (Continued)
a Per share net investment income (loss) has been determined on the basis of the weighted average number of shares outstanding during the period.
b Total return assumes dividend reinvestment and does not reflect the effect of sales charges.
c Includes amounts paid through expense offset and brokerage/service arrangements (Note 2).
d Portfolio turnover excludes TBA purchase and sales transactions.
e Amount represents less than $0.01 per share.
f Reflects a non-recurring reimbursement related to restitution amounts in connection with a distribution plan approved by the Securities and Exchange Commission (the SEC), which amounted to less than $0.01 per share outstanding on July 21, 2011. Also reflects a non-recurring reimbursal related to short-term trading related lawsuits, which amounted to less than $0.01 per share outstanding on May 11, 2011.
g Reflects a non-recurring reimbursement pursuant to a settlement between the SEC and Bear Stearns & Co., Inc. and Bear Stearns Securities Corp., which amounted to less than $0.01 per share outstanding as of May 21, 2009.
h Excludes the impact of a reduction to interest expense related to the resolution of certain terminated derivatives contracts, which amounted to 0.02% of average net assets as of July 31, 2010.
i Includes interest accrued in connection with certain terminated derivative contracts, which amounted to 0.20% of average net assets as of July 31, 2009 (Note 2).
j Reflects an involuntary contractual expense limitation in effect during the period. For periods prior to July 31, 2009, certain fund expenses were waived in connection with the fund’s investment in Putnam Prime Money Market Fund. As a result of such limitation and/or waivers, the expenses of each class reflect a reduction of the following amount:
| |
| | Percentage of |
| | average net assets |
|
| July 31, 2009 | 0.01% |
|
The accompanying notes are an integral part of these financial statements.
| |
| 48 | George Putnam Balanced Fund |
Notes to financial statements 7/31/13
Within the following Notes to financial statements, references to “State Street” represent State Street Bank and Trust Company, references to “the SEC” represent the Securities and Exchange Commission, references to “Putnam Management” represent Putnam Investment Management, LLC, the fund’s manager, an indirect wholly-owned subsidiary of Putnam Investments, LLC and references to “OTC”, if any, represent over-the-counter. Unless otherwise noted, the “reporting period” represents the period from August 1, 2012 through July 31, 2013.
The George Putnam Fund of Boston d/b/a George Putnam Balanced Fund (the fund) is a Massachusetts business trust, which is registered under the Investment Company Act of 1940, as amended, as a diversified open-end management investment company. The investment objective of the fund is to provide a balanced investment composed of a well-diversified portfolio of stocks and bonds which produce both capital growth and current income. The fund invests mainly in a combination of bonds and value stocks of large and midsized U.S. companies with a greater focus on value stocks. Value stocks are those that Putnam Management believes are currently undervalued by the market. If Putnam Management is correct and other investors ultimately recognize the value of the company, the price of its stock may rise. The fund buys bonds of governments and private companies that are mostly investment-grade in quality with intermediate- to long-term maturities (three years or longer). Putnam Management may consider, among other factors, a company’s valuation, financial strength, growth potential, competitive position in its industry, projected future earnings, cash flows and dividends when deciding whether to buy or sell equity investments, and, among other factors, credit, interest rate and prepayment risks, as well as general market conditions, when deciding whether to buy or sell fixed income investments.
The fund offers class A, class B, class C, class M, class R and class Y shares. Class A and class M shares are sold with a maximum front-end sales charge of 5.75% and 3.50%, respectively, and generally do not pay a contingent deferred sales charge. Class B shares, which convert to class A shares after approximately eight years, do not pay a front-end sales charge and are subject to a contingent deferred sales charge if those shares are redeemed within six years of purchase. Class C shares have a one-year 1.00% contingent deferred sales charge and do not convert to class A shares. Class R shares, which are not available to all investors, are sold at net asset value. The expenses for class A, class B, class C, class M and class R shares may differ based on the distribution fee of each class, which is identified in Note 2. Class Y shares, which are sold at net asset value, are generally subject to the same expenses as class A, class B, class C, class M and class R shares, but do not bear a distribution fee. Class Y shares are not available to all investors.
In the normal course of business, the fund enters into contracts that may include agreements to indemnify another party under given circumstances. The fund’s maximum exposure under these arrangements is unknown as this would involve future claims that may be, but have not yet been, made against the fund. However, the fund’s management team expects the risk of material loss to be remote.
Note 1: Significant accounting policies
The following is a summary of significant accounting policies consistently followed by the fund in the preparation of its financial statements. The preparation of financial statements is in conformity with accounting principles generally accepted in the United States of America and requires management to make estimates and assumptions that affect the reported amounts of assets and liabilities in the financial statements and the reported amounts of increases and decreases in net assets from operations. Actual results could differ from those estimates. Subsequent events after the Statement of assets and liabilities date through the date that the financial statements were issued have been evaluated in the preparation of the financial statements.
Investment income, realized and unrealized gains and losses and expenses of the fund are borne pro-rata based on the relative net assets of each class to the total net assets of the fund, except that each class bears expenses unique to that class (including the distribution fees applicable to such classes). Each class votes as a class only with respect to its own distribution plan or other matters on which a class vote is required by law or determined by the Trustees. If the fund were liquidated, shares of each class would receive their pro-rata share of the net assets of the fund. In addition, the Trustees declare separate dividends on each class of shares.
Security valuation Investments for which market quotations are readily available are valued at the last reported sales price on their principal exchange, or official closing price for certain markets, and are classified as Level 1 securities under Accounting Standards Codification 820 Fair Value Measurements and Disclosures (ASC 820). If no sales are reported, as in the case of some securities that are traded OTC, a security is valued at its last reported bid price and is generally categorized as a Level 2 security.
| |
| George Putnam Balanced Fund | 49 |
Investments in open-end investment companies (excluding exchange traded funds), if any, which can be classified as Level 1 or Level 2 securities, are valued based on their net asset value. The net asset value of such investment companies equals the total value of their assets less their liabilities and divided by the number of their outstanding shares.
Market quotations are not considered to be readily available for certain debt obligations and other investments; such investments are valued on the basis of valuations furnished by an independent pricing service approved by the Trustees or dealers selected by Putnam Management. Such services or dealers determine valuations for normal institutional-size trading units of such securities using methods based on market transactions for comparable securities and various relationships, generally recognized by institutional traders, between securities (which consider such factors as security prices, yields, maturities and ratings). These securities will generally be categorized as Level 2.
Many securities markets and exchanges outside the U.S. close prior to the close of the New York Stock Exchange and therefore the closing prices for securities in such markets or on such exchanges may not fully reflect events that occur after such close but before the close of the New York Stock Exchange. Accordingly, on certain days, the fund will fair value foreign equity securities taking into account multiple factors including movements in the U.S. securities markets, currency valuations and comparisons to the valuation of American Depository Receipts, exchange-traded funds and futures contracts. These securities, which would generally be classified as Level 1 securities, will be transferred to Level 2 of the fair value hierarchy when they are valued at fair value. The number of days on which fair value prices will be used will depend on market activity and it is possible that fair value prices will be used by the fund to a significant extent. Securities quoted in foreign currencies, if any, are translated into U.S. dollars at the current exchange rate.
To the extent a pricing service or dealer is unable to value a security or provides a valuation that Putnam Management does not believe accurately reflects the security’s fair value, the security will be valued at fair value by Putnam Management. Certain investments, including certain restricted and illiquid securities and derivatives, are also valued at fair value following procedures approved by the Trustees. These valuations consider such factors as significant market or specific security events such as interest rate or credit quality changes, various relationships with other securities, discount rates, U.S. Treasury, U.S. swap and credit yields, index levels, convexity exposures and recovery rates. These securities are classified as Level 2 or as Level 3 depending on the priority of the significant inputs.
Such valuations and procedures are reviewed periodically by the Trustees. The fair value of securities is generally determined as the amount that the fund could reasonably expect to realize from an orderly disposition of such securities over a reasonable period of time. By its nature, a fair value price is a good faith estimate of the value of a security in a current sale and does not reflect an actual market price, which may be different by a material amount.
Security transactions and related investment income Security transactions are recorded on the trade date (the date the order to buy or sell is executed). Gains or losses on securities sold are determined on the identified cost basis. Interest income, net of any applicable withholding taxes, is recorded on the accrual basis. Dividend income, net of any applicable withholding taxes, is recognized on the ex-dividend date except that certain dividends from foreign securities, if any, are recognized as soon as the fund is informed of the ex-dividend date. Non-cash dividends, if any, are recorded at the fair market value of the securities received. Dividends representing a return of capital or capital gains, if any, are reflected as a reduction of cost and/or as a realized gain. All premiums/discounts are amortized/accreted on a yield-to-maturity basis. Securities purchased or sold on a delayed delivery basis may be settled a month or more after the trade date; interest income is accrued based on the terms of the securities. Losses may arise due to changes in the market value of the underlying securities or if the counterparty does not perform under the contract.
Stripped securities The fund may invest in stripped securities which represent a participation in securities that may be structured in classes with rights to receive different portions of the interest and principal. Interest-only securities receive all of the interest and principal-only securities receive all of the principal. If the interest-only securities experience greater than anticipated prepayments of principal, the fund may fail to recoup fully its initial investment in these securities. Conversely, principal-only securities increase in value if prepayments are greater than anticipated and decline if prepayments are slower than anticipated. The market value of these securities is highly sensitive to changes in interest rates.
Foreign currency translation The accounting records of the fund are maintained in U.S. dollars. The market value of foreign securities, currency holdings, and other assets and liabilities is recorded in the books and records of the fund after translation to U.S. dollars based on the exchange rates on that day. The cost of each security is
| |
| 50 | George Putnam Balanced Fund |
determined using historical exchange rates. Income and withholding taxes are translated at prevailing exchange rates when earned or incurred. The fund does not isolate that portion of realized or unrealized gains or losses resulting from changes in the foreign exchange rate on investments from fluctuations arising from changes in the market prices of the securities. Such gains and losses are included with the net realized and unrealized gain or loss on investments. Net realized gains and losses on foreign currency transactions represent net realized exchange gains or losses on closed forward currency contracts, disposition of foreign currencies, currency gains and losses realized between the trade and settlement dates on securities transactions and the difference between the amount of investment income and foreign withholding taxes recorded on the fund’s books and the U.S. dollar equivalent amounts actually received or paid. Net unrealized appreciation and depreciation of assets and liabilities in foreign currencies arise from changes in the value of open forward currency contracts and assets and liabilities other than investments at the period end, resulting from changes in the exchange rate.
TBA purchase commitments The fund may enter into TBA (to be announced) commitments to purchase securities for a fixed unit price at a future date beyond customary settlement time. Although the unit price has been established, the principal value has not been finalized. However, it is anticipated that the amount of the commitments will not significantly differ from the principal amount. The fund holds, and maintains until settlement date, cash or high-grade debt obligations in an amount sufficient to meet the purchase price, or the fund may enter into offsetting contracts for the forward sale of other securities it owns. Income on the securities will not be earned until settlement date. TBA purchase commitments may be considered securities themselves, and involve a risk of loss if the value of the security to be purchased declines prior to the settlement date, which risk is in addition to the risk of decline in the value of the fund’s other assets. Unsettled TBA purchase commitments are valued at fair value of the underlying securities, according to the procedures described under “Security valuation” above. The contract is marked to market daily and the change in market value is recorded by the fund as an unrealized gain or loss.
Although the fund will generally enter into TBA purchase commitments with the intention of acquiring securities for its portfolio or for delivery pursuant to options contracts it has entered into, the fund may dispose of a commitment prior to settlement if Putnam Management deems it appropriate to do so.
TBA sale commitments The fund may enter into TBA sale commitments to hedge its portfolio positions or to sell mortgage-backed securities it owns under delayed delivery arrangements. Proceeds of TBA sale commitments are not received until the contractual settlement date. During the time a TBA sale commitment is outstanding, equivalent deliverable securities, or an offsetting TBA purchase commitment deliverable on or before the sale commitment date, are held as “cover” for the transaction.
Unsettled TBA sale commitments are valued at the fair value of the underlying securities, generally according to the procedures described under “Security valuation” above. The contract is marked to market daily and the change in market value is recorded by the fund as an unrealized gain or loss. If the TBA sale commitment is closed through the acquisition of an offsetting TBA purchase commitment, the fund realizes a gain or loss. If the fund delivers securities under the commitment, the fund realizes a gain or a loss from the sale of the securities based upon the unit price established at the date the commitment was entered into. TBA sale commitments outstanding at period end, if any, are listed after the fund’s portfolio.
Credit default contracts The fund entered into OTC credit default contracts to hedge credit risk. In an OTC credit default contract, the protection buyer typically makes an upfront payment and a periodic stream of payments to a counterparty, the protection seller, in exchange for the right to receive a contingent payment upon the occurrence of a credit event on the reference obligation or all other equally ranked obligations of the reference entity. Credit events are contract specific but may include bankruptcy, failure to pay, restructuring and obligation acceleration. An upfront payment received by the fund is recorded as a liability on the fund’s books. An upfront payment made by the fund is recorded as an asset on the fund’s books. Periodic payments received or paid by the fund are recorded as realized gains or losses. The OTC credit default contracts are marked to market daily based upon quotations from an independent pricing service or market makers and the change, if any, is recorded as an unrealized gain or loss. Upon the occurrence of a credit event, the difference between the par value and market value of the reference obligation, net of any proportional amount of the upfront payment, is recorded as a realized gain or loss.
In addition to bearing the risk that the credit event will occur, the fund could be exposed to market risk due to unfavorable changes in interest rates or in the price of the underlying security or index or the possibility that the fund may be unable to close out its position at the same time or at the same price as if it had purchased the underlying reference obligations. In certain circumstances, the fund may enter into offsetting OTC credit default contracts which would mitigate its risk of loss. Risks of loss may exceed amounts recognized on the Statement of assets and liabilities. The fund’s maximum risk of loss from counterparty risk, either as the protection seller or as the
| |
| George Putnam Balanced Fund | 51 |
protection buyer, is the fair value of the contract. This risk may be mitigated by having a master netting arrangement between the fund and the counterparty. Where the fund is a seller of protection, the maximum potential amount of future payments the fund may be required to make is equal to the notional amount of the relevant OTC credit default contract.
OTC credit default contracts outstanding, including their respective notional amounts at period end, if any, are listed after the fund’s portfolio.
Master agreements The fund is a party to ISDA (International Swaps and Derivatives Association, Inc.) Master Agreements (Master Agreements) with certain counterparties that govern OTC derivative and foreign exchange contracts entered into from time to time. The Master Agreements may contain provisions regarding, among other things, the parties’ general obligations, representations, agreements, collateral requirements, events of default and early termination. With respect to certain counterparties, in accordance with the terms of the Master Agreements, collateral posted to the fund is held in a segregated account by the fund’s custodian and with respect to those amounts which can be sold or repledged, are presented in the fund’s portfolio.
Collateral pledged by the fund is segregated by the fund’s custodian and identified in the fund’s portfolio. Collateral can be in the form of cash or debt securities issued by the U.S. Government or related agencies or other securities as agreed to by the fund and the applicable counterparty. Collateral requirements are determined based on the fund’s net position with each counterparty.
Termination events applicable to the fund may occur upon a decline in the fund’s net assets below a specified threshold over a certain period of time. Termination events applicable to counterparties may occur upon a decline in the counterparty’s long-term and short-term credit ratings below a specified level. In each case, upon occurrence, the other party may elect to terminate early and cause settlement of all derivative and foreign exchange contracts outstanding, including the payment of any losses and costs resulting from such early termination, as reasonably determined by the terminating party. Any decision by one or more of the fund’s counterparties to elect early termination could impact the fund’s future derivative activity.
At the close of the reporting period, the fund did not have a net liability position on open derivative contracts subject to the Master Agreements.
Interfund lending The fund, along with other Putnam funds, may participate in an interfund lending program pursuant to an exemptive order issued by the SEC. This program allows the fund to borrow from or lend to other Putnam funds that permit such transactions. Interfund lending transactions are subject to each fund’s investment policies and borrowing and lending limits. Interest earned or paid on the interfund lending transaction will be based on the average of certain current market rates. During the reporting period, the fund did not utilize the program.
Line of credit The fund participates, along with other Putnam funds, in a $315 million unsecured committed line of credit and a $185 million unsecured uncommitted line of credit, both provided by State Street. Borrowings may be made for temporary or emergency purposes, including the funding of shareholder redemption requests and trade settlements. Interest is charged to the fund based on the fund’s borrowing at a rate equal to the Federal Funds rate plus 1.25% for the committed line of credit and the Federal Funds rate plus 1.30% for the uncommitted line of credit. A closing fee equal to 0.02% of the committed line of credit and $50,000 for the uncommitted line of credit has been paid by the participating funds. In addition, a commitment fee of 0.11% per annum on any unutilized portion of the committed line of credit is allocated to the participating funds based on their relative net assets and paid quarterly. During the reporting period, the fund had no borrowings against these arrangements.
Federal taxes It is the policy of the fund to distribute all of its taxable income within the prescribed time period and otherwise comply with the provisions of the Internal Revenue Code of 1986, as amended (the Code), applicable to regulated investment companies. It is also the intention of the fund to distribute an amount sufficient to avoid imposition of any excise tax under Section 4982 of the Code.
The fund is subject to the provisions of Accounting Standards Codification 740 Income Taxes (ASC 740). ASC 740 sets forth a minimum threshold for financial statement recognition of the benefit of a tax position taken or expected to be taken in a tax return. The fund did not have a liability to record for any unrecognized tax benefits in the accompanying financial statements. No provision has been made for federal taxes on income, capital gains or unrealized appreciation on securities held nor for excise tax on income and capital gains. Each of the fund’s federal tax returns for the prior three fiscal years remains subject to examination by the Internal Revenue Service.
The fund may also be subject to taxes imposed by governments of countries in which it invests. Such taxes are generally based on either income or gains earned or repatriated. The fund accrues and applies such taxes to net investment income, net realized gains and net unrealized gains as income and/or capital gains are earned. In some
| |
| 52 | George Putnam Balanced Fund |
cases, the fund may be entitled to reclaim all or a portion of such taxes, and such reclaim amounts, if any, are reflected as an asset on the fund’s books. In many cases, however, the fund may not receive such amounts for an extended period of time, depending on the country of investment.
At July 31, 2013, the fund had a capital loss carryover of $797,888,409 available to the extent allowed by the Code to offset future net capital gain, if any. The amounts of the carryovers and the expiration dates are:
| | | |
| Loss carryover |
|
| Short-term | Long-term | Total | Expiration |
|
| $158,112,266 | N/A | $158,112,266 | July 2017 |
|
| 639,776,143 | N/A | 639,776,143 | July 2018 |
|
Under the Regulated Investment Company Modernization Act of 2010, the fund will be permitted to carry forward capital losses incurred in taxable years beginning after December 22, 2010 for an unlimited period. However, any losses incurred will be required to be utilized prior to the losses incurred in pre-enactment tax years. As a result of this ordering rule, pre-enactment capital loss carryforwards may be more likely to expire unused. Additionally, post-enactment capital losses that are carried forward will retain their character as either short-term or long-term capital losses rather than being considered all short-term as under previous law.
Distributions to shareholders Distributions to shareholders from net investment income are recorded by the fund on the ex-dividend date. Distributions from capital gains, if any, are recorded on the ex-dividend date and paid at least annually. The amount and character of income and gains to be distributed are determined in accordance with income tax regulations, which may differ from generally accepted accounting principles.
These differences include temporary and/or permanent differences from interest only securities. Reclassifications are made to the fund’s capital accounts to reflect income and gains available for distribution (or available capital loss carryovers) under income tax regulations. For the reporting period ended, the fund reclassified $91,931 to decrease undistributed net investment income, and $91,931 to decrease accumulated net realized loss.
The tax basis components of distributable earnings and the federal tax cost as of the close of the reporting period were as follows:
| |
| Unrealized appreciation | $191,017,394 |
| Unrealized depreciation | (16,077,403) |
|
| Net unrealized appreciation | 174,939,991 |
| Undistributed ordinary income | 4,157,611 |
| Capital loss carryforward | (797,888,409) |
| | |
| Cost for federal income tax purposes | $1,116,923,221 |
Note 2: Management fee, administrative services and other transactions
The fund pays Putnam Management a management fee (based on the fund’s average net assets and computed and paid monthly) at annual rates that may vary based on the average of the aggregate net assets of most open-end funds, as defined in the fund’s management contract, sponsored by Putnam Management. Such annual rates may vary as follows:
| | | | |
| 0.680% | of the first $5 billion, | | 0.480% | of the next $50 billion, |
| |
|
| 0.630% | of the next $5 billion, | | 0.460% | of the next $50 billion, |
| |
|
| 0.580% | of the next $10 billion, | | 0.450% | of the next $100 billion and |
| |
|
| 0.530% | of the next $10 billion, | | 0.445% | of any excess thereafter. |
| |
|
Putnam Management has contractually agreed, through June 30, 2014, to waive fees or reimburse the fund’s expenses to the extent necessary to limit the cumulative expenses of the fund, exclusive of brokerage, interest, taxes, investment-related expenses, extraordinary expenses, acquired fund fees and expenses and payments under the fund’s investor servicing contract, investment management contract and distribution plans, on a fiscal year-to-date basis to an annual rate of 0.20% of the fund’s average net assets over such fiscal year-to-date period. During the reporting period, the fund’s expenses were not reduced as a result of this limit.
| |
| George Putnam Balanced Fund | 53 |
Putnam Investments Limited (PIL), an affiliate of Putnam Management, is authorized by the Trustees to manage a separate portion of the assets of the fund as determined by Putnam Management from time to time. Putnam Management pays a quarterly sub-management fee to PIL for its services at an annual rate of 0.40% of the average net assets of the portion of the fund managed by PIL.
Putnam Management voluntarily reimbursed the fund $54,576 for a trading error which occurred during the reporting period. The effect of the loss incurred and the reimbursement by Putnam Management of such amounts had no impact on total return.
The fund reimburses Putnam Management an allocated amount for the compensation and related expenses of certain officers of the fund and their staff who provide administrative services to the fund. The aggregate amount of all such reimbursements is determined annually by the Trustees.
Custodial functions for the fund’s assets are provided by State Street. Custody fees are based on the fund’s asset level, the number of its security holdings and transaction volumes.
Putnam Investor Services, Inc., an affiliate of Putnam Management, provides investor servicing agent functions to the fund. Putnam Investor Services, Inc. received fees for investor servicing based on the fund’s retail asset level, the number of shareholder accounts in the fund and the level of defined contribution plan assets in the fund. Investor servicing fees will not exceed an annual rate of 0.32% of the fund’s average net assets. During the reporting period, the expenses for each class of shares related to investor servicing fees were as follows:
| | | | |
| Class A | $1,760,375 | | Class R | 1,978 |
| |
|
| Class B | 48,824 | | Class Y | 177,121 |
| |
|
| Class C | 38,924 | | Total | $2,152,977 |
| |
|
| Class M | 125,755 | | | |
| | |
The fund has entered into expense offset arrangements with Putnam Investor Services, Inc. and State Street whereby Putnam Investor Services, Inc.’s and State Street’s fees are reduced by credits allowed on cash balances. The fund also reduced expenses through brokerage/service arrangements. For the reporting period, the fund’s expenses were reduced by $1,573 under the expense offset arrangements and by $40,455 under the brokerage/service arrangements.
Each independent Trustee of the fund receives an annual Trustee fee, of which $896, as a quarterly retainer, has been allocated to the fund, and an additional fee for each Trustees meeting attended. Trustees also are reimbursed for expenses they incur relating to their services as Trustees.
The fund has adopted a Trustee Fee Deferral Plan (the Deferral Plan) which allows the Trustees to defer the receipt of all or a portion of Trustees fees payable on or after July 1, 1995. The deferred fees remain invested in certain Putnam funds until distribution in accordance with the Deferral Plan.
The fund has adopted an unfunded noncontributory defined benefit pension plan (the Pension Plan) covering all Trustees of the fund who have served as a Trustee for at least five years and were first elected prior to 2004. Benefits under the Pension Plan are equal to 50% of the Trustee’s average annual attendance and retainer fees for the three years ended December 31, 2005. The retirement benefit is payable during a Trustee’s lifetime, beginning the year following retirement, for the number of years of service through December 31, 2006. Pension expense for the fund is included in Trustee compensation and expenses in the Statement of operations. Accrued pension liability is included in Payable for Trustee compensation and expenses in the Statement of assets and liabilities. The Trustees have terminated the Pension Plan with respect to any Trustee first elected after 2003.
The fund has adopted distribution plans (the Plans) with respect to its class A, class B, class C, class M and class R shares pursuant to Rule 12b–1 under the Investment Company Act of 1940. The purpose of the Plans is to compensate Putnam Retail Management Limited Partnership, an indirect wholly-owned subsidiary of Putnam Investments, LLC, for services provided and expenses incurred in distributing shares of the fund. The Plans provide for payments by the fund to Putnam Retail Management Limited Partnership at an annual rate of up to 0.35%, 1.00%, 1.00%, 1.00% and 1.00% of the average net assets attributable to class A, class B, class C, class M and class R shares, respectively. The Trustees have approved payment by the fund at an annual rate of 0.25%, 1.00%, 1.00%, 0.75% and
| |
| 54 | George Putnam Balanced Fund |
0.50% of the average net assets attributable to class A, class B, class C, class M and class R shares, respectively. During the reporting period, the class specific expenses related to distribution fees were as follows:
| | | | |
| Class A | $2,487,052 | | Class M | 533,207 |
| |
|
| Class B | 276,114 | | Class R | 5,601 |
| |
|
| Class C | 220,010 | | Total | $3,521,984 |
| |
|
For the reporting period, Putnam Retail Management Limited Partnership, acting as underwriter, received net commissions of $82,277 and $771 from the sale of class A and class M shares, respectively, and received $16,619 and $560 in contingent deferred sales charges from redemptions of class B and class C shares, respectively.
A deferred sales charge of up to 1.00% and 0.65% is assessed on certain redemptions of class A and class M shares, respectively. For the reporting period, Putnam Retail Management Limited Partnership, acting as underwriter, received $75 and no monies on class A and class M redemptions, respectively.
Note 3: Purchases and sales of securities
During the reporting period, cost of purchases and proceeds from sales of investment securities other than short-term investments and TBA transactions aggregated $910,187,186 and $911,853,588, respectively. These figures include the cost of purchases and proceeds from sales of long-term U.S. government securities of $156,046,748 and $103,712,105, respectively.
Note 4: Capital shares
At the close of the reporting period, there was an unlimited number of shares of beneficial interest authorized. Transactions in capital shares were as follows:
| | | | |
| | Year ended 7/31/13 | Year ended 7/31/12 |
|
| Class A | Shares | Amount | Shares | Amount |
|
| Shares sold | 4,192,665 | $57,851,817 | 4,176,401 | $51,105,145 |
|
| Shares issued in connection with | | | | |
| reinvestment of distributions | 977,643 | 13,286,743 | 1,210,965 | 14,521,259 |
|
| | 5,170,308 | 71,138,560 | 5,387,366 | 65,626,404 |
|
| Shares repurchased | (11,171,410) | (153,321,059) | (14,527,294) | (177,131,293) |
|
| Net decrease | (6,001,102) | $(82,182,499) | (9,139,928) | $(111,504,889) |
|
| |
| | Year ended 7/31/13 | Year ended 7/31/12 |
|
| Class B | Shares | Amount | Shares | Amount |
|
| Shares sold | 225,486 | $3,084,438 | 236,098 | $2,871,876 |
|
| Shares issued in connection with | | | | |
| reinvestment of distributions | 14,725 | 197,393 | 22,966 | 272,062 |
|
| | 240,211 | 3,281,831 | 259,064 | 3,143,938 |
|
| Shares repurchased | (726,454) | (9,882,920) | (1,192,864) | (14,417,278) |
|
| Net decrease | (486,243) | $(6,601,089) | (933,800) | $(11,273,340) |
|
| |
| | Year ended 7/31/13 | Year ended 7/31/12 |
|
| Class C | Shares | Amount | Shares | Amount |
|
| Shares sold | 205,715 | $2,843,106 | 202,878 | $2,447,332 |
|
| Shares issued in connection with | | | | |
| reinvestment of distributions | 11,122 | 150,491 | 14,628 | 174,519 |
|
| | 216,837 | 2,993,597 | 217,506 | 2,621,851 |
|
| Shares repurchased | (275,905) | (3,759,607) | (372,777) | (4,537,690) |
|
| Net decrease | (59,068) | $(766,010) | (155,271) | $(1,915,839) |
|
| |
| George Putnam Balanced Fund | 55 |
| | | | |
| | Year ended 7/31/13 | Year ended 7/31/12 |
|
| Class M | Shares | Amount | Shares | Amount |
|
| Shares sold | 515,112 | $7,035,008 | 632,492 | $7,630,386 |
|
| Shares issued in connection with | | | | |
| reinvestment of distributions | 51,706 | 693,748 | 68,110 | 807,182 |
|
| | 566,818 | 7,728,756 | 700,602 | 8,437,568 |
|
| Shares repurchased | (992,324) | (13,318,610) | (1,402,530) | (16,944,743) |
|
| Net decrease | (425,506) | $(5,589,854) | (701,928) | $(8,507,175) |
|
| |
| | Year ended 7/31/13 | Year ended 7/31/12 |
|
| Class R | Shares | Amount | Shares | Amount |
|
| Shares sold | 18,885 | $257,971 | 30,235 | $371,945 |
|
| Shares issued in connection with | | | | |
| reinvestment of distributions | 999 | 13,510 | 1,366 | 16,349 |
|
| | 19,884 | 271,481 | 31,601 | 388,294 |
|
| Shares repurchased | (48,989) | (679,067) | (37,325) | (455,995) |
|
| Net decrease | (29,105) | $(407,586) | (5,724) | $(67,701) |
|
| |
| | Year ended 7/31/13 | Year ended 7/31/12 |
|
| Class Y | Shares | Amount | Shares | Amount |
|
| Shares sold | 3,108,693 | $41,013,365 | 688,476 | $8,632,348 |
|
| Shares issued in connection with | | | | |
| reinvestment of distributions | 113,947 | 1,560,517 | 100,727 | 1,211,947 |
|
| | 3,222,640 | 42,573,882 | 789,203 | 9,844,295 |
|
| Shares repurchased | (1,461,776) | (20,013,685) | (879,680) | (10,790,076) |
|
| Net increase (decrease) | 1,760,864 | $22,560,197 | (90,477) | $(945,781) |
|
Note 5: Transactions with affiliated issuers
Transactions during the reporting period with Putnam Money Market Liquidity Fund and Putnam Short Term Investment Fund, which are under common ownership or control, were as follows:
| | | | | |
| | Market value at | | | | Market value |
| | the beginning | | | | at the end of |
| | of the reporting | | | Investment | the reporting |
| Name of affiliate | period | Purchase cost | Sale proceeds | income | period |
|
| Putnam Money Market | | | | | |
| Liquidity Fund* | $145,927,690 | $126,613,458 | $272,541,148 | $92,426 | $— |
|
| Putnam Short Term | | | | | |
| Investment Fund* | — | 264,494,485 | 149,210,791 | 28,143 | 115,283,694 |
|
| Totals | $145,927,690 | $391,107,943 | $421,751,939 | $120,569 | $115,283,694 |
|
* Management fees charged to Putnam Money Market Liquidity Fund and Putnam Short Term Investment Fund have been waived by Putnam Management.
Note 6: Market, credit and other risks
In the normal course of business, the fund trades financial instruments and enters into financial transactions where risk of potential loss exists due to changes in the market (market risk) or failure of the contracting party to the transaction to perform (credit risk). The fund may be exposed to additional credit risk that an institution or other entity with which the fund has unsettled or open transactions will default. The fund may invest a significant portion of its assets in securitized debt instruments, including mortgage-backed and asset-backed investments. The yields and values of these investments are sensitive to changes in interest rates, the rate of principal payments on the
| |
| 56 | George Putnam Balanced Fund |
underlying assets and the market’s perception of the issuers. The market for these investments may be volatile and limited, which may make them difficult to buy or sell.
Note 7: Summary of derivative activity
The average volume of activity for the reporting period for any derivative type that was held during the period is listed below and was as follows:
| |
| OTC credit default swap contracts (notional) | —* |
|
* For the reporting period, the transaction volume was minimal.
As of the close of the reporting period, the fund did not hold any derivative instruments. The following is a summary of realized gains or losses of derivative instruments on the Statement of operations for the reporting period (see Note 1) (there were no unrealized gains or losses on derivative instruments):
Amount of realized gain or (loss) on derivatives recognized in net gain or (loss) on investments
| | |
| Derivatives not accounted for as hedging | | |
| instruments under ASC 815 | Swaps | Total |
|
| Credit contracts | $236 | $236 |
|
| Total | $236 | $236 |
|
Note 8: New accounting pronouncement
In January 2013, ASU 2013–01, “Clarifying the Scope of Disclosures about Offsetting Assets and Liabilities,” amended ASU No. 2011–11, “Disclosures about Offsetting Assets and Liabilities.” The ASUs create new disclosure requirements requiring entities to disclose both gross and net information for derivatives and other financial instruments that are either offset in the Statement of assets and liabilities or subject to an enforceable master netting arrangement or similar agreement. The disclosure requirements are effective for annual reporting periods beginning on or after January 1, 2013 and interim periods within those annual periods. Putnam Management is currently evaluating the application of ASUs 2013–01 and 2011–11 and their impact, if any, on the fund’s financial statements.
Federal tax information (Unaudited)
The fund designated 91.95% of ordinary income distributions as qualifying for the dividends received deduction for corporations.
For the reporting period ended, the fund hereby designates 100%, or the maximum amount allowable, of its taxable ordinary income distributions as qualified dividends taxed at the individual net capital gain rates.
For the reporting period ended, pursuant to §871(k) of the Internal Revenue Code, the fund hereby designates $5,207,436 of distributions paid as qualifying to be taxed as interest-related dividends for nonresident alien shareholders.
The Form 1099 that will be mailed to you in January 2014 will show the tax status of all distributions paid to your account in calendar 2013.
| |
| George Putnam Balanced Fund | 57 |
About the Trustees
Independent Trustees

| |
| 58 | George Putnam Balanced Fund |
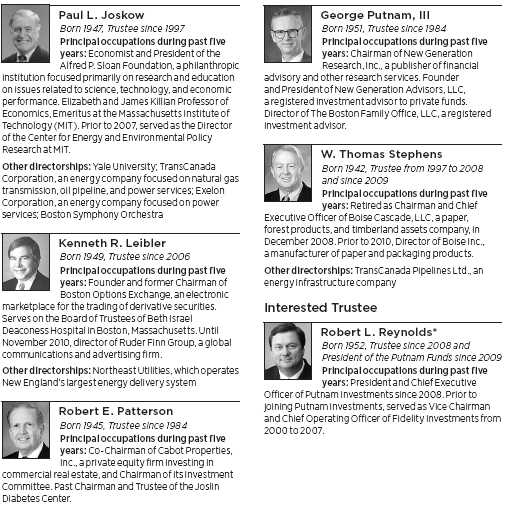
* Mr. Reynolds is an “interested person” (as defined in the Investment Company Act of 1940) of the fund, Putnam Management, and Putnam Retail Management. He is President and Chief Executive Officer of Putnam Investments, as well as the President of your fund and each of the other Putnam funds.
The address of each Trustee is One Post Office Square, Boston, MA 02109.
As of July 31, 2013, there were 116 Putnam funds. All Trustees serve as Trustees of all Putnam funds.
Each Trustee serves for an indefinite term, until his or her resignation, retirement at age 75, removal, or death.
| |
| George Putnam Balanced Fund | 59 |
Officers
In addition to Robert L. Reynolds, the other officers of the fund are shown below:
| |
| Jonathan S. Horwitz (Born 1955) | Janet C. Smith (Born 1965) |
| Executive Vice President, Principal Executive | Vice President, Principal Accounting Officer, |
| Officer, and Compliance Liaison | and Assistant Treasurer |
| Since 2004 | Since 2007 |
| | Director of Fund Administration Services, |
| Steven D. Krichmar (Born 1958) | Putnam Investments and Putnam Management |
| Vice President and Principal Financial Officer | |
| Since 2002 | Susan G. Malloy (Born 1957) |
| Chief of Operations, Putnam Investments and | Vice President and Assistant Treasurer |
| Putnam Management | Since 2007 |
| | Director of Accounting & Control Services, |
| Robert T. Burns (Born 1961) | Putnam Investments and Putnam Management |
| Vice President and Chief Legal Officer | |
| Since 2011 | James P. Pappas (Born 1953) |
| General Counsel, Putnam Investments, Putnam | Vice President |
| Management, and Putnam Retail Management | Since 2004 |
| | Director of Trustee Relations, |
| Robert R. Leveille (Born 1969) | Putnam Investments and Putnam Management |
| Vice President and Chief Compliance Officer | |
| Since 2007 | Mark C. Trenchard (Born 1962) |
| Chief Compliance Officer, Putnam Investments, | Vice President and BSA Compliance Officer |
| Putnam Management, and Putnam Retail | Since 2002 |
| Management | Director of Operational Compliance, |
| | Putnam Investments and Putnam |
| Michael J. Higgins (Born 1976) | Retail Management |
| Vice President, Treasurer, and Clerk | |
| Since 2010 | Nancy E. Florek (Born 1957) |
| Manager of Finance, Dunkin’ Brands (2008– | Vice President, Director of Proxy Voting and |
| 2010); Senior Financial Analyst, Old Mutual Asset | Corporate Governance, Assistant Clerk, |
| Management (2007–2008); Senior Financial | and Associate Treasurer |
| Analyst, Putnam Investments (1999–2007) | Since 2000 |
The principal occupations of the officers for the past five years have been with the employers as shown above although in some cases, they have held different positions with such employers. The address of each Officer is One Post Office Square, Boston, MA 02109.
| |
| 60 | George Putnam Balanced Fund |
Fund information
Founded over 75 years ago, Putnam Investments was built around the concept that a balance between risk and reward is the hallmark of a well-rounded financial program. We manage over 100 funds across income, value, blend, growth, asset allocation, absolute return, and global sector categories.
| | |
| Investment Manager | Trustees | Robert R. Leveille |
| Putnam Investment | Jameson A. Baxter, Chair | Vice President and |
| Management, LLC | Liaquat Ahamed | Chief Compliance Officer |
| One Post Office Square | Ravi Akhoury | |
| Boston, MA 02109 | Barbara M. Baumann | Michael J. Higgins |
| | Charles B. Curtis | Vice President, Treasurer, |
| Investment Sub-Manager | Robert J. Darretta | and Clerk |
| Putnam Investments Limited | Katinka Domotorffy | |
| 57–59 St James’s Street | John A. Hill | Janet C. Smith |
| London, England SW1A 1LD | Paul L. Joskow | Vice President, |
| | Kenneth R. Leibler | Principal Accounting Officer, |
| Marketing Services | Robert E. Patterson | and Assistant Treasurer |
| Putnam Retail Management | George Putnam, III | |
| One Post Office Square | Robert L. Reynolds | Susan G. Malloy |
| Boston, MA 02109 | W. Thomas Stephens | Vice President and |
| | | Assistant Treasurer |
| Custodian | Officers | |
| State Street Bank | Robert L. Reynolds | James P. Pappas |
| and Trust Company | President | Vice President |
| | | |
| Legal Counsel | Jonathan S. Horwitz | Mark C. Trenchard |
| Ropes & Gray LLP | Executive Vice President, | Vice President and |
| | Principal Executive Officer, and | BSA Compliance Officer |
| Auditors | Compliance Liaison | |
| PricewaterhouseCoopers LLP | | Nancy E. Florek |
| | Steven D. Krichmar | Vice President, Director of |
| | Vice President and | Proxy Voting and Corporate |
| | Principal Financial Officer | Governance, Assistant Clerk, |
| | | and Associate Treasurer |
| | Robert T. Burns | |
| | Vice President and | |
| | Chief Legal Officer | |
This report is for the information of shareholders of George Putnam Balanced Fund. It may also be used as sales literature when preceded or accompanied by the current prospectus, the most recent copy of Putnam’s Quarterly Performance Summary, and Putnam’s Quarterly Ranking Summary. For more recent performance, please visit putnam.com. Investors should carefully consider the investment objectives, risks, charges, and expenses of a fund, which are described in its prospectus. For this and other information or to request a prospectus or summary prospectus, call 1-800-225-1581 toll free. Please read the prospectus carefully before investing. The fund’s Statement of Additional Information contains additional information about the fund’s Trustees and is available without charge upon request by calling 1-800-225-1581.

| |
| (a) The fund’s principal executive, financial and accounting officers are employees of Putnam Investment Management, LLC, the Fund’s investment manager. As such they are subject to a comprehensive Code of Ethics adopted and administered by Putnam Investments which is designed to protect the interests of the firm and its clients. The Fund has adopted a Code of Ethics which incorporates the Code of Ethics of Putnam Investments with respect to all of its officers and Trustees who are employees of Putnam Investment Management, LLC. For this reason, the Fund has not adopted a separate code of ethics governing its principal executive, financial and accounting officers. |
| |
| (c) In July 2013, the Code of Ethics of Putnam Investment Management, LLC was amended. The changes to the Code of Ethics were as follows: (i) eliminating the requirement for employees to hold their shares of Putnam mutual funds for specified periods of time, (ii) removing the requirement to preclear transactions in certain kinds of exchange-traded funds and exchange-traded notes, although reporting of all such instruments remains required; (iii) eliminating the excessive trading rule related to employee transactions in securities requiring preclearance under the Code; (iv) adding provisions related to monitoring of employee trading; (v) changing from a set number of shares to a set dollar value of stock of mid- and large-cap companies on the Restricted List that can be purchased or sold; (vi) adding a requirement starting in March 2014 for employees to generally use certain approved brokers that provide Putnam with an electronic feed of transactions and statements for their personal brokerage accounts; and (vii) certain other changes. |
| |
| Item 3. Audit Committee Financial Expert: |
| |
| The Funds’ Audit and Compliance Committee is comprised solely of Trustees who are “independent” (as such term has been defined by the Securities and Exchange Commission (“SEC”) in regulations implementing Section 407 of the Sarbanes-Oxley Act (the “Regulations”)). The Trustees believe that each of the members of the Audit and Compliance Committee also possess a combination of knowledge and experience with respect to financial accounting matters, as well as other attributes, that qualify them for service on the Committee. In addition, the Trustees have determined that each of Mr. Leibler, Mr. Hill, Mr. Darretta and Ms. Baumann qualifies as an “audit committee financial expert” (as such term has been defined by the Regulations) based on their review of his or her pertinent experience and education. The SEC has stated that the designation or identification of a person as an audit committee financial expert pursuant to this Item 3 of Form N-CSR does not impose on such person any duties, obligations or liability that are greater than the duties, obligations and liability imposed on such person as a member of the Audit and Compliance Committee and the Board of Trustees in the absence of such designation or identification. |
| |
| Item 4. Principal Accountant Fees and Services: |
| |
| The following table presents fees billed in each of the last two fiscal years for services rendered to the fund by the fund’s independent auditor: |
| | | | | |
| Fiscal year ended | Audit Fees | Audit-Related Fees | Tax Fees | All Other Fees |
|
|
| | | | | |
| July 31, 2013 | $117,377 | $-- | $15,659 | $ — |
| July 31, 2012 | $136,346 | $-- | $15,750 | $2,356 |
| |
| For the fiscal years ended July 31, 2013 and July 31, 2012, the fund’s independent auditor billed aggregate non-audit fees in the amounts of $163,159 and $180,115 respectively, to the fund, Putnam Management and any entity controlling, controlled by or under common control with Putnam Management that provides ongoing services to the fund. |
| |
| Audit Fees represent fees billed for the fund’s last two fiscal years relating to the audit and review of the financial statements included in annual reports and registration statements, and other services that are normally provided in connection with statutory and regulatory filings or engagements. |
| |
| Audit-Related Fees represent fees billed in the fund’s last two fiscal years for services traditionally performed by the fund’s auditor, including accounting consultation for proposed transactions or concerning financial accounting and reporting standards and other audit or attest services not required by statute or regulation. |
| |
| Tax Fees represent fees billed in the fund’s last two fiscal years for tax compliance, tax planning and tax advice services. Tax planning and tax advice services include assistance with tax audits, employee benefit plans and requests for rulings or technical advice from taxing authorities. |
| |
| All Other Fees represent fees billed for services relating to an analysis of fund profitability |
| |
| Pre-Approval Policies of the Audit and Compliance Committee. The Audit and Compliance Committee of the Putnam funds has determined that, as a matter of policy, all work performed for the funds by the funds’ independent auditors will be pre-approved by the Committee itself and thus will generally not be subject to pre-approval procedures. |
| |
| The Audit and Compliance Committee also has adopted a policy to pre-approve the engagement by Putnam Management and certain of its affiliates of the funds’ independent auditors, even in circumstances where pre-approval is not required by applicable law. Any such requests by Putnam Management or certain of its affiliates are typically submitted in writing to the Committee and explain, among other things, the nature of the proposed engagement, the estimated fees, and why this work should be performed by that particular audit firm as opposed to another one. In reviewing such requests, the Committee considers, among other things, whether the provision of such services by the audit firm are compatible with the independence of the audit firm. |
| |
| The following table presents fees billed by the fund’s independent auditor for services required to be approved pursuant to paragraph (c)(7)(ii) of Rule 2-01 of Regulation S-X. |
| | | | | |
| Fiscal year ended | Audit-Related Fees | Tax Fees | All Other Fees | Total Non-Audit Fees |
|
|
| | | | | |
| July 31, 2013 | $ — | $147,500 | $ — | $ — |
| | | | | |
| July 31, 2012 | $ — | $45,000 | $ — | $ — |
| |
| Item 5. Audit Committee of Listed Registrants |
| |
| Item 6. Schedule of Investments: |
| |
| The registrant’s schedule of investments in unaffiliated issuers is included in the report to shareholders in Item 1 above. |
| |
| Item 7. Disclosure of Proxy Voting Policies and Procedures For Closed-End Management Investment Companies: |
| |
| Item 8. Portfolio Managers of Closed-End Investment Companies |
| |
| Item 9. Purchases of Equity Securities by Closed-End Management Investment Companies and Affiliated Purchasers: |
| |
| Item 10. Submission of Matters to a Vote of Security Holders: |
| |
| Item 11. Controls and Procedures: |
| |
| (a) The registrant’s principal executive officer and principal financial officer have concluded, based on their evaluation of the effectiveness of the design and operation of the registrant’s disclosure controls and procedures as of a date within 90 days of the filing date of this report, that the design and operation of such procedures are generally effective to provide reasonable assurance that information required to be disclosed by the registrant in this report is recorded, processed, summarized and reported within the time periods specified in the Commission’s rules and forms. |
| |
| (b) Changes in internal control over financial reporting: Not applicable |
| |
| (a)(1) The Code of Ethics of The Putnam Funds, which incorporates the Code of Ethics of Putnam Investments, is filed herewith. |
| |
| (a)(2) Separate certifications for the principal executive officer and principal financial officer of the registrant as required by Rule 30a-2(a) under the Investment Company Act of 1940, as amended, are filed herewith. |
| |
| (b) The certifications required by Rule 30a-2(b) under the Investment Company Act of 1940, as amended, are filed herewith. |
| |
| Pursuant to the requirements of the Securities Exchange Act of 1934 and the Investment Company Act of 1940, the registrant has duly caused this report to be signed on its behalf by the undersigned, thereunto duly authorized. |
| |
| The George Putnam Fund of Boston |
| |
| By (Signature and Title): |
| |
| /s/Janet C. Smith
Janet C. Smith
Principal Accounting Officer
|
| |
| Pursuant to the requirements of the Securities Exchange Act of 1934 and the Investment Company Act of 1940, this report has been signed below by the following persons on behalf of the registrant and in the capacities and on the dates indicated. |
| |
| By (Signature and Title): |
| |
| /s/Jonathan S. Horwitz
Jonathan S. Horwitz
Principal Executive Officer
|
| |
| By (Signature and Title): |
| |
| /s/Steven D. Krichmar
Steven D. Krichmar
Principal Financial Officer
|