CERTIFIED SHAREHOLDER REPORT OF REGISTERED MANAGEMENT INVESTMENT COMPANIES
Investment Company Act file number:
(811-00058)
Exact name of registrant as specified in charter:
The George Putnam Fund of Boston
Address of principal executive offices:
One Post Office Square, Boston, Massachusetts 02109
Name and address of agent for service:
Robert T. Burns, Vice President One Post Office Square Boston, Massachusetts 02109
Copy to:
Bryan Chegwidden, Esq. Ropes & Gray LLP 1211 Avenue of the Americas New York, New York 10036
Registrant’s telephone number, including area code:
(617) 292-1000
Date of fiscal year end:
July 31, 2014
Date of reporting period :
August 1, 2013 — July 31, 2014
Item 1. Report to Stockholders:
The following is a copy of the report transmitted to stockholders pursuant to Rule 30e-1 under the Investment Company Act of 1940:
George Putnam Balanced Fund
Annual report 7 | 31 | 14
Message from the Trustees
1
About the fund
2
Performance snapshot
4
Interview with your fund’s portfolio managers
5
Your fund’s performance
10
Your fund’s expenses
13
Terms and definitions
15
Other information for shareholders
16
Important notice regarding Putnam’s privacy policy
17
Trustee approval of management contract
18
Financial statements
23
Federal tax information
68
Shareholder meeting results
69
About the Trustees
70
Officers
72
Consider these risks before investing: Stock and bond prices may fall or fail to rise over time for several reasons, including general financial market conditions, factors related to a specific issuer or industry and, with respect to bond prices, changing market perceptions of the risk of default and changes in government intervention. These factors may also lead to increased volatility and reduced liquidity in the bond markets. Growth stocks may be more susceptible to earnings disappointments, and value stocks may fail to rebound. Bond investments are subject to interest-rate risk (the risk of bond prices falling if interest rates rise) and credit risk (the risk of an issuer defaulting on interest or principal payments). Interest-rate risk is greater for longer-term bonds, and credit risk is greater for below-investment-grade bonds. Risks associated with derivatives include increased investment exposure (which may be considered leverage) and, in the case of over-the-counter instruments, the potential inability to terminate or sell derivatives positions and the potential failure of the other party to the instrument to meet its obligations. You can lose money by investing in the fund.
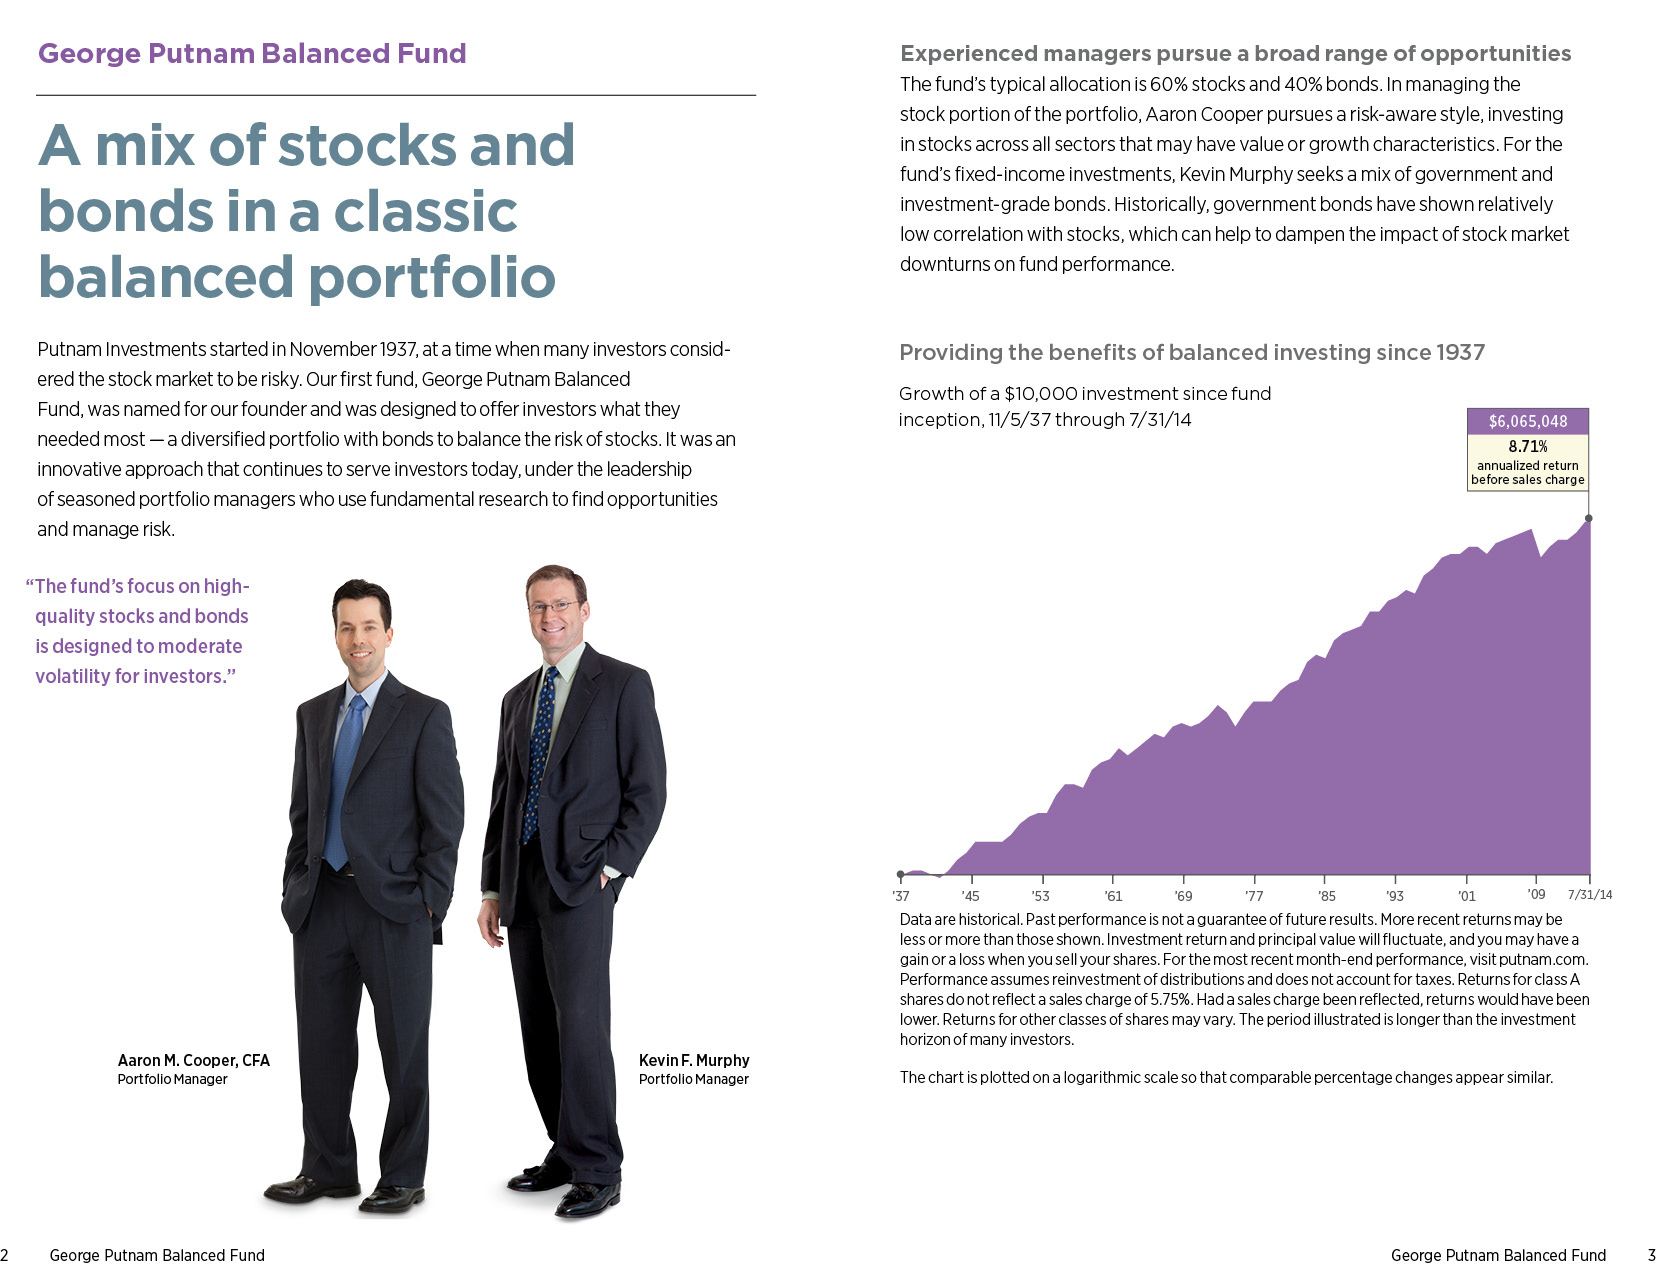
Message from the Trustees
Dear Fellow Shareholder:
The first half of 2014 proved to be an exceptional time for U.S. equities, with markets exhibiting great resilience in the face of rising geopolitical strife around the world. Then, after hovering near record lows earlier in the year, volatility spiked in mid-summer, generated by escalating military conflicts in Ukraine, Iraq, and Gaza, as well as concern that the U.S. Federal Reserve would raise interest rates sooner than expected because of an improving U.S. economy.
We believe that the fundamentals of the U.S. economy and equity markets are sound. Unemployment has declined significantly and second-quarter GDP growth has reaccelerated after the weather-related slowdown in the first three months of 2014. The stock market advance appears to be on solid footing, in our opinion, with valuations in the middle of their historic ranges, a strong corporate earnings outlook, and a rise in merger-and-acquisition activity. Moreover, government bonds have generally performed well, as have other fixed-income securities.
Abroad, however, we note headwinds. Unemployment in Europe remains stubbornly high. Also, the European Union has imposed economic sanctions on Russia as a penalty for its annexation of Ukraine’s Crimea region, and these appear to be having a negative impact on Europe’s tentative recovery, which stalled in the second quarter.
The recent uptick in volatility and modest stock market retreat serve as a clear reminder that markets will experience inevitable ups and downs. That’s why Putnam offers a wide range of strategies for all environments, including products designed to manage risk during periods of higher volatility. As we advance into the second half of the year, we encourage you to meet with your financial advisor to ensure that your portfolio is properly diversified and aligned with your objectives and tolerance for risk.
As always, thank you for investing with Putnam.
Respectfully yours,
Robert L. Reynolds President and Chief Executive Officer Putnam Investments
Jameson A. Baxter Chair, Board of Trustees
September 11, 2014
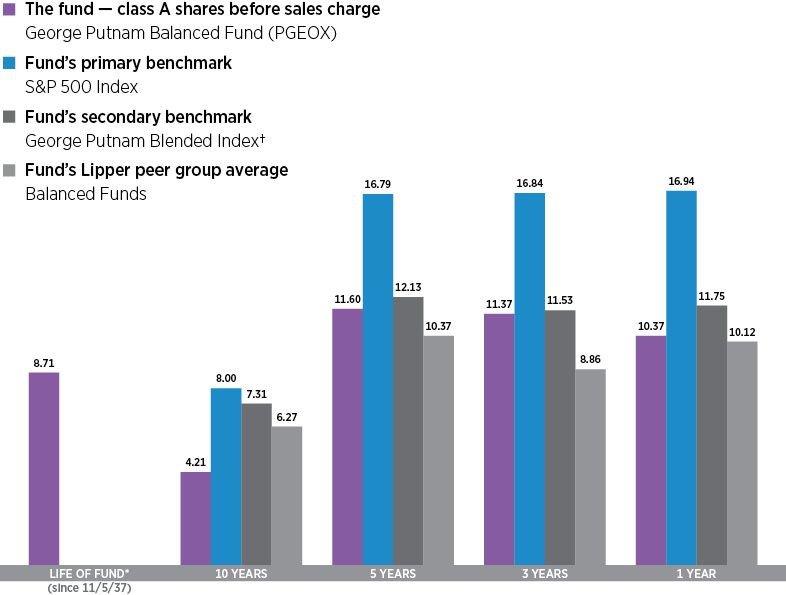
Performance snapshot
Annualized total return (%) comparison as of 7/31/14
Current performance may be lower or higher than the quoted past performance, which cannot guarantee future results. Share price, principal value, and return will fluctuate, and you may have a gain or a loss when you sell your shares. Performance of class A shares assumes reinvestment of distributions and does not account for taxes. Fund returns in the bar chart do not reflect a sales charge of 5.75%; had they, returns would have been lower. See pages 3–5 and 10–12 for additional performance information. For a portion of the periods, the fund had expense limitations, without which returns would have been lower. To obtain the most recent month-end performance, visit putnam.com.
Effective May 30, 2014, the S&P 500 Index replaced the Russell 1000 Value Index as the fund’s equity benchmark. In Putnam Management’s opinion, the securities tracked by this index more accurately reflect the types of securities that will generally be held by the fund.
*The fund’s benchmarks (S&P 500 Index and George Putnam Blended Index) were introduced on 12/31/69 and 12/31/78, respectively, and its Lipper group (Balanced Funds) was introduced on 12/31/59; they all post-date the inception of the fund’s class A shares.
†George Putnam Blended Index is an unmanaged index administered by Putnam Management, 60% of which is the S&P 500 Index and 40% of which is the Barclays U.S. Aggregate Bond Index.
4 George Putnam Balanced Fund
Interview with your fund’s portfolio managers
Aaron M. Cooper, CFA
Kevin F. Murphy
How would you describe the market environment during the 12-month period ended July 31, 2014?
Aaron: The first half of the period was generally a strong environment for stocks, as economic improvements globally helped propel corporate earnings across a variety of sectors. Bond markets, on the other hand, felt the pressure of pending changes to central bank policies. Specifically, the U.S. Federal Reserve’s decision to taper its economic stimulus program caused many to anticipate that interest rates would begin to climb, which would depress bond prices.
In light of these developments, we came into 2014 expecting economic growth to be strong and interest rates to rise, but the opposite occurred. Unusually harsh winter weather in the United States was a challenge for many sectors, and geopolitical tensions in a number of areas around the globe caused Treasury bond prices to rise and interest rates to fall.
After the pronounced slowdown in business activity in the first calendar quarter, the economy and markets recovered nicely, particularly through June. Volatility, as measured by the VIX [Chicago Board Options Exchange Volatility Index], was quite low, and the broad market moved up repeatedly to new highs. Markets effectively looked through the first quarter’s slowdown, as did the Fed, which has been steadily proceeding with its $10 billion monthly reduction in economic stimulus.
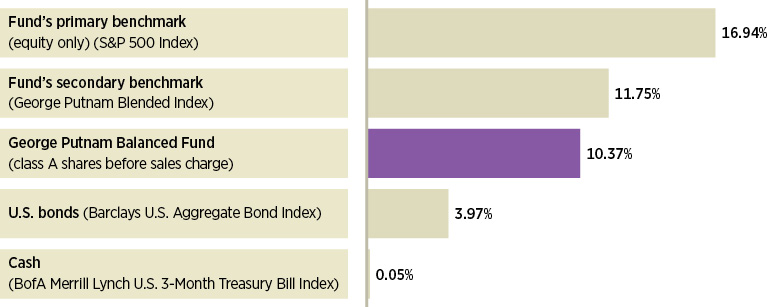
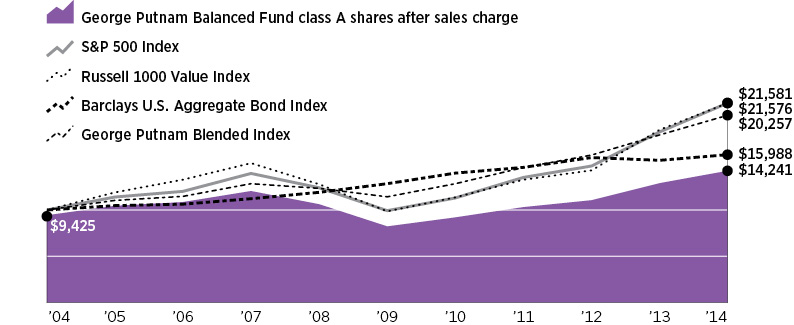
Broad market index and fund performance
This comparison shows your fund’s performance in the context of broad market indexes for the 12 months ended 7/31/14. See pages 3–4 and 10–12 for additional fund performance information. Index descriptions can be found on page 15.
George Putnam Balanced Fund 5
What factors contributed to the fund’s underperformance of its primary and secondary benchmarks during the period?
Aaron: Because of its exposure to both stocks and bonds, the fund may typically underperform its all-equity primary benchmark during rising equity markets, and this was the case for the year ended July 31, 2014. However, the fund also slightly underperformed its secondary benchmark, the George Putnam Blended Index — a 60%/40% mix of stock and bond indexes. Stock selection results among the largest companies represented in the fund’s equity portfolio were strong during the period, but these results were offset by the bond portfolio, which did not perform as well as the Barclays U.S. Aggregate Bond Index, the bond portion of the fund’s secondary benchmark, as interest rates fell.
What were some of the standout performers in the stock portion of the portfolio?
Aaron: The stocks of U.S. energy service companies Halliburton and Hi-Crush Partners, for example, benefited from a robust spending environment in the United States, while Canada-based Suncor Energy benefited from higher energy prices. In addition, the stock of U.K. pharmaceutical company AstraZeneca, which is widely perceived to have a strong pipeline of new cancer drug therapies, rose on speculation that it might be acquired by another large pharmaceuticals maker.
What were some examples of stocks or strategies that detracted from performance?
Aaron: On the negative side, we held — but de-emphasized — a number of large-company financial and technology stocks in the equity benchmark, the S&P 500
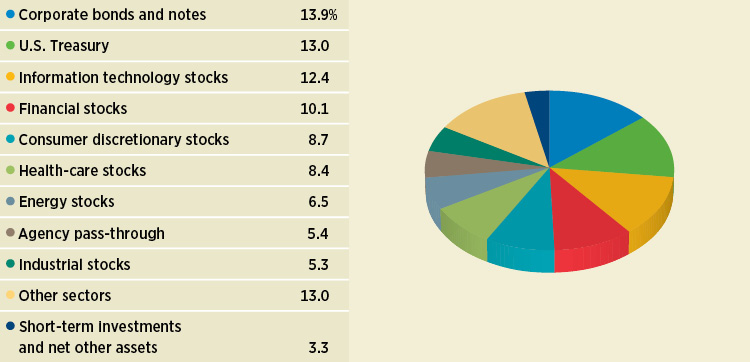
Equity and fixed-income sector allocations
Allocations are shown as a percentage of the fund’s net assets as of 7/31/14. Short-term investments and net other assets, if any, represent the market value weights of cash, derivatives, short-term securities, and other unclassified assets in the portfolio. Summary information may differ from the portfolio schedule included in the financial statements due to the inclusion of derivative securities, any interest accruals, the exclusion of as-of trades, if any, and the use of different classifications of securities for presentation purposes. Holdings and allocations may vary over time.
6 George Putnam Balanced Fund
“After the pronounced slowdown in business activity in the first calendar quarter, the economy and markets recovered nicely, particularly through June.”
Aaron Cooper
Index. Because these stocks performed well overall, the fund’s underweight exposure to them detracted from relative returns. Other stocks in which the fund had benchmark-relative overweight positions, such as U.S. retailer Bed Bath & Beyond, did not perform up to our expectations. In this case, the stock suffered as the company encountered intensifying competition from online retailers, combined with slower demand overall. Philip Morris International also was a drag on performance as its lackluster earnings weighed on its stock price.
How did interest rates, which fell for most of the second half of the period, affect the fund?
Kevin: Overall, the decline in interest rates did not help the fund, as the bond portfolio has a shorter duration — or lower interest-rate sensitivity — than the Barclays U.S. Aggregate Bond Index, the bond portion of the fund’s secondary benchmark. By contrast, the fund’s holdings of mortgage-related debt, particularly commercial mortgage-backed securities [CMBS], performed well during the period, and this offset some of the weakness from the fund’s duration positioning.
Did other factors aid performance of the bond portfolio?
Kevin: Tightening of corporate spreads, or a narrowing of the difference in yield between corporate bonds and U.S. Treasuries with similar maturity dates, generally helped the fund during the period. The bond portfolio
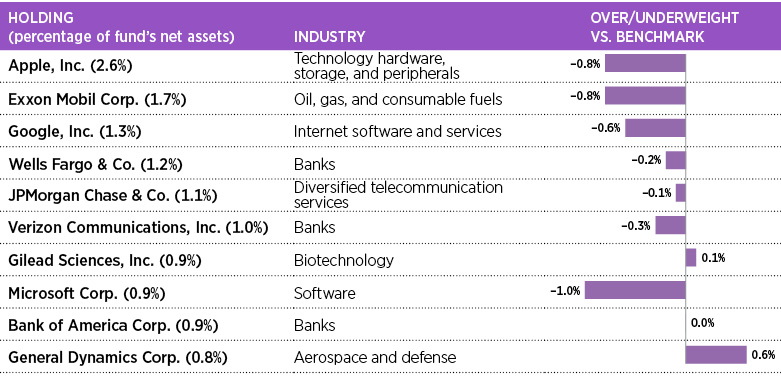
Top 10 equity holdings
This table shows the fund’s top 10 holdings by percentage of the fund’s net assets as of 7/31/14. Short-term holdings and derivatives, if any, are excluded. Holdings may vary over time.
George Putnam Balanced Fund 7
has a slightly lower quality rating than the Barclays U.S. Aggregate Bond Index, and this helped the fund as spreads of lower-quality bonds tightened the most.
Our exposure to financial companies such as banks and insurance entities also aided results. The financials sector is generally still in the process of repairing its balance sheet after the 2008 financial crisis. As bond investors, we benefit from some things that might hurt financial stocks. For example, tighter regulations require banks to hold more capital in reserve. While this may make it harder for banks to earn money, it also makes it harder for them to default on their debt obligations.
What is your outlook for the stock and bond markets in the months ahead?
Aaron: Now past the midpoint of 2014, we find ourselves in a lower-return environment than was the case for much of 2013. But our research leads us to believe that corporate earnings growth should remain robust. Combined with what we believe are middle-of-the-road valuations and improving corporate capital deployment activity, we think stronger earnings should drive positive equity returns. In our view, active management focused on finding a fundamental research advantage over consensus market opinion is a prudent way to invest and can help us to outperform the overall market.
Kevin: We also believe the economic backdrop in the quarters ahead will be supportive of riskier fixed-income assets. That said, there are global risk factors that we are watching, including recent developments in Iraq and the effect this could have on oil prices. Additionally, we continue to monitor the situation in Ukraine, as well as economic transitions under way in China. Volatility has been relatively low among most financial
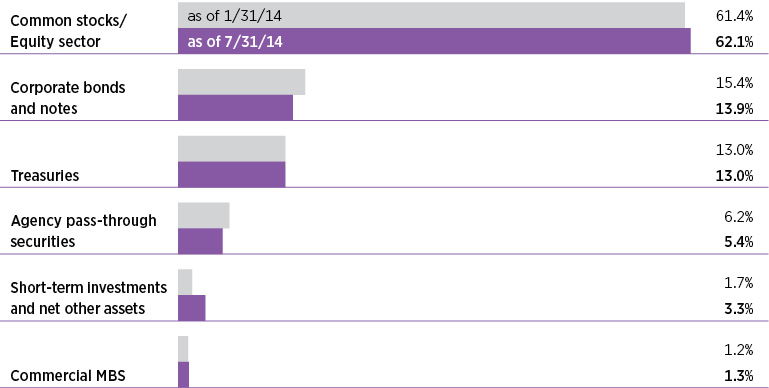
Portfolio composition comparison
This chart shows how the fund’s top weightings have changed over the past six months. Allocations are shown as a percentage of the fund’s net assets. Current period summary information may differ from the portfolio schedule included in the financial statements due to the inclusion of derivative securities, any interest accruals, the exclusion of as-of trades, if any, and the use of different classifications of securities for presentation purposes. Holdings and allocations may vary over time.
8 George Putnam Balanced Fund
assets, and spread markets have generally been moving toward pre-crisis levels. In our view, that suggests the markets may be more vulnerable to shocks and surprises.
Thank you, Kevin and Aaron, for your time and insights today.
The views expressed in this report are exclusively those of Putnam Management and are subject to change. They are not meant as investment advice.
Please note that the holdings discussed in this report may not have been held by the fund for the entire period. Portfolio composition is subject to review in accordance with the fund’s investment strategy and may vary in the future. Current and future portfolio holdings are subject to risk.
Distribution rate increase
In May 2014, the fund’s quarterly distribution rate per class A share increased from $0.053 to $0.057. The increase occurred because the portfolio generated greater distributable income as a result of being less exposed to cash positions.
Portfolio Manager Aaron M. Cooper is Director of Global Equity Research at Putnam. He holds an A.B. from Harvard University. He joined Putnam in 2011 and has been in the investment industry since 1999.
Portfolio Manager Kevin F. Murphy holds a B.S. from Columbia University. He joined Putnam in 1999 and has been in the investment industry since 1988.
IN THE NEWS
Since Russia’s annexation of Ukraine’s Crimea region in March, economic sanctions have escalated between Russia and the West. Russia’s weapons arsenal in this battle has included import bans on agricultural goods like U.S. chicken, Norwegian salmon, Dutch cheese, and Polish apples. As a minor trading partner of Russia, the United States will likely see little economic impact, but the sanctions come at a difficult time for Europe’s agricultural sector and the eurozone’s anemic economic recovery. Also harmed will be the Russian consumer, who will wind up paying more for goods as supplies dwindle. While Western sanctions earlier this year targeted Russia’s banks and its military and oil industries, Russia fired a retaliatory salvo in consumer sectors in early August, banning the import of meat, fish, dairy products, and other agricultural products from nations that have imposed sanctions on Russia. For now, disruption of the trade in Russian natural gas, vitally important to Russia’s export earnings and to Europe’s energy supply, appears to be off the table. But if the Ukrainian situation should deteriorate, sanctions in this critical sector could have far-reaching effects on both sides.
George Putnam Balanced Fund 9
Your fund’s performance
This section shows your fund’s performance, price, and distribution information for periods ended July 31, 2014, the end of its most recent fiscal year. In accordance with regulatory requirements for mutual funds, we also include performance information as of the most recent calendar quarter-end and expense information taken from the fund’s current prospectus. Performance should always be considered in light of a fund’s investment strategy. Data represent past performance. Past performance does not guarantee future results. More recent returns may be less or more than those shown. Investment return and principal value will fluctuate, and you may have a gain or a loss when you sell your shares. Performance information does not reflect any deduction for taxes a shareholder may owe on fund distributions or on the redemption of fund shares. For the most recent month-end performance, please visit the Individual Investors section at putnam.com or call Putnam at 1-800-225-1581. Class R, R5, R6, and Y shares are not available to all investors. See the Terms and Definitions section in this report for definitions of the share classes offered by your fund.
Fund performance Total return for periods ended 7/31/14
Class A
Class B
Class C
Class M
Class R
Class R5
Class R6
Class Y
(inception dates)
(11/5/37)
(4/27/92)
(7/26/99)
(12/1/94)
(1/21/03)
(12/2/13)
(12/2/13)
(3/31/94)
Before sales charge
After sales charge
Before CDSC
After CDSC
Before CDSC
After CDSC
Before sales charge
After sales charge
Net asset value
Net asset value
Net asset value
Net asset value
Annual average
(life of fund)
8.71%
8.62%
8.59%
8.59%
7.89%
7.89%
7.98%
7.93%
8.44%
8.78%
8.78%
8.78%
10 years
51.10
42.41
42.19
42.19
40.20
40.20
43.80
38.77
47.53
55.03
55.11
54.94
Annual average
4.21
3.60
3.58
3.58
3.44
3.44
3.70
3.33
3.97
4.48
4.49
4.48
5 years
73.15
63.19
66.75
64.75
66.71
66.71
68.89
62.98
71.01
75.41
75.49
75.31
Annual average
11.60
10.29
10.77
10.50
10.76
10.76
11.05
10.26
11.33
11.89
11.91
11.88
3 years
38.13
30.18
34.94
31.94
34.97
34.97
35.94
31.18
37.03
39.09
39.16
39.01
Annual average
11.37
9.19
10.51
9.68
10.51
10.51
10.78
9.47
11.07
11.62
11.64
11.60
1 year
10.37
4.02
9.51
4.51
9.50
8.50
9.75
5.91
10.08
10.67
10.73
10.61
Current performance may be lower or higher than the quoted past performance, which cannot guarantee future results. After-sales-charge returns for class A and M shares reflect the deduction of the maximum 5.75% and 3.50% sales charge, respectively, levied at the time of purchase. Class B share returns after contingent deferred sales charge (CDSC) reflect the applicable CDSC, which is 5% in the first year, declining over time to 1% in the sixth year, and is eliminated thereafter. Class C share returns after CDSC reflect a 1% CDSC for the first year that is eliminated thereafter. Class R, R5, R6, and Y shares have no initial sales charge or CDSC. Performance for class B, C, M, R, and Y shares before their inception is derived from the historical performance of class A shares, adjusted for the applicable sales charge (or CDSC) and the higher operating expenses for such shares, except for class Y shares, for which 12b-1 fees are not applicable. Performance for class R5 and R6 shares prior to their inception is derived from the historical performance of class Y shares and has not been adjusted for the lower investor servicing fees applicable to class R5 and R6 shares; had it, returns would have been higher.
For a portion of the periods, the fund had expense limitations, without which returns would have been lower.
Class B share performance reflects conversion to class A shares after eight years.
10 George Putnam Balanced Fund
Comparative index returns For periods ended 7/31/14
S&P 500 Index
Russell 1000 Value Index
Barclays U.S. Aggregate Bond Index
George Putnam Blended Index†
Lipper Balanced Funds category average‡
Annual average (life of fund)
—*
—*
—*
—*
—*
10 years
115.81%
115.76%
59.88%
102.57%
84.72%
Annual average
8.00
7.99
4.80
7.31
6.27
5 years
117.28
118.92
24.42
77.23
64.12
Annual average
16.79
16.97
4.47
12.13
10.37
3 years
59.52
62.49
9.39
38.75
29.15
Annual average
16.84
17.56
3.04
11.53
8.86
1 year
16.94
15.47
3.97
11.75
10.12
Index and Lipper results should be compared with fund performance before sales charge, before CDSC, or at net asset value.
Effective May 30, 2014, the S&P 500 Index replaced the Russell 1000 Value Index as the fund’s equity benchmark. In Putnam Management’s opinion, the securities tracked by this index more accurately reflect the types of securities that will generally be held by the fund.
* The fund’s benchmarks (S&P 500 Index and George Putnam Blended Index) were introduced on 12/31/69 and 12/31/78, respectively, the Barclays U.S. Aggregate Bond Index was introduced on 12/31/75, and the fund’s Lipper group (Balanced Funds) was introduced on 12/31/59; they all post-date the inception of the fund’s class A shares. The fund’s former primary benchmark (Russell 1000 Value Index) was introduced on 12/31/78.
† George Putnam Blended Index is an unmanaged index administered by Putnam Management, 60% of which is the S&P 500 Index and 40% of which is the Barclays U.S. Aggregate Bond Index.
‡ Over the 1-year, 3-year, 5-year, and 10-year periods ended 7/31/14, there were 683, 621, 597, and 350 funds, respectively, in this Lipper category.
Change in the value of a $10,000 investment ($9,425 after sales charge)
Cumulative total return from 7/31/04 to 7/31/14
Past performance does not indicate future results. At the end of the same time period, a $10,000 investment in the fund’s class B and class C shares would have been valued at $14,219 and $14,020, respectively, and no contingent deferred sales charges would apply. A $10,000 investment in the fund’s class M shares ($9,650 after sales charge) would have been valued at $13,877. A $10,000 investment in the fund’s class R, R5, R6, and Y shares would have been valued at $14,753, $15,503, $15,511, and $15,494, respectively.
George Putnam Balanced Fund 11
Fund price and distribution information For the 12-month period ended 7/31/14
Distributions
Class A
Class B
Class C
Class M
Class R
Class R5
Class R6
Class Y
Number
4
4
4
4
4
2
2
4
Income
$0.213
$0.098
$0.103
$0.138
$0.178
$0.129
$0.137
$0.252
Capital gains
—
—
—
—
—
—
—
—
Total
$0.213
$0.098
$0.103
$0.138
$0.178
$0.129
$0.137
$0.252
Share value
Before sales charge
After sales charge
Net asset value
Net asset value
Before sales charge
After sales charge
Net asset value
Net asset value
Net asset value
Net asset value
7/31/13
$14.81
$15.71
$14.65
$14.72
$14.62
$15.15
$14.77
—
—
$14.86
12/2/13*
—
—
—
—
—
—
—
$15.28
$15.28
—
7/31/14
16.12
17.10
15.94
16.01
15.90
16.48
16.07
16.18
16.18
16.17
Current rate (end of period)
Before sales charge
After sales charge
Net asset value
Net asset value
Before sales charge
After sales charge
Net asset value
Net asset value
Net asset value
Net asset value
Current dividend rate 1
1.41%
1.33%
0.68%
0.75%
0.96%
0.92%
1.19%
1.66%
1.76%
1.66%
Current 30-day SEC yield 2
N/A
0.83
0.12
0.13
N/A
0.36
0.63
1.17
1.24
1.13
The classification of distributions, if any, is an estimate. Before-sales-charge share value and current dividend rate for class A and M shares, if applicable, do not take into account any sales charge levied at the time of purchase. After-sales-charge share value, current dividend rate, and current 30-day SEC yield, if applicable, are calculated assuming that the maximum sales charge (5.75% for class A shares and 3.50% for class M shares) was levied at the time of purchase. Final distribution information will appear on your year-end tax forms.
* Inception date of class R5 and R6 shares.
1 Most recent distribution, including any return of capital and excluding capital gains, annualized and divided by share price before or after sales charge at period-end.
2 Based only on investment income and calculated using the maximum offering price for each share class, in accordance with SEC guidelines.
Fund performance as of most recent calendar quarter Total return for periods ended 6/30/14
Class A
Class B
Class C
Class M
Class R
Class R5
Class R6
Class Y
(inception dates)
(11/5/37)
(4/27/92)
(7/26/99)
(12/1/94)
(1/21/03)
(12/2/13)
(12/2/13)
(3/31/94)
Before sales charge
After sales charge
Before CDSC
After CDSC
Before CDSC
After CDSC
Before sales charge
After sales charge
Net asset value
Net asset value
Net asset value
Net asset value
Annual average
(life of fund)
8.74%
8.65%
8.62%
8.62%
7.92%
7.92%
8.01%
7.96%
8.47%
8.81%
8.81%
8.81%
10 years
50.84
42.16
41.93
41.93
40.05
40.05
43.65
38.62
47.37
54.75
54.83
54.76
Annual average
4.20
3.58
3.56
3.56
3.43
3.43
3.69
3.32
3.95
4.46
4.47
4.46
5 years
83.81
73.25
76.89
74.89
77.08
77.08
79.48
73.19
81.69
86.18
86.27
86.19
Annual average
12.95
11.62
12.08
11.83
12.11
12.11
12.41
11.61
12.69
13.24
13.25
13.24
3 years
37.59
29.67
34.49
31.49
34.60
34.60
35.57
30.83
36.58
38.66
38.73
38.67
Annual average
11.22
9.05
10.38
9.56
10.41
10.41
10.68
9.37
10.95
11.51
11.53
11.51
1 year
15.48
8.84
14.63
9.63
14.66
13.66
14.96
10.94
15.26
15.78
15.84
15.79
See the discussion following the fund performance table on page 10 for information about the calculation of fund performance.
12 George Putnam Balanced Fund
Your fund’s expenses
As a mutual fund investor, you pay ongoing expenses, such as management fees, distribution fees (12b-1 fees), and other expenses. Using the following information, you can estimate how these expenses affect your investment and compare them with the expenses of other funds. You may also pay one-time transaction expenses, including sales charges (loads) and redemption fees, which are not shown in this section and would have resulted in higher total expenses. For more information, see your fund’s prospectus or talk to your financial representative.
Expense ratios
Class A
Class B
Class C
Class M
Class R
Class R5
Class R6
Class Y
Total annual operating expenses for the fiscal year ended 7/31/13
1.01%
1.76%
1.76%
1.51%
1.26%
0.73%*
0.63%*
0.76%
Annualized expense ratio for the six-month period ended 7/31/14†
0.99%
1.74%
1.74%
1.49%
1.24%
0.73%
0.63%
0.74%
Fiscal-year expense information in this table is taken from the most recent prospectus, is subject to change, and may differ from that shown for the annualized expense ratio and in the financial highlights of this report.
Expenses are shown as a percentage of average net assets.
* Expenses for class R5 and R6 shares are based on the other expenses of class A shares for the fund’s last fiscal year, adjusted to reflect the lower investor servicing fees applicable to class R5 and R6 shares.
† For the fund’s most recent fiscal half year; may differ from expense ratios based on one-year data in the financial highlights.
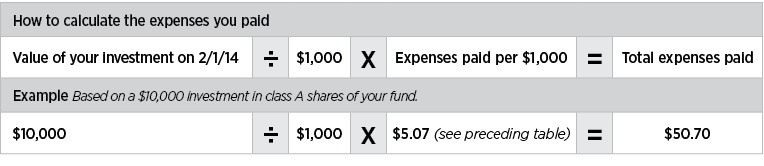
Expenses per $1,000
The following table shows the expenses you would have paid on a $1,000 investment in the fund from February 1, 2014, to July 31, 2014. It also shows how much a $1,000 investment would be worth at the close of the period, assuming actual returns and expenses.
Class A
Class B
Class C
Class M
Class R
Class R5
Class R6
Class Y
Expenses paid per $1,000*†
$5.07
$8.89
$8.89
$7.62
$6.34
$3.74
$3.23
$3.79
Ending value (after expenses)
$1,064.40
$1,060.50
$1,060.50
$1,061.40
$1,063.40
$1,066.20
$1,066.00
$1,065.60
* Expenses for each share class are calculated using the fund’s annualized expense ratio for each class, which represents the ongoing expenses as a percentage of average net assets for the six months ended 7/31/14. The expense ratio may differ for each share class.
† Expenses are calculated by multiplying the expense ratio by the average account value for the period; then multiplying the result by the number of days in the period; and then dividing that result by the number of days in the year.
George Putnam Balanced Fund 13
Estimate the expenses you paid
To estimate the ongoing expenses you paid for the six months ended July 31, 2014, use the following calculation method. To find the value of your investment on February 1, 2014, call Putnam at 1-800-225-1581.
Compare expenses using the SEC’s method
The Securities and Exchange Commission (SEC) has established guidelines to help investors assess fund expenses. Per these guidelines, the following table shows your fund’s expenses based on a $1,000 investment, assuming a hypothetical 5% annualized return. You can use this information to compare the ongoing expenses (but not transaction expenses or total costs) of investing in the fund with those of other funds. All mutual fund shareholder reports will provide this information to help you make this comparison. Please note that you cannot use this information to estimate your actual ending account balance and expenses paid during the period.
Class A
Class B
Class C
Class M
Class R
Class R5
Class R6
Class Y
Expenses paid per $1,000*†
$4.96
$8.70
$8.70
$7.45
$6.21
$3.66
$3.16
$3.71
Ending value (after expenses)
$1,019.89
$1,016.17
$1,016.17
$1,017.41
$1,018.65
$1,021.17
$1,021.67
$1,021.12
* Expenses for each share class are calculated using the fund’s annualized expense ratio for each class, which represents the ongoing expenses as a percentage of average net assets for the six months ended 7/31/14. The expense ratio may differ for each share class.
† Expenses are calculated by multiplying the expense ratio by the average account value for the six-month period; then multiplying the result by the number of days in the six-month period; and then dividing that result by the number of days in the year.
14 George Putnam Balanced Fund
Terms and definitions
Important terms
Total return shows how the value of the fund’s shares changed over time, assuming you held the shares through the entire period and reinvested all distributions in the fund.
Before sales charge, or net asset value, is the price, or value, of one share of a mutual fund, without a sales charge. Before-sales-charge figures fluctuate with market conditions, and are calculated by dividing the net assets of each class of shares by the number of outstanding shares in the class.
After sales charge is the price of a mutual fund share plus the maximum sales charge levied at the time of purchase. After-sales-charge performance figures shown here assume the 5.75% maximum sales charge for class A shares and 3.50% for class M shares.
Contingent deferred sales charge (CDSC) is generally a charge applied at the time of the redemption of class B or C shares and assumes redemption at the end of the period. Your fund’s class B CDSC declines over time from a 5% maximum during the first year to 1% during the sixth year. After the sixth year, the CDSC no longer applies. The CDSC for class C shares is 1% for one year after purchase.
Current rate is the annual rate of return earned from dividends or interest of an investment. Current rate is expressed as a percentage of the price of a security, fund share, or principal investment.
Share classes
Class A shares are generally subject to an initial sales charge and no CDSC (except on certain redemptions of shares bought without an initial sales charge).
Class B shares are not subject to an initial sales charge. They may be subject to a CDSC.
Class C shares are not subject to an initial sales charge and are subject to a CDSC only if the shares are redeemed during the first year.
Class M shares have a lower initial sales charge and a higher 12b-1 fee than class A shares and no CDSC (except on certain redemptions of shares bought without an initial sales charge).
Class R shares are not subject to an initial sales charge or CDSC and are available only to certain employer-sponsored retirement plans.
Class R5 shares and class R6 shares are not subject to an initial sales charge or CDSC, and carry no 12b-1 fee. They are only available to certain employer-sponsored retirement plans.
Class Y shares are not subject to an initial sales charge or CDSC, and carry no 12b-1 fee. They are generally only available to corporate and institutional clients and clients in other approved programs.
Comparative indexes
Barclays U.S. Aggregate Bond Index is an unmanaged index of U.S. investment-grade fixed-income securities.
BofA Merrill Lynch U.S. 3-Month Treasury Bill Index is an unmanaged index that seeks to measure the performance of U.S. Treasury bills available in the marketplace.
George Putnam Blended Index is an unmanaged index administered by Putnam Management, LLC, 60% of which is the S&P 500 Index and 40% of which is the Barclays U.S. Aggregate Bond Index.
Russell 1000 Value Index is an unmanaged index of those companies in the large-cap Russell 1000 Index chosen for their value orientation.
S&P 500 Index is an unmanaged index of common stock performance.
Indexes assume reinvestment of all distributions and do not account for fees. Securities and performance of a fund and an index will differ. You cannot invest directly in an index.
George Putnam Balanced Fund 15
Lipper is a third-party industry-ranking entity that ranks mutual funds. Its rankings do not reflect sales charges. Lipper rankings are based on total return at net asset value relative to other funds that have similar current investment styles or objectives as determined by Lipper. Lipper may change a fund’s category assignment at its discretion. Lipper category averages reflect performance trends for funds within a category.
Other information for shareholders
Proxy voting
Putnam is committed to managing our mutual funds in the best interests of our shareholders. The Putnam funds’ proxy voting guidelines and procedures, as well as information regarding how your fund voted proxies relating to portfolio securities during the 12-month period ended June 30, 2014, are available in the Individual Investors section of putnam.com, and on the Securities and Exchange Commission (SEC) website, www.sec.gov. If you have questions about finding forms on the SEC’s website, you may call the SEC at 1-800-SEC-0330. You may also obtain the Putnam funds’ proxy voting guidelines and procedures at no charge by calling Putnam’s Shareholder Services at 1-800-225-1581.
Fund portfolio holdings
The fund will file a complete schedule of its portfolio holdings with the SEC for the first and third quarters of each fiscal year on Form N-Q. Shareholders may obtain the fund’s Forms N-Q on the SEC’s website at www.sec.gov. In addition, the fund’s Forms N-Q may be reviewed and copied at the SEC’s Public Reference Room in Washington, D.C. You may call the SEC at 1-800-SEC-0330 for information about the SEC’s website or the operation of the Public Reference Room.
Trustee and employee fund ownership
Putnam employees and members of the Board of Trustees place their faith, confidence, and, most importantly, investment dollars in Putnam mutual funds. As of July 31, 2014, Putnam employees had approximately $486,000,000 and the Trustees had approximately $134,000,000 invested in Putnam mutual funds. These amounts include investments by the Trustees’ and employees’ immediate family members as well as investments through retirement and deferred compensation plans.
16 George Putnam Balanced Fund
Important notice regarding Putnam’s privacy policy
In order to conduct business with our shareholders, we must obtain certain personal information such as account holders’ names, addresses, Social Security numbers, and dates of birth. Using this information, we are able to maintain accurate records of accounts and transactions.
It is our policy to protect the confidentiality of our shareholder information, whether or not a shareholder currently owns shares of our funds. In particular, it is our policy not to sell information about you or your accounts to outside marketing firms. We have safeguards in place designed to prevent unauthorized access to our computer systems and procedures to protect personal information from unauthorized use.
Under certain circumstances, we must share account information with outside vendors who provide services to us, such as mailings and proxy solicitations. In these cases, the service providers enter into confidentiality agreements with us, and we provide only the information necessary to process transactions and perform other services related to your account. Finally, it is our policy to share account information with your financial representative, if you’ve listed one on your Putnam account.
George Putnam Balanced Fund 17
Trustee approval of management contract
General conclusions
The Board of Trustees of the Putnam funds oversees the management of each fund and, as required by law, determines annually whether to approve the continuance of your fund’s management contract with Putnam Investment Management, LLC (“Putnam Management”) and the sub-management contract with respect to your fund between Putnam Management and its affiliate, Putnam Investments Limited (“PIL”). The Board of Trustees, with the assistance of its Contract Committee, requests and evaluates all information it deems reasonably necessary under the circumstances in connection with its annual contract review. The Contract Committee consists solely of Trustees who are not “interested persons” (as this term is defined in the Investment Company Act of 1940, as amended (the “1940 Act”)) of the Putnam funds (“Independent Trustees”).
At the outset of the review process, members of the Board’s independent staff and independent legal counsel met with representatives of Putnam Management to review the annual contract review materials furnished to the Contract Committee during the course of the previous year’s review and to discuss possible changes in these materials that might be necessary or desirable for the coming year. Following these discussions and in consultation with the Contract Committee, the Independent Trustees’ independent legal counsel requested that Putnam Management furnish specified information, together with any additional information that Putnam Management considered relevant, to the Contract Committee. Over the course of several months ending in June 2014, the Contract Committee met on a number of occasions with representatives of Putnam Management, and separately in executive session, to consider the information that Putnam Management provided, as well as supplemental information provided in response to additional requests made by the Contract Committee. Throughout this process, the Contract Committee was assisted by the members of the Board’s independent staff and by independent legal counsel for the Putnam funds and the Independent Trustees.
In May 2014, the Contract Committee met in executive session to discuss and consider its preliminary recommendations with respect to the continuance of the contracts. At the Trustees’ June 20, 2014 meeting, the Contract Committee met in executive session with the other Independent Trustees to review a summary of the key financial, performance and other data that the Contract Committee considered in the course of its review. The Contract Committee then presented its written report, which summarized the key factors that the Committee had considered and set forth its final recommendations. The Contract Committee then recommended, and the Independent Trustees approved, the continuance of your fund’s management and sub-management contracts, effective July 1, 2014. (Because PIL is an affiliate of Putnam Management and Putnam Management remains fully responsible for all services provided by PIL, the Trustees have not attempted to evaluate PIL as a separate entity, and all subsequent references to Putnam Management below should be deemed to include reference to PIL as necessary or appropriate in the context.)
The Independent Trustees’ approval was based on the following conclusions:
• That the fee schedule in effect for your fund represented reasonable compensation in light of the nature and quality of the services being provided to the fund, the fees paid by competitive funds, and the costs incurred by Putnam Management in providing services to the fund; and
18 George Putnam Balanced Fund
• That the fee schedule in effect for your fund represented an appropriate sharing between fund shareholders and Putnam Management of such economies of scale as may exist in the management of the fund at current asset levels.
These conclusions were based on a comprehensive consideration of all information provided to the Trustees and were not the result of any single factor. Some of the factors that figured particularly in the Trustees’ deliberations and how the Trustees considered these factors are described below, although individual Trustees may have evaluated the information presented differently, giving different weights to various factors. It is also important to recognize that the management arrangements for your fund and the other Putnam funds are the result of many years of review and discussion between the Independent Trustees and Putnam Management, that some aspects of the arrangements may receive greater scrutiny in some years than others, and that the Trustees’ conclusions may be based, in part, on their consideration of fee arrangements in previous years. For example, with some minor exceptions, the current fee arrangements under the management contracts for the Putnam funds were implemented at the beginning of 2010 following extensive review by the Contract Committee and discussions with representatives of Putnam Management, as well as approval by shareholders. Shareholders also voted overwhelmingly to approve these fee arrangements in early 2014, when they were asked to approve new management contracts (with the same fees and substantially identical other provisions) following the possible termination of the previous management contracts as a result of the death of the Honorable Paul G. Desmarais. (Mr. Desmarais, both directly and through holding companies, controlled a majority of the voting shares of Power Corporation of Canada, which (directly and indirectly) is the majority owner of Putnam Management. Mr. Desmarais’ voting control of shares of Power Corporation of Canada was transferred to The Desmarais Family Residuary Trust upon his death and this transfer, as a technical matter, may have constituted an “assignment” within the meaning of the 1940 Act, causing the Putnam funds’ management contracts to terminate automatically.)
Management fee schedules and total expenses
The Trustees reviewed the management fee schedules in effect for all Putnam funds, including fee levels and breakpoints. The Trustees also reviewed the total expenses of each Putnam fund, recognizing that in most cases management fees represented the major, but not the sole, determinant of total costs to shareholders.
In reviewing fees and expenses, the Trustees generally focus their attention on material changes in circumstances — for example, changes in assets under management, changes in a fund’s investment style, changes in Putnam Management’s operating costs or profitability, or changes in competitive practices in the mutual fund industry — that suggest that consideration of fee changes might be warranted. The Trustees concluded that the circumstances did not warrant changes to the management fee structure of your fund.
Under its management contract, your fund has the benefit of breakpoints in its management fee schedule that provide shareholders with economies of scale in the form of reduced fee levels as assets under management in the Putnam family of funds increase. The Trustees concluded that the fee schedule in effect for your fund represented an appropriate sharing of economies of scale between fund shareholders and Putnam Management.
As in the past, the Trustees also focused on the competitiveness of each fund’s total expense ratio. In order to ensure that expenses of the Putnam funds continue to meet competitive standards, the Trustees and Putnam
George Putnam Balanced Fund 19
Management have implemented certain expense limitations. These expense limitations were: (i) a contractual expense limitation applicable to all retail open-end funds of 32 basis points on investor servicing fees and expenses and (ii) a contractual expense limitation applicable to all open-end funds of 20 basis points on so-called “other expenses” (i.e., all expenses exclusive of management fees, investor servicing fees, distribution fees, investment-related expenses, interest, taxes, brokerage commissions, extraordinary expenses and acquired fund fees and expenses). These expense limitations serve in particular to maintain competitive expense levels for funds with large numbers of small shareholder accounts and funds with relatively small net assets. Most funds, including your fund, had sufficiently low expenses that these expense limitations did not apply. Putnam Management’s support for these expense limitation arrangements was an important factor in the Trustees’ decision to approve the continuance of your fund’s management and sub-management contracts.
The Trustees reviewed comparative fee and expense information for a custom group of competitive funds selected by Lipper Inc. (“Lipper”). This comparative information included your fund’s percentile ranking for effective management fees and total expenses (excluding any applicable 12b-1 fee), which provides a general indication of your fund’s relative standing. In the custom peer group, your fund ranked in the first quintile in effective management fees (determined for your fund and the other funds in the custom peer group based on fund asset size and the applicable contractual management fee schedule) and in the second quintile in total expenses (excluding any applicable 12b-1 fees) as of December 31, 2013 (the first quintile representing the least expensive funds and the fifth quintile the most expensive funds). The fee and expense data reported by Lipper as of December 31, 2013 reflected the most recent fiscal year-end data available in Lipper’s database at that time.
In connection with their review of the management fees and total expenses of the Putnam funds, the Trustees also reviewed the costs of the services provided and the profits realized by Putnam Management and its affiliates from their contractual relationships with the funds. This information included trends in revenues, expenses and profitability of Putnam Management and its affiliates relating to the investment management, investor servicing and distribution services provided to the funds. In this regard, the Trustees also reviewed an analysis of Putnam Management’s revenues, expenses and profitability, allocated on a fund-by-fund basis, with respect to the funds’ management, distribution, and investor servicing contracts. For each fund, the analysis presented information about revenues, expenses and profitability for each of the agreements separately and for the agreements taken together on a combined basis. The Trustees concluded that, at current asset levels, the fee schedules in place represented reasonable compensation for the services being provided and represented an appropriate sharing of such economies of scale as may exist in the management of the Putnam funds at that time.
The information examined by the Trustees as part of their annual contract review for the Putnam funds has included for many years information regarding fees charged by Putnam Management and its affiliates to institutional clients such as defined benefit pension plans, college endowments, and the like. This information included comparisons of those fees with fees charged to the Putnam funds, as well as an assessment of the differences in the services provided to these different types of clients. The Trustees observed that the differences in fee rates between institutional clients and mutual funds are by no means uniform when examined by individual asset sectors, suggesting that
20 George Putnam Balanced Fund
differences in the pricing of investment management services to these types of clients may reflect historical competitive forces operating in separate markets. The Trustees considered the fact that in many cases fee rates across different asset classes are higher on average for mutual funds than for institutional clients, as well as the differences between the services that Putnam Management provides to the Putnam funds and those that it provides to its institutional clients. The Trustees did not rely on these comparisons to any significant extent in concluding that the management fees paid by your fund are reasonable.
Investment performance
The quality of the investment process provided by Putnam Management represented a major factor in the Trustees’ evaluation of the quality of services provided by Putnam Management under your fund’s management contract. The Trustees were assisted in their review of the Putnam funds’ investment process and performance by the work of the investment oversight committees of the Trustees, which meet on a regular basis with the funds’ portfolio teams and with the Chief Investment Officer and other senior members of Putnam Management’s Investment Division throughout the year. The Trustees concluded that Putnam Management generally provides a high-quality investment process — based on the experience and skills of the individuals assigned to the management of fund portfolios, the resources made available to them, and in general Putnam Management’s ability to attract and retain high-quality personnel — but also recognized that this does not guarantee favorable investment results for every fund in every time period.
The Trustees considered that 2013 was a year of strong competitive performance for many of the Putnam funds, with only a relatively small number of exceptions. They noted that this strong performance was exemplified by the fact that the Putnam funds were recognized by Barron’s as the second-best performing mutual fund complex for both 2013 and the five-year period ended December 31, 2013. They also noted, however, the disappointing investment performance of some funds for periods ended December 31, 2013 and considered information provided by Putnam Management regarding the factors contributing to the underperformance and actions being taken to improve the performance of these particular funds. The Trustees indicated their intention to continue to monitor performance trends to assess the effectiveness of these efforts and to evaluate whether additional actions to address areas of underperformance are warranted.
For purposes of evaluating investment performance, the Trustees generally focus on competitive industry rankings for the one-year, three-year and five-year periods. For a number of Putnam funds with relatively unique investment mandates for which meaningful competitive performance rankings are not considered available, the Trustees evaluated performance based on comparisons of their returns with the returns of selected investment benchmarks. In the case of your fund, the Trustees considered that its class A share cumulative total return performance at net asset value was in the following quartiles of its Lipper peer group (Lipper Balanced Funds) for the one-year, three-year and five-year periods ended December 31, 2013 (the first quartile representing the best-performing funds and the fourth quartile the worst-performing funds):
One-year period
2nd
Three-year period
1st
Five-year period
1st
Over the one-year, three-year and five-year periods ended December 31, 2013, there were 687, 635 and 600 funds, respectively, in your fund’s Lipper peer group. (When considering performance information, shareholders should be mindful that past performance is not a guarantee of future results.)
George Putnam Balanced Fund 21
Brokerage and soft-dollar allocations; investor servicing
The Trustees considered various potential benefits that Putnam Management may receive in connection with the services it provides under the management contract with your fund. These include benefits related to brokerage allocation and the use of soft dollars, whereby a portion of the commissions paid by a fund for brokerage may be used to acquire research services that are expected to be useful to Putnam Management in managing the assets of the fund and of other clients. Subject to policies established by the Trustees, soft dollars generated by these means are used primarily to acquire brokerage and research services that enhance Putnam Management’s investment capabilities and supplement Putnam Management’s internal research efforts. However, the Trustees noted that a portion of available soft dollars continues to be used to pay fund expenses. The Trustees indicated their continued intent to monitor regulatory and industry developments in this area with the assistance of their Brokerage Committee and also indicated their continued intent to monitor the allocation of the Putnam funds’ brokerage in order to ensure that the principle of seeking best price and execution remains paramount in the portfolio trading process.
Putnam Management may also receive benefits from payments that the funds make to Putnam Management’s affiliates for investor or distribution services. In conjunction with the annual review of your fund’s management and sub-management contracts, the Trustees reviewed your fund’s investor servicing agreement with Putnam Investor Services, Inc. (“PSERV”) and its distributor’s contracts and distribution plans with Putnam Retail Management Limited Partnership (“PRM”), both of which are affiliates of Putnam Management. The Trustees concluded that the fees payable by the funds to PSERV and PRM, as applicable, for such services are reasonable in relation to the nature and quality of such services, the fees paid by competitive funds, and the costs incurred by PSERV and PRM, as applicable, in providing such services.
22 George Putnam Balanced Fund
Financial statements
A note about your fund’s auditors
Between July 18, 2013 and December 16, 2013, which included a portion of your fund’s fiscal year, a non-U.S. member firm in PricewaterhouseCoopers LLP’s (“PwC”) global network of firms had an investment in certain non-U.S. funds that became affiliated with Putnam Investments as a result of the acquisition of the funds’ advisor by Putnam’s parent company, Great-West Lifeco Inc. The investment consisted of pension plan assets for the benefit of the member firm’s personnel. This investment is inconsistent with the SEC’s independence rules applicable to auditors. Although upon the disposition of the investment by the member firm on December 16, 2013, PwC and its affiliates took all necessary steps to eliminate this issue, the requirements of the SEC’s independence rules were not met for your fund’s fiscal year because the SEC’s rules require an audit firm to be independent for the entire fiscal year under audit. Based on its knowledge of the facts and its experience with PwC, the Audit and Compliance Committee of your fund’s Board of Trustees concluded that the investment by the PwC member firm would not affect PwC���s ability to render an objective audit opinion to your fund. Based on this conclusion and consideration of the potential risks that the disruption of a change of auditor could present, the Audit and Compliance Committee determined that PwC should continue to act as auditor for your fund.
These sections of the report, as well as the accompanying Notes, preceded by the Report of Independent Registered Public Accounting Firm, constitute the fund’s financial statements.
The fund’s portfolio lists all the fund’s investments and their values as of the last day of the reporting period. Holdings are organized by asset type and industry sector, country, or state to show areas of concentration and diversification.
Statement of assets and liabilities shows how the fund’s net assets and share price are determined. All investment and non-investment assets are added together. Any unpaid expenses and other liabilities are subtracted from this total. The result is divided by the number of shares to determine the net asset value per share, which is calculated separately for each class of shares. (For funds with preferred shares, the amount subtracted from total assets includes the liquidation preference of preferred shares.)
Statement of operations shows the fund’s net investment gain or loss. This is done by first adding up all the fund’s earnings — from dividends and interest income — and subtracting its operating expenses to determine net investment income (or loss). Then, any net gain or loss the fund realized on the sales of its holdings — as well as any unrealized gains or losses over the period — is added to or subtracted from the net investment result to determine the fund’s net gain or loss for the fiscal year.
Statement of changes in net assets shows how the fund’s net assets were affected by the fund’s net investment gain or loss, by distributions to shareholders, and by changes in the number of the fund’s shares. It lists distributions and their sources (net investment income or realized capital gains) over the current reporting period and the most recent fiscal year-end. The distributions listed here may not match the sources listed in the Statement of operations because the distributions are determined on a tax basis and may be paid in a different period from the one in which they were earned.
Financial highlights provide an overview of the fund’s investment results, per-share distributions, expense ratios, net investment income ratios, and portfolio turnover in one summary table, reflecting the five most recent reporting periods. In a semiannual report, the highlights table also includes the current reporting period.
George Putnam Balanced Fund 23
Report of Independent Registered Public Accounting Firm
To the Trustees and Shareholders of George Putnam Balanced Fund:
In our opinion, the accompanying statement of assets and liabilities, including the portfolio, and the related statements of operations and of changes in net assets and the financial highlights present fairly, in all material respects, the financial position of George Putnam Balanced Fund (the “fund”) at July 31, 2014, and the results of its operations, the changes in its net assets and the financial highlights for each of the periods indicated, in conformity with accounting principles generally accepted in the United States of America. These financial statements and financial highlights (hereafter referred to as “financial statements”) are the responsibility of the fund’s management. Our responsibility is to express an opinion on these financial statements based on our audits. We conducted our audits of these financial statements in accordance with the standards of the Public Company Accounting Oversight Board (United States). Those standards require that we plan and perform the audit to obtain reasonable assurance about whether the financial statements are free of material misstatement. An audit includes examining, on a test basis, evidence supporting the amounts and disclosures in the financial statements, assessing the accounting principles used and significant estimates made by management, and evaluating the overall financial statement presentation. We believe that our audits, which included confirmation of investments owned at July 31, 2014 by correspondence with the custodian, brokers, and transfer agent, provide a reasonable basis for our opinion.
PricewaterhouseCoopers LLP Boston, Massachusetts September 11, 2014
24 George Putnam Balanced Fund
The fund’s portfolio 7/31/14
COMMON STOCKS (62.2%)*
Shares
Value
Basic materials (2.6%)
Air Products & Chemicals, Inc.
12,424
$1,639,347
Airgas, Inc.
2,109
225,494
Alcoa, Inc.
27,121
444,513
Allegheny Technologies, Inc.
3,199
120,442
Axiall Corp.
21,759
931,938
Cemex SAB de CV ADR (Mexico) †
13,696
172,022
Chemtura Corp. †
24,449
568,684
Constellium NV Class A (Netherlands) †
12,988
376,392
Croda International PLC (United Kingdom)
12,382
439,306
Dow Chemical Co. (The)
88,189
4,503,812
Fortune Brands Home & Security, Inc.
63,281
2,391,389
Freeport-McMoRan, Inc. (Indonesia)
55,480
2,064,966
Hi-Crush Partners LP (Units)
22,812
1,395,410
Huntsman Corp.
59,618
1,553,049
Martin Marietta Materials, Inc.
5,023
624,007
MeadWestvaco Corp.
52,908
2,211,554
Monsanto Co.
39,372
4,452,579
Newmont Mining Corp.
17,084
425,562
Nucor Corp.
10,364
520,480
Packaging Corp. of America
14,559
963,223
Praxair, Inc.
12,358
1,583,554
S&W Seed Co. †
35,365
225,982
Sealed Air Corp.
35,827
1,150,763
Solvay SA (Belgium)
4,838
781,186
Symrise AG (Germany)
37,808
1,978,892
Tronox, Ltd. Class A
23,163
614,746
Wacker Chemie AG (Germany)
6,707
778,512
33,137,804
Capital goods (2.5%)
Airbus Group NV (France)
11,734
678,578
Allegion PLC (Ireland)
3,333
171,416
Eaton Corp PLC
33,268
2,259,563
Embraer SA ADR (Brazil)
2,647
100,692
Gaztransport Et Technigaz SA (France)
23,149
1,457,666
General Dynamics Corp.
90,956
10,620,932
HD Supply Holdings, Inc. †
19,094
485,369
Northrop Grumman Corp.
53,348
6,576,208
Raytheon Co.
37,590
3,412,044
Rockwell Collins, Inc.
21,453
1,571,861
Trinseo SA †
29,809
496,916
United Technologies Corp.
23,716
2,493,737
WESCO International, Inc. †
36,427
2,859,155
33,184,137
Communication services (3.2%)
American Tower Corp. R
55,625
5,250,444
Comcast Corp. Class A
164,111
8,817,684
Corning, Inc.
47,634
936,008
George Putnam Balanced Fund 25
COMMON STOCKS (62.2%)* cont.
Shares
Value
Communication services cont.
DISH Network Corp. Class A †
47,507
$2,938,782
Liberty Global PLC Ser. C (United Kingdom)
173,571
6,941,104
Time Warner Cable, Inc.
28,132
4,081,953
Verizon Communications, Inc.
262,877
13,254,258
42,220,233
Communications equipment (0.2%)
Cisco Systems, Inc.
120,329
3,035,901
3,035,901
Computers (3.6%)
Anixter International, Inc.
26,420
2,271,327
Apple, Inc.
353,900
33,822,223
EMC Corp.
98,479
2,885,434
Hewlett-Packard Co.
44,289
1,577,131
NetApp, Inc.
22,691
881,318
SanDisk Corp.
28,685
2,630,701
Seagate Technology PLC
7,717
452,216
ServiceNow, Inc. †
12,220
718,536
Western Digital Corp.
13,485
1,346,208
46,585,094
Conglomerates (0.8%)
General Electric Co.
27,555
693,008
Siemens AG (Germany)
48,211
5,964,346
Tyco International, Ltd.
80,267
3,463,521
10,120,875
Consumer cyclicals (7.3%)
Advance Auto Parts, Inc.
3,600
435,996
Amazon.com, Inc. †
22,487
7,038,206
Bed Bath & Beyond, Inc. †
47,900
3,031,590
Brunswick Corp.
24,500
988,085
CaesarStone Sdot-Yam, Ltd. (Israel)
20,700
897,552
CBS Corp. Class B (non-voting shares)
61,103
3,472,482
Ctrip.com International, Ltd. ADR (China) †
30,255
1,937,228
D.R. Horton, Inc.
50,571
1,046,820
Dollar General Corp. †
34,751
1,919,298
Five Below, Inc. †
53,500
1,959,170
Ford Motor Co.
50,200
854,404
Gap, Inc. (The)
40,214
1,612,984
General Motors Co.
59,400
2,008,908
Hanesbrands, Inc.
12,705
1,241,406
Hilton Worldwide Holdings, Inc. †
107,005
2,590,591
Home Depot, Inc. (The)
67,196
5,432,796
Johnson Controls, Inc.
16,527
780,735
Live Nation Entertainment, Inc. †
114,972
2,668,500
Macy’s, Inc.
40,976
2,368,003
MasterCard, Inc. Class A
54,947
4,074,320
Michael Kors Holdings, Ltd. †
23,608
1,923,580
NIKE, Inc. Class B
58,903
4,543,188
Office Depot, Inc. †
343,678
1,721,827
Penn National Gaming, Inc. †
65,700
688,536
Priceline Group, Inc. (The) †
4,800
5,963,760
26 George Putnam Balanced Fund
COMMON STOCKS (62.2%)* cont.
Shares
Value
Consumer cyclicals cont.
PulteGroup, Inc.
114,852
$2,027,138
RE/MAX Holdings, Inc. Class A
57,415
1,682,260
Time Warner, Inc.
60,951
5,060,151
TiVo, Inc. †
64,399
866,811
TJX Cos., Inc. (The)
64,490
3,436,672
Tumi Holdings, Inc. †
137,693
2,902,568
Twenty-First Century Fox, Inc.
64,054
2,029,231
Vail Resorts, Inc.
21,100
1,593,050
Wal-Mart Stores, Inc.
51,404
3,782,306
Walt Disney Co. (The)
66,324
5,695,904
Whirlpool Corp.
18,967
2,705,453
Wyndham Worldwide Corp.
31,600
2,387,380
95,368,889
Consumer staples (5.6%)
58.Com, Inc. ADR (China) †
5,951
292,492
Altria Group, Inc.
109,819
4,458,651
Annie’s, Inc. †
10,790
314,852
Bloomin’ Brands, Inc. †
14,600
286,014
Bright Horizons Family Solutions, Inc. †
37,600
1,563,032
Coca-Cola Enterprises, Inc.
29,110
1,323,050
Colgate-Palmolive Co.
74,551
4,726,532
Costco Wholesale Corp.
33,752
3,967,210
Coty, Inc. Class A
333,564
5,707,280
CVS Caremark Corp.
57,999
4,428,803
Dr. Pepper Snapple Group, Inc.
38,730
2,275,775
Dunkin’ Brands Group, Inc.
48,092
2,061,223
Energizer Holdings, Inc.
2,200
252,472
General Mills, Inc.
2,941
147,491
Groupon, Inc. †
106,735
690,575
Hershey Co. (The)
12,568
1,107,869
JM Smucker Co. (The)
8,599
856,804
Kellogg Co.
23,222
1,389,372
Keurig Green Mountain, Inc.
6,400
763,392
Kraft Foods Group, Inc.
29,681
1,590,456
Lorillard, Inc.
26,392
1,596,188
Mead Johnson Nutrition Co.
21,913
2,003,725
Mondelez International, Inc. Class A
84,839
3,054,204
Monster Beverage Corp. †
32,500
2,078,700
Netflix, Inc. †
1,035
437,515
PepsiCo, Inc.
91,158
8,031,020
Philip Morris International, Inc.
125,365
10,281,184
Pinnacle Foods, Inc.
16,806
506,364
Starbucks Corp.
37,615
2,921,933
Walgreen Co.
41,368
2,844,877
Whole Foods Market, Inc.
38,063
1,454,768
73,413,823
Electronics (2.0%)
Broadcom Corp. Class A
42,741
1,635,271
Honeywell International, Inc.
42,386
3,892,306
George Putnam Balanced Fund 27
COMMON STOCKS (62.2%)* cont.
Shares
Value
Electronics cont.
Intel Corp.
224,485
$7,607,797
L-3 Communications Holdings, Inc.
58,048
6,092,718
Micron Technology, Inc. †
154,152
4,709,344
Texas Instruments, Inc.
42,277
1,955,311
25,892,747
Energy (6.4%)
Aker Solutions ASA (Norway)
151,522
2,225,993
Antero Resources Corp. †
40,763
2,354,471
Cameron International Corp. †
6,138
435,246
Cheniere Energy, Inc. †
20,560
1,454,826
CONSOL Energy, Inc.
20,697
803,458
Dril-Quip, Inc. †
5,601
564,413
EnCana Corp. (Canada)
174,924
3,769,612
EOG Resources, Inc.
77,702
8,503,707
EP Energy Corp. Class A †
162,400
3,248,000
Exxon Mobil Corp.
222,500
22,014,150
Halliburton Co.
91,761
6,330,591
Noble Energy, Inc.
54,200
3,603,758
QEP Resources, Inc.
163,297
5,396,966
Rowan Cos. PLC Class A
22,864
697,809
Royal Dutch Shell PLC ADR (United Kingdom)
67,230
5,501,431
Schlumberger, Ltd.
66,026
7,156,558
SPT Energy Group, Inc. (China)
1,173,320
617,429
Suncor Energy, Inc. (Canada)
112,700
4,628,588
Transocean, Ltd. (Switzerland)
27,153
1,095,352
Valero Energy Corp.
57,134
2,902,407
Weatherford International PLC †
18,232
407,850
83,712,615
Financials (9.9%)
Altisource Residential Corp. R
47,900
1,110,801
American Express Co.
66,400
5,843,200
American International Group, Inc.
113,200
5,884,136
Ameriprise Financial, Inc.
25,100
3,001,960
Assured Guaranty, Ltd.
122,569
2,735,740
AvalonBay Communities, Inc. R
16,500
2,443,320
Bank of America Corp.
749,118
11,424,050
Berkshire Hathaway, Inc. Class B †
18,087
2,268,652
Capital One Financial Corp.
17,000
1,352,180
Carlyle Group LP (The)
98,400
3,284,592
CBRE Group, Inc. Class A †
23,800
733,992
Charles Schwab Corp. (The)
207,200
5,749,800
Citigroup, Inc.
106,750
5,221,143
CME Group, Inc.
71,822
5,310,519
Discover Financial Services
43,864
2,678,336
Equity Lifestyle Properties, Inc. R
18,100
801,649
Fifth Third Bancorp
156,185
3,198,669
Gaming and Leisure Properties, Inc. R
46,916
1,579,662
General Growth Properties R
44,200
1,032,954
Genworth Financial, Inc. Class A †
189,797
2,486,341
28 George Putnam Balanced Fund
COMMON STOCKS (62.2%)* cont.
Shares
Value
Financials cont.
Hartford Financial Services Group, Inc. (The)
107,946
$3,687,435
Invesco, Ltd.
20,500
771,415
JPMorgan Chase & Co.
242,400
13,979,208
KeyCorp
185,600
2,513,024
KKR & Co. LP
174,900
4,008,708
Morgan Stanley
15,140
489,628
Plum Creek Timber Co., Inc. R
11,600
479,892
Prologis, Inc. R
34,600
1,412,026
Prudential PLC (United Kingdom)
127,647
2,939,319
Public Storage R
5,400
926,694
Regions Financial Corp.
139,704
1,416,599
Simon Property Group, Inc. R
10,000
1,681,900
State Street Corp.
30,524
2,150,111
Visa, Inc. Class A
32,935
6,949,614
Vornado Realty Trust R
10,600
1,123,812
Washington Prime Group, Inc. † R
5,000
94,450
Wells Fargo & Co.
296,900
15,112,210
WisdomTree Investments, Inc. †
112,784
1,157,164
129,034,905
Health care (8.6%)
Abbott Laboratories
44,479
1,873,455
AbbVie, Inc.
111,077
5,813,770
Actavis PLC †
28,376
6,079,842
Aetna, Inc.
26,103
2,023,766
Allergan, Inc.
20,361
3,377,075
AstraZeneca PLC ADR (United Kingdom)
38,398
2,794,990
Baxter International, Inc.
45,768
3,418,412
Biogen Idec, Inc. †
13,751
4,598,197
Boston Scientific Corp. †
50,054
639,690
Bristol-Myers Squibb Co.
128,164
6,487,662
Cardinal Health, Inc.
7,377
528,561
Catamaran Corp. †
13,357
607,610
Celgene Corp. †
76,135
6,635,165
Cerner Corp. †
6,419
354,329
CIGNA Corp.
34,930
3,145,097
Covidien PLC
10,660
922,197
Eli Lilly & Co.
74,478
4,547,627
ExamWorks Group, Inc. †
28,520
1,006,471
Express Scripts Holding Co. †
37,596
2,618,561
Gilead Sciences, Inc. †
132,886
12,165,713
HCA Holdings, Inc. †
6,261
408,905
InterMune, Inc. †
36,545
1,603,229
Johnson & Johnson
45,252
4,529,273
McKesson Corp.
10,733
2,059,233
Medtronic, Inc.
35,708
2,204,612
Merck & Co., Inc.
110,740
6,283,388
PerkinElmer, Inc.
37,122
1,715,779
Pfizer, Inc.
143,412
4,115,924
George Putnam Balanced Fund 29
COMMON STOCKS (62.2%)* cont.
Shares
Value
Health care cont.
Retrophin, Inc. †
66,386
$705,019
St. Jude Medical, Inc.
47,685
3,108,585
Thermo Fisher Scientific, Inc.
36,221
4,400,852
Tornier NV (Netherlands) †
52,334
1,084,884
TransEnterix, Inc. †
52,744
209,394
Universal Health Services, Inc. Class B
5,649
602,183
Ventas, Inc. R
34,700
2,203,450
Vertex Pharmaceuticals, Inc. †
27,447
2,440,313
WellPoint, Inc.
13,392
1,470,576
WuXi PharmaTech Cayman, Inc. ADR (China) †
9,063
279,231
Zimmer Holdings, Inc.
23,461
2,347,742
111,410,762
Semiconductor (0.9%)
Applied Materials, Inc.
44,187
926,160
Lam Research Corp.
48,737
3,411,590
Qualcomm, Inc.
95,635
7,048,300
11,386,050
Software (2.2%)
Adobe Systems, Inc. †
22,020
1,521,802
Electronic Arts, Inc. †
22,600
759,360
Intuit, Inc.
12,034
986,427
Microsoft Corp.
272,007
11,739,822
Oracle Corp.
212,190
8,570,354
PTC, Inc. †
12,875
462,985
Red Hat, Inc. †
41,105
2,389,023
Tencent Holdings, Ltd. (China)
97,781
1,580,937
28,010,710
Technology (0.2%)
CACI International, Inc. Class A †
40,202
2,773,536
2,773,536
Technology services (3.1%)
Cognizant Technology Solutions Corp. Class A †
33,861
1,660,882
Computer Sciences Corp.
36,923
2,303,626
eBay, Inc. †
87,993
4,646,030
Facebook, Inc. Class A †
119,464
8,679,060
Fidelity National Information Services, Inc.
36,436
2,054,990
Google, Inc. Class C †
30,226
17,277,182
Pandora Media, Inc. †
15,600
391,872
Qihoo 360 Technology Co., Ltd. ADR (China) †
7,198
656,098
Yahoo!, Inc. †
72,967
2,612,948
Yandex NV Class A (Russia) †
19,803
599,635
40,882,323
Transportation (1.2%)
American Airlines Group, Inc. †
34,394
1,336,207
Delta Air Lines, Inc.
112,631
4,219,157
Genesee & Wyoming, Inc. Class A †
19,326
1,927,382
Spirit Airlines, Inc. †
39,471
2,582,193
Union Pacific Corp.
58,448
5,746,023
15,810,962
30 George Putnam Balanced Fund
COMMON STOCKS (62.2%)* cont.
Shares
Value
Utilities and power (1.9%)
Abengoa Yield PLC (United Kingdom) †
11,718
$423,957
Ameren Corp.
32,973
1,267,812
American Electric Power Co., Inc.
38,487
2,000,939
American Water Works Co., Inc.
21,705
1,036,848
Calpine Corp. †
118,065
2,602,153
Dominion Resources, Inc.
8,513
575,819
Duke Energy Corp.
14,815
1,068,606
Edison International
50,718
2,779,346
Exelon Corp.
50,144
1,558,476
FirstEnergy Corp.
10,159
317,062
NextEra Energy Partners LP †
15,068
512,915
NextEra Energy, Inc.
20,672
1,940,894
NiSource, Inc.
23,804
896,935
NRG Energy, Inc.
98,570
3,051,727
PG&E Corp.
64,112
2,863,883
Sempra Energy
17,777
1,772,545
24,669,917
Total common stocks (cost $735,880,237)
$810,651,283
U.S. GOVERNMENT AND AGENCY MORTGAGE OBLIGATIONS (7.2%)*
Principal amount
Value
U.S. Government Guaranteed Mortgage Obligations (0.1%)
Government National Mortgage Association Pass-Through Certificates
3s, TBA, September 1, 2044
$1,000,000
$999,219
3s, TBA, August 1, 2044
1,000,000
1,002,188
2,001,407
U.S. Government Agency Mortgage Obligations (7.1%)
Federal Home Loan Mortgage Corporation Pass-Through Certificates
6s, March 1, 2035
3,742
4,207
4 1/2s, September 1, 2043
1,364,758
1,481,881
4 1/2s, May 1, 2044 F
1,093,199
1,183,509
4s, with due dates from July 1, 2042 to June 1, 2043
11,163,924
11,719,794
3 1/2s, with due dates from December 1, 2042 to April 1, 2043
930,211
949,578
3 1/2s, October 1, 2042 ##
917,078
929,437
Federal National Mortgage Association Pass-Through Certificates
5 1/2s, with due dates from July 1, 2033 to November 1, 2038
2,520,759
2,800,209
5 1/2s, TBA, September 1, 2044
2,000,000
2,215,859
5 1/2s, TBA, August 1, 2044
2,000,000
2,217,812
5s, with due dates from August 1, 2033 to January 1, 2039
1,288,998
1,426,785
4 1/2s, with due dates from August 1, 2041 to October 1, 2043
20,123,145
21,733,132
4 1/2s, TBA, September 1, 2044
5,000,000
5,370,899
4 1/2s, TBA, August 1, 2044
5,000,000
5,383,203
4s, with due dates from May 1, 2044 to June 1, 2044
1,000,000
1,051,875
4s, TBA, September 1, 2044
2,000,000
2,096,719
4s, TBA, August 1, 2044
2,000,000
2,102,656
3 1/2s, with due dates from May 1, 2043 to May 1, 2043
1,865,163
1,901,956
3 1/2s, TBA, September 1, 2044
3,000,000
3,047,109
3 1/2s, TBA, August 1, 2044
4,000,000
4,074,375
3s, February 1, 2043
928,766
911,642
George Putnam Balanced Fund 31
U.S. GOVERNMENT AND AGENCY MORTGAGE OBLIGATIONS (7.2%)* cont.
Principal amount
Value
U.S. Government Agency Mortgage Obligations cont.
Federal National Mortgage Association Pass-Through Certificates
3s, TBA, September 1, 2044
$10,000,000
$9,769,531
3s, TBA, August 1, 2044
10,000,000
9,795,312
92,167,480
Total U.S. government and agency mortgage obligations (cost $94,159,902)
$94,168,887
U.S. TREASURY OBLIGATIONS (12.9%)*
Principal amount
Value
U.S. Treasury Bonds 3 3/4s, November 15, 2043
$5,580,000
$6,055,063
U.S. Treasury Notes
3 1/2s, February 15, 2018
29,440,000
31,668,125
3s, September 30, 2016
13,690,000
14,394,821
1 3/4s, May 31, 2016
31,690,000
32,430,104
1 1/8s, December 31, 2019
6,990,000
6,714,154
1s, August 31, 2016
41,640,000
41,990,117
0 3/4s, March 31, 2018
25,640,000
25,071,612
0 1/4s, November 30, 2014
9,662,000
9,667,898
Total U.S. treasury obligations (cost $168,372,813)
$167,991,894
CORPORATE BONDS AND NOTES (14.6%)*
Principal amount
Value
Basic materials (0.6%)
Agrium, Inc. sr. unsec. unsub. notes 7 1/8s, 2036 (Canada)
$365,000
$474,062
ArcelorMittal SA sr. unsec. bonds 10.35s, 2019 (France)
400,000
498,000
CF Industries, Inc. company guaranty sr. unsec. notes 5 3/8s, 2044
600,000
637,234
CF Industries, Inc. company guaranty sr. unsec. notes 5.15s, 2034
408,000
432,844
CF Industries, Inc. company guaranty sr. unsec. unsub. notes 7 1/8s, 2020
78,000
94,743
Cytec Industries, Inc. sr. unsec. unsub. notes 3 1/2s, 2023
215,000
210,490
Eastman Chemical Co. sr. unsec. unsub. notes 6.3s, 2018
Korea Development Bank sr. unsec. unsub. notes 4s, 2016 (South Korea)
450,000
475,421
Total foreign government and agency bonds and notes (cost $798,020)
$851,234
42 George Putnam Balanced Fund
SHORT-TERM INVESTMENTS (5.1%)*
Principal amount/shares
Value
Putnam Short Term Investment Fund 0.05% L
Shares65,325,071
$65,325,071
SSgA Prime Money Market Fund 0.01% P
Shares130,000
130,000
U.S. Treasury Bills with an effective yield of 0.04%, December 11, 2014 #
$705,000
704,884
U.S. Treasury Bills with an effective yield of 0.04%, October 23, 2014 # Δ
775,000
774,960
Total short-term investments (cost $66,934,911)
$66,934,915
TOTAL INVESTMENTS
Total investments (cost $1,257,080,442)
$1,349,954,114
Key to holding’s abbreviations
ADR
American Depository Receipts: represents ownership of foreign securities on deposit with a custodian bank
BKNT
Bank Note
FRB
Floating Rate Bonds: the rate shown is the current interest rate at the close of the reporting period
FRN
Floating Rate Notes: the rate shown is the current interest rate at the close of the reporting period
G.O. Bonds
General Obligation Bonds
IO
Interest Only
MTN
Medium Term Notes
REGS
Securities sold under Regulation S may not be offered, sold or delivered within the United States except pursuant to an exemption from, or in a transaction not subject to, the registration requirements of the Securities Act of 1933.
TBA
To Be Announced Commitments
Notes to the fund’s portfolio
Unless noted otherwise, the notes to the fund’s portfolio are for the close of the fund’s reporting period, which ran from August 1, 2013 through July 31, 2014 (the reporting period). Within the following notes to the portfolio, references to “ASC 820” represent Accounting Standards Codification 820 Fair Value Measurements and Disclosures and references to “OTC”, if any, represent over-the-counter.
*
Percentages indicated are based on net assets of $1,302,294,108.
†
Non-income-producing security.
#
This security, in part or in entirety, was pledged and segregated with the broker to cover margin requirements for futures contracts at the close of the reporting period.
Δ
This security, in part or in entirety, was pledged and segregated with the custodian for collateral on certain derivative contracts at the close of the reporting period.
##
Forward commitment, in part or in entirety (Note 1).
F
Security is valued at fair value following procedures approved by the Trustees. Securities may be classified as Level 2 or Level 3 for ASC 820 based on the securities’ valuation inputs. At the close of the reporting period, fair value pricing was also used for certain foreign securities in the portfolio (Note 1).
L
Affiliated company (Note 5). The rate quoted in the security description is the annualized 7-day yield of the fund at the close of the reporting period.
George Putnam Balanced Fund 43
P
Security was pledged, or purchased with cash that was pledged, to the fund for collateral on certain derivative contracts. The rate quoted in the security description is the annualized 7-day yield of the fund at the close of the reporting period (Note 1).
R
Real Estate Investment Trust.
At the close of the reporting period, the fund maintained liquid assets totaling $23,712,381 to cover certain derivatives contracts and delayed delivery securities.
Debt obligations are considered secured unless otherwise indicated.
144A after the name of an issuer represents securities exempt from registration under Rule 144A under the Securities Act of 1933, as amended. These securities may be resold in transactions exempt from registration, normally to qualified institutional buyers.
See Note 1 to the financial statements regarding TBA commitments.
The dates shown on debt obligations are the original maturity dates.
FORWARD CURRENCY CONTRACTS at 7/31/14 (aggregate face value $58,532,153)
Counterparty
Currency
Contract type
Delivery date
Value
Aggregate face value
Unrealized appreciation/ (depreciation)
Barclays Bank PLC
British Pound
Sell
9/17/14
$8,396,797
$8,393,458
$(3,339)
Canadian Dollar
Sell
10/15/14
2,079,414
2,126,427
47,013
Citibank, N.A.
Euro
Sell
9/17/14
4,873,885
4,956,210
82,325
Credit Suisse International
British Pound
Sell
9/17/14
5,128,910
5,089,161
(39,749)
Euro
Sell
9/17/14
4,874,019
4,955,989
81,970
Norwegian Krone
Sell
9/17/14
2,320,719
2,425,178
104,459
Deutsche Bank AG
British Pound
Sell
9/17/14
5,128,910
5,089,033
(39,877)
Euro
Buy
9/17/14
3,677,545
3,714,108
(36,563)
HSBC Bank USA, National Association
Euro
Buy
9/17/14
2,527,810
2,585,018
(57,208)
JPMorgan Chase Bank N.A.
British Pound
Buy
9/17/14
2,718,711
2,748,249
(29,538)
Canadian Dollar
Sell
10/15/14
4,344,769
4,412,073
67,304
Euro
Sell
9/17/14
4,874,019
4,956,244
82,225
State Street Bank and Trust Co.
Canadian Dollar
Sell
10/15/14
2,079,322
2,126,253
46,931
Euro
Sell
9/17/14
4,874,019
4,954,752
80,733
Total
$386,686
44 George Putnam Balanced Fund
FUTURES CONTRACTS OUTSTANDING at 7/31/14
Number of contracts
Value
Expiration date
Unrealized appreciation/ (depreciation)
S&P 500 Index E-Mini (Long)
247
$23,771,280
Sep-14
$(449,364)
Total
$(449,364)
TBA SALE COMMITMENTS OUTSTANDING at 7/31/14 (proceeds receivable $24,582,148)
Agency
Principal amount
Settlement date
Value
Federal National Mortgage Association, 5 1/2s, August 1, 2044
$2,000,000
8/12/14
$2,217,812
Federal National Mortgage Association, 4 1/2s, August 1, 2044
5,000,000
8/12/14
5,383,203
Federal National Mortgage Association, 4s, August 1, 2044
2,000,000
8/12/14
2,102,656
Federal National Mortgage Association, 3 1/2s, August 1, 2044
4,000,000
8/12/14
4,074,375
Federal National Mortgage Association, 3s, August 1, 2044
10,000,000
8/12/14
9,795,312
Government National Mortgage Association, 3s, August 1, 2044
1,000,000
8/21/14
1,002,188
Total
$24,575,546
OTC TOTAL RETURN SWAP CONTRACTS OUTSTANDING at 7/31/14
Swap counterparty/ Notional amount
Upfront premium received (paid)
Termination date
Payments received (paid) by fund per annum
Total return received by or paid by fund
Unrealized appreciation/ (depreciation)
JPMorgan Chase Bank N.A.
baskets
30,869
$—
7/16/15
(3 month USD-LIBOR-BBA plus 30 bp)
A basket (JPCMPTMD) of common stocks
$(45,759)
Total
$—
$(45,759)
George Putnam Balanced Fund 45
ASC 820 establishes a three-level hierarchy for disclosure of fair value measurements. The valuation hierarchy is based upon the transparency of inputs to the valuation of the fund’s investments. The three levels are defined as follows:
Level 1: Valuations based on quoted prices for identical securities in active markets.
Level 2: Valuations based on quoted prices in markets that are not active or for which all significant inputs are observable, either directly or indirectly.
Level 3: Valuations based on inputs that are unobservable and significant to the fair value measurement.
The following is a summary of the inputs used to value the fund’s net assets as of the close of the reporting period:
Valuation inputs
Investments in securities:
Level 1
Level 2
Level 3
Common stocks*:
Basic materials
$29,159,908
$3,977,896
$—
Capital goods
31,047,893
2,136,244
—
Communication services
42,220,233
—
—
Conglomerates
4,156,529
5,964,346
—
Consumer cyclicals
95,368,889
—
—
Consumer staples
73,413,823
—
—
Energy
80,869,193
2,843,422
—
Financials
126,095,586
2,939,319
—
Health care
111,410,762
—
—
Technology
156,985,424
1,580,937
—
Transportation
15,810,962
—
—
Utilities and power
24,669,917
—
—
Total common stocks
791,209,119
19,442,164
—
Convertible preferred stocks
$966,026
$—
$—
Corporate bonds and notes
—
189,619,385
—
Foreign government and agency bonds and notes
—
851,234
—
Mortgage-backed securities
—
17,242,440
—
Municipal bonds and notes
—
1,528,050
—
U.S. government and agency mortgage obligations
—
94,168,887
—
U.S. treasury obligations
—
167,991,894
—
Short-term investments
65,455,071
1,479,844
—
Totals by level
$857,630,216
$492,323,898
$—
Valuation inputs
Other financial instruments:
Level 1
Level 2
Level 3
Forward currency contracts
$—
$386,686
$—
Futures contracts
(449,364)
—
—
TBA sale commitments
—
(24,575,546)
—
Total return swap contracts
—
(45,759)
—
Totals by level
$(449,364)
$(24,234,619)
$—
*Common stock classifications are presented at the sector level, which may differ from the fund’s portfolio presentation.
The accompanying notes are an integral part of these financial statements.
Affiliated issuers (identified cost $65,325,071) (Notes 1 and 5)
65,325,071
Cash
1,235
Dividends, interest and other receivables
4,847,545
Receivable for shares of the fund sold
532,184
Receivable for investments sold
42,731,612
Receivable for sales of delayed delivery securities (Note 1)
11,141,146
Unrealized appreciation on forward currency contracts (Note 1)
592,960
Prepaid assets
86,917
Total assets
1,409,887,713
LIABILITIES
Payable for investments purchased
39,630,446
Payable for purchases of delayed delivery securities (Note 1)
39,090,383
Payable for shares of the fund repurchased
1,383,659
Payable for compensation of Manager (Note 2)
584,305
Payable for custodian fees (Note 2)
15,054
Payable for investor servicing fees (Note 2)
156,631
Payable for Trustee compensation and expenses (Note 2)
601,879
Payable for administrative services (Note 2)
4,249
Payable for distribution fees (Note 2)
324,549
Payable for variation margin (Note 1)
497,705
Unrealized depreciation on OTC swap contracts (Note 1)
45,759
Unrealized depreciation on forward currency contracts (Note 1)
206,274
TBA sale commitments, at value (proceeds receivable $24,582,148) (Note 1)
24,575,546
Collateral on certain derivative contracts, at value (Note 1)
130,000
Other accrued expenses
347,166
Total liabilities
107,593,605
Net assets
$1,302,294,108
REPRESENTED BY
Paid-in capital (Unlimited shares authorized) (Notes 1 and 4)
$1,812,921,677
Undistributed net investment income (Note 1)
5,253,158
Accumulated net realized loss on investments and foreign currency transactions (Note 1)
(608,652,564)
Net unrealized appreciation of investments and assets and liabilities in foreign currencies
92,771,837
Total — Representing net assets applicable to capital shares outstanding
$1,302,294,108
(Continued on next page)
The accompanying notes are an integral part of these financial statements.
George Putnam Balanced Fund 47
Statement of assets and liabilities (Continued)
COMPUTATION OF NET ASSET VALUE AND OFFERING PRICE
Net asset value and redemption price per class A share ($1,051,286,830 divided by 65,233,659 shares)
$16.12
Offering price per class A share (100/94.25 of $16.12)*
$17.10
Net asset value and offering price per class B share ($24,880,806 divided by 1,561,266 shares)**
$15.94
Net asset value and offering price per class C share ($29,091,072 divided by 1,816,833 shares)**
$16.01
Net asset value and redemption price per class M share ($77,337,609 divided by 4,862,971 shares)
$15.90
Offering price per class M share (100/96.50 of $15.90)*
$16.48
Net asset value, offering price and redemption price per class R share ($983,006 divided by 61,181 shares)
$16.07
Net asset value, offering price and redemption price per class R5 share ($10,672 divided by 660 shares)
$16.18†
Net asset value, offering price and redemption price per class R6 share ($7,100,381 divided by 438,889 shares)
$16.18
Net asset value, offering price and redemption price per class Y share ($111,603,732 divided by 6,900,405 shares)
$16.17
*
On single retail sales of less than $50,000. On sales of $50,000 or more the offering price is reduced.
**
Redemption price per share is equal to net asset value less any applicable contingent deferred sales charge.
†
Net asset value may not recalculate due to rounding of fractional shares.
The accompanying notes are an integral part of these financial statements.
48 George Putnam Balanced Fund
Statement of operations Year ended 7/31/14
INVESTMENT INCOME
Dividends (net of foreign tax of $160,578)
$18,538,192
Interest (including interest income of $73,710 from investments in affiliated issuers) (Note 5)
13,512,289
Total investment income
32,050,481
EXPENSES
Compensation of Manager (Note 2)
6,703,989
Investor servicing fees (Note 2)
2,033,350
Custodian fees (Note 2)
36,356
Trustee compensation and expenses (Note 2)
86,910
Distribution fees (Note 2)
3,694,185
Administrative services (Note 2)
33,224
Other
552,845
Total expenses
13,140,859
Expense reduction (Note 2)
(26,628)
Net expenses
13,114,231
Net investment income
18,936,250
Net realized gain on investments (Notes 1 and 3)
190,988,216
Net realized gain on swap contracts (Note 1)
27,401
Net realized gain on futures contracts (Note 1)
198,111
Net realized loss on foreign currency transactions (Note 1)
(64,084)
Net unrealized appreciation of assets and liabilities in foreign currencies during the year
386,686
Net unrealized depreciation of investments, futures contracts, swap contracts and TBA sale commitments during the year
(85,089,665)
Net gain on investments
106,446,665
Net increase in net assets resulting from operations
$125,382,915
The accompanying notes are an integral part of these financial statements.
George Putnam Balanced Fund 49
Statement of changes in net assets
INCREASE IN NET ASSETS
Year ended 7/31/14
Year ended 7/31/13
Operations:
Net investment income
$18,936,250
$18,532,686
Net realized gain on investments and foreign currency transactions
191,149,644
82,059,990
Net unrealized appreciation (depreciation) of investments and assets and liabilities in foreign currencies
(84,702,979)
87,169,795
Net increase in net assets resulting from operations
125,382,915
187,762,471
Distributions to shareholders (Note 1):
From ordinary income
Net investment income
Class A
(14,366,201)
(14,505,745)
Class B
(164,904)
(202,130)
Class C
(173,850)
(161,012)
Class M
(694,591)
(699,585)
Class R
(12,093)
(13,812)
Class R5
(85)
—
Class R6
(62,454)
—
Class Y
(1,746,310)
(1,611,862)
Decrease from capital share transactions (Note 4)
(68,878,372)
(72,986,841)
Total increase in net assets
39,284,055
97,581,484
NET ASSETS
Beginning of year
1,263,010,053
1,165,428,569
End of year (including undistributed net investment income of $5,253,158 and $4,157,611, respectively)
$1,302,294,108
$1,263,010,053
The accompanying notes are an integral part of these financial statements.
50 George Putnam Balanced Fund
This page left blank intentionally.
George Putnam Balanced Fund 51
Financial highlights (For a common share outstanding throughout the period)
INVESTMENT OPERATIONS:
LESS DISTRIBUTIONS:
RATIOS AND SUPPLEMENTAL DATA:
Period ended
Net asset value, beginning of period
Net investment income (loss)a
Net realized and unrealized gain (loss) on investments
Total from investment operations
From net investment income
From net realized gain on investments
From return of capital
Total distributions
Redemption fees
Non-recurring reimbursements
Net asset value, end of period
Total return at net asset value (%)b
Net assets, end of period (in thousands)
Ratio of expenses to average net assets (%)c
Ratio of net investment income (loss) to average net assets (%)
Portfolio turnover (%)d
Class A
July 31, 2014
$14.81
.23
1.29
1.52
(.21)
—
—
(.21)
—
—
$16.12
10.37
$1,051,287
.99
1.52
98
July 31, 2013
12.88
.21
1.92
2.13
(.20)
—
—
(.20)
—
—
14.81
16.68
1,030,545
1.01
1.56
86
July 31, 2012
12.21
.22
.65
.87
(.20)
—
—
(.20)
—
—
12.88
7.26
973,318
1.03
1.80
99
July 31, 2011
11.08
.19
1.14
1.33
(.20)
—
—
(.20)
—e
—f
12.21
12.09
1,034,828
1.05
1.57
176
July 31, 2010
10.14
.25
.93
1.18
(.22)
—
(.02)
(.24)
—e
—
11.08
11.83
1,077,209
1.13g
2.27
341
Class B
July 31, 2014
$14.65
.12
1.27
1.39
(.10)
—
—
(.10)
—
—
$15.94
9.51
$24,881
1.74
.77
98
July 31, 2013
12.74
.11
1.90
2.01
(.10)
—
—
(.10)
—
—
14.65
15.83
26,541
1.76
.82
86
July 31, 2012
12.08
.13
.63
.76
(.10)
—
—
(.10)
—
—
12.74
6.38
29,272
1.78
1.06
99
July 31, 2011
10.96
.10
1.13
1.23
(.11)
—
—
(.11)
—e
—f
12.08
11.24
39,031
1.80
.82
176
July 31, 2010
10.02
.17
.94
1.11
(.15)
—
(.02)
(.17)
—e
—
10.96
11.09
56,880
1.88g
1.54
341
Class C
July 31, 2014
$14.72
.12
1.27
1.39
(.10)
—
—
(.10)
—
—
$16.01
9.50
$29,091
1.74
.76
98
July 31, 2013
12.80
.11
1.91
2.02
(.10)
—
—
(.10)
—
—
14.72
15.85
23,534
1.76
.81
86
July 31, 2012
12.14
.13
.64
.77
(.11)
—
—
(.11)
—
—
12.80
6.39
21,223
1.78
1.05
99
July 31, 2011
11.02
.10
1.13
1.23
(.11)
—
—
(.11)
—e
—f
12.14
11.22
22,013
1.80
.82
176
July 31, 2010
10.08
.16
.95
1.11
(.15)
—
(.02)
(.17)
—e
—
11.02
11.06
22,814
1.88g
1.52
341
Class M
July 31, 2014
$14.62
.16
1.26
1.42
(.14)
—
—
(.14)
—
—
$15.90
9.75
$77,338
1.49
1.02
98
July 31, 2013
12.71
.14
1.90
2.04
(.13)
—
—
(.13)
—
—
14.62
16.17
74,636
1.51
1.06
86
July 31, 2012
12.06
.16
.63
.79
(.14)
—
—
(.14)
—
—
12.71
6.62
70,317
1.53
1.30
99
July 31, 2011
10.94
.13
1.13
1.26
(.14)
—
—
(.14)
—e
—f
12.06
11.60
75,160
1.55
1.07
176
July 31, 2010
10.01
.19
.94
1.13
(.18)
—
(.02)
(.20)
—e
—
10.94
11.33
79,010
1.63g
1.77
341
Class R
July 31, 2014
$14.77
.20
1.28
1.48
(.18)
—
—
(.18)
—
—
$16.07
10.08
$983
1.24
1.27
98
July 31, 2013
12.84
.18
1.92
2.10
(.17)
—
—
(.17)
—
—
14.77
16.44
960
1.26
1.32
86
July 31, 2012
12.18
.19
.64
.83
(.17)
—
—
(.17)
—
—
12.84
6.92
1,209
1.28
1.54
99
July 31, 2011
11.05
.16
1.14
1.30
(.17)
—
—
(.17)
—e
—f
12.18
11.84
1,216
1.30
1.32
176
July 31, 2010
10.11
.22
.94
1.16
(.20)
—
(.02)
(.22)
—e
—
11.05
11.59
1,345
1.38g
2.03
341
Class R5
July 31, 2014†
$15.28
.18
.85
1.03
(.13)
—
—
(.13)
—
—
$16.18
6.76*
$11
.48*
1.15*
98
Class R6
July 31, 2014†
$15.28
.19
.85
1.04
(.14)
—
—
(.14)
—
—
$16.18
6.81*
$7,100
.42*
1.19*
98
Class Y
July 31, 2014
$14.86
.27
1.29
1.56
(.25)
—
—
(.25)
—
—
$16.17
10.61
$111,604
.74
1.77
98
July 31, 2013
12.92
.25
1.92
2.17
(.23)
—
—
(.23)
—
—
14.86
16.99
106,794
.76
1.81
86
July 31, 2012
12.26
.25
.64
.89
(.23)
—
—
(.23)
—
—
12.92
7.42
70,090
.78
2.04
99
July 31, 2011
11.12
.22
1.15
1.37
(.23)
—
—
(.23)
—e
—f
12.26
12.42
67,590
.80
1.82
176
July 31, 2010
10.17
.28
.95
1.23
(.25)
—
(.03)
(.28)
—e
—
11.12
12.18
69,539
.88g
2.55
341
See notes to financial highlights at the end of this section.
The accompanying notes are an integral part of these financial statements.
52
George Putnam Balanced Fund
George Putnam Balanced Fund
53
Financial highlights (Continued)
* Not annualized.
† For the period December 2, 2013 (commencement of operations) to July 31, 2014.
a Per share net investment income (loss) has been determined on the basis of the weighted average number of shares outstanding during the period.
b Total return assumes dividend reinvestment and does not reflect the effect of sales charges.
c Includes amounts paid through expense offset and/or brokerage/service arrangements, if any (Note 2). Also excludes acquired fund fees and expenses, if any.
d Portfolio turnover excludes TBA purchase and sales transactions.
e Amount represents less than $0.01 per share.
f Reflects a non-recurring reimbursement related to restitution amounts in connection with a distribution plan approved by the Securities and Exchange Commission (the SEC), which amounted to less than $0.01 per share outstanding on July 21, 2011. Also reflects a non-recurring reimbursal related to short-term trading related lawsuits, which amounted to less than $0.01 per share outstanding on May 11, 2011.
g Excludes the impact of a reduction to interest expense related to the resolution of certain terminated derivatives contracts, which amounted to 0.02% of average net assets as of July 31, 2010.
The accompanying notes are an integral part of these financial statements.
54 George Putnam Balanced Fund
Notes to financial statements 7/31/14
Within the following Notes to financial statements, references to “State Street” represent State Street Bank and Trust Company, references to “the SEC” represent the Securities and Exchange Commission, references to “Putnam Management” represent Putnam Investment Management, LLC, the fund’s manager, an indirect wholly-owned subsidiary of Putnam Investments, LLC and references to “OTC”, if any, represent over-the-counter. Unless otherwise noted, the “reporting period” represents the period from August 1, 2013 through July 31, 2014.
George Putnam Balanced Fund (the fund) is a Massachusetts business trust, which is registered under the Investment Company Act of 1940, as amended, as a diversified open-end management investment company. The goal of the fund is to seek to provide a balanced investment composed of a well-diversified portfolio of stocks and bonds which produce both capital growth and current income. The fund invests mainly in a combination of bonds and common stocks (growth or value stocks or both) of large U.S. companies, with a greater focus on common stocks. For example, the fund may purchase stocks of companies with stock prices that reflect a value lower than that which Putnam Management places on the company. Putnam Management may also consider other factors that it believes will cause the stock price to rise. The fund buys bonds of governments and private companies that are mostly investment-grade in quality with intermediate to long-term maturities (three years or longer). Putnam Management may consider, among other factors, a company’s valuation, financial strength, growth potential, competitive position in its industry, projected future earnings, cash flows and dividends when deciding whether to buy or sell equity investments, and, among other factors, credit, interest rate and prepayment risks, as well as general market conditions, when deciding whether to buy or sell fixed income investments. The fund may also use derivatives, such as futures, options, warrants and swap contracts, for both hedging and non-hedging purposes.
The fund offers class A, class B, class C, class M, class R, class R5, class R6 and class Y shares. The fund began offering R5 and R6 classes of shares on December 2, 2013. Class A and class M shares are sold with a maximum front-end sales charge of 5.75% and 3.50%, respectively, and generally do not pay a contingent deferred sales charge. Class B shares, which convert to class A shares after approximately eight years, do not pay a front-end sales charge and are subject to a contingent deferred sales charge if those shares are redeemed within six years of purchase. Class C shares have a one-year 1.00% contingent deferred sales charge and do not convert to class A shares. Class R shares, which are not available to all investors, are sold at net asset value. The expenses for class A, class B, class C, class M and class R shares may differ based on the distribution fee of each class, which is identified in Note 2. Class R5, class R6 and class Y shares, which are sold at net asset value, are generally subject to the same expenses as class A, class B, class C, class M and class R shares, but do not bear a distribution fee and in the case of class R5 and class R6 shares, bear a lower investor servicing fee, which is identified in Note 2. Class R5, class R6 and class Y shares are not available to all investors.
In the normal course of business, the fund enters into contracts that may include agreements to indemnify another party under given circumstances. The fund’s maximum exposure under these arrangements is unknown as this would involve future claims that may be, but have not yet been, made against the fund. However, the fund’s management team expects the risk of material loss to be remote.
Note 1: Significant accounting policies
The following is a summary of significant accounting policies consistently followed by the fund in the preparation of its financial statements. The preparation of financial statements is in conformity with accounting principles generally accepted in the United States of America and requires management to make estimates and assumptions that affect the reported amounts of assets and liabilities in the financial statements and the reported amounts of increases and decreases in net assets from operations. Actual results could differ from those estimates. Subsequent events after the Statement of assets and liabilities date through the date that the financial statements were issued have been evaluated in the preparation of the financial statements.
Investment income, realized and unrealized gains and losses and expenses of the fund are borne pro-rata based on the relative net assets of each class to the total net assets of the fund, except that each class bears expenses unique to that class (including the distribution fees applicable to such classes). Each class votes as a class only with respect to its own distribution plan or other matters on which a class vote is required by law or determined by the Trustees. If the fund were liquidated, shares of each class would receive their pro-rata share of the net assets of the fund. In addition, the Trustees declare separate dividends on each class of shares.
Security valuation Investments for which market quotations are readily available are valued at the last reported sales price on their principal exchange, or official closing price for certain markets, and are classified as Level 1
George Putnam Balanced Fund 55
securities under Accounting Standards Codification 820 Fair Value Measurements and Disclosures (ASC 820). If no sales are reported, as in the case of some securities that are traded OTC, a security is valued at its last reported bid price and is generally categorized as a Level 2 security.
Investments in open-end investment companies (excluding exchange traded funds), if any, which can be classified as Level 1 or Level 2 securities, are valued based on their net asset value. The net asset value of such investment companies equals the total value of their assets less their liabilities and divided by the number of their outstanding shares.
Market quotations are not considered to be readily available for certain debt obligations and other investments; such investments are valued on the basis of valuations furnished by an independent pricing service approved by the Trustees or dealers selected by Putnam Management. Such services or dealers determine valuations for normal institutional-size trading units of such securities using methods based on market transactions for comparable securities and various relationships, generally recognized by institutional traders, between securities (which consider such factors as security prices, yields, maturities and ratings). These securities will generally be categorized as Level 2. Short-term securities with remaining maturities of 60 days or less may be valued at amortized cost, which approximates fair value and are classified as Level 2 securities.
Many securities markets and exchanges outside the U.S. close prior to the close of the New York Stock Exchange and therefore the closing prices for securities in such markets or on such exchanges may not fully reflect events that occur after such close but before the close of the New York Stock Exchange. Accordingly, on certain days, the fund will fair value foreign equity securities taking into account multiple factors including movements in the U.S. securities markets, currency valuations and comparisons to the valuation of American Depository Receipts, exchange-traded funds and futures contracts. These securities, which would generally be classified as Level 1 securities, will be transferred to Level 2 of the fair value hierarchy when they are valued at fair value. The number of days on which fair value prices will be used will depend on market activity and it is possible that fair value prices will be used by the fund to a significant extent. At the close of the reporting period, fair value pricing was used for certain foreign securities in the portfolio. Securities quoted in foreign currencies, if any, are translated into U.S. dollars at the current exchange rate.
To the extent a pricing service or dealer is unable to value a security or provides a valuation that Putnam Management does not believe accurately reflects the security’s fair value, the security will be valued at fair value by Putnam Management in accordance with policies and procedures approved by the Trustees. Certain investments, including certain restricted and illiquid securities and derivatives, are also valued at fair value following procedures approved by the Trustees. These valuations consider such factors as significant market or specific security events such as interest rate or credit quality changes, various relationships with other securities, discount rates, U.S. Treasury, U.S. swap and credit yields, index levels, convexity exposures and recovery rates. These securities are classified as Level 2 or as Level 3 depending on the priority of the significant inputs.
Such valuations and procedures are reviewed periodically by the Trustees. Certain securities may be valued on the basis of a price provided by a single source. The fair value of securities is generally determined as the amount that the fund could reasonably expect to realize from an orderly disposition of such securities over a reasonable period of time. By its nature, a fair value price is a good faith estimate of the value of a security in a current sale and does not reflect an actual market price, which may be different by a material amount.
Security transactions and related investment income Security transactions are recorded on the trade date (the date the order to buy or sell is executed). Gains or losses on securities sold are determined on the identified cost basis.
Interest income, net of any applicable withholding taxes, is recorded on the accrual basis. Dividend income, net of any applicable withholding taxes, is recognized on the ex-dividend date except that certain dividends from foreign securities, if any, are recognized as soon as the fund is informed of the ex-dividend date. Non-cash dividends, if any, are recorded at the fair value of the securities received. Dividends representing a return of capital or capital gains, if any, are reflected as a reduction of cost and/or as a realized gain. All premiums/discounts are amortized/accreted on a yield-to-maturity basis. Securities purchased or sold on delayed delivery basis may be settled at a future date beyond customary settlement time; interest income is accrued based on the terms of the securities. Losses may arise due to changes in the fair value of the underlying securities or if the counterparty does not perform under the contract.
Stripped securities The fund may invest in stripped securities which represent a participation in securities that may be structured in classes with rights to receive different portions of the interest and principal. Interest-only securities receive all of the interest and principal-only securities receive all of the principal. If the interest-only
56 George Putnam Balanced Fund
securities experience greater than anticipated prepayments of principal, the fund may fail to recoup fully its initial investment in these securities. Conversely, principal-only securities increase in value if prepayments are greater than anticipated and decline if prepayments are slower than anticipated. The fair value of these securities is highly sensitive to changes in interest rates.
Foreign currency translation The accounting records of the fund are maintained in U.S. dollars. The fair value of foreign securities, currency holdings, and other assets and liabilities is recorded in the books and records of the fund after translation to U.S. dollars based on the exchange rates on that day. The cost of each security is determined using historical exchange rates. Income and withholding taxes are translated at prevailing exchange rates when earned or incurred. The fund does not isolate that portion of realized or unrealized gains or losses resulting from changes in the foreign exchange rate on investments from fluctuations arising from changes in the market prices of the securities. Such gains and losses are included with the net realized and unrealized gain or loss on investments. Net realized gains and losses on foreign currency transactions represent net realized exchange gains or losses on closed forward currency contracts, disposition of foreign currencies, currency gains and losses realized between the trade and settlement dates on securities transactions and the difference between the amount of investment income and foreign withholding taxes recorded on the fund’s books and the U.S. dollar equivalent amounts actually received or paid. Net unrealized appreciation and depreciation of assets and liabilities in foreign currencies arise from changes in the value of open forward currency contracts and assets and liabilities other than investments at the period end, resulting from changes in the exchange rate.
Futures contracts The fund uses futures contracts to equitize cash.
The potential risk to the fund is that the change in value of futures contracts may not correspond to the change in value of the hedged instruments. In addition, losses may arise from changes in the value of the underlying instruments, if there is an illiquid secondary market for the contracts, if interest or exchange rates move unexpectedly or if the counterparty to the contract is unable to perform. With futures, there is minimal counterparty credit risk to the fund since futures are exchange traded and the exchange’s clearinghouse, as counterparty to all exchange traded futures, guarantees the futures against default. Risks may exceed amounts recognized on the Statement of assets and liabilities. When the contract is closed, the fund records a realized gain or loss equal to the difference between the value of the contract at the time it was opened and the value at the time it was closed.
Futures contracts are valued at the quoted daily settlement prices established by the exchange on which they trade. The fund and the broker agree to exchange an amount of cash equal to the daily fluctuation in the value of the futures contract. Such receipts or payments are known as “variation margin.”
Futures contracts outstanding at period end, if any, are listed after the fund’s portfolio.
Forward currency contracts The fund buys and sells forward currency contracts, which are agreements between two parties to buy and sell currencies at a set price on a future date. These contracts are used to hedge foreign exchange risk.
The U.S. dollar value of forward currency contracts is determined using current forward currency exchange rates supplied by a quotation service. The fair value of the contract will fluctuate with changes in currency exchange rates. The contract is marked to market daily and the change in fair value is recorded as an unrealized gain or loss. The fund records a realized gain or loss equal to the difference between the value of the contract at the time it was opened and the value at the time it was closed when the contract matures or by delivery of the currency. The fund could be exposed to risk if the value of the currency changes unfavorably, if the counterparties to the contracts are unable to meet the terms of their contracts or if the fund is unable to enter into a closing position. Risks may exceed amounts recognized on the Statement of assets and liabilities.
Forward currency contracts outstanding at period end, if any, are listed after the fund’s portfolio.
Total return swap contracts The fund entered into OTC total return swap contracts, which are arrangements to exchange a market linked return for a periodic payment, both based on a notional principal amount, to gain exposure to a basket of securities (equities in this case).
To the extent that the total return of the security, index or other financial measure underlying the transaction exceeds or falls short of the offsetting interest rate obligation, the fund will receive a payment from or make a payment to the counterparty. OTC total return swap contracts are marked to market daily based upon quotations from an independent pricing service or market makers and the change, if any, is recorded as an unrealized gain or loss. Payments received or made are recorded as realized gains or losses. Certain OTC total return swap contracts may include extended effective dates. Payments related to these swap contracts are accrued based on the terms of the contract. The fund could be exposed to credit or market risk due to unfavorable changes in the fluctuation
George Putnam Balanced Fund 57
of interest rates or in the price of the underlying security or index, the possibility that there is no liquid market for these agreements or that the counterparty may default on its obligation to perform. The fund’s maximum risk of loss from counterparty risk is the fair value of the contract. This risk may be mitigated by having a master netting arrangement between the fund and the counterparty. Risk of loss may exceed amounts recognized on the Statement of assets and liabilities.
OTC total return swap contracts outstanding, including their respective notional amounts at period end, if any, are listed after the fund’s portfolio.
TBA commitments The fund may enter into TBA (to be announced) commitments to purchase securities for a fixed unit price at a future date beyond customary settlement time. Although the unit price and par amount have been established, the actual securities have not been specified. However, it is anticipated that the amount of the commitments will not significantly differ from the principal amount. The fund holds, and maintains until settlement date, cash or high-grade debt obligations in an amount sufficient to meet the purchase price, or the fund may enter into offsetting contracts for the forward sale of other securities it owns. Income on the securities will not be earned until settlement date.
The fund may also enter into TBA sale commitments to hedge its portfolio positions or to sell mortgage-backed securities it owns under delayed delivery arrangements. Proceeds of TBA sale commitments are not received until the contractual settlement date. During the time a TBA sale commitment is outstanding, equivalent deliverable securities, or an offsetting TBA purchase commitment deliverable on or before the sale commitment date, are held as “cover” for the transaction. If the TBA sale commitment is closed through the acquisition of an offsetting TBA purchase commitment, the fund realizes a gain or loss. If the fund delivers securities under the commitment, the fund realizes a gain or a loss from the sale of the securities based upon the unit price established at the date the commitment was entered into.
TBA commitments, which are accounted for as purchase and sale transactions, may be considered securities themselves, and involve a risk of loss due to changes in the value of the security prior to the settlement date as well as the risk that the counterparty to the transaction will not perform. Counterparty risk is mitigated by having a master agreement between the fund and the counterparty.
Unsettled TBA commitments are valued at their fair value according to the procedures described under “Security valuation” above. The contract is marked to market daily and the change in fair value is recorded by the fund as an unrealized gain or loss. Based on market circumstances, Putnam Management will determine whether to take delivery of the underlying securities or to dispose of the TBA commitments prior to settlement.
TBA purchase commitments outstanding at period end, if any, are listed within the fund’s portfolio and TBA sale commitments outstanding at period end, if any, are listed after the fund’s portfolio.
Master agreements The fund is a party to ISDA (International Swaps and Derivatives Association, Inc.) Master Agreements that govern OTC derivative and foreign exchange contracts and Master Securities Forward Transaction Agreements that govern transactions involving mortgage backed and other asset backed securities that may result in delayed delivery (Master Agreements) with certain counterparties entered into from time to time. The Master Agreements may contain provisions regarding, among other things, the parties’ general obligations, representations, agreements, collateral requirements, events of default and early termination. With respect to certain counterparties, in accordance with the terms of the Master Agreements, collateral posted to the fund is held in a segregated account by the fund’s custodian and with respect to those amounts which can be sold or repledged, are presented in the fund’s portfolio.
Collateral pledged by the fund is segregated by the fund’s custodian and identified in the fund’s portfolio. Collateral can be in the form of cash or debt securities issued by the U.S. Government or related agencies or other securities as agreed to by the fund and the applicable counterparty. Collateral requirements are determined based on the fund’s net position with each counterparty.
With respect to ISDA Master Agreements, termination events applicable to the fund may occur upon a decline in the fund’s net assets below a specified threshold over a certain period of time. Termination events applicable to counterparties may occur upon a decline in the counterparty’s long-term or short-term credit ratings below a specified level. In each case, upon occurrence, the other party may elect to terminate early and cause settlement of all derivative and foreign exchange contracts outstanding, including the payment of any losses and costs resulting from such early termination, as reasonably determined by the terminating party. Any decision by one or more of the fund’s counterparties to elect early termination could impact the fund’s future derivative activity.
58 George Putnam Balanced Fund
At the close of the reporting period, the fund had a net liability position of $133,648 on open derivative contracts subject to the Master Agreements. Collateral posted by the fund at period end for these agreements totaled $109,989 and may include amounts related to unsettled agreements.
Interfund lending The fund, along with other Putnam funds, may participate in an interfund lending program pursuant to an exemptive order issued by the SEC. This program allows the fund to borrow from or lend to other Putnam funds that permit such transactions. Interfund lending transactions are subject to each fund’s investment policies and borrowing and lending limits. Interest earned or paid on the interfund lending transaction will be based on the average of certain current market rates. During the reporting period, the fund did not utilize the program.
Lines of credit The fund participates, along with other Putnam funds, in a $392.5 million unsecured committed line of credit and a $235.5 million unsecured uncommitted line of credit, both provided by State Street. Borrowings may be made for temporary or emergency purposes, including the funding of shareholder redemption requests and trade settlements. Interest is charged to the fund based on the fund’s borrowing at a rate equal to the Federal Funds rate plus 1.25% for the committed line of credit and the Federal Funds rate plus 1.30% for the uncommitted line of credit. A closing fee equal to 0.04% of the committed line of credit and 0.04% of the uncommitted line of credit has been paid by the participating funds. In addition, a commitment fee of 0.11% per annum on any unutilized portion of the committed line of credit is allocated to the participating funds based on their relative net assets and paid quarterly. During the reporting period, the fund had no borrowings against these arrangements.
Federal taxes It is the policy of the fund to distribute all of its taxable income within the prescribed time period and otherwise comply with the provisions of the Internal Revenue Code of 1986, as amended (the Code), applicable to regulated investment companies. It is also the intention of the fund to distribute an amount sufficient to avoid imposition of any excise tax under Section 4982 of the Code.
The fund is subject to the provisions of Accounting Standards Codification 740 Income Taxes (ASC 740). ASC 740 sets forth a minimum threshold for financial statement recognition of the benefit of a tax position taken or expected to be taken in a tax return. The fund did not have a liability to record for any unrecognized tax benefits in the accompanying financial statements. No provision has been made for federal taxes on income, capital gains or unrealized appreciation on securities held nor for excise tax on income and capital gains. Each of the fund’s federal tax returns for the prior three fiscal years remains subject to examination by the Internal Revenue Service.
The fund may also be subject to taxes imposed by governments of countries in which it invests. Such taxes are generally based on either income or gains earned or repatriated. The fund accrues and applies such taxes to net investment income, net realized gains and net unrealized gains as income and/or capital gains are earned. In some cases, the fund may be entitled to reclaim all or a portion of such taxes, and such reclaim amounts, if any, are reflected as an asset on the fund’s books. In many cases, however, the fund may not receive such amounts for an extended period of time, depending on the country of investment.
At July 31, 2014, the fund had a capital loss carryover of $606,868,859 available to the extent allowed by the Code to offset future net capital gain, if any. The amounts of the carryovers and the expiration dates are:
Loss carryover
Short-term
Long-term
Total
Expiration
$606,868,859
$—
$606,868,859
July 31, 2018
Under the Regulated Investment Company Modernization Act of 2010, the fund will be permitted to carry forward capital losses incurred in taxable years beginning after December 22, 2010 for an unlimited period. However, any losses incurred will be required to be utilized prior to the losses incurred in pre-enactment tax years. As a result of this ordering rule, pre-enactment capital loss carryforwards may be more likely to expire unused. Additionally, post-enactment capital losses that are carried forward will retain their character as either short-term or long-term capital losses rather than being considered all short-term as under previous law.
Distributions to shareholders Distributions to shareholders from net investment income are recorded by the fund on the ex-dividend date. Distributions from capital gains, if any, are recorded on the ex-dividend date and paid at least annually. The amount and character of income and gains to be distributed are determined in accordance with income tax regulations, which may differ from generally accepted accounting principles. These differences include temporary and/or permanent differences from unrealized gains and losses on certain futures contracts and from interest only securities. Reclassifications are made to the fund’s capital accounts to reflect income and gains available for distribution (or available capital loss carryovers) under income tax regulations. At the close of the
George Putnam Balanced Fund 59
reporting period, the fund reclassified $620,215 to decrease undistributed net investment income, $32 to decrease paid-in-capital and $620,247 to decrease accumulated net realized loss.
The tax basis components of distributable earnings and the federal tax cost as of the close of the reporting period were as follows:
Unrealized appreciation
$106,861,971
Unrealized depreciation
(16,223,350)
Net unrealized appreciation
90,638,621
Undistributed ordinary income
5,599,461
Capital loss carryforward
(606,868,859)
Cost for federal income tax purposes
$1,259,313,511
Note 2: Management fee, administrative services and other transactions
The fund pays Putnam Management a management fee (based on the fund’s average net assets and computed and paid monthly) at annual rates that may vary based on the average of the aggregate net assets of most open-end funds, as defined in the fund’s management contract, sponsored by Putnam Management. Such annual rates may vary as follows:
0.680%
of the first $5 billion,
0.630%
of the next $5 billion,
0.580%
of the next $10 billion,
0.530%
of the next $10 billion,
0.480%
of the next $50 billion,
0.460%
of the next $50 billion,
0.450%
of the next $100 billion and
0.445%
of any excess thereafter.
The fund’s shareholders approved the fund’s current management contract with Putnam Management effective February 27, 2014. Shareholders were asked to approve the fund’s management contract following the death on October 8, 2013 of The Honourable Paul G. Desmarais, who had controlled directly and indirectly a majority of the voting shares of Power Corporation of Canada, the ultimate parent company of Putnam Management. The substantive terms of the management contract, including terms relating to fees, are identical to the terms of the fund’s previous management contract and reflect the rates provided in the table above.
Putnam Management has contractually agreed, through June 30, 2015, to waive fees or reimburse the fund’s expenses to the extent necessary to limit the cumulative expenses of the fund, exclusive of brokerage, interest, taxes, investment-related expenses, extraordinary expenses, acquired fund fees and expenses and payments under the fund’s investor servicing contract, investment management contract and distribution plans, on a fiscal year-to-date basis to an annual rate of 0.20% of the fund’s average net assets over such fiscal year-to-date period. During the reporting period, the fund’s expenses were not reduced as a result of this limit.
Putnam Investments Limited (PIL), an affiliate of Putnam Management, is authorized by the Trustees to manage a separate portion of the assets of the fund as determined by Putnam Management from time to time. Putnam Management pays a quarterly sub-management fee to PIL for its services at an annual rate of 0.40% of the average net assets of the portion of the fund managed by PIL.
The fund reimburses Putnam Management an allocated amount for the compensation and related expenses of certain officers of the fund and their staff who provide administrative services to the fund. The aggregate amount of all such reimbursements is determined annually by the Trustees.
Custodial functions for the fund’s assets are provided by State Street. Custody fees are based on the fund’s asset level, the number of its security holdings and transaction volumes.
Putnam Investor Services, Inc., an affiliate of Putnam Management, provides investor servicing agent functions to the fund. Putnam Investor Services, Inc. received fees for investor servicing (except for Class R5 and R6 shares) based on the fund’s retail asset level, the number of shareholder accounts in the fund and the level of defined contribution plan assets in the fund. Class R5 shares pay a monthly fee based on the average net assets of class R5 shares at an annual rate of 0.15%. Class R6 shares pay a monthly fee based on the average net assets of class R6 shares at an annual rate of 0.05%. Investor servicing fees will not exceed an annual rate of 0.32% of the fund’s
60 George Putnam Balanced Fund
average net assets. During the reporting period, the expenses for each class of shares related to investor servicing fees were as follows:
Class A
$1,655,645
Class B
40,672
Class C
41,209
Class M
121,727
Class R
1,637
Class R5
10
Class R6
2,063
Class Y
170,387
Total
$2,033,350
The fund has entered into expense offset arrangements with Putnam Investor Services, Inc. and State Street whereby Putnam Investor Services, Inc.’s and State Street’s fees are reduced by credits allowed on cash balances. The fund also reduced expenses through brokerage/service arrangements. For the reporting period, the fund’s expenses were reduced by $1,710 under the expense offset arrangements and by $24,918 under the brokerage/service arrangements.
Each Independent Trustee of the fund receives an annual Trustee fee, of which $766, as a quarterly retainer, has been allocated to the fund, and an additional fee for each Trustees meeting attended. Trustees also are reimbursed for expenses they incur relating to their services as Trustees.
The fund has adopted a Trustee Fee Deferral Plan (the Deferral Plan) which allows the Trustees to defer the receipt of all or a portion of Trustees fees payable on or after July 1, 1995. The deferred fees remain invested in certain Putnam funds until distribution in accordance with the Deferral Plan.
The fund has adopted an unfunded noncontributory defined benefit pension plan (the Pension Plan) covering all Trustees of the fund who have served as a Trustee for at least five years and were first elected prior to 2004. Benefits under the Pension Plan are equal to 50% of the Trustee’s average annual attendance and retainer fees for the three years ended December 31, 2005. The retirement benefit is payable during a Trustee’s lifetime, beginning the year following retirement, for the number of years of service through December 31, 2006. Pension expense for the fund is included in Trustee compensation and expenses in the Statement of operations. Accrued pension liability is included in Payable for Trustee compensation and expenses in the Statement of assets and liabilities. The Trustees have terminated the Pension Plan with respect to any Trustee first elected after 2003.
The fund has adopted distribution plans (the Plans) with respect to its class A, class B, class C, class M and class R shares pursuant to Rule 12b–1 under the Investment Company Act of 1940. The purpose of the Plans is to compensate Putnam Retail Management Limited Partnership, an indirect wholly-owned subsidiary of Putnam Investments, LLC, for services provided and expenses incurred in distributing shares of the fund. The Plans provide for payments by the fund to Putnam Retail Management Limited Partnership at an annual rate of up to 0.35%, 1.00%, 1.00%, 1.00% and 1.00% of the average net assets attributable to class A, class B, class C, class M and class R shares, respectively. The Trustees have approved payment by the fund at an annual rate of 0.25%, 1.00%, 1.00%, 0.75% and 0.50% of the average net assets attributable to class A, class B, class C, class M and class R shares, respectively. During the reporting period, the class specific expenses related to distribution fees were as follows:
Class A
$2,600,547
Class B
255,333
Class C
259,388
Class M
573,778
Class R
5,139
Total
$3,694,185
For the reporting period, Putnam Retail Management Limited Partnership, acting as underwriter, received net commissions of $97,829 and $1,205 from the sale of class A and class M shares, respectively, and received $12,533 and $756 in contingent deferred sales charges from redemptions of class B and class C shares, respectively.
A deferred sales charge of up to 1.00% and 0.65% is assessed on certain redemptions of class A and class M shares, respectively. For the reporting period, Putnam Retail Management Limited Partnership, acting as underwriter, received $11 and no monies on class A and class M redemptions, respectively.
Note 3: Purchases and sales of securities
During the reporting period, cost of purchases and proceeds from sales of investment securities other than short-term investments and TBA commitments aggregated $1,136,405,993 and $1,134,055,200, respectively. These figures include the cost of purchases and proceeds from sales of long-term U.S. government securities of $143,969,053 and $106,254,902, respectively.
George Putnam Balanced Fund 61
Note 4: Capital shares
At the close of the reporting period, there was an unlimited number of shares of beneficial interest authorized. Transactions in capital shares were as follows:
Year ended 7/31/14
Year ended 7/31/13
Class A
Shares
Amount
Shares
Amount
Shares sold
3,457,002
$53,340,713
4,192,665
$57,851,817
Shares issued in connection with reinvestment of distributions
865,398
13,236,487
977,643
13,286,743
4,322,400
66,577,200
5,170,308
71,138,560
Shares repurchased
(8,670,694)
(133,759,528)
(11,171,410)
(153,321,059)
Net decrease
(4,348,294)
$(67,182,328)
(6,001,102)
$(82,182,499)
Year ended 7/31/14
Year ended 7/31/13
Class B
Shares
Amount
Shares
Amount
Shares sold
255,479
$3,898,581
225,486
$3,084,438
Shares issued in connection with reinvestment of distributions
10,559
159,882
14,725
197,393
266,038
4,058,463
240,211
3,281,831
Shares repurchased
(516,806)
(7,864,031)
(726,454)
(9,882,920)
Net decrease
(250,768)
$(3,805,568)
(486,243)
$(6,601,089)
Year ended 7/31/14
Year ended 7/31/13
Class C
Shares
Amount
Shares
Amount
Shares sold
406,682
$6,266,807
205,715
$2,843,106
Shares issued in connection with reinvestment of distributions
10,698
163,564
11,122
150,491
417,380
6,430,371
216,837
2,993,597
Shares repurchased
(199,253)
(3,048,789)
(275,905)
(3,759,607)
Net increase (decrease)
218,127
$3,381,582
(59,068)
$(766,010)
Year ended 7/31/14
Year ended 7/31/13
Class M
Shares
Amount
Shares
Amount
Shares sold
511,230
$7,751,216
515,112
$7,035,008
Shares issued in connection with reinvestment of distributions
45,651
690,532
51,706
693,748
556,881
8,441,748
566,818
7,728,756
Shares repurchased
(799,405)
(12,203,783)
(992,324)
(13,318,610)
Net decrease
(242,524)
$(3,762,035)
(425,506)
$(5,589,854)
Year ended 7/31/14
Year ended 7/31/13
Class R
Shares
Amount
Shares
Amount
Shares sold
15,666
$238,594
18,885
$257,971
Shares issued in connection with reinvestment of distributions
792
12,093
999
13,510
16,458
250,687
19,884
271,481
Shares repurchased
(20,291)
(316,142)
(48,989)
(679,067)
Net decrease
(3,833)
$(65,455)
(29,105)
$(407,586)
62 George Putnam Balanced Fund
For the period 12/2/13 (commencement of operations) to 7/31/14
Class R5
Shares
Amount
Shares sold
655
$10,000
Shares issued in connection with reinvestment of distributions
5
85
660
10,085
Shares repurchased
—
—
Net increase
660
$10,085
For the period 12/2/13 (commencement of operations) to 7/31/14
Class R6
Shares
Amount
Shares sold
464,795
$7,193,232
Shares issued in connection with reinvestment of distributions
3,948
62,454
468,743
7,255,686
Shares repurchased
(29,854)
(483,521)
Net increase
438,889
$6,772,165
Year ended 7/31/14
Year ended 7/31/13
Class Y
Shares
Amount
Shares
Amount
Shares sold
919,081
$14,438,934
3,108,693
$41,013,365
Shares issued in connection with reinvestment of distributions
113,179
1,736,265
113,947
1,560,517
1,032,260
16,175,199
3,222,640
42,573,882
Shares repurchased
(1,316,942)
(20,402,017)
(1,461,776)
(20,013,685)
Net increase (decrease)
(284,682)
$(4,226,818)
1,760,864
$22,560,197
At the close of the reporting period, Putnam Investments, LLC owned the following shares of the fund:
Shares owned
Percentage of ownership
Value
Class R5
660
100%
$10,672
Class R6
660
0.15
10,679
Note 5: Affiliated transactions
Transactions during the reporting period with Putnam Short Term Investment Fund, which is under common ownership and control, were as follows:
Name of affiliate
Fair value at the beginning of the reporting period
Purchase cost
Sale proceeds
Investment income
Fair value at the end of the reporting period
Putnam Short Term Investment Fund*
$115,283,694
$183,404,329
$233,362,952
$73,710
$65,325,071
*Management fees charged to Putnam Short Term Investment Fund have been waived by Putnam Management.
George Putnam Balanced Fund 63
Note 6: Market, credit and other risks
In the normal course of business, the fund trades financial instruments and enters into financial transactions where risk of potential loss exists due to changes in the market (market risk) or failure of the contracting party to the transaction to perform (credit risk). The fund may be exposed to additional credit risk that an institution or other entity with which the fund has unsettled or open transactions will default. The fund may invest a significant portion of its assets in securitized debt instruments, including mortgage-backed and asset-backed investments. The yields and values of these investments are sensitive to changes in interest rates, the rate of principal payments on the underlying assets and the market’s perception of the issuers. The market for these investments may be volatile and limited, which may make them difficult to buy or sell.
Note 7: Summary of derivative activity
The volume of activity for the reporting period for any derivative type that was held during the period is listed below and was as follows based on an average of the holdings at the end of each fiscal quarter:
Futures contracts (number of contracts)
60
Forward currency contracts (contract amount)
$13,400,000
OTC total return swap contracts (notional)
$750,000
The following is a summary of the fair value of derivative instruments as of the close of the reporting period:
Fair value of derivative instruments as of the close of the reporting period
Asset derivatives
Liability derivatives
Derivatives not accounted for as hedging instruments under ASC 815
Statement of assets and liabilities location
Fair value
Statement of assets and liabilities location
Fair value
Foreign exchange contracts
Receivables
$592,960
Payables
$206,274
Equity contracts
Receivables
—
Payables, Net assets — Unrealized depreciation
495,123*
Total
$592,960
$701,397
*Includes cumulative appreciation/depreciation of futures contracts as reported in the fund’s portfolio. Only current day’s variation margin is reported within the Statement of assets and liabilities.
The following is a summary of realized and change in unrealized gains or losses of derivative instruments on the Statement of operations for the reporting period (see Note 1):
Amount of realized gain or (loss) on derivatives recognized in net gain or (loss) on investments
Derivatives not accounted for as hedging instruments under ASC 815
Futures
Forward currency contracts
Swaps
Total
Foreign exchange contracts
$—
$(59,899)
$—
$(59,899)
Equity contracts
198,111
—
27,401
$225,512
Total
$198,111
$(59,899)
$27,401
$165,613
Change in unrealized appreciation or (depreciation) on derivatives recognized in net gain or (loss) on investments
Derivatives not accounted for as hedging instruments under ASC 815
Futures
Forward currency contracts
Swaps
Total
Foreign exchange contracts
$—
$386,686
$—
$386,686
Equity contracts
(449,364)
—
(45,759)
(495,123)
Total
$(449,364)
$386,686
$(45,759)
$(108,437)
64 George Putnam Balanced Fund
This page left blank intentionally.
George Putnam Balanced Fund 65
Note 8: Offsetting of financial and derivative assets and liabilities
The following table summarizes any derivatives, repurchase agreements and reverse repurchase agreements, at the end of the reporting period, that are subject to an enforceable master netting agreement or similar agreement. For securities lending transactions or borrowing transactions associated with securities sold short, if any, see Note 1. For financial reporting purposes, the fund does not offset financial assets and financial liabilities that are subject to the master netting agreements in the Statement of assets and liabilities.
Barclays Bank PLC
Citibank, N.A.
Credit Suisse International
Deutsche Bank AG
HSBC Bank USA, National Association
JPMorgan Chase Bank N.A.
Merrill Lynch, Pierce, Fenner & Smith, Inc.
State Street Bank and Trust Co.
Total
Assets:
OTC Total return swap contracts*#
$—
$—
$—
$—
$—
$—
$—
$—
$—
Futures contracts§
—
—
—
—
—
—
—
—
—
Forward currency contracts#
47,013
82,325
186,429
—
—
149,529
—
127,664
592,960
Total Assets
$47,013
$82,325
$186,429
$—
$—
$149,529
$—
$127,664
$592,960
Liabilities:
OTC Total return swap contracts*#
—
—
—
—
—
45,759
—
—
45,759
Futures contracts§
—
—
—
—
—
—
497,705
—
497,705
Forward currency contracts#
3,339
—
39,749
76,440
57,208
29,538
—
—
206,274
Total Liabilities
$3,339
$—
$39,749
$76,440
$57,208
$75,297
$497,705
$—
$749,738
Total Financial and Derivative Net Assets
$43,674
$82,325
$146,680
$(76,440)
$(57,208)
$74,232
$(497,705)
$127,664
$(156,778)
Total collateral received (pledged)†##
$—
$—
$—
$(76,440)
$—
$74,232
$—
$—
Net amount
$43,674
$82,325
$146,680
$—
$(57,208)
$—
$(497,705)
$127,664
*
Excludes premiums, if any. Included in unrealized appreciation and depreciation on OTC swap contracts on the Statement of assets and liabilities.
†
Additional collateral may be required from certain brokers based on individual agreements.
#
Covered by master netting agreement. (Note 1)
##
Any over-collateralization of total financial and derivative net assets is not shown. Collateral may include amounts related to unsettled agreements.
§
Includes current day’s variation margin only as reported on the Statement of assets and liabilities, which is not collateralized. Cumulative appreciation/(depreciation) for futures contracts and centrally cleared swap contracts is represented in the tables listed after the fund’s portfolio.
66
George Putnam Balanced Fund
George Putnam Balanced Fund
67
Federal tax information (Unaudited)
The fund designated 77.89% of ordinary income distributions as qualifying for the dividends received deduction for corporations.
For the reporting period, the fund hereby designates 90.63%, or the maximum amount allowable, of its taxable ordinary income distributions as qualified dividends taxed at the individual net capital gain rates.
For the reporting period, pursuant to §871(k) of the Internal Revenue Code, the fund hereby designates $5,941,042 of distributions paid as qualifying to be taxed as interest-related dividends for nonresident alien shareholders.
The Form 1099 that will be mailed to you in January 2015 will show the tax status of all distributions paid to your account in calendar 2014.
68 George Putnam Balanced Fund
Shareholder meeting results (Unaudited)
February 27, 2014 special meeting
At the meeting, each of the nominees for Trustees was elected as follows:
Votes for
Votes withheld
Liaquat Ahamed
55,511,831
1,928,831
Ravi Akhoury
55,538,167
1,902,495
Barbara M. Baumann
55,796,892
1,643,770
Jameson A. Baxter
55,808,512
1,632,150
Charles B. Curtis
55,743,844
1,696,818
Robert J. Darretta
55,731,009
1,709,653
Katinka Domotorffy
55,587,888
1,852,774
John A. Hill
55,805,275
1,635,387
Paul L. Joskow
55,807,596
1,633,067
Kenneth R. Leibler
55,768,192
1,672,470
Robert E. Patterson
55,779,277
1,661,385
George Putnam, III
55,730,564
1,710,098
Robert L. Reynolds
55,796,756
1,643,906
W. Thomas Stephens
55,796,638
1,644,024
A proposal to approve a new management contract between the fund and Putnam Management was approved as follows:
Votes for
Votes against
Abstentions
Broker non-votes
46,505,623
1,122,183
2,319,981
7,492,875
A proposal to adopt an Amended and Restated Declaration of Trust was approved as follows:
Votes for
Votes against
Abstentions
Broker non-votes
46,132,082
1,213,335
2,602,371
7,492,873
All tabulations are rounded to the nearest whole number.
George Putnam Balanced Fund 69
About the Trustees
Independent Trustees
Liaquat Ahamed
Born 1952, Trustee since 2012
Principal occupations during past five years: Pulitzer Prize-winning author of Lords of Finance: The Bankers Who Broke the World, whose articles on economics have appeared in such publications as the New York Times, Foreign Affairs, and the Financial Times. Director of Aspen Insurance Co., a New York Stock Exchange company, and Chair of the Aspen Board’s Investment Committee. Trustee of the Brookings Institution and Chair of its Investment Committee.
Other directorships: The Rohatyn Group, an emerging-market fund complex that manages money for institutions
Ravi Akhoury
Born 1947, Trustee since 2009
Principal occupations during past five years: Trustee of American India Foundation and of the Rubin Museum. From 1992 to 2007, was Chairman and CEO of MacKay Shields, a multi-product investment management firm.
Other directorships: RAGE Frameworks, Inc., a private software company; English Helper, Inc., a private software company
Barbara M. Baumann
Born 1955, Trustee since 2010
Principal occupations during past five years: President and Owner of Cross Creek Energy Corporation, a strategic consultant to domestic energy firms and direct investor in energy projects. Current Board member of The Denver Foundation. Former Chair and current Board member of Girls Incorporated of Metro Denver. Member of the Finance Committee, the Children’s Hospital of Colorado.
Other directorships: Devon Energy Corporation, a leading independent natural gas and oil exploration and production company; UNS Energy Corporation, an Arizona utility; Cody Resources Management, a private company in the energy and ranching businesses
Jameson A. Baxter
Born 1943, Trustee since 1994, Vice Chair from 2005 to 2011, and Chair since 2011
Principal occupations during past five years: President of Baxter Associates, Inc., a private investment firm. Chair of Mutual Fund Directors Forum. Chair Emeritus of the Board of Trustees of Mount Holyoke College. Director of the Adirondack Land Trust and Trustee of the Nature Conservancy’s Adirondack Chapter.
Charles B. Curtis
Born 1940, Trustee since 2001
Principal occupations during past five years: Senior Advisor to the Center for Strategic and International Studies. President Emeritus and former President and Chief Operating Officer of the Nuclear Threat Initiative, a private foundation dealing with national security issues. Member of the Council on Foreign Relations and U.S. State Department International Security Advisory Board.
Robert J. Darretta
Born 1946, Trustee since 2007
Principal occupations during past five years: From 2009 until 2012, served as Health Care Industry Advisor to Permira, a global private equity firm. Until April 2007, was Vice Chairman of the Board of Directors of Johnson & Johnson. Served as Johnson & Johnson’s Chief Financial Officer for a decade.
Other directorships: UnitedHealth Group, a diversified health-care company
Katinka Domotorffy
Born 1975, Trustee since 2012
Principal occupations during past five years: Voting member of the Investment Committees of the Anne Ray Charitable Trust and Margaret A. Cargill Foundation, part of the Margaret A. Cargill Philanthropies. Until 2011, Partner, Chief Investment Officer, and Global Head of Quantitative Investment Strategies at Goldman Sachs Asset Management.
Other directorships: Reach Out and Read of Greater New York, an organization dedicated to promoting childhood literacy
John A. Hill
Born 1942, Trustee since 1985 and Chairman from 2000 to 2011
Principal occupations during past five years: Founder and Vice-Chairman of First Reserve Corporation, the leading private equity buyout firm focused on the worldwide energy industry. Trustee and Chairman of the Board of Trustees of Sarah Lawrence College. Member of the Advisory Board of the Millstein Center for Global Markets and Corporate Ownership at The Columbia University Law School.
Other directorships: Devon Energy Corporation, a leading independent natural gas and oil exploration and production company
70 George Putnam Balanced Fund
Paul L. Joskow
Born 1947, Trustee since 1997
Principal occupations during past five years: Economist and President of the Alfred P. Sloan Foundation, a philanthropic institution focused primarily on research and education on issues related to science, technology, and economic performance. Elizabeth and James Killian Professor of Economics, Emeritus at the Massachusetts Institute of Technology (MIT). Prior to 2007, served as the Director of the Center for Energy and Environmental Policy Research at MIT.
Other directorships: Yale University; Exelon Corporation, an energy company focused on power services; Boston Symphony Orchestra; Prior to April 2013, served as Director of TransCanada Corporation and TransCanada Pipelines Ltd., energy companies focused on natural gas transmission, oil pipelines and power services
Kenneth R. Leibler
Born 1949, Trustee since 2006
Principal occupations during past five years: Founder and former Chairman of Boston Options Exchange, an electronic marketplace for the trading of derivative securities. Serves on the Board of Trustees of Beth Israel Deaconess Hospital in Boston, Massachusetts. Director of Beth Israel Deaconess Care Organization. Until November 2010, director of Ruder Finn Group, a global communications and advertising firm.
Other directorships: Northeast Utilities, which operates New England’s largest energy delivery system
Robert E. Patterson
Born 1945, Trustee since 1984
Principal occupations during past five years: Co-Chairman of Cabot Properties, Inc., a private equity firm investing in commercial real estate, and Chairman of its Investment Committee. Past Chairman and Trustee of the Joslin Diabetes Center.
George Putnam, III
Born 1951, Trustee since 1984
Principal occupations during past five years: Chairman of New Generation Research, Inc., a publisher of financial advisory and other research services. Founder and President of New Generation Advisors, LLC, a registered investment advisor to private funds. Director of The Boston Family Office, LLC, a registered investment advisor.
W. Thomas Stephens
Born 1942, Trustee from 1997 to 2008 and since 2009
Principal occupations during past five years: Retired as Chairman and Chief Executive Officer of Boise Cascade, LLC, a paper, forest products, and timberland assets company, in December 2008. Prior to 2010, Director of Boise Inc., a manufacturer of paper and packaging products.
Other directorships: TransCanada Pipelines Ltd., an energy infrastructure company
Interested Trustee
Robert L. Reynolds*
Born 1952, Trustee since 2008 and President of the Putnam Funds since 2009
Principal occupations during past five years: President and Chief Executive Officer of Putnam Investments since 2008 and, since 2014, President and Chief Executive Officer of Great-West Financial, a financial services company that provides retirement savings plans, life insurance, and annuity and executive benefits products, and of Great-West Lifeco U.S. Inc., a holding company that owns Putnam Investments and Great-West Financial. Prior to joining Putnam Investments, served as Vice Chairman and Chief Operating Officer of Fidelity Investments from 2000 to 2007.
*Mr. Reynolds is an “interested person” (as defined in the Investment Company Act of 1940) of the fund and Putnam Investments. He is President and Chief Executive Officer of Putnam Investments, as well as the President of your fund and each of the other Putnam funds.
The address of each Trustee is One Post Office Square, Boston, MA 02109.
As of July 31, 2014, there were 116 Putnam funds. All Trustees serve as Trustees of all Putnam funds.
Each Trustee serves for an indefinite term, until his or her resignation, retirement at age 75, removal, or death.
George Putnam Balanced Fund 71
Officers
In addition to Robert L. Reynolds, the other officers of the fund are shown below:
Jonathan S. Horwitz (Born 1955)
Executive Vice President, Principal Executive Officer, and Compliance Liaison
Since 2004
Steven D. Krichmar (Born 1958)
Vice President and Principal Financial Officer
Since 2002
Chief of Operations, Putnam Investments and Putnam Management
Robert T. Burns (Born 1961)
Vice President and Chief Legal Officer
Since 2011
General Counsel, Putnam Investments, Putnam Management, and Putnam Retail Management
Manager of Finance, Dunkin’ Brands (2008–2010); Senior Financial Analyst, Old Mutual Asset Management (2007–2008); Senior Financial Analyst, Putnam Investments (1999–2007)
Janet C. Smith (Born 1965)
Vice President, Principal Accounting Officer, and Assistant Treasurer
Since 2007
Director of Fund Administration Services, Putnam Investments and Putnam Management
Susan G. Malloy (Born 1957)
Vice President and Assistant Treasurer
Since 2007
Director of Accounting & Control Services, Putnam Investments and Putnam Management
James P. Pappas (Born 1953)
Vice President
Since 2004
Director of Trustee Relations, Putnam Investments and Putnam Management
Mark C. Trenchard (Born 1962)
Vice President and BSA Compliance Officer
Since 2002
Director of Operational Compliance, Putnam Investments and Putnam Retail Management
Nancy E. Florek (Born 1957)
Vice President, Director of Proxy Voting and Corporate Governance, Assistant Clerk, and Associate Treasurer
Since 2000
The principal occupations of the officers for the past five years have been with the employers as shown above, although in some cases they have held different positions with such employers. The address of each Officer is One Post Office Square, Boston, MA 02109.
72 George Putnam Balanced Fund
Services for shareholders
Investor services
Systematic investment plan Tell us how much you wish to invest regularly — weekly, semimonthly, or monthly — and the amount you choose will be transferred automatically from your checking or savings account. There’s no additional fee for this service, and you can suspend it at any time. This plan may be a great way to save for college expenses or to plan for your retirement.
Please note that regular investing does not guarantee a profit or protect against loss in a declining market. Before arranging a systematic investment plan, consider your financial ability to continue making purchases in periods when prices are low.
Systematic exchange You can make regular transfers from one Putnam fund to another Putnam fund. There are no additional fees for this service, and you can cancel or change your options at any time.
Dividends PLUS You can choose to have the dividend distributions from one of your Putnam funds automatically reinvested in another Putnam fund at no additional charge.
Free exchange privilege You can exchange money between Putnam funds free of charge, as long as they are the same class of shares. A signature guarantee is required if you are exchanging more than $500,000. The fund reserves the right to revise or terminate the exchange privilege.
Reinstatement privilege If you’ve sold Putnam shares or received a check for a dividend or capital gain, you may reinvest the proceeds with Putnam within 90 days of the transaction and they will be reinvested at the fund’s current net asset value — with no sales charge. However, reinstatement of class B shares may have special tax consequences. Ask your financial or tax representative for details.
Check-writing service You have ready access to many Putnam accounts. It’s as simple as writing a check, and there are no special fees or service charges. For more information about the check-writing service, call Putnam or visit our website.
Dollar cost averaging When you’re investing for long-term goals, it’s time, not timing, that counts. Investing on a systematic basis is a better strategy than trying to figure out when the markets will go up or down. This means investing the same amount of money regularly over a long period. This method of investing is called dollar cost averaging. When a fund’s share price declines, your investment dollars buy more shares at lower prices. When it increases, they buy fewer shares. Over time, you will pay a lower average price per share.
For more information
Visit the Individual Investors section at putnam.com A secure section of our website contains complete information on your account, including balances and transactions, updated daily. You may also conduct transactions, such as exchanges, additional investments, and address changes. Log on today to get your password.
Call us toll free at 1-800-225-1581 Ask a helpful Putnam representative or your financial advisor for details about any of these or other services, or see your prospectus.
George Putnam Balanced Fund 73
The Putnam family of funds
The following is a list of Putnam’s open-end mutual funds offered to the public. Investors should carefully consider the investment objective, risks, charges, and expenses of a fund before investing. For a prospectus, or a summary prospectus if available, containing this and other information for any Putnam fund or product, call your financial advisor at 1-800-225-1581 and ask for a prospectus. Please read the prospectus carefully before investing.
Growth
Growth Opportunities Fund
International Growth Fund
Multi-Cap Growth Fund
Small Cap Growth Fund
Voyager Fund
Blend
Asia Pacific Equity Fund
Capital Opportunities Fund
Capital Spectrum Fund
Emerging Markets Equity Fund
Equity Spectrum Fund
Europe Equity Fund
Global Equity Fund
International Capital Opportunities Fund
International Equity Fund
Investors Fund
Low Volatility Equity Fund
Multi-Cap Core Fund
Research Fund
Strategic Volatility Equity Fund
Value
Convertible Securities Fund
Equity Income Fund
Global Dividend Fund
The Putnam Fund for Growth and Income
International Value Fund
Multi-Cap Value Fund
Small Cap Value Fund
Income
American Government Income Fund
Diversified Income Trust
Emerging Markets Income Fund
Floating Rate Income Fund
Global Income Trust
High Yield Advantage Fund
High Yield Trust
Income Fund
Money Market Fund*
Short Duration Income Fund
U.S. Government Income Trust
Tax-free income
AMT-Free Municipal Fund
Intermediate-Term Municipal Income Fund
Short-Term Municipal Income Fund
Tax Exempt Income Fund
Tax Exempt Money Market Fund*
Tax-Free High Yield Fund
State tax-free income funds:
Arizona, California, Massachusetts, Michigan, Minnesota, New Jersey, New York, Ohio, and Pennsylvania.
* An investment in a money market fund is not insured or guaranteed by the Federal Deposit Insurance Corporation or any other government agency. Although the fund seeks to preserve the value of your investment at $1.00 per share, it is possible to lose money by investing in the fund.
74 George Putnam Balanced Fund
Absolute Return
Absolute Return 100 Fund®
Absolute Return 300 Fund®
Absolute Return 500 Fund®
Absolute Return 700 Fund®
Global Sector
Global Consumer Fund
Global Energy Fund
Global Financials Fund
Global Health Care Fund
Global Industrials Fund
Global Natural Resources Fund
Global Sector Fund
Global Technology Fund
Global Telecommunications Fund
Global Utilities Fund
Asset Allocation
Putnam Global Asset Allocation Funds — portfolios with allocations to stocks, bonds, and money market instruments that are adjusted dynamically within specified ranges as market conditions change.
Dynamic Asset Allocation Balanced Fund
Dynamic Asset Allocation Conservative Fund
Dynamic Asset Allocation Growth Fund
Dynamic Risk Allocation Fund
George Putnam Balanced Fund
Putnam RetirementReady® Funds — portfolios with automatically adjusting allocations to stocks, bonds, and money market instruments, becoming more conservative over time.
RetirementReady 2055 Fund
RetirementReady 2050 Fund
RetirementReady 2045 Fund
RetirementReady 2040 Fund
RetirementReady 2035 Fund
RetirementReady 2030 Fund
RetirementReady 2025 Fund
RetirementReady 2020 Fund
RetirementReady 2015 Fund
Putnam Retirement Income Lifestyle Funds — portfolios with managed allocations to stocks, bonds, and money market investments to generate retirement income.
Retirement Income Fund Lifestyle 1
Retirement Income Fund Lifestyle 2
Retirement Income Fund Lifestyle 3
Check your account balances and the most recent month-end performance in the Individual Investors section at putnam.com.
George Putnam Balanced Fund 75
Fund information
Founded over 75 years ago, Putnam Investments was built around the concept that a balance between risk and reward is the hallmark of a well-rounded financial program. We manage over 100 funds across income, value, blend, growth, asset allocation, absolute return, and global sector categories.
Investment Manager
Putnam Investment Management, LLC One Post Office Square Boston, MA 02109
Investment Sub-Manager
Putnam Investments Limited 57–59 St James’s Street London, England SW1A 1LD
Marketing Services
Putnam Retail Management One Post Office Square Boston, MA 02109
Custodian
State Street Bank and Trust Company
Legal Counsel
Ropes & Gray LLP
Auditor
PricewaterhouseCoopers LLP
Trustees
Jameson A. Baxter, Chair Liaquat Ahamed Ravi Akhoury Barbara M. Baumann Charles B. Curtis Robert J. Darretta Katinka Domotorffy John A. Hill Paul L. Joskow Kenneth R. Leibler Robert E. Patterson George Putnam, III Robert L. Reynolds W. Thomas Stephens
Officers
Robert L. Reynolds President
Jonathan S. Horwitz Executive Vice President, Principal Executive Officer, and Compliance Liaison
Steven D. Krichmar Vice President and Principal Financial Officer
Robert T. Burns Vice President and Chief Legal Officer
Robert R. Leveille Vice President and Chief Compliance Officer
Michael J. Higgins Vice President, Treasurer, and Clerk
Janet C. Smith Vice President, Principal Accounting Officer, and Assistant Treasurer
Susan G. Malloy Vice President and Assistant Treasurer
James P. Pappas Vice President
Mark C. Trenchard Vice President and BSA Compliance Officer
Nancy E. Florek Vice President, Director of Proxy Voting and Corporate Governance, Assistant Clerk, and Associate Treasurer
This report is for the information of shareholders of George Putnam Balanced Fund. It may also be used as sales literature when preceded or accompanied by the current prospectus, the most recent copy of Putnam’s Quarterly Performance Summary, and Putnam’s Quarterly Ranking Summary. For more recent performance, please visit putnam.com. Investors should carefully consider the investment objectives, risks, charges, and expenses of a fund, which are described in its prospectus. For this and other information or to request a prospectus or summary prospectus, call 1-800-225-1581 toll free. Please read the prospectus carefully before investing. The fund’s Statement of Additional Information contains additional information about the fund’s Trustees and is available without charge upon request by calling 1-800-225-1581.
Item 2. Code of Ethics:
(a) The fund’s principal executive, financial and accounting officers are employees of Putnam Investment Management, LLC, the Fund’s investment manager. As such they are subject to a comprehensive Code of Ethics adopted and administered by Putnam Investments which is designed to protect the interests of the firm and its clients. The Fund has adopted a Code of Ethics which incorporates the Code of Ethics of Putnam Investments with respect to all of its officers and Trustees who are employees of Putnam Investment Management, LLC. For this reason, the Fund has not adopted a separate code of ethics governing its principal executive, financial and accounting officers.
(c) In July 2013, the Code of Ethics of Putnam Investment Management, LLC was amended. The changes to the Code of Ethics were as follows: (i) eliminating the requirement for employees to hold their shares of Putnam mutual funds for specified periods of time, (ii) removing the requirement to preclear transactions in certain kinds of exchange-traded funds and exchange-traded notes, although reporting of all such instruments remains required; (iii) eliminating the excessive trading rule related to employee transactions in securities requiring preclearance under the Code; (iv) adding provisions related to monitoring of employee trading; (v) changing from a set number of shares to a set dollar value of stock of mid- and large-cap companies on the Restricted List that can be purchased or sold; (vi) adding a requirement starting in March 2014 for employees to generally use certain approved brokers that provide Putnam with an electronic feed of transactions and statements for their personal brokerage accounts; and (vii) certain other changes.
Item 3. Audit Committee Financial Expert:
The Funds’ Audit and Compliance Committee is comprised solely of Trustees who are “independent” (as such term has been defined by the Securities and Exchange Commission (“SEC”) in regulations implementing Section 407 of the Sarbanes-Oxley Act (the “Regulations”)). The Trustees believe that each of the members of the Audit and Compliance Committee also possess a combination of knowledge and experience with respect to financial accounting matters, as well as other attributes, that qualify them for service on the Committee. In addition, the Trustees have determined that each of Mr. Leibler, Mr. Hill, Mr. Darretta, and Ms. Baumann qualifies as an “audit committee financial expert” (as such term has been defined by the Regulations) based on their review of his or her pertinent experience and education. The SEC has stated, and the funds’ amended and restated agreement and Declaration of Trust provides, that the designation or identification of a person as an audit committee financial expert pursuant to this Item 3 of Form N-CSR does not impose on such person any duties, obligations or liability that are greater than the duties, obligations and liability imposed on such person as a member of the Audit and Compliance Committee and the Board of Trustees in the absence of such designation or identification.
Item 4. Principal Accountant Fees and Services:
The following table presents fees billed in each of the last two fiscal years for services rendered to the fund by the fund’s independent auditor:
Fiscal year ended
Audit Fees
Audit-Related Fees
Tax Fees
All Other Fees
July 31, 2014
$101,245
$ —
$15,714
$ —
July 31, 2013
$117,377
$ —
$15,659
$ —
For the fiscal years ended July 31, 2014 and July 31, 2013, the fund’s independent auditor billed aggregate non-audit fees in the amounts of $591,888 and $163,159 respectively, to the fund, Putnam Management and any entity controlling, controlled by or under common control with Putnam Management that provides ongoing services to the fund.
Audit Fees represent fees billed for the fund’s last two fiscal years relating to the audit and review of the financial statements included in annual reports and registration statements, and other services that are normally provided in connection with statutory and regulatory filings or engagements.
Audit-Related Fees represent fees billed in the fund’s last two fiscal years for services traditionally performed by the fund’s auditor, including accounting consultation for proposed transactions or concerning financial accounting and reporting standards and other audit or attest services not required by statute or regulation.
Tax Fees represent fees billed in the fund’s last two fiscal years for tax compliance, tax planning and tax advice services. Tax planning and tax advice services include assistance with tax audits, employee benefit plans and requests for rulings or technical advice from taxing authorities.
Pre-Approval Policies of the Audit and Compliance Committee. The Audit and Compliance Committee of the Putnam funds has determined that, as a matter of policy, all work performed for the funds by the funds’ independent auditors will be pre-approved by the Committee itself and thus will generally not be subject to pre-approval procedures.
The Audit and Compliance Committee also has adopted a policy to pre-approve the engagement by Putnam Management and certain of its affiliates of the funds’ independent auditors, even in circumstances where pre-approval is not required by applicable law. Any such requests by Putnam Management or certain of its affiliates are typically submitted in writing to the Committee and explain, among other things, the nature of the proposed engagement, the estimated fees, and why this work should be performed by that particular audit firm as opposed to another one. In reviewing such requests, the Committee considers, among other things, whether the provision of such services by the audit firm are compatible with the independence of the audit firm.
The following table presents fees billed by the fund’s independent auditor for services required to be approved pursuant to paragraph (c)(7)(ii) of Rule 2-01 of Regulation S-X.
Fiscal year ended
Audit-Related Fees
Tax Fees
All Other Fees
Total Non-Audit Fees
July 31, 2014
$ —
$576,174
$ —
$ —
July 31, 2013
$ —
$147,500
$ —
$ —
Item 5. Audit Committee of Listed Registrants
Not applicable
Item 6. Schedule of Investments:
The registrant’s schedule of investments in unaffiliated issuers is included in the report to shareholders in Item 1 above.
Item 7. Disclosure of Proxy Voting Policies and Procedures For Closed-End Management Investment Companies:
Not applicable
Item 8. Portfolio Managers of Closed-End Investment Companies
Not Applicable
Item 9. Purchases of Equity Securities by Closed-End Management Investment Companies and Affiliated Purchasers:
Not applicable
Item 10. Submission of Matters to a Vote of Security Holders:
Not applicable
Item 11. Controls and Procedures:
(a) The registrant’s principal executive officer and principal financial officer have concluded, based on their evaluation of the effectiveness of the design and operation of the registrant’s disclosure controls and procedures as of a date within 90 days of the filing date of this report, that the design and operation of such procedures are generally effective to provide reasonable assurance that information required to be disclosed by the registrant in this report is recorded, processed, summarized and reported within the time periods specified in the Commission’s rules and forms.
(b) Changes in internal control over financial reporting: Not applicable
Item 12. Exhibits:
(a)(1) The Code of Ethics of The Putnam Funds, which incorporates the Code of Ethics of Putnam Investments, is filed herewith.
(a)(2) Separate certifications for the principal executive officer and principal financial officer of the registrant as required by Rule 30a-2(a) under the Investment Company Act of 1940, as amended, are filed herewith.
(b) The certifications required by Rule 30a-2(b) under the Investment Company Act of 1940, as amended, are filed herewith.
SIGNATURES
Pursuant to the requirements of the Securities Exchange Act of 1934 and the Investment Company Act of 1940, the registrant has duly caused this report to be signed on its behalf by the undersigned, thereunto duly authorized.
The George Putnam Fund of Boston
By (Signature and Title):
/s/Janet C. Smith Janet C. Smith Principal Accounting Officer
Date: September 26, 2014
Pursuant to the requirements of the Securities Exchange Act of 1934 and the Investment Company Act of 1940, this report has been signed below by the following persons on behalf of the registrant and in the capacities and on the dates indicated.
By (Signature and Title):
/s/Jonathan S. Horwitz Jonathan S. Horwitz Principal Executive Officer
Date: September 26, 2014
By (Signature and Title):
/s/Steven D. Krichmar Steven D. Krichmar Principal Financial Officer
Date: September 26, 2014
We use cookies on this site to provide a more responsive and personalized service. Continuing to browse, clicking I Agree, or closing this banner indicates agreement. See our Cookie Policy for more information.