| | |
| UNITED STATES
SECURITIES AND EXCHANGE COMMISSION |
| | |
| CERTIFIED SHAREHOLDER REPORT OF REGISTERED
MANAGEMENT INVESTMENT COMPANIES
|
| | |
| Investment Company Act file number: | (811-00058) |
| | |
| Exact name of registrant as specified in charter: | George Putnam Balanced Fund |
| | |
| Address of principal executive offices: | One Post Office Square, Boston, Massachusetts 02109 |
| | |
| Name and address of agent for service: | Robert T. Burns, Vice President
One Post Office Square
Boston, Massachusetts 02109 |
| | |
| Copy to: | Bryan Chegwidden, Esq.
Ropes & Gray LLP
1211 Avenue of the Americas
New York, New York 10036 |
| | |
| Registrant's telephone number, including area code: | (617) 292-1000 |
| | |
| Date of fiscal year end: | July 31, 2017 |
| | |
| Date of reporting period : | August 1, 2016 — July 31, 2017 |
| | |
|
Item 1. Report to Stockholders: | |
| | |
| The following is a copy of the report transmitted to stockholders pursuant to Rule 30e-1 under the Investment Company Act of 1940: | |

George Putnam
Balanced
Fund
Annual report
7 | 31 | 17
Consider these risks before investing: Stock and bond prices may fall or fail to rise over time for several reasons, including general financial market conditions, changing market perceptions (including perceptions about the risk of default and expectations about monetary policy or interest rates), changes in government intervention in the financial markets, and factors related to a specific issuer or industry. These factors may also lead to increased volatility and reduced liquidity in the bond markets. Growth stocks may be more susceptible to earnings disappointments, and value stocks may fail to rebound. Bond investments are subject to interest-rate risk (the risk of bond prices falling if interest rates rise) and credit risk (the risk of an issuer defaulting on interest or principal payments). Interest-rate risk is greater for longer-term bonds, and credit risk is greater for below-investment-grade bonds. Risks associated with derivatives include increased investment exposure (which may be considered leverage) and, in the case of over-the-counter instruments, the potential inability to terminate or sell derivatives positions and the potential failure of the other party to the instrument to meet its obligations. You can lose money by investing in the fund.
Message from the Trustees
September 8, 2017
Dear Fellow Shareholder:
A fair amount of investor optimism has helped to fuel financial markets in 2017, and global stock and bond markets have generally fared well. At the same time, however, a number of macroeconomic and geopolitical risks around the world could disrupt the positive momentum.
While calm markets are generally welcome, we believe investors should continue to remember time-tested strategies: maintain a well-diversified portfolio, keep a long-term view, and speak regularly with your financial advisor. In the following pages, you will find an overview of your fund’s performance for the reporting period as well as an outlook for the coming months.
We would like to take this opportunity to announce some changes to your fund’s Board of Trustees. First, we are pleased to welcome the arrival of Catharine Bond Hill and Manoj P. Singh, who bring extensive professional and directorship experience to their new roles as Putnam Trustees. In addition, we would like to extend our appreciation and best wishes to Robert J. Darretta, John A. Hill, and W. Thomas Stephens, who retired from the Board, effective June 30, 2017. We are grateful for their years of work on behalf of you and your fellow shareholders, and we wish them well in their future endeavors.
Thank you for investing with Putnam.


The George Putnam Balanced Fund was introduced in 1937, at a time when many investors considered the stock market to be risky. Named for the founder of Putnam Investments, the fund offered an innovative concept for the time — a diversified portfolio with bonds to balance the risk of stocks.
A balanced approach, grounded in research
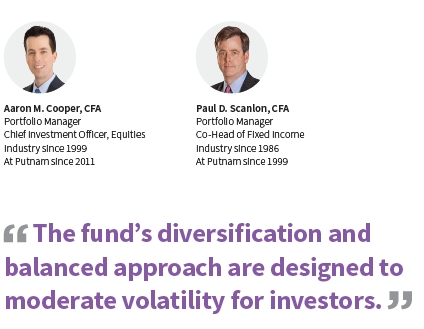
The fund’s classic balanced approach continues to serve investors today, under the leadership of seasoned portfolio managers who use fundamental research to find opportunities and manage risk.
|
| 2 George Putnam Balanced Fund |
Experienced managers pursue a broad range of opportunities
The fund’s typical allocation is 60% stocks and 40% bonds. In managing the stock portion of the portfolio, Aaron Cooper pursues a risk-aware style, investing in stocks across all sectors that may have value or growth characteristics. For the fund��s fixed-income investments, Paul Scanlon assembles a mix of government and investment-grade bonds. Historically, government bonds have shown relatively low correlation with stocks, which can help to dampen the impact of stock market downturns on fund performance.
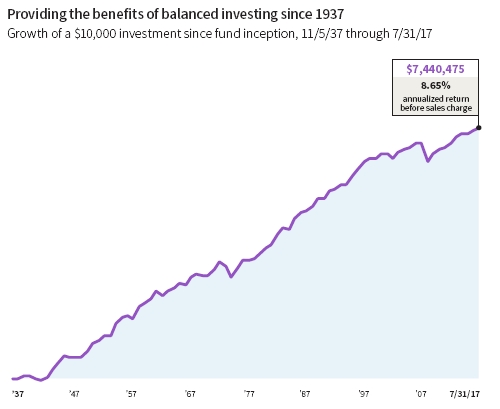
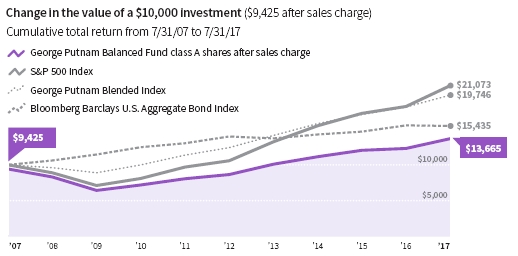
Data are historical. Past performance is not a guarantee of future results. More recent returns may be less or more than those shown. Investment return and principal value will fluctuate, and you may have a gain or a loss when you sell your shares. For the most recent month-end performance, visit putnam.com. Performance assumes reinvestment of distributions and does not account for taxes. Returns for class A shares do not reflect a sales charge of 5.75%. Had a sales charge been reflected, returns would have been lower. Returns for other classes of shares may vary. The period illustrated is longer than the investment horizon of many investors.
The chart is plotted on a logarithmic scale so that comparable percentage changes appear similar.
|
| George Putnam Balanced Fund 3 |
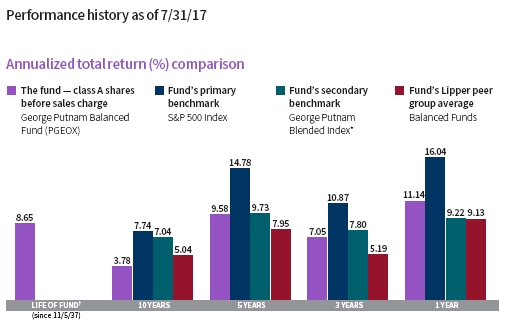
Current performance may be lower or higher than the quoted past performance, which cannot guarantee future results. Share price, principal value, and return will fluctuate, and you may have a gain or a loss when you sell your shares. Performance of class A shares assumes reinvestment of distributions and does not account for taxes. Fund returns in the bar chart do not reflect a sales charge of 5.75%; had they, returns would have been lower. See below and pages 10–13 for additional performance information. For a portion of the periods, the fund had expense limitations, without which returns would have been lower. To obtain the most recent month-end performance, visit putnam.com.
* The George Putnam Blended Index is an unmanaged index administered by Putnam Management, 60% of which is the S&P 500 Index and 40% of which is the Bloomberg Barclays U.S. Aggregate Bond Index.
† The fund’s benchmarks (S&P 500 Index and George Putnam Blended Index) were introduced on 12/31/69 and 12/31/78, respectively, and its Lipper group (Balanced Funds) was introduced on 12/31/59; they all post-date the inception of the fund’s class A shares.
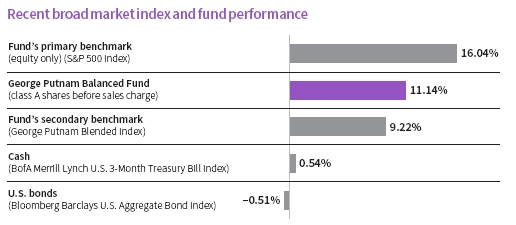
This comparison shows your fund’s performance in the context of broad market indexes for the 12 months ended 7/31/17. See above and pages 10–13 for additional fund performance information. Index descriptions can be found on pages 15–16.
|
| 4 George Putnam Balanced Fund |


Aaron is Chief Investment Officer, Equities, at Putnam. He holds an A.B. from Harvard University. Aaron joined Putnam in 2011 and has been in the investment industry since 1999.

Paul is Co-Head of Fixed Income at Putnam. He has an M.B.A. from the University of Chicago Booth School of Business and a B.A. from Colgate University. Paul joined Putnam in 1999 and has been in the investment industry since 1986.
How would you characterize the stock market environment for the fiscal period?
AARON Overall, it was a strong period for U.S. stocks. Although notable market turbulence occurred in the weeks leading up to the U.S. presidential election, following the vote, stock prices rose in anticipation of a new business-friendly administration.
This market rally largely continued for the rest of the fund’s reporting period. The Dow Jones Industrial Average surpassed the 20,000 level in February, and the U.S. bull market observed its eighth anniversary in March. Through the end of the period in July, the market experienced relatively low volatility and new record highs for major indexes. Along with these positive factors, however, comes a decidedly lower level of optimism about Washington’s progress in implementing pro-growth, business-friendly policies.
PAUL During the period, anticipation of federal stimulus policies pushed bond yields higher and prices, which move in the opposite direction of yields, declined. This was a large factor affecting the fixed-income component of the portfolio [about 40% of assets]. The Federal Reserve increased its target for short-term
|
| George Putnam Balanced Fund 5 |
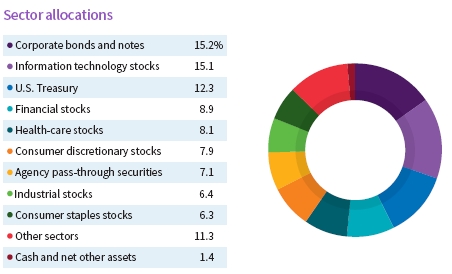
Allocations are shown as a percentage of the fund’s net assets as of 7/31/17. Cash and net other assets, if any, represent the market value weights of cash, derivatives, short-term securities, and other unclassified assets in the portfolio. Summary information may differ from the portfolio schedule included in the financial statements due to the inclusion of derivative securities, any interest accruals, the exclusion of as-of trades, if any, the use of different classifications of securities for presentation purposes, and rounding. Holdings and allocations may vary over time.
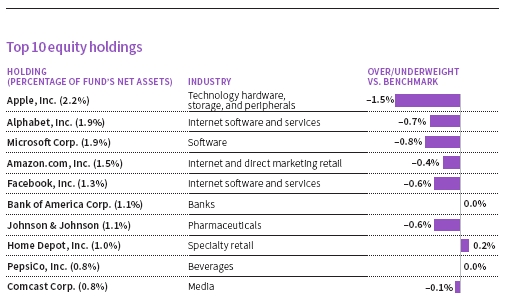
This table shows the fund’s top 10 holdings by percentage of the fund’s net assets as of 7/31/17. Short-term investments and derivatives, if any, are excluded. Holdings may vary over time.
|
| 6 George Putnam Balanced Fund |
interest rates three times during the period. The benchmark 10-year Treasury yield moved higher in November, then fluctuated in a narrow range until reaching its high for the fund’s 12-month reporting period in March. Fortunately, corporate bonds performed better than Treasuries.
How did the fund perform within this environment?
AARON The fund performed well, outperforming its custom-blended secondary benchmark index, which reflects the fund’s balance of stocks and bonds. The outperformance was driven primarily by favorable stock selection in the equity portion of the portfolio, although the fixed-income holdings also performed well on a relative basis.
It is worth noting that, in the equity portion of the portfolio, we have increased our stock-specific focus over the past 12 months. We eliminated smaller positions and underweight positions. We directed our analyst team to focus more time on their best investment ideas.
What were the performance highlights of the fund’s corporate bond allocation?
PAUL Our corporate credit investment strategy generally performed very well during the period. Favorable corporate fundamentals and strong demand from international investors were positive tailwinds for investment-grade bonds. These factors drove valuations versus Treasuries tighter throughout the period. We also believe the current environment will provide positive momentum for investment-grade bonds, particularly in the financials sector, which composes a large segment of the opportunity set.
What were some stock selections that contributed to fund performance during the reporting period?
AARON Our decision to maintain an underweight position, relative to the benchmark, in General Electric [GE] was a significant contributor. We have been pessimistic about GE because our analysts believe the company’s earnings power is well below what the company claims, and that the company has a poor ability to convert earnings to cash. We believe that GE’s core industrial end markets remain challenged, particularly power generation and oil and gas equipment. The recent replacement of GE’s CEO reinforced our pessimism about this stock.

Another bearish stance that paid off was our underweight position in Exxon, as the company struggled to combat falling oil prices. We continue to underweight integrated oil companies relative to the benchmark while favoring exploration and production companies with low-cost U.S. shale acreage. We believe these companies, given adequate inventory, can outperform in a variety of scenarios for oil prices.
Another contributor to benchmark outperformance was the fund’s overweight position in Charter Communications, one of the nation’s largest cable companies. We believe Charter has a talented management team that has made some impressive strategic decisions. As consumers have gravitated toward more mini-malist cable bundles, Charter has been creative with its over-the-top offerings, maximizing customer retention in an increasingly dynamic space, in our view. We also believe Charter is positioned to benefit from the anticipated market-wide transition to 5G — fifth generation wireless networks.
What were some detractors from performance during the period?
AARON Performance was dampened by our decision to avoid the stock of Boeing, which performed well over the period. As a manufacturer, Boeing has benefited from recent
|
| George Putnam Balanced Fund 7 |
pricing and consolidation in the commercial airline industry. We have pursued opportunities created by these developments by focusing on other areas of the product chain. One step we have taken on this front has been building positions in companies on the supply end, such as United Technologies.
Another strong-performing stock that was not held in the fund was Citi. This commercial bank thrived alongside other large banks, all of which benefited from expectations of higher rates and a less-burdensome regulatory environment. Much like the decision we made with Boeing, we have participated in this bank-stock rally at other points, one of which was our investment in Bank of America [BofA]. We like BofA because of its strong footing outside commercial banking, specifically through its wealth management arm, Merrill Lynch.
What is your outlook for the bond market?
PAUL We remain constructive on the U.S. investment-grade corporate bond market because of what we view as solid fundamental and favorable technical conditions, and because we consider valuations to be generally fair. Regarding fundamentals, earnings results for the first quarter of 2017 largely exceeded market expectations, with strength in the banking, technology, and energy sectors. The only notable weakness during this period was in telecommunications. Preliminary second-quarter earnings results have also generally outperformed market expectations with notable strength in energy and technology, but continued weakness in telecommunications.
We anticipate that fundamentals will continue to be supportive for corporate credit, subject to uncertainty about government policy initiatives. Regarding technical conditions, we expect to see elevated new issue supply, tempered by the decline in pending transactions related to corporate mergers and acquisitions. U.S. corporates will likely continue to be supported by a solid fundamental backdrop, international flows, and European Central Bank purchase
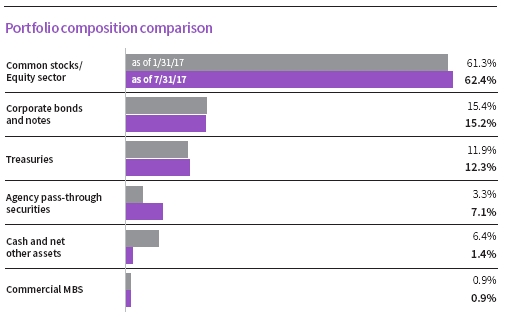
This chart shows how the fund’s top weightings have changed over the past six months. Allocations are shown as a percentage of the fund’s net assets. Current period summary information may differ from the portfolio schedule included in the financial statements due to the inclusion of derivative securities, any interest accruals, the exclusion of as-of trades, if any, the use of different classifications of securities for presentation purposes, and rounding. Holdings and allocations may vary over time.
|
| 8 George Putnam Balanced Fund |
programs focused on corporate bonds over the near-term. We continue to find current spread levels to be appropriate versus underlying fundamental risk. However, we think it will be challenging for corporate spreads to perform as strongly as they did in the reporting period.
What is your outlook for the stock market and the fund’s equity positioning over the coming months?
AARON We are skeptical that the current low level of volatility will persist as the economic cycle further matures, central banks globally begin to shrink balance sheets, and political uncertainty remains high. That said, corporate earnings have been quite robust, and if coupled with lower tax rates through fiscal policy progress, we believe we could see continued stable or even accelerating growth. The fund has a slight orientation toward growth stocks as we head into our new fiscal year. The growth tilt in the portfolio reflects a degree of caution regarding the advanced stage of the current economic cycle and gathering pessimism about the emergence of stimulus policies from Washington.
I will emphasize, however, that this growth orientation is very much at the margin. As I have mentioned, this is a best ideas fund, and we structure our investments to favor stock-specific risk. As has been the case in the past, our principal focus will be on our discrete investment ideas, especially as we continue to reduce the total number of holdings in the portfolio and place greater emphasis on stocks in which we have the greatest conviction.
Aaron and Paul, thanks for your comments today about the fund.
The views expressed in this report are exclusively those of Putnam Management and are subject to change. They are not meant as investment advice.
Please note that the holdings discussed in this report may not have been held by the fund for the entire period. Portfolio composition is subject to review in accordance with the fund’s investment strategy and may vary in the future. Current and future portfolio holdings are subject to risk.
|
| George Putnam Balanced Fund 9 |
Your fund’s performance
This section shows your fund’s performance, price, and distribution information for periods ended July 31, 2017, the end of its most recent fiscal year. In accordance with regulatory requirements for mutual funds, we also include performance information as of the most recent calendar quarter-end and expense information taken from the fund’s current prospectus. Performance should always be considered in light of a fund’s investment strategy. Data represent past performance. Past performance does not guarantee future results. More recent returns may be less or more than those shown. Investment return and principal value will fluctuate, and you may have a gain or a loss when you sell your shares. Performance information does not reflect any deduction for taxes a shareholder may owe on fund distributions or on the redemption of fund shares. For the most recent month-end performance, please visit the Individual Investors section at putnam.com or call Putnam at 1-800-225-1581. Class R, R5, R6, and Y shares are not available to all investors. See the Terms and Definitions section in this report for definitions of the share classes offered by your fund.
Fund performance Total return for periods ended 7/31/17
| | | | | | | | |
| | Annual | | | | | | | |
| | average | | Annual | | Annual | | Annual | |
| | (life of fund) | 10 years | average | 5 years | average | 3 years | average | 1 year |
|
| Class A (11/5/37) | | | | | | | | |
| Before sales charge | 8.65% | 44.98% | 3.78% | 57.99% | 9.58% | 22.68% | 7.05% | 11.14% |
|
| After sales charge | 8.57 | 36.65 | 3.17 | 48.90 | 8.29 | 15.62 | 4.96 | 4.75 |
|
| Class B (4/27/92) | | | | | | | | |
| Before CDSC | 8.54 | 36.36 | 3.15 | 52.17 | 8.76 | 19.96 | 6.25 | 10.33 |
|
| After CDSC | 8.54 | 36.36 | 3.15 | 50.17 | 8.47 | 16.96 | 5.36 | 5.33 |
|
| Class C (7/26/99) | | | | | | | | |
| Before CDSC | 7.83 | 34.63 | 3.02 | 52.24 | 8.77 | 20.01 | 6.27 | 10.29 |
|
| After CDSC | 7.83 | 34.63 | 3.02 | 52.24 | 8.77 | 20.01 | 6.27 | 9.29 |
|
| Class M (12/1/94) | | | | | | | | |
| Before sales charge | 7.92 | 38.00 | 3.27 | 54.13 | 9.04 | 20.89 | 6.53 | 10.53 |
|
| After sales charge | 7.87 | 33.17 | 2.91 | 48.74 | 8.26 | 16.66 | 5.27 | 6.66 |
|
| Class R (1/21/03) | | | | | | | | |
| Net asset value | 8.38 | 41.59 | 3.54 | 56.09 | 9.31 | 21.79 | 6.79 | 10.90 |
|
| Class R5 (12/2/13) | | | | | | | | |
| Net asset value | 8.73 | 48.86 | 4.06 | 60.16 | 9.88 | 23.70 | 7.35 | 11.46 |
|
| Class R6 (12/2/13) | | | | | | | | |
| Net asset value | 8.73 | 49.36 | 4.09 | 60.70 | 9.95 | 24.05 | 7.45 | 11.57 |
|
| Class Y (3/31/94) | | | | | | | | |
| Net asset value | 8.73 | 48.72 | 4.05 | 60.01 | 9.86 | 23.65 | 7.33 | 11.37 |
Current performance may be lower or higher than the quoted past performance, which cannot guarantee future results. After-sales-charge returns for class A and M shares reflect the deduction of the maximum 5.75% and 3.50% sales charge, respectively, levied at the time of purchase. Class B share returns after contingent deferred sales charge (CDSC) reflect the applicable CDSC, which is 5% in the first year, declining over time to 1% in the sixth year, and is eliminated thereafter. Class C share returns after CDSC reflect a 1% CDSC for the first year that is eliminated thereafter. Class R, R5, R6, and Y shares have no initial sales charge or CDSC. Performance for class B, C, M, R, and Y shares before their inception is derived from the historical performance of class A shares, adjusted for the applicable sales charge (or CDSC) and the higher operating expenses for such shares, except for class Y shares, for which 12b-1 fees are not applicable. Performance for class R5 and R6 shares prior to their inception is derived from the historical performance
|
| 10 George Putnam Balanced Fund |
of class Y shares and has not been adjusted for the lower investor servicing fees applicable to class R5 and R6 shares; had it, returns would have been higher.
For a portion of the periods, the fund had expense limitations, without which returns would have been lower.
Class B share performance reflects conversion to class A shares after eight years.
Comparative index returns For periods ended 7/31/17
| | | | | | | | |
| | Annual | | | | | | | |
| | average | | Annual | | Annual | | Annual | |
| | (life of fund) | 10 years | average | 5 years | average | 3 years | average | 1 year |
|
| S&P 500 Index | —* | 110.73% | 7.74% | 99.22% | 14.78% | 36.29% | 10.87% | 16.04% |
|
| Bloomberg Barclays U.S. | | | | | | | | |
| Aggregate Bond Index | —* | 54.35 | 4.44 | 10.52 | 2.02 | 8.37 | 2.71 | –0.51 |
|
| George Putnam Blended | | | | | | | | |
| Index† | —* | 97.46 | 7.04 | 59.10 | 9.73 | 25.26 | 7.80 | 9.22 |
|
| Lipper Balanced Funds | | | | | | | | |
| category average‡ | —* | 64.41 | 5.04 | 46.96 | 7.95 | 16.48 | 5.19 | 9.13 |
Index and Lipper results should be compared with fund performance before sales charge, before CDSC, or at net asset value.
* The fund’s benchmarks (S&P 500 Index and George Putnam Blended Index) were introduced on 12/31/69 and 12/31/78, respectively; the Bloomberg Barclays U.S. Aggregate Bond Index was introduced on 12/31/75; and the fund’s Lipper group (Balanced Funds) was introduced on 12/31/59; they all post-date the inception of the fund’s class A shares.
† The George Putnam Blended Index is an unmanaged index administered by Putnam Management, 60% of which is the S&P 500 Index and 40% of which is the Bloomberg Barclays U.S. Aggregate Bond Index.
‡ Over the 1-year, 3-year, 5-year, and 10-year periods ended 7/31/17, there were 607, 564, 527, and 422 funds, respectively, in this Lipper category.
Past performance does not indicate future results. At the end of the same time period, a $10,000 investment in the fund’s class B and C shares would have been valued at $13,636 and $13,463, respectively, and no contingent deferred sales charges would apply. A $10,000 investment in the fund’s class M shares ($9,650 after sales charge) would have been valued at $13,317. A $10,000 investment in the fund’s class R, R5, R6, and Y shares would have been valued at $14,159, $14,886, $14,936, and $14,872, respectively.
|
| George Putnam Balanced Fund 11 |
Fund price and distribution information For the 12-month period ended 7/31/17
| | | | | | | | | | |
| Distributions | Class A | Class B | Class C | Class M | Class R | ClassR5 | ClassR6 | Class Y |
|
| Number | 4 | 4 | 4 | 4 | 4 | 3 | 4 | 4 |
|
| Income | $0.212 | $0.079 | $0.081 | $0.127 | $0.178 | $0.195 | $0.279 | $0.257 |
|
| Capital gains | — | — | — | — | — | — | — | — |
|
| Total | $0.212 | $0.079 | $0.081 | $0.127 | $0.178 | $0.195 | $0.279 | $0.257 |
|
| | Before | After | Net | Net | Before | After | Net | Net | Net | Net |
| | sales | sales | asset | asset | sales | sales | asset | asset | asset | asset |
| Share value | charge | charge | value | value | charge | charge | value | value | value | value |
|
| 7/31/16 | $17.38 | $18.44 | $17.18 | $17.26 | $17.15 | $17.77 | $17.33 | $17.45 | $17.45 | $17.45 |
|
| 7/31/17 | 19.09 | 20.25 | 18.87 | 18.95 | 18.82 | 19.50 | 19.03 | 19.24 | 19.17 | 19.16 |
|
| Current rate | Before | After | Net | Net | Before | After | Net | Net | Net | Net |
| (end of | sales | sales | asset | asset | sales | sales | asset | asset | asset | asset |
| period) | charge | charge | value | value | charge | charge | value | value | value | value |
|
| Current | | | | | | | | | | |
| dividend rate1 | 1.13% | 1.07% | 0.38% | 0.42% | 0.68% | 0.66% | 0.92% | 1.39% | 1.48% | 1.38% |
|
| Current | | | | | | | | | | |
| 30-day | | | | | | | | | | |
| SEC yield2 | N/A | 0.95 | 0.27 | 0.27 | N/A | 0.50 | 0.76 | 1.31 | 1.37 | 1.25 |
The classification of distributions, if any, is an estimate. Before-sales-charge share value and current dividend rate for class A and M shares, if applicable, do not take into account any sales charge levied at the time of purchase. After-sales-charge share value, current dividend rate, and current 30-day SEC yield, if applicable, are calculated assuming that the maximum sales charge (5.75% for class A shares and 3.50% for class M shares) was levied at the time of purchase. Final distribution information will appear on your year-end tax forms.
1 Most recent distribution, including any return of capital and excluding capital gains, annualized and divided by share price before or after sales charge at period-end.
2 Based only on investment income and calculated using the maximum offering price for each share class, in accordance with SEC guidelines.
|
| 12 George Putnam Balanced Fund |
Fund performance as of most recent calendar quarter Total return for periods ended 6/30/17
| | | | | | | | |
| | Annual | | | | | | | |
| | average | | Annual | | Annual | | Annual | |
| | (life of fund) | 10 years | average | 5 years | average | 3 years | average | 1 year |
|
| Class A (11/5/37) | | | | | | | | |
| Before sales charge | 8.63% | 39.09% | 3.35% | 57.92% | 9.57% | 19.33% | 6.07% | 12.56% |
|
| After sales charge | 8.55 | 31.09 | 2.74 | 48.84 | 8.28 | 12.47 | 4.00 | 6.09 |
|
| Class B (4/27/92) | | | | | | | | |
| Before CDSC | 8.52 | 30.85 | 2.72 | 52.14 | 8.75 | 16.70 | 5.28 | 11.74 |
|
| After CDSC | 8.52 | 30.85 | 2.72 | 50.14 | 8.47 | 13.70 | 4.37 | 6.74 |
|
| Class C (7/26/99) | | | | | | | | |
| Before CDSC | 7.82 | 29.05 | 2.58 | 52.13 | 8.75 | 16.63 | 5.26 | 11.70 |
|
| After CDSC | 7.82 | 29.05 | 2.58 | 52.13 | 8.75 | 16.63 | 5.26 | 10.70 |
|
| Class M (12/1/94) | | | | | | | | |
| Before sales charge | 7.91 | 32.40 | 2.85 | 54.10 | 9.03 | 17.53 | 5.53 | 12.01 |
|
| After sales charge | 7.86 | 27.76 | 2.48 | 48.71 | 8.26 | 13.42 | 4.29 | 8.09 |
|
| Class R (1/21/03) | | | | | | | | |
| Net asset value | 8.37 | 35.82 | 3.11 | 55.90 | 9.29 | 18.39 | 5.79 | 12.33 |
|
| Class R5 (12/2/13) | | | | | | | | |
| Net asset value | 8.72 | 42.77 | 3.62 | 60.02 | 9.86 | 20.28 | 6.35 | 12.89 |
|
| Class R6 (12/2/13) | | | | | | | | |
| Net asset value | 8.72 | 43.31 | 3.66 | 60.63 | 9.94 | 20.68 | 6.47 | 13.05 |
|
| Class Y (3/31/94) | | | | | | | | |
| Net asset value | 8.72 | 42.70 | 3.62 | 59.94 | 9.85 | 20.21 | 6.33 | 12.86 |
See the discussion following the fund performance table on page 10 for information about the calculation of fund performance.
Your fund’s expenses
As a mutual fund investor, you pay ongoing expenses, such as management fees, distribution fees (12b-1 fees), and other expenses. Using the following information, you can estimate how these expenses affect your investment and compare them with the expenses of other funds. You may also pay one-time transaction expenses, including sales charges (loads) and redemption fees, which are not shown in this section and would have resulted in higher total expenses. For more information, see your fund’s prospectus or talk to your financial representative.
Expense ratios
| | | | | | | | |
| | Class A | Class B | Class C | Class M | Class R | Class R5 | Class R6 | Class Y |
|
| Total annual operating | | | | | | | | |
| expenses for the fiscal year | | | | | | | | |
| ended 7/31/16 | 1.02%* | 1.77%* | 1.77%* | 1.52%* | 1.27%* | 0.73% | 0.63% | 0.77%* |
|
| Annualized expense ratio | | | | | | | | |
| for the six-month period | | | | | | | | |
| ended 7/31/17† | 1.01% | 1.76% | 1.76% | 1.51% | 1.26% | 0.74% | 0.64% | 0.76% |
Fiscal-year expense information in this table is taken from the most recent prospectus, is subject to change, and may differ from that shown for the annualized expense ratio and in the financial highlights of this report.
Expenses are shown as a percentage of average net assets.
|
| George Putnam Balanced Fund 13 |
* Restated to reflect current fees resulting from a change to the fund’s investor servicing arrangements effective 9/1/16.
† Expense ratios for each class are for the fund’s most recent fiscal half year. As a result of this, ratios may differ from expense ratios based on one-year data in the financial highlights.
Expenses per $1,000
The following table shows the expenses you would have paid on a $1,000 investment in each class of the fund from 2/1/17 to 7/31/17. It also shows how much a $1,000 investment would be worth at the close of the period, assuming actual returns and expenses.
| | | | | | | | |
| | Class A | Class B | Class C | Class M | Class R | Class R5 | Class R6 | Class Y |
|
| Expenses paid per $1,000*† | $5.18 | $9.01 | $9.01 | $7.73 | $6.46 | $3.80 | $3.29 | $3.90 |
|
| Ending value (after expenses) | $1,068.50 | $1,064.80 | $1,065.20 | $1,065.80 | $1,067.80 | $1,070.90 | $1,070.70 | $1,070.10 |
* Expenses for each share class are calculated using the fund’s annualized expense ratio for each class, which represents the ongoing expenses as a percentage of average net assets for the six months ended 7/31/17. The expense ratio may differ for each share class.
† Expenses are calculated by multiplying the expense ratio by the average account value for the period; then multiplying the result by the number of days in the period; and then dividing that result by the number of days in the year.
Estimate the expenses you paid
To estimate the ongoing expenses you paid for the six months ended 7/31/17, use the following calculation method. To find the value of your investment on 2/1/17, call Putnam at 1-800-225-1581.

Compare expenses using the SEC’s method
The Securities and Exchange Commission (SEC) has established guidelines to help investors assess fund expenses. Per these guidelines, the following table shows your fund’s expenses based on a $1,000 investment, assuming a hypothetical 5% annualized return. You can use this information to compare the ongoing expenses (but not transaction expenses or total costs) of investing in the fund with those of other funds. All mutual fund shareholder reports will provide this information to help you make this comparison. Please note that you cannot use this information to estimate your actual ending account balance and expenses paid during the period.
| | | | | | | | |
| | Class A | Class B | Class C | Class M | Class R | Class R5 | Class R6 | Class Y |
|
| Expenses paid per $1,000*† | $5.06 | $8.80 | $8.80 | $7.55 | $6.31 | $3.71 | $3.21 | $3.81 |
|
| Ending value (after expenses) | $1,019.79 | $1,016.07 | $1,016.07 | $1,017.31 | $1,018.55 | $1,021.12 | $1,021.62 | $1,021.03 |
* Expenses for each share class are calculated using the fund’s annualized expense ratio for each class, which represents the ongoing expenses as a percentage of average net assets for the six months ended 7/31/17. The expense ratio may differ for each share class.
† Expenses are calculated by multiplying the expense ratio by the average account value for the six-month period; then multiplying the result by the number of days in the six-month period; and then dividing that result by the number of days in the year.
|
| 14 George Putnam Balanced Fund |
Terms and definitions
Important terms
Total return shows how the value of the fund’s shares changed over time, assuming you held the shares through the entire period and reinvested all distributions in the fund.
Before sales charge, or net asset value, is the price, or value, of one share of a mutual fund, without a sales charge. Before-sales-charge figures fluctuate with market conditions, and are calculated by dividing the net assets of each class of shares by the number of outstanding shares in the class.
After sales charge is the price of a mutual fund share plus the maximum sales charge levied at the time of purchase. After-sales-charge performance figures shown here assume the 5.75% maximum sales charge for class A shares and 3.50% for class M shares.
Contingent deferred sales charge (CDSC) is generally a charge applied at the time of the redemption of class B or C shares and assumes redemption at the end of the period. Your fund’s class B CDSC declines over time from a 5% maximum during the first year to 1% during the sixth year. After the sixth year, the CDSC no longer applies. The CDSC for class C shares is 1% for one year after purchase.
Current rate is the annual rate of return earned from dividends or interest of an investment. Current rate is expressed as a percentage of the price of a security, fund share, or principal investment.
Share classes
Class A shares are generally subject to an initial sales charge and no CDSC (except on certain redemptions of shares bought without an initial sales charge).
Class B shares are closed to new investments and are only available by exchange from another Putnam fund or through dividend and/or capital gains reinvestment. They are not subject to an initial sales charge and may be subject to a CDSC.
Class C shares are not subject to an initial sales charge and are subject to a CDSC only if the shares are redeemed during the first year.
Class M shares have a lower initial sales charge and a higher 12b-1 fee than class A shares and no CDSC.
Class R shares are not subject to an initial sales charge or CDSC and are only available to employer-sponsored retirement plans.
Class R5 and R6 shares are not subject to an initial sales charge or CDSC, and carry no 12b-1 fee. They are only available to employer-sponsored retirement plans.
Class Y shares are not subject to an initial sales charge or CDSC, and carry no 12b-1 fee. They are generally only available to corporate and institutional clients and clients in other approved programs.
Comparative indexes
Bloomberg Barclays U.S. Aggregate Bond Index is an unmanaged index of U.S. investment-grade fixed-income securities.
BofA Merrill Lynch U.S. 3-Month Treasury Bill Index is an unmanaged index that seeks to measure the performance of U.S. Treasury bills available in the marketplace.
George Putnam Blended Index is an unmanaged index administered by Putnam Management, LLC, 60% of which is the S&P 500 Index and 40% of which is the Bloomberg Barclays U.S. Aggregate Bond Index.
S&P 500 Index is an unmanaged index of common stock performance.
Indexes assume reinvestment of all distributions and do not account for fees. Securities and performance of a fund and an index will differ. You cannot invest directly in an index.
Merrill Lynch, Pierce, Fenner & Smith Incorporated (“BofAML”), used with permission. BofAML permits use of the BofAML indices and related data on an “as is”
|
| George Putnam Balanced Fund 15 |
basis, makes no warranties regarding same, does not guarantee the suitability, quality, accuracy, timeliness, and/or completeness of the BofAML indices or any data included in, related to, or derived therefrom, assumes no liability in connection with the use of the foregoing, and does not sponsor, endorse, or recommend Putnam Investments, or any of its products or services.
Lipper is a third-party industry-ranking entity that ranks mutual funds. Its rankings do not reflect sales charges. Lipper rankings are based on total return at net asset value relative to other funds that have similar current investment styles or objectives as determined by Lipper. Lipper may change a fund’s category assignment at its discretion. Lipper category averages reflect performance trends for funds within a category.
Other information for shareholders
Proxy voting
Putnam is committed to managing our mutual funds in the best interests of our shareholders. The Putnam funds’ proxy voting guidelines and procedures, as well as information regarding how your fund voted proxies relating to portfolio securities during the 12-month period ended June 30, 2017, are available in the Individual Investors section of putnam.com, and on the Securities and Exchange Commission (SEC) website, www.sec.gov. If you have questions about finding forms on the SEC’s website, you may call the SEC at 1-800-SEC-0330. You may also obtain the Putnam funds’ proxy voting guidelines and procedures at no charge by calling Putnam’s Shareholder Services at 1-800-225-1581.
Fund portfolio holdings
The fund will file a complete schedule of its portfolio holdings with the SEC for the first and third quarters of each fiscal year on Form N-Q. Shareholders may obtain the fund’s Form N-Q on the SEC’s website at www.sec.gov. In addition, the fund’s Form N-Q may be reviewed and copied at the SEC’s Public Reference Room in Washington, D.C. You may call the SEC at 1-800-SEC-0330 for information about the SEC’s website or the operation of the Public Reference Room.
Trustee and employee fund ownership
Putnam employees and members of the Board of Trustees place their faith, confidence, and, most importantly, investment dollars in Putnam mutual funds. As of July 31, 2017, Putnam employees had approximately $501,000,000 and the Trustees had approximately $88,000,000 invested in Putnam mutual funds. These amounts include investments by the Trustees’ and employees’ immediate family members as well as investments through retirement and deferred compensation plans.
|
| 16 George Putnam Balanced Fund |
Important notice regarding Putnam’s privacy policy
In order to conduct business with our shareholders, we must obtain certain personal information such as account holders’ names, addresses, Social Security numbers, and dates of birth. Using this information, we are able to maintain accurate records of accounts and transactions.
It is our policy to protect the confidentiality of our shareholder information, whether or not a shareholder currently owns shares of our funds. In particular, it is our policy not to sell information about you or your accounts to outside marketing firms. We have safeguards in place designed to prevent unauthorized access to our computer systems and procedures to protect personal information from unauthorized use.
Under certain circumstances, we must share account information with outside vendors who provide services to us, such as mailings and proxy solicitations. In these cases, the service providers enter into confidentiality agreements with us, and we provide only the information necessary to process transactions and perform other services related to your account. Finally, it is our policy to share account information with your financial representative, if you’ve listed one on your Putnam account.
|
| George Putnam Balanced Fund 17 |
Trustee approval of management contract
General conclusions
The Board of Trustees of The Putnam Funds oversees the management of each fund and, as required by law, determines annually whether to approve the continuance of your fund’s management contract with Putnam Investment Management, LLC (“Putnam Management”) and the sub-management contract with respect to your fund between Putnam Management and its affiliate, Putnam Investments Limited (“PIL”). The Board, with the assistance of its Contract Committee, requests and evaluates all information it deems reasonably necessary under the circumstances in connection with its annual contract review. The Contract Committee consists solely of Trustees who are not “interested persons” (as this term is defined in the Investment Company Act of 1940, as amended (the “1940 Act”)) of The Putnam Funds (“Independent Trustees”).
At the outset of the review process, members of the Board’s independent staff and independent legal counsel discussed with representatives of Putnam Management the annual contract review materials furnished to the Contract Committee during the course of the previous year’s review, identifying possible changes in these materials that might be necessary or desirable for the coming year. Following these discussions and in consultation with the Contract Committee, the Independent Trustees’ independent legal counsel requested that Putnam Management and its affiliates furnish specified information, together with any additional information that Putnam Management considered relevant, to the Contract Committee. Over the course of several months ending in June 2017, the Contract Committee met on a number of occasions with representatives of Putnam Management, and separately in executive session, to consider the information that Putnam Management provided. Throughout this process, the Contract Committee was assisted by the members of the Board’s independent staff and by independent legal counsel for The Putnam Funds and the Independent Trustees.
In May 2017, the Contract Committee met in executive session to discuss and consider its recommendations with respect to the continuance of the contracts. At the Trustees’ June 2017 meeting, the Contract Committee met in executive session with the other Independent Trustees to review a summary of the key financial, performance and other data that the Contract Committee considered in the course of its review. The Contract Committee then presented its written report, which summarized the key factors that the Committee had considered and set forth its recommendations. The Contract Committee recommended, and the Independent Trustees approved, the continuance of your fund’s management and sub-management contracts, effective July 1, 2017. (Because PIL is an affiliate of Putnam Management and Putnam Management remains fully responsible for all services provided by PIL, the Trustees have not attempted to evaluate PIL as a separate entity, and all subsequent references to Putnam Management below should be deemed to include reference to PIL as necessary or appropriate in the context.)
The Independent Trustees’ approval was based on the following conclusions:
• That the fee schedule in effect for your fund represented reasonable compensation in light of the nature and quality of the services being provided to the fund, the fees paid by competitive funds, the costs incurred by Putnam Management in providing services to the fund, and the continued application of certain reductions and waivers noted below; and
• That the fee schedule in effect for your fund represented an appropriate sharing between fund shareholders and Putnam Management of such economies of scale as may exist in the management of the fund at current asset levels.
These conclusions were based on a comprehensive consideration of all information provided to the Trustees and were not the result of any single factor. Some of the factors that figured particularly in the Trustees’ deliberations and how the Trustees considered these factors are described below, although individual Trustees may have evaluated the information presented differently, giving different weights to various factors. It is also important to recognize that the management arrangements for your fund and the other Putnam funds are the result of many years of review and discussion between the Independent Trustees and Putnam Management, that some aspects of the arrangements may receive greater scrutiny in some years than others, and that the Trustees’ conclusions may be based, in part, on their consideration of fee arrangements in previous years. For example, with some minor exceptions, the funds’ current fee arrangements under the
|
| 18 George Putnam Balanced Fund |
management contracts were first implemented at the beginning of 2010 following extensive review by the Contract Committee and discussions with representatives of Putnam Management, as well as approval by shareholders.
Management fee schedules and total expenses
The Trustees reviewed the management fee schedules in effect for all Putnam funds, including fee levels and breakpoints. The Trustees also reviewed the total expenses of each Putnam fund, recognizing that in most cases management fees represented the major, but not the sole, determinant of total costs to fund shareholders. (In a few instances, funds have implemented so-called “all-in” management fees covering substantially all routine fund operating costs.)
In reviewing fees and expenses, the Trustees generally focus their attention on material changes in circumstances — for example, changes in assets under management, changes in a fund’s investment strategy, changes in Putnam Management’s operating costs or profitability, or changes in competitive practices in the mutual fund industry — that suggest that consideration of fee changes might be warranted. The Trustees concluded that the circumstances did not indicate that changes to the management fee structure for your fund would be appropriate at this time.
Under its management contract, your fund has the benefit of breakpoints in its management fee schedule that provide shareholders with economies of scale in the form of reduced fee rates as assets under management in the Putnam family of funds increase. The Trustees concluded that the fee schedule in effect for your fund represented an appropriate sharing of economies of scale between fund shareholders and Putnam Management.
As in the past, the Trustees also focused on the competitiveness of each fund’s total expense ratio. In order to support the effort to have fund expenses meet competitive standards, the Trustees and Putnam Management have implemented certain expense limitations that were in effect during your fund’s fiscal year ending in 2016. These expense limitations were: (i) a contractual expense limitation applicable to specified retail open-end funds, including your fund, of 32 basis points on investor servicing fees and expenses and (ii) a contractual expense limitation applicable to specified open-end funds, including your fund, of 20 basis points on so-called “other expenses” (i.e., all expenses exclusive of management fees, distribution fees, investor servicing fees, investment-related expenses, interest, taxes, brokerage commissions, acquired fund fees and expenses and extraordinary expenses). These expense limitations attempt to maintain competitive expense levels for the funds. Most funds, including your fund, had sufficiently low expenses that these expense limitations were not operative during their fiscal years ending in 2016. Putnam Management has agreed to maintain the 32 basis points expense limitation (reduced to 25 basis points effective September 1, 2016) until at least August 31, 2018 and to maintain the 20 basis points expense limitation until at least November 30, 2018. Putnam Management’s support for these expense limitation arrangements was an important factor in the Trustees’ decision to approve the continuance of your fund’s management and sub-management contracts.
The Trustees reviewed comparative fee and expense information for a custom group of competitive funds selected by Broadridge Financial Solutions, Inc. (“Broadridge”). This comparative information included your fund’s percentile ranking for effective management fees and total expenses (excluding any applicable 12b-1 fee), which provides a general indication of your fund’s relative standing. In the custom peer group, your fund ranked in the first quintile in effective management fees (determined for your fund and the other funds in the custom peer group based on fund asset size and the applicable contractual management fee schedule) and in the second quintile in total expenses (excluding any applicable 12b-1 fees) as of December 31, 2016. The first quintile represents the least expensive funds and the fifth quintile the most expensive funds. The fee and expense data reported by Broadridge as of December 31, 2016 reflected the most recent fiscal year-end data available in Broadridge’s database at that time.
In connection with their review of fund management fees and total expenses, the Trustees also reviewed the costs of the services provided and the profits realized by Putnam Management and its affiliates from their contractual relationships with the funds. This information included trends in revenues, expenses and profitability of Putnam Management and its affiliates relating to the investment management, investor servicing and distribution services provided to the funds. In this regard, the Trustees also reviewed an analysis of Putnam Management’s revenues, expenses and profitability, allocated on a fund-by-fund basis, with respect to the funds’ management,
|
| George Putnam Balanced Fund 19 |
distribution, and investor servicing contracts. For each fund, the analysis presented information about revenues, expenses and profitability for each of the agreements separately and for the agreements taken together on a combined basis. The Trustees concluded that, at current asset levels, the fee schedules in place represented reasonable compensation for the services being provided and represented an appropriate sharing between fund shareholders and Putnam Management of such economies of scale as may exist in the management of the Putnam funds at that time.
The information examined by the Trustees in connection with their annual contract review for the Putnam funds included information regarding fees charged by Putnam Management and its affiliates to institutional clients, including defined benefit pension and profit-sharing plans, charities, college endowments, foundations, sub-advised third-party mutual funds, state, local and non-U.S. government entities, and corporations. This information included, in cases where an institutional product’s investment strategy corresponds with a fund’s strategy, comparisons of those fees with fees charged to the Putnam funds, as well as an assessment of the differences in the services provided to these different types of clients as compared to the services provided to the Putnam Funds. The Trustees observed that the differences in fee rates between these clients and the Putnam funds are by no means uniform when examined by individual asset sectors, suggesting that differences in the pricing of investment management services to these types of clients may reflect, among other things, historical competitive forces operating in separate markets. The Trustees considered the fact that in many cases fee rates across different asset classes are higher on average for mutual funds than for institutional clients, as well as the differences between the services that Putnam Management provides to the Putnam funds and those that it provides to its other clients. The Trustees did not rely on these comparisons to any significant extent in concluding that the management fees paid by your fund are reasonable.
Investment performance
The quality of the investment process provided by Putnam Management represented a major factor in the Trustees’ evaluation of the quality of services provided by Putnam Management under your fund’s management contract. The Trustees were assisted in their review of the Putnam funds’ investment process and performance by the work of the investment oversight committees of the Trustees, which meet on a regular basis with the funds’ portfolio teams and with the Chief Investment Officers and other senior members of Putnam Management’s Investment Division throughout the year. In addition, in response to a request from the Independent Trustees, Putnam Management provided the Trustees with in-depth presentations regarding each of the equity and fixed income investment teams, including the operation of the teams and their investment approaches. The Trustees concluded that Putnam Management generally provides a high-quality investment process — based on the experience and skills of the individuals assigned to the management of fund portfolios, the resources made available to them, and in general Putnam Management’s ability to attract and retain high-quality personnel — but also recognized that this does not guarantee favorable investment results for every fund in every time period.
The Trustees considered that 2016 was a challenging year for the performance of the Putnam funds, with generally disappointing results for the international and global equity funds and taxable fixed income funds, mixed results for small-cap equity, Spectrum, global asset allocation, equity research and tax exempt fixed income funds, but generally strong results for U.S. equity funds. The Trustees noted, however, that they were encouraged by the positive performance trend since mid-year 2016 across most Putnam Funds. In particular, from May 1, 2016 through April 30, 2017, 51% of Putnam Fund assets were in the top quartile and 87% were above the median of the Putnam Funds’ competitive industry rankings. They noted that the longer-term performance of the Putnam funds generally continued to be strong, exemplified by the fact that the Putnam funds were ranked by the Barron’s/Lipper Fund Families survey as the 5th-best performing mutual fund complex out of 54 complexes for the five-year period ended December 31, 2016. In addition, while the survey ranked the Putnam Funds 52nd out of 61 mutual fund complexes for the one-year period ended 2016, the Putnam Funds have ranked 1st or 2nd in the survey for the one-year period three times since 2009 (most recently in 2013). They also noted, however, the disappointing investment performance of some funds for periods ended December 31, 2016 and considered information provided by Putnam Management regarding the factors contributing to the underperformance and actions being taken to improve the performance
|
| 20 George Putnam Balanced Fund |
of these particular funds. The Trustees indicated their intention to continue to monitor closely the performance of those funds, including the effectiveness of any efforts Putnam Management has undertaken to address underperformance and whether additional actions to address areas of underperformance are warranted.
For purposes of the Trustees’ evaluation of the Putnam Funds’ investment performance, the Trustees generally focus on a competitive industry ranking of each fund’s total net return over a one-year, three-year and five-year period. For a number of Putnam funds with relatively unique investment mandates for which Putnam Management informed the Trustees that meaningful competitive performance rankings are not considered to be available, the Trustees evaluated performance based on their total gross and net returns and, in most cases, comparisons of those returns with the returns of selected investment benchmarks. In the case of your fund, the Trustees considered that its class A share cumulative total return performance at net asset value was in the following quartiles of its Lipper Inc. (“Lipper”) peer group (Lipper Balanced Funds) for the one-year, three-year and five-year periods ended December 31, 2016 (the first quartile representing the best-performing funds and the fourth quartile the worst-performing funds):
| |
| One-year period | 1st |
|
| Three-year period | 1st |
|
| Five-year period | 1st |
|
Over the one-year, three-year and five-year periods ended December 31, 2016, there were 635, 595 and 540 funds, respectively, in your fund’s Lipper peer group. (When considering performance information, shareholders should be mindful that past performance is not a guarantee of future results.)
The Trustees also considered Putnam Management’s continued efforts to support fund performance through initiatives including structuring compensation for portfolio managers and research analysts to enhance accountability for fund performance, emphasizing accountability in the portfolio management process, and affirming its commitment to a fundamental-driven approach to investing. The Trustees noted further that Putnam Management continued to strengthen its fundamental research capabilities by adding new investment personnel.
Brokerage and soft-dollar allocations; investor servicing
The Trustees considered various potential benefits that Putnam Management may receive in connection with the services it provides under the management contract with your fund. These include benefits related to brokerage allocation and the use of soft dollars, whereby a portion of the commissions paid by a fund for brokerage may be used to acquire research services that are expected to be useful to Putnam Management in managing the assets of the fund and of other clients. Subject to policies established by the Trustees, soft dollars generated by these means are used predominantly to acquire brokerage and research services (including third-party research and market data) that enhance Putnam Management’s investment capabilities and supplement Putnam Management’s internal research efforts. However, the Trustees noted that a portion of available soft dollars continues to be used to pay fund expenses. The Trustees indicated their continued intent to monitor regulatory and industry developments in this area with the assistance of their Brokerage Committee, including any developments with respect to the European Union’s updated Markets in Financial Instruments Directive and its potential impact on PIL’s use of client commissions to obtain investment research. The Trustees also indicated their continued intent to monitor the allocation of the Putnam funds’ brokerage in order to ensure that the principle of seeking best price and execution remains paramount in the portfolio trading process.
Putnam Management may also receive benefits from payments that the funds make to Putnam Management’s affiliates for investor or distribution services. In conjunction with the annual review of your fund’s management and sub-management contracts, the Trustees reviewed your fund’s investor servicing agreement with Putnam Investor Services, Inc. (“PSERV”) and its distributor’s contracts and distribution plans with Putnam Retail Management Limited Partnership (“PRM”), both of which are affiliates of Putnam Management. The Trustees concluded that the fees payable by the funds to PSERV and PRM, as applicable, for such services are fair and reasonable in relation to the nature and quality of such services, the fees paid by competitive funds, and the costs incurred by PSERV and PRM, as applicable, in providing such services. Furthermore, the Trustees believed that the services provided were required for the operation of the funds, and that they were of a quality at least equal to those provided by other providers.
|
| George Putnam Balanced Fund 21 |
Financial statements
These sections of the report, as well as the accompanying Notes, preceded by the Report of Independent Registered Public Accounting Firm, constitute the fund’s financial statements.
The fund’s portfolio lists all the fund’s investments and their values as of the last day of the reporting period. Holdings are organized by asset type/and industry sector, country, or state to show areas of concentration and/diversification.
Statement of assets and liabilities shows how the fund’s net assets and share price are determined. All investment and non-investment assets are added together. Any unpaid expenses and other liabilities are subtracted from this total. The result is divided by the number of shares to determine the net asset value per share, which is calculated separately for each class of shares. (For funds with preferred shares, the amount subtracted from total assets includes the liquidation preference of preferred shares.)
Statement of operations shows the fund’s net investment gain or loss. This is done by first adding up all the fund’s earnings — from dividends and interest income — and subtracting its operating expenses to determine net investment income (or loss). Then, any net gain or loss the fund realized on the sales of its holdings — as well as any unrealized gains or losses over the period — is added to or subtracted from the net investment result to determine the fund’s net gain or loss for the fiscal year.
Statement of changes in net assets shows how the fund’s net assets were affected by the fund’s net investment gain or loss, by distributions to shareholders, and by changes in the number of the fund’s shares. It lists distributions and their sources (net investment income or realized capital gains) over the current reporting period and the most recent fiscal year-end. The distributions listed here may not match the sources listed in the Statement of operations because the distributions are determined on a tax basis and may be paid in a different period from the one in which they were/earned.
Financial highlights provide an overview of the fund’s investment results, per-share distributions, expense ratios, net investment income ratios, and portfolio turnover in one summary table, reflecting the five most recent reporting periods. In a semiannual report, the highlights table also includes the current reporting period.
|
| 22 George Putnam Balanced Fund |
Report of Independent Registered Public Accounting Firm
To the Trustees and Shareholders of
George Putnam Balanced Fund:
In our opinion, the accompanying statement of assets and liabilities, including the portfolio, and the related statements of operations and of changes in net assets and the financial highlights present fairly, in all material respects, the financial position of George Putnam Balanced Fund (the “Fund”) as of July 31, 2017, the results of its operations for the year then ended, the changes in its net assets for each of the two years in the period then ended and the financial highlights for each of the periods indicated, in conformity with accounting principles generally accepted in the United States of America. These financial statements and financial highlights (hereafter referred to as “financial statements”) are the responsibility of the Fund’s management. Our responsibility is to express an opinion on these financial statements based on our audits. We conducted our audits of these financial statements in accordance with the standards of the Public Company Accounting Oversight Board (United States). Those standards require that we plan and perform the audit to obtain reasonable assurance about whether the financial statements are free of material misstatement. An audit includes examining, on a test basis, evidence supporting the amounts and disclosures in the financial statements, assessing the accounting principles used and significant estimates made by management, and evaluating the overall financial statement presentation. Our procedures included confirmation of securities owned as of July 31, 2017 by correspondence with the custodian and brokers; when replies were not received from brokers, we performed other auditing procedures. We believe that our audits provide a reasonable basis for our opinion.
PricewaterhouseCoopers LLP
Boston, Massachusetts
September 8, 2017
|
| George Putnam Balanced Fund 23 |
The fund’s portfolio 7/31/17
| | |
| COMMON STOCKS (61.5%)* | Shares | Value |
|
| Basic materials (2.5%) | | |
|
| Albemarle Corp. | 12,874 | $1,490,809 |
|
| Alcoa Corp. | 67,096 | 2,442,294 |
|
| Calyxt, Inc. † | 30,350 | 327,173 |
|
| CF Industries Holdings, Inc. | 79,302 | 2,327,514 |
|
| Dow Chemical Co. (The) | 86,640 | 5,565,754 |
|
| Evonik Industries AG (Germany) | 29,551 | 1,007,496 |
|
| Fortune Brands Home & Security, Inc. S | 41,535 | 2,727,603 |
|
| Iluka Resources, Ltd. (Australia) | 196,255 | 1,416,176 |
|
| LyondellBasell Industries NV Class A | 11,163 | 1,005,675 |
|
| Sealed Air Corp. | 48,055 | 2,090,873 |
|
| Sherwin-Williams Co. (The) | 17,453 | 5,886,373 |
|
| W.R. Grace & Co. | 55,215 | 3,807,626 |
|
| | | 30,095,366 |
|
| Capital goods (4.5%) | | |
|
| Airbus SE (France) | 36,158 | 3,021,952 |
|
| Caterpillar, Inc. | 35,209 | 4,012,066 |
|
| Cummins, Inc. | 25,947 | 4,356,501 |
|
| Dover Corp. | 45,520 | 3,823,680 |
|
| Fortive Corp. | 57,418 | 3,717,241 |
|
| Johnson Controls International PLC | 100,729 | 3,923,395 |
|
| KION Group AG (Germany) | 38,514 | 3,343,327 |
|
| Komatsu, Ltd. (Japan) | 125,600 | 3,377,398 |
|
| L3 Technologies, Inc. | 19,457 | 3,404,391 |
|
| Northrop Grumman Corp. | 19,522 | 5,136,824 |
|
| Raytheon Co. | 32,307 | 5,549,373 |
|
| Stericycle, Inc. † | 22,052 | 1,699,768 |
|
| United Technologies Corp. | 50,431 | 5,979,604 |
|
| Waste Connections, Inc. (Canada) | 34,393 | 2,234,857 |
|
| | | 53,580,377 |
|
| Communication services (2.9%) | | |
|
| American Tower Corp. R | 23,616 | 3,219,569 |
|
| AT&T, Inc. | 200,820 | 7,831,980 |
|
| Charter Communications, Inc. Class A † | 18,391 | 7,207,617 |
|
| Comcast Corp. Class A | 237,204 | 9,606,762 |
|
| DISH Network Corp. Class A † | 32,985 | 2,112,030 |
|
| T-Mobile US, Inc. † | 34,207 | 2,109,204 |
|
| Verizon Communications, Inc. | 49,579 | 2,399,624 |
|
| | | 34,486,786 |
|
| Communications equipment (0.2%) | | |
|
| Cisco Systems, Inc. | 83,757 | 2,634,158 |
|
| | | 2,634,158 |
|
| Computers (2.7%) | | |
|
| Apple, Inc. | 177,389 | 26,383,066 |
|
| HP, Inc. | 91,748 | 1,752,387 |
|
| RealPage, Inc. † | 99,827 | 3,868,296 |
|
| Western Digital Corp. | 9,150 | 778,848 |
|
| | | 32,782,597 |
|
| 24 George Putnam Balanced Fund |
| | |
| COMMON STOCKS (61.5%)* cont. | Shares | Value |
|
| Conglomerates (0.8%) | | |
|
| Danaher Corp. | 71,094 | $5,793,450 |
|
| Siemens AG (Germany) | 25,298 | 3,436,508 |
|
| | | 9,229,958 |
|
| Consumer cyclicals (6.9%) | | |
|
| Amazon.com, Inc. † | 18,005 | 17,784,979 |
|
| Expedia, Inc. | 24,927 | 3,900,328 |
|
| Hanesbrands, Inc. S | 98,226 | 2,251,340 |
|
| Hilton Worldwide Holdings, Inc. | 72,126 | 4,510,039 |
|
| Home Depot, Inc. (The) | 87,202 | 13,045,419 |
|
| IHS Markit, Ltd. (United Kingdom) † | 56,056 | 2,615,012 |
|
| L Brands, Inc. | 34,487 | 1,599,852 |
|
| Live Nation Entertainment, Inc. † S | 73,535 | 2,740,649 |
|
| MasterCard, Inc. Class A | 34,540 | 4,414,212 |
|
| NIKE, Inc. Class B | 46,959 | 2,772,929 |
|
| O’Reilly Automotive, Inc. † | 12,598 | 2,573,771 |
|
| Penn National Gaming, Inc. † S | 127,478 | 2,569,956 |
|
| Priceline Group, Inc. (The) † | 3,074 | 6,235,609 |
|
| TJX Cos., Inc. (The) | 54,084 | 3,802,646 |
|
| Twenty-First Century Fox, Inc. | 28,606 | 832,435 |
|
| Vulcan Materials Co. | 12,093 | 1,488,890 |
|
| Wal-Mart Stores, Inc. | 40,544 | 3,243,115 |
|
| Walt Disney Co. (The) | 30,016 | 3,299,659 |
|
| Wynn Resorts, Ltd. | 25,392 | 3,284,201 |
|
| | | 82,965,041 |
|
| Consumer staples (6.6%) | | |
|
| Brown-Forman Corp. Class B | 59,482 | 2,938,411 |
|
| Colgate-Palmolive Co. | 32,940 | 2,378,268 |
|
| Constellation Brands, Inc. Class A | 31,155 | 6,023,819 |
|
| Costco Wholesale Corp. | 28,528 | 4,521,973 |
|
| CVS Health Corp. | 36,401 | 2,909,532 |
|
| Delivery Hero Holding GmbH (acquired 6/12/15 cost $446,716) (Private) | | |
| (Germany) † ∆∆ F | 17,400 | 513,511 |
|
| Dr. Pepper Snapple Group, Inc. | 14,208 | 1,295,201 |
|
| Edgewell Personal Care Co. † | 25,710 | 1,856,262 |
|
| Kraft Heinz Co. (The) | 90,118 | 7,881,720 |
|
| Kroger Co. (The) | 145,215 | 3,560,672 |
|
| McCormick & Co., Inc. (non-voting shares) | 35,982 | 3,429,085 |
|
| Molson Coors Brewing Co. Class B | 32,625 | 2,902,973 |
|
| Mondelez International, Inc. Class A | 119,094 | 5,242,518 |
|
| Monster Beverage Corp. † | 24,979 | 1,317,642 |
|
| PepsiCo, Inc. | 84,587 | 9,863,690 |
|
| Pinnacle Foods, Inc. | 56,725 | 3,368,331 |
|
| Procter & Gamble Co. (The) | 68,779 | 6,246,509 |
|
| Restaurant Brands International, Inc. (Canada) | 45,201 | 2,693,076 |
|
| Simply Good Foods Co. (The) † | 74,366 | 881,237 |
|
| Walgreens Boots Alliance, Inc. | 76,934 | 6,206,266 |
|
| Yum China Holdings, Inc. (China) † | 80,604 | 2,884,817 |
|
| | | 78,915,513 |
|
| George Putnam Balanced Fund 25 |
| | |
| COMMON STOCKS (61.5%)* cont. | Shares | Value |
|
| Electronics (2.7%) | | |
|
| Agilent Technologies, Inc. | 39,956 | $2,388,969 |
|
| Broadcom, Ltd. | 29,774 | 7,344,055 |
|
| Cavium, Inc. † | 44,309 | 2,744,499 |
|
| NXP Semiconductor NV † | 18,324 | 2,021,687 |
|
| Qorvo, Inc. † | 48,488 | 3,324,337 |
|
| Qualcomm, Inc. | 92,019 | 4,894,491 |
|
| Rockwell Automation, Inc. | 25,818 | 4,260,745 |
|
| Texas Instruments, Inc. | 74,822 | 6,089,014 |
|
| | | 33,067,797 |
|
| Energy (3.6%) | | |
|
| Anadarko Petroleum Corp. | 43,909 | 2,005,324 |
|
| Cenovus Energy, Inc. (Canada) | 292,164 | 2,453,545 |
|
| Cheniere Energy, Inc. † | 64,964 | 2,936,373 |
|
| ConocoPhillips | 100,724 | 4,569,848 |
|
| EnCana Corp. (Canada) | 102,630 | 1,033,091 |
|
| EOG Resources, Inc. | 44,411 | 4,225,263 |
|
| EQT Corp. | 25,572 | 1,628,936 |
|
| Exxon Mobil Corp. | 22,582 | 1,807,463 |
|
| Halliburton Co. | 74,622 | 3,166,958 |
|
| Marathon Oil Corp. | 63,057 | 771,187 |
|
| Noble Energy, Inc. | 66,139 | 1,912,078 |
|
| Pioneer Natural Resources Co. | 29,483 | 4,808,677 |
|
| Plains All American Pipeline LP | 39,787 | 1,049,183 |
|
| Plains GP Holdings LP Class A † | 22,991 | 628,574 |
|
| Royal Dutch Shell PLC Class A (United Kingdom) | 124,579 | 3,506,003 |
|
| Select Energy Services Class A † | 112,596 | 1,748,616 |
|
| Seven Generations Energy, Ltd. (Canada) † | 70,957 | 1,233,317 |
|
| Suncor Energy, Inc. (Canada) | 103,221 | 3,367,153 |
|
| | | 42,851,589 |
|
| Financials (9.0%) | | |
|
| American International Group, Inc. | 87,815 | 5,747,492 |
|
| Assured Guaranty, Ltd. | 103,779 | 4,671,093 |
|
| Bank of America Corp. | 560,243 | 13,513,061 |
|
| BlackRock, Inc. | 8,527 | 3,637,021 |
|
| Charles Schwab Corp. (The) | 52,684 | 2,260,144 |
|
| Chubb, Ltd. | 52,364 | 7,669,231 |
|
| Citigroup, Inc. | 138,119 | 9,454,246 |
|
| E*Trade Financial Corp. † | 49,632 | 2,034,912 |
|
| Gaming and Leisure Properties, Inc. R | 79,139 | 3,002,534 |
|
| Goldman Sachs Group, Inc. (The) | 23,760 | 5,353,841 |
|
| Hamilton Lane, Inc. Class A | 93,883 | 2,108,612 |
|
| Hartford Financial Services Group, Inc. (The) | 24,206 | 1,331,330 |
|
| Intercontinental Exchange, Inc. | 81,391 | 5,429,594 |
|
| Invesco, Ltd. | 228,943 | 7,960,348 |
|
| Investment Technology Group, Inc. | 143,354 | 3,163,823 |
|
| JPMorgan Chase & Co. | 93,368 | 8,571,182 |
|
| KKR & Co. LP | 170,366 | 3,301,693 |
|
| MBIA, Inc. † S | 182,956 | 1,860,663 |
|
| MetLife, Inc. | 44,963 | 2,472,965 |
|
|
| 26 George Putnam Balanced Fund |
| | |
| COMMON STOCKS (61.5%)* cont. | Shares | Value |
|
| Financials cont. | | |
|
| Oportun Financial Corp. (acquired 6/23/15, cost $386,984) (Private) † ∆∆ F | 135,784 | $327,825 |
|
| Prudential PLC (United Kingdom) | 171,857 | 4,190,307 |
|
| Synchrony Financial | 51,379 | 1,557,811 |
|
| Visa, Inc. Class A | 86,590 | 8,620,900 |
|
| | | 108,240,628 |
|
| Health care (7.4%) | | |
|
| Aetna, Inc. | 5,143 | 793,616 |
|
| Amgen, Inc. | 37,285 | 6,506,605 |
|
| Becton Dickinson and Co. | 31,407 | 6,325,370 |
|
| Biogen, Inc. † | 19,841 | 5,745,755 |
|
| Bioverativ, Inc. † | 29,613 | 1,835,118 |
|
| Boston Scientific Corp. † | 151,384 | 4,029,842 |
|
| Bristol-Myers Squibb Co. | 20,150 | 1,146,535 |
|
| C.R. Bard, Inc. | 3,246 | 1,040,668 |
|
| Celgene Corp. † | 35,718 | 4,836,574 |
|
| Cigna Corp. | 22,042 | 3,825,610 |
|
| DENTSPLY Sirona, Inc. | 54,925 | 3,406,998 |
|
| Gilead Sciences, Inc. | 75,824 | 5,769,448 |
|
| Humana, Inc. | 6,212 | 1,436,214 |
|
| Intuitive Surgical, Inc. † | 3,104 | 2,912,359 |
|
| Jazz Pharmaceuticals PLC † | 34,801 | 5,345,782 |
|
| Johnson & Johnson | 99,569 | 13,214,798 |
|
| McKesson Corp. | 9,678 | 1,566,578 |
|
| Merck & Co., Inc. | 64,764 | 4,137,124 |
|
| Pfizer, Inc. | 69,440 | 2,302,630 |
|
| Regeneron Pharmaceuticals, Inc. † | 5,073 | 2,493,988 |
|
| UnitedHealth Group, Inc. | 34,912 | 6,696,471 |
|
| Vertex Pharmaceuticals, Inc. † | 25,211 | 3,827,534 |
|
| | | 89,195,617 |
|
| Miscellaneous (—%) | | |
|
| Gores Holdings II, Inc. (Units) † | 51,253 | 534,569 |
|
| | | 534,569 |
|
| Semiconductor (0.4%) | | |
|
| Applied Materials, Inc. | 107,637 | 4,769,395 |
|
| | | 4,769,395 |
|
| Software (3.4%) | | |
|
| Adobe Systems, Inc. † | 32,417 | 4,748,766 |
|
| Everbridge, Inc. † | 73,062 | 1,727,916 |
|
| Instructure, Inc. † | 50,963 | 1,648,653 |
|
| Microsoft Corp. | 309,749 | 22,518,752 |
|
| Oracle Corp. | 63,289 | 3,160,020 |
|
| Tencent Holdings, Ltd. (China) | 86,381 | 3,465,945 |
|
| Ubisoft Entertainment SA (France) † | 50,064 | 3,166,571 |
|
| | | 40,436,623 |
|
| Technology services (5.0%) | | |
|
| Alibaba Group Holding, Ltd. ADR (China) † S | 28,807 | 4,463,645 |
|
| Alphabet, Inc. Class A † | 24,469 | 23,135,440 |
|
| DXC Technology Co. | 62,899 | 4,930,024 |
|
| Facebook, Inc. Class A † | 94,013 | 15,911,700 |
|
|
| George Putnam Balanced Fund 27 |
| | |
| COMMON STOCKS (61.5%)* cont. | Shares | Value |
|
| Technology services cont. | | |
|
| Fidelity National Information Services, Inc. | 37,189 | $3,392,381 |
|
| GoDaddy, Inc. Class A † | 41,640 | 1,789,687 |
|
| NCSoft Corp. (South Korea) | 14,948 | 4,822,151 |
|
| salesforce.com, Inc. † | 20,277 | 1,841,152 |
|
| | | 60,286,180 |
|
| Transportation (0.7%) | | |
|
| American Airlines Group, Inc. S | 70,571 | 3,559,601 |
|
| Norfolk Southern Corp. | 39,545 | 4,451,976 |
|
| | | 8,011,577 |
|
| Utilities and power (2.2%) | | |
|
| Ameren Corp. | 33,622 | 1,886,194 |
|
| American Electric Power Co., Inc. | 59,283 | 4,181,823 |
|
| American Water Works Co., Inc. | 24,004 | 1,946,724 |
|
| Edison International | 20,457 | 1,609,557 |
|
| Exelon Corp. | 116,763 | 4,476,693 |
|
| Kinder Morgan, Inc. | 32,122 | 656,252 |
|
| NextEra Energy, Inc. | 21,736 | 3,175,412 |
|
| NRG Energy, Inc. | 182,039 | 4,481,800 |
|
| PG&E Corp. | 53,014 | 3,588,518 |
|
| | | 26,002,973 |
|
| Total common stocks (cost $640,151,688) | | $738,086,744 |
|
| |
| U.S. GOVERNMENT AND AGENCY | Principal | |
| MORTGAGE OBLIGATIONS (13.4%)* | amount | Value |
|
| U.S. Government Guaranteed Mortgage Obligations (2.4%) | | |
|
| Government National Mortgage Association Pass-Through Certificates | | |
|
| 3.50%, with due dates from 2/20/43 to 11/20/45 | $3,604,536 | $3,761,036 |
|
| 3.50%, TBA, 8/1/47 | 15,000,000 | 15,585,938 |
|
| 3.00%, with due dates from 8/20/46 to 10/20/46 | 1,940,068 | 1,965,966 |
|
| 3.00%, TBA, 8/1/47 | 7,000,000 | 7,101,172 |
|
| | | 28,414,112 |
|
| U.S. Government Agency Mortgage Obligations (11.0%) | | |
|
| Federal Home Loan Mortgage Corporation Pass-Through Certificates | | |
|
| 6.00%, 3/1/35 | 1,735 | 1,971 |
|
| 4.00%, with due dates from 7/1/42 to 9/1/45 | 4,687,165 | 4,968,081 |
|
| 3.50%, with due dates from 12/1/42 to 1/1/47 | 11,466,780 | 11,869,949 |
|
| 3.00%, 3/1/43 | 637,096 | 642,369 |
|
| Federal National Mortgage Association Pass-Through Certificates | | |
|
| 5.50%, with due dates from 7/1/33 to 11/1/38 | 2,294,409 | 2,546,908 |
|
| 5.00%, with due dates from 8/1/33 to 1/1/39 | 647,649 | 709,970 |
|
| 4.50%, TBA, 9/1/47 | 19,000,000 | 20,378,243 |
|
| 4.50%, TBA, 8/1/47 | 19,000,000 | 20,398,282 |
|
| 4.00%, with due dates from 9/1/45 to 7/1/56 | 11,526,360 | 12,209,643 |
|
| 4.00%, TBA, 9/1/47 | 4,000,000 | 4,205,156 |
|
| 4.00%, TBA, 8/1/47 | 4,000,000 | 4,211,562 |
|
| 3.50%, with due dates from 5/1/43 to 1/1/47 | 13,596,172 | 14,057,844 |
|
| 3.50%, TBA, 9/1/47 | 3,000,000 | 3,083,672 |
|
| 3.50%, TBA, 8/1/47 | 8,000,000 | 8,236,250 |
|
|
| 28 George Putnam Balanced Fund |
| | |
| U.S. GOVERNMENT AND AGENCY | Principal | |
| MORTGAGE OBLIGATIONS (13.4%)* cont. | amount | Value |
|
| U.S. Government Agency Mortgage Obligations cont. | | |
|
| Federal National Mortgage Association Pass-Through Certificates | | |
|
| 3.00%, with due dates from 2/1/43 to 3/1/47 | $6,422,690 | $6,468,865 |
|
| 3.00%, TBA, 8/1/47 | 18,000,000 | 18,029,531 |
|
| | | 132,018,296 |
|
| Total U.S. government and agency mortgage obligations (cost $160,113,902) | $160,432,408 |
|
| |
| | Principal | |
| U.S. TREASURY OBLIGATIONS (12.2%)* | amount | Value |
|
| U.S. Treasury Bonds 2.75%, 8/15/42 ∆ Φ | $17,760,000 | $17,404,800 |
|
| U.S. Treasury Notes | | |
|
| 2.00%, 2/15/22 | 5,880,000 | 5,936,733 |
|
| 2.00%, 11/30/20 | 44,660,000 | 45,258,373 |
|
| 1.875%, 11/30/21 | 6,480,000 | 6,512,653 |
|
| 1.625%, 7/31/19 | 9,580,000 | 9,630,894 |
|
| 1.375%, 9/30/18 ∆ | 23,230,000 | 23,253,139 |
|
| 1.125%, 3/31/20 | 7,770,000 | 7,706,262 |
|
| 1.125%, 12/31/19 | 31,470,000 | 31,263,478 |
|
| Total U.S. treasury obligations (cost $147,124,072) | | $146,966,332 |
|
| |
| | Principal | |
| CORPORATE BONDS AND NOTES (15.7%)* | amount | Value |
|
| Basic materials (0.9%) | | |
|
| Celanese US Holdings, LLC company guaranty sr. unsec. unsub. | | |
| notes 4.625%, 11/15/22 (Germany) | $668,000 | $725,615 |
|
| Eastman Chemical Co. sr. unsec. notes 3.80%, 3/15/25 | 760,000 | 783,194 |
|
| Georgia-Pacific, LLC sr. unsec. unsub. notes 7.75%, 11/15/29 | 850,000 | 1,195,060 |
|
| Glencore Funding, LLC 144A company guaranty sr. unsec. unsub. | | |
| notes 4.625%, 4/29/24 | 941,000 | 997,460 |
|
| Glencore Funding, LLC 144A company guaranty sr. unsec. unsub. | | |
| notes 4.00%, 4/16/25 | 638,000 | 647,663 |
|
| International Paper Co. sr. unsec. notes 8.70%, 6/15/38 | 10,000 | 14,754 |
|
| INVISTA Finance, LLC 144A company guaranty sr. notes | | |
| 4.25%, 10/15/19 | 356,000 | 363,120 |
|
| Sherwin-Williams Co. (The) sr. unsec. unsub. bonds 3.45%, 6/1/27 | 1,040,000 | 1,057,046 |
|
| Westlake Chemical Corp. company guaranty sr. unsec. unsub. | | |
| notes 3.60%, 8/15/26 | 1,610,000 | 1,617,947 |
|
| WestRock MWV, LLC company guaranty sr. unsec. unsub. notes | | |
| 8.20%, 1/15/30 | 1,265,000 | 1,789,292 |
|
| WestRock MWV, LLC company guaranty sr. unsec. unsub. notes | | |
| 7.95%, 2/15/31 | 187,000 | 262,530 |
|
| Weyerhaeuser Co. sr. unsec. unsub. notes 7.375%, 3/15/32 R | 553,000 | 766,066 |
|
| | | 10,219,747 |
|
| Capital goods (0.5%) | | |
|
| Johnson Controls International PLC sr. unsec. unsub. bonds | | |
| 4.50%, 2/15/47 | 1,040,000 | 1,111,746 |
|
| L3 Technologies, Inc. company guaranty sr. unsec. bonds | | |
| 3.85%, 12/15/26 | 235,000 | 244,741 |
|
| Legrand France SA sr. unsec. unsub. notes 8.50%, 2/15/25 (France) | 767,000 | 991,749 |
|
| Medtronic, Inc. company guaranty sr. unsec. sub. notes | | |
| 4.375%, 3/15/35 | 307,000 | 340,034 |
|
|
| George Putnam Balanced Fund 29 |
| | |
| | Principal | |
| CORPORATE BONDS AND NOTES (15.7%)* cont. | amount | Value |
|
| Capital goods cont. | | |
|
| Medtronic, Inc. company guaranty sr. unsec. sub. notes | | |
| 3.50%, 3/15/25 | $327,000 | $342,800 |
|
| Northrop Grumman Systems Corp. company guaranty sr. unsec. | | |
| unsub. notes 7.875%, 3/1/26 | 265,000 | 352,766 |
|
| Parker Hannifin Corp. sr. unsec. unsub. notes Ser. MTN, | | |
| 6.25%, 5/15/38 | 370,000 | 494,116 |
|
| Rockwell Collins, Inc. sr. unsec. bonds 4.35%, 4/15/47 | 1,758,000 | 1,845,747 |
|
| United Technologies Corp. sr. unsec. unsub. notes 5.70%, 4/15/40 | 100,000 | 125,685 |
|
| United Technologies Corp. sr. unsec. unsub. notes 4.50%, 6/1/42 | 225,000 | 245,208 |
|
| | | 6,094,592 |
|
| Communication services (1.4%) | | |
|
| America Movil SAB de CV company guaranty sr. unsec. unsub. | | |
| notes 6.125%, 3/30/40 (Mexico) | 200,000 | 245,074 |
|
| American Tower Corp. sr. unsec. notes 4.00%, 6/1/25 R | 335,000 | 347,660 |
|
| American Tower Corp. sr. unsec. unsub. bonds 3.55%, 7/15/27 R | 555,000 | 551,209 |
|
| American Tower Corp. sr. unsec. unsub. bonds 3.375%, 10/15/26 R | 500,000 | 494,236 |
|
| AT&T, Inc. sr. unsec. unsub. bonds 5.15%, 2/14/50 | 1,445,000 | 1,437,661 |
|
| AT&T, Inc. sr. unsec. unsub. notes 4.75%, 5/15/46 | 122,000 | 117,153 |
|
| AT&T, Inc. sr. unsec. unsub. notes 4.25%, 3/1/27 | 1,580,000 | 1,624,676 |
|
| CC Holdings GS V, LLC/Crown Castle GS III Corp. company guaranty | | |
| sr. notes 3.849%, 4/15/23 | 240,000 | 253,085 |
|
| Charter Communications Operating, LLC/Charter | | |
| Communications Operating Capital Corp. company guaranty sr. | | |
| sub. bonds 6.484%, 10/23/45 | 1,159,000 | 1,366,234 |
|
| Charter Communications Operating, LLC/Charter | | |
| Communications Operating Capital Corp. company guaranty sr. | | |
| sub. notes 4.908%, 7/23/25 | 356,000 | 382,559 |
|
| Charter Communications Operating, LLC/Charter | | |
| Communications Operating Capital Corp. 144A company guaranty | | |
| sr. bonds 5.375%, 5/1/47 | 696,000 | 721,566 |
|
| Comcast Cable Communications Holdings, Inc. company | | |
| guaranty sr. unsec. notes 9.455%, 11/15/22 | 645,000 | 866,587 |
|
| Comcast Corp. company guaranty sr. unsec. unsub. notes | | |
| 6.50%, 11/15/35 | 268,000 | 357,971 |
|
| Comcast Corp. company guaranty sr. unsec. unsub. notes | | |
| 3.15%, 3/1/26 | 610,000 | 617,457 |
|
| Cox Communications, Inc. 144A sr. unsec. bonds 3.50%, 8/15/27 | 825,000 | 819,804 |
|
| Crown Castle International Corp. sr. unsec. bonds 3.65%, 9/1/27 R | 714,000 | 714,442 |
|
| Crown Castle International Corp. sr. unsec. notes 5.25%, 1/15/23 R | 75,000 | 83,858 |
|
| Crown Castle International Corp. sr. unsec. notes 4.875%, 4/15/22 R | 313,000 | 342,526 |
|
| Crown Castle International Corp. sr. unsec. notes 4.75%, 5/15/47 R | 170,000 | 171,981 |
|
| Crown Castle Towers, LLC 144A company guaranty sr. notes | | |
| 4.883%, 8/15/20 | 710,000 | 756,801 |
|
| NBCUniversal Media, LLC company guaranty sr. unsec. unsub. | | |
| notes 6.40%, 4/30/40 | 380,000 | 512,345 |
|
| Rogers Communications, Inc. company guaranty sr. unsec. bonds | | |
| 8.75%, 5/1/32 (Canada) | 95,000 | 139,175 |
|
| Rogers Communications, Inc. company guaranty sr. unsec. unsub. | | |
| notes 4.50%, 3/15/43 (Canada) | 215,000 | 221,566 |
|
|
| 30 George Putnam Balanced Fund |
| | |
| | Principal | |
| CORPORATE BONDS AND NOTES (15.7%)* cont. | amount | Value |
|
| Communication services cont. | | |
|
| Sprint Spectrum Co., LLC/Sprint Spectrum Co. II, LLC/ | | |
| Sprint Spectrum Co. III, LL 144A company guaranty sr. notes | | |
| 3.36%, 9/20/21 | $955,000 | $968,084 |
|
| Telecom Italia SpA 144A sr. unsec. notes 5.303%, 5/30/24 (Italy) | 1,000,000 | 1,102,500 |
|
| Telefonica Emisiones SAU company guaranty sr. unsec. unsub. | | |
| notes 7.045%, 6/20/36 (Spain) | 355,000 | 463,265 |
|
| Verizon Communications, Inc. sr. unsec. unsub. notes | | |
| 4.522%, 9/15/48 | 252,000 | 234,104 |
|
| Verizon Communications, Inc. sr. unsec. unsub. notes | | |
| 4.125%, 3/16/27 | 610,000 | 627,197 |
|
| Videotron, Ltd./Videotron Ltee. 144A sr. unsec. notes 5.125%, | | |
| 4/15/27 (Canada) | 700,000 | 721,000 |
|
| | | 17,261,776 |
|
| Conglomerates (0.1%) | | |
|
| General Electric Co. jr. unsec. sub. FRB Ser. D, 5.00%, | | |
| perpetual maturity | 1,111,000 | 1,170,716 |
|
| | | 1,170,716 |
|
| Consumer cyclicals (1.7%) | | |
|
| 21st Century Fox America, Inc. company guaranty sr. unsec. notes | | |
| 7.85%, 3/1/39 | 190,000 | 274,496 |
|
| 21st Century Fox America, Inc. company guaranty sr. unsec. notes | | |
| 7.75%, 1/20/24 | 1,045,000 | 1,307,270 |
|
| Alimentation Couche-Tard, Inc. 144A company guaranty sr. unsec. | | |
| notes 3.55%, 7/26/27 (Canada) | 720,000 | 725,279 |
|
| Autonation, Inc. company guaranty sr. unsec. notes 4.50%, 10/1/25 | 330,000 | 349,521 |
|
| Autonation, Inc. company guaranty sr. unsec. unsub. notes | | |
| 5.50%, 2/1/20 | 847,000 | 909,595 |
|
| CBS Corp. company guaranty sr. unsec. unsub. bonds | | |
| 2.90%, 1/15/27 | 374,000 | 357,212 |
|
| CBS Corp. company guaranty sr. unsec. unsub. notes | | |
| 4.60%, 1/15/45 | 1,010,000 | 1,037,494 |
|
| CBS Corp. company guaranty sr. unsec. unsub. notes | | |
| 3.50%, 1/15/25 | 477,000 | 484,869 |
|
| Dollar General Corp. sr. unsec. sub. notes 3.25%, 4/15/23 | 625,000 | 639,512 |
|
| Expedia, Inc. company guaranty sr. unsec. unsub. notes | | |
| 5.00%, 2/15/26 | 187,000 | 205,907 |
|
| Ford Motor Co. sr. unsec. unsub. notes 4.346%, 12/8/26 | 880,000 | 910,040 |
|
| General Motors Financial Co., Inc. company guaranty sr. unsec. | | |
| notes 4.00%, 10/6/26 | 262,000 | 261,333 |
|
| General Motors Financial Co., Inc. company guaranty sr. unsec. | | |
| unsub. notes 4.30%, 7/13/25 | 252,000 | 258,891 |
|
| General Motors Financial Co., Inc. company guaranty sr. unsec. | | |
| unsub. notes 4.00%, 1/15/25 | 250,000 | 252,730 |
|
| Grupo Televisa SAB sr. unsec. unsub. bonds 6.625%, | | |
| 1/15/40 (Mexico) | 300,000 | 352,135 |
|
| Grupo Televisa SAB sr. unsec. unsub. notes 5.00%, 5/13/45 (Mexico) | 355,000 | 352,724 |
|
| Hilton Domestic Operating Co., Inc. 144A sr. unsec. sub. notes | | |
| 4.25%, 9/1/24 | 205,000 | 207,050 |
|
| Hilton Worldwide Finance, LLC/Hilton Worldwide Finance Corp. | | |
| 144A sr. unsec. bonds 4.875%, 4/1/27 | 1,200,000 | 1,251,000 |
|
|
| George Putnam Balanced Fund 31 |
| | |
| | Principal | |
| CORPORATE BONDS AND NOTES (15.7%)* cont. | amount | Value |
|
| Consumer cyclicals cont. | | |
|
| Historic TW, Inc. company guaranty sr. unsec. unsub. bonds | | |
| 9.15%, 2/1/23 | $460,000 | $593,209 |
|
| Host Hotels & Resorts LP sr. unsec. unsub. notes 6.00%, 10/1/21 R | 320,000 | 357,334 |
|
| Host Hotels & Resorts LP sr. unsec. unsub. notes 5.25%, 3/15/22 R | 150,000 | 163,629 |
|
| Hyatt Hotels Corp. sr. unsec. unsub. notes 3.375%, 7/15/23 | 200,000 | 204,715 |
|
| IHS Markit, Ltd. 144A company guaranty notes 4.75%, 2/15/25 | | |
| (United Kingdom) | 1,285,000 | 1,352,463 |
|
| Lear Corp. company guaranty sr. unsec. unsub. notes | | |
| 5.375%, 3/15/24 | 375,000 | 401,375 |
|
| Moody’s Corp. 144A sr. unsec. bonds 3.25%, 1/15/28 | 540,000 | 533,741 |
|
| NVR, Inc. sr. unsec. notes 3.95%, 9/15/22 | 435,000 | 456,938 |
|
| O’Reilly Automotive, Inc. company guaranty sr. unsec. notes | | |
| 3.85%, 6/15/23 | 195,000 | 203,743 |
|
| O’Reilly Automotive, Inc. company guaranty sr. unsec. sub. notes | | |
| 3.55%, 3/15/26 | 480,000 | 482,782 |
|
| Omnicom Group, Inc. company guaranty sr. unsec. unsub. notes | | |
| 3.60%, 4/15/26 | 540,000 | 547,894 |
|
| Priceline Group, Inc. (The) sr. unsec. notes 3.65%, 3/15/25 | 164,000 | 168,854 |
|
| QVC, Inc. company guaranty sr. notes 4.85%, 4/1/24 | 390,000 | 401,767 |
|
| S&P Global, Inc. company guaranty sr. unsec. unsub. notes | | |
| 4.40%, 2/15/26 | 670,000 | 723,909 |
|
| Sirius XM Radio, Inc. 144A sr. unsec. bonds 5.00%, 8/1/27 | 1,115,000 | 1,134,513 |
|
| Standard Industries, Inc. 144A sr. unsec. notes 5.00%, 2/15/27 | 1,195,000 | 1,232,344 |
|
| Time Warner, Inc. company guaranty sr. unsec. unsub. bonds | | |
| 2.95%, 7/15/26 | 79,000 | 75,321 |
|
| Vulcan Materials Co. sr. unsec. unsub. notes 4.50%, 4/1/25 | 175,000 | 186,877 |
|
| Wyndham Worldwide Corp. sr. unsec. unsub. bonds 4.50%, 4/1/27 | 530,000 | 550,420 |
|
| | | 19,908,886 |
|
| Consumer staples (1.3%) | | |
|
| Anheuser-Busch InBev Finance, Inc. company guaranty sr. unsec. | | |
| unsub. bonds 4.90%, 2/1/46 | 1,947,000 | 2,186,615 |
|
| Anheuser-Busch InBev Finance, Inc. company guaranty sr. unsec. | | |
| unsub. bonds 3.65%, 2/1/26 | 428,000 | 442,689 |
|
| Anheuser-Busch InBev Worldwide, Inc. company guaranty sr. | | |
| unsec. unsub. bonds 4.95%, 1/15/42 | 200,000 | 224,327 |
|
| Anheuser-Busch InBev Worldwide, Inc. company guaranty sr. | | |
| unsec. unsub. notes 8.20%, 1/15/39 | 165,000 | 258,599 |
|
| Bacardi, Ltd. 144A unsec. notes 4.50%, 1/15/21 (Bermuda) | 495,000 | 524,704 |
|
| Constellation Brands, Inc. company guaranty sr. unsec. unsub. | | |
| bonds 3.70%, 12/6/26 | 525,000 | 539,266 |
|
| CVS Health Corp. sr. unsec. notes 4.75%, 12/1/22 | 715,000 | 784,376 |
|
| CVS Pass-Through Trust 144A sr. mtge. notes 7.507%, 1/10/32 | 625,663 | 777,272 |
|
| CVS Pass-Through Trust 144A sr. mtge. notes 4.704%, 1/10/36 | 630,897 | 658,195 |
|
| Diageo Investment Corp. company guaranty sr. unsec. notes | | |
| 8.00%, 9/15/22 | 820,000 | 1,029,141 |
|
| ERAC USA Finance, LLC 144A company guaranty sr. unsec. notes | | |
| 7.00%, 10/15/37 | 1,434,000 | 1,871,630 |
|
| ERAC USA Finance, LLC 144A company guaranty sr. unsec. notes | | |
| 5.625%, 3/15/42 | 553,000 | 631,290 |
|
| Grupo Bimbo SAB de CV 144A company guaranty sr. unsec. unsub. | | |
| notes 4.875%, 6/27/44 (Mexico) | 350,000 | 354,012 |
|
|
| 32 George Putnam Balanced Fund |
| | |
| | Principal | |
| CORPORATE BONDS AND NOTES (15.7%)* cont. | amount | Value |
|
| Consumer staples cont. | | |
|
| Kraft Heinz Co. (The) company guaranty sr. unsec. bonds | | |
| 4.375%, 6/1/46 | $670,000 | $651,007 |
|
| Kraft Heinz Co. (The) company guaranty sr. unsec. notes Ser. 144A, | | |
| 6.875%, 1/26/39 | 625,000 | 809,266 |
|
| Kraft Heinz Co. (The) company guaranty sr. unsec. unsub. notes | | |
| 6.50%, 2/9/40 | 309,000 | 387,669 |
|
| Lamb Weston Holdings, Inc. 144A company guaranty sr. unsec. | | |
| unsub. notes 4.875%, 11/1/26 | 1,166,000 | 1,218,948 |
|
| Newell Brands, Inc. sr. unsec. unsub. notes 4.20%, 4/1/26 | 1,030,000 | 1,101,878 |
|
| Tyson Foods, Inc. company guaranty sr. unsec. bonds | | |
| 4.875%, 8/15/34 | 134,000 | 146,673 |
|
| Walgreens Boots Alliance, Inc. sr. unsec. bonds 3.45%, 6/1/26 | 765,000 | 766,730 |
|
| | | 15,364,287 |
|
| Energy (1.3%) | | |
|
| BG Energy Capital PLC 144A company guaranty sr. unsec. unsub. | | |
| notes 4.00%, 10/15/21 (United Kingdom) | 250,000 | 265,643 |
|
| BP Capital Markets PLC company guaranty sr. unsec. bonds | | |
| 3.119%, 5/4/26 (United Kingdom) | 670,000 | 670,826 |
|
| Canadian Natural Resources, Ltd. sr. unsec. unsub. bonds 3.85%, | | |
| 6/1/27 (Canada) | 425,000 | 429,412 |
|
| Cenovus Energy, Inc. sr. unsec. bonds 6.75%, 11/15/39 (Canada) | 459,000 | 495,720 |
|
| Cenovus Energy, Inc. 144A sr. unsec. notes 4.25%, | | |
| 4/15/27 (Canada) | 700,000 | 684,052 |
|
| Cheniere Corpus Christi Holdings, LLC 144A company guaranty sr. | | |
| bonds 5.125%, 6/30/27 | 565,000 | 588,306 |
|
| Concho Resources, Inc. company guaranty sr. unsec. notes | | |
| 4.375%, 1/15/25 | 925,000 | 953,906 |
|
| DCP Midstream Operating LP company guaranty sr. unsec. notes | | |
| 3.875%, 3/15/23 | 276,000 | 269,100 |
|
| DCP Midstream Operating LP company guaranty sr. unsec. notes | | |
| 2.70%, 4/1/19 | 225,000 | 223,594 |
|
| Devon Energy Corp. sr. unsec. unsub. notes 3.25%, 5/15/22 | 276,000 | 278,741 |
|
| EQT Midstream Partners LP company guaranty sr. unsec. sub. | | |
| notes 4.00%, 8/1/24 | 575,000 | 584,447 |
|
| Hess Corp. sr. unsec. unsub. notes 7.30%, 8/15/31 | 388,000 | 459,529 |
|
| Lukoil International Finance BV 144A company guaranty sr. unsec. | | |
| notes 4.563%, 4/24/23 (Russia) | 315,000 | 320,119 |
|
| Marathon Petroleum Corp. sr. unsec. unsub. notes 6.50%, 3/1/41 | 175,000 | 205,782 |
|
| MPLX LP sr. unsec. unsub. notes 4.125%, 3/1/27 | 615,000 | 624,153 |
|
| Nabors Industries, Inc. company guaranty sr. unsec. unsub. notes | | |
| 4.625%, 9/15/21 | 600,000 | 574,500 |
|
| Noble Holding International, Ltd. company guaranty sr. unsec. | | |
| unsub. notes 6.05%, 3/1/41 | 350,000 | 209,125 |
|
| Petroleos Mexicanos company guaranty sr. unsec. unsub. notes | | |
| 4.50%, 1/23/26 (Mexico) | 348,000 | 345,703 |
|
| Pride International, LLC company guaranty sr. unsec. unsub. notes | | |
| 7.875%, 8/15/40 | 760,000 | 630,800 |
|
| Sabine Pass Liquefaction, LLC sr. bonds 4.20%, 3/15/28 | 225,000 | 228,539 |
|
| Sabine Pass Liquefaction, LLC sr. notes 5.00%, 3/15/27 | 1,280,000 | 1,370,765 |
|
| Statoil ASA company guaranty sr. unsec. notes 5.10%, | | |
| 8/17/40 (Norway) | 480,000 | 555,578 |
|
|
| George Putnam Balanced Fund 33 |
| | |
| | Principal | |
| CORPORATE BONDS AND NOTES (15.7%)* cont. | amount | Value |
|
| Energy cont. | | |
|
| Tosco Corp. company guaranty sr. unsec. notes 8.125%, 2/15/30 | $600,000 | $833,837 |
|
| Transcanada Trust company guaranty jr. unsec. sub. FRB 5.30%, | | |
| 3/15/77 (Canada) | 1,285,000 | 1,329,975 |
|
| Valero Energy Partners LP sr. unsec. unsub. notes | | |
| 4.375%, 12/15/26 | 427,000 | 442,008 |
|
| Williams Partners LP sr. unsec. sub. notes 4.30%, 3/4/24 | 1,022,000 | 1,076,926 |
|
| Williams Partners LP sr. unsec. sub. notes 3.60%, 3/15/22 | 250,000 | 257,545 |
|
| Williams Partners LP/ACMP Finance Corp. sr. unsec. sub. notes | | |
| 4.875%, 3/15/24 | 342,000 | 358,306 |
|
| | | 15,266,937 |
|
| Financials (5.4%) | | |
|
| Aflac, Inc. sr. unsec. notes 6.45%, 8/15/40 | 82,000 | 107,583 |
|
| Air Lease Corp. sr. unsec. notes 3.75%, 2/1/22 | 410,000 | 428,176 |
|
| Air Lease Corp. sr. unsec. unsub. notes 3.375%, 6/1/21 | 630,000 | 648,462 |
|
| Ally Financial, Inc. sub. unsec. notes 5.75%, 11/20/25 | 705,000 | 754,350 |
|
| American Express Co. jr. unsec. sub. FRN Ser. C, 4.90%, | | |
| perpetual maturity | 310,000 | 316,975 |
|
| American Express Co. sr. unsec. notes 7.00%, 3/19/18 | 650,000 | 671,987 |
|
| American International Group, Inc. jr. unsec. sub. FRB | | |
| 8.175%, 5/15/58 | 856,000 | 1,168,440 |
|
| Aon PLC company guaranty sr. unsec. unsub. notes | | |
| 4.25%, 12/12/42 | 1,150,000 | 1,130,022 |
|
| Assurant, Inc. sr. unsec. notes 6.75%, 2/15/34 | 198,000 | 243,210 |
|
| Australia & New Zealand Banking Group, Ltd./United | | |
| Kingdom 144A jr. unsec. sub. FRB 6.75%, perpetual maturity | | |
| (United Kingdom) | 200,000 | 223,741 |
|
| Aviation Capital Group Corp. 144A sr. unsec. unsub. notes | | |
| 7.125%, 10/15/20 | 265,000 | 301,546 |
|
| AXA SA 144A jr. unsec. sub. FRN 6.463%, perpetual | | |
| maturity (France) | 550,000 | 568,563 |
|
| AXA SA 144A jr. unsec. sub. FRN 6.379%, perpetual | | |
| maturity (France) | 135,000 | 152,719 |
|
| Banco del Estado de Chile 144A sr. unsec. notes 2.00%, | | |
| 11/9/17 (Chile) | 400,000 | 399,996 |
|
| Bank of America Corp. jr. unsec. sub. FRN Ser. AA, 6.10%, | | |
| perpetual maturity | 314,000 | 346,185 |
|
| Bank of America Corp. unsec. sub. FRN 2.006%, 9/15/26 | 275,000 | 257,994 |
|
| Bank of America Corp. unsec. sub. notes 6.11%, 1/29/37 | 600,000 | 734,957 |
|
| Barclays Bank PLC 144A unsec. sub. notes 10.179%, 6/12/21 | | |
| (United Kingdom) | 321,000 | 402,183 |
|
| Bear Stearns Cos., LLC (The) sr. unsec. unsub. notes 7.25%, 2/1/18 | 331,000 | 340,091 |
|
| Berkshire Hathaway Finance Corp. company guaranty sr. unsec. | | |
| notes 4.30%, 5/15/43 | 703,000 | 751,782 |
|
| BGC Partners, Inc. sr. unsec. notes 5.125%, 5/27/21 | 155,000 | 163,464 |
|
| BPCE SA 144A unsec. sub. notes 5.15%, 7/21/24 (France) | 810,000 | 870,091 |
|
| BPCE SA 144A unsec. sub. notes 4.50%, 3/15/25 (France) | 1,060,000 | 1,099,197 |
|
| Camden Property Trust sr. unsec. unsub. notes 4.875%, 6/15/23 R | 1,213,000 | 1,323,916 |
|
| Cantor Fitzgerald LP 144A unsec. notes 6.50%, 6/17/22 | 1,020,000 | 1,141,931 |
|
| Capital One Bank USA NA unsec. sub. notes 3.375%, 2/15/23 | 462,000 | 468,880 |
|
| Capital One Financial Corp. unsec. sub. notes 4.20%, 10/29/25 | 295,000 | 300,675 |
|
|
| 34 George Putnam Balanced Fund |
| | |
| | Principal | |
| CORPORATE BONDS AND NOTES (15.7%)* cont. | amount | Value |
|
| Financials cont. | | |
|
| CBRE Services, Inc. company guaranty sr. unsec. notes | | |
| 5.25%, 3/15/25 | $257,000 | $282,648 |
|
| CBRE Services, Inc. company guaranty sr. unsec. unsub. notes | | |
| 4.875%, 3/1/26 | 708,000 | 765,003 |
|
| Citigroup, Inc. jr. unsec. sub. FRB Ser. P, 5.95%, perpetual maturity | 956,000 | 1,026,744 |
|
| Citigroup, Inc. jr. unsec. sub. FRN 5.875%, perpetual maturity | 402,000 | 422,603 |
|
| Citigroup, Inc. unsec. sub. bonds 4.75%, 5/18/46 | 1,400,000 | 1,485,961 |
|
| CNO Financial Group, Inc. sr. unsec. unsub. notes 5.25%, 5/30/25 | 345,000 | 366,563 |
|
| Cooperatieve Centrale Raiffeisen-Boerenleenbank BA/ | | |
| Netherlands company guaranty unsec. sub. notes 4.625%, | | |
| 12/1/23 (Netherlands) | 250,000 | 271,112 |
|
| Cooperatieve Rabobank UA 144A jr. unsec. sub. FRN 11.00%, | | |
| perpetual maturity (Netherlands) | 718,000 | 831,157 |
|
| Cooperative Rabobank UA company guaranty unsec. sub. notes | | |
| 3.75%, 7/21/26 (Netherlands) | 285,000 | 289,028 |
|
| Credit Agricole SA 144A unsec. sub. notes 4.375%, 3/17/25 (France) | 255,000 | 265,087 |
|
| Credit Suisse Group AG 144A sr. unsec. bonds 4.282%, | | |
| 1/9/28 (Switzerland) | 1,770,000 | 1,852,896 |
|
| Credit Suisse Group AG 144A unsec. sub. notes 6.50%, | | |
| 8/8/23 (Switzerland) | 729,000 | 825,880 |
|
| Fairfax US, Inc. 144A company guaranty sr. unsec. notes | | |
| 4.875%, 8/13/24 | 300,000 | 312,350 |
|
| Fifth Third Bancorp jr. unsec. sub. FRB 5.10%, perpetual maturity | 217,000 | 224,053 |
|
| Five Corners Funding Trust 144A sr. unsec. bonds 4.419%, 11/15/23 | 425,000 | 461,511 |
|
| GE Capital International Funding Co. Unlimited Co. company | | |
| guaranty sr. unsec. bonds 4.418%, 11/15/35 (Ireland) | 1,962,000 | 2,124,169 |
|
| Goldman Sachs Group, Inc. (The) sr. unsec. unsub. notes | | |
| 3.85%, 1/26/27 | 1,835,000 | 1,872,342 |
|
| Goldman Sachs Group, Inc. (The) unsec. sub. notes 6.75%, 10/1/37 | 282,000 | 368,978 |
|
| Hartford Financial Services Group, Inc. (The) sr. unsec. unsub. | | |
| notes 6.625%, 3/30/40 | 1,495,000 | 2,020,196 |
|
| Healthcare Realty Trust, Inc. sr. unsec. unsub. notes | | |
| 3.875%, 5/1/25 R | 555,000 | 561,711 |
|
| Hospitality Properties Trust sr. unsec. unsub. notes | | |
| 4.50%, 3/15/25 R | 250,000 | 258,230 |
|
| HSBC Bank USA NA/New York NY unsec. sub. notes Ser. BKNT, | | |
| 5.625%, 8/15/35 (United Kingdom) | 250,000 | 303,915 |
|
| HSBC Bank USA, NA unsec. sub. notes 7.00%, 1/15/39 | 342,000 | 483,673 |
|
| HSBC Holdings PLC unsec. sub. notes 6.50%, 5/2/36 | | |
| (United Kingdom) | 800,000 | 1,023,866 |
|
| HSBC Holdings PLC unsec. sub. notes 4.25%, 8/18/25 | | |
| (United Kingdom) | 455,000 | 472,185 |
|
| HSBC USA, Inc. sr. unsec. unsub. notes 3.50%, 6/23/24 | 105,000 | 108,267 |
|
| ING Bank NV 144A unsec. sub. notes 5.80%, 9/25/23 (Netherlands) | 2,225,000 | 2,536,983 |
|
| JPMorgan Chase & Co. jr. unsec. sub. FRB Ser. Z, 5.30%, | | |
| perpetual maturity | 1,110,000 | 1,162,725 |
|
| KKR Group Finance Co., LLC 144A company guaranty sr. unsec. | | |
| unsub. notes 6.375%, 9/29/20 | 555,000 | 622,804 |
|
| Liberty Mutual Group, Inc. 144A company guaranty jr. unsec. sub. | | |
| bonds 7.80%, 3/15/37 | 785,000 | 985,175 |
|
|
| George Putnam Balanced Fund 35 |
| | |
| | Principal | |
| CORPORATE BONDS AND NOTES (15.7%)* cont. | amount | Value |
|
| Financials cont. | | |
|
| Liberty Mutual Insurance Co. 144A unsec. sub. notes | | |
| 7.697%, 10/15/97 | $340,000 | $481,871 |
|
| Liberty Property LP sr. unsec. unsub. notes 3.375%, 6/15/23 R | 100,000 | 101,460 |
|
| Lloyds Bank PLC company guaranty sr. unsec. unsub. notes 2.70%, | | |
| 8/17/20 (United Kingdom) | 220,000 | 224,156 |
|
| Lloyds Banking Group PLC unsec. sub. bonds 5.30%, 12/1/45 | | |
| (United Kingdom) | 304,000 | 350,295 |
|
| Lloyds Banking Group PLC unsec. sub. notes 4.50%, 11/4/24 | | |
| (United Kingdom) | 530,000 | 553,959 |
|
| Massachusetts Mutual Life Insurance Co. 144A unsec. sub. notes | | |
| 8.875%, 6/1/39 | 1,290,000 | 2,095,846 |
|
| MetLife Capital Trust IV 144A jr. unsec. sub. notes 7.875%, 12/15/37 | 2,564,000 | 3,438,965 |
|
| Mid-America Apartments LP sr. unsec. notes 4.30%, 10/15/23 R | 285,000 | 303,280 |
|
| Mitsubishi UFJ Financial Group, Inc. sr. unsec. unsub. notes 3.85%, | | |
| 3/1/26 (Japan) | 640,000 | 670,857 |
|
| Nationwide Mutual Insurance Co. 144A unsec. sub. notes | | |
| 8.25%, 12/1/31 | 415,000 | 597,753 |
|
| Neuberger Berman Group, LLC/Neuberger Berman Finance Corp. | | |
| 144A sr. unsec. notes 4.875%, 4/15/45 | 840,000 | 806,400 |
|
| OneAmerica Financial Partners, Inc. 144A sr. unsec. notes | | |
| 7.00%, 10/15/33 | 370,000 | 468,064 |
|
| Pacific LifeCorp 144A sr. unsec. notes 6.00%, 2/10/20 | 365,000 | 396,047 |
|
| Peachtree Corners Funding Trust 144A company guaranty sr. | | |
| unsec. unsub. bonds 3.976%, 2/15/25 | 140,000 | 143,232 |
|
| Primerica, Inc. sr. unsec. notes 4.75%, 7/15/22 | 213,000 | 230,511 |
|
| Prudential Financial, Inc. jr. unsec. sub. FRN 5.625%, 6/15/43 | 359,000 | 393,105 |
|
| Prudential Financial, Inc. jr. unsec. sub. FRN 5.20%, 3/15/44 | 1,153,000 | 1,222,180 |
|
| Realty Income Corp. sr. unsec. notes 4.65%, 8/1/23 R | 1,045,000 | 1,135,234 |
|
| Royal Bank of Canada unsec. sub. notes Ser. GMTN, 4.65%, | | |
| 1/27/26 (Canada) | 420,000 | 451,587 |
|
| Royal Bank of Scotland Group PLC sr. unsec. unsub. notes 3.875%, | | |
| 9/12/23 (United Kingdom) | 200,000 | 205,082 |
|
| Santander Issuances SAU company guaranty unsec. sub. notes | | |
| 5.179%, 11/19/25 (Spain) | 1,200,000 | 1,298,749 |
|
| Santander UK PLC 144A unsec. sub. notes 5.00%, 11/7/23 | | |
| (United Kingdom) | 430,000 | 466,912 |
|
| Select Income REIT sr. unsec. unsub. notes 3.60%, 2/1/20 R | 290,000 | 294,401 |
|
| Select Income REIT sr. unsec. unsub. notes 2.85%, 2/1/18 R | 290,000 | 291,120 |
|
| Sumitomo Mitsui Financial Group, Inc. 144A unsec. sub. bonds | | |
| 4.436%, 4/2/24 (Japan) | 412,000 | 436,931 |
|
| Teachers Insurance & Annuity Association of America 144A unsec. | | |
| sub. notes 6.85%, 12/16/39 | 263,000 | 359,542 |
|
| TIERS Trust/United States 144A sr. bonds stepped-coupon zero % | | |
| (8.125%, 9/15/17), 3/15/46 †† | 570,000 | 698,250 |
|
| Toronto-Dominion Bank (The) unsec. sub. FRB 3.625%, | | |
| 9/15/31 (Canada) | 659,000 | 654,156 |
|
| Travelers Property Casualty Corp. company guaranty sr. unsec. | | |
| unsub. bonds 7.75%, 4/15/26 | 295,000 | 396,458 |
|
| UBS AG unsec. sub. notes 5.125%, 5/15/24 (Switzerland) | 2,640,000 | 2,843,122 |
|
| VEREIT Operating Partnership LP company guaranty sr. unsec. | | |
| notes 4.60%, 2/6/24 R | 720,000 | 755,464 |
|
|
| 36 George Putnam Balanced Fund |
| | |
| | Principal | |
| CORPORATE BONDS AND NOTES (15.7%)* cont. | amount | Value |
|
| Financials cont. | | |
|
| Wells Fargo & Co. jr. unsec. sub. FRB Ser. U, 5.875%, | | |
| perpetual maturity | $580,000 | $643,075 |
|
| Willis Towers Watson PLC company guaranty sr. unsec. unsub. | | |
| notes 5.75%, 3/15/21 | 710,000 | 783,138 |
|
| WP Carey, Inc. sr. unsec. unsub. notes 4.60%, 4/1/24 R | 787,000 | 822,652 |
|
| | | 64,918,785 |
|
| Government (0.4%) | | |
|
| International Bank for Reconstruction & Development sr. unsec. | | |
| unsub. bonds 7.625%, 1/19/23 (Supra-Nation) | 4,000,000 | 5,118,816 |
|
| | | 5,118,816 |
|
| Health care (0.7%) | | |
|
| AbbVie, Inc. sr. unsec. notes 3.60%, 5/14/25 | 194,000 | 199,936 |
|
| Allergan Funding SCS company guaranty sr. unsec. notes 4.75%, | | |
| 3/15/45 (Luxembourg) | 125,000 | 136,199 |
|
| Allergan Funding SCS company guaranty sr. unsec. notes 3.45%, | | |
| 3/15/22 (Luxembourg) | 186,000 | 193,519 |
|
| Anthem, Inc. sr. unsec. unsub. notes 4.625%, 5/15/42 | 205,000 | 220,810 |
|
| Becton Dickinson and Co. sr. unsec. unsub. bonds 4.669%, 6/6/47 | 1,136,000 | 1,189,681 |
|
| Becton Dickinson and Co. sr. unsec. unsub. bonds 3.70%, 6/6/27 | 976,000 | 989,806 |
|
| HCA, Inc. company guaranty sr. bonds 5.25%, 6/15/26 | 185,000 | 200,263 |
|
| HCA, Inc. company guaranty sr. sub. bonds 5.50%, 6/15/47 | 245,000 | 256,638 |
|
| HCA, Inc. company guaranty sr. sub. notes 5.00%, 3/15/24 | 430,000 | 456,445 |
|
| Omega Healthcare Investors, Inc. company guaranty sr. unsec. | | |
| bonds 5.25%, 1/15/26 R | 510,000 | 540,600 |
|
| Omega Healthcare Investors, Inc. company guaranty sr. unsec. | | |
| notes 4.50%, 4/1/27 R | 145,000 | 145,725 |
|
| Omega Healthcare Investors, Inc. company guaranty sr. unsec. | | |
| unsub. notes 4.95%, 4/1/24 R | 659,000 | 690,150 |
|
| Quest Diagnostics, Inc. company guaranty sr. unsec. notes | | |
| 4.75%, 1/30/20 | 121,000 | 128,425 |
|
| Shire Acquisitions Investments Ireland DAC company guaranty sr. | | |
| unsec. unsub. notes 3.20%, 9/23/26 (Ireland) | 748,000 | 737,598 |
|
| Shire Acquisitions Investments Ireland DAC company guaranty sr. | | |
| unsec. unsub. notes 2.875%, 9/23/23 (Ireland) | 458,000 | 457,144 |
|
| Teva Pharmaceutical Finance Netherlands III BV company | | |
| guaranty sr. unsec. unsub. bonds 3.15%, 10/1/26 (Netherlands) | 1,062,000 | 1,016,224 |
|
| UnitedHealth Group, Inc. sr. unsec. unsub. notes 4.625%, 11/15/41 | 300,000 | 332,826 |
|
| | | 7,891,989 |
|
| Technology (0.6%) | | |
|
| Apple, Inc. sr. unsec. notes 3.45%, 5/6/24 | 215,000 | 224,997 |
|
| Apple, Inc. sr. unsec. unsub. notes 4.375%, 5/13/45 | 297,000 | 322,812 |
|
| Apple, Inc. sr. unsec. unsub. notes 3.85%, 5/4/43 | 421,000 | 420,172 |
|
| Broadcom Corp./Broadcom Cayman Finance, Ltd. 144A company | | |
| guaranty sr. unsec. unsub. notes 3.875%, 1/15/27 | 1,077,000 | 1,105,406 |
|
| Diamond 1 Finance Corp./Diamond 2 Finance Corp. 144A | | |
| company guaranty sr. unsec. notes 7.125%, 6/15/24 | 813,000 | 904,705 |
|
| Diamond 1 Finance Corp./Diamond 2 Finance Corp. 144A sr. bonds | | |
| 8.35%, 7/15/46 | 271,000 | 353,937 |
|
| Diamond 1 Finance Corp./Diamond 2 Finance Corp. 144A sr. notes | | |
| 5.45%, 6/15/23 | 1,231,000 | 1,356,808 |
|
|
| George Putnam Balanced Fund 37 |
| | |
| | Principal | |
| CORPORATE BONDS AND NOTES (15.7%)* cont. | amount | Value |
|
| Technology cont. | | |
|
| Jabil Circuit, Inc. sr. unsec. sub. notes 8.25%, 3/15/18 | $162,000 | $168,278 |
|
| Microsoft Corp. sr. unsec. unsub. bonds 2.40%, 8/8/26 | 925,000 | 892,483 |
|
| Oracle Corp. sr. unsec. unsub. notes 2.65%, 7/15/26 | 1,475,000 | 1,436,985 |
|
| | | 7,186,583 |
|
| Transportation (0.2%) | | |
|
| Burlington Northern Santa Fe, LLC sr. unsec. notes 5.40%, 6/1/41 | 454,000 | 554,861 |
|
| Burlington Northern Santa Fe, LLC sr. unsec. unsub. notes | | |
| 5.75%, 5/1/40 | 109,000 | 137,272 |
|
| Continental Airlines, Inc. Pass-Through Trust pass-through | | |
| certificates Ser. 97-4, Class A, 6.90%, 1/2/18 | 7,120 | 7,191 |
|
| Continental Airlines, Inc. Pass-Through Trust pass-through | | |
| certificates Ser. 98-1, Class A, 6.648%, 9/15/17 | 15,618 | 15,699 |
|
| Norfolk Southern Corp. sr. unsec. unsub. bonds 6.00%, 5/23/11 | 390,000 | 486,067 |
|
| Penske Truck Leasing Co. LP/PTL Finance Corp. 144A sr. unsec. | | |
| bonds 3.40%, 11/15/26 | 540,000 | 536,162 |
|
| Southwest Airlines Co. Pass Through Trust pass-through | | |
| certificates Ser. 07-1, Class A, 6.15%, 8/1/22 | 547,619 | 603,824 |
|
| United Airlines, Inc. Pass-Through Trust pass-through certificates | | |
| Ser. 14-2, Class A, 3.75%, 9/3/26 | 205,602 | 212,248 |
|
| | | 2,553,324 |
|
| Utilities and power (1.2%) | | |
|
| Appalachian Power Co. sr. unsec. unsub. notes Ser. L, | | |
| 5.80%, 10/1/35 | 510,000 | 613,768 |
|
| Arizona Public Services Co. sr. unsec. notes 4.50%, 4/1/42 | 138,000 | 150,992 |
|
| Boardwalk Pipelines LP company guaranty sr. unsec. unsub. FRB | | |
| 4.45%, 7/15/27 | 240,000 | 247,177 |
|
| Commonwealth Edison Co. sr. mtge. bonds 5.875%, 2/1/33 | 595,000 | 721,326 |
|
| Consolidated Edison Co. of New York, Inc. sr. unsec. unsub. notes | | |
| 4.20%, 3/15/42 | 220,000 | 230,950 |
|
| Duke Energy Carolinas, LLC sr. mtge. notes 4.25%, 12/15/41 | 450,000 | 487,085 |
|
| EDP Finance BV 144A sr. unsec. unsub. notes 5.25%, | | |
| 1/14/21 (Netherlands) | 365,000 | 392,390 |
|
| El Paso Natural Gas Co., LLC company guaranty sr. unsec. unsub. | | |
| notes 8.375%, 6/15/32 | 490,000 | 639,286 |
|
| Emera US Finance LP company guaranty sr. unsec. notes | | |
| 3.55%, 6/15/26 | 437,000 | 443,191 |
|
| Enbridge, Inc. sr. unsec. unsub. bonds 4.25%, 12/1/26 (Canada) | 540,000 | 570,257 |
|
| Enel Finance International SA 144A company guaranty sr. unsec. | | |
| unsub. notes 5.125%, 10/7/19 (Netherlands) | 360,000 | 384,536 |
|
| Energy Transfer Partners LP sr. unsec. unsub. bonds | | |
| 4.20%, 4/15/27 | 115,000 | 115,498 |
|
| Energy Transfer Partners LP sr. unsec. unsub. notes 7.60%, 2/1/24 | 470,000 | 556,081 |
|
| Energy Transfer Partners LP sr. unsec. unsub. notes 6.50%, 2/1/42 | 766,000 | 860,389 |
|
| Energy Transfer Partners LP sr. unsec. unsub. notes 5.20%, 2/1/22 | 240,000 | 260,363 |
|
| FirstEnergy Corp. sr. unsec. unsub. bonds Ser. B, 3.90%, 7/15/27 | 86,000 | 86,683 |
|
| FirstEnergy Corp. sr. unsec. unsub. bonds Ser. C, 4.85%, 7/15/47 | 144,000 | 147,290 |
|
| FirstEnergy Transmission, LLC 144A sr. unsec. unsub. notes | | |
| 5.45%, 7/15/44 | 1,120,000 | 1,302,721 |
|
| Iberdrola International BV company guaranty sr. unsec. unsub. | | |
| bonds 6.75%, 7/15/36 (Spain) | 185,000 | 237,087 |
|
|
| 38 George Putnam Balanced Fund |
| | |
| | Principal | |
| CORPORATE BONDS AND NOTES (15.7%)* cont. | amount | Value |
|
| Utilities and power cont. | | |
|
| Kinder Morgan Energy Partners LP company guaranty sr. unsec. | | |
| notes 5.40%, 9/1/44 | $179,000 | $183,527 |
|
| Kinder Morgan Energy Partners LP company guaranty sr. unsec. | | |
| notes 3.50%, 3/1/21 | 420,000 | 431,234 |
|
| Kinder Morgan, Inc. company guaranty sr. unsec. unsub. notes | | |
| 3.05%, 12/1/19 | 235,000 | 239,282 |
|
| Oncor Electric Delivery Co., LLC sr. notes 7.00%, 9/1/22 | 445,000 | 537,887 |
|
| Pacific Gas & Electric Co. sr. unsec. notes 6.35%, 2/15/38 | 418,000 | 558,078 |
|
| Pacific Gas & Electric Co. sr. unsec. unsub. notes 5.80%, 3/1/37 | 140,000 | 178,228 |
|
| PPL Capital Funding, Inc. company guaranty sr. unsec. unsub. | | |
| notes 4.20%, 6/15/22 | 145,000 | 156,433 |
|
| Puget Sound Energy, Inc. jr. unsec. sub. FRN Ser. A, 6.974%, 6/1/67 | 656,000 | 629,760 |
|
| Texas Gas Transmission, LLC 144A sr. unsec. notes 4.50%, 2/1/21 | 623,000 | 654,774 |
|
| Texas-New Mexico Power Co. 144A 1st sr. bonds Ser. A, | | |
| 9.50%, 4/1/19 | 889,000 | 990,183 |
|
| WEC Energy Group jr. unsec. sub. FRN 3.294%, 5/15/67 | 1,945,000 | 1,887,195 |
|
| | | 14,893,651 |
|
| Total corporate bonds and notes (cost $175,794,670) | | $187,850,089 |
|
| |
| | Principal | |
| MORTGAGE-BACKED SECURITIES (0.9%)* | amount | Value |
|
| Citigroup Commercial Mortgage Trust Ser. 14-GC21, Class AS, | | |
| 4.026%, 5/10/47 | $520,000 | $542,542 |
|
| COMM Mortgage Trust | | |
| FRB Ser. 12-LC4, Class C, 5.589%, 12/10/44 | 500,000 | 543,200 |
|
| FRB Ser. 14-CR18, Class C, 4.735%, 7/15/47 | 2,392,000 | 2,435,534 |
|
| Ser. 13-CR13, Class AM, 4.449%, 12/10/23 | 777,000 | 839,160 |
|
| Ser. 12-CR1, Class AM, 3.912%, 5/15/45 | 1,046,000 | 1,100,915 |
|
| Federal Home Loan Mortgage Corporation Structured Agency | | |
| Credit Risk Debt FRN Ser. 16-HQA2, Class M1, 2.432%, 11/25/28 | 121,778 | 122,171 |
|
| Federal National Mortgage Association | | |
|
| Connecticut Avenue Securities FRB Ser. 16-C05, Class 2M1, | | |
| 2.582%, 1/25/29 | 16,003 | 16,134 |
|
| Ser. 01-79, Class BI, IO, 0.298%, 3/25/45 | 883,525 | 8,145 |
|
| FIRSTPLUS Home Loan Owner Trust Ser. 97-3, Class B1, 7.79%, | | |
| 11/10/23 (In default) † | 194,241 | 19 |
|
| JPMBB Commercial Mortgage Securities Trust FRB Ser. 13-C14, | | |
| Class C, 4.569%, 8/15/46 | 683,000 | 693,286 |
|
| JPMorgan Chase Commercial Mortgage Securities Trust | | |
|
| FRB Ser. 12-C6, Class D, 5.136%, 5/15/45 | 772,000 | 796,936 |
|
| Ser. 04-LN2, Class A2, 5.115%, 7/15/41 | 3,767 | 3,778 |
|
| FRB Ser. 13-C13, Class C, 4.053%, 1/15/46 | 450,000 | 452,477 |
|
| JPMorgan Chase Commercial Mortgage Securities Trust 144A FRB | | |
| Ser. 12-C8, Class D, 4.652%, 10/15/45 | 404,000 | 399,637 |
|
| LB Commercial Mortgage Trust 144A Ser. 99-C1, Class G, | | |
| 6.41%, 6/15/31 | 103,777 | 105,728 |
|
| Morgan Stanley Capital I Trust 144A FRB Ser. 12-C4, Class D, | | |
| 5.421%, 3/15/45 | 1,794,000 | 1,835,621 |
|
|
| George Putnam Balanced Fund 39 |
| | | | |
| | | | Principal | |
| MORTGAGE-BACKED SECURITIES (0.9%)* cont. | | | amount | Value |
|
| TIAA Real Estate CDO, Ltd. 144A Ser. 03-1A, Class E, | | | | |
| 8.00%, 12/28/38 | | | $2,082,436 | $150,560 |
|
| WF-RBS Commercial Mortgage Trust Ser. 14-C19, Class C, | | | |
| 4.646%, 3/15/47 | | | 394,000 | 409,169 |
|
| Total mortgage-backed securities (cost $11,081,622) | | | $10,455,012 |
|
| |
| INVESTMENT COMPANIES (0.7%)* | | | Shares | Value |
|
| SPDR S&P Regional Banking ETF S | | | 160,792 | $8,759,948 |
|
| Total investment companies (cost $8,983,428) | | | | $8,759,948 |
|
| |
| CONVERTIBLE PREFERRED STOCKS (0.1%)* | | | Shares | Value |
|
| Oportun Financial Corp. Ser. A-1, 8.00% cv. pfd. (acquired 6/23/15, cost | | | |
| $1,057) (Private) † ∆∆ F | | | 371 | $896 |
|
| Oportun Financial Corp. Ser. B-1, 8.00% cv. pfd. (acquired 6/23/15, cost | | | |
| $20,210) (Private) † ∆∆ F | | | 6,416 | 17,121 |
|
| Oportun Financial Corp. Ser. C-1, 8.00% cv. pfd. (acquired 6/23/15, cost | | | |
| $47,464) (Private) † ∆∆ F | | | 9,325 | 40,208 |
|
| Oportun Financial Corp. Ser. D-1, 8.00% cv. pfd. (acquired 6/23/15, cost | | | |
| $68,847) (Private) † ∆∆ F | | | 13,526 | 58,322 |
|
| Oportun Financial Corp. Ser. E-1, 8.00% cv. pfd. (acquired 6/23/15, cost | | | |
| $38,611) (Private) † ∆∆ F | | | 7,033 | 32,709 |
|
| Oportun Financial Corp. Ser. F, 8.00% cv. pfd. (acquired 6/23/15, cost | | | |
| $116,544) (Private) † ∆∆ F | | | 15,175 | 98,728 |
|
| Oportun Financial Corp. Ser. F-1, 8.00% cv. pfd. (acquired 6/23/15, cost | | | |
| $326,895) (Private) † ∆∆ F | | | 114,700 | 276,921 |
|
| Oportun Financial Corp. Ser. G, 8.00% cv. pfd. (acquired 6/23/15, cost | | | |
| $413,355) (Private) † ∆∆ F | | | 145,037 | 350,164 |
|
| Oportun Financial Corp. Ser. H, 8.00% cv. pfd. (acquired 2/6/15, cost | | | |
| $633,655) (Private) † ∆∆ F | | | 222,546 | 536,781 |
|
| Total convertible preferred stocks (cost $1,666,638) | | | $1,411,850 |
|
| |
| | | | Principal | |
| MUNICIPAL BONDS AND NOTES (0.1%)* | | | amount | Value |
|
| CA State G.O. Bonds (Build America Bonds), 7.50%, 4/1/34 | | $215,000 | $313,672 |
|
| North TX, Tollway Auth. Rev. Bonds (Build America Bonds), | | | |
| 6.718%, 1/1/49 | | | 350,000 | 506,044 |
|
| OH State U. Rev. Bonds (Build America Bonds), 4.91%, 6/1/40 | | 275,000 | 329,533 |
|
| Total municipal bonds and notes (cost $841,312) | | | $1,149,249 |
|
| |
| | Expiration | Strike | | |
| WARRANTS (0.0%)* † | date | price | Warrants | Value |
|
| Simply Good Foods Co. (The) | 7/10/22 | $0.00 | 18,097 | $44,881 |
|
| Total warrants (cost $36,366) | | | | $44,881 |
|
| |
| SHORT-TERM INVESTMENTS (5.8%)* | | | Shares | Value |
|
| Putnam Cash Collateral Pool, LLC 1.29% d | | | 21,555,769 | $21,555,769 |
|
| Putnam Short Term Investment Fund 1.15% L | | | 48,130,013 | 48,130,013 |
|
| Total short-term investments (cost $69,685,782) | | | $69,685,782 |
|
| |
| TOTAL INVESTMENTS | | | | |
|
| Total investments (cost $1,215,479,480) | | | | $1,324,842,295 |
|
|
| 40 George Putnam Balanced Fund |
Key to holding’s abbreviations
| |
| ADR | American Depository Receipts: represents ownership of foreign securities on deposit with a |
| | custodian bank |
| BKNT | Bank Note |
| DAC | Designated Activity Company |
| ETF | Exchange Traded Fund |
| FRB | Floating Rate Bonds: the rate shown is the current interest rate at the close of the reporting period |
| FRN | Floating Rate Notes: the rate shown is the current interest rate or yield at the close of the |
| | reporting period |
| GMTN | Global Medium Term Notes |
| G.O. Bonds | General Obligation Bonds |
| IO | Interest Only |
| MTN | Medium Term Notes |
| SPDR | S&P Depository Receipts |
| TBA | To Be Announced Commitments |
Notes to the fund’s portfolio
Unless noted otherwise, the notes to the fund’s portfolio are for the close of the fund’s reporting period, which ran from August 1, 2016 through July 31, 2017 (the reporting period). Within the following notes to the portfolio, references to “ASC 820” represent Accounting Standards Codification 820 Fair Value Measurements and Disclosures, references to “Putnam Management” represent Putnam Investment Management, LLC, the fund’s manager, an indirect wholly-owned subsidiary of Putnam Investments, LLC and references to “OTC”, if any, represent over-the-counter.
* Percentages indicated are based on net assets of $1,200,203,979.
† This security is non-income-producing.
†† The interest rate and date shown parenthetically represent the new interest rate to be paid and the date the fund will begin accruing interest at this rate.
∆∆ This security is restricted with regard to public resale. The total fair value of this security and any other restricted securities (excluding 144A securities), if any, held at the close of the reporting period was $2,253,186, or 0.2% of net assets.
∆ This security, in part or in entirety, was pledged and segregated with the custodian for collateral on certain derivative contracts at the close of the reporting period.
Φ This security, in part or in entirety, was pledged and segregated with the custodian for collateral on certain TBA commitments at the close of the reporting period.
d Affiliated company. See Notes 1 and 5 to the financial statements regarding securities lending. The rate quoted in the security description is the annualized 7-day yield of the fund at the close of the reporting period.
F This security is valued by Putnam Management at fair value following procedures approved by the Trustees. Securities may be classified as Level 2 or Level 3 for ASC 820 based on the securities’ valuation inputs (Note 1).
L Affiliated company (Note 5). The rate quoted in the security description is the annualized 7-day yield of the fund at the close of the reporting period.
R Real Estate Investment Trust.
S Security on loan, in part or in entirety, at the close of the reporting period (Note 1).
At the close of the reporting period, the fund maintained liquid assets totaling $63,708,076 to cover certain derivative contracts, and delayed delivery securities.
Debt obligations are considered secured unless otherwise indicated.
144A after the name of an issuer represents securities exempt from registration under Rule 144A of the Securities Act of 1933, as amended. These securities may be resold in transactions exempt from registration, normally to qualified institutional buyers.
See Note 1 to the financial statements regarding TBA commitments.
The dates shown on debt obligations are the original maturity dates.
|
| George Putnam Balanced Fund 41 |
| | | | | | |
| FORWARD CURRENCY CONTRACTS at 7/31/17 (aggregate face value $46,958,944) | |
|
| | | | | | | Unrealized |
| | | Contract | Delivery | | Aggregate | appreciation/ |
| Counterparty | Currency | type | date | Value | face value | (depreciation) |
|
| Bank of America N.A. | | | | | | |
|
| | British Pound | Sell | 9/20/17 | $5,559,582 | $5,441,596 | $(117,986) |
|
| | Canadian Dollar | Sell | 10/18/17 | 4,836,682 | 4,649,589 | (187,093) |
|
| Barclays Bank PLC | | | | | | |
|
| | British Pound | Buy | 9/20/17 | 3,395,510 | 3,332,110 | 63,400 |
|
| | Canadian Dollar | Sell | 10/18/17 | 2,986,425 | 2,871,746 | (114,679) |
|
| Citibank, N.A. | | | | | | |
|
| | Euro | Sell | 9/20/17 | 13,254,128 | 12,571,212 | (682,916) |
|
| | Japanese Yen | Sell | 8/16/17 | 2,323,550 | 2,290,418 | (33,132) |
|
| Credit Suisse International | | | | | |
|
| | British Pound | Sell | 9/20/17 | 5,833,147 | 5,693,780 | (139,367) |
|
| | Canadian Dollar | Sell | 10/18/17 | 1,780,887 | 1,712,349 | (68,538) |
|
| Goldman Sachs International | | | | | |
|
| | Japanese Yen | Sell | 8/16/17 | 1,402,626 | 1,318,579 | (84,047) |
|
| JPMorgan Chase Bank N.A. | | | | | |
|
| | Canadian Dollar | Sell | 10/18/17 | 4,432,748 | 4,261,609 | (171,139) |
|
| | Swiss Franc | Buy | 9/20/17 | 191,183 | 191,172 | 11 |
|
| | Swiss Franc | Sell | 9/20/17 | 191,183 | 190,804 | (379) |
|
| UBS AG | | | | | | |
|
| | Euro | Sell | 9/20/17 | 2,561,666 | 2,433,980 | (127,686) |
|
| Total | | | | | | $(1,663,551) |
|
| | | | |
| TBA SALE COMMITMENTS OUTSTANDING at 7/31/17 (proceeds receivable $74,916,875) | |
|
| | Principal | | Settlement | |
| Agency | amount | | date | Value |
|
| Federal National Mortgage Association, 4.50%, 8/1/47 | $19,000,000 | | 8/14/17 | $20,398,282 |
|
| Federal National Mortgage Association, 4.00%, 8/1/47 | 4,000,000 | | 8/14/17 | 4,211,562 |
|
| Federal National Mortgage Association, 3.50%, 8/1/47 | 5,000,000 | | 8/14/17 | 5,147,656 |
|
| Federal National Mortgage Association, 3.00%, 9/1/47 | 18,000,000 | | 9/13/17 | 18,002,812 |
|
| Federal National Mortgage Association, 3.00%, 8/1/47 | 18,000,000 | | 8/14/17 | 18,029,531 |
|
| Government National Mortgage Association, 3.50%, 8/1/47 | 9,000,000 | | 8/21/17 | 9,351,563 |
|
| Total | | | | $75,141,406 |
|
|
| 42 George Putnam Balanced Fund |
ASC 820 establishes a three-level hierarchy for disclosure of fair value measurements. The valuation hierarchy is based upon the transparency of inputs to the valuation of the fund’s investments. The three levels are defined as follows:
Level 1: Valuations based on quoted prices for identical securities in active markets.
Level 2: Valuations based on quoted prices in markets that are not active or for which all significant inputs are observable, either directly or indirectly.
Level 3: Valuations based on inputs that are unobservable and significant to the fair value measurement.
The following is a summary of the inputs used to value the fund’s net assets as of the close of the reporting period:
| | | | |
| | | | | Valuation inputs | |
|
| Investments in securities: | | Level 1 | Level 2 | Level 3 |
|
| Common stocks*: | | | | |
|
| Basic materials | | $30,095,366 | $— | $— |
|
| Capital goods | | 53,580,377 | — | — |
|
| Communication services | | 34,486,786 | — | — |
|
| Conglomerates | | 9,229,958 | — | — |
|
| Consumer cyclicals | | 82,965,041 | — | — |
|
| Consumer staples | | 78,402,002 | — | 513,511 |
|
| Energy | | 42,851,589 | — | — |
|
| Financials | | 107,912,803 | — | 327,825 |
|
| Health care | | 89,195,617 | — | — |
|
| Miscellaneous | | 534,569 | — | — |
|
| Technology | | 173,976,750 | — | — |
|
| Transportation | | 8,011,577 | — | — |
|
| Utilities and power | | 26,002,973 | — | — |
|
| Total common stocks | | 737,245,408 | — | 841,336 |
| | | | | |
| Convertible preferred stocks | | — | — | 1,411,850 |
|
| Corporate bonds and notes | | — | 187,151,839 | 698,250 |
|
| Investment companies | | 8,759,948 | — | — |
|
| Mortgage-backed securities | | — | 10,455,012 | — |
|
| Municipal bonds and notes | | — | 1,149,249 | — |
|
| U.S. government and agency mortgage obligations | | — | 160,432,408 | — |
|
| U.S. treasury obligations | | — | 146,966,332 | — |
|
| Warrants | | 44,881 | — | — |
|
| Short-term investments | | 48,130,013 | 21,555,769 | — |
|
| Totals by level | | $794,180,250 | $527,710,609 | $2,951,436 |
| | | | | |
| | | | | Valuation inputs | |
|
| Other financial instruments: | | Level 1 | Level 2 | Level 3 |
|
| Forward currency contracts | | $— | $(1,663,551) | $— |
|
| TBA sale commitments | | — | (75,141,406) | — |
|
| Totals by level | | $— | $(76,804,957) | $— |
* Common stock classifications are presented at the sector level, which may differ from the fund’s portfolio presentation.
During the reporting period, transfers within the fair value hierarchy, if any, did not represent, in the aggregate, more than 1% of the fund’s net assets measured as of the end of the period. Transfers are accounted for using the end of period pricing valuation method.
At the start and close of the reporting period, Level 3 investments in securities represented less than 1% of the fund’s net assets and were not considered a significant portion of the fund’s portfolio.
The accompanying notes are an integral part of these financial statements.
|
| George Putnam Balanced Fund 43 |
Statement of assets and liabilities 7/31/17
| |
| ASSETS | |
|
| Investment in securities, at value, including $20,991,950 of securities on loan (Note 1): | |
| Unaffiliated issuers (identified cost $1,145,793,698) | $1,255,156,513 |
| Affiliated issuers (identified cost $69,685,782) (Notes 1 and 5) | 69,685,782 |
|
| Cash | 5,324 |
|
| Foreign currency (cost $75) (Note 1) | 76 |
|
| Dividends, interest and other receivables | 4,068,764 |
|
| Receivable for shares of the fund sold | 860,489 |
|
| Receivable for investments sold | 17,539,738 |
|
| Receivable for sales of delayed delivery securities (Note 1) | 54,665,847 |
|
| Unrealized appreciation on forward currency contracts (Note 1) | 63,411 |
|
| Prepaid assets | 57,859 |
|
| Total assets | 1,402,103,803 |
|
| |
| LIABILITIES | |
|
| Payable for investments purchased | 18,624,965 |
|
| Payable for purchases of delayed delivery securities (Note 1) | 80,729,181 |
|
| Payable for shares of the fund repurchased | 1,902,953 |
|
| Payable for compensation of Manager (Note 2) | 532,906 |
|
| Payable for custodian fees (Note 2) | 22,434 |
|
| Payable for investor servicing fees (Note 2) | 465,790 |
|
| Payable for Trustee compensation and expenses (Note 2) | 665,835 |
|
| Payable for administrative services (Note 2) | 4,939 |
|
| Payable for distribution fees (Note 2) | 308,011 |
|
| Unrealized depreciation on forward currency contracts (Note 1) | 1,726,962 |
|
| TBA sale commitments, at value (proceeds receivable $74,916,875) (Note 1) | 75,141,406 |
|
| Collateral on securities loaned, at value (Note 1) | 21,555,769 |
|
| Other accrued expenses | 218,673 |
|
| Total liabilities | 201,899,824 |
| | |
| Net assets | $1,200,203,979 |
|
| |
| REPRESENTED BY | |
|
| Paid-in capital (Unlimited shares authorized) (Notes 1 and 4) | $1,505,022,923 |
|
| Undistributed net investment income (Note 1) | 15,132,481 |
|
| Accumulated net realized loss on investments and foreign currency transactions (Note 1) | (427,427,205) |
|
| Net unrealized appreciation of investments and assets and liabilities in foreign currencies | 107,475,780 |
|
| Total — Representing net assets applicable to capital shares outstanding | $1,200,203,979 |
(Continued on next page)
|
| 44 George Putnam Balanced Fund |
Statement of assets and liabilities cont.
| |
| COMPUTATION OF NET ASSET VALUE AND OFFERING PRICE | |
|
| Net asset value and redemption price per class A share | |
| ($972,570,278 divided by 50,942,631 shares) | $19.09 |
|
| Offering price per class A share (100/94.25 of $19.09)* | $20.25 |
|
| Net asset value and offering price per class B share ($20,188,239 divided by 1,069,901 shares)** | $18.87 |
|
| Net asset value and offering price per class C share ($45,969,932 divided by 2,426,080 shares)** | $18.95 |
|
| Net asset value and redemption price per class M share ($70,918,910 divided by 3,767,393 shares) | $18.82 |
|
| Offering price per class M share (100/96.50 of $18.82)* | $19.50 |
|
| Net asset value, offering price and redemption price per class R share | |
| ($1,090,282 divided by 57,304 shares) | $19.03 |
|
| Net asset value, offering price and redemption price per class R5 share | |
| ($13,205 divided by 686 shares) | $19.24† |
|
| Net asset value, offering price and redemption price per class R6 share | |
| ($11,737,598 divided by 612,263 shares) | $19.17 |
|
| Net asset value, offering price and redemption price per class Y share | |
| ($77,715,535 divided by 4,055,255 shares) | $19.16 |
* On single retail sales of less than $50,000. On sales of $50,000 or more the offering price is reduced.
** Redemption price per share is equal to net asset value less any applicable contingent deferred sales charge.
† Net asset value may not recalculate due to rounding of fractional shares.
The accompanying notes are an integral part of these financial statements.
|
| George Putnam Balanced Fund 45 |
Statement of operations Year ended 7/31/17
| |
| INVESTMENT INCOME | |
|
| Dividends (net of foreign tax of $114,027) | $13,902,058 |
|
| Interest (including interest income of $509,213 from investments in affiliated issuers) (Note 5) | 13,624,500 |
|
| Securities lending (net of expenses) (Note 1) | 108,983 |
|
| Total investment income | 27,635,541 |
|
| |
| EXPENSES | |
|
| Compensation of Manager (Note 2) | 6,295,588 |
|
| Investor servicing fees (Note 2) | 2,090,396 |
|
| Custodian fees (Note 2) | 59,017 |
|
| Trustee compensation and expenses (Note 2) | 71,950 |
|
| Distribution fees (Note 2) | 3,542,500 |
|
| Administrative services (Note 2) | 36,306 |
|
| Other | 552,826 |
|
| Total expenses | 12,648,583 |
|
| Expense reduction (Note 2) | (29,168) |
|
| Net expenses | 12,619,415 |
| |
| Net investment income | 15,016,126 |
|
| |
| Net realized gain on securities from unaffiliated issuers (Notes 1 and 3) | 84,278,412 |
|
| Net realized gain on forward currency contracts (Note 1) | 420,697 |
|
| Net realized gain on foreign currency transactions (Note 1) | 3,628 |
|
| Net realized gain on futures contracts (Note 1) | 221,215 |
|
| Net unrealized appreciation of securities in unaffiliated issuers and TBA sale commitments | |
| during the year | 27,336,494 |
|
| Net unrealized depreciation of forward currency contracts during the year | (2,279,062) |
|
| Net unrealized appreciation of assets and liabilities in foreign currencies during the year | 2,310 |
|
| Net gain on investments | 109,983,694 |
| |
| Net increase in net assets resulting from operations | $124,999,820 |
|
The accompanying notes are an integral part of these financial statements.
|
| 46 George Putnam Balanced Fund |
Statement of changes in net assets
| | |
| DECREASE IN NET ASSETS | Year ended 7/31/17 | Year ended 7/31/16 |
|
| Operations | | |
|
| Net investment income | $15,016,126 | $16,191,101 |
|
| Net realized gain on investments | | |
| and foreign currency transactions | 84,923,952 | 6,509,085 |
|
| Net unrealized appreciation (depreciation) of investments | | |
| and assets and liabilities in foreign currencies | 25,059,742 | (1,159,527) |
|
| Net increase in net assets resulting from operations | 124,999,820 | 21,540,659 |
|
| Distributions to shareholders (Note 1): | | |
| From ordinary income | | |
| Net investment income | | |
|
| Class A | (11,235,571) | (11,362,355) |
|
| Class B | (94,595) | (102,384) |
|
| Class C | (197,342) | (196,107) |
|
| Class M | (487,958) | (502,000) |
|
| Class R | (6,751) | (5,030) |
|
| Class R5 | (565,801) | (1,028,461) |
|
| Class R6 | (155,643) | (366,668) |
|
| Class Y | (947,277) | (1,303,237) |
|
| Decrease from capital share transactions (Note 4) | (138,110,403) | (111,655,880) |
|
| Total decrease in net assets | (26,801,521) | (104,981,463) |
|
| |
| NET ASSETS | | |
|
| Beginning of year | 1,227,005,500 | 1,331,986,963 |
|
| End of year (including undistributed net investment | | |
| income of $15,132,481 and $13,015,690, respectively) | $1,200,203,979 | $1,227,005,500 |
The accompanying notes are an integral part of these financial statements.
|
| George Putnam Balanced Fund 47 |
Financial highlights (For a common share outstanding throughout the period)
| | | | | | | | | | | | |
| | INVESTMENT OPERATIONS | LESS DISTRIBUTIONS | RATIOS AND SUPPLEMENTAL DATA |
| |
|
| | | | | | | | | | | | Ratio | |
| | | | Net realized | | | | | | | | of net investment | |
| | Net asset value, | | and unrealized | Total from | From | | | Total return | Net assets, | Ratio of expenses | income (loss) | |
| | beginning | Net investment | gain (loss) | investment | net investment | Total | Net asset value, | at net asset value | end of period | to average | to average | Portfolio |
| Period ended | of period | income (loss)a | on investments | operations | income | distributions | end of period | (%)b | (in thousands) | net assets (%)c | net assets (%) | turnover (%) |
|
| Class A | | | | | | | | | | | | |
|
| July 31, 2017 | $17.38 | .23 | 1.69 | 1.92 | (.21) | (.21) | $19.09 | 11.14 | $972,570 | 1.01 | 1.29 | 204d |
|
| July 31, 2016 | 17.22 | .22 | .14 | .36 | (.20) | (.20) | 17.38 | 2.17 | 953,549 | 1.00e | 1.33e | 154d |
|
| July 31, 2015 | 16.12 | .19 | 1.10 | 1.29 | (.19) | (.19) | 17.22 | 8.04 | 999,928 | .97 | 1.11 | 130d |
|
| July 31, 2014 | 14.81 | .23 | 1.29 | 1.52 | (.21) | (.21) | 16.12 | 10.37 | 1,051,287 | .99 | 1.52 | 98f |
|
| July 31, 2013 | 12.88 | .21 | 1.92 | 2.13 | (.20) | (.20) | 14.81 | 16.68 | 1,030,545 | 1.01 | 1.56 | 86f |
|
| Class B | | | | | | | | | | | | |
|
| July 31, 2017 | $17.18 | .10 | 1.67 | 1.77 | (.08) | (.08) | $18.87 | 10.33 | $20,188 | 1.76 | .55 | 204d |
|
| July 31, 2016 | 17.02 | .10 | .14 | .24 | (.08) | (.08) | 17.18 | 1.42 | 21,592 | 1.75e | .58e | 154d |
|
| July 31, 2015 | 15.94 | .06 | 1.09 | 1.15 | (.07) | (.07) | 17.02 | 7.21 | 24,133 | 1.72 | .36 | 130d |
|
| July 31, 2014 | 14.65 | .12 | 1.27 | 1.39 | (.10) | (.10) | 15.94 | 9.51 | 24,881 | 1.74 | .77 | 98f |
|
| July 31, 2013 | 12.74 | .11 | 1.90 | 2.01 | (.10) | (.10) | 14.65 | 15.83 | 26,541 | 1.76 | .82 | 86f |
|
| Class C | | | | | | | | | | | | |
|
| July 31, 2017 | $17.26 | .10 | 1.67 | 1.77 | (.08) | (.08) | $18.95 | 10.29 | $45,970 | 1.76 | .54 | 204d |
|
| July 31, 2016 | 17.10 | .09 | .15 | .24 | (.08) | (.08) | 17.26 | 1.45 | 41,700 | 1.75e | .58e | 154d |
|
| July 31, 2015 | 16.01 | .06 | 1.10 | 1.16 | (.07) | (.07) | 17.10 | 7.26 | 36,720 | 1.72 | .36 | 130d |
|
| July 31, 2014 | 14.72 | .12 | 1.27 | 1.39 | (.10) | (.10) | 16.01 | 9.50 | 29,091 | 1.74 | .76 | 98f |
|
| July 31, 2013 | 12.80 | .11 | 1.91 | 2.02 | (.10) | (.10) | 14.72 | 15.85 | 23,534 | 1.76 | .81 | 86f |
|
| Class M | | | | | | | | | | | | |
|
| July 31, 2017 | $17.15 | .14 | 1.66 | 1.80 | (.13) | (.13) | $18.82 | 10.53 | $70,919 | 1.51 | .79 | 204d |
|
| July 31, 2016 | 16.99 | .14 | .14 | .28 | (.12) | (.12) | 17.15 | 1.69 | 66,779 | 1.50e | .83e | 154d |
|
| July 31, 2015 | 15.90 | .10 | 1.10 | 1.20 | (.11) | (.11) | 16.99 | 7.56 | 75,297 | 1.47 | .61 | 130d |
|
| July 31, 2014 | 14.62 | .16 | 1.26 | 1.42 | (.14) | (.14) | 15.90 | 9.75 | 77,338 | 1.49 | 1.02 | 98f |
|
| July 31, 2013 | 12.71 | .14 | 1.90 | 2.04 | (.13) | (.13) | 14.62 | 16.17 | 74,636 | 1.51 | 1.06 | 86f |
|
| Class R | | | | | | | | | | | | |
|
| July 31, 2017 | $17.33 | .18 | 1.70 | 1.88 | (.18) | (.18) | $19.03 | 10.90 | $1,090 | 1.26 | .99 | 204d |
|
| July 31, 2016 | 17.16 | .19 | .13 | .32 | (.15) | (.15) | 17.33 | 1.93 | 409 | 1.25e | 1.13e | 154d |
|
| July 31, 2015 | 16.07 | .15 | 1.09 | 1.24 | (.15) | (.15) | 17.16 | 7.74 | 1,102 | 1.22 | .86 | 130d |
|
| July 31, 2014 | 14.77 | .20 | 1.28 | 1.48 | (.18) | (.18) | 16.07 | 10.08 | 983 | 1.24 | 1.27 | 98f |
|
| July 31, 2013 | 12.84 | .18 | 1.92 | 2.10 | (.17) | (.17) | 14.77 | 16.44 | 960 | 1.26 | 1.32 | 86f |
|
| Class R5 | | | | | | | | | | | | |
|
| July 31, 2017 | $17.45 | .30g | 1.69 | 1.99 | (.20) | (.20) | $19.24 | 11.46 | $13 | .74 | 1.71g | 204d |
|
| July 31, 2016 | 17.28 | .26 | .16 | .42 | (.25) | (.25) | 17.45 | 2.49 | 76,674 | .73e | 1.59e | 154d |
|
| July 31, 2015 | 16.18 | .23 | 1.11 | 1.34 | (.24) | (.24) | 17.28 | 8.28 | 71,647 | .72 | 1.34 | 130d |
|
| July 31, 2014† | 15.28 | .18 | .85 | 1.03 | (.13) | (.13) | 16.18 | 6.76* | 11 | .48* | 1.15* | 98f |
See notes to financial highlights at the end of this section.
The accompanying notes are an integral part of these financial statements.
| |
| 48 George Putnam Balanced Fund | George Putnam Balanced Fund 49 |
Financial highlights cont.
| | | | | | | | | | | | |
| | INVESTMENT OPERATIONS | LESS DISTRIBUTIONS | RATIOS AND SUPPLEMENTAL DATA |
| |
|
| | | | | | | | | | | | Ratio | |
| | | | Net realized | | | | | | | | of net investment | |
| | Net asset value, | | and unrealized | Total from | From | | | Total return | Net assets, | Ratio of expenses | income (loss) | |
| | beginning | Net investment | gain (loss) | investment | net investment | Total | Net asset value, | at net asset value | end of period | to average | to average | Portfolio |
| Period ended | of period | income (loss)a | on investments | operations | income | distributions | end of period | (%)b | (in thousands) | net assets (%)c | net assets (%) | turnover (%) |
|
| Class R6 | | | | | | | | | | | | |
|
| July 31, 2017 | $17.45 | .30 | 1.70 | 2.00 | (.28) | (.28) | $19.17 | 11.57 | $11,738 | .64 | 1.64 | 204d |
|
| July 31, 2016 | 17.28 | .28 | .15 | .43 | (.26) | (.26) | 17.45 | 2.58 | 8,013 | .63e | 1.71e | 154d |
|
| July 31, 2015 | 16.18 | .25 | 1.10 | 1.35 | (.25) | (.25) | 17.28 | 8.39 | 8,239 | .62 | 1.46 | 130d |
|
| July 31, 2014† | 15.28 | .19 | .85 | 1.04 | (.14) | (.14) | 16.18 | 6.81* | 7,100 | .42* | 1.19 * | 98f |
|
| Class Y | | | | | | | | | | | | |
|
| July 31, 2017 | $17.45 | .28 | 1.69 | 1.97 | (.26) | (.26) | $19.16 | 11.37 | $77,716 | .76 | 1.54 | 204d |
|
| July 31, 2016 | 17.28 | .26 | .15 | .41 | (.24) | (.24) | 17.45 | 2.48 | 58,289 | .75e | 1.60e | 154d |
|
| July 31, 2015 | 16.17 | .23 | 1.11 | 1.34 | (.23) | (.23) | 17.28 | 8.34 | 114,920 | .72 | 1.36 | 130d |
|
| July 31, 2014 | 14.86 | .27 | 1.29 | 1.56 | (.25) | (.25) | 16.17 | 10.61 | 111,604 | .74 | 1.77 | 98f |
|
| July 31, 2013 | 12.92 | .25 | 1.92 | 2.17 | (.23) | (.23) | 14.86 | 16.99 | 106,794 | .76 | 1.81 | 86f |
* Not annualized.
† For the period December 2, 2013 (commencement of operations) to July 31, 2014.
a Per share net investment income (loss) has been determined on the basis of the weighted average number of shares outstanding during the period.
b Total return assumes dividend reinvestment and does not reflect the effect of sales charges.
c Includes amounts paid through expense offset and/or brokerage/service arrangements, if any (Note 2). Also excludes acquired fund fees and expenses, if any.
d Portfolio turnover includes TBA purchase and sales transactions.
e Reflects a voluntary waiver of certain fund expenses in effect during the period. As a result of such waivers, the expenses of each class reflect a reduction of less than .01% as a percentage of average net assets per share for each class (Note 2).
f Portfolio turnover excludes TBA purchase and sale commitments. Including TBA purchase and sale commitments to conform with current year presentation, the portfolio turnover would have been the following:
| | | |
| July 31, 2014 | 142% | | |
| | |
| July 31, 2013 | 186% | | |
| | |
g The net investment income ratio and per share amount shown for the period ended July 31, 2017 may not correspond with the expected class specific differences for the period due to the timing of redemptions of the class.
The accompanying notes are an integral part of these financial statements.
| |
| 50 George Putnam Balanced Fund | George Putnam Balanced Fund 51 |
Notes to financial statements 7/31/17
Within the following Notes to financial statements, references to “State Street” represent State Street Bank and Trust Company, references to “the SEC” represent the Securities and Exchange Commission, references to “Putnam Management” represent Putnam Investment Management, LLC, the fund’s manager, an indirect wholly-owned subsidiary of Putnam Investments, LLC and references to “OTC”, if any, represent over-the-counter. Unless otherwise noted, the “reporting period” represents the period from August 1, 2016 through July 31, 2017.
George Putnam Balanced Fund (the fund) is a Massachusetts business trust, which is registered under the Investment Company Act of 1940, as amended, as a diversified open-end management investment company. The goal of the fund is to seek to provide a balanced investment composed of a well-diversified portfolio of stocks and bonds which produce both capital growth and current income. The fund invests mainly in a combination of bonds and common stocks (growth or value stocks or both) of large U.S. companies, with a greater focus on common stocks. For example, Putnam Management may purchase stocks of companies with stock prices that reflect a value lower than that which Putnam Management places on the company. Putnam Management may also consider other factors that Putnam Management believes will cause the stock price to rise. The fund buys bonds of governments and private companies that are mostly investment-grade in quality with intermediate- to long-term maturities (three years or longer). Putnam Management may consider, among other factors, a company’s valuation, financial strength, growth potential, competitive position in its industry, projected future earnings, cash flows and dividends when deciding whether to buy or sell equity investments, and, among other factors, credit, interest rate and prepayment risks, as well as general market conditions, when deciding whether to buy or sell fixed-income investments. The fund may also use derivatives, such as futures, options, warrants and swap contracts, for both hedging and non-hedging purposes.
The fund offers class A, class B, class C, class M, class R, class R5, class R6 and class Y shares. The fund registered class T shares in February 2017, however, as of the date of this report, class T shares had not commenced operations and are not available for purchase. Effective April 1, 2017, purchases of class B shares are closed to new and existing investors except by exchange from class B shares of another Putnam fund or through dividend and/or capital gains reinvestment. Class A and class M shares are sold with a maximum front-end sales charge of 5.75% and 3.50%, respectively. Class A shares generally are not subject to a contingent deferred sales charge, and class M, class R, class R5, class R6 and class Y shares are not subject to a contingent deferred sales charge. Class B shares, which convert to class A shares after approximately eight years, are not subject to a front-end sales charge and are subject to a contingent deferred sales charge if those shares are redeemed within six years of purchase. Class C shares are subject to a one-year 1.00% contingent deferred sales charge and do not convert to class A shares. Class R shares, which are not available to all investors, are sold at net asset value. The expenses for class A, class B, class C, class M and class R shares may differ based on the distribution fee of each class, which is identified in Note 2. Class R5, class R6 and class Y shares, which are sold at net asset value, are generally subject to the same expenses as class A, class B, class C, class M and class R shares, but do not bear a distribution fee and in the case of class R5 and class R6 shares, bear a lower investor servicing fee, which is identified in Note 2. Class R5, class R6 and class Y shares are not available to all investors.
In the normal course of business, the fund enters into contracts that may include agreements to indemnify another party under given circumstances. The fund’s maximum exposure under these arrangements is unknown as this would involve future claims that may be, but have not yet been, made against the fund. However, the fund’s management team expects the risk of material loss to be remote.
The fund has entered into contractual arrangements with an investment adviser, administrator, distributor, shareholder servicing agent and custodian, who each provide services to the fund. Unless expressly stated otherwise, shareholders are not parties to, or intended beneficiaries of these contractual arrangements, and these contractual arrangements are not intended to create any shareholder right to enforce them against the service providers or to seek any remedy under them against the service providers, either directly or on behalf of the fund.
Under the fund’s Declaration of Trust, any claims asserted against or on behalf of the Putnam Funds, including claims against Trustees and Officers, must be brought in state and federal courts located within the Commonwealth of Massachusetts.
Note 1: Significant accounting policies
The following is a summary of significant accounting policies consistently followed by the fund in the preparation of its financial statements. The preparation of financial statements is in conformity with accounting principles generally accepted in the United States of America and requires management to make estimates and assumptions that affect the reported amounts of assets and liabilities in the financial statements and the
|
| 52 George Putnam Balanced Fund |
reported amounts of increases and decreases in net assets from operations. Actual results could differ from those estimates. Subsequent events after the Statement of assets and liabilities date through the date that the financial statements were issued have been evaluated in the preparation of the financial statements.
Investment income, realized and unrealized gains and losses and expenses of the fund are borne pro-rata based on the relative net assets of each class to the total net assets of the fund, except that each class bears expenses unique to that class (including the distribution fees applicable to such classes). Each class votes as a class only with respect to its own distribution plan or other matters on which a class vote is required by law or determined by the Trustees. If the fund were liquidated, shares of each class would receive their pro-rata share of the net assets of the fund. In addition, the Trustees declare separate dividends on each class of shares.
Security valuation Portfolio securities and other investments are valued using policies and procedures adopted by the Board of Trustees. The Trustees have formed a Pricing Committee to oversee the implementation of these procedures and have delegated responsibility for valuing the fund’s assets in accordance with these procedures to Putnam Management. Putnam Management has established an internal Valuation Committee that is responsible for making fair value determinations, evaluating the effectiveness of the pricing policies of the fund and reporting to the Pricing Committee.
Investments for which market quotations are readily available are valued at the last reported sales price on their principal exchange, or official closing price for certain markets, and are classified as Level 1 securities under Accounting Standards Codification 820 Fair Value Measurements and Disclosures (ASC 820). If no sales are reported, as in the case of some securities that are traded OTC, a security is valued at its last reported bid price and is generally categorized as a Level 2 security.
Investments in open-end investment companies (excluding exchange-traded funds), if any, which can be classified as Level 1 or Level 2 securities, are valued based on their net asset value. The net asset value of such investment companies equals the total value of their assets less their liabilities and divided by the number of their outstanding shares.
Market quotations are not considered to be readily available for certain debt obligations (including short-term investments with remaining maturities of 60 days or less) and other investments; such investments are valued on the basis of valuations furnished by an independent pricing service approved by the Trustees or dealers selected by Putnam Management. Such services or dealers determine valuations for normal institutional-size trading units of such securities using methods based on market transactions for comparable securities and various relationships, generally recognized by institutional traders, between securities (which consider such factors as security prices, yields, maturities and ratings). These securities will generally be categorized as Level 2.
Many securities markets and exchanges outside the U.S. close prior to the scheduled close of the New York Stock Exchange and therefore the closing prices for securities in such markets or on such exchanges may not fully reflect events that occur after such close but before the scheduled close of the New York Stock Exchange. Accordingly, on certain days, the fund will fair value certain foreign equity securities taking into account multiple factors including movements in the U.S. securities markets, currency valuations and comparisons to the valuation of American Depository Receipts, exchange-traded funds and futures contracts. The foreign equity securities, which would generally be classified as Level 1 securities, will be transferred to Level 2 of the fair value hierarchy when they are valued at fair value. The number of days on which fair value prices will be used will depend on market activity and it is possible that fair value prices will be used by the fund to a significant extent. Securities quoted in foreign currencies, if any, are translated into U.S. dollars at the current exchange rate.
To the extent a pricing service or dealer is unable to value a security or provides a valuation that Putnam Management does not believe accurately reflects the security’s fair value, the security will be valued at fair value by Putnam Management in accordance with policies and procedures approved by the Trustees. Certain investments, including certain restricted and illiquid securities and derivatives, are also valued at fair value following procedures approved by the Trustees. These valuations consider such factors as significant market or specific security events such as interest rate or credit quality changes, various relationships with other securities, discount rates, U.S. Treasury, U.S. swap and credit yields, index levels, convexity exposures, recovery rates, sales and other multiples and resale restrictions. These securities are classified as Level 2 or as Level 3 depending on the priority of the significant inputs.
To assess the continuing appropriateness of fair valuations, the Valuation Committee reviews and affirms the reasonableness of such valuations on a regular basis after considering all relevant information that is reasonably available. Such valuations and procedures are reviewed periodically by the Trustees. Certain securities may be valued on the basis of a price provided by a single source. The fair value of securities is generally determined as
|
| George Putnam Balanced Fund 53 |
the amount that the fund could reasonably expect to realize from an orderly disposition of such securities over a reasonable period of time. By its nature, a fair value price is a good faith estimate of the value of a security in a current sale and does not reflect an actual market price, which may be different by a material amount.
Security transactions and related investment income Security transactions are recorded on the trade date (the date the order to buy or sell is executed). Gains or losses on securities sold are determined on the identified cost basis.
Interest income, net of any applicable withholding taxes, is recorded on the accrual basis. Dividend income, net of any applicable withholding taxes, is recognized on the ex-dividend date except that certain dividends from foreign securities, if any, are recognized as soon as the fund is informed of the ex-dividend date. Non-cash dividends, if any, are recorded at the fair value of the securities received. Dividends representing a return of capital or capital gains, if any, are reflected as a reduction of cost and/or as a realized gain. All premiums/discounts are amortized/accreted on a yield-to-maturity basis.
Securities purchased or sold on a delayed delivery basis may be settled at a future date beyond customary settlement time; interest income is accrued based on the terms of the securities. Losses may arise due to changes in the fair value of the underlying securities or if the counterparty does not perform under the contract.
Stripped securities The fund may invest in stripped securities which represent a participation in securities that may be structured in classes with rights to receive different portions of the interest and principal. Interest-only securities receive all of the interest and principal-only securities receive all of the principal. If the interest-only securities experience greater than anticipated prepayments of principal, the fund may fail to recoup fully its initial investment in these securities. Conversely, principal-only securities increase in value if prepayments are greater than anticipated and decline if prepayments are slower than anticipated. The fair value of these securities is highly sensitive to changes in interest rates.
Foreign currency translation The accounting records of the fund are maintained in U.S. dollars. The fair value of foreign securities, currency holdings, and other assets and liabilities is recorded in the books and records of the fund after translation to U.S. dollars based on the exchange rates on that day. The cost of each security is determined using historical exchange rates. Income and withholding taxes are translated at prevailing exchange rates when earned or incurred. The fund does not isolate that portion of realized or unrealized gains or losses resulting from changes in the foreign exchange rate on investments from fluctuations arising from changes in the market prices of the securities. Such gains and losses are included with the net realized and unrealized gain or loss on investments. Net realized gains and losses on foreign currency transactions represent net realized exchange gains or losses on disposition of foreign currencies, currency gains and losses realized between the trade and settlement dates on securities transactions and the difference between the amount of investment income and foreign withholding taxes recorded on the fund’s books and the U.S. dollar equivalent amounts actually received or paid. Net unrealized appreciation and depreciation of assets and liabilities in foreign currencies arise from changes in the value of assets and liabilities other than investments at the period end, resulting from changes in the exchange rate.
Futures contracts The fund uses futures contracts to equitize cash.
The potential risk to the fund is that the change in value of futures contracts may not correspond to the change in value of the hedged instruments. In addition, losses may arise from changes in the value of the underlying instruments, if there is an illiquid secondary market for the contracts, if interest or exchange rates move unexpectedly or if the counterparty to the contract is unable to perform. With futures, there is minimal counterparty credit risk to the fund since futures are exchange traded and the exchange’s clearinghouse, as counterparty to all exchange traded futures, guarantees the futures against default. Risks may exceed amounts recognized on the Statement of assets and liabilities. When the contract is closed, the fund records a realized gain or loss equal to the difference between the value of the contract at the time it was opened and the value at the time it was closed.
Futures contracts are valued at the quoted daily settlement prices established by the exchange on which they trade. The fund and the broker agree to exchange an amount of cash equal to the daily fluctuation in the value of the futures contract. Such receipts or payments are known as “variation margin.”
Futures contracts outstanding at period end, if any, are listed after the fund’s portfolio.
Forward currency contracts The fund buys and sells forward currency contracts, which are agreements between two parties to buy and sell currencies at a set price on a future date. These contracts are used to hedge foreign exchange risk.
|
| 54 George Putnam Balanced Fund |
The U.S. dollar value of forward currency contracts is determined using current forward currency exchange rates supplied by a quotation service. The fair value of the contract will fluctuate with changes in currency exchange rates. The contract is marked to market daily and the change in fair value is recorded as an unrealized gain or loss. The fund records a realized gain or loss equal to the difference between the value of the contract at the time it was opened and the value at the time it was closed when the contract matures or by delivery of the currency. The fund could be exposed to risk if the value of the currency changes unfavorably, if the counterparties to the contracts are unable to meet the terms of their contracts or if the fund is unable to enter into a closing position. Risks may exceed amounts recognized on the Statement of assets and liabilities.
Forward currency contracts outstanding at period end, if any, are listed after the fund’s portfolio.
TBA commitments The fund may enter into TBA (to be announced) commitments to purchase securities for a fixed unit price at a future date beyond customary settlement time. Although the unit price and par amount have been established, the actual securities have not been specified. However, it is anticipated that the amount of the commitments will not significantly differ from the principal amount. The fund holds, and maintains until settlement date, cash or high-grade debt obligations in an amount sufficient to meet the purchase price, or the fund may enter into offsetting contracts for the forward sale of other securities it owns. Income on the securities will not be earned until settlement date.
The fund may also enter into TBA sale commitments to hedge its portfolio positions, to sell mortgage-backed securities it owns under delayed delivery arrangements or to take a short position in mortgage-backed securities. Proceeds of TBA sale commitments are not received until the contractual settlement date. During the time a TBA sale commitment is outstanding, either equivalent deliverable securities or an offsetting TBA purchase commitment deliverable on or before the sale commitment date are held as “cover” for the transaction, or other liquid assets in an amount equal to the notional value of the TBA sale commitment are segregated. If the TBA sale commitment is closed through the acquisition of an offsetting TBA purchase commitment, the fund realizes a gain or loss. If the fund delivers securities under the commitment, the fund realizes a gain or a loss from the sale of the securities based upon the unit price established at the date the commitment was entered into.
TBA commitments, which are accounted for as purchase and sale transactions, may be considered securities themselves, and involve a risk of loss due to changes in the value of the security prior to the settlement date as well as the risk that the counterparty to the transaction will not perform its obligations. Counterparty risk is mitigated by having a master agreement between the fund and the counterparty.
Unsettled TBA commitments are valued at their fair value according to the procedures described under “Security valuation” above. The contract is marked to market daily and the change in fair value is recorded by the fund as an unrealized gain or loss. Based on market circumstances, Putnam Management will determine whether to take delivery of the underlying securities or to dispose of the TBA commitments prior to settlement.
TBA purchase commitments outstanding at period end, if any, are listed within the fund’s portfolio and TBA sale commitments outstanding at period end, if any, are listed after the fund’s portfolio.
Master agreements The fund is a party to ISDA (International Swaps and Derivatives Association, Inc.) Master Agreements that govern OTC derivative and foreign exchange contracts and Master Securities Forward Transaction Agreements that govern transactions involving mortgage-backed and other asset-backed securities that may result in delayed delivery (Master Agreements) with certain counterparties entered into from time to time. The Master Agreements may contain provisions regarding, among other things, the parties’ general obligations, representations, agreements, collateral requirements, events of default and early termination. With respect to certain counterparties, in accordance with the terms of the Master Agreements, collateral posted to the fund is held in a segregated account by the fund’s custodian and, with respect to those amounts which can be sold or repledged, are presented in the fund’s portfolio.
Collateral pledged by the fund is segregated by the fund’s custodian and identified in the fund’s portfolio. Collateral can be in the form of cash or debt securities issued by the U.S. Government or related agencies or other securities as agreed to by the fund and the applicable counterparty. Collateral requirements are determined based on the fund’s net position with each counterparty.
With respect to ISDA Master Agreements, termination events applicable to the fund may occur upon a decline in the fund’s net assets below a specified threshold over a certain period of time. Termination events applicable to counterparties may occur upon a decline in the counterparty’s long-term or short-term credit ratings below a specified level. In each case, upon occurrence, the other party may elect to terminate early and cause settlement of all derivative and foreign exchange contracts outstanding, including the payment of any losses and costs
|
| George Putnam Balanced Fund 55 |
resulting from such early termination, as reasonably determined by the terminating party. Any decision by one or more of the fund’s counterparties to elect early termination could impact the fund’s future derivative activity.
At the close of the reporting period, the fund had a net liability position of $1,663,551 on open derivative contracts subject to the Master Agreements. Collateral posted by the fund at period end for these agreements totaled $1,512,334 and may include amounts related to unsettled agreements.
Securities lending The fund may lend securities, through its agent, to qualified borrowers in order to earn additional income. The loans are collateralized by cash in an amount at least equal to the fair value of the securities loaned. The fair value of securities loaned is determined daily and any additional required collateral is allocated to the fund on the next business day. The remaining maturities of the securities lending transactions are considered overnight and continuous. The risk of borrower default will be borne by the fund’s agent; the fund will bear the risk of loss with respect to the investment of the cash collateral. Income from securities lending, net of expenses, is included in investment income on the Statement of operations. Cash collateral is invested in Putnam Cash Collateral Pool, LLC, a limited liability company managed by an affiliate of Putnam Management. Investments in Putnam Cash Collateral Pool, LLC are valued at its closing net asset value each business day. There are no management fees charged to Putnam Cash Collateral Pool, LLC. At the close of the reporting period, the fund received cash collateral of $21,555,769 and the value of securities loaned amounted to $20,991,950.
Interfund lending The fund, along with other Putnam funds, may participate in an interfund lending program pursuant to an exemptive order issued by the SEC. This program allows the fund to borrow from or lend to other Putnam funds that permit such transactions. Interfund lending transactions are subject to each fund’s investment policies and borrowing and lending limits. Interest earned or paid on the interfund lending transaction will be based on the average of certain current market rates. During the reporting period, the fund did not utilize the program.
Lines of credit The fund participates, along with other Putnam funds, in a $317.5 million unsecured committed line of credit and a $235.5 million unsecured uncommitted line of credit, both provided by State Street. Borrowings may be made for temporary or emergency purposes, including the funding of shareholder redemption requests and trade settlements. Interest is charged to the fund based on the fund’s borrowing at a rate equal to the higher of (1) the Federal Funds rate and (2) the overnight LIBOR plus 1.25% for the committed line of credit and the Federal Funds rate plus 1.30% for the uncommitted line of credit. A closing fee equal to 0.04% of the committed line of credit plus a $25,000 flat fee and 0.04% of the uncommitted line of credit has been paid by the participating funds. In addition, a commitment fee of 0.21% per annum on any unutilized portion of the committed line of credit is allocated to the participating funds based on their relative net assets and paid quarterly. During the reporting period, the fund had no borrowings against these arrangements.
Federal taxes It is the policy of the fund to distribute all of its taxable income within the prescribed time period and otherwise comply with the provisions of the Internal Revenue Code of 1986, as amended (the Code), applicable to regulated investment companies. It is also the intention of the fund to distribute an amount sufficient to avoid imposition of any excise tax under Section 4982 of the Code.
The fund is subject to the provisions of Accounting Standards Codification 740 Income Taxes (ASC 740). ASC 740 sets forth a minimum threshold for financial statement recognition of the benefit of a tax position taken or expected to be taken in a tax return. The fund did not have a liability to record for any unrecognized tax benefits in the accompanying financial statements. No provision has been made for federal taxes on income, capital gains or unrealized appreciation on securities held nor for excise tax on income and capital gains. Each of the fund’s federal tax returns for the prior three fiscal years remains subject to examination by the Internal Revenue Service.
The fund may also be subject to taxes imposed by governments of countries in which it invests. Such taxes are generally based on either income or gains earned or repatriated. The fund accrues and applies such taxes to net investment income, net realized gains and net unrealized gains as income and/or capital gains are earned. In some cases, the fund may be entitled to reclaim all or a portion of such taxes, and such reclaim amounts, if any, are reflected as an asset on the fund’s books. In many cases, however, the fund may not receive such amounts for an extended period of time, depending on the country of investment.
|
| 56 George Putnam Balanced Fund |
At July 31, 2017, the fund had a capital loss carryover of $424,406,218 available to the extent allowed by the Code to offset future net capital gain, if any. For any carryover, the amount of the carryover and that carryover’s expiration date is:
| | | |
| Loss carryover |
|
| Short-term | Long-term | Total | Expiration |
|
| $424,406,218 | N/A | $424,406,218 | July 31, 2018 |
|
Under the Regulated Investment Company Modernization Act of 2010, the fund will be permitted to carry forward capital losses incurred in taxable years beginning after December 22, 2010 for an unlimited period. However, any losses incurred will be required to be utilized prior to the losses incurred in pre-enactment tax years. As a result of this ordering rule, pre-enactment capital loss carryforwards may be more likely to expire unused. Additionally, post-enactment capital losses that are carried forward will retain their character as either short-term or long-term capital losses rather than being considered all short-term as under previous law.
Distributions to shareholders Distributions to shareholders from net investment income are recorded by the fund on the ex-dividend date. Distributions from capital gains, if any, are recorded on the ex-dividend date and paid at least annually. The amount and character of income and gains to be distributed are determined in accordance with income tax regulations, which may differ from generally accepted accounting principles. These differences include temporary and/or permanent differences from losses on wash sale transactions, from foreign currency gains and losses, from interest-only securities, and from corporate action adjustments to basis and income. Reclassifications are made to the fund’s capital accounts to reflect income and gains available for distribution (or available capital loss carryovers) under income tax regulations. At the close of the reporting period, the fund reclassified $791,603 to increase undistributed net investment income, $173,577 to increase paid-in capital and $965,180 to increase accumulated net realized loss.
The tax basis components of distributable earnings and the federal tax cost as of the close of the reporting period were as follows:
| |
| Unrealized appreciation | $128,984,144 |
|
| Unrealized depreciation | (22,642,040) |
|
| Net unrealized appreciation | 106,342,104 |
|
| Undistributed ordinary income | 13,469,129 |
|
| Capital loss carryforward | (424,406,218) |
|
| Cost for federal income tax purposes | $1,218,499,936 |
Note 2: Management fee, administrative services and other transactions
The fund pays Putnam Management a management fee (based on the fund’s average net assets and computed and paid monthly) at annual rates that may vary based on the average of the aggregate net assets of all open-end mutual funds sponsored by Putnam Management (excluding net assets of funds that are invested in, or that are invested in by, other Putnam funds to the extent necessary to avoid “double counting” of those assets). Such annual rates may vary as follows:
| | | | |
| 0.680% | of the first $5 billion, | | 0.480% | of the next $50 billion, |
| |
|
| 0.630% | of the next $5 billion, | | 0.460% | of the next $50 billion, |
| |
|
| 0.580% | of the next $10 billion, | | 0.450% | of the next $100 billion and |
| |
|
| 0.530% | of the next $10 billion, | | 0.445% | of any excess thereafter. |
For the reporting period, the management fee represented an effective rate (excluding the impact from any expense waivers in effect) of 0.525% of the fund’s average net assets.
Putnam Management has contractually agreed, through November 30, 2018, to waive fees or reimburse the fund’s expenses to the extent necessary to limit the cumulative expenses of the fund, exclusive of brokerage, interest, taxes, investment-related expenses, extraordinary expenses, acquired fund fees and expenses and payments under the fund’s investor servicing contract, investment management contract and distribution plans, on a fiscal
|
| George Putnam Balanced Fund 57 |
year-to-date basis to an annual rate of 0.20% of the fund’s average net assets over such fiscal year-to-date period.
During the reporting period, the fund’s expenses were not reduced as a result of this limit.
Putnam Investments Limited (PIL), an affiliate of Putnam Management, is authorized by the Trustees to manage a separate portion of the assets of the fund as determined by Putnam Management from time to time. PIL did not manage any portion of the assets of the fund during the reporting period. If Putnam Management were to engage the services of PIL, Putnam Management would pay a quarterly sub-management fee to PIL for its services at an annual rate of 0.40% of the average net assets of the portion of the fund managed by PIL.
The fund reimburses Putnam Management an allocated amount for the compensation and related expenses of certain officers of the fund and their staff who provide administrative services to the fund. The aggregate amount of all such reimbursements is determined annually by the Trustees.
Custodial functions for the fund’s assets are provided by State Street. Custody fees are based on the fund’s asset level, the number of its security holdings and transaction volumes.
Putnam Investor Services, Inc., an affiliate of Putnam Management, provides investor servicing agent functions to the fund. Putnam Investor Services, Inc. received fees for investor servicing for class A, class B, class C, class M, class R, and class Y shares that included (1) a per account fee for each direct and underlying non-defined contribution account (“retail account”) of the fund; (2) a specified rate of the fund’s assets attributable to defined contribution plan accounts; and (3) a specified rate based on the average net assets in retail accounts. Putnam Investor Services, Inc. has agreed that the aggregate investor servicing fees for each fund’s retail and defined contribution accounts for these share classes will not exceed an annual rate of 0.25% of the fund’s average assets attributable to such accounts.
Class R5 shares paid a monthly fee based on the average net assets of class R5 shares at an annual rate of 0.15%.
Class R6 shares paid a monthly fee based on the average net assets of class R6 shares at an annual rate of 0.05%.
Prior to September 1, 2016, Putnam Investor Services, Inc. received fees for investor servicing for class A, class B, class C, class M, class R, and class Y shares that included (1) a per account fee for each retail account of the fund and each of the other funds in its specified category, which was totaled and then allocated to each fund in the category based on its average daily net assets; (2) a specified rate of the fund’s assets attributable to defined contribution plan accounts; and (3) a specified rate based on the average net assets in retail accounts. Prior to September 1, 2016, Putnam Investor Services, Inc. had agreed that the aggregate investor servicing fees for each fund’s retail and defined contribution accounts for these share classes would not exceed an annual rate of 0.320% of the fund’s average assets attributable to such accounts.
During the reporting period, the expenses for each class of shares related to investor servicing fees were as follows:
| | | | |
| Class A | $1,681,006 | | Class R5 | 48,701 |
| |
|
| Class B | 37,246 | | Class R6 | 5,461 |
| |
|
| Class C | 77,169 | | Class Y | 119,089 |
| |
|
| Class M | 120,424 | | Total | $2,090,396 |
| | | |
| Class R | 1,300 | | | |
| | | |
The fund has entered into expense offset arrangements with Putnam Investor Services, Inc. and State Street whereby Putnam Investor Services, Inc.’s and State Street’s fees are reduced by credits allowed on cash balances. The fund also reduced expenses through brokerage/service arrangements. For the reporting period, the fund’s expenses were reduced by $1,922 under the expense offset arrangements and by $27,246 under the brokerage/service arrangements.
Each Independent Trustee of the fund receives an annual Trustee fee, of which $883, as a quarterly retainer, has been allocated to the fund, and an additional fee for each Trustees meeting attended. Trustees also are reimbursed for expenses they incur relating to their services as Trustees.
|
| 58 George Putnam Balanced Fund |
The fund has adopted a Trustee Fee Deferral Plan (the Deferral Plan) which allows the Trustees to defer the receipt of all or a portion of Trustees fees payable on or after July 1, 1995. The deferred fees remain invested in certain Putnam funds until distribution in accordance with the Deferral Plan.
The fund has adopted an unfunded noncontributory defined benefit pension plan (the Pension Plan) covering all Trustees of the fund who have served as a Trustee for at least five years and were first elected prior to 2004. Benefits under the Pension Plan are equal to 50% of the Trustee’s average annual attendance and retainer fees for the three years ended December 31, 2005. The retirement benefit is payable during a Trustee’s lifetime, beginning the year following retirement, for the number of years of service through December 31, 2006. Pension expense for the fund is included in Trustee compensation and expenses in the Statement of operations. Accrued pension liability is included in Payable for Trustee compensation and expenses in the Statement of assets and liabilities. The Trustees have terminated the Pension Plan with respect to any Trustee first elected after 2003.
The fund has adopted distribution plans (the Plans) with respect to the following share classes pursuant to Rule 12b–1 under the Investment Company Act of 1940. The purpose of the Plans is to compensate Putnam Retail Management Limited Partnership, an indirect wholly-owned subsidiary of Putnam Investments, LLC, for services provided and expenses incurred in distributing shares of the fund. The Plans provide payments by the fund to Putnam Retail Management Limited Partnership at an annual rate of up to the following amounts (“Maximum %”) of the average net assets attributable to each class. The Trustees have approved payment by the fund at the following annual rate (“Approved %”) of the average net assets attributable to each class. During the reporting period, the class-specific expenses related to distribution fees were as follows:
| | | |
| | Maximum % | Approved % | Amount |
|
| Class A | 0.35% | 0.25% | $2,379,541 |
|
| Class B | 1.00% | 1.00% | 210,723 |
|
| Class C | 1.00% | 1.00% | 437,017 |
|
| Class M | 1.00% | 0.75% | 511,503 |
|
| Class R | 1.00% | 0.50% | 3,716 |
|
| Total | | | $3,542,500 |
For the reporting period, Putnam Retail Management Limited Partnership, acting as underwriter, received net commissions of $86,189 and $1,421 from the sale of class A and class M shares, respectively, and received $8,643 and $1,255 in contingent deferred sales charges from redemptions of class B and class C shares, respectively.
A deferred sales charge of up to 1.00% is assessed on certain redemptions of class A shares. For the reporting period, Putnam Retail Management Limited Partnership, acting as underwriter, received $39 on class A redemptions.
Note 3: Purchases and sales of securities
During the reporting period, the cost of purchases and the proceeds from sales, excluding short-term investments, were as follows:
| | |
| | Cost of purchases | Proceeds from sales |
|
| Investments in securities, including TBA commitments (Long-term) | $2,294,483,303 | $2,373,747,674 |
|
| U.S. government securities (Long-term) | 49,285,287 | 61,403,383 |
|
| Total | $2,343,768,590 | $2,435,151,057 |
The fund may purchase or sell investments from or to other Putnam funds in the ordinary course of business, which can reduce the fund’s transaction costs, at prices determined in accordance with SEC requirements and policies approved by the Trustees. During the reporting period, purchases or sales of long-term securities from or to other Putnam funds, if any, did not represent more than 5% of the fund’s total cost of purchases and/or total proceeds from sales.
|
| George Putnam Balanced Fund 59 |
Note 4: Capital shares
At the close of the reporting period, there were an unlimited number of shares of beneficial interest authorized. Transactions in capital shares were as follows:
| | | | |
| | YEAR ENDED 7/31/17 | YEAR ENDED 7/31/16 |
| Class A | Shares | Amount | Shares | Amount |
|
| Shares sold | 2,202,885 | $39,786,938 | 2,585,466 | $42,620,286 |
|
| Shares issued in connection with | | | | |
| reinvestment of distributions | 577,406 | 10,365,598 | 635,462 | 10,433,690 |
|
| | 2,780,291 | 50,152,536 | 3,220,928 | 53,053,976 |
|
| Shares repurchased | (6,689,972) | (120,513,807) | (6,444,498) | (106,322,090) |
|
| Net decrease | (3,909,681) | $(70,361,271) | (3,223,570) | $(53,268,114) |
| |
| | YEAR ENDED 7/31/17 | YEAR ENDED 7/31/16 |
| Class B | Shares | Amount | Shares | Amount |
|
| Shares sold | 132,514 | $2,321,878 | 200,145 | $3,264,784 |
|
| Shares issued in connection with | | | | |
| reinvestment of distributions | 5,079 | 90,067 | 5,963 | 97,029 |
|
| | 137,593 | 2,411,945 | 206,108 | 3,361,813 |
|
| Shares repurchased | (324,166) | (5,782,170) | (367,448) | (5,977,728) |
|
| Net decrease | (186,573) | $(3,370,225) | (161,340) | $(2,615,915) |
| |
| | YEAR ENDED 7/31/17 | YEAR ENDED 7/31/16 |
| Class C | Shares | Amount | Shares | Amount |
|
| Shares sold | 495,386 | $8,850,728 | 885,692 | $14,594,654 |
|
| Shares issued in connection with | | | | |
| reinvestment of distributions | 9,604 | 171,631 | 10,397 | 169,838 |
|
| | 504,990 | 9,022,359 | 896,089 | 14,764,492 |
|
| Shares repurchased | (495,191) | (8,893,301) | (627,298) | (10,291,137) |
|
| Net increase | 9,799 | $129,058 | 268,791 | $4,473,355 |
| |
| | YEAR ENDED 7/31/17 | YEAR ENDED 7/31/16 |
| Class M | Shares | Amount | Shares | Amount |
|
| Shares sold | 376,213 | $6,667,677 | 291,292 | $4,736,923 |
|
| Shares issued in connection with | | | | |
| reinvestment of distributions | 27,378 | 485,506 | 30,784 | 499,259 |
|
| | 403,591 | 7,153,183 | 322,076 | 5,236,182 |
|
| Shares repurchased | (530,725) | (9,426,192) | (860,422) | (13,953,965) |
|
| Net decrease | (127,134) | $(2,273,009) | (538,346) | $(8,717,783) |
|
| 60 George Putnam Balanced Fund |
| | | | |
| | YEAR ENDED 7/31/17 | YEAR ENDED 7/31/16 |
| Class R | Shares | Amount | Shares | Amount |
|
| Shares sold | 52,756 | $946,668 | 24,807 | $410,071 |
|
| Shares issued in connection with | | | | |
| reinvestment of distributions | 362 | 6,562 | 305 | 4,969 |
|
| | 53,118 | 953,230 | 25,112 | 415,040 |
|
| Shares repurchased | (19,404) | (347,705) | (65,752) | (1,077,168) |
|
| Net increase (decrease) | 33,714 | $605,525 | (40,640) | $(662,128) |
| |
| | YEAR ENDED 7/31/17 | YEAR ENDED 7/31/16 |
| Class R5 | Shares | Amount | Shares | Amount |
|
| Shares sold | 301,981 | $5,272,798 | 959,785 | $15,911,788 |
|
| Shares issued in connection with | | | | |
| reinvestment of distributions | 32,489 | 565,801 | 62,403 | 1,028,461 |
|
| | 334,470 | 5,838,599 | 1,022,188 | 16,940,249 |
|
| Shares repurchased | (4,727,649) | (83,905,117) | (773,902) | (12,818,389) |
|
| Net increase (decrease) | (4,393,179) | $(78,066,518) | 248,286 | $4,121,860 |
| |
| | YEAR ENDED 7/31/17 | YEAR ENDED 7/31/16 |
| Class R6 | Shares | Amount | Shares | Amount |
|
| Shares sold | 518,751 | $9,080,109 | 1,894,887 | $30,556,270 |
|
| Shares issued in connection with | | | | |
| reinvestment of distributions | 8,584 | 155,643 | 22,331 | 366,668 |
|
| | 527,335 | 9,235,752 | 1,917,218 | 30,922,938 |
|
| Shares repurchased | (374,138) | (6,771,775) | (1,934,837) | (32,250,486) |
|
| Net increase (decrease) | 153,197 | $2,463,977 | (17,619) | $(1,327,548) |
| |
| | YEAR ENDED 7/31/17 | YEAR ENDED 7/31/16 |
| Class Y | Shares | Amount | Shares | Amount |
|
| Shares sold | 1,534,355 | $27,609,634 | 1,659,173 | $27,671,572 |
|
| Shares issued in connection with | | | | |
| reinvestment of distributions | 50,154 | 905,205 | 76,694 | 1,262,449 |
|
| | 1,584,509 | 28,514,839 | 1,735,867 | 28,934,021 |
|
| Shares repurchased | (869,848) | (15,752,779) | (5,045,595) | (82,593,628) |
|
| Net increase (decrease) | 714,661 | $12,762,060 | (3,309,728) | $(53,659,607) |
At the close of the reporting period, Putnam Investments, LLC owned the following shares of the fund:
| | | |
| | Shares owned | Percentage of ownership | Value |
|
| Class R5 | 686 | 100% | 13,205 |
|
| Class R6 | 691 | 0.11 | 13,246 |
|
| George Putnam Balanced Fund 61 |
Note 5: Affiliated transactions
Transactions during the reporting period with any company which is under common ownership or control were as follows:
| | | | | |
| | | | | | Shares |
| | | | | | outstanding |
| | | | | | and fair |
| | Fair value as | Purchase | Sale | Investment | value as |
| Name of affiliate | of 7/31/16 | Cost | Proceeds | Income | of 7/31/17 |
|
| Short-term investments | | | | | |
|
| Putnam Cash Collateral | | | | | |
| Pool, LLC* | $— | $288,536,119 | $266,980,350 | $188,102 | $21,555,769 |
|
| Putnam Short Term | | | | | |
| Investment Fund** | 85,041,084 | 229,421,466 | 266,332,537 | 509,213 | 48,130,013 |
|
| Total Short-term | | | | | |
| investments | $85,041,084 | $517,957,585 | $533,312,887 | $697,315 | $69,685,782 |
* No management fees are charged to Putnam Cash Collateral Pool, LLC. Investment income shown is included in securities lending income on the Statement of operations. There were no realized or unrealized gains or losses during the period.
** Management fees charged to Putnam Short Term Investment Fund have been waived by Putnam Management. There were no realized or unrealized gains or losses during the period.
Note 6: Market, credit and other risks
In the normal course of business, the fund trades financial instruments and enters into financial transactions where risk of potential loss exists due to changes in the market (market risk) or failure of the contracting party to the transaction to perform (credit risk). The fund may be exposed to additional credit risk that an institution or other entity with which the fund has unsettled or open transactions will default. Investments in foreign securities involve certain risks, including those related to economic instability, unfavorable political developments, and currency fluctuations. The fund may invest a significant portion of its assets in securitized debt instruments, including mortgage-backed and asset-backed investments. The yields and values of these investments are sensitive to changes in interest rates, the rate of principal payments on the underlying assets and the market’s perception of the issuers. The market for these investments may be volatile and limited, which may make them difficult to buy or sell.
Note 7: Summary of derivative activity
The volume of activity for the reporting period for any derivative type that was held during the period is listed below and was based on an average of the holdings at the end of each fiscal quarter:
| |
| Futures contracts (number of contracts) | 4 |
|
| Forward currency contracts (contract amount) | $50,100,000 |
|
| Warrants (number of warrants) | 4,000 |
|
|
| 62 George Putnam Balanced Fund |
The following is a summary of the fair value of derivative instruments as of the close of the reporting period:
| | | | |
| Fair value of derivative instruments as of the close of the reporting period | |
|
| | ASSET DERIVATIVES | LIABILITY DERIVATIVES |
|
| Derivatives not | | | | |
| accounted for as | Statement of | | Statement of | |
| hedging instruments | assets and | | assets and | |
| under ASC 815 | liabilities location | Fair value | liabilities location | Fair value |
|
| Foreign exchange | | | | |
| contracts | Receivables | $63,411 | Payables | $1,726,962 |
|
| Equity contracts | Investments | 44,881 | | — |
|
| Total | | $108,292 | | $1,726,962 |
The following is a summary of realized and change in unrealized gains or losses of derivative instruments in the Statement of operations for the reporting period (Note 1):
| | | |
| Amount of realized gain or (loss) on derivatives recognized in net gain or (loss) on investments | |
|
| Derivatives not accounted for as hedging | | Forward currency | |
| instruments under ASC 815 | Futures | contracts | Total |
|
| Foreign exchange contracts | $— | 420,697 | $420,697 |
|
| Equity contracts | 221,215 | — | 221,215 |
|
| Total | $221,215 | $420,697 | $641,912 |
| |
| Change in unrealized appreciation or (depreciation) on derivatives recognized in net gain or (loss) |
| on investments | | | |
|
| Derivatives not accounted for as hedging | | Forward currency | |
| instruments under ASC 815 | Warrants | contracts | Total |
|
| Foreign exchange contracts | $— | (2,279,062) | $(2,279,062) |
|
| Equity contracts | 8,515 | — | 8,515 |
|
| Total | $8,515 | $(2,279,062) | $(2,270,547) |
|
| George Putnam Balanced Fund 63 |
Note 8: Offsetting of financial and derivative assets and liabilities
The following table summarizes any derivatives, repurchase agreements and reverse repurchase agreements, at the end of the reporting period, that are subject to an enforceable master netting agreement or similar agreement. For securities lending transactions or borrowing transactions associated with securities sold short, if any, see Note 1. For financial reporting purposes, the fund does not offset financial assets and financial liabilities that are subject to the master netting agreements in the Statement of assets and liabilities.
| | | | | | | | | | | | | | | |
| | Bank of America N.A. | | Barclays Bank PLC | | Citibank, N.A. | | Credit Suisse International | | Goldmann Sachs International | | JPMorgan Chase Bank N.A. | | UBS AG | | Total |
|
| Assets: | | | | | | | | | | | | | | | |
|
| Forward currency | $— | | $63,400 | | $— | | $— | | $— | | $11 | | $— | | $63,411 |
| contracts # | | | | | | | | | | | | | | | |
|
| Total Assets | $— | | $63,400 | | $— | | $— | | $— | | $11 | | $— | | $63,411 |
|
| Liabilities: | | | | | | | | | | | | | | | |
|
| Forward currency | 305,079 | | 114,679 | | 716,048 | | 207,905 | | 84,047 | | 171,518 | | 127,686 | | 1,726,962 |
| contracts # | | | | | | | | | | | | | | | |
|
| Total Liabilities | $305,079 | | $114,679 | | $716,048 | | $207,905 | | $84,047 | | $171,518 | | $127,686 | | $1,726,962 |
|
| Total Financial | | | | | | | | | | | | | | | |
| and Derivative | $(305,079) | | $(51,279) | | $(716,048) | | $(207,905) | | $(84,047) | | $(171,507) | | $(127,686) | | $(1,663,551) |
| Net Assets | | | | | | | | | | | | | | | |
|
| Total collateral | | | | | | | | | | | | | | | |
| received | $(305,079) | | $(51,279) | | $(637,313) | | $(112,627) | | $(62,540) | | $(136,993) | | $(115,153) | | |
| (pledged)†## | | | | | | | | | | | | | | | |
|
| Net amount | $— | | $— | | $(78,735) | | $(95,278) | | $(21,507) | | $(34,514) | | $(12,533) | | |
† Additional collateral may be required from certain brokers based on individual agreements.
# Covered by master netting agreement (Note 1).
## Any over-collateralization of total financial and derivative net assets is not shown. Collateral may include amounts related to unsettled agreements.
Note 9: New pronouncements
In October 2016, the SEC adopted amendments to rules under the Investment Company Act of 1940 (“final rules”) intended to modernize the reporting and disclosure of information by registered investment companies. The final rules amend Regulation S-X and require funds to provide standardized, enhanced derivative disclosure in fund financial statements in a format designed for individual investors. The amendments to Regulation S-X also update the disclosures for other investments and investments in and advances to affiliates and amend the rules regarding the general form and content of fund financial statements. The compliance date for the amendments to Regulation S-X is August 1, 2017. Putnam Management has evaluated the amendments and its adoption will have no effect on the fund’s net assets or results of operations.
|
| 64 George Putnam Balanced Fund |
Federal tax information (Unaudited)
The fund designated 72.28% of ordinary income distributions as qualifying for the dividends received deduction for corporations.
For the reporting period, the fund hereby designates 80.47%, or the maximum amount allowable, of its taxable ordinary income distributions as qualified dividends taxed at the individual net capital gain rates.
For the reporting period, pursuant to §871(k) of the Internal Revenue Code, the fund hereby designates $6,840,998 of distributions paid as qualifying to be taxed as interest-related dividends.
The Form 1099 that will be mailed to you in January 2018 will show the tax status of all distributions paid to your account in calendar 2017.
|
| George Putnam Balanced Fund 65 |

|
| 66 George Putnam Balanced Fund |

* Mr. Reynolds is an “interested person” (as defined in the Investment Company Act of 1940) of the fund and Putnam Investments. He is President and Chief Executive Officer of Putnam Investments, as well as the President of your fund and each of the other Putnam funds.
The address of each Trustee is One Post Office Square, Boston, MA 02109.
As of July 31, 2017, there were 103 Putnam funds. All Trustees serve as Trustees of all Putnam funds.
Each Trustee serves for an indefinite term, until his or her resignation, retirement at age 75, removal, or death.
|
| George Putnam Balanced Fund 67 |
Officers
In addition to Robert L. Reynolds, the other officers of the fund are shown below:
| |
| Jonathan S. Horwitz (Born 1955) | Susan G. Malloy (Born 1957) |
| Executive Vice President, Principal Executive Officer, | Vice President and Assistant Treasurer |
| and Compliance Liaison | Since 2007 |
| Since 2004 | Director of Accounting & Control Services, |
| | Putnam Investments and Putnam Management |
| Robert T. Burns (Born 1961) | |
| Vice President and Chief Legal Officer | Mark C. Trenchard (Born 1962) |
| Since 2011 | Vice President and BSA Compliance Officer |
| General Counsel, Putnam Investments, | Since 2002 |
| Putnam Management, and Putnam Retail Management | Director of Operational Compliance, Putnam |
| | Investments and Putnam Retail Management |
| James F. Clark (Born 1974) | |
| Vice President and Chief Compliance Officer | Nancy E. Florek (Born 1957) |
| Since 2016 | Vice President, Director of Proxy Voting and Corporate |
| Chief Compliance Officer, Putnam Investments | Governance, Assistant Clerk, and Assistant Treasurer |
| and Putnam Management | Since 2000 |
| |
| Michael J. Higgins (Born 1976) | Denere P. Poulack (Born 1968) |
| Vice President, Treasurer, and Clerk | Assistant Vice President, Assistant Clerk, |
| Since 2010 | and Assistant Treasurer |
| | Since 2004 |
| Janet C. Smith (Born 1965) | |
| Vice President, Principal Financial Officer, Principal | |
| Accounting Officer, and Assistant Treasurer | |
| Since 2007 | |
| Director of Fund Administration Services, | |
| Putnam Investments and Putnam Management | |
The principal occupations of the officers for the past five years have been with the employers as shown above, although in some cases they have held different positions with such employers. The address of each officer is One Post Office Square, Boston, MA 02109.
|
| 68 George Putnam Balanced Fund |
Fund information
Founded over 75 years ago, Putnam Investments was built around the concept that a balance between risk and reward is the hallmark of a well-rounded financial program. We manage over 100 funds across income, value, blend, growth, asset allocation, absolute return, and global sector categories.
| | |
| Investment Manager | Trustees | Michael J. Higgins |
| Putnam Investment | Jameson A. Baxter, Chair | Vice President, Treasurer, |
| Management, LLC | Kenneth R. Leibler, Vice Chair | and Clerk |
| One Post Office Square | Liaquat Ahamed | |
| Boston, MA 02109 | Ravi Akhoury | Janet C. Smith |
| | Barbara M. Baumann | Vice President, |
| Investment Sub-Advisor | Katinka Domotorffy | Principal Financial Officer, |
| Putnam Investments Limited | Catharine Bond Hill | Principal Accounting Officer, |
| 57–59 St James’s Street | Paul L. Joskow | and Assistant Treasurer |
| London, England SW1A 1LD | Robert E. Patterson | |
| George Putnam, III | Susan G. Malloy |
| Marketing Services | Robert L. Reynolds | Vice President and |
| Putnam Retail Management | Manoj P. Singh | Assistant Treasurer |
| One Post Office Square | | |
| Boston, MA 02109 | Officers | Mark C. Trenchard |
| Robert L. Reynolds | Vice President and |
| Custodian | President | BSA Compliance Officer |
| State Street Bank | | |
| and Trust Company | Jonathan S. Horwitz | Nancy E. Florek |
| Executive Vice President, | Vice President, Director of |
| Legal Counsel | Principal Executive Officer, | Proxy Voting and Corporate |
| Ropes & Gray LLP | and Compliance Liaison | Governance, Assistant Clerk, |
| | | and Assistant Treasurer |
| Independent Registered Public | Robert T. Burns | |
| Accounting Firm | Vice President and | Denere P. Poulack |
| PricewaterhouseCoopers LLP | Chief Legal Officer | Assistant Vice President, Assistant |
| | | Clerk, and Assistant Treasurer |
| | James F. Clark | |
| | Vice President and | |
| | Chief Compliance Officer | |
This report is for the information of shareholders of George Putnam Balanced Fund. It may also be used as sales literature when preceded or accompanied by the current prospectus, the most recent copy of Putnam’s Quarterly Performance Summary, and Putnam’s Quarterly Ranking Summary. For more recent performance, please visit putnam.com. Investors should carefully consider the investment objectives, risks, charges, and expenses of a fund, which are described in its prospectus. For this and other information or to request a prospectus or summary prospectus, call 1-800-225-1581 toll free. Please read the prospectus carefully before investing. The fund’s Statement of Additional Information contains additional information about the fund’s Trustees and is available without charge upon request by calling 1-800-225-1581.

| |
| (a) The fund's principal executive, financial and accounting officers are employees of Putnam Investment Management, LLC, the Fund's investment manager. As such they are subject to a comprehensive Code of Ethics adopted and administered by Putnam Investments which is designed to protect the interests of the firm and its clients. The Fund has adopted a Code of Ethics which incorporates the Code of Ethics of Putnam Investments with respect to all of its officers and Trustees who are employees of Putnam Investment Management, LLC. For this reason, the Fund has not adopted a separate code of ethics governing its principal executive, financial and accounting officers. |
| |
| Item 3. Audit Committee Financial Expert: |
| |
| The Funds' Audit, Compliance and Distributions Committee is comprised solely of Trustees who are “independent” (as such term has been defined by the Securities and Exchange Commission (“SEC”) in regulations implementing Section 407 of the Sarbanes-Oxley Act (the “Regulations”)). The Trustees believe that each of the members of the Audit, Compliance and Distributions Committee also possess a combination of knowledge and experience with respect to financial accounting matters, as well as other attributes, that qualify them for service on the Committee. In addition, the Trustees have determined that each of Mr. Patterson, Ms. Baumann and Mr. Singh qualifies as an “audit committee financial expert” (as such term has been defined by the Regulations) based on their review of his or her pertinent experience and education. The SEC has stated, and the funds' amended and restated agreement and Declaration of Trust provides, that the designation or identification of a person as an audit committee financial expert pursuant to this Item 3 of Form N-CSR does not impose on such person any duties, obligations or liability that are greater than the duties, obligations and liability imposed on such person as a member of the Audit, Compliance and Distribution Committee and the Board of Trustees in the absence of such designation or identification. |
| |
| Item 4. Principal Accountant Fees and Services: |
| |
| The following table presents fees billed in each of the last two fiscal years for services rendered to the fund by the fund's independent auditor: |
| | | | | |
| Fiscal year ended | Audit Fees | Audit-Related Fees | Tax Fees | All Other Fees |
|
|
| | | | | |
| July 31, 2017 | $121,419 | $ — | $23,698 | $ — |
| July 31, 2016 | $105,601 | $ — | $16,543 | $ — |
| |
| For the fiscal years ended July 31, 2017 and July 31, 2016, the fund's independent auditor billed aggregate non-audit fees in the amounts of $406,228 and $576,296 respectively, to the fund, Putnam Management and any entity controlling, controlled by or under common control with Putnam Management that provides ongoing services to the fund. |
| |
| Audit Fees represent fees billed for the fund's last two fiscal years relating to the audit and review of the financial statements included in annual reports and registration statements, and other services that are normally provided in connection with statutory and regulatory filings or engagements. |
| |
| Audit-Related Fees represent fees billed in the fund's last two fiscal years for services traditionally performed by the fund's auditor, including accounting consultation for proposed transactions or concerning financial accounting and reporting standards and other audit or attest services not required by statute or regulation. |
| |
| Tax Fees represent fees billed in the fund's last two fiscal years for tax compliance, tax planning and tax advice services. Tax planning and tax advice services include assistance with tax audits, employee benefit plans and requests for rulings or technical advice from taxing authorities. |
| |
| Pre-Approval Policies of the Audit, Compliance and Distributions Committee. The Audit, Compliance and Distributions Committee of the Putnam funds has determined that, as a matter of policy, all work performed for the funds by the funds' independent auditors will be pre-approved by the Committee itself and thus will generally not be subject to pre-approval procedures. |
| |
| The Audit, Compliance and Distributions Committee also has adopted a policy to pre-approve the engagement by Putnam Management and certain of its affiliates of the funds' independent auditors, even in circumstances where pre-approval is not required by applicable law. Any such requests by Putnam Management or certain of its affiliates are typically submitted in writing to the Committee and explain, among other things, the nature of the proposed engagement, the estimated fees, and why this work should be performed by that particular audit firm as opposed to another one. In reviewing such requests, the Committee considers, among other things, whether the provision of such services by the audit firm are compatible with the independence of the audit firm. |
| |
| The following table presents fees billed by the fund's independent auditor for services required to be approved pursuant to paragraph (c)(7)(ii) of Rule 2-01 of Regulation S-X. |
| | | | | |
| Fiscal year ended | Audit-Related Fees | Tax Fees | All Other Fees | Total Non-Audit Fees |
|
|
| | | | | |
| July 31, 2017 | $ — | $382,530 | $ — | $ — |
| | | | | |
| July 31, 2016 | $ — | $559,753 | $ — | $ — |
| |
|
Item 5. Audit Committee of Listed Registrants |
| |
|
Item 6. Schedule of Investments: |
| |
| The registrant's schedule of investments in unaffiliated issuers is included in the report to shareholders in Item 1 above. |
| |
|
Item 7. Disclosure of Proxy Voting Policies and Procedures For Closed-End Management Investment Companies: |
| |
|
Item 8. Portfolio Managers of Closed-End Investment Companies |
| |
|
Item 9. Purchases of Equity Securities by Closed-End Management Investment Companies and Affiliated Purchasers: |
| |
|
Item 10. Submission of Matters to a Vote of Security Holders: |
| |
|
Item 11. Controls and Procedures: |
| |
| (a) The registrant's principal executive officer and principal financial officer have concluded, based on their evaluation of the effectiveness of the design and operation of the registrant's disclosure controls and procedures as of a date within 90 days of the filing date of this report, that the design and operation of such procedures are generally effective to provide reasonable assurance that information required to be disclosed by the registrant in this report is recorded, processed, summarized and reported within the time periods specified in the Commission's rules and forms. |
| |
| (b) Changes in internal control over financial reporting: Not applicable |
| |
| (a)(1) The Code of Ethics of The Putnam Funds, which incorporates the Code of Ethics of Putnam Investments, is filed herewith. |
| |
| (a)(2) Separate certifications for the principal executive officer and principal financial officer of the registrant as required by Rule 30a-2(a) under the Investment Company Act of 1940, as amended, are filed herewith. |
| |
| (b) The certifications required by Rule 30a-2(b) under the Investment Company Act of 1940, as amended, are filed herewith. |
| |
| Pursuant to the requirements of the Securities Exchange Act of 1934 and the Investment Company Act of 1940, the registrant has duly caused this report to be signed on its behalf by the undersigned, thereunto duly authorized. |
| |
| George Putnam Balanced Fund |
| |
| By (Signature and Title): |
| |
| /s/ Janet C. Smith
Janet C. Smith
Principal Accounting Officer
|
| |
| Pursuant to the requirements of the Securities Exchange Act of 1934 and the Investment Company Act of 1940, this report has been signed below by the following persons on behalf of the registrant and in the capacities and on the dates indicated. |
| |
| By (Signature and Title): |
| |
| /s/ Jonathan S. Horwitz
Jonathan S. Horwitz
Principal Executive Officer
|
| |
| By (Signature and Title): |
| |
| /s/ Janet C. Smith
Janet C. Smith
Principal Financial Officer
|