Item 1. Report to Stockholders:
-------------------------------
The following is a copy of the report transmitted to stockholders pursuant
to Rule 30e-1 under the Investment Company Act of 1940:

What makes Putnam different?

In 1830, Massachusetts Supreme Judicial Court Justice Samuel Putnam established The Prudent Man Rule, a legal foundation for responsible money management.
THE PRUDENT MAN RULE
All that can be required of a trustee to invest is that he shall conduct himself faithfully and exercise a sound discretion. He is to observe how men of prudence, discretion, and intelligence manage their own affairs, not in regard to speculation, but in regard to the permanent disposition of their funds, considering the probable income, as well as the probable safety of the capital to be invested.

A time-honored tradition in money management
Since 1937, our values have been rooted in a profound sense of responsibility for the money entrusted to us.
A prudent approach to investing
We use a research-driven team approach to seek consistent, dependable, superior investment results over time, although there is no guarantee a fund will meet its objectives.
Funds for every investment goal
We offer a broad range of mutual funds and other financial products so investors and their advisors can build diversified portfolios.
A commitment to doing what’s right for investors
We have below-average expenses and stringent investor protections, and provide a wealth of information about the Putnam funds.
Industry-leading service
We help investors, along with their financial advisors, make informed investment decisions with confidence.
| Message from the Trustees | 2 |
| About the fund | 4 |
| Report from the fund managers | 7 |
| Performance | 13 |
| Expenses | 17 |
| Portfolio turnover | 19 |
| Risk | 20 |
| Your fund’s management | 21 |
| Terms and definitions | 24 |
| Trustee approval of management contract | 26 |
| Other information for shareholders | 31 |
| Financial statements | 32 |
| Federal tax information | 97 |
| About the Trustees | 98 |
| Officers | | 104 |
Cover photograph: © Richard H. Johnson
Message from the Trustees
|
Dear Fellow Shareholder
During the period that ended October 31, 2005, domestic stocks advanced at a pace reflecting their long-term average returns, while bonds registered sub-par results. Outside the United States, most markets showed more impressive gains. Although U.S. economic growth proceeded at a steady pace, new concerns emerged. High energy prices, the Federal Reserve Board’s program of interest-rate increases, and the impact of the unusually active 2005 hurricane season proved challenging to consumers and sparked brief bouts of volatility in financial markets. Putnam Management believes that energy prices, interest rates, and the aftereffects of this year’s storms are likely to continue to shape investment opportunities and risks in the months to come.
Amid the uncertainties of this environment, the professional research, diversification, and active management that mutual funds provide continue to make them an intelligent choice for investors. We want you to know that Putnam Investments’ management team, under the leadership of Chief Executive Officer Ed Haldeman, continues to focus on investment performance and remains committed to putting the interests of shareholders first. In keeping with these goals, we have redesigned and expanded our shareholder reports to make it easier for you to learn more about your fund. Furthermore, on page 26 we provide information about the 2005 approval by the Trustees of your fund’s management contract with Putnam.
We would also like to take this opportunity to announce the retirement of one of your fund’s Trustees, Ronald J. Jackson, who has been an independent Trustee of the Putnam funds since 1996. We thank him for his service.
2
In the following pages, members of your fund’s management team discuss the fund’s performance and strategies, and their outlook for the months ahead. As always, we thank you for your support of the Putnam funds.

Putnam Income Fund: seeking high current income
across a broad range of fixed-income securities
|

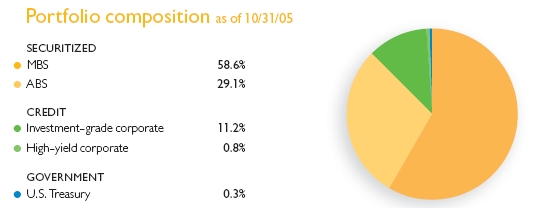
Over Putnam Income Fund’s 50-year history, the bond landscape has undergone a dramatic transformation. One-third of the U.S. investment-grade sector, the fund’s primary focus, is now composed of “securitized” debt instruments, including mortgage- and asset-backed securities. The high-yield corporate bond sector, which was established in the late 1970s, has also grown significantly and is now considered a mature asset class. And outside the United States, there are new opportunities in the debt of developed and emerging-market countries.
Amid this evolution of the fixed-income markets, the investment objective of Putnam Income Fund has remained constant. In a letter to Putnam shareholders in 1963, George Putnam, Jr. (who is currently Chairman Emeritus of the Putnam Funds), expressed it this way: “We have in mind those people who need a liberal current return---” Mr. Putnam’s choice of “current return” rather than “current income” captures the investment philosophy of the team managing your fund today: that high current income should be pursued within a total return context and that risk management is as important as yield in maintaining a high current income stream.
Successful investing in today’s global bond market requires broad expertise. Putnam’s 100-member fixed-income group is divided into teams of specialists who focus on varied investment opportunities. Each team identifies compelling opportunities within its area
Optimizing the risk/return trade-off across multiple sectors
Putnam believes that building a diversified portfolio with multiple income-generating strategies is the best way to pursue your
fund’s objectives. The fund’s portfolio is composed of a broad spectrum of government, credit, and securitized debt instruments.
4
of expertise. Your fund’s management team selects from among these opportunities, systematically building a diversified portfolio that carefully balances risk and return.
Lower-rated bonds may offer higher yields in return for more risk. Mutual funds that invest in government securities are not guaranteed. Mortgage-backed securities are subject to prepayment risk. Mutual funds that invest in bonds are subject to certain risks, including interest-rate risk, credit risk, and inflation risk. As interest rates rise, the prices of bonds fall. Long-term bonds are more exposed to interest-rate risk than short-term bonds. Unlike bonds, bond funds have ongoing fees and expenses.
Key fixed-income
return sources
|
Government: Interest-rate levels are a primary driver of government bond performance. Generally, bond prices decline when interest rates rise, and rise when interest rates fall. Interest rates -- and bond yields -- rise and fall according to investor expectations about the overall health of the economy.
Credit: Corporate bond performance tends to track the health of the overall economy more closely than other bonds. These bonds are less sensitive to interest-rate movements; they tend to perform well when the economy strengthens, often in spite of the higher rates that accompany stronger growth.
Securitized: Interest-rate cycles also affect mortgage- and asset-backed securities (MBSs/ABSs). Because MBSs are the securitized cash flows of mortgages, prepayment rates are another consideration. For ABSs, managers monitor the credit quality of the underlying assets, which comprise the securitized cash flow of anything from credit card debt to manufactured housing debt.
“We use all the different
opportunities, from term
structure to sector rotation
to securities selection, across
all the sectors.”
|
Kevin Cronin
Chief Investment Officer
Putnam Fixed Income
|
Allocations and holdings in each sector will vary
over time. For more information on current fund
holdings, see pages 9 and 34.
|
5
Putnam Income Fund seeks high current income consistent with what Putnam Management believes to be a prudent level of risk. The fund invests in a diversified portfolio composed mainly of corporate investment-grade bonds, U.S. government and agency bonds, and collateralized mortgage obligations.
| Highlights |
* During the annual period ended October 31, 2005, Putnam Income Fund’s class A shares had |
| a total return of 1.05% without sales charges. |
* The fund’s benchmark, the Lehman Aggregate Bond Index, returned 1.13%. |
* The average return for the fund’s Lipper category, Corporate Debt Funds A Rated, was 0.98%. |
* The fund's monthly dividend was increased three times during the period, ending the period at |
| $0.023 per share for class A shares. Similar dividend increases were made in other share |
| classes. See page 11 for details. |
* Additional fund performance, comparative performance, and Lipper data can be found in the |
| performance section beginning on page 13. |
Performance
Total return for class A shares for periods ended 10/31/05
Since the fund’s inception (11/1/54), average annual return is 8.02% at NAV and 7.93% at POP.
| | Average annual return | Cumulative return |
| | NAV | POP | NAV | POP |
|
| 10 years | 5.09% | 4.62% | 64.35% | 57.02% |
|
| 5 years | 5.83 | 4.85 | 32.73 | 26.70 |
|
| 1 year | 1.05 | -3.45 | 1.05 | -3.45 |
|
Data is historical. Past performance does not guarantee future results. More recent returns may be less or more than those shown. Investment return and principal value will fluctuate, and you may have a gain or a loss when you sell your shares. Performance assumes reinvestment of distributions and does not account for taxes. Returns at NAV do not reflect a sales charge of 4.50% . For the most recent month-end performance, visit www.putnam.com. For a portion of the period, this fund limited expenses, without which returns would have been lower. A short-term trading fee of up to 2% may apply.
6
Report from the fund managers
|
The year in review
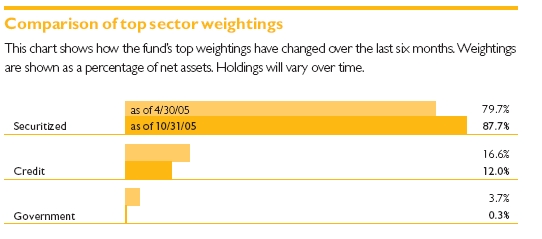
During the fiscal year, rising interest rates generally resulted in falling bond prices, particularly among the higher-quality, lower-yielding sectors of the fixed-income markets that are the primary focus of your fund. Your fund’s results at net asset value (NAV) were in line with those of its benchmark and Lipper peer group. The fund’s relative performance benefited from defensive duration and yield curve positioning strategies as well as our emphasis on securitized bonds at the expense of underperforming investment-grade corporate bonds. Our underweight position in mortgage pass-throughs within the securitized sector, and in U.S. agency debt and emerging-market debt, which outperformed during the period, detracted from relative results.
During the fiscal year, the domestic bond market was affected by a shift from a supportive low/declining-interest-rate, low-inflation environment to an investment landscape characterized by rising interest rates amid signs of potentially higher inflation. The U.S. economy has been posting a steady 3% to 4% growth rate for almost four years now, and during the past 12 months there were indications that spare capacity (i.e., plant and equipment capacity) was beginning to decline. Declining excess capacity can be an indication that the demand for products is strong enough that companies could raise their prices, leading to higher inflation. Inflation-wary bond investors monitor the pace of economic growth and capacity utilization rates closely. In addition, there have been indications that record-high energy prices have begun to affect the prices of goods and services.
Performance among higher-yielding, more credit-sensitive issues, such as high-yield corporate bonds and emerging-market debt, benefited from improving economies and rising corporate earnings. In general, the lower its credit rating, the stronger a bond’s performance was during the period, as strong demand from buyers in search of higher yields drove prices higher. However, in the final months of the
7
period, there were signs that the rally among lower-rated segments of the market had run its course. The investment-grade corporate sector suffered from downgrades in the corporate debt ratings of both Ford and General Motors, spurred by declining profits and rising pension and benefits expenses. Ratings on both companies’ debt are now below investment grade. The effect of this significant action spilled over into other sectors, especially as hedge funds sold leveraged positions in investment-grade corporate debt.
Strategy overview
Your fund employs multiple income-generating strategies across U.S. fixed-income sectors in pursuit of its objectives. We believe that having multiple return sources contributes to consistency of returns and helps to manage risk. Generally, our investment decisions involve the following interrelated considerations: duration management, yield-curve positioning, sector allocation, and security selection.
In anticipation of rising interest rates, we reduced the fund’s sensitivity to interest-rate changes by shortening the portfolio’s overall duration. Duration, which is measured in years, is the primary indicator of interest-rate sensitivity. The shorter a bond’s duration, the less sensitive its price will be to interest-rate changes. The fund’s lower interest-rate sensitivity helped performance.
The fund also benefited from a yield-curve strategy that took advantage of a flattening curve. The yield curve is a
Market sector performance
These indexes provide an overview of performance in different market sectors for the 12 months ended 10/31/05.
| Bonds | |
| Lehman Aggregate Bond Index (broad bond market) | 1.13% |
|
| Lehman Global Aggregate Bond Index (international bonds) | -0.72% |
|
| Lehman Government Bond Index (U.S. Treasury and agency securities) | 0.94% |
|
| Lehman GNMA Index (Government National Mortgage Association bonds) | 2.13% |
|
| Equities | |
| S&P 500 Index (broad stock market) | 8.72% |
|
| Russell 2000 Growth Index (small-company growth stocks) | 10.91% |
|
| Russell 2000 Value Index (small-company value stocks) | 13.04% |
|
8
graphical representation of yields on bonds of comparable quality plotted from the shortest to the longest maturity. Flattening occurs when yields on short-and long-term securities converge, as was the case during the period when short-term rose faster than long-term rates.
In terms of sector and security considerations, we further reduced the fund’s exposure to investment-grade corporate debt and continued to avoid emerging-market debt. As interest rates rise, it becomes more expensive for issuers to borrow money. These increased expenses are particularly burdensome for highly leveraged companies or economies, which explains why we believed it prudent to avoid them. The fund’s underweighting of investment-grade corporate debt relative to the benchmark proved advantageous for relative results, while the fund’s underweight to emerging-market debt modestly detracted from results.
As noted above, we reduced the fund’s holdings in the investment-grade corporate bond sector while adding high-quality bonds in the securitized bond sector. During the 12-month period, the portfolio’s significant position in securitized bonds, or structured securities, performed well as interest rates fluctuated, but generally remained within a narrow range. Structured securities typically offer higher income than corporate bonds of comparable credit quality. They also offer shorter maturities, which provides us with the
9
flexibility to shift to other fixed-income securities should interest rates rise.
This securitized bond sector is now the largest within the U.S. investment-grade universe. We think of structured securities as arrayed along a continuum representing pure interest-rate or prepayment risk (agency market) at one extreme and pure credit risk (nonagency market) at the other. Within the agency market, the most common type of securitized bonds are mortgage-backed securities (MBSs) issued by the Government National Mortgage Association (Ginnie Mae). Ginnie Mae issues are backed by the full faith and credit of the U.S. government. The agency market segment also includes MBSs issued by two U.S. government-sponsored entities (GSEs): the Federal National Mortgage Association (Fannie Mae) and the Federal Home Loan Mortgage Company (Freddie Mac). The fund’s underweighting in mortgage pass-through securities issued by these entities detracted from results, as this segment of the market outperformed during the period.
Within the agency segment of the market, we tended to favor more complex securities such as collateralized mortgage obligations (CMOs) during the period. CMOs can be further divided into interest-only (IO) and principal-only(PO) securities, which separate the interest and principal payments of a bond into separate cash flows. Although these types of securities exhibit much greater
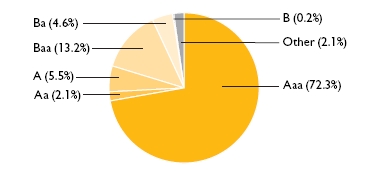
Credit qualities shown as a percentage of portfolio value as of 10/31/05. A bond rated Baa or higher is considered investment grade. The chart reflects Moody’s ratings; percentages may include bonds not rated by Moody’s but considered by Putnam Management to be of comparable quality. Ratings will vary over time.
10
prepayment sensitivity than pass-throughs, they compensate investors by offering much higher yields. The fund has been combining IOs and POs to create a cash flow that is similar to that of a mortgage pass-through, but which can be obtained at a lower cost.
Other types of securitized bonds may be classified as non-agency securities. This market segment includes asset-backed securities (ABSs), which are securitized cash flows from assets such as car loans or credit card payments, and commercial mortgage-backed securities (CMBSs), which are backed by loans on large commercial real estate projects, such as office parks or shopping malls. CMBSs were an area of particular focus during the period as we sought to replace the credit risk of corporate bonds with the more diversified credit exposure available through CMBSs. The home equity and manufactured-housing sectors of the ABS market were also areas of emphasis. These areas performed well amid continued strong demand, low default rates, and sustained strength in the real estate market.
Hybrid Adjustable Rate Mortgages (ARMs) are another area of opportunity for the fund. Hybrid ARMs typically offer borrowers three or five years at a fixed interest rate, after which they become an adjustable interest-rate mortgage in which the interest rate is adjusted yearly (3/1 and 5/1 ARMs). According to our analysis, many of these securities have been offering yields that more than compensate for the level of risk they represent. Therefore, they contribute to an attractive risk/return profile for the fund.
Please note that the holdings discussed in this report may not have been held by the fund for the entire period discussed, are subject to review in accordance with the fund’s investment strategy, and may vary in the future.
Of special interest
As interest rates have risen steadily over the past year, newer holdings in the portfolio have generated more income. In addition, the fund has derived additional income, on the margin, from derivative instruments, such as swaps. Consequently, the funds monthly dividend was increased three times during the period. Dividends on class A shares rose from $0.015 per share to $0.016 per share effective with the February 2005 payment; from $0.016 to $0.019 per share effective with the June 2005 payment; and from $0.019 to $0.023 per share effective with the September 2005 payment. Similar dividend increases were made in other share classes at the time of the increases for class A shares.
11
The outlook for your fund
|
The following commentary reflects anticipated developments that could affect your fund over the next six months, as well as your management team’s plans for responding to them.
We believe that solid economic growth will continue to fuel rising short-term interest rates. We expect the Fed to continue raising rates even beyond the market’s current expectations. We also believe there is increased risk that long-term interest rates could rise at some point, given the reduced excess capacity in the U.S. economy and the stirrings of a rebound in the Japanese economy.
Over the near term, we will continue to maintain a cautious stance, reflected in a portfolio with higher credit quality and a duration that is shorter than that of the fund’s benchmark. We do not believe there is enough reward available in the form of higher interest rates to make it worthwhile for the fund to take on additional credit or interest-rate risk.
We will remain vigilant regarding any possible disruptions to the economy and fixed-income markets, seeking to keep the fund positioned defensively. We will continue to pursue the fund’s objectives through multiple income-generating strategies across investment-grade U.S. fixed-income sectors and securities.
The views expressed in this report are exclusively those of Putnam Management. They are not meant as investment advice.
Lower-rated bonds may offer higher yields in return for more risk. Mutual funds that invest in government securities are not guaranteed. Mortgage-backed securities are subject to prepayment risk. Mutual funds that invest in bonds are subject to certain risks, including interest-rate risk, credit risk, and inflation risk. As interest rates rise, the prices of bonds fall. Long-term bonds are more exposed to interest-rate risk than short-term bonds. Unlike bonds, bond funds have ongoing fees and expenses.
12
This section shows your fund’s performance during its fiscal year, which ended October 31, 2005. In accordance with regulatory requirements, we also include performance for the most current calendar quarter-end. Performance should always be considered in light of a fund’s investment strategy. Data represents past performance. Past performance does not guarantee future results. More recent returns may be less or more than those shown. Investment return and principal value will fluctuate, and you may have a gain or a loss when you sell your shares. For the most recent month-end performance, please visit www.putnam.com or call Putnam at 1-800-225-1581. Class Y shares are generally only available to corporate and institutional clients. See the Terms and Definitions section in this report for definitions of the share classes offered by your fund.
| Fund performance | | | | | | | | |
| Total return for periods ended 10/31/05 | | | | | | | |
|
| |
| | Class A | | Class B | | Class C | | Class M | | Class R | Class Y |
| (inception dates) | (11/1/54) | | (3/1/93) | | (7/26/99) | | (12/14/94) | | (1/21/03) | (6/16/94) |
| | NAV | POP | NAV | CDSC | NAV | CDSC | NAV | POP | NAV | NAV |
|
| Annual average | | | | | | | | | | |
| (life of fund) | 8.02% | 7.93% | 7.01% | 7.01% | 7.21% | 7.21% | 7.56% | 7.49% | 7.75% | 8.08% |
|
| 10 years | 64.35 | 57.02 | 52.50 | 52.50 | 52.25 | 52.25 | 60.75 | 55.46 | 60.25 | 68.56 |
| Annual average | 5.09 | 4.62 | 4.31 | 4.31 | 4.29 | 4.29 | 4.86 | 4.51 | 4.83 | 5.36 |
|
| 5 years | 32.73 | 26.70 | 27.84 | 25.84 | 27.82 | 27.82 | 31.12 | 26.85 | 31.10 | 34.36 |
| Annual average | 5.83 | 4.85 | 5.03 | 4.70 | 5.03 | 5.03 | 5.57 | 4.87 | 5.57 | 6.09 |
|
| 1 year | 1.05 | -3.45 | 0.28 | -4.61 | 0.28 | -0.70 | 0.84 | -2.46 | 0.72 | 1.28 |
|
Performance assumes reinvestment of distributions and does not account for taxes. Returns at public offering price (POP) for class A and M shares reflect a sales charge of 4.50% and 3.25%, respectively (which for class A shares does not reflect a reduction in sales charges that went into effect on April 1, 2005; if this reduction had been in place for all periods indicated, returns would have been higher). Class B share returns reflect the applicable contingent deferred sales charge (CDSC), which is 5% in the first year, declining to 1% in the sixth year, and is eliminated thereafter. Class C shares reflect a 1% CDSC the first year that is eliminated thereafter. Class R and Y shares have no initial sales charge or CDSC. Performance for class B, C, M, R, and Y shares before their inception is derived from the historical performance of class A shares, adjusted for the applicable sales charge (or CDSC) and, except for class Y shares, the higher operating expenses for such shares.
For a portion of the period, this fund limited expenses, without which returns would have been lower.
A 2% short-term trading fee may be applied to shares exchanged or sold within 5 days of purchase.
13
Change in the value of a $10,000 investment ($9,550 after sales charge)
Cumulative total return from 10/31/95 to 10/31/05
|
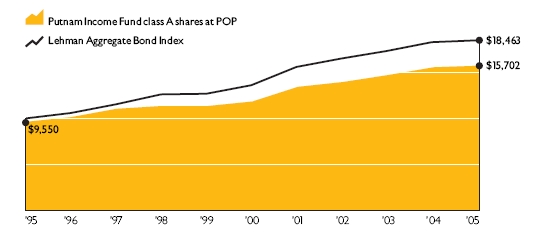
Past performance does not indicate future results. At the end of the same time period, a $10,000 investment in the fund’s class B and class C shares would have been valued at $15,250 and $15,225, respectively, and no contingent deferred sales charges would apply. A $10,000 investment in the fund’s class M shares would have been valued at $16,075 ($15,546 at public offering price). A $10,000 investment in the fund’s class R and class Y shares would have been valued at $16,025 and $16,856, respectively. See first page of performance section for performance calculation method.
Comparative index returns
For periods ended 10/31/05
|
| | | Lipper Corporate |
| | Lehman Aggregate | Debt Funds A Rated |
| | Bond Index | category average* |
|
| Annual average | | |
| (life of fund) | --† | --† |
|
| 10 years | 84.63% | 73.82% |
| Annual average | 6.32 | 5.67 |
|
| 5 years | 35.82 | 33.40 |
| Annual average | 6.31 | 5.92 |
|
| 1 year | 1.13 | 0.98 |
|
| | Index and Lipper results should be compared to fund performance at net asset value. |
| * | Over the 1-, 5-, and 10-year periods ended 10/31/05, there were 182, 112, and 68 funds, respectively, in this Lipper category. |
| † | The benchmark and Lipper category were not in existence at the time of the fund's inception. The Lehman Aggregate Bond |
| | Index commenced 12/31/75. This Lipper category commenced 12/31/59. |
14
| Fund price and distribution information | | | |
| For the 12-month period ended 10/31/05 | | | | |
|
| |
| | Class A | Class B | Class C | Class M | Class R | Class Y |
|
| Distributions | | | | | | |
| (number) | 12 | 12 | 12 | 12 | 12 | 12 |
|
| Income | $0.212 | $0.160 | $0.160 | $0.197 | $0.200 | $0.228 |
|
| Capital gains | -- | -- | -- | -- | -- | -- |
|
| Total | $0.212 | $0.160 | $0.160 | $0.197 | $0.200 | $0.228 |
|
| Share value: | NAV | POP | NAV | NAV | NAV | POP | NAV | NAV |
|
| 10/31/04 | $6.87 | $7.19 | $6.82 | $6.84 | $6.80 | $7.03 | $6.87 | $6.91 |
| 10/31/05 | $6.73 | $6.99* | $6.68 | $6.70 | $6.66 | $6.88 | $6.72 | $6.77 |
| |
| Current yield | | | | | | |
| |
| (end of period) | | | | | | |
| Current | | | | | | |
| dividend rate1 | 4.10% | 3.95% | 3.41% | 3.40% | 3.96% | 3.84% | 3.93% | 4.25% |
|
| Current 30-day | | | | | | |
| SEC yield2 | | | | | | |
| (with expense | | | | | | |
| limitation) | 4.27 | 4.11 | 3.52 | 3.52 | 4.02 | 3.89 | 4.03 | 4.53 |
|
| Current 30-day | | | | | | |
| SEC yield3 | | | | | | |
| (without | | | | | | |
| expense | | | | | | |
| limitation) | 4.26 | 4.10 | 3.51 | 3.51 | 4.01 | 3.88 | 4.01 | 4.51 |
|
| * | Reflects a reduction in sales charge that took effect on April 1, 2005. |
| |
| | 1 | Most recent distribution, excluding capital gains, annualized and divided by NAV or POP at end of period. |
| |
| | 2 | For a portion of the period, this fund limited expenses, without which yields would have been lower. Based only on investment income, calculated using SEC guidelines. |
| |
| | 3 | Based only on investment income, calculated using SEC guidelines. |
| |
15
| Fund performance for most recent calendar quarter | | | |
| Total return for periods ended 9/30/05 | | | | | | | |
|
| |
| | Class A | | Class B | | Class C | | Class M | | Class R | Class Y |
| (inception dates) | (11/1/54) | | (3/1/93) | | (7/26/99) | | (12/14/94) | | (1/21/03) | (6/16/94) |
| | NAV | POP | NAV | CDSC | NAV | CDSC | NAV | POP | NAV | NAV |
|
| Annual average | | | | | | | | | | |
| (life of fund) | 8.05% | 7.96% | 7.05% | 7.05% | 7.24% | 7.24% | 7.59% | 7.52% | 7.79% | 8.11% |
|
| 10 years | 68.10 | 60.53 | 56.00 | 56.00 | 55.99 | 55.99 | 64.21 | 58.97 | 64.14 | 72.40 |
| Annual average | 5.33 | 4.85 | 4.55 | 4.55 | 4.55 | 4.55 | 5.08 | 4.74 | 5.08 | 5.60 |
|
| 5 years | 33.55 | 27.51 | 28.82 | 26.82 | 28.80 | 28.80 | 31.93 | 27.67 | 32.12 | 35.18 |
| Annual average | 5.96 | 4.98 | 5.20 | 4.87 | 5.19 | 5.19 | 5.70 | 5.01 | 5.73 | 6.21 |
|
| 1 year | 2.57 | -2.02 | 1.81 | -3.17 | 1.80 | 0.81 | 2.22 | -1.14 | 2.24 | 2.80 |
|
16
As a mutual fund investor, you pay ongoing expenses, such as management fees, distribution fees (12b-1 fees), and other expenses. In the most recent six-month period, your fund limited these expenses; had it not done so, expenses would have been higher. Using the information below, you can estimate how these expenses affect your investment and compare them with the expenses of other funds. You may also pay one-time transaction expenses, including sales charges (loads) and redemption fees, which are not shown in this section and would have resulted in higher total expenses. For more information, see your fund’s prospectus or talk to your financial advisor.
Review your fund’s expenses
|
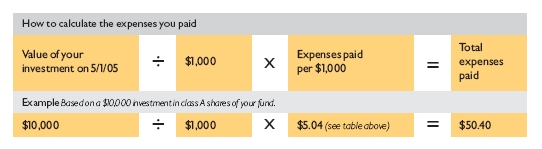
The table below shows the expenses you would have paid on a $1,000 investment in Putnam Income Fund from May 1, 2005, to October 31, 2005. It also shows how much a $1,000 investment would be worth at the close of the period, assuming actual returns and expenses.
| | Class A | Class B | Class C | Class M | Class R | Class Y |
|
| Expenses paid per $1,000* | $ 5.04 | $ 8.80 | $ 8.80 | $ 6.30 | $ 6.29 | $ 3.78 |
|
| Ending value (after expenses) | $999.70 | $995.90 | $995.90 | $998.70 | $997.20 | $1,000.90 |
|
* Expenses for each share class are calculated using the fund’s annualized expense ratio for each class, which represents the ongoing expenses as a percentage of net assets for the six months ended 10/31/05. The expense ratio may differ for each share class (see the table at the bottom of the next page). Expenses are calculated by multiplying the expense ratio by the average account value for the period; then multiplying the result by the number of days in the period; and then dividing that result by the number of days in the year.
Estimate the expenses you paid
|
To estimate the ongoing expenses you paid for the six months ended October 31, 2005, use the calculation method below. To find the value of your investment on May 1, 2005, go to www.putnam.com and log on to your account. Click on the “Transaction History” tab in your Daily Statement and enter 05/01/2005 in both the “from” and “to” fields. Alternatively, call Putnam at 1-800-225-1581.
17
Compare expenses using the SEC’s method
|
The Securities and Exchange Commission (SEC) has established guidelines to help investors assess fund expenses. Per these guidelines, the table below shows your fund’s expenses based on a $1,000 investment, assuming a hypothetical 5% annualized return. You can use this information to compare the ongoing expenses (but not transaction expenses or total costs) of investing in the fund with those of other funds. All mutual fund shareholder reports will provide this information to help you make this comparison. Please note that you cannot use this information to estimate your actual ending account balance and expenses paid during the period.
| | Class A | Class B | Class C | Class M | Class R | Class Y |
|
| Expenses paid per $1,000* | $ 5.09 | $ 8.89 | $ 8.89 | $ 6.36 | $ 6.36 | $ 3.82 |
|
| Ending value (after expenses) | $1,020.16 | $1,016.38 | $1,016.38 | $1,018.90 | $1,018.90 | $1,021.42 |
|
* Expenses for each share class are calculated using the fund’s annualized expense ratio for each class, which represents the ongoing expenses as a percentage of net assets for the six months ended 10/31/05. The expense ratio may differ for each share class (see the table at the bottom of this page). Expenses are calculated by multiplying the expense ratio by the average account value for the period; then multiplying the result by the number of days in the period; and then dividing that result by the number of days in the year.
Compare expenses using industry averages
|
You can also compare your fund’s expenses with the average of its peer group, as defined by Lipper, an independent fund-rating agency that ranks funds relative to others that Lipper considers to have similar investment styles or objectives. The expense ratio for each share class shown below indicates how much of your fund’s net assets have been used to pay ongoing expenses during the period.
| | Class A | Class B | Class C | Class M | Class R | Class Y |
|
| Your fund’s annualized | | | | | | |
| expense ratio† | 1.00% | 1.75% | 1.75% | 1.25% | 1.25% | 0.75% |
|
| Average annualized expense | | | | | | |
| ratio for Lipper peer group‡ | 1.02% | 1.77% | 1.77% | 1.27% | 1.27% | 0.77% |
|
† For the fund’s most recent fiscal half year; may differ from expense ratios based on one-year data in the financial highlights.
‡ Simple average of the expenses of all front-end load funds in the fund’s Lipper peer group, calculated in accordance with Lipper’s standard method for comparing fund expenses (excluding 12b-1 fees and without giving effect to any expense offset and brokerage service arrangements that may reduce fund expenses). This average reflects each fund’s expenses for its most recent fiscal year available to Lipper as of 9/30/05. To facilitate comparison, Putnam has adjusted this average to reflect the 12b-1 fees carried by each class of shares other than class Y shares, which do not incur 12b-1 fees. The peer group may include funds that are significantly smaller or larger than the fund, which may limit the comparability of the fund’s expenses to the simple average, which typically is higher than the asset-weighted average.
18
Your fund’s
portfolio turnover
|
Putnam funds are actively managed by teams of experts who buy and sell securities based on intensive analysis of companies, industries, economies, and markets. Portfolio turnover is a measure of how often a fund’s managers buy and sell securities for your fund. A portfolio turnover of 100%, for example, means that the managers sold and replaced securities valued at 100% of a fund’s assets within a one-year period. Funds with high turnover may be more likely to generate capital gains and dividends that must be distributed to shareholders as taxable income. High turnover may also cause a fund to pay more brokerage commissions and other transaction costs, which may detract from performance.
Funds that invest in bonds or other fixed-income instruments may have higher turnover than funds that invest only in stocks. Short-term bond funds tend to have higher turnover than longer-term bond funds, because shorter-term bonds will mature or be sold more frequently than longer-term bonds. You can use the table below to compare your fund’s turnover with the average turnover for funds in its Lipper category.
| Turnover comparisons | | | | | |
| Percentage of holdings that change every year | | | |
|
| |
| | 2005 | 2004 | 2003 | 2002 | 2001 |
|
| Putnam Income Fund | 300%* | 441% | 251%† | 268%† | 234%† |
|
| Lipper Corporate Debt Funds | | | | | |
| A Rated category average | 150% | 171% | 171% | 154% | 168% |
|
* Portfolio turnover excludes dollar roll transactions.
|
+ Portfolio turnover excludes certain Treasury note transactions executed in connection with a short-term trading strategy.
Turnover data for the fund is calculated based on the fund’s fiscal-year period, which ends on October 31. Turnover data for the fund’s Lipper category is calculated based on the average of the turnover of each fund in the category for its fiscal year ended during the indicated year. Fiscal years vary across funds in the Lipper category, which may limit the comparability of the fund’s portfolio turnover rate to the Lipper average. Comparative data for 2005 is based on information available as of 9/30/05.
19
This risk comparison is designed to help you understand how your fund compares with other funds. The comparison utilizes a risk measure developed by Morningstar, an independent fund-rating agency. This risk measure is referred to as the fund’s Overall Morningstar Risk.
Your fund’s Overall Morningstar® Risk
|
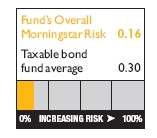
Your fund’s Overall Morningstar Risk is shown alongside that of the average fund in its broad asset class, as determined by Morningstar. The risk bar broadens the comparison by translating the fund’s Overall Morningstar Risk into a percentile, which is based on the fund’s ranking among all funds rated by Morningstar as of September 30, 2005. A higher Overall Morningstar Risk generally indicates that a fund’s monthly returns have varied more widely.
Morningstar determines a fund’s Overall Morningstar Risk by assessing variations in the fund’s monthly returns -- with an emphasis on downside variations -- over 3-, 5-, and 10-year periods, if available. Those measures are weighted and averaged to produce the fund’s Overall Morningstar Risk. The information shown is provided for the fund’s class A shares only; information for other classes may vary. Overall Morningstar Risk is based on historical data and does not indicate future results. Morningstar does not purport to measure the risk associated with a current investment in a fund, either on an absolute basis or on a relative basis. Low Overall Morningstar Risk does not mean that you cannot lose money on an investment in a fund. Copyright 2004 Morningstar, Inc. All Rights Reserved. The information contained herein (1) is proprietary to Morningstar and/or its content providers; (2) may not be copied or distributed; and (3) is not warranted to be accurate, complete, or timely. Neither Morningstar nor its content providers are responsible for any damages or losses arising from any use of this information.
20
Your fund is managed by the members of the Putnam Core Fixed-Income Team. Kevin Cronin is the Portfolio Leader of the fund. Rob Bloemker, Kevin Murphy, and Raman Srivastava are Portfolio Members. The Portfolio Leader and Portfolio Members coordinate the team’s management of the fund.
For a complete listing of the members of the Putnam Core Fixed-Income Team, including those who are not Portfolio Leaders or Portfolio Members of your fund, visit Putnam’s Individual Investor Web site at www.putnam.com.
Fund ownership by the Portfolio Leader and Portfolio Members
The table below shows how much the fund’s current Portfolio Leader and Portfolio Members have invested in the fund (in dollar ranges). Information shown is as of October 31, 2005, and October 31, 2004.
| | | $1 - | $10,001 - | $50,001 - | $100,001 - | $500,001 - | $1,000,001 |
| | Year | $0 | $10,000 | $50,000 | $100,000 | $500,000 | $1,000,000 | and over |
|
| Kevin Cronin | 2005 | | | | * | | | |
|
|
| Portfolio Leader | 2004 | * | | | | | | |
|
| Rob Bloemker | 2005 | | | * | | | |
|
|
| Portfolio Member | 2004 | * | | | | | | |
|
| Kevin Murphy | 2005 | * | | | | | | |
|
|
| Portfolio Member | N/A | | | | | | |
|
| Raman Srivastava | 2005 | * | | | | | | |
|
|
| Portfolio Member | N/A | | | | | | |
|
| |
| N/A indicates the individual was not a Portfolio Leader or Portfolio Member as of 10/31/04. | | | |
21
Fund manager compensation
|
The total 2004 fund manager compensation that is attributable to your fund is approximately $880,000. This amount includes a portion of 2004 compensation paid by Putnam Management to the fund managers listed in this section for their portfolio management responsibilities, calculated based on the fund assets they manage taken as a percentage of the total assets they manage. The compensation amount also includes a portion of the 2004 compensation paid to the Chief Investment Officer of the team and the Group Chief Investment Officer of the fund’s broader investment category for their oversight responsibilities, calculated based on the fund assets they oversee taken as a percentage of the total assets they oversee. This amount does not include compensation of other personnel involved in research, trading, administration, systems, compliance, or fund operations; nor does it include non-compensation costs. These percentages are determined as of the fund’s fiscal period-end. For personnel who joined Putnam Management during or after 2004, the calculation reflects annualized 2004 compensation or an estimate of 2005 compensation, as applicable.
Other Putnam funds managed by the Portfolio Leader and Portfolio Members
Kevin Cronin is also a Portfolio Leader of Putnam American Government Income Fund, Putnam Global Income Trust, Putnam Limited Duration Government Income Fund, and Putnam U.S. Government Income Trust. He is also a Portfolio Member of The George Putnam Fund of Boston and Putnam Equity Income Fund.
Rob Bloemker is also a Portfolio Member of Putnam American Government Income Fund, Putnam Diversified Income Trust, Putnam Limited Duration Government Income Fund, Putnam Master Intermediate Income Trust, Putnam Premier Income Trust, and Putnam U.S. Government Income Trust.
Kevin Murphy is also a Portfolio Member of Putnam Utilities Growth and Income Fund.
Raman Srivastava is also a Portfolio Member of The George Putnam Fund of Boston. Kevin Cronin, Rob Bloemker, Kevin Murphy, and Raman Srivastava may also manage other accounts and variable trust funds advised by Putnam Management or an affiliate.
Changes in your fund’s Portfolio Leader and Portfolio Members
During the year ended October 31, 2005, Kevin Murphy and Raman Srivastava became Portfolio Members of your fund.
22
Fund ownership by Putnam’s Executive Board
The table below shows how much the members of Putnam’s Executive Board have invested in the fund (in dollar ranges). Information shown is as of October 31, 2005, and October 31, 2004.
| | | | | $1 - | $10,001 - | $50,001- | $100,001 |
| | Year | $0 | | $10,000 | $50,000 | $100,000 | and over |
|
| Philippe Bibi | 2005 | | * | | | | |
|
|
| Chief Technology Officer | 2004 | | * | | | | |
|
| Joshua Brooks | 2005 | | * | | | | |
|
|
| Deputy Head of Investments | N/A | | | | | | |
|
| William Connolly | 2005 | | * | | | | |
|
|
| Head of Retail Management | N/A | | | | | | |
|
| Kevin Cronin | 2005 | | | | | * | |
|
|
| Head of Investments | 2004 | | * | | | | |
|
| Charles Haldeman, Jr. | 2005 | | | | * | | |
|
|
| President and CEO | 2004 | | | | * | | |
|
| Amrit Kanwal | 2005 | | * | | | | |
|
|
| Chief Financial Officer | 2004 | | * | | | | |
|
| Steven Krichmar | 2005 | | * | | | | |
|
|
| Chief of Operations | 2004 | | * | | | | |
|
| Francis McNamara, III | 2005 | | | * | | | |
|
|
| General Counsel | 2004 | | * | | | | |
|
| Richard Robie, III | 2005 | | * | | | | |
|
|
| Chief Administrative Officer | 2004 | | * | | | | |
|
| Edward Shadek | 2005 | | * | | | | |
|
|
| Deputy Head of Investments | N/A | | | | | | |
|
| Sandra Whiston | 2005 | | | | | | * |
|
|
| Head of Institutional Management | N/A | | | | | | |
|
N/A indicates the individual was not a member of Putnam’s Executive Board as of 10/31/04.
23
Total return shows how the value of the fund’s shares changed over time, assuming you held the shares through the entire period and reinvested all distributions in the fund.
Net asset value (NAV) is the price, or value, of one share of a mutual fund, without a sales charge. NAVs fluctuate with market conditions. NAV is calculated by dividing the net assets of each class of shares by the number of outstanding shares in the class.
Public offering price (POP) is the price of a mutual fund share plus the maximum sales charge levied at the time of purchase. POP performance figures shown here assume the 4.50% maximum sales charge for class A shares (since reduced to 3.75%) and 3.25% for class M shares.
Contingent deferred sales charge (CDSC) is a charge applied at the time of the redemption of class B or C shares and assumes redemption at the end of the period. Your fund’s class B CDSC declines from a 5% maximum during the first year to 1% during the sixth year. After the sixth year, the CDSC no longer applies. The CDSC for class C shares is 1% for one year after purchase.
Class A shares are generally subject to an initial sales charge and no sales charge on redemption (except on certain redemptions of shares bought without an initial sales charge).
Class B shares may be subject to a sales charge upon redemption.
Class C shares are not subject to an initial sales charge and are subject to a contingent deferred sales charge only if the shares are redeemed during the first year.
Class M shares have a lower initial sales charge and a higher 12b-1 fee than class A shares and no sales charge on redemption (except on certain redemptions of shares bought without an initial sales charge).
Class R shares are not subject to an initial sales charge or CDSC and are available only to certain defined contribution plans.
Class Y shares are not subject to an initial sales charge or CDSC, and carry no 12b-1 fee. They are only available to eligible purchasers, including eligible defined contribution plans or corporate IRAs.
24
Lehman Aggregate Bond Index is an unmanaged index of U.S. investment-grade fixed-income securities.
Lehman Global Aggregate Bond Index is an unmanaged index of global investment-grade fixed-income securities.
Lehman Government Bond Index is an unmanaged index of U.S. Treasury and agency securities.
Lehman GNMA Index is an unmanaged index of Government National Mortgage Association bonds.
Russell 2000 Growth Index is an unmanaged index of those companies in the small-cap Russell 2000 Index chosen for their growth orientation.
Russell 2000 Value Index is an unmanaged index of those companies in the small-cap Russell 2000 Index chosen for their value orientation.
S&P 500 Index is an unmanaged index of common stock performance.
Indexes assume reinvestment of all distributions and do not account for fees. Securities and performance of a fund and an index will differ. You cannot invest directly in an index.
Lipper is a third-party industry-ranking entity that ranks mutual funds. Lipper rankings are based on total return at net asset value and do not reflect sales charges. Funds are ranked among other funds with similar current investment styles or objectives as determined by Lipper. Lipper category averages reflect performance trends for funds within a category.
25
Trustee approval of
management contract
|
The Board of Trustees of the Putnam funds oversees the management of each fund and, as required by law, determines annually whether to approve the continuance of your fund’s management contract with Putnam Management. In this regard, the Board of Trustees, with the assistance of its Contract Committee consisting solely of Trustees who are not “interested persons” (as such term is defined in the Investment Company Act of 1940, as amended) of the Putnam funds (the “Independent Trustees”), requests and evaluates all information it deems reasonably necessary under the circumstances. Over the course of several months beginning in March and ending in June 2005, the Contract Committee met five times to consider the information provided by Putnam Management and other information developed with the assistance of the Board’s independent counsel and independent staff. The Contract Committee reviewed and discussed key aspects of this information with all of the Independent Trustees. Upon completion of this review, the Contract Committee recommended and the Independent Trustees approved the continuance of your fund’s management contract, effective July 1, 2005.
This approval was based on the following conclusions:
- That the fee schedule currently in effect for your fund represents reasonable compensation in light of the nature and quality of the services being provided to the fund, the fees paid by competitive funds and the costs incurred by Putnam Management in providing such services, and
- That such fee schedule represents an appropriate sharing between fund shareholders and Putnam Management of such economies of scale as may exist in the management of the fund at current asset levels.
These conclusions were based on a comprehensive consideration of all information provided to the Trustees and were not the result of any single factor. Some of the factors that figured particularly in the Trustees’ deliberations and how the Trustees considered these factors are described below, although individual Trustees may have evaluated the information presented differently, giving different weights to various factors. It is also important to recognize that the fee arrangements for your fund and the other Putnam funds are the result of many years of review and discussion between the Independent Trustees and Putnam Management, that certain aspects of such arrangements may receive greater scrutiny in some years than others, and that the Trustees’ conclusions may be based, in part, on their consideration of these same arrangements in prior years.
Model fee schedules and categories; total expenses
The Trustees’ review of the management fees and total expenses of the Putnam funds focused on three major themes:
- Consistency. The Trustees, working in cooperation with Putnam Management, have developed and implemented a series of model fee schedules for the Putnam funds designed to ensure that
26
each fund’s management fee is consistent with the fees for similar funds in the Putnam family of funds and compares favorably with fees paid by competitive funds sponsored by other invest- ment advisors. Under this approach, each Putnam fund is assigned to one of several fee categories based on a combination of factors, including competitive fees and perceived difficulty of management, and a common fee schedule is implemented for all funds in a given fee cate- gory. The Trustees reviewed the model fee schedule currently in effect for your fund, including fee levels and breakpoints, and the assignment of the fund to a particular fee category under this structure. (“Breakpoints” refer to reductions in fee rates that apply to additional assets once specified asset levels are reached.) The Trustees concluded that no changes should be made in the fund’s current fee schedule at this time.
- Competitiveness. The Trustees also reviewed comparative fee and expense information for competitive funds, which indicated that, in a custom peer group of competitive funds selected by Lipper Inc., your fund ranked in the 43rd percentile in management fees and in the 27th percentile in total expenses (less any applicable 12b-1 fees) as of December 31, 2004 (the first percentile being the least expensive funds and the 100th percentile being the most expensive funds). (Because the fund’s custom peer group is smaller than the fund’s broad Lipper Inc. peer group, this expense comparison may differ from the Lipper peer expense information found elsewhere in this report.) The Trustees noted that expense ratios for a number of Putnam funds, which show the percentage of fund assets used to pay for management and administrative services, distribution (12b-1) fees and other expenses, had been increasing recently as a result of declining net assets and the natural operation of fee breakpoints. They noted that such expense ratio increases were currently being controlled by expense limita- tions implemented in January 2004 and which Putnam Management, in consultation with the Contract Committee, has committed to maintain at least through 2006. The Trustees expressed their intention to monitor this information closely to ensure that fees and expenses of the Putnam funds continue to meet evolving competitive standards.
- Economies of scale. The Trustees concluded that the fee schedule currently in effect for your fund represents an appropriate sharing of economies of scale at current asset levels. Your fund currently has the benefit of breakpoints in its management fee that provide shareholders with significant economies of scale, which means that the effective management fee rate of a fund (as a percentage of fund assets) declines as a fund grows in size and crosses specified asset thresholds. The Trustees examined the existing breakpoint structure of the Putnam funds’ management fees in light of competitive industry practices. The Trustees considered various possible modifications to the Putnam Funds’ current breakpoint structure, but ulti- mately concluded that the current breakpoint structure continues to serve the interests of fund shareholders. Accordingly, the Trustees continue to believe that the fee schedules currently in effect for the funds represent an appropriate sharing of economies of scale at current asset levels. The Trustees noted that significant redemptions in many Putnam funds, together with significant changes in the cost structure of Putnam Management, have altered the economics of Putnam Management’s business in significant ways. In view of these changes,
27
the Trustees intend to consider whether a greater sharing of the economies of scale by fund shareholders would be appropriate if and when aggregate assets in the Putnam funds begin to experience meaningful growth.
In connection with their review of the management fees and total expenses of the Putnam funds, the Trustees also reviewed the costs of the services to be provided and profits to be realized by Putnam Management and its affiliates from the relationship with the funds. This information included trends in revenues, expenses and profitability of Putnam Management and its affiliates relating to the investment management and distribution services provided to the funds. In this regard, the Trustees also reviewed an analysis of Putnam Management’s revenues, expenses and profitability with respect to the funds’ management contracts, allocated on a fund-by-fund basis.
The quality of the investment process provided by Putnam Management represented a major factor in the Trustees’ evaluation of the quality of services provided by Putnam Management under your fund’s management contract. The Trustees were assisted in their review of the funds’ investment process and performance by the work of the Investment Oversight Committees of the Trustees, which meet on a regular monthly basis with the funds’ portfolio teams throughout the year. The Trustees concluded that Putnam Management generally provides a high quality investment process -- as measured by the experience and skills of the individuals assigned to the management of fund portfolios, the resources made available to such personnel, and in general the ability of Putnam Management to attract and retain high-quality personnel -- but also recognize that this does not guarantee favorable investment results for every fund in every time period. The Trustees considered the investment performance of each fund over multiple time periods and considered information comparing the fund’s performance with various benchmarks and with the performance of competitive funds. The Trustees noted the satisfactory investment performance of many Putnam funds. They also noted the disappointing investment performance of certain funds in recent years and continued to discuss with senior management of Putnam Management the factors contributing to such underperformance and actions being taken to improve performance. The Trustees recognized that, in recent years, Putnam Management has made significant changes in its investment personnel and processes and in the fund product line to address areas of underperformance. The Trustees indicated their intention to continue to monitor performance trends to assess the effectiveness of these changes and to evaluate whether additional remedial changes are warranted.
In the case of your fund, the Trustees considered that your fund’s class A share performance at net asset value was in the following percentiles of its Lipper Inc. peer group for the one-, three-and five-year periods ended December 31, 2004 (the first percentile being the best-performing funds and the 100th percentile being the worst-performing funds):
28
| One-year period | Three-year period | Five-year period |
|
| 37th | 46th | 74th |
(Because of the passage of time, these performance results may differ from the performance results for more recent periods shown elsewhere in this report.)
As a general matter, the Trustees believe that cooperative efforts between the Trustees and Putnam Management represent the most effective way to address investment performance problems. The Trustees believe that investors in the Putnam funds have, in effect, placed their trust in the Putnam organization, under the oversight of the funds’ Trustees, to make appropriate decisions regarding the management of the funds. Based on the responsiveness of Putnam Management in the recent past to Trustee concerns about investment performance, the Trustees believe that it is preferable to seek change within Putnam Management to address performance shortcomings. In the Trustees’ view, the alternative of terminating a management contract and engaging a new investment advisor for an underperforming fund would entail significant disruptions and would not provide any greater assurance of improved investment performance.
Brokerage and soft-dollar allocations; other benefits
The Trustees considered various potential benefits that Putnam Management may receive in connection with the services it provides under the management contract with your fund. These include principally benefits related to brokerage and soft-dollar allocations, whereby a portion of the commissions paid by a fund for brokerage is earmarked to pay for research services that may be utilized by a fund’s investment advisor. The Trustees believe that soft-dollar credits and other potential benefits associated with the allocation of fund brokerage, which pertains mainly to funds investing in equity securities, represent assets of the funds that should be used for the benefit of fund shareholders. This area has been marked by significant change in recent years. In July 2003, acting upon the Contract Committee’s recommendation, the Trustees directed that allocations of brokerage to reward firms that sell fund shares be discontinued no later than December 31, 2003. In addition, commencing in 2004, the allocation of brokerage commissions by Putnam Management to acquire research services from third-party service providers has been significantly reduced, and continues at a modest level only to acquire research that is customarily not available for cash. The Trustees will continue to monitor the allocation of the funds’ brokerage to ensure that the principle of “best price and execution” remains paramount in the portfolio trading process.
The Trustees’ annual review of your fund’s management contract also included the review of its distributor’s contract and distribution plan with Putnam Retail Management Limited Partnership and the custodian agreement and investor servicing agreement with Putnam Fiduciary Trust Company, all of which provide benefits to affiliates of Putnam Management.
29
Comparison of retail and institutional fee schedules
The information examined by the Trustees as part of their annual contract review has included for many years information regarding fees charged by Putnam Management and its affiliates to institutional clients such as defined benefit pension plans, college endowments, etc. This information included comparison of such fees with fees charged to the funds, as well as a detailed assessment of the differences in the services provided to these two types of clients. The Trustees observed, in this regard, that the differences in fee rates between institutional clients and the mutual funds are by no means uniform when examined by individual asset sectors, suggesting that differences in the pricing of investment management services to these types of clients reflect to a substantial degree historical competitive forces operating in separate market places. The Trustees considered the fact that fee rates across all asset sectors are higher on average for mutual funds than for institutional clients, as well as the differences between the services that Putnam Management provides to the Putnam funds and those that it provides to institutional clients of the firm, but have not relied on such comparisons to any significant extent in concluding that the management fees paid by your fund are reasonable.
30
Other information
for shareholders
|
Putnam’s policy on confidentiality
|
In order to conduct business with our shareholders, we must obtain certain personal information such as account holders’ addresses, telephone numbers, Social Security numbers, and the names of their financial advisors. We use this information to assign an account number and to help us maintain accurate records of transactions and account balances. It is our policy to protect the confidentiality of your information, whether or not you currently own shares of our funds, and in particular, not to sell information about you or your accounts to outside marketing firms. We have safeguards in place designed to prevent unauthorized access to our computer systems and procedures to protect personal information from unauthorized use. Under certain circumstances, we share this information with outside vendors who provide services to us, such as mailing and proxy solicitation. In those cases, the service providers enter into confidentiality agreements with us, and we provide only the information necessary to process transactions and perform other services related to your account. We may also share this information with our Putnam affiliates to service your account or provide you with information about other Putnam products or services. It is also our policy to share account information with your financial advisor, if you’ve listed one on your Putnam account. If you would like clarification about our confidentiality policies or have any questions or concerns, please don’t hesitate to contact us at 1-800-225-1581, Monday through Friday, 8:30 a.m. to 7:00 p.m., or Saturdays from 9:00 a.m. to 5:00 p.m. Eastern Time.
Putnam is committed to managing our mutual funds in the best interests of our shareholders. The Putnam funds’ proxy voting guidelines and procedures, as well as information regarding how your fund voted proxies relating to portfolio securities during the 12-month period ended June 30, 2005, are available on the Putnam Individual Investor Web site, www.putnam.com/individual, and on the SEC’s Web site, www.sec.gov. If you have questions about finding forms on the SEC’s Web site, you may call the SEC at 1-800-SEC-0330. You may also obtain the Putnam funds’ proxy voting guidelines and procedures at no charge by calling Putnam’s Shareholder Services at 1-800-225-1581.
The fund will file a complete schedule of its portfolio holdings with the SEC for the first and third quarters of each fiscal year on Form N-Q. Shareholders may obtain the fund’s Forms N-Q on the SEC’s Web site at www.sec.gov. In addition, the fund’s Forms N-Q may be reviewed and copied at the SEC’s public reference room in Washington, D.C. You may call the SEC at 1-800-SEC-0330 for information about the SEC’s Web site or the operation of the public reference room.
31
A guide to financial statements
|
These sections of the report, as well as the accompanying Notes, preceded by the Report of Independent Registered Public Accounting Firm, constitute the fund’s financial statements.
The fund’s portfolio lists all the fund’s investments and their values as of the last day of the reporting period. Holdings are organized by asset type and industry sector, country, or state to show areas of concentration and diversification.
Statement of assets and liabilities shows how the fund’s net assets and share price are determined. All investment and noninvestment assets are added together. Any unpaid expenses and other liabilities are subtracted from this total. The result is divided by the number of shares to determine the net asset value per share, which is calculated separately for each class of shares. (For funds with preferred shares, the amount subtracted from total assets includes the net assets allocated to remarketed preferred shares.)
Statement of operations shows the fund’s net investment gain or loss. This is done by first adding up all the fund’s earnings -- from dividends and interest income - -- and subtracting its operating expenses to determine net investment income (or loss). Then, any net gain or loss the fund realized on the sales of its holdings - -- as well as any unrealized gains or losses over the period -- is added to or subtracted from the net investment result to determine the fund’s net gain or loss for the fiscal year.
Statement of changes in net assets shows how the fund’s net assets were affected by the fund’s net investment gain or loss, by distributions to shareholders, and by changes in the number of the fund’s shares. It lists distributions and their sources (net investment income or realized capital gains) over the current reporting period and the most recent fiscal year-end. The distributions listed here may not match the sources listed in the Statement of operations because the distributions are determined on a tax basis and may be paid in a different period from the one in which they were earned.
Financial highlights provide an overview of the fund’s investment results, per-share distributions, expense ratios, net investment income ratios, and portfolio turnover in one summary table, reflecting the five most recent reporting periods. In a semiannual report, the highlight table also includes the current reporting period. For open-end funds, a separate table is provided for each share class.
32
Report of Independent Registered Public Accounting Firm
The Board of Trustees and Shareholders
Putnam Income Fund:
|
We have audited the accompanying statement of assets and liabilities of Putnam Income Fund, including the fund’s portfolio, as of October 31, 2005, and the related statement of operations for the year then ended, the statements of changes in net assets for each of the two years in the period then ended and the financial highlights for each of the five years or periods in the period then ended. These financial statements and financial highlights are the responsibility of the fund’s management. Our responsibility is to express an opinion on these financial statements and financial highlights based on our audits.
We conducted our audits in accordance with the standards of the Public Company Accounting Oversight Board (United States). Those standards require that we plan and perform our audit to obtain reasonable assurance about whether the financial statements and financial highlights are free of material misstatement. An audit includes examining, on a test basis, evidence supporting the amounts and disclosures in the financial statements. Our procedures included confirmation of securities owned as of October 31, 2005 by correspondence with the custodian and brokers or by other appropriate auditing procedures. An audit also includes assessing the accounting principles used and significant estimates made by management, as well as evaluating the overall financial statement presentation. We believe that our audits provide a reasonable basis for our opinion.
In our opinion, the financial statements and financial highlights referred to above present fairly, in all material respects, the financial position of Putnam Income Fund as of October 31, 2005, the results of its operations for the year then ended, the changes in its net assets for each of the two years in the period then ended, and the financial highlights for each of the five years or periods in the period then ended, in conformity with U.S. generally accepted accounting principles.

33
| The fund's portfolio 10/31/05 | | | | |
|
| |
| |
| COLLATERALIZED MORTGAGE OBLIGATIONS (33.9%)* | | | | |
|
| | | Principal amount | | Value |
| |
| Amresco Commercial Mortgage Funding I 144A | | | | |
| Ser. 97-C1, Class H, 7s, 2029 | $ | 815,000 | $ | 825,514 |
| Asset Securitization Corp. Ser. 96-MD6, Class A7, | | | | |
| 8.007s, 2029 | | 2,347,000 | | 2,494,442 |
| Banc of America Commercial Mortgage, Inc. 144A | | | | |
| Ser. 01-PB1, Class K, 6.15s, 2035 | | 880,000 | | 891,959 |
| Ser. 05-1, Class XW, Interest Only (IO), 0.105s, 2042 | | 226,923,912 | | 1,219,035 |
| Ser. 05-4, Class XC, IO, 0.038s, 2045 | | 105,659,000 | | 774,375 |
| Banc of America Large Loan | | | | |
| FRB Ser. 04-BBA4, Class H, 4.92s, 2018 | | 188,000 | | 189,315 |
| FRB Ser. 04-BBA4, Class G, 4.67s, 2018 | | 300,000 | | 301,619 |
| Banc of America Large Loan 144A | | | | |
| FRB Ser. 02-FL2A, Class L1, 6.89s, 2014 | | 552,000 | | 552,835 |
| FRN Ser. 02-FL2A, Class K1, 6.39s, 2014 | | 190,000 | | 190,437 |
| FRB Ser. 05-BOCA, Class M, 6.07s, 2016 | | 1,362,000 | | 1,364,795 |
| FRB Ser. 05-ESHA, Class K, 5.746s, 2020 | | 2,099,000 | | 2,099,000 |
| FRB Ser. 05-BOCA, Class L, 5.67s, 2016 | | 546,000 | | 547,286 |
| FRB Ser. 05-BOCA, Class K, 5.32s, 2016 | | 465,000 | | 465,954 |
| FRB Ser. 05-BOCA, Class J, 5.07s, 2016 | | 250,000 | | 250,617 |
| FRB Ser. 05-BOCA, Class H, 4.92s, 2016 | | 250,000 | | 251,550 |
| FRB Ser. 05-ESHA, Class G, 4.826s, 2020 | | 1,050,000 | | 1,050,000 |
| Ser. 03-BBA2, Class X1A, IO, 0 5/8s, 2015 | | 63,321,228 | | 191,293 |
| Banc of America Structured Security Trust 144A | | | | |
| Ser. 02-X1, Class A3, 5.436s, 2033 | | 2,390,000 | | 2,401,391 |
| Bayview Commercial Asset Trust 144A | | | | |
| FRB Ser. 05-1A, Class A1, 4.338s, 2035 | | 2,574,432 | | 2,571,343 |
| Ser. 04-3, IO, 0.775s, 2035 | | 9,253,077 | | 700,848 |
| Ser. 05-1A, IO, 0.775s, 2035 | | 10,464,094 | | 783,172 |
| Ser. 05-3A, IO, 0.775s, 2035 | | 25,155,000 | | 2,068,687 |
| Ser. 04-2, IO, 0.72s, 2034 | | 9,361,061 | | 737,184 |
| Bear Stearns Commercial Mortgage Securities, Inc. | | | | |
| Ser. 05-PWR9, Class X1, IO, 0.046s, 2042 | | 52,376,000 | | 505,324 |
| Bear Stearns Commercial Mortgage Securitization Corp. | | | | |
| Ser. 00-WF2, Class F, 8.199s, 2032 | | 619,000 | | 706,737 |
| Chase Commercial Mortgage Securities Corp. Ser. 00-3, | | | | |
| Class A2, 7.319s, 2032 | | 736,000 | | 797,366 |
| Chase Commercial Mortgage Securities Corp. 144A | | | | |
| Ser. 98-1, Class F, 6.56s, 2030 | | 5,896,000 | | 6,132,433 |
| Ser. 98-1, Class G, 6.56s, 2030 | | 1,502,003 | | 1,565,840 |
| Ser. 98-1, Class H, 6.34s, 2030 | | 2,217,000 | | 1,879,600 |
| Citigroup Commercial Mortgage Trust 144A Ser. 05-C3, | | | | |
| Class XC, IO, 0.054s, 2043 | | 147,010,111 | | 1,539,012 |
| Commercial Mortgage Acceptance Corp. Ser. 97-ML1, | | | | |
| Class A3, 6.57s, 2030 | | 7,083,000 | | 7,207,027 |
| Commercial Mortgage Acceptance Corp. 144A Ser. 98-C1, | | | | |
| Class F, 6.23s, 2031 | | 2,605,530 | | 2,676,082 |
34
| COLLATERALIZED MORTGAGE OBLIGATIONS (33.9%)* continued | | | | |
|
| | | Principal amount | | Value |
| |
| Commercial Mortgage Pass-Through | | | | |
| Certificates 144A | | | | |
| FRB Ser. 01-J2A, Class A2F, 4.47s, 2034 | $ | 1,960,000 | $ | 1,984,696 |
| Ser. 05-LP5, Class XC, IO, 0.042s, 2043 | | 77,681,826 | | 815,659 |
| Ser. 05-C6, Class XC, IO, 0.04s, 2044 | | 86,688,851 | | 589,484 |
| Criimi Mae Commercial Mortgage Trust Ser. 98-C1, | | | | |
| Class A2, 7s, 2033 | | 13,599,500 | | 13,939,488 |
| Criimi Mae Commercial Mortgage Trust 144A Ser. 98-C1, | | | | |
| Class B, 7s, 2033 | | 7,975,000 | | 8,171,792 |
| Crown Castle Towers, LLC 144A Ser. 05-1A, Class D, | | | | |
| 5.612s, 2035 | | 3,575,000 | | 3,492,049 |
| CS First Boston Mortgage Securities Corp. Ser. 97-C2, | | | | |
| Class F, 7.46s, 2035 | | 1,193,000 | | 1,259,969 |
| CS First Boston Mortgage Securities Corp. 144A | | | | |
| FRB Ser. 03-TF2A, Class L, 7.97s, 2014 | | 1,475,000 | | 1,467,303 |
| FRB Ser. 00-FL1A, Class D, 5.72s, 2009 | | 791,086 | | 787,130 |
| FRB Ser. 04-TF2A, Class J, 4.92s, 2016 | | 414,000 | | 413,998 |
| FRB Ser. 05-TFLA, Class J, 4.92s, 2020 | | 391,000 | | 390,998 |
| FRB Ser. 05-TFLA, Class H, 4.72s, 2020 | | 391,000 | | 390,998 |
| FRB Ser. 04-TF2A, Class H, 4.67s, 2019 | | 825,000 | | 824,996 |
| Ser. 01-CK1, Class AY, IO, 0.785s, 2035 | | 83,484,000 | | 2,788,366 |
| Ser. 03-C3, Class AX, IO, 0.355s, 2038 | | 43,463,153 | | 1,834,536 |
| Ser. 05-C2, Class AX, IO, 0.066s, 2037 | | 86,045,191 | | 1,338,691 |
| Deutsche Mortgage & Asset Receiving Corp. Ser. 98-C1, | | | | |
| Class X, IO, 0.926s, 2031 | | 1,203,040 | | 24,248 |
| DLJ Commercial Mortgage Corp. | | | | |
| Ser. 00-CF1, Class A1B, 7.62s, 2033 | | 2,945,000 | | 3,220,717 |
| Ser. 99-CG2, Class B3, 6.1s, 2032 | | 2,455,000 | | 2,483,176 |
| Ser. 99-CG2, Class B4, 6.1s, 2032 | | 3,434,000 | | 3,462,817 |
| Ser. 98-CF2, Class B3, 6.04s, 2031 | | 575,367 | | 581,950 |
| DLJ Mortgage Acceptance Corp. 144A Ser. 97-CF1, | | | | |
| Class A3, 7.76s, 2030 | | 1,170,000 | | 1,203,657 |
| Fannie Mae | | | | |
| IFB Ser. 05-37, Class SU, 13.05s, 2035 | | 4,456,713 | | 5,039,865 |
| IFB Ser. 04-10, Class QC, 12.45s, 2031 | | 3,162,035 | | 3,392,707 |
| Ser. 92-15, Class L, IO, 10.38s, 2022 | | 358 | | 4,112 |
| IFB Ser. 02-36, Class SJ, 10.031s, 2029 | | 796,703 | | 813,791 |
| IFB Ser. 05-57, Class CD, 9.984s, 2035 | | 2,089,508 | | 2,195,804 |
| IFB Ser. 05-74, Class CP, 9.946s, 2035 | | 2,352,776 | | 2,483,306 |
| IFB Ser. 05-76, Class SA, 9.946s, 2034 | | 3,323,310 | | 3,445,857 |
| FRB Ser. 05-104, Class NS, 9.9s, 2035 | | 1,342,000 | | 1,395,051 |
| Ser. 04-T3, Class PT1, 9.878s, 2044 | | 770,327 | | 830,104 |
| IFB Ser. 05-45, Class DA, 9.616s, 2035 | | 4,258,508 | | 4,433,186 |
| IFB Ser. 05-74, Class DM, 9.579s, 2035 | | 5,474,995 | | 5,678,017 |
| IFB Ser. 05-45, Class DC, 9.506s, 2035 | | 3,358,445 | | 3,481,671 |
| Ser. 02-T1, Class A4, 9 1/2s, 2031 | | 89,235 | | 95,258 |
| Ser. 02-T4, Class A4, 9 1/2s, 2041 | | 744,787 | | 794,573 |
| Ser. 02-T6, Class A3, 9 1/2s, 2041 | | 933,235 | | 993,423 |
| Ser. 02-T12, Class A4, 9 1/2s, 2042 | | 444,449 | | 474,868 |
35
| COLLATERALIZED MORTGAGE OBLIGATIONS (33.9%)* continued | | | | |
|
| | | Principal amount | | Value |
| |
| Fannie Mae | | | | |
| Ser. 03-W6, Class PT1, 9.45s, 2042 | $ | 1,249,910 | $ | 1,338,965 |
| IFB Ser. 05-74, Class SK, 9.027s, 2035 | | 4,452,417 | | 4,627,975 |
| IFB Ser. 05-74, Class CS, 8.917s, 2035 | | 2,681,458 | | 2,776,529 |
| IFB Ser. 04-79, Class SA, 8.724s, 2032 | | 5,988,269 | | 5,968,978 |
| IFB Ser. 05-57, Class DC, 8.653s, 2034 | | 4,115,040 | | 4,262,368 |
| IFB Ser. 05-95, Class OP, 8.182s, 2035 | | 1,286,000 | | 1,228,308 |
| IFB Ser. 05-45, Class PC, 8.138s, 2034 | | 2,001,031 | | 2,051,104 |
| IFB Ser. 05-95, Class CP, 8.089s, 2035 | | 456,000 | | 461,118 |
| Ser. 94-95, Class A, 8s, 2024 | | 1,080,277 | | 1,168,689 |
| Ser. 94-106, Class PA, 8s, 2024 | | 709,496 | | 767,134 |
| Ser. 95-5, Class A, 8s, 2025 | | 537,738 | | 581,054 |
| Ser. 95-5, Class TA, 8s, 2025 | | 132,556 | | 143,580 |
| Ser. 95-6, Class A, 8s, 2025 | | 352,981 | | 381,348 |
| Ser. 95-7, Class A, 8s, 2025 | | 462,364 | | 499,851 |
| Ser. 95-12, Class PD, 8s, 2025 | | 460,826 | | 497,007 |
| Ser. 97-13, Class TA, 8s, 2027 | | 281,626 | | 304,275 |
| Ser. 97-16, Class PE, 8s, 2027 | | 757,273 | | 817,703 |
| Ser. 97-21, Class PA, 8s, 2027 | | 1,162,592 | | 1,254,708 |
| Ser. 97-22, Class PA, 8s, 2027 | | 2,185,920 | | 2,360,822 |
| Ser. 97-25, Class PB, 8s, 2027 | | 729,125 | | 787,075 |
| Ser. 97-37, Class PB, 8s, 2027 | | 1,925,331 | | 2,079,834 |
| Ser. 00-17, Class PA, 8s, 2030 | | 691,023 | | 742,464 |
| Ser. 00-18, Class PA, 8s, 2030 | | 651,431 | | 699,888 |
| Ser. 00-19, Class PA, 8s, 2030 | | 677,101 | | 727,512 |
| Ser. 00-20, Class PA, 8s, 2030 | | 379,237 | | 407,960 |
| Ser. 00-21, Class PA, 8s, 2030 | | 1,135,721 | | 1,220,929 |
| Ser. 00-22, Class PA, 8s, 2030 | | 836,062 | | 898,276 |
| Ser. 00-42, Class B2, 8s, 2030 | | 140,597 | | 151,136 |
| Ser. 99-T2, Class A1, 7 1/2s, 2039 | | 463,623 | | 487,583 |
| Ser. 00-T6, Class A1, 7 1/2s, 2030 | | 2,950,434 | | 3,094,498 |
| Ser. 01-T1, Class A1, 7 1/2s, 2040 | | 1,342,852 | | 1,407,876 |
| Ser. 01-T3, Class A1, 7 1/2s, 2040 | | 750,716 | | 785,678 |
| Ser. 01-T4, Class A1, 7 1/2s, 2028 | | 8,941,211 | | 9,432,663 |
| Ser. 01-T5, Class A3, 7 1/2s, 2030 | | 87,648 | | 91,724 |
| Ser. 01-T7, Class A1, 7 1/2s, 2041 | | 8,462,973 | | 8,850,898 |
| Ser. 01-T8, Class A1, 7 1/2s, 2041 | | 1,079,323 | | 1,129,938 |
| Ser. 01-T10, Class A2, 7 1/2s, 2041 | | 4,115,482 | | 4,313,162 |
| Ser. 01-T12, Class A2, 7 1/2s, 2041 | | 3,871,592 | | 4,059,064 |
| Ser. 02-14, Class A2, 7 1/2s, 2042 | | 644,892 | | 676,985 |
| Ser. 02-26, Class A2, 7 1/2s, 2048 | | 3,782,635 | | 3,973,117 |
| Ser. 02-T1, Class A3, 7 1/2s, 2031 | | 649,119 | | 680,904 |
| Ser. 02-T4, Class A3, 7 1/2s, 2041 | | 266,302 | | 279,160 |
| Ser. 02-T6, Class A2, 7 1/2s, 2041 | | 9,940,621 | | 10,409,469 |
| Ser. 02-T12, Class A3, 7 1/2s, 2042 | | 642,847 | | 674,773 |
| Ser. 02-T16, Class A3, 7 1/2s, 2042 | | 6,400,956 | | 6,728,880 |
| Ser. 02-T18, Class A4, 7 1/2s, 2042 | | 2,341,169 | | 2,461,930 |
| Ser. 02-T19, Class A3, 7 1/2s, 2042 | | 7,333,008 | | 7,709,993 |
| Ser. 02-W1, Class 2A, 7 1/2s, 2042 | | 4,117,109 | | 4,305,902 |
| Ser. 03-W2, Class 1A3, 7 1/2s, 2042 | | 2,088,487 | | 2,196,667 |
36
| COLLATERALIZED MORTGAGE OBLIGATIONS (33.9%)* continued | | | | |
|
| | | Principal amount | | Value |
| |
| Fannie Mae | | | | |
| Ser. 03-W3, Class 1A3, 7 1/2s, 2042 | $ | 4,683,754 | $ | 4,924,657 |
| Ser. 03-W4, Class 4A, 7 1/2s, 2042 | | 538,210 | | 564,710 |
| Ser. 02-W3, Class A5, 7 1/2s, 2028 | | 1,976,446 | | 2,074,803 |
| Ser. 02-W4, Class A5, 7 1/2s, 2042 | | 8,738,973 | | 9,178,196 |
| Ser. 02-W6, Class 2A, 7 1/2s, 2042 | | 4,006,514 | | 4,206,815 |
| Ser. 02-W7, Class A5, 7 1/2s, 2029 | | 2,362,374 | | 2,482,637 |
| Ser. 03-W1, Class 2A, 7 1/2s, 2042 | | 786,994 | | 824,980 |
| Ser. 03-W10, Class 1A1, 7 1/2s, 2032 | | 1,853,153 | | 1,945,023 |
| Ser. 04-T2, Class 1A4, 7 1/2s, 2043 | | 1,686,143 | | 1,776,296 |
| Ser. 04-T3, Class 1A4, 7 1/2s, 2044 | | 1,175,786 | | 1,238,849 |
| Ser. 04-W2, Class 5A, 7 1/2s, 2044 | | 7,959,199 | | 8,391,166 |
| Ser. 04-W8, Class 3A, 7 1/2s, 2044 | | 5,686,634 | | 5,995,643 |
| Ser. 04-W9, Class 2A3, 7 1/2s, 2044 | | 2,170,739 | | 2,285,680 |
| Ser. 04-W12, Class 1A4, 7 1/2s, 2044 | | 2,945,217 | | 3,103,338 |
| Ser. 04-W14, Class 2A, 7 1/2s, 2044 | | 606,188 | | 638,450 |
| Ser. 05-W1, Class 1A4, 7 1/2s, 2044 | | 4,886,676 | | 5,148,339 |
| Ser. 05-W3, Class 1A, 7 1/2s, 2045 | | 4,880,441 | | 5,153,999 |
| IFB Ser. 05-73, Class SA, 7.053s, 2035 | | 2,445,692 | | 2,367,354 |
| Ser. 01-W3, Class A, 7s, 2041 | | 902,405 | | 935,010 |
| Ser. 02-14, Class A1, 7s, 2042 | | 685,778 | | 711,183 |
| Ser. 02-26, Class A1, 7s, 2048 | | 2,356,861 | | 2,445,488 |
| Ser. 02-T16, Class A2, 7s, 2042 | | 2,390,653 | | 2,482,579 |
| Ser. 03-14, Class AI, IO, 7s, 2033 | | 1,341,039 | | 277,462 |
| Ser. 03-W3, Class 1A2, 7s, 2042 | | 1,167,585 | | 1,212,786 |
| Ser. 04-T2, Class 1A3, 7s, 2043 | | 1,881,513 | | 1,957,996 |
| Ser. 04-T3, Class 1A3, 7s, 2044 | | 2,540,477 | | 2,643,710 |
| Ser. 04-W1, Class 2A2, 7s, 2033 | | 6,721,938 | | 6,993,246 |
| Ser. 05-45, Class OX, IO, 7s, 2035 | | 3,882,286 | | 770,380 |
| IFB Ser. 05-83, Class QP, 6.897s, 2034 | | 859,929 | | 817,886 |
| IFB Ser. 05-59, Class NQ, 6.781s, 2035 | | 4,215,138 | | 3,981,988 |
| IFB Ser. 05-93, Class AS, 6.781s, 2034 | | 1,097,942 | | 1,029,492 |
| IFB Ser. 02-97, Class TW, IO, 6 1/2s, 2031 | | 1,941,677 | | 334,313 |
| Ser. 03-31, Class IM, IO, 5 3/4s, 2032 | | 6,938,896 | | 1,012,385 |
| Ser. 329, Class 2, IO, 5 1/2s, 2033 | | 34,605,023 | | 8,317,313 |
| Ser. 333, Class 2, IO, 5 1/2s, 2033 | | 24,865,456 | | 6,054,868 |
| Ser. 350, Class 2, IO, 5 1/2s, 2034 | | 19,590,451 | | 4,722,364 |
| Ser. 03-6, Class IB, IO, 5 1/2s, 2022 | | 101,407 | | 30 |
| Ser. 03-8, Class IP, IO, 5 1/2s, 2028 | | 4,576,151 | | 329,029 |
| Ser. 03-45, Class PI, IO, 5 1/2s, 2029 | | 4,113,389 | | 467,898 |
| Ser. 03-14, Class XI, IO, 5 1/4s, 2033 | | 3,778,171 | | 589,282 |
| Ser. 03-14, Class TI, IO, 5s, 2033 | | 3,532,992 | | 510,146 |
| Ser. 03-24, Class UI, IO, 5s, 2031 | | 3,479,745 | | 582,014 |
| Ser. 05-29, Class SX, IO, 5s, 2035 | | 1,425,000 | | 1,457,953 |
| Ser. 05-99, Class SA, 5s, 2035 | | 2,718,000 | | 2,806,760 |
| Ser. 05-104, Class SD, 5s, 2035 | | 3,576,000 | | 3,681,045 |
| Ser. 05-106, Class US, 5s, 2035 | | 5,635,000 | | 5,888,575 |
| IFB Ser. 02-89, Class S, IO, 4.163s, 2033 | | 5,750,467 | | 528,324 |
| IFB Ser. 02-36, Class QH, IO, 4.013s, 2029 | | 1,726,235 | | 37,645 |
| IFB Ser. 97-44, Class SN, IO, 3.77s, 2023 | | 1,988,365 | | 184,123 |
37
| COLLATERALIZED MORTGAGE OBLIGATIONS (33.9%)* continued | | | | |
|
| | | Principal amount | | Value |
| |
| Fannie Mae | | | | |
| IFB Ser. 03-66, Class SA, IO, 3.613s, 2033 | $ | 6,008,008 | $ | 462,617 |
| IFB Ser. 02-92, Class SB, IO, 3.313s, 2030 | | 2,088,613 | | 140,943 |
| IFB Ser. 05-52, Class DC, IO, 3.163s, 2035 | | 4,426,568 | | 336,281 |
| IFB Ser. 04-24, Class CS, IO, 3.113s, 2034 | | 7,292,698 | | 618,740 |
| IFB Ser. 03-122, Class SA, IO, 3.063s, 2028 | | 10,406,336 | | 623,156 |
| IFB Ser. 03-122, Class SJ, IO, 3.063s, 2028 | | 11,044,159 | | 671,270 |
| IFB Ser. 04-51, Class S0, IO, 3.013s, 2034 | | 1,552,269 | | 86,772 |
| IFB Ser. 04-60, Class SW, IO, 3.013s, 2034 | | 13,599,955 | | 1,185,916 |
| IFB Ser. 04-64, Class SW, IO, 3.013s, 2034 | | 17,378,176 | | 1,047,904 |
| IFB Ser. 04-65, Class ST, IO, 3.013s, 2034 | | 8,787,162 | | 529,866 |
| IFB Ser. 05-65, Class KI, IO, 2.963s, 2035 | | 35,198,151 | | 2,170,780 |
| IFB Ser. 05-42, Class PQ, IO, 2.763s, 2035 | | 2,634,036 | | 193,531 |
| IFB Ser. 05-42, Class SA, IO, 2.763s, 2035 | | 11,530,395 | | 755,658 |
| IFB Ser. 05-95, Class CI, IO, 2.73s, 2035 | | 6,031,000 | | 395,241 |
| IFB Ser. 05-17, Class ES, IO, 2.713s, 2035 | | 5,346,373 | | 433,497 |
| IFB Ser. 05-17, Class SY, IO, 2.713s, 2035 | | 2,500,596 | | 199,200 |
| IFB Ser. 05-29, Class SD, IO, 2.713s, 2035 | | 7,025,203 | | 465,706 |
| IFB Ser. 05-62, Class FS, IO, 2.713s, 2034 | | 6,833,676 | | 450,686 |
| IFB Ser. 05-73, Class SI, IO, 2.713s, 2035 | | 2,818,911 | | 180,146 |
| IFB Ser. 05-82, Class SW, IO, 2.693s, 2035 | | 11,879,877 | | 632,975 |
| IFB Ser. 05-82, Class SY, IO, 2.693s, 2035 | | 15,116,065 | | 805,404 |
| IFB Ser. 05-45, Class EW, IO, 2.683s, 2035 | | 26,830,976 | | 1,455,686 |
| IFB Ser. 05-45, Class SR, IO, 2.683s, 2035 | | 20,145,303 | | 1,077,587 |
| IFB Ser. 04-92, Class S, IO, 2.663s, 2034 | | 8,790,584 | | 554,686 |
| IFB Ser. 05-17, Class SA, IO, 2.663s, 2035 | | 7,932,304 | | 566,746 |
| IFB Ser. 05-17, Class SE, IO, 2.663s, 2035 | | 8,466,878 | | 590,136 |
| IFB Ser. 05-23, Class SG, IO, 2.663s, 2035 | | 8,664,795 | | 611,951 |
| IFB Ser. 05-29, Class SX, IO, 2.663s, 2035 | | 10,714,431 | | 710,862 |
| IFB Ser. 05-54, Class SA, IO, 2.663s, 2035 | | 14,151,252 | | 734,450 |
| IFB Ser. 05-57, Class CI, IO, 2.663s, 2035 | | 8,409,964 | | 529,578 |
| IFB Ser. 05-57, Class DI, IO, 2.663s, 2035 | | 17,165,548 | | 1,106,754 |
| IFB Ser. 05-84, Class SG, IO, 2.663s, 2035 | | 10,956,426 | | 771,996 |
| IFB Ser. 05-87, Class SG, IO, 2.663s, 2035 | | 14,215,428 | | 824,051 |
| IFB Ser. 05-89, Class S, IO, 2.663s, 2035 | | 21,231,741 | | 1,127,936 |
| IFB Ser. 05-83, Class QI, IO, 2.653s, 2035 | | 1,445,010 | | 112,703 |
| IFB Ser. 05-95, Class OI, IO, 2.649s, 2035 | | 805,000 | | 62,148 |
| IFB Ser. 05-73, Class SD, IO, 2.643s, 2035 | | 6,968,383 | | 461,655 |
| IFB Ser. 05-92, Class SC, IO, 2.643s, 2035 | | 14,405,591 | | 898,045 |
| IFB Ser. 05-83, Class SL, IO, 2.633s, 2035 | | 29,642,340 | | 1,667,446 |
| IFB Ser. 04-38, Class SI, IO, 2.533s, 2033 | | 13,747,013 | | 720,343 |
| IFB Ser. 04-72, Class SB, IO, 2.463s, 2034 | | 6,504,541 | | 294,656 |
| Ser. 03-W12, Class 2, IO, 2.223s, 2043 | | 8,834,309 | | 443,700 |
| IFB Ser. 05-67, Class BS, IO, 2.113s, 2035 | | 7,574,294 | | 302,972 |
| IFB Ser. 05-74, Class SE, IO, 2.063s, 2035 | | 15,807,286 | | 581,156 |
| IFB Ser. 05-82, Class SI, IO, 2.063s, 2035 | | 24,657,499 | | 947,773 |
| IFB Ser. 05-87, Class SE, IO, 2.013s, 2035 | | 56,735,697 | | 2,235,386 |
| Ser. 03-W10, Class 1, IO, 1.969s, 2043 | | 35,146,634 | | 1,515,699 |
| IFB Ser. 05-58, Class IK, IO, 1.963s, 2035 | | 5,479,742 | | 261,144 |
| Ser. 03-W10, Class 3, IO, 1.933s, 2043 | | 13,448,957 | | 579,986 |
38
| COLLATERALIZED MORTGAGE OBLIGATIONS (33.9%)* continued | | | | | |
| |
| | | Principal amount | | Value | |
| |
| Fannie Mae | | | | | |
| Ser. 03-W8, Class 12, IO, 1.639s, 2042 | $ | 62,602,620 | $ | 2,423,461 | |
| Ser. 03-W3, Class 2IO2, IO, 1.456s, 2042 | | 8,620,979 | | 41,462 | |
| Ser. 03-W10, Class 1A, IO, 1.349s, 2043 | | 1,165,202 | | 18,935 | |
| Ser. 03-W10, Class 3A, IO, 1.338s, 2043 | | 1,394,115 | | 23,961 | |
| Ser. 03-W6, Class 11, IO, 1.286s, 2042 | | 11,254,118 | | 41,291 | |
| Ser. 03-W17, Class 12, IO, 1.155s, 2033 | | 16,042,456 | | 481,387 | |
| Ser. 03-W19, IO, 1.11s, 2033 | | 1,847,121 | | 49,567 | |
| Ser. 03-49, Class SV, IO, 1s, 2033 | | 36,235,050 | | 1,370,214 | |
| Ser. 03-T2, Class 2, IO, 0.896s, 2042 | | 101,386,685 | | 1,905,675 | |
| Ser. 03-W6, Class 51, IO, 0.683s, 2042 | | 25,829,735 | | 413,134 | |
| Ser. 03-W3, Class 2IO1, IO, 0.677s, 2042 | | 36,985,391 | | 594,736 | |
| Ser. 03-18, Class X1, IO, 0.674s, 2042 | | 47,159,238 | | 793,256 | |
| Ser. 01-T12, Class IO, 0.57s, 2041 | | 47,436,707 | | 575,149 | |
| Ser. 03-W2, Class 1, IO, 0.469s, 2042 | | 55,061,582 | | 537,248 | |
| Ser. 01-50, Class B1, IO, 0.466s, 2041 | | 6,232,403 | | 49,256 | |
| Ser. 02-T4, IO, 0.453s, 2041 | | 25,996,690 | | 239,196 | |
| Ser. 03-W3, Class 1, IO, 0.435s, 2042 | | 35,441,138 | | 340,780 | |
| Ser. 02-T1, Class IO, IO, 0.425s, 2031 | | 37,214,794 | | 347,344 | |
| Ser. 03-W6, Class 3, IO, 0.365s, 2042 | | 36,301,679 | | 246,704 | |
| Ser. 03-W6, Class 23, IO, 0.35s, 2042 | | 38,333,986 | | 264,916 | |
| Ser. 03-W8, Class 11, IO, 0.115s, 2042 | | 25,717,371 | | 4,176 | |
| Ser. 03-W6, Class 21, IO, 0.004s, 2042 | | 10,845,060 | | 131 | |
| Ser. 342, Class 1, Principal Only (PO), zero %, 2033 | | 3,172,391 | | 2,442,741 | |
| Ser. 352, Class 1, PO, zero %, 2034 | | 2,838,204 | | 2,093,507 | |
| Ser. 353, Class 1, PO, zero %, 2034 | | 27,624,597 | | 19,659,070 | |
| Ser. 361, Class 1, PO, zero %, 2035 | | 13,354,627 | | 10,258,814 | |
| Ser. 03-34, Class P1, PO, zero %, 2043 | | 163,388 | | 112,830 | |
| FRB Ser. 05-36, Class QA, zero %, 2035 | | 942,797 | | 970,644 | |
| Ser. 05-38, PO, zero %, 2031 | | 544,000 | | 387,090 | |
| FRB Ser. 05-57, Class UL, zero %, 2035 | | 4,968,494 | | 5,172,123 | |
| FRB Ser. 05-65, Class CU, zero %, 2034 | | 693,842 | | 927,866 | |
| FRB Ser. 05-65, Class ER, zero %, 2035 | | 4,789,469 | | 5,030,198 | |
| Ser. 05-65, Class KO, PO, zero %, 2035 | | 1,121,867 | | 925,470 | |
| FRB Ser. 05-81, Class DF, zero %, 2033 | | 771,403 | | 828,024 | |
| Federal Home Loan Mortgage Corp. Structured | | | | | |
| Pass-Through Securities | | | | | |
| Ser. T-42, Class A6, 9 1/2s, 2042 | | 479,036 | | 511,662 | |
| Ser. T-41, Class 3A, 7 1/2s, 2032 | | 5,596,485 | | 5,863,603 | |
| Ser. T-42, Class A5, 7 1/2s, 2042 | | 1,773,454 | | 1,861,147 | |
| Ser. T-51, Class 2A, 7 1/2s, 2042 | | 2,860,772 | | 2,996,726 | |
| Ser. T-57, Class 1A3, 7 1/2s, 2043 | | 6,684,946 | | 7,041,773 | |
| Ser. T-58, Class 4A, 7 1/2s, 2043 | | 2,462,452 | | 2,585,162 | |
| Ser. T-59, Class 1A3, 7 1/2s, 2043 | | 6,190,711 | | 6,531,391 | |
| Ser. T-60, Class 1A3, 7 1/2s, 2044 | | 8,920,278 | | 9,394,706 | |
| Ser. T-41, Class 2A, 7s, 2032 | | 223,716 | | 231,610 | |
| Ser. T-60, Class 1A2, 7s, 2044 | | 8,297,946 | | 8,628,230 | |
| Ser. T-56, Class A, IO, 0.761s, 2043 | | 23,175,564 | | 267,967 | |
| Ser. T-56, Class 3, IO, 0.35s, 2043 | | 23,672,781 | | 236,728 | |
| Ser. T-56, Class 1, IO, 0.283s, 2043 | | 28,645,201 | | 205,887 | |
| Ser. T-56, Class 2, IO, 0.041s, 2043 | | 27,006,805 | | 67,517 | |
39 | | | | | |
| COLLATERALIZED MORTGAGE OBLIGATIONS (33.9%)* continued | | | | |
|
| | | Principal amount | | Value |
| |
| FFCA Secured Lending Corp. 144A Ser. 00-1, Class A2, | | | | |
| 7.77s, 2027 | $ | 11,909,277 | $ | 12,996,512 |
| First Union National Bank-Bank of America Commercial | | | | |
| Mortgage 144A Ser. 01-C1, Class 3, IO, 1.698s, 2033 | | 42,721,118 | | 3,068,273 |
| First Union-Lehman Brothers Commercial Mortgage Trust II | | | | |
| Ser. 97-C2, Class F, 7 1/2s, 2029 | | 3,492,000 | | 3,928,902 |
| Ser. 97-C1, Class A3, 7.38s, 2029 | | 5,445,454 | | 5,514,029 |
| First Union-Lehman Brothers-Bank of America 144A | | | | |
| Ser. 98-C2, Class G, 7s, 2035 | | 4,500,000 | | 4,898,078 |
| Freddie Mac | | | | |
| IFB Ser. 2763, Class SC, 12.72s, 2032 | | 6,253,146 | | 6,686,055 |
| IFB Ser. 2963, Class SV, 12.72s, 2034 | | 1,112,000 | | 1,233,277 |
| IFB Ser. 3028, Class SM, 10.193s, 2035 | | 4,242,920 | | 4,424,482 |
| IFB Ser. 2990, Class SL, 9.937s, 2034 | | 3,400,362 | | 3,516,886 |
| IFB Ser. 2976, Class LC, 9.863s, 2035 | | 1,598,814 | | 1,649,488 |
| IFB Ser. 2976, Class KL, 9.827s, 2035 | | 3,768,969 | | 3,873,833 |
| IFB Ser. 2979, Class AS, 9.717s, 2034 | | 974,400 | | 998,760 |
| IFB Ser. 2990, Class DP, 9.717s, 2034 | | 3,362,868 | | 3,429,521 |
| Ser. 3067, Class SA, 9.717s, 2035 | | 3,270,000 | | 3,292,992 |
| IFB Ser. 2990, Class LB, 9.048s, 2034 | | 3,930,712 | | 3,680,612 |
| IFB Ser. 2967, Class DS, 8.19s, 2035 | | 1,080,988 | | 1,030,917 |
| Ser. 1890, Class H, 7 1/2s, 2026 | | 590,503 | | 627,409 |
| Ser. 1895, Class C, 7 1/2s, 2026 | | 301,773 | | 320,633 |
| Ser. 1904, Class D, 7 1/2s, 2026 | | 709,636 | | 753,988 |
| Ser. 1905, Class H, 7 1/2s, 2026 | | 619,869 | | 658,611 |
| Ser. 1915, Class C, 7 1/2s, 2026 | | 545,953 | | 580,075 |
| Ser. 1923, Class D, 7 1/2s, 2026 | | 641,006 | | 681,068 |
| Ser. 1924, Class H, 7 1/2s, 2027 | | 604,940 | | 642,748 |
| Ser. 1928, Class D, 7 1/2s, 2027 | | 235,498 | | 250,217 |
| Ser. 1932, Class E, 7 1/2s, 2027 | | 555,656 | | 590,385 |
| Ser. 1938, Class E, 7 1/2s, 2027 | | 231,361 | | 245,821 |
| Ser. 1941, Class E, 7 1/2s, 2027 | | 185,246 | | 196,824 |
| Ser. 1943, Class M, 7 1/2s, 2027 | | 390,586 | | 414,998 |
| Ser. 1969, Class PF, 7 1/2s, 2027 | | 643,466 | | 683,683 |
| Ser. 1975, Class E, 7 1/2s, 2027 | | 170,522 | | 181,180 |
| Ser. 1989, Class C, 7 1/2s, 2027 | | 269,763 | | 286,623 |
| Ser. 1990, Class D, 7 1/2s, 2027 | | 743,051 | | 789,491 |
| Ser. 2187, Class PH, 7 1/2s, 2029 | | 1,825,532 | | 1,939,628 |
| Ser. 2217, Class PD, 7 1/2s, 2030 | | 822,325 | | 873,720 |
| Ser. 2224, Class PD, 7 1/2s, 2030 | | 811,831 | | 862,571 |
| Ser. 2229, Class PD, 7 1/2s, 2030 | | 787,082 | | 836,275 |
| Ser. 1530, Class I, 7s, 2023 | | 1,424,566 | | 1,495,795 |
| Ser. 1725, Class D, 7s, 2024 | | 606,597 | | 636,927 |
| Ser. 1750, Class C, 7s, 2023 | | 1,344,481 | | 1,411,705 |
| Ser. 1973, Class PJ, 7s, 2027 | | 3,113,005 | | 3,268,655 |
| Ser. 1978, Class PG, 7s, 2027 | | 2,620,444 | | 2,751,466 |
| Ser. 1987, Class AP, 7s, 2027 | | 904,229 | | 949,440 |
| Ser. 1987, Class PT, 7s, 2027 | | 1,479,854 | | 1,553,846 |
| Ser. 1998, Class PL, 7s, 2027 | | 1,846,770 | | 1,939,109 |
| Ser. 1999, Class PG, 7s, 2027 | | 2,980,324 | | 3,129,340 |
40
| COLLATERALIZED MORTGAGE OBLIGATIONS (33.9%)* continued | | | | |
|
| | | Principal amount | | Value |
| |
| Freddie Mac | | | | |
| Ser. 2004, Class BA, 7s, 2027 | $ | 1,764,965 | $ | 1,853,213 |
| Ser. 2005, Class C, 7s, 2027 | | 1,381,453 | | 1,450,525 |
| Ser. 2005, Class CE, 7s, 2027 | | 864,540 | | 907,767 |
| Ser. 2006, Class H, 7s, 2027 | | 2,469,762 | | 2,593,250 |
| Ser. 2006, Class T, 7s, 2027 | | 2,817,184 | | 2,958,043 |
| Ser. 2008, Class G, 7s, 2023 | | 224,571 | | 235,800 |
| Ser. 2020, Class E, 7s, 2028 | | 4,240,095 | | 4,452,100 |
| Ser. 2031, Class PG, 7s, 2028 | | 832,009 | | 873,610 |
| Ser. 2054, Class H, 7s, 2028 | | 4,310,213 | | 4,525,724 |
| Ser. 2198, Class PH, 7s, 2029 | | 3,064,247 | | 3,217,460 |
| Ser. 2208, Class PG, 7s, 2030 | | 3,663,813 | | 3,847,004 |
| Ser. 2211, Class PG, 7s, 2030 | | 2,055,574 | | 2,158,353 |
| Ser. 2256, Class UA, 7s, 2030 | | 411,750 | | 432,337 |
| IFB Ser. 2990, Class WP, 6.785s, 2035 | | 2,675,176 | | 2,595,862 |
| Ser. 2778, Class TI, IO, 6s, 2033 | | 7,321,946 | | 1,219,836 |
| Ser. 226, IO, 5 1/2s, 2034 | | 7,344,004 | | 1,808,003 |
| Ser. 2581, Class IH, IO, 5 1/2s, 2031 | | 2,594,654 | | 713,527 |
| Ser. 2553, Class IJ, IO, 5 1/2s, 2020 | | 716,636 | | 3,041 |
| Ser. 2600, Class CI, IO, 5 1/2s, 2029 | | 823,295 | | 212,513 |
| Ser. 2664, Class UD, IO, 5 1/2s, 2028 | | 1,312,030 | | 274,823 |
| Ser. 2962, Class BS, 5s, 2035 | | 3,256,000 | | 3,087,634 |
| Ser. 3065, Class DI, 5s, 2035 | | 2,358,000 | | 164,635 |
| Ser. 3066, Class PS, 5s, 2035 | | 2,841,999 | | 2,955,901 |
| IFB Ser. 2927, Class SI, IO, 4.53s, 2035 | | 6,572,886 | | 826,135 |
| Ser. 2437, Class SB, IO, 4.03s, 2032 | | 6,699,398 | | 625,724 |
| IFB Ser. 2538, Class SH, IO, 3.58s, 2032 | | 1,177,935 | | 81,087 |
| IFB Ser. 2828, Class GI, IO, 3.53s, 2034 | | 7,149,936 | | 781,255 |
| Ser. 2469, Class SH, IO, 3.53s, 2032 | | 5,786,786 | | 462,943 |
| IFB Ser. 2802, Class SM, IO, 3.38s, 2032 | | 2,467,307 | | 169,160 |
| IFB Ser. 2869, Class SH, IO, 3.33s, 2034 | | 3,810,076 | | 274,770 |
| IFB Ser. 2869, Class JS, IO, 3.28s, 2034 | | 18,425,875 | | 1,302,419 |
| IFB Ser. 2882, Class SL, IO, 3.23s, 2034 | | 4,048,816 | | 346,736 |
| IFB Ser. 2682, Class TQ, IO, 3.08s, 2033 | | 3,288,937 | | 197,336 |
| IFB Ser. 2815, Class PT, IO, 3.08s, 2032 | | 6,893,009 | | 535,124 |
| IFB Ser. 2828, Class TI, IO, 3.08s, 2030 | | 3,376,580 | | 249,023 |
| IFB Ser. 3045, Class DI, IO, 2.89s, 2035 | | 23,925,927 | | 1,256,663 |
| IFB Ser. 3033, Class SF, IO, 2.83s, 2035 | | 4,949,102 | | 290,760 |
| IFB Ser. 2922, Class SE, IO, 2.78s, 2035 | | 11,036,108 | | 576,085 |
| IFB Ser. 2981, Class AS, IO, 2 3/4s, 2035 | | 10,179,959 | | 515,106 |
| IFB Ser. 2981, Class BS, IO, 2 3/4s, 2035 | | 5,407,019 | | 275,420 |
| IFB Ser. 2924, Class SA, IO, 2.73s, 2035 | | 15,700,791 | | 775,619 |
| IFB Ser. 2927, Class ES, IO, 2.73s, 2035 | | 5,296,878 | | 321,636 |
| IFB Ser. 2950, Class SM, IO, 2.73s, 2016 | | 7,273,178 | | 494,349 |
| IFB Ser. 3031, Class BI, IO, 2.72s, 2035 | | 3,186,658 | | 240,582 |
| IFB Ser. 2962, Class BS, IO, 2.68s, 2035 | | 21,071,492 | | 1,252,435 |
| IFB Ser. 2986, Class WS, IO, 2.68s, 2035 | | 4,377,865 | | 192,626 |
| IFB Ser. 2990, Class LI, IO, 2.66s, 2034 | | 6,123,380 | | 418,849 |
| IFB Ser. 2988, Class AS, IO, 2.23s, 2035 | | 2,251,176 | | 82,993 |
41
| COLLATERALIZED MORTGAGE OBLIGATIONS (33.9%)* continued | | | | |
|
| | | Principal amount | | Value |
| |
| Freddie Mac | | | | |
| IFB Ser. 2937, Class SY, IO, 2.13s, 2035 | $ | 3,544,760 | $ | 128,498 |
| IFB Ser. 2957, Class SW, IO, 2.03s, 2035 | | 20,859,534 | | 769,717 |
| Ser. 228, PO, zero %, 2035 | | 42,772,810 | | 32,800,710 |
| Ser. 231, PO, zero %, 2035 | | 79,983,499 | | 58,368,672 |
| FRB Ser. 2958, Class FL, zero %, 2035 | | 2,278,342 | | 2,181,380 |
| FRB Ser. 2986, Class XT, zero %, 2035 | | 443,648 | | 485,447 |
| FRB Ser. 2992, Class WM, zero %, 2035 | | 1,627,265 | | 1,896,018 |
| FRB Ser. 3003, Class XF, zero %, 2035 | | 4,052,529 | | 4,275,418 |
| FRB Ser. 3022, Class TC, zero %, 2035 | | 814,809 | | 950,907 |
| Ser. 3045, Class DO, PO, zero %, 2035 | | 1,929,600 | | 1,480,767 |
| FRB Ser. 3046, Class WF, zero %, 2035 | | 1,119,000 | | 1,110,476 |
| GE Capital Commercial Mortgage Corp. 144A | | | | |
| Ser. 05-C2, Class XC, IO, 0.049s, 2043 | | 124,731,624 | | 1,057,238 |
| Ser. 05-C3, Class XC, IO, 0.031s, 2045 | | 292,832,000 | | 1,552,010 |
| General Growth Properties-Mall Properties Trust 144A FRB | | | | |
| Ser. 01-C1A, Class D3, 6.22s, 2014 | | 2,628,261 | | 2,630,725 |
| GMAC Commercial Mortgage Securities, Inc. | | | | |
| Ser. 99-C3, Class F, 7.787s, 2036 | | 488,000 | | 519,659 |
| Ser. 01-C2, Class A1, 6 1/4s, 2034 | | 660,085 | | 673,023 |
| Ser. 04-C2, Class A4, 5.301s, 2038 | | 2,237,000 | | 2,234,316 |
| Ser. 03-C2, Class A2, 5.28s, 2040 | | 7,723,000 | | 7,822,627 |
| Ser. 05-C1, Class X1, IO, 0.096s, 2043 | | 108,047,000 | | 1,955,651 |
| GMAC Commercial Mortgage Securities, Inc. 144A | | | | |
| Ser. 99-C3, Class G, 6.974s, 2036 | | 2,095,341 | | 1,722,875 |
| Government National Mortgage Association | | | | |
| IFB Ser. 05-7, Class JM, 7.964s, 2034 | | 4,377,056 | | 4,426,848 |
| Ser. 05-13, Class MI, IO, 5 1/2s, 2032 | | 4,705,524 | | 818,982�� |
| Ser. 05-13, Class PI, IO, 5 1/2s, 2033 | | 5,271,917 | | 944,188 |
| IFB Ser. 04-86, Class SW, IO, 2 3/4s, 2034 | | 9,062,621 | | 537,480 |
| IFB Ser. 05-65, Class SI, IO, 2.35s, 2035 | | 8,676,664 | | 414,035 |
| IFB Ser. 05-68, Class SI, IO, 2.3s, 2035 | | 26,912,253 | | 1,465,303 |
| IFB Ser. 05-28, Class SA, IO, 2.2s, 2035 | | 21,370,872 | | 866,059 |
| IFB Ser. 05-51, Class SJ, IO, 2.2s, 2035 | | 8,153,878 | | 430,525 |
| IFB Ser. 05-68, Class S, IO, 2.2s, 2035 | | 16,179,878 | | 790,891 |
| IFB Ser. 04-11, Class SA, IO, 1 1/2s, 2034 | | 7,968,968 | | 257,492 |
| Ser. 98-2, Class EA, PO, zero %, 2028 | | 1,397,776 | | 1,120,405 |
| Ser. 99-31, Class MP, PO, zero %, 2029 | | 185,800 | | 154,212 |
| GS Mortgage Securities Corp. II 144A | | | | |
| FRB Ser. 03-FL6A, Class L, 7.22s, 2015 | | 748,000 | | 750,338 |
| Ser. 98-C1, Class F, 6s, 2030 | | 1,627,000 | | 1,634,972 |
| Ser. 05-GG4, Class XC, IO, 0.107s, 2039 | | 133,923,670 | | 2,624,904 |
| GSMPS Mortgage Loan Trust | | | | |
| Ser. 05-RP3, Class 1A4, 8 1/2s, 2035 | | 695,664 | | 747,769 |
| Ser. 05-RP3, Class 1A3, 8s, 2035 | | 1,862,104 | | 1,979,868 |
| Ser. 05-RP3, Class 1A2, 7 1/2s, 2035 | | 1,461,137 | | 1,534,486 |
| JPMorgan Chase Commercial Mortgage | | | | |
| Securities Corp. 144A | | | | |
| Ser. 04-FL1A, Class X1A, IO, 1.003s, 2019 | | 25,073,553 | | 107,816 |
| Ser. 05-CB12, Class X1, IO, 0.053s, 2037 | | 71,209,303 | | 779,030 |
42
| COLLATERALIZED MORTGAGE OBLIGATIONS (33.9%)* continued | | | | |
|
| | | Principal amount | | Value |
| |
| JPMorgan Chase Commercial Mortgage | | | | |
| Securities Corp. 144A | | | | |
| Ser. 05-LDP2, Class X1, IO, 0.047s, 2042 | $ | 242,268,585 | $ | 3,757,055 |
| Ser. 05-LDP4, Class X1, IO, 0.042s, 2042 | | 141,781,000 | | 1,312,582 |
| Ser. 05-LDP3, Class X1, IO, 0.037s, 2042 | | 173,965,000 | | 1,327,353 |
| Ser. 05-LDP1, Class X1, IO, 0.035s, 2046 | | 47,115,792 | | 439,868 |
| LB Commercial Conduit Mortgage Trust 144A | | | | |
| Ser. 99-C1, Class F, 6.41s, 2031 | | 926,463 | | 949,161 |
| Ser. 99-C1, Class G, 6.41s, 2031 | | 991,777 | | 931,850 |
| Ser. 98-C4, Class G, 5.6s, 2035 | | 784,000 | | 758,563 |
| Ser. 98-C4, Class H, 5.6s, 2035 | | 1,328,000 | | 1,265,595 |
| LB-UBS Commercial Mortgage Trust 144A | | | | |
| Ser. 05-C3, Class XCL, IO, 0.15s, 2040 | | 72,843,935 | | 1,582,280 |
| Ser. 05-C2, Class XCL, IO, 0.101s, 2040 | | 189,881,382 | | 2,092,904 |
| Ser. 05-C5, Class XCL, IO, 0.085s, 2020 | | 106,457,496 | | 1,546,874 |
| Ser. 05-C7, Class XCL, IO, 0.084s, 2040 | | 163,111,067 | | 1,565,866 |
| Lehman Brothers Floating Rate Commercial | | | | |
| Mortgage Trust 144A FRB | | | | |
| Ser. 03-LLFA, Class L, 7.696s, 2014 | | 2,250,000 | | 2,229,128 |
| Ser. 04-LLFA, Class H, 4.92s, 2017 | | 826,000 | | 829,139 |
| Ser. 05-LLFA, 4.77s, 2018 | | 534,000 | | 534,000 |
| Merrill Lynch Mortgage Investors, Inc. | | | | |
| Ser. 96-C2, Class A3, 6.96s, 2028 | | 171,295 | | 172,337 |
| Ser. 98-C3, Class E, 6.934s, 2030 | | 826,000 | | 884,368 |
| Ser. 96-C2, Class JS, IO, 2.112s, 2028 | | 5,181,026 | | 198,739 |
| Merrill Lynch Mortgage Trust Ser. 05-MCP1, Class XC, | | | | |
| IO, 0.048s, 2043 | | 88,940,134 | | 1,181,236 |
| Mezz Cap Commercial Mortgage Trust 144A | | | | |
| Ser. 04-C1, Class X, IO, 7.85s, 2037 | | 4,218,391 | | 1,712,403 |
| Ser. 04-C2, Class X, IO, 5.999s, 2040 | | 1,998,432 | | 735,673 |
| Morgan Stanley Capital 144A | | | | |
| Ser. 05-RR6, Class X, IO, 1.714s, 2043 | | 13,493,000 | | 1,027,789 |
| Ser. 05-HQ6, Class X1, IO, 0.048s, 2042 | | 113,709,640 | | 1,141,531 |
| Morgan Stanley Capital I 144A | | | | |
| Ser. 96-C1, Class E, 7.312s, 2028 | | 1,369,248 | | 1,370,190 |
| Ser. 98-HF1, Class F, 7.18s, 2030 | | 498,000 | | 516,349 |
| Ser. 04-RR, Class F5, 6s, 2039 | | 1,350,000 | | 1,160,865 |
| Ser. 04-RR, Class F6, 6s, 2039 | | 2,030,000 | | 1,676,577 |
| Ser. 05-HQ5, Class X1, IO, 0.04s, 2042 | | 64,820,581 | | 533,733 |
| Morgan Stanley Dean Witter Capital I Ser. 00-LIF2, | | | | |
| Class A1, 6.96s, 2033 | | 1,356,416 | | 1,399,659 |
| Mortgage Capital Funding, Inc. FRB Ser. 98-MC2, | | | | |
| Class E, 7.103s, 2030�� | | 1,389,000 | | 1,451,472 |
| Permanent Financing PLC FRB Ser. 8, Class 2C, 4.234s, | | | | |
| 2042 (United Kingdom) | | 2,413,000 | | 2,411,818 |
| PNC Mortgage Acceptance Corp. 144A | | | | |
| Ser. 99-CM1, Class B3, 7.1s, 2032 | | 4,971,000 | | 5,197,181 |
| Ser. 00-C1, Class J, 6 5/8s, 2010 | | 309,000 | | 292,771 |
| Ser. 00-C2, Class J, 6.22s, 2033 | | 1,290,000 | | 1,299,288 |
43
| COLLATERALIZED MORTGAGE OBLIGATIONS (33.9%)* continued | | | | |
|
| | | Principal amount | | Value |
| |
| Pure Mortgages 144A | | | | |
| FRB Ser. 04-1A, Class F, 7.36s, 2034 (Ireland) | $ | 3,491,000 | $ | 3,497,546 |
| Ser. 04-1A, Class E, 5.11s, 2034 (Ireland) | | 1,374,000 | | 1,376,576 |
| QFA Royalties, LLC 144A Ser. 05-1, 7.3s, 2025 | | 2,285,913 | | 2,242,515 |
| Salomon Brothers Mortgage Securities VII | | | | |
| Ser. 96-C1, Class E, 8.301s, 2028 | | 1,219,579 | | 1,221,775 |
| Salomon Brothers Mortgage Securities VII 144A | | | | |
| Ser. 03-CDCA, Class X3CD, IO, 1.06s, 2015 | | 10,447,274 | | 142,731 |
| STRIPS 144A | | | | |
| Ser. 03-1A, Class L, 5s, 2018 (Cayman Islands) | | 993,000 | | 851,536 |
| Ser. 03-1A, Class M, 5s, 2018 (Cayman Islands) | | 673,000 | | 550,125 |
| Ser. 04-1A, Class L, 5s, 2018 (Cayman Islands) | | 443,000 | | 379,890 |
| Wachovia Bank Commercial Mortgage Trust Ser. 05-C17, | | | | |
| Class A4, 5.083s, 2042 | | 8,696,000 | | 8,543,037 |
| Wachovia Bank Commercial Mortgage Trust 144A | | | | |
| FRB Ser. 05-WL5A, Class L, 7.27s, 2018 | | 944,000 | | 935,089 |
| Ser. 05-C18, Class XC, IO, 0.055s, 2042 | | 51,409,336 | | 526,946 |
| Washington Mutual Asset Securities Corp. 144A | | | | |
| Ser. 05-C1A, Class G, 5.72s, 2036 | | 219,000 | | 212,259 |
|
| Total collateralized mortgage obligations (cost $893,343,845) | | | $ | 873,928,633 |
|
| |
| |
| U.S. GOVERNMENT AND AGENCY MORTGAGE OBLIGATIONS (31.4%)* | | |
|
| | | Principal amount | | Value |
| |
| U.S. Government Guaranteed Mortgage Obligations (0.2%) | | | | |
| Government National Mortgage Association | | | | |
| Graduated Payment Mortgages 11s, with due dates | | | | |
| from March 15, 2010 to July 15, 2013 | $ | 75,100 | $ | 83,915 |
| Government National Mortgage Association | | | | |
| Pass-Through Certificates | | | | |
| 7s, with due dates from April 15, 2026 to December 15, 2031 | | 1,131,730 | | 1,201,935 |
| 6 1/2s, TBA, November 1, 2035 | | 1,815,000 | | 1,882,779 |
| 6s, TBA, November 1, 2035 | | 2,300,000 | | 2,341,508 |
| 4 1/2s, TBA, November 1, 2035 | | 800,000 | | 757,250 |
| | | | | 6,267,387 |
|
| |
| U.S. Government Agency Mortgage Obligations (31.2%) | | | | |
| Federal Home Loan Mortgage Corporation | | | | |
| Pass-Through Certificates | | | | |
| 7 1/2s, due December 1, 2029 | | 48,658 | | 51,561 |
| 7s, January 1, 2015 | | 47,134 | | 49,159 |
| 6s, with due dates from April 1, 2034 to June 1, 2034 | | 24,065 | | 24,374 |
| 6s, TBA, November 1, 2020 | | 3,700,000 | | 3,779,781 |
| 5 1/2s, with due dates from December 1, 2034 to July 1, 2035 | | 3,402,068 | | 3,362,002 |
| 5 1/2s, April 1, 2020 | | 308,191 | | 310,563 |
| 4s, with due dates from April 1, 2020 to August 1, 2020 | | 4,241,652 | | 4,014,658 |
| 4s, TBA, November 1, 2020 | | 4,300,000 | | 4,069,547 |
| Federal National Mortgage Association Graduated | | | | |
| Payment Mortgages 8s, December 1, 2008 | | 154,521 | | 158,253 |
44
| U.S. GOVERNMENT AND AGENCY MORTGAGE OBLIGATIONS (31.4%)* continued | | |
|
| | | Principal amount | | Value |
| |
| Federal National Mortgage Association | | | | |
| Pass-Through Certificates | | | | |
| 11s, October 1, 2015 | $ | 20,853 | $ | 23,219 |
| 9s, with due dates from January 1, 2027 to July 1, 2032 | | 449,226 | | 490,542 |
| 8s, with due dates from January 1, 2025 to July 1, 2033 | | 1,950,527 | | 2,086,012 |
| 7 1/2s, with due dates from September 1, 2022 to July 1, 2033 | | 1,496,012 | | 1,580,979 |
| 7s, with due dates from August 1, 2021 to September 1, 2035 | | 8,375,175 | | 8,768,363 |
| 7s, with due dates from January 1, 2007 to September 1, 2017 | | 1,596,267 | | 1,657,961 |
| 6 1/2s, with due dates from June 1, 2024 to May 1, 2035 | | 106,913,102 | | 109,819,996 |
| 6 1/2s, with due dates from September 1, 2010 | | | | |
| to February 1, 2019 | | 244,817 | | 253,120 |
| 6s, with due dates from February 1, 2034 to April 1, 2035 | | 1,999,881 | | 2,019,352 |
| 6s, with due dates from December 1, 2008 to November 1, 2017 | | 6,791,658 | | 6,950,361 |
| 5 1/2s, with due dates from April 1, 2034 to November 1, 2035 | | 381,499,757 | | 376,795,067 |
| 5 1/2s, with due dates from February 1, 2017 to April 1, 2020 | | 402,938 | | 406,054 |
| 5 1/2s, TBA, November 1, 2035 | | 92,400,000 | | 91,136,716 |
| 5s, with due dates from January 1, 2034 to October 1, 2035 | | 9,125,686 | | 8,784,568 |
| 5s, with due dates from June 1, 2019 to November 1, 2019 | | 300,041 | | 296,265 |
| 5s, TBA, November 1, 2035 | | 56,100,000 | | 53,978,719 |
| 4 1/2s, with due dates from July 1, 2019 to July 1, 2034 | | 9,191,078 | | 8,866,399 |
| 4 1/2s, with due dates from March 1, 2019 to June 1, 2019 | | 2,257,161 | | 2,185,302 |
| 4 1/2s, TBA, November 1, 2020 | | 107,400,000 | | 103,850,763 |
| 4s, with due dates from May 1, 2019 to October 1, 2020 | | 8,944,575 | | 8,478,975 |
| | | | | 804,248,631 |
|
| |
| Total U.S. government and agency mortgage obligations (cost $823,014,285) | $ | 810,516,018 |
|
| |
| |
| U.S. GOVERNMENT AGENCY OBLIGATIONS (0.4%)* | | | | |
|
| | | Principal amount | | Value |
| |
| Fannie Mae | | | | |
| 6 3/8s, June 15, 2009 | $ | 6,635,000 | $ | 6,988,900 |
| 6 1/4s, May 15, 2029 | | 515,000 | | 591,547 |
| 4 3/8s, October 15, 2006 | | 1,520,000 | | 1,516,948 |
|
| Total U.S. government agency obligations (cost $9,227,634) | | | $ | 9,097,395 |
|
| |
| |
| U.S. TREASURY OBLIGATIONS (1.0%)* | | | | |
|
| | | Principal amount | | Value |
| |
| U.S. Treasury Bonds | | | | |
| 8 7/8s, February 15, 2019 | $ | 425,000 | $ | 595,863 |
| 8 1/2s, February 15, 2020 | | 4,700,000 | | 6,491,875 |
| U.S. Treasury Notes | | | | |
| 4 1/4s, November 15, 2013 | | 2,085,000 | | 2,041,997 |
| 3 3/8s, December 15, 2008 | | 14,060,000 | | 13,628,864 |
| 3 1/4s, August 15, 2008 | | 3,934,000 | | 3,813,829 |
|
| Total U.S. treasury obligations (cost $27,247,382) | | | $ | 26,572,428 |
45
| ASSET-BACKED SECURITIES (21.7%)* | | | | |
|
| | | Principal amount | | Value |
| |
| Aames Mortgage Investment Trust FRN Ser. 04-1, | | | | |
| Class 2A1, 4.378s, 2034 | $ | 2,498,355 | $ | 2,501,640 |
| Aames Mortgage Trust 144A Ser. 03-1N, Class A, | | | | |
| 7 1/2s, 2033 | | 3,802 | | 3,819 |
| ABSC NIMS Trust 144A Ser. 05-HE2, Class A1, 4 1/2s, | | | | |
| 2035 (Cayman Islands) | | 2,329,839 | | 2,306,541 |
| Advanta Business Card Master Trust FRN Ser. 04-C1, | | | | |
| Class C, 5.05s, 2013 | | 1,939,000 | | 1,963,761 |
| Advanta Mortgage Loan Trust Ser. 00-1, Class A4, | | | | |
| 8.61s, 2028 | | 763,521 | | 768,174 |
| Aegis Asset Backed Securities Trust 144A | | | | |
| Ser. 04-1N, Class Note, 5s, 2034 | | 64,574 | | 64,574 |
| Ser. 04-4N, Class Note, 5s, 2034 | | 453,520 | | 451,252 |
| Ser. 04-5N, Class Note, 5s, 2034 | | 365,442 | | 365,100 |
| Ser. 04-6N, Class Note, 4 3/4s, 2035 | | 589,317 | | 586,094 |
| Ser. 04-2N, Class N1, 4 1/2s, 2034 | | 236,663 | | 236,183 |
| AFC Home Equity Loan Trust Ser. 99-2, Class 1A, | | | | |
| 4.448s, 2029 | | 6,896,979 | | 6,929,678 |
| American Express Credit Account Master Trust 144A | | | | |
| Ser. 04-C, Class C, 4.47s, 2012 | | 10,311,516 | | 10,313,124 |
| American Home Mortgage Investment Trust FRN | | | | |
| Ser. 04-3, Class 3A, 3.71s, 2034 | | 4,621,432 | | 4,540,665 |
| Ser. 04-3, Class 2A, 3.59s, 2034 | | 3,457,511 | | 3,392,709 |
| Americredit Automobile Receivables Trust 144A | | | | |
| Ser. 05-1, Class E, 5.82s, 2012 | | 1,020,000 | | 1,015,838 |
| Ameriquest Finance NIM Trust 144A | | | | |
| Ser. 04-IAN1, Class B, 8.835s, 2034 (Cayman Islands) | | 300,000 | | 300,000 |
| Ser. 04-IAN, Class 1A, 5.437s, 2034 (Cayman Islands) | | 142,264 | | 142,264 |
| Ser. 04-RN9, Class N1, 4.8s, 2034 (Cayman Islands) | | 643,092 | | 643,092 |
| Ameriquest Mortgage Securities, Inc. | | | | |
| Ser. 03-6, Class S, IO, 5s, 2033 | | 5,694,597 | | 20,501 |
| Ser. 03-8, Class S, IO, 5s, 2006 | | 3,750,646 | | 79,701 |
| Ser. 03-12, Class S, IO, 5s, 2006 | | 4,829,729 | | 113,499 |
| Arcap REIT, Inc. 144A | | | | |
| Ser. 03-1A, Class E, 7.11s, 2038 | | 1,993,000 | | 2,041,268 |
| Ser. 04-1A, Class E, 6.42s, 2039 | | 1,469,204 | | 1,464,168 |
| Argent NIM Trust 144A Ser. 04-WN9, Class A, 5.19s, | | | | |
| 2034 (Cayman Islands) | | 227,129 | | 227,023 |
| Asset Backed Funding Corp. NIM Trust 144A | | | | |
| Ser. 03-WMC1, Class Note, 6.9s, 2033 | | 3,738 | | 3,748 |
| Ser. 04-AHL1, Class Note, 5.6s, 2033 | | 463,334 | | 464,022 |
| Ser. 04-FF1, Class N1, 5s, 2034 (Cayman Islands) | | 289,476 | | 289,528 |
| Ser. 04-FF1, Class N2, 5s, 2034 (Cayman Islands) | | 75,000 | | 69,127 |
| Ser. 04-0PT1, Class N1, 4.55s, 2033 (Cayman Islands) | | 109,434 | | 109,231 |
| Ser. 04-0PT5, Class N1, 4.45s, 2034 (Cayman Islands) | | 294,284 | | 293,738 |
| Asset Backed Securities Corp. Home Equity Loan Trust | | | | |
| Ser. 03-HE5, Class A, IO, 4s, 2033 | | 7,886,626 | | 75,365 |
| FRB Ser. 04-HE9, Class A2, 4.408s, 2034 | | 1,052,817 | | 1,054,388 |
| FRN Ser. 04-HE1, Class A3, 4.37s, 2034 | | 202,863 | | 202,988 |
| FRB Ser. 05-HE1, Class A3, 4.328s, 2035 | | 1,439,645 | | 1,441,003 |
46
| ASSET-BACKED SECURITIES (21.7%)* continued | | | | |
|
| | | Principal amount | | Value |
| |
| Aviation Capital Group Trust 144A FRN Ser. 03-2A, | | | | |
| Class G1, 4.7s, 2033 | $ | 1,512,974 | $ | 1,515,219 |
| Banc of America Funding Corp. 144A Ser. 04-NIM1, | | | | |
| Class Note, 6s, 2034 | | 141,337 | | 141,337 |
| Banc of America Mortgage Securities | | | | |
| Ser. 04-D, Class 2A, IO, 0.684s, 2034 | | 20,689,788 | | 142,242 |
| Ser. 05-E, Class 2, IO, 0.306s, 2035 | | 43,628,000 | | 327,210 |
| Bank One Issuance Trust FRB Ser. 03-C4, Class C4, | | | | |
| 5s, 2011 | | 1,390,000 | | 1,416,225 |
| Bay View Auto Trust Ser. 05-LJ2, Class D, 5.27s, 2014 | | 534,000 | | 526,824 |
| Bayview Financial Acquisition Trust | | | | |
| FRN Ser. 03-G, Class A1, 4.67s, 2039 | | 6,300,000 | | 6,310,105 |
| FRN Ser. 03-F, Class A, 4.57s, 2043 | | 3,545,571 | | 3,554,000 |
| FRB Ser. 04-D, Class A, 4.46s, 2044 | | 4,693,547 | | 4,698,489 |
| Ser. 03-E, Class A, IO, 4s, 2006 | | 7,951,186 | | 123,672 |
| Ser. 04-D, Class A, IO, 3 1/2s, 2007 | | 24,215,846 | | 934,127 |
| Ser. 05-B, Class A, IO, 2.536s, 2039 | | 15,959,574 | | 571,476 |
| Bayview Financial Asset Trust 144A Ser. 03-X, Class A, IO, | | | | |
| 0.61s, 2006 | | 48,894,958 | | 846,303 |
| Bayview Financial Asset Trust 144A | | | | |
| FRN Ser. 03-SSRA, Class M, 5.388s, 2038 | | 2,064,521 | | 2,087,024 |
| FRN Ser. 03-SSRA, Class A, 4.738s, 2038 | | 1,807,740 | | 1,818,405 |
| FRN Ser. 04-SSRA, Class A1, 4.638s, 2039 | | 2,469,213 | | 2,479,831 |
| Ser. 03-Z, Class AIO1, IO, 0.383s, 2005 | | 46,263,975 | | 24,220 |
| Bear Stearns Adjustable Rate Mortgage Trust | | | | |
| Ser. 04-1, Class 11A1, 3.677s, 2034 | | 4,610,728 | | 4,561,014 |
| Bear Stearns Alternate Trust | | | | |
| Ser. 04-12, Class 2A2, 5.044s, 2035 | | 3,062,265 | | 3,061,620 |
| Ser. 04-9, Class 1A1, 5.023s, 2034 | | 1,362,276 | | 1,362,921 |
| Ser. 04-11, Class 2A2, 4.956s, 2034 | | 3,768,308 | | 3,766,406 |
| Ser. 05-2, Class 2A2A, 4.724s, 2035 | | 1,784,994 | | 1,780,447 |
| Ser. 05-5, Class 21A1, 4.694s, 2035 | | 6,585,703 | | 6,542,241 |
| Bear Stearns Asset Backed Securities NIM | | | | |
| Trust 144A | | | | |
| Ser. 04-HE6, Class A1, 5 1/4s, 2034 (Cayman Islands) | | 255,107 | | 254,948 |
| Ser. 04-HE7N, Class A1, 5 1/4s, 2034 | | 355,897 | | 355,675 |
| Ser. 04-FR1, Class A1, 5s, 2034 (Cayman Islands) | | 439,410 | | 438,860 |
| Ser. 04-HE5N, Class A1, 5s, 2034 (Cayman Islands) | | 165,976 | | 165,768 |
| Ser. 04-HE5N, Class A2, 5s, 2034 (Cayman Islands) | | 322,000 | | 320,994 |
| Ser. 04-HE8N, Class A1, 5s, 2034 | | 160,834 | | 160,633 |
| Ser. 04-HE10, Class A2, 5s, 2034 (Cayman Islands) | | 347,000 | | 346,133 |
| Ser. 04-HE10, Class A1, 4 1/4s, 2034 (Cayman Islands) | | 494,418 | | 491,869 |
| Bear Stearns Asset Backed Securities, Inc. | | | | |
| Ser. 03-AC4, Class A, IO, 5s, 2006 | | 10,500,600 | | 129,680 |
| FRN Ser. 03-3, Class A2, 4.628s, 2043 | | 2,964,000 | | 2,974,652 |
| FRN Ser. 03-1, Class A1, 4.538s, 2042 | | 1,290,705 | | 1,290,701 |
| FRB Ser. 05-3, Class A1, 4.488s, 2035 | | 2,066,471 | | 2,065,180 |
| Capital Auto Receivables Asset Trust 144A Ser. 05-1, | | | | |
| Class D, 6 1/2s, 2011 | | 1,776,000 | | 1,734,930 |
47
| ASSET-BACKED SECURITIES (21.7%)* continued | | | | |
|
| | | Principal amount | | Value |
| |
| Capital One Multi-Asset Execution Trust FRB | | | | |
| Ser. 02-C1, Class C1, 6.72s, 2010 | $ | 880,000 | $ | 917,950 |
| CARMAX Auto Owner Trust Ser. 04-2, Class D, | | | | |
| 3.67s, 2011 | | 520,708 | | 513,365 |
| CARSSX Finance, Ltd. 144A | | | | |
| FRB Ser. 04-AA, Class B4, 9.47s, 2011 (Cayman Islands) | | 286,633 | | 294,948 |
| FRB Ser. 04-AA, Class B3, 7.32s, 2011 (Cayman Islands) | | 361,285 | | 365,107 |
| CDO Repackaging Trust Series 144A FRN Ser. 03-2, | | | | |
| Class A, 8.006s, 2008 | | 4,870,000 | | 5,247,425 |
| Centex Home Equity Ser. 04-C, Class A, IO, 3 1/2s, 2006 | | 5,666,100 | | 93,924 |
| Chase Credit Card Master Trust FRB Ser. 03-3, | | | | |
| Class C, 5.05s, 2010 | | 2,550,000 | | 2,599,195 |
| Chase Funding Net Interest Margin 144A Ser. 04-OPT1, | | | | |
| Class Note, 4.458s, 2034 | | 665,242 | | 661,915 |
| CHEC NIM Ltd., 144A | | | | |
| Ser. 04-2, Class N2, 8s, 2034 (Cayman Islands) | | 350,000 | | 348,002 |
| Ser. 04-2, Class N3, 8s, 2034 (Cayman Islands) | | 223,000 | | 191,780 |
| Ser. 04-2, Class N1, 4.45s, 2034 (Cayman Islands) | | 347,465 | | 347,445 |
| Citibank Credit Card Issuance Trust FRN Ser. 01-C1, | | | | |
| Class C1, 5.23s, 2010 | | 1,390,000 | | 1,414,596 |
| Conseco Finance Securitizations Corp. | | | | |
| Ser. 02-1, Class M2, 9.546s, 2033 | | 5,593,000 | | 2,796,500 |
| Ser. 01-4, Class B1, 9.4s, 2033 | | 1,525,271 | | 205,912 |
| Ser. 00-2, Class A5, 8.85s, 2030 | | 8,500,000 | | 7,299,834 |
| Ser. 02-2, Class A, IO, 8 1/2s, 2033 | | 10,347,324 | | 2,551,557 |
| Ser. 00-4, Class A6, 8.31s, 2032 | | 8,633,000 | | 7,306,971 |
| Ser. 00-5, Class A6, 7.96s, 2032 | | 4,808,000 | | 4,093,579 |
| Ser. 00-5, Class A4, 7.47s, 2032 | | 3,112,623 | | 3,143,749 |
| Ser. 01-4, Class A4, 7.36s, 2033 | | 7,948,000 | | 7,857,369 |
| Ser. 01-1, Class A5, 6.99s, 2032 | | 281,000 | | 258,320 |
| Ser. 01-3, Class A4, 6.91s, 2033 | | 9,027,000 | | 8,676,184 |
| Ser. 02-1, Class A, 6.681s, 2033 | | 12,188,314 | | 12,420,292 |
| Ser. 01-1, Class A4, 6.21s, 2032 | | 5,583,173 | | 5,626,163 |
| Consumer Credit Reference IDX Securities 144A FRN | | | | |
| Ser. 02-1A, Class A, 5.924s, 2007 | | 3,653,000 | | 3,701,804 |
| Countrywide Alternative Loan Trust | | | | |
| Ser. 04-15, Class 1A1, 4.964s, 2034 | | 1,157,960 | | 1,155,336 |
| Ser. 05-24, Class IIAX, IO, 1.312s, 2035 | | 28,609,506 | | 1,035,664 |
| Ser. 05-24, Class 1AX, IO, 1.251s, 2035 | | 23,172,477 | | 630,291 |
| Countrywide Asset Backed Certificates 144A | | | | |
| Ser. 04-1NIM, Class Note, 6s, 2034 | | 751,596 | | 739,148 |
| Ser. 04-6N, Class N1, 6 1/4s, 2035 | | 1,886,593 | | 1,882,820 |
| Ser. 04-BC1N, Class Note, 5 1/2s, 2035 | | 386,921 | | 385,470 |
| Ser. 04-11N, Class N, 5 1/4s, 2036 | | 298,659 | | 297,763 |
| Ser. 04-14N, 5s, 2036 | | 667,359 | | 664,231 |
| Countrywide Home Loans | | | | |
| Ser. 05-9, Class 1X, IO, 1.332s, 2035 | | 32,368,588 | | 829,445 |
| Ser. 05-2, Class 2X, IO, 1.235s, 2035 | | 34,964,162 | | 786,694 |
48
| ASSET-BACKED SECURITIES (21.7%)* continued | | | | |
|
| | | Principal amount | | Value |
| |
| Countrywide Home Loans 144A Ser. 05-R2, Class 2A3, | | | | |
| 8s, 2035 | $ | 1,588,719 | $ | 1,683,794 |
| Countrywide Partnership Trust 144A Ser. 04-EC1N, | | | | |
| Class N, 5s, 2035 | | 592,646 | | 589,742 |
| Crest, Ltd. 144A Ser. 03-2A, Class D2, 6.723s, 2038 | | | | |
| (Cayman Islands) | | 2,157,000 | | 2,172,315 |
| CS First Boston Mortgage Securities Corp. 144A | | | | |
| Ser. 04-FR1N, Class A, 5s, 2034 | | 1,787,328 | | 1,780,625 |
| Fieldstone Mortgage Investment Corp. FRN Ser. 05-1, | | | | |
| Class M3, 4.578s, 2035 | | 859,000 | | 861,663 |
| Finance America NIM Trust 144A Ser. 04-1, Class A, | | | | |
| 5 1/4s, 2034 | | 319,822 | | 307,765 |
| First Chicago Lennar Trust 144A Ser. 97-CHL1, | | | | |
| Class D, 7.67s, 2039 | | 6,500,001 | | 6,542,657 |
| First Consumers Master Trust FRB Ser. 01-A, Class A, | | | | |
| 4.28s, 2008 | | 599,570 | | 596,572 |
| First Franklin Mortgage Loan NIM Trust 144A | | | | |
| Ser. 04-FF7A, Class A, 5s, 2034 | | 351,787 | | 351,787 |
| Ser. 04-FF10, Class N1, 4.45s, 2034 (Cayman Islands) | | 359,943 | | 359,448 |
| First Horizon Mortgage Pass-Through Trust | | | | |
| Ser. 05-AR2, Class 1A1, 4.833s, 2035 | | 4,423,833 | | 4,395,843 |
| First Plus Home Loan Trust Ser. 97-3, Class B1, 7.79s, 2023 | | 899,508 | | 900,070 |
| Fort Point CDO, Ltd. FRN Ser. 03-2A, Class A2, | | | | |
| 4.92s, 2038 | | 834,000 | | 843,424 |
| Foxe Basin, Ltd. 144A FRN Ser. 03-1A, Class A1, 4.37s, | | | | |
| 2015 (Cayman Islands) | | 2,600,000 | | 2,606,500 |
| Fremont NIM Trust 144A | | | | |
| Ser. 04-3, Class B, 7 1/2s, 2034 | | 327,392 | | 321,826 |
| Ser. 04-D, Class N2, 7 1/2s, 2034 (Cayman Islands) | | 119,741 | | 119,741 |
| Ser. 04-A, Class Note, 4 3/4s, 2034 | | 40,484 | | 40,383 |
| Ser. 04-B, Class Note, 4.703s, 2034 | | 5,132 | | 5,139 |
| Ser. 04-3, Class A, 4 1/2s, 2034 | | 902,143 | | 897,632 |
| Ser. 04-D, Class N1, 4 1/2s, 2034 (Cayman Islands) | | 673,225 | | 669,655 |
| G-Force CDO, Ltd. 144A Ser. 03-1A, Class E, 6.58s, | | | | |
| 2038 (Cayman Islands) | | 1,241,000 | | 1,247,399 |
| G-Star, Ltd. 144A FRN Ser. 02-2A, Class BFL, 6.038s, | | | | |
| 2037 (Cayman Islands) | | 417,000 | | 435,265 |
| GE Capital Credit Card Master Note Trust FRB | | | | |
| Ser. 04-2, Class C, 4.45s, 2010 | | 2,444,480 | | 2,448,467 |
| GE Corporate Aircraft Financing, LLC 144A | | | | |
| FRB Ser. 05-1A, Class C, 5.338s, 2019 | | 1,593,000 | | 1,593,000 |
| Ser. 04-1A, Class B, 4.888s, 2018 | | 382,607 | | 382,378 |
| GEBL 144A | | | | |
| Ser. 04-2, Class D, 6.72s, 2032 | | 1,050,532 | | 1,050,525 |
| Ser. 04-2, Class C, 4.82s, 2032 | | 393,950 | | 395,891 |
| GMAC Mortgage Corp. Loan Trust Ser. 04-HE5, Class A, | | | | |
| IO, 6s, 2007 | | 9,957,750 | | 591,241 |
| Goldentree Loan Opportunities II, Ltd. 144A FRN | | | | |
| Ser. 2A, Class 4, 6.979s, 2015 (Cayman Islands) | | 750,000 | | 759,375 |
49
| ASSET-BACKED SECURITIES (21.7%)* continued | | | | |
|
| | | Principal amount | | Value |
| |
| Granite Mortgages PLC | | | | |
| FRN Ser. 01-1, Class 1C, 5.574s, 2041(United Kingdom) | $ | 4,368,001 | $ | 4,423,966 |
| FRB Ser. 02-1, Class 1C, 5.474s, 2042 (United Kingdom) | | 1,140,000 | | 1,150,600 |
| FRB Ser. 02-2, Class 1C, 4.87s, 2043 (United Kingdom) | | 860,000 | | 870,950 |
| FRN Ser. 04-1, Class 1C, 4.79s, 2044 (United Kingdom) | | 2,130,000 | | 2,136,656 |
| Green Tree Financial Corp. | | | | |
| Ser. 99-5, Class A5, 7.86s, 2030 | | 19,225,000 | | 16,897,763 |
| Ser. 97-6, Class A9, 7.55s, 2029 | | 1,171,847 | | 1,224,936 |
| Ser. 97-4, Class A7, 7.36s, 2029 | | 455,537 | | 477,460 |
| Ser. 95-8, Class B1, 7.3s, 2026 | | 467,121 | | 357,089 |
| Ser. 97-6, Class A8, 7.07s, 2029 | | 444,415 | | 455,856 |
| Ser. 97-7, Class A8, 6.86s, 2029 | | 349,836 | | 360,878 |
| Ser. 99-3, Class A6, 6 1/2s, 2031 | | 1,473,000 | | 1,480,404 |
| Ser. 99-3, Class A5, 6.16s, 2031 | | 339,450 | | 341,572 |
| Greenpoint Manufactured Housing Ser. 00-3, Class IA, | | | | |
| 8.45s, 2031 | | 5,402,149 | | 5,122,977 |
| Greenpoint Mortgage Funding Trust Ser. 05-AR1, | | | | |
| Class X1, IO, 1.802s, 2045 | | 23,791,852 | | 643,125 |
| GS Auto Loan Trust 144A Ser. 04-1, Class D, 5s, 2011 | | 2,830,585 | | 2,804,827 |
| GSAMP Trust 144A | | | | |
| Ser. 04-NIM1, Class N1, 5 1/2s, 2034 | | 1,635,625 | | 1,634,971 |
| Ser. 04-SE2N, Class Note, 5 1/2s, 2034 | | 120,818 | | 120,697 |
| Ser. 04-FM1N, Class Note, 5 1/4s, 2033 | | 28,338 | | 28,295 |
| Ser. 04-HE1N, Class N1, 5s, 2034 | | 316,842 | | 316,716 |
| Ser. 05-NC1, Class N, 5s, 2035 | | 819,052 | | 817,250 |
| Ser. 04-NIM2, Class N, 4 7/8s, 2034 | | 2,171,795 | | 2,162,456 |
| Ser. 04-NIM1, Class N2, zero %, 2034 | | 1,990,000 | | 1,465,635 |
| GSMPS Mortgage Loan Trust 144A | | | | |
| Ser. 05-RP1, Class 1A3, 8s, 2035 | | 204,178 | | 216,939 |
| Ser. 05-RP2, Class 1A3, 8s, 2035 | | 2,084,119 | | 2,215,419 |
| Ser. 05-RP2, Class 1A2, 7 1/2s, 2035 | | 2,500,703 | | 2,625,238 |
| Guggenheim Structured Real Estate Funding, Ltd. 144A FRB | | | | |
| Ser. 05-1A, Class D, 5.568s, 2030 (Cayman Islands) | | 2,359,000 | | 2,351,687 |
| Guggenheim Structured Real Estate Funding, Ltd. 144A | | | | |
| FRB Ser. 05-2A, Class D, 5.588s, 2030 (Cayman Islands) | | 1,609,000 | | 1,609,000 |
| High Income Trust Securities 144A FRB Ser. 03-1A, | | | | |
| Class A, 4.233s, 2036 (Cayman Islands) | | 3,012,878 | | 2,945,088 |
| Holmes Financing PLC FRB | | | | |
| Ser. 4, Class 3C, 5.45s, 2040 (United Kingdom) | | 860,000 | | 864,567 |
| Ser. 8, Class 2C, 4.87s, 2040 (United Kingdom) | | 976,000 | | 979,660 |
| Home Equity Asset Trust 144A | | | | |
| Ser. 02-5N, Class A, 8s, 2033 | | 29,760 | | 29,760 |
| Ser. 04-5N, Class A, 5 1/4s, 2034 | | 1,413,158 | | 1,404,326 |
| Ser. 05-6N, Class A, 5 1/4s, 2035 | | 1,091,824 | | 1,086,365 |
| Ser. 04-3N, Class A, 5s, 2034 | | 216,269 | | 214,918 |
| Ser. 04-4N, Class A, 5s, 2034 | | 533,976 | | 529,971 |
| Ser. 04-7N, Class A, 4 1/2s, 2035 | | 2,949,932 | | 2,920,433 |
| Hyundai Auto Receivables Trust Ser. 04-A, Class D, 4.1s, 2011 | | 551,000 | | 537,127 |
| Lehman Manufactured Housing Ser. 98-1, Class 1, IO, 0.809s, 2028 | | 35,298,900 | | 707,325 |
50
| ASSET-BACKED SECURITIES (21.7%)* continued | | | | |
|
| | | Principal amount | | Value |
| |
| LNR CDO, Ltd. 144A FRB | | | | |
| Ser. 03-1A, Class EFL, 7.031s, 2036 (Cayman Islands) | $ | 4,150,000 | $ | 4,436,765 |
| Ser. 02-1A, Class FFL, 6.781s, 2037 (Cayman Islands) | | 6,071,000 | | 6,071,000 |
| Long Beach Asset Holdings Corp. NIM Trust 144A | | | | |
| Ser. 04-5, Class Note, 5s, 2034 | | 552,952 | | 552,952 |
| Ser. 04-2, Class N1, 4.94s, 2034 | | 89,195 | | 89,195 |
| Ser. 05-1, Class N1, 4.115s, 2035 | | 2,072,669 | | 2,072,669 |
| Long Beach Mortgage Loan Trust | | | | |
| Ser. 04-3, Class S1, IO, 4 1/2s, 2006 | | 26,987,543 | | 937,817 |
| Ser. 04-3, Class S2, IO, 4 1/2s, 2006 | | 13,494,971 | | 468,950 |
| Madison Avenue Manufactured Housing Contract | | | | |
| FRB Ser. 02-A, Class B1, 7.288s, 2032 | | 5,098,734 | | 2,549,367 |
| Ser. 02-A IO, 0.3s, 2032 | | 227,150,081 | | 2,413,470 |
| Marriott Vacation Club Owner Trust 144A | | | | |
| Ser. 05-2, Class D, 6.205s, 2027 | | 259,000 | | 258,788 |
| Ser. 04-2A, Class D, 5.389s, 2026 | | 205,035 | | 198,520 |
| Ser. 04-2A, Class C, 4.741s, 2026 | | 237,072 | | 229,376 |
| FRB Ser. 02-1A, Class A1, 4.7s, 2024 | | 3,035,129 | | 3,050,305 |
| Master Adjustable Rate Mortgages Trust | | | | |
| Ser. 04-03, Class 4AX, IO, 1.417s, 2034 | | 5,095,840 | | 117,841 |
| Ser. 05-2, Class 7AX, IO, 0.168s, 2035 | | 13,301,095 | | 41,566 |
| Master Asset Backed Securities NIM Trust 144A | | | | |
| Ser. 04-CI5, Class N2, 9s, 2034 | | 800,000 | | 800,400 |
| Ser. 04-HE1A, Class Note, 5.191s, 2034 | | 290,356 | | 290,327 |
| Ser. 04-CI5, Class N1, 4.946s, 2034 | | 145,317 | | 145,317 |
| Master Reperforming Loan Trust 144A | | | | |
| Ser. 05-1, Class 1A4, 7 1/2s, 2034 | | 2,644,210 | | 2,770,946 |
| Ser. 05-2, Class 1A3, 7 1/2s, 2035 | | 3,880,892 | | 4,069,631 |
| MBNA Credit Card Master Note Trust FRB Ser. 03-C5, | | | | |
| Class C5, 5.15s, 2010 | | 2,550,000 | | 2,609,374 |
| Merit Securities Corp. 144A FRB Ser. 11PA, Class 3A1, 4.69s, 2027 | | 8,726,755 | | 8,377,685 |
| Merrill Lynch Mortgage Investors, Inc. | | | | |
| Ser. 03-WM3N, Class N1, 8s, 2034 | | 15,828 | | 15,774 |
| Merrill Lynch Mortgage Investors, Inc. 144A | | | | |
| Ser. 03-WM1N, Class N1, 7s, 2033 | | 230,920 | | 231,497 |
| Ser. 04-FM1N, Class N1, 5s, 2035 (Cayman Islands) | | 116,899 | | 116,936 |
| Ser. 04-HE1N, Class N1, 5s, 2006 | | 179,654 | | 179,036 |
| Ser. 04-HE2N, Class N1, 5s, 2035 (Cayman Islands) | | 517,817 | | 515,713 |
| Ser. 05-WM1N, Class N1, 5s, 2035 | | 1,245,361 | | 1,245,750 |
| Ser. 04-OP1N, Class N1, 4 3/4s, 2035 (Cayman Islands) | | 254,934 | | 254,057 |
| Ser. 04-WM3N, Class N1, 4 1/2s, 2005 | | 300,055 | | 299,024 |
| Metris Master Trust FRN Ser. 04-2, Class C, 5.35s, 2010 | | 1,665,000 | | 1,675,927 |
| Metris Master Trust 144A | | | | |
| FRB Ser. 04-2, Class D, 7.281s, 2010 | | 824,000 | | 832,240 |
| FRB Ser. 01-2, Class C, 5.9s, 2009 | | 1,379,000 | | 1,382,001 |
| FRN Ser. 00-3, Class C, 5.38s, 2009 | | 25,000 | | 25,000 |
| Mid-State Trust | | | | |
| Ser. 11, Class B, 8.221s, 2038 | | 989,270 | | 989,117 |
| Ser. 10, Class B, 7.54s, 2036 | | 1,049,727 | | 915,586 |
51
| ASSET-BACKED SECURITIES (21.7%)* continued | | | | |
|
| | | Principal amount | | Value |
| |
| MMCA Automobile Trust Ser. 02-1, Class B, 5.37s, 2010 | $ | 3,780,128 | $ | 3,765,764 |
| Morgan Stanley ABS Capital I FRB Ser. 04-WMC3, | | | | |
| Class A2PT, 4.328s, 2035 | | 2,807,685 | | 2,808,525 |
| Morgan Stanley Auto Loan Trust Ser. 04-HB2, Class D, 3.82s, 2012 | | 113,037 | | 112,710 |
| Morgan Stanley Auto Loan Trust 144A | | | | |
| Ser. 04-HB1, Class D, 5 1/2s, 2011 | | 1,145,000 | | 1,141,761 |
| Ser. 04-HB2, Class E, 5s, 2012 | | 633,000 | | 617,068 |
| Morgan Stanley Dean Witter Capital I FRB | | | | |
| Ser. 01-NC4, Class B1, 6.538s, 2032 | | 428,958 | | 429,531 |
| Ser. 01-NC3, Class B1, 6.488s, 2031 | | 335,296 | | 335,296 |
| Morgan Stanley Mortgage Loan Trust | | | | |
| Ser. 05-5AR, Class 2A1, 5.465s, 2035 | | 10,534,754 | | 10,553,685 |
| Ser. 05-3AR, Class 2A2, 5.276s, 2035 | | 8,557,474 | | 8,548,112 |
| Navigator CDO, Ltd. 144A FRB Ser. 03-1A, Class A1, | | | | |
| 4.28s, 2015 (Cayman Islands) | | 1,555,000 | | 1,558,421 |
| Navistar Financial Corp. Owner Trust | | | | |
| Ser. 05-A, Class C, 4.84s, 2014 | | 812,000 | | 803,817 |
| Ser. 04-B, Class C, 3.93s, 2012 | | 712,426 | | 697,309 |
| Neon Capital, Ltd. 144A limited recourse sec. | | | | |
| notes Ser. 96, 1.458s, 2013 (Cayman Islands) (F) (g) | | 1,026,842 | | 213,077 |
| New Century Home Equity Loan Trust Ser. 03-5, | | | | |
| Class AI7, 5.15s, 2033 | | 2,365,000 | | 2,288,138 |
| New Century Mortgage Corp. NIM Trust 144A Ser. 03-B, | | | | |
| Class Note, 6 1/2s, 2033 | | 3,167 | | 3,167 |
| Newcastle CDO, Ltd. 144A FRB Ser. 3A, Class 4FL, | | | | |
| 7.231s, 2038 (Cayman Islands) | | 966,000 | | 987,735 |
| Nomura Asset Acceptance Corp. Ser. 04-R3, Class PT, | | | | |
| 9.222s, 2035 | | 1,106,420 | | 1,181,449 |
| Nomura Asset Acceptance Corp. 144A Ser. 04-R2, | | | | |
| Class PT, 9.365s, 2034 | | 574,726 | | 614,238 |
| Novastar NIM Trust 144A Ser. 04-N2, Class Note, | | | | |
| 4.458s, 2034 | | 171,737 | | 171,523 |
| Oakwood Mortgage Investors, Inc. Ser. 02-C, Class A1, | | | | |
| 5.41s, 2032 | | 6,888,453 | | 5,957,134 |
| Oakwood Mortgage Investors, Inc. 144A Ser. 01-B, | | | | |
| Class A4, 7.21s, 2030 | | 1,053,572 | | 958,567 |
| Ocean Star PLC 144A FRB | | | | |
| Ser. 04, Class D, 6.08s, 2018 (Ireland) | | 798,000 | | 820,943 |
| Ser. 05-A, Class D, 5.796s, 2012 (Ireland) | | 908,000 | | 908,000 |
| Option One Mortgage Securities Corp. NIM Trust 144A | | | | |
| Ser. 04-2A, Class N1, 4.213s, 2034 (Cayman Islands) | | 743,660 | | 743,660 |
| Origen Manufactured Housing Ser. 04-B, Class A2, 3.79s, 2017 | | 551,000 | | 536,192 |
| Park Place Securities NIM Trust 144A | | | | |
| Ser. 04-WCW2, Class D, 7.387s, 2034 (Cayman Islands) | | 1,268,000 | | 1,272,818 |
| Ser. 04-MCWN1, Class A, 4.458s, 2034 | | 169,490 | | 169,354 |
| Ser. 04-WHQ2, Class A, 4s, 2035 | | 942,337 | | 932,913 |
| Park Place Securities, Inc. FRB Ser. 04-WHQ2, | | | | |
| Class A3A, 4.388s, 2035 | | 2,220,173 | | 2,222,977 |
52
| ASSET-BACKED SECURITIES (21.7%)* continued | | | | |
|
| | | Principal amount | | Value |
| |
| People's Choice Net Interest Margin Note 144A | | | | |
| Ser. 04-2, Class A, 5s, 2034 | $ | 1,207,187 | $ | 1,209,900 |
| Ser. 04-2, Class B, 5s, 2034 | | 428,000 | | 387,768 |
| Permanent Financing PLC FRB Ser. 3, Class 3C, 4.984s, | | | | |
| 2042 (United Kingdom) | | 2,510,000 | | 2,550,366 |
| Providian Gateway Master Trust FRB Ser. 04-EA, | | | | |
| Class E, 6.768s, 2011 | | 3,450,000 | | 3,448,922 |
| Providian Gateway Master Trust 144A | | | | |
| FRB Ser. 04-AA, Class D, 5.82s, 2011 | | 1,400,000 | | 1,424,290 |
| FRB Ser. 04-BA, Class D, 5.37s, 2010 | | 850,000 | | 854,446 |
| FRB Ser. 04-EA, Class D, 4.9s, 2011 | | 2,100,000 | | 2,117,720 |
| Ser. 04-DA, Class D, 4.4s, 2011 | | 1,183,000 | | 1,149,728 |
| Renaissance Home Equity Loan Trust Ser. 03-2, | | | | |
| Class A, IO, 3s, 2005 | | 1,514,913 | | 3,658 |
| Renaissance NIM Trust 144A | | | | |
| Ser. 05-1, Class N, 4.7s, 2035 | | 698,661 | | 698,661 |
| Ser. 04-A, Class Note, 4.45s, 2034 | | 114,027 | | 113,890 |
| Residential Accredit Loans, Inc. | | | | |
| Ser. 04-QA5, Class A2, 4.984s, 2034 | | 1,091,919 | | 1,091,504 |
| Ser. 04-QA6, Class NB1, 4.967s, 2034 | | 5,491,778 | | 5,485,218 |
| Residential Asset Mortgage Products, Inc. | | | | |
| Ser. 02-SL1, Class AI3, 7s, 2032 | | 338,926 | | 337,980 |
| Ser. 04-RZ2, Class A, IO, 3 1/2s, 2006 | | 4,822,222 | | 76,786 |
| Residential Asset Securities Corp. Ser. 03-KS4, | | | | |
| Class AI, IO, 3 1/2s, 2005 | | 539,586 | | 108 |
| Residential Asset Securities Corp. 144A | | | | |
| Ser. 04-N10B, Class A1, 5s, 2034 | | 1,082,136 | | 1,077,909 |
| Ser. 04-NT, Class Note, 5s, 2034 | | 914,898 | | 906,892 |
| Ser. 04-NT12, Class Note, 4.7s, 2035 | | 455,907 | | 455,907 |
| Residential Asset Securities Corp. NIM Trust 144A | | | | |
| Ser. 05-NTR1, Class Note, 4 1/4s, 2035 | | 561,856 | | 560,715 |
| Residential Funding Mortgage Securities II | | | | |
| Ser. 03-HS2, Class AI, IO, 5 1/2s, 2005 | | 3,412,903 | | 15,527 |
| Ser. 03-HS3, Class AI, IO, 5s, 2006 | | 2,789,302 | | 40,640 |
| SAIL Net Interest Margin Notes 144A | | | | |
| Ser. 03-3, Class A, 7 3/4s, 2033 (Cayman Islands) | | 5,170 | | 4,717 |
| Ser. 03-BC2A, Class A, 7 3/4s, 2033 (Cayman Islands) | | 252,871 | | 139,079 |
| Ser. 03-4, Class A, 7 1/2s, 2033 (Cayman Islands) | | 58,093 | | 50,890 |
| Ser. 04-4A, Class B, 7 1/2s, 2034 (Cayman Islands) | | 620,000 | | 545,600 |
| Ser. 03-5, Class A, 7.35s, 2033 (Cayman Islands) | | 118,419 | | 95,920 |
| Ser. 03-12A, Class A, 7.35s, 2033 (Cayman Islands) | | 87,741 | | 87,741 |
| Ser. 03-6A, Class A, 7s, 2033 (Cayman Islands) | | 27,266 | | 27,102 |
| Ser. 03-7A, Class A, 7s, 2033 (Cayman Islands) | | 119,738 | | 102,185 |
| Ser. 03-9A, Class A, 7s, 2033 (Cayman Islands) | | 165,363 | | 95,580 |
| Ser. 03-13A, Class A, 6 3/4s, 2033 (Cayman Islands) | | 12,559 | | 12,559 |
| Ser. 04-7A, Class B, 6 3/4s, 2034 (Cayman Islands) | | 223,783 | | 187,978 |
| Ser. 04-8A, Class B, 6 3/4s, 2034 (Cayman Islands) | | 624,219 | | 609,987 |
| Ser. 04-2A, Class A, 5 1/2s, 2034 (Cayman Islands) | | 746,981 | | 709,632 |
| Ser. 04-4A, Class A, 5s, 2034 (Cayman Islands) | | 812,050 | | 812,050 |
| Ser. 04-8A, Class A, 5s, 2034 (Cayman Islands) | | 400,811 | | 400,811 |
53
| ASSET-BACKED SECURITIES (21.7%)* continued | | | | |
|
| | | Principal amount | | Value |
| |
| SAIL Net Interest Margin Notes 144A | | | | |
| Ser. 04-10A, Class A, 5s, 2034 (Cayman Islands) | $ | 1,939,669 | $ | 1,935,427 |
| Ser. 04-BN2A, Class A, 5s, 2034 (Cayman Islands) | | 315,025 | | 315,025 |
| Ser. 04-BNCA, Class A, 5s, 2034 (Cayman Islands) | | 108,376 | | 108,376 |
| Ser. 04-7A, Class A, 4 3/4s, 2034 (Cayman Islands) | | 600,713 | | 600,713 |
| Ser. 04-11A, Class A2, 4 3/4s, 2035 (Cayman Islands) | | 2,014,146 | | 2,001,054 |
| Ser. 05-2A, Class A, 4 3/4s, 2035 (Cayman Islands) | | 586,666 | | 584,494 |
| Ser. 04-5A, Class A, 4 1/2s, 2034 (Cayman Islands) | | 191,433 | | 191,433 |
| Ser. 04-AA, Class A, 4 1/2s, 2034 (Cayman Islands) | | 1,377,262 | | 1,374,441 |
| Ser. 05-1A, Class A, 4 1/4s, 2035 | | 1,982,217 | | 1,969,689 |
| Sasco Net Interest Margin Trust 144A | | | | |
| Ser. 05-NC1A, Class A, 4 3/4s, 2035 | | 2,330,855 | | 2,321,532 |
| Ser. 05-WF1A, Class A, 4 3/4s, 2035 | | 687,996 | | 685,244 |
| Sharps SP I, LLC Net Interest Margin Trust 144A | | | | |
| Ser. 03-HE1N, Class N, 6.9s, 2033 | | 69,443 | | 69,617 |
| Ser. 04-4N, Class Note, 6.65s, 2034 | | 178,592 | | 178,592 |
| Ser. 04-HS1N, Class Note, 5.92s, 2034 | | 156,427 | | 156,427 |
| Ser. 04-HE2N, Class NA, 5.43s, 2034 | | 161,270 | | 160,867 |
| Ser. 04-HE1N, Class Note, 4.94s, 2034 | | 300,517 | | 300,517 |
| Ser. 03-0P1N, Class NA, 4.45s, 2033 | | 115,847 | | 115,847 |
| Ser. 04-RM2N, Class NA, 4s, 2035 | | 923,781 | | 920,317 |
| Ser. 04-HE4N, Class NA, 3 3/4s, 2034 | | 2,128,590 | | 2,117,947 |
| South Coast Funding 144A FRB Ser. 3A, Class A2, | | | | |
| 4.96s, 2038 (Cayman Islands) | | 760,000 | | 760,304 |
| Structured Adjustable Rate Mortgage Loan Trust | | | | |
| Ser. 05-1, Class 1A1, 5.143s, 2035 | | 11,549,568 | | 11,538,241 |
| Ser. 04-14, Class 1A, 5.1s, 2034 | | 3,431,110 | | 3,429,073 |
| Ser. 04-20, Class 1A2, 5.077s, 2035 | | 7,577,815 | | 7,583,733 |
| Ser. 04-18, Class 1A1, 5.036s, 2034 | | 3,554,474 | | 3,548,271 |
| Ser. 04-16, Class 1A2, 5.004s, 2034 | | 4,149,014 | | 4,152,254 |
| Ser. 04-12, Class 1A2, 4.992s, 2034 | | 3,112,796 | | 3,119,118 |
| Ser. 04-10, Class 1A1, 4.916s, 2034 | | 2,163,814 | | 2,160,175 |
| Ser. 04-4, Class 1A1, 4.738s, 2034 | | 188,944 | | 188,644 |
| Ser. 04-8, Class 1A3, 4.697s, 2034 | | 80,410 | | 80,053 |
| Ser. 04-6, Class 1A, 4.371s, 2034 | | 9,597,140 | | 9,546,160 |
| Ser. 05-9, Class AX, IO, 0.936s, 2035 | | 63,586,572 | | 1,894,880 |
| Structured Adjustable Rate Mortgage Loan Trust 144A | | | | |
| Ser. 04-NP2, Class A, 4.388s, 2034 | | 2,386,140 | | 2,386,378 |
| Structured Asset Receivables Trust 144A FRB | | | | |
| Ser. 05-1, 4.334s, 2015 | | 6,727,123 | | 6,630,421 |
| Structured Asset Securities Corp. | | | | |
| IFB Ser. 05-10, Class 3A3, 8.697s, 2034 | | 4,479,008 | | 4,277,114 |
| IFB Ser. 05-6, Class 5A8, 5.825s, 2035 | | 5,606,248 | | 5,006,562 |
| Ser. 03-40A, Class 1A, 4.886s, 2034 | | 1,508,549 | | 1,513,711 |
| Ser. 04-8, Class 1A1, 4.697s, 2034 | | 2,070,391 | | 2,062,918 |
| Ser. 03-26A, Class 2A, 4.539s, 2033 | | 2,556,418 | | 2,561,093 |
| Structured Asset Securities Corp. 144A | | | | |
| Ser. 98-RF3, Class A, IO, 6.1s, 2028 | | 6,859,692 | | 840,312 |
| FRB Ser. 03-NP2, Class A2, 4.588s, 2032 | | 960,784 | | 960,784 |
| FRN Ser. 03-NP3, Class A1, 4.538s, 2033 | | 201,511 | | 201,531 |
54
| ASSET-BACKED SECURITIES (21.7%)* continued | | | | |
|
| | | Principal amount | | Value |
| |
| Terwin Mortgage Trust FRB Ser. 04-5HE, Class A1B, | | | | |
| 4.458s, 2035 | $ | 3,327,220 | $ | 3,332,453 |
| TIAA Real Estate CDO, Ltd. Ser. 03-1A, Class E, 8s, | | | | |
| 2038 (Cayman Islands) | | 2,298,000 | | 2,171,406 |
| Wells Fargo Home Equity Trust 144A | | | | |
| Ser. 04-2, Class N2, 8s, 2034 (Cayman Islands) | | 1,102,000 | | 1,068,940 |
| Ser. 04-1N, Class A, 5s, 2034 | | 306,778 | | 306,778 |
| Ser. 04-2, Class N1, 4.45s, 2034 (Cayman Islands) | | 1,032,707 | | 1,031,406 |
| Wells Fargo Mortgage Backed Securities Trust | | | | |
| Ser. 05-AR9, Class 1A2, 4.353s, 2035 | | 2,233,259 | | 2,188,606 |
| Ser. 05-AR12, Class 2A5, 4.321s, 2035 | | 26,265,000 | | 25,420,822 |
| Ser. 05-AR10, Class 2A18, IO, 0.61s, 2035 | | 56,771,000 | | 1,002,363 |
| WFS Financial Owner Trust | | | | |
| Ser. 05-1, Class D, 4 1/4s, 2012 | | 712,607 | | 701,411 |
| Ser. 04-3, Class D, 4.07s, 2012 | | 939,842 | | 926,543 |
| Ser. 04-4, Class D, 3.58s, 2012 | | 614,210 | | 603,678 |
| Ser. 04-1, Class D, 3.17s, 2011 | | 547,334 | | 539,039 |
| Whinstone Capital Management, Ltd. 144A FRB Ser. 1A, | | | | |
| Class B3, 4.965s, 2044 (United Kingdom) | | 2,165,000 | | 2,165,000 |
| Whole Auto Loan Trust Ser. 03-1, Class C, 3.13s, 2010 | | 315,865 | | 312,929 |
| Whole Auto Loan Trust 144A | | | | |
| Ser. 03-1, Class D, 6s, 2010 | | 987,000 | | 986,135 |
| Ser. 04-1, Class D, 5.6s, 2011 | | 4,379,523 | | 4,348,045 |
|
| Total asset-backed securities (cost $577,675,119) | | | $ | 560,747,971 |
|
| |
| |
| CORPORATE BONDS AND NOTES (12.5%)* | | | | |
|
| | | Principal amount | | Value |
| |
| Basic Materials (0.6%) | | | | |
| Alcan, Inc. notes 5s, 2015 (Canada) | $ | 660,000 | $ | 632,809 |
| Alcoa, Inc. notes 4 1/4s, 2007 | | 780,000 | | 773,136 |
| Dow Chemical Co. (The) debs. 8.55s, 2009 | | 1,850,000 | | 2,082,697 |
| Dow Chemical Co. (The) notes 6s, 2012 | | 70,000 | | 73,223 |
| Dow Chemical Co. (The) Pass Through Trust 144A | | | | |
| company guaranty 4.027s, 2009 | | 1,950,000 | | 1,862,178 |
| Georgia-Pacific Corp. notes 8 1/8s, 2011 | | 815,000 | | 884,275 |
| ICI Wilmington, Inc. company guaranty 5 5/8s, 2013 | | 1,585,000 | | 1,571,250 |
| International Paper Co. notes 6 3/4s, 2011 | | 865,000 | | 909,702 |
| Lubrizol Corp. (The) sr. notes 5 1/2s, 2014 | | 570,000 | | 561,698 |
| Newmont Mining Corp. notes 5 7/8s, 2035 | | 830,000 | | 797,273 |
| Potash Corp. of Saskatchewan notes 7 3/4s, 2011 (Canada) | | 670,000 | | 751,489 |
| Praxair, Inc. notes 6 3/8s, 2012 | | 770,000 | | 825,277 |
| Teck Cominco, Ltd. notes 6 1/8s, 2035 (Canada) | | 825,000 | | 774,384 |
| Teck Cominco, Ltd. notes 5 3/8s, 2015 (Canada) | | 150,000 | | 145,798 |
| Weyerhaeuser Co. debs. 7.95s, 2025 | | 1,310,000 | | 1,489,125 |
| Weyerhaeuser Co. debs. 7 3/8s, 2032 | | 1,180,000 | | 1,271,102 |
| Weyerhaeuser Co. notes 6 3/4s, 2012 | | 310,000 | | 328,258 |
| Weyerhaeuser Co. notes 6 1/8s, 2007 | | 760,000 | | 771,804 |
| | | | | 16,505,478 |
55
| CORPORATE BONDS AND NOTES (12.5%)* continued | | | | |
|
| | | Principal amount | | Value |
| |
| Capital Goods (0.5%) | | | | |
| Boeing Capital Corp. sr. notes 6.1s, 2011 | $ | 105,000 | $ | 110,270 |
| Boeing Capital Corp. sr. notes 5 3/4s, 2007 | | 750,000 | | 758,649 |
| Boeing Co. (The) debs. 6 7/8s, 2043 | | 990,000 | | 1,146,052 |
| Bunge, Ltd. Finance Corp. notes 5.35s, 2014 | | 1,165,000 | | 1,146,125 |
| L-3 Communications Corp. 144A sr. sub. notes 6 3/8s, 2015 | | 750,000 | | 740,625 |
| Lockheed Martin Corp. bonds 8 1/2s, 2029 (S) | | 1,680,000 | | 2,261,813 |
| Raytheon Co. debs. 7s, 2028 | | 825,000 | | 945,347 |
| Raytheon Co. debs. 6 3/4s, 2018 | | 120,000 | | 132,655 |
| Raytheon Co. debs. 6s, 2010 | | 797,000 | | 822,926 |
| Raytheon Co. notes 8.3s, 2010 | | 1,410,000 | | 1,582,319 |
| Raytheon Co. notes 4.85s, 2011 | | 1,105,000 | | 1,089,198 |
| Sealed Air Corp. 144A notes 5 5/8s, 2013 | | 1,315,000 | | 1,284,169 |
| | | | | 12,020,148 |
|
| |
| Communication Services (1.3%) | | | | |
| Ameritech Capital Funding company guaranty 6 1/4s, 2009 | | 1,135,000 | | 1,171,050 |
| AT&T Corp. sr. notes 9 3/4s, 2031 | | 825,000 | | 1,004,438 |
| AT&T Wireless Services, Inc. notes 8 1/8s, 2012 | | 345,000 | | 396,760 |
| AT&T Wireless Services, Inc. sr. notes 8 3/4s, 2031 | | 2,825,000 | | 3,683,944 |
| AT&T Wireless Services, Inc. sr. notes 7 7/8s, 2011 | | 1,110,000 | | 1,242,844 |
| Bellsouth Capital Funding notes 7 3/4s, 2010 | | 365,000 | | 400,624 |
| Citizens Communications Co. sr. notes 6 1/4s, 2013 | | 910,000 | | 862,225 |
| Deutsche Telekom International Finance BV company | | | | |
| guaranty 8 3/4s, 2030 (Germany) | | 1,725,000 | | 2,138,969 |
| France Telecom notes 8 1/2s, 2031 (France) | | 560,000 | | 731,710 |
| France Telecom notes 7 3/4s, 2011 (France) | | 1,405,000 | | 1,564,948 |
| SBC Communications, Inc. notes 4 1/8s, 2009 | | 855,000 | | 823,221 |
| Sprint Capital Corp. company guaranty 7 5/8s, 2011 | | 1,800,000 | | 1,980,763 |
| Sprint Capital Corp. company guaranty 6.9s, 2019 | | 1,565,000 | | 1,698,715 |
| Sprint Capital Corp. company guaranty 6 7/8s, 2028 | | 3,690,000 | | 3,934,289 |
| Telecom Italia Capital company guaranty 4s, 2010 (Luxembourg) | | 1,810,000 | | 1,725,817 |
| Telecom Italia Capital notes 5 1/4s, 2015 (Luxembourg) | | 1,315,000 | | 1,266,244 |
| Telecom Italia Capital SA company guaranty 5 1/4s, | | | | |
| 2013 (Luxembourg) | | 1,775,000 | | 1,735,320 |
| Telefonica Europe BV company guaranty 8 1/4s, 2030 | | | | |
| (Netherlands) | | 725,000 | | 907,236 |
| Verizon Global Funding Corp. notes 7 3/4s, 2030 (S) | | 390,000 | | 452,306 |
| Verizon New England, Inc. sr. notes 6 1/2s, 2011 | | 1,675,000 | | 1,729,183 |
| Verizon New Jersey, Inc. debs. 8s, 2022 | | 1,050,000 | | 1,179,099 |
| Verizon Virginia, Inc. debs. Ser. A, 4 5/8s, 2013 | | 1,420,000 | | 1,324,030 |
| Vodafone Group PLC notes 7 7/8s, 2030 (United Kingdom) | | 625,000 | | 770,490 |
| | | | | 32,724,225 |
|
| |
| Conglomerates (0.1%) | | | | |
| Tyco International Group SA company guaranty 7s, 2028 | | | | |
| (Luxembourg) | | 930,000 | | 1,042,964 |
| Tyco International Group SA company guaranty 6 3/4s, | | | | |
| 2011 (Luxembourg) | | 1,497,000 | | 1,592,073 |
| | | | | 2,635,037 |
56
| CORPORATE BONDS AND NOTES (12.5%)* continued | | | | |
|
| | | Principal amount | | Value |
| |
| Consumer Cyclicals (1.3%) | | | | |
| Cendant Corp. notes 6 1/4s, 2010 | $ | 1,770,000 | $ | 1,813,877 |
| Cendant Corp. sr. notes 7 3/8s, 2013 | | 2,150,000 | | 2,351,662 |
| D.R. Horton, Inc. company guaranty 8s, 2009 | | 495,000 | | 526,584 |
| D.R. Horton, Inc. sr. notes 5 7/8s, 2013 | | 1,335,000 | | 1,290,044 |
| DaimlerChrysler NA Holding Corp. company | | | | |
| guaranty 7.2s, 2009 | | 5,550,000 | | 5,857,403 |
| DaimlerChrysler NA Holding Corp. company | | | | |
| guaranty 6 1/2s, 2013 | | 400,000 | | 416,796 |
| Ford Motor Credit Corp. FRN 7.065s, 2007 | | 1,660,000 | | 1,649,613 |
| Ford Motor Credit Corp. notes 7 3/8s, 2009 | | 5,910,000 | | 5,639,174 |
| General Motors Acceptance Corp. FRN 5.1s, 2007 | | 2,160,000 | | 2,111,145 |
| General Motors Acceptance Corp. FRN Ser. MTN, 5.05s, 2007 | | 1,435,000 | | 1,415,032 |
| General Motors Acceptance Corp. FRN Ser. MTN, 4.67s, 2007 | | 2,370,000 | | 2,330,649 |
| GTECH Holdings Corp. notes 4 3/4s, 2010 | | 870,000 | | 780,841 |
| Harrah's Operating Co., Inc. 144A bonds 5 3/4s, 2017 | | 945,000 | | 894,269 |
| Hilton Hotels Corp. notes 8 1/4s, 2011 | | 1,790,000 | | 1,926,880 |
| JC Penney Co., Inc. debs. 7 1/8s, 2023 | | 990,000 | | 1,043,760 |
| May Department Stores Co. (The) notes 5 3/4s, 2014 | | 440,000 | | 439,659 |
| Park Place Entertainment Corp. sr. notes 7s, 2013 | | 1,455,000 | | 1,546,863 |
| Wal-Mart Stores, Inc. sr. notes 5.45s, 2006 | | 885,000 | | 890,374 |
| | | | | 32,924,625 |
|
| |
| Consumer Staples (1.4%) | | | | |
| Archer Daniels Midland Co. notes 5 3/8s, 2035 | | 1,650,000 | | 1,546,492 |
| Chancellor Media Corp. company guaranty 8s, 2008 | | 450,000 | | 479,408 |
| Clear Channel Communications, Inc. sr. notes 5 3/4s, 2013 | | 145,000 | | 140,270 |
| Comcast Corp. company guaranty 4.95s, 2016 | | 845,000 | | 784,860 |
| Cox Communications, Inc. notes 7 3/4s, 2010 | | 445,000 | | 483,563 |
| Cox Communications, Inc. notes 6 3/4s, 2011 | | 1,300,000 | | 1,364,390 |
| Cox Enterprises, Inc. 144A notes 7 7/8s, 2010 | | 1,450,000 | | 1,579,041 |
| CVS Corp. 144A pass-through certificates 6.117s, 2013 | | 999,314 | | 1,032,472 |
| Delhaize America, Inc. company guaranty 8 1/8s, 2011 | | 1,945,000 | | 2,077,186 |
| Diageo PLC company guaranty 8s, 2022 | | 1,110,000 | | 1,375,740 |
| Jones Intercable, Inc. sr. notes 7 5/8s, 2008 | | 4,795,000 | | 5,061,434 |
| Kraft Foods, Inc. notes 6 1/4s, 2012 | | 2,870,000 | | 3,016,763 |
| Miller Brewing Co. 144A notes 5 1/2s, 2013 | | 2,160,000 | | 2,156,720 |
| News America Holdings, Inc. debs. 7 3/4s, 2045 | | 710,000 | | 801,248 |
| News America, Inc. debs. 7 1/4s, 2018 | | 975,000 | | 1,078,834 |
| Supervalu, Inc. notes 7 7/8s, 2009 | | 930,000 | | 999,794 |
| TCI Communications, Inc. debs. 8 3/4s, 2015 | | 2,290,000 | | 2,763,384 |
| TCI Communications, Inc. debs. 7 7/8s, 2013 | | 235,000 | | 264,810 |
| Time Warner Entertainment Co., LP debs. 8 3/8s, 2023 | | 960,000 | | 1,128,391 |
| Time Warner, Inc. company guaranty 6.95s, 2028 | | 565,000 | | 592,197 |
| Time Warner, Inc. debs. 9.15s, 2023 | | 1,180,000 | | 1,487,611 |
| Time Warner, Inc. debs. 9 1/8s, 2013 | | 3,645,000 | | 4,352,166 |
| Turner Broadcasting System, Inc. sr. notes 8 3/8s, 2013 | | 685,000 | | 792,364 |
| | | | | 35,359,138 |
57
| CORPORATE BONDS AND NOTES (12.5%)* continued | | | | |
|
| | | Principal amount | | Value |
| |
| Energy (0.3%) | | | | |
| Amerada Hess Corp. bonds 7 7/8s, 2029 | $ | 920,000 | $ | 1,093,866 |
| Buckeye Partners, LP notes 5.3s, 2014 | | 735,000 | | 720,631 |
| Burlington Resources Finance Co. company | | | | |
| guaranty 7.2s, 2031 (Canada) | | 615,000 | | 738,590 |
| Enbridge Energy Partners, LP sr. notes 5.35s, 2014 | | 735,000 | | 718,948 |
| Forest Oil Corp. sr. notes 8s, 2011 | | 755,000 | | 824,838 |
| Motiva Enterprises, LLC 144A sr. notes 5.2s, 2012 | | 1,345,000 | | 1,341,628 |
| Premcor Refining Group, Inc. sr. notes 7 1/2s, 2015 | | 435,000 | | 463,275 |
| Sunoco, Inc. notes 4 7/8s, 2014 | | 770,000 | | 742,642 |
| Tosco Corp. notes 8 1/8s, 2030 | | 205,000 | | 271,230 |
| Valero Energy Corp. sr. unsecd. notes 7 1/2s, 2032 (S) | | 940,000 | | 1,108,881 |
| | | | | 8,024,529 |
|
| |
| Financial (4.9%) | | | | |
| Allfirst Financial, Inc. sub. notes 7.2s, 2007 | | 1,695,000 | | 1,752,947 |
| Associates First Capital Corp. debs. 6.95s, 2018 | | 4,265,000 | | 4,872,315 |
| AXA Financial, Inc. sr. notes 7 3/4s, 2010 | | 2,070,000 | | 2,289,629 |
| Bank of America Corp. notes 4 3/4s, 2015 (S) | | 1,060,000 | | 1,016,959 |
| Bank of America Corp. sub. notes 7 3/4s, 2015 | | 2,415,000 | | 2,837,444 |
| Bank of America Corp. sub. notes 7.4s, 2011 | | 5,540,000 | | 6,115,711 |
| Bank of New York Co., Inc. (The) sr. sub. notes FRN 3.4s, 2013 | | 735,000 | | 707,647 |
| Bank One Corp. sub. debs. 7 5/8s, 2026 | | 4,040,000 | | 4,838,655 |
| Bank One Corp. sub. notes 5 1/4s, 2013 | | 515,000 | | 511,288 |
| Bank United Corp. notes Ser. A, 8s, 2009 | | 4,705,000 | | 5,133,936 |
| Block Financial Corp. notes 5 1/8s, 2014 | | 980,000 | | 936,143 |
| Bosphorus Financial Services, Ltd. 144A sec. FRN | | | | |
| 6.132s, 2012 (Cayman Islands) | | 3,675,000 | | 3,619,500 |
| Capital One Bank notes 6 1/2s, 2013 | | 840,000 | | 880,033 |
| CenterPoint Properties Trust notes Ser. MTN, 4 3/4s, 2010 (R) | | 1,035,000 | | 1,002,178 |
| CIT Group, Inc. sr. notes 7 3/4s, 2012 | | 155,000 | | 175,117 |
| CIT Group, Inc. sr. notes 5s, 2015 | | 690,000 | | 663,589 |
| CIT Group, Inc. sr. notes 5s, 2014 | | 4,825,000 | | 4,688,520 |
| Citigroup, Inc. sub. notes 5s, 2014 | | 4,379,000 | | 4,288,307 |
| Colonial Properties Trust notes 6 1/4s, 2014 (R) | | 870,000 | | 886,614 |
| Credit Suisse First Boston USA, Inc. notes 4 7/8s, 2015 | | 1,040,000 | | 997,497 |
| Developers Diversified Realty Corp. unsecd. notes 5 3/8s, 2012 (R) | | 485,000 | | 475,540 |
| Equity One, Inc. company guaranty 3 7/8s, 2009 (R) | | 2,400,000 | | 2,270,570 |
| ERP Operating, LP notes 6.584s, 2015 | | 735,000 | | 790,305 |
| FleetBoston Financial Corp. sub. notes 7 3/8s, 2009 | | 65,000 | | 70,496 |
| Franchise Finance Corp. of America sr. notes 8 3/4s, 2010 (R) | | 2,670,000 | | 3,098,068 |
| Fund American Cos., Inc. notes 5 7/8s, 2013 (S) | | 2,165,000 | | 2,143,214 |
| Goldman Sachs Group, Inc. (The) notes 5 1/2s, 2014 | | 725,000 | | 728,382 |
| Goldman Sachs Group, Inc. (The) notes 5 1/8s, 2015 | | 2,315,000 | | 2,257,887 |
| Goldman Sachs Group, Inc. (The) notes 4 3/4s, 2013 | | 2,020,000 | | 1,938,903 |
| Greenpoint Capital Trust I company guaranty 9.1s, 2027 | | 790,000 | | 860,582 |
| Hartford Financial Services Group, Inc. (The) sr. notes 7.9s, 2010 | | 1,300,000 | | 1,444,396 |
| Heritage Property Investment Trust company guaranty 5 1/8s, 2014 (R) | | 985,000 | | 939,723 |
| Hospitality Properties Trust notes 6 3/4s, 2013 (R) | | 2,585,000 | | 2,731,037 |
| Household Finance Corp. notes 8s, 2010 | | 855,000 | | 954,498 |
58
| CORPORATE BONDS AND NOTES (12.5%)* continued | | | | |
|
| | | Principal amount | | Value |
| |
| Financial continued | | | | |
| Household Finance Corp. notes 7s, 2012 | $ | 5,330,000 | $ | 5,818,377 |
| HRPT Properties Trust bonds 5 3/4s, 2014 (R) | | 710,000 | | 710,263 |
| HRPT Properties Trust notes 6 1/4s, 2016 (R) | | 660,000 | | 678,945 |
| HSBC Finance Corp. notes 5 1/4s, 2015 | | 5,080,000 | | 5,019,330 |
| International Lease Finance Corp. FRN Ser. MTNP, 4.55s, 2010 | | 2,530,000 | | 2,539,472 |
| International Lease Finance Corp. notes 4 3/4s, 2012 | | 3,270,000 | | 3,155,380 |
| International Lease Finance Corp. unsecd. notes 4 7/8s, 2010 | | 1,420,000 | | 1,397,281 |
| iStar Financial, Inc. sr. notes 8 3/4s, 2008 (R) | | 305,000 | | 331,350 |
| iStar Financial, Inc. sr. notes 6s, 2010 (R) | | 1,395,000 | | 1,409,829 |
| John Hancock Global Funding II 144A notes 7.9s, 2010 | | 1,090,000 | | 1,224,423 |
| JPMorgan Chase & Co. sub. notes 5 1/8s, 2014 | | 2,195,000 | | 2,148,231 |
| Kimco Realty Corp. notes Ser. MTNC, 5.19s, 2013 (R) | | 655,000 | | 646,721 |
| Lehman Brothers Holdings, Inc. notes 6 5/8s, 2012 | | 110,000 | | 118,180 |
| Lehman Brothers Holdings, Inc. notes Ser. G, 4.8s, 2014 | | 1,275,000 | | 1,233,366 |
| Liberty Mutual Group 144A notes 6 1/2s, 2035 | | 3,010,000 | | 2,795,047 |
| Loews Corp. notes 5 1/4s, 2016 | | 630,000 | | 609,906 |
| MetLife, Inc. notes 5.7s, 2035 | | 1,085,000 | | 1,047,571 |
| MetLife, Inc. notes 5s, 2015 | | 1,615,000 | | 1,569,307 |
| Morgan Stanley Dean Witter & Co. sr. notes 6 3/4s, 2011 | | 1,060,000 | | 1,136,575 |
| Nationwide Financial Services, Inc. notes 5 5/8s, 2015 | | 815,000 | | 821,491 |
| Nuveen Investments, Inc. sr. notes 5 1/2s, 2015 | | 640,000 | | 621,466 |
| Nuveen Investments, Inc. sr. notes 5s, 2010 | | 640,000 | | 626,984 |
| OneAmerica Financial Partners, Inc. 144A bonds 7s, 2033 | | 965,000 | | 1,058,658 |
| PNC Bank NA notes 4 7/8s, 2017 | | 1,300,000 | | 1,232,984 |
| Principal Life Global Funding I 144A sec. notes 5 1/4s, 2013 | | 2,660,000 | | 2,674,295 |
| Protective Life Corp. notes 4.3s, 2013 | | 1,435,000 | | 1,352,463 |
| Prudential Holdings, LLC 144A bonds 8.695s, 2023 | | 1,555,000 | | 1,948,042 |
| Rouse Co. (The) notes 7.2s, 2012 (R) | | 1,305,000 | | 1,359,479 |
| Simon Property Group, LP notes 5 5/8s, 2014 (R) | | 870,000 | | 872,894 |
| Sovereign Bancorp, Inc. 144A sr. notes 4.8s, 2010 | | 920,000 | | 903,748 |
| Suncorp-Metway, Ltd. 144A notes FRN 3 1/2s, 2013 (Australia) | | 2,080,000 | | 2,008,533 |
| UBS AG/Jersey Branch FRN 6.89s, 2008 (Jersey) | | 5,000,000 | | 5,175,000 |
| Wachovia Bank NA sub. notes 4 7/8s, 2015 | | 3,545,000 | | 3,435,084 |
| | | | | 126,598,305 |
|
| |
| Health Care (0.2%) | | | | |
| Bayer Corp. 144A FRB 6.2s, 2008 | | 1,330,000 | | 1,361,893 |
| Hospira, Inc. notes 5.9s, 2014 | | 530,000 | | 541,803 |
| WellPoint, Inc. notes 5s, 2014 | | 685,000 | | 666,876 |
| WellPoint, Inc. notes 4 1/4s, 2009 | | 685,000 | | 664,332 |
| Wyeth notes 5 1/2s, 2014 | | 3,175,000 | | 3,197,711 |
| | | | | 6,432,615 |
|
| |
| Technology (0.1%) | | | | |
| Avnet, Inc. notes 6s, 2015 | | 960,000 | | 924,720 |
| Computer Associates International, Inc. 144A sr. notes 5 5/8s, 2014 | | 1,210,000 | | 1,169,503 |
| Motorola, Inc. notes 7 5/8s, 2010 | | 101,000 | | 112,681 |
| Motorola, Inc. notes 4.608s, 2007 | | 960,000 | | 955,218 |
| | | | | 3,162,122 |
59
| CORPORATE BONDS AND NOTES (12.5%)* continued | | | | |
|
| | | Principal amount | | Value |
| |
| Transportation (0.2%) | | | | |
| Continental Airlines, Inc. pass-through certificates | | | | |
| Ser. 97-4A, 6.9s, 2018 | $ | 2,168,015 | $ | 2,127,365 |
| Continental Airlines, Inc. pass-through certificates | | | | |
| Ser. 98-1A, 6.648s, 2017 | | 595,399 | | 576,048 |
| CSX Corp. notes 6 3/4s, 2011 | | 1,275,000 | | 1,364,888 |
| Norfolk Southern Corp. sr. notes 6 3/4s, 2011 | | 155,000 | | 166,328 |
| Union Pacific Corp. 144A pass-through certificates 5.214s, 2014 | | 470,000 | | 465,822 |
| | | | | 4,700,451 |
|
| |
| Utilities & Power (1.6%) | | | | |
| AEP Texas North Co. sr. notes Ser. B, 5 1/2s, 2013 | | 840,000 | | 842,993 |
| Appalachian Power Co. sr. notes 5.8s, 2035 | | 960,000 | | 918,648 |
| Atmos Energy Corp. notes 4.95s, 2014 | | 1,115,000 | | 1,067,592 |
| Beaver Valley II Funding debs. 9s, 2017 | | 1,220,000 | | 1,408,649 |
| Boardwalk Pipelines, LLC notes 5 1/2s, 2017 | | 440,000 | | 430,485 |
| CenterPoint Energy Resources Corp. notes 7 3/4s, 2011 | | 1,735,000 | | 1,916,103 |
| CenterPoint Energy Resources Corp. sr. notes Ser. B, 7 7/8s, 2013 | | 220,000 | | 248,453 |
| Cleveland Electric Illuminating Co. (The) | | | | |
| sr. notes Ser. D, 7.88s, 2017 | | 670,000 | | 801,552 |
| Consolidated Natural Gas Co. sr. notes 5s, 2014 | | 650,000 | | 629,288 |
| Consumers Energy Co. 1st mtge. 5.65s, 2020 | | 290,000 | | 285,522 |
| Consumers Energy Co. 1st mtge. 5s, 2012 | | 1,525,000 | | 1,495,357 |
| Consumers Energy Co. 1st mtge. Ser. B, 5 3/8s, 2013 | | 1,450,000 | | 1,442,579 |
| Dayton Power & Light Co. (The) 1st mtge. 5 1/8s, 2013 | | 1,035,000 | | 1,018,191 |
| Duke Energy Field Services, LLC 144A notes 5 3/8s, 2015 | | 325,000 | | 318,040 |
| Entergy Gulf States, Inc. 1st mtge. 3.6s, 2008 | | 700,000 | | 671,510 |
| FirstEnergy Corp. notes Ser. B, 6.45s, 2011 | | 735,000 | | 773,152 |
| Indianapolis Power & Light 144A 1st mtge. 6.3s, 2013 | | 680,000 | | 711,026 |
| Ipalco Enterprises, Inc. sec. notes 8 3/8s, 2008 | | 525,000 | | 546,000 |
| Kansas Gas & Electric 144A bonds 5.647s, 2021 | | 375,000 | | 360,356 |
| Kinder Morgan, Inc. sr. notes 6 1/2s, 2012 | | 985,000 | | 1,042,481 |
| MidAmerican Energy Holdings Co. sr. notes 5 7/8s, 2012 | | 1,665,000 | | 1,706,262 |
| Monongahela Power Co. 1st mtge. 5s, 2006 | | 2,940,000 | | 2,940,229 |
| National Fuel Gas Co. notes 5 1/4s, 2013 | | 980,000 | | 968,990 |
| Nevada Power Co. 2nd mtge. 9s, 2013 | | 726,000 | | 800,546 |
| Nevada Power Co. general ref. mtge. Ser. L, 5 7/8s 2015 | | 370,000 | | 362,917 |
| NiSource Finance Corp. company guaranty 5.45s, 2020 | | 1,655,000 | | 1,582,814 |
| NiSource Finance Corp. company guaranty 5 1/4s, 2017 | | 180,000 | | 172,174 |
| Oncor Electric Delivery Co. sec. notes 7 1/4s, 2033 | | 490,000 | | 556,799 |
| Oncor Electric Delivery Co. sec. notes 6 3/8s, 2012 | | 2,405,000 | | 2,521,424 |
| Pacific Gas & Electric Co. 1st mtge. 4.8s, 2014 | | 715,000 | | 689,134 |
| PacifiCorp Sinking Fund 1st mtge. 5.45s, 2013 | | 1,570,000 | | 1,594,060 |
| Pepco Holdings, Inc. notes 5 1/2s, 2007 | | 1,080,000 | | 1,088,905 |
| Power Receivable Finance, LLC 144A sr. notes 6.29s, 2012 (S) | | 1,604,727 | | 1,630,226 |
| PP&L Capital Funding, Inc. company guaranty Ser. D, 8 3/8s, 2007 | | 790,000 | | 830,809 |
| Public Service Co. of Colorado sr. notes Ser. A, 6 7/8s, 2009 | | 1,605,000 | | 1,697,194 |
| Public Service Co. of New Mexico sr. notes 4.4s, 2008 | | 785,000 | | 769,211 |
| Public Service Electric & Gas Co. 1st mtge. 6 3/8s, 2008 | | 1,130,000 | | 1,164,438 |
| Southern California Edison Co. 1st mtge. 5s, 2016 | | 470,000 | | 458,638 |
60
| CORPORATE BONDS AND NOTES (12.5%)* continued | | | | | |
|
| | | | Principal amount | | Value |
| Utilities & Power continued | | | | | |
| Southern California Edison Co. 1st mtge. 5s, 2014 | | $ | 1,285,000 | $ | 1,265,480 |
| Tampa Electric Co. notes 6 7/8s, 2012 | | | 875,000 | | 953,091 |
| Westar Energy, Inc. 1st mtge. 5.1s, 2020 | | | 1,015,000 | | 949,178 |
| York Power Funding 144A notes 12s, 2007 | | | | | |
| (Cayman Islands) (In default) (F) † | | | 212,310 | | 17,707 |
| | | | | | 41,648,203 |
|
| Total corporate bonds and notes (cost $324,349,206) | | | | $ | 322,734,876 |
|
| |
| MUNICIPAL BONDS AND NOTES (0.1%)* | | | | | |
|
| | Rating ** | | Principal amount | | Value |
| NJ State Tpk. Auth. Rev. Bonds, Ser. B, AMBAC | | | | | |
| 4.252s, 1/1/16 | Aaa | $ | 1,705,000 | $ | 1,605,581 |
| 4.252s, 1/1/16 (Prerefunded) | Aaa | | 90,000 | | 84,213 |
|
| Total municipal bonds and notes (cost $1,794,956) | | | | $ | 1,689,794 |
|
| |
| PURCHASED OPTIONS OUTSTANDING (0.1%)* | | | | | |
|
| | Expiration date/ | | Contract | |
| | strike price | | amount | Value |
|
| Option on an interest rate swap with Citibank | | | | | |
| for the right to pay a fixed rate of 4.885% versus | | | | | |
| the three month LIBOR maturing on | | | | | |
| January 11, 2016. | Jan 06 / $4.89 | $ | 48,175,000 | $ | 1,058,887 |
| Option on an interest rate swap with Citibank | | | | | |
| for th right to pay a fixed rate of 4.885% versus | | | | | |
| the three month LIBOR maturing on | | | | | |
| January 11, 2016. | Jan 06 / $4.89 | | 48,175,000 | | 262,554 |
|
| Total purchased options outstanding (cost $1,281,456) | | | $ | 1,321,441 |
|
| |
| UNITS (--%)* (cost $834,204) | | | | | |
|
| | | | Units | | Value |
| Cendant Corp. unit 4.89s, 2006 | | | 13,100 | $ | 652,766 |
61
| SHORT-TERM INVESTMENTS (10.8%)* | | | | |
|
| | Principal amount/shares | | Value |
| U.S. Treasury Bill zero %, November 3, 2005 # | $ | 4,085,000 | $ | 4,084,297 |
| Short-term investments held as collateral for loaned | | | | |
| securities with yields ranging from 3.77% to 4.21% | | | | |
| and due dates ranging from November 1, 2005 | | | | |
| to December 9, 2005 (d) | | 6,394,692 | | 6,393,090 |
| Putnam Prime Money Market Fund (e) | | 266,913,681 | | 266,913,681 |
|
| Total short-term investments (cost $277,391,068) | | | $ | 277,391,068 |
|
| |
| TOTAL INVESTMENTS | | | | |
| Total investments (cost $2,936,159,155) | | | $ | 2,884,652,390 |
* Percentages indicated are based on net assets of $2,578,302,817.
** The Moody's or Standard & Poor's ratings indicated are believed to be the most recent ratings available at October 31, 2005 for the securities listed. Ratings are generally ascribed to securities at the time of issuance. While the agencies may from time to time revise such ratings, they undertake no obligation to do so, and the ratings do not necessarily represent what the agencies would ascribe to these securities at October 31, 2005. Securities rated by Putnam are indicated by “/P”.
Ratings are not covered by the Report of Independent Registered Public Accounting Firm. Security ratings are defined in the Statement of Additional Information.
† Non-income-producing security.
(S) Securities on loan, in part or in entirety, at October 31, 2005.
# This security was pledged and segregated with the custodian to cover margin requirements for futures contracts at October 31, 2005.
(R) Real Estate Investment Trust.
(d) See Note 1 to the financial statements.
(e) See Note 5 to the financial statements regarding investments in Putnam Prime Money Market Fund.
(F) Security is valued at fair value following procedures approved by the Trustees.
(g) The notes are secured by debt and equity securities and equity participation agreements held by Neon Capital, Ltd.
At October 31, 2005, liquid assets totaling $818,356,262 have been designated as collateral for open forward commitments, swap contracts, written options and futures contracts.
144A after the name of a security represents those exempt from registration under Rule 144A of the Securities Act of 1933. These securities may be resold in transactions exempt from registration, normally to qualified institutional buyers.
TBA after the name of a security represents to be announced securities (Note 1).
The rates shown on Floating Rate Bonds (FRB) and Floating Rate Notes (FRN) are the current interest rates at October 31, 2005.
Inverse Floating Rate Bonds (IFB) are securities that pay interest rates that vary inversely to changes in the market interest rates. As interest rates rise, inverse floaters produce less current income. The interest rates shown are the current interest rates at October 31, 2005.
AMBAC represents AMBAC Indemnity Corporation.
62
| FUTURES CONTRACTS OUTSTANDING at 10/31/05 | | | |
|
| | | | | Unrealized |
| | Number of | | Expiration | appreciation/ |
| | contracts | Value | date | (depreciation) |
|
| Euro 90 day (Long) | 20 | $ 4,776,000 | Dec-05 | $ (35,652) |
| Euro 90 day (Long) | 11 | 2,619,788 | Mar-06 | (16,678) |
| U.S. Treasury Bond 20 yr (Long) | 1,903 | 213,076,531 | Dec-05 | (8,555,928) |
| U.S. Treasury Note 2 yr (Short) | 538 | 110,399,281 | Dec-05 | 743,495 |
| U.S. Treasury Note 5 yr (Long) | 1,768 | 187,214,625 | Dec-05 | (295,839) |
| U.S. Treasury Note 10 yr (Short) | 1,021 | 110,730,641 | Dec-05 | 2,361,627 |
|
| Total | | | | $(5,798,975) |
|
| |
| |
| WRITTEN OPTIONS OUTSTANDING at 10/31/05 (premium received $8,781,546) | |
|
| | | Contract | Expiration date/ | |
| | | amount | strike price | Value |
|
| Option on an interest rate swap with JPMorgan | | | | |
| Chase Bank, N.A. for the right to pay a fixed rate | | | | |
| of 4.55% versus the three month LIBOR maturing | | | | |
| on July 5, 2017. | | $113,530,000 | Jul 07 / $4.55 | $1,868,999 |
| Option on an interest rate swap with JPMorgan | | | | |
| Chase Bank, N.A. for the right to pay a fixed rate | | | | |
| of 4.55% versus the three month LIBOR maturing | | | | |
| on July 5, 2017. | | 113,530,000 | Jul 07 / $4.55 | 7,149,915 |
|
| | | | | $9,018,914 |
|
| |
| |
| TBA SALE COMMITMENTS OUTSTANDING at 10/31/05 (proceeds receivable $432,371,023) | |
|
| | | Principal | Settlement | |
| | | amount | date | Value |
|
| FNMA, 6s, November 1, 2020 | | $ 3,700,000 | 11/17/05 | $ 3,783,250 |
| FNMA, 5 1/2s, November 1, 2035 | | 370,300,000 | 11/14/05 | 365,237,295 |
| FNMA, 5s, November 1, 2035 | | 1,900,000 | 11/14/05 | 1,828,156 |
| FNMA, 4 1/2s, November 1, 2020 | | 59,700,000 | 11/17/05 | 57,727,100 |
| GNMA, 6 1/2s, November 1, 2035 | | 1,800,000 | 11/21/05 | 1,867,219 |
|
| Total | | | | $430,443,020 |
63
| INTEREST RATE SWAP CONTRACTS OUTSTANDING at 10/31/05 | | |
|
| | | | Unrealized |
| | Notional | Termination | appreciation/ |
| | amount | date | (depreciation) |
|
| Agreement with Bank of America, N.A. dated January 12, | | | |
| 2005 to receive semi-annually the notional amount | | | |
| multiplied by 4.106% and pay quarterly the notional | | | |
| amount multiplied by the three month USD-LIBOR. | $134,600,000 | 1/14/10 | $(2,691,482) |
| Agreement with Bank of America, N.A. dated March 31, | | | |
| 2005 to pay semi-annually the notional amount multi- | | | |
| plied by 4.6375% and receive quarterly the notional | | | |
| amount multiplied by the three month USD-LIBOR. | 106,100,000 | 4/6/10 | 1,095,657 |
| Agreement with Bank of America, N.A. dated January 26, | | | |
| 2004 to receive semi-annually the notional amount | | | |
| multiplied by 5.2125% and pay quarterly the notional | | | |
| amount multiplied by the three month USD-LIBOR. | 91,608,000 | 1/28/24 | 1,002,239 |
| Agreement with Bank of America, N.A. dated | | | |
| December 20, 2004 to pay semi-annually the notional | | | |
| amount multiplied by 3.965% and receive quarterly the | | | |
| notional amount multiplied by the three month | | | |
| USD-LIBOR. | 70,599,000 | 12/22/09 | 1,751,449 |
| Agreement with Bank of America, N.A. dated | | | |
| October 19, 2005 to pay semi-annually the notional | | | |
| amount multiplied by 4.943% and receive quarterly the | | | |
| notional amount multiplied by the three month | | | |
| USD-LIBOR. | 61,500,000 | 10/21/15 | 599,001 |
| Agreement with Bank of America, N.A. dated June 15, | | | |
| 2005 to pay semi-annually the notional amount multi- | | | |
| plied by 4.555% and receive quarterly the notional | | | |
| amount multiplied by the three month USD-LIBOR. | 25,430,000 | 6/17/15 | 656,123 |
| Agreement with Bank of America, N.A. dated June 21, | | | |
| 2005 to pay semi-annually the notional amount multi- | | | |
| plied by 4.466% and receive quarterly the notional | | | |
| amount multiplied by the three month USD-LIBOR. | 9,200,000 | 6/23/15 | 307,398 |
| Agreement with Bank of America, N.A. dated | | | |
| December 2, 2003 to pay semi-annually the notional | | | |
| amount multiplied by 2.444% and receive quarterly the | | | |
| notional amount multiplied by the three month | | | |
| USD-LIBOR. | 8,767,000 | 12/5/05 | (24,012) |
| Agreement with Bank of America, N.A. dated | | | |
| December 12, 2003 to pay semi-annually the notional | | | |
| amount multiplied by 2.1125% and receive quarterly | | | |
| the notional amount multiplied by the three month | | | |
| USD-LIBOR. | 5,687,000 | 12/16/05 | (4,351) |
| Agreement with Bank of America, N.A. dated June 22, | | | |
| 2005 to pay semi-annually the notional amount multi- | | | |
| plied by 4.39% and receive quarterly the notional | | | |
| amount multiplied by the three month USD-LIBOR. | 4,590,000 | 6/24/15 | 179,938 |
64
| INTEREST RATE SWAP CONTRACTS OUTSTANDING at 10/31/05 continued | | |
|
| | | | Unrealized |
| | Notional | Termination | appreciation/ |
| | amount | date | (depreciation) |
|
| Agreement with Bank of America, N.A. dated June 21, | | | |
| 2005 to pay semi-annually the notional amount multi- | | | |
| plied by 4.45% and receive quarterly the notional | | | |
| amount multiplied by the three month USD-LIBOR. | $ 3,830,000 | 6/23/15 | $ 132,838 |
| Agreement with Bank of America, N.A. dated | | | |
| August 30, 2005 to receive semi-annually the notional | | | |
| amount multiplied by 4.53125% and pay quarterly the | | | |
| notional amount multiplied by the three month | | | |
| USD-LIBOR-BBA. | 1,000,000 | 9/1/15 | (40,318) |
| Agreement with Credit Suisse First Boston | | | |
| International dated October 5, 2004 to receive semi- | | | |
| annually the notional amount multiplied by 4.624% and | | | |
| pay quarterly the notional amount multiplied by the | | | |
| three month USD-LIBOR. | 55,240,000 | 10/7/14 | (1,626,258) |
| Agreement with Credit Suisse First Boston | | | |
| International dated July 7, 2004 to receive semi-annu- | | | |
| ally the notional amount multiplied by 2.931% and pay | | | |
| quarterly the notional amount multiplied by the three | | | |
| month USD-LIBOR. | 34,147,400 | 7/9/06 | (154,641) |
| Agreement with Deutsche Bank AG dated July 31, | | | |
| 2002 to pay quarterly the notional amount multiplied | | | |
| by the three month USD-LIBOR-BBA and receive | | | |
| semi-annually the notional amount multiplied by 5.7756%. | 54,861,045 | 8/2/22 | 4,359,022 |
| Agreement with Deutsche Bank AG dated July 31, | | | |
| 2002 to receive semi-annually the notional amount | | | |
| multiplied by the three month USD-LIBOR-BBA and | | | |
| pay quarterly the notional amount multiplied by 5.86%. | 61,565,504 | 8/2/32 | (6,150,052) |
| Agreement with Goldman Sachs Capital Markets, L.P. | | | |
| dated August 8, 2002 to receive quarterly the notional | | | |
| amount multiplied by the three month USD-LIBOR- | | | |
| BBA and pay semi-annually the notional amount | | | |
| multiplied by 5.689%. | 61,565,504 | 8/12/32 | (3,904,398) |
| Agreement with Goldman Sachs Capital Markets, L.P. | | | |
| dated August 8, 2002 to pay quarterly the notional | | | |
| amount multiplied by the three month USD-LIBOR- | | | |
| BBA and receive semi-annually the notional amount | | | |
| multiplied by 5.601%. | 54,861,045 | 8/12/22 | 2,605,888 |
| Agreement with JPMorgan Chase Bank, N.A. dated | | | |
| June 27, 2005 to receive semi-annually the notional | | | |
| amount multiplied by 4.296% and pay quarterly the | | | |
| notional amount multiplied by the three month | | | |
| USD-LIBOR. | 80,000,000 | 6/29/15 | (3,746,493) |
| Agreement with JPMorgan Chase Bank, N.A. dated | | | |
| March 3, 2005 to receive semi-annually the notional | | | |
| amount multiplied by 4.798% and pay quarterly the | | | |
| notional amount multiplied by the three month | | | |
| USD-LIBOR. | 58,900,000 | 3/7/15 | (1,013,208) |
65
| INTEREST RATE SWAP CONTRACTS OUTSTANDING at 10/31/05 continued | | |
|
| | | | Unrealized |
| | Notional | Termination | appreciation/ |
| | amount | date | (depreciation) |
|
| Agreement with JPMorgan Chase Bank, N.A. dated | | | |
| October 19, 2005 to pay semi-annually the notional | | | |
| amount multiplied by 4.916% and receive quarterly the | | | |
| notional amount multiplied by the three month LIBOR. | $ 55,400,000 | 10/21/15 | $ 647,261 |
| Agreement with JPMorgan Chase Bank, N.A. dated | | | |
| June 14, 2005 to pay semi-annually the notional | | | |
| amount multiplied by 4.538% and receive quarterly the | | | |
| notional amount multiplied by the three month | | | |
| USD-LIBOR. | 22,120,000 | 6/16/15 | 602,796 |
| Agreement with JPMorgan Chase Bank, N.A. dated | | | |
| July 29, 2005 to pay semi-annually the notional amount | | | |
| multiplied by 4.6757% and receive quarterly the | | | |
| notional amount multiplied by the three month | | | |
| USD-LIBOR. | 15,425,000 | 8/2/15 | (447,126) |
| Agreement with JPMorgan Chase Bank, N.A. dated | | | |
| June 22, 2005 to receive semi-annually the notional | | | |
| amount multiplied by 4.387% and pay quarterly the | | | |
| notional amount multiplied by the three month | | | |
| USD-LIBOR. | 5,510,000 | 6/24/15 | 214,556 |
| Agreement with Lehman Brothers Special Financing, | | | |
| Inc. dated July 13, 2005 to pay semi-annually the | | | |
| notional amount multiplied by 4.38% and receive | | | |
| quarterly the notional amount multiplied by the | | | |
| three month USD-LIBOR-BBA. | 73,700,000 | 7/15/10 | 818,711 |
| Agreement with Lehman Brothers Special Financing, | | | |
| Inc. dated December 5, 2003 to receive semi-annually | | | |
| the notional amount multiplied by 2.23762% and pay | | | |
| quarterly the notional amount multiplied by the three | | | |
| month USD-LIBOR-BBA. | 72,256,000 | 12/9/05 | 114,177 |
| Agreement with Lehman Brothers Special Financing, | | | |
| Inc. dated August 29, 2005 to pay semi-annually the | | | |
| notional amount multiplied by 4.505% and receive | | | |
| quarterly the notional amount multiplied by the three | | | |
| month USD-LIBOR-BBA. | 68,000,000 | 8/31/10 | 1,120,668 |
| Agreement with Lehman Brothers Special Financing, | | | |
| Inc. dated July 31, 2002 to pay semi-annually the | | | |
| notional amount multiplied by 5.152% and receive | | | |
| quarterly the notional amount multiplied by the three | | | |
| month USD-LIBOR-BBA. | 54,861,045 | 8/2/22 | 3,770,884 |
| Agreement with Lehman Brothers Special Financing, | | | |
| Inc. dated July 31, 2002 to pay semi-annually the | | | |
| notional amount multiplied by 5.152% and receive | | | |
| quarterly the notional amount multiplied by the three | | | |
| month USD-LIBOR-BBA. | 53,317,584 | 8/2/12 | (699,954) |
66
| INTEREST RATE SWAP CONTRACTS OUTSTANDING at 10/31/05 continued | | |
|
| | | | Unrealized |
| | Notional | Termination | appreciation/ |
| | amount | date | (depreciation) |
|
| Agreement with Lehman Brothers Special Financing, | | | |
| Inc. dated January 22, 2004 to pay semi-annually the | | | |
| notional amount multiplied by 1.999% and receive | | | |
| quarterly the notional amount multiplied by the three | | | |
| month USD-LIBOR-BBA. | $ 33,294,000 | 1/26/06 | $ 24,694 |
| Agreement with Lehman Brothers Special Financing, | | | |
| Inc. dated January 21, 2004 to pay semi-annually the | | | |
| notional amount multiplied by 2.009% and receive | | | |
| quarterly the notional amount multiplied by the three | | | |
| month USD-LIBOR-BBA. | 32,489,000 | 1/23/06 | 21,317 |
| Agreement with Lehman Brothers Special Financing, | | | |
| Inc. dated January 21, 2004 to pay semi-annually the | | | |
| notional amount multiplied by 2.008% and receive | | | |
| quarterly the notional amount multiplied by the three | | | |
| month USD-LIBOR-BBA. | 32,489,000 | 1/23/06 | 21,315 |
| Agreement with Lehman Brothers Special Financing, | | | |
| Inc. dated December 12, 2003 to pay semi-annually | | | |
| the notional amount multiplied by 4.579% and receive | | | |
| quarterly the notional amount multiplied by the three | | | |
| month USD-LIBOR-BBA. | 17,662,000 | 12/16/13 | 288,095 |
| Agreement with Lehman Brothers Special Financing, | | | |
| Inc. dated January 22, 2004 to pay semi-annually the | | | |
| notional amount multiplied by 2.007% and receive | | | |
| quarterly the notional amount multiplied by the three | | | |
| month USD-LIBOR-BBA. | 17,454,000 | 1/26/06 | 12,341 |
| Agreement with Lehman Brothers Special Financing, | | | |
| Inc. dated December 11, 2003 to pay semi-annually | | | |
| the notional amount multiplied by 4.710% and receive | | | |
| quarterly the notional amount multiplied by the three | | | |
| month USD-LIBOR-BBA. | 14,151,000 | 12/15/13 | 101,736 |
| Agreement with Lehman Brothers Special Financing, | | | |
| Inc. dated January 21, 2004 to pay semi-annually the | | | |
| notional amount multiplied by 4.408% and receive | | | |
| quarterly the notional amount multiplied by the three | | | |
| month USD-LIBOR-BBA. | 10,740,000 | 1/23/14 | 320,246 |
| Agreement with Lehman Brothers Special Financing, | | | |
| Inc. dated January 21, 2004 to pay semi-annually the | | | |
| notional amount multiplied by 4.419% and receive | | | |
| quarterly the notional amount multiplied by the three | | | |
| month USD-LIBOR-BBA. | 10,740,000 | 1/23/14 | 312,773 |
| Agreement with Lehman Brothers Special Financing, | | | |
| Inc. dated December 11, 2003 to pay semi-annually | | | |
| the notional amount multiplied by 2.235% and receive | | | |
| quarterly the notional amount multiplied by the three | | | |
| month USD-LIBOR-BBA. | 3,382,000 | 12/15/05 | (4,686) |
67
| INTEREST RATE SWAP CONTRACTS OUTSTANDING at 10/31/05 continued | | |
|
| | | | Unrealized |
| | Notional | Termination | appreciation/ |
| | amount | date | (depreciation) |
|
| Agreement with Merrill Lynch Capital Services, Inc. | | | |
| dated August 8, 2002 to pay quarterly the notional | | | |
| amount multiplied by the three month USD-LIBOR- | | | |
| BBA and receive semi-annually the notional amount | | | |
| multiplied by 5.601%. | $ 54,861,045 | 8/12/22 | $ 2,587,701 |
| Agreement with Merrill Lynch Capital Services, Inc. | | | |
| dated August 8, 2002 to receive quarterly the notional | | | |
| amount multiplied by the three month USD-LIBOR- | | | |
| BBA and pay semi-annually the notional amount | | | |
| multiplied by 4.94%. | 53,317,584 | 8/13/12 | 17,192 |
| Agreement with Morgan Stanley Capital Services, Inc. | | | |
| dated September 28, 2000 to pay semi-annually the | | | |
| notional amount multiplied by 6.94% and receive quar- | | | |
| terly the notional amount multiplied by the three | | | |
| month USD-LIBOR-BBA. | 28,000,000 | 10/2/10 | (2,499,209) |
|
| |
| Total | | | $ 679,828 |
|
| |
| |
| TOTAL RETURN SWAP CONTRACTS OUTSTANDING at 10/31/05 | | |
|
| | | | Unrealized |
| | Notional | Termination | appreciation/ |
| | amount | date | (depreciation) |
|
| Agreement with Citibank, N.A. dated July 7, 2005 to | | | |
| receive at maturity the notional amount multiplied by the | | | |
| nominal spread appreciation of the Lehman Brothers AAA | | | |
| 8.5+ Commercial Mortgage Backed Securities Index | | | |
| adjusted by a modified duration factor and an accrual of 50 | | | |
| basis points plus the beginning of the period nominal | | | |
| spread of the Lehman Brothers AAA 8.5+ Commercial | | | |
| Mortgage Backed Securities Index and pay at maturity the | | | |
| notional amount multiplied by the nominal spread depre- | | | |
| ciation of the Lehman Brothers AAA 8.5+ Commercial | | | |
| Mortgage Backed Securities Index adjusted by a modified | | | |
| duration factor. | $ 30,696,000 | 1/1/06 | $ 32,933 |
| Agreement with Citibank, NA. dated September 8, 2005 | | | |
| to receive at maturity the notional amount multiplied by | | | |
| the nominal spread appreciation of the Lehman Brothers | | | |
| AAA 8.5+ Commercial Mortgage Backed Securities Index | | | |
| adjusted by a modified duration factor and an accrual of 27 | | | |
| basis points plus the beginning of the period nominal | | | |
| spread of the Lehman Brothers AAA 8.5+ Commercial | | | |
| Mortgage Backed Securities Index and pay at maturity the | | | |
| notional amount multiplied by the nominal spread depre- | | | |
| ciation of the Lehman Brothers AAA 8.5+ Commercial | | | |
| Mortgage Backed Securities Index adjusted by a modified | | | |
| duration factor. | 61,547,000 | 4/1/06 | 69,093 |
68
| TOTAL RETURN SWAP CONTRACTS OUTSTANDING at 10/31/05 continued | | |
|
| | | | Unrealized |
| | Notional | Termination | appreciation/ |
| | amount | date | (depreciation) |
|
| Agreement with Citigroup Financial Products, Inc. | | | |
| dated May 5, 2005 to receive at maturity the notional | | | |
| amount multiplied by the nominal spread appreciation | | | |
| of the Lehman Brothers AAA 8.5+ Commercial | | | |
| Mortgage Backed Securities Index adjusted by a modi- | | | |
| fied duration factor and an accrual of 35 basis points | | | |
| plus the beginning of the period nominal spread of the | | | |
| Lehman Brothers AAA 8.5+ Commercial Mortgage | | | |
| Backed Securities Index and pay at maturity the | | | |
| notional amount multiplied by the nominal spread | | | |
| depreciation of the Lehman Brothers AAA 8.5+ | | | |
| Commercial Mortgage Backed Securities Index | | | |
| adjusted by a modified duration factor. | $ 33,133,000 | 11/1/05 | $ 80,814 |
| Agreement with Citigroup Financial Products, Inc. | | | |
| dated April 22, 2005 to receive at maturity the notional | | | |
| amount multiplied by the nominal spread appreciation | | | |
| of the Lehman Brothers AAA 8.5+ Commercial | | | |
| Mortgage Backed Securities Index adjusted by a modi- | | | |
| fied duration factor and an accrual of 40 basis points | | | |
| plus the beginning of the period nominal spread of the | | | |
| Lehman Brothers AAA 8.5+ Commercial Mortgage | | | |
| Backed Securities Index and pay at maturity the | | | |
| notional amount multiplied by the nominal spread | | | |
| depreciation of the Lehman Brothers AAA 8.5+ | | | |
| Commercial Mortgage Backed Securities Index | | | |
| adjusted by a modified duration factor. | 29,935,000 | 11/1/05 | 94,704 |
| Agreement with Deutsche Bank AG dated September 8, | | | |
| 2005 to receive at maturity the notional amount multi- | | | |
| plied by the nominal spread appreciation of the Lehman | | | |
| Brothers AAA 8.5+ Commercial Mortgage Backed | | | |
| Securities Index adjusted by a modified duration factor | | | |
| and an accrual of 25 basis points plus the beginning of the | | | |
| period nominal spread of the Lehman Brothers AAA | | | |
| 8.5+ Commercial Mortgage Backed Securities Index and | | | |
| pay at maturity the notional amount multiplied by the | | | |
| nominal spread depreciation of the Lehman Brothers | | | |
| AAA 8.5+ Commercial Mortgage Backed Securities | | | |
| Index adjusted by a modified duration factor. | 17,471,000 | 3/1/06 | 19,358 |
69
| TOTAL RETURN SWAP CONTRACTS OUTSTANDING at 10/31/05 continued | | |
|
| | | | Unrealized |
| | Notional | Termination | appreciation/ |
| | amount | date | (depreciation) |
|
| Agreement with Deutsche Bank AG dated August 3, | | | |
| 2005 to pay at maturity the notional amount multiplied | | | |
| by the nominal spread appreciation of the Lehman | | | |
| Brothers AAA 8.5+ Commercial Mortgage Backed | | | |
| Securities Index adjusted by a modified duration factor | | | |
| and an accrual of 15 basis points plus the beginning of | | | |
| the period nominal spread of the Lehman Brothers | | | |
| AAA 8.5+ Commercial Mortgage Backed Securities | | | |
| Index and receive at maturity the notional amount | | | |
| multiplied by the nominal spread depreciation of the | | | |
| Lehman Brothers AAA 8.5+ Commercial Mortgage | | | |
| Backed Securities Index adjusted by a modified | | | |
| duration factor. | $ 30,696,000 | 1/1/06 | $ 56,296 |
| Agreement with Deutsche Bank AG dated May 3, | | | |
| 2005 to pay at maturity the notional amount multiplied | | | |
| by the nominal spread appreciation of the Lehman | | | |
| Brothers AAA 8.5+ Commercial Mortgage Backed | | | |
| Securities Index adjusted by a modified duration factor | | | |
| and an accrual of 35 basis points plus the beginning of | | | |
| the period nominal spread of the Lehman Brothers | | | |
| AAA 8.5+ Commercial Mortgage Backed Securities | | | |
| Index and receive at maturity the notional amount | | | |
| multiplied by the nominal spread depreciation of the | | | |
| Lehman Brothers AAA 8.5+ Commercial Mortgage | | | |
| Backed Securities Index adjusted by a modified | | | |
| duration factor. | 14,983,000 | 11/1/05 | (36,139) |
| Agreement with Goldman Sachs Capital Markets, L.P. | | | |
| dated September 8, 2005 to receive at maturity the | | | |
| notional amount multiplied by the nominal spread | | | |
| appreciation of the Lehman Brothers AAA 8.5+ | | | |
| Commercial Mortgage Backed Securities Index adjusted | | | |
| by a modified duration factor and an accrual of 30 basis | | | |
| points plus the beginning of the period nominal spread | | | |
| of the Lehman Brothers AAA 8.5+ Commercial | | | |
| Mortgage Backed Securities Index and pay at maturity | | | |
| the notional amount multiplied by the nominal spread | | | |
| depreciation of the Lehman Brothers AAA 8.5+ | | | |
| Commercial Mortgage Backed Securities Index adjusted | | | |
| by a modified duration factor. | 150,228,000 | 4/1/06 | 256,289 |
70
| TOTAL RETURN SWAP CONTRACTS OUTSTANDING at 10/31/05 continued | | |
|
| | | | Unrealized |
| | Notional | Termination | appreciation/ |
| | amount | date | (depreciation) |
|
| Agreement with Goldman Sachs Capital Markets, L.P. | | | |
| dated July 7, 2005 to pay monthly the notional amount | | | |
| multiplied by the spread depreciation of the Lehman | | | |
| Brothers 8.5+ AAA Commercial Mortgage Backed | | | |
| Securities Index adjusted by a modified duration factor | | | |
| and receive monthly the notional amount multiplied by | | | |
| the appreciation of the Lehman Brothers 8.5+ AAA | | | |
| Commercial Mortgage Backed Securities Index plus | | | |
| 27.2 basis points. | $ 28,000,000 | 12/1/05 | $ 42,840 |
| Agreement with Goldman Sachs Capital Markets, L.P. | | | |
| dated August 3, 2005 to pay at maturity the notional | | | |
| amount multiplied by the nominal spread appreciation | | | |
| of the Lehman Brothers AAA 8.5+ Commercial | | | |
| Mortgage Backed Securities Index adjusted by a modi- | | | |
| fied duration factor and an accrual of 20 basis points | | | |
| plus the beginning of the period nominal spread of the | | | |
| Lehman Brothers AAA 8.5+ Commercial Mortgage | | | |
| Backed Securities Index and receive at maturity the | | | |
| notional amount multiplied by the nominal spread | | | |
| depreciation of the Lehman Brothers AAA 8.5+ | | | |
| Commercial Mortgage Backed Securities Index | | | |
| adjusted by a modified duration factor. | 28,000,000 | 12/1/05 | (48,160) |
| Agreement with Lehman Brothers Finance, S.A. dated | | | |
| August 31, 2005 to receive/(pay) semi-annually the | | | |
| notional amount multiplied by the return of the | | | |
| Lehman Brothers US ABS Floating Rate Index HEL | | | |
| Aggregate Component and pay semi-annually the | | | |
| notional amount multiplied by the six month | | | |
| USD-LIBOR-BBA adjusted by a specified spread. | 186,405,000 | 3/1/06 | (97,491) |
|
| |
| Total | | | $470,537 |
71
| CREDIT DEFAULT CONTRACTS OUTSTANDING at 10/31/05 | | |
|
| | | Unrealized |
| | Notional | appreciation/ |
| | amount | (depreciation) |
|
| Agreement with Bank of America, N.A. on September 13, 2005, | | |
| maturing on June 20, 2010, to receive/(pay) a premium based on | | |
| the difference between the original spread on issue and the market | | |
| spread on day of execution and pay quarterly 90 basis points times | | |
| the notional amount. Upon a credit default event of a reference | | |
| entity within the DJ CDX IG HVOL Series 4 Index, the fund | | |
| receives a payment of the proportional notional amount times the | | |
| difference between the par value and the then-market value of the | | |
| reference entity within the DJ CDX IG HVOL Series 4 Index. | $6,176,000 | $ 22,543 |
| Agreement with Bank of America, N.A. on July 26, 2005, | | |
| maturing on September 20, 2012, to receive quarterly 64 basis | | |
| points times the notional amount. Upon a credit default event of | | |
| Waste Management, 7.375%, 8/1/10, the fund makes a payment | | |
| of the proportional notional amount times the difference between | | |
| the par value and the then-market value of Waste Management, | | |
| 7.375%, 8/1/10. | 1,400,000 | 9,065 |
| Agreement with Bank of America, N.A. on November 24, 2004, | | |
| maturing on April 15, 2010, to receive a premium equal to | | |
| 2.58316% times the notional amount. Upon a credit default event | | |
| of any News Corp. senior note or bond, the fund makes a | | |
| payment of the proportional notional amount times the difference | | |
| between the par value and the then-market value of the defaulted | | |
| News Corp. senior note or bond. | 930,000 | 3,346 |
| Agreement with Citigroup Financial Products, Inc. on August 19, | | |
| 2005, maturing on June 20, 2012, to receive quarterly 62 basis | | |
| points times the notional amount. Upon a credit default event of a | | |
| reference entity within the DJ IG CDX Series 4 Index, 7-10% | | |
| tranche, the fund makes a payment of the proportional notional | | |
| amount times the difference between the par value and the then- | | |
| market value of the reference entity within the DJ IG CDX | | |
| Series 4 Index, 7-10% tranche. | 8,411,000 | 46,312 |
| Agreement with Citigroup Financial Products, Inc. on August 19, | | |
| 2005, maturing on June 20, 2012, to receive/(pay) a premium | | |
| based on the difference between the original spread on issue and | | |
| the market spread on day of execution and pay quarterly 55 basis | | |
| points times the notional amount. Upon a credit default event of a | | |
| reference entity within the DJ IG CDX Series 4 Index, the fund | | |
| receives a payment of the proportional notional amount times the | | |
| difference between the par value and the then-market value of | | |
| the reference entity within the DJ IG CDX Series 4 Index. | 8,411,000 | 1,359 |
| Agreement with Deutsche Bank AG on July 22, 2005, maturing on | | |
| September 20, 2010, to receive quarterly 41 basis points times | | |
| the notional amount. Upon a credit default event of France | | |
| Telecomm, 7.25%, 1/28/13, the fund makes a payment of the | | |
| proportional notional amount times the difference between the par | | |
| value and the then-market value of France Telecomm, 7.25%, 1/28/13. | 2,380,000 | (61) |
72
| CREDIT DEFAULT CONTRACTS OUTSTANDING at 10/31/05 continued | | |
|
| | | Unrealized |
| | Notional | appreciation/ |
| | amount | (depreciation) |
|
| Agreement with Deutsche Bank AG on September 9, 2004, | | |
| maturing on September 20, 2014, to receive a quarterly payment | | |
| of 0.58% times the notional amount. Upon a credit default event | | |
| of any CVS senior note, the fund makes a payment of the propor- | | |
| tional notional amount times the difference between the par value | | |
| and the then-market value of any CVS senior note. | $ 940,000 | $ (4,378) |
| Agreement with Goldman Sachs Capital Markets, L.P. on | | |
| October 21, 2005, maturing on June 20, 2010, to receive/(pay) a | | |
| premium based on the difference between the original spread on | | |
| issue and the market spread on day of execution and pay quar- | | |
| terly 90 basis points times the notional amount. Upon a credit | | |
| default event of a reference entity within the CDX IG Series 4 | | |
| Index, the fund receives a payment of the proportional notional | | |
| amount times the difference between the par value and the | | |
| then-market value of the reference entity within the CDX IG | | |
| Series 4 Index. | 6,032,000 | 3,852 |
| Agreement with Goldman Sachs Capital Markets, L.P. on | | |
| August 4, 2005, maturing on September 20, 2010, to receive | | |
| quarterly 49 basis points times the notional amount. Upon a | | |
| credit default event of Goodyear 7 5/8s, 12/15/12, the fund makes | | |
| a payment of the proportional notional amount times the differ- | | |
| ence between the par value and the then-market value of | | |
| Goodyear 7 5/8s, 12/15/12. | 1,170,000 | (1,708) |
| Agreement with Goldman Sachs International on September 2, | | |
| 2004, terminating on the date on which the notional amount is | | |
| reduced to zero or the date on which the assets securing the | | |
| reference obligation are liquidated, the fund receives a payment of | | |
| the outstanding notional amount times 2.55625% and the fund | | |
| pays in the event of a credit default in one of the underlying | | |
| securities in the basket of BB CMBS securities. | 11,022,000 | 281,051 |
| Agreement with Lehman Brothers Special Financing, Inc. on | | |
| October 5, 2005, maturing on December 20, 2010, to | | |
| receive/(pay) a premium based on the difference between the | | |
| original spread on issue and the market spread on day of execu- | | |
| tion and receive quarterly 45 basis points times the notional | | |
| amount. Upon a credit default event of a reference entity within | | |
| the DJ CDX IG Series 5 Index, the fund makes a payment of the | | |
| proportional notional amount times the difference between the | | |
| par value and the then-market value of the reference entity within | | |
| the DJ CDX IG Series 5 Index. | 15,270,000 | 7,603 |
73
| CREDIT DEFAULT CONTRACTS OUTSTANDING at 10/31/05 continued | | |
|
| | | Unrealized |
| | Notional | appreciation/ |
| | amount | (depreciation) |
|
| Agreement with Lehman Brothers Special Financing, Inc. on | | |
| September 29, 2005, maturing on June 20, 2010, to receive/(pay) | | |
| a premium based on the difference between the original spread | | |
| on issue and the market spread on day of execution and pay | | |
| quarterly 90 basis points times the notional amount. Upon a | | |
| credit default event of a reference entity within the DJ CDX IG | | |
| HVOL Series 4 Index, the fund receives a payment of the propor- | | |
| tional notional amount times the difference between the par value | | |
| and the then-market value of the reference entity within the | | |
| DJ CDX IG HVOL Series 4 Index. | $8,831,000 | $ 2,469 |
| Agreement with Lehman Brothers Special Financing, Inc. on | | |
| September 19, 2005, maturing on June 20, 2015, to receive/(pay) | | |
| a premium based on the difference between the original spread on | | |
| issue and the market spread on day of execution and pay quarterly | | |
| 65 basis points times the notional amount. Upon a credit default | | |
| event of a reference entity within the DJ IG CDX 4 Index, the fund | | |
| receives a payment of the proportional notional amount times the | | |
| difference between the par value and the then-market value of the | | |
| reference entity within the DJ IG CDX 4 Index. | 4,153,000 | 10,144 |
| Agreement with Lehman Brothers Special Financing, Inc. on | | |
| September 21, 2005, maturing on December 20, 2015, to | | |
| receive/(pay) a premium based on the difference between the | | |
| original spread on issue and the market spread on day of execu- | | |
| tion and pay quarterly 70 basis points times the notional amount. | | |
| Upon a credit default event of a reference entity within the DJ IG | | |
| CDX 5 Index, the fund receives a payment of the proportional | | |
| notional amount times the difference between the par value and | | |
| the then-market value of the reference entity within the DJ IG | | |
| CDX 5 Index. | 4,155,000 | 2,475 |
| Agreement with Lehman Brothers Special Financing, Inc. on | | |
| September 21, 2005, maturing on December 20, 2015, to receive | | |
| quarterly 57.5 basis points times the notional amount. Upon a | | |
| credit default event of a reference entity within the DJ IG CDX 5 | | |
| Index, 10-15% tranche, the fund makes a payment of the propor- | | |
| tional notional amount times the difference between the par value | | |
| and the then-market value of the reference entity within the DJ IG | | |
| CDX 5 Index, 10-15% tranche. | 4,155,000 | (9,067) |
| Agreement with Lehman Brothers Special Financing, Inc. on | | |
| September 19, 2005, maturing on June 20, 2015, to receive quar- | | |
| terly 59 basis points times the notional amount. Upon a credit | | |
| default event of a reference entity within the DJ IG CDX 4 | | |
| Index,10-15% tranche, the fund makes a payment of the propor- | | |
| tional notional amount times the difference between the par value | | |
| and the then-market value of the reference entity within the DJ IG | | |
| CDX 4 Index,10-15% tranche. | 4,153,000 | (32,143) |
74
| CREDIT DEFAULT CONTRACTS OUTSTANDING at 10/31/05 continued | | |
|
| | | Unrealized |
| | Notional | appreciation/ |
| | amount | (depreciation) |
|
| Agreement with Morgan Stanley Capital Services, Inc. on | | |
| September 19, 2005, maturing on June 20, 2012, to receive/(pay) | | |
| a premium based on the difference between the original spread | | |
| on issue and the market spread on day of execution and pay | | |
| quarterly 55 basis points times the notional amount. Upon a | | |
| credit default event of a reference entity within the DJ IG CDX | | |
| Series 4 Index, the fund receives a payment of the proportional | | |
| notional amount times the difference between the par value and | | |
| the then-market value of the reference entity within the DJ IG | | |
| CDX Series 4 Index. | $8,307,000 | $ 12,810 |
| Agreement with Morgan Stanley Capital Services, Inc. on | | |
| September 19, 2005, maturing on June 20, 2012, to receive quar- | | |
| terly 48 basis points times the notional amount. Upon a credit | | |
| default event of a reference entity within the DJ IG CDX Series 4 | | |
| Index 7-10% tranche, the fund makes a payment of the propor- | | |
| tional notional amount times the difference between the par value | | |
| and the then-market value of the reference entity within the DJ IG | | |
| CDX Series 4 Index 7-10% tranche. | 8,307,000 | (17,086) |
| Agreement with Morgan Stanley Capital Services, Inc. on | | |
| October 14, 2005, maturing on December 20, 2010, to receive | | |
| quarterly 127 basis points times the notional amount. Upon a | | |
| credit default event of a reference entity within the DJ HY CDX | | |
| Series 5 Index, 25-35% tranche, the fund makes a payment of the | | |
| proportional notional amount times the difference between the | | |
| par value and the then-market value of the reference entity within | | |
| the DJ HY CDX Series 5 Index, 25-35% tranche. | 4,693,000 | 7,556 |
| Agreement with Morgan Stanley Capital Services, Inc. on | | |
| September 7, 2005, maturing on June 20, 2015, to receive/(pay) a | | |
| premium based on the difference between the original spread on | | |
| issue and the market spread on day of execution and pay quarterly | | |
| 65 basis points times the notional amount. Upon a credit default | | |
| event of a reference entity within the DJ IG CDX Series 4 Index, | | |
| the fund receives a payment of the proportional notional amount | | |
| times the difference between the par value and the then-market | | |
| value of the reference entity within the DJ IG CDX Series 4 Index. | 4,127,000 | 5,363 |
| Agreement with Morgan Stanley Capital Services, Inc. on | | |
| September 7, 2005, maturing on June 20, 2015, to receive quar- | | |
| terly 70.5 basis points times the notional amount. Upon a credit | | |
| default event of a reference entity within the DJ IG CDX Series 4 | | |
| Index, 10-15% tranche, the fund makes a payment of the propor- | | |
| tional notional amount times the difference between the par value | | |
| and the then-market value of the reference entity within the DJ IG | | |
| CDX Series 4 Index, 10-15% tranche. | 4,127,000 | 13,530 |
75
| CREDIT DEFAULT CONTRACTS OUTSTANDING at 10/31/05 continued | | |
|
| | | Unrealized |
| | Notional | appreciation/ |
| | amount | (depreciation) |
|
| Agreement with Morgan Stanley Capital Services, Inc. on | | |
| September 13, 2005, maturing on June 20, 2012, to receive quar- | | |
| terly 275 basis points times the notional amount. Upon a credit | | |
| default event of a reference entity within the DJ IG CDX Series 4 | | |
| Index, 3-7% tranche, the fund makes a payment of the propor- | | |
| tional notional amount times the difference between the par value | | |
| and the then-market value of the reference entity within the DJ IG | | |
| CDX Series 4 Index, 3-7% tranche. | $3,088,000 | $(110,756) |
| Agreement with Morgan Stanley Capital Services, Inc. on | | |
| September 29, 2005, maturing on June 20, 2012, to receive quar- | | |
| terly 318 basis points times the notional amount. Upon a credit | | |
| default event of a reference entity within the DJ IG CDX Series 4 | | |
| Index, 3-7% tranche, the fund makes a payment of the propor- | | |
| tional notional amount times the difference between the par value | | |
| and the then-market value of the reference entity within the DJ IG | | |
| CDX Series 4 Index, 3-7% tranche. | 2,944,000 | (39,234) |
| Agreement with Morgan Stanley Capital Services, Inc. on | | |
| October 14, 2005, maturing on December 20, 2010, to | | |
| receive/(pay) a premium based on the difference between the | | |
| original spread on issue and the market spread on day of execu- | | |
| tion and pays quarterly 395 basis points times the notional | | |
| amount. Upon a credit default event of a reference entity within | | |
| the CDX HY Series 5 Index, the fund receives a payment of the | | |
| proportional notional amount times the difference between the | | |
| par value and the then-market value of the reference entity within | | |
| the CDX HY Series 5 Index. | 2,346,500 | (23,733) |
|
| |
| Total | | $191,312 |
The accompanying notes are an integral part of these financial statements.
76
| Statement of assets and liabilities 10/31/05 | |
|
| |
| ASSETS | |
| Investment in securities, at value, including $6,225,281 of securities on loan (Note 1): | |
| Unaffiliated issuers (identified cost $2,669,245,474) | $2,617,738,709 |
| Affiliated issuers (identified cost $266,913,681) (Note 5) | 266,913,681 |
|
| Cash | 5,885,213 |
|
| Interest and other receivables | 15,475,543 |
|
| Receivable for shares of the fund sold | 1,928,988 |
|
| Receivable for securities sold | 14,272,602 |
|
| Receivable for sales of delayed delivery securities (Note 1) | 433,245,678 |
|
| Unrealized appreciation on swap contracts (Note 1) | 24,767,821 |
|
| Receivable for closed swap contracts (Note 1) | 45,590 |
|
| Premium paid on credit default contracts (Note 1) | 358,845 |
|
| Receivable for variation margin (Note 1) | 305,359 |
|
| Total assets | 3,380,938,029 |
|
| |
| LIABILITIES | |
| Payable for securities purchased | 57,990,710 |
|
| Payable for purchases of delayed delivery securities (Note 1) | 264,563,659 |
|
| Payable for shares of the fund repurchased | 5,908,770 |
|
| Payable for compensation of Manager (Notes 2 and 5) | 3,312,840 |
|
| Payable for investor servicing and custodian fees (Note 2) | 484,101 |
|
| Payable for Trustee compensation and expenses (Note 2) | 226,126 |
|
| Payable for administrative services (Note 2) | 3,026 |
|
| Payable for distribution fees (Note 2) | 591,071 |
|
| Written options outstanding, at value (premium received $8,781,546) (Note 1) | 9,018,914 |
|
| Unrealized depreciation on swap contracts (Note 1) | 23,426,144 |
|
| Premium received on credit default contracts (Note 1) | 24,023 |
|
| TBA sale commitments, at value (proceeds receivable $432,371,023) (Note 1) | 430,443,020 |
|
| Collateral on securities loaned, at value (Note 1) | 6,393,090 |
|
| Other accrued expenses | 249,718 |
|
| Total liabilities | 802,635,212 |
|
| Net assets | $2,578,302,817 |
| |
| (Continued on next page) | |
77
Statement of assets and liabilities (Continued)
|
| REPRESENTED BY | |
| Paid-in capital (Unlimited shares authorized) (Notes 1 and 4) | $2,713,185,475 |
|
| Undistributed net investment income (Note 1) | 21,600,598 |
|
| Accumulated net realized loss on investments (Note 1) | (102,209,828) |
|
| Net unrealized depreciation of investments | (54,273,428) |
|
| Total -- Representing net assets applicable to capital shares outstanding | $2,578,302,817 |
|
| |
| COMPUTATION OF NET ASSET VALUE AND OFFERING PRICE | |
| Net asset value and redemption price per class A share | |
| ($872,931,073 divided by 129,768,584 shares) | $6.73 |
|
| Offering price per class A share | |
| (100/96.25 of $6.73)* | $6.99 |
|
| Net asset value and offering price per class B share | |
| ($229,794,230 divided by 34,379,059 shares)** | $6.68 |
|
| Net asset value and offering price per class C share | |
| ($24,644,011 divided by 3,676,329 shares)** | $6.70 |
|
| Net asset value and redemption price per class M share | |
| ($420,886,032 divided by 63,230,847 shares) | $6.66 |
|
| Offering price per class M share | |
| (100/96.75 of $6.66)*** | $6.88 |
|
| Net asset value, offering price and redemption price per class R share | |
| ($400,275 divided by 59,527 shares) | $6.72 |
|
| Net asset value, offering price and redemption price per class Y share | |
| ($1,029,647,196 divided by 152,110,865 shares) | $6.77 |
* On single retail sales of less than $100,000. On sales of $100,000 or more and on group sales, the offering price is reduced.
** Redemption price per share is equal to net asset value less any applicable contingent deferred sales charge.
*** On single retail sales of less than $50,000. On sales of $50,000 or more and on group sales, the offering price is reduced.
The accompanying notes are an integral part of these financial statements.
78
| Statement of operations Year ended 10/31/05 | |
|
| |
| INVESTMENT INCOME | |
| Interest (including interest income of $9,530,693 | |
| from investments in affiliated issuers) (Note 5) | $117,795,742 |
|
| Securities lending | 19,577 |
|
| Total investment income | 117,815,319 |
|
| |
| EXPENSES | |
| Compensation of Manager (Note 2) | 13,813,399 |
|
| Investor servicing fees (Note 2) | 5,317,730 |
|
| Custodian fees (Note 2) | 558,903 |
|
| Trustee compensation and expenses (Note 2) | 97,255 |
|
| Administrative services (Note 2) | 74,704 |
|
| Distribution fees -- Class A (Note 2) | 2,317,414 |
|
| Distribution fees -- Class B (Note 2) | 2,747,050 |
|
| Distribution fees -- Class C (Note 2) | 264,011 |
|
| Distribution fees -- Class M (Note 2) | 2,452,842 |
|
| Distribution fees -- Class R (Note 2) | 1,511 |
|
| Other | 546,927 |
|
| Non-recurring costs (Notes 2 and 6) | 32,334 |
|
| Costs assumed by Manager (Notes 2 and 6) | (32,334) |
|
| Fees waived and reimbursed by Manager (Notes 2 and 5) | (726,853) |
|
| Total expenses | 27,464,893 |
|
| Expense reduction (Note 2) | (413,187) |
|
| Net expenses | 27,051,706 |
|
| Net investment income | 90,763,613 |
|
| Net realized loss on investments (Notes 1 and 3) | (12,292,934) |
|
| Net realized gain on swap contracts (Note 1) | 10,173,130 |
|
| Net realized gain on futures contracts (Note 1) | 16,799,956 |
|
| Net realized gain on written options (Notes 1 and 3) | 234,770 |
|
| Net unrealized depreciation of investments, futures contracts, swap contracts, | |
| written options, and TBA sale commitments during the year | (77,358,436) |
|
| Net loss on investments | (62,443,514) |
|
| Net increase in net assets resulting from operations | $ 28,320,099 |
The accompanying notes are an integral part of these financial statements.
79
| Statement of changes in net assets | |
|
| |
| DECREASE IN NET ASSETS | | |
|
| | Year ended | Year ended |
| | 10/31/05 | 10/31/04 |
|
| Operations: | | |
| Net investment income | $ 90,763,613 | $ 79,463,790 |
|
| Net realized gain on investments | 14,914,922 | 82,727,147 |
|
| Net unrealized depreciation of investments | (77,358,436) | (6,192,494) |
|
| Net increase in net assets resulting from operations | 28,320,099 | 155,998,443 |
|
| Distributions to shareholders: (Note 1) | | |
|
| From net investment income | | |
|
| Class A | (28,598,706) | (30,831,397) |
|
| Class B | (6,366,448) | (8,440,394) |
|
| Class C | (615,427) | (709,582) |
|
| Class M | (14,120,044) | (18,188,598) |
|
| Class R | (9,087) | (224) |
|
| Class Y | (31,990,509) | (23,947,431) |
|
| Redemption fees (Note 1) | 11,566 | 2,568 |
|
| Decrease from capital share transactions (Note 4) | (143,764,508) | (738,478,401) |
|
| Total decrease in net assets | (197,133,064) | (664,595,016) |
|
| |
| NET ASSETS | | |
| Beginning of year | 2,775,435,881 | 3,440,030,897 |
|
| End of year (including undistributed net investment | | |
| income of $21,600,598 and $3,693,679, respectively) | $2,578,302,817 | $2,775,435,881 |
The accompanying notes are an integral part of these financial statements.
80
Financial highlights (For a common share outstanding throughout the period)
| CLASS A | | | | | |
|
| PER-SHARE OPERATING PERFORMANCE | | | | |
|
| | | | Year ended | | |
| | 10/31/05 | 10/31/04 | 10/31/03 | 10/31/02 | 10/31/01 |
|
| Net asset value, | | | | | |
| beginning of period | $6.87 | $6.69 | $6.59 | $6.69 | $6.29 |
|
| Investment operations: | | | | | |
| Net investment income (a) | .23(d) | .19(d) | .24 | .32 | .38 |
|
| Net realized and unrealized | | | | | |
| gain (loss) on investments | (.16) | .19 | .11 | (.07) | .43 |
|
| Total from | | | | | |
| investment operations | .07 | .38 | .35 | .25 | .81 |
|
| Less distributions: | | | | | |
| From net investment income | (.21) | (.20) | (.25) | (.35) | (.41) |
|
| From return of capital | -- | -- | -- | -- | --(e) |
|
| Total distributions | (.21) | (.20) | (.25) | (.35) | (.41) |
|
| Redemption fees | --(e) | --(e) | -- | -- | -- |
|
| Net asset value, | | | | | |
| end of period | $6.73 | $6.87 | $6.69 | $6.59 | $6.69 |
|
| Total return at | | | | | |
| net asset value (%)(b) | 1.05 | 5.70 | 5.45 | 3.93 | 13.39 |
|
| |
| RATIOS AND SUPPLEMENTAL DATA | | | | | |
| Net assets, end of period | | | | | |
| (in thousands) | $872,931 | $985,939 | $1,279,779 | $1,339,061 | $1,251,190 |
|
| Ratio of expenses to | | | | | |
| average net assets (%)(c) | .98(d) | .99(d) | .93 | .92 | .95 |
|
| Ratio of net investment income | | | | | |
| to average net assets (%) | 3.42(d) | 2.83(d) | 3.64 | 4.84 | 5.93 |
|
| Portfolio turnover (%) | 300.04(f ) | 441.06 | 251.00(g) | 268.10(g) | 233.83(g) |
| (a) | Per share net investment income has been determined on the basis of the weighted average number of shares outstanding during the period. |
| |
| (b) | Total return assumes dividend reinvestment and does not reflect the effect of sales charges. |
| |
| (c) | The ratio of expenses to average net assets includes amounts paid through expense offset arrangements (Note 2). |
| |
| (d) | Reflects an involuntary contractual expense limitation and waivers of certain fund expenses in connection with investments in Putnam Prime Money Market Fund during the period. As a result of such limitation and waivers, the expenses of the fund for the periods ended October 31, 2005 and October 31, 2004 reflect a reduction of 0.03% and less than 0.01%, respectively, of average net assets for class A shares (Notes 2 and 5). |
| |
| (e) | Amount represents less than $0.01 per share. |
| |
| (f) | Portfolio turnover excludes dollar roll transactions. |
| |
| (g) | Portfolio turnover excludes certain treasury note transactions executed in connection with a short-term trading strategy. |
| |
| | The accompanying notes are an integral part of these financial statements. |
| |
81
Financial highlights (For a common share outstanding throughout the period)
| CLASS B | | | | | |
|
| PER-SHARE OPERATING PERFORMANCE | | | | |
|
| | | | Year ended | | |
| | 10/31/05 | 10/31/04 | 10/31/03 | 10/31/02 | 10/31/01 |
|
| Net asset value, | | | | | |
| beginning of period | $6.82 | $6.65 | $6.55 | $6.65 | $6.25 |
|
| Investment operations: | | | | | |
| Net investment income (a) | .18(d) | .14(d) | .19 | .27 | .33 |
|
| Net realized and unrealized | | | | | |
| gain (loss) on investments | (.16) | .18 | .11 | (.07) | .44 |
|
| Total from | | | | | |
| investment operations | .02 | .32 | .30 | .20 | .77 |
|
| Less distributions: | | | | | |
| From net investment income | (.16) | (.15) | (.20) | (.30) | (.37) |
|
| From return of capital | -- | -- | -- | -- | --(e) |
|
| Total distributions | (.16) | (.15) | (.20) | (.30) | (.37) |
|
| Redemption fees | --(e) | --(e) | -- | -- | -- |
|
| Net asset value, | | | | | |
| end of period | $6.68 | $6.82 | $6.65 | $6.55 | $6.65 |
|
| Total return at | | | | | |
| net asset value (%)(b) | 0.28 | 4.79 | 4.68 | 3.19 | 12.63 |
|
| |
| RATIOS AND SUPPLEMENTAL DATA | | | | | |
| Net assets, end of period | | | | | |
| (in thousands) | $229,794 | $323,527 | $520,692 | $555,668 | $474,783 |
|
| Ratio of expenses to | | | | | |
| average net assets (%)(c) | 1.73(d) | 1.74(d) | 1.68 | 1.67 | 1.70 |
|
| Ratio of net investment income | | | | | |
| to average net assets (%) | 2.64(d) | 2.12(d) | 2.90 | 4.07 | 5.19 |
|
| Portfolio turnover (%) | 300.04(f ) | 441.06 | 251.00(g) | 268.10(g) | 233.83(g) |
| (a) | Per share net investment income has been determined on the basis of the weighted average number of shares outstanding during the period. |
| |
| (b) | Total return assumes dividend reinvestment and does not reflect the effect of sales charges. |
| |
| (c) | The ratio of expenses to average net assets includes amounts paid through expense offset arrangements (Note 2). |
| |
| (d) | Reflects an involuntary contractual expense limitation and waivers of certain fund expenses in connection with investments in Putnam Prime Money Market Fund during the period. As a result of such limitation and waivers, the expenses of the fund for the periods ended October 31, 2005 and October 31, 2004 reflect a reduction of 0.03% and less than 0.01%, respectively, of average net assets for class B shares (Notes 2 and 5). |
| |
| (e) | Amount represents less than $0.01 per share. |
| |
| (f) | Portfolio turnover excludes dollar roll transactions. |
| |
| (g) | Portfolio turnover excludes certain treasury note transactions executed in connection with a short-term trading strategy. |
| |
| | The accompanying notes are an integral part of these financial statements. |
| |
82
Financial highlights (For a common share outstanding throughout the period)
| CLASS C | | | | | |
|
| PER-SHARE OPERATING PERFORMANCE | | | | |
|
| | | | Year ended | | |
| | 10/31/05 | 10/31/04 | 10/31/03 | 10/31/02 | 10/31/01 |
|
| Net asset value, | | | | | |
| beginning of period | $6.84 | $6.67 | $6.57 | $6.67 | $6.27 |
|
| Investment operations: | | | | | |
| Net investment income (a) | .18(d) | .14(d) | .20 | .26 | .32 |
|
| Net realized and unrealized | | | | | |
| gain (loss) on investments | (.16) | .18 | .11 | (.06) | .45 |
|
| Total from | | | | | |
| investment operations | .02 | .32 | .31 | .20 | .77 |
|
| Less distributions: | | | | | |
| From net investment income | (.16) | (.15) | (.21) | (.30) | (.37) |
|
| From return of capital | -- | -- | -- | -- | --(e) |
|
| Total distributions | (.16) | (.15) | (.21) | (.30) | (.37) |
|
| Redemption fees | --(e) | --(e) | -- | -- | -- |
|
| Net asset value, | | | | | |
| end of period | $6.70 | $6.84 | $6.67 | $6.57 | $6.67 |
|
| Total return at | | | | | |
| net asset value (%)(b) | 0.28 | 4.79 | 4.70 | 3.18 | 12.61 |
|
| |
| RATIOS AND SUPPLEMENTAL DATA | | | | | |
| Net assets, end of period | | | | | |
| (in thousands) | $24,644 | $29,059 | $42,946 | $39,017 | $34,545 |
|
| Ratio of expenses to | | | | | |
| average net assets (%)(c) | 1.73(d) | 1.74(d) | 1.68 | 1.67 | 1.70 |
|
| Ratio of net investment income | | | | | |
| to average net assets (%) | 2.66(d) | 2.10(d) | 2.88 | 4.04 | 5.03 |
|
| Portfolio turnover (%) | 300.04(f ) | 441.06 | 251.00(g) | 268.10(g) | 233.83(g) |
| (a) | Per share net investment income has been determined on the basis of the weighted average number of shares outstanding during the period. |
| |
| (b) | Total return assumes dividend reinvestment and does not reflect the effect of sales charges. |
| |
| (c) | The ratio of expenses to average net assets includes amounts paid through expense offset arrangements (Note 2). |
| |
| (d) | Reflects an involuntary contractual expense limitation and waivers of certain fund expenses in connection with investments in Putnam Prime Money Market Fund during the period. As a result of such limitation and waivers, the expenses of the fund for the periods ended October 31, 2005 and October 31, 2004 reflect a reduction of 0.03% and less than 0.01%, respectively, of average net assets for class C shares (Notes 2 and 5). |
| |
| (e) | Amount represents less than $0.01 per share. |
| |
| (f) | Portfolio turnover excludes dollar roll transactions. |
| |
| (g) | Portfolio turnover excludes certain treasury note transactions executed in connection with a short-term trading strategy. |
| |
| | The accompanying notes are an integral part of these financial statements. |
| |
83
Financial highlights (For a common share outstanding throughout the period)
| CLASS M | | | | | |
|
| PER-SHARE OPERATING PERFORMANCE | | | | |
|
| | | | Year ended | | |
| | 10/31/05 | 10/31/04 | 10/31/03 | 10/31/02 | 10/31/01 |
|
| Net asset value, | | | | | |
| beginning of period | $6.80 | $6.63 | $6.54 | $6.64 | $6.25 |
|
| Investment operations: | | | | | |
| Net investment income (a) | .21(d) | .17(d) | .23 | .30 | .37 |
|
| Net realized and unrealized | | | | | |
| gain (loss) on investments | (.15) | .18 | .10 | (.06) | .42 |
|
| Total from | | | | | |
| investment operations | .06 | .35 | .33 | .24 | .79 |
|
| Less distributions: | | | | | |
| From net investment income | (.20) | (.18) | (.24) | (.34) | (.40) |
|
| From return of capital | -- | -- | -- | -- | --(e) |
|
| Total distributions | (.20) | (.18) | (.24) | (.34) | (.40) |
|
| Redemption fees | --(e) | --(e) | -- | -- | -- |
|
| Net asset value, | | | | | |
| end of period | $6.66 | $6.80 | $6.63 | $6.54 | $6.64 |
|
| Total return at | | | | | |
| net asset value (%)(b) | 0.84 | 5.40 | 5.12 | 3.77 | 13.10 |
|
| |
| RATIOS AND SUPPLEMENTAL DATA | | | | | |
| Net assets, end of period | | | | | |
| (in thousands) | $420,886 | $556,725 | $884,380 | $1,465,393 | $1,024,351 |
|
| Ratio of expenses to | | | | | |
| average net assets (%)(c) | 1.23(d) | 1.24(d) | 1.18 | 1.17 | 1.20 |
|
| Ratio of net investment income | | | | | |
| to average net assets (%) | 3.15(d) | 2.62(d) | 3.48 | 4.56 | 5.74 |
|
| Portfolio turnover (%) | 300.04(f ) | 441.06 | 251.00(g) | 268.10(g) | 233.83(g) |
| (a) | Per share net investment income has been determined on the basis of the weighted average number of shares outstanding during the period. |
| |
| (b) | Total return assumes dividend reinvestment and does not reflect the effect of sales charges. |
| |
| (c) | The ratio of expenses to average net assets includes amounts paid through expense offset arrangements (Note 2). |
| |
| (d) | Reflects an involuntary contractual expense limitation and waivers of certain fund expenses in connection with investments in Putnam Prime Money Market Fund during the period. As a result of such limitation and waivers, the expenses of the fund for the periods ended October 31, 2005 and October 31, 2004 reflect a reduction of 0.03% and less than 0.01%, respectively, of average net assets for class M shares (Notes 2 and 5). |
| |
| (e) | Amount represents less than $0.01 per share. |
| |
| (f) | Portfolio turnover excludes dollar roll transactions. |
| |
| (g) | Portfolio turnover excludes certain treasury note transactions executed in connection with a short-term trading strategy. |
| |
| | The accompanying notes are an integral part of these financial statements. |
| |
84
Financial highlights (For a common share outstanding throughout the period)
| CLASS R | | | |
|
| | PER-SHARE OPERATING PERFORMANCE | | |
|
| | | Year ended | Year ended | Period |
| | | 10/31/05 | 10/31/04 | 1/21/03†-10/31/03 |
|
|
| | Net asset value, | | | |
| | beginning of period | $6.87 | $6.69 | $6.65 |
|
| | Investment operations: | | | |
| | Net investment income (a) | .23(d) | .18(d) | .18 |
|
| | Net realized and unrealized | | | |
| | gain (loss) on investments | (.18) | .18 | .03 |
|
| | Total from | | | |
| | investment operations | .05 | .36 | .21 |
|
| | Less distributions: | | | |
| | From net investment income | (.20) | (.18) | (.17) |
|
| | Total distributions | (.20) | (.18) | (.17) |
|
| | Redemption fees | --(e) | --(e) | -- |
|
| | Net asset value, | | | |
| | end of period | $6.72 | $6.87 | $6.69 |
|
| | Total return at | | | |
| | net asset value (%)(b) | 0.72 | 5.47 | 3.14* |
|
| |
| | RATIOS AND SUPPLEMENTAL DATA | | | |
| | Net assets, end of period | | | |
| | (in thousands) | $400 | $62 | $1 |
|
| | Ratio of expenses to | | | |
| | average net assets (%)(c) | 1.23(d) | 1.24(d) | .92* |
|
| | Ratio of net investment income | | | |
| | to average net assets (%) | 3.29(d) | 2.57(d) | 2.65* |
|
| | Portfolio turnover (%) | 300.04(f ) | 441.06 | 251.00(g) |
| |
| † | Commencement of operations. | | | |
| * | Not annualized. | | | |
| (a) | Per share net investment income has been determined on the basis of the weighted average number of shares outstanding during the period. |
| |
| (b) | Total return assumes dividend reinvestment. |
| |
| (c) | The ratio of expenses to average net assets includes amounts paid through expense offset arrangements (Note 2). |
| |
| (d) | Reflects an involuntary contractual expense limitation and waivers of certain fund expenses in connection with investments in Putnam Prime Money Market Fund during the period. As a result of such limitation and waivers, the expenses of the fund for the periods ended October 31, 2005 and October 31, 2004 reflect a reduction of 0.03% and less than 0.01%, respectively, of average net assets for class R shares (Notes 2 and 5). |
| |
| (e) | Amount represents less than $0.01 per share. |
| |
| (f) | Portfolio turnover excludes dollar roll transactions. |
| |
| (g) | Portfolio turnover excludes certain treasury note transactions executed in connection with a short-term trading strategy. |
| |
| | The accompanying notes are an integral part of these financial statements. |
| |
85
Financial highlights (For a common share outstanding throughout the period)
| CLASS Y | | | | | |
|
| PER-SHARE OPERATING PERFORMANCE | | | | |
|
| | | | Year ended | | |
| | 10/31/05 | 10/31/04 | 10/31/03 | 10/31/02 | 10/31/01 |
|
| Net asset value, | | | | | |
| beginning of period | $6.91 | $6.72 | $6.63 | $6.72 | $6.31 |
|
| Investment operations: | | | | | |
| Net investment income (a) | .25(d) | .21(d) | .26 | .33 | .39 |
|
| Net realized and unrealized | | | | | |
| gain (loss) on investments | (.16) | .19 | .10 | (.06) | .45 |
|
| Total from | | | | | |
| investment operations | .09 | .40 | .36 | .27 | .84 |
|
| Less distributions: | | | | | |
| From net investment income | (.23) | (.21) | (.27) | (.36) | (.43) |
|
| From return of capital | -- | -- | -- | -- | --(e) |
|
| Total distributions | (.23) | (.21) | (.27) | (.36) | (.43) |
|
| Redemption fees | --(e) | --(e) | -- | -- | -- |
|
| Net asset value, | | | | | |
| end of period | $6.77 | $6.91 | $6.72 | $6.63 | $6.72 |
|
| Total return at | | | | | |
| net asset value (%)(b) | 1.28 | 6.06 | 5.50 | 4.26 | 13.73 |
|
| |
| RATIOS AND SUPPLEMENTAL DATA | | | | | |
| Net assets, end of period | | | | | |
| (in thousands) | $1,029,647 | $880,124 | $712,232 | $530,302 | $234,826 |
|
| Ratio of expenses to | | | | | |
| average net assets (%)(c) | .73(d) | .74(d) | .68 | .67 | .70 |
|
| Ratio of net investment income | | | | | |
| to average net assets (%) | 3.69(d) | 3.01(d) | 3.82 | 5.03 | 6.23 |
|
| Portfolio turnover (%) | 300.04(f ) | 441.06 | 251.00(g) | 268.10(g) | 233.83(g) |
| (a) | Per share net investment income has been determined on the basis of the weighted average number of shares outstanding during the period. |
| |
| (b) | Total return assumes dividend reinvestment. |
| |
| (c) | The ratio of expenses to average net assets includes amounts paid through expense offset arrangements (Note 2). |
| |
| (d) | Reflects an involuntary contractual expense limitation and waivers of certain fund expenses in connection with investments in Putnam Prime Money Market Fund during the period. As a result of such limitation and waivers, the expenses of the fund for the periods ended October 31, 2005 and October 31, 2004 reflect a reduction of 0.03% and less than 0.01%, respectively, of average net assets for class Y shares (Notes 2 and 5). |
| |
| (e) | Amount represents less than $0.01 per share. |
| |
| (f) | Portfolio turnover excludes dollar roll transactions. |
| |
| (g) | Portfolio turnover excludes certain treasury note transactions executed in connection with a short-term trading strategy. |
| |
| | The accompanying notes are an integral part of these financial statements. |
| |
86
Notes to financial statements 10/31/05
Note 1: Significant accounting policies
Putnam Income Fund (the “fund”), a Massachusetts business trust, is registered under the Investment Company Act of 1940, as amended, as a diversi-fied, open-end management investment company. The fund seeks high current income consistent with what Putnam Investment Management, LLC (“Putnam Management”), the fund’s manager, an indirect wholly-owned subsidiary of Putnam, LLC, believes to be prudent risk. The fund invests in a portfolio of debt securities composed mainly of corporate bonds, government obligations and securitized fixed-income securities, and may invest in preferred stocks and common stocks.
The fund offers class A, class B, class C, class M, class R and class Y shares. Class A and class M shares are sold with a maximum front-end sales charge of 3.75% and 3.25%, respectively, and generally do not pay a contingent deferred sales charge. Prior to April 1, 2005, the maximum front-end sales charge for class A shares was 4.50% . Class B shares, which convert to class A shares after approximately eight years, do not pay a front-end sales charge and are subject to a contingent deferred sales charge, if those shares are redeemed within six years of purchase. Class C shares are subject to the same fees as class B shares, except that class C shares have a one-year 1.00% contingent deferred sales charge and do not convert to class A shares. Class R shares, which are offered to qualified employee-benefit plans are sold without a front-end sales charge or a contingent deferred sales charge. The expenses for class A, class B, class C, class M and class R shares may differ based on the distribution fee of each class, which is identified in Note 2. Class Y shares, which are sold at net asset value, are generally subject to the same expenses as class A, class B, class C, class M and class R shares, but do not bear a distribution fee. Class Y shares are sold to certain eligible purchasers including certain defined contribution plans (including corporate IRAs), bank trust departments, trust companies, other Putnam funds and products, and certain college savings plans.
A 2.00% redemption fee may apply to any shares that are redeemed (either by selling or exchanging into another fund) within 5 days of purchase. The redemption fee is accounted for as an addition to paid-in-capital.
Investment income, realized and unrealized gains and losses and expenses of the fund are borne pro-rata based on the relative net assets of each class to the total net assets of the fund, except that each class bears expenses unique to that class (including the distribution fees applicable to such classes). Each class votes as a class only with respect to its own distribution plan or other matters on which a class vote is required by law or determined by the Trustees. Shares of each class would receive their pro-rata share of the net assets of the fund, if the fund were liquidated. In addition, the Trustees declare separate dividends on each class of shares.
In the normal course of business, the fund enters into contracts that may include agreements to indemnify another party under given circumstances. The fund’s maximum exposure under these arrangements is unknown as this would involve future claims that may be, but have not yet been, made against the fund. However, the fund expects the risk of material loss to be remote.
The following is a summary of significant accounting policies consistently followed by the fund in the preparation of its financial statements. The preparation of financial statements is in conformity with accounting principles generally accepted in the United States of America and requires management to make estimates and assumptions that affect the reported amounts of assets and liabilities in the financial statements and the reported amounts of increases and decreases in net assets from operations during the reporting period. Actual results could differ from those estimates.
A) Security valuation Market quotations are not considered to be readily available for certain debt obligations; such investments are valued on the basis of valuations furnished by an independent pricing service approved by the Trustees or dealers selected
87
by Putnam Management. Such services or dealers determine valuations for normal institutional-size trading units of such securities using methods based on market transactions for comparable securities and various relationships, generally recognized by institutional traders, between securities. Many securities markets and exchanges outside the U.S. close prior to the close of the New York Stock Exchange and therefore the closing prices for securities in such markets or on such exchanges may not fully reflect events that occur after such close but before the close of the New York Stock Exchange. Accordingly, on certain days, the fund will fair value foreign securities taking into account multiple factors, including movements in the U.S. securities markets. The number of days on which fair value prices will be used will depend on market activity and it is possible that fair value prices will be used by the fund to a significant extent. Securities quoted in foreign currencies, if any, are translated into U.S. dollars at the current exchange rate. Short-term investments having remaining maturities of 60 days or less are valued at amortized cost, which approximates fair value. Other investments, including certain restricted securities, are valued at fair value following procedures approved by the Trustees. Such valuations and procedures are reviewed periodically by the Trustees.
B) Joint trading account Pursuant to an exemptive order from the Securities and Exchange Commission, the fund may transfer uninvested cash balances, including cash collateral received under security lending arrangements, into a joint trading account along with the cash of other registered investment companies and certain other accounts managed by Putnam Management. These balances may be invested in issues of high-grade, short-term investments having maturities of up to 397 days for collateral received under security lending arrangements and up to 90 days for other cash investments.
C) Repurchase agreements The fund, or any joint trading account, through its custodian, receives delivery of the underlying securities, the market value of which at the time of purchase is required to be in an amount at least equal to the resale price, including accrued interest. Collateral for certain tri-party repurchase agreements is held at the counterparty’s custodian in a segregated account for the benefit of the fund and the coun-terparty. Putnam Management is responsible for determining that the value of these underlying securities is at all times at least equal to the resale price, including accrued interest.
D) Security transactions and related investment income Security transactions are recorded on the trade date (date the order to buy or sell is executed). Gains or losses on securities sold are determined on the identified cost basis. Interest income is recorded on the accrual basis.
All premiums/discounts are amortized/accreted on a yield-to-maturity basis.
Securities purchased or sold on a forward commitment or delayed delivery basis may be settled a month or more after the trade date; interest income is accrued based on the terms of the securities. Losses may arise due to changes in the market value of the underlying securities or if the counterparty does not perform under the contract.
E) Stripped mortgage-backed securities The fund may invest in stripped mortgage-backed securities which represent a participation in mortgage loans and may be structured in classes with rights to receive different portions of the interest and principal. Interest-only securities receive all of the interest and principal-only securities receive all of the principal. If the interest-only securities experience greater than anticipated prepayments of principal, the fund may fail to recoup fully its initial investment in these securities. Conversely, principal-only securities increase in value if prepayments are greater than anticipated and decline if prepayments are slower than anticipated. The market value of these securities is highly sensitive to changes in interest rates.
F) Futures and options contracts The fund may use futures and options contracts to hedge against changes in the values of securities the fund owns
88
or expects to purchase. The fund may also write options on swaps or securities it owns or in which it may invest to increase its current returns.
The potential risk to the fund is that the change in value of futures and options contracts may not correspond to the change in value of the hedged instruments. In addition, losses may arise from changes in the value of the underlying instruments, if there is an illiquid secondary market for the contracts, or if the counterparty to the contract is unable to perform. Risks may exceed amounts recognized on the statement of assets and liabilities. When the contract is closed, the fund records a realized gain or loss equal to the difference between the value of the contract at the time it was opened and the value at the time it was closed. Realized gains and losses on purchased options are included in realized gains and losses on investment securities. If a written call option is exercised, the premium originally received is recorded as an addition to sales proceeds. If a written put option is exercised, the premium originally received is recorded as a reduction to the cost of investments.
Futures contracts are valued at the quoted daily settlement prices established by the exchange on which they trade. The fund and the broker agree to exchange an amount of cash equal to the daily fluctuation in the value of the futures contract. Such receipts or payments are known as “variation margin.” Exchange traded options are valued at the last sale price, or if no sales are reported, the last bid price for purchased options and the last ask price for written options. Options traded over-the-counter are valued using prices supplied by dealers. Futures and written option contracts outstanding at period end, if any, are listed after the fund’s portfolio.
G) Total return swap contracts The fund may enter into total return swap contracts, which are arrangements to exchange a market-linked return for a periodic payment, both based on a notional principal amount. To the extent that the total return of the security, index or other financial measure underlying the transaction exceeds or falls short of the offsetting interest rate obligation, the fund will receive a payment from or make a payment to the counterparty. Total return swap contracts are marked-to-market daily based upon quotations from market makers and the change, if any, is recorded as unrealized gain or loss. Payments received or made are recorded as realized gains or loss. The fund could be exposed to credit or market risk due to unfavorable changes in the fluctuation of interest rates or in the price of the underlying security or index, the possibility that there is no liquid market for these agreements or that the counterparty may default on its obligation to perform. Risk of loss may exceed amounts recognized on the statement of assets and liabilities. Total return swap contracts outstanding at period end, if any, are listed after the fund’s portfolio.
H) Interest rate swap contracts The fund may enter into interest rate swap contracts, which are arrangements between two parties to exchange cash flows based on a notional principal amount, to manage the fund’s exposure to interest rates. Interest rate swap contracts are marked-to-market daily based upon quotations from market makers and the change, if any, is recorded as unrealized gain or loss. Payments received or made are recorded as realized gains or loss. The fund could be exposed to credit or market risk due to unfavorable changes in the fluctuation of interest rates or if the counterparty defaults on its obligation to perform. Risk of loss may exceed amounts recognized on the statement of assets and liabilities. Interest rate swap contracts outstanding at period end, if any, are listed after the fund’s portfolio.
I) Credit default contracts The fund may enter into credit default contracts where one party, the protection buyer, makes an upfront or periodic payment to a counterparty, the protection seller, in exchange for the right to receive a contingent payment. The maximum amount of the payment may equal the notional amount, at par, of the underlying index or security as a result of a related credit event. An upfront payment received by the
89
fund, as the protection seller, is recorded as a liability on the fund’s books. An upfront payment made by the fund, as the protection buyer, is recorded as an asset on the fund’s books. Periodic payments received or paid by the fund are recorded as realized gains or losses. The credit default contracts are marked-to-market daily based upon quotations from market makers and the change, if any, is recorded as unrealized gain or loss. Payments received or made as a result of a credit event or termination of the contract are recognized, net of a proportional amount of the upfront payment, as realized gains or losses. In addition to bearing the risk that the credit event will occur, the fund could be exposed to market risk due to unfavorable changes in interest rates or in the price of the underlying security or index, the possibility that the fund may be unable to close out its position at the same time or at the same price as if it had purchased comparable publicly traded securities or that the counterparty may default on its obligation to perform. Risks of loss may exceed amounts recognized on the statement of assets and liabilities. Credit default contracts outstanding at period end, if any, are listed after the fund’s portfolio.
J) TBA purchase commitments The fund may enter into “TBA” (to be announced) commitments to purchase securities for a fixed unit price at a future date beyond customary settlement time. Although the unit price has been established, the principal value has not been finalized. However, the amount of the commitments will not significantly differ from the principal amount. The fund holds, and maintains until settlement date, cash or high-grade debt obligations in an amount sufficient to meet the purchase price, or the fund may enter into offsetting contracts for the forward sale of other securities it owns. Income on the securities will not be earned until settlement date. TBA purchase commitments may be considered securities themselves, and involve a risk of loss if the value of the security to be purchased declines prior to the settlement date, which risk is in addition to the risk of decline in the value of the fund’s other assets. Unsettled TBA purchase commitments are valued at fair value of the underlying securities, according to the procedures described under “Security valuation” above. The contract is marked-to-market daily and the change in market value is recorded by the fund as an unrealized gain or loss.
Although the fund will generally enter into TBA purchase commitments with the intention of acquiring securities for its portfolio or for delivery pursuant to options contracts it has entered into, the fund may dispose of a commitment prior to settlement if Putnam Management deems it appropriate to do so.
K) TBA sale commitments The fund may enter into TBA sale commitments to hedge its portfolio positions or to sell mortgage-backed securities it owns under delayed delivery arrangements. Proceeds of TBA sale commitments are not received until the contractual settlement date. During the time a TBA sale commitment is outstanding, equivalent deliverable securities or an offsetting TBA purchase commitment deliverable on or before the sale commitment date, are held as “cover” for the transaction.
Unsettled TBA sale commitments are valued at fair value of the underlying securities, generally according to the procedures described under “Security valuation” above. The contract is marked-to-market daily and the change in market value is recorded by the fund as an unrealized gain or loss. If the TBA sale commitment is closed through the acquisition of an offsetting purchase commitment, the fund realizes a gain or loss. If the fund delivers securities under the commitment, the fund realizes a gain or a loss from the sale of the securities based upon the unit price established at the date the commitment was entered into. TBA sale commitments outstanding at period end, if any, are listed after the fund’s portfolio.
L) Dollar rolls To enhance returns, the fund may enter into dollar rolls (principally using TBAs) in
90
which the fund sells securities for delivery in the current month and simultaneously contracts to purchase similar securities on a specified future date. During the period between the sale and subsequent purchase, the fund will not be entitled to receive income and principal payments on the securities sold. The fund will, however, retain the difference between the initial sales price and the forward price for the future purchase. The fund will also be able to earn interest on the cash proceeds that are received from the initial sale. The fund may be exposed to market or credit risk if the price of the security changes unfavorably or the counterparty fails to perform under the terms of the agreement.
M) Security lending The fund may lend securities, through its agents, to qualified borrowers in order to earn additional income. The loans are collateralized by cash and/or securities in an amount at least equal to the market value of the securities loaned. The market value of securities loaned is determined daily and any additional required collateral is allocated to the fund on the next business day. The risk of borrower default will be borne by the fund’s agents; the fund will bear the risk of loss with respect to the investment of the cash collateral. Income from securities lending is included in investment income on the statement of operations. At October 31, 2005, the value of securities loaned amounted to $6,225,281. The fund received cash collateral of $6,393,090, which is pooled with collateral of other Putnam funds into 16 issues of high-grade, short-term investments.
N) Federal taxes It is the policy of the fund to distribute all of its taxable income within the prescribed time and otherwise comply with the provisions of the Internal Revenue Code of 1986 (the “Code”) applicable to regulated investment companies. It is also the intention of the fund to distribute an amount sufficient to avoid imposition of any excise tax under Section 4982 of the Code, as amended. Therefore, no provision has been made for federal taxes on income, capital gains or unrealized appreciation on securities held nor for excise tax on income and capital gains.
At October 31, 2005, the fund had a capital loss carryover of $106,146,176 available to the extent allowed by the Code to offset future net capital gain, if any. The amount of the carryover and the expiration dates are:
| Loss Carryover | Expiration |
| $81,110,898 | October 31, 2008 |
|
| 9,580,324 | October 31, 2009 |
|
| 15,454,954 | October 31, 2013 |
|
O) Distributions to shareholders Distributions to shareholders from net investment income are recorded by the fund on the ex-dividend date. Distributions from capital gains, if any, are recorded on the ex-dividend date and paid at least annually. The amount and character of income and gains to be distributed are determined in accordance with income tax regulations, which may differ from generally accepted accounting principles. These differences include temporary and permanent differences of losses on wash sale transactions, defaulted bond interest, both realized and unrealized gains and losses on certain futures contracts, market discount and income on swap contracts. Reclassifications are made to the fund’s capital accounts to reflect income and gains available for distribution (or available capital loss carryovers) under income tax regulations. For the year ended October 31, 2005, the fund reclassified $8,843,527 to increase undistributed net investment income, with an increase to accumulated net realized loss of $8,843,527.
The tax basis components of distributable earnings and the federal tax cost as of period end were as follows:
| Unrealized appreciation | $ 17,767,424 |
| Unrealized depreciation | (71,139,731) |
| | ---------------------------- |
| Net unrealized depreciation | (53,372,307) |
| Undistributed ordinary income | 22,197,926 |
| Capital loss carryforward | (106,146,176) |
| Cost for federal income | |
| tax purposes | $2,938,024,697 |
91
Note 2: Management fee, administrative services and other transactions
Putnam Management is paid for management and investment advisory services quarterly based on the average net assets of the fund. Such fee is based on the following annual rates: 0.65% of the first $500 million of average net assets, 0.55% of the next $500 million, 0.50% of the next $500 million, 0.45% of the next $5 billion, 0.425% of the next $5 billion, 0.405% of the next $5 billion, 0.39% of the next $5 billion and 0.38% thereafter.
Putnam Management has agreed to waive fees and reimburse expenses of the fund through October 31, 2006, to the extent necessary to ensure that the fund’s expenses do not exceed the simple average of the expenses of all front-end load funds viewed by Lipper Inc. as having the same investment classification or objective as the fund. The expense reimbursement is based on a comparison of the fund’s expenses with the average annualized operating expenses of the funds in its Lipper peer group for each calendar quarter during the fund’s last fiscal year, excluding 12b-1 fees and without giving effect to any expense offset and brokerage service arrangements that may reduce fund expenses. For the year ended October 31, 2005, Putnam Management waived $163,522 of its management fee from the fund.
For the year ended October 31, 2005, Putnam Management has assumed $32,334 of legal, shareholder servicing and communication, audit and Trustee fees incurred by the fund in connection with certain legal and regulatory matters (including those described in Note 6).
The fund reimburses Putnam Management an allocated amount for the compensation and related expenses of certain officers of the fund and their staff who provide administrative services to the fund. The aggregate amount of all such reimbursements is determined annually by the Trustees.
Custodial functions for the fund’s assets are provided by Putnam Fiduciary Trust Company (“PFTC”), a subsidiary of Putnam, LLC. PFTC receives fees for custody services based on the fund’s asset level, the number of its security holdings and transaction volumes. Putnam Investor Services, a division of PFTC, provides investor servicing agent functions to the fund. Putnam Investor Services receives fees for investor servicing based on the number of shareholder accounts in the fund and the level of defined contribution plan assets in the fund. During the year ended October 31, 2005, the fund paid PFTC $5,875,242 for these services.
The fund has entered into an arrangement with PFTC whereby credits realized as a result of uninvested cash balances are used to reduce a portion of the fund’s expenses. For the year ended October 31, 2005, the fund’s expenses were reduced by $413,187 under these arrangements.
Each independent Trustee of the fund receives an annual Trustee fee, of which $672, as a quarterly retainer, has been allocated to the fund, and an additional fee for each Trustees meeting attended. Trustees receive additional fees for attendance at certain committee meetings, industry seminars and for certain compliance-related matters. Trustees also are reimbursed for expenses they incur relating to their services as Trustees. George Putnam, III, who is not an independent Trustee, also receives the foregoing fees for his services as Trustee.
The fund has adopted a Trustee Fee Deferral Plan (the “Deferral Plan”) which allows the Trustees to defer the receipt of all or a portion of Trustees fees payable on or after July 1, 1995. The deferred fees remain invested in certain Putnam funds until distribution in accordance with the Deferral Plan.
The fund has adopted an unfunded noncontributory defined benefit pension plan (the “Pension Plan”) covering all Trustees of the fund who have served as a Trustee for at least five years and were first elected prior to 2004. Benefits under the Pension Plan are equal to 50% of the Trustee’s average total retainer and meeting fees for the three years preceding retirement. Pension expense for the fund is included in Trustee compensation and expenses in the statement of
92
operations. Accrued pension liability is included in Payable for Trustee compensation and expenses in the statement of assets and liabilities. The Trustees have terminated the Pension Plan with respect to any Trustee first elected after 2003.
The fund has adopted distribution plans (the “Plans”) with respect to its class A, class B, class C, class M and class R shares pursuant to Rule 12b-1 under the Investment Company Act of 1940. The purpose of the Plans is to compensate Putnam Retail Management, a wholly-owned subsidiary of Putnam, LLC and Putnam Retail Management GP, Inc., for services provided and expenses incurred in distributing shares of the fund. The Plans provide for payments by the fund to Putnam Retail Management at an annual rate of up to 0.35%, 1.00%, 1.00%, 1.00% and 1.00% of the average net assets attributable to class A, class B, class C, class M and class R shares, respectively. The Trustees have approved payment by the fund at an annual rate of 0.25%, 1.00%, 1.00%, 0.50% and 0.50% of the average net assets attributable to class A, class B, class C, class M and class R shares, respectively.
For the year ended October 31, 2005, Putnam Retail Management, acting as underwriter, received net commissions of $69,225 and $10,473 from the sale of class A and class M shares, respectively, and received $497,859 and $2,899 in contingent deferred sales charges from redemptions of class B and class C shares, respectively. A deferred sales charge of up to 1.00% and 0.40% is assessed on certain redemptions of class A and class M shares, respectively. For the year ended October 31, 2005, Putnam Retail Management, acting as underwriter, received $5,001 and no monies on class A and class M redemptions, respectively.
Note 3: Purchases and sales of securities
During the year ended October 31, 2005, cost of purchases and proceeds from sales of investment securities other than U.S. government securities and short-term investments aggregated $7,056,582,194 and $6,402,387,698, respectively. Purchases and sales of U.S. government securities aggregated $65,476,041 and $96,232,324, respectively.
Written option transactions during the year are summarized as follows:
| | Contract | Premiums |
| | Amounts | Received |
|
| Written options | | |
| outstanding at | | |
| beginning of year | -- | $ -- |
|
| Options opened | 431,208,000 | 16,722,902 |
| Options exercised | -- | -- |
| Options expired | -- | -- |
| Options closed | (204,148,000) | (7,941,356) |
|
| Written options | | |
| outstanding at | | |
| end of year | 227,060,000 | $ 8,781,546 |
|
Note 4: Capital shares
At October 31, 2005, there was an unlimited number of shares of beneficial interest authorized. Transactions in capital shares were as follows:
| CLASS A | Shares | Amount |
| Year ended 10/31/05: | |
| Shares sold | 28,549,022 | $ 195,259,865 |
|
| Shares issued | | |
| in connection | | |
| with reinvestment | | |
| of distributions | 3,607,625 | 24,625,810 |
|
| | 32,156,647 | 219,885,675 |
|
| Shares | | |
| repurchased | (45,988,258) | (314,498,488) |
|
| Net decrease | (13,831,611) | $ (94,612,813) |
| |
| Year ended 10/31/04: | |
| Shares sold | 31,909,191 | $ 215,884,659 |
|
| Shares issued | | |
| in connection | | |
| with reinvestment | | |
| of distributions | 3,924,327 | 26,568,614 |
|
| | 35,833,518 | 242,453,273 |
|
| Shares | | |
| repurchased | (83,555,493) | (563,786,160) |
|
| Net decrease | (47,721,975) | $(321,332,887) |
93
| CLASS B | Shares | Amount |
| Year ended 10/31/05: | |
| Shares sold | 3,215,026 | $ 21,861,360 |
|
| Shares issued | | |
| in connection | | |
| with reinvestment | | |
| of distributions | 810,070 | 5,496,954 |
|
| | 4,025,096 | 27,358,314 |
|
| Shares | | |
| repurchased | (17,067,474) | (115,938,880) |
|
| Net decrease | (13,042,378) | $ (88,580,566) |
| |
| Year ended 10/31/04: | |
| Shares sold | 5,965,748 | $ 40,111,036 |
|
| Shares issued | | |
| in connection | | |
| with reinvestment | | |
| of distributions | 1,058,264 | 7,119,883 |
|
| | 7,024,012 | 47,230,919 |
|
| Shares | | |
| repurchased | (37,941,033) | (254,154,887) |
|
| Net decrease | (30,917,021) | $(206,923,968) |
|
| |
| CLASS C | Shares | Amount |
| Year ended 10/31/05: | |
| Shares sold | 672,677 | $ 4,585,391 |
|
| Shares issued | | |
| in connection | | |
| with reinvestment | | |
| of distributions | 73,906 | 502,858 |
|
| | 746,583 | 5,088,249 |
|
| Shares | | |
| repurchased | (1,317,468) | (8,972,166) |
|
| Net decrease | (570,885) | $ (3,883,917) |
| |
| Year ended 10/31/04: | |
| Shares sold | 647,675 | $ 4,369,481 |
|
| Shares issued | | |
| in connection | | |
| with reinvestment | | |
| of distributions | 83,989 | 566,659 |
|
| | 731,664 | 4,936,140 |
|
| Shares | | |
| repurchased | (2,926,972) | (19,647,559) |
|
| Net decrease | (2,195,308) | $(14,711,419) |
| CLASS M | Shares | Amount | |
| Year ended 10/31/05: | | |
| Shares sold | 1,021,945 | $ 6,911,699 |
|
| Shares issued | | | |
| in connection | | | |
| with reinvestment | | | |
| of distributions | 73,581 | 497,166 | |
|
| | 1,095,526 | 7,408,865 |
|
| Shares | | | |
| repurchased | (19,762,113) | (133,762,035) |
|
| Net decrease | (18,666,587) | $(126,353,170) |
| |
| Year ended 10/31/04: | | |
| Shares sold | 1,986,876 | $ 13,366,689 |
|
| Shares issued | | | |
| in connection | | | |
| with reinvestment | | | |
| of distributions | 90,333 | 585,650 | |
|
| | 2,077,209 | 13,952,339 |
|
| Shares | | | |
| repurchased | (53,602,766) | (357,675,112) |
|
| Net decrease | (51,525,557) | $(343,722,773) |
|
| |
| CLASS R | Shares | Amount | |
| Year ended 10/31/05: | | |
| Shares sold | 63,879 | $ 436,963 |
|
| Shares issued | | | |
| in connection | | | |
| with reinvestment | | | |
| of distributions | 1,331 | 9,087 | |
|
| | 65,210 | 446,050 | |
|
| Shares | | | |
| repurchased | (14,732) | (100,565) |
|
| Net increase | 50,478 | $ 345,485 |
| |
| Year ended 10/31/04: | | |
| Shares sold | 9,565 | $ 65,384 | |
|
| Shares issued | | | |
| in connection | | | |
| with reinvestment | | | |
| of distributions | 33 | 224 | |
|
| | 9,598 | 65,608 | |
|
| Shares | | | |
| repurchased | (703) | (4,826) | |
|
| Net increase | 8,895 | $ 60,782 | |
94
| CLASS Y | Shares | Amount |
| Year ended 10/31/05: | |
| Shares sold | 58,704,093 | $ 403,381,794 |
|
| Shares issued | | |
| in connection | | |
| with reinvestment | | |
| of distributions | 4,658,864 | 31,990,509 |
|
| | 63,362,957 | 435,372,303 |
|
| Shares | | |
| repurchased | (38,682,139) | (266,051,830) |
|
| Net increase | 24,680,818 | $ 169,320,473 |
| |
| Year ended 10/31/04: | |
| Shares sold | 56,419,971 | $ 384,844,473 |
|
| Shares issued | | |
| in connection | | |
| with reinvestment | | |
| of distributions | 3,518,688 | 23,947,431 |
|
| | 59,938,659 | 408,791,904 |
|
| Shares | | |
| repurchased | (38,418,296) | (260,640,040) |
|
| Net increase | 21,520,363 | $ 148,151,864 |
Note 5: Investment in Putnam Prime Money Market Fund
Pursuant to an exemptive order from the Securities and Exchange Commission, the fund invests in Putnam Prime Money Market Fund, an open-end management investment company managed by Putnam Management. Management fees paid by the fund are reduced by an amount equal to the management and administrative services fees paid by Putnam Prime Money Market Fund with respect to assets invested by the fund in Putnam Prime Money Market Fund. For the year ended October 31, 2005, management fees paid were reduced by $563,331 relating to the fund’s investment in Putnam Prime Money Market Fund. Income distributions earned by the fund are recorded as income in the statement of operations and totaled $9,530,693 for the year ended October 31, 2005. During the year ended October 31, 2005, cost of purchases and cost of sales of investments in Putnam Prime Money Market Fund aggregated $1,626,049,170 and $1,703,022,482, respectively.
Note 6: Regulatory matters and litigation
Putnam Management has entered into agreements with the Securities and Exchange Commission and the Massachusetts Securities Division settling charges connected with excessive short-term trading by Putnam employees and, in the case of the charges brought by the Massachusetts Securities Division, by participants in some Putnam-administered 401(k) plans. Pursuant to these settlement agreements, Putnam Management will pay a total of $193.5 million in penalties and restitution, with $153.5 million being paid to shareholders and the funds. The amount will be allocated to shareholders and funds pursuant to a plan developed by an independent consultant, and will be paid following approval of the plan by the SEC and the Massachusetts Securities Division.
The Securities and Exchange Commission’s and Massachusetts Securities Division’s allegations and related matters also serve as the general basis for numerous lawsuits, including purported class action lawsuits filed against Putnam Management and certain related parties, including certain Putnam funds. Putnam Management will bear any costs incurred by Putnam funds in connection with these lawsuits. Putnam Management believes that the likelihood that the pending private lawsuits and purported class action lawsuits will have a material adverse financial impact on the fund is remote, and the pending actions are not likely to materially affect its ability to provide investment management services to its clients, including the Putnam funds.
Putnam Investments has recorded a charge of $30 million for the estimated cost, excluding interest, that it believes will be necessary to address issues relating to the calculation of certain amounts paid by the Putnam mutual funds in previous years. The previous payments were cost reimbursements by the Putnam funds to Putnam for transfer agent services relating to defined
95
contribution operations. Putnam currently anticipates that any payments made by Putnam related to this issue will be paid to the Putnam funds. Review of this issue is ongoing.
Putnam Management and Putnam Retail Management are named as defendants in a civil suit in which the plaintiffs allege that the management and distribution fees paid by certain Putnam funds were excessive and seek recovery under the Investment Company Act of 1940. Putnam Management and Putnam Retail Management have contested the plaintiffs’ claims and the matter is currently pending in the U.S. District Court for the District of Massachusetts. Based on currently available information, Putnam Management believes that this action is without merit and that it is unlikely to have a material effect on Putnam Management’s and Putnam Retail Management’s ability to provide services to their clients, including the fund.
96
Federal tax information
(Unaudited)
|
The Form 1099 you receive in January 2006 will show the tax status of all distributions paid to your account in calendar 2005.
97
Jameson A. Baxter (Born 1943), Trustee since 1994, Vice Chairman since 2005
Ms. Baxter is the President of Baxter Associates, Inc., a private investment firm that she founded in 1986.
Ms. Baxter serves as a Director of ASHTA Chemicals, Inc., Banta Corporation (a printing and digital imaging firm), Ryerson Tull, Inc. (a steel service corporation), the Mutual Fund Directors Forum, Advocate Health Care and BoardSource, formerly the National Center for Nonprofit Boards. She is Chairman Emeritus of the Board of Trustees, Mount Holyoke College, having served as Chairman for five years and as a board member for thirteen years. Until 2002, Ms. Baxter was a Director of Intermatic Corporation (a manufacturer of energy control products).
Ms. Baxter has held various positions in investment banking and corporate finance, including Vice President and Principal of the Regency Group, and Vice President of and Consultant to First Boston Corporation. She is a graduate of Mount Holyoke College.
Charles B. Curtis (Born 1940), Trustee since 2001
Mr. Curtis is President and Chief Operating Officer of the Nuclear Threat Initiative (a private foundation dealing with national security issues) and serves as Senior Advisor to the United Nations Foundation.
Mr. Curtis is a member of the Council on Foreign Relations and the Trustee Advisory Council of the Applied Physics Laboratory, Johns Hopkins University. Until 2003, Mr. Curtis was a member of the Electric Power Research Institute Advisory Council and the University of Chicago Board of Governors for Argonne National Laboratory. Prior to 2002, Mr. Curtis was a Member of the Board of Directors of the Gas Technology Institute and the Board of Directors of the Environment and Natural Resources Program Steering Committee, John F. Kennedy School of Government, Harvard University. Until 2001, Mr. Curtis was a member of the Department of Defense Policy Board and Director of EG&G Technical Services, Inc. (a fossil energy research and development support company).
From August 1997 to December 1999, Mr. Curtis was a Partner at Hogan & Hartson L.L.P., a Washington, D.C. law firm. Prior to May 1997, Mr. Curtis was Deputy Secretary of Energy. He served as Chairman of the Federal Energy Regulatory Commission from 1977 to 1981 and has held positions on the staff of the U.S. House of Representatives, the U.S. Treasury Department, and the SEC.
98
Myra R. Drucker (Born 1948), Trustee since 2004
Ms. Drucker is a Vice Chair of the Board of Trustees of Sarah Lawrence College, a Trustee of Commonfund (a not-for-profit firm specializing in asset management for educational endowments and foundations) and a member of the Investment Committee of the Kresge Foundation (a charitable trust).
Ms. Drucker is an ex-officio member of the New York Stock Exchange (NYSE) Pension Managers Advisory Committee, having served as Chair for seven years and a member of the Executive Committee of the Committee on Investment of Employee Benefit Assets. She is Chair of the Advisory Board of Hamilton Lane Advisors (an investment management firm) and a member of the Advisory Board of RCM (an investment management firm). Until August 31, 2004, Ms. Drucker was Managing Director and a member of the Board of Directors of General Motors Asset Management and Chief Investment Officer of General Motors Trust Bank. Ms. Drucker also served as a member of the NYSE Corporate Accountability and Listing Standards Committee and the NYSE/NASD IPO Advisory Committee.
Prior to joining General Motors Asset Management in 2001, Ms. Drucker held various executive positions in the investment management industry. Ms. Drucker served as Chief Investment Officer of Xerox Corporation (a technology and service company in the document industry), where she was responsible for the investment of the company’s pension assets. Ms. Drucker was also Staff Vice President and Director of Trust Investments for International Paper (a paper, paper distribution, packaging and forest products company) and previously served as Manager of Trust Investments for Xerox Corporation. Ms. Drucker received a B.A. degree in Literature and Psychology from Sarah Lawrence College and pursued graduate studies in economics, statistics and portfolio theory at Temple University.
John A. Hill (Born 1942), Trustee since 1985 and Chairman since 2000
Mr. Hill is Vice Chairman of First Reserve Corporation, a private equity buyout firm that specializes in energy investments in the diversified worldwide energy industry.
Mr. Hill is a Director of Devon Energy Corporation, TransMontaigne Oil Company and various private companies controlled by First Reserve Corporation, as well as Chairman of TH Lee, Putnam Investment Trust (a closed-end investment company advised by an affiliate of Putnam Management). He is also a Trustee of Sarah Lawrence College. Until 2005, he was a Director of Continuum Health Partners of New York.
Prior to acquiring First Reserve Corporation in 1983, Mr. Hill held executive positions in investment banking and investment management with several firms and with the federal government, including Deputy Associate Director of the Office of Management and Budget and Deputy
99
Director of the Federal Energy Administration. He is active in various business associations, including the Economic Club of New York, and lectures on energy issues in the United States and Europe. Mr. Hill holds a B.A. degree in Economics from Southern Methodist University and pursued graduate studies there as a Woodrow Wilson Fellow.
Paul L. Joskow (Born 1947), Trustee since 1997
|
Dr. Joskow is the Elizabeth and James Killian Professor of Economics and Management, and Director of the Center for Energy and Environmental Policy Research at the Massachusetts Institute of Technology.
Dr. Joskow serves as a Director of National Grid plc (a UK-based holding company with interests in electric and gas transmission and distribution and telecommunications infrastructure) and TransCanada Corporation (an energy company focused on natural gas transmission and power services). He also serves on the Board of Overseers of the Boston Symphony Orchestra. Prior to February 2005, he served on the board of the Whitehead Institute for Biomedical Research (a non-profit research institution) and has been President of the Yale University Council since 1993. Prior to February 2002, he was a Director of State Farm Indemnity Company (an automobile insurance company), and, prior to March 2000, he was a Director of New England Electric System (a public utility holding company).
Dr. Joskow has published five books and numerous articles on topics in industrial organization, government regulation of industry, and competition policy. He is active in industry restructuring, environmental, energy, competition and privatization policies -- serving as an advisor to governments and corporations worldwide. Dr. Joskow holds a Ph.D. and M. Phil from Yale University and a B.A. from Cornell University.
Elizabeth T. Kennan (Born 1938), Trustee since 1992
Dr. Kennan is a Partner of Cambus-Kenneth Farm (thoroughbred horse and cattle breeding). She is President Emeritus of Mount Holyoke College.
Dr. Kennan served as Chairman and is now Lead Director of Northeast Utilities. Until 2005, she was a Director of Talbots, Inc. She has served as Director on a number of other boards, including Bell Atlantic, Chastain Real Estate, Shawmut Bank, Berkshire Life Insurance and Kentucky Home Life Insurance. She is a Trustee of the National Trust for Historic Preservation, of Centre College and of Midway College in Midway, Kentucky. She is also a member of The Trustees of Reservations. Dr. Kennan has served on the oversight committee of the Folger Shakespeare Library, as President of Five Colleges Incorporated, as a Trustee of Notre Dame University and is active in various educational and civic associations.
100
As a member of the faculty of Catholic University for twelve years, until 1978, Dr. Kennan directed the post-doctoral program in Patristic and Medieval Studies, taught history and published numerous articles. Dr. Kennan holds a Ph.D. from the University of Washington in Seattle, an M.S. from St. Hilda’s College at Oxford University and an A.B. from Mount Holyoke College. She holds several honorary doctorates.
John H. Mullin, III (Born 1941), Trustee since 1997
Mr. Mullin is the Chairman and CEO of Ridgeway Farm (a limited liability company engaged in timber and farming).
Mr. Mullin serves as a Director of The Liberty Corporation (a broadcasting company), Progress Energy, Inc. (a utility company, formerly known as Carolina Power & Light) and Sonoco Products, Inc. (a packaging company). Mr. Mullin is Trustee Emeritus of The National Humanities Center and Washington & Lee University, where he served as Chairman of the Investment Committee. Prior to May 2001, he was a Director of Graphic Packaging International Corp. Prior to February 2004, he was a Director of Alex Brown Realty, Inc.
Mr. Mullin is also a past Director of Adolph Coors Company; ACX Technologies, Inc.; Crystal Brands, Inc.; Dillon, Read & Co., Inc.; Fisher-Price, Inc.; and The Ryland Group, Inc. Mr. Mullin is a graduate of Washington & Lee University and The Wharton Graduate School, University of Pennsylvania.
Robert E. Patterson (Born 1945), Trustee since 1984
Mr. Patterson is Senior Partner of Cabot Properties, L.P. and Chairman of Cabot Properties, Inc. (a private equity firm investing in commercial real estate).
Mr. Patterson serves as Chairman Emeritus and Trustee of the Joslin Diabetes Center and as a Director of Brandywine Trust Group, LLC. Prior to June 2003, he was a Trustee of Sea Education Association. Prior to December 2001, he was President and Trustee of Cabot Industrial Trust (a publicly traded real estate investment trust). Prior to February 1998, he was Executive Vice President and Director of Acquisitions of Cabot Partners Limited Partnership (a registered investment adviser involved in institutional real estate investments). Prior to 1990, he served as Executive Vice President of Cabot, Cabot & Forbes Realty Advisors, Inc. (the predecessor company of Cabot Partners).
Mr. Patterson practiced law and held various positions in state government and was the founding Executive Director of the Massachusetts Industrial Finance Agency. Mr. Patterson is a graduate of Harvard College and Harvard Law School.
101
W. Thomas Stephens (Born 1942), Trustee since 1997
Mr. Stephens is Chairman and Chief Executive Officer of Boise Cascade, L.L.C. (a paper, forest products and timberland assets company).
Until 2004, Mr. Stephens was a Director of Xcel Energy Incorporated (a public utility company), Qwest Communications, and Norske Canada, Inc. (a paper manufacturer). Until 2003, Mr. Stephens was a Director of Mail-Well, Inc. (a diversified printing company). He served as Chairman of Mail-Well until 2001 and as CEO of MacMillan-Bloedel, Ltd. (a forest products company) until 1999.
Prior to 1996, Mr. Stephens was Chairman and Chief Executive Officer of Johns Manville Corporation. He holds B.S. and M.S. degrees from the University of Arkansas.
Richard B. Worley (Born 1945), Trustee since 2004
Mr. Worley is Managing Partner of Permit Capital LLC, an investment management firm.
Mr. Worley serves on the Executive Committee of the University of Pennsylvania Medical Center, is a Trustee of The Robert Wood Johnson Foundation (a philanthropic organization devoted to health care issues) and is a Director of The Colonial Williamsburg Foundation (a historical preservation organization). Mr. Worley also serves on the investment committees of Mount Holyoke College and World Wildlife Fund (a wildlife conservation organization).
Prior to joining Permit Capital LLC in 2002, Mr. Worley served as Chief Strategic Officer of Morgan Stanley Investment Management. He previously served as President, Chief Executive Officer and Chief Investment Officer of Morgan Stanley Dean Witter Investment Management and as a Managing Director of Morgan Stanley, a financial services firm. Mr. Worley also was the Chairman of Miller Anderson & Sherrerd, an investment management firm.
Mr. Worley holds a B.S. degree from University of Tennessee and pursued graduate studies in economics at the University of Texas.
102
| | Charles E. Haldeman, Jr.* (Born 1948), Trustee since 2004 |
| |
| | Mr. Haldeman is President and Chief Executive Officer of Putnam, LLC (“Putnam Investments”). He is a member of Putnam Investments’ Executive Board of Directors and Advisory Council. Prior to November 2003, Mr. Haldeman served as Co-Head of Putnam Investments’ Investment Division. |
| |
| | Prior to joining Putnam Investments in 2002, Mr. Haldeman held executive positions in the invest- ment management industry. He previously served as Chief Executive Officer of Delaware Investments and President & Chief Operating Officer of United Asset Management. Mr. Haldeman was also a partner and director of Cooke & Bieler, Inc. (an investment management firm). |
| |
| | Mr. Haldeman currently serves as a Trustee of Dartmouth College and is a member of the Partners HealthCare Systems Investment Committee. He is a graduate of Dartmouth College, Harvard Law School and Harvard Business School. Mr. Haldeman is also a Chartered Financial Analyst (CFA) charterholder. |
| |
| | George Putnam, III* (Born 1951), Trustee since 1984 and President since 2000 |
| |
| | Mr. Putnam is President of New Generation Research, Inc. (a publisher of financial advisory and other research services), and of New Generation Advisers, Inc. (a registered investment advisor to private funds). Mr. Putnam founded the New Generation companies in 1986. |
| |
| | Mr. Putnam is a Director of The Boston Family Office, LLC (a registered investment adviser). He is a Trustee of St. Mark’s School and Shore Country Day School, and until 2002 was a Trustee of the Sea Education Association. |
| |
| | Mr. Putnam previously worked as an attorney with the law firm of Dechert LLP (formerly known as Dechert Price & Rhoads) in Philadelphia. He is a graduate of Harvard College, Harvard Business School and Harvard Law School. |
| |
| | The address of each Trustee is One Post Office Square, Boston, MA 02109. |
| |
| | As of October 31, 2005, there were 108 Putnam Funds. All Trustees serve as Trustees of all Putnam funds. Each Trustee serves for an indefinite term, until his or her resignation, retirement at age 72, death, or removal. |
| |
| * | Trustees who are or may be deemed to be “interested persons” (as defined in the Investment Company Act of 1940) of the fund, Putnam Management, Putnam Retail Management, or Marsh & McLennan Companies, Inc., the parent company of Putnam, LLC and its affiliated companies. Messrs. Haldeman and Putnam, III are deemed “interested persons” by virtue of their positions as officers of the fund, Putnam Management or Putnam Retail Management and as shareholders of Marsh & McLennan Companies, Inc. Mr. Putnam, III is the President of your fund and each of the other Putnam funds. Mr. Haldeman is President and Chief Executive Officer of Putnam Investments. |
| |
103
Officers
In addition to George Putnam, III, the other officers of the fund are shown below:
| Charles E. Porter (Born 1938) |
| Executive Vice President, Associate Treasurer |
| and Principal Executive Officer |
| Since 1989 |
Jonathan S. Horwitz (Born 1955) |
| Senior Vice President and Treasurer |
| Since 2004 |
Prior to 2004, Managing Director, |
| Putnam Investments |
Steven D. Krichmar (Born 1958) |
| Vice President and Principal Financial Officer |
| Since 2002 |
Senior Managing Director, Putnam |
| Investments. Prior to July 2001, Partner, |
| PricewaterhouseCoopers LLP |
Michael T. Healy (Born 1958) |
| Assistant Treasurer and Principal |
| Accounting Officer |
| Since 2000 |
Managing Director, Putnam Investments |
Beth S. Mazor (Born 1958) |
| Vice President |
| Since 2002 |
Senior Vice President, Putnam Investments |
Daniel T. Gallagher (Born 1962) |
| Senior Vice President, Staff Counsel |
| and Compliance Liaison |
| Since 2004 |
Prior to 2004, Associate, Ropes & Gray LLP; |
| prior to 2000, Law Clerk, Massachusetts |
| Supreme Judicial Court |
Francis J. McNamara, III (Born 1955) |
| Vice President and Chief Legal Officer |
| Since 2004 |
Senior Managing Director, Putnam |
| Investments, Putnam Management |
| and Putnam Retail Management. Prior |
| to 2004, General Counsel, State Street |
| Research & Management Company |
| James P. Pappas (Born 1953) |
| Vice President |
| Since 2004 |
Managing Director, Putnam Investments |
| and Putnam Management. During 2002, |
| Chief Operating Officer, Atalanta/Sosnoff |
| Management Corporation; prior to 2001, |
| President and Chief Executive Officer, |
| UAM Investment Services, Inc. |
Richard S. Robie, III (Born 1960) |
| Vice President |
| Since 2004 |
Senior Managing Director, Putnam |
| Investments, Putnam Management |
| and Putnam Retail Management. Prior |
| to 2003, Senior Vice President, United |
| Asset Management Corporation |
Charles A. Ruys de Perez (Born 1957) |
| Vice President and Chief Compliance Officer |
| Since 2004 |
Managing Director, Putnam Investments |
Mark C. Trenchard (Born 1962) |
| Vice President and BSA Compliance Officer |
| Since 2002 |
Senior Vice President, Putnam Investments |
Judith Cohen (Born 1945) |
| Vice President, Clerk and Assistant Treasurer |
| Since 1993 |
Wanda M. McManus (Born 1947) |
| Vice President, Senior Associate Treasurer |
| and Assistant Clerk |
| Since 2005 |
Nancy T. Florek (Born 1957) |
| Vice President, Assistant Clerk, |
| Assistant Treasurer and Proxy Manager |
| Since 2005 |
The address of each Officer is One Post Office Square, Boston, MA 02109.
104
Services for shareholders
|
Help your investment grow Set up a program for systematic investing with as little as $25 a month from a Putnam fund or from your own savings or checking account. (Regular investing does not guarantee a profit or protect against loss in a declining market.)
Switch funds easily* You can move money from one Putnam fund to another within the same class of shares without a service charge.
Access your money easily You can have checks sent regularly or redeem shares any business day at the then-current net asset value, which may be more or less than the original cost of the shares. Class B and class C shares carry a sales charge that is applied to certain withdrawals.
How to buy additional shares You may buy shares through your financial advisor or directly from Putnam. To open an account by mail, send a check made payable to the name of the fund along with a completed fund application. To add to an existing account, complete the investment slip found at the top of your Confirmation of Activity statement and return it with a check payable to your fund.
Visit www.putnam.com A secure section of our Web site contains complete information on your account, including balances and transactions, updated daily. You may also conduct transactions, such as exchanges, additional investments, and address changes. Log on today to get your password.
Call us toll free at 1-800-225-1581 Ask a helpful Putnam representative or your financial advisor for details about any of these or other services, or see your prospectus.
*This privilege is subject to change or termination. An exchange of funds may result in a taxable event. In addition, a 2% redemption fee will be applied to shares exchanged or sold within 5 days of purchase, and certain funds have imposed a 1% redemption fee on total assets redeemed or exchanged between 6 and 90 days of purchase.
105
The Putnam
family of funds
|
The following is a complete list of Putnam’s open-end mutual funds. Investors should carefully consider the investment objective, risks, charges, and expenses of a fund before investing. For a prospectus containing this and other information for any Putnam fund or product, call your financial advisor at 1-800-225-1581 and ask for a prospectus. Please read the prospectus carefully before investing.
| Growth funds | Value funds |
| Discovery Growth Fund | Classic Equity Fund |
| Growth Opportunities Fund | Convertible Income-Growth Trust |
| Health Sciences Trust | Equity Income Fund |
| International New Opportunities Fund* | The George Putnam Fund of Boston |
| New Opportunities Fund | The Putnam Fund for Growth |
| OTC & Emerging Growth Fund | and Income |
| Small Cap Growth Fund | International Growth and Income Fund* |
| Vista Fund | Mid Cap Value Fund |
| Voyager Fund | New Value Fund |
| | Small Cap Value Fund† |
| |
| Blend funds | Income funds |
| Capital Appreciation Fund | American Government Income Fund |
| Capital Opportunities Fund | Diversified Income Trust |
| Europe Equity Fund* | Floating Rate Income Fund |
| Global Equity Fund* | Global Income Trust* |
| Global Natural Resources Fund* | High Yield Advantage Fund*† |
| International Capital | High Yield Trust* |
| Opportunities Fund* | Income Fund |
| International Equity Fund* | Limited Duration Government |
| Investors Fund | Income Fund‡ |
| Research Fund | Money Market Fund§ |
| Tax Smart Equity Fund® | U.S. Government Income Trust |
| Utilities Growth and Income Fund | |
| * A 1% redemption fee on total assets redeemed or exchanged between 6 and 90 days of purchase may be imposed for all share |
| classes of these funds. |
† Closed to new investors. |
‡ Formerly Putnam Intermediate U.S. Government Income Fund. |
§ An investment in a money market fund is not insured or guaranteed by the Federal Deposit Insurance Corporation or any |
| other government agency. Although the fund seeks to preserve your investment at $1.00 per share, it is possible to lose money |
| by investing in the fund. |
106
| Tax-free income funds |
| AMT-Free Insured Municipal Fund** |
| Tax Exempt Income Fund |
| Tax Exempt Money Market Fund§ |
| Tax-Free High Yield Fund |
State tax-free income funds: |
| Arizona, California, Florida, Massachusetts, |
| Michigan, Minnesota, New Jersey, New York, |
| Ohio, and Pennsylvania |
| |
| Asset allocation funds |
| Income Strategies Fund |
Putnam Asset Allocation Funds -- three |
| investment portfolios that spread your |
| money across a variety of stocks, bonds, |
| and money market investments. |
The three portfolios: |
| Asset Allocation: Balanced Portfolio |
| Asset Allocation: Conservative Portfolio |
| Asset Allocation: Growth Portfolio |
| Putnam RetirementReady® Funds |
| Putnam RetirementReady Funds -- ten |
| investment portfolios that offer diversifica- |
| tion among stocks, bonds, and money |
| market instruments and adjust to become |
| more conservative over time based on a |
| target date for withdrawing assets. |
The ten funds: |
| Putnam RetirementReady 2050 Fund |
| Putnam RetirementReady 2045 Fund |
| Putnam RetirementReady 2040 Fund |
| Putnam RetirementReady 2035 Fund |
| Putnam RetirementReady 2030 Fund |
| Putnam RetirementReady 2025 Fund |
| Putnam RetirementReady 2020 Fund |
| Putnam RetirementReady 2015 Fund |
| Putnam RetirementReady 2010 Fund |
| Putnam RetirementReady Maturity Fund |
| ** | Formerly Putnam Tax-Free Insured Fund. |
| |
| | With the exception of money market funds, a 2% redemption fee may be applied to shares exchanged or sold within 5 days of purchase. |
| |
| | Check your account balances and the most recent month-end performance at www.putnam.com. |
| |
107
Putnam puts your
interests first
|
In January 2004, Putnam began introducing a number of voluntary initiatives designed to reduce fund expenses, provide investors with more useful information, and help safeguard the interests of all Putnam investors. Visit www.putnam.com for details.
Reduced sales charges The maximum sales charge for class A shares has been reduced to 5.25% for equity funds (formerly 5.75%) and 3.75% for most income funds (formerly 4.50%) . The maximum sales charge for class M shares has been reduced to 3.25% for equity funds (formerly 3.50%) .*
Lower class B purchase limit To help ensure that investors are in the most cost-effective share class, the maximum amount that can be invested in class B shares has been reduced to $100,000. (Larger trades or accumulated amounts will be refused.)
Ongoing expenses will be limited Through calendar 2006, total ongoing expenses, including management fees for all funds, will be maintained at or below the average of each fund’s industry peers in its Lipper load-fund universe. For more information, please see the Statement of Additional information.
Putnam fund prospectuses and shareholder reports have been revised to disclose additional information that will help shareholders compare funds and weigh their costs and risks along with their potential benefits. Shareholders will find easy-to-understand information about fund expense ratios, portfolio manager compensation, risk comparisons, turnover comparisons, brokerage commissions, and employee and trustee ownership of Putnam funds. Disclosure of breakpoint discounts has also been enhanced to alert investors to potential cost savings.
Protecting investors’ interests
|
Short-term trading fee introduced To discourage short-term trading, which can interfere with a fund’s long-term strategy, a 2% short-term trading fee may be imposed on any Putnam fund shares (other than money market funds) redeemed or exchanged within five calendar days of purchase.
| * | The maximum sales charge for class A shares of Putnam Limited Duration Government Income Fund (formerly Putnam Intermediate U.S. Government Income Fund) and Putnam Floating Rate Income Fund remains 3.25%. |
| |
108
Founded over 65 years ago, Putnam Investments was built around the concept that a balance between risk and reward is the hallmark of a well-rounded financial program. We manage over 100 mutual funds in growth, value, blend, fixed income, and international.
| Investment Manager |
| Putnam Investment |
| Management, LLC |
| One Post Office Square |
| Boston, MA 02109 |
Marketing Services |
| Putnam Retail Management |
| One Post Office Square |
| Boston, MA 02109 |
Custodian |
| Putnam Fiduciary |
| Trust Company |
Legal Counsel |
| Ropes & Gray LLP |
Independent Registered |
| Public Accounting Firm |
| KPMG LLP |
Trustees |
| John A. Hill, Chairman |
| Jameson Adkins Baxter, |
| Vice Chairman |
| Charles B. Curtis |
| Myra R. Drucker |
| Charles E. Haldeman, Jr. |
| Paul L. Joskow |
| Elizabeth T. Kennan |
| John H. Mullin, III |
| Robert E. Patterson |
| George Putnam, III |
| W. Thomas Stephens |
| Richard B. Worley |
Officers |
George Putnam, III |
| President |
Charles E. Porter |
| Executive Vice President, |
| Associate Treasurer and |
| Principal Executive Officer |
Jonathan S. Horwitz |
| Senior Vice President |
| and Treasurer |
Steven D. Krichmar |
| Vice President and |
| Principal Financial Officer |
Michael T. Healy |
| Assistant Treasurer and |
| Principal Accounting Officer |
Beth S. Mazor |
| Vice President |
Daniel T. Gallagher |
| Senior Vice President, |
| Staff Counsel and |
| Compliance Liaison |
| James P. Pappas |
| Vice President |
Richard S. Robie, III |
| Vice President |
Mark C. Trenchard |
| Vice President and |
| BSA Compliance Officer |
Francis J. McNamara, III |
| Vice President and |
| Chief Legal Officer |
Charles A. Ruys de Perez |
| Vice President and |
| Chief Compliance Officer |
Judith Cohen |
| Vice President, Clerk and |
| Assistant Treasurer |
Wanda M. McManus |
| Vice President, Senior Associate |
| Treasurer and Assistant Clerk |
Nancy T. Florek |
| Vice President, Assistant Clerk, |
| Assistant Treasurer |
| and Proxy Manager |
This report is for the information of shareholders of Putnam Income Fund. It may also be used as sales literature when preceded or accompanied by the current prospectus, the most recent copy of Putnam’s Quarterly Performance Summary, and Putnam’s Quarterly Ranking Summary. For more recent performance, please visit www.putnam.com. Investors should carefully consider the investment objective, risks, charges, and expenses of a fund, which are described in its prospectus. For this and other information or to request a prospectus, call 1-800-225-1581 toll free. Please read the prospectus carefully before investing. The fund’s Statement of Additional Information contains additional information about the fund’s Trustees and is available without charge upon request by calling 1-800-225-1581.

(a) All officers of the Fund, including its principal executive, financial and accounting officers, are employees of Putnam Investment Management, LLC, the Fund's investment manager. As such they are subject to a comprehensive Code of Ethics adopted and administered by Putnam Investments which is designed to protect the interests of the firm and its clients. The Fund has adopted a Code of Ethics which incorporates the Code of Ethics of Putnam Investments with respect to all of its officers and Trustees who are employees of Putnam Investment Management, LLC. For this reason, the Fund has not adopted a separate code of ethics governing its principal executive, financial and accounting officers.
(c) In July 2004, Putnam Investment Management, LLC, the Fund's investment manager, Putnam Retail Management Limited Partnership, the Fund's principal underwriter, and Putnam Investments Limited, the sub-manager for a portion of the assets of certain funds as determined by Putnam Management from time to time, adopted several amendments to their Code of Ethics. Some of these amendments were adopted as a result of Putnam Investment Management's partial settlement order with the SEC on November 13, 2003. Insofar as such Code of Ethics applies to the Fund's principal executive officer, principal financial officer and principal accounting officer, the amendments provided for the following: (i) a 90-day blackout period for all shares of Putnam open-end funds (except for money market funds) purchased or sold (including exchanges into or out of a fund) by Putnam employees and certain family members; (ii) a one-year holding period for all access persons that operates in the same manner as the 90-day rule; (iii) delivery by Putnam employees to the Code of Ethics Administrator of both quarterly account statements for all brokerage accounts (irrespective of activity in the accounts) and account statements for any Putnam funds not held at Putnam or for any funds sub-advised by Putnam; (iv) a prohibition of Putnam employees from making more than 25 trades in individual securities in their personal accounts in any given quarter; (v) the extension of the existing prohibition of access persons from a purchase and sale or sale and purchase of an individual security within 60 days to include trading based on tax-lot election; (vi) the inclusion of trades in Marsh & McLennan Companies, Inc. (ultimate parent company of Putnam Investment Management) securities in pre-clearance and reporting requirements; (vii) a prohibition of limit and good-until-canceled orders as inconsistent with the requirements of daily pre-clearance; (viii) new limits and procedures for accounts managed by outside managers and brokers, in order for trading in such accounts to be exempt from pre-clearance requirements; (ix) a new gift and entertainment policy that imposes a reporting obligation on all meals and entertainment and new limits on non-meal entertainment; (x) a number of alternatives for the reporting of irregular activity.
In December 2004, additional amendments to the Code of Ethics were adopted. Insofar as such Code of Ethics applies to the Fund's principal executive officer, principal financial officer and principal accounting officer, the amendments provided for the following: (i) implementation of minimum monetary sanctions for violations of the Code; (ii) expansion of the definition of "access person" under the Code include all Putnam employees with access to non-public information regarding Putnam-managed mutual fund portfolio holdings; (iii) lengthening the period during which access persons are required to complete quarterly reports; (iv) reducing the maximum number of trades than can be made by Putnam employees in their personal accounts in
any calendar quarter from 25 trades to 10 trades; and (v) lengthening the required holding period for securities by access persons from 60 days to 90 days.
In March 2005, additional amendments to the Code of Ethics were adopted, that went into effect on April 1, 2005. Insofar as such Code of Ethics applies to the Fund’s principal executive officer, principal financial officer and principal accounting officer, the amendments (i) prohibit Putnam employees and their immediate family members from having any direct or indirect personal financial interest in companies that do business with Putnam (excluding investment holdings in public companies that are not material to the employee), unless such interest is disclosed and approved by the Code of Ethics Officer; (ii) prohibit Putnam employees from using Putnam assets, letterhead or other resources in making political or campaign contributions, solicitations or endorsements;(iii) require Putnam employees to obtain pre-clearance of personal political or campaign contributions or other gifts to government officials or political candidates in certain jurisdictions and to officials or candidates with whom Putnam has or is seeking to establish a business relationship and (iv) require Putnam employees to obtain pre-approval from Putnam’s Director of Government Relations prior to engaging in lobbying activities.
In July 2005, additional amendments to the Code of Ethics were adopted. Insofar as such Code of Ethics applies to the Fund's principal executive officer, principal financial officer and principal accounting officer, the amendments provided for an exception to the standard 90-day holding period (one year, in the case of employees deemed to be “access persons” under the Code) for shares of Putnam mutual funds in the case of redemptions from an employee’s account in a college savings plan qualified under Section 529 of the Internal Revenue Code. Under this exception, an employee may, without penalty under the Code, make “qualified redemptions” of shares from such an account less than 90 days (or one year, as applicable) after purchase. “Qualified redemptions” include redemptions for higher education purposes for the account beneficiary and redemptions made upon death or disability. The July 2005 amendments also provide that an employee may, for purposes of the rule limiting the number of trades per calendar quarter in an employee’s personal account to a maximum of 10, count all trades of the same security in the same direction (all buys or all sells) over a period of five consecutive business days as a single trade.
Item 3. Audit Committee Financial Expert:
The Funds' Audit and Pricing Committee is comprised solely of Trustees who are "independent" (as such term has been defined by the Securities and Exchange Commission ("SEC") in regulations implementing Section 407 of the Sarbanes-Oxley Act (the "Regulations")). The Trustees believe that each of the members of the Audit and Pricing Committee also possess a combination of knowledge and experience with respect to financial accounting matters, as well as other attributes, that qualify them for service on the Committee. In addition, the Trustees have determined that all members of the Funds' Audit and Pricing Committee meet the financial literacy requirements of the New York Stock Exchange's rules and that Mr. Patterson, Mr. Stephens and Mr. Worley qualify as "audit committee financial experts" (as such term has been defined by the Regulations) based on their review of their pertinent experience and education. Certain other Trustees, although not on the Audit and Pricing
Committee, would also qualify as "audit committee financial experts." The SEC has stated that the designation or identification of a person as an audit committee financial expert pursuant to this Item 3 of Form N-CSR does not impose on such person any duties, obligations or liability that are greater than the duties, obligations and liability imposed on such person as a member of the Audit and Pricing Committee and the Board of Trustees in the absence of such designation or identification.
The following table presents fees billed in each of the last two fiscal years for services rendered to the fund by the fund’s independent auditors:
| Fiscal year ended | Audit Fees | Audit-Related Fees | Tax Fees | All Other Fees |
| |
| October 31, 2005 | $ 53,351 | $ - | $ 4,141 | $ - |
| October 31, 2004 | $ 46,890* | $ - | $ 4,100 | $ 655 |
*: Includes fees of $ 3,790 by the fund’s independent auditor to the fund for audit procedures necessitated by regulatory and litigation matters for the fiscal year ended October 31, 2004. These fees were reimbursed to the fund by Putnam.
For the fiscal years ended October 31, 2005 and October 31, 2004, the fund’s independent auditors billed aggregate non-audit fees in the amounts of $4,141 and $4,755 respectively, to the fund, Putnam Management and any entity controlling, controlled by or under common control with Putnam Management that provides ongoing services to the fund.
Audit Fees represents fees billed for the fund’s last two fiscal years.
Audit-Related Fees represents fees billed in the fund’s last two fiscal years for services traditionally performed by the fund’s auditor, including accounting consultation for proposed transactions or concerning financial accounting and reporting standards and other audit or attest services not required by statute or regulation.
Tax Fees represent fees billed in the fund’s last two fiscal years for tax compliance, tax planning and tax advice services. Tax planning and tax advice services include assistance with tax audits, employee benefit plans and requests for rulings or technical advice from taxing authorities.
All Other Fees Fees represent fees billed for services relating to interfund trading.
Pre-Approval Policies of the Audit and Pricing Committee. The Audit and Pricing Committee of the Putnam funds has determined that, as a matter of policy, all work performed for the funds by the funds’ independent auditors will be pre-approved by the Committee and will generally not be subject to pre-approval procedures.
Under certain circumstances, the Audit and Pricing Committee believes that it may be appropriate for Putnam Investment Management, LLC (“Putnam Management”) and certain of its affiliates to engage the services of the funds’ independent auditors, but only after prior approval by the Committee. Such requests are required to be submitted in writing to the Committee and explain, among other things, the nature of the proposed engagement, the estimated fees, and why this work must be performed by that particular audit firm. The Committee will review the proposed engagement at its next meeting.
Since May 6, 2003, all work performed by the independent auditors for the funds, Putnam Management and any entity controlling, controlled by or under common control with Putnam Management that provides ongoing services to the fund was pre-approved by the Committee or a member of the Committee pursuant to the pre-approval policies discussed above. Prior to that date, the Committee had a general policy to pre-approve the independent auditor’s engagements for non-audit services with the funds, Putnam Management and any entity controlling, controlled by or under common control with Putnam Management that provides ongoing services to the fund.
The following table presents fees billed by the fund’s principal auditor for services required to be approved pursuant to paragraph (c)(7)(ii) of Rule 2-01 of Regulation S-X.
| Fiscal year ended | Audit-Related Fees | Tax Fees | All Other Fees | Total |
| | | | | | Non-Audit Fees |
| October 31, 2005 | $- | | $ - | $ - | $ - |
| October 31, 2004 | $- | | $ - | $ - | $ - |
Item 5. Audit Committee:
Not applicable
Item 6. Schedule of Investments:
Not applicable
Item 7. Disclosure of Proxy Voting Policies and Procedures For Closed-End
Management Investment Companies:
Not applicable
Item 8. Purchases of Equity Securities by Closed-End Management Investment
Companies and Affiliated Purchasers:
Not applicable
Item 9. Submission of Matters to a Vote of Security Holders:
Not applicable
Item 10. Controls and Procedures:
(a) The registrant's principal executive officer and principal financial officer have concluded, based on their evaluation of the effectiveness of the design and operation of the registrant's disclosure controls and procedures as of a date within 90 days of the filing date of this report, that the design and operation of such procedures are generally effective to provide reasonable assurance that information required to be disclosed by the registrant in this report is recorded, processed, summarized and reported within the time periods specified in the Commission's rules and forms.
(b) Changes in internal control over financial reporting: Not applicable
Item 11. Exhibits:
(a) Not applicable
(b) A separate certification for each principal executive officer and principal financial officer of the registrant as required by Rule 30a-2 under the Investment Company Act of 1940, as amended, and the officer certifications as required by Section 906 of the Sarbanes-Oxley Act of 2002 are filed herewith.
SIGNATURES
Pursuant to the requirements of the Securities Exchange Act of 1934 and the Investment Company Act of 1940, the registrant has duly caused this report to be signed on its behalf by the undersigned, thereunto duly authorized.
NAME OF REGISTRANT
By (Signature and Title):
/s/ Michael T. Healy
Michael T. Healy
Principal Accounting Officer
Date: December 29, 2005 |
Pursuant to the requirements of the Securities Exchange Act of 1934 and the Investment Company Act of 1940, this report has been signed below by the following persons on behalf of the registrant and in the capacities and on the dates indicated.
By (Signature and Title):
/s/ Charles E. Porter
Charles E. Porter
Principal Executive Officer
Date: December 29, 2005
By (Signature and Title):
/s/Steven D. Krichmar
Steven D. Krichmar
Principal Financial Officer
Date: December 29, 2005 |