UNITED STATES
SECURITIES AND EXCHANGE COMMISSION
Washington, D.C. 20549
|
FORM N-CSR
CERTIFIED SHAREHOLDER REPORT OF REGISTERED
MANAGEMENT INVESTMENT COMPANIES
|
Investment Company Act file number: (811- 00653 )
Exact name of registrant as specified in charter: Putnam Income Fund
Address of principal executive offices: One Post Office Square, Boston, Massachusetts 02109
| Name and address of agent for service: | Beth S. Mazor, Vice President |
| | One Post Office Square |
| | Boston, Massachusetts 02109 |
| |
| Copy to: | John W. Gerstmayr, Esq. |
| | Ropes & Gray LLP |
| | One International Place |
| | Boston, Massachusetts 02110 |
| |
| Registrant’s telephone number, including area code: | (617) 292-1000 |
Date of fiscal year end: October 31, 2006
Date of reporting period: November 1, 2005— April 30, 2006
Item 1. Report to Stockholders:
The following is a copy of the report transmitted to stockholders pursuant to Rule 30e-1 under the Investment Company Act of 1940:

What makes Putnam different?

In 1830, Massachusetts Supreme Judicial Court Justice Samuel Putnam established The Prudent Man Rule, a legal foundation for responsible money management.
THE PRUDENT MAN RULE
All that can be required of a trustee to invest is that he shall conduct himself faithfully and exercise a sound discretion. He is to observe how men of prudence, discretion, and intelligence manage their own affairs, not in regard to speculation, but in regard to the permanent disposition of their funds, considering the probable income, as well as the probable safety of the capital to be invested.

A time-honored tradition in money management
Since 1937, our values have been rooted in a profound sense of responsibility for the money entrusted to us.
A prudent approach to investing
We use a research-driven team approach to seek consistent, dependable, superior investment results over time, although there is no guarantee a fund will meet its objectives.
Funds for every investment goal
We offer a broad range of mutual funds and other financial products so investors and their financial representatives can build diversified portfolios.
A commitment to doing what’s right for investors
We have below-average expenses and stringent investor protections, and provide a wealth of information about the Putnam funds.
Industry-leading service
We help investors, along with their financial representatives, make informed investment decisions with confidence.
4| 30| 06
Semiannual Report
|
| Message from the Trustees | 2 |
| About the fund | 4 |
| Report from the fund managers | 7 |
| Performance | 13 |
| Expenses | 17 |
| Portfolio turnover | 19 |
| Risk | 20 |
| Your fund’s management | 21 |
| Terms and definitions | 24 |
| Trustee approval of management contract | 26 |
| Other information for shareholders | 31 |
| Financial statements | 32 |
Cover photograph: © Richard H. Johnson
Message from the Trustees
|
Dear Fellow Shareholder
In recent months, we have witnessed the continuing vibrancy of the current economic expansion, now in its fifth year. U.S. businesses have seized opportunities available both at home and abroad to generate some of the most impressive profit margins in history, by some measures. During your fund’s reporting period, common stocks have traded at higher levels to reflect improving corporate profits. However, the gains have not come without concerns in some quarters of the market about the risks facing the economy. These risks include high energy prices, inflation, and a potential pullback in consumer spending, as well as the potential adverse effects of the Federal Reserve’s (the Fed’s) series of interest-rate increases. Concerns about inflation, in particular, have been reflected in falling bond prices and rising bond yields, and worries about consumer spending have clouded the outlook for stocks.
You can be assured that the investment professionals managing your fund are closely monitoring the factors that are influencing the performance of the securities in which your fund invests. Moreover, Putnam Investments’ management team, under the leadership of Chief Executive Officer Ed Haldeman, continues to focus on investment performance and remains committed to putting the interests of shareholders first.
2
In the following pages, members of your fund’s management team discuss the fund’s performance and strategies for the fiscal period ended April 30, 2006, and provide their outlook for the months ahead. As always, we thank you for your support of the Putnam funds.

Putnam Income Fund: seeking high current income across a broad range of fixed-income securities

Over Putnam Income Fund’s 50-year history, the bond landscape has undergone a dramatic transformation. One-third of the U.S. investment-grade sector, the fund’s primary focus, is now composed of “securitized” debt instruments, including mortgage- and asset-backed securities. The high-yield corporate bond sector, which was established in the late 1970s, has also grown significantly and is now considered a mature asset class. And outside the United States, there are new opportunities in the debt of developed and emerging-market countries.
Amid this evolution of the fixed-income markets, the investment objective of Putnam Income Fund has remained constant. In a letter to Putnam shareholders in 1963, George Putnam, Jr. (who is currently Chairman Emeritus of the Putnam Funds), expressed it this way: “We have in mind those people who need a liberal current return…” Mr. Putnam’s choice of “current return” rather than “current income” captures the investment philosophy of the team managing your fund today: that high current income should be pursued within a total return context and that risk management is as important as yield in maintaining a high current income stream.
Successful investing in today’s global bond market requires broad expertise. Putnam’s 100-member fixed-income group is divided into teams of specialists who focus on varied investment opportunities. Each team identifies compelling opportunities within its area
Optimizing the risk/return trade-off across multiple sectors
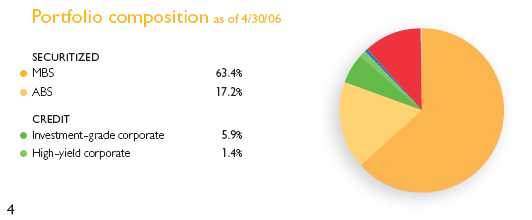
Putnam believes that building a diversified fund’s objectives. The fund’s portfolio is portfolio with multiple income-generating composed of a broad spectrum of government, strategies is the best way to pursue your credit, and securitized debt instruments.
of expertise. Your fund’s management team selects from among these opportunities, systematically building a diversified portfolio that carefully balances risk and return.
Lower-rated bonds may offer higher yields in return for more risk. Mutual funds that invest in government securities are not guaranteed. Mortgage-backed securities are subject to prepayment risk. Mutual funds that invest in bonds are subject to certain risks, including interest-rate risk, credit risk, and inflation risk. As interest rates rise, the prices of bonds fall. Long-term bonds are more exposed to interest-rate risk than short-term bonds. Unlike bonds, bond funds have ongoing fees and expenses. The use of derivatives involves special risks and may result in losses.
Key fixed-income return sources
Government: Interest-rate levels are a primary driver of government bond performance. Generally, bond prices decline when interest rates rise, and rise when interest rates fall. Interest rates — and bond yields — rise and fall according to investor expectations about the overall health of the economy.
Credit: Corporate bond performance tends to track the health of the overall economy more closely than other bonds. These bonds are less sensitive to interest-rate movements; they tend to perform well when the economy strengthens, often in spite of the higher rates that accompany stronger growth.
Securitized: Interest-rate cycles also affect mortgage- and asset-backed securities (MBSs/ABSs). Because MBSs are the securitized cash flows of mortgages, prepayment rates are another consideration. For ABSs, managers monitor the credit quality of the underlying assets, which comprise the securitized cash flow of anything from credit card debt to manufactured housing debt.
5
Putnam Income Fund seeks high current income consistent with what Putnam Management believes to be a prudent level of risk. The fund invests in a diversified portfolio composed mainly of corporate investment-grade bonds, U.S. government and agency bonds, and collateralized mortgage obligations.
| Highlights |
* | During the semiannual period ended April 30, 2006, Putnam Income Fund’s class A shares |
| had a total return of 0.26% without sales charges. |
* | The fund’s benchmark, the Lehman Aggregate Bond Index, returned 0.56%. |
* | The average return for the fund’s Lipper category, Corporate Debt Funds A Rated, |
| was 0.28%. |
* | Additional fund performance, comparative performance, and Lipper data can be found in the |
| performance section beginning on page 13. |
Performance
Total return for class A shares for periods ended 4/30/06
| Since the fund's inception (11/1/54), average annual return is 7.95% at NAV and 7.87% at POP. | |
|
| | Average annual return | Cumulative return |
| | NAV | POP | NAV | POP |
|
| 10 years | 5.10% | 4.70% | 64.49% | 58.26% |
|
| 5 years | 4.65 | 3.86 | 25.51 | 20.82 |
|
| 3 years | 2.59 | 1.31 | 7.98 | 3.97 |
|
| 1 year | 0.23 | –3.57 | 0.23 | –3.57 |
|
| 6 months | — | — | 0.26 | –3.47 |
|
Data is historical. Past performance does not guarantee future results. More recent returns may be less or more than those shown. Investment return and principal value will fluctuate, and you may have a gain or a loss when you sell your shares. Performance assumes reinvestment of distributions and does not account for taxes. Returns at NAV do not reflect a sales charge of 3.75% . For the most recent month-end performance, visit www.putnam.com. For a portion of the period, this fund limited expenses, without which returns would have been lower. A short-term trading fee of up to 2% may apply.
6
Report from the fund managers
|
The period in review
Continuing indications of solid economic growth, and the desire to curb the potential inflation that frequently accompanies such growth, prompted the Fed to continue to raise interest rates during the first half of your fund’s 2006 fiscal year. As interest rates and bond yields rose, bond prices generally fell. However, interest income from the bonds in your fund’s portfolio helped to offset these falling bond prices and resulted in modestly positive returns, based on net asset value (NAV, or without sales charges). These results were in line with the average for the fund’s Lipper group, but slightly behind those of its benchmark. We attribute the underperformance relative to the benchmark to an underweight position in corporate bonds, which strengthened due to continued strong corporate profits and solid economic growth. Performance benefited from a defensive, or short, duration strategy amid rising interest rates and a positioning strategy that we shifted to take advantage of changes in the yield curve. Also, the fund’s strategy in the securitized bond sector contributed positively to returns while its underweight position in dollar-based emerging-market debt detracted from returns.
Market overview
The market environment over the past six months has been challenging for bonds. Interest rates have continued to rise amid signs of stronger-than-expected economic growth. Bond investors closely watch the pace of economic growth, as it can lead to rising inflation, which erodes the value of fixed-income investments. Growth in the United States remained robust, with a surprisingly high first-quarter gross domestic product (GDP) annualized growth rate of 4.8%, continued strong corporate profits, and relatively low unemployment. As a consequence, the Fed raised the federal funds rate four times during the period, pushing up yields on U.S. bonds, which caused their prices to fall.
Economic growth outside the United States is also having an impact on
7
yields and prices of bonds issued here. Demand from non-U.S. investors for higher-yielding U.S. issues has been a key factor in keeping yields relatively low, particularly among longer-maturity bonds. Most noteworthy is the shift of Japan’s economy into a growth mode after a long slump. This shift prompted the Bank of Japan to abandon its extremely loose monetary policy, causing yields on Japanese government bonds to rise. Higher yields in Japan could result in higher yields worldwide, because as Japanese investors begin to divert some of their capital out of the international markets and back to their domestic markets, bond issuers worldwide could be challenged to raise yields to attract these investors.
Performance among credit-sensitive issues, such as corporate bonds and emerging-market debt, benefited from improving economies and rising corporate earnings. In general, the lower its credit rating, the stronger a bond’s performance was during the period, as strong demand from buyers in search of higher yields drove prices higher.
Strategy overview
Your fund employs multiple income-generating strategies across the different U.S. investment-grade bond sectors in pursuit of its objectives. We believe that having diversified return sources contributes to more consistent results over time and helps to manage risk. Generally, our investment decisions
| Market sector performance | |
| These indexes provide an overview of performance in different market sectors for the | |
| six months ended 4/30/06. | |
|
| |
| Bonds | |
|
| Lehman Aggregate Bond Index (broad bond market) | 0.56% |
|
| Lehman Global Aggregate Bond Index (international bonds) | 2.07% |
|
| Lehman Government Bond Index (U.S. Treasury and agency securities) | 0.18% |
|
| Lehman GNMA Index (Government National Mortgage Association bonds) | 1.02% |
|
| Equities | |
|
| S&P 500 Index (broad stock market) | 9.64% |
|
| Russell 2000 Growth Index (small-company growth stocks) | 20.31% |
|
| Russell 2000 Value Index (small-company value stocks) | 17.52% |
|
8
involve the following considerations: duration management, yield curve positioning, sector allocation, and security selection.
In anticipation of continued rising interest rates, we maintained a short (defensive) duration profile for the fund — a strategy that helped performance. Duration, which is measured in years, is the primary indicator of interest-rate sensitivity. The shorter a bond’s duration, the less sensitive its price will be to interest-rate changes.
The fund also benefited from its yield curve positioning. The yield curve is a graphical representation of bond yields with the same quality plotted from the shortest to the longest maturity. As the fiscal year began, the fund was positioned to take advantage of yield-curve flat-tening. Flattening occurs when yields on short- and longer-term securities converge, as was the case early in the period when short-term rates rose faster than long-term rates. However, based on our conviction that conditions were in place for long-term rates to rise, we shifted our strategy to position the fund to benefit from expected yield-curve steepening. This shift helped results as long-term rates did rise later in the period.
In terms of sector and security considerations, we have sought to reduce the level of credit risk in the portfolio over the past two years by reducing the fund’s exposure to corporate and emerging-market debt. (Credit risk is the risk that a bond issuer could default

* Cash exposure includes various derivative investments.
9
and fail to pay interest and repay principal in a timely manner.) As interest rates rise, it becomes more expensive for issuers to borrow money. Increased interest-rate expenses are particularly burdensome for highly leveraged companies or economies. While we expect this strategy to prove rewarding over the long term, it detracted from short-term results as these sectors outperformed during the semiannual period.
Your fund’s holdings
The securitized bond sector remained a key area of focus for the fund. This growing sector is now among the largest within the investment-grade bond universe. The most common securitized bonds are mortgage-backed securities (MBSs) issued by the Federal National Mortgage Association (Fannie Mae) and the Government National Mortgage Association (Ginnie Mae). Other types of securitized bonds include asset-backed securities (ABSs), which are typically backed by car loans and credit card payments, and commercial mortgage-backed securities (CMBSs), which are backed by loans on large commercial real estate projects, such as office parks or shopping malls.
CMBSs were an area of particular focus as we sought to replace the credit risk of corporate bonds with more diversified credit exposure. Securitized bonds typically offer higher income than corporate bonds of comparable credit quality. Another reason for
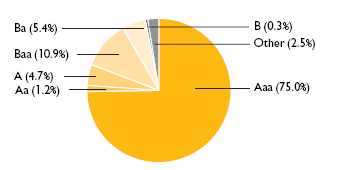
Credit quality overview
Credit qualities shown as a percentage of portfolio value as of 4/30/06. A bond rated Baa or higher is considered investment grade. The chart reflects Moody’s ratings; percentages may include bonds not rated by Moody's but considered by Putnam Management to be of comparable quality. Ratings will vary over time.
10
favoring CMBSs versus corporates was their valuations. The yield spreads on investment-grade corporate bonds versus Treasuries — one means of evaluating the price of corporates on a relative basis — have been at historically low levels. This means that corporates have been very expensive relative to other investment-grade sectors. Based on this measure, we believed that there was greater downside risk in owning corporate bonds. However, yields on corporate bonds continued to tighten against these odds and your fund’s underweight position (relative to the benchmark) hurt results. Strong performance from CMBS holdings helped to offset this somewhat, as did the performance of select corporate bonds the fund held, particularly shorter-duration Ba-rated corporate bonds within the automotive sector.
Another bright spot in our security selection within the securitized bond sector was an emphasis on ABSs backed by manufactured housing and home equity loans. ABSs carry short maturities, which provide us with the flexibility to shift to other fixed-income securities should interest rates rise. In addition, the fund’s collateralized mortgage obligations (CMOs) performed well on a relative basis. CMOs can be further divided into interest-only (IO) and principal-only (PO) securities, which separate the interest and principal payments of a bond into separate cash flows. Although these types of securities exhibit much greater prepayment sensitivity than MBSs, they compensate investors by offering much higher yields. The fund has been combining IOs and POs to create a cash flow that is similar to that of a standard MBSs, but which can be obtained at a lower cost.
Hybrid Adjustable Rate Mortgages
(ARMs) contributed positively to fund results. Hybrid ARMs typically offer borrowers three or five years of payments at a fixed interest rate, after which they become adjustable interest-rate mortgages for which the interest rate is adjusted yearly (3/1 and 5/1 ARMs). According to our analysis, many of these securities have been offering yields that more than compensate for the level of risk they represent. Therefore, they contribute to an attractive risk/return profile for the fund.
The fund’s underweight position in dollar-denominated emerging-market debt detracted from relative results as this segment of the market continued to perform well, and it comprises a small portion of the fund’s benchmark. Rising commodity prices are helping to create positive fundamentals for issuers of emerging-market debt. However, after a prolonged period of strong performance, we have taken a conservative approach with regard to this segment of the market, so the fund did not benefit from its strength to the same extent as many of its peers.
Please note that the holdings discussed in this report may not have been held by the fund for the entire period. Portfolio composition is subject to review in accordance with the fund’s investment strategy and may vary in the future.
11
The outlook for your fund
|
The following commentary reflects anticipated developments that could affect your fund over the next six months, as well as your management team’s plans for responding to them.
With the key federal funds rate at 5%, we believe that the Fed may be nearing the end of its tightening cycle. However, continued solid growth in the United States and Asia (particularly Japan), means that the possibility of globally rising inflation and real interest rates, especially in long-term bonds, will be a major consideration in our strategies for the remainder of the fiscal year and beyond.
Over the near term, we will continue to maintain a cautious stance, reflected in a portfolio with higher credit quality than that of the fund’s benchmark. Currently, we do not believe there is enough reward available in the form of higher interest rates to make it worthwhile for the fund to take on additional credit risk. We have moved to a more neutral stance with regard to the fund’s portfolio duration, as we believe that much of the interest-rate increases have already been priced into the market. Structured securities remain an area of opportunity, particularly CMBSs, ABSs backed by home-equity loans, and CMOs.
We will continue to remain vigilant regarding any possible disruptions to the economy and fixed-income markets, seeking to keep the fund positioned to benefit from opportunities while also avoiding unnecessary risk. We will continue to pursue the fund’s objectives through multiple income-generating strategies across U.S. investment-grade fixed-income sectors and securities.
The views expressed in this report are exclusively those of Putnam Management. They are not meant as investment advice.
Lower-rated bonds may offer higher yields in return for more risk. Mutual funds that invest in government securities are not guaranteed. Mortgage-backed securities are subject to prepayment risk. Mutual funds that invest in bonds are subject to certain risks, including interest-rate risk, credit risk, and inflation risk. As interest rates rise, the prices of bonds fall. Long-term bonds are more exposed to interest-rate risk than short-term bonds. Unlike bonds, bond funds have ongoing fees and expenses. The use of derivatives involves special risks and may result in losses.
12
Your fund’s performance
This section shows your fund’s performance for periods ended April 30, 2006, the end of the first half of its current fiscal year. In accordance with regulatory requirements for mutual funds, we also include performance for the most recent calendar quarter-end. Performance should always be considered in light of a fund’s investment strategy. Data represents past performance. Past performance does not guarantee future results. More recent returns may be less or more than those shown. Investment return and principal value will fluctuate, and you may have a gain or a loss when you sell your shares. For the most recent month-end performance, please visit www.putnam.com or call Putnam at 1-800-225-1581. Class Y shares are generally only available to corporate and institutional clients. See the Terms and Definitions section in this report for definitions of the share classes offered by your fund.
Fund performance
Total return for periods ended 4/30/06
|
| | Class A | | Class B | | Class C | | Class M | | Class R | Class Y |
| (inception dates) | (11/1/54) | | (3/1/93) | | (7/26/99) | | (12/14/94) | | (1/21/03) | (6/16/94) |
| | NAV | POP | NAV | CDSC | NAV | CDSC | NAV | POP | NAV | NAV |
|
| Annual average | | | | | | | | | | |
| (life of fund) | 7.95% | 7.87% | 6.95% | 6.95% | 7.14% | 7.14% | 7.49% | 7.42% | 7.68% | 8.01% |
|
| 10 years | 64.49 | 58.26 | 52.86 | 52.86 | 52.60 | 52.60 | 60.87 | 55.62 | 60.64 | 68.94 |
| Annual average | 5.10 | 4.70 | 4.33 | 4.33 | 4.32 | 4.32 | 4.87 | 4.52 | 4.85 | 5.38 |
|
| 5 years | 25.51 | 20.82 | 20.85 | 18.85 | 20.83 | 20.83 | 23.93 | 19.99 | 24.07 | 27.08 |
| Annual average | 4.65 | 3.86 | 3.86 | 3.51 | 3.86 | 3.86 | 4.38 | 3.71 | 4.41 | 4.91 |
|
| 3 years | 7.98 | 3.97 | 5.59 | 2.65 | 5.74 | 5.74 | 7.21 | 3.80 | 7.31 | 8.99 |
| Annual average | 2.59 | 1.31 | 1.83 | 0.88 | 1.88 | 1.88 | 2.35 | 1.25 | 2.38 | 2.91 |
|
| 1 year | 0.23 | –3.57 | –0.38 | –5.21 | –0.38 | –1.34 | 0.02 | –3.26 | 0.04 | 0.60 |
|
| 6 months | 0.26 | –3.47 | 0.03 | –4.89 | 0.03 | –0.95 | 0.15 | –3.05 | 0.32 | 0.51 |
|
Performance assumes reinvestment of distributions and does not account for taxes. Returns at public offering price (POP) for class A and M shares reflect a sales charge of 3.75% and 3.25%, respectively. Class B share returns reflect the applicable contingent deferred sales charge (CDSC), which is 5% in the first year, declining to 1% in the sixth year, and is eliminated thereafter. Class C shares reflect a 1% CDSC the first year that is eliminated thereafter. Class R and Y shares have no initial sales charge or CDSC. Performance for class B, C, M, R, and Y shares before their inception is derived from the historical performance of class A shares, adjusted for the applicable sales charge (or CDSC) and, except for class Y shares, the higher operating expenses for such shares.
For a portion of the period, this fund limited expenses, without which returns would have been lower.
A 2% short-term trading fee may be applied to shares exchanged or sold within 5 days of purchase.
13
| Comparative index returns | | |
| For periods ended 4/30/06 | | |
|
| | | Lipper Corporate |
| | Lehman Aggregate | Debt Funds A Rated |
| | Bond Index | category average† |
|
| Annual average | | |
| (life of fund) | —* | —* |
|
| 10 years | 84.68% | 74.47% |
| Annual average | 6.33 | 5.71 |
|
| 5 years | 28.57 | 26.49 |
| Annual average | 5.16 | 4.80 |
|
| 3 years | 7.93 | 7.85 |
| Annual average | 2.58 | 2.54 |
|
| 1 year | 0.71 | 0.28 |
|
| 6 months | 0.56 | 0.28 |
|
Index and Lipper results should be compared to fund performance at net asset value.
* The benchmark and the Lipper category were not in existence at the time of the fund's inception. The Lehman Aggregate Bond Index commenced 12/31/75. The Lipper category commenced 12/31/59.
† Over the 6-month and 1-, 3-, 5-, and 10-year periods ended 4/30/06 , there were 178, 178, 152, 112, and 68 funds, respectively, in this Lipper category.
14
Fund price and distribution information
For the six-month period ended 4/30/06
| Distributions* | Class A | | Class B | Class C | Class M | | Class R | Class Y |
|
| Number | 6 | | 6 | 6 | 6 | | 6 | 6 |
|
| Income | $0.138 | | $0.113 | $0.113 | $0.131 | | $0.132 | $0.145 |
|
| Capital gains | — | | — | — | — | | — | — |
|
| Total | $0.138 | | $0.113 | $0.113 | $0.131 | | $0.132 | $0.145 |
|
| Share value: | NAV | POP | NAV | NAV | NAV | POP | NAV | NAV |
|
| 10/31/05 | $6.73 | $6.99 | $6.68 | $6.70 | $6.66 | $6.88 | $6.72 | $6.77 |
|
| 4/30/06 | 6.61 | 6.87 | 6.57 | 6.59 | 6.54 | 6.76 | 6.61 | 6.66 |
| Current yield | | | | | | | | |
| (end of period) | | | | | | | | |
| Current | | | | | | | | |
| dividend rate1 | 4.18% | 4.02% | 3.47% | 3.46% | 4.04% | 3.91% | 3.99% | 4.32% |
|
| Current 30-day | | | | | | | | |
| SEC yield2,3 | | | | | | | | |
| (with expense | | | | | | | | |
| limitation) | 4.56 | 4.38 | 3.80 | 3.80 | 4.30 | 4.16 | 4.30 | 4.80 |
|
| Current 30-day | | | | | | | | |
| SEC yield3 | | | | | | | | |
| (without | | | | | | | | |
| expense | | | | | | | | |
| limitation) | 4.52 | 4.35 | 3.76 | 3.76 | 4.27 | 4.13 | 4.27 | 4.77 |
|
* Dividend sources are estimated and may vary based on final tax calculations after the fund's fiscal year-end.
1 Most recent distribution, excluding capital gains, annualized and divided by NAV or POP at end of period.
2 For a portion of the period, this fund limited expenses, without which yields would have been lower.
3 Based only on investment income, calculated using SEC guidelines.
15
| Fund performance for most recent calendar quarter | | | |
| Total return for periods ended 3/31/06 | | | | | | | |
|
| |
| | Class A | | Class B | | Class C | | Class M | | Class R | Class Y |
| (inception dates) | (11/1/54) | | (3/1/93) | | (7/26/99) | | (12/14/94) | | (1/21/03) | (6/16/94) |
| | NAV | POP | NAV | CDSC | NAV | CDSC | NAV | POP | NAV | NAV |
|
| Annual average | | | | | | | | | | |
| (life of fund) | 7.97% | 7.89% | 6.96% | 6.96% | 7.16% | 7.16% | 7.51% | 7.44% | 7.70% | 8.03% |
|
| 10 years | 64.18 | 58.03 | 52.35 | 52.35 | 52.20 | 52.20 | 60.33 | 55.16 | 60.14 | 68.37 |
| Annual average | 5.08 | 4.68 | 4.30 | 4.30 | 4.29 | 4.29 | 4.83 | 4.49 | 4.82 | 5.35 |
|
| 5 years | 25.64 | 20.97 | 20.98 | 18.98 | 20.96 | 20.96 | 23.87 | 19.77 | 24.03 | 27.22 |
| Annual average | 4.67 | 3.88 | 3.88 | 3.54 | 3.88 | 3.88 | 4.37 | 3.67 | 4.40 | 4.93 |
|
| 3 years | 9.41 | 5.33 | 6.84 | 3.86 | 6.83 | 6.83 | 8.48 | 5.00 | 8.57 | 10.09 |
| Annual average | 3.04 | 1.75 | 2.23 | 1.27 | 2.23 | 2.23 | 2.75 | 1.64 | 2.78 | 3.26 |
|
| 1 year | 1.92 | -1.85 | 1.16 | -3.75 | 1.15 | 0.17 | 1.57 | -1.80 | 1.57 | 2.13 |
|
| 6 months | -0.03 | -3.72 | -0.56 | -5.44 | -0.56 | -1.53 | -0.29 | -3.59 | -0.27 | 0.07 |
|
16
Your fund’s expenses
As a mutual fund investor, you pay ongoing expenses, such as management fees, distribution fees (12b-1 fees), and other expenses. In the most recent six-month period, your fund limited these expenses; had it not done so, expenses would have been higher. Using the information below, you can estimate how these expenses affect your investment and compare them with the expenses of other funds. You may also pay one-time transaction expenses, including sales charges (loads) and redemption fees, which are not shown in this section and would have resulted in higher total expenses. For more information, see your fund’s prospectus or talk to your financial advisor.
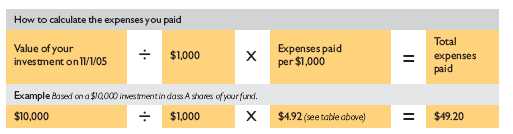
Review your fund’s expenses
The table below shows the expenses you would have paid on a $1,000 investment in Putnam Income Fund from November 1, 2005, to April 30, 2006. It also shows how much a $1,000 investment would be worth at the close of the period, assuming actual returns and expenses.
| | Class A | Class B | Class C | Class M | Class R | Class Y |
|
| Expenses paid per $1,000* | $ 4.92 | $ 8.63 | $ 8.63 | $ 6.15 | $ 6.16 | $ 3.68 |
|
| Ending value (after expenses) | $1,002.60 | $1,000.30 | $1,000.30 | $1,001.50 | $1,003.20 | $1,005.10 |
|
* Expenses for each share class are calculated using the fund’s annualized expense ratio for each class, which represents the ongoing expenses as a percentage of net assets for the six months ended 4/30/06. The expense ratio may differ for each share class (see the table at the bottom of the next page). Expenses are calculated by multiplying the expense ratio by the average account value for the period; then multiplying the result by the number of days in the period; and then dividing that result by the number of days in the year. Does not reflect the effect of a non-recurring reimbursement by Putnam. If this amount had been reflected in the table above, expenses for each share class would have been lower.
Estimate the expenses you paid
To estimate the ongoing expenses you paid for the six months ended April 30, 2006, use the calculation method below. To find the value of your investment on November 1, 2005, go to www.putnam.com and log on to your account. Click on the “Transaction History” tab in your Daily Statement and enter 11/01/2005 in both the “from” and “to” fields. Alternatively, call Putnam at 1-800-225-1581.
17
Compare expenses using the SEC’s method
The Securities and Exchange Commission (SEC) has established guidelines to help investors assess fund expenses. Per these guidelines, the table below shows your fund’s expenses based on a $1,000 investment, assuming a hypothetical 5% annualized return. You can use this information to compare the ongoing expenses (but not transaction expenses or total costs) of investing in the fund with those of other funds. All mutual fund shareholder reports will provide this information to help you make this comparison. Please note that you cannot use this information to estimate your actual ending account balance and expenses paid during the period.
| | Class A | Class B | Class C | Class M | Class R | Class Y |
|
| Expenses paid per $1,000* | $ 4.96 | $ 8.70 | $ 8.70 | $ 6.21 | $ 6.21 | $ 3.71 |
|
| Ending value (after expenses) | $1,019.89 | $1,016.17 | $1,016.17 | $1,018.65 | $1,018.65 | $1,021.12 |
|
* Expenses for each share class are calculated using the fund’s annualized expense ratio for each class, which represents the ongoing expenses as a percentage of net assets for the six months ended 4/30/06. The expense ratio may differ for each share class (see the table at the bottom of this page). Expenses are calculated by multiplying the expense ratio by the average account value for the period; then multiplying the result by the number of days in the period; and then dividing that result by the number of days in the year. Does not reflect the effect of a non-recurring reimbursement by Putnam. If this amount had been reflected in the table above, expenses for each share class would have been lower.
Compare expenses using industry averages
You can also compare your fund’s expenses with the average of its peer group, as defined by Lipper, an independent fund-rating agency that ranks funds relative to others that Lipper considers to have similar investment styles or objectives. The expense ratio for each share class shown below indicates how much of your fund’s net assets have been used to pay ongoing expenses during the period.
| | Class A | Class B | Class C | Class M | Class R | Class Y |
|
| Your fund’s annualized | | | | | | |
| expense ratio* | 0.99% | 1.74% | 1.74% | 1.24% | 1.24% | 0.74% |
|
| Average annualized expense | | | | | | |
| ratio for Lipper peer group† | 1.00% | 1.75% | 1.75% | 1.25% | 1.25% | 0.75% |
|
* Does not reflect the effect of a non-recurring reimbursement by Putnam. If this amount had been reflected in the table above, the expense ratio for each share class would have been lower.
† Simple average of the expenses of all front-end load funds in the fund’s Lipper peer group, calculated in accordance with Lipper’s standard method for comparing fund expenses (excluding 12b-1 fees and without giving effect to any expense offset and brokerage service arrangements that may reduce fund expenses). This average reflects each fund’s expenses for its most recent fiscal year available to Lipper as of 3/31/06. To facilitate comparison, Putnam has adjusted this average to reflect the 12b-1 fees carried by each class of shares other than class Y shares, which do not incur 12b-1 fees. The peer group may include funds that are significantly smaller or larger than the fund, which may limit the comparability of the fund’s expenses to the simple average, which typically is higher than the asset-weighted average.
18
Your fund’s
portfolio turnover
|
Putnam funds are actively managed by teams of experts who buy and sell securities based on intensive analysis of companies, industries, economies, and markets. Portfolio turnover is a measure of how often a fund’s managers buy and sell securities for your fund. A portfolio turnover of 100%, for example, means that the managers sold and replaced securities valued at 100% of a fund’s assets within a one-year period. Funds with high turnover may be more likely to generate capital gains and dividends that must be distributed to shareholders as taxable income. High turnover may also cause a fund to pay more brokerage commissions and other transaction costs, which may detract from performance.
Funds that invest in bonds or other fixed-income instruments may have higher turnover than funds that invest only in stocks. Short-term bond funds tend to have higher turnover than longer-term bond funds, because shorter-term bonds will mature or be sold more frequently than longer-term bonds. You can use the table below to compare your fund’s turnover with the average turnover for funds in its Lipper category.
Turnover comparisons
Percentage of holdings that change every year
|
| | 2005 | 2004 | 2003 | 2002 | 2001 |
|
| Putnam Income Fund | 300%* | 441% | 251%† | 268%† | 234%† |
|
| Lipper Corporate Debt Funds | | | | | |
| A Rated category average | 152% | 163% | 166% | 166% | 200% |
|
Turnover data for the fund is calculated based on the fund's fiscal-year period, which ends on October 31. Turnover data for the fund's Lipper category is calculated based on the average of the turnover of each fund in the category for its fiscal year ended during the indicated year. Fiscal years vary across funds in the Lipper category, which may limit the comparability of the fund's portfolio turnover rate to the Lipper average. Comparative data for 2005 is based on information available as of 12/31/05.
* Portfolio turnover excludes dollar roll transactions.
† Portfolio turnover excludes certain Treasury note transactions executed in connection with a short-term trading strategy.
19
Your fund’s risk
This risk comparison is designed to help you understand how your fund compares with other funds. The comparison utilizes a risk measure developed by Morningstar, an independent fund-rating agency. This risk measure is referred to as the fund’s Overall Morningstar Risk.
Your fund’s Overall Morningstar® Risk
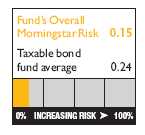
Your fund’s Overall Morningstar Risk is shown alongside that of the average fund in its broad asset class, as determined by Morningstar. The risk bar broadens the comparison by translating the fund’s Overall Morningstar Risk into a percentile, which is based on the fund’s ranking among all funds rated by Morningstar as of March 31, 2006. A higher Overall Morningstar Risk generally indicates that a fund’s monthly returns have varied more widely.
Morningstar determines a fund’s Overall Morningstar Risk by assessing variations in the fund’s monthly returns — with an emphasis on downside variations — over 3-, 5-, and 10-year periods, if available. Those measures are weighted and averaged to produce the fund’s Overall Morningstar Risk. The information shown is provided for the fund’s class A shares only; information for other classes may vary. Overall Morningstar Risk is based on historical data and does not indicate future results. Morningstar does not purport to measure the risk associated with a current investment in a fund, either on an absolute basis or on a relative basis. Low Overall Morningstar Risk does not mean that you cannot lose money on an investment in a fund. Copyright 2006 Morningstar, Inc. All Rights Reserved. The information contained herein (1) is proprietary to Morningstar and/or its content providers; (2) may not be copied or distributed; and (3) is not warranted to be accurate, complete, or timely. Neither Morningstar nor its content providers are responsible for any damages or losses arising from any use of this information.
20
Your fund is managed by the members of the Putnam Core Fixed-Income Team. Kevin
Cronin is the Portfolio Leader of the fund. Rob Bloemker, Kevin Murphy, and Raman
Srivastava are Portfolio Members. The Portfolio Leader and Portfolio Members coordinate
the team’s management of the fund.
For a complete listing of the members of the Putnam Core Fixed-Income Team, including
those who are not Portfolio Leaders or Portfolio Members of your fund, visit Putnam’s
Individual Investor Web site at www.putnam.com.
Fund ownership by the Portfolio Leader and Portfolio Members
The table below shows how much the fund’s current Portfolio Leader and Portfolio Members
have invested in the fund (in dollar ranges). Information shown is as of April 30, 2006, and
April 30, 2005.
|
| | | | $1 – | $10,001 – | $50,001 – | $100,001 – | $500,001 – | $1,000,001 |
| | Year | $0 | $10,000 | $50,000 | $100,000 | $500,000 | $1,000,000 | and over |
|
| Kevin Cronin | 2006 | | | | * | | | |
|
|
| Portfolio Leader | 2005 | | | | * | | | |
|
| Rob Bloemker | 2006 | | | | * | | | |
|
|
| Portfolio Member | 2005 | | | | * | | | |
|
| Kevin Murphy | 2006 | * | | | | | | |
|
|
| Portfolio Member | 2005 | * | | | | | | |
|
| Raman Srivastava | 2006 | * | | | | | | |
|
|
| Portfolio Member | 2005 | * | | | | | | |
|
21
Fund manager compensation
|
The total 2005 fund manager compensation that is attributable to your fund is approximately $1,300,000. This amount includes a portion of 2005 compensation paid by Putnam Management to the fund managers listed in this section for their portfolio management responsibilities, calculated based on the fund assets they manage taken as a percentage of the total assets they manage. The compensation amount also includes a portion of the 2005 compensation paid to the Chief Investment Officer of the team and the Group Chief Investment Officer of the fund’s broader investment category for their oversight responsibilities, calculated based on the fund assets they oversee taken as a percentage of the total assets they oversee. This amount does not include compensation of other personnel involved in research, trading, administration, systems, compliance, or fund operations; nor does it include non-compensation costs. These percentages are determined as of the fund’s fiscal period-end. For personnel who joined Putnam Management during or after 2005, the calculation reflects annualized 2005 compensation or an estimate of 2006 compensation, as applicable.
Other Putnam funds managed by the Portfolio Leader and Portfolio Members
Kevin Cronin is also a Portfolio Leader of Putnam American Government Income Fund, Putnam Global Income Trust, Putnam Limited Duration Government Income Fund, and Putnam U.S. Government Income Trust. He is also a Portfolio Member of Putnam Equity Income Fund.
Rob Bloemker is also a Portfolio Member of Putnam American Government Income Fund, Putnam Diversified Income Trust, Putnam Limited Duration Government Income Fund, Putnam Master Intermediate Income Trust, Putnam Premier Income Trust, and Putnam U.S. Government Income Trust.
Kevin Murphy is also a Portfolio Member of Putnam Utilities Growth and Income Fund.
Raman Srivastava is also a Portfolio Member of The George Putnam Fund of Boston.
Kevin Cronin, Rob Bloemker, Kevin Murphy, and Raman Srivastava may also manage other accounts and variable trust funds advised by Putnam Management or an affiliate.
Changes in your fund’s Portfolio Leader and Portfolio Members
Your fund’s Portfolio Leader and Portfolio Members did not change during the year ended April 30, 2006.
22
Fund ownership by Putnam’s Executive Board
The table below shows how much the members of Putnam’s Executive Board have invested in the fund (in dollar ranges). Information shown is as of April 30, 2006, and April 30, 2005.
| | | | $1 – | $10,001 – | $50,001– | $100,001 |
| | Year | $0 | $10,000 | $50,000 | $100,000 | and over |
|
| Philippe Bibi | 2006 | * | | | | |
|
|
| Chief Technology Officer | 2005 | * | | | | |
|
| Joshua Brooks | 2006 | * | | | | |
|
|
| Deputy Head of Investments | 2005 | * | | | | |
|
| William Connolly | 2006 | * | | | | |
|
|
| Head of Retail Management | N/A | | | | | |
|
| Kevin Cronin | 2006 | | | | * | |
|
|
| Head of Investments | 2005 | | | | * | |
|
| Charles Haldeman, Jr. | 2006 | | | * | | |
|
|
| President and CEO | 2005 | | | * | | |
|
| Amrit Kanwal | 2006 | * | | | | |
|
|
| Chief Financial Officer | 2005 | * | | | | |
|
| Steven Krichmar | 2006 | * | | | | |
|
|
| Chief of Operations | 2005 | * | | | | |
|
| Francis McNamara, III | 2006 | | | * | | |
|
|
| General Counsel | 2005 | | * | | | |
|
| Richard Robie, III | 2006 | * | | | | |
|
|
| Chief Administrative Officer | 2005 | * | | | | |
|
| Edward Shadek | 2006 | * | | | | |
|
|
| Deputy Head of Investments | 2005 | * | | | | |
|
| Sandra Whiston | 2006 | | | | * | |
|
|
| Head of Institutional Management | N/A | | | | | |
|
N/A indicates the individual was not a member of Putnam's Executive Board as of 4/30/05.
23
Total return shows how the value of the fund’s shares changed over time, assuming you held the shares through the entire period and reinvested all distributions in the fund.
Net asset value (NAV) is the price, or value, of one share of a mutual fund, without a sales charge. NAVs fluctuate with market conditions. NAV is calculated by dividing the net assets of each class of shares by the number of outstanding shares in the class.
Public offering price (POP) is the price of a mutual fund share plus the maximum sales charge levied at the time of purchase. POP performance figures shown here assume the 3.75% maximum sales charge for class A shares and 3.25% for class M shares.
Contingent deferred sales charge (CDSC) is a charge applied at the time of the redemption of class B or C shares and assumes redemption at the end of the period. Your fund’s class B CDSC declines from a 5% maximum during the first year to 1% during the sixth year. After the sixth year, the CDSC no longer applies. The CDSC for class C shares is 1% for one year after purchase.
Class A shares are generally subject to an initial sales charge and no sales charge on redemption (except on certain redemptions of shares bought without an initial sales charge).
Class B shares may be subject to a sales charge upon redemption.
Class C shares are not subject to an initial sales charge and are subject to a contingent deferred sales charge only if the shares are redeemed during the first year.
Class M shares have a lower initial sales charge and a higher 12b-1 fee than class A shares and no sales charge on redemption (except on certain redemptions of shares bought without an initial sales charge).
Class R shares are not subject to an initial sales charge or CDSC and are available only to certain defined contribution plans.
Class Y shares are not subject to an initial sales charge or CDSC, and carry no 12b-1 fee. They are only available to eligible purchasers, including eligible defined contribution plans or corporate IRAs.
24
Lehman Aggregate Bond Index is an unmanaged index of U.S. investment-grade fixed-income securities.
Lehman Global Aggregate Bond Index is an unmanaged index of global investment-grade fixed-income securities.
Lehman Government Bond Index is an unmanaged index of U.S. Treasury and agency securities. Lehman GNMA Index is an unmanaged index of Government National Mortgage Association bonds.
Russell 2000 Growth Index is an unmanaged index of those companies in the small-cap Russell 2000 Index chosen for their growth orientation.
Russell 2000 Value Index is an unmanaged index of those companies in the small-cap Russell 2000 Index chosen for their value orientation.
S&P 500 Index is an unmanaged index of common stock performance.
Indexes assume reinvestment of all distributions and do not account for fees. Securities and performance of a fund and an index will differ. You cannot invest directly in an index.
Lipper is a third-party industry-ranking entity that ranks mutual funds. Its rankings do not reflect sales charges. Lipper rankings are based on total return at net asset value relative to other funds that have similar current investment styles or objectives as determined by Lipper. Lipper may change a fund’s category assignment at its discretion. Lipper category averages reflect performance trends for funds within a category.
25
Trustee approval of
management contract
|
General conclusions
The Board of Trustees of the Putnam funds oversees the management of each fund and, as required by law, determines annually whether to approve the continuance of your fund’s management contract with Putnam Management. In this regard, the Board of Trustees, with the assistance of its Contract Committee consisting solely of Trustees who are not “interested persons” (as such term is defined in the Investment Company Act of 1940, as amended) of the Putnam funds (the “Independent Trustees”), requests and evaluates all information it deems reasonably necessary under the circumstances. Over the course of several months beginning in March and ending in June 2005, the Contract Committee met five times to consider the information provided by Putnam Management and other information developed with the assistance of the Board’s independent counsel and independent staff. The Contract Committee reviewed and discussed key aspects of this information with all of the Independent Trustees. Upon completion of this review, the Contract Committee recommended and the Independent Trustees approved the continuance of your fund’s management contract, effective July 1, 2005.
This approval was based on the following conclusions:
| * | That the fee schedule currently in effect for your fund represents reasonable compensation in |
| light of the nature and quality of the services being provided to the fund, the fees paid by |
| competitive funds and the costs incurred by Putnam Management in providing such services, and |
* | That such fee schedule represents an appropriate sharing between fund shareholders and |
| Putnam Management of such economies of scale as may exist in the management of the fund |
| at current asset levels. |
These conclusions were based on a comprehensive consideration of all information provided to the Trustees and were not the result of any single factor. Some of the factors that figured particularly in the Trustees’ deliberations and how the Trustees considered these factors are described below, although individual Trustees may have evaluated the information presented differently, giving different weights to various factors. It is also important to recognize that the fee arrangements for your fund and the other Putnam funds are the result of many years of review and discussion between the Independent Trustees and Putnam Management, that certain aspects of such arrangements may receive greater scrutiny in some years than others, and that the Trustees’ conclusions may be based, in part, on their consideration of these same arrangements in prior years.
26
Model fee schedules and categories; total expenses
The Trustees’ review of the management fees and total expenses of the Putnam funds focused on three major themes:
* Consistency. The Trustees, working in cooperation with Putnam Management, have developed and implemented a series of model fee schedules for the Putnam funds designed to ensure that each fund’s management fee is consistent with the fees for similar funds in the Putnam family of funds and compares favorably with fees paid by competitive funds sponsored by other investment advisors. Under this approach, each Putnam fund is assigned to one of several fee categories based on a combination of factors, including competitive fees and perceived difficulty of management, and a common fee schedule is implemented for all funds in a given fee category. The Trustees reviewed the model fee schedule then in effect for your fund, including fee levels and breakpoints, and the assignment of the fund to a particular fee category under this structure. (“Breakpoints” refer to reductions in fee rates that apply to additional assets once specified asset levels are reached.) The Trustees concluded that no changes should be made in the fund’s current fee schedule at this time.
* Competitiveness. The Trustees also reviewed comparative fee and expense information for competitive funds, which indicated that, in a custom peer group of competitive funds selected by Lipper Inc., your fund ranked in the 43rd percentile in management fees and in the 27th percentile in total expenses (less any applicable 12b-1 fees) as of December 31, 2004 (the first percentile being the least expensive funds and the 100th percentile being the most expensive funds). (Because the fund’s custom peer group is smaller than the fund’s broad Lipper Inc. peer group, this expense comparison may differ from the Lipper peer expense information found elsewhere in this report.) The Trustees noted that expense ratios for a number of Putnam funds, which show the percentage of fund assets used to pay for management and administrative services, distribution (12b-1) fees and other expenses, had been increasing recently as a result of declining net assets and the natural operation of fee breakpoints. They noted that such expense ratio increases were currently being controlled by expense limitations implemented in January 2004 and which Putnam Management, in consultation with the Contract Committee, has committed to maintain at least through 2006. The Trustees expressed their intention to monitor this information closely to ensure that fees and expenses of the Putnam funds continue to meet evolving competitive standards.
* Economies of scale. The Trustees concluded that the fee schedule currently in effect for your fund represents an appropriate sharing of economies of scale at current asset levels. Your fund currently has the benefit of breakpoints in its management fee that provide shareholders with significant economies of scale, which means that the effective management fee rate of a fund (as a percentage of fund assets) declines as a fund grows in size and crosses specified asset thresholds. The Trustees examined the existing breakpoint structure of the Putnam funds’ management fees in light of competitive industry practices. The Trustees considered
27
various possible modifications to the Putnam funds’ current breakpoint structure, but ultimately concluded that the current breakpoint structure continues to serve the interests of fund shareholders. Accordingly, the Trustees continue to believe that the fee schedules currently in effect for the funds represent an appropriate sharing of economies of scale at current asset levels. The Trustees noted that significant redemptions in many Putnam funds, together with significant changes in the cost structure of Putnam Management, have altered the economics of Putnam Management’s business in significant ways. In view of these changes, the Trustees intend to consider whether a greater sharing of the economies of scale by fund shareholders would be appropriate if and when aggregate assets in the Putnam funds begin to experience meaningful growth.
In connection with their review of the management fees and total expenses of the Putnam funds, the Trustees also reviewed the costs of the services to be provided and profits to be realized by Putnam Management and its affiliates from the relationship with the funds. This information included trends in revenues, expenses and profitability of Putnam Management and its affiliates relating to the investment management and distribution services provided to the funds. In this regard, the Trustees also reviewed an analysis of Putnam Management’s revenues, expenses and profitability with respect to the funds’ management contracts, allocated on a fund-by-fund basis.
The quality of the investment process provided by Putnam Management represented a major factor in the Trustees’ evaluation of the quality of services provided by Putnam Management under your fund’s management contract. The Trustees were assisted in their review of the funds’ investment process and performance by the work of the Investment Oversight Committees of the Trustees, which meet on a regular monthly basis with the funds’ portfolio teams throughout the year. The Trustees concluded that Putnam Management generally provides a high quality investment process — as measured by the experience and skills of the individuals assigned to the management of fund portfolios, the resources made available to such personnel, and in general the ability of Putnam Management to attract and retain high-quality personnel — but also recognize that this does not guarantee favorable investment results for every fund in every time period. The Trustees considered the investment performance of each fund over multiple time periods and considered information comparing the fund’s performance with various benchmarks and with the performance of competitive funds. The Trustees noted the satisfactory investment performance of many Putnam funds. They also noted the disappointing investment performance of certain funds in recent years and continued to discuss with senior management of Putnam Management the factors contributing to such underperformance and actions being taken to improve performance. The Trustees recognized that, in recent years, Putnam Management has made significant changes in its investment personnel and processes and in the fund product line to address areas of underperformance. The Trustees indicated their intention to continue to
28
monitor performance trends to assess the effectiveness of these changes and to evaluate whether additional remedial changes are warranted.
In the case of your fund, the Trustees considered that your fund’s class A share cumulative total return performance at net asset value was in the following percentiles of its Lipper Inc. peer group (Lipper Corporate Debt Funds A Rated) for the one-, three- and five-year periods ended December 31, 2004 (the first percentile being the best-performing funds and the 100th percentile being the worst-performing funds):
| One-year period | Three-year period | Five-year period |
|
| 37th | 46th | 74th |
(Because of the passage of time, these performance results may differ from the performance results for more recent periods shown elsewhere in this report. Over the one-, three-, and five-year periods ended December 31, 2004, there were 214, 167, and 130 funds, respectively, in your fund’s Lipper peer group.* Past performance is no guarantee of future performance.)
As a general matter, the Trustees believe that cooperative efforts between the Trustees and Putnam Management represent the most effective way to address investment performance problems. The Trustees believe that investors in the Putnam funds have, in effect, placed their trust in the Putnam organization, under the oversight of the funds’ Trustees, to make appropriate decisions regarding the management of the funds. Based on the responsiveness of Putnam Management in the recent past to Trustee concerns about investment performance, the Trustees believe that it is preferable to seek change within Putnam Management to address performance shortcomings. In the Trustees’ view, the alternative of terminating a management contract and engaging a new investment advisor for an underperforming fund would entail significant disruptions and would not provide any greater assurance of improved investment performance.
Brokerage and soft-dollar allocations; other benefits
The Trustees considered various potential benefits that Putnam Management may receive in connection with the services it provides under the management contract with your fund. These include principally benefits related to brokerage and soft-dollar allocations, whereby a portion of the commissions paid by a fund for brokerage is earmarked to pay for research services that may be utilized by a fund’s investment advisor, subject to the obligation to seek best execution. The Trustees believe that soft-dollar credits and other potential benefits associated with the allocation of fund brokerage, which pertains mainly to funds investing in equity securities, represent assets of the funds that should be used for the benefit of fund shareholders. This area
* The percentile rankings for your fund’s class A share annualized total return performance in the Lipper Corporate Debt Funds A Rated category for the one-, five-, and ten-year periods ended March 31, 2006, were 41%, 53%, and 82%, respectively. Over the one-, five-, and ten-year periods ended March 31, 2006, the fund ranked 73rd out of 180, 60th out of 114, and 57th out of 69 funds, respectively. Note that this more recent information was not available when the Trustees approved the continuance of your fund’s management contract.
29
has been marked by significant change in recent years. In July 2003, acting upon the Contract Committee’s recommendation, the Trustees directed that allocations of brokerage to reward firms that sell fund shares be discontinued no later than December 31, 2003. In addition, commencing in 2004, the allocation of brokerage commissions by Putnam Management to acquire research services from third-party service providers has been significantly reduced, and continues at a modest level only to acquire research that is customarily not available for cash. The Trustees will continue to monitor the allocation of the funds’ brokerage to ensure that the principle of “best price and execution” remains paramount in the portfolio trading process.
The Trustees’ annual review of your fund’s management contract also included the review of its distributor’s contract and distribution plan with Putnam Retail Management Limited Partnership and the custodian agreement and investor servicing agreement with Putnam Fiduciary Trust Company, all of which provide benefits to affiliates of Putnam Management.
Comparison of retail and institutional fee schedules
The information examined by the Trustees as part of their annual contract review has included for many years information regarding fees charged by Putnam Management and its affiliates to institutional clients such as defined benefit pension plans, college endowments, etc. This information included comparison of such fees with fees charged to the funds, as well as a detailed assessment of the differences in the services provided to these two types of clients. The Trustees observed, in this regard, that the differences in fee rates between institutional clients and the mutual funds are by no means uniform when examined by individual asset sectors, suggesting that differences in the pricing of investment management services to these types of clients reflect to a substantial degree historical competitive forces operating in separate market places. The Trustees considered the fact that fee rates across all asset sectors are higher on average for mutual funds than for institutional clients, as well as the differences between the services that Putnam Management provides to the Putnam funds and those that it provides to institutional clients of the firm, but have not relied on such comparisons to any significant extent in concluding that the management fees paid by your fund are reasonable.
30
Other information
for shareholders
|
Important notice regarding delivery of shareholder documents
In accordance with SEC regulations, Putnam sends a single copy of annual and semiannual shareholder reports, prospectuses, and proxy statements to Putnam shareholders who share the same address, unless a shareholder requests otherwise. If you prefer to receive your own copy of these documents, please call Putnam at 1-800-225-1581, and Putnam will begin sending individual copies within 30 days.
Proxy voting
Putnam is committed to managing our mutual funds in the best interests of our shareholders. The Putnam funds’ proxy voting guidelines and procedures, as well as information regarding how your fund voted proxies relating to portfolio securities during the 12-month period ended June 30, 2005, are available on the Putnam Individual Investor Web site, www.putnam.com/individual, and on the SEC’s Web site, www.sec.gov. If you have questions about finding forms on the SEC’s Web site, you may call the SEC at 1-800-SEC-0330. You may also obtain the Putnam funds’ proxy voting guidelines and procedures at no charge by calling Putnam’s Shareholder Services at 1-800-225-1581.
Fund portfolio holdings
The fund will file a complete schedule of its portfolio holdings with the SEC for the first and third quarters of each fiscal year on Form N-Q. Shareholders may obtain the fund’s Forms N-Q on the SEC’s Web site at www.sec.gov. In addition, the fund’s Forms N-Q may be reviewed and copied at the SEC’s Public Reference Room in Washington, D.C. You may call the SEC at 1-800-SEC-0330 for information about the SEC’s Web site or the operation of the Public Reference Room.
31
A guide to financial statementsThese sections of the report, as well as the accompanying Notes, constitute the fund’s financial statements.
The fund’s portfolio lists all the fund’s investments and their values as of the last day of the reporting period. Holdings are organized by asset type and industry sector, country, or state to show areas of concentration and diversification.
Statement of assets and liabilities shows how the fund’s net assets and share price are determined. All investment and noninvestment assets are added together. Any unpaid expenses and other liabilities are subtracted from this total. The result is divided by the number of shares to determine the net asset value per share, which is calculated separately for each class of shares. (For funds with preferred shares, the amount subtracted from total assets includes the liquidation preference of preferred shares.)
Statement of operations shows the fund’s net investment gain or loss. This is done by first adding up all the fund’s earnings — from dividends and interest income — and subtracting its operating expenses to determine net investment income (or loss). Then, any net gain or loss the fund realized on the sales of its holdings — as well as any unrealized gains or losses over the period — is added to or subtracted from the net investment result to determine the fund’s net gain or loss for the fiscal period.
Statement of changes in net assets shows how the fund’s net assets were affected by the fund’s net investment gain or loss, by distributions to shareholders, and by changes in the number of the fund’s shares. It lists distributions and their sources (net investment income or realized capital gains) over the current reporting period and the most recent fiscal year-end. The distributions listed here may not match the sources listed in the Statement of operations because the distributions are determined on a tax basis and may be paid in a different period from the one in which they were earned. Dividend sources are estimated at the time of declaration. Actual results may vary. Any non-taxable return of capital cannot be determined until final tax calculations are completed after the end of the fund’s fiscal year.
Financial highlights provide an overview of the fund’s investment results, per-share distributions, expense ratios, net investment income ratios, and portfolio turnover in one summary table, reflecting the five most recent reporting periods. In a semiannual report, the highlight table also includes the current reporting period.
32
| The fund’s portfolio 4/30/06 (Unaudited) | | | | | |
| |
| |
| |
| COLLATERALIZED MORTGAGE OBLIGATIONS (37.7%)* | | | | | |
| |
| | | Principal amount | | Value | |
| |
| Amresco Commercial Mortgage Funding I Ser. 97-C1, | | | | | |
| Class G, 7s, 2029 | $ | 1,377,000 | $ | 1,386,783 | |
| Amresco Commercial Mortgage Funding I 144A | | | | | |
| Ser. 97-C1, Class H, 7s, 2029 | | 815,000 | | 823,362 | |
| Asset Securitization Corp. Ser. 96-MD6, Class A7, | | | | | |
| 8.293s, 2029 | | 2,347,000 | | 2,447,157 | |
| Banc of America Commercial Mortgage, Inc. | | | | | |
| Ser. 04-3, Class A5, 5.481s, 2039 | | 5,560,000 | | 5,468,927 | |
| Ser. 06-1, Class XC, Interest Only (IO), | | | | | |
| 0.045s, 2045 | | 113,632,000 | | 784,538 | |
| Banc of America Commercial Mortgage, Inc. 144A | | | | | |
| Ser. 01-PB1, Class K, 6.15s, 2035 | | 880,000 | | 871,147 | |
| Ser. 02-PB2, Class XC, IO, 0.26s, 2035 | | 55,132,476 | | 1,042,348 | |
| Ser. 05-1, Class XW, IO, 0.16s, 2042 | | 226,248,711 | | 1,108,913 | |
| Ser. 05-4, Class XC, IO, 0.045s, 2045 | | 105,424,132 | | 751,621 | |
| Banc of America Large Loan | | | | | |
| FRB Ser. 04-BBA4, Class H, 5.851s, 2018 | | 443,000 | | 444,374 | |
| FRB Ser. 04-BBA4, Class G, 5.601s, 2018 | | 595,000 | | 597,185 | |
| Banc of America Large Loan 144A | | | | | |
| FRB Ser. 02-FL2A, Class L1, 7.84s, 2014 | | 552,000 | | 551,241 | |
| FRB Ser. 02-FL2A, Class K1, 7.34s, 2014 | | 190,000 | | 189,964 | |
| FRB Ser. 05-BOCA, Class M, 7.001s, 2016 | | 1,362,000 | | 1,364,912 | |
| FRB Ser. 05-MIB1, Class K, 6.901s, 2022 | | 669,000 | | 656,667 | |
| FRB Ser. 05-ESHA, Class K, 6.701s, 2020 | | 2,099,000 | | 2,098,984 | |
| FRB Ser. 05-BOCA, Class L, 6.601s, 2016 | | 1,315,000 | | 1,317,008 | |
| FRB Ser. 06-LAQ, Class M, 6.573s, 2021 | | 1,535,000 | | 1,534,914 | |
| FRB Ser. 06-LAQ, Class L, 6.473s, 2021 | | 1,279,000 | | 1,278,928 | |
| FRB Ser. 05-BOCA, Class K, 6.251s, 2016 | | 465,000 | | 465,711 | |
| FRB Ser. 05-BOCA, Class J, 6.001s, 2016 | | 250,000 | | 250,306 | |
| FRB Ser. 05-MIB1, Class J, 5.951s, 2022 | | 1,805,000 | | 1,807,391 | |
| FRB Ser. 05-BOCA, Class H, 5.851s, 2016 | | 250,000 | | 250,337 | |
| FRB Ser. 05-ESHA, Class G, 5.781s, 2020 | | 1,050,000 | | 1,049,119 | |
| Ser. 06-LAQ, Class X1, IO, 0.675s, 2021 | | 58,458,486 | | 520,397 | |
| Ser. 03-BBA2, Class X1A, IO, 0.488s, 2015 | | 46,265,627 | | 64,864 | |
| Banc of America Structured Security Trust 144A | | | | | |
| Ser. 02-X1, Class A3, 5.436s, 2033 | | 2,390,000 | | 2,385,926 | |
| Bayview Commercial Asset Trust 144A | | | | | |
| FRB Ser. 05-1A, Class A1, 5.259s, 2035 | | 2,388,790 | | 2,385,923 | |
| Ser. 05-3A, IO, 0.775s, 2035 | | 24,352,130 | | 2,015,185 | |
| Ser. 05-1A, IO, 0.775s, 2035 | | 9,954,627 | | 740,375 | |
| Ser. 04-3, IO, 0.775s, 2035 | | 8,770,996 | | 626,377 | |
| Ser. 04-2, IO, 0.72s, 2034 | | 8,732,201 | | 651,504 | |
| Bear Stearns Commercial Mortgage Securities, Inc. | | | | | |
| Ser. 05-PWR9, Class X1, IO, 0.047s, 2042 | | 52,198,814 | | 491,134 | |
| Bear Stearns Commercial Mortgage | | | | | |
| Securities, Inc. 144A | | | | | |
| FRB Ser. 05-LXR1, Class J, 6.551s, 2018 | | 2,313,000 | | 2,313,000 | |
| FRB Ser. 05-LXR1, Class H, 6.101s, 2018 | | 1,285,000 | | 1,285,000 | |
| FRB Ser. 05-LXR1, Class G, 5.851s, 2018 | | 1,285,000 | | 1,285,000 | |
| | | | | | 33 |
| COLLATERALIZED MORTGAGE OBLIGATIONS (37.7%)* continued | | | |
|
| | | Principal amount | | Value |
| |
| Bear Stearns Commercial Mortgage | | | | |
| Securities, Inc. 144A | | | | |
| Ser. 05-LXR1, Class X1, IO, 0.818s, 2018 | $ | 125,053,256 | $ | 927,520 |
| Ser. 05-PW10, Class X1, IO, 0.032s, 2040 | | 111,440,973 | | 500,593 |
| Bear Stearns Commercial Mortgage | | | | |
| Securitization Corp. | | | | |
| Ser. 00-WF2, Class F, 8.455s, 2032 | | 619,000 | | 685,625 |
| Ser. 04-PR3I, Class X1, IO, 0.26s, 2041 | | 22,840,097 | | 507,164 |
| Chase Commercial Mortgage Securities Corp. Ser. 00-3, | | | | |
| Class A2, 7.319s, 2032 | | 736,000 | | 782,665 |
| Chase Commercial Mortgage Securities Corp. 144A | | | | |
| Ser. 98-1, Class F, 6.56s, 2030 | | 5,896,000 | | 5,986,259 |
| Ser. 98-1, Class G, 6.56s, 2030 | | 1,502,003 | | 1,528,134 |
| Ser. 98-1, Class H, 6.34s, 2030 | | 2,217,000 | | 1,820,584 |
| Citigroup Commercial Mortgage Trust 144A Ser. 05-C3, | | | | |
| Class XC, IO, 0.061s, 2043 | | 146,447,398 | | 1,510,239 |
| Citigroup/Deutsche Bank Commercial Mortgage Trust | | | | |
| 144A Ser. 06-CD2, Class X, IO, 0.13s, 2046 | | 105,558,000 | | 639,681 |
| Commercial Mortgage Acceptance Corp. Ser. 97-ML1, | | | | |
| Class A3, 6.57s, 2030 | | 7,083,000 | | 7,122,975 |
| Commercial Mortgage Acceptance Corp. 144A Ser. 98-C1, | | | | |
| Class F, 6.23s, 2031 | | 2,605,530 | | 2,619,814 |
| Commercial Mortgage Pass-Through Certificates | | | | |
| Ser. 04-LB2A, Class A4, 4.715s, 2039 | | 35,237,000 | | 32,979,499 |
| Commercial Mortgage Pass-Through | | | | |
| Certificates 144A | | | | |
| Ser. 06-CN2A, Class H, 5.756s, 2019 | | 1,271,000 | | 1,248,516 |
| Ser. 06-CN2A, Class J, 5.756s, 2019 | | 1,017,000 | | 994,951 |
| FRB Ser. 01-J2A, Class A2F, 5.401s, 2034 | | 1,960,000 | | 1,984,872 |
| Ser. 03-LB1A, Class X1, IO, 0.267s, 2038 | | 12,821,030 | | 517,662 |
| Ser. 05-LP5, Class XC, IO, 0.043s, 2043 | | 77,420,185 | | 804,396 |
| Ser. 05-C6, Class XC, IO, 0.036s, 2044 | | 86,532,157 | | 574,574 |
| Criimi Mae Commercial Mortgage Trust 144A Ser. 98-C1, | | | | |
| Class B, 7s, 2033 | | 7,975,000 | | 8,065,915 |
| Crown Castle Towers, LLC 144A Ser. 05-1A, Class D, | | | | |
| 5.612s, 2035 | | 3,575,000 | | 3,445,127 |
| CS First Boston Mortgage Securities Corp. | | | | |
| Ser. 97-C2, Class F, 7.46s, 2035 | | 1,193,000 | | 1,298,206 |
| Ser. 04-C2, Class A2, 5.416s, 2036 | | 6,060,000 | | 5,940,988 |
| Ser. 05-C4, Class A5, 5.104s, 2038 | | 21,019,000 | | 20,103,833 |
| CS First Boston Mortgage Securities Corp. 144A | | | | |
| FRB Ser. 05-TFLA, Class J, 5.851s, 2020 | | 647,000 | | 646,914 |
| FRB Ser. 04-TF2A, Class J, 5.851s, 2016 | | 414,000 | | 413,998 |
| FRB Ser. 05-TFLA, Class H, 5.651s, 2020 | | 391,000 | | 390,998 |
| FRB Ser. 04-TF2A, Class H, 5.601s, 2019 | | 825,000 | | 824,996 |
| Ser. 01-CK1, Class AY, IO, 0.905s, 2035 | | 83,484,000 | | 2,490,328 |
| Ser. 02-CP3, Class AX, IO, 0.482s, 2035 | | 25,459,062 | | 1,016,540 |
| Ser. 03-C3, Class AX, IO, 0.357s, 2038 | | 67,384,734 | | 2,766,554 |
| Ser. 05-C2, Class AX, IO, 0.072s, 2037 | | 85,657,887 | | 1,262,683 |
34
| COLLATERALIZED MORTGAGE OBLIGATIONS (37.7%)* continued | | | | |
|
| | | Principal amount | | Value |
| |
| Deutsche Mortgage & Asset Receiving Corp. Ser. 98-C1, | | | | |
| Class X, IO, 0.989s, 2031 | $ | 1,084,133 | $ | 17,999 |
| DLJ Commercial Mortgage Corp. | | | | |
| Ser. 00-CF1, Class A1B, 7.62s, 2033 | | 2,945,000 | | 3,143,378 |
| Ser. 99-CG2, Class B3, 6.1s, 2032 | | 2,455,000 | | 2,449,312 |
| Ser. 99-CG2, Class B4, 6.1s, 2032 | | 3,434,000 | | 3,414,991 |
| Ser. 98-CF2, Class B3, 6.04s, 2031 | | 1,075,367 | | 1,080,900 |
| DLJ Mortgage Acceptance Corp. 144A Ser. 97-CF1, | | | | |
| Class A3, 7.76s, 2030 | | 1,170,000 | | 1,184,263 |
| Fannie Mae | | | | |
| Ser. 04-T3, Class PT1, 9.773s, 2044 | | 669,744 | | 710,331 |
| Ser. 03-W6, Class PT1, 9.637s, 2042 | | 1,067,646 | | 1,133,800 |
| Ser. 02-T12, Class A4, 9 1/2s, 2042 | | 386,329 | | 408,094 |
| Ser. 02-T4, Class A4, 9 1/2s, 2041 | | 631,778 | | 666,382 |
| Ser. 02-T6, Class A3, 9 1/2s, 2041 | | 773,517 | | 812,812 |
| Ser. 02-T1, Class A4, 9 1/2s, 2031 | | 78,553 | | 82,947 |
| IFB Ser. 05-37, Class SU, 9.362s, 2035 | | 4,158,494 | | 4,421,023 |
| IFB Ser. 04-10, Class QC, 8.762s, 2031 | | 2,741,210 | | 2,791,001 |
| Ser. 06-20, Class IP, IO, 8s, 2030 | | 1,760,523 | | 373,732 |
| Ser. 02-26, Class A2, 7 1/2s, 2048 | | 3,297,464 | | 3,426,797 |
| Ser. 05-W3, Class 1A, 7 1/2s, 2045 | | 3,881,319 | | 4,054,392 |
| Ser. 05-W1, Class 1A4, 7 1/2s, 2044 | | 4,219,772 | | 4,398,531 |
| Ser. 04-W12, Class 1A4, 7 1/2s, 2044 | | 2,488,347 | | 2,593,980 |
| Ser. 04-W14, Class 2A, 7 1/2s, 2044 | | 506,063 | | 527,277 |
| Ser. 04-W8, Class 3A, 7 1/2s, 2044 | | 4,922,969 | | 5,134,731 |
| Ser. 04-W2, Class 5A, 7 1/2s, 2044 | | 6,681,257 | | 6,967,360 |
| Ser. 04-T3, Class 1A4, 7 1/2s, 2044 | | 1,001,796 | | 1,044,109 |
| Ser. 04-W9, Class 2A3, 7 1/2s, 2044 | | 1,893,498 | | 1,972,615 |
| Ser. 04-T2, Class 1A4, 7 1/2s, 2043 | | 1,472,309 | | 1,534,478 |
| Ser. 03-W1, Class 2A, 7 1/2s, 2042 | | 684,845 | | 710,462 |
| Ser. 03-W4, Class 4A, 7 1/2s, 2042 | | 454,545 | | 471,753 |
| Ser. 02-T18, Class A4, 7 1/2s, 2042 | | 2,039,153 | | 2,120,896 |
| Ser. 03-W3, Class 1A3, 7 1/2s, 2042 | | 4,000,546 | | 4,161,016 |
| Ser. 02-T16, Class A3, 7 1/2s, 2042 | | 5,541,718 | | 5,762,756 |
| Ser. 02-T19, Class A3, 7 1/2s, 2042 | | 6,253,665 | | 6,503,581 |
| Ser. 03-W2, Class 1A3, 7 1/2s, 2042 | | 1,783,041 | | 1,854,777 |
| Ser. 02-W6, Class 2A, 7 1/2s, 2042 | | 3,425,050 | | 3,556,836 |
| Ser. 02-T12, Class A3, 7 1/2s, 2042 | | 555,935 | | 577,074 |
| Ser. 02-W4, Class A5, 7 1/2s, 2042 | | 7,422,925 | | 7,711,937 |
| Ser. 02-W1, Class 2A, 7 1/2s, 2042 | | 3,540,450 | | 3,665,429 |
| Ser. 02-14, Class A2, 7 1/2s, 2042 | | 553,303 | | 574,535 |
| Ser. 01-T10, Class A2, 7 1/2s, 2041 | | 3,527,458 | | 3,657,166 |
| Ser. 02-T4, Class A3, 7 1/2s, 2041 | | 225,895 | | 234,259 |
| Ser. 02-T6, Class A2, 7 1/2s, 2041 | | 8,244,006 | | 8,538,455 |
| Ser. 01-T12, Class A2, 7 1/2s, 2041 | | 3,256,069 | | 3,375,837 |
| Ser. 01-T8, Class A1, 7 1/2s, 2041 | | 918,908 | | 951,367 |
| Ser. 01-T7, Class A1, 7 1/2s, 2041 | | 7,205,982 | | 7,455,906 |
| Ser. 01-T3, Class A1, 7 1/2s, 2040 | | 645,853 | | 668,695 |
| Ser. 01-T1, Class A1, 7 1/2s, 2040 | | 1,175,819 | | 1,219,069 |
| Ser. 99-T2, Class A1, 7 1/2s, 2039 | | 393,901 | | 410,277 |
35
| COLLATERALIZED MORTGAGE OBLIGATIONS (37.7%)* continued | | | | |
|
| | Principal amount | | Value |
| |
| Fannie Mae | | | | |
| Ser. 03-W10, Class 1A1, 7 1/2s, 2032 | $ | 1,554,731 | $ | 1,614,099 |
| Ser. 02-T1, Class A3, 7 1/2s, 2031 | | 571,416 | | 592,958 |
| Ser. 00-T6, Class A1, 7 1/2s, 2030 | | 2,549,175 | | 2,637,588 |
| Ser. 01-T5, Class A3, 7 1/2s, 2030 | | 73,515 | | 76,147 |
| Ser. 02-W7, Class A5, 7 1/2s, 2029 | | 1,976,350 | | 2,054,458 |
| Ser. 01-T4, Class A1, 7 1/2s, 2028 | | 7,590,376 | | 7,922,743 |
| Ser. 02-W3, Class A5, 7 1/2s, 2028 | | 1,664,896 | | 1,728,783 |
| Ser. 02-26, Class A1, 7s, 2048 | | 2,013,620 | | 2,069,076 |
| Ser. 04-T3, Class 1A3, 7s, 2044 | | 2,122,824 | | 2,185,959 |
| Ser. 04-T2, Class 1A3, 7s, 2043 | | 1,622,629 | | 1,671,010 |
| Ser. 03-W3, Class 1A2, 7s, 2042 | | 981,213 | | 1,008,653 |
| Ser. 02-T16, Class A2, 7s, 2042 | | 2,066,793 | | 2,124,111 |
| Ser. 02-14, Class A1, 7s, 2042 | | 585,589 | | 601,423 |
| Ser. 01-W3, Class A, 7s, 2041 | | 761,411 | | 780,689 |
| Ser. 05-W4, Class 1A3, 7s, 2035 | | 2,916,697 | | 3,004,901 |
| Ser. 04-W1, Class 2A2, 7s, 2033 | | 5,690,781 | | 5,858,505 |
| IFB Ser. 05-74, Class CP, 6.566s, 2035 | | 2,219,868 | | 2,167,617 |
| IFB Ser. 05-76, Class SA, 6.566s, 2034 | | 3,141,386 | | 3,035,271 |
| IFB Ser. 06-8, Class PK, 6.562s, 2036 | | 4,028,057 | | 3,777,471 |
| IFB Ser. 05-57, Class CD, 6.527s, 2035 | | 2,019,381 | | 1,973,694 |
| IFB Ser. 02-97, Class TW, IO, 6 1/2s, 2031 | | 1,670,867 | | 308,227 |
| IFB Ser. 05-74, Class SK, 6.492s, 2035 | | 4,200,901 | | 4,090,996 |
| IFB Ser. 06-27, Class SP, 6.382s, 2036 | | 2,816,000 | | 2,734,879 |
| IFB Ser. 06-11, Class PS, 6.382s, 2036 | | 3,717,170 | | 3,527,246 |
| IFB Ser. 06-8, Class HP, 6.382s, 2036 | | 3,600,349 | | 3,450,417 |
| IFB Ser. 06-8, Class WK, 6.382s, 2036 | | 5,420,586 | | 5,166,106 |
| IFB Ser. 05-106, Class US, 6.382s, 2035 | | 5,360,872 | | 5,220,108 |
| IFB Ser. 05-99, Class SA, 6.382s, 2035 | | 2,629,314 | | 2,543,791 |
| IFB Ser. 05-74, Class CS, 6.382s, 2035 | | 2,529,983 | | 2,455,094 |
| IFB Ser. 05-45, Class DA, 6.236s, 2035 | | 4,029,927 | | 3,866,437 |
| IFB Ser. 05-74, Class DM, 6.199s, 2035 | | 5,181,108 | | 4,958,396 |
| IFB Ser. 04-79, Class SA, 6.189s, 2032 | | 5,496,382 | | 5,157,660 |
| IFB Ser. 05-45, Class DC, 6.126s, 2035 | | 3,178,176 | | 3,036,091 |
| IFB Ser. 05-114, Class SP, 5.942s, 2036 | | 1,513,327 | | 1,407,394 |
| IFB Ser. 05-57, Class DC, 5.657s, 2034 | | 3,935,812 | | 3,820,519 |
| Ser. 350, Class 2, IO, 5 1/2s, 2034 | | 17,797,469 | | 4,560,847 |
| Ser. 329, Class 2, IO, 5 1/2s, 2033 | | 12,434,898 | | 3,190,597 |
| IFB Ser. 05-45, Class PC, 5.372s, 2034 | | 1,880,276 | | 1,812,963 |
| IFB Ser. 05-95, Class CP, 5.157s, 2035 | | 423,337 | | 402,733 |
| IFB Ser. 05-95, Class OP, 5.037s, 2035 | | 1,286,000 | | 1,109,945 |
| Ser. 06-42, Class PS, 5s, 2036 | | 2,886,000 | | 2,812,844 |
| Ser. 06-45, Class SM, IO, 5s, 2036 | | 8,825,000 | | 416,452 |
| Ser. 06-42, Class IB, IO, 5s, 2036 | | 7,278,000 | | 295,763 |
| IFB Ser. 05-73, Class SA, 4.656s, 2035 | | 2,260,541 | | 2,087,998 |
| IFB Ser. 05-83, Class QP, 4 1/2s, 2034 | | 837,170 | | 743,794 |
| IFB Ser. 05-93, Class AS, 4.477s, 2034 | | 1,073,972 | | 940,439 |
| IFB Ser. 97-44, Class SN, IO, 3.31s, 2023 | | 1,815,322 | | 150,490 |
| IFB Ser. 05-56, Class TP, 3.272s, 2033 | | 1,007,212 | | 868,850 |
| IFB Ser. 02-89, Class S, IO, 3.241s, 2033 | | 4,794,920 | | 424,051 |
36
| COLLATERALIZED MORTGAGE OBLIGATIONS (37.7%)* continued | | | | |
|
| | Principal amount | | Value |
| |
| Fannie Mae | | | | |
| IFB Ser. 02-36, Class QH, IO, 3.091s, 2029 | $ | 1,062,007 | $ | 18,277 |
| IFB Ser. 03-66, Class SA, IO, 2.691s, 2033 | | 5,203,130 | | 382,919 |
| IFB Ser. 03-48, Class S, IO, 2.591s, 2033 | | 2,300,746 | | 166,804 |
| IFB Ser. 02-92, Class SB, IO, 2.391s, 2030 | | 1,740,429 | | 106,434 |
| IFB Ser. 05-113, Class DI, IO, 2.271s, 2036 | | 61,819,043 | | 3,664,196 |
| IFB Ser. 05-52, Class DC, IO, 2.241s, 2035 | | 3,580,361 | | 281,953 |
| Ser. 03-W12, Class 2, IO, 2.229s, 2043 | | 7,519,377 | | 369,379 |
| IFB Ser. 04-24, Class CS, IO, 2.191s, 2034 | | 6,580,964 | | 454,498 |
| IFB Ser. 03-122, Class SA, IO, 2.141s, 2028 | | 9,268,492 | | 438,172 |
| IFB Ser. 03-122, Class SJ, IO, 2.141s, 2028 | | 9,892,111 | | 474,588 |
| IFB Ser. 04-65, Class ST, IO, 2.091s, 2034 | | 7,178,208 | | 376,856 |
| IFB Ser. 04-51, Class S0, IO, 2.091s, 2034 | | 1,296,172 | | 63,593 |
| IFB Ser. 04-60, Class SW, IO, 2.091s, 2034 | | 12,288,264 | | 827,541 |
| IFB Ser. 05-65, Class KI, IO, 2.041s, 2035 | | 29,260,483 | | 1,622,874 |
| Ser. 03-W10, Class 1, IO, 1.961s, 2043 | | 30,021,951 | | 1,358,779 |
| Ser. 03-W10, Class 3, IO, 1.929s, 2043 | | 11,562,207 | | 538,393 |
| IFB Ser. 05-42, Class SA, IO, 1.841s, 2035 | | 10,344,567 | | 534,436 |
| IFB Ser. 05-73, Class SI, IO, 1.791s, 2035 | | 2,605,505 | | 124,372 |
| IFB Ser. 05-17, Class ES, IO, 1.791s, 2035 | | 5,131,138 | | 318,021 |
| IFB Ser. 05-17, Class SY, IO, 1.791s, 2035 | | 2,389,736 | | 149,421 |
| IFB Ser. 05-62, Class FS, IO, 1.791s, 2034 | | 6,551,935 | | 347,289 |
| IFB Ser. 05-82, Class SW, IO, 1.771s, 2035 | | 9,924,361 | | 434,578 |
| IFB Ser. 05-82, Class SY, IO, 1.771s, 2035 | | 12,627,849 | | 552,962 |
| IFB Ser. 05-45, Class EW, IO, 1.761s, 2035 | | 22,361,742 | | 1,066,405 |
| IFB Ser. 05-45, Class SR, IO, 1.761s, 2035 | | 16,777,744 | | 798,312 |
| IFB Ser. 05-47, Class SW, IO, 1.761s, 2035 | | 14,614,896 | | 626,842 |
| IFB Ser. 05-105, Class S, IO, 1.741s, 2035 | | 3,828,246 | | 199,787 |
| IFB Ser. 05-95, Class CI, IO, 1.741s, 2035 | | 5,622,608 | | 313,364 |
| IFB Ser. 05-84, Class SG, IO, 1.741s, 2035 | | 9,989,981 | | 596,162 |
| IFB Ser. 05-87, Class SG, IO, 1.741s, 2035 | | 12,528,270 | | 599,008 |
| IFB Ser. 05-89, Class S, IO, 1.741s, 2035 | | 17,854,902 | | 772,782 |
| IFB Ser. 05-69, Class AS, IO, 1.741s, 2035 | | 2,617,122 | | 140,670 |
| IFB Ser. 05-54, Class SA, IO, 1.741s, 2035 | | 11,858,606 | | 511,402 |
| IFB Ser. 05-23, Class SG, IO, 1.741s, 2035 | | 7,913,409 | | 450,075 |
| IFB Ser. 05-29, Class SX, IO, 1.741s, 2035 | | 9,499,457 | | 537,078 |
| IFB Ser. 05-57, Class CI, IO, 1.741s, 2035 | | 7,441,132 | | 396,933 |
| IFB Ser. 05-104, Class NI, IO, 1.741s, 2035 | | 1,692,097 | | 108,116 |
| IFB Ser. 05-17, Class SA, IO, 1.741s, 2035 | | 7,209,579 | | 433,597 |
| IFB Ser. 05-17, Class SE, IO, 1.741s, 2035 | | 7,715,224 | | 458,119 |
| IFB Ser. 05-57, Class DI, IO, 1.741s, 2035 | | 16,084,376 | | 808,867 |
| IFB Ser. 04-92, Class S, IO, 1.741s, 2034 | | 8,094,394 | | 417,371 |
| IFB Ser. 05-104, Class SI, IO, 1.741s, 2033 | | 12,542,663 | | 700,548 |
| IFB Ser. 05-83, Class QI, IO, 1.731s, 2035 | | 1,388,861 | | 86,349 |
| IFB Ser. 05-92, Class SC, IO, 1.721s, 2035 | | 13,207,588 | | 736,732 |
| IFB Ser. 05-73, Class SD, IO, 1.721s, 2035 | | 6,522,786 | | 354,422 |
| IFB Ser. 06-20, Class PI, IO, 1.721s, 2030 | | 10,922,155 | | 408,043 |
| IFB Ser. 05-83, Class SL, IO, 1.711s, 2035 | | 25,998,829 | | 1,293,418 |
| IFB Ser. 06-20, Class IG, IO, 1.691s, 2036 | | 36,215,708 | | 1,693,291 |
| IFB Ser. 06-8, Class NS, IO, 1.671s, 2036 | | 16,648,821 | | 901,816 |
37
| COLLATERALIZED MORTGAGE OBLIGATIONS (37.7%)* continued | | | | |
|
| | Principal amount | | Value |
| |
| Fannie Mae | | | | |
| IFB Ser. 06-8, Class NY, IO, 1.641s, 2036 | $ | 6,638,423 | $ | 346,762 |
| Ser. 03-W8, Class 12, IO, 1.637s, 2042 | | 53,086,402 | | 1,999,551 |
| IFB Ser. 06-20, Class IB, IO, 1.631s, 2036 | | 15,521,018 | | 697,231 |
| IFB Ser. 05-95, Class OI, IO, 1.631s, 2035 | | 786,930 | | 47,802 |
| IFB Ser. 04-38, Class SI, IO, 1.611s, 2033 | | 11,689,085 | | 451,199 |
| IFB Ser. 04-72, Class SB, IO, 1.541s, 2034 | | 5,315,216 | | 195,999 |
| IFB Ser. 03-112, Class SA, IO, 1.541s, 2028 | | 5,058,761 | | 168,454 |
| Ser. 03-W3, Class 2IO2, IO, 1.456s, 2042 | | 3,799,281 | | 6,750 |
| Ser. 03-W6, Class 11, IO, 1.286s, 2035 | | 5,300,197 | | 3,180 |
| IFB Ser. 05-67, Class BS, IO, 1.191s, 2035 | | 6,703,470 | | 259,759 |
| Ser. 03-W10, Class 1A, IO, 1.174s, 2043 | | 988,525 | | 14,706 |
| Ser. 03-W10, Class 3A, IO, 1.151s, 2043 | | 1,191,145 | | 19,563 |
| Ser. 03-W17, Class 12, IO, 1.151s, 2033 | | 13,945,630 | | 408,989 |
| IFB Ser. 05-74, Class SE, IO, 1.141s, 2035 | | 13,674,515 | | 391,848 |
| IFB Ser. 05-82, Class SI, IO, 1.141s, 2035 | | 21,388,417 | | 615,752 |
| Ser. 03-W19, IO, 1.104s, 2033 | | 1,558,854 | | 40,818 |
| IFB Ser. 05-87, Class SE, IO, 1.091s, 2035 | | 50,002,023 | | 1,609,440 |
| IFB Ser. 05-58, Class IK, IO, 1.041s, 2035 | | 5,402,725 | | 211,888 |
| IFB Ser. 04-54, Class SW, IO, 1.041s, 2033 | | 3,076,952 | | 80,386 |
| Ser. 03-T2, Class 2, IO, 0.848s, 2042 | | 86,459,616 | | 1,560,035 |
| Ser. 03-18, Class X1, IO, 0.684s, 2042 | | 39,893,231 | | 541,080 |
| Ser. 03-W6, Class 51, IO, 0.682s, 2042 | | 22,527,059 | | 247,798 |
| Ser. 03-W3, Class 2IO1, IO, 0.682s, 2042 | | 31,924,471 | | 501,640 |
| Ser. 01-T12, Class IO, 0.569s, 2041 | | 39,873,977 | | 457,808 |
| Ser. 03-W2, Class 1, IO, 0.471s, 2042 | | 46,390,131 | | 439,715 |
| Ser. 01-50, Class B1, IO, 0.453s, 2041 | | 5,348,724 | | 39,336 |
| Ser. 02-T4, IO, 0.45s, 2041 | | 22,099,837 | | 194,329 |
| Ser. 03-W3, Class 1, IO, 0.439s, 2042 | | 29,938,822 | | 280,510 |
| Ser. 02-T1, Class IO, IO, 0.426s, 2031 | | 32,422,238 | | 291,905 |
| Ser. 03-W6, Class 3, IO, 0.365s, 2042 | | 30,693,739 | | 144,261 |
| Ser. 03-W6, Class 23, IO, 0.35s, 2042 | | 32,825,690 | | 147,716 |
| Ser. 03-W8, Class 11, IO, 0.03s, 2042 | | 15,006,286 | | 1,504 |
| Ser. 03-W6, Class 21, IO, 0.004s, 2042 | | 6,247,713 | | 1 |
| Ser. 03-34, Class P1, Principal Only (PO), | | | | |
| zero %, 2043 | | 142,149 | | 96,994 |
| Ser. 05-113, Class DO, PO, zero %, 2036 | | 9,502,115 | | 7,337,428 |
| Ser. 363, Class 1, PO, zero %, 2035 | | 20,154,195 | | 14,066,900 |
| Ser. 361, Class 1, PO, zero %, 2035 | | 13,079,811 | | 9,869,056 |
| Ser. 05-65, Class KO, PO, zero %, 2035 | | 932,617 | | 734,002 |
| Ser. 04-38, Class AO, PO, zero %, 2034 | | 5,937,530 | | 4,211,935 |
| Ser. 342, Class 1, PO, zero %, 2033 | | 2,791,538 | | 2,082,361 |
| Ser. 02-82, Class TO, PO, zero %, 2032 | | 1,837,333 | | 1,376,565 |
| Ser. 04-61, Class CO, PO, zero %, 2031 | | 4,902,000 | | 3,578,460 |
| Ser. 05-38, PO, zero %, 2031 | | 544,000 | | 373,490 |
| FRB Ser. 05-117, Class GF, zero %, 2036 | | 1,288,705 | | 1,279,039 |
| FRB Ser. 05-65, Class ER, zero %, 2035 | | 4,034,339 | | 4,402,172 |
| FRB Ser. 05-57, Class UL, zero %, 2035 | | 4,166,570 | | 4,495,844 |
| FRB Ser. 05-36, Class QA, zero %, 2035 | | 778,161 | | 802,300 |
| FRB Ser. 05-65, Class CU, zero %, 2034 | | 575,396 | | 835,662 |
| FRB Ser. 05-81, Class DF, zero %, 2033 | | 590,029 | | 684,806 |
| | | | | |
38
| COLLATERALIZED MORTGAGE OBLIGATIONS (37.7%)* continued | | | | |
|
| | Principal amount | | Value |
| |
| Federal Home Loan Mortgage Corp. Structured | | | | |
| Pass-Through Securities | | | | |
| Ser. T-42, Class A6, 9 1/2s, 2042 | $ | 404,153 | $ | 426,809 |
| Ser. T-60, Class 1A3, 7 1/2s, 2044 | | 7,688,802 | | 8,012,906 |
| Ser. T-59, Class 1A3, 7 1/2s, 2043 | | 5,212,668 | | 5,441,263 |
| Ser. T-58, Class 4A, 7 1/2s, 2043 | | 2,106,156 | | 2,188,398 |
| Ser. T-57, Class 1A3, 7 1/2s, 2043 | | 5,546,637 | | 5,762,731 |
| Ser. T-51, Class 2A, 7 1/2s, 2042 | | 2,392,080 | | 2,479,886 |
| Ser. T-42, Class A5, 7 1/2s, 2042 | | 1,502,297 | | 1,559,217 |
| Ser. T-41, Class 3A, 7 1/2s, 2032 | | 4,698,086 | | 4,871,854 |
| Ser. T-60, Class 1A2, 7s, 2044 | | 7,082,440 | | 7,289,870 |
| Ser. T-41, Class 2A, 7s, 2032 | | 183,956 | | 188,579 |
| Ser. T-56, Class A, IO, 0.641s, 2043 | | 19,714,305 | | 217,804 |
| Ser. T-56, Class 3, IO, 0.353s, 2043 | | 19,944,870 | | 206,673 |
| Ser. T-56, Class 1, IO, 0.279s, 2043 | | 24,667,731 | | 173,133 |
| Ser. T-56, Class 2, IO, 0.038s, 2043 | | 22,983,330 | | 60,758 |
| FFCA Secured Lending Corp. 144A Ser. 00-1, Class A2, | | | | |
| 7.77s, 2027 | | 7,604,544 | | 8,035,097 |
| First Union National Bank-Bank of America Commercial | | | | |
| Mortgage 144A Ser. 01-C1, Class 3, IO, 1.956s, 2033 | | 41,972,740 | | 2,726,100 |
| First Union-Lehman Brothers Commercial | | | | |
| Mortgage Trust II | | | | |
| Ser. 97-C2, Class F, 7 1/2s, 2029 | | 3,492,000 | | 3,766,947 |
| Ser. 97-C2, Class G, 7 1/2s, 2029 | | 1,156,000 | | 1,249,631 |
| Ser. 97-C1, Class A3, 7.38s, 2029 | | 3,962,957 | | 3,991,114 |
| First Union-Lehman Brothers-Bank of America 144A | | | | |
| Ser. 98-C2, Class G, 7s, 2035 | | 4,500,000 | | 4,709,880 |
| Freddie Mac | | | | |
| IFB Ser. 2990, Class LB, 4.419s, 2034 | | 3,828,134 | | 3,361,069 |
| IFB Ser. 2963, Class SV, 8.995s, 2034 | | 1,112,000 | | 1,111,044 |
| IFB Ser. 2763, Class SC, 8.995s, 2032 | | 5,710,156 | | 5,786,005 |
| Ser. 3114, Class BL, IO, 7 1/2s, 2030 | | 1,017,950 | | 201,284 |
| IFB Ser. 3081, Class DC, 7.104s, 2035 | | 2,111,125 | | 1,988,918 |
| IFB Ser. 3114, Class GK, 6.795s, 2036 | | 1,402,713 | | 1,321,545 |
| IFB Ser. 2976, Class LC, 6.449s, 2035 | | 1,560,791 | | 1,474,453 |
| IFB Ser. 2976, Class KL, 6.412s, 2035 | | 3,679,221 | | 3,476,509 |
| IFB Ser. 2996, Class SA, 6.322s, 2035 | | 1,850,889 | | 1,691,250 |
| IFB Ser. 2990, Class DP, 6.302s, 2034 | | 3,259,655 | | 3,093,233 |
| IFB Ser. 2979, Class AS, 6.302s, 2034 | | 938,872 | | 885,473 |
| IFB Ser. 3072, Class SA, 6.155s, 2035 | | 824,307 | | 745,418 |
| IFB Ser. 3072, Class SM, 5.825s, 2035 | | 1,312,182 | | 1,168,354 |
| IFB Ser. 3072, Class SB, 5.679s, 2035 | | 1,228,697 | | 1,087,349 |
| IFB Ser. 3065, Class DC, 5.156s, 2035 | | 3,161,992 | | 2,780,749 |
| IFB Ser. 3050, Class SA, 4.622s, 2034 | | 2,261,448 | | 1,979,386 |
| IFB Ser. 2990, Class WP, 4.383s, 2035 | | 2,573,634 | | 2,374,908 |
| IFB Ser. 2927, Class SI, IO, 3.599s, 2035 | | 6,078,869 | | 656,976 |
| Ser. 2437, Class SB, IO, 3.099s, 2032 | | 5,633,713 | | 457,739 |
| IFB Ser. 2538, Class SH, IO, 2.649s, 2032 | | 925,710 | | 58,609 |
| IFB Ser. 2828, Class GI, IO, 2.599s, 2034 | | 6,702,373 | | 601,923 |
| IFB Ser. 2802, Class SM, IO, 2.449s, 2032 | | 1,977,207 | | 126,399 |
39
| COLLATERALIZED MORTGAGE OBLIGATIONS (37.7%)* continued | | | | |
|
| | Principal amount | | Value |
| |
| Freddie Mac | | | | |
| IFB Ser. 2869, Class SH, IO, 2.399s, 2034 | $ | 3,456,596 | $ | 197,305 |
| IFB Ser. 2869, Class JS, IO, 2.349s, 2034 | | 16,716,412 | | 938,062 |
| IFB Ser. 2882, Class SL, IO, 2.299s, 2034 | | 3,773,171 | | 259,540 |
| IFB Ser. 2682, Class TQ, IO, 2.149s, 2033 | | 2,790,247 | | 145,616 |
| IFB Ser. 2815, Class PT, IO, 2.149s, 2032 | | 6,531,007 | | 419,185 |
| IFB Ser. 2828, Class TI, IO, 2.149s, 2030 | | 3,163,281 | | 186,831 |
| IFB Ser. 3033, Class SF, IO, 1.899s, 2035 | | 4,677,918 | | 181,269 |
| IFB Ser. 3028, Class ES, IO, 1.849s, 2035 | | 15,701,971 | | 1,007,603 |
| IFB Ser. 2922, Class SE, IO, 1.849s, 2035 | | 9,269,674 | | 411,342 |
| IFB Ser. 3045, Class DI, IO, 1.829s, 2035 | | 20,090,733 | | 907,508 |
| IFB Ser. 2981, Class AS, IO, 1.819s, 2035 | | 8,590,983 | | 357,063 |
| IFB Ser. 2981, Class BS, IO, 1.819s, 2035 | | 4,354,198 | | 187,775 |
| IFB Ser. 3118, Class SD, IO, 1.799s, 2036 | | 15,816,005 | | 625,226 |
| IFB Ser. 3054, Class CS, IO, 1.799s, 2035 | | 3,597,381 | | 166,940 |
| IFB Ser. 3107, Class DC, IO, 1.799s, 2035 | | 15,898,858 | | 1,120,373 |
| IFB Ser. 3129, Class SP, IO, 1.799s, 2035 | | 6,678,782 | | 312,026 |
| IFB Ser. 3066, Class SI, IO, 1.799s, 2035 | | 10,218,527 | | 640,880 |
| IFB Ser. 2924, Class SA, IO, 1.799s, 2035 | | 13,211,128 | | 549,088 |
| IFB Ser. 2927, Class ES, IO, 1.799s, 2035 | | 4,899,400 | | 223,205 |
| IFB Ser. 2950, Class SM, IO, 1.799s, 2016 | | 6,795,833 | | 331,297 |
| IFB Ser. 3031, Class BI, IO, 1.789s, 2035 | | 2,995,004 | | 186,746 |
| IFB Ser. 3067, Class SI, IO, 1.749s, 2035 | | 11,832,051 | | 779,319 |
| IFB Ser. 2986, Class WS, IO, 1.749s, 2035 | | 3,965,186 | | 135,287 |
| IFB Ser. 2962, Class BS, IO, 1.749s, 2035 | | 19,862,810 | | 995,778 |
| IFB Ser. 3114, Class TS, IO, 1.749s, 2030 | | 40,745,316 | | 1,627,207 |
| IFB Ser. 3114, Class BI, IO, 1.749s, 2030 | | 15,125,760 | | 565,613 |
| IFB Ser. 2990, Class LI, IO, 1.729s, 2034 | | 5,790,741 | | 327,113 |
| IFB Ser. 3065, Class DI, IO, 1.719s, 2035 | | 2,303,603 | | 133,733 |
| IFB Ser. 3114, Class GI, IO, 1.699s, 2036 | | 3,466,807 | | 202,925 |
| IFB Ser. 3081, Class DI, IO, 1.579s, 2035 | | 3,035,507 | | 162,018 |
| IFB Ser. 2988, Class AS, IO, 1.299s, 2035 | | 1,937,454 | | 63,511 |
| IFB Ser. 3016, Class SP, IO, 1.209s, 2035 | | 3,089,358 | | 93,163 |
| IFB Ser. 3016, Class SQ, IO, 1.209s, 2035 | | 7,363,208 | | 228,952 |
| IFB Ser. 2937, Class SY, IO, 1.199s, 2035 | | 3,010,227 | | 78,416 |
| IFB Ser. 2957, Class SW, IO, 1.099s, 2035 | | 17,063,861 | | 485,254 |
| IFB Ser. 2815, Class S, IO, 1.099s, 2032 | | 7,247,752 | | 202,021 |
| Ser. 236, PO, zero %, 2036 | | 13,502,507 | | 9,955,629 |
| Ser. 3045, Class DO, PO, zero %, 2035 | | 1,620,296 | | 1,203,324 |
| Ser. 231, PO, zero %, 2035 | | 126,184,701 | | 89,302,476 |
| Ser. 228, PO, zero %, 2035 | | 32,475,397 | | 24,000,546 |
| FRB Ser. 3022, Class TC, zero %, 2035 | | 632,835 | | 759,402 |
| FRB Ser. 3003, Class XF, zero %, 2035 | | 3,719,460 | | 4,227,390 |
| FRB Ser. 2986, Class XT, zero %, 2035 | | 376,582 | | 418,005 |
| FRB Ser. 2958, Class FL, zero %, 2035 | | 1,631,331 | | 1,563,663 |
| FRB Ser. 3046, Class WF, zero %, 2035 | | 911,843 | | 907,133 |
| FRB Ser. 3054, Class XF, zero %, 2034 | | 379,517 | | 420,315 |
| GE Capital Commercial Mortgage Corp. Ser. 04-C2, | | | | |
| Class A4, 4.893s, 2040 | | 8,506,000 | | 8,034,700 |
40
| COLLATERALIZED MORTGAGE OBLIGATIONS (37.7%)* continued | | | |
|
| | Principal amount | | Value |
| |
| GE Capital Commercial Mortgage Corp. 144A | | | |
| Ser. 05-C2, Class XC, IO, 0.052s, 2043 | $ 124,382,465 | $ | 1,036,255 |
| Ser. 05-C3, Class XC, IO, 0.035s, 2045 | 292,832,000 | | 1,511,013 |
| General Growth Properties-Mall Properties Trust 144A | | | |
| FRB Ser. 01-C1A, Class D3, 7.151s, 2014 | 2,600,334 | | 2,602,772 |
| GMAC Commercial Mortgage Securities, Inc. | | | |
| Ser. 99-C3, Class F, 8.062s, 2036 | 488,000 | | 524,151 |
| Ser. 01-C2, Class A1, 6 1/4s, 2034 | 435,143 | | 440,021 |
| Ser. 03-C2, Class A2, 5.457s, 2040 | 7,723,000 | | 7,633,027 |
| Ser. 04-C2, Class A4, 5.301s, 2038 | 13,017,000 | | 12,667,884 |
| Ser. 97-C1, Class X, IO, 1.552s, 2029 | 18,888,677 | | 620,898 |
| Ser. 05-C1, Class X1, IO, 0.109s, 2043 | 108,047,000 | | 1,924,317 |
| GMAC Commercial Mortgage Securities, Inc. 144A | | | |
| Ser. 99-C3, Class G, 6.974s, 2036 | 2,095,341 | | 2,026,859 |
| Ser. 06-C1, Class XC, IO, 0.043s, 2045 | 173,377,581 | | 1,151,227 |
| Government National Mortgage Association | | | |
| IFB Ser. 05-7, Class JM, 5.918s, 2034 | 4,139,107 | | 3,976,553 |
| IFB Ser. 05-66, Class SP, 4.467s, 2035 | 1,913,366 | | 1,663,022 |
| IFB Ser. 04-86, Class SW, IO, 1.828s, 2034 | 8,264,093 | | 408,337 |
| IFB Ser. 05-65, Class SI, IO, 1.428s, 2035 | 7,967,450 | | 305,815 |
| IFB Ser. 05-68, Class SI, IO, 1.378s, 2035 | 26,036,220 | | 1,099,420 |
| IFB Ser. 06-10, Class SM, IO, 1.328s, 2036 | 18,106,280 | | 695,960 |
| IFB Ser. 06-14, Class S, IO, 1.328s, 2036 | 7,767,892 | | 279,159 |
| IFB Ser. 05-51, Class SJ, IO, 1.278s, 2035 | 7,788,332 | | 317,616 |
| IFB Ser. 05-68, Class S, IO, 1.278s, 2035 | 15,389,748 | | 594,071 |
| IFB Ser. 05-28, Class SA, IO, 1.278s, 2035 | 19,944,266 | | 689,409 |
| Ser. 99-31, Class MP, PO, zero %, 2029 | 150,897 | | 125,016 |
| Ser. 98-2, Class EA, PO, zero %, 2028 | 1,207,905 | | 933,485 |
| Greenwich Capital Commercial Funding Corp. | | | |
| Ser. 05-GG5, Class XC, IO, 0.041s, 2037 | 237,692,408 | | 1,057,192 |
| Greenwich Capital Commercial Funding Corp. 144A | | | |
| Ser. 05-GG3, Class XC, IO, 0.08s, 2042 | 107,854,592 | | 1,741,852 |
| GS Mortgage Securities Corp. II | | | |
| Ser. 04-GG2, Class A6, 5.396s, 2038 | 5,069,000 | | 4,965,111 |
| Ser. 05-GG4, Class A4B, 4.732s, 2039 | 7,685,000 | | 7,113,874 |
| GS Mortgage Securities Corp. II 144A | | | |
| FRB Ser. 03-FL6A, Class L, 8.151s, 2015 | 748,000 | | 752,208 |
| Ser. 98-C1, Class F, 6s, 2030 | 1,627,000 | | 1,617,791 |
| Ser. 03-C1, Class X1, IO, 0.297s, 2040 | 40,798,064 | | 752,521 |
| Ser. 05-GG4, Class XC, IO, 0.112s, 2039 | 133,722,852 | | 2,545,215 |
| Ser. 04-C1, Class X1, IO, 0.088s, 2028 | 46,397,217 | | 376,977 |
| Ser. 06-GG6, Class XC, IO, 0.04s, 2038 | 147,274,915 | | 506,258 |
| JP Morgan Commercial Mortgage Finance Corp. | | | |
| Ser. 97-C5, Class F, 7.561s, 2029 | 1,171,000 | | 1,259,498 |
| JP Morgan Commercial Mortgage Finance Corp. 144A | | | |
| Ser. 00-C9, Class G, 6 1/4s, 2032 | 1,515,000 | | 1,530,011 |
41
| COLLATERALIZED MORTGAGE OBLIGATIONS (37.7%)* continued | | | | |
|
| | Principal amount | | Value |
| |
| JPMorgan Chase Commercial Mortgage | | | | |
| Securities Corp. | | | | |
| Ser. 06-CB14, Class AM, 5.63s, 2044 | $ | 5,894,000 | $ | 5,789,676 |
| Ser. 06-CB14, Class A4, 5.481s, 2044 | | 11,600,000 | | 11,364,404 |
| Ser. 05-CB11, Class A4, 5.335s, 2037 | | 8,740,000 | | 8,827,400 |
| Ser. 05-LDP2, Class AM, 4.78s, 2042 | | 2,030,000 | | 1,887,890 |
| JPMorgan Chase Commercial Mortgage | | | | |
| Securities Corp. 144A | | | | |
| Ser. 04-FL1A, Class X1A, IO, 0.964s, 2019 | | 7,702,431 | | 25,445 |
| Ser. 03-ML1A, Class X1, IO, 0.413s, 2039 | | 20,756,283 | | 767,010 |
| Ser. 05-LDP1, Class X1, IO, 0.061s, 2046 | | 46,954,397 | | 432,861 |
| Ser. 05-CB12, Class X1, IO, 0.06s, 2037 | | 70,688,421 | | 751,064 |
| Ser. 05-LDP2, Class X1, IO, 0.051s, 2042 | | 241,625,908 | | 3,775,405 |
| Ser. 05-LDP4, Class X1, IO, 0.047s, 2042 | | 141,351,419 | | 1,303,083 |
| Ser. 06-LDP6, Class X1, IO, 0.041s, 2043 | | 95,657,053 | | 553,017 |
| Ser. 06-CB14, Class X1, IO, 0.04s, 2044 | | 58,833,373 | | 275,781 |
| Ser. 05-LDP3, Class X1, IO, 0.04s, 2042 | | 173,314,918 | | 1,299,862 |
| Ser. 05-LDP5, Class X1, IO, 0.037s, 2044 | | 447,739,816 | | 2,098,780 |
| LB Commercial Conduit Mortgage Trust 144A | | | | |
| Ser. 99-C1, Class F, 6.41s, 2031 | | 926,463 | | 929,029 |
| Ser. 99-C1, Class G, 6.41s, 2031 | | 991,777 | | 910,654 |
| Ser. 98-C4, Class G, 5.6s, 2035 | | 784,000 | | 762,657 |
| Ser. 98-C4, Class H, 5.6s, 2035 | | 1,328,000 | | 1,244,793 |
| LB-UBS Commercial Mortgage Trust | | | | |
| Ser. 05-C7, Class AM, 5.263s, 2040 | | 9,607,000 | | 9,233,943 |
| Ser. 04-C7, Class A6, 4.786s, 2029 | | 2,341,000 | | 2,195,435 |
| LB-UBS Commercial Mortgage Trust 144A | | | | |
| Ser. 05-C3, Class XCL, IO, 0.127s, 2040 | | 71,790,665 | | 1,543,603 |
| Ser. 05-C2, Class XCL, IO, 0.107s, 2040 | | 236,332,762 | | 2,518,920 |
| Ser. 05-C5, Class XCL, IO, 0.092s, 2020 | | 106,242,048 | | 1,506,935 |
| Ser. 05-C7, Class XCL, IO, 0.083s, 2040 | | 158,641,607 | | 1,468,825 |
| Ser. 06-C1, Class XCL, IO, 0.072s, 2041 | | 168,306,745 | | 1,813,374 |
| Lehman Brothers Floating Rate Commercial | | | | |
| Mortgage Trust 144A | | | | |
| FRB Ser. 03-LLFA, Class L, 8.651s, 2014 | | 2,250,000 | | 2,248,402 |
| FRB Ser. 04-LLFA, Class H, 5.851s, 2017 | | 826,000 | | 829,139 |
| FRB Ser. 05-LLFA, 5.701s, 2018 | | 534,000 | | 534,000 |
| Merrill Lynch Mortgage Investors, Inc. | | | | |
| Ser. 98-C3, Class E, 7.138s, 2030 | | 826,000 | | 870,043 |
| Ser. 96-C2, Class JS, IO, 2.136s, 2028 | | 3,804,167 | | 152,018 |
| Merrill Lynch Mortgage Trust Ser. 05-MCP1, Class XC, | | | | |
| IO, 0.052s, 2043 | | 88,646,834 | | 1,166,952 |
| Merrill Lynch Mortgage Trust 144A Ser. 05-LC1, | | | | |
| Class X, IO, 0.238s, 2044 | | 48,902,547 | | 489,025 |
| Merrill Lynch/Countrywide Commercial Mortgage Trust | | | | |
| 144A Ser. 06-1, Class X, IO, 0.14s, 2039 | | 126,898,000 | | 768,328 |
| Mezz Cap Commercial Mortgage Trust 144A | | | | |
| Ser. 04-C1, Class X, IO, 8.051s, 2037 | | 4,214,124 | | 1,590,832 |
| Ser. 04-C2, Class X, IO, 6.405s, 2040 | | 1,997,761 | | 685,482 |
| Ser. 05-C3, Class X, IO, 4.362s, 2044 | | 3,724,341 | | 1,220,886 |
42
| COLLATERALIZED MORTGAGE OBLIGATIONS (37.7%)* continued | | | |
|
| | Principal amount | | Value |
| |
| Morgan Stanley Capital 144A | | | |
| Ser. 05-RR6, Class X, IO, 1.719s, 2043 | $ 13,493,000 | $ | 926,969 |
| Ser. 05-HQ6, Class X1, IO, 0.05s, 2042 | 113,277,379 | | 1,123,938 |
| Morgan Stanley Capital I | | | |
| Ser. 05-HQ6, Class A4A, 4.989s, 2042 | 5,354,000 | | 5,072,440 |
| Ser. 04-HQ4, Class A7, 4.97s, 2040 | 2,771,000 | | 2,623,777 |
| Morgan Stanley Capital I 144A | | | |
| Ser. 98-HF1, Class F, 7.18s, 2030 | 498,000 | | 509,969 |
| Ser. 04-RR, Class F5, 6s, 2039 | 1,350,000 | | 1,103,790 |
| Ser. 04-RR, Class F6, 6s, 2039 | 2,030,000 | | 1,595,215 |
| Ser. 05-HQ5, Class X1, IO, 0.088s, 2042 | 64,606,411 | | 522,407 |
| Morgan Stanley Dean Witter Capital I Ser. 00-LIF2, | | | |
| Class A1, 6.96s, 2033 | 585,344 | | 593,321 |
| Mortgage Capital Funding, Inc. FRB Ser. 98-MC2, | | | |
| Class E, 7 1/4s, 2030 | 1,389,000 | | 1,426,831 |
| Permanent Financing PLC FRB Ser. 8, Class 2C, 5.28s, | | | |
| 2042 (United Kingdom) | 2,413,000 | | 2,412,235 |
| PNC Mortgage Acceptance Corp. 144A | | | |
| Ser. 99-CM1, Class B3, 7.1s, 2032 | 4,971,000 | | 5,133,502 |
| Ser. 00-C1, Class J, 6 5/8s, 2010 | 309,000 | | 286,805 |
| Ser. 00-C2, Class J, 6.22s, 2033 | 1,290,000 | | 1,298,488 |
| Pure Mortgages 144A | | | |
| FRB Ser. 04-1A, Class F, 8.31s, 2034 (Ireland) | 3,491,000 | | 3,510,899 |
| Ser. 04-1A, Class E, 6.06s, 2034 (Ireland) | 1,374,000 | | 1,374,344 |
| QFA Royalties, LLC 144A Ser. 05-1, 7.3s, 2025 | 2,145,048 | | 2,102,625 |
| Salomon Brothers Mortgage Securities VII 144A | | | |
| Ser. 03-CDCA, Class X3CD, IO, 1.43s, 2015 | 5,055,133 | | 32,646 |
| SBA CMBS Trust 144A Ser. 05-1A, Class D, 6.219s, 2035 | 770,000 | | 760,261 |
| STRIPS 144A | | | |
| Ser. 03-1A, Class L, 5s, 2018 (Cayman Islands) | 993,000 | | 854,606 |
| Ser. 03-1A, Class M, 5s, 2018 (Cayman Islands) | 673,000 | | 553,724 |
| Ser. 04-1A, Class L, 5s, 2018 (Cayman Islands) | 443,000 | | 379,385 |
| Wachovia Bank Commercial Mortgage Trust | | | |
| Ser. 06-C23, Class A4, 5.418s, 2045 | 15,955,000 | | 15,540,489 |
| Ser. 05-C17, Class A4, 5.083s, 2042 | 8,696,000 | | 8,297,375 |
| Ser. 04-C15, Class A4, 4.803s, 2041 | 4,128,000 | | 3,861,758 |
| Wachovia Bank Commercial Mortgage Trust 144A | | | |
| FRB Ser. 05-WL5A, Class L, 8.201s, 2018 | 944,000 | | 941,262 |
| Ser. 03-C3, Class IOI, IO, 0.401s, 2035 | 23,191,266 | | 784,837 |
| Ser. 05-C18, Class XC, IO, 0.055s, 2042 | 51,363,198 | | 518,768 |
| Ser. 06-C23, Class XC, IO, 0.052s, 2045 | 297,637,197 | | 1,812,611 |
| Washington Mutual Asset Securities Corp. 144A | | | |
| Ser. 05-C1A, Class G, 5.72s, 2036 | 219,000 | | 205,988 |
| Washington Mutual Multi-Fam., Mtge. 144A Ser. 01-1, | | | |
| Class B5, 7.209s, 2031 (Cayman Islands) | 1,793,000 | | 1,848,528 |
|
| Total collateralized mortgage obligations (cost $998,459,334) | | $ | 955,648,056 |
43
| U.S. GOVERNMENT AND AGENCY MORTGAGE OBLIGATIONS (31.2%)* | | |
|
| | Principal amount | | Value |
| |
| U.S. Government Guaranteed Mortgage Obligations (0.2%) | | | | |
| Government National Mortgage Association | | | | |
| Graduated Payment Mortgages | | | | |
| 11s, with due dates from March 15, 2010 to | | | | |
| October 15, 2010 | $ | 29,519 | $ | 31,959 |
| Government National Mortgage Association | | | | |
| Pass-Through Certificates | | | | |
| 7s, with due dates from April 15, 2026 to | | | | |
| December 15, 2031 | | 912,528 | | 955,988 |
| 6s, TBA, May 1, 2036 | | 1,550,000 | | 1,555,691 |
| 5 1/2s, TBA, May 1, 2036 | | 1,650,000 | | 1,612,488 |
| | | | | 4,156,126 |
|
| |
| U.S. Government Agency Mortgage Obligations (31.0%) | | | | |
| Federal Home Loan Mortgage Corporation | | | | |
| Pass-Through Certificates | | | | |
| 7 1/2s, December 1, 2029 | | 41,221 | | 43,013 |
| 7s, January 1, 2015 | | 41,184 | | 41,888 |
| 7s, TBA, May 1, 2036 | | 5,900,000 | | 6,058,563 |
| 6s, with due dates from April 1, 2034 to June 1, 2034 | | 22,488 | | 22,451 |
| 5 1/2s, with due dates from December 1, 2034 to | | | | |
| July 1, 2035 | | 3,155,109 | | 3,069,811 |
| 5 1/2s, April 1, 2020 | | 299,849 | | 297,213 |
| 5 1/2s, TBA, May 1, 2021 | | 5,250,000 | | 5,201,601 |
| 4 1/2s, TBA, May 1, 2036 | | 9,550,000 | | 8,737,504 |
| 4s, TBA, May 1, 2021 | | 2,515,000 | | 2,337,575 |
| Federal National Mortgage Association Graduated | | | | |
| Payment Mortgages 8s, December 1, 2008 | | 113,451 | | 115,043 |
| Federal National Mortgage Association | | | | |
| Pass-Through Certificates | | | | |
| 11s, October 1, 2015 | | 14,861 | | 16,112 |
| 9s, with due dates from January 1, 2027 to July 1, 2032 | | 411,998 | | 445,159 |
| 8s, with due dates from January 1, 2025 to July 1, 2033 | | 1,638,829 | | 1,722,655 |
| 7 1/2s, with due dates from September 1, 2022 to July 1, 2033 | | 1,261,519 | | 1,311,037 |
| 7s, with due dates from August 1, 2021 to December 1, 2035 | | 6,453,600 | | 6,646,698 |
| 7s, with due dates from January 1, 2007 to September 1, 2017 | | 1,309,046 | | 1,330,850 |
| 6 1/2s, with due dates from August 1, 2032 to October 1, 2034 | | 10,854,057 | | 11,057,224 |
| 6 1/2s, with due dates from September 1, 2010 | | | | |
| to February 1, 2019 | | 221,192 | | 226,119 |
| 6s, with due dates from February 1, 2034 to February 1, 2036 | | 1,732,181 | | 1,726,294 |
| 6s, with due dates from August 1, 2013 to November 1, 2017 | | 2,637,675 | | 2,671,773 |
| 6s, TBA, May 1, 2036 | | 77,930,000 | | 77,576,884 |
| 5 1/2s, with due dates from February 1, 2021 | | | | |
| to February 1, 2036 | | 1,629,981 | | 1,616,936 |
| 5 1/2s, with due dates from November 1, 2011 | | | | |
| to January 1, 2021 | | 11,715,318 | | 11,634,355 |
| 5 1/2s, TBA, May 1, 2036 | | 367,895,000 | | 357,260,554 |
| 5s, with due dates from April 1, 2021 to August 1, 2035 | | 156,421 | | 148,587 |
| 5s, June 1, 2019 | | 47,086 | | 45,883 |
44
| U.S. GOVERNMENT AND AGENCY MORTGAGE OBLIGATIONS (31.2%)* continued | | |
|
| | Principal amount | | Value |
| |
| Federal National Mortgage Association | | | |
| Pass-Through Certificates | | | |
| 5s, TBA, May 1, 2036 | $ 223,800,000 | $ | 211,683,334 |
| 4 1/2s, with due dates from April 1, 2020 to July 1, 2034 | 40,033,779 | | 38,080,581 |
| 4 1/2s, TBA, May 1, 2036 | 36,600,000 | | 33,509,017 |
| 4s, with due dates from May 1, 2019 to August 1, 2020 | 988,098 | | 922,180 |
| | | | 785,556,894 |
|
| |
| Total U.S. government and agency mortgage obligations (cost $796,711,293) | $ | 789,713,020 |
|
| |
| |
| U.S. GOVERNMENT AGENCY OBLIGATIONS (0.5%)* | | | |
|
| | Principal amount | | Value |
| |
| Fannie Mae | | | |
| 7 1/4s, with due dates from January 15, 2010 to May 15, 2030 | $ 5,080,000 | $ | 5,475,317 |
| 7 1/8s, January 15, 2030 | 370,000 | | 445,448 |
| 6 5/8s, September 15, 2009 | 4,990,000 | | 5,227,025 |
| 4 1/4s, July 15, 2007 | 2,210,000 | | 2,187,152 |
|
| Total U.S. government agency obligations (cost $13,372,530) | | $ | 13,334,942 |
|
| |
| |
| U.S. TREASURY OBLIGATIONS (0.9%)* | | | |
|
| | Principal amount | | Value |
| |
| U.S. Treasury Bonds 8 7/8s, February 15, 2019 | $ 11,940,000 | $ | 15,951,094 |
| U.S. Treasury Notes | | | |
| 4 1/4s, November 15, 2013 | 2,085,000 | | 1,984,985 |
| 3 1/4s, August 15, 2008 | 3,934,000 | | 3,796,924 |
|
| Total U.S. treasury obligations (cost $22,320,781) | | $ | 21,733,003 |
|
| |
| |
| ASSET-BACKED SECURITIES (17.1%)* | | | |
|
| | Principal amount | | Value |
| |
| Aames Mortgage Investment Trust FRB Ser. 04-1, | | | |
| Class 2A1, 5.299s, 2034 | $ 1,381,323 | $ | 1,382,688 |
| ABSC NIMS Trust 144A Ser. 05-HE2, Class A1, 4 1/2s, | | | |
| 2035 (Cayman Islands) | 1,317,495 | | 1,291,507 |
| Advanta Business Card Master Trust FRB Ser. 04-C1, | | | |
| Class C, 5.973s, 2013 | 1,939,000 | | 1,964,905 |
| Advanta Mortgage Loan Trust Ser. 00-1, Class A4, | | | |
| 8.61s, 2028 | 240,711 | | 240,410 |
| Aegis Asset Backed Securities Trust 144A | | | |
| Ser. 04-2N, Class N1, 4 1/2s, 2034 | 10,896 | | 10,860 |
| Ser. 04-5N, Class Note, 5s, 2034 | 193,380 | | 192,110 |
| Ser. 04-6N, Class Note, 4 3/4s, 2035 | 318,816 | | 316,326 |
| AFC Home Equity Loan Trust Ser. 99-2, Class 1A, | | | |
| 5.369s, 2029 | 5,929,440 | | 5,954,822 |
| American Express Credit Account Master Trust 144A | | | |
| Ser. 04-C, Class C, 5.401s, 2012 | 8,215,296 | | 8,216,578 |
45
| ASSET-BACKED SECURITIES (17.1%)* continued | | | | |
|
| | Principal amount | | Value |
| |
| American Home Mortgage Investment Trust | | | | |
| FRB Ser. 04-3, Class 2A, 3.59s, 2034 | $ | 2,662,150 | $ | 2,614,600 |
| FRB Ser. 04-3, Class 3A, 3.71s, 2034 | | 3,662,180 | | 3,601,796 |
| Americredit Automobile Receivables Trust 144A | | | | |
| Ser. 05-1, Class E, 5.82s, 2012 | | 813,443 | | 810,856 |
| Ameriquest Finance NIM Trust 144A | | | | |
| Ser. 04-IAN, Class 1A, 5.437s, 2034 (Cayman Islands) | | 6,066 | | 6,053 |
| Ser. 04-RN9, Class N1, 4.8s, 2034 (Cayman Islands) | | 152,724 | | 152,724 |
| Ameriquest Mortgage Securities, Inc. FRB Ser. 06-R1, | | | | |
| Class M10, 7.459s, 2036 | | 1,245,000 | | 1,044,321 |
| Arcap REIT, Inc. 144A | | | | |
| Ser. 03-1A, Class E, 7.11s, 2038 | | 1,993,000 | | 1,991,643 |
| Ser. 04-1A, Class E, 6.42s, 2039 | | 1,469,204 | | 1,426,812 |
| Argent NIM Trust 144A Ser. 04-WN9, Class A, 5.19s, | | | | |
| 2034 (Cayman Islands) | | 36,804 | | 36,574 |
| Asset Backed Funding Corp. NIM Trust 144A | | | | |
| Ser. 04-0PT5, Class N1, 4.45s, 2034 (Cayman Islands) | | 67,333 | | 67,157 |
| FRB Ser. 05-OPT1, Class B1, 7.459s, 2035 | | 587,000 | | 434,953 |
| Asset Backed Securities Corp. Home Equity Loan Trust | | | | |
| FRB Ser. 04-HE9, Class A2, 5.329s, 2034 | | 678,552 | | 679,567 |
| FRB Ser. 05-HE1, Class A3, 5.249s, 2035 | | 892,866 | | 893,776 |
| Asset Backed Securities Corp. Home Equity Loan Trust | | | | |
| 144A FRB Ser. 06-HE2, Class M11, 7.459s, 2036 | | 336,000 | | 273,702 |
| Aviation Capital Group Trust 144A FRB Ser. 03-2A, | | | | |
| Class G1, 5.623s, 2033 | | 1,497,463 | | 1,499,685 |
| Banc of America Mortgage Securities | | | | |
| Ser. 04-D, Class 2A, IO, 0.542s, 2034 | | 19,139,712 | | 59,812 |
| Ser. 05-E, Class 2, IO, 0.306s, 2035 | | 43,628,000 | | 286,309 |
| Bank One Issuance Trust FRB Ser. 03-C4, Class C4, 5.931s, 2011 | | 1,390,000 | | 1,416,225 |
| Bay View Auto Trust Ser. 05-LJ2, Class D, 5.27s, 2014 | | 534,000 | | 523,659 |
| Bayview Financial Acquisition Trust | | | | |
| Ser. 04-D, Class A, IO, 3.938s, 2007 | | 17,726,400 | | 545,763 |
| Ser. 05-B, Class A, IO, 3.382s, 2039 | | 11,685,978 | | 392,906 |
| FRB Ser. 03-F, Class A, 5 1/2s, 2043 | | 2,810,632 | | 2,815,704 |
| FRB Ser. 03-G, Class A1, 5.6s, 2039 | | 6,300,000 | | 6,307,098 |
| FRB Ser. 04-D, Class A, 5.39s, 2044 | | 3,547,593 | | 3,550,553 |
| Bayview Financial Asset Trust 144A | | | | |
| FRB Ser. 03-SSRA, Class A, 5.659s, 2038 | | 1,546,964 | | 1,556,091 |
| FRB Ser. 03-SSRA, Class M, 6.309s, 2038 | | 1,766,703 | | 1,785,960 |
| FRB Ser. 04-SSRA, Class A1, 5.559s, 2039 | | 2,094,831 | | 2,099,649 |
| Bear Stearns Adjustable Rate Mortgage Trust | | | | |
| Ser. 04-1, Class 11A1, 3.617s, 2034 | | 3,583,153 | | 3,542,755 |
| Bear Stearns Alternate Trust | | | | |
| Ser. 04-12, Class 2A2, 4.986s, 2035 | | 2,526,221 | | 2,508,061 |
| Ser. 04-9, Class 1A1, 4.949s, 2034 | | 1,061,622 | | 1,055,503 |
| Ser. 05-2, Class 2A2A, 4.826s, 2035 | | 1,511,360 | | 1,498,764 |
| Ser. 05-5, Class 21A1, 4.683s, 2035 | | 5,721,587 | | 5,651,830 |
| Bear Stearns Asset Backed Securities NIM Trust 144A | | | | |
| Ser. 04-FR1, Class A1, 5s, 2034 (Cayman Islands) | | 65,145 | | 65,013 |
| Ser. 04-HE10, Class A1, 4 1/4s, 2034 (Cayman Islands) | | 196,690 | | 195,338 |
46
| ASSET-BACKED SECURITIES (17.1%)* continued | | | | |
|
| | Principal amount | | Value |
| |
| Bear Stearns Asset Backed Securities NIM Trust 144A | | | | |
| Ser. 04-HE10, Class A2, 5s, 2034 (Cayman Islands) | $ | 347,000 | $ | 343,964 |
| Ser. 04-HE6, Class A1, 5 1/4s, 2034 (Cayman Islands) | | 53,487 | | 53,412 |
| Ser. 04-HE7N, Class A1, 5 1/4s, 2034 | | 73,141 | | 73,038 |
| Ser. 04-HE8N, Class A1, 5s, 2034 | | 50,849 | | 50,738 |
| Bear Stearns Asset Backed Securities, Inc. | | | | |
| FRB Ser. 03-1, Class A1, 5.459s, 2042 | | 943,758 | | 943,754 |
| FRB Ser. 03-3, Class A2, 5.549s, 2043 | | 2,964,000 | | 2,970,947 |
| FRB Ser. 05-3, Class A1, 5.409s, 2035 | | 1,569,923 | | 1,569,923 |
| FRB Ser. 06-EC1, Class M9, 6.959s, 2035 | | 944,000 | | 765,820 |
| FRB Ser. 06-PC1, Class M9, 6.709s, 2035 | | 546,000 | | 439,871 |
| Broadhollow Funding, LLC 144A FRB Ser. 04-A, | | | | |
| Class Sub, 6.57s, 2009 | | 2,169,000 | | 2,194,160 |
| Capital Auto Receivables Asset Trust 144A | | | | |
| Ser. 05-1, Class D, 6 1/2s, 2011 | | 1,776,000 | | 1,741,868 |
| Ser. 06-1, Class D, 7.39s, 2013 | | 1,000,000 | | 995,781 |
| Capital One Multi-Asset Execution Trust FRB | | | | |
| Ser. 02-C1, Class C1, 7.651s, 2010 | | 880,000 | | 907,913 |
| CARMAX Auto Owner Trust Ser. 04-2, Class D, 3.67s, 2011 | | 406,576 | | 398,364 |
| CARSSX Finance, Ltd. 144A | | | | |
| FRB Ser. 04-AA, Class B3, 8.251s, 2011 | | | | |
| (Cayman Islands) | | 101,729 | | 104,305 |
| FRB Ser. 04-AA, Class B4, 10.401s, 2011 | | | | |
| (Cayman Islands) | | 207,579 | | 217,923 |
| CDO Repackaging Trust Series 144A FRB Ser. 03-2, | | | | |
| Class A, 9.04s, 2008 | | 4,870,000 | | 5,210,900 |
| Centex Home Equity Ser. 04-C, Class A, IO, 3 1/2s, 2006 | | 3,777,400 | | 10,283 |
| Chase Credit Card Master Trust FRB Ser. 03-3, | | | | |
| Class C, 5.981s, 2010 | | 2,550,000 | | 2,597,187 |
| Chase Funding Net Interest Margin 144A Ser. 04-OPT1, | | | | |
| Class Note, 4.458s, 2034 | | 352,291 | | 352,070 |
| CHEC NIM Ltd., 144A | | | | |
| Ser. 04-2, Class N1, 4.45s, 2034 (Cayman Islands) | | 12,552 | | 12,533 |
| Ser. 04-2, Class N2, 8s, 2034 (Cayman Islands) | | 350,000 | | 346,860 |
| Ser. 04-2, Class N3, 8s, 2034 (Cayman Islands) | | 223,000 | | 203,084 |
| Citibank Credit Card Issuance Trust FRB Ser. 01-C1, | | | | |
| Class C1, 6.148s, 2010 | | 1,390,000 | | 1,409,602 |
| Citigroup Mortgage Loan Trust, Inc. FRB Ser. 06-WMC1, | | | | |
| Class M10, 8.459s, 2035 | | 264,000 | | 234,424 |
| Conseco Finance Securitizations Corp. | | | | |
| Ser. 00-2, Class A5, 8.85s, 2030 | | 8,500,000 | | 7,164,200 |
| Ser. 00-4, Class A6, 8.31s, 2032 | | 8,633,000 | | 7,195,395 |
| Ser. 00-5, Class A4, 7.47s, 2032 | | 1,151,110 | | 1,153,557 |
| Ser. 00-5, Class A6, 7.96s, 2032 | | 4,808,000 | | 3,950,354 |
| Ser. 01-1, Class A4, 6.21s, 2032 | | 3,411,183 | | 3,418,278 |
| Ser. 01-1, Class A5, 6.99s, 2032 | | 281,000 | | 253,462 |
| Ser. 01-3, Class A4, 6.91s, 2033 | | 9,027,000 | | 8,478,240 |
| Ser. 01-4, Class A4, 7.36s, 2033 | | 7,948,000 | | 7,683,610 |
| Ser. 01-4, Class B1, 9.4s, 2033 | | 434,272 | | 35,827 |
| Ser. 02-1, Class A, 6.681s, 2033 | | 10,770,483 | | 10,844,098 |
47
| ASSET-BACKED SECURITIES (17.1%)* continued | | | | |
|
| | Principal amount | | Value |
| |
| Conseco Finance Securitizations Corp. | | | | |
| Ser. 02-1, Class M2, 9.546s, 2033 | $ | 3,629,000 | $ | 1,995,950 |
| Ser. 02-2, Class A, IO, 8 1/2s, 2033 | | 9,671,368 | | 2,229,744 |
| Consumer Credit Reference IDX Securities 144A FRB | | | | |
| Ser. 02-1A, Class A, 6.935s, 2007 | | 3,653,000 | | 3,707,795 |
| Countrywide Alternative Loan Trust | | | | |
| Ser. 04-15, Class 1A1, 4.934s, 2034 | | 908,310 | | 901,214 |
| Ser. 05-24, Class 1AX, IO, 1.233s, 2035 | | 20,672,970 | | 542,665 |
| Ser. 05-24, Class IIAX, IO, 1.201s, 2035 | | 26,024,063 | | 975,902 |
| Countrywide Asset Backed Certificates 144A | | | | |
| Ser. 04-11N, Class N, 5 1/4s, 2036 | | 76,664 | | 76,428 |
| Ser. 04-14N, 5s, 2036 | | 354,497 | | 351,864 |
| Ser. 04-6N, Class N1, 6 1/4s, 2035 | | 803,144 | | 797,713 |
| Ser. 04-BC1N, Class Note, 5 1/2s, 2035 | | 159,551 | | 155,753 |
| Countrywide Home Loans | | | | |
| Ser. 05-2, Class 2X, IO, 1.428s, 2035 | | 28,164,022 | | 629,291 |
| Ser. 05-9, Class 1X, IO, 1 1/4s, 2035 | | 26,931,377 | | 649,046 |
| Ser. 06-0A5, Class X, IO, 1.464s, 2046 | | 32,508,899 | | 1,625,445 |
| Countrywide Home Loans 144A Ser. 05-R2, Class 2A3, | | | | |
| 8s, 2035 | | 1,381,516 | | 1,446,706 |
| Countrywide Partnership Trust 144A Ser. 04-EC1N, | | | | |
| Class N, 5s, 2035 | | 145,179 | | 144,622 |
| Crest, Ltd. 144A Ser. 03-2A, Class D2, 6.723s, 2038 | | | | |
| (Cayman Islands) | | 2,157,000 | | 2,120,115 |
| CS First Boston Mortgage Securities Corp. 144A | | | | |
| Ser. 04-FR1N, Class A, 5s, 2034 | | 1,211,295 | | 1,199,182 |
| Fieldstone Mortgage Investment Corp. FRB Ser. 05-1, | | | | |
| Class M3, 5.499s, 2035 | | 859,000 | | 860,828 |
| Finance America NIM Trust 144A Ser. 04-1, Class A, | | | | |
| 5 1/4s, 2034 | | 175,425 | | 66,013 |
| First Chicago Lennar Trust 144A Ser. 97-CHL1, | | | | |
| Class D, 7.577s, 2039 | | 3,933,672 | | 3,923,838 |
| First Franklin Mortgage Loan NIM Trust 144A | | | | |
| Ser. 04-FF10, Class N1, 4.45s, 2034 (Cayman Islands) | | 58,412 | | 58,267 |
| Ser. 04-FF7A, Class A, 5s, 2034 (Cayman Islands) | | 59,299 | | 59,122 |
| First Horizon Mortgage Pass-Through Trust | | | | |
| Ser. 05-AR2, Class 1A1, 4.832s, 2035 | | 4,033,997 | | 3,985,855 |
| First Plus Home Loan Trust Ser. 97-3, Class B1, | | | | |
| 7.79s, 2023 | | 707,486 | | 707,928 |
| Fort Point CDO, Ltd. FRB Ser. 03-2A, Class A2, | | | | |
| 5.873s, 2038 (Cayman Islands) | | 834,000 | | 841,756 |
| Foxe Basin, Ltd. 144A FRB Ser. 03-1A, Class A1, | | | | |
| 5.41s, 2015 (Cayman Islands) | | 2,600,000 | | 2,605,200 |
| Fremont NIM Trust 144A | | | | |
| Ser. 04-3, Class A, 4 1/2s, 2034 | | 345,045 | | 342,486 |
| Ser. 04-3, Class B, 7 1/2s, 2034 | | 289,627 | | 249,079 |
| Ser. 04-D, Class N1, 4 1/2s, 2034 (Cayman Islands) | | 187,293 | | 186,580 |
| Ser. 04-D, Class N2, 7 1/2s, 2034 (Cayman Islands) | | 79,100 | | 78,465 |
| G-Force CDO, Ltd. 144A Ser. 03-1A, Class E, 6.58s, | | | | |
| 2038 (Cayman Islands) | | 1,241,000 | | 1,234,964 |
48
| ASSET-BACKED SECURITIES (17.1%)* continued | | | | |
|
| | Principal amount | | Value |
| |
| G-Star, Ltd. 144A FRB Ser. 02-2A, Class BFL, 6.959s, | | | | |
| 2037 (Cayman Islands) | $ | 417,000 | $ | 433,463 |
| GE Capital Credit Card Master Note Trust FRB | | | | |
| Ser. 04-2, Class C, 5.381s, 2010 | | 2,444,480 | | 2,447,418 |
| GE Corporate Aircraft Financing, LLC 144A | | | | |
| Ser. 04-1A, Class B, 5.809s, 2018 | | 288,881 | | 288,708 |
| FRB Ser. 05-1A, Class C, 6.259s, 2019 | | 1,593,000 | | 1,592,984 |
| Gears Auto Owner Trust Ser. 05-AA, Class E1, 8.22s, 2012 | | 2,523,000 | | 2,489,726 |
| GEBL 144A | | | | |
| Ser. 04-2, Class C, 5.751s, 2032 | | 369,451 | | 369,451 |
| Ser. 04-2, Class D, 7.651s, 2032 | | 985,202 | | 966,533 |
| GMAC Mortgage Corp. Loan Trust Ser. 04-HE5, Class A, | | | | |
| IO, 6s, 2007 | | 8,200,500 | | 348,521 |
| Goldentree Loan Opportunities II, Ltd. 144A FRB | | | | |
| Ser. 2A, Class 4, 7.93s, 2015 (Cayman Islands) | | 750,000 | | 754,875 |
| Granite Mortgages PLC | | | | |
| FRB Ser. 01-1, Class 1C, 6.48s, 2041 (United Kingdom) | | 3,733,333 | | 3,771,833 |
| FRB Ser. 02-1, Class 1C, 6.38s, 2042 (United Kingdom) | | 1,140,000 | | 1,146,680 |
| FRB Ser. 02-2, Class 1C, 6.33s, 2043 (United Kingdom) | | 860,000 | | 868,213 |
| FRB Ser. 04-1, Class 1C, 5.83s, 2044 (United Kingdom) | | 2,130,000 | | 2,131,331 |
| Green Tree Financial Corp. | | | | |
| Ser. 95-8, Class B1, 7.3s, 2026 | | 467,121 | | 360,257 |
| Ser. 97-4, Class A7, 7.36s, 2029 | | 415,070 | | 415,963 |
| Ser. 97-6, Class A8, 7.07s, 2029 | | 392,464 | | 395,498 |
| Ser. 97-6, Class A9, 7.55s, 2029 | | 1,110,994 | | 1,140,738 |
| Ser. 97-7, Class A8, 6.86s, 2029 | | 310,220 | | 312,128 |
| Ser. 99-3, Class A5, 6.16s, 2031 | | 230,170 | | 231,609 |
| Ser. 99-3, Class A6, 6 1/2s, 2031 | | 1,473,000 | | 1,466,437 |
| Ser. 99-5, Class A5, 7.86s, 2030 | | 19,225,000 | | 16,691,051 |
| Greenpoint Manufactured Housing Ser. 00-3, Class IA, | | | | |
| 8.45s, 2031 | | 5,044,954 | | 4,621,496 |
| Greenpoint Mortgage Funding Trust Ser. 05-AR1, | | | | |
| Class X1, IO, 1.985s, 2045 | | 19,113,693 | | 522,641 |
| GS Auto Loan Trust 144A Ser. 04-1, Class D, 5s, 2011 | | 1,710,219 | | 1,698,059 |
| GSAMP Trust 144A | | | | |
| Ser. 04-NIM1, Class N1, 5 1/2s, 2034 | | 182,760 | | 182,724 |
| Ser. 04-NIM1, Class N2, zero %, 2034 | | 1,990,000 | | 1,465,635 |
| Ser. 04-NIM2, Class N, 4 7/8s, 2034 | | 951,272 | | 947,182 |
| Ser. 05-NC1, Class N, 5s, 2035 | | 403,987 | | 403,098 |
| GSMPS Mortgage Loan Trust | | | | |
| Ser. 05-RP3, Class 1A2, 7 1/2s, 2035 | | 1,307,815 | | 1,360,154 |
| Ser. 05-RP3, Class 1A3, 8s, 2035 | | 1,627,701 | | 1,711,251 |
| Ser. 05-RP3, Class 1A4, 8 1/2s, 2035 | | 589,533 | | 625,884 |
| GSMPS Mortgage Loan Trust 144A | | | | |
| Ser. 04-4, Class 1AS, IO, 1.279s, 2034 | | 16,308,580 | | 494,354 |
| Ser. 05-RP1, Class 1A3, 8s, 2035 | | 179,109 | | 188,279 |
| Ser. 05-RP2, Class 1A2, 7 1/2s, 2035 | | 2,061,153 | | 2,148,958 |
| Ser. 05-RP2, Class 1A3, 8s, 2035 | | 1,797,750 | | 1,890,334 |
49
| ASSET-BACKED SECURITIES (17.1%)* continued | | | | |
|
| | Principal amount | | Value |
| |
| Guggenheim Structured Real Estate Funding, Ltd. 144A | | | | |
| FRB Ser. 05-1A, Class D, 6.489s, 2030 | | | | |
| (Cayman Islands) | $ | 2,359,000 | $ | 2,359,000 |
| FRB Ser. 05-2A, Class D, 6.509s, 2030 | | | | |
| (Cayman Islands) | | 1,609,000 | | 1,609,483 |
| HASCO NIM Trust 144A Ser. 05-OP1A, Class A, 6 1/4s, 2035 | | 1,385,358 | | 1,338,198 |
| High Income Trust Securities 144A FRB Ser. 03-1A, | | | | |
| Class A, 5.215s, 2036 (Cayman Islands) | | 2,795,673 | | 2,676,857 |
| Holmes Financing PLC | | | | |
| FRB Ser. 4, Class 3C, 6.368s, 2040 (United Kingdom) | | 860,000 | | 861,262 |
| FRB Ser. 8, Class 2C, 5.788s, 2040 (United Kingdom) | | 976,000 | | 978,245 |
| Home Equity Asset Trust 144A | | | | |
| Ser. 04-3N, Class A, 5s, 2034 | | 7,354 | | 7,299 |
| Ser. 04-4N, Class A, 5s, 2034 | | 228,175 | | 225,323 |
| Hyundai Auto Receivables Trust Ser. 04-A, Class D, | | | | |
| 4.1s, 2011 | | 551,000 | | 537,391 |
| Lehman Manufactured Housing Ser. 98-1, Class 1, IO, | | | | |
| 0.809s, 2028 | | 31,918,261 | | 621,513 |
| LNR CDO, Ltd. 144A | | | | |
| FRB Ser. 02-1A, Class FFL, 7.7s, 2037 (Cayman Islands) | | 6,071,000 | | 6,151,866 |
| FRB Ser. 03-1A, Class EFL, 7.95s, 2036 (Cayman Islands) | | 4,150,000 | | 4,474,530 |
| Long Beach Asset Holdings Corp. NIM Trust 144A | | | | |
| Ser. 04-5, Class Note, 5s, 2034 | | 36,722 | | 36,659 |
| Ser. 05-1, Class N1, 4.115s, 2035 | | 634,415 | | 631,243 |
| Long Beach Mortgage Loan Trust | | | | |
| Ser. 04-3, Class S1, IO, 4 1/2s, 2006 | | 18,613,836 | | 488,613 |
| Ser. 04-3, Class S2, IO, 4 1/2s, 2006 | | 9,306,935 | | 244,307 |
| Long Beach Mortgage Loan Trust 144A FRB Ser. 06-WL3, | | | | |
| Class B1, 7.459s, 2036 | | 1,400,000 | | 1,124,718 |
| Madison Avenue Manufactured Housing | | | | |
| Contract | | | | |
| Ser. 02-A IO, 0.3s, 2032 | | 209,150,767 | | 2,222,227 |
| FRB Ser. 02-A, Class B1, 8.209s, 2032 | | 5,098,734 | | 2,549,367 |
| Marriott Vacation Club Owner Trust 144A | | | | |
| Ser. 04-2A, Class C, 4.741s, 2026 | | 207,201 | | 197,950 |
| Ser. 04-2A, Class D, 5.389s, 2026 | | 179,201 | | 171,774 |
| Ser. 05-2, Class D, 6.205s, 2027 | | 203,317 | | 201,221 |
| FRB Ser. 02-1A, Class A1, 5.623s, 2024 | | 2,591,400 | | 2,614,090 |
| MASTR Adjustable Rate Mortgages Trust | | | | |
| Ser. 04-03, Class 4AX, IO, 1.417s, 2034 | | 4,161,183 | | 93,627 |
| Ser. 04-7, Class 2A1, 4.66s, 2034 | | 1,120,759 | | 1,104,871 |
| Ser. 05-2, Class 7AX, IO, 0.168s, 2035 | | 11,045,212 | | 33,136 |
| Ser. 06-OA1, Class X, IO, zero %, 2046 | | 9,501,875 | | 484,691 |
| MASTR Asset Backed Securities NIM Trust 144A | | | | |
| Ser. 04-CI5, Class N2, 9s, 2034 (Cayman Islands) | | 625,845 | | 629,475 |
| Ser. 04-HE1A, Class Note, 5.191s, 2034 | | | | |
| (Cayman Islands) | | 46,152 | | 46,060 |
| MASTR Reperforming Loan Trust 144A | | | | |
| Ser. 05-1, Class 1A4, 7 1/2s, 2034 | | 2,343,873 | | 2,428,106 |
| Ser. 05-2, Class 1A3, 7 1/2s, 2035 | | 3,301,068 | | 3,419,700 |
50
| ASSET-BACKED SECURITIES (17.1%)* continued | | | | |
|
| | Principal amount | | Value |
| |
| MBNA Credit Card Master Note Trust FRB Ser. 03-C5, | | | | |
| Class C5, 6.081s, 2010 | $ | 2,550,000 | $ | 2,598,143 |
| Merit Securities Corp. 144A FRB Ser. 11PA, Class 3A1, | | | | |
| 5.62s, 2027 | | 8,296,238 | | 7,964,389 |
| Merrill Lynch Mortgage Investors, Inc. Ser. 03-WM3N, | | | | |
| Class N1, 8s, 2034 | | 10,409 | | 10,282 |
| Merrill Lynch Mortgage Investors, Inc. 144A | | | | |
| Ser. 04-FM1N, Class N1, 5s, 2035 (Cayman Islands) | | 30,512 | | 30,207 |
| Ser. 04-HE2N, Class N1, 5s, 2035 (Cayman Islands) | | 219,127 | | 215,292 |
| Ser. 04-OP1N, Class N1, 4 3/4s, 2035 (Cayman Islands) | | 53,471 | | 53,004 |
| Ser. 04-WM2N, Class N1, 4 1/2s, 2034 | | 94,680 | | 93,941 |
| Ser. 04-WM3N, Class N1, 4 1/2s, 2035 | | 77,464 | | 76,302 |
| Ser. 05-WM1N, Class N1, 5s, 2035 | | 484,434 | | 478,378 |
| Metris Master Trust FRB Ser. 04-2, Class C, 6.273s, 2010 | | 1,665,000 | | 1,673,903 |
| Metris Master Trust 144A | | | | |
| FRB Ser. 01-2, Class C, 6.823s, 2009 | | 1,379,000 | | 1,380,634 |
| FRB Ser. 04-2, Class D, 8.173s, 2010 | | 824,000 | | 832,240 |
| Mid-State Trust | | | | |
| Ser. 10, Class B, 7.54s, 2036 | | 986,385 | | 842,696 |
| Ser. 11, Class B, 8.221s, 2038 | | 927,402 | | 905,943 |
| MMCA Automobile Trust Ser. 02-1, Class B, 5.37s, 2010 | | 2,383,113 | | 2,374,057 |
| Morgan Stanley ABS Capital I FRB Ser. 04-WMC3, | | | | |
| Class A2PT, 5.249s, 2035 | | 1,549,147 | | 1,549,632 |
| Morgan Stanley Auto Loan Trust Ser. 04-HB2, Class D, | | | | |
| 3.82s, 2012 | | 18,811 | | 18,801 |
| Morgan Stanley Auto Loan Trust 144A | | | | |
| Ser. 04-HB1, Class D, 5 1/2s, 2011 | | 720,169 | | 715,666 |
| Ser. 04-HB2, Class E, 5s, 2012 | | 633,000 | | 620,693 |
| Morgan Stanley Dean Witter Capital I | | | | |
| FRB Ser. 01-NC3, Class B1, 8.634s, 2031 | | 319,933 | | 319,933 |
| FRB Ser. 01-NC4, Class B1, 8.709s, 2032 | | 428,958 | | 429,411 |
| Morgan Stanley Mortgage Loan Trust Ser. 05-5AR, | | | | |
| Class 2A1, 5.42s, 2035 | | 8,234,187 | | 8,222,289 |
| Navigator CDO, Ltd. 144A FRB Ser. 03-1A, Class A1, | | | | |
| 5.239s, 2015 (Cayman Islands) | | 1,555,000 | | 1,557,799 |
| Navistar Financial Corp. Owner Trust | | | | |
| Ser. 04-B, Class C, 3.93s, 2012 | | 615,356 | | 595,780 |
| Ser. 05-A, Class C, 4.84s, 2014 | | 756,228 | | 742,944 |
| Neon Capital, Ltd. 144A limited recourse sec. | | | | |
| notes Ser. 96, 1.458s, 2013 (Cayman Islands) (F) (g) | | 1,026,842 | | 198,275 |
| New Century Home Equity Loan Trust Ser. 03-5, | | | | |
| Class AI7, 5.15s, 2033 | | 2,365,000 | | 2,255,885 |
| Newcastle CDO, Ltd. 144A FRB Ser. 3A, Class 4FL, | | | | |
| 8.15s, 2038 (Cayman Islands) | | 966,000 | | 970,106 |
| Nomura Asset Acceptance Corp. Ser. 04-R3, Class PT, | | | | |
| 8.795s, 2035 | | 986,515 | | 1,036,149 |
| Nomura Asset Acceptance Corp. 144A Ser. 04-R2, | | | | |
| Class PT, 9.087s, 2034 | | 507,606 | | 533,938 |
| Oakwood Mortgage Investors, Inc. Ser. 02-C, Class A1, | | | | |
| 5.41s, 2032 | | 6,385,448 | | 5,395,372 |
51
| ASSET-BACKED SECURITIES (17.1%)* continued | | | | |
|
| | Principal amount | | Value |
| |
| Oakwood Mortgage Investors, Inc. 144A Ser. 01-B, | | | | |
| Class A4, 7.21s, 2030 | $ | 955,550 | $ | 842,005 |
| Ocean Star PLC 144A | | | | |
| FRB Ser. 04, Class D, 7.04s, 2018 (Ireland) | | 798,000 | | 820,943 |
| FRB Ser. 05-A, Class D, 6.24s, 2012 (Ireland) | | 908,000 | | 907,909 |
| Option One Mortgage Loan Trust FRB Ser. 05-4, | | | | |
| Class M11, 7.459s, 2035 | | 298,000 | | 259,807 |
| Origen Manufactured Housing Ser. 04-B, Class A2, | | | | |
| 3.79s, 2017 | | 551,000 | | 536,020 |
| Park Place Securities NIM Trust 144A | | | | |
| Ser. 04-MCWN1, Class A, 4.458s, 2034 | | 11,253 | | 11,239 |
| Ser. 04-WHQ2, Class A, 4s, 2035 | | 78,617 | | 77,831 |
| Park Place Securities, Inc. FRB Ser. 04-WHQ2, | | | | |
| Class A3A, 5.309s, 2035 | | 1,505,814 | | 1,507,144 |
| Park Place Securities, Inc. 144A | | | | |
| FRB Ser. 04-MHQ1, Class M10, 7.459s, 2034 | | 570,000 | | 519,699 |
| FRB Ser. 05-WCW2, Class M11, 7.459s, 2035 | | 2,532,000 | | 1,962,300 |
| People’s Choice Net Interest Margin Note 144A | | | | |
| Ser. 04-2, Class A, 5s, 2034 | | 289,480 | | 288,380 |
| Ser. 04-2, Class B, 5s, 2034 | | 428,000 | | 417,043 |
| Permanent Financing PLC FRB Ser. 3, Class 3C, 6.03s, | | | | |
| 2042 (United Kingdom) | | 2,510,000 | | 2,541,772 |
| Providian Gateway Master Trust FRB Ser. 04-EA, | | | | |
| Class E, 7.57s, 2011 | | 3,450,000 | | 3,510,375 |
| Providian Gateway Master Trust 144A | | | | |
| Ser. 04-DA, Class D, 4.4s, 2011 | | 1,183,000 | | 1,150,837 |
| FRB Ser. 04-AA, Class D, 6.751s, 2011 | | 1,400,000 | | 1,418,564 |
| FRB Ser. 04-BA, Class D, 6.301s, 2010 | | 850,000 | | 851,841 |
| FRB Ser. 04-EA, Class D, 5.831s, 2011 | | 2,100,000 | | 2,122,884 |
| Renaissance NIM Trust 144A Ser. 05-1, Class N, 4.7s, 2035 | | 342,437 | | 342,437 |
| Residential Accredit Loans, Inc. Ser. 04-QA5, | | | | |
| Class A2, 4.976s, 2034 | | 844,595 | | 839,156 |
| Residential Asset Mortgage Products, Inc. | | | | |
| Ser. 02-SL1, Class AI3, 7s, 2032 | | 285,956 | | 284,731 |
| Ser. 04-RZ2, Class A, IO, 3 1/2s, 2006 | | 2,955,556 | | 7,966 |
| Residential Asset Securities Corp. 144A | | | | |
| Ser. 04-N10B, Class A1, 5s, 2034 | | 450,891 | | 448,919 |
| Ser. 04-NT, Class Note, 5s, 2034 | | 308,063 | | 295,740 |
| Ser. 04-NT12, Class Note, 4.7s, 2035 | | 196,131 | | 195,365 |
| FRB Ser. 05-KS10, Class B, 7.709s, 2035 | | 1,391,000 | | 1,220,491 |
| Saco I Trust FRB Ser. 05-10, Class 1A1, 5.219s, 2033 | | 3,064,854 | | 3,064,854 |
| SAIL Net Interest Margin Notes 144A | | | | |
| Ser. 03-3, Class A, 7 3/4s, 2033 (Cayman Islands) | | 3,662 | | 2,747 |
| Ser. 03-5, Class A, 7.35s, 2033 (Cayman Islands) | | 58,378 | | 43,006 |
| Ser. 03-6A, Class A, 7s, 2033 (Cayman Islands) | | 21,771 | | 14,708 |
| Ser. 03-7A, Class A, 7s, 2033 (Cayman Islands) | | 76,665 | | 59,799 |
| Ser. 03-9A, Class A, 7s, 2033 (Cayman Islands) | | 101,327 | | 12,159 |
| Ser. 03-BC2A, Class A, 7 3/4s, 2033 (Cayman Islands) | | 237,726 | | 51,587 |
| Ser. 04-10A, Class A, 5s, 2034 (Cayman Islands) | | 827,736 | | 822,869 |
| Ser. 04-11A, Class A2, 4 3/4s, 2035 (Cayman Islands) | | 980,323 | | 971,960 |
52
| ASSET-BACKED SECURITIES (17.1%)* continued | | | | |
|
| | Principal amount | | Value |
| |
| SAIL Net Interest Margin Notes 144A | | | | |
| Ser. 04-4A, Class B, 7 1/2s, 2034 (Cayman Islands) | $ | 428,837 | $ | 257,302 |
| Ser. 04-7A, Class A, 4 3/4s, 2034 (Cayman Islands) | | 115,440 | | 115,232 |
| Ser. 04-8A, Class A, 5s, 2034 (Cayman Islands) | | 65,398 | | 65,267 |
| Ser. 04-AA, Class A, 4 1/2s, 2034 (Cayman Islands) | | 423,324 | | 421,048 |
| Ser. 04-BN2A, Class A, 5s, 2034 (Cayman Islands) | | 120,936 | | 120,283 |
| Ser. 04-BNCA, Class A, 5s, 2034 (Cayman Islands) | | 5,039 | | 5,031 |
| Ser. 04-4A, Class A, 5s, 2034 (Cayman Islands) | | 14,763 | | 14,744 |
| Ser. 05-1A, Class A, 4 1/4s, 2035 | | 973,625 | | 964,008 |
| Ser. 05-2A, Class A, 4 3/4s, 2035 (Cayman Islands) | | 282,258 | | 279,984 |
| Sasco Net Interest Margin Trust 144A | | | | |
| Ser. 05-NC1A, Class A, 4 3/4s, 2035 (Cayman Islands) | | 1,165,869 | | 1,156,485 |
| Ser. 05-WF1A, Class A, 4 3/4s, 2035 (Cayman Islands) | | 334,307 | | 331,487 |
| Sharps SP I, LLC Net Interest Margin Trust 144A | | | | |
| Ser. 03-HE1N, Class N, 6.9s, 2033 | | 26,460 | | 26,460 |
| Ser. 04-4N, Class Note, 6.65s, 2034 | | 6,766 | | 6,766 |
| Ser. 04-HE1N, Class Note, 4.94s, 2034 | | 231,040 | | 80,864 |
| Ser. 04-HE2N, Class NA, 5.43s, 2034 | | 55,653 | | 54,819 |
| Ser. 04-HE4N, Class NA, 3 3/4s, 2034 | | 675,490 | | 668,735 |
| Ser. 04-HS1N, Class Note, 5.92s, 2034 | | 62,625 | | 62,625 |
| Ser. 04-RM2N, Class NA, 4s, 2035 | | 340,534 | | 337,129 |
| Soundview Home Equity Loan Trust 144A FRB | | | | |
| Ser. 05-CTX1, Class B1, 7.459s, 2035 | | 672,000 | | 540,960 |
| South Coast Funding 144A FRB Ser. 3A, Class A2, | | | | |
| 5.92s, 2038 (Cayman Islands) | | 760,000 | | 767,144 |
| Structured Adjustable Rate Mortgage Loan Trust | | | | |
| Ser. 04-10, Class 1A1, 4.913s, 2034 | | 1,808,269 | | 1,803,538 |
| Ser. 04-12, Class 1A2, 4.961s, 2034 | | 2,580,163 | | 2,573,981 |
| Ser. 04-6, Class 1A, 4.373s, 2034 | | 8,451,023 | | 8,302,124 |
| Ser. 04-8, Class 1A3, 4.685s, 2034 | | 68,779 | | 68,028 |
| Ser. 05-9, Class AX, IO, 0.943s, 2035 | | 56,395,149 | | 1,680,575 |
| Structured Adjustable Rate Mortgage Loan Trust 144A | | | | |
| Ser. 04-NP2, Class A, 5.309s, 2034 | | 1,898,724 | | 1,898,914 |
| Structured Asset Investment Loan Trust 144A | | | | |
| FRB Ser. 05-HE3, Class M11, 7.459s, 2035 | | 1,284,000 | | 1,032,046 |
| FRB Ser. 06-BNC1, Class B1, 7.459s, 2036 | | 1,492,000 | | 1,285,032 |
| Structured Asset Receivables Trust 144A FRB | | | | |
| Ser. 05-1, 5.575s, 2015 | | 6,684,495 | | 6,682,409 |
| Structured Asset Securities Corp. | | | | |
| Ser. 03-40A, Class 1A, 4.88s, 2034 | | 1,111,297 | | 1,114,491 |
| Ser. 04-8, Class 1A1, 4.685s, 2034 | | 1,770,936 | | 1,754,145 |
| IFB Ser. 05-10, Class 3A3, 6.162s, 2034 | | 4,156,384 | | 3,630,301 |
| IFB Ser. 05-6, Class 5A8, 3.981s, 2035 | | 5,461,700 | | 4,258,237 |
| Structured Asset Securities Corp. 144A | | | | |
| Ser. 98-RF3, Class A, IO, 6.1s, 2028 | | 5,777,922 | | 707,795 |
| FRB Ser. 03-NP2, Class A2, 5.509s, 2032 | | 146,888 | | 146,888 |
| FRB Ser. 03-NP3, Class A1, 5.959s, 2033 | | 40,562 | | 40,566 |
| Terwin Mortgage Trust FRB Ser. 04-5HE, Class A1B, | | | | |
| 5.379s, 2035 | | 1,692,072 | | 1,694,002 |
53
| ASSET-BACKED SECURITIES (17.1%)* continued | | | | |
|
| | Principal amount | | Value |
| |
| TIAA Real Estate CDO, Ltd. Ser. 03-1A, Class E, 8s, | | | | |
| 2038 (Cayman Islands) | $ | 2,298,000 | $ | 2,306,959 |
| Wells Fargo Home Equity Trust 144A | | | | |
| Ser. 04-2, Class N1, 4.45s, 2034 (Cayman Islands) | | 51,967 | | 51,865 |
| Ser. 04-2, Class N2, 8s, 2034 (Cayman Islands) | | 1,102,000 | | 1,102,812 |
| Wells Fargo Mortgage Backed Securities Trust | | | | |
| Ser. 05-AR10, Class 2A18, IO, 0.61s, 2035 | | 56,771,000 | | 798,342 |
| Ser. 05-AR12, Class 2A5, 4.32s, 2035 | | 26,265,000 | | 25,152,065 |
| Ser. 05-AR9, Class 1A2, 4.352s, 2035 | | 2,017,875 | | 1,964,130 |
| WFS Financial Owner Trust | | | | |
| Ser. 04-1, Class D, 3.17s, 2011 | | 406,528 | | 400,636 |
| Ser. 04-3, Class D, 4.07s, 2012 | | 726,691 | | 714,534 |
| Ser. 04-4, Class D, 3.58s, 2012 | | 473,796 | | 465,245 |
| Ser. 05-1, Class D, 4 1/4s, 2012 | | 552,830 | | 544,256 |
| Whinstone Capital Management, Ltd. 144A FRB Ser. 1A, | | | | |
| Class B3, 6s, 2044 (United Kingdom) | | 2,165,000 | | 2,164,729 |
| Whole Auto Loan Trust Ser. 03-1, Class C, 3.13s, 2010 | | 216,653 | | 215,822 |
| Whole Auto Loan Trust 144A | | | | |
| Ser. 03-1, Class D, 6s, 2010 | | 76,547 | | 76,522 |
| Ser. 04-1, Class D, 5.6s, 2011 | | 2,740,420 | | 2,718,328 |
|
| Total asset-backed securities (cost $450,777,207) | | | $ | 434,226,108 |
|
| |
| |
| CORPORATE BONDS AND NOTES (10.3%)* | | | | |
|
| | Principal amount | | Value |
| |
| Basic Materials (0.4%) | | | | |
| Alcoa, Inc. notes 4 1/4s, 2007 | $ | 800,000 | $ | 787,697 |
| Dow Chemical Co. (The) Pass Through Trust 144A | | | | |
| company guaranty 4.027s, 2009 | | 1,950,000 | | 1,844,522 |
| Georgia-Pacific Corp. notes 8 1/8s, 2011 | | 815,000 | | 845,563 |
| ICI Wilmington, Inc. company guaranty 5 5/8s, 2013 | | 1,585,000 | | 1,533,472 |
| Lubrizol Corp. (The) sr. notes 5 1/2s, 2014 | | 570,000 | | 545,916 |
| Newmont Mining Corp. notes 5 7/8s, 2035 | | 830,000 | | 749,004 |
| Potash Corp. of Saskatchewan notes 7 3/4s, 2011 (Canada) | | 670,000 | | 728,768 |
| Teck Cominco Ltd. notes 6 1/8s, 2035 (Canada) | | 825,000 | | 759,883 |
| Teck Cominco Ltd. notes 5 3/8s, 2015 (Canada) | | 150,000 | | 142,817 |
| Weyerhaeuser Co. debs. 7.95s, 2025 | | 1,310,000 | | 1,429,093 |
| Weyerhaeuser Co. debs. 7 3/8s, 2032 | | 1,180,000 | | 1,232,301 |
| Weyerhaeuser Co. notes 6 3/4s, 2012 | | 310,000 | | 320,862 |
| | | | | 10,919,898 |
|
| |
| Capital Goods (0.2%) | | | | |
| L-3 Communications Corp. sr. sub. notes 5 7/8s, 2015 | | 1,085,000 | | 1,019,900 |
| L-3 Communications Corp. sr. sub. notes Class B, 6 3/8s, 2015 | | 750,000 | | 727,500 |
| Lockheed Martin Corp. bonds 8 1/2s, 2029 | | 1,520,000 | | 1,923,265 |
| Raytheon Co. debs. 6 3/4s, 2018 | | 120,000 | | 126,870 |
| Sealed Air Corp. 144A notes 5 5/8s, 2013 | | 1,315,000 | | 1,277,629 |
| Waste Management, Inc. sr. notes 7s, 2028 | | 670,000 | | 695,331 |
| | | | | 5,770,495 |
54
| CORPORATE BONDS AND NOTES (10.3%)* continued | | | | |
|
| | Principal amount | | Value |
| |
| Communication Services (1.2%) | | | | |
| Ameritech Capital Funding company guaranty 6 1/4s, 2009 | $ | 1,135,000 | $ | 1,154,863 |
| AT&T Corp. sr. notes 9 3/4s, 2031 | | 825,000 | | 977,589 |
| AT&T Wireless Services, Inc. sr. notes 8 3/4s, 2031 | | 2,995,000 | | 3,764,721 |
| Bellsouth Capital Funding notes 7 3/4s, 2010 | | 750,000 | | 805,202 |
| Citizens Communications Co. sr. notes 6 1/4s, 2013 | | 910,000 | | 883,838 |
| Deutsche Telekom International Finance BV company | | | | |
| guaranty 8 1/4s, 2030 (Germany) | | 1,725,000 | | 2,048,270 |
| France Telecom notes 8 1/2s, 2031 (France) | | 560,000 | | 690,169 |
| France Telecom notes 7 3/4s, 2011 (France) | | 389,000 | | 423,189 |
| Rogers Wireless, Inc. sec. notes 6 3/8s, 2014 (Canada) | | 1,020,000 | | 1,002,150 |
| Southwestern Bell Telephone debs. 7s, 2027 | | 1,245,000 | | 1,215,462 |
| Sprint Capital Corp. company guaranty 6.9s, 2019 | | 1,980,000 | | 2,095,349 |
| Sprint Capital Corp. company guaranty 6 7/8s, 2028 (S) | | 3,560,000 | | 3,667,512 |
| Telecom Italia Capital SA company guaranty 5 1/4s, | | | | |
| 2013 (Luxembourg) | | 1,775,000 | | 1,673,761 |
| Telecom Italia Capital SA company guaranty 4s, 2010 (Luxembourg) | | 1,810,000 | | 1,700,911 |
| Telecom Italia Capital SA notes 5 1/4s, 2015 (Luxembourg) | | 1,315,000 | | 1,208,222 |
| Telefonica Europe BV company guaranty 8 1/4s, 2030 (Netherlands) | | 725,000 | | 830,619 |
| Verizon New England, Inc. sr. notes 6 1/2s, 2011 | | 2,600,000 | | 2,637,027 |
| Verizon New Jersey, Inc. debs. 8s, 2022 | | 1,050,000 | | 1,122,404 |
| Verizon Pennsylvania, Inc. debs. 8.35s, 2030 | | 1,305,000 | | 1,441,966 |
| Verizon Virginia Inc. debs. Ser. A, 4 5/8s, 2013 | | 364,000 | | 327,182 |
| Vodafone Group PLC notes 5 3/4s, 2016 | | | | |
| (United Kingdom) | | 1,565,000 | | 1,517,236 |
| | | | | 31,187,642 |
|
| |
| Conglomerates (0.1%) | | | | |
| Tyco International Group SA company guaranty 6 3/4s, | | | | |
| 2011 (Luxembourg) | | 1,497,000 | | 1,557,392 |
|
| |
| Consumer Cyclicals (1.4%) | | | | |
| Cendant Corp. notes 6 1/4s, 2010 | | 1,770,000 | | 1,812,418 |
| D.R. Horton, Inc. sr. notes 7 7/8s, 2011 | | 765,000 | | 819,035 |
| D.R. Horton, Inc. sr. notes 5 7/8s, 2013 | | 890,000 | | 850,401 |
| DaimlerChrysler NA Holding Corp. company | | | | |
| guaranty 7.2s, 2009 | | 5,550,000 | | 5,803,907 |
| DaimlerChrysler NA Holding Corp. company | | | | |
| guaranty 6 1/2s, 2013 | | 400,000 | | 404,720 |
| Ford Motor Credit Corp. FRN 7.68s, 2007 | | 1,660,000 | | 1,629,235 |
| Ford Motor Credit Corp. notes 7 3/8s, 2009 | | 3,855,000 | | 3,561,927 |
| Ford Motor Credit Corp. notes 6 3/8s, 2008 | | 1,355,000 | | 1,267,639 |
| Ford Motor Credit Corp. notes 5 5/8s, 2008 | | 2,499,000 | | 2,274,692 |
| General Motors Acceptance Corp. FRN 6.018s, 2007 | | 2,160,000 | | 2,096,286 |
| General Motors Acceptance Corp. FRN Ser. MTN, 5.968s, 2007 | | 1,435,000 | | 1,410,107 |
| General Motors Acceptance Corp. FRN Ser. MTN, 5.645s, 2006 | | 1,374,000 | | 1,373,691 |
| General Motors Acceptance Corp. FRN Ser. MTN, 5.62s, 2007 | | 2,370,000 | | 2,324,562 |
| GTECH Holdings Corp. notes 4 3/4s, 2010 | | 870,000 | | 841,532 |
| Harrah’s Operating Co., Inc. company guaranty 5 3/4s, 2017 | | 1,725,000 | | 1,616,492 |
| Hilton Hotels Corp. notes 8 1/4s, 2011 | | 1,790,000 | | 1,928,265 |
55
| CORPORATE BONDS AND NOTES (10.3%)* continued | | | | |
|
| | Principal amount | | Value |
| |
| Consumer Cyclicals continued | | | | |
| JC Penney Co., Inc. debs. 7.65s, 2016 | $ | 180,000 | $ | 196,311 |
| JC Penney Co., Inc. notes 8s, 2010 | | 685,000 | | 735,321 |
| JC Penney Co., Inc. notes 6 7/8s, 2015 | | 465,000 | | 481,460 |
| Johnson Controls, Inc. sr. notes 5 1/2s, 2016 | | 1,130,000 | | 1,081,595 |
| Masco Corp. notes 5 7/8s, 2012 | | 725,000 | | 723,756 |
| Office Depot, Inc. notes 6 1/4s, 2013 | | 751,000 | | 743,834 |
| Omnicom Group, Inc. sr. notes 5.9s, 2016 | | 885,000 | | 863,483 |
| Park Place Entertainment Corp. sr. notes 7s, 2013 | | 1,440,000 | | 1,498,509 |
| | | | | 36,339,178 |
|
| |
| Consumer Staples (1.1%) | | | | |
| Chancellor Media Corp. company guaranty 8s, 2008 | | 450,000 | | 473,441 |
| Cox Communications, Inc. notes 7 3/4s, 2010 | | 445,000 | | 475,822 |
| Cox Communications, Inc. notes 6 3/4s, 2011 | | 1,170,000 | | 1,206,451 |
| Cox Enterprises, Inc. 144A notes 7 7/8s, 2010 | | 1,450,000 | | 1,540,943 |
| CVS Corp. 144A pass-through certificates 6.117s, 2013 | | 974,854 | | 977,126 |
| Delhaize America, Inc. company guaranty 8 1/8s, 2011 | | 1,660,000 | | 1,789,810 |
| Diageo PLC company guaranty 8s, 2022 | | 1,110,000 | | 1,306,295 |
| Fortune Brands, Inc. notes 5 3/8s, 2016 | | 1,570,000 | | 1,486,319 |
| Jones Intercable, Inc. sr. notes 7 5/8s, 2008 | | 4,795,000 | | 4,976,289 |
| News America Holdings, Inc. debs. 7 3/4s, 2045 | | 710,000 | | 759,542 |
| News America, Inc. debs. 7 1/4s, 2018 | | 975,000 | | 1,047,818 |
| News America, Inc. 144A notes 6.4s, 2035 | | 1,790,000 | | 1,691,776 |
| TCI Communications, Inc. debs. 8 3/4s, 2015 | | 2,290,000 | | 2,658,147 |
| TCI Communications, Inc. debs. 7 7/8s, 2013 | | 1,010,000 | | 1,105,165 |
| Time Warner Entertainment Co., LP debs. 8 3/8s, 2023 | | 960,000 | | 1,076,575 |
| Time Warner, Inc. debs. 9.15s, 2023 | | 1,110,000 | | 1,326,339 |
| Time Warner, Inc. debs. 9 1/8s, 2013 | | 2,735,000 | | 3,148,510 |
| Viacom, Inc. company guaranty 7 7/8s, 2030 | | 650,000 | | 700,640 |
| Viacom, Inc. 144A sr. notes 5 3/4s, 2011 | | 810,000 | | 804,377 |
| | | | | 28,551,385 |
|
| |
| Energy (0.4%) | | | | |
| Amerada Hess Corp. bonds 7 7/8s, 2029 | | 2,350,000 | | 2,676,847 |
| Forest Oil Corp. sr. notes 8s, 2011 | | 755,000 | | 803,131 |
| Motiva Enterprises, LLC 144A sr. notes 5.2s, 2012 | | 1,345,000 | | 1,306,520 |
| Newfield Exploration Co. sr. sub. notes 6 5/8s, 2016 | | 900,000 | | 889,875 |
| Premcor Refining Group, Inc. sr. notes 7 1/2s, 2015 | | 435,000 | | 457,083 |
| Sunoco, Inc. notes 4 7/8s, 2014 | | 770,000 | | 717,076 |
| Valero Energy Corp. sr. unsecd. notes 7 1/2s, 2032 | | 940,000 | | 1,053,230 |
| Weatherford International, Ltd. sr. notes 5 1/2s, 2016 | | 650,000 | | 627,080 |
| | | | | 8,530,842 |
|
| |
| Financial (3.0%) | | | | |
| Allfirst Financial Inc. sub. notes 7.2s, 2007 | | 1,695,000 | | 1,729,982 |
| Archstone-Smith Trust 5 3/4s, 2016 (R) | | 1,030,000 | | 1,007,316 |
| Bank of America Corp. sub. notes 7 3/4s, 2015 | | 2,415,000 | | 2,728,735 |
| Bank of New York Co., Inc. (The) sr. sub. notes FRN 3.4s, 2013 | | 735,000 | | 707,032 |
| Bank One Corp. sub. debs. 7 5/8s, 2026 | | 4,040,000 | | 4,574,815 |
56
| CORPORATE BONDS AND NOTES (10.3%)* continued | | | | |
|
| | Principal amount | | Value |
| |
| Financial continued | | | | |
| Bank One Corp. sub. notes 5 1/4s, 2013 | $ | 515,000 | $ | 502,051 |
| Block Financial Corp. notes 5 1/8s, 2014 | | 980,000 | | 887,439 |
| Bosphorus Financial Services, Ltd. 144A sec. FRN | | | | |
| 6.549s, 2012 (Cayman Islands) | | 2,907,000 | | 2,928,538 |
| Brandywine Operating Partnership LP notes 5 3/4s, 2012 (R) | | 705,000 | | 696,335 |
| Capital One Bank notes 6 1/2s, 2013 | | 840,000 | | 870,090 |
| CIT Group Co. of Canada company guaranty 4.65s, 2010 (Canada) | | 850,000 | | 818,813 |
| CIT Group, Inc. sr. notes 5s, 2015 | | 690,000 | | 642,947 |
| CIT Group, Inc. sr. notes 5s, 2014 | | 4,825,000 | | 4,527,105 |
| Citigroup, Inc. sub. notes 5s, 2014 | | 2,829,000 | | 2,679,369 |
| Colonial Properties Trust notes 6 1/4s, 2014 (R) | | 870,000 | | 868,113 |
| Deutsche Bank Capital Funding Trust VII 144A FRB 5.628s, 2049 | | 1,540,000 | | 1,461,497 |
| Developers Diversified Realty Corp. unsecd. notes 5 3/8s, 2012 (R) | | 485,000 | | 469,468 |
| EOP Operating LP sr. notes 7s, 2011 | | 700,000 | | 736,319 |
| Equity One, Inc. company guaranty 3 7/8s, 2009 (R) | | 1,090,000 | | 1,034,817 |
| ERP Operating LP notes 6.584s, 2015 | | 735,000 | | 761,311 |
| Franchise Finance Corp. of America sr. notes 8 3/4s, 2010 (R) | | 2,670,000 | | 3,004,898 |
| Fund American Cos. Inc. notes 5 7/8s, 2013 | | 2,165,000 | | 2,103,572 |
| Goldman Sachs Group, Inc. (The) notes 4 3/4s, 2013 | | 1,000,000 | | 934,274 |
| Greenpoint Capital Trust I company guaranty 9.1s, 2027 | | 790,000 | | 850,029 |
| Heritage Property Investment Trust company | | | | |
| guaranty 5 1/8s, 2014 (R) | | 985,000 | | 911,498 |
| Hospitality Properties Trust notes 6 3/4s, 2013 (R) | | 1,005,000 | | 1,036,658 |
| HRPT Properties Trust bonds 5 3/4s, 2014 (R) | | 710,000 | | 684,857 |
| HRPT Properties Trust notes 6 1/4s, 2016 (R) | | 660,000 | | 655,435 |
| International Lease Finance Corp. notes 4 3/4s, 2012 | | 3,270,000 | | 3,107,491 |
| iStar Financial, Inc. sr. unsecd. notes 5 7/8s, 2016 (R) | | 2,205,000 | | 2,123,993 |
| Key Bank NA sub. notes 7s, 2011 | | 730,000 | | 771,822 |
| Lehman Brothers Holdings, Inc. bonds 7 7/8s, 2010 | | 800,000 | | 869,738 |
| Lehman Brothers Holdings, Inc. notes Ser. MTN, 5 1/2s, 2016 | | 2,450,000 | | 2,366,788 |
| Liberty Mutual Group 144A notes 6 1/2s, 2035 | | 3,010,000 | | 2,698,318 |
| Loews Corp. notes 5 1/4s, 2016 | | 630,000 | | 590,244 |
| MetLife, Inc. notes 5.7s, 2035 | | 1,085,000 | | 986,000 |
| MetLife, Inc. notes 5s, 2015 | | 1,505,000 | | 1,410,441 |
| Morgan Stanley Dean Witter & Co. notes 7 1/4s, 2032 | | 680,000 | | 752,602 |
| Nationwide Financial Services, Inc. notes 5 5/8s, 2015 (S) | | 815,000 | | 792,242 |
| Nuveen Investments, Inc. sr. notes 5 1/2s, 2015 | | 640,000 | | 605,866 |
| Nuveen Investments, Inc. sr. notes 5s, 2010 | | 640,000 | | 615,832 |
| OneAmerica Financial Partners, Inc. 144A bonds 7s, 2033 | | 965,000 | | 992,462 |
| PNC Bank NA notes 4 7/8s, 2017 | | 1,300,000 | | 1,188,560 |
| ProLogis Trust sr. notes 5 3/4s, 2016 (R) | | 1,260,000 | | 1,226,878 |
| Prudential Holdings LLC 144A bonds 8.695s, 2023 | | 2,035,000 | | 2,431,113 |
| Rouse Co. (The) notes 7.2s, 2012 (R) | | 1,305,000 | | 1,343,555 |
| Safeco Capital Trust I company guaranty 8.072s, 2037 | | 1,835,000 | | 1,938,733 |
| Simon Property Group LP 144A unsub. notes 5 3/4s, 2015 (R) | | 950,000 | | 930,564 |
| Sovereign Bancorp, Inc. 144A sr. notes 4.8s, 2010 | | 920,000 | | 885,770 |
| UBS AG/Jersey Branch FRN 7.93s, 2008 (Jersey) | | 5,000,000 | | 5,168,750 |
| | | | | 74,611,075 |
57
| CORPORATE BONDS AND NOTES (10.3%)* continued | | | | |
|
| | Principal amount | | Value |
| |
| Health Care (0.3%) | | | | |
| American Home Products Corp. notes 6.95s, 2011 | $ | 730,000 | $ | 769,823 |
| Bayer Corp. 144A FRB 6.2s, 2008 | | 1,330,000 | | 1,343,220 |
| Health Management Associates, Inc. sr. notes 6 1/8s, 2016 | | 1,360,000 | | 1,349,362 |
| Hospira, Inc. notes 5.9s, 2014 | | 530,000 | | 524,251 |
| WellPoint, Inc. notes 5s, 2014 | | 685,000 | | 643,776 |
| WellPoint, Inc. unsecd. notes 5 1/4s, 2016 | | 800,000 | | 760,226 |
| Wyeth notes 5 1/2s, 2014 | | 3,175,000 | | 3,102,188 |
| | | | | 8,492,846 |
|
| |
| Technology (0.2%) | | | | |
| Arrow Electronics, Inc. debs. 7 1/2s, 2027 | | 1,015,000 | | 1,061,921 |
| Avnet, Inc. notes 6s, 2015 | | 960,000 | | 915,113 |
| Computer Associates International, Inc. 144A | | | | |
| sr. notes 6 1/8s, 2014 | | 1,210,000 | | 1,141,750 |
| Xerox Corp. sr. notes 6.4s, 2016 | | 1,430,000 | | 1,392,463 |
| | | | | 4,511,247 |
|
| |
| Transportation (0.1%) | | | | |
| Continental Airlines, Inc. pass-through certificates | | | | |
| Ser. 97-4A, 6.9s, 2018 | | 2,106,761 | | 2,117,295 |
| Continental Airlines, Inc. pass-through certificates | | | | |
| Ser. 98-1A, 6.648s, 2017 | | 568,887 | | 564,621 |
| Union Pacific Corp. 144A pass-through certificates 5.214s, 2014 | | 470,000 | | 448,841 |
| | | | | 3,130,757 |
|
| |
| Utilities & Power (1.9%) | | | | |
| AEP Texas North Co. sr. notes Ser. B, 5 1/2s, 2013 | | 840,000 | | 814,893 |
| Appalachian Power Co. sr. notes 5.8s, 2035 | | 960,000 | | 855,708 |
| Atmos Energy Corp. notes 4.95s, 2014 | | 1,115,000 | | 1,031,339 |
| Beaver Valley II Funding debs. 9s, 2017 | | 1,435,000 | | 1,602,838 |
| Buckeye Partners LP notes 5.3s, 2014 | | 735,000 | | 697,990 |
| CenterPoint Energy Resources Corp. notes 7 3/4s, 2011 | | 1,735,000 | | 1,874,189 |
| Cleveland Electric Illuminating Co. (The) 144A | | | | |
| sr. notes Ser. D, 7.88s, 2017 | | 670,000 | | 760,431 |
| Commonwealth Edison Co. 1st mtge. 5.9s, 2036 | | 1,310,000 | | 1,217,395 |
| Consolidated Natural Gas Co. sr. notes 5s, 2014 | | 650,000 | | 602,801 |
| Consumers Energy Co. 1st mtge. 5.65s, 2020 | | 290,000 | | 272,176 |
| Consumers Energy Co. 1st mtge. 5s, 2012 | | 1,525,000 | | 1,459,725 |
| Consumers Energy Co. 1st mtge. Ser. B, 5 3/8s, 2013 | | 1,420,000 | | 1,368,630 |
| Dayton Power & Light Co. (The) 1st mtge. 5 1/8s, 2013 | | 1,035,000 | | 994,003 |
| Duke Energy Field Services, LLC notes 7 7/8s, 2010 | | 680,000 | | 734,597 |
| Duke Energy Field Services, LLC 144A notes 5 3/8s, 2015 | | 325,000 | | 308,052 |
| Enbridge Energy Partners LP sr. notes 5.35s, 2014 | | 735,000 | | 691,432 |
| Entergy Gulf States, Inc. 1st mtge. 5 1/4s, 2015 | | 565,000 | | 515,526 |
| Entergy Gulf States, Inc. 1st mtge. 3.6s, 2008 | | 700,000 | | 670,330 |
| FirstEnergy Corp. notes Ser. B, 6.45s, 2011 | | 735,000 | | 757,949 |
| Indianapolis Power & Light 144A 1st mtge. 6.3s, 2013 | | 680,000 | | 685,414 |
| Ipalco Enterprises, Inc. sec. notes 8 3/8s, 2008 | | 525,000 | | 546,000 |
| Kansas Gas & Electric bonds 5.647s, 2021 | | 375,000 | | 352,661 |
58
| CORPORATE BONDS AND NOTES (10.3%)* continued | | | | |
|
| | | Principal amount | | Value |
| |
| Utilities & Power continued | | | | | |
| Kinder Morgan, Inc. sr. notes 6 1/2s, 2012 | | $ | 1,385,000 | $ | 1,423,889 |
| MidAmerican Energy Holdings Co. 144A bonds 6 1/8s, 2036 | | 3,730,000 | | 3,558,088 |
| Monongahela Power Co. 1st mtge. 5s, 2006 | | | 2,940,000 | | 2,932,262 |
| National Fuel Gas Co. notes 5 1/4s, 2013 | | | 980,000 | | 941,181 |
| Nevada Power Co. 2nd mtge. 9s, 2013 | | | 726,000 | | 797,342 |
| Nevada Power Co. general ref. mtge. Ser. L, 5 7/8s, 2015 | | 370,000 | | 356,461 |
| NiSource Finance Corp. company guaranty 5.45s, 2020 | | 1,655,000 | | 1,504,342 |
| NiSource Finance Corp. company guaranty 5 1/4s, 2017 | | 180,000 | | 166,045 |
| Oncor Electric Delivery Co. debs. 7s, 2022 | | | 80,000 | | 83,526 |
| Oncor Electric Delivery Co. sec. notes 7 1/4s, 2033 | | 490,000 | | 531,946 |
| PacifiCorp Sinking Fund 1st mtge. 5.45s, 2013 | | | 1,570,000 | | 1,544,781 |
| Power Receivable Finance, LLC 144A sr. notes 6.29s, 2012 (S) | | 1,502,054 | | 1,505,899 |
| PPL Energy Supply LLC bonds Ser. A, 5.7s, 2015 | | | 855,000 | | 820,668 |
| Progress Energy, Inc. sr. unsecd. notes 5 5/8s, 2016 | | 1,295,000 | | 1,251,338 |
| Public Service Co. of Colorado sr. notes Ser. A, 6 7/8s, 2009 | | 1,605,000 | | 1,665,014 |
| Public Service Co. of New Mexico sr. notes 4.4s, 2008 | | 785,000 | | 762,067 |
| Public Service Electric & Gas Co. 1st mtge. 6 3/8s, 2008 | | 1,130,000 | | 1,148,859 |
| Southern California Edison Co. 1st mtge. 5s, 2014 | | 310,000 | | 295,134 |
| Southern California Edison Co. notes 6.65s, 2029 | | | 1,620,000 | | 1,659,356 |
| Teco Energy, Inc. notes 7.2s, 2011 | | | 1,485,000 | | 1,540,688 |
| TransAlta Corp. notes 5 3/4s, 2013 (Canada) | | | 880,000 | | 858,309 |
| TXU Corp. sr. notes Ser. P, 5.55s, 2014 | | | 2,735,000 | | 2,541,559 |
| Westar Energy, Inc. 1st mtge. 5.15s, 2017 | | | 195,000 | | 179,913 |
| Westar Energy, Inc. 1st mtge. 5.1s, 2020 | | | 1,015,000 | | 908,814 |
| York Power Funding 144A notes 12s, 2007 | | | | | |
| (Cayman Islands) (In default) (F) † | | | 212,310 | | 17,707 |
| | | | | | 47,809,267 |
|
| |
| Total corporate bonds and notes (cost $269,445,273) | | | $ | 261,412,024 |
|
| |
| |
| PURCHASED OPTIONS OUTSTANDING (0.2%)* | | | | |
|
| | Expiration date/ | | Contract | | |
|
| | strike price | | Amount | | Value |
| |
| Option on an interest rate swap with JPMorgan | | | | | |
| Chase Bank, N.A. for the obligation to pay a fixed | | | | | |
| rate of 5.28% versus the three month | | | | | |
| USD-LIBOR-BBA maturing on March 8, 2017. | Mar 07/$5.28 | | 110,693,000 | $ | 4,111,714 |
| Option on an interest rate swap with JPMorgan | | | | | |
| Chase Bank, N.A. for the right to receive a fixed | | | | | |
| rate of 5.28% versus the three month | | | | | |
| USD-LIBOR-BBA maturing on March 8, 2017. | Mar 07/$5.28 | | 110,693,000 | | 1,209,708 |
| 90 Day Euro-Euribor Interest Rate Future (Call) | Mar 07/$94.75 | | 610 | | 388,875 |
| 90 Day Euro-Euribor Interest Rate Future (Put) | Mar 07/$94.75 | | 610 | | 327,875 |
59
| PURCHASED OPTIONS OUTSTANDING (0.2%)* continued | | | |
|
| | Expiration date/ | Contract | | |
| | strike price | Amount | | Value |
|
| Option on an interest rate swap with JPMorgan | | | | |
| Chase Bank, N.A. for the right to receive a | | | | |
| fixed rate of 5.165% versus the three month | | | | |
| USD-LIBOR-BBA maturing on March 7, 2009. | Mar 07/$5.165 | 6,500,000 | $ | 23,984 |
| Option on an interest rate swap with JPMorgan | | | | |
| Chase Bank, N.A. for the right to receive a | | | | |
| fixed rate of 5.22% versus the three month | | | | |
| USD-LIBOR-BBA maturing on April 11, 2008. | Apr 07/$5.22 | 5,370,000 | | 11,860 |
|
| |
| Total purchased options outstanding (cost $6,265,728) | | $ | 6,074,016 |
|
| |
| MUNICIPAL BONDS AND NOTES (0.1%)* | | | | |
|
| | Rating** | Principal amount | | Value |
|
| NJ State Tpk. Auth. Rev. Bonds, Ser. B | | | | |
| AMBAC, 4.252s, 1/1/16 | Aaa | $ 1,705,000 | $ | 1,556,222 |
| AMBAC, U.S. Govt. Coll., 4.252s, | | | | |
| 1/1/16 (Prerefunded) | Aaa | 90,000 | | 81,125 |
|
| Total municipal bonds and notes (cost $1,794,889) | | $ | 1,637,347 |
|
| |
| |
| UNITS (—%)* (cost $1,119,342) | | | | |
|
| | | Units | | Value |
|
| Cendant Corp. units 4.89s, 2006 | | 1,310 | $ | 652,941 |
|
| |
| SHORT-TERM INVESTMENTS (30.6%)* | | | | |
|
| | | Principal amount/shares | | Value |
|
| Amstel Funding Corp., for an effective yield | | | | |
| of 4.88%, May 17, 2006 | | $ 22,000,000 | $ | 21,952,480 |
| Atlantic Assets Security Corp., for an effective | | | | |
| yield of 4.81%, May 11, 2006 | | 8,000,000 | | 7,989,333 |
| Jupiter Securities Corp., for an effective yield | | | | |
| of 4.79%, May 11, 2006 | | 1,200,000 | | 1,198,410 |
| Sheffield Receivable Corp., for an effective yield | | | | |
| of 4.78%, May 1, 2006 | | 30,000,000 | | 30,000,000 |
| U.S. Treasury Bills 4.55%, May 18, 2006 # | | 3,545,000 | | 3,537,417 |
| Interest in $495,000,000 joint tri party repurchase | | | | |
| agreement dated April 28, 2006 with Bank of America | | | |
| Securities, LLC due May 1, 2006 with respect | | | | |
| to various U.S. Government obligations — maturity | | | |
| value of $176,135,133 for an effective yield of 4.78% | | | |
| (collateralized by Fannie Mae with a yield of 5.00% | | | | |
| due March 1, 2035 valued at $504,900,000) | | 176,065,000 | | 176,065,000 |
60
| SHORT-TERM INVESTMENTS (30.6%)* continued | | | |
|
| | Principal amount/shares | | Value |
| Short-term investments held as collateral for loaned | | | |
| securities with yields ranging from 4.7% to 5.01% and | | | |
| due dates ranging from May 1,2006 to June 2, 2006 (d) | $ 5,180,108 | $ | 5,174,020 |
| Putnam Prime Money Market Fund (e) | 530,079,758 | | 530,079,758 |
|
| Total short-term investments (cost $775,996,418) | | $ | 775,996,418 |
|
| |
| TOTAL INVESTMENTS | | | |
| Total investments (cost $3,336,262,795) | | $ | 3,260,427,875 |
* Percentages indicated are based on net assets of $2,535,525,263.
** The Moody’s or Standard & Poor’s ratings indicated are believed to be the most recent ratings available at April 30, 2006 for the securities listed. Ratings are generally ascribed to securities at the time of issuance. While the agencies may from time to time revise such ratings, they undertake no obligation to do so, and the ratings do not necessarily represent what the agencies would ascribe to these securities at April 30, 2006. Securities rated by Putnam are indicated by “/P” . Ratings are not covered by the Report of Independent Registered Public Accounting Firm. Security ratings are defined in the Statement of Additional Information.
† Non-income-producing security.
(S) Securities on loan, in part or in entirety, at April 30, 2006.
# A portion of this security was pledged and segregated with the custodian to cover margin requirements for futures contracts at April 30, 2006.
(R) Real Estate Investment Trust.
(d) See Note 1 to the financial statements.
(e) See Note 5 to the financial statements regarding investments in Putnam Prime Money Market Fund.
(F) Security is valued at fair value following procedures approved by the Trustees.
(g) The notes are secured by debt and equity securities and equity participation agreements held by Neon Capital, Ltd. At April 30, 2006, liquid assets totaling $772,884,523 have been designated as collateral for open forward commitments, swap contracts and futures contracts.
144A after the name of an issuer represents securities exempt from registration under Rule 144A of the Securities Act of 1933. These securities may be resold in transactions exempt from registration, normally to qualified institutional buyers.
TBA after the name of a security represents to be announced securities (Note 1).
The rates shown on Floating Rate Bonds (FRB) and Floating Rate Notes (FRN) are the current interest rates at April 30, 2006.
Inverse Floating Rate Bonds (IFB) are securities that pay interest rates that vary inversely to changes in the market interest rates. As interest rates rise, inverse floaters produce less current income. The interest rates shown are the current interest rates at April 30, 2006.
AMBAC represents AMBAC Indemnity Corporation.
U.S. Govt. Coll. represents U.S. Government Collateralized.
61
| FUTURES CONTRACTS OUTSTANDING at 4/30/06 (Unaudited) | | | |
|
| | | | | | Unrealized |
| | Number of | | Expiration | | appreciation/ |
| | contracts | Value | date | | (depreciation) |
|
| Euro 90 day (Long) | 11 | $ 2,607,275 | Jun-06 | $ | (591) |
| Euro 90 day (Long) | 7,384 | 1,749,269,600 | Sep-06 | | (2,092,272) |
| Euro 90 day (Short) | 7,058 | 1,672,569,550 | Mar-07 | | 5,693,140 |
| U.S. Treasury Bond 20 yr (Long) | 2,694 | 287,837,063 | Jun-06 | | (12,602,782) |
| U.S. Treasury Note 2 yr (Long) | 295 | 60,101,641 | Jun-06 | | (116,119) |
| U.S. Treasury Note 5 yr (Short) | 3,806 | 396,418,688 | Jun-06 | | 2,789,638 |
| U.S. Treasury Note 10 yr (Short) | 210 | 22,171,406 | Jun-06 | | 52,419 |
|
| Total | | | | $ | (6,276,567) |
|
| WRITTEN OPTIONS OUTSTANDING at 4/30/06 (premiums received $12,151,806) (Unaudited) | |
|
| | Contract | Expiration date/ | |
| | amount | strike price | Value |
|
| Option on an interest rate swap with Lehman | | | |
| Brothers International for the obligation to pay | | | |
| a fixed rate of 5.225% semi-annually versus the | | | |
| three month USD-LIBOR-BBA maturing | | | |
| March 5, 2018. | 45,268,000 | Mar 08 / $5.225 | $ 2,252,581 |
| Option on an interest rate swap with JPMorgan | | | |
| Chase Bank, N.A. for the obligation to pay a | | | |
| fixed rate of 5.4325% versus the three month | | | |
| USD-LIBOR-BBA maturing on April 7, 2012. | 4,650,000 | Apr 11 / $5.4325 | 23,615 |
| Option on an interest rate swap with Lehman | | | |
| Brothers International for the right to receive a | | | |
| fixed rate of 5.225% semi-annually versus the | | | |
| three month USD-LIBOR-BBA maturing | | | |
| March 5, 2018. | 45,268,000 | Mar 08 / $5.225 | 803,643 |
| Option on an interest rate swap with JPMorgan | | | |
| Chase Bank, N.A. for the obligation to pay a | | | |
| fixed rate of 5.50% versus the three month | | | |
| USD-LIBOR-BBA maturing on April 11, 2027. | 5,630,000 | Apr 07 / $5.5 | 118,980 |
| Option on an interest rate swap with JPMorgan | | | |
| Chase Bank, N.A. for the right to receive a | | | |
| fixed rate of 4.55% versus the three month | | | |
| USD-LIBOR-BBA maturing on July 5, 2017. | 113,530,000 | Jul 07 / $4.55 | 389,714 |
| Option on an interest rate swap with JPMorgan | | | |
| Chase Bank, N.A. for the obligation to pay a | | | |
| fixed rate of 4.55% versus the three month | | | |
| USD-LIBOR-BBA maturing on July 5, 2017. | 113,530,000 | Jul 07 / $4.55 | 9,407,596 |
|
| |
| Total | | | $12,996,129 |
62
TBA SALE COMMITMENTS OUTSTANDING at 4/30/06 (proceeds receivable $219,981,910) (Unaudited)
| | | | Principal | Settlement | |
| | | | amount | date | Value |
|
| FNMA, 6s, May 1, 2036 | | | $77,930,000 | 5/11/06 | $ 77,576,884 |
| FNMA, 5 1/2s, May 1, 2036 | | 36,600,000 | 5/11/06 | 35,542,033 |
| FNMA, 5s, May 1, 2036 | | | 73,200,000 | 5/11/06 | 69,236,908 |
| FNMA, 4 1/2s, May 1, 2036 | | 36,600,000 | 5/11/06 | 33,509,017 |
| GNMA, 6s, May 1, 2036 | | 1,550,000 | 5/18/06 | 1,555,691 |
|
| Total | | | | | $217,420,533 |
|
| |
| |
| INTEREST RATE SWAP CONTRACTS OUTSTANDING at 4/30/06 (Unaudited) | | |
|
| | | Fixed payments | Fixed payments | Unrealized |
| Swap counterparty/ | Termination | made by | received by | | appreciation/ |
| Notional amount | date | fund per annum | fund per annum | (depreciation) |
|
| Bank of America, N.A. | | | | | |
| $ 91,608,000 | 1/28/24 | 3 month USD-LIBOR-BBA | 5.2125% | | $(3,790,839) |
|
| 70,599,000 | 12/22/09 | 3.965% | 3 month USD-LIBOR-BBA | 2,562,450 |
|
| 134,600,000 | 1/14/10 | 3 month USD-LIBOR-BBA | 4.106% | | (4,219,498) |
|
| 106,100,000 | 4/6/10 | 4.6375% | 3 month USD-LIBOR-BBA | 2,683,468 |
|
| 25,430,000 | 6/17/15 | 4.555% | 3 month USD-LIBOR-BBA | 1,520,926 |
|
| 9,200,000 | 6/23/15 | 4.466% | 3 month USD-LIBOR-BBA | 609,984 |
|
| 3,830,000 | 6/23/15 | 4.45% | 3 month USD-LIBOR-BBA | 258,523 |
|
| 4,590,000 | 6/24/15 | 4.39% | 3 month USD-LIBOR-BBA | 332,757 |
|
| 61,500,000 | 10/21/15 | 4.943% | 3 month USD-LIBOR-BBA | 2,756,835 |
|
| 1,000,000 | 9/1/15 | 3 month USD-LIBOR-BBA | 4.53% | | (74,547) |
|
| Citibank, N.A. | | | | | |
| 5,230,000 | 4/7/14 | 5.377% | 3 month USD-LIBOR-BBA | 40,455 |
|
| Credit Suisse First Boston International | | | | |
| 34,147,400 | 7/9/06 | 3 month USD-LIBOR-BBA | 2.931% | | 63,134 |
|
| 55,240,000 | 10/7/14 | 3 month USD-LIBOR-BBA | 4.624% | | (3,338,696) |
|
| Credit Suisse International | | | | | |
| 5,195,000 | 3/21/16 | 3 month USD-LIBOR-BBA | 5.20497% | | (142,194) |
|
| Deutsche Bank AG | | | | | |
| 61,565,504 | 8/2/32 | 5.86% | 3 month USD-LIBOR-BBA | (1,313,021) |
|
| 54,861,045 | 8/2/22 | 3 month USD-LIBOR-BBA | 5.7756% | | 688,428 |
|
| Goldman Sachs Capital Markets, L.P. | | | | |
| 61,565,504 | 8/12/32 | 5.689% | 3 month USD-LIBOR-BBA | 159,588 |
|
| 54,861,045 | 8/12/22 | 3 month USD-LIBOR-BBA | 5.601% | | (366,627) |
|
| 16,030,000 | 4/7/14 | 5.33842% | 3 month USD-LIBOR-BBA | 165,486 |
|
| 5,322,000 | 5/3/16 | 5.565% | 3 month USD-LIBOR-BBA | — |
|
| JPMorgan Chase Bank, N.A. | | | | |
| 156,000,000 | 1/17/16 | 4.946% | 3 month USD-LIBOR-BBA | 5,247,547 |
|
| 58,900,000 | 3/7/15 | 3 month USD-LIBOR-BBA | 4.798% | | (3,029,387) |
|
| 22,120,000 | 6/16/15 | 4.538% | 3 month USD-LIBOR-BBA | 1,345,674 |
|
| 5,510,000 | 6/24/15 | 3 month USD-LIBOR-BBA | 4.387% | | 407,335 |
|
| 80,000,000 | 6/29/15 | 3 month USD-LIBOR-BBA | 4.296% | | (6,312,640) |
|
| 15,425,000 | 8/2/15 | 4.6757% | 3 month USD-LIBOR-BBA | (971,418) |
|
| 55,400,000 | 10/21/15 | 4.916% | 3 month USD-LIBOR-BBA | 2,593,500 |
|
63
| INTEREST RATE SWAP CONTRACTS OUTSTANDING at 4/30/06 (Unaudited) continued | |
|
| | | Fixed payments | Fixed payments | Unrealized |
| Swap counterparty/ | Termination | made by | received by | appreciation/ |
| Notional amount | date | fund per annum | fund per annum | (depreciation) |
|
| Lehman Brothers Special Financing, Inc. | | | |
| $ 53,317,584 | 8/2/12 | 5.152% | 3 month USD-LIBOR-BBA | $ 775,937 |
|
| 54,861,045 | 8/2/22 | 3 month USD-LIBOR-BBA | 5.7756% | 688,428 |
|
| 84,327,000 | 12/19/15 | 5.0265% | 3 month USD-LIBOR-BBA | 2,255,002 |
|
| 36,201,000 | 3/21/14 | 5.17596% | 3 month USD-LIBOR-BBA | 734,650 |
|
| 14,151,000 | 12/15/13 | 4.710% | 3 month USD-LIBOR-BBA | 526,515 |
|
| 17,662,000 | 12/16/13 | 4.579% | 3 month USD-LIBOR-BBA | 808,945 |
|
| 2,040,000 | 4/10/15 | 5.41053% | 3 month USD-LIBOR-BBA | 17,857 |
|
| 81,400,000 | 4/28/08 | 5.4025% | 3 month USD-LIBOR-BBA | (140,339) |
|
| 73,700,000 | 7/15/10 | 4.38% | 3 month USD-LIBOR-BBA | 1,905,651 |
|
| 54,700,000 | 4/28/16 | 5.613% | 3 month USD-LIBOR-BBA | (180,544) |
|
| 68,000,000 | 8/31/10 | 4.505% | 3 month USD-LIBOR-BBA | 2,256,929 |
|
| 10,740,000 | 1/23/14 | 4.408% | 3 month USD-LIBOR-BBA | 616,692 |
|
| 10,740,000 | 1/23/14 | 4.419% | 3 month USD-LIBOR-BBA | 615,727 |
|
| Merrill Lynch Capital Services, Inc. | | | |
| 54,861,045 | 8/12/22 | 3 month USD-LIBOR-BBA | 5.601% | (366,627) |
|
| 53,317,584 | 8/13/12 | 4.94% | 3 month USD-LIBOR-BBA | 1,410,517 |
|
| Morgan Stanley Capital Services, Inc. | | | |
| 28,000,000 | 10/2/10 | 6.94% | 3 month USD-LIBOR-BBA | (1,744,783) |
|
| Total | | | | $ 8,057,780 |
| TOTAL RETURN SWAP CONTRACTS OUTSTANDING at 4/30/06 (Unaudited) | |
|
| |
| | | Fixed payments | Total return | Unrealized |
| Swap counterparty / | Termination | received (paid) by | received by | appreciation/ |
| Notional amount | date | fund per annum | or paid by fund | (depreciation) |
|
| Citibank, N.A. | | | | |
| $21,290,000 | 11/1/06 | (7.5 bp plus | Lehman Brothers | $ — |
| | | beginning | AAA 8.5+ CMBS | |
| | | of period nominal | Index adjusted | |
| | | spread of Lehman | by modified | |
| | | Brothers AAA | duration factor | |
| | | 8.5+ Commercial | | |
| | | Mortgage Backed | | |
| | | Securities Index) | | |
|
| Deutsche Bank AG London | | | | |
| 21,290,000 | 11/1/06 | (5 bp plus | Lehman Brothers | — |
| | | nominal spread | AAA 8.5+ CMBS | |
| | | of Lehman | Index adjusted | |
| | | Brothers AAA | by modified | |
| | | 8.5+ Commercial | duration factor | |
| | | Mortgage Backed | | |
| | | Securities Index) | | |
|
| Goldman Sachs | | | | |
| 4,951,000 | 9/15/11 | 678 bp | Ford Credit Auto | (21,936) |
| | | (1 month USD-LIBOR) | Owner Trust | |
| | | | Series 2005-B | |
| | | | Class D | |
|
64
| TOTAL RETURN SWAP CONTRACTS OUTSTANDING at 4/30/06 (Unaudited) continued | | |
|
| |
| | | Fixed payments | Total return | Unrealized |
| Swap counterparty / | Termination | received (paid) by | received by | appreciation/ |
| Notional amount | date | fund per annum | or paid by fund | (depreciation) |
|
| Goldman Sachs International | | | | | |
| $ 19,920,000 | 11/1/06 | (5 bp plus | Lehman Brothers | $ — |
| | | change in spread | AAA 8.5+ CMBS | | |
| | | on the Lehman | Index adjusted | | |
| | | Brothers AAA | by modified | | |
| | | 8.5+ Commercial | duration factor | | |
| | | Mortgage Backed | | | |
| | | Securities Index | | | |
| | | multiplied by | | | |
| | | the modified | | | |
| | | duration factor) | | | |
|
| |
| Total | | | | $(21,936) |
| CREDIT DEFAULT CONTRACTS OUTSTANDING at 4/30/06 (Unaudited) | | |
|
| | Upfront | | | Fixed payments | Unrealized |
| Swap counterparty / | premium | Notional | Termination | received (paid) | by appreciation/ |
| Referenced Debt* | received (paid)** | amount | date | fund per annum | (depreciation) |
|
| Bank of America, N.A. | | | | | |
| DJ CDX NA IG HVOL | | | | | |
| Series 4 Index | $(46,530) | $6,176,000 | 6/20/10 | (90 bp) | $ (64,995) |
|
| Waste Management, | | | | | |
| 7.375%, 8/1/10 | — | 1,400,000 | 9/20/12 | 64 bp | 16,081 |
|
| Deutsche Bank AG | | | | | |
| CVS Corp., 5.625%, | | | | | |
| 3/15/06 | — | 940,000 | 12/20/14 | 0.58% | 11,606 |
|
| France Telecomm, 7.25%, | | | | | |
| 1/28/13 | — | 2,380,000 | 9/20/10 | 41 bp | (4,760) |
|
| Goldman Sachs Capital Markets, L.P. | | | | |
| DJ CDX NA IG HVOL | | | | | |
| Series 5 Index | (24,874) | 2,944,000 | 12/20/10 | (85 bp) | (50,522) |
|
| DJ CDX NA IG Series 5 | | | | | |
| Index | (85,233) | 34,405,000 | 12/20/10 | (45 bp) | (280,138) |
|
| DJ CDX NA IG Series 5 | | | | | |
| Index 3-7% tranche | — | 1,472,000 | 12/20/10 | (113 bp) | (38,947) |
|
| DJ CDX NA IG HVOL | | | | | |
| Series 5 Index | (18,798) | 2,944,000 | 12/20/10 | (85 bp) | (44,446) |
|
| DJ CDX NA IG Series 5 | | | | | |
| Index 3-7% tranche | — | 1,386,000 | 12/20/10 | (115 bp) | (37,854) |
|
| Noble Energy, Inc., 8%, | | | | | |
| 4/1/27 | — | 1,590,000 | 6/20/13 | 60 bp | (477) |
|
| Goodrich Corp., 7 5/8%, | | | | | |
| 12/15/12 | — | 1,170,000 | 9/20/10 | 49 bp | 5,548 |
|
| Goldman Sachs International | | | | | |
| One of the underlying | | | | | |
| securities in the | | | | | |
| basket of BB CMBS | | | | | |
| securities | — | 11,022,000 | (a) | 2.55625% | 544,608 |
|
65
| CREDIT DEFAULT CONTRACTS OUTSTANDING at 4/30/06 (Unaudited) continued | |
|
| | Upfront | | | Fixed payments | Unrealized |
| Swap counterparty / | premium | Notional | Termination | received (paid) | by appreciation/ |
| Referenced Debt* | received (paid)** | amount | date | fund per annum | (depreciation) |
|
| Lehman Brothers Special Financing, Inc. | | | | |
| DJ CDX NA IG Series 5 | | | | | |
| Index | $(31,305) | $17,455,000 | 12/20/10 | (45 bp) | $(130,188) |
|
| DJ CDX NA IG Series 4 | | | | | |
| Index 3-7% tranche | — | 1,544,000 | 6/20/10 | (124.5 bp) | (44,626) |
|
| DJ CDX NA IG Series 4 | | | | | |
| Index | (11,076) | 8,405,000 | 12/20/10 | (45 bp) | (58,691) |
|
| DJ CDX NA IG HVOL | | | | | |
| Series 4 Index | (22,178) | 1,960,000 | 6/20/10 | (90 bp) | (27,842) |
|
| DJ CDX NA IG Series 4 | | | | | |
| Index 3-7% tranche | — | 1,960,000 | 6/20/12 | 309 bp | 127,214 |
|
| DJ CDX NA IG HVOL | | | | | |
| Series 5 Index | (7,425) | 1,386,000 | 12/20/10 | (85 bp) | (19,500) |
|
| DJ CDX NA IG Series 5 | | | | | |
| Index | (4,852) | 15,270,000 | 12/20/10 | 45 bp | (91,357) |
|
| Merrill Lynch International | | | | | |
| DJ CDX NA IG Series 5 | | | | | |
| Index | (3,710) | 5,850,000 | 12/20/10 | (45 bp) | (36,851) |
|
| Merrill Lynch International & Co. C.V. | | | | |
| DJ CDX NA IG Series 5 | | | | | |
| Index 3-7% tranche | — | 1,386,000 | 12/20/12 | 246 bp | 69,702 |
|
| Morgan Stanley Capital Services, Inc. | | | | |
| DJ CDX NA IG Series 5 | | | | | |
| Index 3-7% tranche | — | 2,944,000 | 12/20/12 | 305 bp | 246,438 |
|
| DJ CDX NA IG Series 4 | | | | | |
| Index 3-7% tranche | — | 1,960,000 | 6/20/10 | (110.5 bp) | (46,411) |
|
| DJ CDX NA IG Series 4 | | | | | |
| Index 3-7% tranche | — | 3,088,000 | 6/20/12 | 275 bp | 144,791 |
|
| DJ CDX NA IG Series 5 | | | | | |
| Index 3-7% tranche | — | 1,386,000 | 12/20/10 | (115 bp) | (37,854) |
|
| DJ CDX NA IG HVOL | | | | | |
| Series 5 Index | (7,786) | 1,386,000 | 12/20/10 | (85 bp) | (19,860) |
|
| DJ CDX NA IG Series 5 | | | | | |
| Index 3-7% tranche | — | 1,386,000 | 12/20/12 | 248 bp | 71,273 |
|
| Total | | | | | $ 201,942 |
* Payments related to the reference debt are made upon a credit default event.
** Upfront premium is based on the difference between the original spread on issue and the market spread on day of execution.
(a) Terminating on the date on which the notional amount is reduced to zero or the date on which the assets securing the reference entity are liquidated.
The accompanying notes are an integral part of these financial statements.
66
Statement of assets and liabilities 4/30/06 (Unaudited)
| ASSETS | |
|
| Investment in securities, at value including $5,045,993 of securities on loan (Note 1): | |
| Unaffiliated issuers (identified cost $2,806,183,037) | $2,730,348,117 |
| Affiliated issuers (identified cost $530,079,758) (Note 5) | 530,079,758 |
|
| Cash | 1,237,102 |
|
| Interest and other receivables | 14,137,351 |
|
| Receivable for shares of the fund sold | 1,639,874 |
|
| Receivable for securities sold | 73,246,647 |
|
| Receivable for sales of delayed delivery securities (Note 1) | 220,319,518 |
|
| Unrealized appreciation on swap contracts (Note 1) | 35,286,201 |
|
| Receivable for closed swap contracts (Note 1) | 226,434 |
|
| Premium payed on credit default contracts (Note 1) | 263,767 |
|
| Total assets | 3,606,784,769 |
|
| |
| LIABILITIES | |
|
| Payable for variation margin (Note 1) | 36,345 |
|
| Payable for securities purchased | 86,702,648 |
|
| Payable for purchases of delayed delivery securities (Note 1) | 712,464,938 |
|
| Payable for shares of the fund repurchased | 5,094,241 |
|
| Payable for compensation of Manager (Notes 2 and 5) | 2,887,065 |
|
| Payable for investor servicing and custodian fees (Note 2) | 447,864 |
|
| Payable for Trustee compensation and expenses (Note 2) | 239,342 |
|
| Payable for administrative services (Note 2) | 6,221 |
|
| Payable for distribution fees (Note 2) | 499,466 |
|
| Collateral on securities loaned, at value (Note 1) | 5,174,020 |
|
| Written options outstanding, at value (premiums received $12,151,806) (Note 1) | 12,996,129 |
|
| Unrealized depreciation on swap contracts (Note 1) | 27,048,415 |
|
| TBA sales commitments, at value (proceeds receivable $219,981,910) (Note 1) | 217,420,533 |
|
| Other accrued expenses | 242,279 |
|
| Total liabilities | 1,071,259,506 |
|
| Net assets | $2,535,525,263 |
| |
| (Continued on next page) | |
67
| Statement of assets and liabilities (Continued) | |
|
| |
| REPRESENTED BY | |
|
| Paid-in capital (Unlimited shares authorized) (Notes 1 and 4) | $2,713,421,313 |
|
| Undistributed net investment income (Note 1) | 23,500,279 |
|
| Accumulated net realized loss on investments (Note 1) | (129,239,682) |
|
| Net unrealized depreciation of investments | (72,156,647) |
|
| Total — Representing net assets applicable to capital shares outstanding | $2,535,525,263 |
|
| |
| COMPUTATION OF NET ASSET VALUE AND OFFERING PRICE | |
|
| Net asset value and redemption price per class A share | |
| ($807,878,357 divided by 122,159,254 shares) | $6.61 |
|
| Offering price per class A share | |
| (100/96.25 of $6.61)* | $6.87 |
|
| Net asset value and offering price per class B share | |
| ($188,265,745 divided by 28,651,638 shares)** | $6.57 |
|
| Net asset value and offering price per class C share | |
| ($22,437,532 divided by 3,404,854 shares)** | $6.59 |
|
| Net asset value and redemption price per class M share | |
| ($370,972,138 divided by 56,711,301 shares) | $6.54 |
|
| Offering price per class M share | |
| (100/96.75 of $6.54)*** | $6.76 |
|
| Net asset value, offering price and redemption price per class R share | |
| ($545,049 divided by 82,475 shares) | $6.61 |
|
| Net asset value, offering price and redemption price per class Y share | |
| ($1,145,426,442 divided by 172,056,980 shares) | $6.66 |
* On single retail sales of less than $100,000. On sales of $100,000 or more and on group sales, the offering price is reduced.
** Redemption price per share is equal to net asset value less any applicable contingent deferred sales charge.
*** On single retail sales of less than $50,000. On sales of $50,000 or more and on group sales, the offering price is reduced.
The accompanying notes are an integral part of these financial statements.
68
Statement of operations Six months ended 4/30/06 (Unaudited)
| INVESTMENT INCOME | |
|
| Interest (including interest income of $9,281,642 | |
| from investments in affiliated issuers) (Note 5) | $ 65,845,846 |
|
| Security lending | 3,380 |
|
| Total investment income | 65,849,226 |
|
| |
| EXPENSES | |
|
| Compensation of Manager (Note 2) | 6,576,232 |
|
| Investor servicing fees (Note 2) | 2,676,557 |
|
| Custodian fees (Note 2) | 198,584 |
|
| Trustee compensation and expenses (Note 2) | 45,637 |
|
| Administrative services (Note 2) | 30,948 |
|
| Distribution fees — Class A (Note 2) | 1,047,754 |
|
| Distribution fees — Class B (Note 2) | 1,048,731 |
|
| Distribution fees — Class C (Note 2) | 119,603 |
|
| Distribution fees — Class M (Note 2) | 984,787 |
|
| Distribution fees — Class R (Note 2) | 1,137 |
|
| Other | 244,066 |
|
| Non-recurring costs (Notes 2 and 6) | 17,208 |
|
| Costs assumed by Manager (Notes 2 and 6) | (17,208) |
|
| Fees waived and reimbursed by Manager or affiliate (Notes 2, 5 and 6) | (1,070,406) |
|
| Total expenses | 11,903,630 |
|
| Expense reduction (Note 2) | (254,592) |
|
| Net expenses | 11,649,038 |
|
| Net investment income | 54,200,188 |
|
| Net realized loss on investments (Notes 1 and 3) | (24,813,441) |
|
| Net realized loss on futures contracts (Note 1) | (6,880,810) |
|
| Net realized gain on swap contracts (Note 1) | 4,557,277 |
|
| Net realized gain on written options (Notes 1 and 3) | 107,120 |
|
| Net unrealized depreciation of investments, futures contracts, swap contracts, | |
| written options and TBA sale commitments during the period | (17,883,219) |
|
| Net loss on investments | (44,913,073) |
|
| Net increase in net assets resulting from operations | $ 9,287,115 |
The accompanying notes are an integral part of these financial statements.
69
| Statement of changes in net assets | |
|
| |
| DECREASE IN NET ASSETS | | |
|
| | Six months ended | Year ended |
| | 4/30/06* | 10/31/05 |
|
| Operations: | | |
| Net investment income | $ 54,200,188 | $ 90,763,613 |
|
| Net realized gain (loss) on investments | (27,029,854) | 14,914,922 |
|
| Net unrealized depreciation of investments | (17,883,219) | (77,358,436) |
|
| Net increase in net assets resulting from operations | 9,287,115 | 28,320,099 |
|
| Distributions to shareholders: (Note 1) | | |
|
| From net investment income | | |
|
| Class A | (17,319,073) | (28,598,706) |
|
| Class B | (3,585,083) | (6,366,448) |
|
| Class C | (405,359) | (615,427) |
|
| Class M | (7,829,559) | (14,120,044) |
|
| Class R | (9,061) | (9,087) |
|
| Class Y | (23,152,372) | (31,990,509) |
|
| Redemption fees (Note 1) | 4,844 | 11,566 |
|
| Increase (decrease) from capital share transactions (Note 4) | 230,994 | (143,764,508) |
|
| Total decrease in net assets | (42,777,554) | (197,133,064) |
|
| |
| NET ASSETS | | |
|
| Beginning of period | 2,578,302,817 | 2,775,435,881 |
|
| End of period (including undistributed net investment | | |
| income of $23,500,279 and $21,600,598, respectively) | $2,535,525,263 | $2,578,302,817 |
| | |
* Unaudited The accompanying notes are an integral part of these financial statements.
70
This page left blank intentionally.
71
| Financial highlights | (For a common share outstanding throughout the period) | | | | | | | | | |
|
| |
| INVESTMENT OPERATIONS: | | | | LESS DISTRIBUTIONS: | | | | | RATIOS AND SUPPLEMENTAL DATA: | |
|
| | | | Net | | | | | | | Total | | Ratio of net | |
| | Net asset | | realized and | Total | From | | | | Net asset | return | Net | Ratio of | investment | |
| | value, | Net | unrealized | from | net | From | | | value, | at net | assets, | expenses to | income | Portfolio |
| | beginning | investment | gain (loss) on | investment | investment | return of | Total | Redemption | end | asset | end of period | average net | to average | turnover |
| Period ended | of period | income(a) | investments | operations | income | capital | distributions | fees | of period | value (%)(b) | (in thousands) | assets (%)(c) | net assets (%) | (%) |
| |
| CLASS A | | | | | | | | | | | | | | |
| April 30, 2006** | $6.73 | .14(d,e) | (.12) | .02 | (.14) | — | (.14) | —(f ) | $6.61 | .26* | $807,878 | .46*(d,e) | 2.12*(d,e) | 126.59*(g) |
| October 31, 2005 | 6.87 | .23(d) | (.16) | .07 | (.21) | — | (.21) | —(f ) | 6.73 | 1.05 | 872,931 | .98(d) | 3.42(d) | 300.04(g) |
| October 31, 2004 | 6.69 | .19(d) | .19 | .38 | (.20) | — | (.20) | —(f ) | 6.87 | 5.70 | 985,939 | .99(d) | 2.83(d) | 441.06 |
| October 31, 2003 | 6.59 | .24 | .11 | .35 | (.25) | — | (.25) | — | 6.69 | 5.45 | 1,279,779 | .93 | 3.64 | 251.00(h) |
| October 31, 2002 | 6.69 | .32 | (.07) | .25 | (.35) | — | (.35) | — | 6.59 | 3.93 | 1,339,061 | .92 | 4.84 | 268.10(h) |
| October 31, 2001 | 6.29 | .38 | .43 | .81 | (.41) | —(f ) | (.41) | — | 6.69 | 13.39 | 1,251,190 | .95 | 5.93 | 233.83(h) |
|
| |
| CLASS B | | | | | | | | | | | | | | |
| April 30, 2006** | $6.68 | .12(d,e) | (.12) | — | (.11) | — | (.11) | —(f) | $6.57 | .03* | $188,266 | .84*(d,e) | 1.75*(d,e) | 126.59*(g) |
| October 31, 2005 | 6.82 | .18(d) | (.16) | .02 | (.16) | — | (.16) | —(f ) | 6.68 | .28 | 229,794 | 1.73(d) | 2.64(d) | 300.04(g) |
| October 31, 2004 | 6.65 | .14(d) | .18 | .32 | (.15) | — | (.15) | —(f ) | 6.82 | 4.79 | 323,527 | 1.74(d) | 2.12(d) | 441.06 |
| October 31, 2003 | 6.55 | .19 | .11 | .30 | (.20) | — | (.20) | — | 6.65 | 4.68 | 520,692 | 1.68 | 2.90 | 251.00(h) |
| October 31, 2002 | 6.65 | .27 | (.07) | .20 | (.30) | — | (.30) | — | 6.55 | 3.19 | 555,668 | 1.67 | 4.07 | 268.10(h) |
| October 31, 2001 | 6.25 | .33 | .44 | .77 | (.37) | —(f ) | (.37) | — | 6.65 | 12.63 | 474,783 | 1.70 | 5.19 | 233.83(h) |
|
| |
| CLASS C | | | | | | | | | | | | | | |
| April 30, 2006** | $6.70 | .12(d,e) | (.12) | — | (.11) | — | (.11) | —(f) | $6.59 | .03* | $22,438 | .84*(d,e) | 1.75*(d,e) | 126.59*(g) |
| October 31, 2005 | 6.84 | .18(d) | (.16) | .02 | (.16) | — | (.16) | —(f ) | 6.70 | .28 | 24,644 | 1.73(d) | 2.66(d) | 300.04(g) |
| October 31, 2004 | 6.67 | .14(d) | .18 | .32 | (.15) | — | (.15) | —(f) | 6.84 | 4.79 | 29,059 | 1.74(d) | 2.10(d) | 441.06 |
| October 31, 2003 | 6.57 | .20 | .11 | .31 | (.21) | — | (.21) | — | 6.67 | 4.70 | 42,946 | 1.68 | 2.88 | 251.00(h) |
| October 31, 2002 | 6.67 | .26 | (.06) | .20 | (.30) | — | (.30) | — | 6.57 | 3.18 | 39,017 | 1.67 | 4.04 | 268.10(h) |
| October 31, 2001 | 6.27 | .32 | .45 | .77 | (.37) | —(f ) | (.37) | — | 6.67 | 12.61 | 34,545 | 1.70 | 5.03 | 233.83(h) |
|
| |
| CLASS M | | | | | | | | | | | | | | |
| April 30, 2006** | $6.66 | .13(d,e) | (.12) | .01 | (.13) | — | (.13) | —(f) | $6.54 | .15* | $370,972 | .59*(d,e) | 2.00*(d,e) | 126.59*(g) |
| October 31, 2005 | 6.80 | .21(d) | (.15) | .06 | (.20) | — | (.20) | —(f ) | 6.66 | .84 | 420,886 | 1.23(d) | 3.15(d) | 300.04(g) |
| October 31, 2004 | 6.63 | .17(d) | .18 | .35 | (.18) | — | (.18) | —(f ) | 6.80 | 5.40 | 556,725 | 1.24(d) | 2.62(d) | 441.06 |
| October 31, 2003 | 6.54 | .23 | .10 | .33 | (.24) | — | (.24) | — | 6.63 | 5.12 | 884,380 | 1.18 | 3.48 | 251.00(h) |
| October 31, 2002 | 6.64 | .30 | (.06) | .24 | (.34) | — | (.34) | — | 6.54 | 3.77 | 1,465,393 | 1.17 | 4.56 | 268.10(h) |
| October 31, 2001 | 6.25 | .37 | .42 | .79 | (.40) | —(f) | (.40) | — | 6.64 | 13.10 | 1,024,351 | 1.20 | 5.74 | 233.83(h) |
|
| |
| CLASS R | | | | | | | | | | | | | | |
| April 30, 2006** | $6.72 | .13(d,e) | (.11) | .02 | (.13) | — | (.13) | —(f ) | $6.61 | .32* | $545 | .59*(d,e) | 1.98*(d,e) | 126.59*(g) |
| October 31, 2005 | 6.87 | .23(d) | (.18) | .05 | (.20) | — | (.20) | —(f ) | 6.72 | 0.72 | 400 | 1.23(d) | 3.29(d) | 300.04(g) |
| October 31, 2004 | 6.69 | .18(d) | .18 | .36 | (.18) | — | (.18) | —(f ) | 6.87 | 5.47 | 62 | 1.24(d) | 2.57(d) | 441.06 |
| October 31, 2003† | 6.65 | .18 | .03 | .21 | (.17) | — | (.17) | — | 6.69 | 3.14* | 1 | .92* | 2.65* | 251.00(h) |
|
| |
| CLASS Y | | | | | | | | | | | | | | |
| April 30, 2006** | $6.77 | .15(d,e) | (.11) | .04 | (.15) | — | (.15) | —(f ) | $6.66 | .51* | $1,145,426 | .34*(d,e) | 2.24*(d,e) | 126.59*(g) |
| October 31, 2005 | 6.91 | .25(d) | (.16) | .09 | (.23) | — | (.23) | —(f ) | 6.77 | 1.28 | 1,029,647 | .73(d) | 3.69(d) | 300.04(g) |
| October 31, 2004 | 6.72 | .21(d) | .19 | .40 | (.21) | — | (.21) | —(f ) | 6.91 | 6.06 | 880,124 | .74(d) | 3.01(d) | 441.06 |
| October 31, 2003 | 6.63 | .26 | .10 | .36 | (.27) | — | (.27) | — | 6.72 | 5.50 | 712,232 | .68 | 3.82 | 251.00(h) |
| October 31, 2002 | 6.72 | .33 | (.06) | .27 | (.36) | — | (.36) | — | 6.63 | 4.26 | 530,302 | .67 | 5.03 | 268.10(h) |
| October 31, 2001 | 6.31 | .39 | .45 | .84 | (.43) | —(f) | (.43) | — | 6.72 | 13.73 | 234,826 | .70 | 6.23 | 233.83(h) |
|
| |
| |
| See notes to financial highlights at the end of this section. | | | | | | | | | | | | |
| |
| |
| The accompanying notes are an integral part of these financial statements. | | | | | | | | | | | |
Financial highlights (Continued)
* Not annualized.
** Unaudited.
† For the period January 21, 2003 (commencement of operations) to October 31, 2003.
(a) Per share net investment income has been determined on the basis of the weighted average number of shares outstanding during the period.
(b) Total return assumes dividend reinvestment and does not reflect the effect of sales charges.
(c) Includes amounts paid through expense offset arrangements (Note 2).
(d) Reflects an involuntary contractual expense limitation and waivers of certain fund expenses in connection with investments in Putnam Prime Market Fund during the period. As a result of such limitation and waivers, the expenses of each class, as a percentage of its net assets, reflect a reduction of the following amounts (Notes 2 and 5):
| | 4/30/06 | 10/31/05 | 10/31/04 |
|
| Class A | 0.02% | 0.03% | <0.01% |
|
| Class B | 0.02 | 0.03 | <0.01 |
|
| Class C | 0.02 | 0.03 | <0.01 |
|
| Class M | 0.02 | 0.03 | <0.01 |
|
| Class R | 0.02 | 0.03 | <0.01 |
|
| Class Y | 0.02 | 0.03 | <0.01 |
|
(e) Reflects a non-recurring accrual related to a reimbursement to the fund from Putnam Investments relating to the calculation of certain amounts paid by the fund to Putnam in previous years for transfer agent services, which amounted to less than $0.01 per share and 0.02% of average net assets for the period ended April 30, 2006 (Note 6).
(f) Amount represents less than $0.01 per share.
(g) Portfolio turnover excludes dollar roll transactions.
(h) Portfolio turnover excludes certain treasury note transactions executed in connection with a short-term trading strategy.
The accompanying notes are an integral part of these financial statements.
74
Notes to financial statements 4/30/06 (Unaudited)
Note 1: Significant accounting policies
Putnam Income Fund (the “fund”), a Massachusetts business trust, is registered under the Investment Company Act of 1940, as amended, as a diversi-fied, open-end management investment company. The fund seeks high current income consistent with what Putnam Investment Management, LLC (“Putnam Management”), the fund’s manager, an indirect wholly-owned subsidiary of Putnam, LLC, believes to be prudent risk. The fund invests in a portfolio of debt securities composed mainly of corporate bonds, government obligations and securitized fixed-income securities, and may invest in preferred stocks and common stocks.
The fund offers class A, class B, class C, class M, class R and class Y shares. Class A and class M shares are sold with a maximum front-end sales charge of 3.75% and 3.25%, respectively, and generally do not pay a contingent deferred sales charge. Class B shares, which convert to class A shares after approximately eight years, do not pay a front-end sales charge and are subject to a contingent deferred sales charge, if those shares are redeemed within six years of purchase.
Class C shares have a one-year 1.00% contingent deferred sales charge and do not convert to class A shares. Class R shares, which are offered to qual-ified employee-benefit plans are sold without a front-end sales charge or a contingent deferred sales charge. The expenses for class A, class B, class C, class M and class R shares may differ based on the distribution fee of each class, which is identified in Note 2. Class Y shares, which are sold at net asset value, are generally subject to the same expenses as class A, class B, class C, class M and class R shares, but do not bear a distribution fee. Class Y shares are sold to certain eligible purchasers including certain defined contribution plans (including corporate IRAs), bank trust departments, trust companies, other Putnam funds and products, and certain college savings plans.
A 2.00% redemption fee may apply to any shares that are redeemed (either by selling or exchanging into another fund) within 5 days of purchase. The redemption fee is accounted for as an addition to paid-in-capital.
Investment income, realized and unrealized gains and losses and expenses of the fund are borne pro-rata based on the relative net assets of each class to the total net assets of the fund, except that each class bears expenses unique to that class (including the distribution fees applicable to such classes). Each class votes as a class only with respect to its own distribution plan or other matters on which a class vote is required by law or determined by the Trustees. Shares of each class would receive their pro-rata share of the net assets of the fund, if the fund were liquidated. In addition, the Trustees declare separate dividends on each class of shares.
In the normal course of business, the fund enters into contracts that may include agreements to indemnify another party under given circumstances. The fund’s maximum exposure under these arrangements is unknown as this would involve future claims that may be, but have not yet been, made against the fund. However, the fund expects the risk of material loss to be remote.
The following is a summary of significant accounting policies consistently followed by the fund in the preparation of its financial statements. The preparation of financial statements is in conformity with accounting principles generally accepted in the United States of America and requires management to make estimates and assumptions that affect the reported amounts of assets and liabilities in the financial statements and the reported amounts of increases and decreases in net assets from operations during the reporting period. Actual results could differ from those estimates.
A) Security valuation Market quotations are not considered to be readily available for certain debt obligations; such investments are valued on the basis of valuations furnished by an independent pricing service approved by the Trustees or dealers selected by Putnam Management. Such services or dealers determine valuations for normal institutional-size trading units of such securities
75
using methods based on market transactions for comparable securities and various relationships, generally recognized by institutional traders, between securities. Securities quoted in foreign currencies, if any, are translated into U.S. dollars at the current exchange rate. Other investments, including certain restricted securities, are valued at fair value following procedures approved by the Trustees. Such valuations and procedures are reviewed periodically by the Trustees.
B) Joint trading account Pursuant to an exemptive order from the Securities and Exchange Commission, the fund may transfer uninvested cash balances, including cash collateral received under security lending arrangements, into a joint trading account along with the cash of other registered investment companies and certain other accounts managed by Putnam Management. These balances may be invested in issues of high-grade short-term investments having maturities of up to 397 days for collateral received under security lending arrangements and up to 90 days for other cash investments.
C) Repurchase agreements The fund, or any joint trading account, through its custodian, receives delivery of the underlying securities, the market value of which at the time of purchase is required to be in an amount at least equal to the resale price, including accrued interest. Collateral for certain tri-party repurchase agreements is held at the counterparty’s custodian in a segregated account for the benefit of the fund and the counterparty. Putnam Management is responsible for determining that the value of these underlying securities is at all times at least equal to the resale price, including accrued interest.
D) Security transactions and related investment income Security transactions are recorded on the trade date (the date the order to buy or sell is executed). Gains or losses on securities sold are determined on the identified cost basis. Interest income is recorded on the accrual basis.
All premiums/discounts are amortized/accreted on a yield-to-maturity basis.
Securities purchased or sold on a forward commitment or delayed delivery basis may be settled a month or more after the trade date; interest income is accrued based on the terms of the securities. Losses may arise due to changes in the market value of the underlying securities or if the counterparty does not perform under the contract.
E) Stripped mortgage-backed securities The fund may invest in stripped mortgage-backed securities which represent a participation in mortgage loans and may be structured in classes with rights to receive different portions of the interest and principal. Interest-only securities receive all of the interest and principal-only securities receive all of the principal. If the interest-only securities experience greater than anticipated prepayments of principal, the fund may fail to recoup fully its initial investment in these securities. Conversely, principal-only securities increase in value if prepayments are greater than anticipated and decline if prepayments are slower than anticipated. The market value of these securities is highly sensitive to changes in interest rates.
F) Futures and options contracts The fund may use futures and options contracts to hedge against changes in the values of securities the fund owns or expects to purchase, or for other investment purposes. The fund may also write options on swaps or securities it owns or in which it may invest to increase its current returns.
The potential risk to the fund is that the change in value of futures and options contracts may not correspond to the change in value of the hedged instruments. In addition, losses may arise from changes in the value of the underlying instruments, if there is an illiquid secondary market for the contracts, or if the counterparty to the
76
contract is unable to perform. Risks may exceed amounts recognized on the statement of assets and liabilities. When the contract is closed, the fund records a realized gain or loss equal to the difference between the value of the contract at the time it was opened and the value at the time it was closed. Realized gains and losses on purchased options are included in realized gains and losses on investment securities. If a written call option is exercised, the premium originally received is recorded as an addition to sales proceeds. If a written put option is exercised, the premium originally received is recorded as a reduction to the cost of investments.
Futures contracts are valued at the quoted daily settlement prices established by the exchange on which they trade. The fund and the broker agree to exchange an amount of cash equal to the daily fluctuation in the value of the futures contract. Such receipts or payments are known as “variation margin.” Exchange traded options are valued at the last sale price or, if no sales are reported, the last bid price for purchased options and the last ask price for written options. Options traded over-the-counter are valued using prices supplied by dealers. Futures and written option contracts outstanding at period end, if any, are listed after the fund’s portfolio.
G) Total return swap contracts The fund may enter into total return swap contracts, which are arrangements to exchange a market linked return for a periodic payment, both based on a notional principal amount. To the extent that the total return of the security, index or other financial measure underlying the transaction exceeds or falls short of the offsetting interest rate obligation, the fund will receive a payment from or make a payment to the counterparty. Total return swap contracts are marked to market daily based upon quotations from market makers and the change, if any, is recorded as unrealized gain or loss. Payments received or made are recorded as realized gains or loss. The fund could be exposed to credit or market risk due to unfavorable changes in the fluctuation of interest rates or in the price of the underlying security or index, the possibility that there is no liquid market for these agreements or that the counterparty may default on its obligation to perform. Risk of loss may exceed amounts recognized on the statement of assets and liabilities. Total return swap contracts outstanding at period end, if any, are listed after the fund’s portfolio.
H) Interest rate swap contracts The fund may enter into interest rate swap contracts, which are arrangements between two parties to exchange cash flows based on a notional principal amount, to manage the fund’s exposure to interest rates. Interest rate swap contracts are marked to market daily based upon quotations from an independent pricing service or market makers and the change, if any, is recorded as unrealized gain or loss. Payments received or made are recorded as realized gains or loss. The fund could be exposed to credit or market risk due to unfavorable changes in the fluctuation of interest rates or if the counterparty defaults on its obligation to perform. Risk of loss may exceed amounts recognized on the statement of assets and liabilities. Interest rate swap contracts outstanding at period end, if any, are listed after the fund’s portfolio.
I) Credit default contracts The fund may enter into credit default contracts where one party, the protection buyer, makes an upfront or periodic payment to a counter party, the protection seller, in exchange for the right to receive a contingent payment. The maximum amount of the payment may equal the notional amount, at par, of the underlying index or security as a result of a related credit event. An upfront payment received by the fund, as the protection seller, is recorded as a liability on the fund’s books. An upfront payment made by the fund, as the protection buyer, is recorded as an asset on the fund’s books. Periodic payments received or paid by the fund are recorded as realized gains or losses. The credit default contracts are marked to market daily based upon quotations from an independent pricing service or market makers and the change, if any, is recorded as unrealized gain or loss.
77
Payments received or made as a result of a credit event or termination of the contract are recognized, net of a proportional amount of the upfront payment, as realized gains or losses. In addition to bearing the risk that the credit event will occur, the fund could be exposed to market risk due to unfavorable changes in interest rates or in the price of the underlying security or index, the possibility that the fund may be unable to close out its position at the same time or at the same price as if it had purchased comparable publicly traded securities or that the counterparty may default on its obligation to perform. Risks of loss may exceed amounts recognized on the statement of assets and liabilities. Credit default contracts outstanding at period end, if any, are listed after the fund’s portfolio.
J) TBA purchase commitments The fund may enter into “TBA” (to be announced) commitments to purchase securities for a fixed unit price at a future date beyond customary settlement time. Although the unit price has been established, the principal value has not been finalized. However, the amount of the commitments will not significantly differ from the principal amount. The fund holds, and maintains until settlement date, cash or high-grade debt obligations in an amount sufficient to meet the purchase price, or the fund may enter into offsetting contracts for the forward sale of other securities it owns. Income on the securities will not be earned until settlement date. TBA purchase commitments may be considered securities themselves, and involve a risk of loss if the value of the security to be purchased declines prior to the settlement date, which risk is in addition to the risk of decline in the value of the fund’s other assets. Unsettled TBA purchase commitments are valued at fair value of the underlying securities, according to the procedures described under “Security valuation” above. The contract is “marked-to-market” daily and the change in market value is recorded by the fund as an unrealized gain or loss.
Although the fund will generally enter into TBA purchase commitments with the intention of acquiring securities for its portfolio or for delivery pursuant to options contracts it has entered into, the fund may dispose of a commitment prior to settlement if Putnam Management deems it appropriate to do so.
K) TBA sale commitments The fund may enter into TBA sale commitments to hedge its portfolio positions or to sell mortgage-backed securities it owns under delayed delivery arrangements. Proceeds of TBA sale commitments are not received until the contractual settlement date. During the time a TBA sale commitment is outstanding, equivalent deliverable securities or an offsetting TBA purchase commitment deliverable on or before the sale commitment date, are held as “cover” for the transaction.
Unsettled TBA sale commitments are valued at fair value of the underlying securities, generally according to the procedures described under “Security valuation” above. The contract is “marked-to-market” daily and the change in market value is recorded by the fund as an unrealized gain or loss. If the TBA sale commitment is closed through the acquisition of an offsetting purchase commitment, the fund realizes a gain or loss. If the fund delivers securities under the commitment, the fund realizes a gain or a loss from the sale of the securities based upon the unit price established at the date the commitment was entered into. TBA sale commitments outstanding at period end, if any, are listed after the fund’s portfolio.
L) Dollar rolls To enhance returns, the fund may enter into dollar rolls (principally using TBAs) in which the fund sells securities for delivery in the current month and simultaneously contracts to purchase similar securities on a specified future date. During the period between the sale and subsequent purchase, the fund will not be entitled to receive income and principal payments on the securities sold. The fund will, however, retain the difference between the initial sales price and the forward price for the future purchase. The fund will also be able to earn interest on the cash proceeds that are received from the initial sale.
78
The fund may be exposed to market or credit risk if the price of the security changes unfavorably or the counterparty fails to perform under the terms of the agreement.
M) Security lending The fund may lend securities, through its agents, to qualified borrowers in order to earn additional income. The loans are collateralized by cash and/or securities in an amount at least equal to the market value of the securities loaned. The market value of securities loaned is determined daily and any additional required collateral is allocated to the fund on the next business day. The risk of borrower default will be borne by the fund’s agents; the fund will bear the risk of loss with respect to the investment of the cash collateral. Income from securities lending is included in investment income on the statement of operations. At April 30, 2006, the value of securities loaned amounted to $5,045,993. The fund received cash collateral of $5,174,020 which is pooled with collateral of other Putnam funds into 31 issues of high grade short-term investments.
N) Federal taxes It is the policy of the fund to distribute all of its taxable income within the prescribed time and otherwise comply with the provisions of the Internal Revenue Code of 1986 (the “Code”) applicable to regulated investment companies. It is also the intention of the fund to distribute an amount sufficient to avoid imposition of any excise tax under Section 4982 of the Code, as amended. Therefore, no provision has been made for federal taxes on income, capital gains or unrealized appreciation on securities held nor for excise tax on income and capital gains.
At October 31, 2005, the fund had a capital loss carryover of $106,146,176 available to the extent allowed by the Code to offset future net capital gain, if any. The amount of the carryover and the expiration dates are:
| Loss Carryover | Expiration |
| $81,110,898 | October 31, 2008 |
|
| 9,580,324 | October 31, 2009 |
|
| 15,454,954 | October 31, 2013 |
|
The aggregate identified cost on a tax basis is $3,338,128,337, resulting in gross unrealized appreciation and depreciation of $11,453,091 and $89,153,553, respectively, or net unrealized depreciation of $77,700,462.
O) Distributions to shareholders Distributions to shareholders from net investment income are recorded by the fund on the ex-dividend date. Distributions from capital gains, if any, are recorded on the ex-dividend date and paid at least annually. The amount and character of income and gains to be distributed are determined in accordance with income tax regulations, which may differ from generally accepted accounting principles. Dividend sources are estimated at the time of declaration. Actual results may vary. Any non-taxable return of capital cannot be determined until final tax calculations are completed after the end of the fund’s fiscal year. Reclassifications are made to the fund’s capital accounts to reflect income and gains available for distribution (or available capital loss carryovers) under income tax regulations.
Note 2: Management fee, administrative
services and other transactions
Putnam Management is paid for management and investment advisory services quarterly based on the average net assets of the fund. Such fee is based on the following annual rates: 0.65% of the first $500 million of average net assets, 0.55% of the next $500 million, 0.50% of the next $500 million, 0.45% of the next $5 billion, 0.425% of the next $5 billion, 0.405% of the next $5 billion, 0.39% of the next $5 billion and 0.38% thereafter.
Putnam Management has agreed to waive fees and reimburse expenses of the fund through October 31, 2006, to the extent necessary to ensure that the fund’s expenses do not exceed the simple average of the expenses of all front-end load funds viewed by Lipper Inc. as having the same investment classification or objective as the fund. The expense reimbursement is based on a comparison of the fund’s expenses with the average annualized
79
operating expenses of the funds in its Lipper peer group for each calendar quarter during the fund’s last fiscal year, excluding 12b-1 fees and without giving effect to any expense offset and brokerage service arrangements that may reduce fund expenses. For the period April 30, 2006, Putnam Management waived $197,212 of its management fee from the fund.
For the period ended April 30, 2006, Putnam Management has assumed $17,208 of legal, shareholder servicing and communication, audit and Trustee fees incurred by the fund in connection with certain legal and regulatory matters (including those described in Note 6).
The fund reimburses Putnam Management an allocated amount for the compensation and related expenses of certain officers of the fund and their staff who provide administrative services to the fund. The aggregate amount of all such reimbursements is determined annually by the Trustees.
Custodial functions for the fund’s assets are provided by Putnam Fiduciary Trust Company (“PFTC”), a subsidiary of Putnam, LLC. PFTC receives fees for custody services based on the fund’s asset level, the number of its security holdings and transaction volumes. Putnam Investor Services, a division of PFTC, provides investor servicing agent functions to the fund. Putnam Investor Services receives fees for investor servicing based on the number of shareholder accounts in the fund and the level of defined contribution plan assets in the fund. During the period ended April 30, 2006, the fund incurred $2,875,141 for these services.
The fund has entered into an arrangement with PFTC whereby credits realized as a result of uninvested cash balances are used to reduce a portion of the fund’s expenses. For the six months ended April 30, 2006, the fund’s expenses were reduced by $254,592 under these arrangements.
Each independent Trustee of the fund receives an annual Trustee fee, of which $720, as a quarterly retainer, has been allocated to the fund, and an additional fee for each Trustees meeting attended.
Trustees receive additional fees for attendance at certain committee meetings, industry seminars and for certain compliance-related matters. Trustees also are reimbursed for expenses they incur relating to their services as Trustees. George Putnam, III, who is not an independent Trustee, also receives the foregoing fees for his services as Trustee. The fund has adopted a Trustee Fee Deferral Plan (the “Deferral Plan”) which allows the Trustees to defer the receipt of all or a portion of Trustees fees payable on or after July 1, 1995. The deferred fees remain invested in certain Putnam funds until distribution in accordance with the Deferral Plan.
The fund has adopted an unfunded noncontributory defined benefit pension plan (the “Pension Plan”) covering all Trustees of the fund who have served as a Trustee for at least five years and were first elected prior to 2004. Benefits under the Pension Plan are equal to 50% of the Trustee’s average annual attendance and retainer fees for the three years ended December 31, 2005. Pension expense for the fund is included in Trustee compensation and expenses in the statement of operations. Accrued pension liability is included in Payable for Trustee compensation and expenses in the statement of assets and liabilities. The Trustees have terminated the Pension Plan with respect to any Trustee first elected after 2003.
The fund has adopted distribution plans (the “Plans”) with respect to its class A, class B, class C, class M and class R shares pursuant to Rule 12b-1 under the Investment Company Act of 1940. The purpose of the Plans is to compensate Putnam Retail Management, a wholly-owned subsidiary of Putnam, LLC and Putnam Retail Management GP, Inc., for services provided and expenses incurred in distributing shares of the fund. The Plans provide for payments by the fund to Putnam Retail Management at an annual rate of up to 0.35%, 1.00%, 1.00%, 1.00% and 1.00% of the average net assets attributable to class A, class B, class C, class M and class R shares, respectively. The Trustees have approved payment by the fund at an annual rate of 0.25%, 1.00%, 1.00%, 0.50% and 0.50% of the average net assets attributable
80
to class A, class B, class C, class M and class R shares, respectively.
For the six months ended April 30, 2006, Putnam Retail Management, acting as underwriter, received net commissions of $33,561 and $1,087 from the sale of class A and class M shares, respectively, and received $173,185 and $1,173 in contingent deferred sales charges from redemptions of class B and class C shares, respectively. A deferred sales charge of up to 1.00% and 0.40% is assessed on certain redemptions of class A and class M shares, respectively. For the six months ended April 30, 2006, Putnam Retail Management, acting as underwriter, received $12,643 and no monies on class A and class M redemptions, respectively.
Note 3: Purchases and sales of securities
During the six months ended April 30, 2006, cost of purchases and proceeds from sales of investment securities other than U.S. government securities and short-term investments aggregated $2,365,563,471 and $2,870,826,344, respectively. Purchases and sales of U.S. government securities aggregated $23,017,222 and $19,118,103, respectively. Written option transactions during the period ended April 30, 2006, are summarized as follows:
| | Contract | Premiums |
| | Amounts | Received |
|
| Written options | | |
| outstanding at | | |
| beginning of period | 227,060,000 | $ 8,781,546 |
|
| Options opened | 111,116,000 | 3,694,710 |
| Options exercised | — | — |
| Options expired | — | — |
| Options closed | (10,300,000) | (324,450) |
|
| Written options | | |
| outstanding at | | |
| end of period | 327,876,000 | $12,151,806 |
Note 4: Capital shares
At April 30, 2006, there was an unlimited number of shares of beneficial interest authorized. Transactions in capital shares were as follows:
| CLASS A | Shares | | Amount |
| Six months ended 4/30/06: | | |
| Shares sold | 9,976,455 | $ | 66,997,526 |
|
| Shares issued | | | |
| in connection | | | |
| with reinvestment | | | |
| of distributions | 2,215,951 | | 14,869,487 |
|
| | 12,192,406 | | 81,867,013 |
|
| Shares | | | |
| repurchased | (19,801,736) | | (132,941,773) |
|
| Net decrease | (7,609,330) | $ | (51,074,760) |
| |
| Year ended 10/31/05: | | |
| Shares sold | 28,549,022 | $ | 195,259,865 |
|
| Shares issued | | | |
| in connection | | | |
| with reinvestment | | | |
| of distributions | 3,607,625 | | 24,625,810 |
|
| | 32,156,647 | | 219,885,675 |
|
| Shares | | | |
| repurchased | (45,988,258) | | (314,498,488) |
|
| Net decrease | (13,831,611) | $ | (94,612,813) |
|
| |
| CLASS B | Shares | | Amount |
| Six months ended 4/30/06: | | |
| Shares sold | 1,158,503 | $ | 7,735,449 |
|
| Shares issued | | | |
| in connection | | | |
| with reinvestment | | | |
| of distributions | 467,248 | | 3,117,213 |
|
| | 1,625,751 | | 10,852,662 |
|
| Shares | | | |
| repurchased | (7,353,172) | | (49,053,949) |
|
| Net decrease | (5,727,421) | $ | (38,201,287) |
| |
| Year ended 10/31/05: | | |
| Shares sold | 3,215,026 | $ | 21,861,360 |
|
| Shares issued | | | |
| in connection | | | |
| with reinvestment | | | |
| of distributions | 810,070 | | 5,496,954 |
|
| | 4,025,096 | | 27,358,314 |
|
| Shares | | | |
| repurchased | (17,067,474) | | (115,938,880) |
|
| Net decrease | (13,042,378) | $ | (88,580,566) |
81
| CLASS C | Shares | Amount |
| Six months ended 4/30/06: | |
| Shares sold | 406,090 | $ 2,723,395 |
|
| Shares issued | | |
| in connection | | |
| with reinvestment | | |
| of distributions | 49,180 | 329,070 |
|
| | 455,270 | 3,052,465 |
|
| Shares | | |
| repurchased | (726,745) | (4,869,622) |
|
| Net decrease | (271,475) | $(1,817,157) |
| |
| Year ended 10/31/05: | |
| Shares sold | 672,677 | $ 4,585,391 |
|
| Shares issued | | |
| in connection | | |
| with reinvestment | | |
| of distributions | 73,906 | 502,858 |
|
| | 746,583 | 5,088,249 |
|
| Shares | | |
| repurchased | (1,317,468) | (8,972,166) |
|
| Net decrease | (570,885) | $(3,883,917) |
|
| |
| CLASS M | Shares | Amount |
| Six months ended 4/30/06: | |
| Shares sold | 167,455 | $ 1,113,513 |
|
| Shares issued | | |
| in connection | | |
| with reinvestment | | |
| of distributions | 41,637 | 276,562 |
|
| | 209,092 | 1,390,075 |
|
| Shares | | |
| repurchased | (6,728,638) | (44,667,308) |
|
| Net decrease | (6,519,546) | $ (43,277,233) |
| |
| Year ended 10/31/05: | |
| Shares sold | 1,021,945 | $ 6,911,699 |
|
| Shares issued | | |
| in connection | | |
| with reinvestment | | |
| of distributions | 73,581 | 497,166 |
|
| | 1,095,526 | 7,408,865 |
|
| Shares | | |
| repurchased | (19,762,113) | (133,762,035) |
|
| Net decrease | (18,666,587) | $(126,353,170) |
| CLASS R | Shares | Amount |
| Six months ended 4/30/06: | |
| Shares sold | 30,821 | $ 206,842 |
|
| Shares issued | | |
| in connection | | |
| with reinvestment | | |
| of distributions | 1,352 | 9,061 |
|
| | 32,173 | 215,903 |
|
| Shares | | |
| repurchased | (9,225) | (61,783) |
|
| Net increase | 22,948 | $ 154,120 |
| |
| Year ended 10/31/05: | |
| Shares sold | 63,879 | $ 436,963 |
|
| Shares issued | | |
| in connection | | |
| with reinvestment | | |
| of distributions | 1,331 | 9,087 |
|
| | 65,210 | 446,050 |
|
| Shares | | |
| repurchased | (14,732) | (100,565) |
|
| Net increase | 50,478 | $ 345,485 |
|
| |
| CLASS Y | Shares | Amount |
| Six months ended 4/30/06: | |
| Shares sold | 33,546,264 | $ 226,567,259 |
|
| Shares issued | | |
| in connection | | |
| with reinvestment | | |
| of distributions | 3,430,055 | 23,149,904 |
|
| | 36,976,319 | 249,717,163 |
|
| Shares | | |
| repurchased | (17,030,204) | (115,269,852) |
|
| Net increase | 19,946,115 | $ 134,447,311 |
| |
| Year ended 10/31/05: | |
| Shares sold | 58,704,093 | $ 403,381,794 |
|
| Shares issued | | |
| in connection | | |
| with reinvestment | | |
| of distributions | 4,658,864 | 31,990,509 |
|
| | 63,362,957 | 435,372,303 |
|
| Shares | | |
| repurchased | (38,682,139) | (266,051,830) |
|
| Net increase | 24,680,818 | $ 169,320,473 |
82
Note 5: Investment in Putnam Prime Money Market Fund
Pursuant to an exemptive order from the Securities and Exchange Commission, the fund invests in Putnam Prime Money Market Fund, an open-end management investment company managed by Putnam Management. Management fees paid by the fund are reduced by an amount equal to the management and administrative services fees paid by Putnam Prime Money Market Fund with respect to assets invested by the fund in Putnam Prime Money Market Fund. For the period ended April 30, 2006, management fees paid were reduced by $238,686 relating to the fund’s investment in Putnam Prime Money Market Fund. Income distributions earned by the fund are recorded as income in the statement of operations and totaled $9,281,642 for the period April 30, 2006. During the period ended April 30, 2006, cost of purchases and cost of sales of investments in Putnam Prime Money Market Fund aggregated $686,893,015 and $423,726,938, respectively.
Note 6: Regulatory matters and litigation
Putnam Management has entered into agreements with the Securities and Exchange Commission and the Massachusetts Securities Division settling charges connected with excessive short-term trading by Putnam employees and, in the case of the charges brought by the Massachusetts Securities Division, by participants in some Putnam-administered 401(k) plans. Pursuant to these settlement agreements, Putnam Management will pay a total of $193.5 million in penalties and restitution, with $153.5 million being paid to certain open-end funds and their shareholders. The amount will be allocated to shareholders and funds pursuant to a plan developed by an independent consultant, and will be paid following approval of the plan by the SEC and the Massachusetts Securities Division.
The Securities and Exchange Commission’s and Massachusetts Securities Division’s allegations and related matters also serve as the general basis for numerous lawsuits, including purported class action lawsuits filed against Putnam Management and certain related parties, including certain Putnam funds. Putnam Management will bear any costs incurred by Putnam funds in connection with these lawsuits. Putnam Management believes that the likelihood that the pending private lawsuits and purported class action lawsuits will have a material adverse financial impact on the fund is remote, and the pending actions are not likely to materially affect its ability to provide investment management services to its clients, including the Putnam funds.
In March 2006, the fund received $634,508 from Putnam to address issues relating to the calculation of certain amounts paid by the Putnam mutual funds to Putnam for transfer agent services. This amount is included in Fees waived and reimbursed by Manager or affiliate on the Statement of operations. Review of this matter is ongoing and the amount received by the fund may be adjusted in the future. Such adjustment is not expected to be material.
Putnam Management and Putnam Retail Management are named as defendants in a civil suit in which the plaintiffs allege that the management and distribution fees paid by certain Putnam funds were excessive and seek recovery under the Investment Company Act of 1940. Putnam Management and Putnam Retail Management have contested the plaintiffs’ claims and the matter is currently pending in the U.S. District Court for the District of Massachusetts. Based on currently available information, Putnam Management believes that this action is without merit and that it is unlikely to have a material effect on Putnam Management’s and Putnam Retail Management’s ability to provide services to their clients, including the fund.
83
Founded over 65 years ago, Putnam Investments was built around the concept that a balance between risk and reward is the hallmark of a well-rounded financial program. We manage over 100 mutual funds in growth, value, blend, fixed income, and international.
| Investment Manager | Officers | Francis J. McNamara, III |
| Putnam Investment | George Putnam, III | Vice President and |
| Management, LLC | President | Chief Legal Officer |
| One Post Office Square | | |
| Boston, MA 02109 | Charles E. Porter | Charles A. Ruys de Perez |
| Executive Vice President, | Vice President and |
| Marketing Services | Associate Treasurer and | Chief Compliance Officer |
| One Post Office Square | Principal Executive Officer | |
| Boston, MA 02109 | | Mark C. Trenchard |
| Jonathan S. Horwitz | Vice President and |
| Custodian | Senior Vice President | BSA Compliance Officer |
| Putnam Fiduciary | and Treasurer | |
| Trust Company | | Judith Cohen |
| Steven D. Krichmar | Vice President, Clerk and |
| Legal Counsel | Vice President and | Assistant Treasurer |
| Ropes & Gray LLP | Principal Financial Officer | |
| | Wanda M. McManus |
| Trustees | Michael T. Healy | Vice President, Senior Associate |
| John A. Hill, Chairman | Assistant Treasurer and | Treasurer and Assistant Clerk |
| Jameson Adkins Baxter, | Principal Accounting Officer | |
| Vice Chairman | | Nancy E. Florek |
| Charles B. Curtis | Daniel T. Gallagher | Vice President, Assistant |
| Myra R. Drucker | Senior Vice President, | Clerk, Assistant Treasurer |
| Charles E. Haldeman, Jr. | Staff Counsel and | and Proxy Manager |
| Paul L. Joskow | Compliance Liaison | |
| Elizabeth T. Kennan | | |
| John H. Mullin, III | Beth S. Mazor | |
| George Putnam, III | Vice President | |
| W. Thomas Stephens | | |
| Richard B. Worley | James P. Pappas | |
| Vice President | |
| | |
| Richard S. Robie, III | |
| Vice President | |
This report is for the information of shareholders of Putnam Income Fund. It may also be used as sales literature when preceded or accompanied by the current prospectus, the most recent copy of Putnam’s Quarterly Performance Summary, and Putnam’s Quarterly Ranking Summary. For more recent performance, please visit www.putnam.com. Investors should carefully consider the investment objective, risks, charges, and expenses of a fund, which are described in its prospectus. For this and other information or to request a prospectus, call 1-800-225-1581 toll free. Please read the prospectus carefully before investing. The fund’s Statement of Additional Information contains additional information about the fund’s Trustees and is available without charge upon request by calling 1-800-225-1581.
84

Item 2. Code of Ethics:
Not applicable
Item 3. Audit Committee Financial Expert:
Not applicable
Item 4. Principal Accountant Fees and Services:
Not applicable
Item 5. Audit Committee of Listed Registrants
Not applicable
Item 6. Schedule of Investments:
The registrant’s schedule of investments in unaffiliated issuers is included in the report to shareholders in Item 1 above.
Item 7. Disclosure of Proxy Voting Policies and Procedures For Closed-End Management
Investment Companies:
|
Not applicable
Item 8. Portfolio Managers of Closed-End Investment Companies
Not Applicable
Item 9. Purchases of Equity Securities by Closed-End Management Investment Companies and
Affiliated Purchasers:
|
Not applicable
Item 10. Submission of Matters to a Vote of Security Holders:
Not applicable
Item 11. Controls and Procedures:
(a) The registrant's principal executive officer and principal financial officer have concluded, based on their evaluation of the effectiveness of the design and operation of the registrant's disclosure controls and procedures as of a date within 90 days of the filing date of this report, that the design and operation of such procedures are generally effective to provide reasonable assurance that information required to be disclosed by the registrant in this report is recorded, processed, summarized and reported within the time periods specified in the Commission's rules and forms.
(b) Changes in internal control over financial reporting: Not applicable
Item 12. Exhibits:
(a)(1) Not applicable
(a)(2) Separate certifications for the principal executive officer and principal financial officer of the registrant as required by Rule 30a-2(a) under the Investment Company Act of 1940, as amended, are filed herewith.
(b) The certifications required by Rule 30a-2(b) under the Investment Company Act of 1940, as amended, are filed herewith.
SIGNATURES
Pursuant to the requirements of the Securities Exchange Act of 1934 and the Investment Company Act of 1940, the registrant has duly caused this report to be signed on its behalf by the undersigned, thereunto duly authorized.
Putnam Income Fund
By (Signature and Title):
/s/Michael T. Healy
Michael T. Healy
Principal Accounting Officer
|
Date: June 28, 2006
Pursuant to the requirements of the Securities Exchange Act of 1934 and the Investment Company Act of 1940, this report has been signed below by the following persons on behalf of the registrant and in the capacities and on the dates indicated.
By (Signature and Title):
/s/Charles E. Porter
Charles E. Porter
Principal Executive Officer
|
Date: June 28, 2006
By (Signature and Title):
/s/Steven D. Krichmar
Steven D. Krichmar
Principal Financial Officer
|
Date: June 28, 2006