| | |
| UNITED STATES |
| SECURITIES AND EXCHANGE COMMISSION |
| Washington, D.C. 20549 |
| |
| FORM N-CSR |
| |
| CERTIFIED SHAREHOLDER REPORT OF REGISTERED |
| MANAGEMENT INVESTMENT COMPANIES |
| | |
| Investment Company Act file number: (811- 00653) | |
| |
| Exact name of registrant as specified in charter: Putnam Income Fund |
| |
| Address of principal executive offices: One Post Office Square, Boston, Massachusetts 02109 |
| | |
| Name and address of agent for service: | Beth S. Mazor, Vice President |
| | One Post Office Square |
| | Boston, Massachusetts 02109 |
| |
| Copy to: | John W. Gerstmayr, Esq. |
| | Ropes & Gray LLP |
| | One International Place |
| | Boston, Massachusetts 02110 |
| | |
| Registrant’s telephone number, including area code: | (617) 292-1000 |
| | | |
| Date of fiscal year end: October 31, 2008 | | |
| |
| Date of reporting period: November 1, 2007— October 31, 2008 |
Item 1. Report to Stockholders:
The following is a copy of the report transmitted to stockholders pursuant to Rule 30e-1 under the Investment Company Act of 1940:

What makes
Putnam different?
A time-honored tradition in money management
Since 1937, our values have been rooted in a profound sense of responsibility for the money entrusted to us.
A prudent approach to investing
We use a research-driven approach to seek superior investment results over time.
Funds for every investment goal
We offer a broad range of mutual funds and other financial products so investors and their financial representatives can build diversified portfolios.
A commitment to doing what’s right for investors
With a focus on investment performance, below-average expenses, and in-depth information about our funds, we put the interests of investors first and seek to set the standard for integrity and service.
Industry-leading service
We help investors, along with their financial representatives, make informed investment decisions with confidence.

In 1830, Massachusetts Supreme Judicial Court Justice Samuel Putnam established The Prudent Man Rule, a legal foundation for responsible money management.
THE PRUDENT MAN RULE
All that can be required of a trustee to invest is that he shall conduct himself faithfully and exercise a sound discretion. He is to observe how men of prudence, discretion, and intelligence manage their own affairs, not in regard to speculation, but in regard to the permanent disposition of their funds, considering the probable income, as well as the probable safety of the capital to be invested.

Putnam
Income
Fund
10 | 31 | 08
Annual Report
| |
| Message from the Trustees | 1 |
| About the fund | 2 |
| Performance and portfolio snapshots | 4 |
| Interview with your fund’s Portfolio Manager | 5 |
| Performance in depth | 8 |
| Expenses | 10 |
| Portfolio turnover | 12 |
| Risk | 12 |
| Your fund’s management | 13 |
| Terms and definitions | 14 |
| Trustee approval of management contract | 15 |
| Other information for shareholders | 18 |
| Financial statements | 19 |
| Federal tax information | 53 |
| About the Trustees | 54 |
| Officers | 57 |
Cover photograph: © Richard H. Johnson
Message from the Trustees
Dear Fellow Shareholder:
For several months now, financial markets have been experiencing significant upheaval. Coordinated responses by economic and financial authorities in the United States and overseas should restore stability in due course, but investors should not expect a reduction in volatility in the near term.
Putnam, meanwhile, is making several important changes to its equity fund lineup and portfolio teams under the leadership of its newly appointed President and Chief Executive Officer, Robert L. Reynolds. Putnam is removing product redundancies, seeking the best investment talent, bolstering equity research, fostering individual portfolio manager’s authority and accountability, and realigning compensation for managers so that only those who achieve top-quartile returns for shareholders are eligible for full bonuses.
In addition, Putnam is defining fundamental research as the cornerstone of its equity management approach, with quantitative analysts providing input to — but not driving — investment decisions. Putnam is also streamlining its range of equity funds by merging six equity funds into larger funds with similar investment objectives. In addition to removing product redundancies, these mergers are generally expected to result in lower expense ratios for shareholders.
Mr. Reynolds, who joined Putnam in July, has substantial industry experience and an outstanding record of success, including serving as Vice Chairman and Chief Operating Officer at Fidelity Investments from 2000 to 2007. Charles E. Haldeman, Jr., former President and CEO, has taken on the role of Chairman of Putnam Investment Management, LLC, the firm’s fund management company. Mr. Haldeman continues to serve as President of the Funds and as a Trustee. Mr. Reynolds also serves as a Trustee.
We would like to take this opportunity to welcome new shareholders to the fund and to thank all of our investors for your continued confidence in Putnam during these challenging times.

About the fund
Seeking high current income across a broad range of fixed-income securities

Over Putnam Income Fund’s 54-year history, the bond landscape has undergone a dramatic transformation. One third of the U.S. investment-grade sector, the fund’s primary focus, is now composed of “securitized” debt instruments, including mortgage- and asset-backed securities. The high-yield corporate bond sector, which was established in the late 1970s, has also grown significantly and is now considered a mature asset class. And outside the United States, there are new opportunities to invest in the debt of developed and emerging-market countries.
Amid this evolution of the fixed-income markets, the investment objective of Putnam Income Fund has remained constant. In a letter to Putnam shareholders in 1963, George Putnam, Jr. (who is currently Chairman Emeritus of the Trustees of the Putnam Funds), expressed it this way: “We have in mind those people who need a liberal current return…” Mr. Putnam’s choice of “current return” rather than “current income” captures the investment philosophy of the fund today: that high current income should be pursued within a total return context and that risk management is as important as yield in maintaining a high current income stream.
Successful investing in today’s global bond market requires broad expertise. Putnam’s nearly 100-member fixed-income group is divided into teams of specialists who focus on varied investment opportunities. Each team iden-tifies compelling opportunities within its area of expertise. Your fund’s managers select from among these opportunities, systematically building a diversified portfolio that carefully balances risk and return.
Mutual funds that invest in bonds are subject to certain risks, including interest-rate risk, credit risk, and inflation risk. As interest rates rise, the prices of bonds fall. Long-term bonds are more exposed to interest-rate risk than short-term bonds. Unlike bonds, bond funds have ongoing fees and expenses. Lower-rated bonds may offer higher yields in return for more risk. Mutual funds that invest in government securities are not guaranteed. Mortgage-backed securities are subject to prepayment risk. The use of derivatives involves special risks and may result in losses.
Key fixed-income
return sources
Securitized: Interest-rate cycles affect mortgage- and asset-backed securities (MBSs/ABSs). Because MBSs are the securitized cash flows of mortgages, prepayment rates are another consideration. For ABSs, managers monitor the credit quality of the underlying assets, which comprise the securitized cash flow of anything from credit card debt to manufactured housing debt.
Credit: Corporate bond performance tends to track the health of the overall economy more closely than other bonds. These bonds are less sensitive to interest-rate movements; they tend to perform well when the economy strengthens, often in spite of the higher rates that accompany stronger growth.
Government: Interest-rate levels are also a primary driver of government bond performance. Generally, bond prices decline when interest rates rise, and rise when interest rates fall. Interest rates — and bond yields — rise and fall according to investor expectations about the overall health of the economy.
Optimizing the risk/return trade-off across multiple sectors
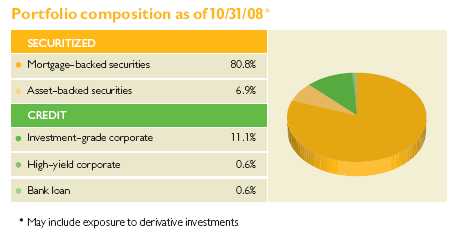
Putnam believes that building a diversified portfolio with multiple income-generating strategies is the best way to pursue your fund’s objectives. The fund’s portfolio is normally composed of a broad spectrum of government, credit, and securitized debt instruments.
Weightings are shown as a percentage of the fund’s net assets. Allocations and holdings in each sector will vary over time. For more information on current fund holdings, see pages 21–43.
Performance and portfolio snapshots
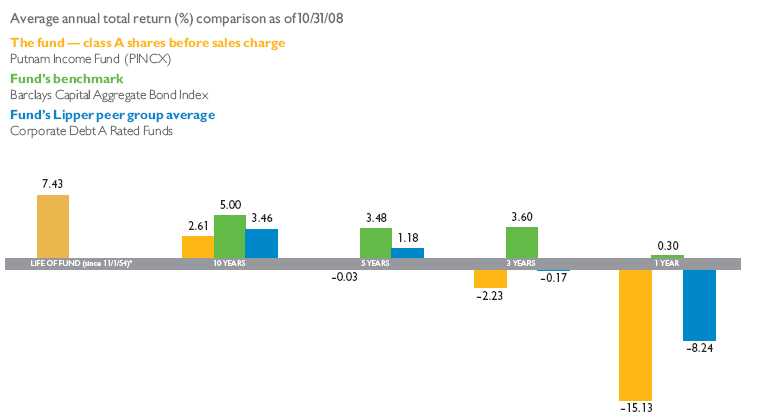
Current performance may be lower or higher than the quoted past performance, which cannot guarantee future results. Share price, principal value, and return will fluctuate, and you may have a gain or a loss when you sell your shares. Performance of class A shares assumes reinvestment of distributions and does not account for taxes. Fund returns in the bar chart do not reflect a sales charge of 4.00%; had they, returns would have been lower. See pages 5 and 8–10 for additional performance information. For a portion of the periods, this fund may have limited expenses, without which returns would have been lower. A 1% short-term trading fee may apply. To obtain the most recent month-end performance, visit www.putnam.com.
* The fund’s benchmark and Lipper category were not in existence at the time of the fund’s inception. The Barclays Capital (formerly Lehman) Aggregate Bond Index commenced 12/31/75. The Lipper category commenced 12/31/59.
“Many of the securities currently held by the fund
offer the potential for substantial returns once
the market environment stabilizes and investors
begin to capitalize on the value embedded in
them. Of course, a stable market environment
depends upon whether the measures introduced
by the Federal Reserve Board and the U.S.
Treasury are successful at solving the credit crisis.”
Rob Bloemker, Portfolio Manager, Putnam Income Fund
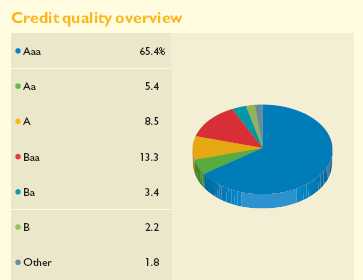
Credit qualities shown as a percentage of portfolio value as of 10/31/08. A bond rated Baa or higher (MIG3/VMIG3 or higher, for short-term debt) is considered investment grade. The chart reflects Moody’s ratings; percentages may include bonds not rated by Moody’s but considered by Putnam Management to be of comparable quality. Ratings will vary over time.
4
Interview with your
fund’s Portfolio Manager
Rob Bloemker
How did the fund perform during the past year, Rob?
It was an extremely difficult period for the fund, as it trailed its benchmark, the Barclays Capital Aggregate Bond Index, and the average for its Lipper peer group, Corporate Debt A Rated Funds. Specifically, the fund declined 15.13% at net asset value versus a 0.30% return for the Barclays index and a –8.24% result for the Lipper peer group.
How would you characterize the bond market environment over this period?
Liquidity conditions worsened significantly throughout most of the period, and market turbulence was particularly acute during the July-through-September stretch. Short-term credit markets seized up amid widespread turmoil in the financial system. U.S. Treasury bonds — considered to be the ultimate “safe” investment — outperformed all other fixed-income categories as investors generally fled from risk.
There were numerous corporate-bond defaults, particularly in the financials sector. Recognizing the increasing risk among corporate bonds generally, we maintained an underweighted position in this part of the market, and the fund avoided the defaults that occurred.
During the final two months of the period, the Federal Reserve Board [the Fed], in coordinated action with other central banks around the world, injected huge amounts of liquidity into the banking system. The goal of this action was to loosen the paralysis that had gripped short-term credit markets for many months.
Signs that these actions were beginning to bear fruit emerged at the close of the period as corporate lending rates relaxed to levels not seen since before the credit crisis. Specifically, the three-month LIBOR rate dropped to 3.03% on October 31 from well over 4% earlier in the month and continued to fall as November began. LIBOR stands for “London Interbank Offered Rate” and is the rate at which banks lend to each other on the London interbank market. LIBOR levels are important because they are a measure of banks’ confidence, and the fact that they moved lower indicated that the government’s actions were beginning to bolster this confidence.
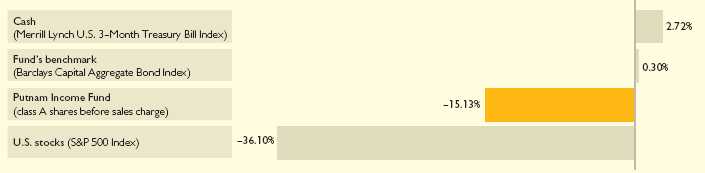
Broad market index and fund performance
This comparison shows your fund’s performance in the context of broad market indexes for the 12 months ended 10/31/08. See the previous page and pages 8–10 for additional fund performance information. Index descriptions can be found on page 14.
5
Why did the fund lag its benchmark and Lipper peer group average?
Starting in late 2007, we began to find compelling opportunities in distressed sectors of the mortgage-backed market, particularly among securitized investment vehicles such as Aaa-rated CMBS, CMBS interest-only securities [CMBS IOs], and collateralized mortgage obligations [CMOs]. We believed that securities in all of these areas were trading at attractive levels versus traditional mortgage pass-through bonds. What’s more, the CMOs we added were backed by U.S. government agencies, such as the Federal National Mortgage Association [Fannie Mae], and therefore carried Aaa credit ratings.
However, given the market upheaval that was prevalent throughout the period, investors that were experiencing increasing duress — such as many investment banks, broker/dealers, and hedge fund operators — began liquidating their Aaa-rated holdings. This selling pressure, in turn, caused yield spreads to widen and prices to decline significantly in this area of the market. Essentially, the fund underperformed because we purchased safe cash flows through predominantly Aaa-rated securities, which the market subsequently priced at much wider-than-normal yield spreads because of the liquidity disruption that was occurring. It is important to note, however, that the fund did not underperform due to defaults or realized losses.
Later in the period, we added selectively to the fund’s mortgage pass-through holdings by investing in bonds that were trading at extremely distressed levels despite their high credit quality. However, these positions also detracted from performance as yield spreads continued to widen and the prices of these bonds declined from the levels at which we had purchased them.
By way of background, mortgage pass-through bonds are collateralized by pools of similar types of mortgage loans, and those held by the fund were issued by government-sponsored enterprises [GSEs] such as Fannie Mae or Freddie Mac. With pass-throughs, the cash flows from homeowners’ mortgage payments pass through a GSE and on to the investor. CMOs usually use pools of pass-throughs, or mortgage loans themselves, as collateral but carve the cash flows into different classes to meet the needs of various investors. CMBS are mortgage securities backed by commercial, rather than residential, mortgage loans. And CMBS IOs are securities derived from the interest portion of the underlying commercial mortgages.
What was your yield curve strategy during the period, and how did it affect results?
We positioned the fund to benefit from a steeper yield curve by overweighting its allocation to short-term versus long-term bonds, which aided results. As a reminder, the yield curve is a graphical representation of the difference
Comparison of sector weightings*
This chart shows how the fund’s top sector weightings have changed over the past six months. Weightings are shown as a percentage of net assets. Holdings will vary over time.

* May include exposure to derivative investments.
6
in yields between shorter- and longer-term bonds. A steep yield curve reflects a market where short-term bond yields are substantially lower than yields on longer-term bonds. At the beginning of the period, we believed that the Fed would reduce the federal funds target rate, which is exactly what happened. The Fed cut the rate seven times during the period, lowering it from 4.5% at the beginning to 1% at the end. The Fed’s activity, combined with an overall flight to higher-quality bonds, resulted in greater demand for shorter-term Treasuries, which caused prices to rise, yields to fall, and the yield curve to become steeper. We were also concerned about escalating inflationary pressures around the world, as were many other investors. These concerns also contributed to a steeper yield curve, as demand for longer-term bonds weakened since they tend be more sensitive to inflation expectations.
What is your outlook for the economy and the fund in the coming months, Rob?
The scope and depth of the credit crisis that has weighed heavily on financial markets throughout this period is unprecedented in market history. The economic damage from this crisis has been vast, and the economy and corporate earnings likely will worsen before they improve. Consequently, I believe that there is a distinct possibility that the current recession may be severe, with major implications not only for corporate profits, but also for default rates on corporate bonds and bank loans.
That said, many of the securities currently held by the fund offer the potential for substantial returns once the market environment stabilizes and investors begin to capitalize on the value embedded in them. Of course, a stable market environment depends upon whether the measures introduced by the Fed and the Treasury are successful at solving the credit crisis. I am encouraged by the actions being taken. Moreover, I believe that these and other measures still to come should facilitate the formation and deployment of capital that will enable private investors to resume investing in CMOs, CMBS, and other mortgage-backed securities. As a result, I would urge patience and encourage investors to maintain a long-term perspective while this process is carried out. In the meantime, the fund is, in effect, being paid to wait as it continues to collect what I view to be very secure cash flows from the mortgage-backed bonds currently in the portfolio.
I N T H E N E W S
In November, the Federal Reserve Bank (the Fed) and the U.S. Treasury announced $800 billion in new lending programs to help the consumer lending and home mortgage markets. The Treasury and the Fed said they would create a $200 billion program to support the issuance of securities that are backed by car loans, student loans, credit card debt, and small-business loans. In a separate action, the Fed said it would lower mortgage rates and increase the availability of credit for the housing market by buying up to $600 billion in debt tied to home loans backed by Fannie Mae, Freddie Mac, and other government-controlled financing agencies.
Thanks again, Rob, for sharing your time and insights with us.
The views expressed in this report are exclusively those of Putnam Management. They are not meant as investment advice.
Please note that the holdings discussed in this report may not have been held by the fund for the entire period. Portfolio composition is subject to review in accordance with the fund’s investment strategy and may vary in the future.
Of special interest
We are pleased to report that effective April 2008, your fund’s dividend for class A shares was increased from $0.029 to $0.039 per share. This dividend increase was made possible due to increased interest income resulting from higher yields on interest-only (IO) securities and other mortgage-backed securities. IOs are securities derived from the interest portion of underlying mortgages.
7
Your fund’s performance
This section shows your fund’s performance, price, and distribution information for periods ended October 31, 2008, the end of its most recent fiscal year. In accordance with regulatory requirements for mutual funds, we also include performance as of the most recent calendar quarter-end and expense information taken from the fund’s current prospectus. Performance should always be considered in light of a fund’s investment strategy. Data represents past performance. Past performance does not guarantee future results. More recent returns may be less or more than those shown. Investment return and principal value will fluctuate, and you may have a gain or a loss when you sell your shares. Performance information does not reflect any deduction for taxes a shareholder may owe on fund distributions or on the redemption of fund shares. For the most recent month-end performance, please visit the Individual Investors section of www.pu tnam.com or call Putnam at 1-800-225-1581. Class Y shares are generally only available to corporate and institutional clients and clients in other approved programs. See the Terms and Definitions section in this report for definitions of the share classes offered by your fund.
Fund performance Total return for periods ended 10/31/08
| | | | | | | | | | |
| | Class A | Class B | Class C | Class M | Class R | Class Y |
| (inception dates) | (11/1/54) | (3/1/93) | (7/26/99) | (12/14/94) | (1/21/03) | (6/16/94) |
|
| | NAV | POP | NAV | CDSC | NAV | CDSC | NAV | POP | NAV | NAV |
|
| Annual average (life of fund) | 7.43% | 7.34% | 6.44% | 6.44% | 6.62% | 6.62% | 6.98% | 6.91% | 7.16% | 7.50% |
|
| 10 years | 29.39 | 24.15 | 20.33 | 20.33 | 19.98 | 19.98 | 26.30 | 22.19 | 26.33 | 32.81 |
| Annual average | 2.61 | 2.19 | 1.87 | 1.87 | 1.84 | 1.84 | 2.36 | 2.02 | 2.36 | 2.88 |
|
| 5 years | –0.17 | –4.18 | –3.74 | –5.34 | –3.85 | –3.85 | –1.34 | –4.51 | –1.29 | 1.25 |
| Annual average | –0.03 | –0.85 | –0.76 | –1.09 | –0.78 | –0.78 | –0.27 | –0.92 | –0.26 | 0.25 |
|
| 3 years | –6.54 | –10.27 | –8.39 | –10.78 | –8.50 | –8.50 | –7.17 | –10.14 | –7.08 | –5.74 |
| Annual average | –2.23 | –3.55 | –2.88 | –3.73 | –2.92 | –2.92 | –2.45 | –3.50 | –2.42 | –1.95 |
|
| 1 year | –15.13 | –18.50 | –15.58 | –19.54 | –15.67 | –16.46 | –15.19 | –17.89 | –15.30 | –14.85 |
|
Current performance may be lower or higher than the quoted past performance, which cannot guarantee future results. After sales charge returns (public offering price, or POP) for class A and M shares reflect a maximum 4.00% and 3.25% load, respectively, as of 1/2/08. Class B share returns reflect the applicable contingent deferred sales charge (CDSC), which is 5% in the first year, declining to 1% in the sixth year, and is eliminated thereafter. Class C shares reflect a 1% CDSC for the first year that is eliminated thereafter. Class R and Y shares have no initial sales charge or CDSC. Performance for class B, C, M, R, and Y shares before their inception is derived from the historical performance of class A shares, adjusted for the applicable sales charge (or CDSC) and, except for class Y shares, the higher operating expenses for such shares.
For a portion of the periods, this fund limited expenses, without which returns would have been lower.
A 1% short-term trading fee may be applied to shares exchanged or sold within 7 days of purchase.
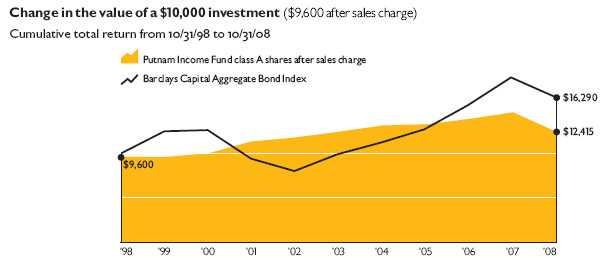
Past performance does not indicate future results. At the end of the same time period, a $10,000 investment in the fund’s class B and class C shares would have been valued at $12,033 and $11,998, respectively, and no contingent deferred sales charges would apply. A $10,000 investment in the fund’s class M shares ($9,675 after sales charge) would have been valued at $12,219 at public offering price. A $10,000 investment in the fund’s class R and class Y shares would have been valued at $12,633 and $13,281, respectively.
8
Comparative index returns For periods ended 10/31/08
| | |
| | Barclays Capital Aggregate | Lipper Corporate Debt A Rated Funds |
| | Bond Index | category average* |
|
| Annual average (life of fund) | —† | —† |
|
| 10 years | 62.90% | 41.13% |
| Annual average | 5.00 | 3.46 |
|
| 5 years | 18.67 | 6.25 |
| Annual average | 3.48 | 1.18 |
|
| 3 years | 11.19 | –0.34 |
| Annual average | 3.60 | –0.17 |
|
| 1 year | 0.30 | –8.24 |
|
Index and Lipper results should be compared to fund performance at net asset value.
* Over the 1-year, 3-year, 5-year, and 10-year periods ended 10/31/08, there were 171, 160, 141, and 66 funds, respectively, in this Lipper category.
† The fund’s benchmark and Lipper category were not in existence at the time of the fund’s inception. The Barclays Capital Aggregate Bond Index commenced 12/31/75. The Lipper category commenced 12/31/59.
Fund price and distribution information For the 12-month period ended 10/31/08
| | | | | | | | |
| Distributions | Class A | Class B | Class C | Class M | Class R | Class Y |
|
| Number | 12 | 12 | 12 | 12 | 12 | 12 |
|
| Income | $0.460 | $0.411 | $0.412 | $0.448 | $0.448 | $0.472 |
|
| Capital gains | — | — | — | — | — | — |
|
| Total | $0.460 | $0.411 | $0.412 | $0.448 | $0.448 | $0.472 |
|
| Share value | NAV | POP | NAV | NAV | NAV | POP | NAV | NAV |
|
| 10/31/07 | $6.77 | $7.05* | $6.72 | $6.74 | $6.68 | $6.90 | $6.76 | $6.82 |
|
| 10/31/08 | 5.35 | 5.57 | 5.32 | 5.33 | 5.28 | 5.46 | 5.34 | 5.40 |
|
| Current yield (end of period) | NAV | POP | NAV | NAV | NAV | POP | NAV | NAV |
|
| Current dividend rate 1 | 8.75% | 8.40% | 7.89% | 7.88% | 8.64% | 8.35% | 8.54% | 8.89% |
|
| Current 30-day SEC yield 2,3 | | | | | | | | |
| (with expense limitation) | N/A | 7.48 | 6.97 | 6.98 | N/A | 7.27 | 7.52 | 8.06 |
|
| Current 30-day SEC yield 3 | | | | | | | | |
| (without expense limitation) | N/A | 7.29 | 6.77 | 6.78 | N/A | 7.07 | 7.32 | 7.86 |
|
The classification of distributions, if any, is an estimate. Final distribution information will appear on your year-end tax forms.
* Reflects an increase in sales charges that took effect on 1/2/08.
1 Most recent distribution, excluding capital gains, annualized and divided by NAV or POP at end of period.
2 For a portion of the period, this fund may have limited expenses, without which yields would have been lower.
3 Based only on investment income and calculated using the maximum offering price for each share class, in accordance with SEC guidelines.
Fund performance as of most recent calendar quarter Total return for periods ended 9/30/08
| | | | | | | | | | |
| | Class A | Class B | Class C | Class M | Class R | Class Y |
| (inception dates) | (11/1/54) | (3/1/93) | (7/26/99) | (12/14/94) | (1/21/03) | (6/16/94) |
|
| | NAV | POP | NAV | CDSC | NAV | CDSC | NAV | POP | NAV | NAV |
|
| Annual average (life of fund) | 7.64% | 7.55% | 6.65% | 6.65% | 6.83% | 6.83% | 7.19% | 7.12% | 7.37% | 7.71% |
|
| 10 years | 40.61 | 35.04 | 30.43 | 30.43 | 30.53 | 30.53 | 37.19 | 32.82 | 37.36 | 44.45 |
| Annual average | 3.47 | 3.05 | 2.69 | 2.69 | 2.70 | 2.70 | 3.21 | 2.88 | 3.23 | 3.75 |
|
| 5 years | 9.43 | 5.08 | 5.41 | 3.65 | 5.45 | 5.45 | 8.10 | 4.51 | 8.23 | 11.08 |
| Annual average | 1.82 | 1.00 | 1.06 | 0.72 | 1.07 | 1.07 | 1.57 | 0.89 | 1.59 | 2.12 |
|
| 3 years | 2.52 | –1.54 | 0.23 | –2.40 | 0.26 | 0.26 | 1.77 | –1.59 | 1.79 | 3.48 |
| Annual average | 0.83 | –0.52 | 0.08 | –0.81 | 0.09 | 0.09 | 0.59 | –0.53 | 0.59 | 1.15 |
|
| 1 year | –5.46 | –9.23 | –6.20 | –10.61 | –6.17 | –7.05 | –5.70 | –8.72 | –5.64 | –5.09 |
|
9
Fund’s annual operating expenses For the fiscal year ended 10/31/07
| | | | | | | |
| | | Class A | Class B | Class C | Class M | Class R | Class Y |
|
| Net expenses* | | 1.00% | 1.75% | 1.75% | 1.25% | 1.25% | 0.75% |
|
| Total annual fund operating expenses | | 1.07 | 1.82 | 1.82 | 1.32 | 1.32 | 0.82 |
|
* Reflects Putnam Management’s decision to contractually limit expenses through 10/31/08.
Expense information in this table is taken from the most recent prospectus, is subject to change, and may differ from that shown in the next section and in the financial highlights of this report. Expenses are shown as a percentage of average net assets.
Your fund’s expenses
As a mutual fund investor, you pay ongoing expenses, such as management fees, distribution fees (12b-1 fees), and other expenses. In the most recent six-month period, your fund limited these expenses; had it not done so, expenses would have been higher. Using the following information, you can estimate how these expenses affect your investment and compare them with the expenses of other funds. You may also pay one-time transaction expenses, including sales charges (loads) and redemption fees, which are not shown in this section and would have resulted in higher total expenses. For more information, see your fund’s prospectus or talk to your financial representative.
Review your fund’s expenses
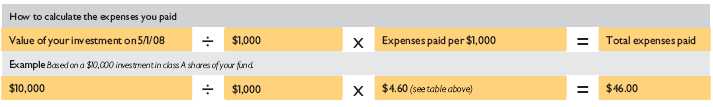
The following table shows the expenses you would have paid on a $1,000 investment in Putnam Income Fund from May 1, 2008, to October 31, 2008. It also shows how much a $1,000 investment would be worth at the close of the period, assuming actual returns and expenses.
| | | | | | | |
| | | Class A | Class B | Class C | Class M | Class R | Class Y |
|
| Expenses paid per $1,000* | | $4.60 | $8.08 | $8.08 | $5.76 | $5.76 | $3.44 |
|
| Ending value (after expenses) | | $849.30 | $846.70 | $846.90 | $849.50 | $848.30 | $851.30 |
|
* Expenses for each share class are calculated using the fund’s annualized expense ratio for each class, which represents the ongoing expenses as a percentage of average net assets for the six months ended 10/31/08. The expense ratio may differ for each share class (see the last table in this section). Expenses are calculated by multiplying the expense ratio by the average account value for the period; then multiplying the result by the number of days in the period; and then dividing that result by the number of days in the year.
Estimate the expenses you paid
To estimate the ongoing expenses you paid for the six months ended October 31, 2008, use the following calculation method. To find the value of your investment on May 1, 2008, call Putnam at 1-800-225-1581.
10
Compare expenses using the SEC’s method
The Securities and Exchange Commission (SEC) has established guidelines to help investors assess fund expenses. Per these guidelines, the following table shows your fund’s expenses based on a $1,000 investment, assuming a hypothetical 5% annualized return. You can use this information to compare the ongoing expenses (but not transaction expenses or total costs) of investing in the fund with those of other funds. All mutual fund shareholder reports will provide this information to help you make this comparison. Please note that you cannot use this information to estimate your actual ending account balance and expenses paid during the period.
| | | | | | | |
| | | Class A | Class B | Class C | Class M | Class R | Class Y |
|
| Expenses paid per $1,000* | | $5.03 | $8.82 | $8.82 | $6.29 | $6.29 | $3.76 |
|
| Ending value (after expenses) | | $1,020.16 | $1,016.39 | $1,016.39 | $1,018.90 | $1,018.90 | $1,021.42 |
|
* Expenses for each share class are calculated using the fund’s annualized expense ratio for each class, which represents the ongoing expenses as a percentage of average net assets for the six months ended 10/31/08. The expense ratio may differ for each share class (see the last table in this section). Expenses are calculated by multiplying the expense ratio by the average account value for the period; then multiplying the result by the number of days in the period; and then dividing that result by the number of days in the year.
Compare expenses using industry averages
You can also compare your fund’s expenses with the average of its peer group, as defined by Lipper, an independent fund-rating agency that ranks funds relative to others that Lipper considers to have similar investment styles or objectives. The expense ratio for each share class shown indicates how much of your fund’s average net assets have been used to pay ongoing expenses during the period.
| | | | | | | |
| | | Class A | Class B | Class C | Class M | Class R | Class Y |
|
| Your fund’s annualized expense ratio* | 0.99% | 1.74% | 1.74% | 1.24% | 1.24% | 0.74% |
|
| Average annualized expense ratio for Lipper peer group† | 0.98% | 1.73% | 1.73% | 1.23% | 1.23% | 0.73% |
|
* For the fund’s most recent fiscal half year; may differ from expense ratios based on one-year data in the financial highlights.
† Putnam keeps fund expenses below the Lipper peer group average expense ratio by limiting our fund expenses if they exceed the Lipper average. The Lipper average is a simple average of front-end load funds in the peer group that excludes 12b-1 fees as well as any expense offset and brokerage/service arrangements that may reduce fund expenses. To facilitate the comparison in this presentation, Putnam has adjusted the Lipper average to reflect 12b-1 fees. Investors should note that the other funds in the peer group may be significantly smaller or larger than the fund, and that an asset-weighted average would likely be lower than the simple average. Also, the fund and Lipper report expense data at different times; the fund’s expense ratio shown here is annualized data for the most recent six-month period, while the quarterly updated Lipper average is based on the most recent fiscal year-end data available for the peer grou p funds as of 9/30/08.
11
Your fund’s portfolio turnover
Putnam funds are actively managed by teams of experts who buy and sell securities based on intensive analysis of companies, industries, economies, and markets. Portfolio turnover is a measure of how often a fund’s managers buy and sell securities for your fund. A portfolio turnover of 100%, for example, means that the managers sold and replaced securities valued at 100% of a fund’s average portfolio value within a given period. Funds with high turnover may be more likely to generate capital gains that must be distributed to shareholders as taxable income. High turnover may also cause a fund to pay more brokerage commissions and other transaction costs, which may detract from performance.
Funds that invest in bonds or other fixed-income instruments may have higher turnover than funds that invest only in stocks. Short-term bond funds tend to have higher turnover than longer-term bond funds, because shorter-term bonds will mature or be sold more frequently than longer-term bonds. You can use the following table to compare your fund’s turnover with the average turnover for funds in its Lipper category.
Turnover comparisons
Percentage of holdings that change every year
| | | | | | |
| | | 2008 | 2007 | 2006 | 2005 | 2004 |
|
| Putnam Income Fund | | 200%* | 323%* | 239%* | 300%* | 441% |
|
| Lipper Corporate Debt A Rated Funds category average | | 113% | 106% | 138% | 152% | 163% |
|
* Portfolio turnover excludes dollar roll transactions.
Turnover data for the fund is calculated based on the fund’s fiscal-year period, which ends on October 31. Turnover data for the fund’s Lipper category is calculated based on the average of the turnover of each fund in the category for its fiscal year ended during the indicated year. Fiscal years vary across funds in the Lipper category, which may limit the comparability of the fund’s portfolio turnover rate to the Lipper average. Comparative data for 2008 is based on information available as of 10/31/08.
Your fund’s risk
Your fund’s Morningstar® Risk
This risk comparison is designed to help you understand how your fund compares with other funds. The comparison utilizes a risk measure developed by Morningstar, an independent fund-rating agency. This risk measure is referred to as the fund’s Morningstar Risk.
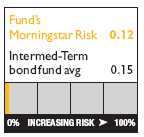
Your fund’s Morningstar Risk is shown alongside that of the average fund in its Morningstar category. The risk bar broadens the comparison by translating the fund’s Morningstar Risk into a percentile, which is based on the fund’s ranking among all funds rated by Morningstar as of September 30, 2008. A higher Morningstar Risk generally indicates that a fund’s monthly returns have varied more widely.
Morningstar determines a fund’s Morningstar Risk by assessing variations in the fund’s monthly returns — with an emphasis on downside variations — over a 3-year period, if available. Those measures are weighted and averaged to produce the fund’s Morningstar Risk. The information shown is provided for the fund’s class A shares only; information for other classes may vary. Morningstar Risk is based on historical data and does not indicate future results. Morningstar does not purport to measure the risk associated with a current investment in a fund, either on an absolute basis or on a relative basis. Low Morningstar Risk does not mean that you cannot lose money on an investment in a fund. Copyright 2008 Morningstar, Inc. All Rights Reserved. The information contained herein (1) is proprietary to Morningstar and/or its content providers; (2) may not be copied or distributed; and (3) is not warranted to be accurate, complete, or timely. Neither Morningstar nor its content providers are responsible for any damages or losses arising from any use of this information.
12
Your fund’s management
Your fund’s Portfolio Managers are Carl Bell, Rob Bloemker, Kevin Murphy, Michael Salm, and Raman Srivastava.
Trustee and Putnam employee fund ownership
As of October 31, 2008, 12 of the 13 Trustees of the Putnam funds owned fund shares. The table below shows the approximate value of investments in the fund and all Putnam funds as of that date by the Trustees and Putnam employees. These amounts include investments by the Trustees’ and employees’ immediate family members and investments through retirement and deferred compensation plans.
| | | |
| | Assets in | Total assets in | |
| | the fund | all Putnam funds | |
| |
| Trustees | $179,000 | $33,000,000 | |
| |
| Putnam employees | $6,399,000 | $396,000,000 | |
| |
Other Putnam funds managed by the Portfolio Managers
Rob Bloemker is also a Portfolio Manager of Putnam Diversified Income Trust, Putnam Global Income Trust, Putnam U.S. Government Income Trust, Putnam American Government Income Fund, Putnam Premier Income Trust, and Putnam Master Intermediate Income Trust.
Kevin Murphy is also a Portfolio Manager of Putnam Diversified Income Trust, Putnam Premier Income Trust, Putnam Master Intermediate Income Trust, and Putnam Utilities Growth and Income Fund.
Michael Salm is also a Portfolio Manager of Putnam Global Income Trust, Putnam U.S. Government Income Trust, and Putnam American Government Income Fund.
Raman Srivastava is also a Portfolio Manager of Putnam Global Income Trust and The George Putnam Fund of Boston.
Carl Bell, Rob Bloemker, Kevin Murphy, Michael Salm, and Raman Srivastava may also manage other accounts and variable trust funds advised by Putnam Management or an affiliate.
Changes in your fund’s portfolio management
During the reporting period ended October 31, 2008, Carl Bell joined your fund’s portfolio team, following the departure of Kevin Cronin.
Portfolio management fund ownership
The following table shows how much the fund’s current Portfolio Managers have invested in the fund and in all Putnam mutual funds (in dollar ranges). Information shown is as of October 31, 2008, and October 31, 2007.
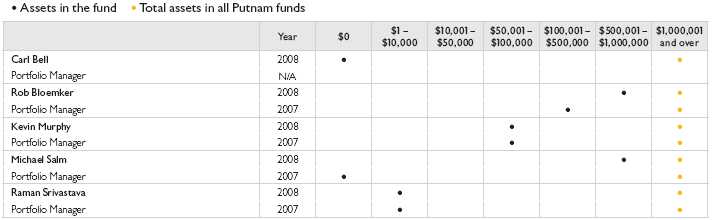
N/A indicates the individual was not a Portfolio Manager as of 10/31/07.
13
Terms and definitions
Important terms
Total return shows how the value of the fund’s shares changed over time, assuming you held the shares through the entire period and reinvested all distributions in the fund.
Net asset value (NAV) is the price, or value, of one share of a mutual fund, without a sales charge. NAVs fluctuate with market conditions. NAV is calculated by dividing the net assets of each class of shares by the number of outstanding shares in the class.
Public offering price (POP) is the price of a mutual fund share plus the maximum sales charge levied at the time of purchase. POP performance figures shown here assume the 4.00% maximum sales charge for class A shares and 3.25% for class M shares.
Contingent deferred sales charge (CDSC) is generally a charge applied at the time of the redemption of class B or C shares and assumes redemption at the end of the period. Your fund’s class B CDSC declines from a 5% maximum during the first year to 1% during the sixth year. After the sixth year, the CDSC no longer applies. The CDSC for class C shares is 1% for one year after purchase.
Current yield is the annual rate of return earned from dividends or interest of an investment. Current yield is expressed as a percentage of the price of a security, fund share, or principal investment.
Share classes
Class A shares are generally subject to an initial sales charge and no CDSC (except on certain redemptions of shares bought without an initial sales charge).
Class B shares are not subject to an initial sales charge. They may be subject to a CDSC.
Class C shares are not subject to an initial sales charge and are subject to a CDSC only if the shares are redeemed during the first year.
Class M shares have a lower initial sales charge and a higher 12b-1 fee than class A shares and no CDSC (except on certain redemptions of shares bought without an initial sales charge).
Class R shares are not subject to an initial sales charge or CDSC and are available only to certain defined contribution plans.
Class Y shares are not subject to an initial sales charge or CDSC, and carry no 12b-1 fee. They are generally only available to corporate and institutional clients and clients in other approved programs.
Comparative indexes
Barclays Capital Aggregate Bond Index is an unmanaged index of U.S. investment-grade fixed-income securities.
Merrill Lynch U.S. 3-Month Treasury Bill Index is an unmanaged index that seeks to measure the performance of U.S. Treasury bills available in the marketplace.
S&P 500 Index is an unmanaged index of common stock performance.
Indexes assume reinvestment of all distributions and do not account for fees. Securities and performance of a fund and an index will differ. You cannot invest directly in an index.
Lipper is a third-party industry-ranking entity that ranks mutual funds. Its rankings do not reflect sales charges. Lipper rankings are based on total return at net asset value relative to other funds that have similar current investment styles or objectives as determined by Lipper. Lipper may change a fund’s category assignment at its discretion. Lipper category averages reflectperformance trends for funds within a category.
14
Trustee approval of management contract
General conclusions
The Board of Trustees of the Putnam funds oversees the management of each fund and, as required by law, determines annually whether to approve the continuance of your fund’s management contract with Putnam Investment Management (“Putnam Management”). In this regard, the Board of Trustees, with the assistance of its Contract Committee consisting solely of Trustees who are not “interested persons” (as such term is defined in the Investment Company Act of 1940, as amended) of the Putnam funds (the “Independent Trustees”), requests and evaluates all information it deems reasonably necessary under the circumstances. Over the course of several months ending in June 2008, the Contract Committee met several times to consider the information provided by Putnam Management and other information developed with the assistance of the Board’s independent counsel and independent staff. The Contract Committee reviewed and discussed key aspects of t his information with all of the Independent Trustees. The Contract Committee recommended, and the Independent Trustees approved, the continuance of your fund’s management contract, effective July 1, 2008.
The Independent Trustees’ approval was based on the following conclusions:
• That the fee schedule in effect for your fund represented reasonable compensation in light of the nature and quality of the services being provided to the fund, the fees paid by competitive funds and the costs incurred by Putnam Management in providing such services, and
• That this fee schedule represented an appropriate sharing between fund shareholders and Putnam Management of such economies of scale as may exist in the management of the fund at current asset levels.
These conclusions were based on a comprehensive consideration of all information provided to the Trustees, were subject to the continued application of certain expense reductions and waivers and other considerations noted below, and were not the result of any single factor. Some of the factors that figured particularly in the Trustees’ deliberations and how the Trustees considered these factors are described below, although individual Trustees may have evaluated the information presented differently, giving different weights to various factors. It is also important to recognize that the fee arrangements for your fund and the other Putnam funds are the result of many years of review and discussion between the Independent Trustees and Putnam Management, that certain aspects of such arrangements may receive greater scrutiny in some years than others, and that the Trustees’ conclusions may be based, in part, on their consideration of these same arrangements in prior years.
Management fee schedules and categories; total expenses
The Trustees reviewed the management fee schedules in effect for all Putnam funds, including fee levels and breakpoints, and the assignment of funds to particular fee categories. In reviewing fees and expenses, the Trustees generally focused their attention on material changes in circumstances — for example, changes in a fund’s size or investment style, changes in Putnam Management’s operating costs or responsibilities, or changes in competitive practices in the mutual fund industry — that suggest that consideration of fee changes might be warranted. The Trustees concluded that the circumstances did not warrant changes to the management fee structure of your fund, which had been carefully developed over the years, re-examined on many occasions and adjusted where appropriate. In this regard, the Trustees also noted that shareholders of your fund voted in 2007 to approve new management contracts containing an identical fee structure. The Trustees focuse d on two areas of particular interest, as discussed further below:
• Competitiveness. The Trustees reviewed comparative fee and expense information for competitive funds, which indicated that, in a custom peer group of competitive funds selected by Lipper Inc., your fund ranked in the 28th percentile in management fees and in the 24th percentile in total expenses (less any applicable 12b-1 fees) as of December 31, 2007 (the first percentile being the least expensive funds and the 100th percentile being the most expensive funds). (Because the fund’s custom peer group is smaller than the fund’s broad Lipper Inc. peer group, this expense information may differ from the Lipper peer expense information found elsewhere in this report.) The Trustees noted that expense ratios for a number of Putnam funds, which show the percentage of fund assets used to pay for management and administrative services, distribution (12b-1) fees and other expenses, had been increasing recently as a result of declining net assets and the natural operation of fee breakpoints.
The Trustees noted that the expense ratio increases described above were currently being controlled by expense limitations initially implemented in January 2004. The Trustees have received a commitment from Putnam Management and its parent company to continue this program through at least June 30, 2009. These expense limitations give effect to a commitment by Putnam Management that the expense ratio of each open-end fund would be no higher than the average expense ratio of the competitive funds included in the fund’s relevant Lipper universe (exclusive of any applicable 12b-1 charges in each case). The Trustees observed that this commitment to limit fund expenses has served shareholders well since its inception.
In order to ensure that the expenses of the Putnam funds continue to meet evolving competitive standards, the Trustees requested, and Putnam Management agreed, to extend for the twelve months beginning July 1, 2008, an additional expense limitation for certain funds at an amount equal to the average expense ratio (exclusive of 12b-1 charges) of a custom peer group of competitive funds selected by Lipper to correspond to the size of the fund. This additional expense limitation
15
will be applied to those open-end funds that had above-average expense ratios (exclusive of 12b-1 charges) based on the custom peer group data for the period ended December 31, 2007. This additional expense limitation will not be applied to your fund because it had a below-average expense ratio relative to its custom peer group.
In addition, the Trustees devoted particular attention to analyzing the Putnam funds’ fees and expenses relative to those of competitors in fund complexes of comparable size and with a comparable mix of asset categories. The Trustees concluded that this analysis did not reveal any matters requiring further attention at the current time.
• Economies of scale. Your fund currently has the benefit of breakpoints in its management fee that provide shareholders with significant economies of scale, which means that the effective management fee rate of the fund (as a percentage of fund assets) declines as the fund grows in size and crosses specified asset thresholds.
Conversely, if the fund shrinks in size — as has been the case for many Putnam funds in recent years — these breakpoints result in increasing fee levels. In recent years, the Trustees have examined the operation of the existing breakpoint structure during periods of both growth and decline in asset levels. The Trustees concluded that the fee schedule in effect for your fund represented an appropriate sharing of economies of scale at current asset levels.
In connection with their review of the management fees and total expenses of the Putnam funds, the Trustees also reviewed the costs of the services to be provided and profits to be realized by Putnam Management and its affiliates from the relationship with the funds. This information included trends in revenues, expenses and profitability of Putnam Management and its affiliates relating to the investment management and distribution services provided to the funds. In this regard, the Trustees also reviewed an analysis of Putnam Management’s revenues, expenses and profitability with respect to the funds’ management contracts, allocated on a fund-by-fund basis.
Investment performance
The quality of the investment process provided by Putnam Management represented a major factor in the Trustees’ evaluation of the quality of services provided by Putnam Management under your fund’s management contract. The Trustees were assisted in their review of the Putnam funds’ investment process and performance by the work of the Investment Oversight Coordinating Committee of the Trustees and the Investment Oversight Committees of the Trustees, which had met on a regular monthly basis with the funds’ portfolio teams throughout the year. The Trustees concluded that Putnam Management generally provides a high-quality investment process — as measured by the experience and skills of the individuals assigned to the management of fund portfolios, the resources made available to such personnel, and in general the ability of Putnam Management to attract and retain high-quality personnel — but also recognized that this does not guarantee favorab le investment results for every fund in every time period. The Trustees considered the investment performance of each fund over multiple time periods and considered information comparing each fund’s performance with various benchmarks and with the performance of competitive funds.
While the Trustees noted the satisfactory investment performance of certain Putnam funds, they considered the disappointing investment performance of many funds in recent periods, particularly over periods in 2007 and 2008. They discussed with senior management of Putnam Management the factors contributing to such underperformance and actions being taken to improve performance. The Trustees recognized that, in recent years, Putnam Management has taken steps to strengthen its investment personnel and processes to address areas of underperformance, including recent efforts to further centralize Putnam Management’s equity research function. In this regard, the Trustees took into consideration efforts by Putnam Management to improve its ability to assess and mitigate investment risk in individual funds, across asset classes, and across the complex as a whole. The Trustees indicated their intention to continue to monitor performance trends to assess the effectiveness of these efforts and to evaluate whether additional changes to address areas of underperformance are warranted.
In the case of your fund, the Trustees considered that your fund’s class A share cumulative total return performance at net asset value was in the following percentiles of its Lipper Inc. peer group (Lipper Corporate Debt Funds A Rated) for the one-year, three-year and five-year periods ended December 31, 2007 (the first percentile being the best-performing funds and the 100th percentile being the worst-performing funds):
| | |
| One-year period | 42nd | |
| |
| Three-year period | 27th | |
| |
| Five-year period | 47th | |
| |
(Because of the passage of time, these performance results may differ from the performance results for more recent periods shown elsewhere in this report.) Over the one-year, three-year and five-year periods ended December 31, 2007, there were 172, 155, and 132 funds, respectively, in your fund’s Lipper peer group.* Past performance is no guarantee of future returns.
As a general matter, the Trustees believe that cooperative efforts between the Trustees and Putnam Management represent the
*The percentile rankings for your fund’s class A share annualized total return performance in the Lipper Corporate Debt Funds A Rated category for the one-year, five-year and ten-year periods ended September 30, 2008 were 71st, 62nd, and 72nd, respectively. Over the one-year, five-year and ten-year periods ended September 30, 2008, your fund ranked 122 out of 171, 86 out of 139, and 47 out of 65 funds, respectively. Note that this more recent information was not available when the Trustees approved the continuance of your fund’s management contract.
16
most effective way to address investment performance problems. The Trustees noted that investors in the Putnam funds have, in effect, placed their trust in the Putnam organization, under the oversight of the funds’ Trustees, to make appropriate decisions regarding the management of the funds. Based on the responsiveness of Putnam Management in the recent past to Trustee concerns about investment performance, the Trustees concluded that it is preferable to seek change within Putnam Management to address performance shortcomings. In the Trustees’ view, the alternative of engaging a new investment adviser for an underperforming fund would entail significant disruptions and would not provide any greater assurance of improved investment performance.
Brokerage and soft-dollar allocations; other benefits
The Trustees considered various potential benefits that Putnam Management may receive in connection with the services it provides under the management contract with your fund. These include benefits related to brokerage and soft-dollar allocations, whereby a portion of the commissions paid by a fund for brokerage may be used to acquire research services that may be useful to Putnam Management in managing the assets of the fund and of other clients. The Trustees considered changes made in 2008, at Putnam Management’s request, to the Putnam funds’ brokerage allocation policy, which expanded the permitted categories of brokerage and research services payable with soft dollars and increased the permitted soft dollar allocation to third-party services over what had been authorized in previous years. The Trustees indicated their continued intent to monitor the potential benefits associated with the allocation of fund brokerage and trend s in industry practice to ensure that the principle of seeking “best price and execution” remains paramount in the portfolio trading process.
The Trustees’ annual review of your fund’s management contract arrangements also included the review of its distributor’s contract and distribution plan with Putnam Retail Management Limited Partnership and the investor servicing agreement with Put-nam Fiduciary Trust Company (“PFTC”), each of which provides benefits to affiliates of Putnam Management. In the case of the investor servicing agreement, the Trustees considered that certain shareholder servicing functions were shifted to a third-party service provider by PFTC in 2007.
Comparison of retail and institutional fee schedules
The information examined by the Trustees as part of their annual contract review has included for many years information regarding fees charged by Putnam Management and its affiliates to institutional clients such as defined benefit pension plans, college endowments, etc. This information included comparisons of such fees with fees charged to the funds, as well as a detailed assessment of the differences in the services provided to these two types of clients. The Trustees observed, in this regard, that the differences in fee rates between institutional clients and mutual funds are by no means uniform when examined by individual asset sectors, suggesting that differences in the pricing of investment management services to these types of clients reflect to a substantial degree historical competitive forces operating in separate market places. The Trustees considered the fact that fee rates across different asset classes are typically higher on average for mutual funds than for institutional clients, as well as the differences between the services that Putnam Management provides to the Putnam funds and those that it provides to institutional clients of the firm, but did not rely on such comparisons to any significant extent in concluding that the management fees paid by your fund are reasonable.
17
Other information for shareholders
Putnam’s policy on confidentiality
In order to conduct business with our shareholders, we must obtain certain personal information such as account holders’ addresses, telephone numbers, Social Security numbers, and the names of their financial representatives. We use this information to assign an account number and to help us maintain accurate records of transactions and account balances. It is our policy to protect the confidentiality of your information, whether or not you currently own shares of our funds, and, in particular, not to sell information about you or your accounts to outside marketing firms. We have safeguards in place designed to prevent unauthorized access to our computer systems and procedures to protect personal information from unauthorized use. Under certain circumstances, we share this information with outside vendors who provide services to us, such as mailing and proxy solicitation. In those cases, the service providers enter into confidentiality agreements with us, and we provide only the information necessary to process transactions and perform other services related to your account. We may also share this information with our Putnam affiliates to service your account or provide you with information about other Putnam products or services. It is also our policy to share account information with your financial representative, if you’ve listed one on your Putnam account. If you would like clarification about our confidentiality policies or have any questions or concerns, please don’t hesitate to contact us at 1-800-225-1581, Monday through Friday, 8:30 a.m. to 8:00 p.m., or Saturdays from 9:00 a.m. to 5:00 p.m. Eastern Time.
Proxy voting
Putnam is committed to managing our mutual funds in the best interests of our shareholders. The Putnam funds’ proxy voting guidelines and procedures, as well as information regarding how your fund voted proxies relating to portfolio securities during the 12-month period ended June 30, 2008, are available in the Individual Investors section of www.putnam.com, and on the SEC’s Web site, www.sec.gov. If you have questions about finding forms on the SEC’s Web site, you may call the SEC at 1-800-SEC-0330. You may also obtain the Putnam funds’ proxy voting guidelines and procedures at no charge by calling Putnam’s Shareholder Services at 1-800-225-1581.
Fund portfolio holdings
The fund will file a complete schedule of its portfolio holdings with the SEC for the first and third quarters of each fiscal year on Form N-Q. Shareholders may obtain the fund’s Forms N-Q on the SEC’s Web site at www.sec.gov. In addition, the fund’s Forms N-Q may be reviewed and copied at the SEC’s Public Reference Room in Washington, D.C. You may call the SEC at 1-800-SEC-0330 for information about the SEC’s Web site or the operation of the Public Reference Room.
18
Financial statements
These sections of the report, as well as the accompanying Notes, preceded by the Report of Independent Registered Public Accounting Firm, constitute the fund’s financial statements.
The fund’s portfolio lists all the fund’s investments and their values as of the last day of the reporting period. Holdings are organized by asset type and industry sector, country, or state to show areas of concentration and diversification.
Statement of assets and liabilities shows how the fund’s net assets and share price are determined. All investment and noninvestment assets are added together. Any unpaid expenses and other liabilities are subtracted from this total. The result is divided by the number of shares to determine the net asset value per share, which is calculated separately for each class of shares. (For funds with preferred shares, the amount subtracted from total assets includes the liquidation preference of preferred shares.)
Statement of operations shows the fund’s net investment gain or loss. This is done by first adding up all the fund’s earnings — from dividends and interest income — and subtracting its operating expenses to determine net investment income (or loss). Then, any net gain or loss the fund realized on the sales of its holdings — as well as any unrealized gains or losses over the period — is added to or subtracted from the net investment result to determine the fund’s net gain or loss for the fiscal year.
Statement of changes in net assets shows how the fund’s net assets were affected by the fund’s net investment gain or loss, by distributions to shareholders, and by changes in the number of the fund’s shares. It lists distributions and their sources (net investment income or realized capital gains) over the current reporting period and the most recent fiscal year-end. The distributions listed here may not match the sources listed in the Statement of operations because the distributions are determined on a tax basis and may be paid in a different period from the one in which they were earned.
Financial highlights provide an overview of the fund’s investment results, per-share distributions, expense ratios, net investment income ratios, and portfolio turnover in one summary table, reflecting the five most recent reporting periods. In a semi-annual report, the highlight table also includes the current reporting period.
19
Report of Independent Registered Public Accounting Firm
The Board of Trustees and Shareholders Putnam Income Fund:
We have audited the accompanying statement of assets and liabilities of Putnam Income Fund (“the fund”), including the fund’s portfolio, as of October 31, 2008, and the related statement of operations for the year then ended, the statements of changes in net assets for each of the two years in the period then ended and the financial highlights for each of the five years in the period then ended. These financial statements and financial highlights are the responsibility of the fund’s management. Our responsibility is to express an opinion on these financial statements and financial highlights based on our audits.
We conducted our audits in accordance with the standards of the Public Company Accounting Oversight Board (United States). Those standards require that we plan and perform our audit to obtain reasonable assurance about whether the financial statements and financial highlights are free of material misstatement. An audit includes examining, on a test basis, evidence supporting the amounts and disclosures in the financial statements. Our procedures included confirmation of securities owned as of October 31, 2008 by correspondence with the custodian and brokers or by other appropriate auditing procedures. An audit also includes assessing the accounting principles used and significant estimates made by management, as well as evaluating the overall financial statement presentation. We believe that our audits provide a reasonable basis for our opinion.
In our opinion, the financial statements and financial highlights referred to above present fairly, in all material respects, the financial position of Putnam Income Fund as of October 31, 2008, the results of its operations for the year then ended, the changes in its net assets for each of the two years in the period then ended, and the financial highlights for each of the five years in the period then ended, in conformity with U.S. generally accepted accounting principles.

Boston, Massachusetts
December 17, 2008
20
| | |
| The fund’s portfolio 10/31/08 | | |
|
| |
| U.S. GOVERNMENT AND AGENCY | Principal | |
| MORTGAGE OBLIGATIONS (142.9%)* | amount | Value |
|
| U.S. Government Guaranteed Mortgage Obligations (3.2%) | |
| Government National Mortgage | | |
| Association Graduated Payment Mortgages | | |
| 11s, with due dates from March 15, 2010 | | |
| to August 15, 2010 | $3,812 | $4,029 |
| Government National Mortgage | | |
| Association Pass-Through Certificates | | |
| 6 1/2s, with due dates from December 20, | | |
| 2034 to November 20, 2037 | 19,038,747 | 19,275,260 |
| 6 1/2s, TBA, November 1, 2036 | 31,000,000 | 31,324,533 |
|
| | | 50,603,822 |
| U.S. Government Agency Mortgage Obligations (139.7%) | |
| Federal Home Loan Mortgage Corporation | | |
| Pass-Through Certificates | | |
| 7s, January 1, 2015 | 22,536 | 23,326 |
| 6s, September 1, 2021 | 61,634 | 62,050 |
| 5 1/2s, with due dates from December 1, | | |
| 2034 to July 1, 2035 | 2,274,194 | 2,222,290 |
| 5 1/2s, April 1, 2020 | 158,036 | 157,888 |
|
| Federal National Mortgage Association | | |
| Pass-Through Certificates | | |
| 9s, with due dates from | | |
| January 1, 2027 to April 1, 2032 | 306,869 | 330,832 |
| 8s, with due dates from | | |
| May 1, 2025 to July 1, 2033 | 735,589 | 760,239 |
| 7 1/2s, with due dates from | | |
| September 1, 2022 to July 1, 2033 | 671,169 | 701,933 |
| 7s, with due dates from May 1, 2026 | | |
| to December 1, 2035 | 3,833,516 | 3,981,274 |
| 7s, with due dates from July 1, 2014 | | |
| to January 1, 2017 | 485,190 | 501,832 |
| 6 1/2s, with due dates from | | |
| March 1, 2037 to December 1, 2037 | 9,648,853 | 9,788,311 |
| 6 1/2s, with due dates from | | |
| July 1, 2016 to September 1, 2016 | 102,626 | 104,856 |
| 6 1/2s, TBA, November 1, 2035 | 128,000,000 | 129,699,994 |
| 6s, with due dates from | | |
| January 1, 2009 to July 1, 2021 | 5,804,210 | 5,953,981 |
| 6s, TBA, November 1, 2038 | 44,000,000 | 43,965,627 |
| 5 1/2s, with due dates from | | |
| November 1, 2034 to January 1, 2038 | 11,357,045 | 11,104,156 |
| 5 1/2s, with due dates from | | |
| November 1, 2011 to October 1, 2022 | 71,347,610 | 71,266,054 |
| 5 1/2s, TBA, December 1, 2038 | 238,000,000 | 232,124,375 |
| 5 1/2s, TBA, November 1, 2038 | 1,039,000,000 | 1,014,810,833 |
| 5s, with due dates from | | |
| February 1, 2021 to August 1, 2035 | 7,996,326 | 7,592,531 |
| 5s, TBA, December 1, 2038 | 200,000,000 | 189,289,060 |
| 5s, TBA, November 1, 2035 | 473,000,000 | 448,241,383 |
| 5s, TBA, November 1, 2023 | 19,000,000 | 18,572,500 |
| 4 1/2s, with due dates from | | |
| May 1, 2034 to September 1, 2035 | 697,725 | 636,392 |
| 4 1/2s, TBA, November 1, 2038 | 1,000,000 | 908,594 |
| 4s, with due dates from | | |
| May 1, 2019 to August 1, 2020 | 707,061 | 654,892 |
|
| | | 2,193,455,203 |
| |
| Total U.S. government and agency mortgage obligations | |
| (cost $2,282,056,645) | | $2,244,059,025 |
| |
| |
| COLLATERALIZED MORTGAGE | Principal | |
| OBLIGATIONS (55.8%)* | amount | Value |
|
| Adjustable Rate Mortgage Trust FRB | | |
| Ser. 04-5, Class 3A1, 4.945s, 2035 | $3,828,818 | $2,871,614 |
|
| Asset Backed Funding Certificates 144A | | |
| FRB Ser. 06-OPT3, Class B, 5.759s, 2036 | 149,178 | 5,196 |
|
| | |
| COLLATERALIZED MORTGAGE | Principal | |
| OBLIGATIONS (55.8%)* cont. | amount | Value |
|
| Asset Securitization Corp. | | |
| Ser. 96-MD6, Class A7, 8.335s, 2029 | $1,952,962 | $1,933,419 |
| FRB Ser. 97-D5, Class A5, 6.934s, 2043 | 300,000 | 310,508 |
|
| Banc of America Commercial Mortgage, Inc. | | |
| FRB Ser. 07-3, Class A3, 5.658s, 2049 | 2,003,000 | 1,781,779 |
| Ser. 07-2, Class A2, 5.634s, 2049 | 1,565,000 | 1,375,792 |
| Ser. 06-4, Class A2, 5.522s, 2046 | 8,064,000 | 7,303,245 |
| Ser. 05-6, Class A2, 5.165s, 2047 | 880,000 | 808,688 |
| FRB Ser. 05-1, Class A5, 5.084s, 2042 | 163,000 | 150,299 |
| Ser. 07-5, Class XW, Interest Only (IO), | | |
| 0.44s, 2051 | 38,748,865 | 649,823 |
| Ser. 07-1, Class XW, IO, 0.291s, 2049 | 19,144,601 | 286,040 |
| Ser. 06-1, Class XC, IO, 0.068s, 2045 | 111,766,826 | 585,274 |
|
| Banc of America Commercial Mortgage, Inc. 144A | |
| Ser. 01-PB1, Class K, 6.15s, 2035 | 880,000 | 752,735 |
| Ser. 02-PB2, Class XC, IO, 0.198s, 2035 | 46,491,718 | 683,428 |
| Ser. 04-4, Class XC, IO, 0.17s, 2042 | 38,965,315 | 506,676 |
| Ser. 04-5, Class XC, IO, 0.147s, 2041 | 61,605,970 | 590,278 |
| Ser. 05-1, Class XW, IO, 0.101s, 2042 | 196,865,400 | 451,214 |
| Ser. 06-4, Class XC, IO, 0.088s, 2046 | 67,215,808 | 584,939 |
| Ser. 05-4, Class XC, IO, 0.084s, 2045 | 103,094,210 | 582,258 |
| Ser. 06-5, Class XC, IO, 0.078s, 2016 | 137,085,567 | 1,514,204 |
|
| Banc of America Funding Corp. FRB | �� | |
| Ser. 06-D, Class 6A1, 5.991s, 2036 | 210,930 | 132,886 |
|
| Banc of America Large Loan | | |
| FRB Ser. 04-BBA4, Class H, 5.51s, 2018 | 443,000 | 435,765 |
| FRB Ser. 04-BBA4, Class G, 5.26s, 2018 | 595,000 | 585,277 |
|
| Banc of America Large Loan 144A | | |
| FRB Ser. 05-MIB1, Class K, 6.56s, 2022 | 669,000 | 553,330 |
| FRB Ser. 05-MIB1, Class J, 5.61s, 2022 | 1,805,000 | 1,516,200 |
|
| Banc of America Mortgage Securities | | |
| FRB Ser. 03-F, Class 2A1, 4.67s, 2033 | 486,842 | 440,592 |
| Ser. 05-E, Class 2, IO, 0.3s, 2035 | 36,760,681 | 122,057 |
| Ser. 04-D, Class 2A, IO, 0.21s, 2034 | 12,959,572 | 12,150 |
|
| Banc of America Structured Security Trust | | |
| 144A Ser. 02-X1, Class A3, 5.436s, 2033 | 1,804,541 | 1,809,519 |
|
| Bayview Commercial Asset Trust 144A | | |
| FRB Ser. 05-1A, Class A1, 3.559s, 2035 | 1,341,077 | 1,143,268 |
| Ser. 06-4A, IO, 2.331s, 2036 | 2,455,738 | 239,680 |
| Ser. 04-2, IO, 2.22s, 2034 | 3,708,805 | 129,808 |
| Ser. 04-3, IO, 2.15s, 2035 | 4,031,020 | 141,086 |
| Ser. 06-2A, IO, 1.798s, 2036 | 3,086,754 | 214,221 |
| Ser. 05-3A, IO, 1.6s, 2035 | 15,603,675 | 920,617 |
| Ser. 05-1A, IO, 1.6s, 2035 | 5,780,604 | 231,224 |
| Ser. 07-5A, IO, 1.55s, 2037 | 17,968,327 | 2,184,949 |
| Ser. 07-2A, IO, 1.3s, 2037 | 20,591,451 | 1,822,343 |
| Ser. 07-1, Class S, IO, 1.211s, 2037 | 15,852,536 | 1,244,424 |
|
| Bear Stearns Alternate Trust | | |
| FRB Ser. 06-5, Class 2A2, 6 1/4s, 2036 | 4,676,730 | 2,735,887 |
| Ser. 04-9, Class 1A1, 5.903s, 2034 | 173,508 | 132,024 |
|
| Bear Stearns Commercial Mortgage Securities, Inc. | |
| FRB Ser. 00-WF2, Class F, 8.186s, 2032 | 619,000 | 536,988 |
| Ser. 07-PW17, Class A3, 5.736s, 2050 | 25,117,000 | 21,153,537 |
| Ser. 04-PR3I, Class X1, IO, 0.338s, 2041 | 18,968,006 | 260,469 |
| Ser. 05-PWR9, Class X1, IO, 0.112s, 2042 | 50,753,353 | 357,811 |
|
| Bear Stearns Commercial Mortgage | | |
| Securities, Inc. 144A | | |
| Ser. 06-PW14, Class XW, IO, 0.689s, 2038 | 25,360,540 | 810,269 |
| Ser. 06-PW14, Class X1, IO, 0.077s, 2038 | 27,272,413 | 328,905 |
| Ser. 07-PW15, Class X1, IO, 0.066s, 2044 | 79,882,973 | 647,052 |
| Ser. 05-PW10, Class X1, IO, 0.056s, 2040 | 108,722,613 | 339,215 |
| Ser. 07-PW16, Class X, IO, 0.021s, 2040 | 175,571,841 | 126,412 |
|
| Bear Stearns Small Balance Commercial | | |
| Trust 144A Ser. 06-1A, Class AIO, IO, 1s, 2034 | 7,084,200 | 83,018 |
|
21
| | |
| COLLATERALIZED MORTGAGE | Principal | |
| OBLIGATIONS (55.8%)* cont. | amount | Value |
|
| Chase Commercial Mortgage Securities | | |
| Corp. Ser. 00-3, Class A2, 7.319s, 2032 | $655,840 | $677,508 |
|
| Chase Commercial Mortgage Securities | | |
| Corp. 144A | | |
| Ser. 98-1, Class F, 6.56s, 2030 | 5,896,000 | 5,978,573 |
| Ser. 98-1, Class G, 6.56s, 2030 | 1,502,003 | 1,365,481 |
| Ser. 98-1, Class H, 6.34s, 2030 | 2,217,000 | 1,694,881 |
|
| Citigroup Commercial Mortgage Trust | | |
| Ser. 08-C7, Class A3, 6.096s, 2014 | 4,845,000 | 3,894,616 |
| Ser. 08-C7, Class A2A, 6.034s, 2049 | 2,640,000 | 2,282,941 |
|
| Citigroup Commercial Mortgage Trust 144A | | |
| Ser. 05-C3, Class XC, IO, 0.115s, 2043 | 141,899,006 | 1,247,159 |
| Ser. 06-C5, Class XC, IO, 0.072s, 2049 | 162,950,436 | 1,935,036 |
|
| Citigroup Mortgage Loan Trust, Inc. | | |
| FRB Ser. 06-AR7, Class 2A2A, 5.652s, 2036 | 537,141 | 316,913 |
| IFB Ser. 07-6, Class 2A5, IO, 3.391s, 2037 | 5,894,732 | 471,579 |
|
| Citigroup/Deutsche Bank Commercial | | |
| Mortgage Trust Ser. 06-CD3, Class A4, | | |
| 5.658s, 2048 | 1,266,000 | 1,123,333 |
|
| Citigroup/Deutsche Bank Commercial | | |
| Mortgage Trust 144A | | |
| Ser. 07-CD4, Class XW, IO, 0.377s, 2049 | 34,800,052 | 691,923 |
| Ser. 06-CD2, Class X, IO, 0.086s, 2046 | 104,571,630 | 334,304 |
| Ser. 07-CD4, Class XC, IO, 0.059s, 2049 | 116,367,568 | 918,213 |
|
| Commercial Mortgage Acceptance Corp. 144A | | |
| Ser. 98-C1, Class F, 6.23s, 2031 | 2,605,530 | 2,642,060 |
| Ser. 98-C2, Class F, 5.44s, 2030 | 4,946,000 | 4,501,237 |
|
| Commercial Mortgage Loan Trust Ser. 08-LS1, | | |
| Class A4B, 6.02s, 2017 | 2,151,000 | 1,831,845 |
|
| Commercial Mortgage Pass-Through | | |
| Certificates 144A | | |
| Ser. 06-CN2A, Class H, 5.57s, 2019 | 1,271,000 | 800,117 |
| Ser. 06-CN2A, Class J, 5.57s, 2019 | 1,017,000 | 712,117 |
| FRB Ser. 01-J2A, Class A2F, 4.969s, 2034 | 1,960,000 | 1,626,800 |
| Ser. 03-LB1A, Class X1, IO, 0.454s, 2038 | 11,498,542 | 352,787 |
| Ser. 05-LP5, Class XC, IO, 0.086s, 2043 | 73,448,692 | 464,875 |
| Ser. 06-C8, Class XS, IO, 0.067s, 2046 | 81,016,832 | 525,460 |
| Ser. 05-C6, Class XC, IO, 0.064s, 2044 | 85,610,471 | 370,337 |
|
| Countrywide Alternative Loan Trust | | |
| Ser. 06-45T1, Class 2A2, 6s, 2037 | 1,949,273 | 1,154,639 |
| Ser. 05-24, Class 1AX, IO, 1.222s, 2035 | 7,619,364 | 175,007 |
|
| Countrywide Home Loans | | |
| FRB Ser. 05-HYB7, Class 6A1, 5.711s, 2035 | 99,156 | 66,435 |
| Ser. 05-9, Class 1X, IO, zero, 2035 | 9,882,990 | 227,772 |
| Ser. 05-2, Class 2X, IO, 1.16s, 2035 | 9,818,599 | 210,179 |
|
| Countrywide Home Loans 144A | | |
| IFB Ser. 05-R2, Class 2A3, 8s, 2035 | 789,283 | 747,837 |
| IFB Ser. 05-R1, Class 1AS, IO, 2.82s, 2035 | 7,029,959 | 430,233 |
| IFB Ser. 05-R2, Class 1AS, IO, 2.458s, 2035 | 9,249,268 | 508,710 |
|
| Credit Suisse Mortgage Capital Certificates | | |
| FRB Ser. 07-C4, Class A2, 5.811s, 2039 F | 7,233,000 | 6,462,883 |
| Ser. 06-C5, Class AX, IO, 0.092s, 2039 | 51,618,885 | 454,091 |
|
| Credit Suisse Mortgage Capital | | |
| Certificates 144A | | |
| Ser. 07-C2, Class AX, IO, 0.114s, 2049 | 159,283,104 | 846,271 |
| Ser. 06-C4, Class AX, IO, 0.114s, 2039 | 103,568,915 | 807,838 |
| Ser. 07-C1, Class AX, IO, 0.07s, 2040 | 103,824,964 | 486,731 |
| Ser. 06-C3, Class AX, IO, 0.02s, 2038 | 427,594,445 | 216,790 |
|
| CRESI Finance Limited Partnership 144A | | |
| FRB Ser. 06-A, Class D, 4.059s, 2017 | 308,000 | 254,254 |
| FRB Ser. 06-A, Class C, 3.859s, 2017 | 913,000 | 795,862 |
|
| Criimi Mae Commercial Mortgage Trust | | |
| 144A Ser. 98-C1, Class B, 7s, 2033 | 4,675,077 | 4,725,402 |
|
| Crown Castle Towers, LLC 144A Ser. 05-1A, | | |
| Class D, 5.612s, 2035 | 3,575,000 | 3,074,500 |
|
| | |
| COLLATERALIZED MORTGAGE | Principal | |
| OBLIGATIONS (55.8%)* cont. | amount | Value |
|
| CS First Boston Mortgage Securities Corp. | | |
| Ser. 97-C2, Class F, 7.46s, 2035 | $1,193,000 | $1,229,822 |
| Ser. 04-C2, Class A2, 5.416s, 2036 | 6,060,000 | 4,868,604 |
| FRB Ser. 04-C3, Class A5, 5.113s, 2036 | 59,000 | 48,292 |
| Ser. 04-C3, Class A3, 4.302s, 2036 F | 127,000 | 124,274 |
|
| CS First Boston Mortgage Securities Corp. 144A | | |
| FRB Ser. 05-TFLA, Class J, 5.51s, 2020 | 323,500 | 274,975 |
| FRB Ser. 04-TF2A, Class J, 5.51s, 2016 | 414,000 | 364,320 |
| FRB Ser. 04-TF2A, Class H, 5.26s, 2019 | 825,000 | 750,750 |
| Ser. 01-CK1, Class AY, IO, 0.781s, 2035 | 74,075,545 | 814,831 |
| Ser. 03-C3, Class AX, IO, 0.524s, 2038 | 90,377,777 | 3,127,071 |
| Ser. 02-CP3, Class AX, IO, 0.427s, 2035 | 22,781,660 | 756,351 |
| Ser. 04-C4, Class AX, IO, 0.242s, 2039 | 15,027,594 | 233,168 |
| Ser. 05-C2, Class AX, IO, 0.136s, 2037 | 83,509,510 | 837,767 |
|
| Deutsche Mortgage & Asset Receiving Corp. | | |
| Ser. 98-C1, Class X, IO, 0 5/8s, 2031 | 175,983 | 4,301 |
|
| DLJ Commercial Mortgage Corp. | | |
| Ser. 00-CF1, Class A1B, 7.62s, 2033 | 2,821,392 | 2,821,388 |
| Ser. 99-CG2, Class B3, 6.1s, 2032 | 2,455,000 | 2,459,885 |
| Ser. 99-CG2, Class B4, 6.1s, 2032 | 3,434,000 | 3,219,557 |
| Ser. 98-CF2, Class B3, 6.04s, 2031 | 1,075,367 | 1,094,261 |
|
| Fannie Mae | | |
| IFB Ser. 06-70, Class SM, 27.126s, 2036 | 439,033 | 588,644 |
| IFB Ser. 07-75, Class JS, 26.29s, 2037 | 3,066,937 | 4,109,251 |
| IFB Ser. 07-80, Class AS, 23.29s, 2037 | 1,278,368 | 1,601,755 |
| IFB Ser. 07-75, Class CS, 22.689s, 2037 | 1,944,263 | 2,521,001 |
| IFB Ser. 06-62, Class PS, 20.348s, 2036 | 1,025,433 | 1,296,154 |
| IFB Ser. 07-60, Class SB, 20.048s, 2037 | 1,157,326 | 1,374,126 |
| IFB Ser. 06-76, Class QB, 20.048s, 2036 | 2,009,236 | 2,515,016 |
| IFB Ser. 06-48, Class TQ, 20.048s, 2036 | 3,398,884 | 4,174,126 |
| IFB Ser. 06-63, Class SP, 19.748s, 2036 | 2,199,541 | 2,716,814 |
| IFB Ser. 07-W7, Class 1A4, 19.628s, 2037 | 1,914,469 | 1,837,891 |
| IFB Ser. 07-81, Class SC, 18.248s, 2037 | 1,832,575 | 2,112,968 |
| IFB Ser. 07-1, Class NK, 17.827s, 2037 | 4,919,944 | 5,947,322 |
| IFB Ser. 06-104, Class GS, 17.725s, 2036 | 1,164,658 | 1,366,401 |
| IFB Ser. 06-104, Class ES, 17.156s, 2036 | 2,254,074 | 2,708,491 |
| IFB Ser. 05-37, Class SU, 16.165s, 2035 | 2,589,267 | 3,026,876 |
| IFB Ser. 06-49, Class SE, 15.965s, 2036 | 3,209,631 | 3,708,665 |
| IFB Ser. 06-60, Class AK, 15.765s, 2036 | 1,576,612 | 1,783,645 |
| IFB Ser. 06-60, Class TK, 15.565s, 2036 | 992,836 | 1,110,095 |
| IFB Ser. 06-104, Class CS, 15.036s, 2036 | 2,300,138 | 2,463,530 |
| IFB Ser. 07-30, Class FS, 14.734s, 2037 | 5,018,939 | 5,442,844 |
| IFB Ser. 07-96, Class AS, 13.856s, 2037 | 2,127,164 | 2,229,332 |
| IFB Ser. 05-25, Class PS, 13.822s, 2035 | 84,329 | 91,697 |
| IFB Ser. 06-115, Class ES, 13.525s, 2036 | 2,199,442 | 2,433,673 |
| IFB Ser. 06-8, Class PK, 13.365s, 2036 | 3,344,720 | 3,450,119 |
| IFB Ser. 05-57, Class CD, 12.905s, 2035 | 1,397,964 | 1,581,970 |
| IFB Ser. 05-74, Class CP, 12.801s, 2035 | 1,614,102 | 1,700,900 |
| IFB Ser. 05-115, Class NQ, 12.717s, 2036 | 918,135 | 1,006,268 |
| IFB Ser. 06-27, Class SP, 12.618s, 2036 | 2,579,715 | 2,814,224 |
| IFB Ser. 06-8, Class HP, 12.618s, 2036 | 2,744,527 | 2,978,102 |
| IFB Ser. 06-8, Class WK, 12.618s, 2036 | 4,393,371 | 4,717,923 |
| IFB Ser. 05-99, Class SA, 12.618s, 2035 | 1,892,694 | 2,036,993 |
| IFB Ser. 05-45, Class DA, 12.471s, 2035 | 2,996,076 | 3,170,956 |
| IFB Ser. 05-74, Class DM, 12.435s, 2035 | 3,841,952 | 4,135,331 |
| IFB Ser. 05-45, Class DC, 12.361s, 2035 | 2,362,836 | 2,544,798 |
| IFB Ser. 06-60, Class CS, 12.141s, 2036 | 1,037,761 | 1,035,283 |
| IFB Ser. 05-57, Class DC, 11.184s, 2034 | 2,455,293 | 2,623,103 |
| IFB Ser. 05-74, Class SK, 11.168s, 2035 | 3,054,544 | 3,130,945 |
| IFB Ser. 05-74, Class CS, 11.058s, 2035 | 1,839,592 | 1,928,338 |
| IFB Ser. 05-114, Class SP, 10.618s, 2036 | 1,146,153 | 1,143,776 |
| IFB Ser. 05-45, Class PC, 10.474s, 2034 | 1,153,626 | 1,224,168 |
| IFB Ser. 05-95, Class OP, 10.29s, 2035 | 1,191,292 | 1,284,221 |
| IFB Ser. 05-95, Class CP, 10.196s, 2035 | 275,995 | 297,970 |
| IFB Ser. 05-106, Class JC, 10.019s, 2035 | 718,137 | 674,316 |
| FRB Ser. 03-W6, Class PT1, 9.997s, 2042 | 610,139 | 703,361 |
22
| | |
| COLLATERALIZED MORTGAGE | Principal | |
| OBLIGATIONS (55.8%)* cont. | amount | Value |
|
| Fannie Mae | | |
| Ser. 02-T12, Class A4, 9 1/2s, 2042 | $230,626 | $249,535 |
| Ser. 02-T6, Class A3, 9 1/2s, 2041 | 452,229 | 485,538 |
| Ser. 02-T1, Class A4, 9 1/2s, 2031 | 50,365 | 52,552 |
| Ser. 04-T3, Class PT1, 9.017s, 2044 | 426,242 | 465,878 |
| IFB Ser. 05-83, Class QP, 8.921s, 2034 | 653,323 | 665,878 |
| IFB Ser. 05-72, Class SB, 8.728s, 2035 | 2,142,769 | 2,045,309 |
| Ser. 383, Class 90, IO, 8s, 2037 | 148,109 | 27,248 |
| Ser. 383, Class 91, IO, 8s, 2037 | 117,362 | 20,494 |
| Ser. 04-T3, Class 1A4, 7 1/2s, 2044 | 562,875 | 608,155 |
| Ser. 03-W1, Class 2A, 7 1/2s, 2042 | 1,789,743 | 1,852,384 |
| Ser. 02-T12, Class A3, 7 1/2s, 2042 | 330,008 | 348,499 |
| Ser. 02-T4, Class A3, 7 1/2s, 2041 | 128,094 | 134,965 |
| Ser. 01-T3, Class A1, 7 1/2s, 2040 | 425,255 | 447,897 |
| Ser. 01-T1, Class A1, 7 1/2s, 2040 | 736,897 | 760,616 |
| Ser. 99-T2, Class A1, 7 1/2s, 2039 | 240,267 | 261,956 |
| Ser. 386, Class 26, IO, 7 1/2s, 2038 | 298,913 | 65,284 |
| Ser. 386, Class 27, IO, 7 1/2s, 2037 | 175,532 | 40,208 |
| Ser. 386, Class 28, IO, 7 1/2s, 2037 | 171,528 | 30,116 |
| Ser. 383, Class 88, IO, 7 1/2s, 2037 | 319,093 | 68,227 |
| Ser. 383, Class 89, IO, 7 1/2s, 2037 | 248,638 | 44,667 |
| Ser. 383, Class 87, IO, 7 1/2s, 2037 | 397,241 | 86,135 |
| Ser. 02-T1, Class A3, 7 1/2s, 2031 | 366,367 | 378,160 |
| Ser. 01-T5, Class A3, 7 1/2s, 2030 | 214,008 | 220,896 |
| Ser. 04-T3, Class 1A3, 7s, 2044 | 1,326,393 | 1,399,166 |
| Ser. 04-T2, Class 1A3, 7s, 2043 | 1,002,620 | 1,060,891 |
| Ser. 03-W3, Class 1A2, 7s, 2042 | 591,801 | 626,479 |
| Ser. 01-W3, Class A, 7s, 2041 | 416,461 | 437,210 |
| Ser. 386, Class 24, IO, 7s, 2038 | 256,597 | 56,890 |
| Ser. 386, Class 25, IO, 7s, 2038 | 273,158 | 50,959 |
| Ser. 386, Class 22, IO, 7s, 2038 | 351,974 | 79,820 |
| Ser. 386, Class 21, IO, 7s, 2037 | 395,441 | 85,873 |
| Ser. 386, Class 23, IO, 7s, 2037 | 390,607 | 87,900 |
| Ser. 383, Class 84, IO, 7s, 2037 | 366,039 | 90,780 |
| Ser. 383, Class 85, IO, 7s, 2037 | 232,987 | 56,774 |
| Ser. 383, Class 86, IO, 7s, 2037 | 183,538 | 35,164 |
| Ser. 383, Class 79, IO, 7s, 2037 | 368,714 | 85,375 |
| Ser. 383, Class 80, IO, 7s, 2037 | 806,751 | 154,251 |
| Ser. 383, Class 81, IO, 7s, 2037 | 442,722 | 101,528 |
| Ser. 383, Class 82, IO, 7s, 2037 | 441,350 | 100,057 |
| Ser. 383, Class 83, IO, 7s, 2037 | 371,153 | 91,582 |
| Ser. 05-W4, Class 1A3, 7s, 2035 | 1,574,917 | 1,654,533 |
| Ser. 04-W1, Class 2A2, 7s, 2033 | 3,438,952 | 3,626,333 |
| Ser. 386, Class 14, IO, 6 1/2s, 2038 | 3,212,416 | 574,380 |
| Ser. 386, Class 19, IO, 6 1/2s, 2038 | 378,664 | 84,032 |
| Ser. 386, Class 17, IO, 6 1/2s, 2037 | 582,780 | 104,201 |
| Ser. 386, Class 16, IO, 6 1/2s, 2037 | 400,536 | 105,097 |
| Ser. 383, Class 60, IO, 6 1/2s, 2037 | 1,843,700 | 375,746 |
| Ser. 383, Class 62, IO, 6 1/2s, 2037 | 514,612 | 134,133 |
| Ser. 383, Class 69, IO, 6 1/2s, 2037 | 292,721 | 48,096 |
| Ser. 383, Class 63, IO, 6 1/2s, 2037 | 402,005 | 95,888 |
| Ser. 383, Class 64, IO, 6 1/2s, 2037 | 741,002 | 149,090 |
| Ser. 383, Class 67, IO, 6 1/2s, 2037 | 392,314 | 102,307 |
| Ser. 383, Class 68, IO, 6 1/2s, 2037 | 189,783 | 50,337 |
| Ser. 383, Class 58, IO, 6 1/2s, 2037 | 856,395 | 161,687 |
| Ser. 383, Class 59, IO, 6 1/2s, 2037 | 540,866 | 125,081 |
| Ser. 383, Class 61, IO, 6 1/2s, 2037 | 431,463 | 103,427 |
| Ser. 383, Class 65, IO, 6 1/2s, 2037 | 514,229 | 137,483 |
| Ser. 383, Class 66, IO, 6 1/2s, 2037 | 524,244 | 140,413 |
| Ser. 383, Class 72, IO, 6 1/2s, 2037 | 2,064,293 | 401,299 |
| Ser. 383, Class 77, IO, 6 1/2s, 2037 | 311,608 | 75,924 |
| Ser. 383, Class 78, IO, 6 1/2s, 2037 | 319,058 | 51,178 |
| Ser. 381, Class 14, IO, 6 1/2s, 2037 | 2,517,003 | 440,476 |
| Ser. 381, Class 16, IO, 6 1/2s, 2037 | 569,410 | 90,683 |
| Ser. 381, Class 15, IO, 6 1/2s, 2037 | 1,152,195 | 201,634 |
| Ser. 383, Class 73, IO, 6 1/2s, 2037 | 704,322 | 134,666 |
| Ser. 383, Class 76, IO, 6 1/2s, 2037 | 426,651 | 114,909 |
| | |
| COLLATERALIZED MORTGAGE | Principal | |
| OBLIGATIONS (55.8%)* cont. | amount | Value |
|
| Fannie Mae | | |
| Ser. 383, Class 70, IO, 6 1/2s, 2037 | $1,087,544 | $207,938 |
| Ser. 383, Class 74, IO, 6 1/2s, 2037 | 582,504 | 111,375 |
| Ser. 383, Class 71, IO, 6 1/2s, 2036 | 460,679 | 107,294 |
| Ser. 383, Class 75, IO, 6 1/2s, 2036 | 370,476 | 90,057 |
| Ser. 371, Class 2, IO, 6 1/2s, 2036 | 1,149,586 | 269,233 |
| Ser. 383, Class 101, IO, 6 1/2s, 2022 | 172,624 | 30,818 |
| Ser. 383, Class 102, IO, 6 1/2s, 2022 | 104,120 | 15,386 |
| Ser. 389, Class 6, IO, 6s, 2038 | 123,952 | 22,782 |
| Ser. 08-76, Class JI, IO, 6s, 2038 | 3,563,760 | 726,294 |
| Ser. 386, Class 10, IO, 6s, 2038 | 282,583 | 69,575 |
| Ser. 386, Class 11, IO, 6s, 2038 | 188,681 | 34,285 |
| Ser. 383, Class 41, IO, 6s, 2038 | 3,127,678 | 598,012 |
| Ser. 383, Class 42, IO, 6s, 2038 | 2,262,089 | 434,095 |
| Ser. 383, Class 43, IO, 6s, 2038 | 2,043,445 | 390,707 |
| Ser. 383, Class 44, IO, 6s, 2038 | 1,866,401 | 363,948 |
| Ser. 383, Class 45, IO, 6s, 2038 | 1,438,333 | 280,475 |
| Ser. 383, Class 46, IO, 6s, 2038 | 1,249,630 | 243,678 |
| Ser. 383, Class 47, IO, 6s, 2038 | 1,106,544 | 213,010 |
| Ser. 383, Class 48, IO, 6s, 2038 | 993,510 | 197,510 |
| Ser. 383, Class 52, IO, 6s, 2038 | 402,763 | 92,589 |
| Ser. 386, Class 9, IO, 6s, 2038 | 1,793,987 | 320,765 |
| Ser. 383, Class 28, IO, 6s, 2038 | 3,743,499 | 753,192 |
| Ser. 383, Class 29, IO, 6s, 2038 | 3,343,524 | 672,717 |
| Ser. 383, Class 30, IO, 6s, 2038 | 2,484,402 | 493,899 |
| Ser. 383, Class 31, IO, 6s, 2038 | 2,191,355 | 435,641 |
| Ser. 383, Class 32, IO, 6s, 2038 | 1,700,142 | 337,988 |
| Ser. 383, Class 33, IO, 6s, 2038 | 1,454,255 | 287,215 |
| Ser. 383, Class 37, IO, 6s, 2038 | 565,502 | 138,536 |
| Ser. 386, Class 7, IO, 6s, 2038 | 2,199,400 | 426,244 |
| Ser. 383, Class 34, IO, 6s, 2037 | 588,449 | 116,219 |
| Ser. 383, Class 35, IO, 6s, 2037 | 485,601 | 117,483 |
| Ser. 383, Class 36, IO, 6s, 2037 | 382,601 | 92,175 |
| Ser. 383, Class 38, IO, 6s, 2037 | 239,874 | 56,742 |
| Ser. 383, Class 50, IO, 6s, 2037 | 677,925 | 129,619 |
| Ser. 386, Class 6, IO, 6s, 2037 | 1,054,323 | 197,686 |
| Ser. 383, Class 39, IO, 6s, 2037 | 160,799 | 28,863 |
| Ser. 383, Class 49, IO, 6s, 2037 | 510,120 | 122,627 |
| Ser. 383, Class 51, IO, 6s, 2037 | 526,560 | 117,431 |
| Ser. 383, Class 53, IO, 6s, 2037 | 194,593 | 46,818 |
| Ser. 383, Class 54, IO, 6s, 2037 | 126,264 | 30,354 |
| Ser. 383, Class 55, IO, 6s, 2037 | 105,507 | 25,341 |
| Ser. 383, Class 56, IO, 6s, 2037 | 83,358 | 18,927 |
| Ser. 383, Class 57, IO, 6s, 2037 | 321,875 | 59,117 |
| Ser. 383, Class 100, IO, 6s, 2022 | 178,658 | 25,957 |
| Ser. 383, Class 98, IO, 6s, 2022 | 552,061 | 103,956 |
| Ser. 383, Class 99, IO, 6s, 2022 | 242,586 | 44,110 |
| Ser. 383, Class 18, IO, 5 1/2s, 2038 | 1,974,868 | 394,974 |
| Ser. 383, Class 19, IO, 5 1/2s, 2038 | 1,801,045 | 360,209 |
| Ser. 383, Class 25, IO, 5 1/2s, 2038 | 307,662 | 71,937 |
| Ser. 386, Class 4, IO, 5 1/2s, 2037 | 445,875 | 110,082 |
| Ser. 386, Class 5, IO, 5 1/2s, 2037 | 285,503 | 60,074 |
| Ser. 383, Class 15, IO, 5 1/2s, 2037 | 273,047 | 64,016 |
| Ser. 383, Class 16, IO, 5 1/2s, 2037 | 118,799 | 24,368 |
| Ser. 383, Class 4, IO, 5 1/2s, 2037 | 2,756,739 | 548,040 |
| Ser. 383, Class 5, IO, 5 1/2s, 2037 | 1,750,633 | 348,026 |
| Ser. 383, Class 6, IO, 5 1/2s, 2037 | 1,572,712 | 312,655 |
| Ser. 383, Class 7, IO, 5 1/2s, 2037 | 1,549,735 | 308,087 |
| Ser. 383, Class 8, IO, 5 1/2s, 2037 | 628,515 | 126,897 |
| Ser. 383, Class 9, IO, 5 1/2s, 2037 | 599,409 | 121,021 |
| Ser. 383, Class 20, IO, 5 1/2s, 2037 | 1,115,382 | 228,653 |
| Ser. 383, Class 21, IO, 5 1/2s, 2037 | 1,054,858 | 216,246 |
| Ser. 383, Class 22, IO, 5 1/2s, 2037 | 714,276 | 146,427 |
| Ser. 383, Class 23, IO, 5 1/2s, 2037 | 644,005 | 132,021 |
| Ser. 383, Class 24, IO, 5 1/2s, 2037 | 450,444 | 108,339 |
| Ser. 383, Class 26, IO, 5 1/2s, 2037 | 331,783 | 85,268 |
| Ser. 383, Class 27, IO, 5 1/2s, 2037 | 96,472 | 19,569 |
23
| | |
| COLLATERALIZED MORTGAGE | Principal | |
| OBLIGATIONS (55.8%)* cont. | amount | Value |
|
| Fannie Mae | | |
| Ser. 383, Class 95, IO, 5 1/2s, 2022 | $877,476 | $127,761 |
| Ser. 383, Class 97, IO, 5 1/2s, 2022 | 369,549 | 56,489 |
| Ser. 383, Class 94, IO, 5 1/2s, 2022 | 441,044 | 85,511 |
| Ser. 383, Class 96, IO, 5 1/2s, 2022 | 479,555 | 88,344 |
| Ser. 386, Class 1, IO, 5s, 2037 | 95,482 | 22,931 |
| Ser. 383, Class 2, IO, 5s, 2037 | 296,677 | 64,393 |
| Ser. 383, Class 92, IO, 5s, 2022 | 383,724 | 63,469 |
| Ser. 383, Class 93, IO, 5s, 2022 | 209,638 | 34,434 |
| IFB Ser. 07-W6, Class 6A2, IO, 4.541s, 2037 | 2,388,059 | 225,433 |
| IFB Ser. 06-90, Class SE, IO, 4.541s, 2036 | 2,574,148 | 299,103 |
| IFB Ser. 03-66, Class SA, IO, 4.391s, 2033 | 3,185,381 | 338,947 |
| IFB Ser. 07-W6, Class 5A2, IO, 4.031s, 2037 | 3,626,328 | 312,590 |
| IFB Ser. 07-W4, Class 4A2, IO, 4.021s, 2037 | 15,749,880 | 1,357,640 |
| IFB Ser. 07-W2, Class 3A2, IO, 4.021s, 2037 | 4,612,731 | 400,846 |
| IFB Ser. 06-115, Class BI, IO, 4.001s, 2036 | 4,261,195 | 321,124 |
| IFB Ser. 05-113, Class AI, IO, 3.971s, 2036 | 815,642 | 77,448 |
| IFB Ser. 05-113, Class DI, IO, 3.971s, 2036 | 34,892,633 | 3,278,163 |
| IFB Ser. 05-52, Class DC, IO, 3.941s, 2035 | 2,496,275 | 334,202 |
| IFB Ser. 06-60, Class SI, IO, 3.891s, 2036 | 4,597,480 | 465,265 |
| IFB Ser. 06-60, Class UI, IO, 3.891s, 2036 | 1,857,449 | 216,934 |
| IFB Ser. 04-24, Class CS, IO, 3.891s, 2034 | 4,514,486 | 553,472 |
| IFB Ser. 07-W7, Class 3A2, IO, 3.871s, 2037 | 6,653,907 | 642,972 |
| IFB Ser. 03-122, Class SA, IO, 3.841s, 2028 | 5,542,931 | 425,503 |
| IFB Ser. 03-122, Class SJ, IO, 3.841s, 2028 | 5,737,546 | 429,162 |
| IFB Ser. 06-60, Class DI, IO, 3.811s, 2035 | 2,316,969 | 175,163 |
| IFB Ser. 04-60, Class SW, IO, 3.791s, 2034 | 8,255,525 | 789,228 |
| IFB Ser. 05-65, Class KI, IO, 3.741s, 2035 | 16,693,625 | 1,262,038 |
| IFB Ser. 08-10, Class LI, IO, 3.721s, 2038 | 189,991 | 18,524 |
| IFB Ser. 08-01, Class GI, IO, 3.701s, 2037 | 20,612,234 | 2,009,693 |
| IFB Ser. 07-39, Class LI, IO, 3.511s, 2037 | 102,155 | 9,711 |
| IFB Ser. 07-23, Class SI, IO, 3.511s, 2037 | 3,719,255 | 294,619 |
| IFB Ser. 07-54, Class CI, IO, 3.501s, 2037 | 3,109,489 | 274,664 |
| IFB Ser. 07-39, Class PI, IO, 3.501s, 2037 | 2,868,024 | 237,241 |
| IFB Ser. 07-30, Class WI, IO, 3.501s, 2037 | 27,325,834 | 2,328,216 |
| IFB Ser. 07-28, Class SE, IO, 3.491s, 2037 | 3,187,744 | 281,468 |
| IFB Ser. 06-128, Class SH, IO, 3.491s, 2037 | 3,496,943 | 285,653 |
| IFB Ser. 06-56, Class SM, IO, 3.491s, 2036 | 8,788,439 | 736,691 |
| IFB Ser. 05-73, Class SI, IO, 3.491s, 2035 | 1,888,355 | 141,851 |
| IFB Ser. 05-12, Class SC, IO, 3.491s, 2035 | 3,069,104 | 306,541 |
| IFB Ser. 05-17, Class ES, IO, 3.491s, 2035 | 3,584,401 | 324,738 |
| IFB Ser. 05-17, Class SY, IO, 3.491s, 2035 | 1,668,925 | 156,541 |
| IFB Ser. 07-W5, Class 2A2, IO, 3.481s, 2037 | 1,460,396 | 127,785 |
| IFB Ser. 07-30, Class IE, IO, 3.481s, 2037 | 8,736,457 | 910,243 |
| IFB Ser. 06-123, Class CI, IO, 3.481s, 2037 | 7,189,349 | 624,805 |
| IFB Ser. 06-123, Class UI, IO, 3.481s, 2037 | 3,158,583 | 272,270 |
| IFB Ser. 05-82, Class SY, IO, 3.471s, 2035 | 7,303,408 | 522,924 |
| IFB Ser. 05-45, Class EW, IO, 3.461s, 2035 | 2,534,844 | 222,405 |
| IFB Ser. 05-45, Class SR, IO, 3.461s, 2035 | 9,691,838 | 839,323 |
| IFB Ser. 07-15, Class BI, IO, 3.441s, 2037 | 5,091,936 | 422,116 |
| IFB Ser. 06-126, Class CS, IO, 3.441s, 2037 | 2,002,267 | 165,489 |
| IFB Ser. 06-16, Class SM, IO, 3.441s, 2036 | 2,735,604 | 248,647 |
| IFB Ser. 05-95, Class CI, IO, 3.441s, 2035 | 4,245,714 | 400,375 |
| IFB Ser. 05-84, Class SG, IO, 3.441s, 2035 | 7,052,022 | 652,312 |
| IFB Ser. 05-57, Class NI, IO, 3.441s, 2035 | 1,610,242 | 148,536 |
| IFB Ser. 05-54, Class SA, IO, 3.441s, 2035 | 6,927,011 | 603,931 |
| IFB Ser. 05-23, Class SG, IO, 3.441s, 2035 | 5,402,140 | 516,086 |
| IFB Ser. 05-17, Class SA, IO, 3.441s, 2035 | 4,747,102 | 421,234 |
| IFB Ser. 05-17, Class SE, IO, 3.441s, 2035 | 5,169,988 | 437,709 |
| IFB Ser. 05-57, Class DI, IO, 3.441s, 2035 | 10,508,625 | 846,995 |
| IFB Ser. 05-83, Class QI, IO, 3.431s, 2035 | 1,149,910 | 124,454 |
| IFB Ser. 06-128, Class GS, IO, 3.421s, 2037 | 3,487,965 | 300,778 |
| IFB Ser. 06-114, Class IS, IO, 3.391s, 2036 | 3,593,957 | 292,124 |
| IFB Ser. 06-116, Class ES, IO, 3.391s, 2036 | 2,557,754 | 209,864 |
| IFB Ser. 06-115, Class GI, IO, 3.381s, 2036 | 3,428,665 | 338,325 |
| IFB Ser. 06-115, Class IE, IO, 3.381s, 2036 | 2,740,374 | 254,584 |
| IFB Ser. 06-117, Class SA, IO, 3.381s, 2036 | 4,099,094 | 327,202 |
| | |
| COLLATERALIZED MORTGAGE | Principal | |
| OBLIGATIONS (55.8%)* cont. | amount | Value |
|
| Fannie Mae | | |
| IFB Ser. 06-121, Class SD, IO, 3.381s, 2036 | $7,538,642 | $612,138 |
| IFB Ser. 06-109, Class SG, IO, 3.371s, 2036 | 4,840,894 | 405,667 |
| IFB Ser. 06-104, Class IM, IO, 3.361s, 2036 | 1,774,441 | 148,297 |
| IFB Ser. 06-104, Class SY, IO, 3.361s, 2036 | 2,627,248 | 212,605 |
| IFB Ser. 06-109, Class SH, IO, 3.361s, 2036 | 3,702,435 | 351,039 |
| Ser. 06-104, Class SG, IO, 3.341s, 2036 | 5,873,297 | 461,923 |
| IFB Ser. 07-W6, Class 4A2, IO, 3.341s, 2037 | 14,792,700 | 1,294,361 |
| IFB Ser. 06-128, Class SC, IO, 3.341s, 2037 | 11,464,743 | 922,488 |
| IFB Ser. 06-43, Class SI, IO, 3.341s, 2036 | 10,598,147 | 854,264 |
| IFB Ser. 06-44, Class IS, IO, 3.341s, 2036 | 5,078,302 | 477,479 |
| IFB Ser. 06-8, Class JH, IO, 3.341s, 2036 | 12,719,784 | 1,096,089 |
| IFB Ser. 05-122, Class SG, IO, 3.341s, 2035 | 2,773,422 | 257,393 |
| IFB Ser. 05-95, Class OI, IO, 3.331s, 2035 | 659,598 | 64,401 |
| IFB Ser. 06-92, Class JI, IO, 3.321s, 2036 | 2,649,408 | 213,615 |
| IFB Ser. 06-92, Class LI, IO, 3.321s, 2036 | 4,041,115 | 327,641 |
| IFB Ser. 06-96, Class ES, IO, 3.321s, 2036 | 4,433,640 | 313,492 |
| IFB Ser. 06-99, Class AS, IO, 3.321s, 2036 | 3,076,471 | 263,346 |
| IFB Ser. 06-85, Class TS, IO, 3.301s, 2036 | 6,037,608 | 487,036 |
| IFB Ser. 06-61, Class SE, IO, 3.291s, 2036 | 6,024,294 | 456,780 |
| IFB Ser. 07-75, Class PI, IO, 3.281s, 2037 | 4,347,516 | 351,149 |
| IFB Ser. 07-76, Class SA, IO, 3.281s, 2037 | 4,861,498 | 341,229 |
| IFB Ser. 07-W7, Class 2A2, IO, 3.271s, 2037 | 11,716,070 | 1,053,754 |
| IFB Ser. 07-88, Class MI, IO, 3.261s, 2037 | 2,959,749 | 191,964 |
| Ser. 06-94, Class NI, IO, 3.241s, 2036 | 2,864,646 | 193,364 |
| IFB Ser. 07-116, Class IA, IO, 3.241s, 2037 | 16,609,202 | 1,411,782 |
| IFB Ser. 07-103, Class AI, IO, 3.241s, 2037 | 20,210,773 | 1,730,042 |
| IFB Ser. 07-1, Class NI, IO, 3.241s, 2037 | 10,615,266 | 868,371 |
| IFB Ser. 07-15, Class NI, IO, 3.241s, 2022 | 5,415,020 | 402,877 |
| IFB Ser. 08-3, Class SC, IO, 3.191s, 2038 | 3,149,158 | 274,813 |
| IFB Ser. 07-109, Class XI, IO, 3.191s, 2037 | 2,607,646 | 175,716 |
| IFB Ser. 07-109, Class YI, IO, 3.191s, 2037 | 4,758,428 | 369,359 |
| IFB Ser. 07-W8, Class 2A2, IO, 3.191s, 2037 | 8,797,526 | 612,669 |
| IFB Ser. 07-88, Class JI, IO, 3.191s, 2037 | 5,324,877 | 450,916 |
| IFB Ser. 07-54, Class KI, IO, 3.181s, 2037 | 2,207,590 | 156,210 |
| IFB Ser. 07-30, Class JS, IO, 3.181s, 2037 | 7,275,929 | 595,899 |
| IFB Ser. 07-30, Class LI, IO, 3.181s, 2037 | 12,984,897 | 1,094,260 |
| IFB Ser. 07-W2, Class 1A2, IO, 3.171s, 2037 | 3,006,632 | 275,209 |
| IFB Ser. 07-106, Class SN, IO, 3.151s, 2037 | 4,755,221 | 368,125 |
| IFB Ser. 07-54, Class IA, IO, 3.151s, 2037 | 3,872,915 | 306,839 |
| IFB Ser. 07-54, Class IB, IO, 3.151s, 2037 | 3,872,915 | 306,839 |
| IFB Ser. 07-54, Class IC, IO, 3.151s, 2037 | 3,872,915 | 306,839 |
| IFB Ser. 07-54, Class ID, IO, 3.151s, 2037 | 3,872,915 | 306,839 |
| IFB Ser. 07-54, Class IE, IO, 3.151s, 2037 | 3,872,915 | 306,839 |
| IFB Ser. 07-54, Class IF, IO, 3.151s, 2037 | 5,761,828 | 480,092 |
| IFB Ser. 07-54, Class NI, IO, 3.151s, 2037 | 3,340,374 | 254,497 |
| IFB Ser. 07-54, Class UI, IO, 3.151s, 2037 | 4,872,676 | 374,467 |
| IFB Ser. 07-109, Class AI, IO, 3.141s, 2037 | 14,257,825 | 1,157,735 |
| IFB Ser. 07-91, Class AS, IO, 3.141s, 2037 | 2,839,188 | 222,331 |
| IFB Ser. 07-91, Class HS, IO, 3.141s, 2037 | 3,312,806 | 282,494 |
| IFB Ser. 07-15, Class CI, IO, 3.121s, 2037 | 13,416,803 | 1,056,748 |
| IFB Ser. 06-123, Class BI, IO, 3.121s, 2037 | 16,326,574 | 1,268,999 |
| IFB Ser. 06-115, Class JI, IO, 3.121s, 2036 | 9,716,683 | 795,796 |
| IFB Ser. 07-109, Class PI, IO, 3.091s, 2037 | 4,535,070 | 332,997 |
| IFB Ser. 06-123, Class LI, IO, 3.061s, 2037 | 6,466,442 | 514,567 |
| IFB Ser. 08-1, Class NI, IO, 2.991s, 2037 | 7,749,892 | 581,242 |
| IFB Ser. 07-116, Class BI, IO, 2.991s, 2037 | 15,237,474 | 1,142,811 |
| IFB Ser. 08-01, Class AI, IO, 2.991s, 2037 | 25,539,246 | 2,055,986 |
| IFB Ser. 08-10, Class GI, IO, 2.971s, 2038 | 5,263,896 | 406,796 |
| IFB Ser. 08-1, Class HI, IO, 2.941s, 2037 | 11,887,676 | 933,052 |
| IFB Ser. 07-39, Class AI, IO, 2.861s, 2037 | 6,768,157 | 518,449 |
| IFB Ser. 07-32, Class SD, IO, 2.851s, 2037 | 4,606,736 | 391,932 |
| IFB Ser. 07-30, Class UI, IO, 2.841s, 2037 | 3,749,072 | 318,136 |
| IFB Ser. 07-32, Class SC, IO, 2.841s, 2037 | 6,113,997 | 444,402 |
| IFB Ser. 07-1, Class CI, IO, 2.841s, 2037 | 4,382,456 | 318,364 |
| IFB Ser. 05-74, Class SE, IO, 2.841s, 2035 | 8,452,482 | 594,049 |
| IFB Ser. 05-14, Class SE, IO, 2.791s, 2035 | 6,024,839 | 559,016 |
24
| | |
| COLLATERALIZED MORTGAGE | Principal | |
| OBLIGATIONS (55.8%)* cont. | amount | Value |
|
| Fannie Mae | | |
| IFB Ser. 05-58, Class IK, IO, 2.741s, 2035 | $5,325,278 | $464,195 |
| IFB Ser. 08-1, Class BI, IO, 2.651s, 2038 | 24,283,007 | 1,524,730 |
| IFB Ser. 07-75, Class ID, IO, 2.611s, 2037 | 3,948,405 | 269,431 |
| Ser. 03-W12, Class 2, IO, 2.22s, 2043 | 4,600,842 | 393,766 |
| Ser. 03-W10, Class 3, IO, 1.937s, 2043 | 6,875,534 | 499,692 |
| Ser. 03-W10, Class 1, IO, 1.917s, 2043 | 18,017,305 | 1,416,975 |
| Ser. 03-W8, Class 12, IO, 1.635s, 2042 | 32,869,707 | 2,210,899 |
| Ser. 03-W17, Class 12, IO, 1.147s, 2033 | 8,698,106 | 255,829 |
| Ser. 03-W19, IO, 1.093s, 2033 | 1,003,919 | 26,380 |
| Ser. 03-T2, Class 2, IO, 0.808s, 2042 | 51,213,282 | 1,010,551 |
| Ser. 03-W10, Class 3A, IO, 0.689s, 2043 | 691,195 | 9,746 |
| Ser. 03-W3, Class 2IO1, IO, 0.681s, 2042 | 20,013,627 | 348,912 |
| Ser. 03-W6, Class 51, IO, 0.671s, 2042 | 13,409,081 | 210,343 |
| Ser. 03-18, Class X1, IO, 0.667s, 2042 | 23,729,169 | 205,051 |
| Ser. 06-W3, Class 1AS, IO, 0.662s, 2046 | 16,203,797 | 1,003,015 |
| Ser. 03-W10, Class 1A, IO, 0.646s, 2043 | 577,220 | 7,318 |
| Ser. 01-T12, Class IO, 0.565s, 2041 | 22,847,164 | 353,939 |
| Ser. 03-W2, Class 1, IO, 0.465s, 2042 | 26,387,468 | 282,897 |
| Ser. 02-T4, IO, 0.448s, 2041 | 12,955,731 | 163,928 |
| Ser. 01-50, Class B1, IO, 0.445s, 2041 | 3,305,838 | 37,207 |
| Ser. 03-W3, Class 1, IO, 0.439s, 2042 | 17,834,062 | 188,226 |
| Ser. 02-T1, Class IO, IO, 0.424s, 2031 | 20,557,022 | 215,676 |
| Ser. 03-W6, Class 3, IO, 0.367s, 2042 | 18,918,070 | 179,703 |
| Ser. 03-W6, Class 23, IO, 0.352s, 2042 | 19,628,553 | 174,042 |
| Ser. 03-34, Class P1, Principal Only | | |
| (PO), zero %, 2043 | 93,617 | 70,021 |
| Ser. 08-33, PO, zero %, 2038 | 483,490 | 332,399 |
| Ser. 08-9, PO, zero %, 2038 | 348,244 | 243,771 |
| Ser. 07-89, Class PO, PO, zero %, 2037 | 684,670 | 459,695 |
| Ser. 07-64, Class LO, PO, zero %, 2037 | 1,737,181 | 1,275,752 |
| Ser. 07-47, Class B0, PO, zero %, 2037 | 339,112 | 271,490 |
| Ser. 07-14, Class KO, PO, zero %, 2037 | 797,312 | 558,263 |
| Ser. 06-125, Class MO, PO, zero %, 2037 | 1,230,561 | 842,047 |
| Ser. 06-125, Class OX, PO, zero %, 2037 | 323,686 | 238,324 |
| Ser. 06-116, Class OD, PO, zero %, 2036 | 275,367 | 183,582 |
| Ser. 06-84, Class OT, PO, zero %, 2036 | 142,921 | 112,849 |
| Ser. 06-56, Class XF, zero %, 2036 | 291,620 | 302,410 |
| Ser. 06-46, Class OC, PO, zero %, 2036 | 294,095 | 219,664 |
| Ser. 06-16, Class OG, PO, zero %, 2036 | 110,552 | 72,249 |
| Ser. 04-61, Class CO, PO, zero %, 2031 | 4,281,882 | 3,104,364 |
| Ser. 07-15, Class IM, IO, zero %, 2009 | 4,185,152 | 1,565 |
| Ser. 07-16, Class TS, IO, zero %, 2009 | 17,997,107 | 9,175 |
| FRB Ser. 07-76, Class SF, zero %, 2037 | 175,400 | 170,612 |
| FRB Ser. 06-115, Class SN, zero %, 2036 | 1,524,295 | 1,299,274 |
| FRB Ser. 06-104, Class EK, zero %, 2036 | 394,277 | 320,408 |
| FRB Ser. 05-117, Class GF, zero %, 2036 | 208,266 | 142,558 |
| FRB Ser. 05-57, Class UL, zero %, 2035 | 2,735,568 | 1,921,093 |
| FRB Ser. 05-36, Class QA, zero %, 2035 | 587,677 | 439,117 |
| FRB Ser. 05-65, Class CU, zero %, 2034 | 388,539 | 429,765 |
| FRB Ser. 05-81, Class DF, zero %, 2033 | 305,909 | 306,317 |
| FRB Ser. 06-1, Class HF, zero %, 2032 | 274,903 | 235,411 |
| IFB Ser. 06-75, Class FY, zero %, 2036 | 579,423 | 458,646 |
|
| Federal Home Loan Mortgage Corp. | | |
| Structured Pass-Through Securities | | |
| Ser. T-42, Class A6, 9 1/2s, 2042 | 236,613 | 264,292 |
| Ser. T-58, Class 4A, 7 1/2s, 2043 | 1,256,464 | 1,303,189 |
| Ser. T-51, Class 2A, 7 1/2s, 2042 | 1,335,273 | 1,384,929 |
| Ser. T-42, Class A5, 7 1/2s, 2042 | 887,350 | 969,813 |
| Ser. T-41, Class 2A, 6.984s, 2032 | 93,878 | 99,009 |
| IFB Ser. T-56, Class 2ASI, IO, 4.841s, 2043 | 2,385,229 | 286,227 |
| Ser. T-56, Class A, IO, 0.524s, 2043 | 11,479,226 | 177,051 |
| Ser. T-56, Class 3, IO, 0.367s, 2043 | 11,431,352 | 131,659 |
| Ser. T-56, Class 1, IO, 0.282s, 2043 | 14,847,854 | 128,455 |
| Ser. T-56, Class 2, IO, 0.022s, 2043 | 13,457,343 | 25,521 |
|
| FFCA Secured Lending Corp. 144A | | |
| Ser. 00-1, Class A2, 7.77s, 2027 | 4,207,840 | 3,366,272 |
|
| | |
| COLLATERALIZED MORTGAGE | Principal | |
| OBLIGATIONS (55.8%)* cont. | amount | Value |
|
| First Horizon Alternative Mortgage Securities | | |
| FRB Ser. 05-AA10, Class 2A1, 5.746s, 2035 | $2,560,865 | $1,536,519 |
|
| First Union National Bank-Bank of America | | |
| Commercial Mortgage 144A Ser. 01-C1, | | |
| Class 3, IO, 1.683s, 2033 | 38,685,257 | 1,129,610 |
|
| First Union-Lehman Brothers Commercial | | |
| Mortgage Trust II | | |
| Ser. 97-C2, Class F, 7 1/2s, 2029 | 3,492,000 | 3,730,050 |
| Ser. 97-C2, Class G, 7 1/2s, 2029 | 1,156,000 | 900,544 |
|
| First Union-Lehman Brothers-Bank of America | | |
| 144A Ser. 98-C2, Class G, 7s, 2035 | 4,500,000 | 3,154,050 |
|
| Freddie Mac | | |
| IFB Ser. 3339, Class WS, 13.247s, 2037 | 1,835,303 | 2,364,986 |
| IFB Ser. 3339, Class JS, 13.016s, 2037 | 1,586,865 | 1,944,656 |
| IFB Ser. 3360, Class SB, 11.94s, 2037 | 1,351,790 | 1,816,047 |
| IFB Ser. 3202, Class PS, 11.715s, 2036 | 938,935 | 1,131,425 |
| IFB Ser. 3349, Class SA, 11.475s, 2037 | 6,198,681 | 7,441,436 |
| IFB Ser. 3331, Class SE, 11.475s, 2037 | 1,499,944 | 1,767,987 |
| IFB Ser. 3202, Class HM, 10.312s, 2036 | 680,295 | 787,469 |
| IFB Ser. 3182, Class PS, 10 1/4s, 2032 | 2,513,882 | 2,965,654 |
| IFB Ser. 3153, Class JS, 10.163s, 2036 | 75,937 | 86,354 |
| IFB Ser. 3081, Class DC, 8.516s, 2035 | 1,562,188 | 1,683,630 |
| IFB Ser. 3114, Class GK, 8.05s, 2036 | 1,101,107 | 1,145,136 |
| IFB Ser. 2976, Class KL, 7.562s, 2035 | 2,877,731 | 2,995,009 |
| IFB Ser. 2990, Class DP, 7.453s, 2034 | 2,468,039 | 2,603,321 |
| IFB Ser. 2979, Class AS, 7.452s, 2034 | 692,006 | 726,721 |
| IFB Ser. 3408, Class EK, 7.334s, 2037 | 4,679,462 | 4,761,203 |
| IFB Ser. 3149, Class SU, 7.047s, 2036 | 1,353,230 | 1,295,296 |
| IFB Ser. 3360, Class SC, 6.681s, 2037 | 2,909,844 | 2,949,289 |
| IFB Ser. 3065, Class DC, 6.098s, 2035 | 2,536,967 | 2,453,648 |
| IFB Ser. 3012, Class FS, 5.406s, 2035 | 73,165 | 78,981 |
| IFB Ser. 2990, Class LB, 5.22s, 2034 | 2,954,809 | 2,725,819 |
| IFB Ser. 2990, Class WP, 5.192s, 2035 | 1,680,886 | 1,726,785 |
| IFB Ser. 2927, Class SI, IO, 3.913s, 2035 | 4,004,063 | 456,111 |
| IFB Ser. 2828, Class GI, IO, 2.913s, 2034 | 4,755,855 | 607,335 |
| IFB Ser. 3184, Class SP, IO, 2.763s, 2033 | 4,856,083 | 451,290 |
| IFB Ser. 2869, Class SH, IO, 2.713s, 2034 | 2,091,180 | 137,392 |
| IFB Ser. 2869, Class JS, IO, 2.663s, 2034 | 10,113,136 | 825,404 |
| IFB Ser. 2882, Class LS, IO, 2.613s, 2034 | 4,528,819 | 428,938 |
| IFB Ser. 3203, Class SH, IO, 2.553s, 2036 | 2,761,396 | 272,080 |
| IFB Ser. 2815, Class PT, IO, 2.463s, 2032 | 4,706,107 | 605,718 |
| IFB Ser. 2828, Class TI, IO, 2.463s, 2030 | 2,184,680 | 265,249 |
| IFB Ser. 3397, Class GS, IO, 2.413s, 2037 | 2,559,900 | 225,676 |
| IFB Ser. 3297, Class BI, IO, 2.173s, 2037 | 11,618,867 | 992,902 |
| IFB Ser. 3287, Class SD, IO, 2.163s, 2037 | 4,604,762 | 388,803 |
| IFB Ser. 3281, Class BI, IO, 2.163s, 2037 | 2,229,811 | 231,765 |
| IFB Ser. 3281, Class CI, IO, 2.163s, 2037 | 3,554,591 | 413,714 |
| IFB Ser. 3249, Class SI, IO, 2.163s, 2036 | 2,308,454 | 265,900 |
| IFB Ser. 3028, Class ES, IO, 2.163s, 2035 | 11,857,978 | 1,111,911 |
| IFB Ser. 2922, Class SE, IO, 2.163s, 2035 | 5,536,830 | 672,110 |
| IFB Ser. 3045, Class DI, IO, 2.143s, 2035 | 12,110,977 | 1,004,763 |
| IFB Ser. 3236, Class ES, IO, 2.113s, 2036 | 4,405,593 | 419,503 |
| IFB Ser. 3136, Class NS, IO, 2.113s, 2036 | 6,982,896 | 579,797 |
| IFB Ser. 3118, Class SD, IO, 2.113s, 2036 | 8,893,952 | 731,667 |
| IFB Ser. 3107, Class DC, IO, 2.113s, 2035 | 12,588,959 | 1,194,012 |
| IFB Ser. 2927, Class ES, IO, 2.113s, 2035 | 3,111,604 | 191,862 |
| IFB Ser. 2950, Class SM, IO, 2.113s, 2016 | 6,220,367 | 609,462 |
| IFB Ser. 3256, Class S, IO, 2.103s, 2036 | 5,280,088 | 485,240 |
| IFB Ser. 3031, Class BI, IO, 2.102s, 2035 | 2,308,957 | 330,171 |
| IFB Ser. 3244, Class SB, IO, 2.073s, 2036 | 3,199,119 | 330,856 |
| IFB Ser. 3244, Class SG, IO, 2.073s, 2036 | 3,731,966 | 307,182 |
| IFB Ser. 3236, Class IS, IO, 2.063s, 2036 | 5,793,451 | 481,436 |
| IFB Ser. 2962, Class BS, IO, 2.063s, 2035 | 13,258,249 | 973,156 |
| IFB Ser. 3114, Class TS, IO, 2.063s, 2030 | 24,684,505 | 2,123,114 |
| IFB Ser. 3128, Class JI, IO, 2.043s, 2036 | 7,768,984 | 675,125 |
| IFB Ser. 2990, Class LI, IO, 2.043s, 2034 | 4,513,702 | 519,666 |
25
| | |
| COLLATERALIZED MORTGAGE | Principal | |
| OBLIGATIONS (55.8%)* cont. | amount | Value |
|
| Freddie Mac | | |
| IFB Ser. 3240, Class S, IO, 2.033s, 2036 | $11,225,704 | $923,887 |
| IFB Ser. 3229, Class BI, IO, 2.033s, 2036 | 1,011,688 | 105,364 |
| IFB Ser. 3153, Class JI, IO, 2.033s, 2036 | 5,537,352 | 373,771 |
| IFB Ser. 3065, Class DI, IO, 2.033s, 2035 | 1,757,750 | 222,456 |
| IFB Ser. 3145, Class GI, IO, 2.013s, 2036 | 6,365,181 | 584,960 |
| IFB Ser. 3114, Class GI, IO, 2.013s, 2036 | 2,636,475 | 221,322 |
| IFB Ser. 3339, Class JI, IO, 2.003s, 2037 | 11,455,969 | 788,171 |
| IFB Ser. 3218, Class AS, IO, 1.993s, 2036 | 4,017,501 | 317,065 |
| IFB Ser. 3221, Class SI, IO, 1.993s, 2036 | 4,717,725 | 371,058 |
| IFB Ser. 3153, Class UI, IO, 1.983s, 2036 | 11,882,400 | 1,159,984 |
| IFB Ser. 3202, Class PI, IO, 1.953s, 2036 | 12,986,166 | 1,022,881 |
| IFB Ser. 3355, Class MI, IO, 1.913s, 2037 | 3,013,804 | 237,732 |
| IFB Ser. 3201, Class SG, IO, 1.913s, 2036 | 5,919,031 | 493,834 |
| IFB Ser. 3203, Class SE, IO, 1.913s, 2036 | 5,332,496 | 439,309 |
| IFB Ser. 3238, Class LI, IO, 1.903s, 2036 | 83,491 | 7,441 |
| IFB Ser. 3171, Class PS, IO, 1.898s, 2036 | 5,162,267 | 409,884 |
| IFB Ser. 3152, Class SY, IO, 1.893s, 2036 | 5,731,861 | 494,438 |
| IFB Ser. 3366, Class SA, IO, 1.863s, 2037 | 155,648 | 12,221 |
| IFB Ser. 3284, Class BI, IO, 1.863s, 2037 | 3,641,397 | 256,402 |
| IFB Ser. 3260, Class SA, IO, 1.863s, 2037 | 3,643,680 | 261,008 |
| IFB Ser. 3199, Class S, IO, 1.863s, 2036 | 3,139,673 | 260,352 |
| IFB Ser. 3284, Class LI, IO, 1.853s, 2037 | 17,045,848 | 1,347,491 |
| IFB Ser. 3281, Class AI, IO, 1.843s, 2037 | 13,590,917 | 1,128,850 |
| IFB Ser. 3311, Class EI, IO, 1.823s, 2037 | 3,732,206 | 329,308 |
| IFB Ser. 3311, Class IA, IO, 1.823s, 2037 | 5,491,229 | 460,815 |
| IFB Ser. 3311, Class IB, IO, 1.823s, 2037 | 5,491,229 | 460,815 |
| IFB Ser. 3311, Class IC, IO, 1.823s, 2037 | 5,491,229 | 460,815 |
| IFB Ser. 3311, Class ID, IO, 1.823s, 2037 | 5,491,229 | 460,815 |
| IFB Ser. 3311, Class IE, IO, 1.823s, 2037 | 7,874,527 | 660,817 |
| IFB Ser. 3240, Class GS, IO, 1.793s, 2036 | 6,757,952 | 549,036 |
| IFB Ser. 3416, Class BI, IO, 1.663s, 2038 | 328,182 | 24,861 |
| IFB Ser. 3339, Class TI, IO, 1.553s, 2037 | 6,086,175 | 479,227 |
| IFB Ser. 3284, Class CI, IO, 1.533s, 2037 | 10,334,579 | 747,748 |
| IFB Ser. 3016, Class SQ, IO, 1.523s, 2035 | 4,822,629 | 308,764 |
| IFB Ser. 3397, Class SQ, IO, 1.383s, 2037 | 13,592,284 | 917,017 |
| IFB Ser. 3424, Class UI, IO, 1.173s, 2037 | 114,690 | 7,471 |
| Ser. 3327, Class IF, IO, zero %, 2037 | 1,290,339 | 290,326 |
| Ser. 3403, PO, zero %, 2037 | 127,950 | 98,072 |
| Ser. 3369, Class BO, PO, zero %, 2037 | 87,049 | 62,082 |
| Ser. 3391, PO, zero %, 2037 | 261,192 | 181,750 |
| Ser. 3292, Class DO, PO, zero %, 2037 | 369,544 | 276,999 |
| Ser. 3292, Class OA, PO, zero %, 2037 | 255,734 | 167,410 |
| Ser. 3296, Class OK, PO, zero %, 2037 | 382,322 | 289,464 |
| Ser. 3274, Class MO, PO, zero %, 2037 | 116,557 | 85,505 |
| Ser. 3300, PO, zero %, 2037 | 2,730,877 | 1,996,817 |
| Ser. 3252, Class LO, PO, zero %, 2036 | 1,522,060 | 1,147,355 |
| Ser. 3255, Class CO, PO, zero %, 2036 | 521,685 | 348,553 |
| Ser. 3218, Class AO, PO, zero %, 2036 | 129,869 | 89,246 |
| Ser. 3206, Class EO, PO, zero %, 2036 | 215,826 | 171,459 |
| Ser. 3175, Class MO, PO, zero %, 2036 | 556,310 | 385,861 |
| Ser. 3210, PO, zero %, 2036 | 96,682 | 68,326 |
| Ser. 3139, Class CO, PO, zero %, 2036 | 1,349,086 | 1,018,584 |
| Ser. 2587, Class CO, PO, zero %, 2032 | 4,456,302 | 3,631,513 |
| FRB Ser. 3349, Class DO, zero %, 2037 | 324,602 | 277,140 |
| FRB Ser. 3326, Class XF, zero %, 2037 | 1,933,785 | 1,402,451 |
| FRB Ser. 3326, Class YF, zero %, 2037 | 4,117,643 | 3,652,036 |
| FRB Ser. 3263, Class TA, zero %, 2037 | 407,676 | 333,241 |
| FRB Ser. 3241, Class FH, zero %, 2036 | 864,105 | 692,734 |
| FRB Ser. 3341, Class FA, zero %, 2036 | 123,147 | 116,258 |
| FRB Ser. 3231, Class XB, zero %, 2036 | 652,257 | 588,441 |
| FRB Ser. 3283, Class HF, zero %, 2036 | 109,560 | 111,537 |
| FRB Ser. 3231, Class X, zero %, 2036 | 496,414 | 410,151 |
| FRB Ser. 3147, Class SF, zero %, 2036 | 1,845,061 | 1,061,322 |
| FRB Ser. 3117, Class AF, zero %, 2036 | 253,341 | 258,020 |
| FRB Ser. 3326, Class WF, zero %, 2035 | 2,769,472 | 1,894,579 |
| FRB Ser. 3036, Class AS, zero %, 2035 | 262,011 | 249,892 |
| FRB Ser. 3003, Class XF, zero %, 2035 | 2,611,487 | 1,867,751 |
|
| | |
| COLLATERALIZED MORTGAGE | Principal | |
| OBLIGATIONS (55.8%)* cont. | amount | Value |
|
| GE Capital Commercial Mortgage Corp. 144A | | |
| Ser. 05-C2, Class XC, IO, 0.073s, 2043 | $118,959,378 | $704,992 |
| Ser. 07-C1, Class XC, IO, 0.066s, 2019 | 240,794,655 | 1,237,424 |
| Ser. 05-C3, Class XC, IO, 0.064s, 2045 | 288,219,731 | 966,490 |
|
| GMAC Commercial Mortgage Securities, Inc. | | |
| Ser. 99-C3, Class F, 7.895s, 2036 | 488,000 | 498,380 |
| Ser. 01-C2, Class A1, 6 1/4s, 2034 | 22,389 | 22,215 |
| Ser. 97-C1, Class X, IO, 1.259s, 2029 | 4,527,771 | 180,658 |
| Ser. 05-C1, Class X1, IO, 0.185s, 2043 | 99,615,377 | 903,627 |
|
| GMAC Commercial Mortgage | | |
| Securities, Inc. 144A | | |
| Ser. 99-C3, Class G, 6.974s, 2036 | 2,095,341 | 1,997,591 |
| Ser. 06-C1, Class XC, IO, 0.071s, 2045 | 171,295,038 | 647,454 |
|
| Government National Mortgage Association | | |
| IFB Ser. 07-38, Class AS, 15.93s, 2037 | 3,684,121 | 4,774,695 |
| IFB Ser. 07-44, Class SP, 14.1s, 2036 | 2,007,717 | 2,461,911 |
| IFB Ser. 06-34, Class SA, 13 7/8s, 2036 | 421,846 | 501,792 |
| IFB Ser. 07-51, Class SP, 13.815s, 2037 | 2,045,708 | 2,453,659 |
| IFB Ser. 07-35, Class DK, 11.801s, 2035 | 954,681 | 1,112,299 |
| IFB Ser. 05-7, Class JM, 7.31s, 2034 | 2,762,522 | 2,835,096 |
| IFB Ser. 05-66, Class SP, 5.938s, 2035 | 1,521,302 | 1,513,066 |
| Ser. 07-17, Class CI, IO, 7 1/2s, 2037 | 74,359 | 15,244 |
| IFB Ser. 06-69, Class SI, IO, 3.103s, 2036 | 99,508 | 8,654 |
| IFB Ser. 06-62, Class SI, IO, 3.103s, 2036 | 4,123,124 | 354,638 |
| IFB Ser. 07-1, Class SL, IO, 3.083s, 2037 | 1,906,813 | 157,123 |
| IFB Ser. 07-1, Class SM, IO, 3.073s, 2037 | 1,906,118 | 156,698 |
| IFB Ser. 05-68, Class PU, IO, 3.023s, 2032 | 84,242 | 8,006 |
| IFB Ser. 07-49, Class NY, IO, 2.823s, 2035 | 13,879,935 | 1,227,597 |
| IFB Ser. 04-59, Class SC, IO, 2.731s, 2034 | 2,500,849 | 235,327 |
| IFB Ser. 07-26, Class SG, IO, 2.573s, 2037 | 6,183,099 | 573,011 |
| IFB Ser. 07-9, Class BI, IO, 2.543s, 2037 | 12,082,548 | 1,090,787 |
| IFB Ser. 07-31, Class CI, IO, 2.533s, 2037 | 3,174,550 | 200,619 |
| IFB Ser. 07-25, Class SA, IO, 2.523s, 2037 | 4,240,403 | 326,553 |
| IFB Ser. 07-25, Class SB, IO, 2.523s, 2037 | 8,227,762 | 739,712 |
| IFB Ser. 07-22, Class S, IO, 2.523s, 2037 | 3,473,799 | 326,819 |
| IFB Ser. 07-11, Class SA, IO, 2.523s, 2037 | 3,254,930 | 239,920 |
| IFB Ser. 07-14, Class SB, IO, 2.523s, 2037 | 3,151,427 | 252,662 |
| IFB Ser. 06-69, Class SA, IO, 2.523s, 2036 | 190,855 | 12,952 |
| IFB Ser. 07-51, Class SJ, IO, 2.473s, 2037 | 4,078,214 | 374,252 |
| IFB Ser. 07-58, Class PS, IO, 2.423s, 2037 | 16,839,329 | 1,473,711 |
| IFB Ser. 07-59, Class PS, IO, 2.393s, 2037 | 3,122,584 | 260,461 |
| IFB Ser. 07-59, Class SP, IO, 2.393s, 2037 | 8,350,699 | 708,440 |
| IFB Ser. 07-68, Class PI, IO, 2.373s, 2037 | 4,262,140 | 306,353 |
| IFB Ser. 06-38, Class SG, IO, 2.373s, 2033 | 12,420,460 | 974,964 |
| IFB Ser. 07-26, Class SD, IO, 2.331s, 2037 | 6,006,914 | 473,345 |
| IFB Ser. 07-26, Class SL, IO, 2.331s, 2037 | 615,298 | 59,998 |
| IFB Ser. 07-53, Class SG, IO, 2.323s, 2037 | 2,339,619 | 156,663 |
| IFB Ser. 08-3, Class SA, IO, 2.273s, 2038 | 7,359,810 | 571,450 |
| IFB Ser. 07-79, Class SY, IO, 2.273s, 2037 | 11,732,714 | 798,998 |
| IFB Ser. 07-64, Class AI, IO, 2.273s, 2037 | 32,652,025 | 2,565,286 |
| IFB Ser. 07-53, Class ES, IO, 2.273s, 2037 | 3,363,790 | 203,863 |
| IFB Ser. 07-10, Class SB, IO, 2.243s, 2037 | 534,956 | 47,140 |
| IFB Ser. 08-4, Class SA, IO, 2.239s, 2038 | 17,762,491 | 1,219,732 |
| IFB Ser. 07-67, Class SI, IO, 2.233s, 2037 | 13,958,416 | 946,688 |
| IFB Ser. 07-9, Class DI, IO, 2.233s, 2037 | 6,086,948 | 362,006 |
| IFB Ser. 07-57, Class QA, IO, 2.223s, 2037 | 7,973,773 | 610,065 |
| IFB Ser. 07-58, Class SA, IO, 2.223s, 2037 | 26,252,326 | 1,792,561 |
| IFB Ser. 07-58, Class SC, IO, 2.223s, 2037 | 5,456,738 | 378,093 |
| IFB Ser. 07-61, Class SA, IO, 2.223s, 2037 | 4,261,488 | 328,911 |
| IFB Ser. 07-53, Class SC, IO, 2.223s, 2037 | 3,684,311 | 250,383 |
| IFB Ser. 06-28, Class GI, IO, 2.223s, 2035 | 5,207,306 | 320,134 |
| IFB Ser. 07-58, Class SD, IO, 2.213s, 2037 | 5,173,652 | 360,256 |
| IFB Ser. 07-59, Class SD, IO, 2.193s, 2037 | 13,426,206 | 898,173 |
| IFB Ser. 06-49, Class SA, IO, 2.183s, 2036 | 226,792 | 17,830 |
| IFB Ser. 07-48, Class SB, IO, 2.181s, 2037 | 4,853,358 | 349,320 |
| IFB Ser. 07-17, Class AI, IO, 2.081s, 2037 | 13,578,575 | 1,076,156 |
| IFB Ser. 05-65, Class SI, IO, 2.073s, 2035 | 4,964,990 | 403,386 |
26
| | |
| COLLATERALIZED MORTGAGE | Principal | |
| OBLIGATIONS (55.8%)* cont. | amount | Value |
|
| Government Nat ional Mortgage Association | | |
| IFB Ser. 07-9, Class AI, IO, 2.031s, 2037 | $5,143,210 | $383,113 |
| IFB Ser. 07-17, Class IB, IO, 1.973s, 2037 | 2,575,672 | 191,444 |
| IFB Ser. 06-10, Class SM, IO, 1.973s, 2036 | 22,561,401 | 1,805,677 |
| IFB Ser. 06-14, Class S, IO, 1.973s, 2036 | 4,875,886 | 335,636 |
| IFB Ser. 06-11, Class ST, IO, 1.963s, 2036 | 3,059,472 | 248,467 |
| IFB Ser. 07-26, Class SW, IO, 1.923s, 2037 | 49,447,882 | 3,293,081 |
| IFB Ser. 07-27, Class SD, IO, 1.923s, 2037 | 3,065,650 | 205,113 |
| IFB Ser. 07-19, Class SJ, IO, 1.923s, 2037 | 5,197,454 | 323,905 |
| IFB Ser. 07-23, Class ST, IO, 1.923s, 2037 | 6,524,048 | 392,480 |
| IFB Ser. 07-8, Class SA, IO, 1.923s, 2037 | 4,586,502 | 304,755 |
| IFB Ser. 07-9, Class CI, IO, 1.923s, 2037 | 7,906,313 | 609,673 |
| IFB Ser. 07-7, Class EI, IO, 1.923s, 2037 | 5,402,015 | 336,124 |
| IFB Ser. 07-7, Class JI, IO, 1.923s, 2037 | 8,595,084 | 558,680 |
| IFB Ser. 07-1, Class S, IO, 1.923s, 2037 | 6,784,447 | 424,055 |
| IFB Ser. 07-3, Class SA, IO, 1.923s, 2037 | 6,475,596 | 403,663 |
| IFB Ser. 07-17, Class IC, IO, 1.781s, 2037 | 8,040,293 | 583,524 |
| IFB Ser. 07-25, Class KS, IO, 1.731s, 2037 | 1,127,906 | 100,987 |
| IFB Ser. 07-21, Class S, IO, 1.731s, 2037 | 7,018,286 | 460,063 |
| IFB Ser. 07-73, Class MI, IO, 1.723s, 2037 | 14,558,072 | 811,176 |
| IFB Ser. 07-31, Class AI, IO, 1.711s, 2037 | 3,501,270 | 233,545 |
| IFB Ser. 07-43, Class SC, IO, 1.631s, 2037 | 4,329,042 | 273,535 |
| IFB Ser. 07-67, Class EI, IO, 0.02s, 2037 | 7,533,076 | 3,121 |
| IFB Ser. 07-67, Class GI, IO, 0.02s, 2037 | 22,057,772 | 9,128 |
| Ser. 07-73, Class MO, PO, zero %, 2037 | 1,119,852 | 740,681 |
| Ser. 99-31, Class MP, PO, zero %, 2029 | 78,706 | 59,921 |
| FRB Ser. 07-73, Class KI, IO, zero %, 2037 | 11,198,517 | 168,594 |
| FRB Ser. 07-73, Class KM, zero %, 2037 | 1,119,852 | 823,233 |
| FRB Ser. 07-49, Class UF, zero %, 2037 | 302,714 | 195,962 |
| FRB Ser. 07-35, Class UF, zero %, 2037 | 537,489 | 359,279 |
| FRB Ser. 07-22, Class TA, zero %, 2037 | 346,793 | 254,015 |
| FRB Ser. 98-2, Class EA, PO, zero %, 2028 | 714,171 | 586,703 |
|
| Greenpoint Mortgage Funding Trust | | |
| Ser. 05-AR1, Class X1, IO, 3.271s, 2045 | 6,455,523 | 151,705 |
|
| Greenwich Capital Commercial Funding Corp. | | |
| Ser. 05-GG5, Class XC, IO, 0.062s, 2037 | 234,850,005 | 516,670 |
|
| Greenwich Capital Commercial | | |
| Funding Corp. 144A | | |
| Ser. 07-GG9, Class X, IO, 0.323s, 2039 | 33,022,341 | 554,775 |
| Ser. 05-GG3, Class XC, IO, 0.229s, 2042 | 120,545,875 | 1,581,562 |
|
| GS Mortgage Securities Corp. II | | |
| FRB Ser. 07-GG10, Class A3, 5.799s, 2045 | 3,813,000 | 3,043,667 |
| Ser. 06-GG6, Class A2, 5.506s, 2038 | 3,917,000 | 3,634,976 |
| Ser. 05-GG4, Class A4, 4.761s, 2039 | 127,000 | 97,428 |
|
| GS Mortgage Securities Corp. II 144A | | |
| Ser. 98-C1, Class F, 6s, 2030 | 1,627,000 | 1,380,021 |
| FRB Ser. 07-EOP, Class J, 4.895s, 2009 | 610,000 | 469,700 |
| Ser. 06-GG8, Class X, IO, 0.671s, 2039 | 35,623,865 | 744,539 |
| Ser. 04-C1, Class X1, IO, 0.312s, 2028 | 21,731,264 | 121,695 |
| Ser. 03-C1, Class X1, IO, 0.24s, 2040 | 26,855,412 | 495,225 |
| Ser. 05-GG4, Class XC, IO, 0.194s, 2039 | 130,092,358 | 1,509,071 |
| Ser. 06-GG6, Class XC, IO, 0.046s, 2038 | 145,968,645 | 291,937 |
|
| GSMPS Mortgage Loan Trust | | |
| Ser. 05-RP3, Class 1A4, 8 1/2s, 2035 | 326,833 | 332,524 |
| Ser. 05-RP3, Class 1A3, 8s, 2035 | 972,759 | 971,223 |
| Ser. 05-RP3, Class 1A2, 7 1/2s, 2035 | 749,070 | 730,269 |
|
| GSMPS Mortgage Loan Trust 144A | | |
| Ser. 05-RP2, Class 1A3, 8s, 2035 | 1,037,178 | 1,045,117 |
| Ser. 05-RP1, Class 1A3, 8s, 2035 | 111,221 | 112,561 |
| Ser. 05-RP2, Class 1A2, 7 1/2s, 2035 | 1,153,465 | 1,144,407 |
| IFB Ser. 04-4, Class 1AS, IO, 2.895s, 2034 | 9,934,879 | 608,015 |
|
| GSR Mortgage Loan Trust Ser. 05-AR2, | | |
| Class 2A1, 4.837s, 2035 | 2,163,004 | 1,535,733 |
|
| HASCO NIM Trust 144A Ser. 05-OP1A, | | |
| Class A, 6 1/4s, 2035 (Cayman Islands) | 312,283 | 26,544 |
|
| | |
| COLLATERALIZED MORTGAGE | Principal | |
| OBLIGATIONS (55.8%)* cont. | amount | Value |
|
| HSI Asset Loan Obligation FRB Ser. 07-AR1, | | |
| Class 2A1, 6.131s, 2037 | $5,053,764 | $3,386,022 |
|
| IMPAC Secured Assets Corp. FRB Ser. 07-2, | | |
| Class 1A1A, 3.369s, 2037 | 6,786,448 | 5,484,828 |
|
| IndyMac Index Mortgage Loan Trust | | |
| FRB Ser. 05-AR31, Class 3A1, 5.636s, 2036 | 6,146,463 | 3,810,807 |
| FRB Ser. 07-AR11, Class 1A1, 5.628s, 2037 | 4,620,315 | 2,541,173 |
|
| JPMorgan Chase Commercial | | |
| Mortgage Securities Corp. | | |
| Ser. 97-C5, Class F, 7.561s, 2029 | 1,171,000 | 993,242 |
| FRB Ser. 07-LD12, Class AM, 6.062s, 2051 | 8,761,000 | 5,278,183 |
| FRB Ser. 07-LD12, Class A3, 5.99s, 2051 | 41,526,000 | 32,819,742 |
| Ser. 07-CB20, Class A3, 5.863s, 2051 | 9,549,000 | 7,460,321 |
| FRB Ser. 07-LD11, Class A3, 5.819s, 2049 | 4,755,000 | 3,651,840 |
| Ser. 06-CB15, Class A4, 5.814s, 2043 | 6,028,000 | 4,813,513 |
| Ser. 07-CB20, Class A4, 5.794s, 2051 | 6,219,000 | 4,696,786 |
| Ser. 06-CB14, Class A4, 5.481s, 2044 | 5,624,000 | 4,562,334 |
| FRB Ser. 04-PNC1, Class A4, 5.368s, 2041 | 48,000 | 40,027 |
| Ser. 05-CB12, Class A4, 4.895s, 2037 | 128,000 | 99,456 |
| Ser. 04-C3, Class A5, 4.878s, 2042 | 122,000 | 96,282 |
| Ser. 05-LDP2, Class AM, 4.78s, 2042 | 2,030,000 | 1,446,763 |
| Ser. 06-LDP8, Class X, IO, 0.573s, 2045 | 47,323,238 | 1,233,381 |
| Ser. 06-CB17, Class X, IO, 0.513s, 2043 | 57,549,416 | 1,240,765 |
| Ser. 06-LDP9, Class X, IO, 0.455s, 2047 | 36,596,723 | 640,443 |
| Ser. 07-LDPX, Class X, IO, 0.347s, 2049 | 71,036,929 | 899,328 |
| Ser. 06-CB16, Class X1, IO, 0.093s, 2045 | 53,915,718 | 588,291 |
| Ser. 06-LDP7, Class X, IO, 0.009s, 2045 | 296,898,425 | 187,046 |
|
| JPMorgan Chase Commercial Mortgage | | |
| Securities Corp. 144A | | |
| Ser. 00-C9, Class G, 6 1/4s, 2032 | 1,515,000 | 1,486,401 |
| Ser. 03-ML1A, Class X1, IO, 0.578s, 2039 | 15,946,002 | 413,001 |
| Ser. 05-LDP2, Class X1, IO, 0.19s, 2042 | 234,889,305 | 2,569,689 |
| Ser. 05-LDP1, Class X1, IO, 0.153s, 2046 F | 68,780,962 | 459,954 |
| Ser. 05-CB12, Class X1, IO, 0.107s, 2037 F | 68,336,042 | 486,884 |
| Ser. 05-LDP3, Class X1, IO, 0.085s, 2042 | 170,031,967 | 822,955 |
| Ser. 07-CB20, Class X1, IO, 0.074s, 2051 | 121,566,576 | 892,299 |
| Ser. 06-CB14, Class X1, IO, 0.063s, 2044 F | 58,047,565 | 172,733 |
| Ser. 06-LDP6, Class X1, IO, 0.063s, 2043 | 94,728,480 | 310,709 |
| Ser. 05-LDP5, Class X1, IO, 0.061s, 2044 | 442,624,119 | 1,314,594 |
|
| LB Commercial Conduit Mortgage Trust 144A | | |
| Ser. 99-C1, Class F, 6.41s, 2031 | 926,463 | 793,052 |
| Ser. 99-C1, Class G, 6.41s, 2031 | 991,777 | 543,791 |
| Ser. 98-C4, Class G, 5.6s, 2035 | 784,000 | 732,848 |
| Ser. 98-C4, Class H, 5.6s, 2035 | 1,328,000 | 770,306 |
|
| LB-UBS Commercial Mortgage Trust | | |
| Ser. 01-C3, Class A2, 6.365s, 2028 | 43,000 | 40,050 |
| Ser. 07-C6, Class A2, 5.845s, 2012 | 12,934,000 | 11,276,455 |
| Ser. 04-C7, Class A6, 4.786s, 2029 | 2,341,000 | 1,911,614 |
| Ser. 07-C2, Class XW, IO, 0.536s, 2040 | 15,387,135 | 389,239 |
|
| LB-UBS Commercial Mortgage Trust 144A | | |
| Ser. 06-C7, Class XW, IO, 0.718s, 2038 | 40,955,721 | 1,274,952 |
| Ser. 03-C5, Class XCL, IO, 0.256s, 2037 | 21,754,227 | 420,704 |
| Ser. 05-C3, Class XCL, IO, 0.209s, 2040 | 69,894,938 | 1,086,803 |
| Ser. 05-C2, Class XCL, IO, 0.167s, 2040 | 214,198,993 | 1,693,072 |
| Ser. 05-C5, Class XCL, IO, 0.139s, 2020 | 104,519,438 | 1,090,190 |
| Ser. 05-C7, Class XCL, IO, 0.096s, 2040 | 155,434,264 | 986,635 |
| Ser. 06-C1, Class XCL, IO, 0.086s, 2041 | 166,336,826 | 1,330,761 |
| Ser. 06-C7, Class XCL, IO, 0.082s, 2038 | 63,418,366 | 792,926 |
| Ser. 07-C2, Class XCL, IO, 0.077s, 2040 | 132,222,012 | 1,224,482 |
|
| Lehman Brothers Floating Rate Commercial Mortgage Trust 144A | |
| FRB Ser. 04-LLFA, Class H, 5.51s, 2017 | 826,000 | 578,200 |
| FRB Ser. 05-LLFA, Class J, 5.36s, 2018 | 534,000 | 400,500 |
|
| Lehman Mortgage Trust | | |
| IFB Ser. 06-7, Class 1A9, 21.368s, 2036 | 847,609 | 1,022,396 |
| IFB Ser. 07-5, Class 4A3, 20.528s, 2037 | 2,587,168 | 2,457,809 |
| IFB Ser. 06-7, Class 4A2, IO, 4.491s, 2036 | 4,215,572 | 353,825 |
27
| | |
| COLLATERALIZED MORTGAGE | Principal | |
| OBLIGATIONS (55.8%)* cont. | amount | Value |
|
| Lehman Mortgage Trust | | |
| IFB Ser. 07-5, Class 8A2, IO, 4.461s, 2036 | $4,497,967 | $371,174 |
| Ser. 07-1, Class 3A2, IO, 3.991s, 2037 | 5,105,151�� | 706,825 |
| IFB Ser. 06-9, Class 3A2, IO, 3.971s, 2037 | 2,922,795 | 275,068 |
| IFB Ser. 07-4, Class 3A2, IO, 3.941s, 2037 | 4,113,376 | 362,066 |
| IFB Ser. 06-5, Class 2A2, IO, 3.891s, 2036 | 8,719,089 | 697,527 |
| IFB Ser. 07-2, Class 2A13, IO, 3.431s, 2037 | 7,266,357 | 581,309 |
| IFB Ser. 07-4, Class 2A2, IO, 3.411s, 2037 | 17,816,323 | 1,425,306 |
| IFB Ser. 07-1, Class 2A3, IO, 3.371s, 2037 | 8,093,633 | 637,374 |
| Ser. 06-9, Class 2A3, IO, 3.361s, 2036 | 10,116,290 | 750,498 |
| IFB Ser. 06-9, Class 2A2, IO, 3.361s, 2037 | 7,488,567 | 547,515 |
| IFB Ser. 06-8, Class 2A2, IO, 3.321s, 2036 | 659,810 | 51,960 |
| IFB Ser. 06-7, Class 2A4, IO, 3.291s, 2036 | 14,417,766 | 1,189,466 |
| IFB Ser. 06-7, Class 2A5, IO, 3.291s, 2036 | 13,516,049 | 1,061,010 |
| IFB Ser. 06-6, Class 1A2, IO, 3.241s, 2036 | 5,226,249 | 418,100 |
| IFB Ser. 06-6, Class 1A3, IO, 3.241s, 2036 | 7,610,181 | 599,302 |
| IFB Ser. 07-5, Class 10A2, IO, 3.081s, 2037 | 8,270,184 | 640,939 |
|
| MASTR Adjustable Rate Mortgages Trust | | |
| Ser. 04-7, Class 2A1, 6.095s, 2034 | 180,305 | 115,262 |
| FRB Ser. 04-13, Class 3A6, 3.788s, 2034 | 3,642,000 | 2,972,132 |
| Ser. 04-03, Class 4AX, IO, 1.417s, 2034 | 2,366,611 | 17,011 |
| Ser. 05-2, Class 7AX, IO, 0.17s, 2035 | 6,432,490 | 22,115 |
|
| MASTR Reperforming Loan Trust 144A | | |
| Ser. 05-2, Class 1A3, 7 1/2s, 2035 | 2,036,696 | 2,159,717 |
| Ser. 05-1, Class 1A4, 7 1/2s, 2034 | 1,485,616 | 1,515,768 |
|
| Merit Securities Corp. 144A FRB Ser. 11PA, | | |
| Class 3A1, 3.86s, 2027 | 6,267,331 | 4,966,894 |
|
| Merrill Lynch Capital Funding Corp. Ser. 06-4, | | |
| Class XC, IO, 0 1/8s, 2049 | 124,527,965 | 1,536,644 |
|
| Merrill Lynch Floating Trust 144A | | |
| FRB Ser. 06-1, Class TM, 5.06s, 2022 | 1,221,546 | 1,074,960 |
| Ser. 06-1, Class X1A, IO, 1.515s, 2022 | 21,439,717 | 112,344 |
|
| Merrill Lynch Mortgage Investors, Inc. | | |
| FRB Ser. 98-C3, Class E, 6.876s, 2030 | 826,000 | 829,510 |
| FRB Ser. 05-A9, Class 3A1, 5.276s, 2035 | 5,390,570 | 3,989,022 |
| Ser. 96-C2, Class JS, IO, 2.261s, 2028 | 900,804 | 58,012 |
|
| Merrill Lynch Mortgage Trust | | |
| FRB Ser. 07-C1, Class A3, 5.829s, 2050 | 2,626,000 | 2,198,954 |
| FRB Ser. 07-C1, Class A4, 5.829s, 2050 | 2,411,000 | 1,826,812 |
| FRB Ser. 04-BPC1, Class A5, 4.855s, 2041 | 125,000 | 100,041 |
| FRB Ser. 05-MCP1, Class A4, 4.747s, 2043 | 121,000 | 93,775 |
| Ser. 05-MCP1, Class XC, IO, 0.123s, 2043 | 85,794,949 | 783,450 |
|
| Merrill Lynch Mortgage Trust 144A | | |
| Ser. 04-KEY2, Class XC, IO, 0.259s, 2039 | 18,838,870 | 289,959 |
| Ser. 05-LC1, Class X, IO, 0.101s, 2044 | 47,104,109 | 252,930 |
|
| Merrill Lynch/Countrywide | | |
| Commercial Mortgage Trust | | |
| FRB Ser. 07-8, Class A3, 5.957s, 2049 | 5,421,000 | 4,512,983 |
| FRB Ser. 07-8, Class A2, 5.92s, 2049 F | 4,620,000 | 4,475,701 |
| Ser. 07-9, Class A4, 5.748s, 2049 | 11,070,000 | 8,495,965 |
|
| Merrill Lynch/Countrywide | | |
| Commercial Mortgage Trust 144A | | |
| Ser. 06-3, Class XC, IO, 0.113s, 2046 | 70,633,343 | 796,490 |
| Ser. 06-1, Class X, IO, 0.077s, 2039 | 124,618,884 | 348,205 |
| Ser. 07-7, Class X, IO, 0.019s, 2050 | 252,651,987 | 528,968 |
|
| Mezz Cap Commercial Mortgage Trust 144A | | |
| Ser. 04-C1, Class X, IO, 7.795s, 2037 F | 4,031,454 | 876,594 |
| Ser. 04-C2, Class X, IO, 6.004s, 2040 F | 1,918,999 | 419,778 |
| Ser. 05-C3, Class X, IO, 5.555s, 2044 F | 3,670,130 | 776,586 |
| Ser. 06-C4, Class X, IO, 5.074s, 2016 F | 12,602,298 | 2,387,337 |
|
| Morgan Stanley Capital 144A Ser. 05-RR6, | | |
| Class X, IO, 1.597s, 2043 | 12,529,658 | 375,890 |
|
| Morgan Stanley Capital I | | |
| FRB Ser. 08-T29, Class A3, 6.28s, 2043 | 1,780,000 | 1,397,478 |
| FRB Ser. 06-IQ11, Class A4, 5.772s, 2042 | 6,028,000 | 5,390,898 |
| | |
| COLLATERALIZED MORTGAGE | Principal | |
| OBLIGATIONS (55.8%)* cont. | amount | Value |
|
| Morgan Stanley Capital I | | |
| FRB Ser. 07-IQ14, Class AM, 5.691s, 2049 | $2,866,000 | $1,800,993 |
| Ser. 05-HQ6, Class A4A, 4.989s, 2042 | 5,354,000 | 4,338,014 |
| Ser. 04-HQ4, Class A7, 4.97s, 2040 | 2,771,000 | 2,271,112 |
|
| Morgan Stanley Capital I 144A | | |
| Ser. 04-RR, Class F5, 6s, 2039 | 1,350,000 | 607,500 |
| Ser. 04-RR, Class F6, 6s, 2039 | 2,030,000 | 812,000 |
| Ser. 07-HQ13, Class X1, IO, 0.671s, 2044 | 60,510,823 | 1,429,871 |
| Ser. 05-HQ6, Class X1, IO, 0.116s, 2042 | 110,954,553 | 915,075 |
| Ser. 05-HQ5, Class X1, IO, 0.094s, 2042 | 28,272,737 | 160,306 |
|
| Morgan Stanley Mortgage Loan Trust | | |
| Ser. 05-5AR, Class 2A1, 4.973s, 2035 | 4,632,321 | 2,779,392 |
|
| Mortgage Capital Funding, Inc. FRB | | |
| Ser. 98-MC2, Class E, 7.113s, 2030 | 1,389,000 | 1,250,100 |
|
| Nomura Asset Acceptance Corp. | | |
| Ser. 04-R3, Class PT, 7.433s, 2035 | 601,168 | 531,317 |
|
| Nomura Asset Acceptance Corp. 144A | | |
| Ser. 04-R2, Class PT, 9.087s, 2034 | 309,011 | 309,069 |
|
| Permanent Financing PLC 144A FRB Ser. 9A, | | |
| Class 3A, 2.917s, 2033 (United Kingdom) | 4,086,000 | 3,377,443 |
|
| Permanent Master Issuer PLC FRB Ser. 07-1, | | |
| Class 4A, 4.833s, 2033 (United Kingdom) | 4,962,000 | 4,411,218 |
|
| PNC Mortgage Acceptance Corp. 144A | | |
| Ser. 99-CM1, Class B3, 7.1s, 2032 | 4,971,000 | 4,645,897 |
| Ser. 00-C1, Class J, 6 5/8s, 2010 | 309,000 | 172,159 |
| Ser. 00-C2, Class J, 6.22s, 2033 | 1,499,000 | 1,071,785 |
|
| Residential Asset Mortgage Products, Inc. | | |
| Ser. 02-SL1, Class AI3, 7s, 2032 | 163,595 | 161,389 |
|
| Residential Asset Securitization Trust | | |
| Ser. 07-A5, Class 2A3, 6s, 2037 | 1,945,357 | 1,293,663 |
| IFB Ser. 07-A3, Class 2A2, IO, 3.431s, 2037 | 16,706,258 | 1,211,204 |
|
| Residential Funding Mortgage Securities I | | |
| Ser. 04-S5, Class 2A1, 4 1/2s, 2019 | 4,340,744 | 3,870,047 |
|
| Saco I Trust FRB Ser. 05-10, Class 1A1, | | |
| 3.519s, 2033 | 1,343,641 | 524,020 |
|
| Salomon Brothers Mortgage Securities VII 144A | | |
| Ser. 02-KEY2, Class X1, IO, 0.666s, 2036 | 31,894,693 | 1,262,083 |
|
| SBA CMBS Trust 144A Ser. 05-1A, Class D, | | |
| 6.219s, 2035 | 770,000 | 562,100 |
|
| STRIPS 144A | | |
| Ser. 03-1A, Class L, 5s, 2018 (Cayman Islands) | 993,000 | 853,980 |
| Ser. 03-1A, Class M, 5s, 2018 (Cayman Islands) | 673,000 | 457,640 |
| Ser. 04-1A, Class L, 5s, 2018 (Cayman Islands) | 443,000 | 310,100 |
|
| Structured Adjustable Rate Mortgage Loan Trust | | |
| FRB Ser. 07-8, Class 1A2, 6 1/4s, 2037 | 14,301,717 | 8,294,996 |
| FRB Ser. 05-18, Class 6A1, 5.256s, 2035 | 2,515,843 | 1,761,090 |
| Ser. 04-8, Class 1A3, 5.127s, 2034 | 11,906 | 9,110 |
| Ser. 05-9, Class AX, IO, 1.409s, 2035 | 23,095,188 | 424,259 |
|
| Structured Adjustable Rate Mortgage | | |
| Loan Trust 144A Ser. 04-NP2, Class A, | | |
| 3.609s, 2034 | 795,510 | 596,632 |
|
| Structured Asset Securities Corp. | | |
| IFB Ser. 07-4, Class 1A3, IO, 3.01s, 2037 | 51,621,128 | 3,355,373 |
| Ser. 07-4, Class 1A4, IO, 1s, 2037 | 53,810,462 | 1,138,602 |
|
| Structured Asset Securities Corp. 144A | | |
| Ser. 07-RF1, Class 1A, IO, 2.577s, 2037 | 17,661,145 | 861,864 |
| Ser. 06-RF4, Class 1A, IO, 0.356s, 2036 | 9,224,997 | 804,949 |
|
| Wachovia Bank Commercial Mortgage Trust | | |
| FRB Ser. 07-C33, Class A3, 5.903s, 2051 | 4,252,000 | 3,300,062 |
| Ser. 07-C30, Class A3, 5.246s, 2043 | 2,486,000 | 2,158,457 |
| Ser. 04-C15, Class A4, 4.803s, 2041 | 4,128,000 | 3,318,285 |
| Ser. 06-C28, Class XC, IO, 0.38s, 2048 | 28,292,828 | 414,773 |
| Ser. 06-C29, IO, 0 3/8s, 2048 | 122,782,386 | 1,937,506 |
| Ser. 07-C34, IO, 0.356s, 2046 | 29,147,719 | 458,494 |
|
28
| | |
| COLLATERALIZED MORTGAGE | Principal | |
| OBLIGATIONS (55.8%)* cont. | amount | Value |
|
| Wachovia Bank Commercial Mortgage Trust 144A | | |
| FRB Ser. 05-WL5A, Class L, 7.86s, 2018 | $944,000 | $755,200 |
| Ser. 03-C3, Class IOI, IO, 0.421s, 2035 | 20,359,325 | 547,174 |
| Ser. 07-C31, IO, 0.261s, 2047 | 119,734,356 | 1,291,934 |
| Ser. 05-C18, Class XC, IO, 0.104s, 2042 | 49,728,644 | 307,820 |
| Ser. 06-C27, Class XC, IO, 0.078s, 2045 | 61,568,731 | 338,628 |
| Ser. 06-C23, Class XC, IO, 0.055s, 2045 | 293,928,836 | 1,193,351 |
| Ser. 06-C26, Class XC, IO, 0.039s, 2045 | 21,917,490 | 41,643 |
|
| WAMU Commercial Mortgage Securities | | |
| Trust 144A | | |
| Ser. 05-C1A, Class G, 5.72s, 2036 | 219,000 | 95,944 |
| Ser. 06-SL1, Class X, IO, 0.936s, 2043 | 10,135,018 | 317,226 |
| Ser. 07-SL2, Class X, IO, 0.851s, 2049 | 20,733,910 | 576,403 |
|
| WAMU Mortgage Pass-Through Certificates | | |
| FRB Ser. 04-AR1, Class A, 4.229s, 2034 | 512,224 | 414,902 |
|
| Washington Mutual Mortgage Pass-Through | | |
| Certificates Ser. 07-2, Class CX, IO, 7s, 2037 | 1,135,267 | 175,966 |
|
| Washington Mutual Multi-Fam., Mtge. 144A | | |
| Ser. 01-1, Class B5, 7.189s, 2031 (Cayman Islands) 1,793,000 | 1,579,875 |
|
| Wells Fargo Mortgage Backed Securities Trust | | |
| Ser. 06-AR10, Class 3A1, 4.871s, 2036 | 2,988,557 | 2,419,447 |
| Ser. 05-AR2, Class 2A1, 4.549s, 2035 | 1,559,021 | 1,147,678 |
| Ser. 05-AR9, Class 1A2, 4.42s, 2035 | 1,079,970 | 453,588 |
| Ser. 04-R, Class 2A1, 4.366s, 2034 | 1,507,765 | 1,216,755 |
| Ser. 05-AR12, Class 2A5, 4.345s, 2035 | 23,270,000 | 16,888,930 |
| Ser. 05-AR10, Class 2A18, IO, 0.61s, 2035 | 56,771,000 | 135,765 |
| Total collateralized mortgage obligations | | |
| (cost $908,336,345) | | $876,553,047 |
| |
| |
| CORPORATE BONDS | Principal | |
| AND NOTES (21.2%)* | amount | Value |
|
| Basic materials (1.0%) | | |
| ArcelorMittal 144A notes 6 1/8s, | | |
| 2018 (Luxembourg) | $1,080,000 | $744,176 |
|
| BHP Billton Finance USA, Ltd. company | | |
| guaranty unsec. notes 5.4s, 2017 (Australia) | 850,000 | 683,849 |
|
| BHP Billton Finance USA, Ltd. company | | |
| guaranty unsec. notes 5 1/8s, 2012 (Australia) | 435,000 | 418,721 |
|
| Domtar Corp. company guaranty Ser. *, | | |
| 7 7/8s, 2011 (Canada) | 410,000 | 352,600 |
|
| Dow Chemical Co. (The) Pass Through | | |
| Trust 144A company guaranty 4.027s, 2009 | 4,165,000 | 4,225,549 |
|
| Freeport-McMoRan Copper & Gold, Inc. | | |
| sr. unsec. notes 8 3/8s, 2017 | 2,240,000 | 1,752,800 |
|
| Georgia-Pacific Corp. debs. 9 1/2s, 2011 | 830,000 | 709,650 |
|
| Georgia-Pacific Corp. notes 8 1/8s, 2011 | 820,000 | 692,900 |
|
| International Paper Co. bonds 7.95s, 2018 | 525,000 | 425,200 |
|
| International Paper Co. bonds 7.4s, 2014 | 150,000 | 126,576 |
|
| Lubrizol Corp. (The) sr. notes 5 1/2s, 2014 | 570,000 | 472,667 |
|
| Monsanto Co. company guaranty sr. unsec. | | |
| notes 5 7/8s, 2038 | 440,000 | 368,629 |
|
| Monsanto Co. sr. unsec. unsub. notes | | |
| 5 1/8s, 2018 | 305,000 | 268,257 |
|
| Mosaic Co. (The) 144A sr. unsec. unsub. | | |
| notes 7 5/8s, 2016 | 795,000 | 694,250 |
|
| Steel Dynamics, Inc. company guaranty sr. | | |
| unsec. unsub. notes 7 3/8s, 2012 | 985,000 | 732,594 |
|
| Steel Dynamics, Inc. company guaranty sr. | | |
| unsec. unsub. notes 6 3/4s, 2015 | 1,520,000 | 995,600 |
|
| Westvaco Corp. unsec. notes 7 1/2s, 2027 | 216,000 | 174,642 |
|
| Xstrata Finance Canada, Ltd. 144A | | |
| company guaranty 5.8s, 2016 (Canada) | 1,010,000 | 772,934 |
|
| | | 14,611,594 |
| | |
| CORPORATE BONDS | Principal | |
| AND NOTES (21.2%)* cont. | amount | Value |
|
| Capital goods (0.9%) | | |
| Caterpillar Financial Services Corp. | | |
| sr. unsec. notes 4.85s, 2012 | $2,060,000 | $1,913,631 |
|
| Caterpillar Financial Services Corp. | | |
| sr. unsec. notes Ser. MTN, 5.85s, 2017 | 1,315,000 | 1,147,850 |
|
| Covidien International Finance SA company | | |
| guaranty sr. unsec. unsub. notes 6.55s, | | |
| 2037 (Luxembourg) | 685,000 | 541,506 |
|
| Covidien International Finance SA company | | |
| guaranty sr. unsec. unsub. notes 6s, | | |
| 2017 (Luxembourg) | 785,000 | 684,504 |
|
| Eaton Corp. notes 5.6s, 2018 | 1,025,000 | 912,106 |
|
| John Deere Capital Corp. sr. unsec. notes | | |
| Ser. MTN, 5.35s, 2018 | 490,000 | 417,726 |
|
| L-3 Communications Corp. company | | |
| guaranty Ser. B, 6 3/8s, 2015 | 750,000 | 622,500 |
|
| L-3 Communications Corp. sr. sub. | | |
| notes 5 7/8s, 2015 | 640,000 | 524,800 |
|
| Legrand SA unsec. unsub. debs. 8 1/2s, | | |
| 2025 (France) | 1,085,000 | 1,012,062 |
|
| Parker Hannifin Corp. sr. unsec. | | |
| unsub. notes 6 1/4s, 2038 | 715,000 | 594,799 |
|
| Parker Hannifin Corp. sr. unsec. | | |
| unsub. notes 5 1/2s, 2018 | 325,000 | 284,906 |
|
| Rexam PLC 144A bond 6 3/4s, 2013 | | |
| (United Kingdom) | 3,300,000 | 3,329,145 |
|
| United Technologies Corp. sr. | | |
| unsec. notes 6 1/8s, 2038 | 995,000 | 858,212 |
|
| United Technologies Corp. sr. | | |
| unsec. notes 5 3/8s, 2017 | 1,785,000 | 1,612,136 |
|
| | | 14,455,883 |
| Communication services (2.0%) | | |
| American Tower Corp. 144A sr. notes 7s, 2017 | 1,760,000 | 1,531,200 |
|
| Ameritech Capital Funding company | | |
| guaranty 6 1/4s, 2009 | 1,140,000 | 1,159,471 |
|
| AT&T Wireless Services, Inc. sr. notes | | |
| 8 3/4s, 2031 | 1,536,000 | 1,428,721 |
|
| AT&T Wireless Services, Inc. sr. notes | | |
| 7 7/8s, 2011 | 990,000 | 987,908 |
|
| AT&T, Inc. sr. unsec. unsub. bonds 5 1/2s, 2018 | 370,000 | 314,371 |
|
| AT&T, Inc. sr. unsec. unsub. notes 6.3s, 2038 | 5,050,000 | 3,893,474 |
|
| AT&T, Inc. sr. unsec. unsub. notes 4.95s, 2013 | 1,570,000 | 1,480,566 |
|
| Bellsouth Capital Funding unsec. notes | | |
| 7 7/8s, 2030 | 980,000 | 867,143 |
|
| British Telecommunications PLC sr. unsec. | | |
| notes 5.15s, 2013 (United Kingdom) | 2,570,000 | 2,224,566 |
|
| France Telecom notes 8 1/2s, 2031 (France) | 560,000 | 527,666 |
|
| Nextel Communications, Inc. sr. notes | | |
| Ser. E, 6 7/8s, 2013 | 830,000 | 481,085 |
|
| Nextel Communications, Inc. sr. notes | | |
| Ser. F, 5.95s, 2014 | 3,670,000 | 1,981,800 |
|
| Rogers Wireless, Inc. sec. notes 6 3/8s, | | |
| 2014 (Canada) S | 1,650,000 | 1,473,359 |
|
| Southwestern Bell Telephone debs. 7s, 2027 | 1,245,000 | 917,737 |
|
| Telecom Italia Capital SA company guaranty | | |
| 7.2s, 2036 (Luxembourg) | 515,000 | 331,794 |
|
| Telecom Italia Capital SA company guaranty | | |
| 5 1/4s, 2015 (Luxembourg) | 1,320,000 | 905,396 |
|
| Telecom Italia Capital SA company guaranty | | |
| 5 1/4s, 2013 (Luxembourg) | 255,000 | 193,554 |
|
29
| | |
| CORPORATE BONDS | Principal | |
| AND NOTES (21.2%)* cont. | amount | Value |
|
| Communication services cont. | | |
| Telecom Italia Capital SA company guaranty | | |
| 4s, 2010 (Luxembourg) | $525,000 | $502,472 |
|
| Telefonica Emisones SAU company guaranty | | |
| 7.045s, 2036 (Spain) | 1,055,000 | 814,167 |
|
| Telefonica Emisones SAU company guaranty | | |
| 6.421s, 2016 (Spain) | 370,000 | 317,046 |
|
| Telefonica Emisones SAU company guaranty | | |
| 6.221s, 2017 (Spain) | 565,000 | 476,871 |
|
| Telefonica Europe BV company guaranty 8 1/4s, | | |
| 2030 (Netherlands) | 725,000 | 647,643 |
|
| Telus Corp. notes 8s, 2011 (Canada) | 1,465,000 | 1,439,755 |
|
| Verizon Communications, Inc. sr. unsec. unsub. | | |
| notes 8.95s, 2039 | 455,000 | 441,426 |
|
| Verizon Communications, Inc. sr. unsec. unsub. | | |
| notes 8 3/4s, 2018 | 95,000 | 94,390 |
|
| Verizon New England, Inc. sr. notes 6 1/2s, 2011 | 2,600,000 | 2,437,705 |
|
| Verizon New Jersey, Inc. debs. 8s, 2022 | 1,050,000 | 930,622 |
|
| Verizon Pennsylvania, Inc. debs. 8.35s, 2030 | 1,305,000 | 1,134,236 |
|
| Verizon Virginia, Inc. debs. Ser. A, 4 5/8s, 2013 | 369,000 | 314,489 |
|
| Vodafone Group PLC unsec. notes 6.15s, 2037 | | |
| (United Kingdom) | 2,090,000 | 1,565,370 |
|
| | | 31,816,003 |
| Conglomerates (0.1%) | | |
| Honeywell International, Inc. sr. unsec. | | |
| notes 5.3s, 2018 | 630,000 | 550,893 |
|
| Siemens Financieringsmaatschappij 144A | | |
| notes 5 3/4s, 2016 (Netherlands) | 920,000 | 825,706 |
|
| | | 1,376,599 |
| Consumer cyclicals (0.8%) | | |
| D.R. Horton, Inc. sr. notes 7 7/8s, 2011 | 765,000 | 612,000 |
|
| D.R. Horton, Inc. sr. notes 5 7/8s, 2013 | 895,000 | 608,600 |
|
| Daimler Chrysler NA Holding Corp. company | | |
| guaranty unsec. notes 7.2s, 2009 | 3,190,000 | 2,961,172 |
|
| Daimler Chrysler NA Holding Corp. company | | |
| guaranty unsec. unsub. notes Ser. MTN, | | |
| 5 3/4s, 2011 | 2,350,000 | 1,881,814 |
|
| Ford Motor Credit Co., LLC notes 6 3/8s, 2008 | 1,360,000 | 1,360,000 |
|
| JC Penney Co., Inc. debs. 7.65s, 2016 | 185,000 | 154,416 |
|
| JC Penney Co., Inc. notes 6 7/8s, 2015 | 465,000 | 380,387 |
|
| Marriott International, Inc. sr. unsec. Ser. J, | | |
| 5 5/8s, 2013 | 210,000 | 161,294 |
|
| Omnicom Group, Inc. sr. notes 5.9s, 2016 | 885,000 | 698,281 |
|
| Starwood Hotels & Resorts Worldwide, Inc. | | |
| sr. unsec. notes 6 1/4s, 2013 | 1,255,000 | 923,334 |
|
| Target Corp. bonds 6 1/2s, 2037 | 1,605,000 | 1,155,234 |
|
| Vulcan Materials Co. sr. unsec. unsub. notes | | |
| 5.6s, 2012 | 1,195,000 | 1,179,492 |
|
| Wal-Mart Stores, Inc. sr. unsec. notes 6.2s, 2038 | 595,000 | 508,772 |
|
| | | 12,584,796 |
| Consumer staples (2.3%) | | |
| Campbell Soup Co. debs. 8 7/8s, 2021 | 1,185,000 | 1,402,975 |
|
| Comcast Cable Communications company | | |
| guaranty sr. unsub. notes 8 7/8s, 2017 | 1,295,000 | 1,264,400 |
|
| Comcast Corp. company guaranty sr. unsec. | | |
| unsub. notes 6.95s, 2037 | 745,000 | 607,468 |
|
| ConAgra Foods, Inc. unsec. notes 7 7/8s, 2010 | 575,000 | 572,204 |
|
| Cox Communications, Inc. notes 7 1/8s, 2012 | 565,000 | 539,626 |
|
| Cox Communications, Inc. 144A notes 5 7/8s, 2016 S | 650,000 | 537,812 |
|
| Cox Enterprises, Inc. 144A notes 7 7/8s, 2010 | 250,000 | 241,119 |
| |
| | |
| CORPORATE BONDS | Principal | |
| AND NOTES (21.2%)* cont. | amount | Value |
|
| Consumer staples cont. | | |
| CVS Caremark, Corp. 144A pass-through | | |
| certificates 6.117s, 2013 | $1,575,096 | $1,582,608 |
|
| CVS Corp. sr. unsecd. notes 6 1/8s, 2016 | 5,000 | 4,184 |
|
| Delhaize Group sr. unsub. notes | | |
| 6 1/2s, 2017 (Belgium) S | 790,000 | 641,377 |
|
| Diageo Capital PLC company guaranty | | |
| 5 3/4s, 2017 (United Kingdom) | 575,000 | 494,320 |
|
| Diageo Capital PLC company guaranty | | |
| 5.2s, 2013 (United Kingdom) | 245,000 | 228,429 |
|
| Diageo PLC company guaranty 8s, 2022 | 1,115,000 | 1,054,797 |
|
| Estee Lauder Cos., Inc. (The) | | |
| sr. unsec. notes 6s, 2037 | 1,440,000 | 981,773 |
|
| Estee Lauder Cos., Inc. (The) | | |
| sr. unsec. notes 5.55s, 2017 | 380,000 | 310,348 |
|
| H.J. Heinz Co. sr. unsec. notes 5.35s, 2013 | 985,000 | 912,621 |
|
| Kellogg Co. sr. unsub. 5 1/8s, 2012 | 225,000 | 215,831 |
|
| Kraft Foods, Inc. notes 6 1/8s, 2018 | 1,210,000 | 1,012,402 |
|
| Kroger Co. company guaranty 6 3/4s, 2012 | 5,000 | 4,874 |
|
| Kroger Co. company guaranty 6.4s, 2017 | 1,005,000 | 874,428 |
|
| Kroger Co. sr. notes 6.15s, 2020 | 330,000 | 265,083 |
|
| McDonald’s Corp. sr. unsec. | | |
| Ser. MTN, 6.3s, 2038 | 1,120,000 | 978,279 |
|
| McDonald’s Corp. sr. unsec. bond 6.3s, 2037 | 880,000 | 771,686 |
|
| McDonald’s Corp. sr. unsec. bond 5.8s, 2017 | 445,000 | 419,832 |
|
| News America Holdings, Inc. company | | |
| guaranty 7 3/4s, 2024 | 1,430,000 | 1,206,507 |
|
| News America Holdings, Inc. debs. | | |
| 7 3/4s, 2045 | 2,810,000 | 2,345,678 |
|
| Rogers Communications Inc. company | | |
| guaranty notes 6.8s, 2018 (Canada) | 1,010,000 | 885,013 |
|
| SABMiller PLC 144A notes 6 1/2s, | | |
| 2018 (United Kingdom) | 1,660,000 | 1,435,545 |
|
| Sara Lee Corp. sr. unsec. unsub. notes | | |
| 6 1/4s, 2011 | 1,195,000 | 1,147,875 |
|
| TCI Communications, Inc. company | | |
| guaranty 7 7/8s, 2026 | 4,215,000 | 3,654,047 |
|
| TCI Communications, Inc. debs. 9.8s, 2012 | 1,580,000 | 1,598,508 |
|
| Tesco PLC 144A sr. unsec. unsub. notes | | |
| 6.15s, 2037 (United Kingdom) S | 1,545,000 | 1,025,471 |
|
| Time Warner Cable, Inc. company | | |
| guaranty sr. notes 7.3s, 2038 | 1,915,000 | 1,585,001 |
|
| Time Warner Cable, Inc. company | | |
| guaranty sr. unsec. 6 3/4s, 2018 | 585,000 | 503,910 |
|
| Time Warner Entertainment Co., LP | | |
| debs. 8 3/8s, 2023 | 90,000 | 80,315 |
|
| Time Warner, Inc. debs. 9.15s, 2023 | 1,115,000 | 1,035,042 |
|
| Time Warner, Inc. debs. 9 1/8s, 2013 | 2,740,000 | 2,631,962 |
|
| Viacom, Inc. sr. notes 5 3/4s, 2011 | 810,000 | 724,633 |
|
| Yum! Brands, Inc. sr. unsec. unsub. 6 1/4s, 2018 | 1,180,000 | 892,379 |
|
| | | 36,670,362 |
| Energy (1.0%) | | |
| Anadarko Petroleum Corp. sr. notes 5.95s, 2016 | 487,000 | 402,867 |
|
| Chesapeake Energy Corp. sr. unsec. notes | | |
| 7 5/8s, 2013 | 1,375,000 | 1,168,750 |
|
| ConocoPhillips comp 5.9s, 2038 | 980,000 | 733,527 |
|
| ConocoPhillips company guaranty unsec. | | |
| sr. notes 5.2s, 2018 | 470,000 | 388,384 |
|
| El Paso Natural Gas Co. sr. unsec. notes | | |
| 5.95s, 2017 | 165,000 | 127,611 |
|
30
| | |
| CORPORATE BONDS | Principal | |
| AND NOTES (21.2%)* cont. | amount | Value |
|
| Energy cont. | | |
| Enterprise Products Operating, LLC company | | |
| guaranty sr. notes 6 1/2s, 2019 | $1,120,000 | $907,297 |
|
| EOG Resources, Inc. sr. unsec. notes | | |
| 5 7/8s, 2017 | 910,000 | 804,478 |
|
| Forest Oil Corp. sr. notes 8s, 2011 | 755,000 | 671,950 |
|
| Hess Corp. sr. unsec. bonds 7 7/8s, 2029 | 1,357,000 | 1,156,959 |
|
| Motiva Enterprises, LLC 144A sr. notes | | |
| 5.2s, 2012 | 315,000 | 320,800 |
|
| Newfield Exploration Co. sr. sub. notes | | |
| 6 5/8s, 2016 | 900,000 | 670,500 |
|
| Nexen, Inc. unsec. unsub. notes | | |
| 6.4s, 2037 (Canada) | 815,000 | 555,895 |
|
| Peabody Energy Corp. sr. notes 5 7/8s, 2016 | 1,095,000 | 845,888 |
|
| Petro-Canada sr. unsec. unsub. notes | | |
| 6.05s, 2018 (Canada) | 765,000 | 594,534 |
|
| Premcor Refining Group, Inc. sr. notes | | |
| 7 1/2s, 2015 | 2,045,000 | 1,877,371 |
|
| Sunoco, Inc. notes 4 7/8s, 2014 | 770,000 | 602,801 |
|
| Tesoro Corp. company guaranty 6 1/2s, 2017 | 360,000 | 241,200 |
|
| Weatherford International, Inc. company | | |
| guaranty sr. unsec. unsub. bonds 6.8s, 2037 | 345,000 | 244,701 |
|
| Weatherford International, Inc. company | | |
| guaranty sr. unsec. unsub. bonds 6.35s, 2017 | 400,000 | 330,450 |
|
| Weatherford International, Ltd. company | | |
| guaranty 6 1/2s, 2036 | 1,125,000 | 748,378 |
|
| Weatherford International, Ltd. sr. notes | | |
| 5 1/2s, 2016 | 650,000 | 506,092 |
|
| XTO Energy, Inc. sr. unsec. notes 6 3/4s, 2037 | 1,045,000 | 774,431 |
|
| XTO Energy, Inc. sr. unsec. notes 5 1/2s, 2018 | 470,000 | 366,407 |
|
| XTO Energy, Inc. sr. unsec. unsub. notes | | |
| 6 1/2s, 2018 | 835,000 | 699,242 |
|
| | | 15,740,513 |
| Financials (7.3%) | | |
| Allstate Life Global Funding Trusts notes | | |
| Ser. MTN, 5 3/8s, 2013 | 1,920,000 | 1,735,119 |
|
| American Express Bank FSB notes Ser. | | |
| BKN1, 5.55s, 2012 | 1,635,000 | 1,363,469 |
|
| American Express Bank FSB sr. unsec. | | |
| FRN Ser. BKNT, 4.888s, 2017 | 1,715,000 | 1,029,000 |
|
| American International Group, Inc. sr. unsec. | | |
| Ser. G, 5.85s, 2018 | 4,375,000 | 1,575,000 |
|
| American International Group, Inc. 144A | | |
| sr. unsec. notes 8 1/4s, 2018 | 690,000 | 275,138 |
|
| Amvescap PLC company guaranty 5 5/8s, 2012 | 720,000 | 694,945 |
|
| ANZ National International Ltd. 144A bank | | |
| guaranty sr. unsec. note 6.2s, 2013 (New Zealand) | 1,670,000 | 1,507,237 |
|
| Bank of America Corp. sub. notes 7 3/4s, 2015 | 2,415,000 | 2,326,623 |
|
| Bank of America NA sub. notes 5.3s, 2017 | 1,495,000 | 1,259,677 |
|
| Bank of New York Mellon Corp. (The) sr. | | |
| unsec. unsub. notes Ser. G, 4.95s, 2012 | 825,000 | 796,073 |
|
| Barclays Bank PLC unsec. FRN 3.313s, 2049 | | |
| (United Kingdom) | 2,520,000 | 1,058,400 |
|
| Bear Stearns Cos., Inc. (The) notes Ser. | | |
| MTN, 6.95s, 2012 | 2,270,000 | 2,239,945 |
|
| Bear Stearns Cos., Inc. (The) sr. notes | | |
| 6.4s, 2017 | 1,690,000 | 1,506,223 |
|
| Bear Stearns Cos., Inc. (The) sr. unsec. notes | | |
| 7 1/4s, 2018 | 3,960,000 | 3,727,976 |
|
| Bosphorus Financial Services, Ltd. 144A sec. | | |
| sr. notes FRN 4.604s, 2012 (Cayman Islands) | 2,543,625 | 2,460,728 |
| |
| | |
| CORPORATE BONDS | Principal | |
| AND NOTES (21.2%)* cont. | amount | Value |
|
| Financials cont. | | |
| Capital One Financial Corp. sub. notes | | |
| 6.15s, 2016 | $1,635,000 | $991,724 |
|
| Chubb Corp. (The) sr. notes 6 1/2s, 2038 | 800,000 | 609,990 |
|
| CIT Group, Inc. sr. notes 5.4s, 2013 | 1,930,000 | 1,017,793 |
|
| CIT Group, Inc. sr. notes 5s, 2015 | 5,000 | 2,543 |
|
| CIT Group, Inc. sr. notes 5s, 2014 | 1,870,000 | 973,256 |
|
| Citigroup, Inc. sr. notes 6 1/2s, 2013 | 1,565,000 | 1,483,556 |
|
| Citigroup, Inc. sr. unsec. bonds 6 7/8s, 2038 | 942,000 | 807,990 |
|
| Citigroup, Inc. sr. unsec. notes 6 1/8s, 2018 S | 5,150,000 | 4,411,928 |
|
| Citigroup, Inc. sub. notes 5s, 2014 | 1,791,000 | 1,415,719 |
|
| CNA Financial Corp. unsec. notes 6 1/2s, 2016 | 985,000 | 736,483 |
|
| CNA Financial Corp. unsec. notes 6s, 2011 | 990,000 | 917,671 |
|
| Countrywide Financial Corp. FRN Ser. MTN, | | |
| 2.946s, 2012 | 1,800,000 | 1,509,750 |
|
| Deutsche Bank AG/London notes 4 7/8s, | | |
| 2013 (Germany) | 1,265,000 | 1,178,828 |
|
| Deutsche Bank Capital Funding Trust VII | | |
| 144A FRB 5.628s, 2049 | 1,540,000 | 926,469 |
|
| Developers Diversified Realty Corp. unsec. | | |
| notes 5 3/8s, 2012 R | 485,000 | 362,569 |
|
| Dresdner Funding Trust I 144A bonds | | |
| 8.151s, 2031 | 100,000 | 47,858 |
|
| Duke Realty LP sr. unsec. notes 6 1/2s, 2018 | 650,000 | 419,050 |
|
| Duke Realty LP sr. unsec. notes 6 1/4s, 2013 R | 405,000 | 363,311 |
|
| Equity One, Inc. notes 5 3/8s, 2015 R | 965,000 | 782,711 |
|
| Erac USA Finance Co. 144A company guaranty | | |
| 6 3/8s, 2017 | 1,510,000 | 926,131 |
|
| Fund American Cos., Inc. notes 5 7/8s, 2013 | 1,740,000 | 1,250,748 |
|
| GATX Financial Corp. notes 5.8s, 2016 | 755,000 | 577,681 |
|
| General Electric Capital Corp. sr. unsec. FRN | | |
| Ser. MTN, 3.003s, 2016 | 2,155,000 | 1,649,504 |
|
| General Electric Capital Corp. sr. unsec. | | |
| notes 5 7/8s, 2038 | 3,300,000 | 2,354,022 |
|
| Genworth Life Institutional Funding Trust | | |
| notes Ser. MTN, 5 7/8s, 2013 | 1,425,000 | 982,777 |
|
| GMAC, LLC sr. unsec. unsub. notes FRN | | |
| 4.054s, 2009 | 1,408,000 | 1,175,680 |
|
| Goldman Sachs Group, Inc (The) sr. unsec. | | |
| 6.15s, 2018 | 975,000 | 807,683 |
|
| Goldman Sachs Group, Inc. (The) sr. notes | | |
| 5.45s, 2012 | 1,590,000 | 1,399,200 |
|
| Goldman Sachs Group, Inc. (The) sub. notes | | |
| 6 3/4s, 2037 | 4,150,000 | 2,709,950 |
|
| Hartford Financial Services Group, Inc. (The) | | |
| sr. unsec. notes 6.1s, 2041 | 3,000,000 | 1,699,500 |
|
| HCP, Inc. sr. unsec. Ser. MTN, 6.7s, 2018 R | 90,000 | 63,423 |
|
| Health Care Property Investors, Inc. sr. | | |
| unsec. notes 6s, 2017 | 1,045,000 | 742,230 |
|
| Health Care REIT, Inc. sr. notes 6s, 2013 R | 520,000 | 453,396 |
|
| Highwood Properties, Inc. sr. unsec. | | |
| bonds 5.85s, 2017 R | 1,385,000 | 890,056 |
|
| Hospitality Properties Trust notes 6 3/4s, 2013 R | 1,005,000 | 892,451 |
|
| HRPT Properties Trust bonds 5 3/4s, 2014 R | 715,000 | 573,221 |
|
| HRPT Properties Trust notes 6 1/4s, 2016 R | 660,000 | 468,669 |
|
| HSBC Bank USA NA sub. notes 7s, 2039 | 1,090,000 | 961,006 |
|
| HSBC Holdings PLC sub. notes 6 1/2s, | | |
| 2037 (United Kingdom) | 9,060,000 | 7,143,828 |
|
| iStar Financial, Inc. sr. unsec. notes 5 7/8s, 2016 R | 2,210,000 | 839,800 |
|
31
| | |
| CORPORATE BONDS | Principal | |
| AND NOTES (21.2%)* cont. | amount | Value |
|
| Financials cont. | | |
| iStar Financial, Inc. sr. unsec. notes Ser. B, | | |
| 4 7/8s, 2009 R | $855,000 | $709,650 |
|
| JPMorgan Chase & Co. sr. notes 6s, 2018 | 85,000 | 76,252 |
|
| JPMorgan Chase Bank NA sub. notes 6s, 2017 | 404,000 | 353,658 |
|
| JPMorgan Chase Bank NA sub. notes Ser. | | |
| BKNT, 6s, 2017 | 2,161,000 | 1,909,021 |
|
| Liberty Mutual Group 144A notes 6 1/2s, 2035 | 2,825,000 | 1,796,816 |
|
| Lincoln National Corp. sr. unsec. notes | | |
| 6.3s, 2037 | 1,855,000 | 1,195,234 |
|
| Loews Corp. notes 5 1/4s, 2016 | 635,000 | 496,062 |
|
| Marsh & McLennan Cos., Inc. sr. unsec. | | |
| notes 6 1/4s, 2012 | 2,230,000 | 2,247,512 |
|
| Marsh & McLennan Cos., Inc. sr. unsec. | | |
| notes 5 3/8s, 2014 | 1,360,000 | 1,266,794 |
|
| Merrill Lynch & Co., Inc. jr. sub. bonds | | |
| 7 3/4s, 2038 | 2,535,000 | 2,084,280 |
|
| Merrill Lynch & Co., Inc. notes 5.45s, 2013 | 2,220,000 | 1,988,767 |
|
| Merrill Lynch & Co., Inc. notes FRN Ser. | | |
| MTN, 3.735s, 2011 | 1,500,000 | 1,268,573 |
|
| MetLife, Inc. sr. unsec. notes Ser. A, | | |
| 6.817s, 2018 | 2,415,000 | 2,079,279 |
|
| Monumental Global Funding, Ltd. 144A | | |
| notes 5 1/2s, 2013 (Cayman Islands) | 1,160,000 | 1,099,834 |
|
| Morgan Stanley & Co. sr. unsec. notes | | |
| Ser. MTN, 5 3/4s, 2016 | 1,600,000 | 1,247,962 |
|
| Nationwide Financial Services, Inc. notes | | |
| 5 5/8s, 2015 | 820,000 | 833,474 |
|
| Nationwide Health Properties, Inc. notes | | |
| 6 1/2s, 2011 R | 890,000 | 803,979 |
|
| Nationwide Health Properties, Inc. unsec. | | |
| notes 6 1/4s, 2013 R | 1,510,000 | 1,364,981 |
|
| Nuveen Investments, Inc. sr. unsec. notes | | |
| 5 1/2s, 2015 | 640,000 | 102,400 |
|
| OneAmerica Financial Partners, Inc. 144A | | |
| bonds 7s, 2033 | 1,670,000 | 1,780,923 |
|
| Pacific Life Global Funding 144A notes | | |
| 5.15s, 2013 | 1,115,000 | 1,131,687 |
|
| Protective Life Secured Trusts sr. sec. | | |
| notes 5.45s, 2012 | 760,000 | 679,093 |
|
| Prudential Financial, Inc. sr. unsec. unsub. | | |
| notes Ser. MTNB, 5.1s, 2014 | 945,000 | 714,917 |
|
| Prudential Holdings LLC 144A bonds | | |
| 8.695s, 2023 | 2,035,000 | 1,753,539 |
|
| Regency Centers LP sr. unsec. 5 7/8s, 2017 | 895,000 | 681,832 |
|
| Rouse Co. (The) notes 7.2s, 2012 R | 885,000 | 309,750 |
|
| Rouse Co., LP (The) / TRC Property | | |
| Holdings, Inc. 144A sr. unsec. unsub. notes | | |
| 6 3/4s, 2013 R | 935,000 | 317,900 |
|
| Simon Property Group LP sr. unsec. notes | | |
| 6 1/8s, 2018 R | 1,530,000 | 1,031,733 |
|
| Simon Property Group LP unsub. bonds | | |
| 5 3/4s, 2015 R | 476,000 | 353,526 |
|
| SLM Corp. notes Ser. MTNA, 4 1/2s, 2010 | 1,515,000 | 1,185,701 |
|
| Sovereign Bancorp, Inc. sr. notes 4.8s, 2010 | 920,000 | 818,416 |
|
| Travelers Cos., Inc. (The) sr. unsec. notes | | |
| 6 1/4s, 2037 | 2,165,000 | 1,596,545 |
|
| Unitrin, Inc. sr. notes 6s, 2017 | 1,020,000 | 849,941 |
|
| Wachovia Bank NA sr. unsec. sub. notes | | |
| 6.6s, 2038 | 985,000 | 778,821 |
|
| | |
| CORPORATE BONDS | Principal | |
| AND NOTES (21.2%)* cont. | amount | Value |
|
| Financials cont. | | |
| Wachovia Bank NA sub. notes Ser. | | |
| BKNT, 6s, 2017 | $3,110,000 | $2,505,055 |
|
| Wells Fargo & Co. sr. notes 4 3/8s, 2013 S | 2,945,000 | 2,718,983 |
|
| Westfield Group sr. notes 5.7s, 2016 (Australia) | 1,175,000 | 872,121 |
|
| Willis Group North America, Inc. | | |
| company guaranty 6.2s, 2017 | 840,000 | 612,125 |
|
| | | 114,692,844 |
| Health care (0.6%) | | |
| Aetna, Inc. sr. unsec. unsub. notes 6 3/4s, 2037 | 4,150,000 | 2,948,330 |
|
| AstraZeneca PLC sr. unsub. notes 5.9s, | | |
| 2017 (United Kingdom) | 2,535,000 | 2,339,843 |
|
| GlaxoSmithKline Capital Inc, company | | |
| guaranty sr. notes 5.65s, 2018 | 1,545,000 | 1,369,193 |
|
| Hospira, Inc. sr. notes 6.05s, 2017 | 180,000 | 151,201 |
|
| Hospira, Inc. sr. notes 5.55s, 2012 | 1,075,000 | 976,385 |
|
| UnitedHealth Group, Inc. sr. unsec. | | |
| notes 5.8s, 2036 | 200,000 | 122,122 |
|
| UnitedHealth Group, Inc. sr. unsec. | | |
| notes 5 1/2s, 2012 | 1,015,000 | 896,506 |
|
| Ventas Realty LP/Capital Corp. sr. | | |
| notes 6 3/4s, 2017 R | 650,000 | 533,000 |
|
| | | 9,336,580 |
| Technology (0.6%) | | |
| Arrow Electronics, Inc. debs. 7 1/2s, 2027 | 1,020,000 | 798,822 |
|
| Avnet, Inc. notes 6s, 2015 | 965,000 | 748,776 |
|
| Fiserv, Inc. sr. unsec. unsub. notes | | |
| company guaranty 6.8s, 2017 | 1,015,000 | 775,522 |
|
| Fiserv, Inc. sr. unsec. unsub. notes | | |
| company guaranty 6 1/8s, 2012 | 1,015,000 | 893,801 |
|
| IBM Corp. sr. unsec. notes 5.7s, 2017 | 770,000 | 706,172 |
|
| Lexmark International Inc, sr. unsec. | | |
| notes 5.9s, 2013 | 1,415,000 | 1,399,891 |
|
| Motorola, Inc. sr. unsec. notes 6 5/8s, 2037 | 1,560,000 | 913,235 |
|
| Motorola, Inc. sr. unsec. notes 6s, 2017 | 750,000 | 514,419 |
|
| Tyco Electronics Group SA sr. unsec. | | |
| notes company guaranty 6s, 2012 (Luxembourg) | 1,620,000 | 1,524,420 |
|
| Tyco Electronics Group SA sr. unsec. unsub. | | |
| note company quaranty 5.95s, 2014 (Luxembourg) | 160,000 | 145,677 |
|
| Xerox Corp. sr. notes 6.4s, 2016 | 1,435,000 | 1,018,946 |
|
| Xerox Corp. sr. unsec. notes 6.35s, 2018 | 410,000 | 300,448 |
|
| Xerox Corp. sr. unsec. notes 5 1/2s, 2012 | 125,000 | 97,149 |
|
| | | 9,837,278 |
| Transportation (0.5%) | | |
| American Airlines, Inc. pass-through | | |
| certificates Ser. 01-1, 6.817s, 2011 | 160,000 | 105,600 |
|
| American Airlines, Inc. pass-through | | |
| certificates Ser. 01-2, 7.858s, 2011 | 710,000 | 564,450 |
|
| Canadian National Railway Co. sr. unsec. | | |
| unsub. notes 5.55s, 2018 (Canada) | 825,000 | 717,701 |
|
| Continental Airlines, Inc. pass-through | | |
| certificates Ser. 97-4A, 6.9s, 2018 | 1,373,260 | 1,112,340 |
|
| Continental Airlines, Inc. pass-through | | |
| certificates Ser. 98-1A, 6.648s, 2017 | 413,683 | 320,605 |
|
| Delta Air Lines, Inc. pass-through | | |
| certificates 6.821s, 2022 | 1,220,091 | 793,059 |
|
| Northwest Airlines Corp. pass-through | | |
| certificates Ser. 00-1, 7.15s, 2019 | 2,049,246 | 1,536,934 |
|
| Southwest Airlines Co. pass-through | | |
| certificates 6.15s, 2022 | 396,364 | 317,532 |
|
| Union Pacific Corp. sr. unsub. notes 5 3/4s, 2017 | 1,475,000 | 1,250,099 |
|
32
| | |
| CORPORATE BONDS | Principal | |
| AND NOTES (21.2%)* cont. | amount | Value |
|
| Transportation cont. | | |
| Union Pacific Corp. 144A pass-through | | |
| certificates 5.214s, 2014 | $470,000 | $469,836 |
|
| United AirLines, Inc. pass-through | | |
| certificates 6.636s, 2022 | 946,701 | 568,021 |
|
| | | 7,756,177 |
| Utilities and power (4.1%) | | |
| AEP Texas North Co. sr. notes Ser. B, | | |
| 5 1/2s, 2013 | 845,000 | 775,661 |
|
| American Water Capital Corp. sr. | | |
| unsec. bonds 6.593s, 2037 | 615,000 | 407,287 |
|
| American Water Capital Corp. sr. | | |
| unsec. bonds 6.085s, 2017 | 690,000 | 533,353 |
|
| Appalachian Power Co. sr. notes 5.8s, 2035 | 960,000 | 619,571 |
|
| Arizona Public Services Co. notes 6 1/2s, 2012 | 1,415,000 | 1,303,035 |
|
| Atmos Energy Corp. sr. unsub. notes 6.35s, 2017 | 1,255,000 | 998,591 |
|
| Beaver Valley II Funding debs. 9s, 2017 | 1,305,000 | 1,386,288 |
|
| Boardwalk Pipelines LP company guaranty | | |
| 5 7/8s, 2016 | 1,620,000 | 1,297,692 |
|
| Bruce Mansfield Unit pass-through certificates | | |
| 6.85s, 2034 | 3,275,000 | 3,212,831 |
|
| CenterPoint Energy Resources Corp. notes | | |
| 7 3/4s, 2011 | 1,740,000 | 1,635,931 |
|
| CMS Energy Corp. unsub. notes 6.55s, 2017 | 75,000 | 57,563 |
|
| Commonwealth Edison Co. 1st mtge. 6.15s, 2017 | 420,000 | 352,015 |
|
| Commonwealth Edison Co. 1st mtge. 5.9s, 2036 | 1,575,000 | 1,098,063 |
|
| Commonwealth Edison Co. 1st mtge. sec. | | |
| bonds 5 7/8s, 2033 | 790,000 | 556,444 |
|
| Commonwealth Edison Co. 1st mtge. sec. | | |
| bonds 5.8s, 2018 | 220,000 | 180,504 |
|
| Consolidated Natural Gas Co. sr. notes 5s, 2014 | 660,000 | 549,835 |
|
| Consumers Energy Co. 1st mtge. sec. bond | | |
| 6 1/8s, 2019 | 2,235,000 | 1,779,471 |
|
| Consumers Energy Co. 1st mtge. sec. bonds | | |
| 5.65s, 2018 | 125,000 | 97,174 |
|
| Dayton Power & Light Co. (The) 1st mtge. | | |
| 5 1/8s, 2013 | 876,000 | 848,551 |
|
| Dominion Resources, Inc. sr. unsec. unsub. | | |
| notes Ser. 07-A, 6s, 2017 | 4,060,000 | 3,374,335 |
|
| Duke Energy Carolinas LLC 1st mtge. sec. | | |
| bond 6.05s, 2038 S | 880,000 | 658,064 |
|
| Duke Energy Corp. sr. unsec. notes 6 1/4s, 2018 | 1,735,000 | 1,510,892 |
|
| Duke Energy Indiana, Inc. 1st mtge. sec. bond | | |
| 6.35s, 2038 S | 920,000 | 778,665 |
|
| E.ON International Finance BV 144A notes | | |
| 5.8s, 2018 (Netherlands) | 1,825,000 | 1,557,992 |
|
| Entergy Gulf States, Inc. 1st mtge. 5 1/4s, 2015 | 1,330,000 | 1,060,046 |
|
| Florida Power Corp. 1st mtge. 6.35s, 2037 | 750,000 | 656,003 |
|
| Florida Power Corp. 1st mtge. sec. bond | | |
| 6.4s, 2038 | 1,580,000 | 1,389,973 |
|
| Indianapolis Power & Light 144A 1st mtge. | | |
| 6.3s, 2013 | 680,000 | 670,049 |
|
| Indiantown Cogeneration LP 1st mtge. Ser. | | |
| A-10, 9.77s, 2020 | 1,065,000 | 1,052,827 |
|
| Ipalco Enterprises, Inc. 144A sr. sec. notes | | |
| 7 1/4s, 2016 | 320,000 | 267,200 |
|
| ITC Holdings Corp. 144A notes 5 7/8s, 2016 | 1,470,000 | 1,294,730 |
|
| ITC Holdings Corp. 144A sr. unsec. notes | | |
| 6.05s, 2018 | 540,000 | 472,987 |
|
| Kansas Gas & Electric bonds 5.647s, 2021 | 467,938 | 387,542 |
|
| | |
| CORPORATE BONDS | Principal | |
| AND NOTES (21.2%)* cont. | amount | Value |
|
| Utilities and power cont. | | |
| Kinder Morgan, Inc. sr. notes 6 1/2s, 2012 | $558,000 | $488,250 |
|
| MidAmerican Energy Holdings Co. bonds | | |
| 6 1/8s, 2036 | 3,030,000 | 2,230,353 |
|
| MidAmerican Energy Holdings Co. sr. | | |
| unsec. bond 6 1/2s, 2037 | 790,000 | 610,108 |
|
| National Fuel Gas Co. notes 5 1/4s, 2013 | 985,000 | 920,858 |
|
| Nevada Power Co. general ref. mtge. Ser. L, | | |
| 5 7/8s, 2015 | 585,000 | 506,209 |
|
| Northwest Pipeline Corp. sr. unsec. notes | | |
| 5.95s, 2017 | 300,000 | 244,611 |
|
| Northwestern Corp. sec. notes 5 7/8s, 2014 | 1,480,000 | 1,261,278 |
|
| Oncor Electric Delivery Co. debs. 7s, 2022 | 348,000 | 278,187 |
|
| Oncor Electric Delivery Co. sec. notes | | |
| 6 3/8s, 2012 | 360,000 | 342,300 |
|
| Oncor Electric Delivery Co. 144A 1st mtge. | | |
| sec. bond 5.95s, 2013 | 480,000 | 439,977 |
|
| Pacific Gas & Electric Co. sr. unsec. notes | | |
| 6.35s, 2038 | 485,000 | 389,620 |
|
| Pacific Gas & Electric Co. sr. unsub. 5.8s, 2037 | 1,070,000 | 778,244 |
|
| PacifiCorp Sinking Fund 1st mtge. 6 1/4s, 2037 | 760,000 | 619,022 |
|
| Potomac Edison Co. 144A 1st mtge. 5.8s, 2016 | 1,465,000 | 1,194,310 |
|
| Power Receivable Finance, LLC 144A sr. | | |
| notes 6.29s, 2012 | 913,145 | 950,429 |
|
| PPL Energy Supply LLC bonds Ser. A, 5.7s, 2015 | 855,000 | 704,496 |
|
| Progress Energy, Inc. sr. notes 6.85s, 2012 | 315,000 | 295,135 |
|
| Public Service Co. of Colorado 1st mtge. | | |
| sec. bond 6 1/2s, 2038 | 1,475,000 | 1,274,276 |
|
| Public Service Co. of Colorado sr. notes | | |
| Ser. A, 6 7/8s, 2009 | 1,610,000 | 1,614,334 |
|
| Rockies Express Pipeline, LLC 144A | | |
| sr. notes 7 1/2s, 2038 | 2,455,000 | 1,835,280 |
|
| Sierra Pacific Power Co. general ref. mtge. | | |
| Ser. P, 6 3/4s, 2037 | 2,350,000 | 1,779,382 |
|
| Southern California Edison Co. 1st mtge. | | |
| Ser. 06-E, 5.55s, 2037 S | 1,245,000 | 972,875 |
|
| Southern California Edison Co. notes | | |
| 6.65s, 2029 | 1,415,000 | 1,186,226 |
|
| Southern Natural Gas. Co. 144A notes | | |
| 5.9s, 2017 | 630,000 | 486,319 |
|
| Spectra Energy Capital, LLC company | | |
| guaranty sr. unsec. notes 5.9s, 2013 | 1,500,000 | 1,362,509 |
|
| Spectra Energy Capital, LLC company | | |
| guaranty sr. unsec. unsub. notes 6.2s, 2018 | 225,000 | 180,940 |
|
| Spectra Energy Capital, LLC sr. notes 8s, 2019 | 1,080,000 | 911,960 |
|
| Teco Finance, Inc. company guaranty sr. | | |
| unsec. unsub. notes 7.2s, 2011 | 1,490,000 | 1,471,648 |
|
| TransAlta Corp. notes 5 3/4s, 2013 (Canada) | 885,000 | 819,521 |
|
| TransAlta Corp. sr. unsec. notes 6.65s, | | |
| 2018 (Canada) | 1,095,000 | 949,456 |
|
| TransCanada Pipelines, Ltd. sr. unsec. | | |
| unsub. notes 6 1/2s, 2018 (Canada) | 1,525,000 | 1,283,862 |
|
| Union Electric Co. 1st mtge. sr. sec. bond | | |
| 6.7s, 2019 | 920,000 | 790,029 |
|
| West Penn Power Co. 1st mtge. 5.95s, 2017 | 1,370,000 | 1,116,083 |
|
| Westar Energy, Inc. 1st mtge. 5.15s, 2017 | 195,000 | 161,811 |
|
| Westar Energy, Inc. 1st mtge. 5.1s, 2020 | 1,020,000 | 786,012 |
|
| | | 64,057,075 |
| | |
| Total corporate bonds and notes (cost $407,846,749) | $332,935,704 |
33
| | |
| ASSET-BACKED | Principal | |
| SECURITIES (10.9%)* | amount | Value |
|
| Accredited Mortgage Loan Trust | | |
| FRB Ser. 05-1, Class M2, 3.949s, 2035 | $436,096 | $130,829 |
| FRB Ser. 05-4, Class A2C, 3.469s, 2035 | 493,000 | 441,235 |
|
| Ace Securities Corp. | | |
| FRB Ser. 06-OP2, Class A2C, 3.409s, 2036 | 1,258,000 | 635,290 |
| FRB Ser. 06-HE3, Class A2C, 3.409s, 2036 | 1,603,000 | 879,778 |
|
| Advanta Business Card Master Trust FRB | | |
| Ser. 04-C1, Class C, 5.328s, 2013 | 1,939,000 | 664,709 |
|
| Aegis Asset Backed Securities Trust 144A | | |
| Ser. 04-6N, Class Note, 4 3/4s, 2035 | 74,374 | 7 |
|
| AFC Home Equity Loan Trust Ser. 99-2, | | |
| Class 1A, 3.617s, 2029 | 3,762,872 | 1,633,143 |
|
| American Express Credit Account Master | | |
| Trust 144A Ser. 04-C, Class C, 5.06s, 2012 | 565,273 | 534,033 |
|
| Ameriquest Mortgage Securities, Inc. | | |
| FRB Ser. 06-R1, Class M10, 5.759s, 2036 | 1,245,000 | 66,359 |
| FRB Ser. 03-8, Class M2, 5.009s, 2033 | 625,154 | 93,773 |
|
| AMP CMBS 144A FRB Ser. 06-1A, Class A, | | |
| 3.569s, 2047 (Cayman Islands) | 2,520,000 | 974,938 |
|
| Arcap REIT, Inc. 144A | | |
| Ser. 03-1A, Class E, 7.11s, 2038 | 1,993,000 | 1,282,667 |
| Ser. 04-1A, Class E, 6.42s, 2039 | 1,469,204 | 834,979 |
|
| Argent Securities, Inc. | | |
| FRB Ser. 03-W3, Class M3, 5.529s, 2033 | 70,558 | 4,939 |
| FRB Ser. 06-W4, Class A2C, 3.419s, 2036 | 2,865,000 | 1,575,750 |
|
| Asset Backed Funding Certificates | | |
| FRB Ser. 04-OPT2, Class M2, 4.259s, 2033 | 644,244 | 225,486 |
| FRB Ser. 05-WMC1, Class M1, 3.699s, 2035 | 893,000 | 634,030 |
|
| Asset Backed Funding Corp. NIM Trust 144A | | |
| FRB Ser. 05-OPT1, Class B1, 5.759s, 2035 | 508,457 | 7,804 |
|
| Asset Backed Securities Corp. Home | | |
| Equity Loan Trust | | |
| FRB Ser. 06-HE2, Class A3, 3.449s, 2036 | 543,025 | 405,158 |
| FRB Ser. 06-HE4, Class A5, 3.419s, 2036 | 2,101,036 | 1,607,293 |
| FRB Ser. 06-HE7, Class A4, 3.399s, 2036 | 874,000 | 419,083 |
|
| Aviation Capital Group Trust 144A FRB | | |
| Ser. 03-2A, Class G1, 4.978s, 2033 | 1,294,839 | 608,574 |
|
| Bay View Auto Trust Ser. 05-LJ2, Class D, | | |
| 5.27s, 2014 | 534,000 | 502,210 |
|
| Bayview Financial Acquisition Trust FRB | | |
| Ser. 04-D, Class A, 3.63s, 2044 | 1,330,162 | 1,122,531 |
|
| Bayview Financial Asset Trust 144A | | |
| FRB Ser. 03-SSRA, Class M, 4.609s, 2038 | 922,112 | 666,226 |
| FRB Ser. 03-SSRA, Class A, 3.959s, 2038 | 807,421 | 649,974 |
| FRB Ser. 04-SSRA, Class A1, 3.859s, 2039 | 1,106,997 | 774,898 |
|
| Bear Stearns Asset Backed Securities, Inc. | | |
| FRB Ser. 06-EC1, Class M9, 5.259s, 2035 | 881,429 | 17,629 |
| FRB Ser. 06-PC1, Class M9, 5.009s, 2035 | 546,000 | 5,460 |
| FRB Ser. 05-HE1, Class M3, 4.189s, 2035 | 645,000 | 161,250 |
| FRB Ser. 03-3, Class A2, 3.849s, 2043 | 2,396,676 | 2,073,676 |
| FRB Ser. 03-1, Class A1, 3.759s, 2042 | 751,257 | 612,187 |
| FRB Ser. 05-3, Class A1, 3.709s, 2035 | 437,415 | 391,965 |
|
| Bear Stearns Asset Backed Securities, Inc. | | |
| 144A FRB Ser. 06-HE2, Class M10, 5.509s, 2036 | 194,019 | 1,332 |
|
| Capital Auto Receivables Asset Trust 144A | | |
| Ser. 06-1, Class D, 7.16s, 2013 | 1,000,000 | 843,477 |
| Ser. 05-1, Class D, 6 1/2s, 2011 | 1,776,000 | 1,568,430 |
|
| Citigroup Mortgage Loan Trust, Inc. FRB | | |
| Ser. 05-OPT1, Class M1, 3.679s, 2035 | 539,532 | 337,929 |
|
| Conseco Finance Securitizations Corp. | | |
| Ser. 00-2, Class A5, 8.85s, 2030 | 7,099,235 | 4,271,198 |
| Ser. 02-2, Class A, IO, 8 1/2s, 2033 | 6,928,547 | 718,463 |
| Ser. 00-4, Class A6, 8.31s, 2032 | 7,666,323 | 4,450,753 |
| Ser. 00-5, Class A6, 7.96s, 2032 | 4,105,620 | 2,528,487 |
| | |
| ASSET-BACKED | Principal | |
| SECURITIES (10.9%)* cont. | amount | Value |
|
| Conseco Finance Securitizations Corp. | | |
| Ser. 02-1, Class M1F, 7.954s, 2033 | $1,561,000 | $1,382,854 |
| Ser. 01-4, Class A4, 7.36s, 2033 | 5,833,348 | 4,108,445 |
| Ser. 00-6, Class A5, 7.27s, 2031 | 1,303,850 | 846,872 |
| Ser. 01-1, Class A5, 6.99s, 2032 | 5,569,850 | 3,501,909 |
| Ser. 01-3, Class A4, 6.91s, 2033 | 7,531,860 | 5,097,171 |
| Ser. 02-1, Class A, 6.681s, 2033 | 5,692,292 | 4,656,022 |
|
| Countrywide Asset Backed Certificates | | |
| FRB Ser. 05-BC3, Class M1, 3.779s, 2035 | 474,000 | 284,400 |
| FRB Ser. 04-6, Class 2A5, 3.649s, 2034 | 1,272,567 | 1,018,053 |
| FRB Ser. 05-14, Class 3A2, 3.499s, 2036 | 299,962 | 260,967 |
|
| Credit-Based Asset Servicing and Securitization | | |
| 144A Ser. 06-MH1, Class B1, 6 1/4s, 2036 | 625,000 | 376,563 |
|
| Crest, Ltd. 144A Ser. 03-2A, Class D2, | | |
| 6.723s, 2038 (Cayman Islands) | 2,157,000 | 1,078,500 |
|
| CS First Boston Mortgage Securities Corp. | | |
| 144A Ser. 04-FR1N, Class A, 5s, 2034 | 247,417 | 17,319 |
|
| DB Master Finance, LLC 144A Ser. 06-1, | | |
| Class M1, 8.285s, 2031 | 1,262,000 | 914,635 |
|
| Equifirst Mortgage Loan Trust FRB Ser. 05-1, | | |
| Class M5, 3.929s, 2035 | 265,000 | 13,250 |
|
| Fieldstone Mortgage Investment Corp. FRB | | |
| Ser. 05-1, Class M3, 3.799s, 2035 | 859,000 | 792,053 |
|
| First Franklin Mortgage Loan Asset Backed | | |
| Certificates FRB Ser. 06-FF7, Class 2A3, | | |
| 3.409s, 2036 | 1,999,000 | 1,151,024 |
|
| First Plus Home Loan Trust Ser. 97-3, | | |
| Class B1, 7.79s, 2023 | 279,675 | 261,022 |
|
| Fort Point CDO, Ltd. FRB Ser. 03-2A, | | |
| Class A2, 3.86s, 2038 (Cayman Islands) | 834,000 | 50,040 |
|
| Foxe Basin, Ltd. 144A FRB Ser. 03-1A, | | |
| Class A1, 3.319s, 2015 (Cayman Islands) | 2,600,000 | 2,441,140 |
|
| Fremont Home Loan Trust | | |
| FRB Ser. 05-E, Class 2A4, 3.589s, 2036 | 2,801,000 | 1,932,690 |
| FRB Ser. 06-2, Class 2A3, 3.429s, 2036 | 4,961,000 | 3,373,480 |
|
| G-Star, Ltd. 144A FRB Ser. 02-2A, Class BFL, | | |
| 5.259s, 2037 (Cayman Islands) F | 417,000 | 342,070 |
|
| GE Corporate Aircraft Financing, LLC 144A | | |
| FRB Ser. 05-1A, Class C, 4.559s, 2019 | 1,593,000 | 923,940 |
| Ser. 04-1A, Class B, 4.057s, 2018 | 61,622 | 52,995 |
|
| Gears Auto Owner Trust 144A Ser. 05-AA, | | |
| Class E1, 8.22s, 2012 | 2,523,000 | 2,418,731 |
|
| GEBL 144A | | |
| Ser. 04-2, Class D, 7.31s, 2032 | 738,683 | 169,897 |
| Ser. 04-2, Class C, 5.41s, 2032 | 277,006 | 164,126 |
|
| Green Tree Financial Corp. | | |
| Ser. 96-5, Class M1, 8.05s, 2027 | 729,203 | 377,607 |
| Ser. 99-5, Class A5, 7.86s, 2030 | 16,365,506 | 10,096,617 |
| Ser. 97-2, Class A7, 7.62s, 2028 | 396,749 | 407,329 |
| Ser. 97-6, Class A9, 7.55s, 2029 | 832,350 | 827,376 |
| Ser. 97-4, Class A7, 7.36s, 2029 | 258,722 | 262,046 |
| Ser. 95-8, Class B1, 7.3s, 2026 | 467,121 | 388,992 |
| Ser. 96-10, Class M1, 7.24s, 2028 | 1,342,000 | 733,090 |
| Ser. 97-3, Class A5, 7.14s, 2028 | 530,353 | 508,711 |
| Ser. 97-6, Class A8, 7.07s, 2029 | 197,286 | 196,674 |
| Ser. 98-4, Class A7, 6.87s, 2030 | 391,365 | 368,296 |
| Ser. 97-7, Class A8, 6.86s, 2029 | 163,041 | 162,452 |
| Ser. 99-3, Class A6, 6 1/2s, 2031 | 40,652 | 40,641 |
| Ser. 98-6, Class A7, 6.45s, 2030 | 429,077 | 425,904 |
| Ser. 99-2, Class A7, 6.44s, 2030 | 1,471,163 | 934,490 |
| Ser. 99-1, Class A6, 6.37s, 2025 | 1,602,000 | 1,573,600 |
|
| Greenpoint Manufactured Housing | | |
| Ser. 00-3, Class IA, 8.45s, 2031 | 4,556,345 | 2,860,314 |
| Ser. 99-5, Class M1A, 8.3s, 2026 | 669,000 | 362,631 |
| Ser. 99-3, Class 1A5, 6.79s, 2023 | 231,372 | 220,182 |
|
34
| | |
| ASSET-BACKED | Principal | |
| SECURITIES (10.9%)* cont. | amount | Value |
|
| GS Auto Loan Trust 144A Ser. 04-1, Class D, | | |
| 5s, 2011 F | $1,517,046 | $1,388,088 |
|
| GSAMP Trust FRB Ser. 06-HE5, Class A2C, | | |
| 3.409s, 2036 | 7,385,000 | 4,639,405 |
|
| Guggenheim Structured Real Estate | | |
| Funding, Ltd. 144A | | |
| FRB Ser. 05-2A, Class D, 4.809s, 2030 | | |
| (Cayman Islands) | 1,609,000 | 702,811 |
| FRB Ser. 05-1A, Class D, 4.789s, 2030 | | |
| (Cayman Islands) | 533,020 | 389,105 |
|
| High Income Trust Securities 144A FRB | | |
| Ser. 03-1A, Class A, 3.303s, 2036 | | |
| (Cayman Islands) | 1,683,677 | 673,471 |
|
| Home Equity Asset Trust FRB Ser. 06-1, | | |
| Class 2A4, 3.589s, 2036 | 1,413,000 | 826,605 |
|
| JPMorgan Mortgage Acquisition Corp. | | |
| FRB Ser. 05-OPT2, Class M11, 5.509s, 2035 | 435,000 | 21,750 |
| FRB Ser. 06-FRE1, Class A4, 3.549s, 2035 | 1,186,000 | 631,545 |
|
| Lehman Manufactured Housing Ser. 98-1, | | |
| Class 1, IO, 0.807s, 2028 | 18,644,630 | 196,850 |
|
| Lehman XS Trust | | |
| Ser. 07-6, Class 3A6, 6 1/2s, 2037 | 16,503,928 | 11,057,632 |
| IFB Ser. 07-3, Class 4B, IO, 3.483s, 2037 | 5,875,226 | 409,601 |
| FRB Ser. 07-6, Class 2A1, 3.469s, 2037 | 13,613,899 | 7,279,111 |
|
| LNR CDO, Ltd. 144A | | |
| FRB Ser. 03-1A, Class EFL, 6.528s, 2036 | | |
| (Cayman Islands) | 4,150,000 | 1,037,500 |
| FRB Ser. 02-1A, Class FFL, 6.025s, 2037 | | |
| (Cayman Islands) | 6,071,000 | 2,428,400 |
|
| Local Insight Media Finance, LLC Ser. 07-1W, | | |
| Class A1, 5.53s, 2012 F | 6,862,549 | 4,460,657 |
|
| Long Beach Mortgage Loan Trust | | |
| FRB Ser. 05-2, Class M4, 3.879s, 2035 F | 738,000 | 199,998 |
| FRB Ser. 06-4, Class 2A4, 3.519s, 2036 | 1,349,000 | 646,228 |
| FRB Ser. 06-1, Class 2A3, 3.449s, 2036 | 2,262,000 | 1,266,720 |
|
| Madison Avenue Manufactured Housing Contract | | |
| FRB Ser. 02-A, Class B1, 6.509s, 2032 | 5,098,734 | 2,564,735 |
| FRB Ser. 02-A, Class M2, 5.509s, 2032 | 453,000 | 214,444 |
| Ser. 02-A IO, 0.3s, 2032 | 147,832,010 | 1,420,074 |
|
| Marriott Vacation Club Owner Trust 144A | | |
| Ser. 05-2, Class D, 6.205s, 2027 | 102,680 | 100,811 |
| Ser. 04-2A, Class D, 5.389s, 2026 | 96,539 | 94,658 |
| FRB Ser. 02-1A, Class A1, 4.978s, 2024 | 1,099,394 | 984,371 |
| Ser. 04-2A, Class C, 4.741s, 2026 | 111,624 | 110,172 |
|
| MASTR Asset Backed Securities Trust FRB | | |
| Ser. 06-FRE2, Class A4, 3.409s, 2036 | 705,000 | 477,624 |
|
| Mid-State Trust | | |
| Ser. 11, Class B, 8.221s, 2038 | 729,254 | 552,785 |
| Ser. 10, Class B, 7.54s, 2036 | 741,823 | 578,887 |
|
| Morgan Stanley ABS Capital I | | |
| FRB Ser. 05-HE2, Class M5, 3.939s, 2035 F | 461,000 | 59,952 |
| FRB Ser. 05-HE1, Class M3, 3.779s, 2034 F | 461,000 | 147,585 |
| FRB Ser. 06-NC4, Class M2, 3.559s, 2036 F | 645,000 | 32,556 |
|
| N-Star Real Estate CDO, Ltd. 144A FRB | | |
| Ser. 04-2A, Class C1, 5.24s, 2039 (Cayman Islands) | 735,000 | 588,000 |
|
| Navigator CDO, Ltd. 144A FRB Ser. 03-1A, | | |
| Class A1, 3.294s, 2015 (Cayman Islands) | 438,986 | 418,573 |
|
| Navistar Financial Corp. Owner Trust | | |
| Ser. 05-A, Class C, 4.84s, 2014 | 196,219 | 175,912 |
| Ser. 04-B, Class C, 3.93s, 2012 | 229,178 | 192,865 |
|
| New Century Home Equity Loan Trust | | |
| FRB Ser. 03-4, Class M3, 5.309s, 2033 F | 38,746 | 1,163 |
| Ser. 03-5, Class AI7, 5.15s, 2033 | 2,106,428 | 1,843,124 |
|
| | |
| ASSET-BACKED | Principal | |
| SECURITIES (10.9%)* cont. | amount | Value |
|
| Novastar Home Equity Loan | | |
| FRB Ser. 06-1, Class A2C, 3.419s, 2036 | $1,677,000 | $1,257,750 |
| FRB Ser. 06-2, Class A2C, 3.409s, 2036 | 1,677,000 | 1,198,939 |
|
| Oakwood Mortgage Investors, Inc. | | |
| Ser. 00-D, Class A3, 6.99s, 2022 | 200,577 | 200,556 |
| Ser. 01-D, Class A3, 5.9s, 2022 | 205,293 | 109,655 |
| Ser. 02-C, Class A1, 5.41s, 2032 | 4,513,342 | 2,975,692 |
|
| Oakwood Mortgage Investors, Inc. 144A | | |
| Ser. 01-B, Class A4, 7.21s, 2030 | 657,718 | 427,319 |
| Ser. 01-B, Class A3, 6.535s, 2023 | 199,225 | 125,610 |
|
| Ocean Star PLC 144A FRB Ser. 05-A, | | |
| Class D, 4.304s, 2012 (Ireland) | 908,000 | 599,825 |
|
| Option One Mortgage Loan Trust FRB | | |
| Ser. 05-4, Class M11, 5.759s, 2035 | 298,000 | 8,195 |
|
| Origen Manufactured Housing Ser. 04-B, | | |
| Class A2, 3.79s, 2017 | 83,984 | 80,733 |
|
| Park Place Securities, Inc. | | |
| FRB Ser. 05-WCH1, Class M4, 4.089s, 2036 F | 300,000 | 15,116 |
| FRB Ser. 04-WHQ2, Class A3A, 3.609s, 2035 | 180,054 | 159,348 |
|
| Park Place Securities, Inc. 144A FRB | | |
| Ser. 04-MHQ1, Class M10, 5.759s, 2034 F | 198,731 | 4,877 |
|
| People’s Financial Realty Mortgage Securities | | |
| Trust FRB Ser. 06-1, Class 1A2, 3.389s, 2036 | 2,312,000 | 1,294,720 |
|
| Residential Asset Mortgage Products, Inc. | | |
| FRB Ser. 06-NC3, Class A2, 3.449s, 2036 | 2,138,937 | 1,756,517 |
| FRB Ser. 07-RZ1, Class A2, 3.419s, 2037 | 2,585,000 | 1,988,204 |
|
| Residential Asset Securities Corp. FRB | | |
| Ser. 05-EMX1, Class M2, 3.989s, 2035 F | 1,047,000 | 335,194 |
|
| Residential Asset Securities Corp. 144A | | |
| FRB Ser. 05-KS10, Class B, 6.009s, 2035 F | 896,611 | 92 |
| Ser. 04-NT, Class Note, 4 1/2s, 2034 (In default) † | 100,741 | 2,015 |
|
| SAIL Net Interest Margin Notes 144A Ser. 04-4A, | | |
| Class B, 7 1/2s, 2034 (Cayman Islands) (In default) † | 380,795 | — |
|
| Securitized Asset Backed Receivables, LLC | | |
| FRB Ser. 05-HE1, Class M2, 3.909s, 2035 F | 461,000 | 83,136 |
| FRB Ser. 07-NC2, Class A2B, 3.399s, 2037 | 2,319,000 | 1,275,450 |
|
| SG Mortgage Securities Trust | | |
| FRB Ser. 06-OPT2, Class A3D, PO, | | |
| 3.469s, 2036 | 2,860,000 | 1,086,800 |
| FRB Ser. 06-FRE1, Class A2B, 3.439s, 2036 | 1,177,000 | 753,280 |
|
| Soundview Home Equity Loan Trust | | |
| FRB Ser. 06-OPT3, Class 2A3, 3.429s, 2036 | 1,258,000 | 767,380 |
| FRB Ser. 06-3, Class A3, 3.419s, 2036 | 7,427,000 | 6,001,439 |
|
| Soundview Home Equity Loan Trust 144A | | |
| FRB Ser. 05-CTX1, Class B1, 5.759s, 2035 | 672,000 | 13,440 |
|
| South Coast Funding 144A FRB Ser. 3A, | | |
| Class A2, 4.003s, 2038 (Cayman Islands) | 760,000 | 3,800 |
|
| Structured Asset Investment Loan Trust FRB | | |
| Ser. 06-BNC2, Class A6, 3.519s, 2036 | 1,351,000 | 261,937 |
|
| Structured Asset Investment Loan Trust 144A | | |
| FRB Ser. 05-HE3, Class M11, 5.707s, 2035 | 92,748 | 103 |
|
| Structured Asset Receivables Trust 144A FRB | | |
| Ser. 05-1, 4.919s, 2015 F | 6,530,962 | 3,048,000 |
|
| Structured Asset Securities Corp. 144A | | |
| Ser. 98-RF3, Class A, IO, 6.1s, 2028 | 3,620,773 | 332,749 |
|
| TIAA Real Estate CDO, Ltd. Ser. 03-1A, | | |
| Class E, 8s, 2038 | 2,298,000 | 893,439 |
|
| Wells Fargo Home Equity Trust FRB Ser. 07-1, | | |
| Class A3, 3.579s, 2037 | 596,000 | 303,933 |
|
| Whinstone Capital Management, Ltd. 144A FRB | | |
| Ser. 1A, Class B3, 4.435s, 2044 (United Kingdom) | 758,810 | 601,467 |
|
| |
| Total asset-backed securities (cost $269,669,142) | $170,515,530 |
35
| | | |
| PURCHASED OPTIONS OUTSTANDING (3.9%)* | Expiration date/ | Contract | |
| | strike price | amount | Value |
|
| Option on an interest rate swap with Deutschbank for the right to receive a fixed rate of 5.385% | | | |
| versus the three month USD-LIBOR-BBA maturing April 16, 2019. | Apr-09/5.385 | $68,646,000 | $5,199,248 |
|
| Option on an interest rate swap with Deutschbank for the right to pay a fixed rate of 5.385% | | | |
| versus the three month USD-LIBOR-BBA maturing April 16, 2019. | Apr-09/5.385 | 68,646,000 | 801,099 |
|
| Option on an interest rate swap with Goldman Sachs International for the right to pay a fixed | | | |
| rate of 5.325% versus the three month USD-LIBOR-BBA maturing April 08, 2019. | Apr-09/5.325 | 84,687,000 | 1,022,172 |
|
| Option on an interest rate swap with Goldman Sachs International for the right to receive a fixed | | | |
| rate of 5.325% versus the three month USD-LIBOR-BBA maturing April 08, 2019. | Apr-09/5.325 | 84,687,000 | 6,093,230 |
|
| Option on an interest rate swap with Goldman Sachs International for the right to receive a fixed | | | |
| rate of 5.355% versus the three month USD-LIBOR-BBA maturing November 12, 2019. | Nov-09/5.355 | 92,480,000 | 6,590,125 |
|
| Option on an interest rate swap with Goldman Sachs International for the right to pay a fixed | | | |
| rate of 5.355% versus the three month USD-LIBOR-BBA maturing on November 12, 2019. | Nov-09/5.355 | 92,480,000 | 2,225,069 |
|
| Option on an interest rate swap with JPMorgan Chase Bank, N.A. for the right to receive a | | | |
| fixed rate of 4.83% versus the three month USD-LIBOR-BBA maturing on November 10, 2018. | Nov-08/4.83 | 134,641,000 | 4,086,354 |
|
| Option on an interest rate swap with JPMorgan Chase Bank, N.A. for the right to pay a fixed | | | |
| rate of 4.83% versus the three month USD-LIBOR-BBA maturing on November 10, 2018. | Nov-08/4.83 | 134,641,000 | 45,778 |
|
| Option on an interest rate swap with JPMorgan Chase Bank, N.A. for the right to receive a | | | |
| fixed rate of 5.315% versus the three month USD-LIBOR-BBA maturing on April 08, 2019. | Apr-09/5.315 | 84,687,000 | 6,040,724 |
|
| Option on an interest rate swap with JPMorgan Chase Bank, N.A. for the right to pay a fixed | | | |
| rate of 5.315% versus the three month USD-LIBOR-BBA maturing on April 08, 2019. | Apr-09/5.315 | 84,687,000 | 1,037,416 |
|
| Option on an interest rate swap with JPMorgan Chase Bank, N.A. for the right to pay a fixed | | | |
| rate of 5.355% versus the three month USD-LIBOR-BBA maturing November 12, 2019. | Nov-09/5.355 | 92,480,000 | 2,225,069 |
|
| Option on an interest rate swap with JPMorgan Chase Bank, N.A. for the right to receive a | | | |
| fixed rate of 5.355% versus the three month USD-LIBOR-BBA maturing on November 12, 2019. | Nov-09/5.355 | 92,480,000 | 6,590,125 |
|
| Option on an interest rate swap with JPMorgan Chase Bank, N.A. for the right to receive a | | | |
| fixed rate of 5.355% versus the three month USD-LIBOR-BBA maturing on November 12, 2019. | Nov-09/5.355 | 97,133,000 | 6,918,784 |
|
| Option on an interest rate swap with JPMorgan Chase Bank, N.A. for the right to pay a fixed | | | |
| rate of 5.355% versus the three month USD-LIBOR-BBA maturing November 12, 2019. | Nov-09/5.355 | 97,133,000 | 2,334,106 |
|
| Option on an interest rate swap with JPMorgan Chase Bank, N.A. for the right to receive a | | | |
| fixed rate of 5.03% versus the three month USD-LIBOR-BBA maturing on February 16, 2020. | Feb-10/5.03 | 102,080,000 | 5,709,334 |
|
| Option on an interest rate swap with JPMorgan Chase Bank, N.A. for the right to pay a fixed | | | |
| rate of 5.03% versus the three month USD-LIBOR-BBA maturing on February 16, 2020. | Feb-10/5.03 | 102,080,000 | 3,985,203 |
|
| Total purchased options outstandings (cost $48,465,350) | | | $60,903,836 |
| |
| |
| SENIOR LOANS (1.0%)* c | | Principal amount | Value |
|
| Basic materials (0.1%) | | | |
| Aleris International, Inc. bank term loan FRN Ser. B, 6.313s, 2013 | | $273,909 | $175,302 |
|
| Georgia-Pacific, LLC bank term loan FRN Ser. B, 4.689s, 2013 | | 395,050 | 326,575 |
|
| NewPage Holding Corp. bank term loan FRN 7s, 2014 | | 410,895 | 330,330 |
|
| | | | 832,207 |
| Capital goods (0.1%) | | | |
| Allied Waste Industries, Inc. bank term loan FRN 6.82s, 2012 | | 346,429 | 328,674 |
|
| Allied Waste Industries, Inc. bank term loan FRN 5.44s, 2012 | | 484,766 | 459,922 |
|
| Hawker Beechcraft Acquisition Co., LLC bank term loan FRN 3.562s, 2014 | | 22,175 | 14,113 |
|
| Hawker Beechcraft Acquisition Co., LLC bank term loan FRN Ser. B, 5.762s, 2014 | | 378,595 | 240,949 |
|
| Polypore, Inc. bank term loan FRN Ser. B, 6.03s, 2014 | | 410,879 | 316,377 |
|
| Sequa Corp. bank term loan FRN 6.933s, 2014 | | 566,917 | 416,684 |
|
| Wesco Aircraft Hardware Corp. bank term loan FRN 5.96s, 2013 | | 414,000 | 322,920 |
|
| | | | 2,099,639 |
| | | | |
| Communication services (0.1%) | | | |
| Cricket Communications, Inc. bank term loan FRN Ser. B, 7.262s, 2013 | | 410,848 | 346,579 |
|
| Crown Castle International Corp. bank term loan FRN 5.376s, 2014 | | 205,436 | 154,488 |
|
| Intelsat Corp. bank term loan FRN Ser. B2, 6.65s, 2011 | | 136,938 | 112,094 |
|
| Intelsat Corp. bank term loan FRN Ser. B2-A, 6.65s, 2013 | | 136,979 | 112,127 |
|
| Intelsat Corp. bank term loan FRN Ser. B2-C, 6.65s, 2013 | | 136,938 | 112,094 |
|
| Level 3 Communications, Inc. bank term loan FRN 7s, 2014 | | 414,000 | 305,843 |
|
| MetroPCS Wireless, Inc. bank term loan FRN 5.402s, 2013 | | 410,856 | 338,032 |
|
| PAETEC Holding Corp. bank term loan FRN Ser. B1, 6.204s, 2013 | | 402,679 | 257,714 |
|
| Time Warner Telecom, Inc. bank term loan FRN Ser. B, 5.71s, 2013 | | 410,864 | 332,800 |
|
| West Corp. bank term loan FRN 5.512s, 2013 | | 411,909 | 261,562 |
|
| | | | 2,333,333 |
36
| | |
| SENIOR LOANS (1.0%)* c cont. | Principal amount | Value |
|
| Consumer cyclicals (0.2%) | | |
| Allison Transmission bank term loan FRN Ser. B, 5.669s, 2014 | $404,193 | $273,552 |
|
| Aramark Corp. bank term loan FRN 3.762s, 2014 | 24,730 | 20,594 |
|
| Aramark Corp. bank term loan FRN Ser. B, 5.637s, 2014 | 389,270 | 324,164 |
|
| Dana Corp. bank term loan FRN 7.279s, 2015 | 410,895 | 273,930 |
|
| Goodman Global Holdings, Inc. bank term loan FRN Ser. B, 7.708s, 2011 | 324,240 | 260,203 |
|
| Goodyear Tire & Rubber Co. (The) bank term loan FRN 4.78s, 2010 | 414,000 | 289,800 |
|
| Harrah’s Operating Co., Inc. bank term loan FRN Ser. B2, 6.536s, 2015 | 411,930 | 280,970 |
|
| Lear Corp bank term loan FRN 5.748s, 2013 | 412,747 | 263,745 |
|
| National Bedding Co. bank term loan FRN 5.353s, 2011 | 187,568 | 121,919 |
|
| Navistar Financial Corp. bank term loan FRN 5.695s, 2012 | 110,400 | 75,624 |
|
| Navistar International Corp. bank term loan FRN 6.191s, 2012 | 303,600 | 207,966 |
|
| Yankee Candle Co., Inc. bank term loan FRN 5.762s, 2014 | 245,000 | 162,925 |
|
| | | 2,555,392 |
| | | |
| Consumer staples (0.3%) | | |
| Affinion Group, Inc. bank term loan FRN Ser. B, 5.345s, 2013 | 414,000 | 322,920 |
|
| Cablevision Systems Corp. bank term loan FRN 4.569s, 2013 | 410,840 | 353,615 |
|
| Charter Communications, Inc. bank term loan FRN 4.8s, 2014 | 410,895 | 306,374 |
|
| Cinemark USA, Inc. bank term loan FRN 4.641s, 2013 | 412,464 | 311,926 |
|
| DirecTV Holdings, LLC bank term loan FRN 5.601s, 2013 | 992,513 | 899,464 |
|
| Idearc, Inc. bank term loan FRN Ser. B, 5.767s, 2014 | 410,864 | 173,248 |
|
| Pinnacle Foods Holding Corp. bank term loan FRN Ser. B, 6.763s, 2014 | 410,879 | 293,368 |
|
| Spectrum Brands, Inc. bank term loan FRN 3.57s, 2013 | 26,417 | 17,798 |
|
| Spectrum Brands, Inc. bank term loan FRN Ser. B1, 7.274s, 2013 | 384,590 | 259,117 |
|
| Ticketmaster bank term loan FRN Ser. B, 6.64s, 2014 | 1,335,000 | 1,094,700 |
|
| Univision Communications, Inc. bank term loan FRN Ser. B, 5.061s, 2014 | 414,000 | 221,904 |
|
| VNU Group BV bank term loan FRN Ser. B, 4.803s, 2013 (Netherlands) | 410,858 | 296,023 |
|
| | | 4,550,457 |
| | | |
| Financials (—%) | | |
| Lender Processing Services, Inc. bank term loan FRN Ser. B, 6.204s, 2014 | 623,438 | 567,328 |
|
| | | 567,328 |
| | | |
| Health care (0.1%) | | |
| Health Management Associates, Inc. bank term loan FRN 5.512s, 2014 | 392,366 | 273,185 |
|
| IASIS Healthcare, LLC/IASIS Capital Corp. bank term loan FRN 7.62s, 2014 | 26,466 | 21,041 |
|
| IASIS Healthcare, LLC/IASIS Capital Corp. bank term loan FRN Ser. B, 5.704s, 2014 | 286,108 | 227,456 |
|
| IASIS Healthcare, LLC/IASIS Capital Corp. bank term loan FRN Ser. DD, 5.704s, 2014 | 99,000 | 78,705 |
|
| Sun Healthcare Group, Inc. bank term loan FRN 2.701s, 2014 | 69,023 | 48,316 |
|
| Sun Healthcare Group, Inc. bank term loan FRN Ser. B, 5.235s, 2014 | 431,487 | 302,041 |
|
| Sun Healthcare Group, Inc. bank term loan FRN Ser. DD, 5.422s, 2014 | 41,785 | 29,249 |
|
| | | 979,993 |
| | | |
| Technology (0.1%) | | |
| First Data Corp. bank term loan FRN Ser. B1, 6.053s, 2014 | 409,895 | 299,377 |
|
| Freescale Semiconductor, Inc. bank term loan FRN Ser. B, 5.47s, 2013 | 270,932 | 181,976 |
|
| SunGard Data Systems, Inc. bank term loan FRN 4.553s, 2014 | 410,864 | 313,284 |
|
| Travelport bank term loan FRN Ser. B, 6.012s, 2013 | 165,388 | 99,705 |
|
| Travelport bank term loan FRN Ser. DD, 5.954s, 2013 | 246,738 | 144,342 |
|
| | | 1,038,684 |
| | | |
| Utilities and power (—%) | | |
| Energy Future Holdings Corp. bank term loan FRN Ser. B2, 6.659s, 2014 | 410,887 | 320,321 |
|
| NRG Energy, Inc. bank term loan FRN 5.412s, 2014 | 130,767 | 113,041 |
|
| NRG Energy, Inc. bank term loan FRN 5.262s, 2014 | 266,172 | 230,091 |
|
| | | 663,453 |
| | |
| Total senior loans (cost $18,997,605) | | $15,620,486 |
37
| | | |
| MUNICIPAL BONDS AND NOTES (0.3%)* | Rating** | Principal amount | Value |
| Chicago, Transit Auth. Transfer Tax Receipts Rev. Bonds, Ser. B, 6.899s, 12/1/40 | Aa3 | $2,830,000 | $2,559,772 |
|
| MI Tobacco Settlement Fin. Auth. Rev. Bonds, Ser. A, 7.309s, 6/1/34 | Baa3 | 1,330,000 | 1,062,244 |
|
| Tobacco Settlement Fin. Auth. of WVA Rev. Bonds, Ser. A, 7.467s, 6/1/47 | Baa3 | 2,045,000 | 1,331,315 |
|
| Total municipal bonds and notes (cost $6,204,678) | | | $4,953,331 |
| |
| |
| SHORT-TERM INVESTMENTS (16.8%)* | | Principal amount/shares | Value |
|
| Short-term investments held as collateral for loaned securities with yields ranging from 0.13% to 2.68% | | | |
| and due dates ranging from November 3, 2008 to November 10, 2008 d | | $5,447,314 | $5,446,040 |
|
| Interest in $357,300,000 joint tri-party repurchase agreement dated October 31, 2008 with | | | |
| Deutsche Bank Sec, Inc., due November 3, 2008 — maturity value of $52,701,098 for an effective yield | | | |
| of 0.25% (collateralized by various mortgage backed securities with coupon rates ranging from 4.00% | | | |
| to 7.00% and due dates ranging from October 18, 2018 to August 1, 2047 valued at $364,446,000) | | 52,700,000 | 52,700,000 |
|
| U.S. Treasury Bills for an effective yield of 0.23%, December 4, 2008 # | | 6,030,000 | 6,028,731 |
|
| U.S. Treasury Bills for a range of effective yields of 0.20% to 0.22%, November 13, 2008 # | | 20,795,000 | 20,793,481 |
|
| Federal Home Loan Banks, for an effective yield of 2.73%, July 14, 2009 | | 27,500,000 | 26,968,233 |
|
| Federated Prime Obligations Fund | | 151,911,736 | 151,911,736 |
|
| Total short-term investments (cost $263,848,221) | | | $263,848,221 |
|
| |
| TOTAL INVESTMENTS | | | |
|
| Total investments (cost $4,205,424,735) | | | $3,969,389,180 |
* Percentages indicated are based on net assets of $1,570,261,236.
** The Moody’s, Standard & Poor’s or Fitch ratings indicated are believed to be the most recent ratings available at October 31, 2008 for the securities listed. Ratings are generally ascribed to securities at the time of issuance. While the agencies may from time to time revise such ratings, they undertake no obligation to do so, and the ratings do not necessarily represent what the agencies would ascribe to these securities at October 31, 2008. Securities rated by Putnam are indicated by “/P.” Securities rated by Fitch are indicated by “/F.” The rating of an insured security represents what is believed to be the most recent rating of the insurer’s claims-paying ability available at October 31, 2008 and does not reflect any subsequent changes. Ratings are not covered by the Report of Independent Registered Public Accounting Firm. Security ratings are defined in the Statement of Additional Information.
† Non-income-producing security.
# These securities were pledged and segregated with the custodian to cover margin requirements for futures contracts at October 31, 2008.
c Senior loans are exempt from registration under the Securities Act of 1933, as amended, but contain certain restrictions on resale and cannot be sold publicly. These loans pay interest at rates which adjust periodically. The interest rates shown for senior loans are the current interest rates at October 31, 2008. Senior loans are also subject to mandatory and/or optional prepayment which cannot be predicted. As a result, the remaining maturity may be substantially less than the stated maturity shown (Notes 1 and 6).
d See Note 1 to the financial statements.
F Is valued at fair value following procedures approved by the Trustees. (Note 1).
R Real Estate Investment Trust.
S Securities on loan, in part or in entirety, at October 31, 2008.
At October 31, 2008, liquid assets totaling $1,160,299,034 have been designated as collateral for open forward commitments and swap contracts.
Debt obligations are considered secured unless otherwise indicated.
144A after the name of an issuer represents securities exempt from registration under Rule 144A under the Securities Act of 1933, as amended. These securities may be resold in transactions exempt from registration, normally to qualified institutional buyers.
TBA after the name of a security represents to be announced securities (Note 1).
The rates shown on Floating Rate Bonds (FRB) and Floating Rate Notes (FRN) are the current interest rates at October 31, 2008.
The dates shown on debt obligations are the original maturity dates.
Inverse Floating Rate Bonds (IFB) are securities that pay interest rates that vary inversely to changes in the market interest rates. As interest rates rise, inverse floaters produce less current income. The interest rates shown are the current interest rates at October 31, 2008.
38
| | | | | |
| FUTURES CONTRACTS OUTSTANDING at 10/31/08 | Number of | | | Expiration | Unrealized appreciation/ |
| | contracts | Value | | date | (depreciation) |
|
| Euro-Dollar 90 day (Long) | 160 | $39,102,000 | | Dec-08 | $375,400 |
|
| Euro-Dollar 90 day (Short) | 648 | 158,079,600 | | Jun-09 | (519,175) |
|
| Euro-Dollar 90 day (Short) | 1,542 | 375,419,175 | | Sep-09 | (1,385,059) |
|
| Euro-Dollar 90 day (Short) | 1,813 | 440,377,700 | | Dec-09 | (1,630,931) |
|
| Euro-Dollar 90 day (Short) | 105 | 25,478,250 | | Mar-10 | (194,048) |
|
| U.S. Treasury Bond 20 yr (Short) | 179 | 20,249,375 | | Dec-08 | 155,727 |
|
| U.S. Treasury Note 2 yr (Short) | 3,167 | 680,360,672 | | Dec-08 | (8,099,039) |
|
| U.S. Treasury Note 5 yr (Long) | 226 | 25,596,266 | | Dec-08 | 128,449 |
|
| Total | | | | | $(11,168,676) |
| |
| | | | | |
| WRITTEN OPTIONS OUTSTANDING at 10/31/08 (premiums received $46,373,762) | | Contract | | Expiration date/ | |
| | | amount | | strike price | Value |
|
| Option on an interest rate swap with JPMorgan Chase Bank, N.A. for the obligation to pay a | | | | | |
| fixed rate of 5.00% versus the three month USD-LIBOR-BBA maturing on December 19, 2018. | | $122,424,000 | | Dec-08/5.00 | $5,922,873 |
|
| Option on an interest rate swap with JPMorgan Chase Bank, N.A. for the obligation to receive a | | | | | |
| fixed rate of 5.00% versus the three month USD-LIBOR-BBA maturing on December 19, 2018. | | 122,424,000 | | Dec-08/5.00 | 796,980 |
|
| Option on an interest rate swap with JPMorgan Chase Bank, N.A. for the obligation to pay a | | | | | |
| fixed rate of 5.215% versus the three month USD-LIBOR-BBA maturing on February 18, 2020. | | 166,462,000 | | Feb-10/5.215 | 10,683,531 |
|
| Option on an interest rate swap with JPMorgan Chase Bank, N.A. for the obligation to receive a | | | | | |
| fixed rate of 5.215% versus the three month USD-LIBOR-BBA maturing on February 18, 2020. | | 166,462,000 | | Feb-10/5.215 | 5,528,203 |
|
| Option on an interest rate swap with JPMorgan Chase Bank, N.A. for the obligation to pay a | | | | | |
| fixed rate of 5.22% versus the three month USD-LIBOR-BBA maturing on February 24, 2020. | | 111,102,000 | | Feb-10/5.22 | 7,151,636 |
|
| Option on an interest rate swap with JPMorgan Chase Bank, N.A. for the obligation to pay a | | | | | |
| fixed rate of 5.08% versus the three month USD-LIBOR-BBA maturing on February 24, 2020. | | 111,102,000 | | Feb-10/5.08 | 6,456,137 |
|
| Option on an interest rate swap with JPMorgan Chase Bank, N.A. for the obligation to receive a | | | | | |
| fixed rate of 5.08% versus the three month USD-LIBOR-BBA maturing on February 24, 2020. | | 111,102,000 | | Feb-10/5.08 | 4,205,211 |
|
| Option on an interest rate swap with JPMorgan Chase Bank, N.A. for the obligation to receive a | | | | | |
| fixed rate of 5.22% versus the three month USD-LIBOR-BBA maturing on February 24, 2020. | | 111,102,000 | | Feb-10/5.22 | 3,709,696 |
|
| Option on an interest rate swap with JPMorgan Chase Bank, N.A. for the obligation to pay a | | | | | |
| fixed rate of 5.51% versus the three month USD-LIBOR-BBA maturing on May 14, 2022. | | 17,335,500 | | May-12/5.51 | 1,341,767 |
|
| Option on an interest rate swap with JPMorgan Chase Bank, N.A. for the obligation to receive a | | | | | |
| fixed rate of 5.51% versus the three month USD-LIBOR-BBA maturing on May 14, 2022. | | 17,335,500 | | May-12/5.51 | 796,740 |
|
| Total | | | | | $46,592,774 |
|
| |
| TBA SALE COMMITMENTS OUTSTANDING at 10/31/08 (proceeds receivable $1,010,304,219) | | Principal | | Settlement | |
| Agency | | amount | | date | Value |
|
| FNMA, 5s, November 1, 2038 | | $200,000,000 | | 11/13/08 | $189,531,240 |
|
| FNMA, 5 1/2s, November 1, 2038 | | 789,000,000 | | 11/13/08 | 770,631,133 |
|
| FNMA, 6s, November 1, 2038 | | 41,000,000 | | 11/13/08 | 40,967,971 |
|
| Total | | | | | $1,001,130,344 |
|
| | | | | | | | |
| INTEREST RATE SWAP CONTRACTS OUTSTANDING at 10/31/08 | | |
| |
| | | | Upfront | | | | | |
| | | | premium | | | | | |
| Swap | Notional | | received | | Termination | Payments made by | Payments received by | Unrealized appreciation/ |
| counterparty | amount | | (paid) | | date | fund per annum | fund per annum | (depreciation) |
| Bank of America, N.A. | | | | | | | |
|
| | $94,053,000 | | $— | | 5/23/10 | 3 month USD-LIBOR-BBA | 3.155% | $1,643,675 |
|
| | 102,500,000 | | — | | 7/18/13 | 4.14688% | 3 month USD-LIBOR-BBA | (2,406,070) |
|
| | 39,390,000 | | — | | 8/26/18 | 3 month USD-LIBOR-BBA | 4.54375% | 420,413 |
|
| | 709,017,000 | | — | | 9/10/10 | 3 month USD-LIBOR-BBA | 3.22969% | 7,463,515 |
|
| | 69,168,000 | | — | | 9/15/10 | 3.08% | 3 month USD-LIBOR-BBA | (523,292) |
|
| | 52,510,000 | | — | | 9/18/10 | 3 month USD-LIBOR-BBA | 2.86667% | 169,012 |
|
| | 15,243,000 | | (47,580) | | 10/1/18 | 4.30% | 3 month USD-LIBOR-BBA | 151,949 |
|
| | 288,144,000 | | 1,623,874 | | 10/14/18 | 3 month USD-LIBOR-BBA | 4.30% | (3,042,458) |
|
| | 170,300,000 | | 425,239 | | 10/14/38 | 4.25% | 3 month USD-LIBOR-BBA | 7,197,739 |
|
| | 123,737,000 | | 46,704 | | 10/20/18 | 3 month USD-LIBOR-BBA | 4.60% | 1,121,326 |
|
| | 231,234,000 | | (210,203) | | 10/20/10 | 3.00% | 3 month USD-LIBOR-BBA | (210,306) |
|
| | 40,036,000 | | — | | 5/8/28 | 4.95% | 3 month USD-LIBOR-BBA | (3,163,264) |
|
39
| | | | | | | | |
| INTEREST RATE SWAP CONTRACTS OUTSTANDING at 10/31/08 cont. | | |
|
| | | | Upfront | | | | | |
| | | | premium | | | | | |
| Swap | Notional | | received | | Termination | Payments made by | Payments received by | Unrealized appreciation/ |
| counterparty | amount | | (paid) | | date | fund per annum | fund per annum | (depreciation) |
|
| Bear Stearns Bank plc | | | | | | | |
| | $84,500,000 | | $— | | 4/24/12 | 5.027% | 3 month USD-LIBOR-BBA | $(4,513,190) |
|
| Citibank, N.A. | | | | | | | | |
| | 153,000,000 | | — | | 7/21/18 | 4.80625% | 3 month USD-LIBOR-BBA | (5,818,670) |
|
| | 90,900,000 | | — | | 8/26/10 | 3 month USD-LIBOR-BBA | 3.34125% | 1,164,603 |
|
| | 40,597,000 | | — | | 9/8/18 | 3 month USD-LIBOR-BBA | 4.3152% | (350,740) |
|
| | 161,656,000 | | — | | 9/10/10 | 3 month USD-LIBOR-BBA | 3.1825% | 1,553,468 |
|
| | 75,397,000 | | — | | 9/16/10 | 3.175% | 3 month USD-LIBOR-BBA | (709,261) |
|
| | 3,390,000 | | — | | 9/16/18 | 3 month USD-LIBOR-BBA | 4.355% | (19,384) |
|
| | 315,481,000 | | — | | 9/17/13 | 3 month USD-LIBOR-BBA | 3.4975% | (4,289,150) |
|
| | 219,376,000 | | — | | 9/18/38 | 4.45155% | 3 month USD-LIBOR-BBA | 205,838 |
|
| | 25,555,000 | | — | | 9/18/10 | 3 month USD-LIBOR-BBA | 2.92486% | 111,117 |
|
| | 31,016,000 | | — | | 10/26/12 | 4.6275% | 3 month USD-LIBOR-BBA | (1,217,477) |
|
| | 70,857,000 | | — | | 11/9/17 | 5.0825% | 3 month USD-LIBOR-BBA | (4,887,686) |
|
| | 63,720,000 | | — | | 11/23/17 | 4.885% | 3 month USD-LIBOR-BBA | (3,344,588) |
|
| | 27,252,000 | | — | | 12/24/27 | 4.9425% | 3 month USD-LIBOR-BBA | (1,975,795) |
|
| Credit Suisse International | | | | | | | |
| | 11,108,300 | | — | | 9/16/10 | 3.143% | 3 month USD-LIBOR-BBA | (97,609) |
|
| | 151,366,000 | | — | | 9/18/38 | 4.41338% | 3 month USD-LIBOR-BBA | 1,097,991 |
|
| | 10,502,000 | | — | | 9/18/10 | 3 month USD-LIBOR-BBA | 2.91916% | 44,543 |
|
| | 70,425,000 | | — | | 9/23/10 | 3 month USD-LIBOR-BBA | 3.32% | 780,798 |
|
| | 159,291,000 | | — | | 10/9/10 | 3 month USD-LIBOR-BBA | 2.81% | (202,742) |
|
| | 176,420,000 | | (123,768) | | 10/31/13 | 3 month USD-LIBOR-BBA | 3.80% | (712,913) |
|
| | 125,559,000 | | 119,363 | | 10/31/18 | 4.35% | 3 month USD-LIBOR-BBA | 1,281,307 |
|
| | 93,900,000 | | — | | 9/23/38 | 4.7375% | 3 month USD-LIBOR-BBA | (4,256,787) |
|
| Deutsche Bank AG | | | | | | | |
| | 61,565,504 | | — | | 8/2/32 | 5.86% | 3 month USD-LIBOR-BBA | (12,955,911) |
|
| | 54,861,045 | | — | | 8/2/22 | 3 month USD-LIBOR-BBA | 5.7756% | 7,503,735 |
|
| | 116,000,000 | | — | | 7/10/13 | 3 month USD-LIBOR-BBA | 4.149% | 2,769,875 |
|
| | 125,600,000 | | — | | 9/24/10 | 3 month USD-LIBOR-BBA | 3.395% | 1,575,547 |
|
| | 39,965,000 | | — | | 10/17/18 | 4.585% | 3 month USD-LIBOR-BBA | (294,831) |
|
| | 18,710,000 | | — | | 11/7/17 | 3 month USD-LIBOR-BBA | 5.056% | 1,250,089 |
|
| Goldman Sachs Capital Markets, L.P. | | | | | | | |
| | 61,565,504 | | — | | 8/12/32 | 5.689% | 3 month USD-LIBOR-BBA | (11,385,663) |
|
| Goldman Sachs International | | | | | | | |
| | 32,826,000 | | — | | 3/11/38 | 5.029% | 3 month USD-LIBOR-BBA | (3,107,059) |
|
| | 51,275,000 | | — | | 4/2/18 | 4.076% | 3 month USD-LIBOR-BBA | 1,469,215 |
|
| | 87,394,000 | | — | | 4/8/10 | 3 month USD-LIBOR-BBA | 2.64% | (232,883) |
|
| | 59,900,000 | | — | | 4/23/18 | 4.43% | 3 month USD-LIBOR-BBA | 104,802 |
|
| | 72,730,000 | | — | | 5/19/18 | 4.525% | 3 month USD-LIBOR-BBA | (1,586,166) |
|
| | 68,001,000 | | (74,354) | | 10/24/13 | 3.50% | 3 month USD-LIBOR-BBA | 1,090,937 |
|
| | 222,080,000 | | — | | 11/20/08 | 5.16% | 3 month USD-LIBOR-BBA | (4,112,613) |
|
| | 217,245,000 | | — | | 11/21/08 | 5.0925% | 3 month USD-LIBOR-BBA | (3,947,523) |
|
| | 280,517,000 | | 132,189 | | 10/24/10 | 3 month USD-LIBOR-BBA | 2.60% | (1,165,023) |
|
| | 140,248,000 | | — | | 10/30/18 | 3 month USD-LIBOR-BBA | 4.32125% | (1,652,467) |
|
| | 113,084,000 | | — | | 10/30/18 | 3 month USD-LIBOR-BBA | 4.33% | (1,252,091) |
|
| | 5,322,000 | | — | | 5/3/16 | 5.565% | 3 month USD-LIBOR-BBA | (549,771) |
|
| | 272,933,000 | | — | | 1/16/18 | 5.790% | 3 month USD-LIBOR-BBA | (31,877,892) |
|
| JPMorgan Chase Bank, N.A. | | | | | | | |
| | 41,147,000 | | — | | 8/15/11 | 5.412% | 3 month USD-LIBOR-BBA | (2,770,805) |
|
| | 29,451,000 | | — | | 3/5/18 | 4.325% | 3 month USD-LIBOR-BBA | 147,972 |
|
| | 75,794,000 | | — | | 3/7/18 | 4.45% | 3 month USD-LIBOR-BBA | (353,116) |
|
| | 20,516,000 | | — | | 3/11/38 | 5.0025% | 3 month USD-LIBOR-BBA | (1,852,504) |
|
40
| | | | | | | | |
| INTEREST RATE SWAP CONTRACTS OUTSTANDING at 10/31/08 cont. | | |
| |
| | | | Upfront | | | | | |
| | | | premium | | | | | |
| Swap | Notional | | received | | Termination | Payments made by | Payments received by | Unrealized appreciation/ |
| counterparty | amount | | (paid) | | date | fund per annum | fund per annum | (depreciation) |
|
| JPMorgan Chase Bank, N.A. cont. | | | | | | | |
| | $73,518,000 | | $— | | 3/11/38 | 5.03% | 3 month USD-LIBOR-BBA | $(6,970,518) |
|
| | 287,973,000 | | — | | 3/15/10 | 3 month USD-LIBOR-BBA | 2.5% | (249,267) |
|
| | 166,411,000 | | — | | 3/20/13 | 3 month USD-LIBOR-BBA | 3.145% | (3,619,878) |
|
| | 121,767,000 | | — | | 3/20/13 | 3 month USD-LIBOR-BBA | 3.13% | (2,725,010) |
|
| | 230,974,000 | | — | | 3/26/10 | 3 month USD-LIBOR-BBA | 2.33375% | (1,172,730) |
|
| | 200,941,000 | | — | | 4/8/13 | 3 month USD-LIBOR-BBA | 3.58406% | (1,352,368) |
|
| | 28,581,000 | | — | | 5/7/13 | 3.9325% | 3 month USD-LIBOR-BBA | (615,169) |
|
| | 156,754,000 | | — | | 5/23/10 | 3 month USD-LIBOR-BBA | 3.16% | 2,753,853 |
|
| | 93,000,000 | | — | | 6/13/13 | 4.47% | 3 month USD-LIBOR-BBA | (4,140,822) |
|
| | 43,000,000 | | — | | 6/27/18 | 3 month USD-LIBOR-BBA | 4.8305% | 1,837,979 |
|
| | 113,000,000 | | — | | 7/10/13 | 3 month USD-LIBOR-BBA | 4.176% | 2,838,728 |
|
| | 87,996,000 | | — | | 7/22/10 | 3 month USD-LIBOR-BBA | 3.565% | 1,948,788 |
|
| | 307,649,000 | | — | | 7/28/10 | 3 month USD-LIBOR-BBA | 3.5141% | 6,887,460 |
|
| | 67,841,000 | | — | | 8/28/18 | 5.395% | 3 month USD-LIBOR-BBA | (5,474,006) |
|
| | 141,923,000 | | — | | 9/15/10 | 3.11% | 3 month USD-LIBOR-BBA | (1,157,219) |
|
| | 49,901,000 | | — | | 11/20/26 | 3 month USD-LIBOR-BBA | 5.266% | 5,712,800 |
|
| | 25,648,000 | | — | | 9/15/18 | 4.2145% | 3 month USD-LIBOR-BBA | 441,526 |
|
| | 49,331,000 | | — | | 1/19/09 | 5.24% | 3 month USD-LIBOR-BBA | (706,653) |
|
| | 173,000,000 | | — | | 1/31/17 | 3 month USD-LIBOR-BBA | 5.415% | 15,081,138 |
|
| | 110,693,000 | | — | | 3/8/17 | 3 month USD-LIBOR-BBA | 5.28% | 7,671,117 |
|
| | 25,612,000 | | — | | 10/22/10 | 3 month USD-LIBOR-BBA | 2.78% | (38,224) |
|
| | 17,075,000 | | — | | 10/22/18 | 3 month USD-LIBOR-BBA | 4.2825% | (276,902) |
|
| | 77,137,000 | | — | | 10/23/13 | 3 month USD-LIBOR-BBA | 3.535% | (1,244,442) |
|
| | 24,835,000 | | (73,054) | | 11/4/18 | 3 month USD-LIBOR-BBA | 4.45% | — |
|
| | 14,414,000 | | (68,447) | | 11/4/13 | 3 month USD-LIBOR-BBA | 3.85% | — |
|
| | 141,023,100 | | — | | 9/21/09 | 3 month USD-LIBOR-BBA | 4.6125% | 2,829,932 |
|
| | 39,245,600 | | — | | 9/21/17 | 5.15% | 3 month USD-LIBOR-BBA | (2,271,906) |
|
| | 20,012,000 | | — | | 10/30/12 | 4.68375% | 3 month USD-LIBOR-BBA | (830,650) |
|
| | 11,400,000 | | — | | 11/7/17 | 3 month USD-LIBOR-BBA | 5.05771% | 763,255 |
|
| | 68,952,000 | | — | | 11/9/09 | 4.3975% | 3 month USD-LIBOR-BBA | (2,340,700) |
|
| | 27,252,000 | | — | | 12/24/27 | 4.9675% | 3 month USD-LIBOR-BBA | (2,065,677) |
|
| | 104,300,000 | | — | | 8/4/16 | 3 month USD-LIBOR-BBA | 5.5195% | 9,111,460 |
|
| | 5,877,000 | | — | | 1/18/18 | 4.27625% | 3 month USD-LIBOR-BBA | 17,608 |
|
| | 206,768,000 | | — | | 1/31/18 | 3 month USD-LIBOR-BBA | 4.25% | (624,841) |
|
| Merrill Lynch Capital Services, Inc. | | | | | | | |
| | 2,783,000 | | — | | 9/16/38 | 3 month USD-LIBOR-BBA | 4.66% | 94,269 |
|
| | 31,016,000 | | — | | 10/26/12 | 4.6165% | 3 month USD-LIBOR-BBA | (1,204,723) |
|
| | 219,655,000 | | — | | 5/19/10 | 3.2925% | 3 month USD-LIBOR-BBA | (4,378,319) |
|
| | 109,878,000 | | — | | 7/22/10 | 3 month USD-LIBOR-BBA | 3.5375% | 2,340,996 |
|
| Total | | | | | | | | $(63,647,349) |
The accompanying notes are an integral part of these financial statements.
41
| | | | | | | |
| TOTAL RETURN SWAP CONTRACTS OUTSTANDING at 10/31/08 | | |
| | | | | Termi- | | | |
| Swap | Notional | | | nation | Fixed payments received (paid) | Total return received by | Unrealized |
| counterparty | amount | | | date | by fund per annum | or paid by fund | depreciation |
|
| Goldman Sachs International | $4,951,000 | | | 9/15/11 | 678 bp (1 month USD-LIBOR-BBA) | Ford Credit Auto Owner Trust | $(490,866) |
| | | | | | | Series 2005-B Class D | |
|
| | 21,510,000 | F | | 11/28/08 | Banc of America Securities AAA 10 year | The spread return of Banc of | (2,092,364) |
| | | | | | Index multiplied by the modified duration | America Securities CMBS AAA | |
| | | | | | factor plus 20 bp | 10 year Index | |
|
| JPMorgan Chase Bank, N.A. | 34,999,953 | F | | 11/13/08 | (4.96%) 5.50% | FNMA 5.50% 30 YR TBA | (742,120) |
|
| |
| Total | | | | | | | $(3,325,350) |
F Is valued at fair value following procedures approved by the Trustees.
| | | | | | | |
| CREDIT DEFAULT CONTRACTS OUTSTANDING at 10/31/08 cont. | | | | Fixed payments | Unrealized |
| | | Upfront premium | Notional | | Termination | received (paid) by | appreciation/ |
| Swap counterparty/Referenced debt* | | received (paid)** | amount | | date | fund per annum | (depreciation) |
|
| Deutsche Bank AG | | | | | | | |
| DJ ABX CMBX AAA Index | | $52,995 | $879,000 | | 2/17/51 | 35 bp | $(54,985) |
|
| DJ ABX NA HE A Index | | 3,943,940 | 4,334,000 | | 1/25/38 | 369 bp | (14,817) |
|
| DJ ABX HE AAA Series 6 Version 1 Index | | 388,920 | 3,687,265 | | 7/25/45 | 18 bp | (25,805) |
|
| France Telecom, 7.25%, 1/28/13 | | — | 2,375,000 | | 6/20/16 | 70 bp | (66,102) |
|
| General Electric Capital Corp., 6%, 6/15/12 | | — | 3,150,000 | | 9/20/13 | 109 bp | (486,234) |
|
| iStar Financial, Inc., 6%, 12/15/10 | | 11,475 | 170,000 | | 3/20/09 | 500 bp | (9,732) |
|
| MetLife Inc., 5%, 6/15/15 | | — | 970,000 | | 12/20/13 | (405 bp) | 25,026 |
|
| Prudential Financial Inc., 4 1/2%, 7/15/13 | | — | 1,380,000 | | 12/20/13 | (388 bp) | 142,445 |
|
| Goldman Sachs International | | | | | | | |
| Any one of the underlying securities in the basket | | | | | | | |
| of BB CMBS securities | | — | 11,022,000 | a | | 2.461% | (2,571,475) |
|
| DJ ABX HE A Series 7 Version 2 Index | | 1,452,112 | 2,167,000 | | 1/25/38 | 369 bp | (535,000) |
|
| DJ ABX HE AAA Index | | 509,291 | 2,167,000 | | 1/25/38 | 76 bp | (752,758) |
|
| DJ CDX NA CMBX AAA Index | | 84,124 | 2,300,000 | | 3/15/49 | 7 bp | (135,334) |
|
| DJ CDX NA HY Series 9 Index 25-35% tranche | | — | 4,593,000 | | 12/20/10 | 108.65 bp | (359,048) |
|
| DJ CDX NA HY Series 9 Index 25-35% tranche | | — | 27,760,000 | | 12/20/10 | 249 bp | (1,329,241) |
|
| DJ CDX NA HY Series 9 Index 25-35% tranche | | — | 9,460,000 | | 12/20/10 | 305 bp | (338,584) |
|
| DJ CDX NA IG Series 10 Index | | 142,643 | 7,431,264 | | 6/20/18 | (150 bp) | 328,895 |
|
| DJ CDX NA IG Series 10 Index | | 2,179,161 | 94,804,736 | | 6/20/18 | (150 bp) | 4,555,284 |
|
| DJ CDX NA IG Series 11 Index | | (3,911,539) | 158,520,000 | | 12/20/18 | (140 bp) | 720,736 |
|
| DJ CDX NA IG Series 11 Index | | 2,900,016 | 137,688,000 | | 12/20/13 | 150 bp | (222,623) |
|
| DJ CDX NA IG Series 11 Index | | (689,788) | 27,230,000 | | 12/20/18 | (140 bp) | 97,764 |
|
| DJ CDX NA IG Series 8 Index | | 680,712 | 48,609,680 | | 6/20/18 | (150 bp) | 1,899,033 |
|
| JPMorgan Chase Bank, N.A. | | | | | | | |
| DJ ABX HE AAA Series 6 Version 2 Index | | 742,995 | 3,794,287 | | 5/25/46 | 11 bp | 60,082 |
|
| DJ CDX NA HY Series 9 Index 25-35% tranche | | — | 4,709,000 | | 12/20/10 | 105.5 bp | (371,341) |
|
| DJ CMB NA CMBX AAA Index | | (227,406) | 2,920,000 | F | 2/17/51 | (35 bp) | 148,398 |
|
| Domtar Corp., 7 1/8%, 8/15/15 | | — | 410,000 | | 12/20/11 | (500 bp) | (9,831) |
|
| GMAC, LLC, 6 7/8%, 8/28/12 | | 88,838 | 1,545,000 | | 3/20/09 | 500 bp | 40,563 |
|
| iStar Financial, Inc., 6%, 12/15/10 | | 11,550 | 165,000 | | 3/20/09 | 500 bp | (9,033) |
|
| Lexmark International, Inc., 5.9%, 6/1/13 | | — | 1,415,000 | | 6/20/13 | (113 bp) | 121,880 |
|
| Nextel Communications, 7 3/8%, 8/1/15 | | — | 830,000 | | 9/20/13 | (540 bp) | 108,722 |
|
| Merrill Lynch International | | | | | | | |
| KinderMorgan, 6 1/2%, 9/1/12 | | — | 558,000 | | 9/20/12 | (128 bp) | 24,590 |
|
| Morgan Stanley Capital Services, Inc. | | | | | | | |
| DJ ABX CMBX AAA Index | | 1,897,762 | 26,662,000 | | 3/15/49 | 7 bp | (553,435) |
|
| DJ CDX NA IG Series 10 Index | | 200,175 | 10,274,840 | | 6/20/18 | (150 bp) | 457,697 |
|
| DJ CDX NA IG Series 11 Index | | (409,903) | 16,010,000 | | 12/20/18 | (140 bp) | 51,273 |
|
| DJ CMB NA CMBX AAA Index | | 7,153,058 | 59,629,500 | | 12/13/49 | 8 bp | (967,039) |
|
| DJ CMB NA CMBX AAA Index | | 6,024,691 | 55,516,500 | | 2/17/51 | 35 bp | (783,388) |
|
| Total | | | | | | | $4,905,031 |
* Payments related to the reference debt are made upon a credit default event.
** Upfront premium is based on the difference between the original spread on issue and the market spread on day of execution.
a Terminating on the date on which the notional amount is reduced to zero or the date on which the assets securing the reference entity are liquidated.
F Is valued at fair value following procedures approved by the Trustees.
The accompanying notes are an integral part of these financial statements.
43
| |
| Statement of assets and liabilities 10/31/08 | |
| |
| ASSETS | |
|
| Investment in securities, at value, including $4,440,674 | |
| of securities on loan (Note 1): | |
| Unaffiliated issuers (identified cost $4,205,424,735) | $3,969,389,180 |
|
| Cash | 21,579,292 |
|
| Interest and other receivables | 16,681,034 |
|
| Receivable for shares of the fund sold | 6,143,427 |
|
| Receivable for securities sold | 48,437,013 |
|
| Receivable for sales of delayed delivery securities (Note 1) | 1,012,166,057 |
|
| Receivable from Manager (Note 2) | 140,039 |
|
| Receivable for variation margin (Note 1) | 13,461,292 |
|
| Unrealized appreciation on swap contracts (Note 1) | 116,482,084 |
|
| Receivable for open swap contracts (Note 1) | 12,321 |
|
| Receivable for closed swap contracts (Note 1) | 8,152,223 |
|
| Premiums paid on swap contracts (Note 1) | 12,395,435 |
|
| Total assets | 5,225,039,397 |
| |
| |
| LIABILITIES | |
|
| Payable for securities purchased | 22,764,222 |
|
| Payable for purchases of delayed delivery securities (Note 1) | 2,150,615,516 |
|
| Payable for shares of the fund repurchased | 18,153,177 |
|
| Payable for compensation of Manager (Notes 2 and 5) | 1,876,855 |
|
| Payable for investor servicing fees (Note 2) | 440,180 |
|
| Payable for Trustee compensation and expenses (Note 2) | 249,499 |
|
| Payable for administrative services (Note 2) | 6,378 |
|
| Payable for distribution fees (Note 2) | 265,884 |
|
| Unrealized depreciation on swap contracts (Note 1) | 178,549,752 |
|
| Payable for open swap contracts (Note 1) | 141,501 |
|
| Payable for closed swap contracts (Note 1) | 187,809,748 |
|
| Premiums received on swap contracts (Note 1) | 39,716,105 |
|
| Written options outstanding, at value | |
| (premiums received $46,373,762) (Notes 1 and 3) | 46,592,774 |
|
| TBA sales commitments, at value | |
| (proceeds receivable $1,010,304,219) (Note 1) | 1,001,130,344 |
|
| Collateral on securities loaned, at value (Note 1) | 5,446,040 |
|
| Payable for receivable purchase agreement (Note 2) | 759,954 |
|
| Other accrued expenses | 260,232 |
|
| Total liabilities | 3,654,778,161 |
| |
| Net assets | $1,570,261,236 |
| |
| |
| REPRESENTED BY | |
|
| Paid-in capital (Unlimited shares authorized) (Notes 1 and 4) | $2,046,254,930 |
|
| Undistributed net investment income (Note 1) | 20,690,640 |
|
| Accumulated net realized loss on investments (Note 1) | (197,457,731) |
|
| Net unrealized depreciation of investments | (299,226,603) |
|
| Total — Representing net assets applicable | |
| to capital shares outstanding | $1,570,261,236 |
| |
| |
| COMPUTATION OF NET ASSET VALUE AND OFFERING PRICE |
|
| Net asset value and redemption price per class A share | |
| ($537,220,437 divided by 100,337,040 shares) | $5.35 |
|
| Offering price per class A share (100/96.00 of $5.35)* | $5.57 |
|
| Net asset value and offering price per class B share | |
| ($57,170,566 divided by 10,750,455 shares)** | $5.32 |
|
| Net asset value and offering price per class C share | |
| ($16,414,345 divided by 3,078,666 shares)** | $5.33 |
|
| Net asset value and redemption price per class M share | |
| ($167,743,451 divided by 31,771,408 shares) | $5.28 |
|
| Offering price per class M share (100/96.75 of $5.28)*** | $5.46 |
|
| Net asset value, offering price and redemption price per class R share |
| ($1,448,026 divided by 271,148 shares) | $5.34 |
|
| Net asset value, offering price and redemption price per class Y share |
| ($790,264,411 divided by 146,345,084 shares) | $5.40 |
* On single retail sales of less than $100,000. On sales of $100,000 or more the offering price is reduced.
** Redemption price per share is equal to net asset value less any applicable contingent deferred sales charge.
*** On single retail sales of less than $50,000. On sales of $50,000 or more the offering price is reduced.
The accompanying notes are an integral part of these financial statements.
44
| |
| Statement of operations Year ended 10/31/08 | |
| |
| INVESTMENT INCOME | |
|
| Interest (including interest income of $2,856,062 | |
| from investments in affiliated issuers) (Note 5) | $143,133,201 |
|
| Securities lending | 81,859 |
|
| Total investment income | 143,215,060 |
| |
| |
| EXPENSES | |
|
| Compensation of Manager (Note 2) | 11,129,635 |
|
| Investor servicing fees (Note 2) | 5,439,448 |
|
| Custodian fees (Note 2) | 118,365 |
|
| Trustee compensation and expenses (Note 2) | 81,434 |
|
| Administrative services (Note 2) | 51,847 |
|
| Distribution fees — Class A (Note 2) | 1,805,115 |
|
| Distribution fees — Class B (Note 2) | 886,001 |
|
| Distribution fees — Class C (Note 2) | 216,221 |
|
| Distribution fees — Class M (Note 2) | 1,128,573 |
|
| Distribution fees — Class R (Note 2) | 7,645 |
|
| Other | 582,052 |
|
| Non-recurring costs (Notes 2 and 7) | 3,975 |
|
| Costs assumed by Manager (Notes 2 and 7) | (3,975) |
|
| Fees waived and reimbursed by Manager (Notes 2 and 5) | (1,975,034) |
|
| Total expenses | 19,471,302 |
| | |
| Expense reduction (Note 2) | (382,527) |
|
| Net expenses | 19,088,775 |
| |
| Net investment income | 124,126,285 |
|
| Net realized gain on investments (Notes 1 and 3) | 31,481,419 |
|
| Net realized loss on swap contracts (Note 1) | (142,927,940) |
|
| Net realized loss on futures contracts (Note 1) | (29,449,654) |
|
| Net realized loss on written options (Notes 1 and 3) | (370,645) |
|
| Net unrealized depreciation of investments, futures | |
| contracts, swap contracts, written options, and TBA | |
| sale commitments during the year | (266,679,860) |
|
| Net loss on investments | (407,946,680) |
|
| Net decrease in net assets resulting from operations | $(283,820,395) |
| | |
| Statement of changes in net assets | |
| |
| DECREASE IN NET ASSETS | | |
| | Year ended | Year ended |
|
| | 10/31/08 | 10/31/07 |
|
| Operations: | | |
|
| Net investment income | $124,126,285 | $114,634,349 |
|
| Net realized gain (loss) on investments | (141,266,820) | 20,572,079 |
|
| Net unrealized depreciation of investments | (266,679,860) | (10,657,815) |
|
| Net increase (decrease) in net assets | | |
| resulting from operations | (283,820,395) | 124,548,613 |
|
| Distributions to shareholders (Note 1): | | |
|
| From ordinary income | | |
|
| Net investment income | | |
|
| Class A | (50,934,368) | (36,686,887) |
|
| Class B | (5,580,614) | (5,242,893) |
|
| Class C | (1,366,217) | (830,587) |
|
| Class M | (15,777,681) | (13,239,603) |
|
| Class R | (107,043) | (42,898) |
|
| Class Y | (74,106,432) | (59,801,833) |
|
| Redemption fees (Note 1) | 4,540 | 4,937 |
|
| Decrease from capital share transactions | | |
| (Note 4) | (278,003,797) | (223,642,431) |
|
| Total decrease in net assets | (709,692,007) | (214,933,582) |
| |
| |
| NET ASSETS | | |
|
| Beginning of year | 2,279,953,243 | 2,494,886,825 |
|
| End of year (including undistributed net | | |
| investment income of $20,690,640 | | |
| and $39,288,020, respectively) | $1,570,261,236 | $2,279,953,243 |
The accompanying notes are an integral part of these financial statements.
45
Financial highlights (For a common share outstanding throughout the period)
| | | | | | | | | | | | | | | | | | | | | | | | | | |
| INVESTMENT OPERATIONS: | | | | | | | | | | LESS DISTRIBUTIONS: | | | | | | | | RATIOS AND SUPPLEMENTAL DATA: |
|
| | | | | | | | | | | | | | | | | | | | | | | | | Ratio of net | | |
| | | | | | | Net realized and | | Total from | | | | | | | | | | Total return | | Net assets, | | Ratio of expenses | | investment income | | |
| | | Net asset value, | | Net investment | | unrealized gain (loss) | | investment | | From net | | Total | | Redemption | | Net asset value, | | at net asset | | end of period | | to average | | (loss) to average | | Portfolio |
| Period ended | | beginning of period | | income (loss) a,b | | on investments | | operations | | investment income | | distributions | | fees c | | end of period | | value (%) d | | (in thousands) | | net assets (%) b,e | | net assets (%) b | | turnover (%) |
|
| Class A | | | | | | | | | | | | | | | | | | | | | | | | | | |
| October 31, 2008 | | $6.77 | | .38 | | (1.34) | | (.96) | | (.46) | | (.46) | | — | | $5.35 | | (15.13) | | $537,220 | | .99 | | 5.91 | | 200.36 g |
| October 31, 2007 | | 6.74 | | .31 | | .04 | | .35 | | (.32) | | (.32) | | — | | 6.77 | | 5.35 | | 768,016 | | .98 | | 4.67 | | 322.90 g |
| October 31, 2006 | | 6.73 | | .27 f | | .03 | | .30 | | (.29) | | (.29) | | — | | 6.74 | | 4.53 | | 791,970 | | .95 f | | 4.07 f | | 238.67 g |
| October 31, 2005 | | 6.87 | | .23 | | (.16) | | .07 | | (.21) | | (.21) | | — | | 6.73 | | 1.05 | | 872,931 | | .98 | | 3.42 | | 300.04 g |
| October 31, 2004 | | 6.69 | | .19 | | .19 | | .38 | | (.20) | | (.20) | | — | | 6.87 | | 5.70 | | 985,939 | | .99 | | 2.83 | | 441.06 |
|
| Class B | | | | | | | | | | | | | | | | | | | | | | | | | | |
| October 31, 2008 | | $6.72 | | .34 | | (1.33) | | (.99) | | (.41) | | (.41) | | — | | $5.32 | | (15.58) | | $57,171 | | 1.74 | | 5.22 | | 200.36 g |
| October 31, 2007 | | 6.70 | | .26 | | .03 | | .29 | | (.27) | | (.27) | | — | | 6.72 | | 4.43 | | 110,495 | | 1.73 | | 3.96 | | 322.90 g |
| October 31, 2006 | | 6.68 | | .22 f | | .04 | | .26 | | (.24) | | (.24) | | — | | 6.70 | | 3.92 | | 154,775 | | 1.70 f | | 3.37 f | | 238.67 g |
| October 31, 2005 | | 6.82 | | .18 | | (.16) | | .02 | | (.16) | | (.16) | | — | | 6.68 | | .28 | | 229,794 | | 1.73 | | 2.64 | | 300.04 g |
| October 31, 2004 | | 6.65 | | .14 | | .18 | | .32 | | (.15) | | (.15) | | — | | 6.82 | | 4.79 | | 323,527 | | 1.74 | | 2.12 | | 441.06 |
|
| Class C | | | | | | | | | | | | | | | | | | | | | | | | | | |
| October 31, 2008 | | $6.74 | | .33 | | (1.33) | | (1.00) | | (.41) | | (.41) | | — | | $5.33 | | (15.67) | | $16,414 | | 1.74 | | 5.16 | | 200.36 g |
| October 31, 2007 | | 6.72 | | .26 | | .03 | | .29 | | (.27) | | (.27) | | — | | 6.74 | | 4.41 | | 20,396 | | 1.73 | | 3.93 | | 322.90 g |
| October 31, 2006 | | 6.70 | | .22 f | | .04 | | .26 | | (.24) | | (.24) | | — | | 6.72 | | 3.92 | | 21,736 | | 1.70 f | | 3.33 f | | 238.67 g |
| October 31, 2005 | | 6.84 | | .18 | | (.16) | | .02 | | (.16) | | (.16) | | — | | 6.70 | | .28 | | 24,644 | | 1.73 | | 2.66 | | 300.04 g |
| October 31, 2004 | | 6.67 | | .14 | | .18 | | .32 | | (.15) | | (.15) | | — | | 6.84 | | 4.79 | | 29,059 | | 1.74 | | 2.10 | | 441.06 |
|
| Class M | | | | | | | | | | | | | | | | | | | | | | | | | | |
| October 31, 2008 | | $6.68 | | .36 | | (1.31) | | (.95) | | (.45) | | (.45) | | — | | $5.28 | | (15.19) | | $167,743 | | 1.24 | | 5.67 | | 200.36 g |
| October 31, 2007 | | 6.67 | | .30 | | .02 | | .32 | | (.31) | | (.31) | | — | | 6.68 | | 4.86 | | 253,457 | | 1.23 | | 4.45 | | 322.90 g |
| October 31, 2006 | | 6.66 | | .25 f | | .03 | | .28 | | (.27) | | (.27) | | — | | 6.67 | | 4.38 | | 331,997 | | 1.20 f | | 3.85 f | | 238.67 g |
| October 31, 2005 | | 6.80 | | .21 | | (.15) | | .06 | | (.20) | | (.20) | | — | | 6.66 | | .84 | | 420,886 | | 1.23 | | 3.15 | | 300.04 g |
| October 31, 2004 | | 6.63 | | .17 | | .18 | | .35 | | (.18) | | (.18) | | — | | 6.80 | | 5.40 | | 556,725 | | 1.24 | | 2.62 | | 441.06 |
|
| Class R | | | | | | | | | | | | | | | | | | | | | | | | | | |
| October 31, 2008 | | $6.76 | | .36 | | (1.33) | | (.97) | | (.45) | | (.45) | | — | | $5.34 | | (15.30) | | $1,448 | | 1.24 | | 5.54 | | 200.36 g |
| October 31, 2007 | | 6.74 | | .30 | | .03 | | .33 | | (.31) | | (.31) | | — | | 6.76 | | 4.98 | | 1,062 | | 1.23 | | 4.38 | | 322.90 g |
| October 31, 2006 | | 6.72 | | .25 f | | .04 | | .29 | | (.27) | | (.27) | | — | | 6.74 | | 4.50 | | 755 | | 1.20 f | | 3.70 f | | 238.67 g |
| October 31, 2005 | | 6.87 | | .23 | | (.18) | | .05 | | (.20) | | (.20) | | — | | 6.72 | | .72 | | 400 | | 1.23 | | 3.29 | | 300.04 g |
| October 31, 2004 | | 6.69 | | .18 | | .18 | | .36 | | (.18) | | (.18) | | — | | 6.87 | | 5.47 | | 62 | | 1.24 | | 2.57 | | 441.06 |
|
| Class Y | | | | | | | | | | | | | | | | | | | | | | | | | | |
| October 31, 2008 | | $6.82 | | .40 | | (1.35) | | (.95) | | (.47) | | (.47) | | — | | $5.40 | | (14.85) | | $790,264 | | .74 | | 6.14 | | 200.36 g |
| October 31, 2007 | | 6.79 | | .33 | | .04 | | .37 | | (.34) | | (.34) | | — | | 6.82 | | 5.54 | | 1,126,527 | | .73 | | 4.93 | | 322.90 g |
| October 31, 2006 | | 6.77 | | .29 f | | .03 | | .32 | | (.30) | | (.30) | | — | | 6.79 | | 4.89 | | 1,193,654 | | .70 f | | 4.30 f | | 238.67 g |
| October 31, 2005 | | 6.91 | | .25 | | (.16) | | .09 | | (.23) | | (.23) | | — | | 6.77 | | 1.28 | | 1,029,647 | | .73 | | 3.69 | | 300.04 g |
| October 31, 2004 | | 6.72 | | .21 | | .19 | | .40 | | (.21) | | (.21) | | — | | 6.91 | | 6.06 | | 880,124 | | .74 | | 3.01 | | 441.06 |
|
a Per share net investment income has been determined on the basis of the weighted average number of shares outstanding during the period.
b Reflects an involuntary contractual expense limitation and/or waivers of certain fund expenses in connection with investments in Putnam Prime Money Market Fund in effect during the period. As a result of such limitation and/ or waivers, the expenses of each class reflect a reduction of the following amounts (Notes 2 and 5):
| |
| | Percentage of average net assets |
|
| October 31, 2008 | 0.09% |
|
| October 31, 2007 | 0.08 |
|
| October 31, 2006 | 0.05 |
|
| October 31, 2005 | 0.03 |
|
| October 31, 2004 | <0.01 |
|
c Amount represents less than $0.01 per share.
d Total return assumes dividend reinvestment and does not reflect the effect of sales charges.
e Includes amounts paid through expense offset arrangements (Note 2).
f Reflects a non-recurring reimbursement to the fund from Putnam Investments relating to the calculation of certain amounts paid by the fund to Putnam in previous years for transfer agent services, which amounted to less than $0.01 per share and 0.03% of average net assets for the period ended October 31, 2006.
g Portfolio turnover excludes dollar roll transactions.
The accompanying notes are an integral part of these financial statements.
Notes to financial statements 10/31/08
Note 1: Significant accounting policies
Putnam Income Fund (the “fund”), a Massachusetts business trust, is registered under the Investment Company Act of 1940, as amended, as a diversified, open-end management investment company. The fund seeks high current income consistent with what Putnam Investment Management, LLC (“Putnam Management”), the fund’s manager, a wholly-owned subsidiary of Putnam, LLC, believes to be prudent risk. The fund invests in a portfolio of debt securities, both government and corporate obligations, and may invest in preferred stocks and common stocks. The fund may invest a significant portion of their assets in securitized debt instruments, including mortgage-backed and asset-backed investments. The yields and values of these investments are sensitive to changes in interest rates, the rate of principal payments on the underlying assets and the market’s perception of the issuers. The market for these investments may be volatile and limited, which may make them difficult to buy or sell.
The fund offers class A, class B, class C, class M, class R and class Y shares. Class A and class M shares are sold with a maximum front-end sales charge of 4.00% and 3.25%, respectively, and generally do not pay a contingent deferred sales charge. Class B shares, which convert to class A shares after approximately eight years, do not pay a front-end sales charge and are subject to a contingent deferred sales charge, if those shares are redeemed within six years of purchase. Class C shares have a one-year 1.00% contingent deferred sales charge and do not convert to class A shares. Class R shares, which are offered to qualified employee-benefit plans, are sold at net asset value. The expenses for class A, class B, class C, class M and class R shares may differ based on the distribution fee of each class, which is identified in Note 2. Class Y shares, which are sold at net asset value, are generally subject to the same expenses as class A, class B, class C, class M an d class R shares, but do not bear a distribution fee. Class Y shares are generally only available to corporate and institutional clients and clients in other approved programs.
A 1.00% redemption fee may apply on any shares that are redeemed (either by selling or exchanging into another fund) within 7 days of purchase. The redemption fee is accounted for as an addition to paid-in-capital.
Investment income, realized and unrealized gains and losses and expenses of the fund are borne pro-rata based on the relative net assets of each class to the total net assets of the fund, except that each class bears expenses unique to that class (including the distribution fees applicable to such classes). Each class votes as a class only with respect to its own distribution plan or other matters on which a class vote is required by law or determined by the Trustees. If the fund were liquidated, shares of each class would receive their pro-rata share of the net assets of the fund. In addition, the Trustees declare separate dividends on each class of shares.
In the normal course of business, the fund enters into contracts that may include agreements to indemnify another party under given circumstances. The fund’s maximum exposure under these arrangements is unknown as this would involve future claims that may be, but have not yet been, made against the fund. However, the fund’s management team expects the risk of material loss to be remote.
The following is a summary of significant accounting policies consistently followed by the fund in the preparation of its financial statements. The preparation of financial statements is in conformity with accounting principles generally accepted in the United States of America and requires management to make estimates and assumptions that affect the reported amounts of assets and liabilities in the financial statements and the reported amounts of increases and decreases in net assets from operations during the reporting period. Actual results could differ from those estimates.
A) Security valuation Market quotations are not considered to be readily available for certain debt obligations; such investments are valued on the basis of valuations furnished by an independent pricing service approved by the Trustees or dealers selected by Putnam Management. Such services or dealers determine valuations for normal institutional-size trading units of such securities using methods based on market transactions for comparable securities and various relationships, generally recognized by institutional traders, between securities. Securities quoted in foreign currencies, if any, are translated into U.S. dollars at the current exchange rate. To the extent a pricing service or dealer is unable to value a security or provides a valuation which Putnam Management does not believe accurately reflects the security’s fair value, the security will be valued at fair value by Putn am Management. Certain investments, including certain restricted securities and derivatives, are also valued at fair value following procedures approved by the Trustees. Such valuations and procedures are reviewed periodically by the Trustees. Certain securities may be valued on the basis of a price provided by a single source. The fair value of securities is generally determined as the amount that the fund could reasonably expect to realize from an orderly disposition of such securities over a reasonable period of time. By its nature, a fair value price is a good faith estimate of the value of a security at a given point in time and does not reflect an actual market price, which may be different by a material amount.
B) Joint trading account Pursuant to an exemptive order from the Securities and Exchange Commission (the “SEC”), the fund may transfer uninvested cash balances, including cash collateral received under security lending arrangements, into a joint trading account along with the cash of other registered investment companies and certain other accounts managed by Putnam Management. These balances may be invested in issues of short-term investments having maturities of up to 397 days for collateral received under security lending arrangements and up to 90 days for other cash investments.
C) Repurchase agreements The fund, or any joint trading account, through its custodian, receives delivery of the underlying securities, the market value of which at the time of purchase is required to be in an amount at least equal to the resale price, including accrued interest. Collateral for certain tri-party repurchase agreements is held at the counterparty’s custodian in a segregated account for the benefit of the fund and the counterparty. Putnam Management is responsible for determining that the value of these underlying securities is at all times at least equal to the resale price, including accrued interest.
D) Security transactions and related investment income Security transactions are recorded on the trade date (the date the order to buy or sell is executed). Gains or losses on securities sold are determined on the identified cost basis.
Interest income is recorded on the accrual basis. All premiums/discounts are amortized/accreted on a yield-to-maturity basis.
Securities purchased or sold on a delayed delivery basis may be settled a month or more after the trade date; interest income is accrued based on the terms of the securities. Losses may arise due to changes in the market value of the underlying securities or if the counterparty does not perform under the contract.
The fund earned certain fees in connection with its senior loan purchasing activities. These fees are treated as market discount and are recorded as income in the Statement of operations.
E) Stripped securities The fund may invest in stripped securities which represent a participation in securities that may be structured in classes with rights to receive different portions of the interest and principal. Interest-only securities receive all of the interest and principal-only securities receive all of the principal. If the interest-only securities experience greater than anticipated prepayments of principal, the fund may fail to recoup fully its initial investment in these securities. Conversely, principal-only securities increase in value if prepayments are greater than anticipated and decline if prepayments are slower than anticipated. The market value of these securities is highly sensitive to changes in interest rates.
F) Futures and options contracts The fund may use futures and options contracts to hedge against changes in the values of securities the fund owns,
48
owned or expects to purchase, or for other investment purposes. The fund may also write options on swaps or securities it owns or in which it may invest to increase its current returns.
The potential risk to the fund is that the change in value of futures and options contracts may not correspond to the change in value of the hedged instruments. In addition, losses may arise from changes in the value of the underlying instruments, if there is an illiquid secondary market for the contracts, or if the counterparty to the contract is unable to perform. Risks may exceed amounts recognized on the Statement of assets and liabilities. When the contract is closed, the fund records a realized gain or loss equal to the difference between the value of the contract at the time it was opened and the value at the time it was closed. Realized gains and losses on purchased options are included in realized gains and losses on investment securities. If a written call option is exercised, the premium originally received is recorded as an addition to sales proceeds. If a written put option is exercised, the premium originally received is recorded as a reduction to the cost of investments.
Futures contracts are valued at the quoted daily settlement prices established by the exchange on which they trade. The fund and the broker agree to exchange an amount of cash equal to the daily fluctuation in the value of the futures contract. Such receipts or payments are known as “variation margin.” Exchange traded options are valued at the last sale price or, if no sales are reported, the last bid price for purchased options and the last ask price for written options. Options traded over-the-counter are valued using prices supplied by dealers. Futures and written option contracts outstanding at period end, if any, are listed after the fund’s portfolio.
G) Total return swap contracts The fund may enter into total return swap contracts, which are arrangements to exchange a market linked return for a periodic payment, both based on a notional principal amount. To the extent that the total return of the security, index or other financial measure underlying the transaction exceeds or falls short of the offsetting interest rate obligation, the fund will receive a payment from or make a payment to the counterparty. Total return swap contracts are marked to market daily based upon quotations from market makers and the change, if any, is recorded as an unrealized gain or loss. Payments received or made are recorded as realized gains or losses. Certain total return swap contracts may include extended effective dates. Payments related to these swap contracts are accrued based on the terms of the contract. The fund could be exposed to credit or market risk due to unfavorable changes in the fluctuation of interest rates or in the price of the underlying security or index, the possibility that there is no liquid market for these agreements or that the counterparty may default on its obligation to perform. Risk of loss may exceed amounts recognized on the Statement of assets and liabilities. Total return swap contracts outstanding at period end, if any, are listed after the fund’s portfolio.
H) Interest rate swap contracts The fund may enter into interest rate swap contracts, which are arrangements between two parties to exchange cash flows based on a notional principal amount, to manage the fund’s exposure to interest rates. An interest rate swap can be purchased or sold with an upfront premium. An upfront payment received by the fund is recorded as a liability on the fund’s books. An upfront payment made by the fund is recorded as an asset on the fund’s books. Interest rate swap contracts are marked to market daily based upon quotations from an independent pricing service or market makers and the change, if any, is recorded as an unrealized gain or loss. Payments received or made are recorded as realized gains or losses. Certain interest rate swap contracts may include extended effective dates. Payments related to these swap contracts are accrued based on the terms of the contract. The fund cou ld be exposed to credit or market risk due to unfavorable changes in the fluctuation of interest rates or if the counterparty defaults on its obligation to perform. Risk of loss may exceed amounts recognized on the Statement of assets and liabilities. Interest rate swap contracts outstanding at period end, if any, are listed after the fund’s portfolio.
I) Credit default contracts The fund may enter into credit default contracts where one party, the protection buyer, makes an upfront or periodic payment to a counterparty, the protection seller, in exchange for the right to receive a contingent payment. The maximum amount of the payment may equal the notional amount, at par, of the underlying index or security as a result of a related credit event. Payments are made upon a credit default event of the disclosed primary referenced obligation or all other equally ranked obligations of the reference entity. An upfront payment received by the fund, as the protection seller, is recorded as a liability on the fund’s books. An upfront payment made by the fund, as the protection buyer, is recorded as an asset on the fund’s books. Periodic payments received or paid by the fund are recorded as realized gains or losses. The credit default contracts are marked to market daily based upon quotations from an independent pricing service or market makers and the change, if any, is recorded as an unrealized gain or loss. Payments received or made as a result of a credit event or termination of the contract are recognized, net of a proportional amount of the upfront payment, as realized gains or losses. In addition to bearing the risk that the credit event will occur, the fund could be exposed to market risk due to unfavorable changes in interest rates or in the price of the underlying security or index, the possibility that the fund may be unable to close out its position at the same time or at the same price as if it had purchased comparable publicly traded securities or that the counterparty may default on its obligation to perform. Risks of loss may exceed amounts recognized on the Statement of assets and liabilities. Credit default contracts outstanding at period end, if any, are listed after the fund’s portfolio.
J) TBA purchase commitments The fund may enter into “TBA” (to be announced) commitments to purchase securities for a fixed unit price at a future date beyond customary settlement time. Although the unit price has been established, the principal value has not been finalized. However, the amount of the commitments will not significantly differ from the principal amount. The fund holds, and maintains until settlement date, cash or high-grade debt obligations in an amount sufficient to meet the purchase price, or the fund may enter into offsetting contracts for the forward sale of other securities it owns. Income on the securities will not be earned until settlement date. TBA purchase commitments may be considered securities themselves, and involve a risk of loss if the value of the security to be purchased declines prior to the settlement date, which risk is in addition to the risk of decline in the value of the fund ’s other assets. Unsettled TBA purchase commitments are valued at fair value of the underlying securities, according to the procedures described under “Security valuation” above. The contract is marked to market daily and the change in market value is recorded by the fund as an unrealized gain or loss.
Although the fund will generally enter into TBA purchase commitments with the intention of acquiring securities for its portfolio or for delivery pursuant to options contracts it has entered into, the fund may dispose of a commitment prior to settlement if Putnam Management deems it appropriate to do so.
K) TBA sale commitments The fund may enter into TBA sale commitments to hedge its portfolio positions or to sell mortgage-backed securities it owns under delayed delivery arrangements. Proceeds of TBA sale commitments are not received until the contractual settlement date. During the time a TBA sale commitment is outstanding, equivalent deliverable securities or an offsetting TBA purchase commitment deliverable on or before the sale commitment date, are held as “cover” for the transaction.
Unsettled TBA sale commitments are valued at the fair value of the underlying securities, generally according to the procedures described under “Security valuation” above. The contract is marked to market daily and the change in market value is recorded by the fund as an unrealized gain or loss. If the TBA sale commitment is closed through the acquisition of an offsetting TBA purchase commitment, the fund realizes a gain or loss. If the fund delivers securities under the commitment, the fund realizes a gain or a loss from the sale of the securities based upon the unit price established at the
49
date the commitment was entered into. TBA sale commitments outstanding at period end, if any, are listed after the fund’s portfolio.
L) Dollar rolls To enhance returns, the fund may enter into dollar rolls (principally using TBAs) in which the fund sells securities for delivery in the current month and simultaneously contracts to purchase similar securities on a specified future date. During the period between the sale and subsequent purchase, the fund will not be entitled to receive income and principal payments on the securities sold. The fund will, however, retain the difference between the initial sales price and the forward price for the future purchase. The fund will also be able to earn interest on the cash proceeds that are received from the initial sale, on settlement date. The fund may be exposed to market or credit risk if the price of the security changes unfavorably or the counterparty fails to perform under the terms of the agreement.
M) Securities lending The fund may lend securities, through its agents, to qualified borrowers in order to earn additional income. The loans are collateralized by cash and/or securities in an amount at least equal to the market value of the securities loaned. The market value of securities loaned is determined daily and any additional required collateral is allocated to the fund on the next business day. The risk of borrower default will be borne by the fund’s agents; the fund will bear the risk of loss with respect to the investment of the cash collateral. Income from securities lending is included in investment income on the Statement of operations. At October 31, 2008, the value of securities loaned amounted to $5,316,710. Certain of these securities were sold prior to period end and are included in the Receivable for securities sold on the Statement of assets and liabilities. The fund received cash collateral of $5 ,446,040 which is pooled with collateral of other Putnam funds into 15 issues of short-term investments.
N) Federal taxes It is the policy of the fund to distribute all of its taxable income within the prescribed time and otherwise comply with the provisions of the Internal Revenue Code of 1986, as amended (the “Code”), applicable to regulated investment companies. It is also the intention of the fund to distribute an amount sufficient to avoid imposition of any excise tax under Section 4982 of the Code. Therefore, no provision has been made for federal taxes on income, capital gains or unrealized appreciation on securities held nor for excise tax on income and capital gains.
At October 31, 2008, the fund had a capital loss carryover of $166,538,840 available to the extent allowed by the Code to offset future net capital gain, if any. The amount of the carryover and the expiration dates are:
| | | |
| | |
| Loss Carryover | Expiration | |
| |
| $ 9,580,324 | | October 31, 2009 | |
| |
| 15,454,954 | | October 31, 2013 | |
| |
| 14,607,635 | | October 31, 2014 | |
| |
| 126,895,927 | | October 31, 2016 | |
| |
O) Distributions to shareholders Distributions to shareholders from net investment income are recorded by the fund on the ex-dividend date. Distributions from capital gains, if any, are recorded on the ex-dividend date and paid at least annually. The amount and character of income and gains to be distributed are determined in accordance with income tax regulations, which may differ from generally accepted accounting principles. These differences include temporary and/or permanent differences of losses on wash sale transactions, the expiration of a capital loss carryover, unrealized gains and losses on certain futures contracts, income on swap contracts and interest only securities. Reclassifications are made to the fund’s capital accounts to reflect income and gains available for distribution (or available capital loss carryovers) under income tax regulations. For the year ended October 31, 2008, the fund reclassified $5,148,690 to increase undistributed net investment income and $76,761,268 to decrease paid-in-capital, with a decrease to accumulated net realized losses of $71,612,578.
The tax basis components of distributable earnings and the federal tax cost as of October 31, 2008 were as follows:
| | |
| Unrealized appreciation | $71,753,402 | |
| Unrealized depreciation | (349,876,522) | |
| |
| Net unrealized depreciation | (278,123,120) | |
| Undistributed ordinary income | 12,533,407 | |
| Capital loss carryforward | (166,538,840) | |
| |
| Cost for federal income tax purposes | $4,247,512,300 | |
Note 2: Management fee, administrative services and other transactions
The fund pays Putnam Management for management and investment advisory services quarterly based on the average net assets of the fund. Such fee is based on the following annual rates: 0.65% of the first $500 million of average net assets, 0.55% of the next $500 million, 0.50% of the next $500 million, 0.45% of the next $5 billion, 0.425% of the next $5 billion, 0.405% of the next $5 billion, 0.39% of the next $5 billion and 0.38% thereafter.
Putnam Management has agreed to waive fees and reimburse expenses of the fund through June 30, 2009 to the extent necessary to ensure that the fund’s expenses do not exceed the simple average of the expenses of all front-end load funds viewed by Lipper Inc. as having the same investment classification or objective as the fund. The expense reimbursement is based on a comparison of the fund’s expenses with the average annualized operating expenses of the funds in its Lipper peer group for each calendar quarter during the fund’s last fiscal year, excluding 12b-1 fees and without giving effect to any expense offset and brokerage/service arrangements that may reduce fund expenses. For the year ended October 31, 2008, Putnam Management waived $1,888,109 of its management fee from the fund.
For the year ended October 31, 2008, Putnam Management has assumed $3,975 of legal, shareholder servicing and communication, audit and Trustee fees incurred by the fund in connection with certain legal and regulatory matters (including those described in Note 7).
On September 26, 2008, the fund entered into Agreements with other registered investment companies (each a “Seller”) managed by Putnam Management. Under the Agreements, the Seller sold to the fund the right to receive, in the aggregate, $2,948,825 in net payments from Lehman Brothers Special Financing, Inc. in connection with certain terminated derivatives transactions (the “Receivable”), in each case in exchange for an initial payment plus (or minus) additional amounts based on the fund’s ultimate realized gain (or loss) with respect to the Receivable. The Receivable will be offset against the fund’s net payable to Lehman Brothers Special Financing, Inc. and is included in the Statement of assets and liabilities under Payable for securities purchased. Future payments under the Agreements are valued at fair value following procedures approved by the Trustees and are included in the Statement of assets and liabilities. All remaining paym ents under the Agreements will be recorded as realized gain or loss.
The fund reimburses Putnam Management an allocated amount for the compensation and related expenses of certain officers of the fund and their staff who provide administrative services to the fund. The aggregate amount of all such reimbursements is determined annually by the Trustees.
Custodial services for the fund’s assets were provided by Putnam Fiduciary Trust Company (“PFTC”), an affiliate of Putnam Management, and by State Street Bank and Trust Company (“State Street”). Custody fees are based on the fund’s asset level, the number of its security holdings, transaction volumes and with respect to PFTC, certain fees related to the transition of assets to State Street. Putnam Investor Services, a division of PFTC, provided investor servicing agent functions to the fund. Putnam Investor Services received fees for investor servicing, subject to certain limitations, based on the number of shareholder accounts in the fund and the level of defined contribution plan assets in the fund. During the year ended October 31, 2008, the fund incurred $5,451,760 for custody and investor servicing agent functions provided by PFTC.
50
The fund has entered into expense offset arrangements with PFTC and State Street whereby PFTC’s and State Street’s fees are reduced by credits allowed on cash balances. For the year ended October 31, 2008, the fund’s expenses were reduced by $382,527 under the expense offset arrangements.
Each independent Trustee of the fund receives an annual Trustee fee, of which $849, as a quarterly retainer, has been allocated to the fund, and an additional fee for each Trustees meeting attended. Trustees receive additional fees for attendance at certain committee meetings and industry seminars and for certain compliance-related matters. Trustees also are reimbursed for expenses they incur relating to their services as Trustees.
The fund has adopted a Trustee Fee Deferral Plan (the “Deferral Plan”) which allows the Trustees to defer the receipt of all or a portion of Trustees fees payable on or after July 1, 1995. The deferred fees remain invested in certain Putnam funds until distribution in accordance with the Deferral Plan.
The fund has adopted an unfunded noncontributory defined benefit pension plan (the “Pension Plan”) covering all Trustees of the fund who have served as a Trustee for at least five years and were first elected prior to 2004. Benefits under the Pension Plan are equal to 50% of the Trustee’s average annual attendance and retainer fees for the three years ended December 31, 2005. The retirement benefit is payable during a Trustee’s lifetime, beginning the year following retirement, for the number of years of service through December 31, 2006. Pension expense for the fund is included in Trustee compensation and expenses in the Statement of operations. Accrued pension liability is included in Payable for Trustee compensation and expenses in the Statement of assets and liabilities. The Trustees have terminated the Pension Plan with respect to any Trustee first elected after 2003.
The fund has adopted distribution plans (the “Plans”) with respect to its class A, class B, class C, class M and class R shares pursuant to Rule 12b-1 under the Investment Company Act of 1940. The purpose of the Plans is to compensate Putnam Retail Management Limited Partnership, a wholly-owned subsidiary of Putnam, LLC and Putnam Retail Management GP, Inc., for services provided and expenses incurred in distributing shares of the fund. The Plans provide for payments by the fund to Putnam Retail Management Limited Partnership at an annual rate of up to 0.35%, 1.00%, 1.00%, 1.00% and 1.00% of the average net assets attributable to class A, class B, class C, class M and class R shares, respectively. The Trustees have approved payment by the fund at an annual rate of 0.25%, 1.00%, 1.00%, 0.50% and 0.50% of the average net assets attributable to class A, class B, class C, class M and class R shares, respectively.
For the year ended October 31, 2008, Putnam Retail Management Limited Partnership, acting as underwriter, received net commissions of $76,130 and $6,232 from the sale of class A and class M shares, respectively, and received $85,820 and $2,374 in contingent deferred sales charges from redemptions of class B and class C shares, respectively.
A deferred sales charge of up to 1.00% and 0.40% is assessed on certain redemptions of class A and class M shares, respectively. For the year ended October 31, 2008, Putnam Retail Management Limited Partnership, acting as underwriter, received $2,741 and no monies on class A and class M redemptions, respectively.
Note 3: Purchases and sales of securities
During the year ended October 31, 2008, cost of purchases and proceeds from sales of investment securities other than U.S. government securities and short-term investments aggregated $3,851,447,986 and $4,120,264,666, respectively. Purchases and sales of U.S. government securities aggregated $264,786,439 and $287,349,766, respectively.
Written option transactions during the year ended October 31, 2008, are summarized as follows:
| | |
| | Contract | Premiums |
| | Amounts | Received |
|
| Written options outstanding | | |
| at beginning of year | $1,647,293,000 | $36,726,633 |
|
| Options opened | 1,827,432,000 | 54,192,940 |
|
| Options exercised | — | — |
|
| Options expired | (1,048,190,000) | (21,532,518) |
|
| Options closed | (1,369,684,000) | (23,013,293) |
|
| Written options outstanding | | |
| at end of year | $1,056,851,000 | $46,373,762 |
|
Note 4: Capital shares
At October 31, 2008, there was an unlimited number of shares of beneficial interest authorized. Transactions in capital shares were as follows:
| | | | |
| | Year ended 10/31/08 | Year ended 10/31/07 |
|
| Class A | Shares | Amount | Shares | Amount |
|
| Shares sold | 21,752,218 | $142,173,993 | 21,065,263 | $141,935,434 |
|
| Shares issued in | 6,760,403 | 43,497,295 | 4,666,388 | 31,380,871 |
| connection with | | | | |
| reinvestment of | | | | |
| distributions | | | | |
|
| | 28,512,621 | 185,671,288 | 25,731,651 | 173,316,305 |
|
| Shares | (41,670,108) | (266,129,201) | (29,680,681) | (199,970,922) |
| repurchased | | | | |
|
| Net decrease | (13,157,487) | $(80,457,913) | (3,949,030) | $(26,654,617) |
|
| |
| | Year ended 10/31/08 | Year ended 10/31/07 |
|
| Class B | Shares | Amount | Shares | Amount |
|
| Shares sold | 1,584,663 | $10,299,308 | 2,043,378 | $13,682,242 |
|
| Shares issued in | 773,388 | 4,960,947 | 694,505 | 4,642,191 |
| connection with | | | | |
| reinvestment of | | | | |
| distributions | | | | |
|
| | 2,358,051 | 15,260,255 | 2,737,883 | 18,324,433 |
|
| Shares | (8,044,172) | (51,673,753) | (9,400,717) | (62,921,114) |
| repurchased | | | | |
|
| Net decrease | (5,686,121) | $(36,413,498) | (6,662,834) | $(44,596,681) |
|
| |
| | Year ended 10/31/08 | Year ended 10/31/07 |
|
| Class C | Shares | Amount | Shares | Amount |
|
| Shares sold | 1,252,390 | $8,189,286 | 444,163 | $2,977,328 |
|
| Shares issued in | 168,291 | 1,077,051 | 100,263 | 672,080 |
| connection with | | | | |
| reinvestment of | | | | |
| distributions | | | | |
|
| | 1,420,681 | 9,266,337 | 544,426 | 3,649,408 |
|
| Shares | (1,367,549) | (8,545,299) | (754,052) | (5,059,479) |
| repurchased | | | | |
|
| Net increase | 53,132 | $721,038 | (209,626) | $(1,410,071) |
| (decrease) | | | | |
|
51
| | | | |
| | Year ended 10/31/08 | Year ended 10/31/07 |
|
| Class M | Shares | Amount | Shares | Amount |
|
| Shares sold | 594,579 | $3,823,974 | 387,398 | $2,578,562 |
|
| Shares issued in | 91,701 | 583,154 | 71,890 | 477,841 |
| connection with | | | | |
| reinvestment of | | | | |
| distributions | | | | |
|
| | 686,280 | 4,407,128 | 459,288 | 3,056,403 |
|
| Shares | (6,837,946) | (43,480,869) | (12,340,684) | (82,080,849) |
| repurchased | | | | |
|
| Net decrease | (6,151,666) | $(39,073,741) | (11,881,396) | $(79,024,446) |
| |
| |
| | Year ended 10/31/08 | Year ended 10/31/07 |
|
| Class R | Shares | Amount | Shares | Amount |
|
| Shares sold | 169,375 | $1,108,766 | 89,701 | $602,799 |
|
| Shares issued in | 15,709 | 100,142 | 6,371 | 42,817 |
| connection with | | | | |
| reinvestment of | | | | |
| distributions | | | | |
|
| | 185,084 | 1,208,908 | 96,072 | 645,616 |
|
| Shares | (71,169) | (447,754) | (50,845) | (341,578) |
| repurchased | | | | |
|
| Net increase | 113,915 | $761,154 | 45,227 | $304,038 |
| |
| |
| | Year ended 10/31/08 | Year ended 10/31/07 |
|
| Class Y | Shares | Amount | Shares | Amount |
|
| Shares sold | 44,660,333 | $291,913,128 | 54,773,479 | $371,309,420 |
|
| Shares issued in | 11,425,176 | 74,094,826 | 8,829,919 | 59,795,640 |
| connection with | | | | |
| reinvestment of | | | | |
| distributions | | | | |
|
| | 56,085,509 | 366,007,954 | 63,603,398 | 431,105,060 |
|
| Shares | (74,990,907) | (489,548,791) | (74,170,365) | (503,365,714) |
| repurchased | | | | |
|
| Net decrease | (18,905,398) | $(123,540,837) | (10,566,967) | $(72,260,654) |
|
Note 5: Investment in Putnam Prime Money Market Fund
The fund invested in Putnam Prime Money Market Fund, an open-end management investment company managed by Putnam Management. Investments in Putnam Prime Money Market Fund were valued at its closing net asset value each business day. Management fees paid by the fund were reduced by an amount equal to the management fees paid by Putnam Prime Money Market Fund with respect to assets invested by the fund in Putnam Prime Money Market Fund. For the year ended October 31, 2008, management fees paid were reduced by $86,925 relating to the fund’s investment in Putnam Prime Money Market Fund. Income distributions earned by the fund were recorded as interest income in the Statement of operations and totaled $2,856,062 for the year ended October 31, 2008. During the year ended October 31, 2008, cost of purchases and proceeds of sales of investments in Putnam Prime Money Market Fund aggregated $846,927,678 and $846,927,678, respectively.
On September 17, 2008, the Trustees of the Putnam Prime Money Market Fund voted to close that fund effective September 17, 2008. On September 24, 2008 the fund received shares of Federated Prime Obligations Fund, an unaffiliated management investment company registered under the Investment Company Act of 1940, in liquidation of its shares of Putnam Prime Money Market Fund.
Note 6: Senior loan commitments
Senior loans are purchased or sold on a when-issued or delayed delivery basis and may be settled a month or more after the trade date, which from time to time can delay the actual investment of available cash balances; interest income is accrued based on the terms of the securities. Senior loans can be acquired through an agent, by assignment from another holder of the loan, or as a participation interest in another holder’s portion of the loan. When the fund invests in a loan or participation, the fund is subject to the risk that an intermediate participant between the fund and the borrower will fail to meet its obligations to the fund, in addition to the risk that the borrower under the loan may default on its obligations.
Note 7: Regulatory matters and litigation
In late 2003 and 2004, Putnam Management settled charges brought by the SEC and the Massachusetts Securities Division in connection with excessive short-term trading in Putnam funds. Distribution of payments from Putnam Management to certain open-end Putnam funds and their shareholders is expected to be completed in the next several months. These allegations and related matters have served as the general basis for certain lawsuits, including purported class action lawsuits against Putnam Management and, in a limited number of cases, some Putnam funds. Putnam Management believes that these lawsuits will have no material adverse effect on the funds or on Putnam Management’s ability to provide investment management services. In addition, Putnam Management has agreed to bear any costs incurred by the Putnam funds as a result of these matters.
Note 8: New accounting pronouncements
In June 2006, the Financial Accounting Standards Board (“FASB”) issued Interpretation No. 48, Accounting for Uncertainty in Income Taxes (the “Interpretation”). The Interpretation prescribes a minimum threshold for financial statement recognition of the benefit of a tax position taken or expected to be taken by a filer in the filer’s tax return. Upon adoption, the Interpretation did not have a material effect on the fund’s financial statements. However, the conclusions regarding the Interpretation may be subject to review and adjustment at a later date based on factors including, but not limited to, further implementation guidance expected from the FASB, and on-going analysis of tax laws, regulations and interpretations thereof. Each of the fund’s federal tax returns for the prior three fiscal years remains subject to examination by the Internal Revenue Service.
In September 2006, the FASB issued Statement of Financial Accounting Standards No. 157, Fair Value Measurements (the “Standard”). The Standard defines fair value, sets out a framework for measuring fair value and expands disclosures about fair value measurements. The Standard applies to fair value measurements already required or permitted by existing standards. The Standard is effective for fiscal years beginning after November 15, 2007 and interim periods within those fiscal years. Putnam Management does not believe the adoption of the Standard will impact the amounts reported in the financial statements; however, additional disclosures will be required about the inputs used to develop the measurements of fair value.
In March 2008, Statement of Financial Accounting Standards No. 161, Disclosures about Derivative Instruments and Hedging Activities (“SFAS 161”) — an amendment of FASB Statement No. 133, was issued and is effective for fiscal years beginning after November 15, 2008. SFAS 161 requires enhanced disclosures about how and why an entity uses derivative instruments and how derivative instruments affect an entity’s financial position. Putnam Management is currently evaluating the impact the adoption of SFAS 161 will have on the fund’s financial statement disclosures.
In September 2008, FASB Staff Position FAS 133-1 and FIN 45-4, “Disclosures about Credit Derivatives and Certain Guarantees: An Amendment of FASB Statement No. 133 and FASB Interpretation No. 45; and Clarification
52
of the Effective Date of FASB Statement No. 161” (the “Amendment”) was issued and is effective for annual and interim reporting periods ending after November 15, 2008. The Amendment requires enhanced disclosures regarding a fund’s credit derivatives holdings and hybrid financial instruments containing embedded credit derivatives. Putnam Management is currently evaluating the impact the adoption of the Amendment will have on the fund’s financial statement disclosures.
Note 9: Market conditions
Recent events in the financial sector have resulted in an unusually high degree of volatility in the financial markets. The fund’s investments in the financial sector, as reflected in the fund’s schedule of investments, exposes investors to the negative (or positive) performance resulting from these events.
Federal tax information (unaudited)
Federal tax information
For the tax year ended October 31, 2008, pursuant to §871(k) of the Internal Revenue Code, the fund hereby designates $146,421,302 of distributions paid as qualifying to be taxed as interest-related dividends.
The Form 1099 you receive in January 2009 will show the tax status of all distributions paid to your account in calendar 2008.
About the Trustees
Jameson A. Baxter
Born 1943, Trustee since 1994, Vice Chairman since 2005
Ms. Baxter is the President of Baxter Associates, Inc., a private investment firm.
Ms. Baxter serves as a Director of ASHTA Chemicals, Inc., and the Mutual Fund Directors Forum. Until 2007, she was a Director of Banta Corporation (a printing and supply chain management company), Ryerson, Inc. (a metals service corporation), and Advocate Health Care. Until 2004, she was a Director of BoardSource (formerly the National Center for Nonprofit Boards); and until 2002, she was a Director of Intermatic Corporation (a manufacturer of energy control products). She is Chairman Emeritus of the Board of Trustees, Mount Holyoke College, having served as Chairman for five years.
Ms. Baxter has held various positions in investment banking and corporate finance, including Vice President of and Consultant to First Boston Corporation and Vice President and Principal of the Regency Group. She is a graduate of Mount Holyoke College.
Charles B. Curtis
Born 1940, Trustee since 2001
Mr. Curtis is President and Chief Operating Officer of the Nuclear Threat Initiative (a private foundation dealing with national security issues), and serves as Senior Advisor to the United Nations Foundation.
Mr. Curtis is a member of the Council on Foreign Relations and serves as Director of Edison International and Southern California Edison. Until 2006, Mr. Curtis served as a member of the Trustee Advisory Council of the Applied Physics Laboratory, Johns Hopkins University. Until 2003, Mr. Curtis was a member of the Electric Power Research Institute Advisory Council and the University of Chicago Board of Governors for Argonne National Laboratory. Prior to 2002, Mr. Curtis was a member of the Board of Directors of the Gas Technology Institute and the Board of Directors of the Environment and Natural Resources Program Steering Committee, John F. Kennedy School of Government, Harvard University. Until 2001, Mr. Curtis was a member of the Department of Defense Policy Board and Director of EG&G Technical Services, Inc. (a fossil energy research and development support company).
From August 1997 to December 1999, Mr. Curtis was a Partner at Hogan & Hartson LLP, an international law firm headquartered in Washington, D.C. Prior to May 1997, Mr. Curtis was Deputy Secretary of Energy and Under Secretary of the U.S. Department of Energy. He served as Chairman of the Federal Energy Regulatory Commission from 1977 to 1981 and has held positions on the staff of the U.S. House of Representatives, the U.S. Treasury Department, and the SEC.
Robert J. Darretta
Born 1946, Trustee since 2007
Mr. Darretta serves as Director of United-Health Group, a diversified health-care company.
Until April 2007, Mr. Darretta was Vice Chairman of the Board of Directors of Johnson & Johnson, one of the world’s largest and most broadly based health-care companies. Prior to 2007, he had responsibility for Johnson & Johnson’s finance, investor relations, information technology, and procurement function. He served as Johnson & Johnson Chief Financial Officer for a decade, prior to which he spent two years as Treasurer of the corporation and over ten years leading various Johnson & Johnson operating companies.
Mr. Darretta received a B.S. in Economics from Villanova University.
Myra R. Drucker
Born 1948, Trustee since 2004
Ms. Drucker is Chair of the Board of Trustees of Commonfund (a not-for-profit firm specializing in managing assets for educational endowments and foundations), Vice Chair of the Board of Trustees of Sarah Lawrence College, and a member of the Investment Committee of the Kresge Foundation (a charitable trust). She is also a Director of New York Stock Exchange LLC (a wholly-owned subsidiary of NYSE Euronext), and a Director of Interactive Data Corporation (a provider of financial market data and analytics to financial institutions and investors).
Ms. Drucker is an ex-officio member of the New York Stock Exchange (NYSE) Pension Managers Advisory Committee, having served as Chair for seven years. She serves as an advisor to RCM Capital Management (an investment management firm) and to the Employee Benefits Investment Committee of The Boeing Company (an aerospace firm).
From November 2001 until August 2004, Ms. Drucker was Managing Director and a member of the Board of Directors of General Motors Asset Management and Chief Investment Officer of General Motors Trust Bank. From December 1992 to November 2001, Ms. Drucker served as Chief Investment Officer of Xerox Corporation (a document company). Prior to December 1992, Ms. Drucker was Staff Vice President and Director of Trust Investments for International Paper (a paper and packaging company).
Ms. Drucker received a B.A. degree in Literature and Psychology from Sarah Lawrence College and pursued graduate studies in economics, statistics, and portfolio theory at Temple University.
Charles E. Haldeman, Jr.*
Born 1948, Trustee since 2004 and President of the Funds since 2007
Mr. Haldeman is Chairman of Putnam Investment Management, LLC and President of the Putnam Funds. Prior to July 2008, he was President and Chief Executive Officer of Putnam, LLC (“Putnam Investments”). Prior to November 2003, Mr. Haldeman served as Co-Head of Putnam Investments’ Investment Division.
Prior to joining Putnam in 2002, he held executive positions in the investment management industry. He previously served as Chief Executive Officer of Delaware Investments and President and Chief Operating Officer of United Asset Management. Mr. Haldeman was also a
54
Partner and Director of Cooke & Bieler, Inc. (an investment management firm).
Mr. Haldeman currently serves on the Board of Governors of the Investment Company Institute and as Chair of the Board of Trustees of Dartmouth College. He also serves on the Partners HealthCare Investment Committee, the Tuck School of Business Overseers, and the Harvard Business School Board of Dean’s Advisors. He is a graduate of Dartmouth College, Harvard Law School, and Harvard Business School. Mr. Haldeman is also a Chartered Financial Analyst (CFA) charterholder.
John A. Hill
Born 1942, Trustee since 1985 and Chairman since 2000
Mr. Hill is founder and Vice-Chairman of First Reserve Corporation, the leading private equity buyout firm specializing in the worldwide energy industry, with offices in Greenwich, Connecticut; Houston, Texas; London, England; and Shanghai, China. The firm’s investments on behalf of some of the nation’s largest pension and endowment funds are currently concentrated in 26 companies with annual revenues in excess of $13 billion, which employ over 100,000 people in 23 countries.
Mr. Hill is Chairman of the Board of Trustees of the Putnam Mutual Funds, a Director of Devon Energy Corporation and various private companies owned by First Reserve, and serves as a Trustee of Sarah Lawrence College where he chairs the Investment Committee.
Prior to forming First Reserve in 1983, Mr. Hill served as President of F. Eberstadt and Company, an investment banking and investment management firm. Between 1969 and 1976, Mr. Hill held various senior positions in Washington, D.C. with the federal government, including Deputy Associate Director of the Office of Management and Budget and Deputy Administrator of the Federal Energy Administration during the Ford Administration.
Born and raised in Midland, Texas, he received his B.A. in Economics from Southern Methodist University and pursued graduate studies as a Woodrow Wilson Fellow.
Paul L. Joskow
Born 1947, Trustee since 1997
Dr. Joskow is an economist and President of the Alfred P. Sloan Foundation (a philanthropic institution focused primarily on research and education on issues related to science, technology, and economic performance). He is on leave from his position as the Elizabeth and James Killian Professor of Economics and Management at the Mas-sachusetts Institute of Technology (MIT), where he has been on the faculty since 1972. Dr. Joskow was the Director of the Center for Energy and Environmental Policy Research at MIT from 1999 through 2007.
Dr. Joskow serves as a Trustee of Yale University, as a Director of TransCanada Corporation (an energy company focused on natural gas transmission and power services) and of Exelon Corporation (an energy company focused on power services), and as a member of the Board of Overseers of the Boston Symphony Orchestra. Prior to August 2007, he served as a Director of National Grid (a UK-based holding company with interests in electric and gas transmission and distribution and telecommunications infrastructure). Prior to July 2006, he served as President of the Yale University Council and continues to serve as a member of the Council. Prior to February 2005, he served on the board of the Whitehead Institute for Biomedical Research (a non-profit research institution). Prior to February 2002, he was a Director of State Farm Indemnity Company (an automobile insurance company), and prior to March 2000, he was a Director of New England Electric System (a public utility holding comp any).
Dr. Joskow has published six books and numerous articles on industrial organization, government regulation of industry, and competition policy. He is active in industry restructuring, environmental, energy, competition, and privatization policies — serving as an advisor to governments and corporations worldwide. Dr. Joskow holds a Ph.D. and MPhil from Yale University and a B.A. from Cornell University.
Elizabeth T. Kennan
Born 1938, Trustee since 1992
Dr. Kennan is a Partner of Cambus-Kenneth Farm (thoroughbred horse and cattle breeding). She is President Emeritus of Mount Holyoke College.
Dr. Kennan served as Chairman and is now Lead Director of Northeast Utilities. She is a Trustee of the National Trust for Historic Preservation, of Centre College, and of Midway College in Midway, Kentucky. Until 2006, she was a member of The Trustees of Reservations. Prior to 2001, Dr. Kennan served on the oversight committee of the Folger Shakespeare Library. Prior to June 2005, she was a Director of Talbots, Inc., and she has served as Director on a number of other boards, including Bell Atlantic, Chastain Real Estate, Shawmut Bank, Berkshire Life Insurance, and Kentucky Home Life Insurance. Dr. Kennan has also served as President of Five Colleges Incorporated and as a Trustee of Notre Dame University, and is active in various educational and civic associations.
As a member of the faculty of Catholic University for twelve years, until 1978, Dr. Kennan directed the post-doctoral program in Patristic and Medieval Studies, taught history, and published numerous articles and two books. Dr. Kennan holds a Ph.D. from the University of Washington in Seattle, an M.S. from St. Hilda’s College at Oxford University, and an A.B. from Mount Holyoke College. She holds several honorary doctorates.
Kenneth R. Leibler
Born 1949, Trustee since 2006
Mr. Leibler is a founder and former Chairman of the Boston Options Exchange, an electronic marketplace for the trading of derivative securities.
Mr. Leibler currently serves as a Trustee of Beth Israel Deaconess Hospital in Boston. He is also Lead Director of Ruder Finn Group, a global communications and advertising firm, and a Director of Northeast Utilities, which operates New England’s largest energy delivery system. Prior to December 2006, he served as a Director of the Optimum Funds group. Prior to October 2006, he served as a Director of ISO New England, the
55
organization responsible for the operation of the electric generation system in the New England states. Prior to 2000, Mr. Leibler was a Director of the Investment Company Institute in Washington, D.C.
Prior to January 2005, Mr. Leibler served as Chairman and Chief Executive Officer of the Boston Stock Exchange. Prior to January 2000, he served as President and Chief Executive Officer of Liberty Financial Companies, a publicly traded diversified asset management organization. Prior to June 1990, Mr. Leibler served as President and Chief Operating Officer of the American Stock Exchange (AMEX), and at the time was the youngest person in AMEX history to hold the title of President. Prior to serving as AMEX President, he held the position of Chief Financial Officer, and headed its management and marketing operations. Mr. Leibler graduated magna cum laude with a degree in Economics from Syracuse University, where he was elected Phi Beta Kappa.
Robert E. Patterson
Born 1945, Trustee since 1984
Mr. Patterson is Senior Partner of Cabot Properties, LP and Chairman of Cabot Properties, Inc. (a private equity firm investing in commercial real estate).
Mr. Patterson serves as Chairman Emeritus and Trustee of the Joslin Diabetes Center. Prior to June 2003, he was a Trustee of Sea Education Association. Prior to December 2001, Mr. Patterson was President and Trustee of Cabot Industrial Trust (a publicly traded real estate investment trust). Prior to February 1998, he was Executive Vice President and Director of Acquisitions of Cabot Partners Limited Partnership (a registered investment adviser involved in institutional real estate investments). Prior to 1990, he served as Executive Vice President of Cabot, Cabot & Forbes Realty Advisors, Inc. (the predecessor company of Cabot Partners).
Mr. Patterson practiced law and held various positions in state government, and was the founding Executive Director of the Massachusetts Industrial Finance Agency. Mr. Patterson is a graduate of Harvard College and Harvard Law School.
George Putnam, III
Born 1951, Trustee since 1984
Mr. Putnam is Chairman of New Generation Research, Inc. (a publisher of financial advisory and other research services), and President of New Generation Advisers, Inc. (a registered investment adviser to private funds). Mr. Putnam founded the New Generation companies in 1986.
Mr. Putnam is a Director of The Boston Family Office, LLC (a registered investment adviser). He is a Trustee of St. Mark’s School and a Trustee of the Marine Biological Laboratory in Woods Hole, Massachusetts. Until 2006, he was a Trustee of Shore Country Day School, and until 2002, was a Trustee of the Sea Education Association.
Mr. Putnam previously worked as an attorney with the law firm of Dechert LLP (formerly known as Dechert Price & Rhoads) in Philadelphia. He is a graduate of Harvard College, Harvard Business School, and Harvard Law School.
Robert L. Reynolds*
Born 1952, Trustee since 2008
Mr. Reynolds is President and Chief Executive Officer of Putnam Investments, and a member of Putnam Investments’ Executive Board of Directors. He has more than 30 years of investment and financial services experience.
Prior to joining Putnam Investments in 2008, Mr. Reynolds was Vice Chairman and Chief Operating Officer of Fidelity Investments from 2000 to 2007. During this time, he served on the Board of Directors for FMR Corporation, Fidelity Investments Insurance Ltd., Fidelity Investments Canada Ltd., and Fidelity Management Trust Company. He was also a Trustee of the Fidelity Family of Funds. From 1984 to 2000, Mr. Reynolds served in a number of increasingly responsible leadership roles at Fidelity.
Mr. Reynolds serves on several not-for-profit boards, including those of the West Virginia University Foundation, Concord Museum, Dana-Farber Cancer Institute, Lahey Clinic, and Initiative for a Competitive Inner City in Boston. He is a member of the Chief Executives Club of Boston, the National Innovation Initiative, and the Council on Competitiveness.
Mr. Reynolds received a B.S. in Business Administration/Finance from West Virginia University.
Richard B.Worley
Born 1945, Trustee since 2004
Mr. Worley is Managing Partner of Permit Capital LLC, an investment management firm.
Mr. Worley serves as a Trustee of the University of Pennsylvania Medical Center, The Robert Wood Johnson Foundation (a philanthropic organization devoted to health-care issues), and the National Constitution Center. He is also a Director of The Colonial Williamsburg Foundation (a historical preservation organization), and the Philadelphia Orchestra Association. Mr. Worley also serves on the investment committees of Mount Holyoke College and World Wildlife Fund (a wildlife conservation organization).
Prior to joining Permit Capital LLC in 2002, Mr. Worley served as President, Chief Executive Officer, and Chief Investment Officer of Morgan Stanley Dean Witter Investment Management and as a Managing Director of Morgan Stanley, a financial services firm. Mr. Worley also was the Chairman of Miller Anderson & Sherrerd, an investment management firm that was acquired by Morgan Stanley in 1996.
Mr. Worley holds a B.S. degree from the University of Tennessee and pursued graduate studies in economics at the University of Texas.
The address of each Trustee is One Post Office Square, Boston, MA 02109.
As of October 31, 2008, there were 99 Putnam funds. All Trustees serve as Trustees of all Putnam funds. Each Trustee serves for an indefinite term, until his or her resignation, retirement at age 72, death, or removal.
* Trustee who is an “interested person” (as defined in the Investment Company Act of 1940) of the fund, Putnam Management, and/or Putnam Retail Management. Mr. Reynolds is President and Chief Executive Officer of Putnam Investments. Mr. Haldeman is the President of your fund and each of the other Putnam funds and Chairman of Putnam Investment Management, LLC, and prior to July 2008 was President and Chief Executive Officer of Putnam Investments.
56
Officers
In addition to Charles E. Haldeman, Jr., the other officers of the fund are shown below:
| | |
| Charles E. Porter (Born 1938) | James P. Pappas (Born 1953) | Wanda M. McManus (Born 1947) |
| Executive Vice President, Principal Executive | Vice President | Vice President, Senior Associate Treasurer |
| Officer, Associate Treasurer, and | Since 2004 | and Assistant Clerk |
| Compliance Liaison | Managing Director, Putnam Investments and | Since 2005 |
| Since 1989 | Putnam Management. During 2002, Chief | Senior Associate Treasurer/Assistant Clerk |
| | Operating Officer, Atalanta/Sosnoff | of Funds |
| Jonathan S. Horwitz (Born 1955) | Management Corporation | |
| Senior Vice President and Treasurer | | |
| Since 2004 | Francis J. McNamara, III (Born 1955) | Nancy E. Florek (Born 1957) |
| Prior to 2004, Managing Director, | Vice President and Chief Legal Officer | Vice President and Chief Legal Officer |
| Putnam Investments | Since 2004 | Treasurer and Proxy Manager |
| Senior Managing Director, Putnam | Since 2005 |
| Steven D. Krichmar (Born 1958) | Investments, Putnam Management | Manager, Mutual Fund Proxy Voting |
| Vice President and Principal Financial Officer | and Putnam Retail Management. Prior | |
| Since 2002 | to 2004, General Counsel, State Street | |
| Senior Managing Director, | Research & Management Company | |
| Putnam Investments | | |
| Robert R. Leveille (Born 1969) | |
| Janet C. Smith (Born 1965) | Vice President and Chief Compliance Officer | |
| Vice President, Principal Accounting Officer | Since 2007 | |
| and Assistant Treasurer | Managing Director, Putnam Investments, | |
| Since 2007 | Putnam Management, and Putnam Retail | |
| Managing Director, Putnam Investments and | Management. Prior to 2004, member of | |
| Putnam Management | Bell Boyd & Lloyd LLC. Prior to 2003, | |
| Vice President and Senior Counsel, | |
| Susan G. Malloy (Born 1957) | Liberty Funds Group LLC | |
| Vice President and Assistant Treasurer | | |
| Since 2007 | Mark C. Trenchard (Born 1962) | |
| Managing Director, Putnam Investments | Vice President and BSA Compliance Officer | |
| Since 2002 | |
| Beth S. Mazor (Born 1958) | Managing Director, Putnam Investments | |
| Vice President | | |
| Since 2002 | Judith Cohen (Born 1945) | |
| Managing Director, Putnam Investments | Vice President, Clerk and Assistant Treasurer | |
| Since 1993 | |
| |
The address of each Officer is One Post Office Square, Boston, MA 02109.
57
The Putnam Family of Funds
The following is a list of Putnam’s open-end mutual funds offered to the public. Investors should carefully consider the investment objective, risks, charges, and expenses of a fund before investing. For a prospectus containing this and other information for any Putnam fund or product, call your financial advisor at 1-800-225-1581 and ask for a prospectus. Please read the prospectus carefully before investing.
Growth funds
Discovery Growth Fund
Growth Opportunities Fund
Health Sciences Trust
International New Opportunities Fund*
New Opportunities Fund
OTC & Emerging Growth Fund
Small Cap Growth Fund*
Vista Fund
Voyager Fund
Blend funds
Capital Appreciation Fund
Capital Opportunities Fund*
Europe Equity Fund*
Global Equity Fund*
Global Natural Resources Fund*
International Capital Opportunities Fund*
International Equity Fund*
Investors Fund
Research Fund
Tax Smart Equity Fund®
Utilities Growth and Income Fund
Value funds
Classic Equity Fund
Convertible Income-Growth Trust
Equity Income Fund
The George Putnam Fund of Boston
The Putnam Fund for Growth and Income
International Growth and Income Fund*
Mid Cap Value Fund
New Value Fund
Small Cap Value Fund*
Income funds
American Government Income Fund
Diversified Income Trust
Floating Rate Income Fund
Global Income Trust*
High Yield Advantage Fund*
High Yield Trust*
Income Fund
Money Market Fund†
U.S. Government Income Trust
Tax-free income funds
AMT-Free Insured Municipal Fund
Tax Exempt Income Fund
Tax Exempt Money Market Fund†
Tax-Free High Yield Fund
State tax-free income funds:
Arizona, California, Massachusetts, Michigan, Minnesota, New Jersey, New York, Ohio, and Pennsylvania
Asset allocation funds
Income Strategies Fund
Putnam Asset Allocation Funds — three investment portfolios that spread your money across a variety of stocks, bonds, and money market investments.
The three portfolios:
Asset Allocation: Balanced Portfolio
Asset Allocation: Conservative Portfolio
Asset Allocation: Growth Portfolio
Putnam RetirementReady® Funds
Putnam RetirementReady Funds — 10 investment portfolios that offer diversification among stocks, bonds, and money market instruments and adjust to become more conservative over time based on a target date for withdrawing assets.
The 10 funds:
Putnam RetirementReady 2050 Fund
Putnam RetirementReady 2045 Fund
Putnam RetirementReady 2040 Fund
Putnam RetirementReady 2035 Fund
Putnam RetirementReady 2030 Fund
Putnam RetirementReady 2025 Fund
Putnam RetirementReady 2020 Fund
Putnam RetirementReady 2015 Fund
Putnam RetirementReady 2010 Fund
Putnam RetirementReady Maturity Fund
* A 1% redemption fee on total assets redeemed or exchanged within 90 days of purchase may be imposed for all share classes of these funds.
†An investment in a money market fund is not insured or guaranteed by the Federal Deposit Insurance Corporation or any other government agency. Although the fund seeks to preserve the value of your investment at $1.00 per share, it is possible to lose money by investing in the fund.
With the exception of money market funds, a 1% redemption fee may be applied to shares exchanged or sold within 7 days of purchase (90 days, for certain funds).
Check your account balances and the most recent month-end performance in the Individual Investors section at www.putnam.com.
58
Services for shareholders
Investor services
Systematic investment plan Tell us how much you wish to invest regularly — weekly, semimonthly, or monthly — and the amount you choose will be transferred automatically from your checking or savings account. There’s no additional fee for this service, and you can suspend it at any time. This plan may be a great way to save for college expenses or to plan for your retirement.
Please note that regular investing does not guarantee a profit or protect against loss in a declining market. Before arranging a systematic investment plan, consider your financial ability to continue making purchases in periods when prices are low.
Systematic exchange You can make regular transfers from one Putnam fund to another Putnam fund. There are no additional fees for this service, and you can cancel or change your options at any time.
Dividends PLUS You can choose to have the dividend distributions from one of your Putnam funds automatically reinvested in another Putnam fund at no additional charge.
Free exchange privilege You can exchange money between Putnam funds free of charge, as long as they are the same class of shares. A signature guarantee is required if you are exchanging more than $500,000.
Reinstatement privilege If you’ve sold Putnam shares or received a check for a dividend or capital gain, you may reinvest the proceeds with Putnam within 90 days of the transaction and they will be reinvested at the fund’s current net asset value —with no sales charge. However, reinstatement of class B shares may have special tax consequences. Ask your financial or tax representative for details.
Check-writing service You have ready access to many Putnam accounts. It’s as simple as writing a check, and there are no special fees or service charges. For more information about the check-writing service, call Putnam or visit our Web site.
Dollar cost averaging When you’re investing for long-term goals, it’s time, not timing, that counts. Investing on a systematic basis is a better strategy than trying to figure out when the markets will go up or down. This means investing the same amount of money regularly over a long period. This method of investing is called dollar cost averaging. When a fund’s share price declines, your investment dollars buy more shares at lower prices. When it increases, they buy fewer shares. Over time, you will pay a lower average price per share.
For more information
Visit the Individual Investors section at www.putnam.com
A secure section of our Web site contains complete information on your account, including balances and transactions, updated daily. You may also conduct transactions, such as exchanges, additional investments, and address changes. Log on today to get your password.
Call us toll free at 1-800-225-1581 Ask a helpful Putnam representative or your financial advisor for details about any of these or other services, or see your prospectus.
59
Putnam puts your interests first
Putnam has introduced a number of voluntary initiatives designed to reduce fund expenses, provide investors with more useful information, and help safeguard the interests of all Putnam investors. Visit the Individual Investors section at www.putnam.com for details.
Cost-cutting initiatives
Ongoing expenses will be limited Through calendar 2008, total ongoing expenses, including management fees for all funds, will be maintained at or below the average of each fund’s industry peers in its Lipper load-fund universe. For more information, please see the Statement of Additional information.
Lower class B purchase limit To help ensure that investors are in the most cost-effective share class, the maximum amount that can be invested in class B shares has been reduced to $100,000. (Larger trades or accumulated amounts will be refused.)
Improved disclosure
Putnam fund prospectuses and shareholder reports have been revised to disclose additional information that will help shareholders compare funds and weigh their costs and risks along with their potential benefits. Shareholders will find easy-to-understand information about fund expense ratios, portfolio manager compensation, risk comparisons, turnover comparisons, brokerage commissions, and employee and trustee ownership of Putnam funds. Disclosure of breakpoint discounts has also been enhanced to alert investors to potential cost savings.
Protecting investors’ interests
Short-term trading fee introduced To discourage short-term trading, which can interfere with a fund’s long-term strategy, a 1% short-term trading fee may be imposed on any Putnam fund shares (other than money market funds) redeemed or exchanged within 7 calendar days of purchase (for certain funds, this fee applies for 90 days).
60
Fund information
Founded over 70 years ago, Putnam Investments was built around the concept that a balance between risk and reward is the hallmark of a well-rounded financial program. We manage nearly 100 mutual funds in growth, value, blend, fixed income, and international.
| | |
| Investment Manager | Officers | Wanda M. McManus |
| Putnam Investment | Charles E. Haldeman, Jr. | Vice President, Senior Associate Treasurer |
| Management, LLC | President | and Assistant Clerk |
| One Post Office Square | | |
| Boston, MA 02109 | Charles E. Porter | Nancy E. Florek |
| Executive Vice President, Principal | Vice President, Assistant Clerk, |
| Marketing Services | Executive Officer, Associate Treasurer | Assistant Treasurer and Proxy Manager |
| Putnam Retail Management | and Compliance Liaison | |
| One Post Office Square |
| Boston, MA 02109 | Jonathan S. Horwitz | |
| | Senior Vice President and Treasurer | |
| Custodian | | |
| State Street Bank and Trust Company | Steven D. Krichmar | |
| Vice President and Principal Financial Officer | |
| Legal Counsel | | |
| Ropes & Gray LLP | Janet C. Smith | |
| Vice President, Principal Accounting Officer | |
| Independent Registered Public | and Assistant Treasurer | |
| Accounting Firm | | |
| KPMG LLP | Susan G. Malloy | |
| Vice President and Assistant Treasurer | |
| Trustees | | |
| John A. Hill, Chairman | Beth S. Mazor | |
| Jameson A. Baxter, Vice Chairman | Vice President | |
| Charles B. Curtis | | |
| Robert J. Darretta | James P. Pappas | |
| Myra R. Drucker | Vice President | |
| Charles E. Haldeman, Jr. | | |
| Paul L. Joskow | Francis J. McNamara, III | |
| Elizabeth T. Kennan | Vice President and Chief Legal Officer | |
| Kenneth R. Leibler | | |
| Robert E. Patterson | Robert R. Leveille | |
| George Putnam, III | Vice President and Chief Compliance Officer | |
| Robert L. Reynolds | | |
| Richard B. Worley | Mark C. Trenchard | |
| Vice President and BSA Compliance Officer | |
| |
| Judith Cohen | |
| Vice President, Clerk and Assistant Treasurer | |
| | |
This report is for the information of shareholders of Putnam Income Fund. It may also be used as sales literature when preceded or accompanied by the current prospectus, the most recent copy of Putnam’s Quarterly Performance Summary, and Putnam’s Quarterly Ranking Summary. For more recent performance, please visit www.putnam.com. Investors should carefully consider the investment objective, risks, charges, and expenses of a fund, which are described in its prospectus. For this and other information or to request a prospectus, call 1-800-225-1581 toll free. Please read the prospectus carefully before investing. The fund’s Statement of Additional Information contains additional information about the fund’s Trustees and is available without charge upon request by calling 1-800-225-1581.

Item 2. Code of Ethics:
(a) The fund’s principal executive, financial and accounting officers are employees of Putnam Investment Management, LLC, the Fund's investment manager. As such they are subject to a comprehensive Code of Ethics adopted and administered by Putnam Investments which is designed to protect the interests of the firm and its clients. The Fund has adopted a Code of Ethics which incorporates the Code of Ethics of Putnam Investments with respect to all of its officers and Trustees who are employees of Putnam Investment Management, LLC. For this reason, the Fund has not adopted a separate code of ethics governing its principal executive, financial and accounting officers.
(c) In May 2008, the Code of Ethics of Putnam Investment Management, LLC was updated in its entirety to include the amendments adopted in August 2007 as well as a several additional technical, administrative and non-substantive changes.
Item 3. Audit Committee Financial Expert:
The Funds' Audit and Compliance Committee is comprised solely of Trustees who are "independent" (as such term has been defined by the Securities and Exchange Commission ("SEC") in regulations implementing Section 407 of the Sarbanes-Oxley Act (the "Regulations")). The Trustees believe that each of the members of the Audit and Compliance Committee also possess a combination of knowledge and experience with respect to financial accounting matters, as well as other attributes, that qualify them for service on the Committee. In addition, the Trustees have determined that each of Mr. Patterson, Mr. Leibler, Mr. Hill and Mr. Darretta meets the financial literacy requirements of the New York Stock Exchange's rules and qualifies as an "audit committee financial expert" (as such term has been defined by the Regulations) based on their review of his pertinent experience and education. Certain other Trustees, although not on the Audit and Compliance Committee, would also quali fy as "audit committee financial experts." The SEC has stated that the designation or identification of a person as an audit committee financial expert pursuant to this Item 3 of Form N-CSR does not impose on such person any duties, obligations or liability that are greater than the duties, obligations and liability imposed on such person as a member of the Audit and Compliance Committee and the Board of Trustees in the absence of such designation or identification.
Item 4. Principal Accountant Fees and Services:
The following table presents fees billed in each of the last two fiscal years for services rendered to the fund by the fund’s independent auditor:
| | | | |
| Fiscal | | Audit- | | |
| year | Audit | Related | Tax | All Other |
| ended | Fees | Fees | Fees | Fees |
|
| October 31, 2008 | $100,675 | $-- | $6,000 | $- |
|
| October 31, 2007 | $93,178 | $-- | $5,450 | $ - |
|
For the fiscal years ended October 31, 2008 and October 31, 2007, the fund’s independent auditor billed aggregate non-audit fees in the amounts of $ 74,733 and $5,450 respectively, to the fund, Putnam Management and any entity controlling, controlled by or under common control with Putnam Management that provides ongoing services to the fund.
Audit Fees represent fees billed for the fund's last two fiscal years relating to the audit and review of the financial statements included in annual reports and registration statements, and other
services that are normally provided in connection with statutory and regulatory filings or engagements.
Audit-Related Fees represent fees billed in the fund’s last two fiscal years for services traditionally performed by the fund’s auditor, including accounting consultation for proposed transactions or concerning financial accounting and reporting standards and other audit or attest services not required by statute or regulation.
Tax Fees represent fees billed in the fund’s last two fiscal years for tax compliance, tax planning and tax advice services. Tax planning and tax advice services include assistance with tax audits, employee benefit plans and requests for rulings or technical advice from taxing authorities.
Pre-Approval Policies of the Audit and Compliance Committee. The Audit and Compliance Committee of the Putnam funds has determined that, as a matter of policy, all work performed for the funds by the funds’ independent auditors will be pre-approved by the Committee itself and thus will generally not be subject to pre-approval procedures.
The Audit and Compliance Committee also has adopted a policy to pre-approve the engagement by Putnam Management and certain of its affiliates of the funds’ independent auditors, even in circumstances where pre-approval is not required by applicable law. Any such requests by Putnam Management or certain of its affiliates are typically submitted in writing to the Committee and explain, among other things, the nature of the proposed engagement, the estimated fees, and why this work should be performed by that particular audit firm as opposed to another one. In reviewing such requests, the Committee considers, among other things, whether the provision of such services by the audit firm are compatible with the independence of the audit firm.
The following table presents fees billed by the fund’s independent auditor for services required to be approved pursuant to paragraph (c)(7)(ii) of Rule 2-01 of Regulation S-X.
| | | | |
| Fiscal | Audit- | | All | Total |
| year | Related | Tax | Other | Non-Audit |
| ended | Fees | Fees | Fees | Fees |
|
| October 31, 2008 | $ - | $ - | $ - | $ - |
|
| October 31, 2007 | $ - | $ - | $ - | $ - |
|
Item 5. Audit Committee of Listed Registrants
Not applicable
Item 6. Schedule of Investments:
The registrant’s schedule of investments in unaffiliated issuers is included in the report to shareholders in Item 1 above.
Item 7. Disclosure of Proxy Voting Policies and Procedures For Closed-End Management Investment Companies:
Not applicable
Item 8. Portfolio Managers of Closed-End Investment Companies
Not Applicable
Item 9. Purchases of Equity Securities by Closed-End Management Investment Companies and Affiliated Purchasers:
Not applicable
Item 10. Submission of Matters to a Vote of Security Holders: Not applicable Item 11. Controls and Procedures:
(a) The registrant's principal executive officer and principal financial officer have concluded, based on their evaluation of the effectiveness of the design and operation of the registrant's disclosure controls and procedures as of a date within 90 days of the filing date of this report, that the design and operation of such procedures are generally effective to provide reasonable assurance that information required to be disclosed by the registrant in this report is recorded, processed, summarized and reported within the time periods specified in the Commission's rules and forms.
(b) Changes in internal control over financial reporting: Not applicable
Item 12. Exhibits:
(a)(1) The Code of Ethics of The Putnam Funds, which incorporates the Code of Ethics of Putnam Investments, is filed herewith.
(a)(2) Separate certifications for the principal executive officer and principal financial officer of the registrant as required by Rule 30a-2(a) under the Investment Company Act of 1940, as amended, are filed herewith.
(b) The certifications required by Rule 30a-2(b) under the Investment Company Act of 1940, as amended, are filed herewith.
SIGNATURES
Pursuant to the requirements of the Securities Exchange Act of 1934 and the Investment Company Act of 1940, the registrant has duly caused this report to be signed on its behalf by the undersigned, thereunto duly authorized.
Putnam Income Fund
By (Signature and Title):
/s/Janet C. Smith
Janet C. Smith
Principal Accounting Officer
Date: December 29, 2008
Pursuant to the requirements of the Securities Exchange Act of 1934 and the Investment Company Act of 1940, this report has been signed below by the following persons on behalf of the registrant and in the capacities and on the dates indicated.
By (Signature and Title):
/s/Charles E. Porter
Charles E. Porter
Principal Executive Officer
Date: December 29, 2008
By (Signature and Title):
/s/Steven D. Krichmar
Steven D. Krichmar
Principal Financial Officer
Date: December 29, 2008