UNITED STATES
SECURITIES AND EXCHANGE COMMISSION
Washington, D.C. 20549
FORM N-CSR
CERTIFIED SHAREHOLDER REPORT OF REGISTERED
MANAGEMENT INVESTMENT COMPANIES
Investment Company Act file number: (811-00653 )
Exact name of registrant as specified in charter: Putnam Income Fund
Address of principal executive offices: One Post Office Square, Boston, Massachusetts 02109
| Name and address of agent for service: | Beth S. Mazor, Vice President |
| | One Post Office Square |
| | Boston, Massachusetts 02109 |
| |
| Copy to: | John W. Gerstmayr, Esq. |
| | Ropes & Gray LLP |
| | One International Place |
| | Boston, Massachusetts 02110 |
Registrant’s telephone number, including area code: (617) 292-1000
Date of fiscal year end: October 31, 2007
Date of reporting period: November 1, 2006— April 30, 2007
Item 1. Report to Stockholders:
The following is a copy of the report transmitted to stockholders pursuant to Rule 30e-1 under the Investment Company Act of 1940:

What makes Putnam different?

In 1830, Massachusetts Supreme Judicial Court Justice Samuel Putnam established The Prudent Man Rule, a legal foundation for responsible money management.
THE PRUDENT MAN RULE
All that can be required of a trustee to invest is that he shall conduct himself faithfully and exercise a sound discretion. He is to observe how men of prudence, discretion, and intelligence manage their own affairs, not in regard to speculation, but in regard to the permanent disposition of their funds, considering the probable income, as well as the probable safety of the capital to be invested.

A time-honored tradition in money management
Since 1937, our values have been rooted in a profound sense of responsibility for the money entrusted to us.
A prudent approach to investing
We use a research-driven team approach to seek consistent, dependable, superior investment results over time, although there is no guarantee a fund will meet its objectives.
Funds for every investment goal
We offer a broad range of mutual funds and other financial products so investors and their financial representatives can build diversified portfolios.
A commitment to doing what’s right for investors
We have below-average expenses and stringent investor protections, and provide a wealth of information about the Putnam funds.
Industry-leading service
We help investors, along with their financial representatives, make informed investment decisions with confidence.
Putnam
Income
Fund
4| 30| 07
Semiannual Report |
| Message from the Trustees | 2 |
| About the fund | 4 |
| Report from the fund managers | 7 |
| Performance | 14 |
| Expenses | 17 |
| Portfolio turnover | 19 |
| Risk | 20 |
| Your fund’s management | 21 |
| Terms and definitions | 24 |
| Trustee approval of management contract | 26 |
| Other information for shareholders | 32 |
| Financial statements | 33 |
Cover photograph: © Richard H. Johnson
| Message from the Trustees |
Dear Fellow Shareholder
Reflecting investor uncertainty about the outlook for the U.S. economy, volatility in the financial markets has been on the rise: after a downturn in March, the Dow Jones Industrial Average recently reached new record-high levels. However, it remains to be seen whether the current levels are sustainable. From our perspective, we are encouraged by recent indications of moderate inflation, a low unemployment rate, and a rebound in manufacturing. We consequently believe the resilience of the U.S. economy will enable it to weather this period of uncertainty.
As we communicated in proxy materials recently mailed to all Putnam fund shareholders, on February 1, 2007, Marsh & McLennan Companies, Inc. announced that it had signed a definitive agreement to sell its ownership interest in Putnam Investments Trust, the parent company of Putnam Management and its affiliates, to Great-West Lifeco Inc. Great-West Lifeco is a financial services holding company with operations in Canada, the United States, and Europe and is a member of the Power Financial Corporation group of companies. We are pleased to announce that in mid-May, shareholders voted overwhelmingly in favor of the proposed transaction. While it is still subject to regulatory approvals and other conditions, we currently expect the transaction to be completed in the middle of the year.
We would also like to take this opportunity to announce that Putnam President and Chief Executive Officer Ed Haldeman, one of your fund’s Trustees since 2004, has been named President of the Funds, assuming this role from George Putnam, III. This change will enable George Putnam to become an independent Trustee of the funds upon completion of the transaction with Great-West Lifeco. Both George and Ed will continue serving on the Board of Trustees in our collective role of overseeing the Putnam funds on your behalf.
2
In the following pages, members of your fund’s management team discuss the fund’s performance and strategies for the fiscal period ended April 30, 2007, and provide their outlook for the months ahead. As always, we thank you for your support of the Putnam funds.

Putnam Income Fund: seeking high current income
across a broad range of fixed-income securities |

Over Putnam Income Fund’s 50-year history, the bond landscape has undergone a dramatic transformation. One-third of the U.S. investment-grade sector, the fund’s primary focus, is now composed of “securitized” debt instruments, including mortgage- and asset-backed securities. The high-yield corporate bond sector, which was established in the late 1970s, has also grown significantly and is now considered a mature asset class. And outside the United States, there are new opportunities to invest in the debt of developed and emerging-market countries.
Amid this evolution of the fixed-income markets, the investment objective of Putnam Income Fund has remained constant. In a letter to Putnam shareholders in 1963, George Putnam, Jr. (who is currently Chairman Emeritus of the Trustees of the Putnam Funds), expressed it this way: “We have in mind those people who need a liberal current return…” Mr. Putnam’s choice of “current return” rather than “current income” captures the investment philosophy of the team managing your fund today: that high current income should be pursued within a total return context, and that risk management is as important as yield in maintaining a high current income stream.
Successful investing in today’s global bond market requires broad expertise. Putnam’s 100-member fixed-income group is divided into teams of specialists who focus on varied investment opportunities. Each team identifies compelling opportunities within its area of expertise. Your fund’s management team selects from among these opportunities, systematically building a diversified portfolio that carefully balances risk and return.
Mutual funds that invest in bonds are subject to certain risks, including interest-rate risk, credit risk, and inflation risk. As interest rates rise, the prices of bonds fall. Long-term bonds are more exposed to interest-rate risk than short-term bonds. Unlike bonds, bond funds have ongoing fees and expenses. Lower-rated bonds may offer higher yields in return for more risk. Mutual funds that invest in government securities are not guaranteed. Mortgage-backed securities are subject to prepayment risk. The use of derivatives involves special risks and may result in losses.
Key fixed-income return sources
Government: Interest-rate levels are a primary driver of government bond performance. Generally, bond prices decline when interest rates rise, and rise when interest rates fall. Interest rates —and bond yields — rise and fall according to investor expectations about the overall health of the economy.
Credit: Corporate bond performance tends to track the health of the overall economy more closely than other bonds. These bonds are less sensitive to interest-rate movements; they tend to perform well when the economy strengthens, often in spite of the higher rates that accompany stronger growth.
Securitized: Interest-rate cycles also affect mortgage- and asset-backed securities (MBSs/ABSs). Because MBSs are the securitized cash flows of mortgages, prepayment rates are another consideration. For ABSs, managers monitor the credit quality of the underlying assets, which comprise the securitized cash flow of anything from credit card debt to manufactured housing debt.
Optimizing the risk/return trade-off across multiple sectors
Putnam believes that building a diversified portfolio with multiple income-generating strategies is the best way to pursue your fund’s objectives. The fund’s portfolio is composed of a broad spectrum of government, credit, and securitized debt instruments.
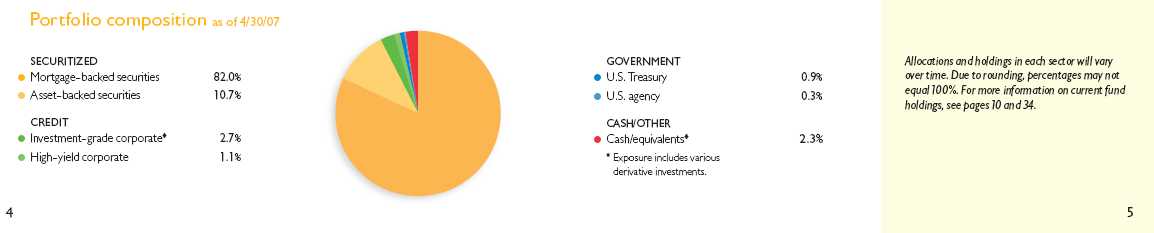
Putnam Income Fund seeks high current income consistent with what Putnam Management believes to be a prudent level of risk. The fund invests in a diversified portfolio composed mainly of corporate bonds, U.S. government and agency bonds, and securitized debt.
• For the six months ended April 30, 2007, Putnam Income Fund’s class A shares had a total return of 2.84% before sales charges.
• The fund’s benchmark, the Lehman Aggregate Bond Index, returned 2.64% .
• The average return for the fund’s Lipper category, Corporate Debt Funds A Rated, was 2.49% .
• Additional fund performance, comparative performance, and Lipper data can be found in the performance section beginning on page 14.
Total return for class A shares for periods ended 4/30/07
Since the fund’s inception (11/1/54), average annual return is 7.93% before sales charge and 7.85% after sales charge.
| | Average annual return | Cumulative return |
|
| | Before sales charge | After sales charge | Before sales charge | After sales charge |
| 10 years | 5.01% | 4.61% | 63.10% | 56.97% |
|
| 5 years | 4.69 | 3.91 | 25.78 | 21.13 |
|
| 3 years | 4.12 | 2.81 | 12.88 | 8.66 |
|
| 1 year | 7.23 | 3.17 | 7.23 | 3.17 |
|
| 6 months | — | — | 2.84 | –0.98 |
|
Current performance may be lower or higher than the quoted past performance, which cannot guarantee future results. Share price, principal value, and return will fluctuate, and you may have a gain or a loss when you sell your shares. Performance of class A shares assumes reinvestment of distributions and does not account for taxes. After sales charge returns reflect a maximum 3.75% load. For a portion of the periods, this fund may have limited expenses, without which returns would have been lower. A 1% short-term trading fee may apply. To obtain the most recent month-end performance, visit www.putnam.com.
6
| Report from the fund managers |
The period in review
Amid mixed signals about the direction of U.S. economic growth, investment-grade bonds recorded modest gains over the past six months. Your fund’s performance before sales charges was in line with its benchmark and edged slightly ahead of the average for its Lipper group. Performance benefited from our defensive, or short, duration strategy amid rising interest rates in late 2006 and early 2007. The fund’s holdings in the securitized sector also contributed positively to returns, particularly holdings of commercial mortgage-backed securities (CMBSs) and holdings of asset-backed securities (ABSs) in the manufactured housing sector. Compared with its benchmark, the fund was underweighted in corporate bonds and dollar-based emerging-market debt, both of which continued to rally despite what we see as stretched valuations by many measures. Although holdings in these sectors performed well, the underweighting detracted from results.
Market overview
Expectations that the Federal Reserve’s (the Fed’s) next major move would be to cut interest rates helped fuel a modest rally in the U.S. investment-grade bond market during the six months ended April 30, 2007. Although the Fed held the federal funds rate steady at 5.25% throughout the period, investors’ hopes for a rate cut were focused on a statement accompanying the March rate decision that assigned equal probabilities to the Fed raising or lowering rates in coming months. This neutral stance replaced a former bias to raising rates.
Economic data on the health of the U.S. economy were mixed during the period. Although the 2.5% fourth-quarter GDP growth rate was slightly more robust than the third quarter’s pace, a softening housing sector and a buildup of inventories across industries slowed the pace of the economy somewhat during the first quarter of calendar 2007. Weighing in on the positive side, unemployment remained low and consumer confidence high even after the latter slid modestly toward the end of the period. Although higher than in
the previous year, the level of volatility in the bond market stayed within what we consider normal parameters.
Corporate bonds were the top-performing investment-grade sector, reflecting solid demand from foreign investors and underwriters of structured credit products (e.g., collateralized debt obligations or CDOs). Lower-quality issues outperformed higher-quality issues due to investors’ desire for yield and greater tolerance of risk. MBSs outperformed comparable Treasury and agency bonds during the period. Thirty-year MBSs outperformed 15-year securities, which are generally considered more conservative. Lower-coupon MBSs outpaced those with higher coupons, and the best performers were those with 5.5% coupons. Government National Mortgage Association (Ginnie Mae) certificates jockeyed for position with Federal National Mortgage Association (Fannie Mae) certificates during the period with Fannie Maes outpacing Ginnie Maes overall. Despite weakness in the home equity sector caused by concerns in the subprime mortgage market, ABSs also finished ahead of Treasuries for the period, as strength in the manufactured housing sector offset other weaknesses. Agency bonds also outperformed Treasuries.
Strategy overview
Your fund employs multiple income-generating strategies across the different U.S. investment-grade bond sectors in
Market sector performance
These indexes provide an overview of performance in different market sectors for the six months ended 4/30/07.
| Bonds | |
|
| Lehman Aggregate Bond Index (broad bond market) | 2.64% |
|
| Lehman Global Aggregate Bond Index (international bonds) | 3.54% |
|
| Lehman Government Bond Index (U.S. Treasury and agency securities) | 2.27% |
|
| Lehman GNMA Index (Government National Mortgage Association bonds) | 2.82% |
| |
| Equities | |
|
| S&P 500 Index (broad stock market) | 8.60% |
|
| Russell 2000 Growth Index (small-company growth stocks) | 7.42% |
|
| Russell 2000 Value Index (small-company value stocks) | 6.36% |
| |
8
pursuit of its objectives. We believe that having diversified return sources contributes to more consistent results over time and enables us to manage risk more effectively than focusing on one sector of the market. Generally, our investment decisions involve the following considerations: duration management, yield-curve positioning, sector allocation, and security selection.
In anticipation of continued rising interest rates, we maintained a short duration profile for the fund in late 2006 and early 2007. This strategy helped performance relative to the fund’s Lipper peer group, as rates rose during this period. A shift to a neutral duration position in February 2007 also proved timely as rates fell toward the end of the semiannual period. Duration, which is measured in years, is the primary indicator of interest-rate sensitivity. The shorter a bond’s duration, the less sensitive its price will be to interest-rate changes.
The impact of the fund’s yield-curve positioning strategy was positive for the period. We had expected the yield curve — a graphical representation of the difference in yields between shorter- and longer-term bonds — to steepen during the period and had positioned the portfolio to take advantage of it. Steepening refers to the widening of this difference in yield. It may occur as a result of a rise in yields of longer-term securities; a fall in yields of shorter-term securities; or when longer- and shorter-term securities
Comparison of top sector weightings
This chart shows how the fund’s top sector weightings have changed over the last six months. Weightings are shown as a percentage of net assets. Holdings will vary over time.

9
rise or fall at the same time, but at differing rates. As the yield curve did steepen modestly late in the period, the fund’s relative performance benefited from this strategy.
In terms of sector and security considerations, we have sought to reduce the level of credit risk in the portfolio by reducing exposure to corporate and emerging-market debt. (Credit risk is the risk that a bond issuer could default and fail to pay interest and repay principal in a timely manner.) As interest rates rise, it becomes more expensive for issuers to borrow money. Increased interest-rate expenses are particularly burdensome for highly leveraged companies or economies. While we expect this strategy to prove rewarding over the long term, it detracted from results during the period, as these sectors outperformed. An underweight to the agency sector also detracted from relative results. Nevertheless, these negatives were more than offset by the fund’s successful strategies in the securitized sector.
Your fund’s holdings
Portfolio holdings from the securitized bond sector were the strongest contributors to the fund’s performance during the period. This fast-growing sector is now among the largest within the investment-grade bond universe. The most common securitized bonds are MBSs issued by Fannie Mae and
Credit qualities shown as a percentage of portfolio value as of 4/30/07. A bond rated Baa or higher is considered investment grade. The chart reflects Moody’s ratings; percentages may include bonds not rated by Moody’s but considered by Putnam Management to be of comparable quality. Ratings will vary over time.

10
Ginnie Mae. Relative to the benchmark, the fund had an underweight position in this segment of the securi-tized debt market, known as agency debt, which detracted from results during the period. Agency debt has continued to benefit from strong demand from Asian banks. The fund’s moderate exposure to this sector is based on our belief that this demand will taper off, particularly if dollar weakness persists.
Other types of securitized bonds include ABSs, which are backed by subprime home loans, loans on manufactured housing, and credit card payments, and CMBSs, which are backed by loans on large commercial real estate projects, such as office parks and shopping malls.
CMBSs were an area of particular focus as we sought to replace the credit risk of corporate bonds with the more diversified credit exposure. Securitized bonds typically offer higher income than corporate bonds of comparable credit quality. Another reason for favoring CMBSs versus corporates was their valuation. The yield spreads on investment-grade corporate bonds versus Treasuries — one means of evaluating the price of corporates on a relative basis —have been at historically low levels. This means that corporates have become expensive relative to other investment-grade sectors. Based on this measure, we believed that there was greater downside risk in owning corporate bonds and opted to limit the fund’s exposure.
However, prices of corporate bonds continued to rise, and your fund’s underweight position (relative to the benchmark) hurt results.
Strong performance from CMBS holdings, which benefited from continued improvements in underlying loan performance, helped offset the negative effects of the corporate bond underweighting. In addition, security selection among the corporate bonds the fund did own proved successful. For example, overweight positions in shorter-duration Ba-rated corporate bonds issued by General Motors Acceptance Corporation and Ford Motor Credit Company performed particularly well, bolstering relative results.
Another bright spot within the securi-tized bond sector was our emphasis on ABSs backed by manufactured housing. With losses and delinquencies at relatively low levels, manufactured housing ABSs were the strongest performers in the sector. Another benefit of ABSs is that they generally have shorter maturities, which provides us with the flexibility to shift to other fixed-income securities should interest rates rise.
Hybrid adjustable rate mortgages (ARMs) contributed positively to fund results. Hybrid ARMs typically offer borrowers three or five years of payments at a fixed interest rate, after which they become adjustable interest-rate mortgages for which the interest rate is adjusted yearly (3/1 and 5/1 ARMs). According to our analysis, many of these securities have been offering yields that
11
more than compensate for the level of risk they represent. Therefore, they contribute to an attractive risk/return profile for the fund.
The fund was also underweighted in dollar-based emerging-market debt (EMD), compared to its benchmark. This detracted from relative performance, as this segment of the market continued to perform well. Rising commodity prices are helping to create positive fundamentals for issuers of emerging-market debt. However, after its recent prolonged period of strong performance, we had a more cautious outlook with regard to this segment of the market, so the fund did not benefit from its strength to the same extent as many of its peers.
Please note that the holdings discussed in this report may not have been held by the fund for the entire period. Portfolio composition is subject to review in accordance with the fund’s investment strategy and may vary in the future.
12
| The outlook for your fund |
The following commentary reflects anticipated developments that could affect your fund over the next six months, as well as your management team’s plans for responding to them.
As the fund began the second half of its fiscal year, markets reflected investor expectations of about a 0.25% cut in the federal funds rate by calendar year-end. We think this is overly optimistic. Global economic growth remains strong, providing a buoyantly supportive environment for U.S. economic activity. Meanwhile, inflation has persistently hovered above the Fed’s target ceiling. Without the emergence of a stumbling block to the domestic economy such as a severe housing-related credit crunch, we believe U.S. rates will likely remain level in coming months, and are as likely to end the year above as below today’s levels.
Accordingly, we expect to continue positioning the fund conservatively. To minimize exposure to fluctuating rates, we are keeping duration neutral; to protect against potential market-adverse events, such as a sudden spike in inflation or greater fallout from subprime lending woes, we continue to favor select segments of the securitized sector over the investment-grade corporate bond sector. The yield advantages offered by bonds from certain higher-risk sectors increased modestly in February and early March, in reaction to subprime worries. However, since then, yield spreads have narrowed to levels that, in our view, do not adequately compensate investors for the bonds’ higher risks. We continue to favor short-maturity, high-quality structured credit securities such as CMBSs and manufactured housing ABSs over pass-through MBSs and corporate issues.
We believe that prices of hybrid ARMs may benefit from their recent inclusion in the Lehman Mortgage Index, and we anticipate that the fund’s position in these securities will contribute to overall returns. As always, we strive to position the fund to take advantage of attractive opportunities without assuming undue risk.
The views expressed in this report are exclusively those of Putnam Management. They are not meant as investment advice.
Mutual funds that invest in bonds are subject to certain risks, including interest-rate risk, credit risk, and inflation risk. As interest rates rise, the prices of bonds fall. Long-term bonds are more exposed to interest-rate risk than short-term bonds. Unlike bonds, bond funds have ongoing fees and expenses. Lower-rated bonds may offer higher yields in return for more risk. Mutual funds that invest in government securities are not guaranteed. Mortgage-backed securities are subject to prepayment risk. The use of derivatives involves special risks and may result in losses.
13
This section shows your fund’s performance for periods ended April 30, 2007, the end of the first half of its current fiscal year. In accordance with regulatory requirements for mutual funds, we also include performance as of the most recent calendar quarter-end and expense information taken from the fund’s current prospectus. Performance should always be considered in light of a fund’s investment strategy. Data represents past performance. Past performance does not guarantee future results. More recent returns may be less or more than those shown. Investment return and principal value will fluctuate, and you may have a gain or a loss when you sell your shares. For the most recent month-end performance, please visit www.putnam.com or call Putnam at 1-800-225-1581. Class Y shares are generally only available to corporate and institutional clients and clients in other approved programs. See the Terms and Definitions section in this report for definition s of the share classes offered by your fund.
Fund performance
Total return for periods ended 4/30/07
| | Class A | | Class B | | Class C | | Class M | | Class R | Class Y |
| (inception dates) | (11/1/54) | | (3/1/93) | | (7/26/99) | | (12/14/94) | | (1/21/03) | (6/16/94) |
| | NAV | POP | NAV | CDSC | NAV | CDSC | NAV | POP | NAV | NAV |
|
| Annual average | | | | | | | | | | |
| (life of fund) | 7.93% | 7.85% | 6.94% | 6.94% | 7.12% | 7.12% | 7.48% | 7.41% | 7.67% | 8.00% |
|
| 10 years | 63.10 | 56.97 | 51.52 | 51.52 | 51.17 | 51.17 | 59.33 | 54.17 | 59.27 | 67.24 |
| Annual average | 5.01 | 4.61 | 4.24 | 4.24 | 4.22 | 4.22 | 4.77 | 4.42 | 4.76 | 5.28 |
|
| 5 years | 25.78 | 21.13 | 21.27 | 19.27 | 21.11 | 21.11 | 24.23 | 20.13 | 24.35 | 27.37 |
| Annual average | 4.69 | 3.91 | 3.93 | 3.59 | 3.90 | 3.90 | 4.43 | 3.74 | 4.45 | 4.96 |
|
| 3 years | 12.88 | 8.66 | 10.42 | 7.42 | 10.26 | 10.26 | 12.17 | 8.57 | 12.12 | 13.71 |
| Annual average | 4.12 | 2.81 | 3.36 | 2.41 | 3.31 | 3.31 | 3.90 | 2.78 | 3.89 | 4.38 |
|
| 1 year | 7.23 | 3.17 | 6.45 | 1.45 | 6.29 | 5.29 | 6.94 | 3.46 | 6.88 | 7.41 |
|
| 6 months | 2.84 | –0.98 | 2.47 | –2.53 | 2.32 | 1.31 | 2.61 | –0.67 | 2.60 | 2.92 |
|
Current performance may be lower or higher than the quoted past performance, which cannot guarantee future results. After sales charge returns (public offering price, or POP) for class A and M shares reflect a maximum 3.75% and 3.25% load, respectively. Class B share returns reflect the applicable contingent deferred sales charge (CDSC), which is 5% in the first year, declining to 1% in the sixth year, and is eliminated thereafter. Class C shares reflect a 1% CDSC for the first year and is eliminated thereafter. Class R and Y shares have no initial sales charge or CDSC. Performance for class B, C, M, R, and Y shares before their inception is derived from the historical performance of class A shares, adjusted for the applicable sales charge (or CDSC) and, except for class Y shares, the higher operating expenses for such shares.
For a portion of the periods, this fund may have limited expenses, without which returns would have been lower.
A 1% short-term trading fee may be applied to shares exchanged or sold within 7 days of purchase.
14
Comparative index returns
For periods ended 4/30/07
| | | Lipper Corporate |
| | Lehman Aggregate | Debt Funds A Rated |
| | Bond Index | category average† |
|
| Annual average | | |
| (life of fund) | —* | —* |
|
| 10 years | 85.16% | 75.17% |
| Annual average | 6.35 | 5.75 |
|
| 5 years | 28.01 | 27.25 |
| Annual average | 5.06 | 4.92 |
|
| 3 years | 13.80 | 12.56 |
| Annual average | 4.40 | 4.02 |
|
| 1 year | 7.36 | 6.96 |
|
| 6 months | 2.64 | 2.49 |
|
Index and Lipper results should be compared to fund performance at net asset value.
* The benchmark and the Lipper category were not in existence at the time of the fund’s inception. The Lehman Aggregate Bond Index commenced 12/31/75. The Lipper category commenced 12/31/59.
† Over the 6-month, 1-year, 3-year, 5-year, and 10-year periods ended 4/30/07, there were 174, 174, 158, 117, and 61 funds, respectively, in this Lipper category.
Fund performance as of most recent calendar quarter
Total return for periods ended 3/31/07
| | Class A | | Class B | | Class C | | Class M | | Class R | Class Y |
| (inception dates) | (11/1/54) | | (3/1/93) | | (7/26/99) | | (12/14/94) | | (1/21/03) | (6/16/94) |
| | NAV | POP | NAV | CDSC | NAV | CDSC | NAV | POP | NAV | NAV |
|
| Annual average | | | | | | | | | | |
| (life of fund) | 7.94% | 7.86% | 6.94% | 6.94% | 7.13% | 7.13% | 7.48% | 7.41% | 7.67% | 8.00% |
|
| 10 years | 64.52 | 58.28 | 52.85 | 52.85 | 52.76 | 52.76 | 60.72 | 55.48 | 60.90 | 68.68 |
| Annual average | 5.10 | 4.70 | 4.33 | 4.33 | 4.33 | 4.33 | 4.86 | 4.51 | 4.87 | 5.37 |
|
| 5 years | 27.44 | 22.66 | 22.87 | 20.87 | 22.89 | 22.89 | 25.87 | 21.85 | 26.18 | 29.05 |
| Annual average | 4.97 | 4.17 | 4.21 | 3.86 | 4.21 | 4.21 | 4.71 | 4.03 | 4.76 | 5.23 |
|
| 3 years | 9.41 | 5.29 | 7.16 | 4.21 | 7.17 | 7.17 | 8.69 | 5.14 | 8.83 | 10.24 |
| Annual average | 3.04 | 1.73 | 2.33 | 1.38 | 2.34 | 2.34 | 2.82 | 1.68 | 2.86 | 3.30 |
|
| 1 year | 6.21 | 2.22 | 5.60 | 0.59 | 5.60 | 4.60 | 6.08 | 2.64 | 6.18 | 6.56 |
|
| 6 months | 2.83 | –1.00 | 2.62 | –2.38 | 2.61 | 1.61 | 2.75 | –0.54 | 2.89 | 3.06 |
|
15
Fund price and distribution information
For the six-month period ended 4/30/07
| Distributions* | Class A | Class B | Class C | Class M | Class R | Class Y |
|
| Number | 6 | 6 | 6 | 6 | 6 | 6 |
|
| Income | $0.159 | $0.134 | $0.134 | $0.152 | $0.153 | $0.166 |
|
| Capital gains | — | — | — | — | — | — |
|
| Total | $0.159 | $0.134 | $0.134 | $0.152 | $0.153 | $0.166 |
| |
| Share value: | NAV | POP | NAV | NAV | NAV | POP | NAV | NAV |
|
| 10/31/06 | $6.74 | $7.00 | $6.70 | $6.72 | $6.67 | $6.89 | $6.74 | $6.79 |
|
| 4/30/07 | 6.77 | 7.03 | 6.73 | 6.74 | 6.69 | 6.91 | 6.76 | 6.82 |
|
| Current yield | | | | | | |
| (end of period) | | | | | | |
|
| Current | | | | | | |
| dividend rate1 | 4.79% | 4.61% | 4.10% | 4.09% | 4.66% | 4.52% | 4.62% | 4.93% |
|
| Current 30-day | | | | | | |
| SEC yield2,3 | | | | | | |
| (with expense | | | | | | |
| limitation) | 4.81 | 4.63 | 4.05 | 4.06 | 4.56 | 4.41 | 4.56 | 5.06 |
|
| Current 30-day | | | | | | |
| SEC yield3 | | | | | | |
| (without | | | | | | |
| expense | | | | | | |
| limitation) | 4.71 | 4.54 | 3.95 | 3.96 | 4.46 | 4.32 | 4.46 | 4.96 |
|
* Dividend sources are estimated and may vary based on final tax calculations after the fund’s fiscal year-end.
1 Most recent distribution, excluding capital gains, annualized and divided by NAV or POP at end of period.
2 For a portion of the period, this fund limited expenses, without which yields would have been lower.
3 Based only on investment income, calculated using SEC guidelines.
Fund’s annual operating expenses
For the fiscal year ended 10/31/06
| | Class A | Class B | Class C | Class M | Class R | Class Y |
|
| Net expenses* | 1.02% | 1.77% | 1.77% | 1.27% | 1.27% | 0.77% |
|
| Total annual fund | | | | | | |
| operating expenses | 1.05 | 1.80 | 1.80 | 1.30 | 1.30 | 0.80 |
|
* Reflects Putnam Management’s decision to contractually limit expenses through 10/31/07.
Expense information in this table is taken from the most recent prospectus, is subject to change, and may differ from that shown in the next section and in the financial highlights of this report. Expenses are shown as a percentage of fund assets.
16
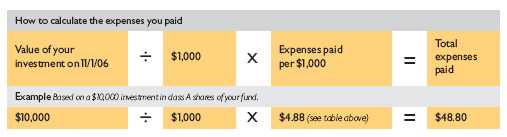
As a mutual fund investor, you pay ongoing expenses, such as management fees, distribution fees (12b-1 fees), and other expenses. In the most recent six-month period, your fund limited these expenses; had it not done so, expenses would have been higher. Using the information below, you can estimate how these expenses affect your investment and compare them with the expenses of other funds. You may also pay one-time transaction expenses, including sales charges (loads) and redemption fees, which are not shown in this section and would have resulted in higher total expenses. For more information, see your fund’s prospectus or talk to your financial advisor.
| Review your fund’s expenses |
The table below shows the expenses you would have paid on a $1,000 investment in Putnam Income Fund from November 1, 2006, to April 30, 2007. It also shows how much a $1,000 investment would be worth at the close of the period, assuming actual returns and expenses.
| | Class A | Class B | Class C | Class M | Class R | Class Y |
|
| Expenses paid per $1,000* | $ 4.88 | $ 8.63 | $ 8.63 | $ 6.13 | $ 6.13 | $ 3.62 |
|
| Ending value (after expenses) | $1,028.40 | $1,024.70 | $1,023.20 | $1,026.10 | $1,026.00 | $1,029.20 |
|
* Expenses for each share class are calculated using the fund’s annualized expense ratio for each class, which represents the ongoing expenses as a percentage of average net assets for the six months ended 4/30/07. The expense ratio may differ for each share class (see the last table in this section). Expenses are calculated by multiplying the expense ratio by the average account value for the period; then multiplying the result by the number of days in the period; and then dividing that result by the number of days in the year.
| Estimate the expenses you paid |
To estimate the ongoing expenses you paid for the six months ended April 30, 2007, use the calculation method below. To find the value of your investment on November 1, 2006, go to www.putnam.com and log on to your account. Click on the “Transaction History” tab in your Daily Statement and enter 11/01/2006 in both the “from” and “to” fields. Alternatively, call Putnam at 1-800-225-1581.
17
Compare expenses using the SEC’s method
The Securities and Exchange Commission (SEC) has established guidelines to help investors assess fund expenses. Per these guidelines, the table below shows your fund’s expenses based on a $1,000 investment, assuming a hypothetical 5% annualized return. You can use this information to compare the ongoing expenses (but not transaction expenses or total costs) of investing in the fund with those of other funds. All mutual fund shareholder reports will provide this information to help you make this comparison. Please note that you cannot use this information to estimate your actual ending account balance and expenses paid during the period.
| | Class A | Class B | Class C | Class M | Class R | Class Y |
|
| Expenses paid per $1,000* | $ 4.86 | $ 8.60 | $ 8.60 | $ 6.11 | $ 6.11 | $ 3.61 |
|
| Ending value (after expenses) | $1,019.98 | $1,016.27 | $1,016.27 | $1,018.74 | $1,018.74 | $1,021.22 |
|
* Expenses for each share class are calculated using the fund’s annualized expense ratio for each class, which represents the ongoing expenses as a percentage of average net assets for the six months ended 4/30/07. The expense ratio may differ for each share class (see the last table in this section). Expenses are calculated by multiplying the expense ratio by the average account value for the period; then multiplying the result by the number of days in the period; and then dividing that result by the number of days in the year.
Compare expenses using industry averages
You can also compare your fund’s expenses with the average of its peer group, as defined by Lipper, an independent fund-rating agency that ranks funds relative to others that Lipper considers to have similar investment styles or objectives. The expense ratio for each share class shown below indicates how much of your fund’s average net assets have been used to pay ongoing expenses during the period.
| | Class A | Class B | Class C | Class M | Class R | Class Y |
|
| Your fund’s annualized | | | | | | |
| expense ratio | 0.97% | 1.72% | 1.72% | 1.22% | 1.22% | 0.72% |
|
| Average annualized expense | | | | | | |
| ratio for Lipper peer group* | 0.98% | 1.73% | 1.73% | 1.23% | 1.23% | 0.73% |
|
* Simple average of the expenses of all front-end load funds in the fund’s Lipper peer group, calculated in accordance with Lipper’s standard method for comparing fund expenses (excluding 12b-1 fees and without giving effect to any expense offset and brokerage service arrangements that may reduce fund expenses). This average reflects each fund’s expenses for its most recent fiscal year available to Lipper as of 3/31/07. To facilitate comparison, Putnam has adjusted this average to reflect the 12b-1 fees carried by each class of shares other than class Y shares, which do not incur 12b-1 fees. The peer group may include funds that are significantly smaller or larger than the fund, which may limit the comparability of the fund’s expenses to the simple average, which typically is higher than the asset-weighted average.
18
Your fund’s
portfolio turnover |
Putnam funds are actively managed by teams of experts who buy and sell securities based on intensive analysis of companies, industries, economies, and markets. Portfolio turnover is a measure of how often a fund’s managers buy and sell securities for your fund. A portfolio turnover of 100%, for example, means that the managers sold and replaced securities valued at 100% of a fund’s assets within a one-year period. Funds with high turnover may be more likely to generate capital gains and dividends that must be distributed to shareholders as taxable income. High turnover may also cause a fund to pay more brokerage commissions and other transaction costs, which may detract from performance.
Funds that invest in bonds or other fixed-income instruments may have higher turnover than funds that invest only in stocks. Short-term bond funds tend to have higher turnover than longer-term bond funds, because shorter-term bonds will mature or be sold more frequently than longer-term bonds. You can use the table below to compare your fund’s turnover with the average turnover for funds in its Lipper category.
Turnover comparisons
Percentage of holdings that change every year
| | 2006 | 2005 | 2004 | 2003 | 2002 |
|
| Putnam Income Fund | 239%* | 300%* | 441% | 251%† | 268%† |
|
| Lipper Corporate Debt Funds | | | | | |
| A Rated category average | 138% | 152% | 163% | 166% | 166% |
|
Turnover data for the fund is calculated based on the fund’s fiscal-year period, which ends on October 31. Turnover data for the fund’s Lipper category is calculated based on the average of the turnover of each fund in the category for its fiscal year ended during the indicated year. Fiscal years vary across funds in the Lipper category, which may limit the comparability of the fund’s portfolio turnover rate to the Lipper average. Comparative data for 2006 is based on information available as of 12/31/06.
| * Portfolio turnover excludes dollar roll transactions. |
† Portfolio turnover excludes certain Treasury note transactions executed in connection with a short-term trading strategy.
19
Your fund’s risk
This risk comparison is designed to help you understand how your fund compares with other funds. The comparison utilizes a risk measure developed by Morningstar, an independent fund-rating agency. This risk measure is referred to as the fund’s Morningstar Risk.
Your fund’s Morningstar® Risk

Your fund’s Morningstar Risk is shown alongside that of the average fund in its Morningstar category. The risk bar broadens the comparison by translating the fund’s Morningstar Risk into a percentile, which is based on the fund’s ranking among all funds rated by Morningstar as of March 31, 2007. A higher Morningstar Risk generally indicates that a fund’s monthly returns have varied more widely.
Morningstar determines a fund’s Morningstar Risk by assessing variations in the fund’s monthly returns — with an emphasis on downside variations — over a 3-year period, if available. Those measures are weighted and averaged to produce the fund’s Morningstar Risk. The information shown is provided for the fund’s class A shares only; information for other classes may vary. Morningstar Risk is based on historical data and does not indicate future results. Morningstar does not purport to measure the risk associated with a current investment in a fund, either on an absolute basis or on a relative basis. Low Morningstar Risk does not mean that you cannot lose money on an investment in a fund. Copyright 2007 Morningstar, Inc. All Rights Reserved. The information contained herein (1) is proprietary to Morningstar and/or its content providers; (2) may not be copied or distributed; and (3) is not warranted to be accurate, complete, or timely. Neither Morningstar nor its content providers are responsible for any damages or losses arising from any use of this information.
20
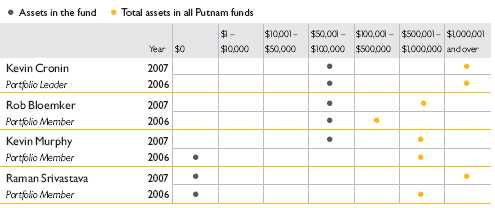
Your fund is managed by the members of the Putnam Core Fixed-Income Team. Kevin Cronin is the Portfolio Leader of the fund. Rob Bloemker, Kevin Murphy, and Raman Srivastava are Portfolio Members. The Portfolio Leader and Portfolio Members coordinate the team’s management of the fund.
For a complete listing of the members of the Putnam Core Fixed-Income Team, including those who are not Portfolio Leaders or Portfolio Members of your fund, visit Putnam’s Individual Investor Web site at www.putnam.com.
Investment team fund ownership
The table below shows how much the fund’s current Portfolio Leader and Portfolio Members have invested in the fund and in all Putnam mutual funds (in dollar ranges). Information shown is as of April 30, 2007, and April 30, 2006.
Trustee and Putnam employee fund ownership
As of April 30, 2007, all of the Trustees of the Putnam funds owned fund shares. The table below shows the approximate value of investments in the fund and all Putnam funds as of that date by the Trustees and Putnam employees. These amounts include investments by the Trustees’ and employees’ immediate family members and investments through retirement and deferred compensation plans.
| | | Total assets in |
| | Assets in the fund | all Putnam funds |
|
| Trustees | $ 206,000 | $ 95,000,000 |
|
| Putnam employees | $3,019,000 | $466,000,000 |
|
21
| Fund manager compensation |
The total 2006 fund manager compensation that is attributable to your fund is approximately $820,000. This amount includes a portion of 2006 compensation paid by Putnam Management to the fund managers listed in this section for their portfolio management responsibilities, calculated based on the fund assets they manage taken as a percentage of the total assets they manage. The compensation amount also includes a portion of the 2006 compensation paid to the Chief Investment Officer of the team and the Group Chief Investment Officer of the fund’s broader investment category for their oversight responsibilities, calculated based on the fund assets they oversee taken as a percentage of the total assets they oversee. This amount does not include compensation of other personnel involved in research, trading, administration, systems, compliance, or fund operations; nor does it include non-compensation costs. These percentages are determined as of the fund’s fisca l period-end. For personnel who joined Putnam Management during or after 2006, the calculation reflects annualized 2006 compensation or an estimate of 2007 compensation, as applicable.
Other Putnam funds managed by the Portfolio Leader and Portfolio Members
Kevin Cronin is also a Portfolio Leader of Putnam American Government Income Fund, Putnam Global Income Trust, Putnam Limited Duration Government Income Fund, and Putnam U.S. Government Income Trust.
Rob Bloemker is also a Portfolio Member of Putnam American Government Income Fund, Putnam Diversified Income Trust, Putnam Limited Duration Government Income Fund, Putnam Master Intermediate Income Trust, Putnam Premier Income Trust, and Putnam U.S. Government Income Trust.
Kevin Murphy is also a Portfolio Member of Putnam Diversified Income Trust, Putnam Master Intermediate Income Trust, Putnam Premier Income Trust, and Putnam Utilities Growth and Income Fund.
Raman Srivastava is also a Portfolio Member of The George Putnam Fund of Boston.
Kevin Cronin, Rob Bloemker, Kevin Murphy, and Raman Srivastava may also manage other accounts and variable trust funds advised by Putnam Management or an affiliate.
Changes in your fund’s Portfolio Leader and Portfolio Members
Your fund’s Portfolio Leader and Portfolio Members did not change during the year ended April 30, 2007.
22
Putnam fund ownership by Putnam’s Executive Board
The table below shows how much the members of Putnam’s Executive Board have invested in all Putnam mutual funds (in dollar ranges). Information shown is as of April 30, 2007, and April 30, 2006.
| | | | $1 – | $10,001 – | $50,001 – | $100,001 – | $500,001 – | $1,000,001 |
| | Year | $0 | $10,000 | $50,000 | $100,000 | $500,000 | $1,000,000 | and over |
|
| Philippe Bibi | 2007 | | | | | | | • |
|
|
| Chief Technology Officer | 2006 | | | | | | | • |
|
| Joshua Brooks | 2007 | | | | | | | • |
|
|
| Deputy Head of Investments | 2006 | | | | | | | • |
|
| William Connolly | 2007 | | | | | | | • |
|
|
| Head of Retail Management | 2006 | | | | | | | • |
|
| Kevin Cronin | 2007 | | | | | | | • |
|
|
| Head of Investments | 2006 | | | | | | | • |
|
| Charles Haldeman, Jr. | 2007 | | | | | | | • |
|
|
| President and CEO | 2006 | | | | | | | • |
|
| Amrit Kanwal | 2007 | | | | | | • | |
|
|
| Chief Financial Officer | 2006 | | | | | | • | |
|
| Steven Krichmar | 2007 | | | | | | | • |
|
|
| Chief of Operations | 2006 | | | | | | • | |
|
| Francis McNamara, III | 2007 | | | | | | | • |
|
|
| General Counsel | 2006 | | | | | | | • |
|
| Jeffrey Peters | 2007 | | | | | | | • |
|
|
| Head of International Business | N/A | | | | | | | |
|
| Richard Robie, III | 2007 | | | | | | • | |
|
|
| Chief Administrative Officer | 2006 | | | | | | • | |
|
| Edward Shadek | 2007 | | | | | | | • |
|
|
| Deputy Head of Investments | 2006 | | | | | | | • |
|
| Sandra Whiston | 2007 | | | | | | | • |
|
|
| Head of Institutional Management | 2006 | | | | | | • | |
|
| |
| N/A indicates the individual was not a member of Putnam’s Executive Board as of 4/30/06. | | | |
23
Total return shows how the value of the fund’s shares changed over time, assuming you held the shares through the entire period and reinvested all distributions in the fund.
Net asset value (NAV) is the price, or value, of one share of a mutual fund, without a sales charge. NAVs fluctuate with market conditions. NAV is calculated by dividing the net assets of each class of shares by the number of outstanding shares in the class.
Public offering price (POP) is the price of a mutual fund share plus the maximum sales charge levied at the time of purchase. POP performance figures shown here assume the 3.75% maximum sales charge for class A shares and 3.25% for class M shares.
Contingent deferred sales charge (CDSC) is generally a charge applied at the time of the redemption of class B or C shares and assumes redemption at the end of the period. Your fund’s class B CDSC declines from a 5% maximum during the first year to 1% during the sixth year. After the sixth year, the CDSC no longer applies. The CDSC for class C shares is 1% for one year after purchase.
Class A shares are generally subject to an initial sales charge and no CDSC (except on certain redemptions of shares bought without an initial sales charge).
Class B shares are not subject to an initial sales charge. They may be subject to a CDSC.
Class C shares are not subject to an initial sales charge and are subject to a CDSC only if the shares are redeemed during the first year.
Class M shares have a lower initial sales charge and a higher 12b-1 fee than class A shares and no CDSC (except on certain redemptions of shares bought without an initial sales charge).
Class R shares are not subject to an initial sales charge or CDSC and are available only to certain defined contribution plans.
Class Y shares are not subject to an initial sales charge or CDSC, and carry no 12b-1 fee. They are only available to eligible purchasers, including eligible defined contribution plans or corporate IRAs.
24
Lehman Aggregate Bond Index is an unmanaged index of U.S. investment-grade fixed-income securities.
Lehman Global Aggregate Bond Index is an unmanaged index of global investment-grade fixed-income securities.
Lehman Government Bond Index is an unmanaged index of U.S. Treasury and agency securities.
Lehman GNMA Index is an unmanaged index of Government National Mortgage Association bonds.
Russell 2000 Growth Index is an unmanaged index of those companies in the small-cap Russell 2000 Index chosen for their growth orientation.
Russell 2000 Value Index is an unmanaged index of those companies in the small-cap Russell 2000 Index chosen for their value orientation.
S&P 500 Index is an unmanaged index of common stock performance.
Indexes assume reinvestment of all distributions and do not account for fees. Securities and performance of a fund and an index will differ. You cannot invest directly in an index.
Lipper is a third-party industry-ranking entity that ranks mutual funds. Its rankings do not reflect sales charges. Lipper rankings are based on total return at net asset value relative to other funds that have similar current investment styles or objectives as determined by Lipper. Lipper may change a fund’s category assignment at its discretion. Lipper category averages reflect performance trends for funds within a category.
25
Trustee approval of
management contract |
The Board of Trustees of the Putnam funds oversees the management of each fund and, as required by law, determines annually whether to approve the continuance of your fund’s management contract with Putnam Management. In this regard, the Board of Trustees, with the assistance of its Contract Committee consisting solely of Trustees who are not “interested persons” (as such term is defined in the Investment Company Act of 1940, as amended) of the Putnam funds (the “Independent Trustees”), requests and evaluates all information it deems reasonably necessary under the circumstances. Over the course of several months ending in June 2006, the Contract Committee met four times to consider the information provided by Putnam Management and other information developed with the assistance of the Board’s independent counsel and independent staff. The Contract Committee reviewed and discussed key aspects of this information with all of the Independe nt Trustees. Upon completion of this review, the Contract Committee recommended, and the Independent Trustees approved, the continuance of your fund’s management contract, effective July 1, 2006.
This approval was based on the following conclusions:
• That the fee schedule in effect for your fund represented reasonable compensation in light of the nature and quality of the services being provided to the fund, the fees paid by competitive funds and the costs incurred by Putnam Management in providing such services, and
• That such fee schedule represented an appropriate sharing between fund shareholders and Putnam Management of such economies of scale as may exist in the management of the fund at current asset levels.
These conclusions were based on a comprehensive consideration of all information provided to the Trustees and were not the result of any single factor. Some of the factors that figured particularly in the Trustees’ deliberations and how the Trustees considered these factors are described below, although individual Trustees may have evaluated the information presented differently, giving different weights to various factors. It is also important to recognize that the fee arrangements for your fund and the other Putnam funds are the result of many years of review and discussion between the Independent Trustees and Putnam Management, that certain aspects of such arrangements may receive greater scrutiny in some years than others, and that the Trustees’ conclusions may be based, in part, on their consideration of these same arrangements in prior years.
26
Management fee schedules and categories; total expenses
The Trustees reviewed the management fee schedules in effect for all Putnam funds, including fee levels and breakpoints, and the assignment of funds to particular fee categories. In reviewing fees and expenses, the Trustees generally focused their attention on material changes in circumstances — for example, changes in a fund’s size or investment style, changes in Putnam Management’s operating costs, or changes in competitive practices in the mutual fund industry —that suggest that consideration of fee changes might be warranted. The Trustees concluded that the circumstances did not warrant changes to the management fee structure of your fund, which had been carefully developed over the years, re-examined on many occasions and adjusted where appropriate. The Trustees focused on two areas of particular interest, as discussed further below:
• Competitiveness. The Trustees reviewed comparative fee and expense information for competitive funds, which indicated that, in a custom peer group of competitive funds selected by Lipper Inc., your fund ranked in the 31st percentile in management fees and in the 24th percentile in total expenses (less any applicable 12b-1 fees) as of December 31, 2005 (the first percentile being the least expensive funds and the 100th percentile being the most expensive funds). (Because the fund’s custom peer group is smaller than the fund’s broad Lipper Inc. peer group, this expense information may differ from the Lipper peer expense information found elsewhere in this report.) The Trustees noted that expense ratios for a number of Putnam funds, which show the percentage of fund assets used to pay for management and administrative services, distribution (12b-1) fees and other expenses, had been increasing recently as a result of declining net assets and the natural operation of fee breakpoints.
The Trustees noted that the expense ratio increases described above were currently being controlled by expense limitations implemented in January 2004 and which Putnam Management, in consultation with the Contract Committee, has committed to maintain at least through 2007. These expense limitations give effect to a commitment by Putnam Management that the expense ratio of each open-end fund would be no higher than the average expense ratio of the competitive funds included in the fund’s relevant Lipper universe (exclusive of any applicable 12b-1 charges in each case). The Trustees observed that this commitment to limit fund expenses has served shareholders well since its inception. In order to ensure that the expenses of the Putnam funds continue to meet evolving competitive standards, the Trustees requested, and Putnam Management agreed, to implement an additional expense limitation for certain funds for the twelve months beginning January 1, 2007 equal to the average expense ratio (exclusive of 12b-1 charges) of a custom peer group of competitive funds selected by Lipper based on the size of the fund. This additional expense limitation will be applied to those open-end funds that had above-average expense ratios (exclusive of 12b-1 charges) based on the Lipper custom peer group data for the period ended December 31, 2005. This additional expense limitation will not be applied to your fund.
27
• Economies of scale. Your fund currently has the benefit of breakpoints in its management fee that provide shareholders with significant economies of scale, which means that the effective management fee rate of a fund (as a percentage of fund assets) declines as a fund grows in size and crosses specified asset thresholds. Conversely, as a fund shrinks in size — as has been the case for many Putnam funds in recent years — these breakpoints result in increasing fee levels. In recent years, the Trustees have examined the operation of the existing breakpoint structure during periods of both growth and decline in asset levels. The Trustees concluded that the fee schedules in effect for the funds represented an appropriate sharing of economies of scale at current asset levels. In reaching this conclusion, the Trustees considered the Contract Committee’s stated intent to continue to work with Putnam Management to plan for an eventual resumption in the growth of assets, including a study of potential economies that might be produced under various growth assumptions.
In connection with their review of the management fees and total expenses of the Putnam funds, the Trustees also reviewed the costs of the services to be provided and profits to be realized by Putnam Management and its affiliates from the relationship with the funds. This information included trends in revenues, expenses and profitability of Putnam Management and its affiliates relating to the investment management and distribution services provided to the funds. In this regard, the Trustees also reviewed an analysis of Putnam Management’s revenues, expenses and profitability with respect to the funds’ management contracts, allocated on a fund-by-fund basis. Because many of the costs incurred by Putnam Management in managing the funds are not readily identifiable to particular funds, the Trustees observed that the methodology for allocating costs is an important factor in evaluating Putnam Management’s costs and profitability, both as to the Putnam funds in the aggregate and as to individual funds. The Trustees reviewed Putnam Management’s cost allocation methodology with the assistance of independent consultants and concluded that this methodology was reasonable and well-considered.
The quality of the investment process provided by Putnam Management represented a major factor in the Trustees’ evaluation of the quality of services provided by Putnam Management under your fund’s management contract. The Trustees were assisted in their review of the Putnam funds’ investment process and performance by the work of the Investment Process Committee of the Trustees and the Investment Oversight Committees of the Trustees, which meet on a regular monthly basis with the funds’ portfolio teams throughout the year. The Trustees concluded that Putnam Management generally provides a high-quality investment process — as measured by the experience and skills of the individuals assigned to the management of fund portfolios, the resources made available to such personnel, and in general the ability of Putnam Management to attract and retain high-quality personnel — but also recognize that this does not guarantee favorable investment results for every fund in every time period.
28
The Trustees considered the investment performance of each fund over multiple time periods and considered information comparing each fund’s performance with various benchmarks and with the performance of competitive funds.
The Trustees noted the satisfactory investment performance of many Putnam funds. They also noted the disappointing investment performance of certain funds in recent years and discussed with senior management of Putnam Management the factors contributing to such underperfor-mance and actions being taken to improve performance. The Trustees recognized that, in recent years, Putnam Management has made significant changes in its investment personnel and processes and in the fund product line to address areas of underperformance. In particular, they noted the important contributions of Putnam Management’s leadership in attracting, retaining and supporting high-quality investment professionals and in systematically implementing an investment process that seeks to merge the best features of fundamental and quantitative analysis. The Trustees indicated their intention to continue to monitor performance trends to assess the effectiveness of these changes and to evaluate whether additional changes to address areas of underperformance are warranted.
In the case of your fund, the Trustees considered that your fund’s class A share cumulative total return performance at net asset value was in the following percentiles of its Lipper Inc. peer group (Lipper Corporate Debt Funds A Rated) for the one-, three- and five-year periods ended March 31, 2006 (the first percentile being the best performing funds and the 100th percentile being the worst performing funds):
| One-year period | Three-year period | Five-year period |
|
| 41st | 44th | 53rd |
(Because of the passage of time, these performance results may differ from the performance results for more recent periods shown elsewhere in this report. Over the one-, three- and five-year periods ended March 31, 2006, there were 180, 153, and 114 funds, respectively, in your fund’s Lipper peer group.* Past performance is no guarantee of future performance.)
As a general matter, the Trustees concluded that cooperative efforts between the Trustees and Putnam Management represent the most effective way to address investment performance problems. The Trustees noted that investors in the Putnam funds have, in effect, placed their trust in the Putnam organization, under the oversight of the funds’ Trustees, to make appropriate decisions regarding the management of the funds. Based on the responsiveness of Putnam Management in the recent past to Trustee concerns about investment performance, the Trustees concluded that it is preferable to seek change within Putnam Management to address performance shortcomings. In the Trustees’ view, the alternative of terminating a
* The percentile rankings for your fund’s class A share annualized total return performance in the Lipper Corporate Debt Funds A Rated category for the one-, five- and ten-year periods ended March 31, 2007, were 41%, 55%, and 91%, respectively. Over the one-, five- and ten-year periods ended March 31, 2007, the fund ranked 69 out of 169, 64 out of 117, and 56 out of 61 funds, respectively. Note that this more recent information was not available when the Trustees approved the continuance of your fund’s management contract.
29
management contract and engaging a new investment adviser for an underperforming fund would entail significant disruptions and would not provide any greater assurance of improved investment performance.
Brokerage and soft-dollar allocations; other benefits
The Trustees considered various potential benefits that Putnam Management may receive in connection with the services it provides under the management contract with your fund. These include benefits related to brokerage and soft-dollar allocations, whereby a portion of the commissions paid by a fund for brokerage may be used to acquire research services that may be useful to Putnam Management in managing the assets of the fund and of other clients. The Trustees indicated their continued intent to monitor the potential benefits associated with the allocation of fund brokerage to ensure that the principle of seeking “best price and execution” remains paramount in the portfolio trading process.
The Trustees’ annual review of your fund’s management contract also included the review of its distributor’s contract and distribution plan with Putnam Retail Management Limited Partnership and the custodian agreement and investor servicing agreement with Putnam Fiduciary Trust Company, all of which provide benefits to affiliates of Putnam Management.
Comparison of retail and institutional fee schedules
The information examined by the Trustees as part of their annual contract review has included for many years information regarding fees charged by Putnam Management and its affiliates to institutional clients such as defined benefit pension plans, college endowments, etc. This information included comparison of such fees with fees charged to the funds, as well as a detailed assessment of the differences in the services provided to these two types of clients. The Trustees observed, in this regard, that the differences in fee rates between institutional clients and the funds are by no means uniform when examined by individual asset sectors, suggesting that differences in the pricing of investment management services to these types of clients reflect to a substantial degree historical competitive forces operating in separate market places. The Trustees considered the fact that fee rates across all asset sectors are higher on average for funds than for institutional clients, as well as the differences between the services that Putnam Management provides to the Putnam funds and those that it provides to institutional clients of the firm, but did not rely on such comparisons to any significant extent in concluding that the management fees paid by your fund are reasonable.
30
Approval of new management and sub-management contracts in connection with pending change in control
As discussed in the “Message from the Trustees” at the beginning of this shareholder report, on February 1, 2007, Marsh & McLennan Companies, Inc. announced that it had signed a definitive agreement to sell its ownership interest in Putnam Investments Trust, the parent company of Putnam Management and its affiliates, to Great-West Lifeco Inc., a member of the Power Financial Corporation group of companies. In mid-May, shareholders voted overwhelmingly in favor of the proposed transaction. While the transaction is still subject to regulatory approvals and other conditions, it is currently expected to be completed by the middle of 2007.
At an in-person meeting on February 8-9, 2007, the Trustees considered the approval of new management contracts for each Putnam fund proposed to become effective upon the closing of the transaction, and the filing of a preliminary proxy statement. At an in-person meeting on March 8-9, 2007, the Trustees considered the approval of the final forms of the proposed new management contracts for each Putnam fund (and, in the case of your fund, the new sub-management contract) and the proxy statement. They reviewed the terms of the proposed new management contracts and the differences between the proposed new management contracts and the current management contracts. They noted that the terms of the proposed new management contracts were substantially identical to the current management contracts, except for certain changes developed at the initiative of the Trustees and designed largely to address inconsistencies among various of the existing contracts, which had been developed and implemented at different times in the past. They noted, in the case of your fund, that the terms of the proposed new sub-management contract were identical to the current sub-management contract, except for the effective date. In considering the approval of the proposed new management contracts (and, in the case of your fund, the new sub-management contract), the Trustees also considered, as discussed further in the proxy statement, various matters relating to the transaction. Finally, in considering the proposed new management contracts (and, in the case of your fund, the new sub-management contract), the Trustees also took into account their deliberations and conclusions (discussed above in the preceding paragraphs of the “Trustee Approval of Management Contract” section) in connection with the most recent annual approval of the continuance of the Putnam funds’ management contracts effective July 1, 2006, and the extensive materials that they had reviewed in connection with that approval process. Based upon the foregoing considerations, on March 9, 2007, the Trustees, including all of the Independent Trustees, unanimously approved the proposed new management contracts (and, in the case of your fund, the new sub-management contract) and determined to recommend their approval to the shareholders of the Putnam funds.
31
Other information
for shareholders |
Important notice regarding delivery of shareholder documents
In accordance with SEC regulations, Putnam sends a single copy of annual and semiannual shareholder reports, prospectuses, and proxy statements to Putnam shareholders who share the same address, unless a shareholder requests otherwise. If you prefer to receive your own copy of these documents, please call Putnam at 1-800-225-1581, and Putnam will begin sending individual copies within 30 days.
Putnam is committed to managing our mutual funds in the best interests of our shareholders. The Putnam funds’ proxy voting guidelines and procedures, as well as information regarding how your fund voted proxies relating to portfolio securities during the 12-month period ended June 30, 2006, are available on the Putnam Individual Investor Web site, www.putnam.com/individual, and on the SEC’s Web site, www.sec.gov. If you have questions about finding forms on the SEC’s Web site, you may call the SEC at 1-800-SEC-0330. You may also obtain the Putnam funds’ proxy voting guidelines and procedures at no charge by calling Putnam’s Shareholder Services at 1-800-225-1581.
The fund will file a complete schedule of its portfolio holdings with the SEC for the first and third quarters of each fiscal year on Form N-Q. Shareholders may obtain the fund’s Forms N-Q on the SEC’s Web site at www.sec.gov. In addition, the fund’s Forms N-Q may be reviewed and copied at the SEC’s Public Reference Room in Washington, D.C. You may call the SEC at 1-800-SEC-0330 for information about the SEC’s Web site or the operation of the Public Reference Room.
32
| A guide to financial statements |
These sections of the report, as well as the accompanying Notes, constitute the fund’s financial statements.
The fund’s portfolio lists all the fund’s investments and their values as of the last day of the reporting period. Holdings are organized by asset type and industry sector, country, or state to show areas of concentration and diversification.
Statement of assets and liabilities shows how the fund’s net assets and share price are determined. All investment and noninvestment assets are added together. Any unpaid expenses and other liabilities are subtracted from this total. The result is divided by the number of shares to determine the net asset value per share, which is calculated separately for each class of shares. (For funds with preferred shares, the amount subtracted from total assets includes the liquidation preference of preferred shares.)
Statement of operations shows the fund’s net investment gain or loss. This is done by first adding up all the fund’s earnings — from dividends and interest income — and subtracting its operating expenses to determine net investment income (or loss). Then, any net gain or loss the fund realized on the sales of its holdings — as well as any unrealized gains or losses over the period — is added to or subtracted from the net investment result to determine the fund’s net gain or loss for the fiscal period.
Statement of changes in net assets shows how the fund’s net assets were affected by the fund’s net investment gain or loss, by distributions to shareholders, and by changes in the number of the fund’s shares. It lists distributions and their sources (net investment income or realized capital gains) over the current reporting period and the most recent fiscal year-end. The distributions listed here may not match the sources listed in the Statement of operations because the distributions are determined on a tax basis and may be paid in a different period from the one in which they were earned. Dividend sources are estimated at the time of declaration. Actual results may vary. Any non-taxable return of capital cannot be determined until final tax calculations are completed after the end of the fund’s fiscal year.
Financial highlights provide an overview of the fund’s investment results, per-share distributions, expense ratios, net investment income ratios, and portfolio turnover in one summary table, reflecting the five most recent reporting periods. In a semiannual report, the highlight table also includes the current reporting period.
33
The fund’s portfolio 4/30/07 (Unaudited)
| U.S. GOVERNMENT AND AGENCY MORTGAGE OBLIGATIONS (75.7%)* | | |
|
| | | Principal amount | | Value |
|
| U.S. Government Guaranteed Mortgage Obligations (0.4%) | | | | |
| Government National Mortgage Association Graduated | | | | |
| Payment Mortgages 11s, with due dates from March 15, 2010 to | | | | |
| August 15, 2010 | $ | 7,085 | $ | 7,569 |
| Government National Mortgage Association | | | | |
| Pass-Through Certificates 6 1/2s, TBA, May 1, 2037 | | 8,000,000 | | 8,214,375 |
| | | | | 8,221,944 |
|
| |
| U.S. Government Agency Mortgage Obligations (75.3%) | | | | |
| Federal Home Loan Mortgage Corporation | | | | |
| Pass-Through Certificates | | | | |
| 7 1/2s, with a due date of December 1, 2029 | | 32,424 | | 33,796 |
| 7s, January 1, 2015 | | 36,986 | | 38,344 |
| 6 1/2s, TBA, May 1, 2037 | | 1,600,000 | | 1,634,250 |
| 6s, with due dates from September 1, 2021 to June 1, 2034 | | 110,868 | | 112,563 |
| 5 1/2s, with due dates from December 1, 2034 to July 1, 2035 | | 2,730,187 | | 2,704,012 |
| 5 1/2s, April 1, 2020 | | 225,284 | | 225,865 |
| 5 1/2s, TBA, May 1, 2037 | | 32,600,000 | | 32,230,704 |
| 5s, TBA, May 1, 2037 | | 211,100,000 | | 204,024,857 |
| 4 1/2s, TBA, May 1, 2037 | | 7,300,000 | | 6,871,125 |
| Federal National Mortgage Association Graduated Payment | | | | |
| Mortgages 8s, December 1, 2008 | | 46,628 | | 46,905 |
| Federal National Mortgage Association Pass-Through Certificates | | | | |
| 11s, October 1, 2015 | | 11,618 | | 12,635 |
| 9s, with due dates from January 1, 2027 to July 1, 2032 | | 358,231 | | 390,875 |
| 8s, with due dates from January 1, 2025 to July 1, 2033 | | 1,301,136 | | 1,360,184 |
| 7 1/2s, with due dates from September 1, 2022 to July 1, 2033 | | 799,033 | | 831,384 |
| 7s, with due dates from August 1, 2021 to December 1, 2035 | | 4,804,294 | | 5,024,161 |
| 7s, with due dates from November 1, 2007 to | | | | |
| September 1, 2017 | | 866,202 | | 894,040 |
| 6 1/2s, October 1, 2034 | | 40,264 | | 41,371 |
| 6 1/2s, with due dates from September 1, 2010 to | | | | |
| February 1, 2019 | | 174,821 | | 179,063 |
| 6s, with due dates from December 1, 2021 to | | | | |
| December 1, 2036 | | 13,946,463 | | 14,168,501 |
| 6s, with due dates from August 1, 2008 to November 1, 2021 | | 408,504,792 | | 415,228,377 |
| 6s, TBA, May 1, 2037 | | 76,100,000 | | 76,670,750 |
| 6s, TBA, May 1, 2022 | | 13,000,000 | | 13,210,235 |
| 5 1/2s, with due dates from October 1, 2036 to April 1, 2037 | | 12,150,678 | | 12,017,611 |
| 5 1/2s, with due dates from November 1, 2011 to | | | | |
| February 1, 2021 | | 1,749,657 | | 1,755,226 |
| 5 1/2s, TBA, May 1, 2037 | | 349,400,000 | | 345,496,538 |
| 5 1/2s, TBA, June 1, 2036 | | 313,700,000 | | 310,134,109 |
| 5s, with due dates from January 1, 2034 to June 1, 2036 | | 73,642,411 | | 71,246,857 |
| 5s, with due dates from June 1, 2019 to April 1, 2021 | | 58,438 | | 57,631 |
| 4 1/2s, with due dates from September 1, 2020 to | | | | |
| September 1, 2035 | | 12,199,644 | | 11,802,484 |
34
| U.S. GOVERNMENT AND AGENCY MORTGAGE OBLIGATIONS (75.7%)* continued | | |
|
| | | Principal amount | | Value |
|
| Federal National Mortgage Association Pass-Through Certificates | | | | |
| 4 1/2s, with due dates from July 1, 2020 to August 1, 2020 | $ | 5,721,232 | $ | 5,545,795 |
| 4 1/2s, TBA, May 1, 2022 | | 305,800,000 | | 296,076,508 |
| 4s, with due dates from May 1, 2019 to August 1, 2020 | | 877,221 | | 830,242 |
| 4s, TBA, May 1, 2022 | | 5,900,000 | | 5,572,734 |
| | | | | 1,836,469,732 |
|
| |
| Total U.S. government and agency mortgage obligations (cost $1,843,535,481) | $ | 1,844,691,676 |
|
| |
| |
| U.S. GOVERNMENT AGENCY OBLIGATIONS (0.3%)* (cost $7,058,250) | | |
|
| | | Principal amount | | Value |
|
| Fannie Mae 6s, May 15, 2011 | $ | 6,800,000 | $ | 7,090,461 |
|
| |
| |
| U.S. TREASURY OBLIGATIONS (0.9%)* | | | | |
|
| | | Principal amount | | Value |
|
| U.S. Treasury Bonds 7 1/4s, August 15, 2022 | $ | 5,200,000 | $ | 6,530,062 |
| U.S. Treasury Notes | | | | |
| 5 1/8s, June 30, 2011 | | 8,300,000 | | 8,491,938 |
| 4 7/8s, May 31, 2008 | | 7,800,000 | | 7,798,782 |
|
| Total U.S. treasury obligations (cost $22,745,225) | | | $ | 22,820,782 |
| |
| |
| |
| COLLATERALIZED MORTGAGE OBLIGATIONS (37.1%)* | | | | |
|
| | | Principal amount | | Value |
|
| AMP CMBS 144A FRB Ser. 06-1A, Class A, 6.105s, 2047 | | | | |
| (Cayman Islands) | $ | 2,520,000 | $ | 2,520,000 |
| Amresco Commercial Mortgage Funding I 144A | | | | |
| Ser. 97-C1, Class G, 7s, 2029 | | 1,092,828 | | 1,092,828 |
| Ser. 97-C1, Class H, 7s, 2029 | | 815,000 | | 812,943 |
| Asset Securitization Corp. | | | | |
| Ser. 96-MD6, Class A7, 8.147s, 2029 | | 2,827,000 | | 3,040,334 |
| FRB Ser. 97-D5, Class A5, 6.875s, 2043 | | 300,000 | | 325,445 |
| Banc of America Commercial Mortgage, Inc. | | | | |
| Ser. 06-2, Class A4, 5.93s, 2045 | | 8,419,000 | | 8,716,393 |
| Ser. 06-4, Class A4, 5.634s, 2046 | | 4,180,000 | | 4,259,783 |
| Ser. 06-5, Class A4, 5.414s, 2047 | | 4,948,000 | | 4,965,374 |
| FRB Ser. 05-1, Class A5, 4.98s, 2042 | | 163,000 | | 162,413 |
| Ser. 07-1, Class XW, IO (Interest only), 0.466s, 2049 | | 19,196,989 | | 456,746 |
| Ser. 06-1, Class XC, IO, 0.054s, 2045 | | 112,974,366 | | 813,842 |
| Banc of America Commercial Mortgage, Inc. 144A | | | | |
| Ser. 01-PB1, Class K, 6.15s, 2035 | | 880,000 | | 905,361 |
| Ser. 02-PB2, Class XC, IO, 0.187s, 2035 | | 51,866,884 | | 972,504 |
| Ser. 05-1, Class XW, IO, 0.157s, 2042 | | 224,661,739 | | 900,107 |
| Ser. 04-4, IO, 0.117s, 2042 | | 41,440,059 | | 665,338 |
| Ser. 04-5, Class XC, IO, 0.088s, 2041 | | 62,697,022 | | 830,018 |
35
| COLLATERALIZED MORTGAGE OBLIGATIONS (37.1%)* continued | | | |
|
| | | Principal amount | | Value |
|
| Banc of America Commercial Mortgage, Inc. 144A | | | | |
| Ser. 05-4, Class XC, IO, 0.072s, 2045 | $ | 104,967,970 | $ | 774,260 |
| Ser. 06-5, Class XC, IO, 0.052s, 2016 | | 104,297,135 | | 1,649,094 |
| Banc of America Large Loan | | | | |
| FRB Ser. 04-BBA4, Class H, 6.27s, 2018 | | 443,000 | | 445,106 |
| FRB Ser. 04-BBA4, Class G, 6.02s, 2018 | | 595,000 | | 595,704 |
| Banc of America Large Loan 144A | | | | |
| FRB Ser. 05-MIB1, Class K, 7.32s, 2022 | | 669,000 | | 669,321 |
| FRB Ser. 05-ESHA, Class K, 7.12s, 2020 | | 2,099,000 | | 2,099,227 |
| FRB Ser. 06-LAQ, Class M, 6.97s, 2021 | | 1,535,000 | | 1,534,992 |
| FRB Ser. 06-LAQ, Class L, 6.87s, 2021 | | 1,899,000 | | 1,901,900 |
| FRB Ser. 05-MIB1, Class J, 6.37s, 2022 | | 1,805,000 | | 1,813,040 |
| FRB Ser. 05-ESHA, Class G, 6.2s, 2020 | | 1,050,000 | | 1,049,625 |
| Ser. 06-LAQ, Class X1, IO, 0.697s, 2021 | | 58,458,486 | | 139,604 |
| Ser. 03-BBA2, Class X1A, IO, 0.175s, 2015 (F) | | 6,303,219 | | 1 |
| Banc of America Mortgage Securities | | | | |
| Ser. 04-D, Class 2A, IO, 0.389s, 2034 | | 16,767,714 | | 58,372 |
| Ser. 05-E, Class 2, IO, 0.306s, 2035 | | 43,628,000 | | 238,526 |
| IFB Ser. 06-2, Class A4, IO, 0.08s, 2036 | | 3,460,770 | | 22,844 |
| Banc of America Structured Security Trust 144A Ser. 02-X1, | | | | |
| Class A3, 5.436s, 2033 | | 2,131,664 | | 2,132,512 |
| Bayview Commercial Asset Trust 144A Ser. 07-1, Class S, IO, | | | | |
| 1.211s, 2037 | �� | 17,090,236 | | 2,255,911 |
| Bayview Commercial Asset Trust 144A | | | | |
| FRB Ser. 05-1A, Class A1, 5.62s, 2035 | | 1,948,155 | | 1,952,441 |
| Ser. 04-2, IO, 1.72s, 2034 | | 6,730,509 | | 462,985 |
| Ser. 05-1A, IO, 1.6s, 2035 | | 8,226,203 | | 610,217 |
| Ser. 04-3, IO, 1.6s, 2035 | | 6,954,857 | | 493,632 |
| Ser. 06-2A, IO, 0.879s, 2036 | | 3,781,278 | | 343,989 |
| Ser. 05-3A, IO, 0.775s, 2035 | | 22,025,192 | | 1,792,986 |
| Bear Stearns Alternate Trust Ser. 04-9, Class 1A1, 4.86s, 2034 | | 784,082 | | 781,441 |
| Bear Stearns Commercial Mortgage Securities, Inc. | | | | |
| FRB Ser. 00-WF2, Class F, 8.194s, 2032 | | 619,000 | | 689,834 |
| Ser. 04-PR3I, Class X1, IO, 0 1/8s, 2041 | | 20,464,331 | | 420,235 |
| Ser. 05-PWR9, Class X1, IO, 0.056s, 2042 | | 51,794,156 | | 528,352 |
| Bear Stearns Commercial Mortgage Securities, Inc. 144A | | | | |
| Ser. 06-BBA7, Class X1A, IO, 1.711s, 2019 | | 27,120,000 | | 239,562 |
| Ser. 06-PW14, Class XW, IO, 0.885s, 2038 | | 25,561,606 | | 1,294,056 |
| Ser. 06-PW14, Class X1, IO, 0.052s, 2038 | | 27,488,637 | | 498,232 |
| Ser. 07-PW15, Class X1, IO, 0.047s, 2044 | | 80,323,604 | | 1,006,897 |
| Ser. 05-PW10, Class X1, IO, 0.032s, 2040 | | 110,770,926 | | 508,594 |
| Bear Stearns Small Balance Commercial Trust 144A Ser. 06-1A, | | | | |
| Class AIO, IO, 1s, 2034 | | 11,807,000 | | 213,540 |
| Chase Commercial Mortgage Securities Corp. Ser. 00-3, | | | | |
| Class A2, 7.319s, 2032 | | 736,000 | | 777,046 |
| Chase Commercial Mortgage Securities Corp. 144A | | | | |
| Ser. 98-1, Class F, 6.56s, 2030 | | 5,896,000 | | 6,166,863 |
| Ser. 98-1, Class G, 6.56s, 2030 | | 1,502,003 | | 1,577,803 |
| Ser. 98-1, Class H, 6.34s, 2030 | | 2,217,000 | | 1,964,437 |
36
| COLLATERALIZED MORTGAGE OBLIGATIONS (37.1%)* continued | | | |
|
| | | Principal amount | | Value |
|
| Citigroup Commercial Mortgage Trust 144A | | | | |
| Ser. 05-C3, Class XC, IO, 0.095s, 2043 | $ | 144,620,283 | $ | 1,525,292 |
| Ser. 06-C5, Class XC, IO, 0.053s, 2049 | | 164,029,585 | | 2,377,148 |
| Citigroup/Deutsche Bank Commercial Mortgage Trust 144A | | | | |
| Ser. 07-CD4, Class XC, IO, 0.044s, 2049 | | 116,665,000 | | 1,125,635 |
| Ser. 07-CD4, Class XW, IO, 0.561s, 2049 | | 34,889,000 | | 985,342 |
| Ser. 06-CD2, Class X, IO, 0.129s, 2046 | | 105,211,227 | | 624,744 |
| Commercial Mortgage Acceptance Corp. Ser. 97-ML1, Class A3, | | | | |
| 6.57s, 2030 | | 5,898,532 | | 5,888,139 |
| Commercial Mortgage Acceptance Corp. 144A | | | | |
| Ser. 98-C1, Class F, 6.23s, 2031 | | 2,605,530 | | 2,697,337 |
| Ser. 98-C2, Class F, 5.44s, 2030 | | 4,946,000 | | 4,993,822 |
| Commercial Mortgage Pass-Through Certificates Ser. 04-LB2A, | | | | |
| Class A4, 4.715s, 2039 | | 35,237,000 | | 34,065,758 |
| Commercial Mortgage Pass-Through Certificates 144A | | | | |
| FRB Ser. 01-J2A, Class A2F, 5.82s, 2034 | | 1,960,000 | | 1,960,000 |
| Ser. 06-CN2A, Class H, 5.756s, 2019 | | 1,271,000 | | 1,267,426 |
| Ser. 06-CN2A, Class J, 5.756s, 2019 | | 1,017,000 | | 1,010,802 |
| Ser. 03-LB1A, Class X1, IO, 0.373s, 2038 | | 12,606,004 | | 518,863 |
| Ser. 06-C8, Class XS, IO, 0.049s, 2046 | | 81,429,436 | | 1,036,922 |
| Ser. 05-LP5, Class XC, IO, 0.046s, 2043 | | 75,240,400 | | 699,510 |
| Ser. 05-C6, Class XC, IO, 0.04s, 2044 | | 86,159,198 | | 609,146 |
| Countrywide Alternative Loan Trust | | | | |
| Ser. 05-24, Class IIAX, IO, 2.391s, 2035 | | 15,103,661 | | 420,728 |
| Ser. 06-OA10, Class XBI, IO, 2.257s, 2046 | | 8,874,790 | | 343,898 |
| Ser. 05-24, Class 1AX, IO, 1.201s, 2035 | | 12,214,397 | | 217,758 |
| IFB Ser. 06-6CB, Class 1A3, IO, zero %, 2036 | | 25,449,442 | | 60,641 |
| Credit Suisse Mortgage Capital Certificates | | | | |
| Ser. 06-C4, Class A3, 5.467s, 2039 | | 8,124,000 | | 8,166,765 |
| Ser. 06-C5, Class AX, IO, 0.074s, 2039 | | 51,808,245 | | 910,167 |
| Credit Suisse Mortgage Capital Certificates 144A | | | | |
| Ser. 07-C1, Class AX, IO, 0.058s, 2040 | | 104,183,971 | | 1,151,337 |
| Ser. 06-C3, Class AX, IO, 0.035s, 2038 | | 430,038,548 | | 490,244 |
| CRESI Finance Limited Partnership 144A | | | | |
| FRB Ser. 06-A, Class D, 6.12s, 2017 | | 308,000 | | 308,048 |
| FRB Ser. 06-A, Class C, 5.92s, 2017 | | 913,000 | | 913,143 |
| Criimi Mae Commercial Mortgage Trust 144A Ser. 98-C1, | | | | |
| Class B, 7s, 2033 | | 7,975,000 | | 7,988,558 |
| Crown Castle Towers, LLC 144A Ser. 05-1A, Class D, | | | | |
| 5.612s, 2035 | | 3,575,000 | | 3,563,270 |
| CS First Boston Mortgage Securities Corp. | | | | |
| Ser. 97-C2, Class F, 7.46s, 2035 | | 1,193,000 | | 1,314,136 |
| Ser. 04-C2, Class A2, 5.416s, 2036 | | 6,060,000 | | 6,097,693 |
| FRB Ser. 04-C3, Class A5, 5.113s, 2036 | | 59,000 | | 58,250 |
| Ser. 05-C4, Class A5, 5.104s, 2038 | | 21,019,000 | | 20,682,318 |
| Ser. 04-C3, Class A3, 4.302s, 2036 | | 127,000 | | 124,452 |
| CS First Boston Mortgage Securities Corp. 144A | | | | |
| FRB Ser. 05-TFLA, Class J, 6.27s, 2020 | | 323,500 | | 323,498 |
| FRB Ser. 04-TF2A, Class J, 6.27s, 2016 | | 414,000 | | 413,987 |
| FRB Ser. 04-TF2A, Class H, 6.02s, 2019 | | 825,000 | | 825,038 |
37
| COLLATERALIZED MORTGAGE OBLIGATIONS (37.1%)* continued | | | | |
|
| | | Principal amount | | Value |
|
| CS First Boston Mortgage Securities Corp. 144A | | | | |
| Ser. 01-CK1, Class AY, IO, 0.894s, 2035 | $ | 83,484,000 | $ | 1,826,213 |
| Ser. 02-CP3, Class AX, IO, 0.435s, 2035 | | 23,292,155 | | 893,169 |
| Ser. 03-C3, Class AX, IO, 0.431s, 2038 | | 106,882,518 | | 4,296,693 |
| Ser. 05-C2, Class AX, IO, 0.114s, 2037 | | 85,100,538 | | 1,308,336 |
| Deutsche Mortgage & Asset Receiving Corp. Ser. 98-C1, | | | | |
| Class X, IO, 0.85s, 2031 | | 817,501 | | 8,271 |
| DLJ Commercial Mortgage Corp. | | | | |
| Ser. 00-CF1, Class A1B, 7.62s, 2033 | | 2,926,910 | | 3,101,795 |
| Ser. 99-CG2, Class B3, 6.1s, 2032 | | 2,455,000 | | 2,464,649 |
| Ser. 99-CG2, Class B4, 6.1s, 2032 | | 3,434,000 | | 3,429,262 |
| Ser. 98-CF2, Class B3, 6.04s, 2031 | | 1,075,367 | | 1,094,182 |
| Fannie Mae | | | | |
| Ser. 03-W6, Class PT1, 9.952s, 2042 | | 787,098 | | 843,526 |
| IFB Ser. 06-70, Class SM, 9.605s, 2036 | | 574,920 | | 620,566 |
| Ser. 02-T12, Class A4, 9 1/2s, 2042 | | 291,457 | | 307,105 |
| Ser. 02-T4, Class A4, 9 1/2s, 2041 | | 479,931 | | 506,018 |
| Ser. 02-T6, Class A3, 9 1/2s, 2041 | | 594,497 | | 625,010 |
| Ser. 02-T1, Class A4, 9 1/2s, 2031 | | 62,812 | | 66,390 |
| Ser. 04-T3, Class PT1, 9.205s, 2044 | | 530,157 | | 573,648 |
| IFB Ser. 06-62, Class PS, 7.98s, 2036 | | 1,241,132 | | 1,386,825 |
| IFB Ser. 05-37, Class SU, 7.92s, 2035 | | 3,486,130 | | 3,809,763 |
| IFB Ser. 06-76, Class QB, 7.68s, 2036 | | 2,404,955 | | 2,653,945 |
| IFB Ser. 06-48, Class TQ, 7.68s, 2036 | | 3,925,475 | | 4,271,056 |
| IFB Ser. 06-60, Class AK, 7.52s, 2036 | | 1,870,725 | | 2,006,935 |
| Ser. 02-26, Class A2, 7 1/2s, 2048 | | 2,555,010 | | 2,671,434 |
| Ser. 04-T3, Class 1A4, 7 1/2s, 2044 | | 746,154 | | 785,432 |
| Ser. 04-T2, Class 1A4, 7 1/2s, 2043 | | 1,155,117 | | 1,215,949 |
| Ser. 02-T19, Class A3, 7 1/2s, 2042 | | 4,955,762 | | 5,185,502 |
| Ser. 02-T12, Class A3, 7 1/2s, 2042 | | 417,597 | | 434,966 |
| Ser. 02-14, Class A2, 7 1/2s, 2042 | | 555,520 | | 580,013 |
| Ser. 01-T10, Class A2, 7 1/2s, 2041 | | 2,634,949 | | 2,744,977 |
| Ser. 02-T4, Class A3, 7 1/2s, 2041 | | 171,601 | | 178,685 |
| Ser. 01-T12, Class A2, 7 1/2s, 2041 | | 2,526,876 | | 2,626,903 |
| Ser. 01-T3, Class A1, 7 1/2s, 2040 | | 531,261 | | 552,117 |
| Ser. 01-T1, Class A1, 7 1/2s, 2040 | | 932,848 | | 969,774 |
| Ser. 99-T2, Class A1, 7 1/2s, 2039 | | 310,274 | | 326,701 |
| Ser. 03-W10, Class 1A1, 7 1/2s, 2032 | | 1,158,103 | | 1,208,653 |
| Ser. 02-T1, Class A3, 7 1/2s, 2031 | | 456,914 | | 476,699 |
| Ser. 00-T6, Class A1, 7 1/2s, 2030 | | 1,968,886 | | 2,054,067 |
| Ser. 01-T5, Class A3, 7 1/2s, 2030 | | 57,414 | | 59,731 |
| Ser. 01-T4, Class A1, 7 1/2s, 2028 | | 5,892,793 | | 6,216,685 |
| IFB Ser. 06-63, Class SP, 7.38s, 2036 | | 2,610,751 | | 2,875,144 |
| IFB Ser. 06-60, Class TK, 7.32s, 2036 | | 1,193,312 | | 1,286,976 |
| Ser. 02-26, Class A1, 7s, 2048 | | 1,622,885 | | 1,677,555 |
| Ser. 04-T3, Class 1A3, 7s, 2044 | | 1,609,664 | | 1,673,849 |
| Ser. 04-T2, Class 1A3, 7s, 2043 | | 1,311,783 | | 1,364,398 |
| Ser. 03-W3, Class 1A2, 7s, 2042 | | 767,646 | | 793,957 |
| Ser. 02-T16, Class A2, 7s, 2042 | | 1,595,777 | | 1,650,651 |
| Ser. 02-14, Class A1, 7s, 2042 | | 429,072 | | 442,728 |
38
| COLLATERALIZED MORTGAGE OBLIGATIONS (37.1%)* continued | | | | |
|
| | | Principal amount | | Value |
|
| Fannie Mae | | | | |
| Ser. 01-W3, Class A, 7s, 2041 | $ | 560,906 | $ | 581,679 |
| Ser. 05-W4, Class 1A3, 7s, 2035 | | 2,120,008 | | 2,204,755 |
| Ser. 04-W1, Class 2A2, 7s, 2033 | | 4,382,597 | | 4,554,350 |
| IFB Ser. 06-104, Class ES, 6.85s, 2036 | | 2,722,150 | | 2,950,260 |
| IFB Ser. 06-104, Class CS, 5.76s, 2036 | | 2,600,205 | | 2,663,589 |
| Ser. 07-16, Class TS, IO, 5 1/2s, 2009 | | 21,823,287 | | 396,922 |
| IFB Ser. 05-74, Class SK, 5 1/2s, 2035 | | 3,720,615 | | 3,799,380 |
| IFB Ser. 05-74, Class CS, 5.39s, 2035 | | 2,240,732 | | 2,278,399 |
| IFB Ser. 05-74, Class CP, 5.243s, 2035 | | 1,966,072 | | 2,025,613 |
| IFB Ser. 05-57, Class CD, 5.175s, 2035 | | 1,800,846 | | 1,835,350 |
| IFB Ser. 06-8, Class PK, 5.12s, 2036 | | 3,784,553 | | 3,783,018 |
| IFB Ser. 06-27, Class SP, 5.06s, 2036 | | 2,816,000 | | 2,912,233 |
| IFB Ser. 06-8, Class HP, 5.06s, 2036 | | 3,264,296 | | 3,331,398 |
| IFB Ser. 06-8, Class WK, 5.06s, 2036 | | 5,119,354 | | 5,187,662 |
| IFB Ser. 05-106, Class US, 5.06s, 2035 | | 4,731,231 | | 4,872,260 |
| IFB Ser. 05-99, Class SA, 5.06s, 2035 | | 2,345,718 | | 2,380,267 |
| Ser. 07-54, Class IA, IO, 5s, 2037 ## | | 5,877,000 | | 320,884 |
| Ser. 07-54, Class IB, IO, 5s, 2037 ## | | 5,877,000 | | 320,884 |
| Ser. 07-54, Class IC, IO, 5s, 2037 ## | | 5,877,000 | | 320,884 |
| Ser. 07-54, Class ID, IO, 5s, 2037 ## | | 5,877,000 | | 320,884 |
| Ser. 07-54, Class IE, IO, 5s, 2037 ## | | 5,877,000 | | 320,884 |
| Ser. 07-54, Class IF, IO, 5s, 2037 ## | | 6,781,000 | | 370,243 |
| IFB Ser. 05-114, Class SP, 4.95s, 2036 | | 1,375,064 | | 1,337,250 |
| IFB Ser. 05-45, Class DA, 4.913s, 2035 | | 3,593,638 | | 3,649,984 |
| IFB Ser. 05-74, Class DM, 4.877s, 2035 | | 4,619,978 | | 4,678,165 |
| IFB Ser. 05-45, Class DC, 4.803s, 2035 | | 2,834,099 | | 2,866,033 |
| IFB Ser. 06-60, Class CS, 4.583s, 2036 | | 1,156,298 | | 1,115,222 |
| IFB Ser. 05-57, Class DC, 4.485s, 2034 | | 3,413,965 | | 3,442,739 |
| IFB Ser. 05-45, Class PC, 4.29s, 2034 | | 1,582,381 | | 1,582,720 |
| IFB Ser. 05-95, Class CP, 4.089s, 2035 | | 360,909 | | 360,101 |
| IFB Ser. 05-95, Class OP, 3.923s, 2035 | | 1,286,000 | | 1,214,105 |
| IFB Ser. 05-106, Class JC, 3.628s, 2035 | | 807,521 | | 747,755 |
| IFB Ser. 05-72, Class SB, 3.575s, 2035 | | 2,780,324 | | 2,656,952 |
| IFB Ser. 05-83, Class QP, 3.562s, 2034 | | 777,950 | | 734,419 |
| IFB Ser. 02-36, Class QH, IO, 2.73s, 2029 | | 178,618 | | 559 |
| IFB Ser. 06-90, Class SE, IO, 2.48s, 2036 | | 3,200,688 | | 300,690 |
| IFB Ser. 03-66, Class SA, IO, 2.33s, 2033 | | 3,956,071 | | 309,088 |
| Ser. 03-W12, Class 2, IO, 2.235s, 2043 | | 5,865,358 | | 334,066 |
| IFB Ser. 07-W2, Class 3A2, IO, 1.96s, 2037 | | 5,817,667 | | 360,123 |
| Ser. 03-W10, Class 1, IO, 1.937s, 2043 | | 23,046,302 | | 1,123,113 |
| Ser. 03-W10, Class 3, IO, 1.933s, 2043 | | 8,881,527 | | 437,317 |
| IFB Ser. 05-113, Class AI, IO, 1.91s, 2036 | | 1,049,863 | | 81,988 |
| IFB Ser. 05-113, Class DI, IO, 1.91s, 2036 | | 45,886,117 | | 2,927,492 |
| IFB Ser. 05-52, Class DC, IO, 1.88s, 2035 | | 2,629,772 | | 248,025 |
| IFB Ser. 04-24, Class CS, IO, 1.83s, 2034 | | 5,585,245 | | 396,286 |
| IFB Ser. 03-122, Class SA, IO, 1.78s, 2028 | | 7,408,327 | | 366,417 |
| IFB Ser. 03-122, Class SJ, IO, 1.78s, 2028 | | 7,797,418 | | 389,759 |
| IFB Ser. 06-60, Class DI, IO, 1 3/4s, 2035 | | 3,094,798 | | 172,778 |
| IFB Ser. 04-60, Class SW, IO, 1.73s, 2034 | | 10,211,156 | | 777,093 |
39
| COLLATERALIZED MORTGAGE OBLIGATIONS (37.1%)* continued | | | | |
|
| | | Principal amount | | Value |
|
| Fannie Mae | | | | |
| IFB Ser. 05-65, Class KI, IO, 1.68s, 2035 | $ | 22,361,679 | $ | 1,432,102 |
| Ser. 03-W8, Class 12, IO, 1.635s, 2042 | | 41,545,213 | | 1,862,912 |
| IFB Ser. 05-42, Class SA, IO, 1.48s, 2035 | | 8,291,255 | | 448,790 |
| IFB Ser. 07-30, Class WI, IO, 1.44s, 2037 | | 31,809,885 | | 1,669,131 |
| IFB Ser. 07-28, Class SE, IO, 1.43s, 2037 | | 3,817,086 | | 261,804 |
| IFB Ser. 07-W2, Class 2A2, IO, 1.43s, 2037 | | 7,540,982 | | 394,761 |
| IFB Ser. 06-128, Class SH, IO, 1.43s, 2037 | | 4,583,844 | | 255,778 |
| IFB Ser. 06-56, Class SM, IO, 1.43s, 2036 | | 11,468,080 | | 631,181 |
| IFB Ser. 06-12, Class SD, IO, 1.43s, 2035 | | 14,668,446 | | 1,059,062 |
| IFB Ser. 05-73, Class SI, IO, 1.43s, 2035 | | 2,242,069 | | 121,544 |
| IFB Ser. 05-17, Class ES, IO, 1.43s, 2035 | | 4,526,730 | | 322,529 |
| IFB Ser. 05-17, Class SY, IO, 1.43s, 2035 | | 2,091,255 | | 148,961 |
| IFB Ser. 07-30, Class IE, IO, 1.42s, 2037 | | 9,909,754 | | 747,768 |
| IFB Ser. 06-123, Class CI, IO, 1.42s, 2037 | | 8,774,958 | | 583,019 |
| IFB Ser. 05-82, Class SY, IO, 1.41s, 2035 | | 9,656,801 | | 473,194 |
| IFB Ser. 05-45, Class SR, IO, 1.4s, 2035 | | 12,848,905 | | 622,475 |
| IFB Ser. 05-95, Class CI, IO, 1.38s, 2035 | | 4,934,316 | | 315,428 |
| IFB Ser. 05-84, Class SG, IO, 1.38s, 2035 | | 8,543,272 | | 553,465 |
| IFB Ser. 05-54, Class SA, IO, 1.38s, 2035 | | 9,206,535 | | 457,450 |
| IFB Ser. 05-23, Class SG, IO, 1.38s, 2035 | | 6,800,089 | | 412,465 |
| IFB Ser. 05-29, Class SX, IO, 1.38s, 2035 | | 7,947,762 | | 470,443 |
| IFB Ser. 05-104, Class NI, IO, 1.38s, 2035 | | 5,719,930 | | 383,807 |
| IFB Ser. 05-17, Class SA, IO, 1.38s, 2035 | | 5,983,072 | | 398,097 |
| IFB Ser. 05-17, Class SE, IO, 1.38s, 2035 | | 6,412,909 | | 420,570 |
| IFB Ser. 05-57, Class DI, IO, 1.38s, 2035 | | 13,349,122 | | 719,786 |
| IFB Ser. 04-92, Class S, IO, 1.38s, 2034 | | 6,822,199 | | 363,494 |
| IFB Ser. 05-83, Class QI, IO, 1.37s, 2035 | | 1,298,716 | | 94,672 |
| IFB Ser. 05-73, Class SD, IO, 1.36s, 2035 | | 5,790,091 | | 367,042 |
| IFB Ser. 05-83, Class SL, IO, 1.35s, 2035 | | 14,981,641 | | 782,362 |
| Ser. 06-116, Class ES, IO, 1.33s, 2036 | | 3,251,735 | | 139,850 |
| IFB Ser. 06-114, Class IS, IO, 1.33s, 2036 | | 4,468,250 | | 251,339 |
| IFB Ser. 06-20, Class IG, IO, 1.33s, 2036 | | 28,442,103 | | 1,221,754 |
| IFB Ser. 06-115, Class GI, IO, 1.32s, 2036 | | 3,787,263 | | 236,522 |
| IFB Ser. 06-121, Class SD, IO, 1.32s, 2036 | | 9,443,181 | | 504,266 |
| IFB Ser. 06-109, Class SG, IO, 1.31s, 2036 | | 5,980,915 | | 331,042 |
| IFB Ser. 06-104, Class IM, IO, 1.3s, 2036 | | 1,426,000 | | 85,084 |
| IFB Ser. 06-104, Class SY, IO, 1.3s, 2036 | | 3,426,876 | | 166,500 |
| IFB Ser. 06-109, Class SH, IO, 1.3s, 2036 | | 4,167,675 | | 310,813 |
| Ser. 06-104, Class SG, IO, 1.28s, 2036 | | 7,724,969 | | 352,164 |
| IFB Ser. 06-128, Class SC, IO, 1.28s, 2037 | | 10,137,963 | | 607,264 |
| IFB Ser. 06-104, Class CI, IO, 1.28s, 2036 | | 1,219,925 | | 75,842 |
| IFB Ser. 06-44, Class IS, IO, 1.28s, 2036 | | 6,155,915 | | 330,034 |
| IFB Ser. 06-45, Class SM, IO, 1.28s, 2036 | | 7,085,557 | | 298,925 |
| IFB Ser. 06-8, Class JH, IO, 1.28s, 2036 | | 15,779,454 | | 916,896 |
| IFB Ser. 06-42, Class IB, IO, 1.27s, 2036 | | 5,843,477 | | 243,633 |
| IFB Ser. 06-20, Class IB, IO, 1.27s, 2036 | | 12,189,473 | | 504,999 |
| IFB Ser. 05-95, Class OI, IO, 1.27s, 2035 | | 728,549 | | 53,824 |
| IFB Ser. 06-92, Class JI, IO, 1.26s, 2036 | | 3,076,833 | | 174,291 |
| IFB Ser. 06-96, Class ES, IO, 1.26s, 2036 | | 5,510,535 | | 298,636 |
40
| COLLATERALIZED MORTGAGE OBLIGATIONS (37.1%)* continued | | | | |
|
| | | Principal amount | | Value |
|
| Fannie Mae | | | | |
| IFB Ser. 06-99, Class AS, IO, 1.26s, 2036 | $ | 3,795,930 | $ | 203,841 |
| IFB Ser. 06-85, Class TS, IO, 1.24s, 2036 | | 7,640,184 | | 366,447 |
| IFB Ser. 06-61, Class SE, IO, 1.23s, 2036 | | 8,183,408 | | 318,384 |
| Ser. 06-94, Class NI, IO, 1.18s, 2036 | | 3,832,754 | | 167,968 |
| Ser. 03-W17, Class 12, IO, 1.152s, 2033 | | 10,929,410 | | 424,762 |
| IFB Ser. 07-30, Class LI, IO, 1.12s, 2037 | | 13,343,069 | | 783,905 |
| IFB Ser. 07-W2, Class 1A2, IO, 1.11s, 2037 | | 20,173,763 | | 908,592 |
| Ser. 03-W19, IO, 1.099s, 2033 | | 1,229,089 | | 37,561 |
| IFB Ser. 07-15, Class CI, IO, 1.06s, 2037 | | 16,075,560 | | 888,697 |
| IFB Ser. 06-123, Class BI, IO, 1.06s, 2037 | | 21,321,694 | | 1,132,910 |
| IFB Ser. 06-115, Class JI, IO, 1.06s, 2036 | | 11,812,179 | | 655,242 |
| IFB Ser. 06-123, Class LI, IO, 1s, 2037 | | 7,892,614 | | 400,424 |
| Ser. 03-W10, Class 3A, IO, 0.915s, 2043 | | 903,127 | | 14,971 |
| Ser. 03-W10, Class 1A, IO, 0.908s, 2043 | | 747,251 | | 10,788 |
| Ser. 03-T2, Class 2, IO, 0.823s, 2042 | | 66,224,798 | | 1,418,909 |
| IFB Ser. 07-39, Class AI, IO, 0.8s, 2037 | | 8,180,000 | | 356,290 |
| IFB Ser. 07-32, Class SD, IO, 0.79s, 2037 | | 5,441,249 | | 240,818 |
| IFB Ser. 07-33, Class SD, IO, 0.79s, 2037 | | 15,575,552 | | 599,659 |
| IFB Ser. 07-32, Class SC, IO, 0.78s, 2037 | | 7,221,551 | | 317,353 |
| IFB Ser. 05-74, Class SE, IO, 0.78s, 2035 | | 11,213,224 | | 353,923 |
| IFB Ser. 05-82, Class SI, IO, 0.78s, 2035 | | 17,607,170 | | 592,866 |
| IFB Ser. 05-87, Class SE, IO, 0.73s, 2035 | | 32,550,091 | | 1,033,612 |
| Ser. 03-18, Class X1, IO, 0.685s, 2042 | | 31,820,609 | | 405,776 |
| Ser. 03-W3, Class 2IO1, IO, 0.683s, 2042 | | 25,908,886 | | 473,872 |
| Ser. 03-W6, Class 51, IO, 0.68s, 2042 | | 17,658,606 | | 280,432 |
| IFB Ser. 05-58, Class IK, IO, 0.68s, 2035 | | 5,325,278 | | 253,395 |
| Ser. 06-W3, Class 1AS, IO, 0.662s, 2046 | | 20,071,142 | | 620,951 |
| Ser. 01-T12, Class IO, 0.567s, 2041 | | 29,912,959 | | 355,956 |
| Ser. 03-W2, Class 1, IO, 0.469s, 2042 | | 34,574,687 | | 379,210 |
| Ser. 01-50, Class B1, IO, 0.459s, 2041 | | 4,130,472 | | 35,239 |
| Ser. 02-T4, IO, 0.453s, 2041 | | 16,796,971 | | 155,554 |
| Ser. 03-W3, Class 1, IO, 0.443s, 2042 | | 22,927,565 | | 203,999 |
| Ser. 02-T1, Class IO, IO, 0.423s, 2031 | | 25,927,239 | | 197,169 |
| Ser. 03-W6, Class 3, IO, 0.365s, 2042 | | 23,579,486 | | 226,018 |
| Ser. 03-W6, Class 23, IO, 0.352s, 2042 | | 25,360,142 | | 235,566 |
| Ser. 03-W8, Class 11, IO, 0.03s, 2042 | | 2,015,975 | | 38 |
| Ser. 03-W6, Class 21, IO, 0.004s, 2042 | | 16,800 | | — |
| Ser. 03-34, Class P1, PO (Principal only), zero %, 2043 | | 109,181 | | 75,267 |
| Ser. 06-104, Class EK, zero %, 2036 | | 623,915 | | 601,708 |
| Ser. 06-84, Class OP, PO, zero %, 2036 | | 80,599 | | 78,670 |
| Ser. 372, Class 1, PO, zero %, 2036 | | 845,235 | | 677,911 |
| Ser. 371, Class 1, PO, zero %, 2036 | | 2,448,750 | | 2,028,673 |
| Ser. 367, Class 1, PO, zero %, 2036 | | 1,522,281 | | 1,153,726 |
| Ser. 363, Class 1, PO, zero %, 2035 | | 13,048,584 | | 9,908,242 |
| Ser. 361, Class 1, PO, zero %, 2035 | | 10,272,264 | | 8,338,030 |
| Ser. 04-38, Class AO, PO, zero %, 2034 | | 5,244,670 | | 3,812,219 |
| Ser. 04-61, Class CO, PO, zero %, 2031 | | 4,902,000 | | 4,025,518 |
| Ser. 07-31, Class TS, IO, zero %, 2009 | | 13,164,704 | | 239,440 |
| Ser. 07-15, Class IM, IO, zero %, 2009 | | 5,110,484 | | 93,040 |
41
| COLLATERALIZED MORTGAGE OBLIGATIONS (37.1%)* continued | | | |
|
| | | Principal amount | | Value |
|
| Fannie Mae | | | | |
| FRB Ser. 05-117, Class GF, zero %, 2036 | $ | 1,029,809 | $ | 961,609 |
| FRB Ser. 05-65, Class ER, zero %, 2035 | | 3,456,277 | | 3,280,805 |
| FRB Ser. 05-57, Class UL, zero %, 2035 | | 3,321,823 | | 3,197,784 |
| FRB Ser. 05-36, Class QA, zero %, 2035 | | 643,949 | | 588,856 |
| FRB Ser. 05-65, Class CU, zero %, 2034 | | 467,005 | | 518,619 |
| FRB Ser. 05-81, Class DF, zero %, 2033 | | 410,476 | | 408,680 |
| FRB Ser. 06-1, Class HF, zero %, 2032 | | 448,928 | | 422,382 |
| Federal Home Loan Mortgage Corp. Structured | | | | |
| Pass-Through Securities | | | | |
| Ser. T-42, Class A6, 9 1/2s, 2042 | | 309,188 | | 325,629 |
| Ser. T-58, Class 4A, 7 1/2s, 2043 | | 1,638,661 | | 1,718,044 |
| Ser. T-51, Class 2A, 7 1/2s, 2042 | | 1,748,196 | | 1,822,547 |
| Ser. T-42, Class A5, 7 1/2s, 2042 | | 1,158,135 | | 1,206,458 |
| Ser. T-60, Class 1A2, 7s, 2044 | | 5,349,634 | | 5,562,482 |
| Ser. T-41, Class 2A, 7s, 2032 | | 125,720 | | 129,650 |
| Ser. T-56, Class A, IO, 0.555s, 2043 | | 14,885,043 | | 203,949 |
| Ser. T-56, Class 3, IO, 0.363s, 2043 | | 15,015,182 | | 123,342 |
| Ser. T-56, Class 1, IO, 0.285s, 2043 | | 18,974,858 | | 103,556 |
| Ser. T-56, Class 2, IO, 0.049s, 2043 | | 17,363,389 | | 38,064 |
| FFCA Secured Lending Corp. 144A Ser. 00-1, Class A2, | | | | |
| 7.77s, 2027 | | 5,546,208 | | 5,832,612 |
| First Union National Bank-Bank of America Commercial | | | | |
| Mortgage 144A Ser. 01-C1, Class 3, IO, 1.951s, 2033 | | 40,652,054 | | 2,124,907 |
| First Union-Lehman Brothers Commercial Mortgage Trust II | | | | |
| Ser. 97-C2, Class F, 7 1/2s, 2029 | | 3,492,000 | | 3,791,716 |
| Ser. 97-C2, Class G, 7 1/2s, 2029 | | 1,156,000 | | 1,255,678 |
| First Union-Lehman Brothers-Bank of America 144A Ser. 98-C2, | | | |
| Class G, 7s, 2035 | | 4,500,000 | | 4,848,975 |
| Freddie Mac | | | | |
| IFB Ser. 2990, Class LB, 3.348s, 2034 | | 3,525,774 | | 3,248,401 |
| IFB Ser. 3153, Class UK, 7 1/2s, 2036 | | 2,290,600 | | 2,620,362 |
| IFB Ser. 3202, Class PS, 7.32s, 2036 | | 1,186,552 | | 1,297,851 |
| IFB Ser. 3182, Class PS, 7.32s, 2032 | | 3,147,571 | | 3,488,297 |
| IFB Ser. 3202, Class HM, 6.65s, 2036 | | 821,845 | | 877,787 |
| IFB Ser. 3081, Class DC, 5.22s, 2035 | | 1,914,186 | | 1,946,715 |
| IFB Ser. 3114, Class GK, 5.12s, 2036 | | 1,279,254 | | 1,300,095 |
| Ser. 3311, Class IA, IO, 5s, 2037 ## | | 6,320,000 | | 369,205 |
| Ser. 3311, Class IB, IO, 5s, 2037 ## | | 6,320,000 | | 369,205 |
| Ser. 3311, Class IC, IO, 5s, 2037 ## | | 6,320,000 | | 369,205 |
| Ser. 3311, Class ID, IO, 5s, 2037 ## | | 6,320,000 | | 369,205 |
| Ser. 3311, Class IE, IO, 5s, 2037 ## | | 6,320,000 | | 369,205 |
| IFB Ser. 2976, Class KL, 4.877s, 2035 | | 3,407,920 | | 3,418,654 |
| IFB Ser. 2990, Class DP, 4.767s, 2034 | | 2,963,827 | | 2,944,449 |
| IFB Ser. 2979, Class AS, 4.767s, 2034 | | 842,776 | | 835,768 |
| IFB Ser. 3065, Class DC, 3.9s, 2035 | | 2,894,831 | | 2,740,705 |
| IFB Ser. 3050, Class SA, 3.575s, 2034 | | 2,109,851 | | 1,948,918 |
| IFB Ser. 2990, Class WP, 3.302s, 2035 | | 2,263,806 | | 2,175,877 |
| IFB Ser. 2927, Class SI, IO, 3.18s, 2035 | | 5,091,102 | | 558,505 |
| IFB Ser. 2828, Class GI, IO, 2.18s, 2034 | | 5,778,326 | | 589,856 |
42
| COLLATERALIZED MORTGAGE OBLIGATIONS (37.1%)* continued | | | | |
|
| | | Principal amount | | Value |
|
| Freddie Mac | | | | |
| IFB Ser. 2869, Class SH, IO, 1.98s, 2034 | $ | 2,817,841 | $ | 165,233 |
| IFB Ser. 2869, Class JS, IO, 1.93s, 2034 | | 13,627,334 | | 782,079 |
| IFB Ser. 2815, Class PT, IO, 1.73s, 2032 | | 5,714,947 | | 390,059 |
| IFB Ser. 2828, Class TI, IO, 1.73s, 2030 | | 2,739,268 | | 171,416 |
| IFB Ser. 3284, Class IV, IO, 1.43s, 2037 | | 3,418,887 | | 247,800 |
| IFB Ser. 3287, Class SD, IO, 1.43s, 2037 | | 5,673,515 | | 351,166 |
| IFB Ser. 3028, Class ES, IO, 1.43s, 2035 | | 14,419,517 | | 969,423 |
| IFB Ser. 2922, Class SE, IO, 1.43s, 2035 | | 7,228,509 | | 367,931 |
| IFB Ser. 3045, Class DI, IO, 1.41s, 2035 | | 15,673,985 | | 776,546 |
| Ser. 3236, Class ES, IO, 1.38s, 2036 | | 5,566,454 | | 264,407 |
| IFB Ser. 3136, Class NS, IO, 1.38s, 2036 | | 8,721,290 | | 530,219 |
| IFB Ser. 3118, Class SD, IO, 1.38s, 2036 | | 11,929,861 | | 561,411 |
| IFB Ser. 3054, Class CS, IO, 1.38s, 2035 | | 3,072,500 | | 132,502 |
| IFB Ser. 3107, Class DC, IO, 1.38s, 2035 | | 14,900,655 | | 1,054,207 |
| IFB Ser. 3129, Class SP, IO, 1.38s, 2035 | | 6,234,684 | | 258,153 |
| IFB Ser. 3066, Class SI, IO, 1.38s, 2035 | | 9,451,809 | | 642,980 |
| IFB Ser. 2927, Class ES, IO, 1.38s, 2035 | | 4,051,489 | | 193,724 |
| IFB Ser. 2950, Class SM, IO, 1.38s, 2016 | | 7,909,139 | | 448,153 |
| IFB Ser. 3031, Class BI, IO, 1.37s, 2035 | | 2,667,296 | | 192,900 |
| IFB Ser. 2962, Class BS, IO, 1.33s, 2035 | | 16,754,431 | | 818,546 |
| IFB Ser. 3114, Class TS, IO, 1.33s, 2030 | | 32,662,316 | | 1,631,430 |
| IFB Ser. 3128, Class JI, IO, 1.31s, 2036 | | 9,376,753 | | 577,776 |
| IFB Ser. 2990, Class LI, IO, 1.31s, 2034 | | 5,184,845 | | 331,290 |
| IFB Ser. 3240, Class S, IO, 1.3s, 2036 | | 13,632,722 | | 845,403 |
| IFB Ser. 3229, Class BI, IO, 1.3s, 2036 | | 1,227,658 | | 59,872 |
| IFB Ser. 3065, Class DI, IO, 1.3s, 2035 | | 2,058,278 | | 148,512 |
| IFB Ser. 3145, Class GI, IO, 1.28s, 2036 | | 7,605,178 | | 501,566 |
| IFB Ser. 3114, Class GI, IO, 1.28s, 2036 | | 3,053,112 | | 222,195 |
| IFB Ser. 3174, Class BS, IO, 1.2s, 2036 | | 7,066,778 | | 282,034 |
| IFB Ser. 3152, Class SY, IO, 1.16s, 2036 | | 6,808,856 | | 408,284 |
| IFB Ser. 3199, Class S, IO, 1.13s, 2036 | | 3,803,495 | | 203,844 |
| IFB Ser. 3284, Class LI, IO, 1.12s, 2037 | | 18,022,748 | | 1,024,871 |
| IFB Ser. 3281, Class AI, IO, 1.11s, 2037 | | 16,143,783 | | 922,786 |
| IFB Ser. 3240, Class GS, IO, 1.06s, 2036 | | 8,249,192 | | 448,442 |
| IFB Ser. 3288, Class SJ, IO, 0.81s, 2037 | | 7,276,912 | | 275,158 |
| IFB Ser. 3284, Class CI, IO, 0.8s, 2037 | | 12,211,484 | | 582,110 |
| IFB Ser. 3291, Class SA, IO, 0.79s, 2037 | | 8,046,526 | | 295,307 |
| IFB Ser. 3016, Class SQ, IO, 0.79s, 2035 | | 6,149,503 | | 174,880 |
| IFB Ser. 3284, Class WI, IO, 0.78s, 2037 | | 20,350,975 | | 907,765 |
| Ser. 3300, PO, zero %, 2037 | | 3,560,000 | | 2,875,936 |
| Ser. 242, PO, zero %, 2036 ## | | 34,560,623 | | 28,167,094 |
| Ser. 239, PO, zero %, 2036 | | 17,242,972 | | 13,779,738 |
| Ser. 3174, PO, zero %, 2036 | | 476,291 | | 409,433 |
| Ser. 236, PO, zero %, 2036 | | 11,754,998 | | 9,451,321 |
| FRB Ser. 3213, Class FX, zero %, 2036 | | 611,432 | | 588,480 |
| FRB Ser. 3231, Class X, zero %, 2036 | | 736,379 | | 732,860 |
| FRB Ser. 3147, Class SF, zero %, 2036 | | 2,389,905 | | 2,217,462 |
| FRB Ser. 3048, Class XG, zero %, 2035 | | 362,021 | | 345,710 |
| FRB Ser. 3022, Class TC, zero %, 2035 | | 401,168 | | 408,721 |
43
| COLLATERALIZED MORTGAGE OBLIGATIONS (37.1%)* continued | | | |
|
| | | Principal amount | | Value |
|
| Freddie Mac | | | | |
| FRB Ser. 3003, Class XF, zero %, 2035 | $ | 2,861,624 | $ | 2,778,010 |
| FRB Ser. 2986, Class XT, zero %, 2035 | | 271,207 | | 264,141 |
| FRB Ser. 2958, Class FL, zero %, 2035 | | 1,164,750 | | 1,048,365 |
| FRB Ser. 3046, Class WF, zero %, 2035 | | 464,071 | | 448,641 |
| FRB Ser. 3054, Class XF, zero %, 2034 | | 267,900 | | 259,654 |
| GE Capital Commercial Mortgage Corp. 144A | | | | |
| Ser. 05-C3, Class XC, IO, 0.059s, 2045 | | 290,748,076 | | 1,556,084 |
| Ser. 05-C2, Class XC, IO, 0.059s, 2043 | | 120,997,869 | | 940,355 |
| Ser. 07-C1, Class XC, IO, 0.048s, 2019 ## | | 241,470,731 | | 1,910,033 |
| GMAC Commercial Mortgage Securities, Inc. | | | | |
| Ser. 99-C3, Class F, 8.058s, 2036 | | 488,000 | | 515,669 |
| Ser. 01-C2, Class A1, 6 1/4s, 2034 | | 302,462 | | 305,427 |
| Ser. 03-C2, Class A2, 5.461s, 2040 | | 7,723,000 | | 7,821,854 |
| Ser. 04-C2, Class A4, 5.301s, 2038 | | 13,017,000 | | 12,994,481 |
| Ser. 97-C1, Class X, IO, 1.513s, 2029 | | 12,620,364 | | 509,477 |
| Ser. 05-C1, Class X1, IO, 0.111s, 2043 | | 107,421,119 | | 1,493,798 |
| GMAC Commercial Mortgage Securities, Inc. 144A | | | | |
| Ser. 99-C3, Class G, 6.974s, 2036 | | 2,095,341 | | 2,149,899 |
| Ser. 06-C1, Class XC, IO, 0.033s, 2045 | | 172,717,435 | | 1,288,645 |
| Government National Mortgage Association | | | | |
| IFB Ser. 06-34, Class SA, 7.62s, 2036 | | 532,393 | | 573,051 |
| Ser. 2003-41, Class DS, IO, 6.38s, 2037 | | 780,000 | | 41,243 |
| Ser. 07-25, Class SB, IO, 6s, 2037 | | 11,803,000 | | 624,379 |
| Ser. 07-26, Class SA, IO, 6s, 2037 | | 17,100,000 | | 850,946 |
| Ser. 07-26, Class SD, IO, 6s, 2037 | | 8,439,000 | | 455,875 |
| Ser. 07-25, Class SA, IO, 6s, 2037 ## | | 6,083,000 | | 316,924 |
| IFB Ser. 05-7, Class JM, 5.016s, 2034 | | 3,572,151 | | 3,550,926 |
| IFB Ser. 05-66, Class SP, 3.1s, 2035 | | 1,789,476 | | 1,648,812 |
| IFB Ser. 07-1, Class SL, IO, 2.04s, 2037 | | 2,704,640 | | 185,358 |
| IFB Ser. 07-1, Class SM, IO, 2.03s, 2037 | | 2,703,654 | | 184,480 |
| IFB Ser. 07-9, Class BI, IO, 1 1/2s, 2037 | | 17,562,124 | | 909,815 |
| IFB Ser. 06-69, Class SA, IO, 1.48s, 2036 | | 9,200,974 | | 444,842 |
| IFB Ser. 06-38, Class SG, IO, 1.33s, 2033 | | 17,267,886 | | 668,845 |
| IFB Ser. 07-9, Class DI, IO, 1.19s, 2037 | | 8,826,760 | | 392,043 |
| IFB Ser. 07-9, Class AI, IO, 1.18s, 2037 | | 6,939,429 | | 344,663 |
| IFB Ser. 06-28, Class GI, IO, 1.18s, 2035 | | 6,032,082 | | 272,952 |
| IFB Ser. 05-65, Class SI, IO, 1.03s, 2035 | | 6,553,935 | | 251,253 |
| IFB Ser. 07-19, Class SJ, IO, 0.88s, 2037 | | 7,561,000 | | 241,007 |
| IFB Ser. 07-21, Class S, IO, 0.88s, 2037 | | 9,133,270 | | 315,026 |
| IFB Ser. 07-8, Class SA, IO, 0.88s, 2037 | | 18,731,898 | | 714,154 |
| IFB Ser. 07-9, Class CI, IO, 0.88s, 2037 | | 11,468,432 | | 400,538 |
| IFB Ser. 07-7, Class EI, IO, 0.88s, 2037 | | 3,322,160 | | 108,933 |
| Ser. 99-31, Class MP, PO, zero %, 2029 | | 112,626 | | 96,251 |
| Ser. 98-2, Class EA, PO, zero %, 2028 | | 951,214 | | 782,278 |
| Greenpoint Mortgage Funding Trust Ser. 05-AR1, Class X1, IO, | | | | |
| 1.36s, 2045 | | 10,032,801 | | 246,118 |
| Greenwich Capital Commercial Funding Corp. | | | | |
| Ser. 07-GG9, Class A4, 5.444s, 2039 | | 2,148,000 | | 2,170,769 |
| Ser. 05-GG5, Class XC, IO, 0.052s, 2037 | | 236,802,117 | | 1,026,759 |
44
| COLLATERALIZED MORTGAGE OBLIGATIONS (37.1%)* continued | | | |
|
| | | Principal amount | | Value |
|
| Greenwich Capital Commercial Funding Corp. 144A | | | | |
| Ser. 07-GG9, Class X, IO, 0.512s, 2039 | $ | 33,084,281 | $ | 835,378 |
| Ser. 05-GG3, Class XC, IO, 0.137s, 2042 | | 107,067,054 | | 1,713,073 |
| GS Mortgage Securities Corp. II | | | | |
| Ser. 06-GG8, Class A4, 5.56s, 2039 | | 5,341,000 | | 5,405,840 |
| Ser. 04-GG2, Class A6, 5.396s, 2038 | | 5,069,000 | | 5,097,234 |
| Ser. 05-GG4, Class A4, 4.761s, 2039 | | 127,000 | | 122,503 |
| Ser. 05-GG4, Class A4B, 4.732s, 2039 | | 7,685,000 | | 7,374,093 |
| GS Mortgage Securities Corp. II 144A | | | | |
| FRB Ser. 03-FL6A, Class L, 8.57s, 2015 | | 748,000 | | 748,000 |
| Ser. 98-C1, Class F, 6s, 2030 | | 1,627,000 | | 1,634,045 |
| Ser. 03-C1, Class X1, IO, 0.414s, 2040 | | 39,640,505 | | 683,990 |
| Ser. 05-GG4, Class XC, IO, 0.162s, 2039 | | 133,144,834 | | 2,350,838 |
| Ser. 04-C1, Class X1, IO, 0.126s, 2028 | | 44,240,888 | | 293,787 |
| Ser. 06-GG6, Class XC, IO, 0.045s, 2038 | | 146,926,128 | | 510,798 |
| GSR Mortgage Loan Trust Ser. 05-AR2, Class 2A1, 4.853s, 2035 | | 2,696,355 | | 2,655,910 |
| JPMorgan Chase Commercial Mortgage Securities Corp. | | | | |
| Ser. 97-C5, Class F, 7.561s, 2029 | | 1,171,000 | | 1,269,704 |
| Ser. 06-CB14, Class AM, 5.629s, 2044 | | 5,894,000 | | 5,935,965 |
| Ser. 06-CB16, Class A4, 5.552s, 2045 | | 5,705,000 | | 5,767,413 |
| FRB Ser. 04-PNC1, Class A4, 5.372s, 2041 | | 48,000 | | 48,376 |
| Ser. 06-CB14, Class A4, 5.481s, 2044 | | 11,600,000 | | 11,679,808 |
| Ser. 06-LDP9, Class A3, 5.336s, 2047 | | 8,661,000 | | 8,600,460 |
| Ser. 05-CB11, Class A4, 5.335s, 2037 | | 8,740,000 | | 8,738,643 |
| Ser. 05-CB12, Class A4, 4.895s, 2037 | | 128,000 | | 124,059 |
| Ser. 04-C3, Class A5, 4.878s, 2042 | | 122,000 | | 118,439 |
| Ser. 05-LDP2, Class AM, 4.78s, 2042 | | 2,030,000 | | 1,948,582 |
| Ser. 06-CB17, Class X, IO, 0.703s, 2043 | | 57,832,349 | | 2,331,222 |
| Ser. 06-LDP9, Class X, IO, 0.642s, 2047 | | 36,732,594 | | 1,262,867 |
| Ser. 07-LDPX, Class X, IO, 0.527s, 2049 | | 71,194,794 | | 1,757,799 |
| Ser. 06-LDP7, Class X, IO, 0.02s, 2045 | | 299,092,623 | | 257,034 |
| JPMorgan Chase Commercial Mortgage Securities Corp. 144A | | | | |
| Ser. 00-C9, Class G, 6 1/4s, 2032 | | 1,515,000 | | 1,542,606 |
| Ser. 06-FL2A, Class X1, IO, 0.694s, 2018 | | 137,662,285 | | 435,013 |
| Ser. 03-ML1A, Class X1, IO, 0.472s, 2039 | | 19,954,442 | | 708,383 |
| Ser. 05-LDP2, Class X1, IO, 0.105s, 2042 | | 238,424,635 | | 4,163,118 |
| Ser. 05-LDP1, Class X1, IO, 0.101s, 2046 | | 46,595,454 | | 451,393 |
| Ser. 05-CB12, Class X1, IO, 0.097s, 2037 | | 70,278,530 | | 790,633 |
| Ser. 06-CB14, Class X1, IO, 0.069s, 2044 | | 58,554,040 | | 274,472 |
| Ser. 05-LDP3, Class X1, IO, 0.062s, 2042 | | 172,150,949 | | 1,371,828 |
| Ser. 06-LDP6, Class X1, IO, 0.05s, 2043 | | 95,353,899 | | 521,467 |
| Ser. 05-LDP5, Class X1, IO, 0.043s, 2044 | | 446,074,541 | | 2,160,674 |
| LB Commercial Conduit Mortgage Trust 144A | | | | |
| Ser. 99-C1, Class F, 6.41s, 2031 | | 926,463 | | 939,554 |
| Ser. 99-C1, Class G, 6.41s, 2031 | | 991,777 | | 1,030,368 |
| Ser. 98-C4, Class G, 5.6s, 2035 | | 784,000 | | 783,712 |
| Ser. 98-C4, Class H, 5.6s, 2035 | | 1,328,000 | | 1,250,544 |
45
| COLLATERALIZED MORTGAGE OBLIGATIONS (37.1%)* continued | | | |
|
| | | Principal amount | | Value |
|
| LB-UBS Commercial Mortgage Trust | | | | |
| Ser. 01-C3, Class A2, 6.365s, 2028 | $ | 43,000 | $ | 44,728 |
| Ser. 05-C7, Class AM, 5.263s, 2040 | | 9,607,000 | | 9,541,051 |
| Ser. 04-C7, Class A6, 4.786s, 2029 | | 2,341,000 | | 2,272,533 |
| LB-UBS Commercial Mortgage Trust 144A | | | | |
| Ser. 06-C7, Class XW, IO, 0.914s, 2038 | | 41,058,023 | | 2,003,583 |
| Ser. 05-C3, Class XCL, IO, 0.133s, 2040 | | 70,958,152 | | 1,480,431 |
| Ser. 05-C2, Class XCL, IO, 0.122s, 2040 | | 234,838,622 | | 2,448,241 |
| Ser. 05-C5, Class XCL, IO, 0.11s, 2020 | | 105,793,600 | | 1,511,241 |
| Ser. 05-C7, Class XCL, IO, 0.096s, 2040 | | 157,523,053 | | 1,580,256 |
| Ser. 06-C1, Class XCL, IO, 0.082s, 2041 | | 167,588,219 | | 1,869,828 |
| Ser. 06-C7, Class XCL, IO, 0.072s, 2038 | | 29,843,119 | | 537,619 |
| Lehman Brothers Floating Rate Commercial Mortgage Trust 144A | | | | |
| FRB Ser. 04-LLFA, Class H, 6.27s, 2017 | | 826,000 | | 826,903 |
| FRB Ser. 05-LLFA, 6.12s, 2018 | | 534,000 | | 532,665 |
| Lehman Mortgage Trust | | | | |
| IFB Ser. 06-7, Class 1A9, 9s, 2036 | | 1,190,565 | | 1,310,105 |
| IFB Ser. 06-7, Class 4A2, IO, 2.43s, 2036 | | 5,429,969 | | 308,542 |
| Ser. 07-1, Class 3A2, IO, 1.93s, 2037 | | 5,586,075 | | 372,301 |
| IFB Ser. 06-9, Class 3A2, IO, 1.91s, 2037 | | 3,426,615 | | 210,032 |
| IFB Ser. 06-5, Class 2A2, IO, 1.83s, 2036 | | 10,705,987 | | 484,565 |
| IFB Ser. 07-2, Class 2A13, IO, 1.37s, 2037 | | 7,732,450 | | 438,630 |
| Ser. 06-9, Class 2A3, IO, 1.3s, 2036 | | 11,641,853 | | 651,222 |
| IFB Ser. 06-9, Class 2A2, IO, 1.3s, 2037 | | 8,279,401 | | 465,716 |
| IFB Ser. 06-8, Class 2A2, IO, 1.26s, 2036 | | 753,418 | | 28,377 |
| IFB Ser. 06-7, Class 2A4, IO, 1.23s, 2036 | | 16,750,691 | | 618,647 |
| IFB Ser. 06-7, Class 2A5, IO, 1.23s, 2036 | | 15,093,869 | | 785,422 |
| IFB Ser. 06-6, Class 1A2, IO, 1.18s, 2036 | | 6,386,477 | | 241,721 |
| IFB Ser. 06-6, Class 1A3, IO, 1.18s, 2036 | | 8,480,879 | | 406,004 |
| IFB Ser. 06-5, Class 1A3, IO, 0.08s, 2036 | | 2,918,712 | | 13,241 |
| IFB Ser. 06-4, Class 1A3, IO, 0.08s, 2036 | | 2,367,899 | | 19,265 |
| IFB Ser. 06-7, Class 1A3, IO, 0.03s, 2036 | | 6,922,636 | | 38,125 |
| IFB Ser. 06-9, Class 1A6, IO, zero %, 2037 | | 5,992,347 | | 18,824 |
| MASTR Adjustable Rate Mortgages Trust | | | | |
| Ser. 04-7, Class 2A1, 4.688s, 2034 | | 785,218 | | 801,241 |
| Ser. 04-13, Class 3A6, 3.786s, 2034 | | 3,642,000 | | 3,524,111 |
| Ser. 06-OA1, Class X, IO, 2.082s, 2046 | | 7,533,958 | | 249,562 |
| Ser. 04-03, Class 4AX, IO, 1.417s, 2034 | | 3,132,517 | | 45,735 |
| Ser. 05-2, Class 7AX, IO, 0.168s, 2035 | | 8,235,852 | | 20,590 |
| Merrill Lynch Capital Funding Corp. Ser. 06-4, Class XC, IO, | | | | |
| 0.049s, 2049 | | 125,078,263 | | 1,881,060 |
| Merrill Lynch Floating Trust 144A | | | | |
| FRB Ser. 06-1, Class TM, 5.82s, 2022 | | 1,222,000 | | 1,227,831 |
| Ser. 06-1, Class X1TM, IO, 5.569s, 2022 | | 12,038,000 | | 265,980 |
| Ser. 06-1, Class X1A, IO, 1.273s, 2022 | | 47,561,060 | | 683,690 |
| Merrill Lynch Mortgage Investors, Inc. | | | | |
| Ser. 98-C3, Class E, 7.116s, 2030 | | 826,000 | | 888,743 |
| FRB Ser. 05-A9, Class 3A1, 5.284s, 2035 | | 6,485,658 | | 6,473,498 |
| Ser. 96-C2, Class JS, IO, 2.282s, 2028 | | 1,178,920 | | 115,037 |
46
| COLLATERALIZED MORTGAGE OBLIGATIONS (37.1%)* continued | | | |
|
| | | Principal amount | | Value |
|
| Merrill Lynch Mortgage Trust | | | | |
| FRB Ser. 04-BPC1, Class A5, 4.855s, 2041 | $ | 125,000 | $ | 121,658 |
| FRB Ser. 05-MCP1, Class A4, 4.747s, 2043 | | 121,000 | | 116,321 |
| Ser. 05-MCP1, Class XC, IO, 0.095s, 2043 | | 87,968,428 | | 1,233,620 |
| Merrill Lynch Mortgage Trust 144A | | | | |
| Ser. 04-KEY2, Class XC, IO, 0.212s, 2039 | | 19,884,069 | | 435,741 |
| Ser. 05-LC1, Class X, IO, 0.067s, 2044 | | 48,654,424 | | 446,632 |
| Merrill Lynch/Countrywide Commercial Mortgage Trust 144A | | | | |
| Ser. 06-1, Class X, IO, 0.039s, 2039 | | 126,898,000 | | 674,146 |
| Mezz Cap Commercial Mortgage Trust 144A | | | | |
| Ser. 04-C1, Class X, IO, 8.047s, 2037 | | 4,073,163 | | 1,321,232 |
| Ser. 06-C4, Class X, IO, 4.33s, 2016 | | 12,962,910 | | 4,430,666 |
| Ser. 04-C2, Class X, IO, 2.594s, 2040 | | 1,986,707 | | 614,637 |
| Ser. 05-C3, Class X, IO, 2.279s, 2044 | | 3,718,282 | | 1,120,713 |
| Morgan Stanley Capital 144A | | | | |
| Ser. 05-RR6, Class X, IO, 1.708s, 2043 | | 13,441,658 | | 732,990 |
| Ser. 05-HQ6, Class X1, IO, 0.083s, 2042 | | 112,454,023 | | 1,209,551 |
| Morgan Stanley Capital I | | | | |
| Ser. 07-HQ11, Class A4, 5.447s, 2044 | | 3,820,000 | | 3,834,773 |
| Ser. 05-HQ6, Class A4A, 4.989s, 2042 | | 5,354,000 | | 5,233,226 |
| Ser. 04-HQ4, Class A7, 4.97s, 2040 | | 2,771,000 | | 2,712,393 |
| Morgan Stanley Capital I 144A | | | | |
| Ser. 98-HF1, Class F, 7.18s, 2030 | | 498,000 | | 502,116 |
| Ser. 04-RR, Class F5, 6s, 2039 | | 1,350,000 | | 1,196,754 |
| Ser. 04-RR, Class F6, 6s, 2039 | | 2,030,000 | | 1,713,447 |
| Morgan Stanley Mortgage Loan Trust Ser. 05-5AR, Class 2A1, | | | | |
| 5.387s, 2035 | | 6,222,069 | | 6,220,785 |
| Mortgage Capital Funding, Inc. FRB Ser. 98-MC2, Class E, | | | | |
| 7.086s, 2030 | | 1,389,000 | | 1,418,147 |
| Permanent Financing PLC FRB Ser. 8, Class 2C, 5.74s, 2042 | | | | |
| (United Kingdom) | | 2,413,000 | | 2,412,838 |
| PNC Mortgage Acceptance Corp. 144A | | | | |
| Ser. 99-CM1, Class B3, 7.1s, 2032 | | 4,971,000 | | 5,132,905 |
| Ser. 00-C1, Class J, 6 5/8s, 2010 | | 309,000 | | 298,568 |
| Ser. 00-C2, Class J, 6.22s, 2033 | | 1,499,000 | | 1,522,669 |
| Pure Mortgages 144A | | | | |
| FRB Ser. 04-1A, Class F, 8.86s, 2034 (Ireland) | | 3,491,000 | | 3,569,548 |
| Ser. 04-1A, Class E, 6.61s, 2034 (Ireland) | | 1,374,000 | | 1,374,824 |
| Residential Asset Securitization Trust IFB Ser. 06-A7CB, | | | | |
| Class 1A6, IO, 0.23s, 2036 | | 1,634,828 | | 20,499 |
| Residential Funding Mortgage Securities I Ser. 04-S5, Class 2A1, | | | | |
| 4 1/2s, 2019 | | 5,258,368 | | 5,080,852 |
| Salomon Brothers Mortgage Securities VII 144A Ser. 02-KEY2, | | | | |
| Class X1, IO, 0.953s, 2036 | | 30,284,903 | | 1,422,603 |
| SBA CMBS Trust 144A Ser. 05-1A, Class D, 6.219s, 2035 | | 770,000 | | 778,192 |
| STRIPS 144A | | | | |
| Ser. 03-1A, Class L, 5s, 2018 (Cayman Islands) | | 993,000 | | 886,718 |
| Ser. 03-1A, Class M, 5s, 2018 (Cayman Islands) | | 673,000 | | 577,834 |
| Ser. 04-1A, Class L, 5s, 2018 (Cayman Islands) | | 443,000 | | 395,049 |
47
| COLLATERALIZED MORTGAGE OBLIGATIONS (37.1%)* continued | | | | |
|
| | | Principal amount | | Value |
|
| Structured Adjustable Rate Mortgage Loan Trust | | | | |
| FRB Ser. 05-18, Class 6A1, 5.261s, 2035 | $ | 3,151,642 | $ | 3,142,755 |
| Ser. 04-8, Class 1A3, 4.646s, 2034 | | 43,111 | | 43,905 |
| Ser. 05-9, Class AX, IO, 1.018s, 2035 | | 33,894,353 | | 505,026 |
| Wachovia Bank Commercial Mortgage Trust | | | | |
| Ser. 06-C23, Class A4, 5.418s, 2045 | | 15,955,000 | | 16,016,419 |
| Ser. 05-C17, Class A4, 5.083s, 2042 | | 8,696,000 | | 8,554,820 |
| Ser. 04-C15, Class A4, 4.803s, 2041 | | 4,128,000 | | 4,001,100 |
| Ser. 06-C28, Class XC, IO, 0.564s, 2048 | | 28,389,676 | | 781,852 |
| Ser. 06-C29, IO, 0.528s, 2048 | | 136,920,355 | | 4,063,796 |
| Wachovia Bank Commercial Mortgage Trust 144A | | | | |
| FRB Ser. 05-WL5A, Class L, 8.62s, 2018 | | 944,000 | | 943,830 |
| Ser. 03-C3, Class IOI, IO, 0.419s, 2035 | | 22,419,974 | | 675,603 |
| Ser. 05-C18, Class XC, IO, 0.094s, 2042 | | 50,568,302 | | 523,888 |
| Ser. 06-C23, Class XC, IO, 0.061s, 2045 | | 296,377,819 | | 1,834,579 |
| Ser. 06-C26, Class XC, IO, 0.045s, 2045 | | 22,395,103 | | 85,325 |
| WAMU Commercial Mortgage Securities Trust 144A Ser. 07-SL2, | | | | |
| Class X, IO, 0.856s, 2049 | | 21,743,000 | | 1,031,943 |
| Washington Mutual 144A Ser. 06-SL1, Class X, IO, 0.938s, 2043 | | 10,392,373 | | 553,719 |
| Washington Mutual Asset Securities Corp. 144A | | | | |
| Ser. 05-C1A, Class G, 5.72s, 2036 | | 219,000 | | 207,306 |
| Ser. 06-SL1, Class A, 5.421s, 2043 | | 7,489,277 | | 7,497,761 |
| Washington Mutual Multi-Fam., Mtge. 144A Ser. 01-1, Class B5, | | | | |
| 7.21s, 2031 (Cayman Islands) | | 1,793,000 | | 1,831,571 |
| Wells Fargo Mortgage Backed Securities Trust | | | | |
| Ser. 06-AR10, Class 3A1, 5.259s, 2036 | | 4,257,862 | | 4,224,651 |
| Ser. 05-AR2, Class 2A1, 4.545s, 2035 | | 1,957,953 | | 1,930,737 |
| Ser. 04-R, Class 2A1, 4.361s, 2034 | | 1,993,431 | | 1,961,137 |
| Ser. 05-AR9, Class 1A2, 4.354s, 2035 | | 1,631,323 | | 1,603,564 |
| Ser. 05-AR12, Class 2A5, 4.319s, 2035 | | 26,265,000 | | 25,662,371 |
| Ser. 05-AR10, Class 2A18, IO, 0.61s, 2035 | | 56,771,000 | | 569,581 |
|
| Total collateralized mortgage obligations (cost $908,823,968) | | | $ | 905,835,600 |
|
| |
| |
| CORPORATE BONDS AND NOTES (10.7%)* | | | | |
|
| | | Principal amount | | Value |
|
| Basic Materials (0.4%) | | | | |
| Alcoa, Inc. notes 5 3/8s, 2013 | $ | 800,000 | $ | 800,126 |
| Dow Chemical Co. (The) sr. notes 6 1/8s, 2011 | | 800,000 | | 821,920 |
| Dow Chemical Co. (The) Pass Through Trust 144A | | | | |
| company guaranty 4.027s, 2009 | | 1,950,000 | | 1,889,446 |
| Georgia-Pacific Corp. debs. 9 1/2s, 2011 | | 1,140,000 | | 1,259,700 |
| Georgia-Pacific Corp. notes 8 1/8s, 2011 | | 815,000 | | 859,825 |
| Lafarge SA notes 6 1/2s, 2016 (France) | | 440,000 | | 465,740 |
| Lubrizol Corp. (The) sr. notes 5 1/2s, 2014 | | 570,000 | | 559,605 |
| Newmont Mining Corp. notes 5 7/8s, 2035 | | 830,000 | | 779,030 |
| Potash Corp. of Saskatchewan notes 5 7/8s, 2036 (Canada) | | 1,095,000 | | 1,075,478 |
| Westvaco Corp./NY unsec. notes 7 1/2s, 2027 | | 240,000 | | 253,195 |
48
| CORPORATE BONDS AND NOTES (10.7%)* continued | | | | |
|
| | | Principal amount | | Value |
|
| Basic Materials continued | | | | |
| Weyerhaeuser Co. debs. 7 3/8s, 2032 | $ | 450,000 | $ | 475,813 |
| Xstrata Finance Canada, Ltd. 144A company guaranty 5.8s, | | | | |
| 2016 (Canada) | | 1,010,000 | | 1,015,849 |
| | | | | 10,255,727 |
|
| |
| Capital Goods (0.2%) | | | | |
| L-3 Communications Corp. sr. sub. notes 5 7/8s, 2015 | | 640,000 | | 623,200 |
| L-3 Communications Corp. sr. sub. notes Class B, 6 3/8s, 2015 | | 750,000 | | 746,250 |
| Legrand SA debs. 8 1/2s, 2025 (France) | | 1,160,000 | | 1,363,000 |
| Lockheed Martin Corp. notes Ser. B, 6.15s, 2036 | | 750,000 | | 779,771 |
| | | | | 3,512,221 |
|
| |
| Communication Services (1.2%) | | | | |
| Ameritech Capital Funding company guaranty 6 1/4s, 2009 | | 1,135,000 | | 1,153,728 |
| AT&T Corp. sr. notes 8s, 2031 | | 825,000 | | 1,033,737 |
| AT&T Wireless Services, Inc. sr. notes 8 3/4s, 2031 | | 2,995,000 | | 3,918,829 |
| France Telecom notes 8 1/2s, 2031 (France) | | 560,000 | | 737,599 |
| Nextel Communications, Inc. sr. notes Ser. E, 6 7/8s, 2013 | | 825,000 | | 847,835 |
| Pacific Bell debs. 7 1/8s, 2026 | | 1,000,000 | | 1,086,265 |
| Rogers Wireless, Inc. sec. notes 6 3/8s, 2014 (Canada) | | 1,020,000 | | 1,053,150 |
| Southwestern Bell Telephone debs. 7s, 2027 | | 1,245,000 | | 1,273,327 |
| Sprint Capital Corp. company guaranty 8 3/4s, 2032 | | 400,000 | | 472,058 |
| Sprint Capital Corp. company guaranty 6.9s, 2019 | | 920,000 | | 948,004 |
| Sprint Capital Corp. company guaranty 6 7/8s, 2028 | | 2,410,000 | | 2,391,472 |
| Telecom Italia Capital SA company guaranty 7.2s, 2036 (Luxembourg) | 515,000 | | 547,486 |
| Telecom Italia Capital SA company guaranty 5 1/4s, 2013 | | | | |
| (Luxembourg) | | 255,000 | | 249,758 |
| Telecom Italia Capital SA company guaranty 4s, 2010 (Luxembourg) | 525,000 | | 509,308 |
| Telecom Italia Capital SA notes 5 1/4s, 2015 (Luxembourg) | | 1,315,000 | | 1,263,940 |
| Telefonica Emisones SAU company guaranty 7.045s, 2036 (Spain) | | 1,055,000 | | 1,134,825 |
| Telefonica Emisones SAU company guaranty 6.421s, 2016 (Spain) | | 370,000 | | 387,890 |
| Telefonica Europe BV company guaranty 8 1/4s, 2030 (Netherlands) | 725,000 | | 870,943 |
| Telus Corp. notes 8s, 2011 (Canada) | | 1,460,000 | | 1,595,176 |
| Verizon Communications, Inc. sr. unsec. bond 6 1/4s, 2037 | | 1,475,000 | | 1,478,080 |
| Verizon Communications, Inc. sr. unsec. bond 5 1/2s, 2017 | | 1,480,000 | | 1,473,222 |
| Verizon New England, Inc. sr. notes 6 1/2s, 2011 | | 2,600,000 | | 2,711,160 |
| Verizon New Jersey, Inc. debs. 8s, 2022 | | 1,050,000 | | 1,196,138 |
| Verizon Pennsylvania, Inc. debs. 8.35s, 2030 | | 1,305,000 | | 1,552,472 |
| Verizon Virginia Inc. debs. Ser. A, 4 5/8s, 2013 | | 364,000 | | 347,099 |
| | | | | 30,233,501 |
|
| |
| Conglomerates (—%) | | | | |
| Siemens Financieringsmaatschappij 144A notes 5 3/4s, | | | | |
| 2016 (Netherlands) | | 920,000 | | 933,367 |
|
| |
| Consumer Cyclicals (0.7%) | | | | |
| Chrysler Corp. debs. 7.45s, 2027 | | 850,000 | | 974,440 |
| D.R. Horton, Inc. sr. notes 7 7/8s, 2011 | | 765,000 | | 815,975 |
| D.R. Horton, Inc. sr. notes 5 7/8s, 2013 | | 890,000 | | 867,716 |
49
| CORPORATE BONDS AND NOTES (10.7%)* continued | | | | |
|
| | | Principal amount | | Value |
|
| Consumer Cyclicals continued | | | | |
| DaimlerChrysler NA Holding Corp. company guaranty 7.2s, 2009 | $ | 3,185,000 | $ | 3,316,075 |
| DaimlerChrysler NA Holding Corp. notes Ser. MTN, | | | | |
| 5 3/4s, 2011 | | 2,345,000 | | 2,380,768 |
| Federated Retail Holdings, Inc. company guaranty 5.9s, 2016 | | 780,000 | | 780,961 |
| Federated Retail Holdings, Inc. company guaranty 5.35s, 2012 | | 1,760,000 | | 1,753,118 |
| Ford Motor Credit Corp. notes 6 3/8s, 2008 | | 1,355,000 | | 1,341,161 |
| JC Penney Co., Inc. debs. 7.65s, 2016 | | 180,000 | | 200,882 |
| JC Penney Co., Inc. notes 6 7/8s, 2015 | | 465,000 | | 492,906 |
| JC Penney Co., Inc. sr. notes 6 3/8s, 2036 | | 860,000 | | 857,178 |
| JC Penney Co., Inc. sr. notes 5 3/4s, 2018 | | 430,000 | | 429,011 |
| Office Depot, Inc. notes 6 1/4s, 2013 | | 751,000 | | 768,316 |
| Omnicom Group, Inc. sr. notes 5.9s, 2016 | | 885,000 | | 906,586 |
| Wyndham Worldwide Corp. 144A sr. unsec. 6s, 2016 | | 1,050,000 | | 1,041,659 |
| | | | | 16,926,752 |
|
| |
| Consumer Staples (1.3%) | | | | |
| Comcast Corp. company guaranty 5 7/8s, 2018 | | 490,000 | | 494,430 |
| Cox Communications, Inc. notes 7 1/8s, 2012 | | 1,125,000 | | 1,214,939 |
| Cox Communications, Inc. 144A bonds 6.45s, 2036 | | 945,000 | | 953,687 |
| Cox Communications, Inc. 144A notes 5 7/8s, 2016 | | 900,000 | | 907,344 |
| Cox Enterprises, Inc. 144A notes 7 7/8s, 2010 | | 1,450,000 | | 1,559,101 |
| CVS Corp. 144A pass-through certificates 6.117s, 2013 | | 1,731,820 | | 1,776,467 |
| Delhaize America, Inc. company guaranty 8 1/8s, 2011 | | 885,000 | | 979,031 |
| Diageo PLC company guaranty 8s, 2022 | | 1,110,000 | | 1,344,587 |
| Estee Lauder Cos Inc. (The) sr. unsec. 6s, 2037 | | 1,440,000 | | 1,434,528 |
| Estee Lauder Cos Inc. (The) sr. unsec. 5.55s, 2017 | | 380,000 | | 381,330 |
| Fortune Brands, Inc. notes 5 3/8s, 2016 | | 1,240,000 | | 1,177,473 |
| News America Holdings, Inc. company guaranty 7 3/4s, 2024 | | 1,430,000 | | 1,617,662 |
| News America Holdings, Inc. debs. 7 3/4s, 2045 | | 2,810,000 | | 3,201,174 |
| News America, Inc. company guaranty 6.4s, 2035 | | 180,000 | | 181,402 |
| Sara Lee Corp. notes 6 1/4s, 2011 | | 770,000 | | 795,621 |
| TCI Communications, Inc. debs. 9.8s, 2012 | | 1,580,000 | | 1,873,433 |
| TCI Communications, Inc. debs. 8 3/4s, 2015 | | 2,290,000 | | 2,748,213 |
| TCI Communications, Inc. debs. 7 7/8s, 2013 | | 1,010,000 | | 1,133,186 |
| Time Warner Cable, Inc. 144A sr. unsec. 6.55s, 2037 | | 790,000 | | 803,050 |
| Time Warner Cable, Inc. 144A sr. unsec. 5.85s, 2017 | | 480,000 | | 484,208 |
| Time Warner Entertainment Co., LP debs. 8 3/8s, 2023 | | 90,000 | | 107,199 |
| Time Warner, Inc. company guaranty 6 1/2s, 2036 | | 585,000 | | 585,439 |
| Time Warner, Inc. company guaranty 5 7/8s, 2016 | | 200,000 | | 201,373 |
| Time Warner, Inc. debs. 9.15s, 2023 | | 1,110,000 | | 1,395,253 |
| Time Warner, Inc. debs. 9 1/8s, 2013 | | 2,735,000 | | 3,209,736 |
| Viacom, Inc. sr. notes 5 3/4s, 2011 | | 810,000 | | 821,039 |
| | | | | 31,380,905 |
|
| |
| Energy (0.6%) | | | | |
| Anadarko Petroleum Corp. sr. notes 6.45s, 2036 | | 1,175,000 | | 1,180,420 |
| Anadarko Petroleum Corp. sr. notes 5.95s, 2016 | | 965,000 | | 973,036 |
| Chesapeake Energy Corp. sr. unsecd. notes 7 5/8s, 2013 | | 1,370,000 | | 1,452,200 |
50
| CORPORATE BONDS AND NOTES (10.7%)* continued | | | | |
|
| | | Principal amount | | Value |
|
| Energy continued | | | | |
| Devon Financing Corp. ULC company guaranty 7 7/8s, 2031 | $ | 450,000 | $ | 544,142 |
| Enterprise Products Operating LP sr. notes Ser. B, 5.6s, 2014 | | 700,000 | | 702,188 |
| Forest Oil Corp. sr. notes 8s, 2011 | | 755,000 | | 790,863 |
| Hess Corp. bonds 7 7/8s, 2029 | | 1,720,000 | | 2,019,648 |
| Motiva Enterprises, LLC 144A sr. notes 5.2s, 2012 | | 715,000 | | 713,608 |
| Newfield Exploration Co. sr. sub. notes 6 5/8s, 2016 | | 900,000 | | 904,500 |
| Peabody Energy Corp. sr. notes 5 7/8s, 2016 | | 1,095,000 | | 1,048,463 |
| Premcor Refining Group, Inc. sr. notes 7 1/2s, 2015 | | 2,045,000 | | 2,110,739 |
| Sunoco, Inc. notes 4 7/8s, 2014 | | 770,000 | | 733,303 |
| Valero Energy Corp. sr. unsecd. notes 7 1/2s, 2032 | | 315,000 | | 365,302 |
| Weatherford International, Ltd. company guaranty 6 1/2s, 2036 | | 1,120,000 | | 1,140,561 |
| Weatherford International, Ltd. sr. notes 5 1/2s, 2016 | | 650,000 | | 638,415 |
| | | | | 15,317,388 |
|
| |
| Financial (3.2%) | | | | |
| Amvescap PLC company guaranty 5 5/8s, 2012 (United Kingdom) | | 720,000 | | 726,297 |
| Bank of America Corp. sub. notes 7 3/4s, 2015 | | 2,415,000 | | 2,777,153 |
| Bank of America NA sub. notes 5.3s, 2017 | | 2,770,000 | | 2,738,397 |
| Block Financial Corp. notes 5 1/8s, 2014 | | 980,000 | | 920,119 |
| Bosphorus Financial Services, Ltd. 144A sec. FRN 7.16s, | | | | |
| 2012 (Cayman Islands) | | 2,907,000 | | 2,936,337 |
| Brandywine Operating Partnership LP sr. unsec. 5.7s, 2017 (R) | | 1,160,000 | | 1,158,051 |
| Capital One Financial Corp. sub. notes 6.15s, 2016 | | 1,635,000 | | 1,659,525 |
| CIT Group, Inc. sr. notes 5s, 2015 | | 690,000 | | 659,058 |
| CIT Group, Inc. sr. notes 5s, 2014 | | 4,325,000 | | 4,173,599 |
| Citigroup, Inc. sub. notes 5s, 2014 | | 2,829,000 | | 2,768,137 |
| CNA Financial Corp. unsecd. notes 6 1/2s, 2016 | | 985,000 | | 1,021,635 |
| CNA Financial Corp. unsecd. notes 6s, 2011 | | 985,000 | | 1,007,179 |
| Colonial Properties Trust notes 6 1/4s, 2014 (R) | | 985,000 | | 1,018,662 |
| Deutsche Bank Capital Funding Trust VII 144A FRB 5.628s, 2049 | | 1,540,000 | | 1,521,070 |
| Developers Diversified Realty Corp. unsecd. notes | | | | |
| 5 3/8s, 2012 (R) | | 485,000 | | 484,974 |
| Dresdner Funding Trust I 144A bonds 8.151s, 2031 | | 1,940,000 | | 2,345,326 |
| Equity One, Inc. notes 5 3/8s, 2015 (R) | | 965,000 | | 939,329 |
| ERP Operating LP notes 6.584s, 2015 | | 735,000 | | 788,626 |
| Fund American Cos., Inc. notes 5 7/8s, 2013 | | 2,165,000 | | 2,154,575 |
| GATX Financial Corp. notes 5.8s, 2016 | | 755,000 | | 752,756 |
| General Motors Acceptance Corp. bonds 8s, 2031 (S) | | 1,380,000 | | 1,481,202 |
| General Motors Acceptance Corp. FRN 6.306s, 2007 | | 2,160,000 | | 2,160,814 |
| General Motors Acceptance Corp. notes 7s, 2012 (S) | | 1,380,000 | | 1,385,262 |
| Greenpoint Capital Trust I company guaranty 9.1s, 2027 | | 790,000 | | 827,658 |
| Health Care REIT, Inc. sr. notes 6s, 2013 (R) | | 520,000 | | 525,556 |
| Heritage Property Investment Trust company guaranty | | | | |
| 5 1/8s, 2014 (R) | | 985,000 | | 954,556 |
| Highwood Properties, Inc. 144A bonds 5.85s, 2017 (R) | | 1,385,000 | | 1,377,366 |
| Hospitality Properties Trust notes 6 3/4s, 2013 (R) | | 1,005,000 | | 1,058,481 |
| HRPT Properties Trust bonds 5 3/4s, 2014 (R) | | 710,000 | | 713,402 |
| HRPT Properties Trust notes 6 1/4s, 2016 (R) | | 660,000 | | 686,950 |
| iStar Financial, Inc. sr. unsec 5.15s, 2012 (R) | | 800,000 | | 783,729 |
51
| CORPORATE BONDS AND NOTES (10.7%)* continued | | | | |
|
| | | Principal amount | | Value |
|
| Financial continued | | | | |
| iStar Financial, Inc. sr. unsecd. notes 5 7/8s, 2016 (R) | $ | 2,205,000 | $ | 2,192,050 |
| Kimco Realty Corp. sr. sub. notes 5.7s, 2017 (R) | | 810,000 | | 812,414 |
| Lehman Brothers Holdings, Inc. sub. notes 5 3/4s, 2017 | | 3,560,000 | | 3,578,747 |
| Liberty Mutual Group 144A notes 6 1/2s, 2035 | | 2,825,000 | | 2,709,212 |
| Loews Corp. notes 5 1/4s, 2016 | | 630,000 | | 618,588 |
| MetLife, Inc. notes 5.7s, 2035 | | 1,085,000 | | 1,051,679 |
| Mizuho Financial Group Cayman, Ltd. bank guaranty 8 3/8s, | | | | |
| 2049 (Cayman Islands) | | 1,015,000 | | 1,069,810 |
| Nationwide Financial Services, Inc. notes 5 5/8s, 2015 | | 815,000 | | 813,377 |
| Nationwide Health Properties, Inc. notes 6 1/2s, 2011 (R) | | 890,000 | | 918,440 |
| Nuveen Investments, Inc. sr. notes 5 1/2s, 2015 | | 640,000 | | 630,275 |
| OneAmerica Financial Partners, Inc. 144A bonds 7s, 2033 | | 1,670,000 | | 1,735,845 |
| PNC Bank NA notes 4 7/8s, 2017 | | 1,300,000 | | 1,241,638 |
| ProLogis Trust sr. notes 5 3/4s, 2016 (R) | | 1,260,000 | | 1,283,599 |
| Prudential Holdings LLC 144A bonds 8.695s, 2023 | | 2,035,000 | | 2,559,643 |
| Rouse Co LP/TRC Co-Issuer Inc. 144A sr. notes 6 3/4s, 2013 (R) | | 935,000 | | 954,520 |
| Rouse Co. (The) notes 7.2s, 2012 (R) | | 880,000 | | 921,167 |
| Simon Property Group LP unsub. bonds 5 3/4s, 2015 (R) | | 950,000 | | 967,320 |
| SLM Corp. notes Ser. MTNA, 4 1/2s, 2010 | | 1,040,000 | | 991,935 |
| Sovereign Bancorp, Inc. sr. notes 4.8s, 2010 | | 920,000 | | 905,629 |
| UBS AG/Jersey Branch FRN 8.35s, 2008 (Jersey) | | 5,000,000 | | 5,106,250 |
| Washington Mutual Bank/Henderson NV sub. notes Ser. BKNT, | | | | |
| 5.95s, 2013 | | 1,390,000 | | 1,416,557 |
| Westfield Group sr. notes 5.7s, 2016 (Australia) | | 1,175,000 | | 1,188,577 |
| Willis Group North America, Inc. company guaranty 6.2s, 2017 | | 995,000 | | 1,000,614 |
| | | | | 79,173,667 |
|
| |
| Health Care (0.3%) | | | | |
| Bayer Corp. 144A FRB 6.2s, 2008 | | 1,330,000 | | 1,333,272 |
| Hospira, Inc. sr. notes 6.05s, 2017 | | 770,000 | | 777,926 |
| Hospira, Inc. sr. notes 5.55s, 2012 | | 1,075,000 | | 1,080,868 |
| Ventas Realty LP/Capital Corp. company guaranty 6 3/4s, 2010 (R) | | 370,000 | | 378,325 |
| Ventas Realty LP/Capital Corp. sr. notes 6 3/4s, 2017 (R) | | 845,000 | | 866,125 |
| Wyeth notes 5.95s, 2037 | | 2,315,000 | | 2,314,817 |
| | | | | 6,751,333 |
|
| |
| Technology (0.2%) | | | | |
| Arrow Electronics, Inc. debs. 7 1/2s, 2027 | | 1,015,000 | | 1,093,654 |
| Avnet, Inc. notes 6s, 2015 | | 960,000 | | 953,089 |
| Xerox Corp. sr. notes 7 1/8s, 2010 | | 700,000 | | 733,808 |
| Xerox Corp. sr. notes 6.4s, 2016 | | 1,430,000 | | 1,473,416 |
| | | | | 4,253,967 |
|
| |
| Transportation (0.2%) | | | | |
| American Airlines, Inc. pass-through certificates Ser. 01-2, | | | | |
| 7.858s, 2011 | | 705,000 | | 763,868 |
| Continental Airlines, Inc. pass-through certificates Ser. 97-4A, | | | | |
| 6.9s, 2018 | | 1,501,188 | | 1,583,753 |
52
| CORPORATE BONDS AND NOTES (10.7%)* continued | | | | |
|
| | | Principal amount | | Value |
|
| Transportation continued | | | | |
| Continental Airlines, Inc. pass-through certificates Ser. 98-1A, | | | | |
| 6.648s, 2017 | $ | 538,168 | $ | 557,676 |
| Continental Airlines, Inc. pass-through certificates Ser. A, | | | | |
| 5.983s, 2022 | | 645,000 | | 646,613 |
| Ryder System, Inc. notes Ser. MTN, 5.95s, 2011 | | 610,000 | | 621,479 |
| Ryder System, Inc. notes Ser. MTN, 5.85s, 2016 | | 815,000 | | 801,059 |
| Union Pacific Corp. 144A pass-through certificates 5.214s, 2014 | | 470,000 | | 464,976 |
| | | | | 5,439,424 |
|
| |
| Utilities & Power (2.4%) | | | | |
| AEP Texas North Co. sr. notes Ser. B, 5 1/2s, 2013 | | 840,000 | | 842,003 |
| Appalachian Power Co. sr. notes 5.8s, 2035 | | 960,000 | | 929,587 |
| Arizona Public Services Co. notes 6 1/2s, 2012 | | 1,410,000 | | 1,469,785 |
| Atmos Energy Corp. notes 4.95s, 2014 | | 1,525,000 | | 1,453,638 |
| Beaver Valley II Funding debs. 9s, 2017 | | 1,435,000 | | 1,629,270 |
| Boardwalk Pipelines LP company guaranty 5 7/8s, 2016 | | 1,620,000 | | 1,635,589 |
| CenterPoint Energy Resources Corp. notes 7 3/4s, 2011 | | 1,735,000 | | 1,879,656 |
| CenterPoint Energy Resources Corp. sr. notes Ser. B, | | | | |
| 7 7/8s, 2013 | | 600,000 | | 670,081 |
| Cleveland Electric Illuminating Co. (The) sr. unsec. bond | | | | |
| 5.95s, 2036 | | 2,395,000 | | 2,309,666 |
| Cleveland Electric Illuminating Co. (The) 144A sr. notes Ser. D, | | | | |
| 7.88s, 2017 | | 670,000 | | 785,331 |
| Commonwealth Edison Co. 1st mtge. 5.9s, 2036 | | 1,575,000 | | 1,500,778 |
| Consolidated Natural Gas Co. sr. notes 5s, 2014 | | 650,000 | | 632,796 |
| Consumers Energy Co. 1st mtge. Ser. B, 5 3/8s, 2013 | | 1,420,000 | | 1,419,597 |
| Dayton Power & Light Co. (The) 1st mtge. 5 1/8s, 2013 | | 1,035,000 | | 1,023,554 |
| El Paso Natural Gas Co. 144A sr. unsec. bond 5.95s, 2017 | | 165,000 | | 166,473 |
| Enbridge Energy Partners LP sr. unsec. notes 5 7/8s, 2016 | | 1,045,000 | | 1,051,402 |
| Entergy Gulf States, Inc. 1st mtge. 5 1/4s, 2015 | | 1,325,000 | | 1,265,119 |
| Indianapolis Power & Light 144A 1st mtge. 6.3s, 2013 | | 680,000 | | 708,762 |
| Indiantown Cogeneration LP 1st mtge. Ser. A-10, 9.77s, 2020 | | 1,065,000 | | 1,236,050 |
| Ipalco Enterprises, Inc. sec. notes 8 3/8s, 2008 | | 525,000 | | 543,375 |
| ITC Holdings Corp. 144A notes 5 7/8s, 2016 | | 1,470,000 | | 1,479,934 |
| Kansas Gas & Electric bonds 5.647s, 2021 | | 500,000 | | 488,265 |
| Kinder Morgan, Inc. notes 6 3/4s, 2011 | | 750,000 | | 789,317 |
| Kinder Morgan, Inc. sr. notes 6 1/2s, 2012 | | 685,000 | | 705,115 |
| MidAmerican Energy Holdings Co. bonds 6 1/8s, 2036 | | 3,030,000 | | 3,079,822 |
| National Fuel Gas Co. notes 5 1/4s, 2013 | | 980,000 | | 972,488 |
| Nevada Power Co. 2nd mtge. 9s, 2013 | | 755,000 | | 812,721 |
| Nevada Power Co. general ref. mtge. Ser. L, 5 7/8s, 2015 | | 580,000 | | 584,402 |
| Northwestern Corp. sec. notes 5 7/8s, 2014 | | 1,475,000 | | 1,465,747 |
| Oncor Electric Delivery Co. debs. 7s, 2022 | | 800,000 | | 863,962 |
| Oncor Electric Delivery Co. sec. notes 7 1/4s, 2033 | | 490,000 | | 553,306 |
| Pacific Gas & Electric Co. sr. unsub. 5.8s, 2037 | | 1,070,000 | | 1,055,866 |
| PacifiCorp Sinking Fund 1st mtge. 5.45s, 2013 | | 1,570,000 | | 1,575,748 |
| Potomac Edison Co. 144A 1st mtge. 5.8s, 2016 | | 1,465,000 | | 1,494,603 |
| Power Receivable Finance, LLC 144A sr. notes 6.29s, 2012 | | 1,278,300 | | 1,290,699 |
| PPL Energy Supply LLC bonds Ser. A, 5.7s, 2015 | | 855,000 | | 847,635 |
53
| CORPORATE BONDS AND NOTES (10.7%)* continued | | | | |
|
| | | Principal amount | | Value |
|
| Utilities & Power continued | | | | |
| Progress Energy, Inc. sr. unsecd. notes 5 5/8s, 2016 | $ | 1,295,000 | $ | 1,308,631 |
| Public Service Co. of Colorado sr. notes Ser. A, 6 7/8s, 2009 | | 1,605,000 | | 1,661,762 |
| Public Service Co. of New Mexico sr. notes 4.4s, 2008 | | 785,000 | | 779,765 |
| Southern California Edison Co. notes 6.65s, 2029 | | 1,410,000 | | 1,547,475 |
| Southern California Edison Co. 06-E 1st mtge. 5.55s, 2037 | | 1,245,000 | | 1,207,208 |
| Southern Natural Gas. Co. 144A notes 5.9s, 2017 | | 630,000 | | 631,720 |
| Spectra Energy Capital, LLC sr. notes 8s, 2019 | | 1,080,000 | | 1,245,254 |
| Teco Energy, Inc. notes 7.2s, 2011 | | 1,485,000 | | 1,581,525 |
| TransAlta Corp. notes 5 3/4s, 2013 (Canada) | | 880,000 | | 876,116 |
| TXU Energy Co. 144A sr. unsec. FRN 5.85s, 2008 | | 4,370,000 | | 4,369,719 |
| Westar Energy, Inc. 1st mtge. 5.15s, 2017 | | 195,000 | | 185,987 |
| Westar Energy, Inc. 1st mtge. 5.1s, 2020 | | 1,015,000 | | 947,341 |
| | | | | 57,554,645 |
|
| |
| Total corporate bonds and notes (cost $260,025,948) | | | $ | 261,732,897 |
| |
| |
| |
| ASSET-BACKED SECURITIES (10.7%)* | | | | |
|
| | | Principal amount | | Value |
|
| Advanta Business Card Master Trust FRB Ser. 04-C1, Class C, | | | | |
| 6.37s, 2013 | $ | 1,939,000 | $ | 1,966,030 |
| Aegis Asset Backed Securities Trust 144A | | | | |
| Ser. 04-5N, Class Note, 5s, 2034 | | 81,892 | | 78,718 |
| Ser. 04-6N, Class Note, 4 3/4s, 2035 | | 79,727 | | 76,588 |
| AFC Home Equity Loan Trust Ser. 99-2, Class 1A, 5.73s, 2029 | | 4,827,210 | | 4,842,501 |
| American Express Credit Account Master Trust 144A | | | | |
| Ser. 04-C, Class C, 5.82s, 2012 | | 5,191,087 | | 5,202,508 |
| Ameriquest Mortgage Securities, Inc. FRB Ser. 06-R1, Class M10, | | | | |
| 7.82s, 2036 | | 1,245,000 | | 983,550 |
| Arcap REIT, Inc. 144A | | | | |
| Ser. 03-1A, Class E, 7.11s, 2038 | | 1,993,000 | | 2,007,114 |
| Ser. 04-1A, Class E, 6.42s, 2039 | | 1,469,204 | | 1,462,151 |
| Asset Backed Funding Certificates 144A FRB Ser. 06-OPT3, | | | | |
| Class B, 7.82s, 2036 | | 166,000 | | 113,423 |
| Asset Backed Funding Corp. NIM Trust 144A FRB Ser. 05-OPT1, | | | | |
| Class B1, 7.82s, 2035 | | 587,000 | | 411,603 |
| Asset Backed Securities Corp. Home Equity Loan Trust FRB | | | | |
| Ser. 05-HE1, Class A3, 5.61s, 2035 | | 83,823 | | 83,834 |
| Aviation Capital Group Trust 144A FRB Ser. 03-2A, Class G1, | | | | |
| 6.02s, 2033 | | 1,430,912 | | 1,436,949 |
| Bank One Issuance Trust FRB Ser. 03-C4, Class C4, 6.35s, 2011 | | 1,390,000 | | 1,402,543 |
| Bay View Auto Trust Ser. 05-LJ2, Class D, 5.27s, 2014 | | 534,000 | | 528,751 |
| Bayview Commercial Asset Trust 144A Ser. 06-4A, Class IO, IO, | | | | |
| 1.14s, 2036 | | 2,792,520 | | 386,205 |
| Bayview Financial Acquisition Trust | | | | |
| FRB Ser. 03-G, Class A1, 5.92s, 2039 | | 6,300,000 | | 6,300,960 |
| FRB Ser. 04-D, Class A, 5.71s, 2044 | | 2,323,772 | | 2,324,134 |
| Ser. 05-B, Class A, IO, 4.412s, 2039 | | 5,585,372 | | 88,106 |
| Ser. 04-D, Class A, IO, 3.938s, 2007 | | 8,949,174 | | 27,311 |
54
| ASSET-BACKED SECURITIES (10.7%)* continued | | | | |
|
| | | Principal amount | | Value |
|
| Bayview Financial Asset Trust 144A | | | | |
| FRB Ser. 03-SSRA, Class M, 6.67s, 2038 | $ | 1,294,213 | $ | 1,301,978 |
| FRB Ser. 03-SSRA, Class A, 6.02s, 2038 | | 1,133,241 | | 1,137,547 |
| FRB Ser. 04-SSRA, Class A1, 5.92s, 2039 | | 1,566,752 | | 1,568,319 |
| Bear Stearns Asset Backed Securities, Inc. | | | | |
| FRB Ser. 06-EC1, Class M9, 7.32s, 2035 | | 944,000 | | 566,400 |
| FRB Ser. 06-PC1, Class M9, 7.07s, 2035 | | 546,000 | | 354,900 |
| FRB Ser. 03-3, Class A2, 5.91s, 2043 | | 2,922,079 | | 2,926,645 |
| FRB Ser. 03-1, Class A1, 5.82s, 2042 | | 943,758 | | 945,528 |
| FRB Ser. 05-3, Class A1, 5.77s, 2035 | | 882,078 | | 883,732 |
| Bear Stearns Asset Backed Securities, Inc. 144A FRB Ser. 06-HE2, | | | | |
| Class M10, 7.57s, 2036 | | 204,000 | | 132,600 |
| Broadhollow Funding, LLC 144A FRB Ser. 04-A, Class Sub, | | | | |
| 7.32s, 2009 | | 2,169,000 | | 2,071,395 |
| Capital Auto Receivables Asset Trust 144A | | | | |
| Ser. 06-1, Class D, 7.16s, 2013 | | 1,000,000 | | 1,001,914 |
| Ser. 05-1, Class D, 6 1/2s, 2011 | | 1,776,000 | | 1,758,171 |
| Capital One Multi-Asset Execution Trust FRB Ser. 02-C1, | | | | |
| Class C1, 8.07s, 2010 | | 880,000 | | 888,078 |
| CARMAX Auto Owner Trust Ser. 04-2, Class D, 3.67s, 2011 | | 221,961 | | 219,327 |
| CARSSX Finance, Ltd. 144A | | | | |
| FRB Ser. 04-AA, Class B4, 10.82s, 2011 (Cayman Islands) | | 207,579 | | 213,196 |
| FRB Ser. 04-AA, Class B3, 8.67s, 2011 (Cayman Islands) | | 101,729 | | 103,112 |
| Chase Credit Card Master Trust FRB Ser. 03-3, Class C, | | | | |
| 6.4s, 2010 | | 2,550,000 | | 2,576,994 |
| Chase Funding Net Interest Margin 144A Ser. 04-OPT1, | | | | |
| Class Note, 4.458s, 2034 | | 140,821 | | 136,244 |
| CHEC NIM Ltd., 144A Ser. 04-2, Class N3, 8s, 2034 | | | | |
| (Cayman Islands) | | 13,666 | | 13,467 |
| Citibank Credit Card Issuance Trust FRB Ser. 01-C1, Class C1, | | | | |
| 6.436s, 2010 | | 1,390,000 | | 1,398,362 |
| Conseco Finance Securitizations Corp. | | | | |
| Ser. 02-1, Class M2, 9.546s, 2033 | | 3,629,000 | | 2,794,330 |
| Ser. 00-2, Class A5, 8.85s, 2030 | | 8,311,780 | | 7,778,230 |
| Ser. 02-2, Class A, IO, 8 1/2s, 2033 | | 8,436,449 | | 1,614,677 |
| Ser. 00-4, Class A6, 8.31s, 2032 | | 8,633,000 | | 7,640,205 |
| Ser. 00-5, Class A6, 7.96s, 2032 | | 4,808,000 | | 4,436,000 |
| Ser. 02-1, Class M1F, 7.954s, 2033 | | 1,561,000 | | 1,626,820 |
| Ser. 01-4, Class A4, 7.36s, 2033 | | 7,483,418 | | 7,786,347 |
| Ser. 00-6, Class A5, 7.27s, 2031 | | 1,605,110 | | 1,612,444 |
| Ser. 01-1, Class A5, 6.99s, 2032 | | 275,486 | | 269,976 |
| Ser. 01-3, Class A4, 6.91s, 2033 | | 9,017,986 | | 8,951,713 |
| Ser. 02-1, Class A, 6.681s, 2033 | | 8,339,209 | | 8,477,744 |
| Countrywide Asset Backed Certificates 144A | | | | |
| Ser. 04-6N, Class N1, 6 1/4s, 2035 | | 82,029 | | 81,618 |
| Ser. 04-BC1N, Class Note, 5 1/2s, 2035 | | 147,369 | | 142,211 |
| Ser. 04-14N, 5s, 2036 | | 59,378 | | 57,596 |
55
| ASSET-BACKED SECURITIES (10.7%)* continued | | | | |
|
| | | Principal amount | | Value |
|
| Countrywide Home Loans | | | | |
| Ser. 06-0A5, Class X, IO, 2.199s, 2046 | $ | 27,127,569 | $ | 1,017,284 |
| Ser. 05-9, Class 1X, IO, 1.802s, 2035 | | 14,665,985 | | 256,655 |
| Ser. 05-2, Class 2X, IO, 1.16s, 2035 | | 16,318,516 | | 349,319 |
| Countrywide Home Loans 144A | | | | |
| IFB Ser. 05-R2, Class 2A3, 8s, 2035 | | 1,073,574 | | 1,133,104 |
| IFB Ser. 05-R1, Class 1AS, IO, 0.802s, 2035 | | 9,120,723 | | 272,011 |
| IFB Ser. 05-R2, Class 1AS, IO, 0.422s, 2035 | | 11,583,765 | | 373,998 |
| Crest, Ltd. 144A Ser. 03-2A, Class D2, 6.723s, 2038 | | | | |
| (Cayman Islands) | | 2,157,000 | | 2,099,705 |
| CS First Boston Mortgage Securities Corp. 144A Ser. 04-FR1N, | | | | |
| Class A, 5s, 2034 | | 888,103 | | 843,698 |
| DB Master Finance, LLC 144A Ser. 06-1, Class M1, 8.285s, 2031 | | 1,262,000 | | 1,295,131 |
| Fieldstone Mortgage Investment Corp. FRB Ser. 05-1, Class M3, | | | | |
| 5.86s, 2035 | | 859,000 | | 859,271 |
| Finance America NIM Trust 144A Ser. 04-1, Class A, | | | | |
| 5 1/4s, 2034 | | 102,049 | | 104 |
| First Plus Home Loan Trust Ser. 97-3, Class B1, 7.79s, 2023 | | 463,584 | | 463,874 |
| Fort Point CDO, Ltd. FRB Ser. 03-2A, Class A2, 6.398s, | | | | |
| 2038 (Cayman Islands) | | 834,000 | | 836,752 |
| Foxe Basin, Ltd. 144A FRB Ser. 03-1A, Class A1, 5.855s, 2015 | | | | |
| (Cayman Islands) | | 2,600,000 | | 2,601,300 |
| Fremont NIM Trust 144A | | | | |
| Ser. 04-3, Class B, 7 1/2s, 2034 | | 266,741 | | 2,374 |
| Ser. 04-3, Class A, 4 1/2s, 2034 | | 7,443 | | 108 |
| G-Star, Ltd. 144A FRB Ser. 02-2A, Class BFL, 7.32s, 2037 | | | | |
| (Cayman Islands) | | 417,000 | | 430,177 |
| GE Capital Credit Card Master Note Trust FRB Ser. 04-2, | | | | |
| Class C, 5.8s, 2010 | | 2,444,480 | | 2,447,144 |
| GE Corporate Aircraft Financing, LLC 144A | | | | |
| FRB Ser. 05-1A, Class C, 6.62s, 2019 | | 1,593,000 | | 1,592,984 |
| Ser. 04-1A, Class B, 6.17s, 2018 | | 146,107 | | 147,127 |
| Gears Auto Owner Trust 144A Ser. 05-AA, Class E1, | | | | |
| 8.22s, 2012 | | 2,523,000 | | 2,514,218 |
| GEBL 144A | | | | |
| Ser. 04-2, Class D, 8.07s, 2032 | | 884,153 | | 870,926 |
| Ser. 04-2, Class C, 6.17s, 2032 | | 331,557 | | 331,557 |
| GMAC Mortgage Corp. Loan Trust Ser. 04-HE5, Class A, IO, | | | | |
| 6s, 2007 | | 4,100,250 | | 43,463 |
| Granite Mortgages PLC | | | | |
| FRB Ser. 01-1, Class 1C, 6.758s, 2041 (United Kingdom) | | 2,650,667 | | 2,668,372 |
| FRB Ser. 02-2, Class 1C, 6.608s, 2043 (United Kingdom) | | 732,955 | | 737,352 |
| Green Tree Financial Corp. | | | | |
| Ser. 96-5, Class M1, 8.05s, 2027 | | 729,203 | | 695,158 |
| Ser. 99-5, Class A5, 7.86s, 2030 | | 19,084,871 | | 18,226,052 |
| Ser. 97-6, Class A9, 7.55s, 2029 | | 985,662 | | 1,022,565 |
| Ser. 97-4, Class A7, 7.36s, 2029 | | 344,763 | | 356,322 |
| Ser. 95-8, Class B1, 7.3s, 2026 | | 467,121 | | 468,584 |
| Ser. 96-10, Class M1, 7.24s, 2028 | | 1,342,000 | | 1,342,000 |
| Ser. 97-6, Class A8, 7.07s, 2029 | | 299,762 | | 306,232 |
56
| ASSET-BACKED SECURITIES (10.7%)* continued | | | | |
|
| | | Principal amount | | Value |
|
| Green Tree Financial Corp. | | | | |
| Ser. 98-4, Class A7, 6.87s, 2030 | $ | 482,225 | $ | 476,197 |
| Ser. 97-7, Class A8, 6.86s, 2029 | | 241,369 | | 245,504 |
| Ser. 99-3, Class A6, 6 1/2s, 2031 | | 1,473,000 | | 1,458,270 |
| Ser. 99-2, Class A7, 6.44s, 2030 | | 1,787,750 | | 1,764,813 |
| Ser. 99-1, Class A6, 6.37s, 2025 | | 833,000 | | 837,165 |
| Ser. 99-3, Class A5, 6.16s, 2031 | | 32,335 | | 32,537 |
| Greenpoint Manufactured Housing Ser. 00-3, Class IA, 8.45s, 2031 | | 4,415,055 | | 4,299,725 |
| GS Auto Loan Trust 144A Ser. 04-1, Class D, 5s, 2011 | | 1,517,046 | | 1,508,718 |
| GSAMP Trust 144A Ser. 05-NC1, Class N, 5s, 2035 | | 5,175 | | 5,123 |
| GSMPS Mortgage Loan Trust | | | | |
| Ser. 05-RP3, Class 1A4, 8 1/2s, 2035 | | 448,419 | | 477,087 |
| Ser. 05-RP3, Class 1A3, 8s, 2035 | | 1,246,769 | | 1,314,967 |
| Ser. 05-RP3, Class 1A2, 7 1/2s, 2035 | | 973,242 | | 1,014,294 |
| GSMPS Mortgage Loan Trust 144A | | | | |
| Ser. 05-RP2, Class 1A3, 8s, 2035 | | 1,368,252 | | 1,442,821 |
| Ser. 05-RP1, Class 1A3, 8s, 2035 | | 140,097 | | 147,721 |
| Ser. 05-RP2, Class 1A2, 7 1/2s, 2035 | | 1,550,393 | | 1,617,417 |
| IFB Ser. 04-4, Class 1AS, IO, 0.754s, 2034 | | 12,560,787 | | 387,158 |
| Guggenheim Structured Real Estate Funding, Ltd. 144A | | | | |
| FRB Ser. 05-2A, Class D, 6.87s, 2030 (Cayman Islands) | | 1,609,000 | | 1,610,287 |
| FRB Ser. 05-1A, Class D, 6.85s, 2030 (Cayman Islands) | | 1,179,534 | | 1,162,666 |
| HASCO NIM Trust 144A Ser. 05-OP1A, Class A, 6 1/4s, 2035 | | | | |
| (Cayman Islands) | | 803,512 | | 707,091 |
| High Income Trust Securities 144A FRB Ser. 03-1A, Class A, | | | | |
| 5.86s, 2036 (Cayman Islands) | | 2,210,211 | | 2,193,634 |
| Home Equity Asset Trust 144A Ser. 04-4N, Class A, 5s, | | | | |
| 2034 (Cayman Islands) | | 49,533 | | 47,056 |
| Hyundai Auto Receivables Trust Ser. 04-A, Class D, 4.1s, 2011 | | 530,070 | | 525,620 |
| JPMorgan Mortgage Acquisition Corp. FRB Ser. 05-OPT2, | | | | |
| Class M11, 7.57s, 2035 | | 435,000 | | 295,800 |
| Lehman Manufactured Housing Ser. 98-1, Class 1, IO, | | | | |
| 0.807s, 2028 | | 25,964,846 | | 491,865 |
| Lehman Mortgage Trust IFB Ser. 07-1, Class 2A3, IO, | | | | |
| 1.31s, 2037 | | 8,789,754 | | 501,198 |
| LNR CDO, Ltd. 144A | | | | |
| FRB Ser. 03-1A, Class EFL, 8.32s, 2036 (Cayman Islands) | | 4,150,000 | | 4,375,980 |
| FRB Ser. 02-1A, Class FFL, 8.07s, 2037 (Cayman Islands) | | 6,071,000 | | 6,071,000 |
| Madison Avenue Manufactured Housing Contract | | | | |
| FRB Ser. 02-A, Class B1, 8.57s, 2032 | | 5,098,734 | | 3,977,013 |
| Ser. 02-A IO, 0.3s, 2032 | | 179,100,076 | | 1,908,795 |
| Marriott Vacation Club Owner Trust 144A | | | | |
| Ser. 05-2, Class D, 6.205s, 2027 | | 151,487 | | 150,913 |
| FRB Ser. 02-1A, Class A1, 6.02s, 2024 | | 1,905,447 | | 1,918,563 |
| Ser. 04-2A, Class D, 5.389s, 2026 | | 137,494 | | 133,611 |
| Ser. 04-2A, Class C, 4.741s, 2026 | | 158,978 | | 154,041 |
| MASTR Asset Backed Securities NIM Trust 144A Ser. 04-HE1A, | | | | |
| Class Note, 5.191s, 2034 (Cayman Islands) | | 12,459 | | 6,229 |
57
| ASSET-BACKED SECURITIES (10.7%)* continued | | | | |
|
| | | Principal amount | | Value |
|
| MASTR Reperforming Loan Trust 144A | | | | |
| Ser. 05-2, Class 1A3, 7 1/2s, 2035 | $ | 2,551,938 | $ | 2,663,301 |
| Ser. 05-1, Class 1A4, 7 1/2s, 2034 | | 1,879,220 | | 1,961,876 |
| MBNA Credit Card Master Note Trust FRB Ser. 03-C5, Class C5, | | | | |
| 6 1/2s, 2010 | | 2,550,000 | | 2,578,074 |
| Merit Securities Corp. 144A FRB Ser. 11PA, Class 3A1, | | | | |
| 5.94s, 2027 | | 7,499,374 | | 7,124,405 |
| Merrill Lynch Mortgage Investors, Inc. 144A | | | | |
| Ser. 05-WM1N, Class N1, 5s, 2035 | | 17,998 | | 17,854 |
| Ser. 04-HE2N, Class N1, 5s, 2035 (Cayman Islands) | | 38,388 | | 37,813 |
| Ser. 04-FM1N, Class N1, 5s, 2035 (Cayman Islands) | | 25,947 | | 25,558 |
| Ser. 04-WM3N, Class N1, 4 1/2s, 2035 (In default) † | | 67,893 | | 65,856 |
| Mid-State Trust | | | | |
| Ser. 11, Class B, 8.221s, 2038 | | 825,827 | | 820,528 |
| Ser. 10, Class B, 7.54s, 2036 | | 871,888 | | 761,482 |
| Morgan Stanley Auto Loan Trust 144A | | | | |
| Ser. 04-HB1, Class D, 5 1/2s, 2011 | | 4,579 | | 4,575 |
| Ser. 04-HB2, Class E, 5s, 2012 | | 227,952 | | 224,248 |
| N-Star Real Estate CDO, Ltd. 144A FRB Ser. 04-2A, Class C1, | | | | |
| 7.32s, 2039 (Cayman Islands) | | 735,000 | | 749,241 |
| Navigator CDO, Ltd. 144A FRB Ser. 03-1A, Class A1, 5.85s, | | | | |
| 2015 (Cayman Islands) | | 1,555,000 | | 1,555,467 |
| Navistar Financial Corp. Owner Trust | | | | |
| Ser. 05-A, Class C, 4.84s, 2014 | | 524,393 | | 514,170 |
| Ser. 04-B, Class C, 3.93s, 2012 | | 433,410 | | 422,701 |
| New Century Home Equity Loan Trust Ser. 03-5, Class AI7, | | | | |
| 5.15s, 2033 | | 2,293,334 | | 2,233,159 |
| Newcastle CDO, Ltd. 144A FRB Ser. 3A, Class 4FL, 8.52s, 2038 | | | | |
| (Cayman Islands) | | 966,000 | | 966,000 |
| Nomura Asset Acceptance Corp. Ser. 04-R3, Class PT, | | | | |
| 7.981s, 2035 | | 830,682 | | 846,963 |
| Nomura Asset Acceptance Corp. 144A Ser. 04-R2, Class PT, | | | | |
| 9.087s, 2034 | | 411,073 | | 426,324 |
| Oakwood Mortgage Investors, Inc. | | | | |
| Ser. 01-D, Class A3, 5.9s, 2022 | | 233,618 | | 186,894 |
| Ser. 02-C, Class A1, 5.41s, 2032 | | 5,456,120 | | 4,992,710 |
| Oakwood Mortgage Investors, Inc. 144A | | | | |
| Ser. 01-B, Class A4, 7.21s, 2030 | | 811,476 | | 726,879 |
| Ser. 01-B, Class A3, 6.535s, 2023 | | 245,799 | | 231,228 |
| Ocean Star PLC 144A | | | | |
| FRB Ser. 04, Class D, 7.66s, 2018 (Ireland) | | 798,000 | | 805,980 |
| FRB Ser. 05-A, Class D, 6.86s, 2012 (Ireland) | | 908,000 | | 908,000 |
| Option One Mortgage Loan Trust FRB Ser. 05-4, Class M11, | | | | |
| 7.82s, 2035 | | 298,000 | | 211,669 |
| Origen Manufactured Housing Ser. 04-B, Class A2, 3.79s, 2017 | | 432,522 | | 425,680 |
| Park Place Securities, Inc. FRB Ser. 04-WHQ2, Class A3A, | | | | |
| 5.67s, 2035 | | 467,043 | | 467,135 |
| Park Place Securities, Inc. 144A FRB Ser. 04-MHQ1, Class M10, | | | | |
| 7.82s, 2034 | | 570,000 | | 490,200 |
58
| ASSET-BACKED SECURITIES (10.7%)* continued | | | | |
|
| | | Principal amount | | Value |
|
| People’s Choice Net Interest Margin Note 144A Ser. 04-2, | | | | |
| Class B, 5s, 2034 | $ | 36,967 | $ | 34,858 |
| Permanent Financing PLC FRB Ser. 3, Class 3C, 6.49s, 2042 | | | | |
| (United Kingdom) | | 2,510,000 | | 2,529,566 |
| Providian Gateway Master Trust FRB Ser. 04-EA, Class E, | | | | |
| 8.32s, 2011 | | 3,450,000 | | 3,510,375 |
| Providian Gateway Master Trust 144A | | | | |
| FRB Ser. 04-EA, Class D, 6 1/4s, 2011 | | 2,100,000 | | 2,108,192 |
| Ser. 04-DA, Class D, 4.4s, 2011 | | 1,183,000 | | 1,173,850 |
| Residential Asset Mortgage Products, Inc. Ser. 02-SL1, Class AI3, | | | | |
| 7s, 2032 | | 206,502 | | 205,578 |
| Residential Asset Securities Corp. 144A | | | | |
| FRB Ser. 05-KS10, Class B, 7.8s, 2035 | | 1,391,000 | | 834,600 |
| Ser. 04-NT12, Class Note, 4.7s, 2035 | | 9,074 | | 8,859 |
| Ser. 04-NT, Class Note, 4 1/2s, 2034 | | 189,313 | | 170,382 |
| Residential Asset Securitization Trust IFB Ser. 07-A3, Class 2A2, | | | | |
| IO, 1.37s, 2037 | | 18,130,948 | | 958,317 |
| Saco I Trust FRB Ser. 05-10, Class 1A1, 5.58s, 2033 | | 1,968,934 | | 1,966,472 |
| SAIL Net Interest Margin Notes 144A | | | | |
| Ser. 03-3, Class A, 7 3/4s, 2033 (Cayman Islands) | | 3,662 | | 11 |
| Ser. 03-BC2A, Class A, 7 3/4s, 2033 (Cayman Islands) | | 237,726 | | 9,509 |
| Ser. 04-4A, Class B, 7 1/2s, 2034 (Cayman Islands) | | 380,795 | | 38 |
| Ser. 03-5, Class A, 7.35s, 2033 (Cayman Islands) | | 45,102 | | 1,326 |
| Ser. 03-9A, Class A, 7s, 2033 (Cayman Islands) | | 99,878 | | 161 |
| Ser. 03-6A, Class A, 7s, 2033 (Cayman Islands) | | 21,771 | | 435 |
| Ser. 03-7A, Class A, 7s, 2033 (Cayman Islands) | | 76,665 | | 383 |
| Sharps SP I, LLC Net Interest Margin Trust 144A Ser. 04-HE1N, | | | | |
| Class Note, 4.94s, 2034 (In default) † | | 230,946 | | 4,619 |
| Soundview Home Equity Loan Trust 144A FRB Ser. 05-CTX1, | | | | |
| Class B1, 7.82s, 2035 | | 672,000 | | 502,790 |
| South Coast Funding 144A FRB Ser. 3A, Class A2, 6.56s, | | | | |
| 2038 (Cayman Islands) | | 760,000 | | 762,356 |
| Structured Adjustable Rate Mortgage Loan Trust 144A | | | | |
| Ser. 04-NP2, Class A, 5.67s, 2034 | | 1,143,674 | | 1,143,559 |
| Structured Asset Investment Loan Trust 144A FRB Ser. 05-HE3, | | | | |
| Class M11, 6.156s, 2035 | | 1,284,000 | | 665,728 |
| Structured Asset Receivables Trust 144A FRB Ser. 05-1, 5.86s, 2015 | | 6,625,252 | | 6,616,971 |
| Structured Asset Securities Corp. | | | | |
| Ser. 07-6, Class AI, IO, 5s, 2037 ## | | 79,034,722 | | 2,988,540 |
| Ser. 07-6, Class IA, IO, 5s, 2037 ## | | 79,034,722 | | 2,394,752 |
| Structured Asset Securities Corp. 144A | | | | |
| Ser. 98-RF3, Class A, IO, 6.1s, 2028 | | 4,594,937 | | 478,880 |
| Ser. 06-RF4, Class 1A, IO, 0.356s, 2036 | | 9,795,213 | | 201,781 |
| TIAA Real Estate CDO, Ltd. Ser. 03-1A, Class E, 8s, 2038 | | | | |
| (Cayman Islands) | | 2,298,000 | | 2,244,686 |
| WFS Financial Owner Trust | | | | |
| Ser. 05-1, Class D, 4.09s, 2012 | | 319,005 | | 315,216 |
| Ser. 04-3, Class D, 4.07s, 2012 | | 405,555 | | 402,396 |
| Ser. 04-4, Class D, 3.58s, 2012 | | 268,756 | | 265,229 |
| Ser. 04-1, Class D, 3.17s, 2011 | | 140,222 | | 139,800 |
59
| ASSET-BACKED SECURITIES (10.7%)* continued | | | | |
|
| | | Principal amount | | Value |
|
| Whinstone Capital Management, Ltd. 144A FRB Ser. 1A, | | | | |
| Class B3, 6.255s, 2044 (United Kingdom) | $ | 1,685,126 | $ | 1,685,092 |
| Whole Auto Loan Trust 144A Ser. 04-1, Class D, 5.6s, 2011 | | 216,265 | | 215,518 |
|
| Total asset-backed securities (cost $268,540,407) | | | $ | 261,043,394 |
| PURCHASED OPTIONS OUTSTANDING (1.3%)* | | | | |
|
| Expiration date/ | | Contract | | |
| | strike price | | amount | | Value |
|
| Option on an interest rate swap with | | | | | |
| Deutschbank for the right to receive a fixed | | | | | |
| rate swap of 5.385% versus the three month | | | | | |
| USD-LIBOR-BBA maturing April 16, 2009. | Apr 09/5.385 | $ | 68,646,000 | $ | 2,196,672 |
| Option on an interest rate swap with | | | | | |
| Deutschbank for the right to pay a fixed | | | | | |
| rate swap of 5.385% versus the three month | | | | | |
| USD-LIBOR-BBA maturing April 16, 2009. | Apr 09/5.385 | | 68,646,000 | | 1,716,150 |
| Option on an interest rate swap with Goldman | | | | | |
| Sachs, International for the right to pay a fixed | | | | | |
| rate swap of 4.965% versus the three month | | | | | |
| USD-LIBOR-BBA maturing April 29, 2008. | Apr 08/4.965 | | 233,000,000 | | 2,925,688 |
| Option on an interest rate swap with Goldman | | | | | |
| Sachs, International for the right to receive a | | | | | |
| fixed rate swap of 4.965% versus the three month | | | | | |
| USD-LIBOR-BBA maturing April 29, 2008. | Apr 08/4.965 | | 233,000,000 | | 2,902,504 |
| Option on an interest rate swap with Goldman | | | | | |
| Sachs, International for the right to receive a | | | | | |
| fixed rate swap of 5.325% versus the three month | | | | | |
| USD-LIBOR-BBA maturing April 8, 2009. | Apr 09/5.325 | | 84,687,000 | | 2,524,477 |
| Option on an interest rate swap with Goldman | | | | | |
| Sachs, International for the right to pay a fixed | | | | | |
| rate swap of 5.325% versus the three month | | | | | |
| USD-LIBOR-BBA maturing April 8, 2009. | Apr 09/5.325 | | 84,687,000 | | 2,256,654 |
| Option on an interest rate swap with JPMorgan | | | | | |
| Chase Bank, N.A. for the right to pay a fixed | | | | | |
| rate of 5.315% versus the three month | | | | | |
| USD-LIBOR-BBA maturing on April 8, 2009. | Apr 09/5.315 | | 84,687,000 | | 2,259,534 |
| Option on an interest rate swap with JPMorgan | | | | | |
| Chase Bank, N.A. for the right to receive a | | | | | |
| fixed rate of 5.315% versus the three month | | | | | |
| USD-LIBOR-BBA maturing on April 8, 2009. | Apr 09/5.315 | | 84,687,000 | | 2,483,683 |
| Option on an interest rate swap with JPMorgan | | | | | |
| Chase Bank, N.A. for the right to receive a | | | | | |
| fixed rate of 5.175% versus the three month | | | | | |
| USD-LIBOR-BBA maturing on April 29, 2008. | Apr 08/5.175 | | 117,000,000 | | 2,329,751 |
60
| PURCHASED OPTIONS OUTSTANDING (1.3%)* continued | | | | |
|
| | Expiration date/ | | Contract | | |
| | strike price | | amount | | Value |
|
| Option on an interest rate swap with JPMorgan | | | | | |
| Chase Bank, N.A. for the right to pay a fixed | | | | | |
| rate of 5.175% versus the three month | | | | | |
| USD-LIBOR-BBA maturing on April 29, 2008. | Apr 08/5.175 | $ | 117,000,000 | $ | 2,420,379 |
| Option on an interest rate swap with JPMorgan | | | | | |
| Chase Bank, N.A. for the right to receive a | | | | | |
| fixed rate of 5.39% versus the three month | | | | | |
| USD-LIBOR-BBA maturing on | | | | | |
| January 29, 2018. | Jan 08/5.39 | | 116,444,000 | | 3,070,663 |
| Option on an interest rate swap with JPMorgan | | | | | |
| Chase Bank, N.A. for the right to pay a | | | | | |
| fixed rate of 5.39% versus the three month | | | | | |
| USD-LIBOR-BBA maturing on | | | | | |
| January 29, 2018. | Jan 08/5.39 | | 116,444,000 | | 1,177,889 |
| Option on an interest rate swap with | | | | | |
| JPMorgan Chase Bank, N.A. for the right to | | | | | |
| pay a fixed rate of 5.34% versus the three | | | | | |
| month USD-LIBOR-BBA maturing on | | | | | |
| February 15, 2018. | Feb 08/5.34 | | 30,969,000 | | 380,510 |
| Option on an interest rate swap with JPMorgan | | | | | |
| Chase Bank, N.A. for the right to receive | | | | | |
| a fixed rate of 5.34% versus the three | | | | | |
| month USD-LIBOR-BBA maturing on | | | | | |
| February 15, 2018. | Feb 08/5.34 | | 30,969,000 | | 757,991 |
| Option on an interest rate swap with Lehman | | | | | |
| Brothers International (Europe) for the right to | | | | | |
| pay a fixed rate swap of 5.3475% versus the | | | | | |
| three month USD-LIBOR-BBA maturing | | | | | |
| February 4, 2018. | Jan 08/5.3475 | | 60,369,000 | | 712,596 |
| Option on an interest rate swap with Lehman | | | | | |
| Brothers Special Financing, Inc. for the right to | | | | | |
| receive a fixed rate of 5.3475% versus the | | | | | |
| three month USD-LIBOR-BBA maturing on | | | | | |
| February 4, 2018. | Jan 08/5.3475 | | 60,369,000 | | 1,508,078 |
|
| |
| Total purchased options outstanding (cost $32,680,322) | | | $ | 31,623,219 |
|
| |
| |
| MUNICIPAL BONDS AND NOTES (0.1%)* (cost $1,354,839) | | | | |
|
| | Rating** | | Principal amount | | Value |
|
| MI Tobacco Settlement Fin. Auth. Rev. Bonds, | | | | | |
| Ser. A, 7.309s, 6/1/34 | Baa3 | $ | 1,355,000 | $ | 1,402,981 |
61
| SHORT-TERM INVESTMENTS (14.7%)* | | | | |
| |
| Principal amount/shares | | Value |
|
| CAFCO, LLC for an effective yield of 5.29%, May 7, 2007 | $ | 10,900,000 | $ | 10,890,444 |
| CHARTA LLC for an effective yield of 5.31%, July 12, 2007 | | 4,200,000 | | 4,155,984 |
| Putnam Prime Money Market Fund (e) | | 310,740,642 | | 310,740,642 |
| Short-term investments held as collateral for loaned securities | | | | |
| with yields ranging from 5.23% to 5.46% and due dates ranging | | | | |
| from May 1, 2007 to June 22, 2007 (d) | $ | 2,368,060 | | 2,364,300 |
| STRATFORD REC CO LLC for an effective yield of 5.33%, | | | | |
| May 17, 2007 | | 23,079,000 | | 23,024,636 |
| U.S. Treasury Bills for an effective yield of 4.83%, May 24, 2007 # | | 3,827,000 | | 3,815,237 |
| U.S. Treasury Bills for an effective yield of 4.98%, | | | | |
| September 27, 2007 # | | 3,826,000 | | 3,749,040 |
|
| Total short-term investments (cost $358,740,283) | | | $ | 358,740,283 |
|
| |
| TOTAL INVESTMENTS | | | | |
| Total investments (cost $3,703,504,723) | | | $ | 3,694,981,293 |
* Percentages indicated are based on net assets of $2,438,326,758.
** The Moody’s or Standard & Poor’s ratings indicated are believed to be the most recent ratings available at April 30, 2007 for the securities listed. Ratings are generally ascribed to securities at the time of issuance. While the agencies may from time to time revise such ratings, they undertake no obligation to do so, and the ratings do not necessarily represent what the agencies would ascribe to these securities at April 30, 2007. Securities rated by Putnam are indicated by “/P.” Security ratings are defined in the Statement of Additional Information.
† Non-income-producing security.
# These securities were pledged and segregated with the custodian to cover margin requirements for futures contracts at April 30, 2007.
(d) See Note 1 to the financial statements.
(e) See Note 5 to the financial statements regarding investments in Putnam Prime Money Market Fund.
(F) Security is valued at fair value following procedures approved by the Trustees.
(R) Real Estate Investment Trust.
(S) Securities on loan, in part or in entirety, at April 30, 2007.
## Forward commitments (Note 1).
At April 30, 2007, liquid assets totaling $983,327,053 have been designated as collateral for open forward commitments, swap contracts, and futures contracts.
144A after the name of an issuer represents securities exempt from registration under Rule 144A under the Securities Act of 1933, as amended. These securities may be resold in transactions exempt from registration, normally to qualified institutional buyers.
TBA after the name of a security represents to be announced securities (Note 1).
The rates shown on Floating Rate Bonds (FRB) and Floating Rate Notes (FRN) are the current interest rates at April 30, 2007.
The dates shown on debt obligations are the original maturity dates.
Inverse Floating Rate Bonds (IFB) are securities that pay interest rates that vary inversely to changes in the market interest rates. As interest rates rise, inverse floaters produce less current income. The interest rates shown are the current interest rates at April 30, 2007.
62
| FUTURES CONTRACTS OUTSTANDING at 4/30/07 (Unaudited) |
|
| | | | | | Unrealized |
| | Number of | | | Expiration | appreciation/ |
| | contracts | Value | | date | (depreciation) |
|
| Euro-Dollar 90 day (Long) | 1,268 | $ 300,516,000 | | Sep-07 | $ (34,799) |
| Euro-Dollar 90 day (Long) | 1,417 | 337,192,863 | | Mar-08 | 155,558 |
| Euro-Dollar 90 day (Short) | 5,658 | 1,349,079,375 | | Sep-08 | (631,850) |
| Euro-Dollar 90 day (Long) | 1,268 | 301,974,200 | | Sep-09 | 75,401 |
| U.S. Treasury Bond 20 yr (Short) | 714 | 79,789,500 | | Jun-07 | (699,874) |
| U.S. Treasury Note 2 yr (Long) | 3,992 | 817,237,250 | | Jun-07 | 777,589 |
| U.S. Treasury Note 5 yr (Long) | 86 | 9,101,219 | | Jun-07 | (45,849) |
| U.S. Treasury Note 10 yr (Short) | 1,553 | 168,233,578 | | Jun-07 | (202,638) |
|
| Total | | | | | $(606,462) |
| WRITTEN OPTIONS OUTSTANDING at 4/30/07 (premiums received $11,916,355) (Unaudited) | | | |
|
| | Contract | | Expiration date/ | |
| | amount | | strike price | Value |
|
| Option on an interest rate swap with JPMorgan Chase | | | | |
| Bank, N.A. for the obligation to pay a fixed rate of | | | | |
| 4.55% versus the three month USD-LIBOR-BBA | | | | |
| maturing on July 5, 2017. | $113,530,000 | | Jun 07/4.55 | $ 16,553 |
| Option on an interest rate swap with JPMorgan Chase | | | | |
| Bank, N.A. for the obligation to receive a fixed rate of | | | | |
| 4.55% versus the three month USD-LIBOR-BBA | | | | |
| maturing on July 5, 2017. | 113,530,000 | | Jun 07/4.55 | 5,401,995 |
| Option on an interest rate swap with Lehman Brothers | | | | |
| International for the obligation to pay a fixed rate of | | | | |
| 5.225% versus the three month USD-LIBOR-BBA | | | | |
| maturing March 5, 2018. | 45,268,000 | | Mar 08/5.225 | 933,155 |
| Option on an interest rate swap with Lehman Brothers | | | | |
| International for the obligation to receive a fixed rate of | | | | |
| 5.225% versus the three month USD-LIBOR-BBA | | | | |
| maturing March 5, 2018. | 45,268,000 | | Mar 08/5.225 | 762,766 |
|
| |
| Total | | | | $7,114,469 |
| TBA SALE COMMITMENTS OUTSTANDING at 4/30/07 (proceeds receivable $994,244,254) (Unaudited) |
|
| | Principal | | Settlement | |
| | amount | | date | Value |
|
| FHLMC, 4 1/2s, May 1, 2037 | $ 7,300,000 | | 5/14/07 | $ 6,871,125 |
| FHLMC, 5s, May 1, 2037 | 211,100,000 | | 5/14/07 | 204,024,857 |
| FHLMC, 6 1/2s, May 1, 2037 | 1,600,000 | | 5/14/07 | 1,634,250 |
| FNMA, 4s, May 1, 2022 | 2,200,000 | | 5/17/07 | 2,077,969 |
| FNMA, 6s, May 1, 2022 | 418,900,000 | | 5/17/07 | 425,674,409 |
| FNMA, 5 1/2s, May 1, 2037 | 349,400,000 | | 5/14/07 | 345,496,538 |
| GNMA, 6 1/2s, May 1, 2037 | 8,000,000 | | 5/21/07 | 8,214,375 |
|
| Total | | | | $993,993,523 |
63
| INTEREST RATE SWAP CONTRACTS OUTSTANDING at 4/30/07 (Unaudited) | |
|
| | | Payments | Payments | Unrealized |
| Swap counterparty / | Termination | made by | received by | appreciation/ |
| Notional amount | date | fund per annum | fund per annum | (depreciation) |
|
| Bank of America, N.A. | | | | |
| $ 1,000,000 | 9/1/15 | 3 month USD-LIBOR-BBA | 4.53% | $ (40,502) |
|
| 5,417,000 | 10/2/16 | 5.15631% | 3 month USD-LIBOR-BBA | (5,279) |
|
| 61,500,000 | 10/21/15 | 4.943% | 3 month USD-LIBOR-BBA | 710,421 |
|
| 4,590,000 | 6/24/15 | 4.39% | 3 month USD-LIBOR-BBA | 170,726 |
|
| 3,830,000 | 6/23/15 | 4.45% | 3 month USD-LIBOR-BBA | 128,106 |
|
| 9,200,000 | 6/23/15 | 4.466% | 3 month USD-LIBOR-BBA | 297,463 |
|
| 25,430,000 | 6/17/15 | 4.555% | 3 month USD-LIBOR-BBA | 649,027 |
|
| 106,100,000 | 4/6/10 | 4.6375% | 3 month USD-LIBOR-BBA | 977,645 |
|
| 134,600,000 | 1/14/10 | 3 month USD-LIBOR-BBA | 4.106% | (1,607,888) |
|
| 70,599,000 | 12/22/09 | 3.965% | 3 month USD-LIBOR-BBA | 1,152,636 |
|
| 91,608,000 | 1/28/24 | 3 month USD-LIBOR-BBA | 5.2125% | 48,743 |
|
| Bear Stearns Bank plc | | | | |
| 84,500,000 | 4/24/12 | 5.027% | 3 month USD-LIBOR-BBA | (139,106) |
|
| Citibank, N.A. | | | | |
| 65,880,000 | 7/27/09 | 5.504% | 3 month USD-LIBOR-BBA | (1,593,683) |
|
| 5,230,000 | 4/7/14 | 5.377% | 3 month USD-LIBOR-BBA | (97,831) |
|
| Credit Suisse First Boston International | | | | |
| 55,240,000 | 10/7/14 | 3 month USD-LIBOR-BBA | 4.624% | (1,556,856) |
|
| Credit Suisse International | | | | |
| 7,986,000 | 9/28/16 | 5.10886% | 3 month USD-LIBOR-BBA | 23,157 |
|
| 5,195,000 | 3/21/16 | 3 month USD-LIBOR-BBA | 5.20497% | 26,080 |
|
| Deutsche Bank AG | | | | |
| 54,861,045 | 8/2/22 | 3 month USD-LIBOR-BBA | 5.7756% | 2,769,185 |
|
| 61,565,504 | 8/2/32 | 5.86% | 3 month USD-LIBOR-BBA | (4,165,214) |
|
| Goldman Sachs Capital Markets, L.P. | | | | |
| 54,861,045 | 8/12/22 | 3 month USD-LIBOR-BBA | 5.601% | 1,741,715 |
|
| 61,565,504 | 8/12/32 | 5.689% | 3 month USD-LIBOR-BBA | (2,681,846) |
|
| Goldman Sachs International | | | | |
| 5,322,000 | 5/3/16 | 5.565% | 3 month USD-LIBOR-BBA | (245,186) |
|
| 16,030,000 | 4/7/14 | 5.33842% | 3 month USD-LIBOR-BBA | (262,303) |
|
| 29,390,000 | 1/8/12 | 3 month USD-LIBOR-BBA | 4.98% | 364,460 |
|
| 48,123,000 | 11/21/26 | 3 month USD-LIBOR-BBA | 5.2075% | (251,630) |
|
| 217,245,000 | 11/21/08 | 5.0925% | 3 month USD-LIBOR-BBA | (2,591,733) |
|
| 49,968,000 | 11/20/26 | 3 month USD-LIBOR-BBA | 5.261% | 75,259 |
|
| 222,080,000 | 11/20/08 | 5.16% | 3 month USD-LIBOR-BBA | (2,934,664) |
|
| 5,329,000 | 10/19/16 | 5.32413% | 3 month USD-LIBOR-BBA | (70,653) |
|
| 19,660,000 | 9/29/16 | 3 month USD-LIBOR-BBA | 5.1275% | (28,633) |
|
| 61,798,000 | 9/29/08 | 5.085% | 3 month USD-LIBOR-BBA | 76,269 |
|
| JPMorgan Chase Bank, N.A. | | | | |
| 55,400,000 | 10/21/15 | 4.916% | 3 month USD-LIBOR-BBA | 742,779 |
|
| 104,300,000 | 8/4/16 | 3 month USD-LIBOR-BBA | 5.5195% | 2,952,724 |
|
| 200,400,000 | 8/4/08 | 3 month USD-LIBOR-BBA | 5.40% | 505,899 |
|
| 15,425,000 | 8/2/15 | 3 month USD-LIBOR-BBA | 4.6570% | (487,416) |
|
| 80,000,000 | 6/29/15 | 3 month USD-LIBOR-BBA | 4.296% | (3,474,840) |
|
| 5,510,000 | 6/24/15 | 4.387% | 3 month USD-LIBOR-BBA | 206,050 |
|
64
| INTEREST RATE SWAP CONTRACTS OUTSTANDING at 4/30/07 (Unaudited) continued |
|
| | | Payments | Payments | Unrealized |
| Swap counterparty / | Termination | made by | received by | appreciation/ |
| Notional amount | date | fund per annum | fund per annum | (depreciation) |
|
| JPMorgan Chase Bank, N.A. continued | | | | |
| $ 22,120,000 | 6/16/15 | 4.538% | 3 month USD-LIBOR-BBA | $ 600,131 |
|
| 23,040,000 | 9/28/16 | 3 month USD-LIBOR-BBA | 5.1223% | (42,793) |
|
| 110,693,000 | 3/8/17 | 3 month USD-LIBOR-BBA | 5.28% | 1,007,676 |
|
| 173,000,000 | 1/31/17 | 3 month USD-LIBOR-BBA | 5.415% | 5,812,656 |
|
| 49,331,000 | 1/19/09 | 5.24% | 3 month USD-LIBOR-BBA | (766,606) |
|
| 12,553,000 | 1/19/17 | 3 month USD-LIBOR-BBA | 5.249% | 252,636 |
|
| 8,389,000 | 12/19/16 | 5.0595% | 3 month USD-LIBOR-BBA | (43,381) |
|
| 49,901,000 | 11/20/26 | 3 month USD-LIBOR-BBA | 5.266% | 106,713 |
|
| 221,852,000 | 11/20/08 | 5.165% | 3 month USD-LIBOR-BBA | (2,952,142) |
|
| 86,260,000 | 10/10/13 | 5.09% | 3 month USD-LIBOR-BBA | (216,369) |
|
| 62,040,000 | 10/10/13 | 5.054% | 3 month USD-LIBOR-BBA | (19,067) |
|
| 58,900,000 | 3/7/15 | 3 month USD-LIBOR-BBA | 4.798% | (1,158,331) |
|
| 72,402,000 | 9/28/08 | 5.096% | 3 month USD-LIBOR-BBA | 84,091 |
|
| 5,733,000 | 9/18/16 | 5.291% | 3 month USD-LIBOR-BBA | (61,185) |
|
| 156,000,000 | 1/17/16 | 4.946% | 3 month USD-LIBOR-BBA | 5,427 |
|
| 41,147,000 | 8/15/11 | 5.412% | 3 month USD-LIBOR-BBA | (698,209) |
|
| 34,100,000 | 4/23/17 | 5.186% | 3 month USD-LIBOR-BBA | (60,781) |
|
| Lehman Brothers International (Europe) | | | |
| 168,290,000 | 3/15/09 | 4.9298% | 3 month USD-LIBOR-BBA | 451,338 |
|
| 24,523,000 | 10/23/16 | 5.325% | 3 month USD-LIBOR-BBA | (326,974) |
|
| 61,010,000 | 10/23/08 | 5.255% | 3 month USD-LIBOR-BBA | (101,141) |
|
| 24,523,000 | 10/23/16 | 3 month USD-LIBOR-BBA | 5.3275% | 331,401 |
|
| 61,010,000 | 10/23/08 | 3 month USD-LIBOR-BBA | 5.26% | 105,480 |
|
| 246,914,000 | 8/3/16 | 5.5675% | 3 month USD-LIBOR-BBA | (7,875,219) |
|
| 295,943,000 | 8/3/11 | 5.445% | 3 month USD-LIBOR-BBA | (5,404,494) |
|
| 124,010,000 | 12/28/16 | 5.084% | 3 month USD-LIBOR-BBA | (882,648) |
|
| Lehman Brothers Special Financing, Inc. | | | |
| 34,808,000 | 4/12/12 | 3 month USD-LIBOR-BBA | 5.087% | 145,099 |
|
| 51,500,000 | 3/16/09 | 4.9275% | 3 month USD-LIBOR-BBA | 138,882 |
|
| 19,500,000 | 3/16/17 | 5.034% | 3 month USD-LIBOR-BBA | 197,605 |
|
| 6,277,000 | 3/15/17 | 5.043% | 3 month USD-LIBOR-BBA | 59,299 |
|
| 123,000,000 | 9/29/13 | 5.0555% | 3 month USD-LIBOR-BBA | (66,372) |
|
| 183,930,000 | 9/8/16 | 5.3275% | 3 month USD-LIBOR-BBA | (2,470,780) |
|
| 27,294,000 | 8/3/36 | 3 month USD-LIBOR-BBA | 5.67% | 1,181,816 |
|
| 223,430,000 | 8/3/08 | 3 month USD-LIBOR-BBA | 5.425% | 644,409 |
|
| 24,607,000 | 12/20/16 | 3 month USD-LIBOR-BBA | 5.069% | 145,768 |
|
| Merrill Lynch Capital Services, Inc. | | | |
| 53,317,584 | 8/13/12 | 4.94% | 3 month USD-LIBOR-BBA | 190,492 |
|
| 54,861,045 | 8/12/22 | 3 month USD-LIBOR-BBA | 5.601% | 1,741,715 |
|
| Morgan Stanley Capital Services, Inc. | | | |
| 3,820,000 | 2/20/17 | 5.19% | 3 month USD-LIBOR-BBA | (8,626) |
|
| 28,000,000 | 10/2/10 | 6.94% | 3 month USD-LIBOR-BBA | (1,762,920) |
|
| Total | | | | $(20,332,323) |
65
| TOTAL RETURN SWAP CONTRACTS OUTSTANDING at 4/30/07 (Unaudited) | |
|
| |
| | | Fixed payments | Total return | Unrealized |
| Swap counterparty / | Termination | received (paid) by | received by | appreciation/ |
| Notional amount | date | fund per annum | or paid by fund | (depreciation) |
|
| Bank of America, N.A. | | | | |
| $24,020,000 | 5/2/08 | 10 bp plus | Banc of America | $ 10,706 |
| | | change in spread | Securities-CMBS | |
| | | of Banc | AAA 10 year Index | |
| | of America | | |
| | | Securities AAA | | |
| | 10 yr Index | | |
| | multiplied by | | |
| | the modified | | |
| | duration factor | | |
| | | | | |
|
| Bear Stearns Bank plc | | | | |
| 89,570,000 | 6/1/07 | 41.2 bp plus | The spread | (201,892) |
| | | change in spread | return of Lehman | |
| | | of Lehman | Brothers Aaa | |
| | | Brothers Aaa | 8.5+ CMBS Index | |
| | | 8.5+ Commercial | adjusted by | |
| | | Mortgage Backed | modified | |
| | | Securities Index | duration factor | |
| | | multiplied by | | |
| | the modified | | |
| | | duration factor | | |
|
| Citibank, N.A. | | | | |
| 22,360,000 | 5/2/08 | 12.5 bp plus | Banc of America | 9,270 |
| | | change in spread | Securities-CMBS | |
| | | of Banc | AAA 10 year Index | |
| | of America | | |
| | | Securities AAA | | |
| | 10 yr Index | | |
| | multiplied by | | |
| | the modified | | |
| | | duration factor | | |
|
| 32,545,000 | 5/1/07 | 10 bp plus | The spread | (137,430) |
| | | beginning | return of Lehman | |
| | | of period nominal | Brothers Aaa | |
| | | spread of Lehman | 8.5+ CMBS Index | |
| | | Brothers AAA | adjusted by | |
| | | 8.5+ Commercial | modified | |
| | | Mortgage Backed | duration factor | |
| | | Securities Index | | |
|
| Goldman Sachs International | | | | |
| 4,951,000 | 9/15/11 | 678 bp (1 month | Ford Credit Auto | 52,218 |
| | | USD-LIBOR-BBA) | Owner Trust | |
| | | | Series 2005-B | |
| | | | Class D | |
|
| 26,800,000 | 5/1/07 | 15 bp plus | The spread | (77,586) |
| | | beginning | return of Lehman | |
| | | of period nominal | Brothers Aaa | |
| | | spread of Lehman | 8.5+ CMBS Index | |
| | | Brothers AAA | adjusted by | |
| | | 8.5+ Commercial | modified | |
| | | Mortgage Backed | duration factor | |
| | | Securities Index | | |
|
66
| TOTAL RETURN SWAP CONTRACTS OUTSTANDING at 4/30/07 (Unaudited) continued |
| |
| |
| | | Fixed payments | Total return | Unrealized |
| Swap counterparty / | Termination | received (paid) by | received by | appreciation/ |
| Notional amount | date | fund per annum | or paid by fund | (depreciation) |
|
| JPMorgan Chase Bank, N.A. | | | | |
| $15,250,000 | 10/1/07 | 175 bp plus | The spread | $ (24,941) |
| | | beginning | return of Lehman | |
| | | of period nominal | Brothers AAA | |
| | | spread of Lehman | 8.5+ CMBS Index | |
| | | Brothers AAA | adjusted by | |
| | | 8.5+ Commercial | modified | |
| | | Mortgage Backed | duration factor | |
| | | Securities Index | | |
|
| 32,655,000 | 5/1/07 | 10 bp plus | The spread | (137,151) |
| | | beginning | return of Lehman | |
| | | of period nominal | Brothers Aaa | |
| | | spread of Lehman | 8.5+ CMBS Index | |
| | | Brothers AAA | adjusted by | |
| | | 8.5+ Commercial | modified | |
| | | Mortgage Backed | duration factor | |
| | | Securities Index | | |
|
| Lehman Brothers Special Financing, Inc. | | | | |
| 33,848,000 | 10/1/07 | 30 bp plus | The spread | (59,302) |
| | | beginning | return of Lehman | |
| | | of period nominal | Brothers AAA | |
| | | spread of Lehman | 8.5+ CMBS Index | |
| | | Brothers AAA | adjusted by | |
| | | 8.5+ Commercial | modified | |
| | | Mortgage Backed | duration factor | |
| | | Securities Index | | |
|
| |
| Total | | | | $(566,108) |
| CREDIT DEFAULT CONTRACTS OUTSTANDING at 4/30/07 (Unaudited) |
|
| | Upfront | | | | Fixed payments | Unrealized |
| Swap counterparty / | premium | Notional | | Termination | received (paid) by | appreciation/ |
| Referenced debt* | received (paid)** | amount | | date | fund per annum | (depreciation) |
|
| Bank of America, N.A. | | | | | | |
| DJ CDX NA IG | | | | | | |
| Series 8 Index | $(139,287) | $38,250,000 | | 6/20/17 | (60 bp) | $ (95,554) |
|
| DJ CDX NA IG | | | | | | |
| Series 8 Index | (20,984) | 36,185,000 | | 6/20/17 | (60 bp) | 16,166 |
|
| L-3 Communications | | | | | | |
| Corp. 7 5/8%, 6/15/12 | — | 400,000 | | 6/20/11 | (101 bp) | (2,855) |
|
| L-3 Communications | | | | | | |
| Corp. 7 5/8%, 6/15/12 | — | 990,000 | | 9/20/11 | (111 bp) | (9,083) |
|
| Deutsche Bank AG | | | | | | |
| DJ CDX NA IG Series 7 | (2) | 4,834,000 | | 12/20/13 | (50 bp) | (1,855) |
|
| DJ CDX NA IG Series 7 | | | | | | |
| Index 7-10% tranche | — | 4,834,000 | | 12/20/13 | 55 bp | 23,695 |
|
| DJ CDX NA IG Series 8 | | | | | | |
| Index 7-10% tranche | — | 4,508,000 | | 6/20/12 | 22 bp | 5,773 |
|
| France Telecom, 7.25%, | | | | | | |
| 1/28/13 | — | 2,375,000 | | 6/20/16 | 70 bp | 59,400 |
|
| Union Pacific Corp., | | | | | | |
| 6 1/8%, 1/15/12 | — | 2,250,000 | | 6/20/17 | 66 bp | (11,449) |
|
67
| CREDIT DEFAULT CONTRACTS OUTSTANDING at 4/30/07 (Unaudited) continued | |
|
| | | Upfront | | | | Fixed payments | Unrealized |
| Swap counterparty / | | premium | Notional | | Termination | received (paid) by | appreciation/ |
| Referenced debt* | | received (paid)** | amount | | date | fund per annum | (depreciation) |
|
| Goldman Sachs International | | | | | | | |
| Any one of the underlying | | | | | | | |
| securities in the basket | | | | | | | |
| of BB CMBS securities | $ | — | $11,022,000 | | (a) | 2.461% | $ 744,445 |
|
| DJ CDX NA IG | | | | | | | |
| Series 7 Index | | 13,364 | 19,841,000 | | 12/20/13 | (50 bp) | 7,963 |
|
| DJ CDX NA IG | | | | | | | |
| Series 7 Index | | (2) | 8,060,000 | | 12/20/13 | (50 bp) | (3,092) |
|
| DJ CDX NA IG Series 7 | | | | | | | |
| Index 7-10% tranche | | — | 8,060,000 | | 12/20/13 | 56 bp | 44,196 |
|
| DJ CDX NA IG Series 7 | | | | | | | |
| Index 7-10% tranche | | — | 19,841,000 | | 12/20/13 | 48 bp | 13,756 |
|
| DJ CDX NA IG | | | | | | | |
| Series 8 Index | | (28) | 36,190,000 | | 6/20/17 | (60 bp) | 37,127 |
|
| DJ CDX NA IG | | | | | | | |
| Series 8 Index | | (171,920) | 40,845,000 | | 6/20/17 | (60 bp) | (123,858) |
|
| JPMorgan Chase Bank, N.A. | | | | | | | |
| DJ CDX NA CMBX AAA Index | — | 15,250,000 | | 3/15/49 | (70 bp) | (22) |
|
| Lehman Brothers Special Financing, Inc. | | | | | |
| DJ CDX NA CMBX AAA Index | — | 33,848,000 | | 3/15/49 | (700 bp) | (2,054) |
|
| DJ CDX NA IG | | | | | | | |
| Series 7 Index | | 4,458 | 7,515,000 | | 12/20/13 | (50 bp) | 1,577 |
|
| DJ CDX NA IG Series 7 | | | | | | | |
| Index 7-10% tranche | | — | 7,515,000 | | 12/20/13 | 54.37 bp | 34,151 |
|
| Hilton Hotels, 7 5/8%, | | | | | | | |
| 12/1/12 | | — | 1,980,000 | | 6/20/13 | 94 bp | (42,398) |
|
| Morgan Stanley Capital Services, Inc. | | | | | | |
| DJ CDX NA IG | | | | | | | |
| Series 7 Index | | 4,967 | 8,365,000 | | 12/20/13 | (50 bp) | 1,760 |
|
| DJ CDX NA IG Series 7 | | | | | | | |
| Index, 7-10% tranche | | — | 8,365,000 | | 12/20/13 | 53 bp | 31,355 |
|
| DJ CDX NA IG | | | | | | | |
| Series 8 Index | | — | 2,254,000 | | 6/20/12 | (35 bp) | 747 |
|
| DJ CDX NA IG | | | | | | | |
| Series 8 Index | | — | 36,390,000 | | 6/20/17 | (60 bp) | 33,721 |
|
| Total | | | | | | | $ 763,612 |
* Payments related to the reference debt are made upon a credit default event.
** Upfront premium is based on the difference between the original spread on issue and the market spread on day of execution.
(a) Terminating on the date on which the notional amount is reduced to zero or the date on which the assets securing the reference entity are liquidated.
The accompanying notes are an integral part of these financial statements.
68
Statement of assets and liabilities 4/30/07 (Unaudited)
| ASSETS | |
|
| Investment in securities, at value, including $2,309,710 of securities on loan (Note 1): | |
| Unaffiliated issuers (identified cost $3,392,764,081) | $3,384,240,651 |
| Affiliated issuers (identified cost $310,740,642) (Note 5) | 310,740,642 |
|
| Cash | 3,762,271 |
|
| Interest and other receivables | 20,236,887 |
|
| Receivable for shares of the fund sold | 1,663,311 |
|
| Receivable for securities sold | 95,579,073 |
|
| Receivable for sales of delayed delivery securities (Note 1) | 996,484,839 |
|
| Receivable for open swap contracts (Note 1) | 27,940 |
|
| Premium paid on swap contracts (Note 1) | 332,223 |
|
| Unrealized appreciation on swap contracts (Note 1) | 27,949,004 |
|
| Total assets | 4,841,016,841 |
|
| |
| LIABILITIES | |
|
| Payable for variation margin (Note 1) | 640,395 |
|
| Payable for purchases of delayed delivery securities (Note 1) | 1,302,241,715 |
|
| Payable for securities purchased | 32,381,607 |
|
| Payable for shares of the fund repurchased | 8,392,208 |
|
| Payable for compensation of Manager (Notes 2 and 5) | 2,476,521 |
|
| Payable for investor servicing and custodian fees (Note 2) | 531,987 |
|
| Payable for Trustee compensation and expenses (Note 2) | 274,204 |
|
| Payable for administrative services (Note 2) | 9,042 |
|
| Payable for distribution fees (Note 2) | 405,258 |
|
| Payable for closed swap contracts (Note 1) | 3,536,493 |
|
| Premium received on swap contracts (Note 1) | 22,789 |
|
| Written options outstanding, at value (premiums received $11,916,355) (Notes 1 and 3) | 7,114,469 |
|
| Unrealized depreciation on swap contracts (Note 1) | 48,083,823 |
|
| TBA sales commitments, at value (proceeds receivable $994,244,254) (Note 1) | 993,993,523 |
|
| Collateral on securities loaned, at value (Note 1) | 2,364,300 |
|
| Other accrued expenses | 221,749 |
|
| Total liabilities | 2,402,690,083 |
|
| Net assets | $2,438,326,758 |
(Continued on next page)
69
Statement of assets and liabilities (Continued)
| REPRESENTED BY | |
|
| Paid-in capital (Unlimited shares authorized) (Notes 1 and 4) | $2,558,029,882 |
|
| Undistributed net investment income (Note 1) | 28,721,548 |
|
| Accumulated net realized loss on investments (Note 1) | (124,212,578) |
|
| Net unrealized depreciation of investments | (24,212,094) |
|
| Total — Representing net assets applicable to capital shares outstanding | $2,438,326,758 |
|
| |
| COMPUTATION OF NET ASSET VALUE AND OFFERING PRICE | |
|
| Net asset value and redemption price per class A share | |
| ($772,962,915 divided by 114,171,538 shares) | $6.77 |
|
| Offering price per class A share | |
| (100/96.25 of $6.77)* | $7.03 |
|
| Net asset value and offering price per class B share | |
| ($129,237,588 divided by 19,216,540 shares)** | $6.73 |
|
| Net asset value and offering price per class C share | |
| ($20,653,263 divided by 3,062,310 shares)** | $6.74 |
|
| Net asset value and redemption price per class M share | |
| ($289,976,787 divided by 43,352,902 shares) | $6.69 |
|
| Offering price per class M share | |
| (100/96.75 of $6.69)*** | $6.91 |
|
| Net asset value, offering price and redemption price per class R share | |
| ($966,260 divided by 142,937 shares) | $6.76 |
|
| Net asset value, offering price and redemption price per class Y share | |
| ($1,224,529,945 divided by 179,590,616 shares) | $6.82 |
* On single retail sales of less than $100,000. On sales of $100,000 or more the offering price is reduced.
** Redemption price per share is equal to net asset value less any applicable contingent deferred sales charge.
*** On single retail sales of less than $50,000. On sales of $50,000 or more the offering price is reduced.
The accompanying notes are an integral part of these financial statements.
70
Statement of operations Six months ended 4/30/07 (Unaudited)
| INVESTMENT INCOME | |
|
| Interest (including interest income of $6,866,617 | |
| from investments in affiliated issuers) (Note 5) | $69,924,409 |
|
| Securities lending | 1,521 |
|
| Total investment income | 69,925,930 |
|
| |
| EXPENSES | |
|
| Compensation of Manager (Note 2) | 6,360,067 |
|
| Investor servicing fees (Note 2) | 2,900,735 |
|
| Custodian fees (Note 2) | 179,017 |
|
| Trustee compensation and expenses (Note 2) | 37,748 |
|
| Administrative services (Note 2) | 28,971 |
|
| Distribution fees — Class A (Note 2) | 970,630 |
|
| Distribution fees — Class B (Note 2) | 703,439 |
|
| Distribution fees — Class C (Note 2) | 105,185 |
|
| Distribution fees — Class M (Note 2) | 769,675 |
|
| Distribution fees — Class R (Note 2) | 2,083 |
|
| Other | 265,176 |
|
| Fees waived and reimbursed by Manager (Notes 2 and 5) | (971,661) |
|
| Total expenses | 11,351,065 |
|
| Expense reduction (Note 2) | (183,709) |
|
| Net expenses | 11,167,356 |
|
| Net investment income | 58,758,574 |
|
| Net realized gain on investments (Notes 1 and 3) | 2,891,225 |
|
| Net realized gain on swap contracts (Note 1) | 7,072,828 |
|
| Net realized gain on futures contracts (Note 1) | 979,554 |
|
| Net realized gain on written options (Notes 1 and 3) | 596,998 |
|
| Net unrealized depreciation of investments, futures contracts, swap contracts, | |
| written options, and TBA sale commitments during the period | (2,323,166) |
|
| Net gain on investments | 9,217,439 |
|
| Net increase in net assets resulting from operations | $67,976,013 |
The accompanying notes are an integral part of these financial statements.
71
Statement of changes in net assets
| DECREASE IN NET ASSETS | | |
|
| | Six months ended | Year ended |
|
| | 4/30/07* | 10/31/06 |
|
| Operations: | | |
| Net investment income | $ 58,758,574 | $ 102,884,406 |
|
| Net realized gain (loss) on investments | 11,540,605 | (22,358,608) |
|
| Net unrealized appreciation (depreciation) of investments | (2,323,166) | 32,384,500 |
|
| Net increase in net assets resulting from operations | 67,976,013 | 112,910,298 |
|
| Distributions to shareholders (Note 1): | | |
|
| From ordinary income | | |
|
| Net investment income | | |
|
| Class A | (18,350,732) | (34,927,122) |
|
| Class B | (2,834,665) | (6,728,554) |
|
| Class C | (421,106) | (809,346) |
|
| Class M | (7,054,530) | (15,462,715) |
|
| Class R | (19,104) | (23,009) |
|
| Class Y | (29,233,074) | (49,842,820) |
|
| Redemption fees (Note 1) | 4,352 | 5,435 |
|
| Decrease from capital share transactions (Note 4) | (66,627,221) | (88,538,159) |
|
| Total decrease in net assets | (56,560,067) | (83,415,992) |
|
| |
| NET ASSETS | | |
|
| Beginning of period | 2,494,886,825 | 2,578,302,817 |
|
| End of period (including undistributed net investment income | | |
| of $28,721,548 and $27,876,185, respectively) | $2,438,326,758 | $2,494,886,825 |
* Unaudited
The accompanying notes are an integral part of these financial statements.
72
This page left blank intentionally.
73
Financial highlights (For a common share outstanding throughout the period)
| INVESTMENT OPERATIONS: | | | | LESS DISTRIBUTIONS: | | | | RATIOS AND SUPPLEMENTAL DATA: | |
| | | | | Net | | | | | | Total | | | Ratio of net | |
| | | Net asset | | realized and | Total | From | | | Net asset | return | Net | Ratio of | investment | |
| | | value, | Net | unrealized | from | net | | | value, | at net | assets, | expenses to | income | Portfolio |
| | | beginning | investment | gain (loss) on | investment | investment | Total | Redemption | end | asset | end of period | average net | to average | turnover |
| Period ended | | of period | income(a) | investments | operations | income | distributions | fees | of period | value (%)(b) | (in thousands) | assets (%)(c) | net assets (%) | (%) |
|
| CLASS A | | | | | | | | | | | | | | |
| April 30, 2007** | | $6.74 | .16(d) | .03 | .19 | (.16) | (.16) | —(f) | $6.77 | 2.84* | $772,963 | .48*(d) | 2.37*(d) | 90.00*(g) |
| October 31, 2006 | | 6.73 | .27(d,e) | .03 | .30 | (.29) | (.29) | —(f) | 6.74 | 4.53 | 791,970 | .95(d,e) | 4.07(d,e) | 238.67(g) |
| October 31, 2005 | | 6.87 | .23(d) | (.16) | .07 | (.21) | (.21) | —(f) | 6.73 | 1.05 | 872,931 | .98(d) | 3.42(d) | 300.04(g) |
| October 31, 2004 | | 6.69 | .19(d) | .19 | .38 | (.20) | (.20) | —(f) | 6.87 | 5.70 | 985,939 | .99(d) | 2.83(d) | 441.06 |
| October 31, 2003 | | 6.59 | .24 | .11 | .35 | (.25) | (.25) | — | 6.69 | 5.45 | 1,279,779 | .93 | 3.64 | 251.00(h) |
| October 31, 2002 | | 6.69 | .32 | (.07) | .25 | (.35) | (.35) | — | 6.59 | 3.93 | 1,339,061 | .92 | 4.84 | 268.10(h) |
|
| |
| CLASS B | | | | | | | | | | | | | | |
| April 30, 2007** | | $6.70 | .13(d) | .03 | .16 | (.13) | (.13) | —(f) | $6.73 | 2.47* | $129,238 | .85*(d) | 2.00*(d) | 90.00*(g) |
| October 31, 2006 | | 6.68 | .22(d,e) | .04 | .26 | (.24) | (.24) | —(f) | 6.70 | 3.92 | 154,775 | 1.70(d,e) | 3.37(d,e) | 238.67(g) |
| October 31, 2005 | | 6.82 | .18(d) | (.16) | .02 | (.16) | (.16) | —(f) | 6.68 | .28 | 229,794 | 1.73(d) | 2.64(d) | 300.04(g) |
| October 31, 2004 | | 6.65 | .14(d) | .18 | .32 | (.15) | (.15) | —(f) | 6.82 | 4.79 | 323,527 | 1.74(d) | 2.12(d) | 441.06 |
| October 31, 2003 | | 6.55 | .19 | .11 | .30 | (.20) | (.20) | — | 6.65 | 4.68 | 520,692 | 1.68 | 2.90 | 251.00(h) |
| October 31, 2002 | | 6.65 | .27 | (.07) | .20 | (.30) | (.30) | — | 6.55 | 3.19 | 555,668 | 1.67 | 4.07 | 268.10(h) |
|
| |
| CLASS C | | | | | | | | | | | | | | |
| April 30, 2007** | | $6.72 | .13(d) | .02 | .15 | (.13) | (.13) | —(f) | $6.74 | 2.32* | $20,653 | .85*(d) | 2.00*(d) | 90.00*(g) |
| October 31, 2006 | | 6.70 | .22(d,e) | .04 | .26 | (.24) | (.24) | —(f) | 6.72 | 3.92 | 21,736 | 1.70(d,e) | 3.33(d,e) | 238.67(g) |
| October 31, 2005 | | 6.84 | .18(d) | (.16) | .02 | (.16) | (.16) | —(f) | 6.70 | .28 | 24,644 | 1.73(d) | 2.66(d) | 300.04(g) |
| October 31, 2004 | | 6.67 | .14(d) | .18 | .32 | (.15) | (.15) | —(f) | 6.84 | 4.79 | 29,059 | 1.74(d) | 2.10(d) | 441.06 |
| October 31, 2003 | | 6.57 | .20 | .11 | .31 | (.21) | (.21) | — | 6.67 | 4.70 | 42,946 | 1.68 | 2.88 | 251.00(h) |
| October 31, 2002 | | 6.67 | .26 | (.06) | .20 | (.30) | (.30) | — | 6.57 | 3.18 | 39,017 | 1.67 | 4.04 | 268.10(h) |
|
| |
| CLASS M | | | | | | | | | | | | | | |
| April 30, 2007** | | $6.67 | .15(d) | .02 | .17 | (.15) | (.15) | —(f) | $6.69 | 2.61* | $289,977 | .61*(d) | 2.25*(d) | 90.00*(g) |
| October 31, 2006 | | 6.66 | .25(d,e) | .03 | .28 | (.27) | (.27) | —(f) | 6.67 | 4.38 | 331,997 | 1.20(d,e) | 3.85(d,e) | 238.67(g) |
| October 31, 2005 | | 6.80 | .21(d) | (.15) | .06 | (.20) | (.20) | —(f) | 6.66 | .84 | 420,886 | 1.23(d) | 3.15(d) | 300.04(g) |
| October 31, 2004 | | 6.63 | .17(d) | .18 | .35 | (.18) | (.18) | —(f) | 6.80 | 5.40 | 556,725 | 1.24(d) | 2.62(d) | 441.06 |
| October 31, 2003 | | 6.54 | .23 | .10 | .33 | (.24) | (.24) | — | 6.63 | 5.12 | 884,380 | 1.18 | 3.48 | 251.00(h) |
| October 31, 2002 | | 6.64 | .30 | (.06) | .24 | (.34) | (.34) | — | 6.54 | 3.77 | 1,465,393 | 1.17 | 4.56 | 268.10(h) |
|
| |
| CLASS R | | | | | | | | | | | | | | |
| April 30, 2007** | | $6.74 | .15(d) | .02 | .17 | (.15) | (.15) | —(f) | $6.76 | 2.60* | $966 | .61*(d) | 2.23*(d) | 90.00*(g) |
| October 31, 2006 | | 6.72 | .25(d,e) | .04 | .29 | (.27) | (.27) | —(f) | 6.74 | 4.50 | 755 | 1.20(d,e) | 3.70(d,e) | 238.67(g) |
| October 31, 2005 | | 6.87 | .23(d) | (.18) | .05 | (.20) | (.20) | —(f) | 6.72 | .72 | 400 | 1.23(d) | 3.29(d) | 300.04(g) |
| October 31, 2004 | | 6.69 | .18(d) | .18 | .36 | (.18) | (.18) | —(f) | 6.87 | 5.47 | 62 | 1.24(d) | 2.57(d) | 441.06 |
| October 31, 2003† | | 6.65 | .18 | .03 | .21 | (.17) | (.17) | — | 6.69 | 3.14* | 1 | .92* | 2.65* | 251.00(h) |
|
| |
| CLASS Y | | | | | | | | | | | | | | |
| April 30, 2007** | | $6.79 | .17(d) | .03 | .20 | (.17) | (.17) | —(f) | $6.82 | 2.92* | $1,224,530 | .36*(d) | 2.49*(d) | 90.00*(g) |
| October 31, 2006 | | 6.77 | .29(d,e) | .03 | .32 | (.30) | (.30) | —(f) | 6.79 | 4.89 | 1,193,654 | .70(d,e) | 4.30(d,e) | 238.67(g) |
| October 31, 2005 | | 6.91 | .25(d) | (.16) | .09 | (.23) | (.23) | —(f) | 6.77 | 1.28 | 1,029,647 | .73(d) | 3.69(d) | 300.04(g) |
| October 31, 2004 | | 6.72 | .21(d) | .19 | .40 | (.21) | (.21) | —(f) | 6.91 | 6.06 | 880,124 | .74(d) | 3.01(d) | 441.06 |
| October 31, 2003 | | 6.63 | .26 | .10 | .36 | (.27) | (.27) | — | 6.72 | 5.50 | 712,232 | .68 | 3.82 | 251.00(h) |
| October 31, 2002 | | 6.72 | .33 | (.06) | .27 | (.36) | (.36) | — | 6.63 | 4.26 | 530,302 | .67 | 5.03 | 268.10(h) |
|
See notes to financial highlights at the end of this section.
The accompanying notes are an integral part of these financial statements.
74
| Financial highlights (Continued) |
* Not annualized.
** Unaudited.
† For the period January 21, 2003 (commencement of operations) to October 31, 2003.
(a) Per share net investment income has been determined on the basis of the weighted average number of shares outstanding during the period.
(b) Total return assumes dividend reinvestment and does not reflect the effect of sales charges.
(c) Includes amounts paid through expense offset arrangements (Note 2).
(d) Reflects an involuntary contractual expense limitation and waivers of certain fund expenses in connection with investments in Putnam Prime Money Market Fund in effect during the period. As a result of such limitation and waivers, the expenses of each class reflect a reduction of the following amounts (Notes 2 and 5):
| | Percentage |
| | of average |
| | net assets |
|
| April 30, 2007 | 0.04% |
|
| October 31, 2006 | 0.05 |
|
| October 31, 2005 | 0.03 |
|
| October 31, 2004 | <0.01 |
|
(e) Reflects a non-recurring reimbursement to the fund from Putnam Investments relating to the calculation of certain amounts paid by the fund to Putnam in previous years for transfer agent services, which amounted to less than $0.01 per share and 0.03% of average net assets for the period ended October 31, 2006.
(f) Amount represents less than $0.01 per share.
(g) Portfolio turnover excludes dollar roll transactions.
(h) Portfolio turnover excludes certain treasury note transactions executed in connection with a short-term trading strategy.
The accompanying notes are an integral part of these financial statements.
76
Notes to financial statements 4/30/07 (Unaudited)
Note 1: Significant accounting policies
Putnam Income Fund (the “fund”), a Massachusetts business trust, is registered under the Investment Company Act of 1940, as amended, as a diversified, open-end management investment company. The fund seeks high current income consistent with what Putnam Investment Management, LLC (“Putnam Management”), the fund’s manager, an indirect wholly-owned subsidiary of Putnam, LLC, believes to be prudent risk. The fund invests in a portfolio of debt securities, both government and corporate obligations, and may invest in preferred stocks and common stocks.
The fund offers class A, class B, class C, class M, class R and class Y shares. Class A and class M shares are sold with a maximum front-end sales charge of 3.75% and 3.25%, respectively, and generally do not pay a contingent deferred sales charge. Class B shares, which convert to class A shares after approximately eight years, do not pay a front-end sales charge and are subject to a contingent deferred sales charge, if those shares are redeemed within six years of purchase. Class C shares have a one-year 1.00% contingent deferred sales charge and do not convert to class A shares. Class R shares, which are offered to qualified employee-benefit plans, are sold without a front-end sales charge or a contingent deferred sales charge. The expenses for class A, class B, class C, class M and class R shares may differ based on the distribution fee of each class, which is identified in Note 2. Class Y shares, which are sold at net asset value, are generally subject to the sa me expenses as class A, class B, class C, class M and class R shares, but do not bear a distribution fee. Class Y shares are sold to certain eligible purchasers including certain defined contribution plans (including corporate IRAs), bank trust departments, trust companies, other Putnam funds and products, and certain college savings plans.
Effective October 2, 2006, a 1.00% redemption fee may apply on any shares purchased on or after such date that are redeemed (either by selling or exchanging into another fund) within 7 days of purchase. The redemption fee is accounted for as an addition to paid-in-capital. Prior to October 2, 2006, a 2.00% redemption fee applied to any shares that were redeemed (either by selling or exchanging into another fund) within 5 days of purchase.
Investment income, realized and unrealized gains and losses and expenses of the fund are borne pro-rata based on the relative net assets of each class to the total net assets of the fund, except that each class bears expenses unique to that class (including the distribution fees applicable to such classes). Each class votes as a class only with respect to its own distribution plan or other matters on which a class vote is required by law or determined by the Trustees. If the fund were liquidated, shares of each class would receive their pro-rata share of the net assets of the fund. In addition, the Trustees declare separate dividends on each class of shares.
In the normal course of business, the fund enters into contracts that may include agreements to indemnify another party under given circumstances. The fund’s maximum exposure under these arrangements is unknown as this would involve future claims that may be, but have not yet been, made against the fund. However, the fund expects the risk of material loss to be remote.
The following is a summary of significant accounting policies consistently followed by the fund in the preparation of its financial statements. The preparation of financial statements is in conformity with accounting principles generally accepted in the United States of America and requires management to make estimates and assumptions that affect the reported amounts of assets and liabilities in the financial statements and the reported amounts of increases and decreases in net assets from operations during the reporting period. Actual results could differ from those estimates.
A) Security valuation Market quotations are not considered to be readily available for certain debt obligations; such investments are valued on the basis of valuations furnished by an independent
77
pricing service approved by the Trustees or dealers selected by Putnam Management. Such services or dealers determine valuations for normal institutional-size trading units of such securities using methods based on market transactions for comparable securities and various relationships, generally recognized by institutional traders, between securities. Securities quoted in foreign currencies, if any, are translated into U.S. dollars at the current exchange rate. Certain investments, including certain restricted securities, are also valued at fair value following procedures approved by the Trustees. Such valuations and procedures are reviewed periodically by the Trustees. The fair value of securities is generally determined as the amount that the fund could reasonably expect to realize from an orderly disposition of such securities over a reasonable period of time. By its nature, a fair value price is a good faith estimate of the value of a security at a given point in time and does not reflect an actual market price, which may be different by a material amount.
B) Joint trading account Pursuant to an exemptive order from the Securities and Exchange Commission (the “SEC”), the fund may transfer uninvested cash balances, including cash collateral received under security lending arrangements, into a joint trading account along with the cash of other registered investment companies and certain other accounts managed by Putnam Management. These balances may be invested in issues of high-grade short-term investments having maturities of up to 397 days for collateral received under security lending arrangements and up to 90 days for other cash investments.
C) Repurchase agreements The fund, or any joint trading account, through its custodian, receives delivery of the underlying securities, the market value of which at the time of purchase is required to be in an amount at least equal to the resale price, including accrued interest. Collateral for certain tri-party repurchase agreements is held at the counterparty’s custodian in a segregated account for the benefit of the fund and the counterparty. Putnam Management is responsible for determining that the value of these underlying securities is at all times at least equal to the resale price, including accrued interest.
D) Security transactions and related investment income Security transactions are recorded on the trade date (the date the order to buy or sell is executed). Gains or losses on securities sold are determined on the identified cost basis.
Interest income is recorded on the accrual basis. All premiums/discounts are amortized/accreted on a yield-to-maturity basis.
Securities purchased or sold on a forward commitment or delayed delivery basis may be settled a month or more after the trade date; interest income is accrued based on the terms of the securities. Losses may arise due to changes in the market value of the underlying securities or if the counterparty does not perform under the contract.
E) Stripped securities The fund may invest in stripped securities which represent a participation in securities that may be structured in classes with rights to receive different portions of the interest and principal. Interest-only securities receive all of the interest and principal-only securities receive all of the principal. If the interest-only securities experience greater than anticipated prepayments of principal, the fund may fail to recoup fully its initial investment in these securities. Conversely, principal-only securities increase in value if prepayments are greater than anticipated and decline if prepayments are slower than anticipated. The market value of these securities is highly sensitive to changes in interest rates.
F) Futures and options contracts The fund may use futures and options contracts to hedge against changes in the values of securities the fund owns or expects to purchase, or for other investment purposes. The fund may also write options on swaps or securities it owns or in which it may invest to increase its current returns.
The potential risk to the fund is that the change in value of futures and options contracts may not correspond to the change in value of the hedged
78
instruments. In addition, losses may arise from changes in the value of the underlying instruments, if there is an illiquid secondary market for the contracts, or if the counterparty to the contract is unable to perform. Risks may exceed amounts recognized on the Statement of assets and liabilities. When the contract is closed, the fund records a realized gain or loss equal to the difference between the value of the contract at the time it was opened and the value at the time it was closed. Realized gains and losses on purchased options are included in realized gains and losses on investment securities. If a written call option is exercised, the premium originally received is recorded as an addition to sales proceeds. If a written put option is exercised, the premium originally received is recorded as a reduction to the cost of investments.
Futures contracts are valued at the quoted daily settlement prices established by the exchange on which they trade. The fund and the broker agree to exchange an amount of cash equal to the daily fluctuation in the value of the futures contract. Such receipts or payments are known as “variation margin.” Exchange traded options are valued at the last sale price or, if no sales are reported, the last bid price for purchased options and the last ask price for written options. Options traded over-the-counter are valued using prices supplied by dealers. Futures and written option contracts outstanding at period end, if any, are listed after the fund’s portfolio.
G) Total return swap contracts The fund may enter into total return swap contracts, which are arrangements to exchange a market linked return for a periodic payment, both based on a notional principal amount. To the extent that the total return of the security, index or other financial measure underlying the transaction exceeds or falls short of the offsetting interest rate obligation, the fund will receive a payment from or make a payment to the counterparty. Total return swap contracts are marked to market daily based upon quotations from market makers and the change, if any, is recorded as unrealized gain or loss. Payments received or made are recorded as realized gains or loss. Certain total return swap contracts may include extended effective dates. Income related to these swap contracts is accrued based on the terms of the contract. The fund could be exposed to credit or market risk due to unfavorable changes in the fluctuation of interest rates or in the price of the underlying security or index, the possibility that there is no liquid market for these agreements or that the counterparty may default on its obligation to perform. Risk of loss may exceed amounts recognized on the Statement of assets and liabilities. Total return swap contracts outstanding at period end, if any, are listed after the fund’s portfolio.
H) Interest rate swap contracts The fund may enter into interest rate swap contracts, which are arrangements between two parties to exchange cash flows based on a notional principal amount, to manage the fund’s exposure to interest rates. Interest rate swap contracts are marked to market daily based upon quotations from an independent pricing service or market makers and the change, if any, is recorded as unrealized gain or loss. Payments received or made are recorded as realized gains or loss. Certain interest rate swap contracts may include extended effective dates. Income related to these swap contracts is accrued based on the terms of the contract. The fund could be exposed to credit or market risk due to unfavorable changes in the fluctuation of interest rates or if the counterparty defaults on its obligation to perform. Risk of loss may exceed amounts recognized on the Statement of assets and liabilities. Interes t rate swap contracts outstanding at period end, if any, are listed after the fund’s portfolio.
I) Credit default contracts The fund may enter into credit default contracts where one party, the protection buyer, makes an upfront or periodic payment to a counter party, the protection seller, in exchange for the right to receive a contingent payment. The maximum amount of the payment may equal the notional amount, at par, of the underlying index or security as a result of a related credit event. Payments are made upon a credit
79
default event of the disclosed primary referenced obligation or all other equally ranked obligations of the reference entity. An upfront payment received by the fund, as the protection seller, is recorded as a liability on the fund’s books. An upfront payment made by the fund, as the protection buyer, is recorded as an asset on the fund’s books. Periodic payments received or paid by the fund are recorded as realized gains or losses. The credit default contracts are marked to market daily based upon quotations from an independent pricing service or market makers and the change, if any, is recorded as unrealized gain or loss. Payments received or made as a result of a credit event or termination of the contract are recognized, net of a proportional amount of the upfront payment, as realized gains or losses. In addition to bearing the risk that the credit event will occur, the fund could be exposed to market risk due to unfavorable changes in interest rates o r in the price of the underlying security or index, the possibility that the fund may be unable to close out its position at the same time or at the same price as if it had purchased comparable publicly traded securities or that the counterparty may default on its obligation to perform. Risks of loss may exceed amounts recognized on the Statement of assets and liabilities. Credit default contracts outstanding at period end, if any, are listed after the fund’s portfolio.
J) TBA purchase commitments The fund may enter into “TBA” (to be announced) commitments to purchase securities for a fixed unit price at a future date beyond customary settlement time. Although the unit price has been established, the principal value has not been finalized. However, the amount of the commitments will not significantly differ from the principal amount. The fund holds, and maintains until settlement date, cash or high-grade debt obligations in an amount sufficient to meet the purchase price, or the fund may enter into offsetting contracts for the forward sale of other securities it owns. Income on the securities will not be earned until settlement date. TBA purchase commitments may be considered securities themselves, and involve a risk of loss if the value of the security to be purchased declines prior to the settlement date, which risk is in addition to the risk of decline in the value of the fund’s other assets. Unsettled TBA purchase commitments are valued at fair value of the underlying securities, according to the procedures described under “Security valuation” above. The contract is marked to market daily and the change in market value is recorded by the fund as an unrealized gain or loss.
Although the fund will generally enter into TBA purchase commitments with the intention of acquiring securities for its portfolio or for delivery pursuant to options contracts it has entered into, the fund may dispose of a commitment prior to settlement if Putnam Management deems it appropriate to do so.
K) TBA sale commitments The fund may enter into TBA sale commitments to hedge its portfolio positions or to sell mortgage-backed securities it owns under delayed delivery arrangements. Proceeds of TBA sale commitments are not received until the contractual settlement date. During the time a TBA sale commitment is outstanding, equivalent deliverable securities or an offsetting TBA purchase commitment deliverable on or before the sale commitment date, are held as “cover” for the transaction.
Unsettled TBA sale commitments are valued at the fair value of the underlying securities, generally according to the procedures described under “Security valuation” above. The contract is marked to market daily and the change in market value is recorded by the fund as an unrealized gain or loss. If the TBA sale commitment is closed through the acquisition of an offsetting purchase commitment, the fund realizes a gain or loss. If the fund delivers securities under the commitment, the fund realizes a gain or a loss from the sale of the securities based upon the unit price established at the date the commitment was entered into. TBA sale commitments outstanding at period end, if any, are listed after the fund’s portfolio.
80
L) Dollar rolls To enhance returns, the fund may enter into dollar rolls (principally using TBAs) in which the fund sells securities for delivery in the current month and simultaneously contracts to purchase similar securities on a specified future date. During the period between the sale and subsequent purchase, the fund will not be entitled to receive income and principal payments on the securities sold. The fund will, however, retain the difference between the initial sales price and the forward price for the future purchase. The fund will also be able to earn interest on the cash proceeds that are received from the initial sale. The fund may be exposed to market or credit risk if the price of the security changes unfavorably or the counterparty fails to perform under the terms of the agreement.
M) Securities lending The fund may lend securities, through its agents, to qualified borrowers in order to earn additional income. The loans are collateralized by cash and/or securities in an amount at least equal to the market value of the securities loaned. The market value of securities loaned is determined daily and any additional required collateral is allocated to the fund on the next business day. The risk of borrower default will be borne by the fund’s agents; the fund will bear the risk of loss with respect to the investment of the cash collateral. Income from securities lending is included in investment income on the Statement of operations. At April 30, 2007, the value of securities loaned amounted to $2,309,710. The fund received cash collateral of $2,364,300 which is pooled with collateral of other Putnam funds into 35 issues of high grade short-term investments.
N) Federal taxes It is the policy of the fund to distribute all of its taxable income within the prescribed time and otherwise comply with the provisions of the Internal Revenue Code of 1986 (the “Code”) applicable to regulated investment companies. It is also the intention of the fund to distribute an amount sufficient to avoid imposition of any excise tax under Section 4982 of the Code, as amended. Therefore, no provision has been made for federal taxes on income, capital gains orunrealized appreciation on securities held nor for excise tax on income and capital gains.
At October 31, 2006, the fund had a capital loss carryover of $120,753,811 available to the extent allowed by the Code to offset future net capital gain, if any. The amount of the carryover and the expiration dates are:
| Loss Carryover | Expiration |
|
| $81,110,898 | October 31, 2008 |
|
| 9,580,324 | October 31, 2009 |
|
| 15,454,954 | October 31, 2013 |
|
| 14,607,635 | October 31, 2014 |
|
The aggregate identified cost on a tax basis is $3,713,468,961, resulting in gross unrealized appreciation and depreciation of $16,154,563 and $34,642,231, respectively, or net unrealized depreciation of $18,487,668.
O) Distributions to shareholders Distributions to shareholders from net investment income are recorded by the fund on the ex-dividend date. Distributions from capital gains, if any, are recorded on the ex-dividend date and paid at least annually. The amount and character of income and gains to be distributed are determined in accordance with income tax regulations, which may differ from generally accepted accounting principles. Dividend sources are estimated at the time of declaration. Actual results may vary. Any non-taxable return of capital cannot be determined until final tax calculations are completed after the end of the fund’s fiscal year. Reclassifications are made to the fund’s capital accounts to reflect income and gains available for distribution (or available capital loss carryovers) under income tax regulations.
Note 2: Management fee, administrative services and other transactions
Putnam Management is paid for management and investment advisory services quarterly based on the average net assets of the fund. Such fee is based on the following annual rates: 0.65% of the
81
first $500 million of average net assets, 0.55% of the next $500 million, 0.50% of the next $500 million, 0.45% of the next $5 billion, 0.425% of the next $5 billion, 0.405% of the next $5 billion, 0.39% of the next $5 billion and 0.38% thereafter.
Putnam Management has agreed to waive fees and reimburse expenses of the fund through October 31, 2007 to the extent necessary to ensure that the fund’s expenses do not exceed the simple average of the expenses of all front-end load funds viewed by Lipper Inc. as having the same investment classification or objective as the fund. The expense reimbursement is based on a comparison of the fund’s expenses with the average annualized operating expenses of the funds in its Lipper peer group for each calendar quarter during the fund’s last fiscal year, excluding 12b-1 fees and without giving effect to any expense offset and brokerage service arrangements that may reduce fund expenses. For the period ended April 30, 2007, Putnam Management waived $852,807 of its management fee from the fund.
In July 2006, questions arose regarding a potential misidentification of the characteristics of certain securities in the fund’s portfolio, and the value of these securities was adjusted. The fund currently expects to be reimbursed for losses relating to this matter by Putnam. The amount of such reimbursement has not yet been determined, but is not expected to be material to the fund.
The fund reimburses Putnam Management an allocated amount for the compensation and related expenses of certain officers of the fund and their staff who provide administrative services to the fund. The aggregate amount of all such reimbursements is determined annually by the Trustees.
Custodial functions for the fund’s assets were provided by Putnam Fiduciary Trust Company (“PFTC”), a subsidiary of Putnam, LLC, and by State Street Bank and Trust Company. Custody fees are based on the fund’s asset level, the number of its security holdings and transaction volumes. Putnam Investor Services, a division of PFTC, provided investor servicing agent functions to the fund.
Putnam Investor Services received fees for investor servicing based on the number of shareholder accounts in the fund and the level of defined contribution plan assets in the fund. During the period ended April 30, 2007, the fund incurred $3,070,038 for custody and investor servicing agent functions provided by PFTC.
The fund has entered into arrangements with PFTC and State Street Bank and Trust Company whereby PFTC’s and State Street Bank and Trust Company’s fees are reduced by credits allowed on cash balances. For the six months ended April 30, 2007, the fund’s expenses were reduced by $183,709 under these arrangements.
Each independent Trustee of the fund receives an annual Trustee fee, of which $730, as a quarterly retainer, has been allocated to the fund, and an additional fee for each Trustees meeting attended. Trustees receive additional fees for attendance at certain committee meetings, industry seminars and for certain compliance-related matters. Trustees also are reimbursed for expenses they incur relating to their services as Trustees. George Putnam, III, who was not an independent Trustee during the period, also receives the foregoing fees for his services as Trustee.
The fund has adopted a Trustee Fee Deferral Plan (the “Deferral Plan”) which allows the Trustees to defer the receipt of all or a portion of Trustees fees payable on or after July 1, 1995. The deferred fees remain invested in certain Putnam funds until distribution in accordance with the Deferral Plan.
The fund has adopted an unfunded noncontributory defined benefit pension plan (the “Pension Plan”) covering all Trustees of the fund who have served as a Trustee for at least five years and were first elected prior to 2004. Benefits under the Pension Plan are equal to 50% of the Trustee’s average annual attendance and retainer fees for the three years ended December 31, 2005. The retirement benefit is payable during a Trustee’s lifetime, beginning the year following retirement, for the number of years of service through December 31, 2006. Pension expense for the fund is included in
82
Trustee compensation and expenses in the Statement of operations. Accrued pension liability is included in Payable for Trustee compensation and expenses in the Statement of assets and liabilities. The Trustees have terminated the Pension Plan with respect to any Trustee first elected after 2003.
The fund has adopted distribution plans (the “Plans”) with respect to its class A, class B, class C, class M and class R shares pursuant to Rule 12b-1 under the Investment Company Act of 1940. The purpose of the Plans is to compensate Putnam Retail Management, a wholly-owned subsidiary of Putnam, LLC and Putnam Retail Management GP, Inc., for services provided and expenses incurred in distributing shares of the fund. The Plans provide for payments by the fund to Putnam Retail Management at an annual rate of up to 0.35%, 1.00%, 1.00%, 1.00% and 1.00% of the average net assets attributable to class A, class B, class C, class M and class R shares, respectively. The Trustees have approved payment by the fund at an annual rate of 0.25%, 1.00%, 1.00%, 0.50% and 0.50% of the average net assets attributable to class A, class B, class C, class M and class R shares, respectively.
For the six months ended April 30, 2007, Putnam Retail Management, acting as underwriter, received net commissions of $26,344 and $1,107 from the sale of class A and class M shares, respectively, and received $90,468 and $449 in contingent deferred sales charges from redemptions of class B and class C shares, respectively.
A deferred sales charge of up to 1.00% and 0.40% is assessed on certain redemptions of class A and class M shares, respectively. For the six months ended April 30, 2007, Putnam Retail Management, acting as underwriter, received $159 and no monies on class A and class M redemptions, respectively.
Note 3: Purchases and sales of securities
During the six months ended April 30, 2007, cost of purchases and proceeds from sales of investment securities other than U.S. government securities and short-term investments aggregated $1,777,957,822 and $1,859,642,189, respectively. Purchases and sales of U.S. government securities aggregated $133,541,727 and $123,004,551, respectively.
Written option transactions during the period ended April 30, 2007 are summarized as follows:
| | Contract | Premiums |
| | Amounts | Received |
|
| Written options | | |
| outstanding at | | |
| beginning of period | $317,596,000 | $11,916,354 |
|
| Options opened | 93,300,000 | 2,102,019 |
| Options exercised | — | — |
| Options expired | — | — |
| Options closed | (93,300,000) | (2,102,018) |
|
| Written options | | |
| outstanding at | | |
| end of period | $317,596,000 | $11,916,355 |
Note 4: Capital shares
At April 30, 2007, there was an unlimited number of shares of beneficial interest authorized. Transactions in capital shares were as follows:
| CLASS A | Shares | | Amount |
|
| Six months ended 4/30/07: | | |
| Shares sold | 10,681,832 | $ | 72,210,609 |
|
| Shares issued | | | |
| in connection | | | |
| with reinvestment | | | |
| of distributions | 2,328,711 | | 15,703,514 |
|
| | 13,010,543 | | 87,914,123 |
|
| Shares | | | |
| repurchased | (16,282,562) | | (110,063,545) |
|
| Net decrease | (3,272,019) | $ | (22,149,422) |
| |
| Year ended 10/31/06: | | |
| Shares sold | 19,865,158 | $ | 132,603,695 |
|
| Shares issued | | | |
| in connection | | | |
| with reinvestment | | | |
| of distributions | 4,497,838 | | 29,973,325 |
|
| | 24,362,996 | | 162,577,020 |
|
| Shares | | | |
| repurchased | (36,688,023) | | (244,947,539) |
|
| Net decrease | (12,325,027) | $ | (82,370,519) |
83
| CLASS B | Shares | Amount |
|
| Six months ended 4/30/07: | | |
| Shares sold | 1,143,087 | $ 7,681,773 |
|
| Shares issued | | |
| in connection | | |
| with reinvestment | | |
| of distributions | 373,545 | 2,502,731 |
|
| | 1,516,632 | 10,184,504 |
|
| Shares | | |
| repurchased | (5,399,502) | (36,249,759) |
|
| Net decrease | (3,882,870) | $(26,065,255) |
| |
| Year ended 10/31/06: | |
| Shares sold | 2,156,920 | $ 14,310,483 |
|
| Shares issued | | |
| in connection | | |
| with reinvestment | | |
| of distributions | 885,021 | 5,865,049 |
|
| | 3,041,941 | 20,175,532 |
|
| Shares | | |
| repurchased | (14,321,590) | (94,952,140) |
|
| Net decrease | (11,279,649) | $(74,776,608) |
|
| |
| CLASS C | Shares | Amount |
|
| Six months ended 4/30/07: | | |
| Shares sold | 172,189 | $ 1,160,277 |
|
| Shares issued | | |
| in connection | | |
| with reinvestment | | |
| of distributions | 50,964 | 342,402 |
|
| | 223,153 | 1,502,679 |
|
| Shares | | |
| repurchased | (396,003) | (2,664,719) |
|
| Net decrease | (172,850) | $(1,162,040) |
| |
| Year ended 10/31/06: | |
| Shares sold | 663,619 | $ 4,427,282 |
|
| Shares issued | | |
| in connection | | |
| with reinvestment | | |
| of distributions | 99,094 | 658,308 |
|
| | 762,713 | 5,085,590 |
|
| Shares | | |
| repurchased | (1,203,882) | (8,025,360) |
|
| Net decrease | (441,169) | $(2,939,770) |
| CLASS M | Shares | Amount |
|
| Six months ended 4/30/07: | |
| Shares sold | 196,325 | $ 1,312,860 |
|
| Shares issued | | |
| in connection | | |
| with reinvestment | | |
| of distributions | 37,536 | 250,185 |
|
| | 233,861 | 1,563,045 |
|
| Shares | | |
| repurchased | (6,685,429) | (44,611,631) |
|
| Net decrease | (6,451,568) | $(43,048,586) |
| |
| Year ended 10/31/06: | |
| Shares sold | 557,067 | $ 3,683,868 |
|
| Shares issued | | |
| in connection | | |
| with reinvestment | | |
| of distributions | 79,585 | 524,809 |
|
| | 636,652 | 4,208,677 |
|
| Shares | | |
| repurchased | (14,063,029) | (92,858,510) |
|
| Net decrease | (13,426,377) | $(88,649,833) |
|
| |
| CLASS R | Shares | Amount |
|
| Six months ended 4/30/07: | |
| Shares sold | 40,876 | $ 275,884 |
|
| Shares issued | | |
| in connection | | |
| with reinvestment | | |
| of distributions | 2,820 | 18,996 |
|
| | 43,696 | 294,880 |
|
| Shares | | |
| repurchased | (12,765) | (86,017) |
|
| Net increase | 30,931 | $ 208,863 |
| |
| Year ended 10/31/06: | |
| Shares sold | 67,633 | $ 450,278 |
|
| Shares issued | | |
| in connection | | |
| with reinvestment | | |
| of distributions | 3,460 | 23,009 |
|
| | 71,093 | 473,287 |
|
| Shares | | |
| repurchased | (18,614) | (123,847) |
|
| Net increase | 52,479 | $ 349,440 |
84
| CLASS Y | Shares | | Amount |
|
| Six months ended 4/30/07: | | |
| Shares sold | 28,833,159 | $ | 196,126,218 |
|
| Shares issued | | | |
| in connection | | | |
| with reinvestment | | | |
| of distributions | 4,304,690 | | 29,230,056 |
|
| | 33,137,849 | | 225,356,274 |
|
| Shares | | | |
| repurchased | (29,364,682) | | (199,767,055) |
|
| Net increase | 3,773,167 | $ | 25,589,219 |
| |
| Year ended 10/31/06: | | |
| Shares sold | 58,853,385 | $ | 396,031,832 |
|
| Shares issued | | | |
| in connection | | | |
| with reinvestment | | | |
| of distributions | 7,436,682 | | 49,837,687 |
|
| | 66,290,067 | | 445,869,519 |
|
| Shares | | | |
| repurchased | (42,583,483) | | (286,020,388) |
|
| Net increase | 23,706,584 | $ | 159,849,131 |
Note 5: Investment in Putnam Prime Money Market Fund
The fund invests in Putnam Prime Money Market Fund, an open-end management investment company managed by Putnam Management. Investments in Putnam Prime Money Market Fund are valued at its closing net asset value each business day. Management fees paid by the fund are reduced by an amount equal to the management and administrative services fees paid by Putnam Prime Money Market Fund with respect to assets invested by the fund in Putnam Prime Money Market Fund. For the period ended April 30, 2007, management fees paid were reduced by $118,854 relating to the fund’s investment in Putnam Prime Money Market Fund. Income distributions earned by the fund are recorded as income in the Statement of operations and totaled $6,866,617 for the period ended April 30, 2007. During the period ended April 30, 2007, cost of purchases and proceeds of sales of investments in Putnam Prime Money Market Fund aggregated $751,028,098 and $785,665,525 , respectively.
Note 6: Regulatory matters and litigation
In late 2003 and 2004, Putnam Management settled charges brought by the SEC and the Massachusetts Securities Division (“MSD”) in connection with excessive short-term trading by certain former Putnam employees and, in the case of charges brought by the MSD, excessive short-term trading by participants in some Putnam-administered 401(k) plans. Putnam Management agreed to pay $193.5 million in penalties and restitution, of which $153.5 million will be distributed to certain open-end Putnam funds and their shareholders after the SEC and MSD approve a distribution plan being developed by an independent consultant. The allegations of the SEC and MSD and related matters have served as the general basis for certain lawsuits, including purported class action lawsuits filed against Putnam Management and, in a limited number of cases, against some Putnam funds. Putnam Management believes that these lawsuits will have no material adverse effect on the funds or on Putn am Management’s ability to provide investment management services. In addition, Putnam Management has agreed to bear any costs incurred by the Putnam funds as a result of these matters.
Putnam Management and Putnam Retail Management are named as defendants in a civil suit in which the plaintiffs allege that the management and distribution fees paid by certain Putnam funds were excessive and seek recovery under the Investment Company Act of 1940. Putnam Management and Putnam Retail Management have contested the plaintiffs’ claims and the matter is currently pending in the U.S. District Court for the District of Massachusetts. Based on currently available information, Putnam Management believes that this action is without merit and that it is unlikely to have a material effect on Putnam Management’s and Putnam Retail Management’s ability to provide services to their clients, including the fund.
85
Note 7: New accounting pronouncements
In June 2006, the Financial Accounting Standards Board (“FASB”) issued Interpretation No. 48, Accounting for Uncertainty in Income Taxes (the “Interpretation”). The Interpretation prescribes a minimum threshold for financial statement recognition of the benefit of a tax position taken or expected to be taken by a filer in the filer’s tax return. The Interpretation will become effective for fiscal years beginning after December 15, 2006 but will also apply to tax positions reflected in the fund’s financial statements as of that date. No determination has been made whether the adoption of the Interpretation will require the fund to make any adjustments to its net assets or have any other effect on the fund’s financial statements. The effects of implementing this pronouncement, if any, will be noted in the fund’s next semiannual financial statements.
In September 2006, the FASB issued Statement of Financial Accounting Standards No. 157, Fair Value Measurements (the “Standard”). The Standard defines fair value, sets out a framework for measuring fair value and requires additional disclosures about fair value measurements. The Standard applies to fair value measurements already required or permitted by existing standards. The Standard is effective for financial statements issued for fiscal years beginning after November 15, 2007 and interim periods within those fiscal years. Putnam Management is currently evaluating what impact the adoption of the Standard will have on the fund’s financial statements.
86
Putnam puts your interests first
In January 2004, Putnam began introducing a number of voluntary initiatives designed to reduce fund expenses, provide investors with more useful information, and help safeguard the interests of all Putnam investors. Visit www.putnam.com for details.
Cost-cutting initiatives
Reduced sales charges The maximum sales charge for class A shares has been reduced to 5.25% for equity funds (formerly 5.75%) and 3.75% for most income funds (formerly 4.50%) . The maximum sales charge for class M shares has been reduced to 3.25% for equity funds (formerly 3.50%) .*
Lower class B purchase limit To help ensure that investors are in the most cost-effective share class, the maximum amount that can be invested in class B shares has been reduced to $100,000. (Larger trades or accumulated amounts will be refused.)
Ongoing expenses will be limited Through calendar 2007, total ongoing expenses, including management fees for all funds, will be maintained at or below the average of each fund’s industry peers in its Lipper load-fund universe. For more information, please see the Statement of Additional information.
Improved disclosure
Putnam fund prospectuses and shareholder reports have been revised to disclose additional information that will help shareholders compare funds and weigh their costs and risks along with their potential benefits. Shareholders will find easy-to-understand information about fund expense ratios, portfolio manager compensation, risk comparisons, turnover comparisons, brokerage commissions, and employee and trustee ownership of Putnam funds. Disclosure of breakpoint discounts has also been enhanced to alert investors to potential cost savings.
Protecting investors’ interests
Short-term trading fee introduced To discourage short-term trading, which can interfere with a fund’s long-term strategy, a 1% short-term trading fee may be imposed on any Putnam fund shares (other than money market funds) redeemed or exchanged within seven calendar days of purchase (for certain funds, this fee applies for 90 days).
* The maximum sales charge for class A shares of Putnam Limited Duration Government Income Fund and Putnam Floating Rate Income Fund remains 3.25% .
87
The Putnam
family of funds |
The following is a list of Putnam’s open-end mutual funds offered to the public. Investors should carefully consider the investment objective, risks, charges, and expenses of a fund before investing. For a prospectus containing this and other information for any Putnam fund or product, call your financial advisor at 1-800-225-1581 and ask for a prospectus. Please read the prospectus carefully before investing.
Growth funds
Discovery Growth Fund
Growth Opportunities Fund
Health Sciences Trust
International New Opportunities Fund*
New Opportunities Fund
OTC & Emerging Growth Fund
Small Cap Growth Fund*
Vista Fund
Voyager Fund |
Blend funds
Capital Appreciation Fund
Capital Opportunities Fund*
Europe Equity Fund*
Global Equity Fund*
Global Natural Resources Fund*
International Capital
Opportunities Fund*
International Equity Fund*
Investors Fund
Research Fund
Tax Smart Equity Fund®
Utilities Growth and Income Fund |
Value funds
Classic Equity Fund
Convertible Income-Growth Trust
Equity Income Fund
The George Putnam Fund of Boston
The Putnam Fund for Growth
and Income
International Growth and Income Fund*
Mid Cap Value Fund
New Value Fund
Small Cap Value Fund* |
Income funds
American Government Income Fund
Diversified Income Trust
Floating Rate Income Fund
Global Income Trust*
High Yield Advantage Fund*
High Yield Trust*
Income Fund
Limited Duration Government
Income Fund
Money Market Fund†
U.S. Government Income Trust |
* A 1% redemption fee on total assets redeemed or exchanged within 90 days of purchase may be imposed for all share classes of these funds.
† An investment in a money market fund is not insured or guaranteed by the Federal Deposit Insurance Corporation or any other government agency. Although the fund seeks to preserve your investment at $1.00 per share, it is possible to lose money by investing in the fund.
88
Tax-free income funds
AMT-Free Insured Municipal Fund
Tax Exempt Income Fund
Tax Exempt Money Market Fund§
Tax-Free High Yield Fund
State tax-free income funds:
Arizona, California, Massachusetts, Michigan,
Minnesota, New Jersey, New York, Ohio,
and Pennsylvania
Asset allocation funds
Income Strategies Fund
Putnam Asset Allocation Funds — three
investment portfolios that spread your
money across a variety of stocks, bonds,
and money market investments.
The three portfolios:
Asset Allocation: Balanced Portfolio
Asset Allocation: Conservative Portfolio
Asset Allocation: Growth Portfolio |
Putnam RetirementReady® Funds
Putnam RetirementReady Funds — ten
investment portfolios that offer diversifica-
tion among stocks, bonds, and money
market instruments and adjust to become
more conservative over time based on a
target date for withdrawing assets.
The ten funds:
Putnam RetirementReady 2050 Fund
Putnam RetirementReady 2045 Fund
Putnam RetirementReady 2040 Fund
Putnam RetirementReady 2035 Fund
Putnam RetirementReady 2030 Fund
Putnam RetirementReady 2025 Fund
Putnam RetirementReady 2020 Fund
Putnam RetirementReady 2015 Fund
Putnam RetirementReady 2010 Fund
Putnam RetirementReady Maturity Fund |
With the exception of money market funds, a 1% redemption fee may be applied to shares exchanged or sold within 7 days of purchase (90 days, for certain funds).
Check your account balances and the most recent month-end performance at www.putnam.com.
89
| Services for shareholders |
Help your investment grow Set up a program for systematic investing from a Putnam fund or from your own savings or checking account. (Regular investing does not guarantee a profit or protect against loss in a declining market.)
Switch funds easily* You can move money from one Putnam fund to another within the same class of shares without a service charge.
Access your money easily You can have checks sent regularly or redeem shares any business day at the then-current net asset value, which may be more or less than the original cost of the shares. Class B and class C shares carry a sales charge that is applied to certain withdrawals.
How to buy additional shares You may buy shares through your financial advisor or directly from Putnam. To open an account by mail, send a check made payable to the name of the fund along with a completed fund application. To add to an existing account, complete the investment slip found at the top of your Confirmation of Activity statement and return it with a check payable to your fund.
Visit www.putnam.com A secure section of our Web site contains complete information on your account, including balances and transactions, updated daily. You may also conduct transactions, such as exchanges, additional investments, and address changes. Log on today to get your password.
Call us toll free at 1-800-225-1581 Ask a helpful Putnam representative or your financial advisor for details about any of these or other services, or see your prospectus.
*This privilege is subject to change or termination. An exchange of funds may result in a taxable event. In addition, a 1% redemption fee will be applied to shares exchanged or sold within 7 days of purchase, and, for certain funds, this fee applies on total assets redeemed or exchanged within 90 days of purchase.
90
Founded nearly 70 years ago, Putnam Investments was built around the concept that a balance between risk and reward is the hallmark of a well-rounded financial program. We manage over 100 mutual funds in growth, value, blend, fixed income, and international.
| Investment Manager | Officers | Francis J. McNamara, III |
| Putnam Investment | Charles E. Haldeman, Jr. | Vice President and |
| Management, LLC | President | Chief Legal Officer |
| One Post Office Square | | |
| Boston, MA 02109 | Charles E. Porter | Robert R. Leveille |
| Executive Vice President, | Chief Compliance Officer |
| Marketing Services | Principal Executive Officer, | |
| Putnam Retail Management | Associate Treasurer and | Mark C. Trenchard |
| One Post Office Square | Compliance Liaison | Vice President and |
| Boston, MA 02109 | | BSA Compliance Officer |
| | Jonathan S. Horwitz | |
| Custodians | Senior Vice President | Judith Cohen |
| Putnam Fiduciary Trust | and Treasurer | Vice President, Clerk and |
| Company, State Street Bank | | Assistant Treasurer |
| and Trust Company | Steven D. Krichmar | |
| | Vice President and | Wanda M. McManus |
| Legal Counsel | Principal Financial Officer | Vice President, Senior Associate |
| Ropes & Gray LLP | | Treasurer and Assistant Clerk |
| | Janet C. Smith | |
| Trustees | Vice President, Principal | Nancy E. Florek |
| John A. Hill, Chairman | Accounting Officer and | Vice President, Assistant Clerk, |
| Jameson Adkins Baxter, | Assistant Treasurer | Assistant Treasurer and |
| Vice Chairman | | Proxy Manager |
| Charles B. Curtis | Susan G. Malloy | |
| Myra R. Drucker | Vice President and | |
| Charles E. Haldeman, Jr. | Assistant Treasurer | |
| Paul L. Joskow | | |
| Elizabeth T. Kennan | Beth S. Mazor | |
| Kenneth R. Leibler | Vice President | |
| Robert E. Patterson | | |
| George Putnam, III | James P. Pappas | |
| W. Thomas Stephens | Vice President | |
| Richard B. Worley | | |
| Richard S. Robie, III | |
| Vice President | |
91
This report is for the information of shareholders of Putnam Income Fund. It may also be used as sales literature when preceded or accompanied by the current prospectus, the most recent copy of Putnam’s Quarterly Performance Summary, and Putnam’s Quarterly Ranking Summary. For more recent performance, please visit www.putnam.com. Investors should carefully consider the investment objective, risks, charges, and expenses of a fund, which are described in its prospectus. For this and other information or to request a prospectus, call 1-800-225-1581 toll free. Please read the prospectus carefully before investing. The fund’s Statement of Additional Information contains additional information about the fund’s Trustees and is available without charge upon request by calling 1-800-225-1581.
92

Item 2. Code of Ethics:
Not applicable
Item 3. Audit Committee Financial Expert: |
| Item 4. Principal Accountant Fees and Services: |
| Item 5. Audit Committee of Listed Registrants |
| Item 6. Schedule of Investments: |
The registrant’s schedule of investments in unaffiliated issuers is included in the report to shareholders in Item 1 above.
Item 7. Disclosure of Proxy Voting Policies and Procedures For Closed-End Management Investment Companies:
Item 8. Portfolio Managers of Closed-End Investment Companies
Item 9. Purchases of Equity Securities by Closed-End Management Investment Companies and Affiliated Purchasers:
Item 10. Submission of Matters to a Vote of Security Holders:
| Item 11. Controls and Procedures: |
(a) The registrant's principal executive officer and principal financial officer have concluded, based on their evaluation of the effectiveness of the design and operation of the registrant's disclosure controls and procedures as of a date within 90 days of the filing date of this report, that the design and operation of such procedures are generally effective to provide reasonable assurance that information required to be disclosed by the registrant in this report is recorded, processed, summarized and reported within the time periods specified in the Commission's rules and forms.
(b) Changes in internal control over financial reporting: Not applicable
Item 12. Exhibits:
(a)(1) Not applicable |
(a)(2) Separate certifications for the principal executive officer and principal financial officer of the registrant as required by Rule 30a-2(a) under the Investment Company Act of 1940, as amended, are filed herewith.
(b) The certifications required by Rule 30a-2(b) under the Investment Company Act of 1940, as amended, are filed herewith.
Pursuant to the requirements of the Securities Exchange Act of 1934 and the Investment Company Act of 1940, the registrant has duly caused this report to be signed on its behalf by the undersigned, thereunto duly authorized.
Putnam Income Fund
By (Signature and Title):
/s/Janet C. Smith
Janet C. Smith
Principal Accounting Officer
Date: June 29, 2007 |
Pursuant to the requirements of the Securities Exchange Act of 1934 and the Investment Company Act of 1940, this report has been signed below by the following persons on behalf of the registrant and in the capacities and on the dates indicated.
By (Signature and Title):
/s/Charles E. Porter
Charles E. Porter
Principal Executive Officer
Date: June 29, 2007 |
By (Signature and Title):
/s/Steven D. Krichmar
Steven D. Krichmar
Principal Financial Officer
Date: June 29, 2007 |