| | |
| |
| UNITED STATES |
| SECURITIES AND EXCHANGE COMMISSION |
| Washington, D.C. 20549 |
| |
| FORM N-CSR |
| |
| CERTIFIED SHAREHOLDER REPORT OF REGISTERED |
| MANAGEMENT INVESTMENT COMPANIES |
| |
| Investment Company Act file number: (811- 00653) |
| |
| Exact name of registrant as specified in charter: | Putnam Income Fund |
| | |
| Address of principal executive offices: One Post Office Square, Boston, Massachusetts 02109 |
| |
| Name and address of agent for service: | Beth S. Mazor, Vice President |
| | One Post Office Square |
| | Boston, Massachusetts 02109 |
| |
| Copy to: | John W. Gerstmayr, Esq. |
| | Ropes & Gray LLP |
| | One International Place |
| | Boston, Massachusetts 02110 |
| | |
| Registrant’s telephone number, including area code: | (617) 292-1000 | |
| |
| Date of fiscal year end: October 31, 2010 | |
| | |
| Date of reporting period: November 1, 2009 — April 30, 2010 |
Item 1. Report to Stockholders:
The following is a copy of the report transmitted to stockholders pursuant to Rule 30e-1 under the Investment Company Act of 1940:

Putnam
Income
Fund
Semiannual report
4 | 30 | 10
| | | |
| Message from the Trustees | 1 | | |
| About the fund | 2 | | |
| Performance snapshot | 4 | | |
| Interview with your fund’s portfolio manager | 5 | | |
| Your fund’s performance | 9 | | |
| Your fund’s expenses | 11 | | |
| Terms and definitions | 13 | | |
| Other information for shareholders | 14 | | |
| Financial statements | 15 | | |
| Shareholder meeting results | 69 | | |
Message from the Trustees
Dear Fellow Shareholder:
Volatility returned to global equity markets this spring. This change was to be expected after the remarkable advances of the past year, but the headlines from Europe added fuel.
If 2009 can be characterized as a rebound from the liquidity crisis, the investment environment for 2010 is shaping up to be somewhat more difficult, one that requires analysis, insight, innovation, and expertise.
These attributes form the very core of Putnam’s analytic, active-management approach, which seeks to weather short-term periods of market dislocation, while preparing for the expected return of a more positive investing environment. With volatility rising in fixed-income markets, bond investors should benefit from active management as well.
We would like to thank all shareholders who took the time to vote by proxy on a number of issues, including shareholder-friendly management fee changes, which went into effect earlier this year. We would also like to welcome new shareholders to the fund, and thank all of our investors for your continued confidence in Putnam.

About the fund
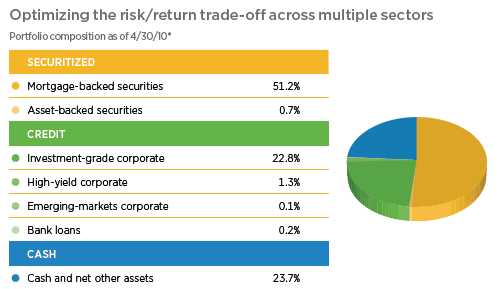
Seeking high current return across a broad range
of fixed-income securities
Over Putnam Income Fund’s 56-year history, the bond landscape has undergone a dramatic transformation. A significant portion of the U.S. investment-grade sector, the fund’s primary focus, is now composed of “securitized” debt instruments, including mortgage- and asset-backed securities. The high-yield corporate bond sector, which was established in the late 1970s, has also grown significantly and is now considered a mature asset class. And outside the United States, there are new opportunities to invest in the debt of developed and emerging-market countries.
Amid this evolution of the fixed-income markets, the investment objective of Putnam Income Fund has remained constant. In a letter to Putnam shareholders in 1963, George Putnam, Jr., expressed it this way: “We have in mind those people who need a liberal current return…” Mr. Putnam’s choice of “current return” rather than “current income” captures the investment philosophy of the fund today: that high current income should be pursued within a total return context and that risk management is as important as yield in maintaining a high current income stream.
Since 1954, Putnam Income Fund
has navigated the changing
bond market landscape to seek
total return for investors.
Successful investing in today’s global bond market requires broad expertise. Putnam’s fixed-income organization includes teams of specialists who focus on varied investment opportunities. The fund’s managers select from among these opportunities, systematically building a diversified portfolio that carefully balances risk and return.
Consider these risks before investing: Lower-rated bonds may offer higher yields in return for more risk. Funds that invest in government securities are not guaranteed. Mortgage-backed securities are subject to prepayment risk. The use of derivatives involves special risks and may result in losses. Funds that invest in bonds are subject to certain risks including interest-rate risk, credit risk, and inflation risk. As interest rates rise, the prices of bonds fall. Long-term bonds are more exposed to interest-rate risk than short-term bonds. Unlike bonds, bond funds have ongoing fees and expenses.
Key fixed-income
return sources
Securitized: Interest-rate cycles affect mortgage- and asset-backed securities (MBS/ABS). Because MBS are the securitized cash flows of mortgages, prepayment rates are another consideration. For ABS, managers monitor the credit quality of the underlying assets, which comprise the securitized cash flow of anything from credit card debt to manufactured housing debt.
Credit: Corporate bond performance tends to track the health of the overall economy more closely than other bonds. These bonds are less sensitive to interest-rate movements; they tend to perform well when the economy strengthens, often in spite of the higher rates that accompany stronger growth.
Government: Interest-rate levels are also a primary driver of government bond performance. Generally, bond prices decline when interest rates rise, and rise when interest rates fall. Interest rates —and bond yields — rise and fall according to investor expectations about the overall health of the economy.
* May include exposure to derivative investments.
Putnam believes that building a diversified portfolio with multiple income-generating strategies is the best way to pursue your fund’s objectives. The fund’s portfolio is normally composed of a broad spectrum of government, credit, and securitized debt instruments.
Weightings are shown as a percentage of the fund’s net assets. Allocations and holdings in each sector will vary over time. For more information on current fund holdings, see pages 16–51.
Performance
snapshot
Annualized total return (%) comparison as of 4/30/10
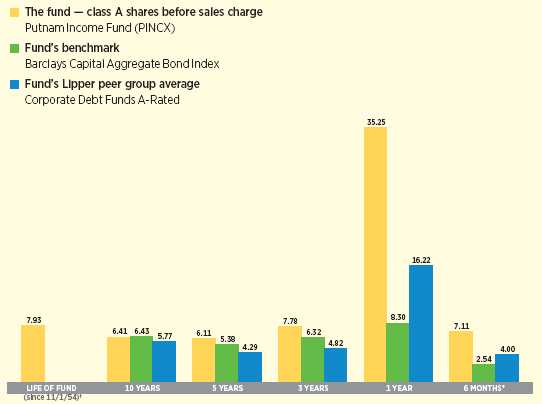
Current performance may be lower or higher than the quoted past performance, which cannot guarantee future results. Share price, principal value, and return will fluctuate, and you may have a gain or a loss when you sell your shares. Performance of class A shares assumes reinvestment of distributions and does not account for taxes. Fund returns in the bar chart do not reflect a sales charge of 4.00%; had they, returns would have been lower. See pages 5 and 9–11 for additional performance information. For a portion of the periods, this fund may have limited expenses, without which returns would have been lower. A 1% short-term trading fee may apply. To obtain the most recent month-end performance, visit putnam.com.
* Returns for the six-month period are not annualized, but cumulative.
† The fund’s benchmark, the Barclays Capital Aggregate Bond Index, was introduced on 12/31/75, and the fund’s Lipper category was introduced on 12/31/59. Both post-date the inception date of the fund’s class A shares.
4
Interview with your
fund’s portfolio manager
Rob Bloemker
How did the fund perform over the recent
six-month period, Rob?
I’m pleased to report that the fund continued to perform well. Over the semiannual period ended April 30, 2010, Putnam Income Fund’s class A shares returned 7.11%, outperforming the 2.54% advance of the benchmark, the Barclays Capital Aggregate Bond Index, and outpacing the 4.00% average return of its peers in the Lipper Corporate Debt Funds A-Rated category.
How would you characterize the broad bond
market environment during this period?
The bond markets generally have been calmer than they were prior to the start of our reporting period. Earlier in 2009, volatility was unusually high, and while we still believe there are areas of the market that offer attractive valuations, the extreme price movements of a year ago have tapered off.
One noteworthy event during the period was the Fed’s [Federal Reserve Board’s] exit from the mortgage market. The Fed had rolled out a number of “quantitative easing” policies in early 2009 that were designed to inject liquidity into the struggling credit market. Some of those policies were fairly traditional, such as reducing the target for short-term interest rates, while others were more unorthodox, including introducing a program to purchase $1.25 trillion of government agency mortgage-backed securities [MBS]. The Fed’s exit from this market in March caused yield spreads on agency MBS to widen moderately — meaning prices of the securities declined — as investors wondered how the sector would perform with the central bank’s purchasing power removed. We believe there is a good deal of pent-up demand for these securities, and the Fed has not indicated it has plans to begin selling the MBS currently on its books. Therefore, we expect prices in the
Broad market index and fund performance
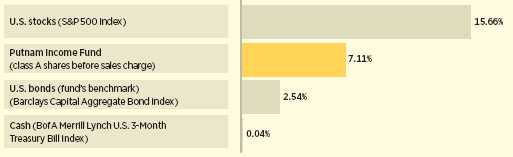
This comparison shows your fund’s performance in the context of broad market indexes for the six months ended 4/30/10. See pages 4 and 9–11 for additional fund performance information. Index descriptions can be found on page 13.
5
sector should remain relatively stable over the near term.
Did you make any significant changes to the
fund’s positioning over the period?
Over the past few months we’ve sought to limit the fund’s exposure to sectors that were being artificially supported by government purchases. Instead, our focus has been on investing in sectors that we felt had the most compelling valuations, including varieties of mortgage bonds that were not being supported by the Fed’s purchase program and remained at distressed levels: agency interest-only mortgage securities, known as “IOs,” commercial mortgage-backed securities [CMBS], and nonagency residential mortgage securities [RMBS]. Roughly half of the fund’s holdings fall into these areas of the market.
IO securities are backed by the interest payments on pools of mortgages. They tend to appreciate in value when refinancing activity and prepayment on the underlying loans slow. That’s exactly the trend we experienced over the past six months. With a somewhat shaky economy, mortgage rates that have been low for some time, and tighter lending standards at banks, homeowners have been sticking with their existing mortgages, and not refinancing, which has helped the fund’s positions.
Holdings in the CMBS market also helped returns. On the whole, we’re bearish on the commercial real estate market, but we’ve been finding a number of opportunities to purchase commercial mortgage bonds at extremely distressed prices, and we’ve been adding to the fund’s position over the past six to twelve months. The securities we do own are very senior, meaning they are among the first debts to be repaid in the event of a bankruptcy. They are also priced so low that, by our analysis, even if the commercial real estate market deteriorates beyond most worst-case predictions, these bonds should still perform.
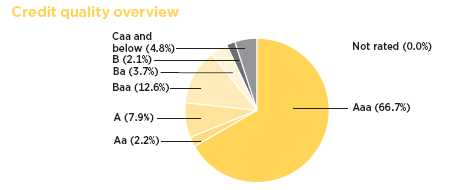
Credit qualities are shown as a percentage of net assets as of 4/30/10. A bond rated Baa or higher (Prime-3 or higher, for short-term debt) is considered investment grade. The chart reflects Moody’s ratings; percentages may include bonds or derivatives not rated by Moody’s but rated by Standard & Poor’s or, if unrated by S&P, by Fitch, and then included in the closest equivalent Moody’s rating. Ratings will vary over time.
Credit quality includes cash bonds and cash, and represents only the fixed-income portion of the portfolio. Derivative instruments, including currency forwards, are only included to the extent of any unrealized gain or loss on such instruments. Rated derivatives are shown in the applicable Moody’s category. Unrated derivatives are shown in the not-rated category. If the aggregate market value of unrated cash bonds plus unrealized losses on unrated derivatives is negative, the sum will be expressed as 0.0% for the not-rated category.
6
“Even if the recovery stalls, we are
still optimistic about the prospects
for the fund.”
Rob Bloemker
Were there any other sectors that had a
notable impact on performance?
The fund has a sizable position in investment-grade corporate credit, which also performed well. Corporate bonds tend to be sensitive to the overall health of the economy, as corporations need to be able to generate revenue to service their debt payments. The possibility for default always exists, but we’ve been mitigating that risk by focusing on a diverse lineup of companies within a very specific segment of the corporate credit market. In general, the balance sheets behind the credit we hold are quite strong. When the recession was at its worst, companies across the board made deep cost cuts and reduced their capital expenditures. With the economy no longer in such dire straits, corporations have been able to refinance their debt at attractive levels, earnings have rebounded sharply, and as a result, these holdings performed well.
How have you positioned the fund with
regard to interest rates?
We’re very cognizant of the risk that rising rates can pose to a bond fund. However, increases in Treasury bond interest rates won’t necessarily translate into interest-rate increases in other sectors. The spread, or the difference in yield, between safe-haven Treasuries and corporate bonds can often tighten as Treasury rates rise, which benefits existing corporate bondholders because bond prices move in the opposite direction of interest rates. In essence, we’re seeking to position the fund in such a way that changes in interest rates — in either direction — have a more muted effect on overall performance, and we seek to achieve this by investing in sectors beyond just Treasuries or government-related securities.
In any event, our outlook on inflation over the near term is for relatively stable prices. A significant portion of the Consumer Price Index [CPI], the national benchmark for inflation, is represented by the housing sector, which continues to be weak. Moreover, because of how housing data is collected for the CPI, there is often a lag between changes in the real estate market and changes in inflation data.
What is your outlook?
The U.S. economy is clearly in much better condition now than it was a year ago, and we believe that it should continue to recover at a moderate pace for the rest of the year. Even if the recovery stalls, however, we are still optimistic about the prospects for the fund. The securities in the portfolio are not overly sensitive to broad economic conditions. For example, the residential and commercial
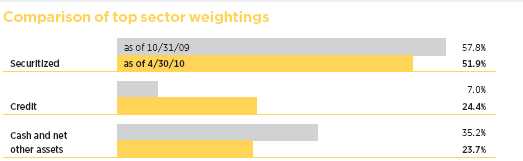
This chart shows how the fund’s top weightings have changed over the past six months. Weightings are shown as a percentage of net assets. Holdings will vary over time.
7
mortgage bonds that the fund holds don’t represent a conviction on our part that those markets are recovering; rather, we believe those securities are undervalued even if those markets continue to deteriorate. The same is true of our corporate bonds: We’re not predicting a significant improvement in corporate America’s bottom line, but instead our holdings reflect our belief that there is value in that sector of the market even if the economy experiences a “double dip.”
As a relatively small fund, we’re able to seek out attractively valued securities throughout the bond market, and quickly implement changes to the portfolio when conditions in the market warrant taking a new direction. The opportunities we’re focused on are often in areas outside the fund’s benchmark, such as the IO securities we discussed. Through careful construction, we’re able to create a portfolio that has a similar risk profile to that of the benchmark, but has the potential to offer very different yield and return characteristics. As active fund managers, we believe this is exactly what our shareholders ask us to do, and I’m glad to report that over the past six months, we’ve delivered on that promise.
Thanks for speaking with us today, Rob.
The views expressed in this report are exclusively those of Putnam Management. They are not meant as investment advice.
Please note that the holdings discussed in this report may not have been held by the fund for the entire period. Portfolio composition is subject to review in accordance with the fund’s investment strategy and may vary in the future. Current and future portfolio holdings are subject to risk.
Of special interest
We are pleased to report that your fund’s monthly dividend increased from $0.039 to $0.043 per share during the period. The increases, which took effect in March 2010, were made possible due to increased interest income resulting from higher yields on interest-only (IO) securities and other mortgage-backed securities.

Portfolio Manager Rob Bloemker is Head of Fixed Income at Putnam. He has a B.S. and a B.A. from Washington University. Rob joined Putnam in 1999 and has been in the investment industry since 1988.
In addition to Rob, your fund’s portfolio managers are Carl Bell, Kevin Murphy, Michael Salm, and Raman Srivastava.
IN THE NEWS
The first-quarter earnings season was much better than expected. With virtually all of the S&P 500 companies reporting, 68% have beaten analysts’ expectations, according to Standard & Poor’s. In a typical quarter, 61% of companies beat estimates. Both top-line (sales) and bottom-line earnings (profits) are coming in above expectations. Companies that undertook aggressive cost-cutting during the economic downturn have added to their bottom lines. Now many of those firms are experiencing rising sales, which is essential to sustained, long-term growth.
8
Your fund’s performance
This section shows your fund’s performance, price, and distribution information for periods ended April 30, 2010, the end of the first half of its current fiscal year. In accordance with regulatory requirements for mutual funds, we also include performance as of the most recent calendar quarter-end and expense information taken from the fund’s current prospectus. Performance should always be considered in light of a fund’s investment strategy. Data represents past performance. Past performance does not guarantee future results. More recent returns may be less or more than those shown. Investment return and principal value will fluctuate, and you may have a gain or a loss when you sell your shares. Performance information does not reflect any deduction for taxes a shareholder may owe on fund distributions or on the redemption of fund shares. For the most recent month-end performance, please visit the Individual Investors section at putnam .com or call Putnam at 1-800-225-1581. Class Y shares are generally only available to corporate and institutional clients and clients in other approved programs. See the Terms and Definitions section in this report for definitions of the share classes offered by your fund.
Fund performance Total return for periods ended 4/30/10
| | | | | | | | | | |
| | Class A | Class B | Class C | Class M | Class R | Class Y |
| (inception dates) | (11/1/54) | (3/1/93) | (7/26/99) | (12/14/94) | (1/21/03) | (6/16/94) |
|
| | NAV | POP | NAV | CDSC | NAV | CDSC | NAV | POP | NAV | NAV |
|
| Annual average | | | | | | | | | | |
| (life of fund) | 7.93% | 7.85% | 6.94% | 6.94% | 7.12% | 7.12% | 7.48% | 7.42% | 7.66% | 8.00% |
|
| 10 years | 86.19 | 78.75 | 72.96 | 72.96 | 73.01 | 73.01 | 81.72 | 75.77 | 81.81 | 91.12 |
| Annual average | 6.41 | 5.98 | 5.63 | 5.63 | 5.63 | 5.63 | 6.15 | 5.80 | 6.16 | 6.69 |
|
| 5 years | 34.54 | 29.08 | 29.73 | 27.74 | 29.78 | 29.78 | 32.90 | 28.53 | 32.90 | 36.25 |
| Annual average | 6.11 | 5.24 | 5.34 | 5.02 | 5.35 | 5.35 | 5.85 | 5.15 | 5.85 | 6.38 |
|
| 3 years | 25.19 | 20.22 | 22.33 | 19.33 | 22.56 | 22.56 | 24.24 | 20.29 | 24.30 | 26.10 |
| Annual average | 7.78 | 6.33 | 6.95 | 6.07 | 7.02 | 7.02 | 7.50 | 6.35 | 7.52 | 8.04 |
|
| 1 year | 35.25 | 29.76 | 34.04 | 29.04 | 34.23 | 33.23 | 34.94 | 30.56 | 34.86 | 35.57 |
|
| 6 months | 7.11 | 2.75 | 6.75 | 1.75 | 6.76 | 5.76 | 7.12 | 3.61 | 7.02 | 7.31 |
|
Current performance may be lower or higher than the quoted past performance, which cannot guarantee future results. After-sales-charge returns (public offering price, or POP) for class A and M shares reflect a maximum 4.00% and 3.25% load, respectively. Class B share returns reflect the applicable contingent deferred sales charge (CDSC), which is 5% in the first year, declining to 1% in the sixth year, and is eliminated thereafter. Class C shares reflect a 1% CDSC for the first year that is eliminated thereafter. Class R and Y shares have no initial sales charge or CDSC. Performance for class B, C, M, R, and Y shares before their inception is derived from the historical performance of class A shares, adjusted for the applicable sales charge (or CDSC) and, except for class Y shares, the higher operating expenses for such shares.
For a portion of the periods, this fund may have limited expenses, without which returns would have been lower.
A 1% short-term trading fee may be applied to shares exchanged or sold within 7 days of purchase.
9
Comparative index returns For periods ended 4/30/10
| | |
| | Barclays Capital Aggregate | Lipper Corporate Debt Funds |
| | Bond Index | A-Rated category average* |
|
| Annual average (life of fund) | —† | —† |
|
| 10 years | 86.43% | 75.69% |
| Annual average | 6.43 | 5.77 |
|
| 5 years | 29.93 | 23.59 |
| Annual average | 5.38 | 4.29 |
|
| 3 years | 20.17 | 15.32 |
| Annual average | 6.32 | 4.82 |
|
| 1 year | 8.30 | 16.22 |
|
| 6 months | 2.54 | 4.00 |
|
Index and Lipper results should be compared to fund performance at net asset value.
* Over the 6-month, 1-year, 3-year, 5-year, and 10-year periods ended 4/30/10, there were 138, 136, 130, 118, and 60 funds, respectively, in this Lipper category.
† The fund’s benchmark, the Barclays Capital Aggregate Bond Index, was introduced on 12/31/75, and the fund’s Lipper category was introduced on 12/31/59. Both post-date the inception date of the fund’s class A shares.
Fund price and distribution information For the six-month period ended 4/30/10
| | | | | | | | |
| Distributions | Class A | Class B | Class C | Class M | Class R | Class Y |
|
| Number | 6 | 6 | 6 | 6 | 6 | 6 |
|
| Income | $0.242 | $0.216 | $0.218 | $0.235 | $0.235 | $0.249 |
|
| Capital gains | — | — | — | — | — | — |
|
| Total | $0.242 | $0.216 | $0.218 | $0.235 | $0.235 | $0.249 |
|
| Share value | NAV | POP | NAV | NAV | NAV | POP | NAV | NAV |
|
| 10/31/09 | $6.61 | $6.89 | $6.56 | $6.58 | $6.50 | $6.72 | $6.59 | $6.67 |
|
| 4/30/10 | 6.83 | 7.11 | 6.78 | 6.80 | 6.72 | 6.95 | 6.81 | 6.90 |
|
| Current yield (end of period) | NAV | POP | NAV | NAV | NAV | POP | NAV | NAV |
|
| Current dividend rate 1 | 7.55% | 7.26% | 6.73% | 6.88% | 7.50% | 7.25% | 7.40% | 7.65% |
|
| Current 30-day SEC yield 2,3 | N/A | 5.16 | 4.61 | 4.62 | N/A | 4.95 | 5.11 | 5.62 |
|
The classification of distributions, if any, is an estimate. Final distribution information will appear on your year-end tax forms.
1 Most recent distribution, excluding capital gains, annualized and divided by NAV or POP at end of period.
2 For a portion of the period, this fund may have limited expenses, without which yields would have been lower.
3 Based only on investment income and calculated using the maximum offering price for each share class, in accordance with SEC guidelines.
10
Fund performance as of most recent calendar quarter
Total return for periods ended 3/31/10
| | | | | | | | | | |
| | Class A | Class B | Class C | Class M | Class R | Class Y |
| (inception dates) | (11/1/54) | (3/1/93) | (7/26/99) | (12/14/94) | (1/21/03) | (6/16/94) |
|
| | NAV | POP | NAV | CDSC | NAV | CDSC | NAV | POP | NAV | NAV |
|
| Annual average | | | | | | | | | | |
| (life of fund) | 7.91% | 7.83% | 6.92% | 6.92% | 7.10% | 7.10% | 7.47% | 7.40% | 7.65% | 7.99% |
|
| 10 years | 81.76 | 74.62 | 68.83 | 68.83 | 68.60 | 68.60 | 77.35 | 71.64 | 77.52 | 86.31 |
| Annual average | 6.16 | 5.73 | 5.38 | 5.38 | 5.36 | 5.36 | 5.90 | 5.55 | 5.91 | 6.42 |
|
| 5 years | 34.61 | 29.27 | 29.81 | 27.81 | 29.84 | 29.84 | 32.95 | 28.54 | 32.96 | 36.33 |
| Annual average | 6.12 | 5.27 | 5.36 | 5.03 | 5.36 | 5.36 | 5.86 | 5.15 | 5.86 | 6.39 |
|
| 3 years | 24.36 | 19.41 | 21.53 | 18.53 | 21.55 | 21.55 | 23.40 | 19.46 | 23.29 | 25.27 |
| Annual average | 7.54 | 6.09 | 6.72 | 5.83 | 6.72 | 6.72 | 7.26 | 6.11 | 7.23 | 7.80 |
|
| 1 year | 40.02 | 34.36 | 39.06 | 34.06 | 38.98 | 37.98 | 39.76 | 35.29 | 39.89 | 40.58 |
|
| 6 months | 8.91 | 4.54 | 8.57 | 3.57 | 8.57 | 7.57 | 8.95 | 5.47 | 9.00 | 9.27 |
|
Your fund’s expenses
As a mutual fund investor, you pay ongoing expenses, such as management fees, distribution fees (12b-1 fees), and other expenses. In the most recent six-month period, your fund limited these expenses; had it not done so, expenses would have been higher. Using the following information, you can estimate how these expenses affect your investment and compare them with the expenses of other funds. You may also pay one-time transaction expenses, including sales charges (loads) and redemption fees, which are not shown in this section and would have resulted in higher total expenses. For more information, see your fund’s prospectus or talk to your financial representative.
Expense ratios
| | | | | | |
| | Class A | Class B | Class C | Class M | Class R | Class Y |
|
| Total annual operating expenses for the fiscal year | | | | | | |
| ended 10/31/09* | 0.95% | 1.70% | 1.70% | 1.20% | 1.20% | 0.70% |
|
| Annualized expense ratio for the six-month period | | | | | | |
| ended 4/30/10† | 0.91% | 1.66% | 1.66% | 1.16% | 1.16% | 0.66% |
|
Fiscal-year expense information in this table is taken from the most recent prospectus, is subject to change, and may differ from that shown for the annualized expense ratio and in the financial highlights of this report. Expenses are shown as a percentage of average net assets.
* Reflects projected expenses under a new management contract, effective 1/1/10, and a new expense arrangement. Excludes estimated interest expense accruing in connection with the termination of certain derivatives contracts.
† Excludes the impact of a current period revision to interest expense related to the resolution of certain terminated derivatives contracts, which amounted to 0.20% of average net assets for the six months ended April 30, 2010.
11
Expenses per $1,000
The following table shows the expenses you would have paid on a $1,000 investment in Putnam Income Fund from November 1, 2009, to April 30, 2010. It also shows how much a $1,000 investment would be worth at the close of the period, assuming actual returns and expenses.
| | | | | | |
| | Class A | Class B | Class C | Class M | Class R | Class Y |
|
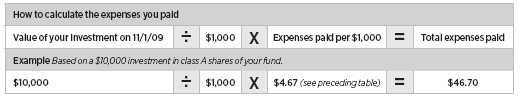
| Expenses paid per $1,000*† | $4.67 | $8.51 | $8.51 | $5.96 | $5.95 | $3.39 |
|
| Ending value (after expenses) | $1,071.10 | $1,067.50 | $1,067.60 | $1,071.20 | $1,070.20 | $1,073.10 |
|
* Expenses for each share class are calculated using the fund’s annualized expense ratio for each class, which represents the ongoing expenses as a percentage of average net assets for the six months ended 4/30/10. The expense ratio may differ for each share class.
† Expenses are calculated by multiplying the expense ratio by the average account value for the period; then multiplying the result by the number of days in the period; and then dividing that result by the number of days in the year.
Estimate the expenses you paid
To estimate the ongoing expenses you paid for the six months ended April 30, 2010, use the following calculation method. To find the value of your investment on November 1, 2009, call Putnam at 1-800-225-1581.
Compare expenses using the SEC’s method
The Securities and Exchange Commission (SEC) has established guidelines to help investors assess fund expenses. Per these guidelines, the following table shows your fund’s expenses based on a $1,000 investment, assuming a hypothetical 5% annualized return. You can use this information to compare the ongoing expenses (but not transaction expenses or total costs) of investing in the fund with those of other funds. All mutual fund shareholder reports will provide this information to help you make this comparison. Please note that you cannot use this information to estimate your actual ending account balance and expenses paid during the period.
| | | | | | |
| | Class A | Class B | Class C | Class M | Class R | Class Y |
|
| Expenses paid per $1,000*† | $4.56 | $8.30 | $8.30 | $5.81 | $5.81 | $3.31 |
|
| Ending value (after expenses) | $1,020.28 | $1,016.56 | $1,016.56 | $1,019.04 | $1,019.04 | $1,021.52 |
|
* Expenses for each share class are calculated using the fund’s annualized expense ratio for each class, which represents the ongoing expenses as a percentage of average net assets for the six months ended 4/30/10. The expense ratio may differ for each share class.
† Expenses are calculated by multiplying the expense ratio by the average account value for the period; then multiplying the result by the number of days in the period; and then dividing that result by the number of days in the year.
12
Terms and definitions
Important terms
Total return shows how the value of the fund’s shares changed over time, assuming you held the shares through the entire period and reinvested all distributions in the fund.
Net asset value (NAV) is the price, or value, of one share of a mutual fund, without a sales charge. NAVs fluctuate with market conditions. NAV is calculated by dividing the net assets of each class of shares by the number of outstanding shares in the class.
Public offering price (POP) is the price of a mutual fund share plus the maximum sales charge levied at the time of purchase. POP performance figures shown here assume the 4.00% maximum sales charge for class A shares and 3.25% for class M shares.
Contingent deferred sales charge (CDSC) is generally a charge applied at the time of the redemption of class B or C shares and assumes redemption at the end of the period. Your fund’s class B CDSC declines from a 5% maximum during the first year to 1% during the sixth year. After the sixth year, the CDSC no longer applies. The CDSC for class C shares is 1% for one year after purchase.
Current yield is the annual rate of return earned from dividends or interest of an investment. Current yield is expressed as a percentage of the price of a security, fund share, or principal investment.
Share classes
Class A shares are generally subject to an initial sales charge and no CDSC (except on certain redemptions of shares bought without an initial sales charge).
Class B shares are not subject to an initial sales charge. They may be subject to a CDSC.
Class C shares are not subject to an initial sales charge and are subject to a CDSC only if the shares are redeemed during the first year.
Class M shares have a lower initial sales charge and a higher 12b-1 fee than class A shares and no CDSC (except on certain redemptions of shares bought without an initial sales charge).
Class R shares are not subject to an initial sales charge or CDSC and are available only to certain defined contribution plans.
Class Y shares are not subject to an initial sales charge or CDSC, and carry no 12b-1 fee. They are generally only available to corporate and institutional clients and clients in other approved programs.
Comparative indexes
Barclays Capital Aggregate Bond Index is an unmanaged index of U.S. investment-grade fixed-income securities.
BofA (Bank of America) Merrill Lynch U.S. 3-Month Treasury Bill Index is an unmanaged index that seeks to measure the performance of U.S. Treasury bills available in the marketplace.
S&P 500 Index is an unmanaged index of common stock performance.
Indexes assume reinvestment of all distributions and do not account for fees. Securities and performance of a fund and an index will differ. You cannot invest directly in an index.
Lipper is a third-party industry-ranking entity that ranks mutual funds. Its rankings do not reflect sales charges. Lipper rankings are based on total return at net asset value relative to other funds that have similar current investment styles or objectives as determined by Lipper. Lipper may change a fund’s category assignment at its discretion. Lipper category averages reflect performance trends for funds within a category.
13
Other information for shareholders
Important notice regarding delivery
of shareholder documents
In accordance with SEC regulations, Putnam sends a single copy of annual and semiannual shareholder reports, prospectuses, and proxy statements to Putnam shareholders who share the same address, unless a shareholder requests otherwise. If you prefer to receive your own copy of these documents, please call Putnam at 1-800-225-1581, and Putnam will begin sending individual copies within 30 days.
Proxy voting
Putnam is committed to managing our mutual funds in the best interests of our shareholders. The Putnam funds’ proxy voting guidelines and procedures, as well as information regarding how your fund voted proxies relating to portfolio securities during the 12-month period ended June 30, 2009, are available in the Individual Investors section of putnam.com, and on the SEC’s Web site, www.sec.gov. If you have questions about finding forms on the SEC’s Web site, you may call the SEC at 1-800-SEC-0330. You may also obtain the Putnam funds’ proxy voting guidelines and procedures at no charge by calling Putnam’s Shareholder Services at 1-800-225-1581.
Fund portfolio holdings
The fund will file a complete schedule of its portfolio holdings with the SEC for the first and third quarters of each fiscal year on Form N-Q. Shareholders may obtain the fund’s Forms N-Q on the SEC’s Web site at www.sec.gov. In addition, the fund’s Forms N-Q may be reviewed and copied at the SEC’s Public Reference Room in Washington, D.C. You may call the SEC at 1-800-SEC-0330 for information about the SEC’s Web site or the operation of the Public Reference Room.
Trustee and employee
fund ownership
Putnam employees and members of the Board of Trustees place their faith, confidence, and, most importantly, investment dollars in Putnam mutual funds. As of April 30, 2010, Putnam employees had approximately $347,000,000 and the Trustees had approximately $49,000,000 invested in Putnam mutual funds. These amounts include investments by the Trustees’ and employees’ immediate family members as well as investments through retirement and deferred compensation plans.
14
Financial statements
A guide to financial statements
These sections of the report, as well as the accompanying Notes, constitute the fund’s financial statements.
The fund’s portfolio lists all the fund’s investments and their values as of the last day of the reporting period. Holdings are organized by asset type and industry sector, country, or state to show areas of concentration and diversification.
Statement of assets and liabilities shows how the fund’s net assets and share price are determined. All investment and non-investment assets are added together. Any unpaid expenses and other liabilities are subtracted from this total. The result is divided by the number of shares to determine the net asset value per share, which is calculated separately for each class of shares. (For funds with preferred shares, the amount subtracted from total assets includes the liquidation preference of preferred shares.)
Statement of operations shows the fund’s net investment gain or loss. This is done by first adding up all the fund’s earnings — from dividends and interest income — and subtracting its operating expenses to determine net investment income (or loss). Then, any net gain or loss the fund realized on the sales of its holdings — as well as any unrealized gains or losses over the period — is added to or subtracted from the net investment result to determine the fund’s net gain or loss for the fiscal period.
Statement of changes in net assets shows how the fund’s net assets were affected by the fund’s net investment gain or loss, by distributions to shareholders, and by changes in the number of the fund’s shares. It lists distributions and their sources (net investment income or realized capital gains) over the current reporting period and the most recent fiscal year-end. The distributions listed here may not match the sources listed in the Statement of operations because the distributions are determined on a tax basis and may be paid in a different period from the one in which they were earned. Dividend sources are estimated at the time of declaration. Actual results may vary. Any non-taxable return of capital cannot be determined until final tax calculations are completed after the end of the fund’s fiscal year.
Financial highlights provide an overview of the fund’s investment results, per-share distributions, expense ratios, net investment income ratios, and portfolio turnover in one summary table, reflecting the five most recent reporting periods. In a semiannual report, the highlights table also includes the current reporting period.
15
The fund’s portfolio 4/30/10 (Unaudited)
| | |
| MORTGAGE-BACKED SECURITIES (43.8%)* | Principal amount | Value |
|
| Asset Securitization Corp. Ser. 96-MD6, Class A7, 8.631s, 2029 | $922,185 | $995,445 |
|
| Banc of America Commercial Mortgage, Inc. | | |
| FRB Ser. 07-3, Class A3, 5.837s, 2049 | 1,213,000 | 1,275,609 |
| Ser. 07-2, Class A2, 5.634s, 2049 | 945,000 | 966,644 |
| Ser. 06-4, Class A2, 5.522s, 2046 | 4,884,000 | 5,024,257 |
| Ser. 05-6, Class A2, 5.165s, 2047 | 530,000 | 536,217 |
| Ser. 07-5, Class XW, IO, 0.6s, 2051 | 23,262,893 | 516,408 |
| Ser. 07-1, Class XW, IO, 0.466s, 2049 | 11,432,432 | 171,377 |
|
| Banc of America Commercial Mortgage, Inc. 144A | | |
| Ser. 02-PB2, Class XC, IO, 0.999s, 2035 | 27,041,749 | 296,694 |
| Ser. 04-4, Class XC, IO, 0.295s, 2042 | 18,893,555 | 288,061 |
| Ser. 04-5, Class XC, IO, 0.231s, 2041 | 53,842,052 | 730,007 |
| Ser. 06-5, Class XC, IO, 0.15s, 2016 | 81,484,926 | 1,229,192 |
| Ser. 05-1, Class XW, IO, 0.132s, 2042 | 104,206,323 | 143,513 |
|
| Banc of America Large Loan | | |
| FRB Ser. 04-BBA4, Class H, 1.204s, 2018 | 273,000 | 163,800 |
| FRB Ser. 04-BBA4, Class G, 0.954s, 2018 | 365,000 | 237,250 |
|
| Banc of America Large Loan 144A | | |
| FRB Ser. 05-MIB1, Class K, 2.254s, 2022 | 409,000 | 198,264 |
| FRB Ser. 05-MIB1, Class J, 1.304s, 2022 | 1,095,000 | 591,300 |
|
| Bayview Commercial Asset Trust 144A | | |
| Ser. 07-5A, IO, 3.047s, 2037 | 7,172,475 | 748,806 |
| Ser. 04-2, IO, 2.97s, 2034 | 1,740,929 | 52,924 |
| Ser. 05-1A, IO, 2.87s, 2035 | 2,915,857 | 123,341 |
| Ser. 04-3, IO, 2.87s, 2035 | 2,077,300 | 77,691 |
| Ser. 07-1, Class S, IO, 2.47s, 2037 | 8,581,052 | 708,795 |
| Ser. 06-4A, IO, 2.331s, 2036 | 1,298,707 | 95,585 |
| Ser. 05-3A, IO, 2.15s, 2035 | 8,096,670 | 396,737 |
| Ser. 06-2A, IO, 1.798s, 2036 | 1,635,872 | 99,134 |
| FRB Ser. 05-1A, Class A1, 0.563s, 2035 | 676,349 | 527,552 |
|
| Bear Stearns Alternate Trust FRB Ser. 06-5, Class 2A2, 6 1/4s, 2036 | 2,512,246 | 1,582,715 |
|
| Bear Stearns Commercial Mortgage Securities, Inc. | | |
| FRB Ser. 00-WF2, Class F, 8.455s, 2032 | 379,000 | 336,389 |
| Ser. 07-PW17, Class A3, 5.736s, 2050 F | 15,217,000 | 15,484,015 |
| Ser. 04-PR3I, Class X1, IO, 0.38s, 2041 | 9,610,272 | 149,959 |
| Ser. 05-PWR9, Class X1, IO, 0.248s, 2042 F | 29,703,506 | 207,176 |
|
| Bear Stearns Commercial Mortgage Securities, Inc. 144A | | |
| Ser. 06-PW14, Class XW, IO, 0.879s, 2038 F | 15,115,701 | 487,876 |
| Ser. 06-PW14, Class X1, IO, 0.172s, 2038 F | 16,255,883 | 241,434 |
| Ser. 07-PW15, Class X1, IO, 0.132s, 2044 F | 47,945,329 | 339,206 |
| Ser. 05-PW10, Class X1, IO, 0.095s, 2040 F | 64,693,984 | 106,661 |
|
| Bear Stearns Small Balance Commercial Trust 144A | | |
| Ser. 06-1A, Class AIO, IO, 1s, 2034 | 1,431,400 | 8,331 |
|
| Citigroup Commercial Mortgage Trust Ser. 08-C7, Class A2A, | | |
| 6.034s, 2049 | 1,600,000 | 1,648,954 |
|
| Citigroup Commercial Mortgage Trust 144A Ser. 06-C5, | | |
| Class XC, IO, 0.129s, 2049 | 97,248,454 | 1,300,212 |
|
| Citigroup Mortgage Loan Trust, Inc. FRB Ser. 06-AR7, | | |
| Class 2A2A, 5.515s, 2036 | 256,418 | 161,543 |
|
16
| | |
| MORTGAGE-BACKED SECURITIES (43.8%)* cont. | Principal amount | Value |
|
| Citigroup/Deutsche Bank Commercial Mortgage Trust 144A | | |
| Ser. 07-CD4, Class XW, IO, 0.561s, 2049 | $20,970,960 | $371,186 |
| Ser. 06-CD2, Class X, IO, 0.126s, 2046 | 62,597,527 | 181,795 |
| Ser. 07-CD4, Class XC, IO, 0.119s, 2049 | 70,133,024 | 567,376 |
|
| Commercial Mortgage Acceptance Corp. 144A | | |
| Ser. 98-C1, Class F, 6.23s, 2031 | 1,546,373 | 1,571,782 |
| Ser. 98-C2, Class F, 5.44s, 2030 | 2,996,000 | 3,149,889 |
|
| Commercial Mortgage Loan Trust Ser. 08-LS1, Class A4B, | | |
| 6.22s, 2017 | 1,301,000 | 1,316,098 |
|
| Commercial Mortgage Pass-Through Certificates 144A | | |
| Ser. 03-LB1A, Class X1, IO, 0.591s, 2038 | 6,682,180 | 245,163 |
| Ser. 05-LP5, Class XC, IO, 0.235s, 2043 | 31,867,057 | 295,790 |
| Ser. 06-C8, Class XS, IO, 0.163s, 2046 | 47,475,625 | 462,669 |
| Ser. 05-C6, Class XC, IO, 0.115s, 2044 | 45,757,362 | 235,109 |
|
| Countrywide Alternative Loan Trust | | �� |
| Ser. 06-2CB, Class A11, 6s, 2036 | 9,105,801 | 6,052,512 |
| Ser. 07-HY5R, Class 2A1A, 5.544s, 2047 | 1,407,357 | 1,257,331 |
|
| Countrywide Home Loans | | |
| FRB Ser. 05-HYB7, Class 6A1, 5.554s, 2035 | 55,697 | 40,659 |
| FRB Ser. 05-HYB4, Class 2A1, 4.518s, 2035 | 2,746,044 | 1,935,961 |
|
| Countrywide Home Loans 144A | | |
| IFB Ser. 05-R2, Class 2A3, 8s, 2035 | 384,066 | 372,544 |
| Ser. 04-R2, Class 1AS, IO, 5.659s, 2034 | 12,206,908 | 1,425,621 |
| IFB Ser. 05-R1, Class 1AS, IO, 5.65s, 2035 | 12,442,320 | 1,460,509 |
| Ser. 06-R1, Class AS, IO, 5.627s, 2036 | 3,253,190 | 353,784 |
| Ser. 05-R3, Class AS, IO, 5.558s, 2035 | 19,537,187 | 2,149,091 |
| FRB Ser. 06-R2, Class AS, IO, 5.489s, 2036 | 6,648,377 | 675,226 |
| IFB Ser. 05-R2, Class 1AS, IO, 5.305s, 2035 | 25,806,187 | 2,727,113 |
| FRB Ser. 04-R2, Class 1AF1, 0.683s, 2034 | 5,024,681 | 4,069,992 |
|
| Credit Suisse Mortgage Capital Certificates | | |
| FRB Ser. 07-C4, Class A2, 5.998s, 2039 | 4,383,000 | 4,568,119 |
| Ser. 06-C5, Class AX, IO, 0.185s, 2039 | 30,892,229 | 451,243 |
|
| Credit Suisse Mortgage Capital Certificates 144A | | |
| Ser. 07-C2, Class AX, IO, 0.273s, 2049 | 95,497,185 | 635,056 |
| Ser. 06-C4, Class AX, IO, 0.16s, 2039 | 62,218,121 | 819,842 |
| Ser. 07-C1, Class AX, IO, 0 1/8s, 2040 | 62,285,070 | 469,941 |
|
| CRESI Finance Limited Partnership 144A | | |
| FRB Ser. 06-A, Class D, 1.063s, 2017 | 188,000 | 80,840 |
| FRB Ser. 06-A, Class C, 0.863s, 2017 | 553,000 | 293,090 |
|
| Criimi Mae Commercial Mortgage Trust 144A Ser. 98-C1, | | |
| Class B, 7s, 2033 | 759,356 | 744,169 |
|
| CS First Boston Mortgage Securities Corp. | | |
| FRB Ser. 04-C3, Class A5, 5.113s, 2036 | 39,000 | 41,001 |
| Ser. 04-C3, Class A3, 4.302s, 2036 | 20,339 | 20,345 |
|
| CS First Boston Mortgage Securities Corp. 144A | | |
| Ser. 02-CP3, Class AX, IO, 1.63s, 2035 | 28,827,940 | 749,789 |
| FRB Ser. 04-TF2A, Class J, 1.204s, 2016 F | 254,000 | 223,521 |
| FRB Ser. 04-TF2A, Class H, 0.954s, 2019 F | 495,000 | 480,149 |
| Ser. 01-CK1, Class AY, IO, 0.886s, 2035 | 67,555,080 | 124,051 |
| Ser. 03-C3, Class AX, IO, 0.606s, 2038 | 37,994,119 | 1,538,446 |
| Ser. 04-C4, Class AX, IO, 0.447s, 2039 | 7,642,409 | 168,777 |
|
17
| | |
| MORTGAGE-BACKED SECURITIES (43.8%)* cont. | Principal amount | Value |
|
| CWCapital Cobalt Ser. 07-C2, Class A2, 5.334s, 2047 | $11,224,000 | $11,638,667 |
|
| Deutsche Mortgage & Asset Receiving Corp. Ser. 98-C1, | | |
| Class X, IO, 0.79s, 2031 | 142,913 | 2,836 |
|
| DLJ Commercial Mortgage Corp. | | |
| Ser. 99-CG2, Class B3, 6.1s, 2032 | 1,485,000 | 1,484,031 |
| Ser. 99-CG2, Class B4, 6.1s, 2032 F | 2,084,000 | 2,119,359 |
|
| Fannie Mae | | |
| IFB Ser. 07-75, Class JS, 50.26s, 2037 | 588,396 | 1,050,992 |
| IFB Ser. 06-62, Class PS, 38.325s, 2036 | 500,151 | 799,143 |
| IFB Ser. 07-30, Class FS, 28.612s, 2037 | 778,902 | 1,131,465 |
| IFB Ser. 06-49, Class SE, 27.95s, 2036 | 1,461,196 | 2,147,490 |
| IFB Ser. 05-25, Class PS, 27.005s, 2035 | 69,765 | 104,848 |
| IFB Ser. 06-115, Class ES, 25.51s, 2036 | 1,049,121 | 1,483,299 |
| IFB Ser. 06-8, Class HP, 23.604s, 2036 | 1,371,193 | 1,927,226 |
| IFB Ser. 05-45, Class DC, 23.348s, 2035 | 1,166,571 | 1,643,602 |
| IFB Ser. 05-95, Class OP, 19.544s, 2035 | 626,693 | 835,945 |
| IFB Ser. 05-106, Class JC, 19.31s, 2035 | 380,432 | 491,426 |
| IFB Ser. 05-83, Class QP, 16.712s, 2034 | 322,317 | 405,526 |
| IFB Ser. 03-44, Class SI, IO, 7.738s, 2033 | 4,554,625 | 822,961 |
| IFB Ser. 06-90, Class SE, IO, 7.538s, 2036 | 1,232,228 | 240,331 |
| IFB Ser. 04-17, Class ST, IO, 7.338s, 2034 | 121,652 | 22,838 |
| IFB Ser. 06-24, Class QS, IO, 6.938s, 2036 | 2,692,277 | 482,968 |
| IFB Ser. 05-52, Class DC, IO, 6.938s, 2035 | 1,409,970 | 250,894 |
| IFB Ser. 04-24, Class CS, IO, 6.888s, 2034 | 2,914,581 | 491,690 |
| IFB Ser. 04-60, Class SW, IO, 6.788s, 2034 | 4,075,212 | 653,338 |
| IFB Ser. 03-130, Class BS, IO, 6.788s, 2033 | 118,702 | 15,815 |
| IFB Ser. 03-76, Class SB, IO, 6.788s, 2033 | 34,275,573 | 5,130,882 |
| IFB Ser. 03-34, Class WS, IO, 6.738s, 2029 | 467,598 | 54,218 |
| IFB Ser. 05-48, Class SM, IO, 6.538s, 2034 | 2,124,489 | 288,208 |
| IFB Ser. 07-54, Class CI, IO, 6.498s, 2037 | 1,525,091 | 211,375 |
| IFB Ser. 08-34, Class SM, IO, 6.488s, 2038 | 4,716,968 | 668,081 |
| IFB Ser. 07-58, Class SP, IO, 6.488s, 2037 | 1,617,541 | 268,725 |
| IFB Ser. 07-28, Class SE, IO, 6.488s, 2037 | 1,573,322 | 217,631 |
| IFB Ser. 07-24, Class SD, IO, 6.488s, 2037 | 6,400,584 | 881,424 |
| IFB Ser. 06-79, Class SI, IO, 6.488s, 2036 | 1,596,254 | 203,778 |
| IFB Ser. 05-90, Class GS, IO, 6.488s, 2035 | 217,347 | 30,924 |
| IFB Ser. 05-12, Class SC, IO, 6.488s, 2035 | 1,340,669 | 184,212 |
| IFB Ser. 05-17, Class ES, IO, 6.488s, 2035 | 1,735,221 | 221,029 |
| IFB Ser. 07-30, Class IE, IO, 6.478s, 2037 | 4,572,193 | 761,864 |
| IFB Ser. 06-123, Class CI, IO, 6.478s, 2037 | 3,457,816 | 494,986 |
| IFB Ser. 05-82, Class SY, IO, 6.468s, 2035 | 10,077,014 | 1,403,778 |
| IFB Ser. 05-45, Class SR, IO, 6.458s, 2035 | 6,287,111 | 876,134 |
| IFB Ser. 06-36, Class SP, IO, 6.438s, 2036 | 3,263,398 | 372,400 |
| IFB Ser. 06-23, Class SP, IO, 6.438s, 2036 | 5,008,370 | 751,506 |
| IFB Ser. 06-16, Class SM, IO, 6.438s, 2036 | 1,309,971 | 190,358 |
| IFB Ser. 05-95, Class CI, IO, 6.438s, 2035 | 2,163,729 | 335,356 |
| IFB Ser. 05-84, Class SG, IO, 6.438s, 2035 | 3,457,915 | 498,362 |
| IFB Ser. 06-3, Class SB, IO, 6.438s, 2035 | 7,813,514 | 1,214,298 |
| IFB Ser. 05-23, Class SG, IO, 6.438s, 2035 | 2,639,034 | 416,139 |
| IFB Ser. 05-17, Class SA, IO, 6.438s, 2035 | 2,414,633 | 349,856 |
| IFB Ser. 05-17, Class SE, IO, 6.438s, 2035 | 2,645,245 | 397,979 |
18
| | |
| MORTGAGE-BACKED SECURITIES (43.8%)* cont. | Principal amount | Value |
|
| Fannie Mae | | |
| IFB Ser. 05-57, Class DI, IO, 6.438s, 2035 | $6,646,803 | $792,400 |
| IFB Ser. 05-5, Class SD, IO, 6.438s, 2035 | 9,220,302 | 1,315,368 |
| IFB Ser. 04-92, Class S, IO, 6.438s, 2034 | 146,842 | 19,464 |
| IFB Ser. 05-83, Class QI, IO, 6.428s, 2035 | 609,855 | 84,074 |
| IFB Ser. 06-128, Class GS, IO, 6.418s, 2037 | 1,676,993 | 228,955 |
| IFB Ser. 05-73, Class SD, IO, 6.418s, 2035 | 292,092 | 49,292 |
| IFB Ser. 07-68, Class SA, IO, 6.388s, 2037 | 12,304,351 | 1,118,798 |
| IFB Ser. 06-116, Class LS, IO, 6.388s, 2036 | 173,989 | 25,100 |
| IFB Ser. 04-92, Class SQ, IO, 6.387s, 2034 | 116,818 | 20,012 |
| IFB Ser. 06-115, Class IE, IO, 6.378s, 2036 | 1,305,994 | 167,130 |
| IFB Ser. 06-109, Class SH, IO, 6.358s, 2036 | 1,875,190 | 290,673 |
| IFB Ser. 06-111, Class SA, IO, 6.358s, 2036 | 516,744 | 74,954 |
| IFB Ser. 06-104, Class IC, IO, 6.338s, 2036 | 5,397,516 | 778,376 |
| IFB Ser. 06-103, Class SB, IO, 6.338s, 2036 | 4,831,450 | 615,701 |
| IFB Ser. 06-39, Class DS, IO, 6.338s, 2036 | 27,610,241 | 3,814,146 |
| IFB Ser. 06-8, Class JH, IO, 6.338s, 2036 | 6,328,521 | 924,850 |
| IFB Ser. 09-12, Class CI, IO, 6.338s, 2036 | 12,419,940 | 1,785,118 |
| IFB Ser. 05-122, Class SG, IO, 6.338s, 2035 | 1,335,352 | 180,019 |
| IFB Ser. 05-122, Class SW, IO, 6.338s, 2035 | 1,711,185 | 235,305 |
| IFB Ser. 06-17, Class SI, IO, 6.318s, 2036 | 1,070,756 | 141,811 |
| IFB Ser. 06-60, Class YI, IO, 6.308s, 2036 | 1,976,870 | 317,723 |
| IFB Ser. 06-42, Class TI, IO, 6.308s, 2036 | 33,644,071 | 4,410,065 |
| IFB Ser. 06-86, Class SB, IO, 6.288s, 2036 | 5,127,656 | 756,893 |
| IFB Ser. 09-12, Class AI, IO, 6.238s, 2037 | 6,828,765 | 931,512 |
| IFB Ser. 10-2, Class TS, IO, 6.238s, 2027 | 1,094,934 | 135,974 |
| IFB Ser. 07-15, Class NI, IO, 6.238s, 2022 | 2,374,695 | 273,279 |
| IFB Ser. 09-70, Class SI, IO, 6.188s, 2036 | 6,026,479 | 604,817 |
| IFB Ser. 06-79, Class SH, IO, 6.188s, 2036 | 151,446 | 22,681 |
| IFB Ser. 07-30, Class LI, IO, 6.178s, 2037 | 6,321,080 | 821,361 |
| IFB Ser. 07-89, Class SA, IO, 6.168s, 2037 | 5,662,376 | 705,143 |
| IFB Ser. 06-82, Class SI, IO, 6.168s, 2036 | 8,964,058 | 1,060,179 |
| IFB Ser. 07-54, Class IA, IO, 6.148s, 2037 | 1,890,603 | 241,109 |
| IFB Ser. 07-54, Class IB, IO, 6.148s, 2037 | 1,890,603 | 241,109 |
| IFB Ser. 07-54, Class IC, IO, 6.148s, 2037 | 1,890,603 | 241,109 |
| IFB Ser. 07-54, Class ID, IO, 6.148s, 2037 | 1,890,603 | 241,109 |
| IFB Ser. 07-54, Class IF, IO, 6.148s, 2037 | 2,811,419 | 364,247 |
| IFB Ser. 07-15, Class CI, IO, 6.118s, 2037 | 6,449,604 | 837,352 |
| IFB Ser. 06-115, Class JI, IO, 6.118s, 2036 | 4,602,328 | 618,093 |
| IFB Ser. 06-123, Class LI, IO, 6.058s, 2037 | 3,110,772 | 400,108 |
| IFB Ser. 10-2, Class SD, IO, 6.038s, 2040 | 3,343,900 | 383,701 |
| IFB Ser. 08-11, Class SC, IO, 6.018s, 2038 | 259,661 | 33,327 |
| IFB Ser. 10-2, Class MS, IO, 5.988s, 2050 | 2,481,435 | 270,136 |
| IFB Ser. 09-111, Class SE, IO, 5.988s, 2040 | 10,934,355 | 925,812 |
| IFB Ser. 09-71, Class XS, IO, 5.938s, 2036 | 30,967,884 | 3,526,627 |
| IFB Ser. 09-87, Class HS, IO, 5.888s, 2039 | 169,338 | 19,855 |
| IFB Ser. 09-91, Class S, IO, 5.888s, 2039 | 4,579,754 | 423,627 |
| IFB Ser. 07-39, Class AI, IO, 5.858s, 2037 | 3,223,261 | 377,379 |
| IFB Ser. 07-32, Class SD, IO, 5.848s, 2037 | 2,307,089 | 280,678 |
| IFB Ser. 07-30, Class UI, IO, 5.838s, 2037 | 1,885,607 | 217,991 |
| IFB Ser. 07-32, Class SC, IO, 5.838s, 2037 | 1,834,126 | 219,983 |
19
| | |
| MORTGAGE-BACKED SECURITIES (43.8%)* cont. | Principal amount | Value |
|
| Fannie Mae | | |
| IFB Ser. 07-1, Class CI, IO, 5.838s, 2037 | $2,119,022 | $258,985 |
| IFB Ser. 07-3, Class SH, IO, 5.808s, 2037 | 4,131,534 | 474,771 |
| Ser. 06-W2, Class 1AS, IO, 5.755s, 2036 | 2,377,030 | 293,200 |
| Ser. 06-W3, Class 1AS, IO, 5.752s, 2046 | 11,998,655 | 1,478,288 |
| IFB Ser. 05-58, Class IK, IO, 5.738s, 2035 | 3,160,830 | 461,590 |
| IFB Ser. 04-46, Class PJ, IO, 5.738s, 2034 | 2,913,370 | 362,889 |
| IFB Ser. 07-75, Class ID, IO, 5.608s, 2037 | 1,960,253 | 218,856 |
| Ser. 383, Class 18, IO, 5 1/2s, 2038 | 825,390 | 129,554 |
| Ser. 383, Class 19, IO, 5 1/2s, 2038 | 746,811 | 117,231 |
| Ser. 383, Class 6, IO, 5 1/2s, 2037 | 627,033 | 112,182 |
| Ser. 383, Class 7, IO, 5 1/2s, 2037 | 618,856 | 99,026 |
| Ser. 385, Class 10, IO, 5 1/2s, 2037 | 45,259,270 | 7,670,554 |
| Ser. 383, Class 20, IO, 5 1/2s, 2037 | 480,044 | 75,772 |
| IFB Ser. 09-3, Class SE, IO, 5.238s, 2037 | 2,493,932 | 256,626 |
| Ser. 385, Class 3, IO, 5s, 2038 | 3,538,395 | 578,377 |
| IFB Ser. 05-W2, Class A2, IO, 4.948s, 2035 | 4,732,878 | 451,076 |
| Ser. 09-86, Class UI, IO, 4s, 2014 | 26,408,618 | 1,945,523 |
| Ser. 03-W12, Class 2, IO, 2.223s, 2043 | 9,880,689 | 802,203 |
| Ser. 03-W10, Class 3, IO, 1.846s, 2043 | 3,421,704 | 239,851 |
| Ser. 03-W10, Class 1, IO, 1.764s, 2043 | 14,657,540 | 945,235 |
| Ser. 03-W8, Class 12, IO, 1.638s, 2042 | 21,805,781 | 1,348,537 |
| Ser. 03-W17, Class 12, IO, 1.139s, 2033 | 4,445,039 | 198,638 |
| Ser. 03-W19, IO, 1.084s, 2033 | 510,220 | 19,452 |
| Ser. 03-T2, Class 2, IO, 0.81s, 2042 | 34,355,493 | 974,661 |
| Ser. 03-W3, Class 2IO1, IO, 0.674s, 2042 | 10,340,049 | 250,147 |
| Ser. 03-W6, Class 51, IO, 0.663s, 2042 | 6,823,473 | 155,997 |
| Ser. 03-18, Class X1, IO, 0.638s, 2042 | 11,923,328 | 266,840 |
| Ser. 03-W10, Class 3A, IO, 0.601s, 2043 | 343,568 | 7,782 |
| Ser. 01-T12, Class IO, 0.565s, 2041 | 12,057,290 | 259,098 |
| Ser. 03-W10, Class 1A, IO, 0.495s, 2043 | 289,801 | 5,389 |
| Ser. 03-W2, Class 1, IO, 0.466s, 2042 | 13,684,178 | 151,277 |
| Ser. 02-T4, IO, 0.446s, 2041 | 6,649,105 | 74,877 |
| Ser. 03-W3, Class 1, IO, 0.442s, 2042 | 9,068,792 | 130,205 |
| Ser. 01-50, Class B1, IO, 0.43s, 2041 | 1,687,526 | 25,707 |
| Ser. 02-T1, Class IO, IO, 0.424s, 2031 | 10,580,353 | 165,799 |
| Ser. 03-W6, Class 3, IO, 0.368s, 2042 | 9,589,373 | 124,681 |
| Ser. 03-W6, Class 23, IO, 0.352s, 2042 | 10,038,698 | 125,641 |
| Ser. 03-34, Class P1, PO, zero %, 2043 | 50,071 | 37,647 |
| Ser. 07-64, Class LO, PO, zero %, 2037 | 451,354 | 426,006 |
| Ser. 07-14, Class KO, PO, zero %, 2037 | 355,519 | 304,243 |
| Ser. 06-125, Class OX, PO, zero %, 2037 | 128,662 | 113,085 |
| Ser. 06-84, Class OT, PO, zero %, 2036 | 80,919 | 72,669 |
| Ser. 06-56, Class XF, zero %, 2036 | 128,286 | 115,200 |
| Ser. 06-46, Class OC, PO, zero %, 2036 | 124,389 | 106,348 |
| Ser. 05-117, Class MO, PO, zero %, 2036 | 8,654 | 8,630 |
| Ser. 05-50, Class LO, PO, zero %, 2035 | 46,740 | 43,844 |
| FRB Ser. 07-76, Class SF, zero %, 2037 | 35,331 | 35,180 |
| FRB Ser. 06-115, Class SN, zero %, 2036 | 718,609 | 769,457 |
| FRB Ser. 06-104, Class EK, zero %, 2036 | 106,011 | 100,487 |
| FRB Ser. 05-117, Class GF, zero %, 2036 | 83,359 | 84,624 |
20
| | |
| MORTGAGE-BACKED SECURITIES (43.8%)* cont. | Principal amount | Value |
|
| Fannie Mae | | |
| FRB Ser. 05-57, Class UL, zero %, 2035 | $150,292 | $149,297 |
| FRB Ser. 05-51, Class FV, zero %, 2035 | 290,750 | 286,708 |
| FRB Ser. 05-36, Class QA, zero %, 2035 | 124,182 | 106,242 |
| FRB Ser. 05-65, Class CU, zero %, 2034 | 20,695 | 20,490 |
| FRB Ser. 06-1, Class HF, zero %, 2032 | 46,845 | 38,351 |
| IFB Ser. 09-86, Class SA, IO, zero %, 2039 | 35,211,782 | 328,526 |
| IFB Ser. 06-48, Class FG, zero %, 2036 | 489,797 | 456,606 |
|
| Federal Home Loan Mortgage Corp. Structured | | |
| Pass-Through Securities | | |
| IFB Ser. T-56, Class 2ASI, IO, 7.838s, 2043 | 1,238,198 | 252,470 |
| IFB Ser. T-56, Class 3ASI, IO, 7.238s, 2043 | 975,040 | 166,333 |
| Ser. T-56, Class A, IO, 0.524s, 2043 | 5,861,906 | 115,217 |
| Ser. T-56, Class 1, IO, 0.055s, 2043 | 7,606,351 | 55,703 |
| Ser. T-56, Class 3, IO, 0.014s, 2043 | 5,695,786 | 38,463 |
| Ser. T-56, Class 2, IO, 0.012s, 2043 | 6,981,451 | 599 |
|
| First Union National Bank-Bank of America Commercial | | |
| Mortgage 144A Ser. 01-C1, Class 3, IO, 1.939s, 2033 | 20,601,439 | 131,344 |
|
| First Union-Lehman Brothers Commercial Mortgage Trust II | | |
| Ser. 97-C2, Class F, 7 1/2s, 2029 | 2,112,000 | 2,234,903 |
| Ser. 97-C2, Class G, 7 1/2s, 2029 F | 696,000 | 715,324 |
|
| Freddie Mac | | |
| IFB Ser. 3182, Class PS, 27.582s, 2032 | 1,464,926 | 2,128,798 |
| IFB Ser. 3408, Class EK, 24.77s, 2037 | 1,201,738 | 1,683,235 |
| IFB Ser. 2976, Class KL, 23.451s, 2035 | 1,443,184 | 2,007,195 |
| IFB Ser. 2979, Class AS, 23.341s, 2034 | 328,880 | 447,721 |
| IFB Ser. 3065, Class DC, 19.097s, 2035 | 1,329,901 | 1,720,972 |
| IFB Ser. 3105, Class SI, IO, 18.963s, 2036 | 346,377 | 170,179 |
| IFB Ser. 2990, Class LB, 16.296s, 2034 | 1,458,284 | 1,782,490 |
| IFB Ser. 3184, Class SP, IO, 7.096s, 2033 | 2,241,031 | 265,598 |
| IFB Ser. 3110, Class SP, IO, 7.046s, 2035 | 3,208,178 | 567,623 |
| IFB Ser. 2927, Class SI, IO, 7s, 2035 | 1,798,454 | 308,020 |
| IFB Ser. 3156, Class PS, IO, 6.996s, 2036 | 2,617,319 | 451,200 |
| IFB Ser. 3119, Class PI, IO, 6.946s, 2036 | 6,173,413 | 1,129,055 |
| IFB Ser. 2882, Class NS, IO, 6.946s, 2034 | 1,840,341 | 253,599 |
| IFB Ser. 3308, Class S, IO, 6.946s, 2032 | 39,309,800 | 5,675,549 |
| IFB Ser. 3149, Class SE, IO, 6.896s, 2036 | 1,820,480 | 327,686 |
| IFB Ser. 3157, Class SA, IO, 6.896s, 2036 | 4,795,105 | 855,543 |
| IFB Ser. 3203, Class SH, IO, 6.886s, 2036 | 1,310,511 | 203,849 |
| IFB Ser. 3208, Class PS, IO, 6.846s, 2036 | 14,824,030 | 2,590,104 |
| IFB Ser. 2835, Class AI, IO, 6.846s, 2034 | 1,299,287 | 220,112 |
| IFB Ser. 2828, Class TI, IO, 6.796s, 2030 | 991,021 | 131,260 |
| IFB Ser. 3249, Class SI, IO, 6.496s, 2036 | 1,157,854 | 177,263 |
| IFB Ser. 3028, Class ES, IO, 6.496s, 2035 | 4,283,498 | 597,535 |
| IFB Ser. 2922, Class SE, IO, 6.496s, 2035 | 7,345,619 | 1,036,132 |
| IFB Ser. 3287, Class SE, IO, 6.446s, 2037 | 5,858,841 | 912,866 |
| IFB Ser. 3122, Class DS, IO, 6.446s, 2036 | 1,883,923 | 268,280 |
| IFB Ser. 3123, Class LI, IO, 6.446s, 2036 | 2,930,320 | 475,650 |
| IFB Ser. 3117, Class SI, IO, 6.446s, 2036 | 41,336,322 | 6,310,248 |
| IFB Ser. 3107, Class DC, IO, 6.446s, 2035 | 3,195,478 | 470,189 |
| IFB Ser. 3001, Class IH, IO, 6.446s, 2035 | 829,177 | 126,267 |
21
| | |
| MORTGAGE-BACKED SECURITIES (43.8%)* cont. | Principal amount | Value |
|
| Freddie Mac | | |
| IFB Ser. 2950, Class SM, IO, 6.446s, 2016 | $2,880,679 | $370,850 |
| IFB Ser. 3256, Class S, IO, 6.436s, 2036 | 2,420,204 | 351,584 |
| IFB Ser. 3031, Class BI, IO, 6.436s, 2035 | 1,155,947 | 148,442 |
| IFB Ser. 3249, Class SM, IO, 6.396s, 2036 | 5,401,125 | 798,826 |
| IFB Ser. 3240, Class SM, IO, 6.396s, 2036 | 5,269,626 | 729,791 |
| IFB Ser. 3147, Class SD, IO, 6.396s, 2036 | 6,852,446 | 940,933 |
| IFB Ser. 3398, Class SI, IO, 6.396s, 2036 | 5,593,502 | 727,099 |
| IFB Ser. 3196, Class SA, IO, 6.396s, 2032 | 24,256,224 | 2,878,001 |
| IFB Ser. 3128, Class JI, IO, 6.376s, 2036 | 3,602,116 | 520,895 |
| IFB Ser. 2990, Class LI, IO, 6.376s, 2034 | 2,300,335 | 340,124 |
| IFB Ser. 3240, Class S, IO, 6.366s, 2036 | 4,823,362 | 691,140 |
| IFB Ser. 3229, Class BI, IO, 6.366s, 2036 | 466,006 | 55,055 |
| IFB Ser. 3065, Class DI, IO, 6.366s, 2035 | 867,473 | 118,841 |
| IFB Ser. 3210, Class SA, IO, 6.346s, 2036 | 102,865 | 12,096 |
| IFB Ser. 3145, Class GI, IO, 6.346s, 2036 | 3,140,566 | 471,741 |
| IFB Ser. 3114, Class GI, IO, 6.346s, 2036 | 1,300,397 | 185,110 |
| IFB Ser. 3114, Class IP, IO, 6.346s, 2036 | 3,134,509 | 438,392 |
| IFB Ser. 3510, Class IB, IO, 6.346s, 2036 | 3,918,412 | 654,022 |
| IFB Ser. 2650, Class SK, IO, 6.346s, 2032 | 9,076,152 | 1,047,388 |
| IFB Ser. 3153, Class UI, IO, 6.316s, 2036 | 6,138,391 | 1,073,918 |
| IFB Ser. 3424, Class XI, IO, 6.316s, 2036 | 177,190 | 25,655 |
| IFB Ser. 3206, Class ES, IO, 6.296s, 2036 | 46,816 | 5,552 |
| IFB Ser. 3485, Class SI, IO, 6.296s, 2036 | 1,936,754 | 299,054 |
| IFB Ser. 3349, Class AS, IO, 6.246s, 2037 | 13,350,080 | 1,858,465 |
| IFB Ser. 3510, Class IA, IO, 6.246s, 2037 | 3,956,953 | 524,098 |
| IFB Ser. 3238, Class LI, IO, 6.236s, 2036 | 60,043 | 8,271 |
| IFB Ser. 3171, Class PS, IO, 6.231s, 2036 | 2,347,573 | 303,532 |
| IFB Ser. 3171, Class ST, IO, 6.231s, 2036 | 4,997,669 | 692,646 |
| IFB Ser. 3510, Class CI, IO, 6.226s, 2037 | 5,953,823 | 820,615 |
| IFB Ser. 3510, Class DI, IO, 6.226s, 2035 | 6,048,711 | 868,474 |
| IFB Ser. 3181, Class PS, IO, 6.216s, 2036 | 1,590,839 | 232,262 |
| IFB Ser. 3308, Class SA, IO, 6.196s, 2037 | 15,142,757 | 1,973,858 |
| IFB Ser. 3199, Class S, IO, 6.196s, 2036 | 1,375,583 | 192,719 |
| IFB Ser. 3281, Class AI, IO, 6.176s, 2037 | 7,069,573 | 970,652 |
| IFB Ser. 3261, Class SA, IO, 6.176s, 2037 | 2,304,497 | 315,393 |
| IFB Ser. 3311, Class IA, IO, 6.156s, 2037 | 2,521,443 | 345,135 |
| IFB Ser. 3311, Class IB, IO, 6.156s, 2037 | 2,521,443 | 345,135 |
| IFB Ser. 3311, Class IC, IO, 6.156s, 2037 | 2,521,443 | 345,135 |
| IFB Ser. 3311, Class ID, IO, 6.156s, 2037 | 2,521,443 | 345,135 |
| IFB Ser. 3311, Class IE, IO, 6.156s, 2037 | 3,615,392 | 494,875 |
| IFB Ser. 3311, Class PI, IO, 6.156s, 2037 | 143,406 | 20,304 |
| IFB Ser. 3265, Class SC, IO, 6.156s, 2037 | 816,289 | 106,917 |
| IFB Ser. 3240, Class GS, IO, 6.126s, 2036 | 3,081,226 | 413,223 |
| IFB Ser. 3424, Class TI, IO, 6.126s, 2035 | 33,766,177 | 3,914,175 |
| IFB Ser. 3598, Class SA, IO, 6.096s, 2039 | 2,818,793 | 379,832 |
| IFB Ser. 3621, Class CS, IO, 6.096s, 2037 | 2,468,952 | 273,930 |
| IFB Ser. 3257, Class SI, IO, 6.066s, 2036 | 1,326,861 | 173,397 |
| IFB Ser. 3225, Class JY, IO, 6.036s, 2036 | 5,689,222 | 753,537 |
| IFB Ser. 3502, Class DS, IO, 5.896s, 2039 | 779,934 | 75,005 |
| IFB Ser. 3339, Class TI, IO, 5.886s, 2037 | 2,800,806 | 352,089 |
22
| | |
| MORTGAGE-BACKED SECURITIES (43.8%)* cont. | Principal amount | Value |
|
| Freddie Mac | | |
| IFB Ser. 3284, Class CI, IO, 5.866s, 2037 | $4,764,555 | $602,621 |
| IFB Ser. 3531, Class SM, IO, 5.846s, 2039 | 22,879,062 | 2,404,546 |
| IFB Ser. 3476, Class S, IO, 5.846s, 2038 | 244,036 | 22,327 |
| IFB Ser. 3303, Class SD, IO, 5.836s, 2037 | 1,884,808 | 224,873 |
| IFB Ser. 3510, Class IC, IO, 5.826s, 2037 | 4,991,786 | 629,764 |
| IFB Ser. 3309, Class SG, IO, 5.816s, 2037 | 5,200,549 | 576,123 |
| IFB Ser. 3549, Class SA, IO, 5.546s, 2039 | 17,474,287 | 1,488,045 |
| IFB Ser. 3424, Class UI, IO, 5.506s, 2037 | 89,269 | 10,423 |
| IFB Ser. 3423, Class SG, IO, 5.396s, 2038 | 85,685 | 7,252 |
| Ser. 3645, Class ID, IO, 5s, 2040 | 621,306 | 107,169 |
| Ser. 3632, Class CI, IO, 5s, 2038 | 824,919 | 151,224 |
| Ser. 3626, Class DI, IO, 5s, 2037 | 643,503 | 94,350 |
| Ser. 3623, Class CI, IO, 5s, 2036 | 574,609 | 77,630 |
| Ser. 3369, Class BO, PO, zero %, 2037 | 57,326 | 51,500 |
| Ser. 3327, Class IF, IO, zero %, 2037 | 252,949 | 20,660 |
| Ser. 3369, PO, zero %, 2037 | 59,613 | 47,995 |
| Ser. 3391, PO, zero %, 2037 | 107,837 | 89,308 |
| Ser. 3300, PO, zero %, 2037 | 883,185 | 746,576 |
| Ser. 3206, Class EO, PO, zero %, 2036 | 83,800 | 71,473 |
| Ser. 3175, Class MO, PO, zero %, 2036 | 227,643 | 187,214 |
| Ser. 3210, PO, zero %, 2036 | 64,997 | 54,750 |
| Ser. 3084, PO, zero %, 2035 | 7,985 | 7,962 |
| Ser. 3145, Class KO, PO, zero %, 2034 | 39,362 | 34,109 |
| Ser. 2587, Class CO, PO, zero %, 2032 | 1,363,929 | 1,274,404 |
| FRB Ser. 3349, Class DO, zero %, 2037 | 54,671 | 54,666 |
| FRB Ser. 3326, Class XF, zero %, 2037 | 58,504 | 57,459 |
| FRB Ser. 3326, Class YF, zero %, 2037 | 423,535 | 420,391 |
| FRB Ser. 3263, Class TA, zero %, 2037 | 98,265 | 96,021 |
| FRB Ser. 3231, Class X, zero %, 2036 | 28,467 | 28,087 |
| FRB Ser. 3147, Class SF, zero %, 2036 | 376,888 | 335,046 |
| FRB Ser. 3117, Class AF, zero %, 2036 | 90,693 | 79,752 |
| FRB Ser. 3047, Class BD, zero %, 2035 | 175,727 | 145,790 |
| FRB Ser. 3326, Class WF, zero %, 2035 | 666,666 | 651,011 |
| FRB Ser. 3033, Class YF, zero %, 2035 | 171,583 | 150,094 |
| FRB Ser. 3036, Class AS, zero %, 2035 | 120,051 | 88,155 |
| FRB Ser. 3251, Class TP, zero %, 2035 | 137,882 | 121,706 |
| FRB Ser. 3003, Class XF, zero %, 2035 | 962,349 | 935,302 |
| FRB Ser. 2963, Class TW, zero %, 2035 | 63,649 | 62,729 |
| FRB Ser. 2947, Class GF, zero %, 2034 | 159,903 | 143,181 |
| FRB Ser. 3006, Class TE, zero %, 2034 | 118,851 | 118,011 |
|
| GE Capital Commercial Mortgage Corp. 144A | | |
| Ser. 05-C2, Class XC, IO, 0.161s, 2043 | 57,057,511 | 421,535 |
| Ser. 05-C3, Class XC, IO, 0.15s, 2045 | 158,398,342 | 526,383 |
| Ser. 07-C1, Class XC, IO, 0.114s, 2049 | 144,052,755 | 800,501 |
|
| GMAC Commercial Mortgage Securities, Inc. | | |
| Ser. 97-C1, Class X, IO, 1.36s, 2029 | 4,386,130 | 197,606 |
| Ser. 05-C1, Class X1, IO, 0.371s, 2043 | 44,443,255 | 525,701 |
|
| GMAC Commercial Mortgage Securities, Inc. 144A | | |
| Ser. 99-C3, Class G, 6.974s, 2036 F | 504,671 | 388,596 |
| Ser. 06-C1, Class XC, IO, 0.1s, 2045 | 99,615,155 | 440,360 |
|
23
| | |
| MORTGAGE-BACKED SECURITIES (43.8%)* cont. | Principal amount | Value |
|
| Government National Mortgage Association | | |
| IFB Ser. 10-14, Class SA, IO, 7.744s, 2032 | $100,000 | $17,263 |
| IFB Ser. 08-47, Class S, IO, 7.444s, 2038 | 2,009,237 | 308,082 |
| IFB Ser. 05-68, Class SN, IO, 6.944s, 2034 | 572,213 | 72,808 |
| IFB Ser. 07-47, Class SA, IO, 6.844s, 2036 | 129,464 | 19,101 |
| IFB Ser. 09-77, Class CS, IO, 6.744s, 2038 | 22,918,220 | 3,214,212 |
| IFB Ser. 04-96, Class KS, IO, 6.744s, 2034 | 289,777 | 44,849 |
| IFB Ser. 06-16, Class GS, IO, 6.734s, 2036 | 2,229,671 | 295,008 |
| IFB Ser. 10-14, Class SD, IO, 6.724s, 2036 | 93,799 | 8,480 |
| IFB Ser. 04-5, Class PS, IO, 6.694s, 2033 | 4,046,000 | 646,794 |
| IFB Ser. 09-106, Class XN, IO, 6.644s, 2035 | 1,669,691 | 98,512 |
| IFB Ser. 09-106, Class XI, IO, 6.544s, 2037 | 35,181,954 | 4,260,183 |
| IFB Ser. 07-26, Class SL, IO, 6.544s, 2037 | 279,822 | 41,039 |
| IFB Ser. 09-106, Class XL, IO, 6.494s, 2037 | 1,836,766 | 211,449 |
| IFB Ser. 09-87, Class SI, IO, 6.494s, 2035 | 250,991 | 37,611 |
| IFB Ser. 04-104, Class IS, IO, 6.494s, 2034 | 206,301 | 25,610 |
| IFB Ser. 09-87, Class IG, IO, 6.484s, 2037 | 4,814,549 | 687,325 |
| IFB Ser. 07-53, Class SY, IO, 6.479s, 2037 | 96,087 | 11,533 |
| IFB Ser. 10-47, Class PX, IO, 6.444s, 2037 | 1,784,000 | 206,510 |
| IFB Ser. 07-37, Class SU, IO, 6.434s, 2037 | 305,220 | 41,424 |
| IFB Ser. 07-37, Class YS, IO, 6.414s, 2037 | 454,101 | 58,334 |
| IFB Ser. 10-47, Class SK, IO, 6.344s, 2037 | 14,172,000 | 1,684,688 |
| IFB Ser. 09-106, Class CM, IO, 6.344s, 2034 | 811,850 | 106,636 |
| IFB Ser. 09-87, Class SK, IO, 6.344s, 2032 | 3,534,740 | 378,959 |
| IFB Ser. 08-6, Class TI, IO, 6.344s, 2032 | 541,796 | 52,874 |
| IFB Ser. 06-34, Class PS, IO, 6.334s, 2036 | 56,300 | 6,615 |
| IFB Ser. 07-17, Class AI, IO, 6.294s, 2037 | 6,077,547 | 859,000 |
| IFB Ser. 10-47, Class XN, IO, 6.294s, 2034 | 9,643,000 | 882,367 |
| IFB Ser. 10-53, Class SA, IO, 6.272s, 2039 | 18,045,000 | 2,667,286 |
| IFB Ser. 08-7, Class SA, IO, 6.264s, 2038 | 65,013,282 | 6,566,992 |
| IFB Ser. 08-6, Class SA, IO, 6.254s, 2038 | 2,481,086 | 253,269 |
| IFB Ser. 07-24, Class SA, IO, 6.254s, 2037 | 54,007,726 | 6,236,362 |
| IFB Ser. 08-9, Class SA, IO, 6.244s, 2038 | 41,395,347 | 4,219,014 |
| IFB Ser. 09-106, Class LS, IO, 6.244s, 2037 | 2,045,929 | 206,966 |
| IFB Ser. 06-26, Class S, IO, 6.244s, 2036 | 300,273 | 35,247 |
| IFB Ser. 08-9, Class SK, IO, 6.224s, 2038 | 119,003 | 13,946 |
| IFB Ser. 07-36, Class SG, IO, 6.214s, 2037 | 73,934,447 | 7,493,256 |
| IFB Ser. 10-14, Class SX, IO, 6.194s, 2040 | 19,155,335 | 2,565,857 |
| IFB Ser. 07-35, Class KY, IO, 6.194s, 2037 | 176,711 | 18,099 |
| IFB Ser. 09-10, Class ST, IO, 6.194s, 2034 | 19,638,415 | 2,080,336 |
| IFB Ser. 09-102, Class SM, IO, 6.144s, 2039 | 3,420,336 | 362,342 |
| IFB Ser. 09-32, Class AS, IO, 6.144s, 2039 | 33,979,045 | 3,944,755 |
| IFB Ser. 09-35, Class SP, IO, 6.144s, 2037 | 7,141,095 | 889,852 |
| IFB Ser. 05-65, Class SI, IO, 6.094s, 2035 | 5,410,209 | 626,556 |
| IFB Ser. 06-16, Class SX, IO, 6.034s, 2036 | 95,124 | 11,000 |
| IFB Ser. 06-10, Class SL, IO, 6.004s, 2036 | 15,217,318 | 1,747,253 |
| IFB Ser. 09-106, Class SD, IO, 5.994s, 2036 | 9,836,216 | 1,113,755 |
| IFB Ser. 09-61, Class WQ, IO, 5.994s, 2035 | 17,397,696 | 2,447,856 |
| IFB Ser. 09-92, Class SC, IO, 5.944s, 2039 | 33,551,988 | 3,499,137 |
| IFB Ser. 09-76, Class CS, IO, 5.944s, 2039 | 18,836,944 | 2,252,577 |
| IFB Ser. 09-106, Class SU, IO, 5.944s, 2037 | 5,782,700 | 566,242 |
24
| | |
| MORTGAGE-BACKED SECURITIES (43.8%)* cont. | Principal amount | Value |
|
| Government National Mortgage Association | | |
| IFB Ser. 07-18, Class SD, IO, 5.944s, 2037 | $18,040,092 | $1,713,394 |
| IFB Ser. 07-7, Class JI, IO, 5.944s, 2037 | 3,406,408 | 380,734 |
| IFB Ser. 10-47, Class SH, IO, 5.914s, 2038 | 3,545,000 | 368,395 |
| IFB Ser. 08-60, Class SH, IO, 5.894s, 2038 | 436,012 | 48,223 |
| IFB Ser. 09-32, Class XS, IO, 5.844s, 2039 | 18,246,986 | 1,970,104 |
| IFB Ser. 09-58, Class SG, IO, 5.844s, 2039 | 19,398,064 | 1,870,167 |
| IFB Ser. 09-87, Class TS, IO, 5.844s, 2035 | 28,878,197 | 3,542,488 |
| IFB Ser. 04-86, Class SP, IO, 5.844s, 2034 | 1,034,137 | 119,294 |
| IFB Ser. 04-83, Class CS, IO, 5.824s, 2034 | 491,500 | 58,366 |
| IFB Ser. 09-53, Class SA, IO, 5.794s, 2039 | 20,054,412 | 1,801,764 |
| Ser. 09-55, Class LI, IO, 5 1/2s, 2038 F | 699,803 | 111,541 |
| IFB Ser. 10-14, Class SC, IO, 4.571s, 2035 | 134,999 | 17,559 |
| IFB Ser. 09-87, Class WT, IO, 0.182s, 2035 | 19,128,945 | 70,586 |
| IFB Ser. 09-106, Class WT, IO, 0.149s, 2037 | 2,744,394 | 10,017 |
| Ser. 06-36, Class OD, PO, zero %, 2036 | 81,517 | 74,628 |
| Ser. 99-31, Class MP, PO, zero %, 2029 | 32,746 | 28,774 |
| FRB Ser. 07-73, Class KI, IO, zero %, 2037 | 3,098,708 | 63,145 |
| FRB Ser. 07-73, Class KM, zero %, 2037 | 311,273 | 283,680 |
| FRB Ser. 07-35, Class UF, zero %, 2037 | 88,971 | 87,209 |
|
| Greenwich Capital Commercial Funding Corp. | | |
| Ser. 05-GG5, Class A2, 5.117s, 2037 | 1,130,408 | 1,150,048 |
| Ser. 05-GG5, Class XC, IO, 0.121s, 2037 | 281,504,489 | 786,805 |
|
| Greenwich Capital Commercial Funding Corp. 144A | | |
| Ser. 05-GG3, Class XC, IO, 0.453s, 2042 | 60,793,715 | 870,833 |
|
| GS Mortgage Securities Corp. II FRB Ser. 07-GG10, Class A3, | | |
| 5.999s, 2045 | 2,313,000 | 2,406,766 |
|
| GS Mortgage Securities Corp. II 144A | | |
| Ser. 98-C1, Class F, 6s, 2030 | 918,751 | 925,426 |
| FRB Ser. 07-EOP, Class J, 1.099s, 2020 | 370,000 | 307,804 |
| Ser. 03-C1, Class X1, IO, 1.009s, 2040 | 15,751,696 | 288,811 |
| Ser. 06-GG8, Class X, IO, 0.863s, 2039 | 41,731,886 | 1,092,078 |
| Ser. 04-C1, Class X1, IO, 0.312s, 2028 | 19,462,011 | 63,890 |
| Ser. 06-GG6, Class XC, IO, 0.109s, 2038 | 132,947,241 | 277,115 |
|
| GSMPS Mortgage Loan Trust | | |
| Ser. 05-RP3, Class 1A4, 8 1/2s, 2035 | 162,553 | 150,737 |
| Ser. 05-RP3, Class 1A3, 8s, 2035 | 503,719 | 463,421 |
| Ser. 05-RP3, Class 1A2, 7 1/2s, 2035 | 357,938 | 329,303 |
| FRB Ser. 05-RP2, Class 1AF, 0.613s, 2035 | 2,751,968 | 2,229,094 |
|
| GSMPS Mortgage Loan Trust 144A | | |
| Ser. 05-RP2, Class 1A3, 8s, 2035 | 535,652 | 514,226 |
| Ser. 05-RP1, Class 1A3, 8s, 2035 | 57,523 | 54,450 |
| Ser. 05-RP2, Class 1A2, 7 1/2s, 2035 | 602,180 | 578,092 |
| Ser. 05-RP1, Class 1AS, IO, 5.965s, 2035 | 3,104,181 | 379,917 |
| IFB Ser. 04-4, Class 1AS, IO, 5.687s, 2034 | 4,588,667 | 536,301 |
| Ser. 05-RP3, Class 1AS, IO, 5.578s, 2035 | 13,834,028 | 1,632,337 |
| FRB Ser. 04-4, Class 1AF, 0.663s, 2034 | 233,855 | 215,146 |
| FRB Ser. 05-RP1, Class 1AF, 0.613s, 2035 | 632,950 | 525,349 |
|
| GSR Mortgage Loan Trust Ser. 05-AR2, Class 2A1, 3.13s, 2035 | 1,004,509 | 863,878 |
|
| HASCO NIM Trust 144A Ser. 05-OP1A, Class A, 6 1/4s, | | |
| 2035 (In default) F † | 189,496 | 19 |
|
25
| | |
| MORTGAGE-BACKED SECURITIES (43.8%)* cont. | Principal amount | Value |
|
| HSI Asset Loan Obligation FRB Ser. 07-AR1, Class 2A1, | | |
| 5.974s, 2037 | $2,479,008 | $1,524,590 |
|
| IMPAC Secured Assets Corp. FRB Ser. 07-2, Class 1A1A, | | |
| 0.373s, 2037 F | 2,901,096 | 1,595,603 |
|
| IndyMac Indx Mortgage Loan Trust | | |
| FRB Ser. 05-AR31, Class 3A1, 5.446s, 2036 | 2,916,965 | 1,896,027 |
| FRB Ser. 06-AR27, Class 2A2, 0.463s, 2036 F | 2,010,815 | 1,312,057 |
|
| JPMorgan Chase Commercial Mortgage Securities Corp. | | |
| Ser. 97-C5, Class F, 7.561s, 2029 | 711,000 | 746,772 |
| FRB Ser. 07-LD12, Class A3, 6.188s, 2051 | 25,166,000 | 25,845,228 |
| FRB Ser. 07-LD11, Class A3, 6.006s, 2049 | 2,885,000 | 3,001,908 |
| Ser. 07-CB20, Class A3, 5.863s, 2051 | 5,789,000 | 5,997,176 |
| Ser. 07-CB20, Class A2, 5.629s, 2051 | 2,747,000 | 2,836,053 |
| Ser. 06-LDP8, Class A2, 5.289s, 2045 | 2,115,000 | 2,207,403 |
| Ser. 05-LDP2, Class AM, 4.78s, 2042 | 1,230,000 | 1,167,577 |
| Ser. 06-LDP8, Class X, IO, 0.76s, 2045 | 55,714,729 | 1,349,634 |
| Ser. 06-CB17, Class X, IO, 0.699s, 2043 | 34,558,791 | 898,097 |
| Ser. 06-LDP9, Class X, IO, 0.638s, 2047 | 21,992,295 | 470,167 |
| Ser. 07-LDPX, Class X, IO, 0.524s, 2049 | 42,885,797 | 656,702 |
| Ser. 06-CB16, Class X1, IO, 0.153s, 2045 | 32,380,979 | 411,015 |
|
| JPMorgan Chase Commercial Mortgage Securities Corp. 144A | | |
| Ser. 00-C9, Class G, 6 1/4s, 2032 | 915,000 | 917,277 |
| Ser. 03-ML1A, Class X1, IO, 0.799s, 2039 | 38,365,070 | 1,172,026 |
| Ser. 05-LDP2, Class X1, IO, 0.339s, 2042 | 130,967,600 | 1,944,672 |
| Ser. 07-CB20, Class X1, IO, 0.195s, 2051 | 73,290,805 | 883,271 |
| Ser. 05-CB12, Class X1, IO, 0.185s, 2037 | 40,299,165 | 318,343 |
| Ser. 06-LDP6, Class X1, IO, 0.103s, 2043 | 56,656,482 | 222,360 |
|
| LB Commercial Conduit Mortgage Trust 144A | | |
| Ser. 99-C1, Class F, 6.41s, 2031 | 556,463 | 463,164 |
| Ser. 99-C1, Class G, 6.41s, 2031 | 601,777 | 362,317 |
| FRB Ser. 07-C3, Class A2FL, 5.84s, 2044 | 7,863,000 | 8,216,000 |
| Ser. 98-C4, Class G, 5.6s, 2035 | 474,000 | 483,480 |
| Ser. 98-C4, Class H, 5.6s, 2035 | 808,000 | 525,200 |
|
| LB-UBS Commercial Mortgage Trust | | |
| Ser. 07-C6, Class A2, 5.845s, 2012 | 6,612,307 | 6,865,805 |
| Ser. 07-C1, Class A2, 5.318s, 2040 | 6,482,000 | 6,669,596 |
| Ser. 07-C2, Class A2, 5.303s, 2040 | 4,642,000 | 4,781,902 |
| Ser. 07-C2, Class XW, IO, 0.741s, 2040 | 9,294,383 | 246,260 |
|
| LB-UBS Commercial Mortgage Trust 144A | | |
| Ser. 06-C7, Class XW, IO, 0.911s, 2038 | 47,755,932 | 1,502,282 |
| Ser. 03-C5, Class XCL, IO, 0.464s, 2037 | 11,299,397 | 208,701 |
| Ser. 05-C3, Class XCL, IO, 0.34s, 2040 | 90,366,263 | 1,704,335 |
| Ser. 05-C2, Class XCL, IO, 0.292s, 2040 | 216,467,694 | 1,705,354 |
| Ser. 05-C5, Class XCL, IO, 0.231s, 2020 | 115,216,845 | 1,347,611 |
| Ser. 05-C7, Class XCL, IO, 0.22s, 2040 | 157,633,862 | 1,112,958 |
| Ser. 06-C1, Class XCL, IO, 0.199s, 2041 | 150,719,324 | 1,314,529 |
| Ser. 06-C7, Class XCL, IO, 0.184s, 2038 | 74,123,705 | 1,104,895 |
| Ser. 07-C2, Class XCL, IO, 0.123s, 2040 | 158,613,900 | 1,746,244 |
|
| Lehman Brothers Floating Rate Commercial Mortgage Trust 144A | | |
| FRB Ser. 04-LLFA, Class H, 1.204s, 2017 | 496,000 | 412,832 |
| FRB Ser. 05-LLFA, Class J, 1.054s, 2018 | 324,000 | 223,627 |
|
26
| | |
| MORTGAGE-BACKED SECURITIES (43.8%)* cont. | Principal amount | Value |
|
| MASTR Reperforming Loan Trust 144A | | |
| Ser. 05-2, Class 1A3, 7 1/2s, 2035 | $1,091,922 | $1,048,245 |
| Ser. 05-1, Class 1A4, 7 1/2s, 2034 | 788,628 | 772,855 |
|
| Merit Securities Corp. 144A FRB Ser. 11PA, Class 3A1, | | |
| 0.885s, 2027 | 3,121,731 | 2,619,440 |
|
| Merrill Lynch Capital Funding Corp. Ser. 06-4, Class XC, | | |
| IO, 0.199s, 2049 | 74,988,355 | 896,943 |
|
| Merrill Lynch Floating Trust 144A FRB Ser. 06-1, Class TM, | | |
| 0.754s, 2022 | 741,724 | 645,300 |
|
| Merrill Lynch Mortgage Investors, Inc. | | |
| FRB Ser. 98-C3, Class E, 7.065s, 2030 | 496,000 | 500,249 |
| FRB Ser. 05-A9, Class 3A1, 5.238s, 2035 | 2,710,833 | 2,186,073 |
| Ser. 96-C2, Class JS, IO, 2.273s, 2028 F | 502,285 | 13,366 |
|
| Merrill Lynch Mortgage Trust | | |
| FRB Ser. 07-C1, Class A3, 6.02s, 2050 | 1,596,000 | 1,628,715 |
| Ser. 05-MCP1, Class XC, IO, 0.305s, 2043 | 49,529,225 | 496,095 |
|
| Merrill Lynch Mortgage Trust 144A | | |
| Ser. 04-KEY2, Class XC, IO, 0 1/2s, 2039 | 9,797,575 | 205,355 |
| Ser. 05-LC1, Class X, IO, 0.225s, 2044 | 27,858,095 | 166,408 |
|
| Merrill Lynch/Countrywide Commercial Mortgage Trust | | |
| FRB Ser. 07-8, Class A3, 6.155s, 2049 | 3,281,000 | 3,314,444 |
| FRB Ser. 07-8, Class A2, 6.118s, 2049 | 1,887,000 | 2,030,152 |
| Ser. 2006-3, Class A2, 5.291s, 2046 | 2,902,000 | 2,978,552 |
|
| Mezz Cap Commercial Mortgage Trust 144A | | |
| Ser. 04-C1, Class X, IO, 7.93s, 2037 | 3,414,863 | 332,949 |
| Ser. 04-C2, Class X, IO, 6.57s, 2040 | 1,880,520 | 159,844 |
| Ser. 06-C4, Class X, IO, 5.526s, 2045 | 7,243,975 | 579,518 |
| Ser. 05-C3, Class X, IO, 5.487s, 2044 | 2,178,831 | 174,306 |
|
| Morgan Stanley Capital 144A Ser. 05-RR6, Class X, IO, | | |
| 1.642s, 2043 F | 6,746,543 | 167,952 |
|
| Morgan Stanley Capital I | | |
| FRB Ser. 08-T29, Class A3, 6.458s, 2043 F | 1,080,000 | 1,135,826 |
| Ser. 06-T21, Class A2, 5.09s, 2052 | 3,325,000 | 3,362,226 |
|
| Morgan Stanley Capital I 144A | | |
| Ser. 04-RR, Class F5, 6s, 2039 F | 820,000 | 291,108 |
| Ser. 04-RR, Class F6, 6s, 2039 F | 1,230,000 | 190,674 |
| Ser. 07-HQ13, Class X1, IO, 0.815s, 2044 F | 36,397,482 | 686,029 |
| Ser. 05-HQ5, Class X1, IO, 0.137s, 2042 F | 15,262,883 | 79,995 |
|
| Morgan Stanley Mortgage Loan Trust Ser. 05-5AR, Class 2A1, | | |
| 3.706s, 2035 F | 2,294,409 | 1,405,326 |
|
| Mortgage Capital Funding, Inc. FRB Ser. 98-MC2, Class E, 7.154s, 2030 F | 839,000 | 889,242 |
|
| Nomura Asset Acceptance Corp. Ser. 04-R3, Class PT, 3.877s, 2035 | 359,712 | 343,525 |
|
| Nomura Asset Acceptance Corp. 144A Ser. 04-R2, Class PT, | | |
| 9.087s, 2034 | 157,488 | 148,826 |
|
| PNC Mortgage Acceptance Corp. 144A Ser. 00-C1, Class J, | | |
| 6 5/8s, 2010 | 189,000 | 47,250 |
|
| Residential Asset Mortgage Products, Inc. Ser. 02-SL1, | | |
| Class AI3, 7s, 2032 | 86,577 | 83,839 |
|
| Residential Asset Securitization Trust | | |
| Ser. 07-A5, Class 2A3, 6s, 2037 | 906,554 | 652,719 |
| FRB Ser. 05-A2, Class A1, 0.763s, 2035 | 2,108,671 | 1,512,660 |
|
27
| | |
| MORTGAGE-BACKED SECURITIES (43.8%)* cont. | Principal amount | Value |
|
| Salomon Brothers Mortgage Securities VII 144A Ser. 02-KEY2, | | |
| Class X1, IO, 2.158s, 2036 | $17,962,006 | $586,100 |
|
| STRIPS 144A | | |
| Ser. 03-1A, Class L, 5s, 2018 | 603,000 | 512,550 |
| Ser. 03-1A, Class M, 5s, 2018 | 403,000 | 282,100 |
| Ser. 04-1A, Class L, 5s, 2018 | 273,000 | 191,100 |
|
| Structured Adjustable Rate Mortgage Loan Trust | | |
| FRB Ser. 07-8, Class 1A2, 6 1/4s, 2037 | 7,217,288 | 5,124,274 |
| FRB Ser. 05-18, Class 6A1, 4.993s, 2035 | 1,266,446 | 1,000,492 |
|
| Structured Adjustable Rate Mortgage Loan Trust 144A | | |
| Ser. 04-NP2, Class A, 0.613s, 2034 | 354,285 | 311,770 |
|
| Structured Asset Securities Corp. | | |
| IFB Ser. 07-4, Class 1A3, IO, 5.985s, 2037 | 40,523,231 | 5,352,156 |
| Ser. 07-4, Class 1A4, IO, 1s, 2037 | 54,774,969 | 1,957,567 |
|
| Structured Asset Securities Corp. 144A | | |
| Ser. 07-RF1, Class 1A, IO, 5.356s, 2037 | 16,099,795 | 1,696,494 |
| Ser. 06-RF4, Class 1A, IO, 5.183s, 2036 | 4,737,106 | 529,218 |
|
| Wachovia Bank Commercial Mortgage Trust | | |
| FRB Ser. 07-C33, Class A3, 6.099s, 2051 | 2,572,000 | 2,675,779 |
| FRB Ser. 07-C33, Class A2, 6.054s, 2051 | 793,000 | 834,321 |
| FRB Ser. 07-C32, Class A2, 5.924s, 2049 | 5,177,000 | 5,341,894 |
| Ser. 2006-C28, Class A2, 5 1/2s, 2048 | 8,609,000 | 8,825,305 |
| Ser. 07-C31, Class A3, 5.483s, 2047 | 1,520,000 | 1,548,966 |
| Ser. 07-C31, Class A2, 5.421s, 2047 | 8,715,000 | 8,997,943 |
| Ser. 07-C30, Class A3, 5.246s, 2043 | 1,506,000 | 1,507,987 |
| Ser. 06-C29, IO, 0.53s, 2048 | 74,272,075 | 1,429,737 |
| Ser. 07-C34, IO, 0.518s, 2046 | 17,585,920 | 329,912 |
|
| Wachovia Bank Commercial Mortgage Trust 144A | | |
| FRB Ser. 05-WL5A, Class L, 3.554s, 2018 | 574,000 | 287,000 |
| Ser. 03-C3, Class IOI, IO, 1.299s, 2035 | 11,571,491 | 271,736 |
| Ser. 07-C31, IO, 0.434s, 2047 | 138,258,795 | 1,791,834 |
| Ser. 05-C18, Class XC, IO, 0.179s, 2042 | 27,905,429 | 250,870 |
| Ser. 06-C27, Class XC, IO, 0.167s, 2045 | 37,010,780 | 327,916 |
| Ser. 06-C23, Class XC, IO, 0.089s, 2045 | 175,979,460 | 941,490 |
| Ser. 06-C26, Class XC, IO, 0.069s, 2045 | 13,148,720 | 37,605 |
|
| WAMU Commercial Mortgage Securities Trust 144A | | |
| Ser. 05-C1A, Class G, 5.72s, 2014 F | 129,000 | 36,308 |
| Ser. 06-SL1, Class X, IO, 0.934s, 2043 F | 5,905,725 | 199,872 |
| Ser. 07-SL2, Class X, IO, 0.849s, 2049 F | 12,064,851 | 347,187 |
|
| Washington Mutual Multi-Fam., Mtge. 144A Ser. 01-1, | | |
| Class B5, 7.109s, 2031 | 1,083,000 | 790,590 |
|
| Total mortgage-backed securities (cost $453,530,727) | | $545,220,065 |
|
| |
| CORPORATE BONDS AND NOTES (22.8%)* | Principal amount | Value |
|
| Basic materials (1.7%) | | |
| Allegheny Technologies, Inc. sr. unsec. unsub. notes 9 3/8s, 2019 | $57,000 | $68,052 |
|
| ArcelorMittal sr. unsec. unsub. 9.85s, 2019 (Luxembourg) | 935,000 | 1,215,294 |
|
| Dow Chemical Co. (The) sr. unsec. notes 7.6s, 2014 | 20,000 | 23,227 |
|
| Dow Chemical Co. (The) sr. unsec. unsub. notes 8.55s, 2019 | 2,505,000 | 3,060,902 |
|
| Dow Chemical Co. (The) sr. unsec. unsub. notes 5.9s, 2015 | 1,272,000 | 1,395,192 |
|
28
| | |
| CORPORATE BONDS AND NOTES (22.8%)* cont. | Principal amount | Value |
|
| Basic materials cont. | | |
| Freeport-McMoRan Copper & Gold, Inc. sr. unsec. | | |
| notes 8 3/8s, 2017 | $1,457,000 | $1,631,840 |
|
| Georgia-Pacific, LLC sr. unsec. unsub. notes 9 1/2s, 2011 | 250,000 | 274,063 |
|
| Georgia-Pacific, LLC sr. unsec. unsub. notes 8 1/8s, 2011 | 1,140,000 | 1,202,700 |
|
| International Paper Co. bonds 7.95s, 2018 | 1,400,000 | 1,661,209 |
|
| International Paper Co. sr. unsec. notes 9 3/8s, 2019 | 1,913,000 | 2,424,728 |
|
| Mosaic Co. (The) 144A sr. unsec. unsub. notes 7 5/8s, 2016 | 1,495,000 | 1,641,458 |
|
| Nalco Co. 144A sr. notes 8 1/4s, 2017 | 201,000 | 215,573 |
|
| Rio Tinto Finance USA LTD company guaranty sr. unsec. | | |
| notes 9s, 2019 (Australia) | 650,000 | 837,442 |
|
| Rohm & Haas Co. sr. unsec. unsub. notes 7.85s, 2029 | 1,715,000 | 1,932,025 |
|
| Sealed Air Corp. 144A notes 5 5/8s, 2013 | 1,153,000 | 1,221,983 |
|
| Sealed Air Corp. 144A sr. notes 7 7/8s, 2017 | 560,000 | 611,395 |
|
| Teck Resources, Ltd. sr. notes 10 3/4s, 2019 (Canada) | 164,000 | 204,180 |
|
| Teck Resources, Ltd. sr. notes 10 1/4s, 2016 (Canada) | 245,000 | 295,225 |
|
| Teck Resources, Ltd. sr. notes 9 3/4s, 2014 (Canada) | 204,000 | 247,860 |
|
| Xstrata Finance Canada, Ltd. 144A company guaranty 5.8s, | | |
| 2016 (Canada) | 610,000 | 652,957 |
|
| | | 20,817,305 |
| Capital goods (0.5%) | | |
| Allied Waste North America, Inc. company | | |
| guaranty sr. unsec. notes 6 7/8s, 2017 | 850,000 | 937,125 |
|
| Ball Corp. company guaranty sr. unsec. notes 7 1/8s, 2016 | 79,000 | 83,938 |
|
| Ball Corp. company guaranty sr. unsec. notes 6 5/8s, 2018 | 680,000 | 691,900 |
|
| L-3 Communications Corp. company guaranty Ser. B, 6 3/8s, 2015 | 450,000 | 460,688 |
|
| L-3 Communications Corp. company guaranty sr. unsec. | | |
| sub. notes 5 7/8s, 2015 | 390,000 | 395,850 |
|
| Legrand SA unsec. unsub. debs. 8 1/2s, 2025 (France) | 768,000 | 906,767 |
|
| Parker Hannifin Corp. sr. unsec. unsub. notes Ser. MTN, | | |
| 6 1/4s, 2038 | 435,000 | 485,371 |
|
| Republic Services, Inc. 144A sr. unsec. notes 5 1/2s, 2019 | 660,000 | 692,893 |
|
| Thomas & Betts Corp. sr. unsec. unsub. notes 5 5/8s, 2021 | 570,000 | 592,762 |
|
| United Technologies Corp. sr. unsec. notes 6 1/8s, 2038 | 305,000 | 341,102 |
|
| United Technologies Corp. sr. unsec. notes 5.7s, 2040 | 100,000 | 104,266 |
|
| | | 5,692,662 |
| Communication services (2.5%) | | |
| American Tower Corp. sr. unsec. notes 7s, 2017 | 1,070,000 | 1,195,725 |
|
| American Tower Corp. 144A sr. unsec. notes 7 1/4s, 2019 | 1,560,000 | 1,747,200 |
|
| AT&T Wireless Services, Inc. sr. notes 8 3/4s, 2031 | 926,000 | 1,221,123 |
|
| AT&T, Inc. sr. unsec. unsub. bonds 5 1/2s, 2018 | 220,000 | 237,042 |
|
| AT&T, Inc. sr. unsec. unsub. notes 6.3s, 2038 | 2,645,000 | 2,740,556 |
|
| Bellsouth Capital Funding unsec. notes 7 7/8s, 2030 | 590,000 | 707,060 |
|
| Comcast Cable Communications company | | |
| guaranty sr. unsub. notes 8 7/8s, 2017 | 785,000 | 959,402 |
|
| Comcast Corp. company guaranty sr. unsec. | | |
| unsub. notes 6.95s, 2037 | 455,000 | 506,751 |
|
| Cox Communications, Inc. notes 7 1/8s, 2012 | 345,000 | 387,116 |
|
| Cox Communications, Inc. 144A bonds 8 3/8s, 2039 | 470,000 | 608,037 |
|
| Cox Communications, Inc. 144A notes 5 7/8s, 2016 | 390,000 | 429,803 |
|
29
| | |
| CORPORATE BONDS AND NOTES (22.8%)* cont. | Principal amount | Value |
|
| Communication services cont. | | |
| Cox Enterprises, Inc. 144A notes 7 7/8s, 2010 | $250,000 | $256,098 |
|
| France Telecom notes 8 1/2s, 2031 (France) | 340,000 | 461,363 |
|
| Frontier Communications Corp. 144A sr. notes 8 1/2s, 2020 | 800,000 | 824,000 |
|
| Frontier Communications Corp. 144A sr. notes 7 7/8s, 2015 | 215,000 | 221,988 |
|
| Nextel Communications, Inc. sr. notes Ser. E, 6 7/8s, 2013 | 230,000 | 226,263 |
|
| Rogers Communications Inc. company guaranty notes 6.8s, | | |
| 2018 (Canada) | 610,000 | 700,973 |
|
| Rogers Wireless, Inc. sec. notes 6 3/8s, 2014 (Canada) | 1,000,000 | 1,119,396 |
|
| SBA Tower Trust 144A company guaranty asset backed | | |
| notes 5.101s, 2017 | 2,400,000 | 2,472,013 |
|
| TCI Communications, Inc. company guaranty 7 7/8s, 2026 | 2,435,000 | 2,863,842 |
|
| TCI Communications, Inc. debs. 9.8s, 2012 | 960,000 | 1,085,672 |
|
| Telefonica Emisones SAU company guaranty 6.221s, 2017 (Spain) | 345,000 | 378,524 |
|
| Time Warner Cable, Inc. company guaranty sr. notes 7.3s, 2038 | 1,165,000 | 1,321,024 |
|
| Time Warner Cable, Inc. company guaranty sr. unsec. 6 3/4s, 2018 | 355,000 | 402,237 |
|
| Time Warner Cable, Inc. company guaranty sr. unsec. | | |
| notes 7 1/2s, 2014 | 345,000 | 399,880 |
|
| Time Warner Cable, Inc. company guaranty sr. unsec. | | |
| unsub. notes 6 3/4s, 2039 | 350,000 | 378,310 |
|
| Verizon Communications, Inc. sr. unsec. notes 7.35s, 2039 | 424,000 | 503,480 |
|
| Verizon Communications, Inc. sr. unsec. | | |
| unsub. notes 8 3/4s, 2018 | 221,000 | 280,200 |
|
| Verizon New England, Inc. sr. notes 6 1/2s, 2011 | 1,580,000 | 1,679,869 |
|
| Verizon New Jersey, Inc. debs. 8s, 2022 | 640,000 | 748,125 |
|
| Verizon Pennsylvania, Inc. debs. 8.35s, 2030 | 795,000 | 903,611 |
|
| Verizon Virginia, Inc. debs. Ser. A, 4 5/8s, 2013 | 219,000 | 232,770 |
|
| Verizon Wireless, Inc. sr. unsec. unsub. notes 5.55s, 2014 | 2,475,000 | 2,724,980 |
|
| | | 30,924,433 |
| Conglomerates (—%) | | |
| Siemens Financieringsmaatschappij 144A notes 5 3/4s, | | |
| 2016 (Netherlands) | 560,000 | 622,240 |
|
| | | 622,240 |
| Consumer cyclicals (1.8%) | | |
| Advance Auto Parts, Inc. company guaranty sr. unsec. | | |
| notes 5 3/4s, 2020 | 950,000 | 963,063 |
|
| Corrections Corporation of America company | | |
| guaranty sr. notes 7 3/4s, 2017 | 466,000 | 497,455 |
|
| D.R. Horton, Inc. sr. notes 7 7/8s, 2011 | 415,000 | 436,788 |
|
| DaimlerChrysler NA Holding Corp. company guaranty unsec. | | |
| unsub. notes 7.3s, 2012 (Germany) | 2,675,000 | 2,914,741 |
|
| DaimlerChrysler NA Holding Corp. company guaranty unsec. | | |
| unsub. notes Ser. MTN, 5 3/4s, 2011 (Germany) | 605,000 | 638,103 |
|
| DIRECTV Holdings, LLC company guaranty sr. unsec. | | |
| unsub. notes 5 7/8s, 2019 | 1,670,000 | 1,773,214 |
|
| DIRECTV Holdings, LLC 144A company guaranty sr. unsec. | | |
| notes 6.35s, 2040 | 805,000 | 831,527 |
|
| Lender Processing Services, Inc. company | | |
| guaranty sr. unsec. unsub. notes 8 1/8s, 2016 | 1,769,000 | 1,886,196 |
|
| Macy’s Retail Holdings, Inc. company guaranty sr. unsec. | | |
| notes 6 5/8s, 2011 | 495,000 | 516,038 |
|
30
| | |
| CORPORATE BONDS AND NOTES (22.8%)* cont. | Principal amount | Value |
|
| Consumer cyclicals cont. | | |
| NBC Universal, Inc. 144A notes 6.4s, 2040 | $845,000 | $864,469 |
|
| NBC Universal, Inc. 144A notes 5.15s, 2020 | 670,000 | 677,248 |
|
| News America Holdings, Inc. company guaranty 7 3/4s, 2024 | 870,000 | 1,053,568 |
|
| News America Holdings, Inc. debs. 7 3/4s, 2045 | 790,000 | 943,589 |
|
| Nissan Motor Acceptance Corp. 144A sr. unsec. notes 4 1/2s, 2015 | 1,695,000 | 1,711,386 |
|
| Omnicom Group, Inc. sr. notes 5.9s, 2016 | 535,000 | 593,853 |
|
| Owens Corning, Inc. company guaranty unsec. | | |
| unsub. notes 9s, 2019 | 672,000 | 808,080 |
|
| QVC Inc. 144A sr. notes 7 1/8s, 2017 | 535,000 | 543,025 |
|
| Staples, Inc. sr. unsec. notes 9 3/4s, 2014 | 980,000 | 1,200,407 |
|
| Time Warner Entertainment Co., LP debs. 8 3/8s, 2023 | 50,000 | 62,747 |
|
| Time Warner, Inc. debs. 9.15s, 2023 | 675,000 | 883,703 |
|
| Time Warner, Inc. debs. 9 1/8s, 2013 | 785,000 | 920,344 |
|
| Viacom, Inc. company guaranty 5 5/8s, 2012 | 333,000 | 358,766 |
|
| Viacom, Inc. company guaranty sr. unsec. notes 8 5/8s, 2012 | 67,000 | 74,804 |
|
| Viacom, Inc. unsec. sr. company guaranty 7 7/8s, 2030 | 920,000 | 1,044,226 |
|
| Wal-Mart Stores, Inc. sr. unsec. notes 6.2s, 2038 | 365,000 | 402,396 |
|
| Whirlpool Corp. sr. unsec. notes 8.6s, 2014 | 180,000 | 210,675 |
|
| | | 22,810,411 |
| Consumer staples (2.4%) | | |
| Altria Group, Inc. company guaranty sr. unsec. notes 9 1/4s, 2019 | 875,000 | 1,080,872 |
|
| Altria Group, Inc. company guaranty sr. unsec. | | |
| unsub. notes 8 1/2s, 2013 | 540,000 | 636,585 |
|
| Anheuser-Busch InBev Worldwide, Inc. 144A company | | |
| guaranty sr. notes 8.2s, 2039 | 2,013,000 | 2,656,381 |
|
| Anheuser-Busch InBev Worldwide, Inc. 144A company | | |
| guaranty sr. notes 5s, 2020 | 980,000 | 993,724 |
|
| Anheuser-Busch InBev Worldwide, Inc. 144A company | | |
| guaranty sr. unsec. unsub. notes 7 3/4s, 2019 | 1,222,000 | 1,470,843 |
|
| Campbell Soup Co. debs. 8 7/8s, 2021 | 715,000 | 968,183 |
|
| ConAgra Foods, Inc. unsec. notes 7 7/8s, 2010 | 36,000 | 36,912 |
|
| CVS Caremark Corp. notes 6.6s, 2019 | 1,310,000 | 1,492,589 |
|
| CVS Caremark Corp. 144A company guaranty notes 7.507s, 2032 | 2,312,280 | 2,618,195 |
|
| CVS Corp. sr. unsec. notes 6 1/8s, 2016 | 5,000 | 5,567 |
|
| Diageo Capital PLC company guaranty 5 3/4s, 2017 (United Kingdom) | 680,000 | 755,500 |
|
| Diageo PLC company guaranty 8s, 2022 (Canada) | 675,000 | 839,714 |
|
| Fortune Brands, Inc. sr. unsec. unsub. notes 3s, 2012 | 1,735,000 | 1,755,007 |
|
| General Mills, Inc. sr. unsec. notes 5.65s, 2019 | 190,000 | 207,836 |
|
| H.J. Heinz Co. sr. unsec. notes 5.35s, 2013 | 595,000 | 649,427 |
|
| H.J. Heinz Finance Co. 144A company guaranty 7 1/8s, 2039 | 85,000 | 99,547 |
|
| Kraft Foods, Inc. notes 6 1/8s, 2018 | 730,000 | 802,812 |
|
| Kraft Foods, Inc. sr. unsec. unsub. notes 6 1/2s, 2040 | 3,905,000 | 4,202,873 |
|
| Kroger Co. company guaranty 6 3/4s, 2012 | 5,000 | 5,458 |
|
| Kroger Co. company guaranty 6.4s, 2017 | 605,000 | 687,683 |
|
| Kroger Co. sr. notes 6.15s, 2020 | 200,000 | 220,540 |
|
| McDonald’s Corp. sr. unsec. Ser. MTN, 6.3s, 2038 | 680,000 | 762,309 |
|
| McDonald’s Corp. sr. unsec. bond 6.3s, 2037 | 530,000 | 593,801 |
|
| McDonald’s Corp. sr. unsec. notes 5.7s, 2039 | 775,000 | 805,199 |
|
31
| | |
| CORPORATE BONDS AND NOTES (22.8%)* cont. | Principal amount | Value |
|
| Consumer staples cont. | | |
| SABMiller PLC 144A notes 6 1/2s, 2018 (United Kingdom) | $1,010,000 | $1,149,305 |
|
| Tesco PLC 144A sr. unsec. unsub. notes 6.15s, 2037 | | |
| (United Kingdom) | 1,150,000 | 1,246,923 |
|
| Tyson Foods, Inc. sr. unsec. notes 8 1/4s, 2011 | 555,000 | 596,625 |
|
| Tyson Foods, Inc. sr. unsec. unsub. notes 10 1/2s, 2014 | 675,000 | 800,719 |
|
| WPP Finance UK company guaranty sr. unsec. notes 8s, 2014 | | |
| (United Kingdom) | 1,370,000 | 1,581,818 |
|
| | | 29,722,947 |
| Energy (1.1%) | | |
| Chesapeake Energy Corp. sr. unsec. notes 7 5/8s, 2013 | 835,000 | 865,269 |
|
| Devon Energy Corp. sr. notes 6.3s, 2019 | 360,000 | 411,744 |
|
| El Paso Pipeline Partners Operating Co., LLC company | | |
| guaranty sr. unsec. notes 6 1/2s, 2020 | 750,000 | 768,750 |
|
| EnCana Corp. sr. unsec. notes 6 1/2s, 2019 (Canada) | 270,000 | 306,033 |
|
| EOG Resources, Inc. sr. unsec. notes 5 5/8s, 2019 | 340,000 | 373,240 |
|
| Forest Oil Corp. sr. notes 8s, 2011 | 455,000 | 481,163 |
|
| Motiva Enterprises, LLC 144A sr. notes 5.2s, 2012 | 195,000 | 206,875 |
|
| Motiva Enterprises, LLC 144A sr. unsec. notes 6.85s, 2040 | 730,000 | 812,167 |
|
| Newfield Exploration Co. sr. sub. notes 6 5/8s, 2016 | 550,000 | 558,250 |
|
| Newfield Exploration Co. sr. unsec. sub. notes 6 5/8s, 2014 | 319,000 | 324,583 |
|
| Nexen, Inc. sr. unsec. unsub. notes 7 1/2s, 2039 (Canada) | 620,000 | 739,652 |
|
| Peabody Energy Corp. sr. notes 5 7/8s, 2016 | 665,000 | 661,675 |
|
| Ras Laffan Liquefied Natural Gas Co., Ltd. 144A company | | |
| guaranty sr. notes 5 1/2s, 2014 (Qatar) | 1,015,000 | 1,085,967 |
|
| Weatherford International, Inc. company guaranty sr. unsec. | | |
| unsub. bonds 6.8s, 2037 | 205,000 | 220,747 |
|
| Weatherford International, Inc. company guaranty sr. unsec. | | |
| unsub. bonds 6.35s, 2017 | 240,000 | 264,838 |
|
| Weatherford International, Ltd. company guaranty 6 1/2s, | | |
| 2036 (Switzerland) | 470,000 | 489,350 |
|
| Weatherford International, Ltd. company guaranty sr. unsec. | | |
| notes 9 5/8s, 2019 (Switzerland) | 1,125,000 | 1,454,956 |
|
| Weatherford International, Ltd. sr. notes 5 1/2s, | | |
| 2016 (Switzerland) | 390,000 | 422,263 |
|
| Williams Partners LP 144A sr. unsec. notes 5 1/4s, 2020 | 625,000 | 642,844 |
|
| Woodside Finance Ltd. 144A notes 4 1/2s, 2014 (Australia) | 655,000 | 678,222 |
|
| XTO Energy, Inc. sr. unsec. notes 6 3/4s, 2037 | 635,000 | 762,770 |
|
| XTO Energy, Inc. sr. unsec. notes 5 1/2s, 2018 | 280,000 | 307,597 |
|
| XTO Energy, Inc. sr. unsec. unsub. notes 6 1/2s, 2018 | 505,000 | 593,363 |
|
| | | 13,432,318 |
| Financials (7.3%) | | |
| Aflac, Inc. sr. unsec. notes 6.9s, 2039 | 620,000 | 670,555 |
|
| Allstate Life Global Funding Trusts notes Ser. MTN, 5 3/8s, 2013 | 1,160,000 | 1,273,632 |
|
| American Express Bank FSB notes Ser. BKN1, 5.55s, 2012 | 995,000 | 1,072,350 |
|
| American Express Bank FSB sr. unsec. FRN Ser. BKNT, 0.55s, 2017 | 1,035,000 | 962,820 |
|
| American Express Co. sr. unsec. notes 8 1/8s, 2019 | 1,450,000 | 1,775,947 |
|
| American Express Travel Related Services Co., Inc. | | |
| sr. unsec. unsub. notes FRN Ser. EMTN, 0.449s, 2011 | 1,225,000 | 1,181,586 |
|
32
| | |
| CORPORATE BONDS AND NOTES (22.8%)* cont. | Principal amount | Value |
|
| Financials cont. | | |
| American International Group, Inc. sr. unsec. Ser. MTN, | | |
| 5.85s, 2018 | $2,440,000 | $2,257,000 |
|
| AON Corp. jr. unsec. sub. notes 8.205s, 2027 | 1,275,000 | 1,389,120 |
|
| Bank of America Corp. sub. notes 7 3/4s, 2015 | 1,465,000 | 1,653,902 |
|
| Bank of America NA sub. notes Ser. BKNT, 5.3s, 2017 | 905,000 | 897,063 |
|
| Barclays Bank PLC sr. unsec. unsub. notes 5s, 2016 | | |
| (United Kingdom) | 100,000 | 103,891 |
|
| Barclays Bank PLC 144A sub. notes 10.179s, 2021 | 1,080,000 | 1,415,155 |
|
| Barclays Bank PLC 144A unsec. sub. notes 6.05s, 2017 | 2,555,000 | 2,662,589 |
|
| Bear Stearns Cos., Inc. (The) sr. notes 6.4s, 2017 | 1,020,000 | 1,125,302 |
|
| Bear Stearns Cos., Inc. (The) sr. unsec. notes 7 1/4s, 2018 | 1,685,000 | 1,943,845 |
|
| Bosphorus Financial Services, Ltd. 144A sr. notes FRN | | |
| 2.05s, 2012 | 897,000 | 876,770 |
|
| Capital One Bank USA NA sub. notes 8.8s, 2019 | 1,050,000 | 1,292,949 |
|
| Chubb Corp. (The) sr. notes 6 1/2s, 2038 | 480,000 | 536,321 |
|
| Citigroup, Inc. sr. unsec. sub. FRN 0.524s, 2016 | 1,961,000 | 1,688,733 |
|
| Citigroup, Inc. sr. unsec. unsub. notes 6 1/8s, 2017 | 1,370,000 | 1,423,504 |
|
| Citigroup, Inc. sr. unsec. unsub. notes 5 1/4s, 2012 | 2,165,000 | 2,268,784 |
|
| Citigroup, Inc. sr. unsec. unsub. notes FRN 0.4s, 2010 | 1,575,000 | 1,574,951 |
|
| Citigroup, Inc. sub. notes 5s, 2014 | 1,156,000 | 1,170,171 |
|
| Citigroup, Inc. unsec. sub. notes 6 5/8s, 2032 | 504,000 | 484,139 |
|
| Commonwealth Bank of Australia 144A sr. unsec. | | |
| notes 3 3/4s, 2014 (Australia) | 100,000 | 101,729 |
|
| Countrywide Financial Corp. FRN Ser. MTN, 0.8s, 2012 | 1,090,000 | 1,078,841 |
|
| Duke Realty LP sr. unsec. notes 6 1/2s, 2018 R | 390,000 | 409,221 |
|
| Duke Realty LP sr. unsec. notes 6 1/4s, 2013 R | 64,000 | 68,373 |
|
| Fund American Cos., Inc. notes 5 7/8s, 2013 | 1,050,000 | 1,096,241 |
|
| GATX Financial Corp. notes 5.8s, 2016 | 455,000 | 470,939 |
|
| General Electric Capital Corp. sr. unsec. FRN Ser. MTN, | | |
| 0.574s, 2016 | 895,000 | 837,912 |
|
| General Electric Capital Corp. sr. unsec. notes 5 1/2s, 2020 | 2,080,000 | 2,166,810 |
|
| General Electric Capital Corp. sr. unsec. notes Ser. MTN, | | |
| 6 7/8s, 2039 | 370,000 | 409,694 |
|
| Goldman Sachs Group, Inc (The) sr. unsec. 6.15s, 2018 | 595,000 | 616,362 |
|
| Goldman Sachs Group, Inc. (The) sr. unsec. | | |
| unsub. notes 5 3/8s, 2020 | 705,000 | 685,713 |
|
| Goldman Sachs Group, Inc. (The) sub. notes 6 3/4s, 2037 | 2,510,000 | 2,436,930 |
|
| Hartford Financial Services Group, Inc. (The) sr. unsec. | | |
| notes 6.1s, 2041 | 1,207,000 | 1,108,051 |
|
| HCP, Inc. sr. unsec. Ser. MTN, 6.7s, 2018 R | 50,000 | 52,246 |
|
| Health Care Property Investors, Inc. sr. unsec. notes 6s, 2017 | 635,000 | 648,439 |
|
| Highwood Properties, Inc. sr. unsec. bonds 5.85s, 2017 R | 835,000 | 818,910 |
|
| HSBC Holdings PLC sub. notes 6 1/2s, 2037 (United Kingdom) | 3,945,000 | 4,180,603 |
|
| Icahn Enterprises LP/Ichan Enterprises Finance Corp. 144A | | |
| company guaranty sr. unsec. notes 7 3/4s, 2016 | 670,000 | 649,900 |
|
| JPMorgan Chase Bank NA sub. notes Ser. BKNT, 6s, 2017 | 404,000 | 433,564 |
|
| JPMorgan Chase Bank NA sub. notes Ser. BKNT, 6s, 2017 | 1,311,000 | 1,409,703 |
|
| Liberty Mutual Group 144A notes 6 1/2s, 2035 | 1,715,000 | 1,544,045 |
|
33
| | |
| CORPORATE BONDS AND NOTES (22.8%)* cont. | Principal amount | Value |
|
| Financials cont. | | |
| Loews Corp. notes 5 1/4s, 2016 | $385,000 | $404,791 |
|
| Marsh & McLennan Cos., Inc. sr. unsec. notes 6 1/4s, 2012 | 1,350,000 | 1,450,015 |
|
| Marsh & McLennan Cos., Inc. sr. unsec. notes 5 3/8s, 2014 | 820,000 | 863,415 |
|
| Massachusetts Mutual Life Insurance Co. 144A notes 8 7/8s, 2039 | 830,000 | 1,109,117 |
|
| MBNA American Bank NA sub. notes Ser. BKNT, 7 1/8s, 2012 | 1,695,000 | 1,855,659 |
|
| Merrill Lynch & Co., Inc. jr. sub. bonds 7 3/4s, 2038 | 1,535,000 | 1,689,510 |
|
| Merrill Lynch & Co., Inc. notes FRN Ser. MTN, 0.516s, 2011 | 910,000 | 905,018 |
|
| MetLife Global Funding I 144A sr. unsub. notes 5 1/8s, 2014 | 715,000 | 767,784 |
|
| MetLife, Inc. sr. unsec. notes Ser. A, 6.817s, 2018 | 845,000 | 951,865 |
|
| Morgan Stanley sr. unsec. notes Ser. MTN, 5 3/4s, 2016 | 970,000 | 1,026,751 |
|
| Nationwide Financial Services, Inc. notes 5 5/8s, 2015 | 500,000 | 512,539 |
|
| Nationwide Health Properties, Inc. notes 6 1/2s, 2011 R | 540,000 | 556,405 |
|
| Nationwide Health Properties, Inc. unsec. notes 6 1/4s, 2013 R | 660,000 | 705,378 |
|
| Nationwide Mutual Insurance Co. 144A notes 9 3/8s, 2039 | 85,000 | 101,115 |
|
| OneAmerica Financial Partners, Inc. 144A bonds 7s, 2033 | 1,010,000 | 900,836 |
|
| Pacific LifeCorp 144A sr. notes 6s, 2020 | 1,575,000 | 1,614,478 |
|
| Prudential Financial, Inc. sr. notes 7 3/8s, 2019 | 340,000 | 400,469 |
|
| Prudential Financial, Inc. sr. notes 6.2s, 2015 | 300,000 | 333,495 |
|
| Prudential Financial, Inc. sr. unsec. | | |
| unsub. notes Ser. MTNB, 5.1s, 2014 | 575,000 | 615,285 |
|
| Prudential Holdings LLC sr. notes FRN Ser. AGM, 1.136s, 2017 | 160,000 | 130,098 |
|
| Royal Bank of Scotland Group PLC sr. unsec. | | |
| unsub. notes 6.4s, 2019 (United Kingdom) | 360,000 | 369,460 |
|
| Royal Bank of Scotland PLC (The) 144A company guaranty | | |
| sr. unsec. unsub. notes 4 7/8s, 2014 (United Kingdom) | 330,000 | 338,307 |
|
| Simon Property Group LP sr. unsec. notes 6 3/4s, 2014 R | 974,000 | 1,081,211 |
|
| Simon Property Group LP sr. unsec. notes 6 1/8s, 2018 R | 930,000 | 1,000,012 |
|
| Simon Property Group LP sr. unsec. unsub. notes 5.65s, 2020 R | 2,213,000 | 2,272,652 |
|
| SLM Corp. notes Ser. MTNA, 4 1/2s, 2010 | 915,000 | 919,058 |
|
| TD Ameritrade Holding Corp. company guaranty sr. unsec. | | |
| unsub. notes 5.6s, 2019 | 985,000 | 1,007,048 |
|
| Teachers Insurance & Annuity Association of America 144A | | |
| notes 6.85s, 2039 | 1,555,000 | 1,753,365 |
|
| Travelers Cos., Inc. (The) sr. unsec. notes 5.9s, 2019 | 220,000 | 241,685 |
|
| Vornado Realty LP sr. unsec. unsub. notes 4 1/4s, 2015 R | 1,180,000 | 1,179,989 |
|
| Wachovia Bank NA sub. notes Ser. BKNT, 6s, 2017 | 1,880,000 | 2,038,828 |
|
| Wachovia Corp. sr. unsec. notes 5 3/4s, 2017 | 1,745,000 | 1,880,180 |
|
| Wachovia Corp. sr. unsec. notes Ser. MTN, 5 1/2s, 2013 | 5,000 | 5,437 |
|
| Wachovia Corp. sr. unsec. notes FRN Ser. MTNE, 0.402s, 2012 | 575,000 | 570,843 |
|
| WEA Finance LLC/ WT Finance Aust. Pty. Ltd. 144A company | | |
| guaranty sr. unsec. notes 6 3/4s, 2019 | 1,810,000 | 2,027,709 |
|
| WEA Finance, LLC 144A company guaranty sr. notes 7 1/8s, 2018 | 1,070,000 | 1,209,223 |
|
| Wells Fargo Bank NA unsec. sub. notes 4 3/4s, 2015 | 345,000 | 360,720 |
|
| Wells Fargo Bank NA unsec. sub. notes FRN 0.46s, 2016 | 1,180,000 | 1,109,602 |
|
| Westpac Banking Corp. sr. unsec. notes 4 7/8s, 2019 (Australia) | 1,750,000 | 1,771,830 |
|
| Willis Group North America, Inc. company guaranty 6.2s, 2017 | 510,000 | 522,207 |
|
| | | 91,478,694 |
34
| | |
| CORPORATE BONDS AND NOTES (22.8%)* cont. | Principal amount | Value |
|
| Health care (0.7%) | | |
| Aetna, Inc. sr. unsec. unsub. notes 6 3/4s, 2037 | $1,660,000 | $1,829,474 |
|
| AstraZeneca PLC sr. unsub. notes 5.9s, 2017 (United Kingdom) | 1,535,000 | 1,738,322 |
|
| Eli Lilly & Co. sr. unsec. unsub. notes 5.95s, 2037 | 480,000 | 522,302 |
|
| Express Scripts, Inc. sr. unsec. notes 7 1/4s, 2019 | 186,000 | 220,647 |
|
| Express Scripts, Inc. sr. unsec. notes 6 1/4s, 2014 | 464,000 | 520,795 |
|
| GlaxoSmith Kline Capital, Inc. company | | |
| guaranty sr. notes 5.65s, 2018 | 935,000 | 1,035,970 |
|
| Hospira, Inc. sr. notes 6.05s, 2017 | 110,000 | 120,666 |
|
| Hospira, Inc. sr. notes 5.55s, 2012 | 655,000 | 701,667 |
|
| Quest Diagnostics, Inc. company guaranty sr. unsec. | | |
| notes 5 3/4s, 2040 | 451,000 | 443,359 |
|
| Quest Diagnostics, Inc. company guaranty sr. unsec. | | |
| notes 4 3/4s, 2020 | 244,000 | 242,813 |
|
| UnitedHealth Group, Inc. sr. unsec. notes 5.8s, 2036 | 120,000 | 115,656 |
|
| Ventas Realty LP/Capital Corp. sr. notes 6 3/4s, 2017 R | 390,000 | 401,213 |
|
| Watson Pharmaceuticals, Inc. sr. unsec. notes 6 1/8s, 2019 | 570,000 | 609,230 |
|
| WellPoint, Inc. notes 7s, 2019 | 225,000 | 259,037 |
|
| | | 8,761,151 |
| Technology (0.4%) | | |
| Amphenol Corp. sr. unsec. notes 4 3/4s, 2014 | 1,240,000 | 1,289,087 |
|
| Brocade Communications Systems, Inc. 144A sr. notes 6 7/8s, 2020 | 955,000 | 983,650 |
|
| Brocade Communications Systems, Inc. 144A sr. notes 6 5/8s, 2018 | 230,000 | 236,325 |
|
| Dell, Inc. sr. unsec. notes 5 7/8s, 2019 | 145,000 | 160,789 |
|
| Lexmark International Inc, sr. unsec. notes 5.9s, 2013 | 855,000 | 914,283 |
|
| Xerox Corp. sr. unsec. notes 6 3/4s, 2039 | 996,000 | 1,078,448 |
|
| Xerox Corp. sr. unsec. unsub. notes 5 5/8s, 2019 | 385,000 | 402,834 |
|
| Xerox Corp. sr. unsec. unsub. notes 4 1/4s, 2015 | 520,000 | 533,088 |
|
| | | 5,598,504 |
| Transportation (0.6%) | | |
| American Airlines, Inc. pass-through certificates | | |
| Ser. 01-1, 6.817s, 2011 | 100,000 | 100,250 |
|
| American Airlines, Inc. pass-through certificates | | |
| Ser. 01-2, 7.858s, 2011 | 290,000 | 299,425 |
|
| Burlington Northern Santa Fe Corp. sr. unsec. notes 7s, 2014 | 305,000 | 349,698 |
|
| Burlington Northern Santa Fe Corp. sr. unsec. notes 5 3/4s, 2018 | 365,000 | 397,786 |
|
| Burlington Northern Santa Fe Corp. sr. unsec. notes 4.7s, 2019 | 1,915,000 | 1,935,116 |
|
| Continental Airlines, Inc. pass-through certificates | | |
| Ser. 97-4A, 6.9s, 2018 | 771,101 | 776,884 |
|
| Continental Airlines, Inc. pass-through certificates | | |
| Ser. 98-1A, 6.648s, 2017 | 222,831 | 223,945 |
|
| Delta Air Lines, Inc. pass-through certificates Ser. 71-A, 6.821s, 2022 | 408,708 | 414,839 |
|
| GATX Corp. notes 4 3/4s, 2012 | 400,000 | 418,247 |
|
| Northwest Airlines Corp. pass-through certificates | | |
| Ser. 00-1, 7.15s, 2019 | 1,186,583 | 1,119,838 |
|
| Southwest Airlines Co. pass-through certificates Ser. 07-1, 6.15s, 2022 | 228,895 | 239,114 |
|
| Union Pacific Corp. sr. unsec. notes 6 1/8s, 2020 | 5,000 | 5,540 |
|
| Union Pacific Corp. 144A pass-through certificates 5.214s, 2014 | 280,000 | 300,597 |
|
| United AirLines, Inc. pass-through certificates Ser. 07-A, 6.636s, 2022 | 539,051 | 514,794 |
|
| | | 7,096,073 |
35
| | |
| CORPORATE BONDS AND NOTES (22.8%)* cont. | Principal amount | Value |
|
| Utilities and power (3.8%) | | |
| AEP Texas North Co. sr. notes Ser. B, 5 1/2s, 2013 | $515,000 | $555,528 |
|
| Ameren Corp. sr. unsec. notes 8 7/8s, 2014 | 207,000 | 242,615 |
|
| Ameren Energy Generating Co. sr. unsec. notes 6.3s, 2020 | 690,000 | 699,541 |
|
| Appalachian Power Co. sr. notes Ser. L, 5.8s, 2035 | 580,000 | 580,807 |
|
| Aquila, Inc. sr. unsec. unsub. notes 11 7/8s, 2012 | 1,525,000 | 1,790,345 |
|
| Atmos Energy Corp. sr. unsub. notes 6.35s, 2017 | 765,000 | 837,556 |
|
| Beaver Valley II Funding debs. 9s, 2017 | 687,000 | 756,167 |
|
| Boardwalk Pipelines LP company guaranty 5 7/8s, 2016 | 980,000 | 1,072,542 |
|
| Bruce Mansfield Unit pass-through certificates 6.85s, 2034 | 1,968,652 | 2,041,502 |
|
| CenterPoint Energy Resources Corp. notes 7 3/4s, 2011 | 1,050,000 | 1,101,135 |
|
| CMS Energy Corp. sr. notes 8 1/2s, 2011 | 2,397,000 | 2,521,397 |
|
| CMS Energy Corp. sr. unsec. unsub. notes FRN 1.253s, 2013 | 625,000 | 592,188 |
|
| Commonwealth Edison Co. 1st mtge. 6.15s, 2017 | 250,000 | 280,396 |
|
| Commonwealth Edison Co. 1st mtge. sec. bonds 5 7/8s, 2033 | 480,000 | 503,213 |
|
| Commonwealth Edison Co. 1st mtge. sec. bonds 5.8s, 2018 | 130,000 | 143,056 |
|
| Consolidated Natural Gas Co. sr. notes Ser. A, 5s, 2014 | 400,000 | 430,549 |
|
| DCP Midstream, LLC 144A sr. unsec. notes 5.35s, 2020 | 775,000 | 795,195 |
|
| Dominion Resources, Inc. sr. unsec. unsub. notes Ser. 07-A, | | |
| 6s, 2017 | 2,460,000 | 2,742,642 |
|
| Duke Energy Corp. sr. unsec. notes 6 1/4s, 2018 | 1,055,000 | 1,170,858 |
|
| El Paso Natural Gas Co. sr. unsec. unsub. bonds 8 3/8s, 2032 | 830,000 | 1,007,885 |
|
| Electricite de France 144A notes 6.95s, 2039 (France) | 970,000 | 1,143,519 |
|
| Electricite de France 144A sr. notes 4.6s, 2020 (France) | 255,000 | 255,162 |
|
| Enel Finance Intl. SA 144A company guaranty sr. unsec. | | |
| notes 5 1/8s, 2019 (Luxembourg) | 695,000 | 702,735 |
|
| Entergy Gulf States, Inc. 1st mtge. 5 1/4s, 2015 | 373,000 | 373,595 |
|
| FirstEnergy Corp. notes Ser. B, 6.45s, 2011 | 7,000 | 7,425 |
|
| Illinois Power Co. 1st mtge. sr. bond 9 3/4s, 2018 | 520,000 | 682,937 |
|
| Ipalco Enterprises, Inc. sr. sec. notes 8 5/8s, 2011 | 735,000 | 777,263 |
|
| Ipalco Enterprises, Inc. 144A sr. sec. notes 7 1/4s, 2016 | 600,000 | 628,500 |
|
| ITC Holdings Corp. 144A notes 5 7/8s, 2016 | 890,000 | 936,600 |
|
| ITC Holdings Corp. 144A sr. unsec. notes 6.05s, 2018 | 330,000 | 349,518 |
|
| Kansas Gas & Electric bonds 5.647s, 2021 | 273,685 | 274,170 |
|
| MidAmerican Energy Holdings Co. bonds 6 1/8s, 2036 | 1,000,000 | 1,043,364 |
|
| MidAmerican Energy Holdings Co. sr. unsec. bond 6 1/2s, 2037 | 410,000 | 448,553 |
|
| MidAmerican Funding, LLC sr. sec. bond 6.927s, 2029 | 360,000 | 403,245 |
|
| National Fuel Gas Co. notes 5 1/4s, 2013 | 595,000 | 626,561 |
|
| NiSource Finance Corp. company guaranty sr. unsec. | | |
| notes 10 3/4s, 2016 | 795,000 | 1,025,772 |
|
| NiSource Finance Corp. company guaranty sr. unsec. | | |
| unsub. notes 7 7/8s, 2010 | 1,660,000 | 1,718,895 |
|
| Northwestern Corp. sec. notes 5 7/8s, 2014 | 900,000 | 926,404 |
|
| Pacific Gas & Electric Co. sr. unsec. notes 6.35s, 2038 | 295,000 | 326,884 |
|
| Pacific Gas & Electric Co. sr. unsub. 5.8s, 2037 | 785,000 | 807,779 |
|
| PacifiCorp Sinking Fund 1st mtge. 6 1/4s, 2037 | 460,000 | 506,539 |
|
| Potomac Edison Co. 144A 1st mtge. 5.8s, 2016 | 885,000 | 915,639 |
|
| Power Receivable Finance, LLC 144A sr. notes 6.29s, 2012 | 2,488,622 | 2,548,299 |
|
36
| | |
| CORPORATE BONDS AND NOTES (22.8%)* cont. | Principal amount | Value |
|
| Utilities and power cont. | | |
| PPL Energy Supply LLC bonds Ser. A, 5.7s, 2015 | $515,000 | $550,400 |
|
| Progress Energy, Inc. sr. notes 6.85s, 2012 | 195,000 | 213,428 |
|
| Sierra Pacific Resources sr. unsec. unsub. notes 6 3/4s, 2017 | 466,000 | 477,459 |
|
| Southern California Edison Co. 1st mtge. bonds 5 1/2s, 2040 | 575,000 | 580,930 |
|
| Spectra Energy Capital, LLC company guaranty sr. unsec. | | |
| notes 5.9s, 2013 | 910,000 | 992,546 |
|
| Spectra Energy Capital, LLC company guaranty sr. unsec. | | |
| notes 5.65s, 2020 | 240,000 | 253,674 |
|
| Spectra Energy Capital, LLC company guaranty sr. unsec. | | |
| unsub. notes 6.2s, 2018 | 135,000 | 148,117 |
|
| Spectra Energy Capital, LLC sr. notes 8s, 2019 | 650,000 | 786,100 |
|
| Texas-New Mexico Power Co. 144A 1st mtge. sec. 9 1/2s, 2019 | 1,960,000 | 2,418,463 |
|
| TransAlta Corp. sr. notes 6 1/2s, 2040 | 890,000 | 911,425 |
|
| TransAlta Corp. sr. unsec. notes 5 3/4s, 2013 (Canada) | 535,000 | 584,039 |
|
| TransAlta Corp. sr. unsec. unsub. notes 4 3/4s, 2015 (Canada) | 450,000 | 470,382 |
|
| Union Electric Co. 1st mtge. sr. sec. bond 6.7s, 2019 | 560,000 | 634,699 |
|
| West Penn Power Co. 144A 1st mtge. 5.95s, 2017 | 830,000 | 863,857 |
|
| | | 47,179,994 |
| Total corporate bonds and notes (cost $265,502,459) | | $284,136,732 |
|
| |
| ASSET-BACKED SECURITIES (6.0%)* | Principal amount | Value |
|
| Accredited Mortgage Loan Trust | | |
| FRB Ser. 05-1, Class M2, 0.953s, 2035 | $130,212 | $50,748 |
| FRB Ser. 05-4, Class A2C, 0.473s, 2035 | 176,822 | 171,380 |
|
| Ace Securities Corp. | | |
| FRB Ser. 06-OP2, Class A2C, 0.413s, 2036 | 758,000 | 233,919 |
| FRB Ser. 06-HE3, Class A2C, 0.413s, 2036 | 973,000 | 353,949 |
|
| AFC Home Equity Loan Trust Ser. 99-2, Class 1A, 0.673s, 2029 | 1,829,848 | 818,277 |
|
| Ameriquest Mortgage Securities, Inc. FRB Ser. 03-8, | | |
| Class M2, 2.013s, 2033 | 349,106 | 124,581 |
|
| Arcap REIT, Inc. 144A | | |
| Ser. 03-1A, Class E, 7.11s, 2038 | 1,203,000 | 216,540 |
| Ser. 04-1A, Class E, 6.42s, 2039 | 889,204 | 142,273 |
|
| Argent Securities, Inc. | | |
| FRB Ser. 03-W3, Class M3, 2.533s, 2033 | 42,539 | 14,431 |
| FRB Ser. 06-W4, Class A2C, 0.423s, 2036 | 1,668,046 | 547,799 |
|
| Asset Backed Funding Certificates | | |
| FRB Ser. 04-OPT2, Class M2, 1.263s, 2033 | 216,447 | 165,553 |
| FRB Ser. 05-WMC1, Class M1, 0.703s, 2035 | 543,000 | 504,990 |
|
| Asset Backed Securities Corp. Home Equity Loan Trust | | |
| FRB Ser. 06-HE2, Class A3, 0.453s, 2036 | 227,043 | 153,369 |
| FRB Ser. 06-HE4, Class A5, 0.423s, 2036 | 859,305 | 559,668 |
| FRB Ser. 06-HE7, Class A4, 0.403s, 2036 | 534,000 | 186,478 |
|
| Bay View Auto Trust Ser. 05-LJ2, Class D, 5.27s, 2014 | 324,000 | 329,957 |
|
| Bayview Financial Acquisition Trust FRB Ser. 04-D, Class A, | | |
| 0.85s, 2044 | 560,691 | 505,209 |
|
| Bayview Financial Asset Trust 144A FRB Ser. 03-SSRA, | | |
| Class M, 1.613s, 2038 | 373,465 | 261,425 |
|
37
| | |
| ASSET-BACKED SECURITIES (6.0%)* cont. | Principal amount | Value |
|
| Bear Stearns Asset Backed Securities, Inc. | | |
| FRB Ser. 05-HE1, Class M3, 1 1/4s, 2035 | $395,000 | $115,790 |
| FRB Ser. 03-3, Class A2, 0.853s, 2043 | 1,118,941 | 955,319 |
| FRB Ser. 05-3, Class A1, 0.713s, 2035 | 163,395 | 150,827 |
|
| Citigroup Mortgage Loan Trust, Inc. FRB Ser. 05-OPT1, | | |
| Class M1, 0.683s, 2035 | 331,324 | 261,109 |
|
| Conseco Finance Securitizations Corp. | | |
| Ser. 00-2, Class A5, 8.85s, 2030 | 3,850,793 | 3,157,651 |
| Ser. 02-2, Class A, IO, 8 1/2s, 2033 | 3,418,165 | 47,000 |
| Ser. 00-4, Class A6, 8.31s, 2032 | 4,201,666 | 3,361,333 |
| Ser. 00-5, Class A6, 7.96s, 2032 | 2,034,103 | 1,790,010 |
| Ser. 02-1, Class M1F, 7.954s, 2033 | 941,000 | 853,697 |
| Ser. 01-4, Class A4, 7.36s, 2033 | 2,857,728 | 2,972,037 |
| Ser. 01-1, Class A5, 6.99s, 2032 | 2,821,463 | 2,849,678 |
|
| Countrywide Asset Backed Certificates | | |
| FRB Ser. 05-BC3, Class M1, 0.783s, 2035 | 260,660 | 245,642 |
| FRB Ser. 04-6, Class 2A5, 0.653s, 2034 | 617,421 | 531,207 |
| FRB Ser. 05-14, Class 3A2, 0.503s, 2036 | 125,236 | 112,192 |
|
| Credit-Based Asset Servicing and Securitization 144A | | |
| Ser. 06-MH1, Class B1, 6 1/4s, 2036 | 375,000 | 273,750 |
|
| Crest, Ltd. 144A Ser. 03-2A, Class D2, 6.723s, 2038 | 1,307,000 | 261,400 |
|
| CS First Boston Mortgage Securities Corp. 144A | | |
| Ser. 04-FR1N, Class A, 5s, 2034 (In default) F † | 150,030 | 15 |
|
| Equifirst Mortgage Loan Trust FRB Ser. 05-1, Class M5, | | |
| 0.933s, 2035 | 132,008 | 43,779 |
|
| Fieldstone Mortgage Investment Corp. FRB Ser. 05-1, | | |
| Class M3, 1.073s, 2035 | 190,845 | 190,307 |
|
| First Plus Home Loan Trust Ser. 97-3, Class B1, 7.79s, 2023 | 134,710 | 130,580 |
|
| Fort Point CDO, Ltd. FRB Ser. 03-2A, Class A2, 1.302s, 2038 | 834,000 | 4,170 |
|
| Foxe Basin, Ltd. 144A FRB Ser. 03-1A, Class A1, 0.757s, 2015 | 687,043 | 647,538 |
|
| Fremont Home Loan Trust | | |
| FRB Ser. 05-E, Class 2A4, 0.593s, 2036 | 1,701,000 | 859,111 |
| FRB Ser. 06-2, Class 2A3, 0.433s, 2036 | 3,011,000 | 1,833,594 |
|
| G-Star, Ltd. 144A FRB Ser. 02-2A, Class BFL, 2.263s, 2037 | 417,000 | 70,890 |
|
| GEBL 144A | | |
| Ser. 04-2, Class D, 3.004s, 2032 | 398,512 | 17,933 |
| Ser. 04-2, Class C, 1.104s, 2032 | 150,190 | 18,023 |
|
| Green Tree Financial Corp. | | |
| Ser. 96-5, Class M1, 8.05s, 2027 | 437,522 | 380,644 |
| Ser. 99-5, Class A5, 7.86s, 2030 | 8,754,442 | 7,441,276 |
| Ser. 97-2, Class A7, 7.62s, 2028 | 456,004 | 483,433 |
| Ser. 97-6, Class A9, 7.55s, 2029 | 497,943 | 508,137 |
| Ser. 95-8, Class B1, 7.3s, 2026 | 284,587 | 260,872 |
| Ser. 96-10, Class M1, 7.24s, 2028 | 812,000 | 820,120 |
| Ser. 97-3, Class A5, 7.14s, 2028 | 249,417 | 254,443 |
| Ser. 98-4, Class A7, 6.87s, 2030 | 195,631 | 194,929 |
| Ser. 98-6, Class A7, 6.45s, 2030 | 84,793 | 84,908 |
| Ser. 99-2, Class A7, 6.44s, 2030 | 757,111 | 720,733 |
| Ser. 99-1, Class A6, 6.37s, 2025 | 895,972 | 904,931 |
|
38
| | |
| ASSET-BACKED SECURITIES (6.0%)* cont. | Principal amount | Value |
|
| Greenpoint Manufactured Housing | | |
| Ser. 00-3, Class IA, 8.45s, 2031 | $2,434,104 | $2,263,717 |
| Ser. 99-5, Class M1A, 8.3s, 2026 | 409,000 | 393,965 |
| Ser. 99-3, Class 1A5, 6.79s, 2023 | 22,909 | 22,829 |
|
| GSAMP Trust FRB Ser. 06-HE5, Class A2C, 0.413s, 2036 | 4,475,000 | 1,334,733 |
|
| Guggenheim Structured Real Estate Funding, Ltd. 144A | | |
| FRB Ser. 05-2A, Class D, 1.813s, 2030 | 994,058 | 149,109 |
| FRB Ser. 05-1A, Class D, 1.793s, 2030 | 322,885 | 38,746 |
|
| High Income Trust Securities 144A FRB Ser. 03-1A, Class A, | | |
| 0.728s, 2036 | 878,553 | 351,421 |
|
| Home Equity Asset Trust FRB Ser. 06-1, Class 2A4, 0.593s, 2036 | 853,000 | 635,238 |
|
| JPMorgan Mortgage Acquisition Corp. FRB Ser. 06-FRE1, | | |
| Class A4, 0.553s, 2035 | 716,000 | 427,381 |
|
| Lehman Manufactured Housing Ser. 98-1, Class 1, IO, 0.807s, 2028 | 8,071,360 | 343,033 |
|
| Lehman XS Trust FRB Ser. 07-6, Class 2A1, 0.473s, 2037 | 6,794,085 | 2,536,694 |
|
| LNR CDO, Ltd. 144A | | |
| FRB Ser. 03-1A, Class EFL, 3.261s, 2036 | 2,510,000 | 175,700 |
| FRB Ser. 02-1A, Class FFL, 3.013s, 2037 | 3,681,000 | 478,530 |
|
| Local Insight Media Finance, LLC Ser. 07-1W, Class A1, | | |
| 5.53s, 2012 | 3,208,410 | 1,957,130 |
|
| Long Beach Mortgage Loan Trust | | |
| FRB Ser. 05-2, Class M4, 0.883s, 2035 | 448,000 | 269,415 |
| FRB Ser. 06-4, Class 2A4, 0.523s, 2036 | 819,000 | 328,390 |
| FRB Ser. 06-1, Class 2A3, 0.453s, 2036 | 905,938 | 472,758 |
|
| Madison Avenue Manufactured Housing Contract | | |
| FRB Ser. 02-A, Class B1, 3.513s, 2032 | 3,088,734 | 2,721,175 |
| FRB Ser. 02-A, Class M2, 2.513s, 2032 | 453,000 | 385,503 |
| Ser. 02-A IO, 0.3s, 2032 | 75,445,183 | 943,065 |
|
| Marriott Vacation Club Owner Trust 144A | | |
| Ser. 05-2, Class D, 6.205s, 2027 | 49,548 | 26,684 |
| Ser. 04-2A, Class D, 5.389s, 2026 | 39,518 | 20,697 |
| Ser. 04-2A, Class C, 4.741s, 2026 | 45,757 | 28,554 |
| FRB Ser. 02-1A, Class A1, 0.956s, 2024 | 308,028 | 293,917 |
|
| MASTR Asset Backed Securities Trust FRB Ser. 06-FRE2, | | |
| Class A4, 0.413s, 2036 | 425,000 | 205,476 |
|
| Mid-State Trust | | |
| Ser. 11, Class B, 8.221s, 2038 | 410,456 | 385,528 |
| Ser. 10, Class B, 7.54s, 2036 | 405,781 | 369,378 |
|
| Morgan Stanley ABS Capital I | | |
| FRB Ser. 05-HE2, Class M5, 0.943s, 2035 | 190,557 | 98,857 |
| FRB Ser. 05-HE1, Class M3, 0.783s, 2034 | 281,000 | 218,802 |
| FRB Ser. 06-NC4, Class M2, 0.563s, 2036 | 395,000 | 3,248 |
|
| N-Star Real Estate CDO, Ltd. 144A FRB Ser. 04-2A, Class C1, | | |
| 2.265s, 2039 | 735,000 | 147,000 |
|
| Navigator CDO, Ltd. 144A FRB Ser. 03-1A, Class A1, 0.74s, 2015 | 84,712 | 82,171 |
|
| New Century Home Equity Loan Trust | | |
| Ser. 03-5, Class AI7, 5.15s, 2033 | 1,054,512 | 1,037,782 |
| FRB Ser. 03-4, Class M3, 3.338s, 2033 | 20,402 | 11,838 |
|
39
| | |
| ASSET-BACKED SECURITIES (6.0%)* cont. | Principal amount | Value |
|
| Novastar Home Equity Loan | | |
| FRB Ser. 06-1, Class A2C, 0.423s, 2036 | $1,003,874 | $544,288 |
| FRB Ser. 06-2, Class A2C, 0.413s, 2036 | 1,017,000 | 593,480 |
|
| Oakwood Mortgage Investors, Inc. | | |
| Ser. 00-D, Class A3, 6.99s, 2022 | 29,224 | 29,517 |
| Ser. 01-D, Class A3, 5.9s, 2022 | 109,189 | 64,826 |
| Ser. 02-C, Class A1, 5.41s, 2032 | 2,376,284 | 2,114,893 |
|
| Oakwood Mortgage Investors, Inc. 144A | | |
| Ser. 01-B, Class A4, 7.21s, 2030 | 323,045 | 310,123 |
| Ser. 01-B, Class A3, 6.535s, 2023 | 96,232 | 88,159 |
|
| Park Place Securities, Inc. | | |
| FRB Ser. 05-WCH1, Class M4, 1.093s, 2036 | 180,000 | 36,372 |
| FRB Ser. 04-WHQ2, Class A3A, 0.613s, 2035 | 8,198 | 8,168 |
|
| People’s Financial Realty Mortgage Securities Trust FRB | | |
| Ser. 06-1, Class 1A2, 0.393s, 2036 | 1,151,651 | 458,887 |
|
| Residential Asset Mortgage Products, Inc. | | |
| FRB Ser. 06-NC3, Class A2, 0.453s, 2036 | 865,728 | 682,480 |
| FRB Ser. 07-RZ1, Class A2, 0.423s, 2037 | 1,565,000 | 913,902 |
|
| Residential Asset Securities Corp. FRB Ser. 05-EMX1, | | |
| Class M2, 0.993s, 2035 | 475,764 | 345,995 |
|
| Residential Asset Securities Corp. 144A Ser. 04-NT, | | |
| Class Note, 4 1/2s, 2034 (In default) F † | 61,018 | 6 |
|
| Saco I Trust FRB Ser. 05-10, Class 1A1, 0.523s, 2036 | 472,689 | 179,298 |
|
| SAIL Net Interest Margin Notes 144A Ser. 04-4A, Class B, | | |
| 7 1/2s, 2034 (In default) F † | 233,390 | — |
|
| Securitized Asset Backed Receivables, LLC | | |
| FRB Ser. 05-HE1, Class M2, 0.913s, 2035 | 231,424 | 1,043 |
| FRB Ser. 07-NC2, Class A2B, 0.403s, 2037 | 1,409,000 | 612,409 |
| FRB Ser. 07-BR5, Class A2A, 0.393s, 2037 | 473,151 | 340,669 |
|
| SG Mortgage Securities Trust | | |
| FRB Ser. 06-OPT2, Class A3D, PO, 0.473s, 2036 | 1,730,000 | 684,037 |
| FRB Ser. 06-FRE1, Class A2B, 0.443s, 2036 | 611,429 | 333,693 |
|
| Soundview Home Equity Loan Trust | | |
| FRB Ser. 06-OPT3, Class 2A3, 0.433s, 2036 | 758,000 | 592,639 |
| FRB Ser. 06-3, Class A3, 0.423s, 2036 | 4,497,000 | 2,684,205 |
|
| South Coast Funding 144A FRB Ser. 3A, Class A2, 1.45s, 2038 | 460,000 | 4,600 |
|
| Structured Asset Investment Loan Trust FRB Ser. 06-BNC2, | | |
| Class A6, 0.523s, 2036 | 821,000 | 156,779 |
|
| Structured Asset Securities Corp. 144A Ser. 98-RF3, | | |
| Class A, IO, 6.1s, 2028 | 1,619,166 | 304,755 |
|
| TIAA Real Estate CDO, Ltd. Ser. 03-1A, Class E, 8s, 2038 | 1,388,000 | 138,800 |
|
| WAMU Asset-Backed Certificates FRB Ser. 07-HE2, Class 2A1, | | |
| 0.373s, 2037 | 5,130,958 | 3,514,706 |
|
| Wells Fargo Home Equity Trust FRB Ser. 07-1, Class A3, | | |
| 0.583s, 2037 | 366,000 | 140,889 |
|
| Whinstone Capital Management, Ltd. 144A FRB Ser. 1A, | | |
| Class B3, 1.216s, 2044 (United Kingdom) | 460,894 | 105,993 |
|
| Total asset-backed securities (cost $113,961,401) | | $74,293,629 |
40
| | | |
| U.S. GOVERNMENT AND AGENCY | | | |
| MORTGAGE OBLIGATIONS (4.0%)* | | Principal amount | Value |
|
| U.S. Government Guaranteed Mortgage Obligations (1.2%) | | |
| Government National Mortgage Association | | | |
| Pass-Through Certificates | | | |
| 6 1/2s, with due dates from April 20, 2038 to October 20, 2039 | $13,742,956 | $14,923,453 |
|
| | | | 14,923,453 |
| U.S. Government Agency Mortgage Obligations (2.8%) | | | |
| Federal National Mortgage Association | | | |
| Pass-Through Certificates | | | |
| 7s, January 1, 2017 | | 13,073 | 14,081 |
| 6s, TBA, May 1, 2040 | | 33,000,000 | 35,232,655 |
|
| | | | 35,246,736 |
| Total U.S. government and agency mortgage obligations (cost $49,844,114) | $50,170,189 |
|
| |
| PURCHASED OPTIONS | Expiration date/ | Contract | |
| OUTSTANDING (0.9%)* | strike price | amount | Value |
|
| Option on an interest rate swap with Barclays | | | |
| Bank PLC for the right to receive a fixed rate | | | |
| of 3.95% versus the three month USD-LIBOR-BBA | | | |
| maturing May 13, 2020. | May-10/3.95 | $63,072,400 | $1,525,721 |
|
| Option on an interest rate swap with Barclays | | | |
| Bank PLC for the right to pay a fixed rate | | | |
| of 3.95% versus the three month USD-LIBOR-BBA | | | |
| maturing May 13, 2020. | May-10/3.95 | 63,072,400 | 17,030 |
|
| Option on an interest rate swap with Barclays | | | |
| Bank PLC for the right to receive a fixed rate | | | |
| of 3.95% versus the three month USD-LIBOR-BBA | | | |
| maturing September 21, 2020. | Sep-10/3.95 | 18,154,900 | 476,566 |
|
| Option on an interest rate swap with Barclays | | | |
| Bank PLC for the right to pay a fixed rate | | | |
| of 3.95% versus the three month USD-LIBOR-BBA | | | |
| maturing September 21, 2020. | Sep-10/3.95 | 18,154,900 | 323,883 |
|
| Option on an interest rate swap with Barclays | | | |
| Bank PLC for the right to receive a fixed rate | | | |
| of 3.7375% versus the three month USD-LIBOR-BBA | | | |
| maturing March 9, 2021. | Mar-11/3.7375 | 32,698,500 | 703,672 |
|
| Option on an interest rate swap with JPMorgan | | | |
| Chase Bank, N.A. for the right to receive a | | | |
| fixed rate of 3.665% versus the three month | | | |
| USD-LIBOR-BBA maturing March 8, 2021. | Mar-11/3.665 | 32,698,500 | 625,522 |
|
| Option on an interest rate swap with JPMorgan | | | |
| Chase Bank, N.A. for the right to receive a | | | |
| fixed rate of 3.885% versus the three month | | | |
| USD-LIBOR-BBA maturing May 19, 2020. | May-10/3.885 | 27,219,100 | 520,701 |
|
| Option on an interest rate swap with JPMorgan | | | |
| Chase Bank, N.A. for the right to pay a fixed | | | |
| rate of 3.885% versus the three month | | | |
| USD-LIBOR-BBA maturing May 19, 2020. | May-10/3.885 | 27,219,100 | 41,373 |
|
| Option on an interest rate swap with JPMorgan | | | |
| Chase Bank, N.A. for the right to receive a | | | |
| fixed rate of 3.885% versus the three month | | | |
| USD-LIBOR-BBA maturing May 12, 2020. | May-10/3.885 | 108,876,400 | 2,059,941 |
|
41
| | | |
| PURCHASED OPTIONS | Expiration date/ | Contract | |
| OUTSTANDING (0.9%)* cont. | strike price | amount | Value |
|
| Option on an interest rate swap with JPMorgan | | | |
| Chase Bank, N.A. for the right to pay a fixed | | | |
| rate of 3.885% versus the three month | | | |
| USD-LIBOR-BBA maturing May 12, 2020. | May-10/3.885 | $108,876,400 | $48,995 |
|
| Option on an interest rate swap with JPMorgan | | | |
| Chase Bank, N.A. for the right to receive a | | | |
| fixed rate of 3.885% versus the three month | | | |
| USD-LIBOR-BBA maturing May 26, 2020. | May-10/3.885 | 27,219,100 | 528,051 |
|
| Option on an interest rate swap with JPMorgan | | | |
| Chase Bank, N.A. for the right to pay a fixed | | | |
| rate of 3.885% versus the three month | | | |
| USD-LIBOR-BBA maturing May 26, 2020. | May-10/3.885 | 27,219,100 | 72,131 |
|
| Option on an interest rate swap with JPMorgan | | | |
| Chase Bank, N.A. for the right to receive a | | | |
| fixed rate of 4.235% versus the three month | | | |
| USD-LIBOR-BBA maturing June 11, 2020. | Jun-10/4.235 | 38,863,000 | 1,776,428 |
|
| Option on an interest rate swap with JPMorgan | | | |
| Chase Bank, N.A. for the right to receive a | | | |
| fixed rate of 4.23% versus the three month | | | |
| USD-LIBOR-BBA maturing June 9, 2020. | Jun-10/4.23 | 38,863,000 | 1,765,935 |
|
| Option on an interest rate swap with JPMorgan | | | |
| Chase Bank, N.A. for the right to receive a | | | |
| fixed rate of 3.995% versus the three month | | | |
| USD-LIBOR-BBA maturing September 20, 2020. | Sep-10/3.995 | 6,562,900 | 186,911 |
|
| Option on an interest rate swap with JPMorgan | | | |
| Chase Bank, N.A. for the right to pay a fixed | | | |
| rate of 3.995% versus the three month | | | |
| USD-LIBOR-BBA maturing September 20, 2020. | Sep-10/3.995 | 6,562,900 | 106,713 |
|
| Option on an interest rate swap with JPMorgan | | | |
| Chase Bank, N.A. for the right to receive a | | | |
| fixed rate of 3.965% versus the three month | | | |
| USD-LIBOR-BBA maturing September 20, 2020. | Sep-10/3.965 | 4,375,200 | 117,780 |
|
| Option on an interest rate swap with JPMorgan | | | |
| Chase Bank, N.A. for the right to pay a fixed | | | |
| rate of 3.965% versus the three month | | | |
| USD-LIBOR-BBA maturing September 20, 2020. | Sep-10/3.965 | 4,375,200 | 75,428 |
|
| Total purchased options outstanding (cost $13,900,275) | | $10,972,781 |
|
| |
| MUNICIPAL BONDS AND NOTES (0.4%)* | | Principal amount | Value |
|
| CA State G.O. Bonds (Build America Bonds), 7 1/2s, 4/1/34 | $770,000 | $845,783 |
|
| IL State G.O. Bonds | | | |
| 4.421s, 1/1/15 | | 410,000 | 416,724 |
| 4.071s, 1/1/14 | | 1,220,000 | 1,236,543 |
|
| MI Tobacco Settlement Fin. Auth. Rev. Bonds, Ser. A, | | | |
| 7.309s, 6/1/34 | | 805,000 | 663,747 |
|
| North TX, Thruway Auth. Rev. Bonds (Build America Bonds), | | |
| 6.718s, 1/1/49 | | 675,000 | 732,713 |
|
| Tobacco Settlement Fin. Auth. of WVA Rev. Bonds, Ser. A, | | |
| 7.467s, 6/1/47 | | 1,990,000 | 1,621,353 |
|
| Total municipal bonds and notes (cost $5,855,868) | | | $5,516,863 |
42
| | | |
| SENIOR LOANS (0.2%)* c | | Principal amount | Value |
|
| First Data Corp. bank term loan FRN Ser. B1, 3.014s, 2014 | | $201,842 | $181,489 |
|
| Harrah’s Operating Co., Inc. bank term loan FRN Ser. B2, | | | |
| 3.316s, 2015 | | 334,037 | 293,442 |
|
| Hawker Beechcraft Acquisition Co., LLC bank term loan FRN | | | |
| 2.29s, 2014 | | 14,203 | 12,144 |
|
| Hawker Beechcraft Acquisition Co., LLC bank term loan FRN | | | |
| Ser. B, 2.259s, 2014 | | 248,731 | 212,665 |
|
| Intelsat Corp. bank term loan FRN Ser. B2, 2.792s, 2011 | | 107,202 | 105,041 |
|
| Intelsat Corp. bank term loan FRN Ser. B2-A, 2.792s, 2013 | | 107,235 | 105,074 |
|
| Intelsat Corp. bank term loan FRN Ser. B2-C, 2.792s, 2013 | | 107,202 | 105,041 |
|
| National Bedding Co. bank term loan FRN 2.313s, 2011 | | 184,705 | 179,510 |
|
| Polypore, Inc. bank term loan FRN Ser. B, 2 1/2s, 2014 | | 395,450 | 383,587 |
|
| Spectrum Brands, Inc. bank term loan FRN 1 1/2s, 2013 | | 26,417 | 26,311 |
|
| Spectrum Brands, Inc. bank term loan FRN Ser. B1, 8s, 2013 | | 380,961 | 379,437 |
|
| SunGard Data Systems, Inc. bank term loan FRN 2.001s, 2014 | | 9,314 | 8,991 |
|
| SunGard Data Systems, Inc. bank term loan FRN Ser. B, 3 7/8s, 2016 | | 192,981 | 191,706 |
|
| Total senior loans (cost $2,128,788) | | | $2,184,438 |
|
| |
| SHORT-TERM INVESTMENTS (47.6%)* | | Principal amount/shares | Value |
|
| Putnam Money Market Liquidity Fund e | | 219,239,867 | $219,239,867 |
|
| Interest in $367,500,000 joint tri-party repurchase agreement | | | |
| dated April 30, 2010 with Deutsche Bank Securities, Inc. due | | | |
| May 3, 2010 — maturity value of $77,001,283 for an effective | | | |
| yield of 0.20% (collateralized by various mortgage backed | | | |
| securities with coupon rates ranging from 4.00% to 7.00% | | | |
| and due dates ranging from April 1, 2024 to May 1, 2038, | | | |
| valued at $374,850,000) | | $77,000,000 | 77,000,000 |
|
| Interest in $350,000,000 joint tri-party repurchase agreement | | | |
| dated April 30, 2010 with Citigroup Global Markets, Inc. due | | | |
| May 3, 2010 — maturity value of $50,000,833 for an effective | | | |
| yield of 0.20% (collateralized by various mortgage backed | | | |
| securities with coupon rates ranging from 2.78% to 6.11% | | | |
| and due dates ranging from March 1, 2022 to September 1, | | | |
| 2044, valued at $357,000,000) | | 50,000,000 | 50,000,000 |
|
| Interest in $385,000,000 joint tri-party repurchase agreement | | | |
| dated April 30, 2010 with Bank of America Securities, Inc. | | | |
| due May 3, 2010 — maturity value of $50,000,833 for an | | | |
| effective yield of 0.20% (collateralized by various mortgage | | | |
| backed securities with coupon rates ranging from 1.58% to | | | |
| 9.41% and due dates ranging from July 1, 2013 to June 1, 2042, | | | |
| valued at $392,700,000) | | 50,000,000 | 50,000,000 |
|
| U.S. Treasury Bills for effective yields ranging from 0.23% | | | |
| to 0.40%, November 18, 2010 # ## | | 57,644,000 | 57,516,203 |
|
| U.S. Treasury Bills for effective yields ranging from 0.18% | | | |
| to 0.26%, August 26, 2010 # ## | | 57,997,000 | 57,962,202 |
|
| U.S. Treasury Cash Management Bills for effective yields | | | |
| ranging from 0.23% to 0.24%, July 15, 2010 ## | | 13,690,000 | 13,680,170 |
|
| Atlantic Asset Sec. Corp., for an effective yield of 0.23%, | | | |
| May 14, 2010 | | 24,000,000 | 23,998,007 |
|
| Federal Home Loan Mortgage Corp., for an effective yield | | | |
| of 0.16%, May 10, 2010 ## | | 25,000,000 | 24,999,000 |
|
43
| | |
| SHORT-TERM INVESTMENTS (47.6%)* cont. | Principal amount/shares | Value |
|
| LMA Americas LLC (Calyon), for an effective yield of 0.27%, | | |
| June 15, 2010 | 8,000,000 | $7,997,300 |
|
| Royal Park Investments Funding Corp., for an effective | | |
| yield of 0.23%, May 7, 2010 | 10,000,000 | 9,999,617 |
|
| Total short-term investments (cost $592,422,028) | | $592,392,366 |
|
| |
| TOTAL INVESTMENTS | | |
|
| Total investments (cost $1,497,145,660) | | $1,564,887,063 |
| |
| Key to holding’s abbreviations |
| EMTN | Euro Medium Term Notes |
| FRB | Floating Rate Bonds |
| FRN | Floating Rate Notes |
| G.O. Bonds | General Obligation Bonds |
| IFB | Inverse Floating Rate Bonds |
| IO | Interest Only |
| MTN | Medium Term Notes |
| MTNA | Medium Term Notes Class A |
| MTNB | Medium Term Notes Class B |
| MTNE | Medium Term Notes Class E |
| PO | Principal Only |
| TBA | To Be Announced Commitments |
Notes to the fund’s portfolio
The Notes to the fund’s portfolio are for the reporting period ended April 30, 2010.
* Percentages indicated are based on net assets of $1,245,524,700.
† Non-income-producing security.
# These securities, in part or in entirety, were pledged and segregated with the broker to cover margin requirements for futures contracts at the close of the reporting period.
## These securities, in part or in entirety, were pledged and segregated with the custodian for collateral on certain derivatives contracts at the close of the reporting period.
c Senior loans are exempt from registration under the Securities Act of 1933, as amended, but contain certain restrictions on resale and cannot be sold publicly. These loans pay interest at rates which adjust periodically. The interest rates shown for senior loans are the current interest rates at the close of the reporting period. Senior loans are also subject to mandatory and/or optional prepayment which cannot be predicted. As a result, the remaining maturity may be substantially less than the stated maturity shown (Notes 1 and 7).
e See Note 6 to the financial statements regarding investments in Putnam Money Market Liquidity Fund.
F Is valued at fair value following procedures approved by the Trustees. Securities may be classified as Level 2 or Level 3 for Accounting Standards Codification ASC 820 Fair Value Measurements and Disclosures (ASC 820) based on the securities valuation inputs.
R Real Estate Investment Trust.
At the close of the reporting period, liquid assets totaling $692,434,709 have been segregated to cover certain derivatives contracts.
Debt obligations are considered secured unless otherwise indicated.
144A after the name of an issuer represents securities exempt from registration under Rule 144A under the Securities Act of 1933, as amended. These securities may be resold in transactions exempt from registration, normally to qualified institutional buyers.
See Note 1 to the financial statements regarding TBA’s.
The rates shown on FRB and FRN are the current interest rates at the close of the reporting period.
44
The dates shown on debt obligations are the original maturity dates.
IFB are securities that pay interest rates that vary inversely to changes in the market interest rates. As interest rates rise, inverse floaters produce less current income. The interest rates shown are the current interest rates at the close of the reporting period.
| | | | | |
| FUTURES CONTRACTS OUTSTANDING at 4/30/10 (Unaudited) | | | |
|
| | | | | | Unrealized |
| | Number of | | | Expiration | appreciation/ |
| | contracts | Value | | date | (depreciation) |
|
| U.S. Treasury Bond 20 yr (Long) | 3,403 | $405,169,688 | | Jun-10 | $9,829,055 |
|
| U.S. Treasury Bond 30 yr (Long) | 63 | 7,813,969 | | Jun-10 | 212,311 |
|
| U.S. Treasury Note 2 yr (Long) | 81 | 17,623,828 | | Jun-10 | 14,965 |
|
| U.S. Treasury Note 5 yr (Short) | 268 | 31,050,313 | | Jun-10 | (211,300) |
|
| U.S. Treasury Note 10 yr (Short) | 46 | 5,423,688 | | Jun-10 | (51,158) |
|
| Total | | | | | $9,793,873 |
| | | |
| | | | |
| WRITTEN OPTIONS OUTSTANDING at 4/30/10 (premiums received $101,075,504) (Unaudited) | |
|
| | Contract | | Expiration date/ | |
| | amount | | strike price | Value |
|
| Option on an interest rate swap with Bank of America, | | | | |
| N.A. for the obligation to receive a fixed rate of 4.70% | | | | |
| versus the three month USD-LIBOR-BBA maturing | | | | |
| August 8, 2021. | $153,193,000 | | Aug-11/4.7 | $4,183,701 |
|
| Option on an interest rate swap with Bank of America, | | | | |
| N.A. for the obligation to pay a fixed rate of 4.70% | | | | |
| versus the three month USD-LIBOR-BBA maturing | | | | |
| August 8, 2021. | 153,193,000 | | Aug-11/4.7 | 9,740,011 |
|
| Option on an interest rate swap with Bank of America, | | | | |
| N.A. for the obligation to receive a fixed rate of 4.55% | | | | |
| versus the three month USD-LIBOR-BBA maturing | | | | |
| August 17, 2021. | 15,331,000 | | Aug-11/4.55 | 499,024 |
|
| Option on an interest rate swap with Bank of America, | | | | |
| N.A. for the obligation to pay a fixed rate of 4.55% | | | | |
| versus the three month USD-LIBOR-BBA maturing | | | | |
| August 17, 2021. | 15,331,000 | | Aug-11/4.55 | 854,397 |
|
| Option on an interest rate swap with Bank of America, | | | | |
| N.A. for the obligation to receive a fixed rate of 4.475% | | | | |
| versus the three month USD-LIBOR-BBA maturing | | | | |
| August 19, 2021. | 23,047,000 | | Aug-11/4.475 | 810,793 |
|
| Option on an interest rate swap with Bank of America, | | | | |
| N.A. for the obligation to pay a fixed rate of 4.475% | | | | |
| versus the three month USD-LIBOR-BBA maturing | | | | |
| August 19, 2021. | 23,047,000 | | Aug-11/4.475 | 1,199,827 |
|
| Option on an interest rate swap with Bank of America, | | | | |
| N.A. for the obligation to receive a fixed rate of 4.72% | | | | |
| versus the three month USD-LIBOR-BBA maturing | | | | |
| January 19, 2022. | 72,092,340 | | Jan-12/4.72 | 2,763,299 |
|
| Option on an interest rate swap with Bank of America, | | | | |
| N.A. for the obligation to pay a fixed rate of 4.72% | | | | |
| versus the three month USD-LIBOR-BBA maturing | | | | |
| January 19, 2022. | 72,092,340 | | Jan-12/4.72 | 4,447,376 |
|
| Option on an interest rate swap with Barclays Bank | | | | |
| PLC for the obligation to pay a fixed rate of 4.02% | | | | |
| versus the three month USD-LIBOR-BBA maturing | | | | |
| September 28, 2020. | 28,270,700 | | Sep-10/4.02 | 848,404 |
|
45
| | | | |
| WRITTEN OPTIONS OUTSTANDING at 4/30/10 (premiums received $101,075,504) (Unaudited) cont. | |
|
| | Contract | | Expiration date/ | |
| | amount | | strike price | Value |
|
| Option on an interest rate swap with Barclays Bank | | | | |
| PLC for the obligation to receive a fixed rate of 4.02% | | | | |
| versus the three month USD-LIBOR-BBA maturing | | | | |
| September 28, 2020. | $28,270,700 | | Sep-10/4.02 | $465,901 |
|
| Option on an interest rate swap with Barclays Bank | | | | |
| PLC for the obligation to receive a fixed rate of 4.7375% | | | | |
| versus the three month USD-LIBOR-BBA maturing | | | | |
| March 9, 2021. | 32,698,500 | | Mar-11/4.7375 | 482,957 |
|
| Option on an interest rate swap with Barclays Bank | | | | |
| PLC for the obligation to pay a fixed rate of 5.36% | | | | |
| versus the three month USD-LIBOR-BBA maturing | | | | |
| February 13, 2025. | 12,614,480 | | Feb-15/5.36 | 996,039 |
|
| Option on an interest rate swap with Barclays Bank | | | | |
| PLC for the obligation to receive a fixed rate of 5.36% | | | | |
| versus the three month USD-LIBOR-BBA maturing | | | | |
| February 13, 2025. | 12,614,480 | | Feb-15/5.36 | 722,557 |
|
| Option on an interest rate swap with Citibank, N.A. | | | | |
| for the obligation to receive a fixed rate of 4.5475% | | | | |
| versus the three month USD-LIBOR-BBA maturing | | | | |
| July 26, 2021. | 22,504,000 | | Jul-11/4.5475 | 688,172 |
|
| Option on an interest rate swap with Citibank, N.A. for | | | | |
| the obligation to pay a fixed rate of 4.5475% versus the | | | | |
| three month USD-LIBOR-BBA maturing July 26, 2021. | 22,504,000 | | Jul-11/4.5475 | 1,261,124 |
|
| Option on an interest rate swap with Citibank, N.A. for | | | | |
| the obligation to receive a fixed rate of 4.52% versus the | | | | |
| three month USD-LIBOR-BBA maturing July 26, 2021. | 45,008,000 | | Jul-11/4.52 | 1,415,052 |
|
| Option on an interest rate swap with Citibank, N.A. for | | | | |
| the obligation to pay a fixed rate of 4.52% versus the | | | | |
| three month USD-LIBOR-BBA maturing July 26, 2021. | 45,008,000 | | Jul-11/4.52 | 2,460,137 |
|
| Option on an interest rate swap with Citibank, N.A. for | | | | |
| the obligation to pay a fixed rate of 4.49% versus the | | | | |
| three month USD-LIBOR-BBA maturing August 17, 2021. | 30,662,000 | | Aug-11/4.49 | 1,619,260 |
|
| Option on an interest rate swap with Citibank, N.A. | | | | |
| for the obligation to receive a fixed rate of 4.49% | | | | |
| versus the three month USD-LIBOR-BBA maturing | | | | |
| August 17, 2021. | 30,662,000 | | Aug-11/4.49 | 1,058,452 |
|
| Option on an interest rate swap with JPMorgan Chase | | | | |
| Bank, N.A. for the obligation to receive a fixed rate | | | | |
| of 4.02% versus the three month USD-LIBOR-BBA | | | | |
| maturing October 14, 2020. | 76,318,900 | | Oct-10/4.02 | 1,432,506 |
|
| Option on an interest rate swap with JPMorgan Chase | | | | |
| Bank, N.A. for the obligation to pay a fixed rate of 4.02% | | | | |
| versus the three month USD-LIBOR-BBA maturing | | | | |
| October 14, 2020. | 76,318,900 | | Oct-10/4.02 | 2,323,147 |
|
| Option on an interest rate swap with JPMorgan Chase | | | | |
| Bank, N.A. for the obligation to receive a fixed rate of | | | | |
| 5.235% versus the three month USD-LIBOR-BBA | | | | |
| maturing June 11, 2020. | 38,863,000 | | Jun-10/5.235 | — |
|
| Option on an interest rate swap with JPMorgan Chase | | | | |
| Bank, N.A. for the obligation to receive a fixed rate of | | | | |
| 5.23% versus the three month USD-LIBOR-BBA | | | | |
| maturing June 9, 2020. | 38,863,000 | | Jun-10/5.23 | — |
|
46
| | | | |
| WRITTEN OPTIONS OUTSTANDING at 4/30/10 (premiums received $101,075,504) (Unaudited) cont. | |
|
| | Contract | | Expiration date/ | |
| | amount | | strike price | Value |
|
| Option on an interest rate swap with JPMorgan Chase | | | | |
| Bank, N.A. for the obligation to receive a fixed rate | | | | |
| of 4.665% versus the three month USD-LIBOR-BBA | | | | |
| maturing March 8, 2021. | $32,698,500 | | Mar-11/4.665 | $526,773 |
|
| Option on an interest rate swap with JPMorgan Chase | | | | |
| Bank, N.A. for the obligation to pay a fixed rate of | | | | |
| 4.525% versus the three month USD-LIBOR-BBA | | | | |
| maturing July 26, 2021. | 47,992,000 | | Jul-11/4.525 | 2,635,241 |
|
| Option on an interest rate swap with JPMorgan Chase | | | | |
| Bank, N.A. for the obligation to receive a fixed rate | | | | |
| of 4.525% versus the three month USD-LIBOR-BBA | | | | |
| maturing July 26, 2021. | 47,992,000 | | Jul-11/4.525 | 1,501,670 |
|
| Option on an interest rate swap with JPMorgan Chase | | | | |
| Bank, N.A. for the obligation to receive a fixed rate | | | | |
| of 4.46% versus the three month USD-LIBOR-BBA | | | | |
| maturing July 26, 2021. | 47,992,000 | | Jul-11/4.46 | 1,602,933 |
|
| Option on an interest rate swap with JPMorgan Chase | | | | |
| Bank, N.A. for the obligation to pay a fixed rate of 4.46% | | | | |
| versus the three month USD-LIBOR-BBA maturing | | | | |
| July 26, 2021. | 47,992,000 | | Jul-11/4.46 | 2,481,666 |
|
| Option on an interest rate swap with JPMorgan Chase | | | | |
| Bank, N.A. for the obligation to receive a fixed rate | | | | |
| of 4.745% versus the three month USD-LIBOR-BBA | | | | |
| maturing July 27, 2021. | 71,988,000 | | Jul-11/4.745 | 1,819,137 |
|
| Option on an interest rate swap with JPMorgan Chase | | | | |
| Bank, N.A. for the obligation to pay a fixed rate of | | | | |
| 4.745% versus the three month USD-LIBOR-BBA | | | | |
| maturing July 27, 2021. | 71,988,000 | | Jul-11/4.745 | 4,779,283 |
|
| Option on an interest rate swap with JPMorgan Chase | | | | |
| Bank, N.A. for the obligation to receive a fixed rate | | | | |
| of 4.80% versus the three month USD-LIBOR-BBA | | | | |
| maturing January 17, 2022. | 120,153,900 | | Jan-12/4.8 | 4,282,285 |
|
| Option on an interest rate swap with JPMorgan Chase | | | | |
| Bank, N.A. for the obligation to pay a fixed rate of 4.80% | | | | |
| versus the three month USD-LIBOR-BBA maturing | | | | |
| January 17, 2022. | 120,153,900 | | Jan-12/4.8 | 7,876,089 |
|
| Option on an interest rate swap with JPMorgan Chase | | | | |
| Bank, N.A. for the obligation to pay a fixed rate of 5.51% | | | | |
| versus the three month USD-LIBOR-BBA maturing | | | | |
| May 14, 2022. | 17,335,500 | | May-12/5.51 | 1,751,024 |
|
| Option on an interest rate swap with JPMorgan Chase | | | | |
| Bank, N.A. for the obligation to receive a fixed rate | | | | |
| of 5.51% versus the three month USD-LIBOR-BBA | | | | |
| maturing May 14, 2022. | 17,335,500 | | May-12/5.51 | 422,012 |
|
| Option on an interest rate swap with JPMorgan Chase | | | | |
| Bank, N.A. for the obligation to receive a fixed rate | | | | |
| of 5.27% versus the three month USD-LIBOR-BBA | | | | |
| maturing February 12, 2025. | 32,662,920 | | Feb-15/5.27 | 1,962,715 |
|
| Option on an interest rate swap with JPMorgan Chase | | | | |
| Bank, N.A. for the obligation to pay a fixed rate of 5.27% | | | | |
| versus the three month USD-LIBOR-BBA maturing | | | | |
| February 12, 2025. | 32,662,920 | | Feb-15/5.27 | 2,468,337 |
|
| Total | | | | $74,381,301 |
47
| | | | | | | |
| TBA SALE COMMITMENTS OUTSTANDING at 4/30/10 (proceeds receivable $35,340,938) (Unaudited) |
|
| | | | | | Principal | Settlement | |
| Agency | | | | | amount | date | Value |
|
| FNMA, 6s, May 1, 2040 | | | | | $33,000,000 | 5/13/10 | $35,232,655 |
|
| Total | | | | | | | $35,232,655 |
|
| |
| INTEREST RATE SWAP CONTRACTS OUTSTANDING at 4/30/10 (Unaudited) | | |
|
| | | Upfront | | | Payments | Payments | Unrealized |
| Swap counterparty / | | premium | Termination | | made by | received by | appreciation/ |
| Notional amount | | received (paid) | date | | fund per annum | fund per annum | (depreciation) |
|
| Bank of America, N.A. | | | | | | | |
| $370,642,500 | | $(1,055,868) | 3/25/20 | | 3 month USD- | | |
| | | | | | LIBOR-BBA | 3.69% | $1,771,613 |
|
| 333,273,800 | | (178,878) | 3/25/30 | | 4.3% | 3 month USD- | |
| | | | | | | LIBOR-BBA | (6,497,280) |
|
| 709,017,000 | | — | 9/10/10 | | 3 month USD- | | |
| | | | | | LIBOR-BBA | 3.22969% | 10,215,619 |
|
| 31,016,000 | | — | 10/26/12 | | 4.6165% | 3 month USD- | |
| | | | | | | LIBOR-BBA | (2,425,058) |
|
| 109,878,000 | | — | 7/22/10 | | 3 month USD- | | |
| | | | | | LIBOR-BBA | 3.5375% | 1,866,973 |
|
| Barclays Bank PLC | | | | | | | |
| 2,226,500 | | 2,899 | 3/5/19 | | 3 month USD- | | |
| | | | | | LIBOR-BBA | 3.53% | 20,159 |
|
| 20,273,100 | E | — | 3/9/21 | | 4.2375% | 3 month USD- | |
| | | | | | | LIBOR-BBA | (274,295) |
|
| 639,813,700 | | 45,692 | 4/16/12 | | 3 month USD- | | |
| | | | | | LIBOR-BBA | 1.18% | 567,206 |
|
| 172,240,900 | | (344,233) | 4/16/16 | | 3.01% | 3 month USD- | |
| | | | | | | LIBOR-BBA | (1,477,165) |
|
| 756,433,100 | | 208,311 | 4/27/11 | | 3 month USD- | | |
| | | | | | LIBOR-BBA | 0.60% | (63,217) |
|
| Credit Suisse International | | | | | |
| 113,842,400 | | (643,507) | 2/22/40 | | 4.58% | 3 month USD- | |
| | | | | | | LIBOR-BBA | (7,283,223) |
|
| 486,922,600 | | 11,629 | 3/19/11 | | 3 month USD- | | |
| | | | | | LIBOR-BBA | 0.5% | (258,536) |
|
| Deutsche Bank AG | | | | | | | |
| 482,629,000 | | (596,485) | 2/3/14 | | 2.25% | 3 month USD- | |
| | | | | | | LIBOR-BBA | (5,735,569) |
|
| 553,947,200 | | (392,527) | 3/16/14 | | 2.25% | 3 month USD- | |
| | | | | | | LIBOR-BBA | (4,061,801) |
|
| 349,707,800 | | 937,977 | 4/26/20 | | 3 month USD- | | |
| | | | | | LIBOR-BBA | 3.72% | 3,163,100 |
|
| 73,603,300 | | 189,620 | 4/26/25 | | 3 month USD- | | |
| | | | | | LIBOR-BBA | 4.15% | 1,073,782 |
|
| 400,662,500 | | 1,337,335 | 4/30/20 | | 3 month USD- | | |
| | | | | | LIBOR-BBA | 3.71% | 3,418,244 |
|
| 284,336,000 | | (758,105) | 1/8/15 | | 2.84% | 3 month USD- | |
| | | | | | | LIBOR-BBA | (7,774,394) |
|
| 125,600,000 | | — | 9/24/10 | | 3 month USD- | | |
| | | | | | LIBOR-BBA | 3.395% | 1,893,014 |
|
48
| | | | | | | |
| INTEREST RATE SWAP CONTRACTS OUTSTANDING at 4/30/10 (Unaudited) cont. | |
|
| | | Upfront | | | Payments | Payments | Unrealized |
| Swap counterparty / | | premium | Termination | | made by | received by | appreciation/ |
| Notional amount | | received (paid) | date | | fund per annum | fund per annum | (depreciation) |
|
| Deutsche Bank AG cont. | | | | | |
| $352,461,000 | | $— | 2/3/14 | | 2.44% | 3 month USD- | |
| | | | | | | LIBOR-BBA | $(6,355,770) |
|
| 492,000,000 | | — | 3/30/14 | | 2.36% | 3 month USD- | |
| | | | | | | LIBOR-BBA | (4,627,533) |
|
| 226,000,000 | | — | 3/30/21 | | 3 month USD- | | |
| | | | | | LIBOR-BBA | 3.125% | (12,530,727) |
|
| 45,660,000 | | — | 10/5/21 | | 3 month USD- | | |
| | | | | | LIBOR-BBA | 3.52057% | (1,139,107) |
|
| Goldman Sachs International | | | | | |
| 120,938,000 | | — | 3/30/40 | | 4.5375% | 3 month USD- | |
| | | | | | | LIBOR-BBA | (5,627,321) |
|
| 462,487,500 | | 1,180,466 | 4/8/15 | | 2.94% | 3 month USD- | |
| | | | | | | LIBOR-BBA | (7,523,520) |
|
| JPMorgan Chase Bank, N.A. | | | | | |
| 20,273,100 | E | — | 3/8/21 | | 4.165% | 3 month USD- | |
| | | | | | | LIBOR-BBA | (154,481) |
|
| 372,165,100 | | (17,426) | 4/12/12 | | 3 month USD- | | |
| | | | | | LIBOR-BBA | 1.19% | 441,412 |
|
| 630,948,200 | | 518,561 | 4/22/12 | | 3 month USD- | | |
| | | | | | LIBOR-BBA | 1.13% | 194,066 |
|
| 178,128,600 | | 1,067,678 | 4/29/15 | | 2.76% | 3 month USD- | |
| | | | | | | LIBOR-BBA | (361,825) |
|
| 27,600,000 | | — | 4/29/15 | | 2.636% | 3 month USD- | |
| | | | | | | LIBOR-BBA | (58,739) |
|
| 20,834,900 | | — | 1/15/13 | | 1.861% | 3 month USD- | |
| | | | | | | LIBOR-BBA | (272,835) |
|
| Total | | | | | | | $(49,877,208) |
E See Note 1 to the financial statements regarding extended effective dates.
| | | | | |
| TOTAL RETURN SWAP CONTRACTS OUTSTANDING at 4/30/10 (Unaudited) | | |
|
| | | | Fixed payments | Total return | Unrealized |
| Swap counterparty / | Termination | | received (paid) by | received by | appreciation/ |
| Notional amount | date | | fund per annum | or paid by fund | (depreciation) |
| Barclays Bank PLC | | | | | |
|
| $997,218 | 1/12/40 | | (4.00%)1 month | Synthetic TRS | $(4,961) |
| | | | USD-LIBOR | Index 4.00% | |
| | | | | 30 year Fannie Mae | |
| | | | | pools | |
|
| 1,980,192 | 1/12/40 | | 4.50% (1 month | Synthetic TRS | 3,731 |
| | | | USD-LIBOR) | Index 4.50% | |
| | | | | 30 year Fannie Mae | |
| | | | | pools | |
|
| 969,608 | 1/12/40 | | (5.00%)1 month | Synthetic TRS | 729 |
| | | | USD-LIBOR | Index 5.00% | |
| | | | | 30 year Fannie Mae | |
| | | | | pools | |
|
49
| | | | | |
| TOTAL RETURN SWAP CONTRACTS OUTSTANDING at 4/30/10 (Unaudited) cont. | |
|
| | | | Fixed payments | Total return | Unrealized |
| Swap counterparty / | Termination | | received (paid) by | received by | appreciation/ |
| Notional amount | date | | fund per annum | or paid by fund | (depreciation) |
|
| Deutsche Bank AG | | | | | |
| $997,218 | 1/12/40 | | 4.00% (1 month | Synthetic TRS | $4,948 |
| | | | USD-LIBOR) | Index 4.00% | |
| | | | | 30 year Fannie Mae | |
| | | | | pools | |
|
| 1,980,192 | 1/12/40 | | (4.50%)1 month | Synthetic TRS | (4,209) |
| | | | USD-LIBOR | Index 4.50% | |
| | | | | 30 year Fannie Mae | |
| | | | | pools | |
|
| 969,608 | 1/12/40 | | 5.00% (1 month | Synthetic TRS | (806) |
| | | | USD-LIBOR) | Index 5.00% | |
| | | | | 30 year Fannie Mae | |
| | | | | pools | |
|
| Total | | | | | $(568) |
| | | |
| | | | | | | |
| CREDIT DEFAULT CONTRACTS OUTSTANDING at 4/30/10 (Unaudited) | | |
|
| | | Upfront | | | | Fixed payments | |
| | | premium | | | Termi- | received | Unrealized |
| Swap counterparty / | | received | Notional | | nation | (paid) by fund | appreciation/ |
| Referenced debt* | Rating*** | (paid)** | amount | | date | per annum | (depreciation) |
|
| Bank of America, N.A. | | | | | | | |
| Financial Security | | | | | | | |
| Assurance Holdings, | | | | | | | |
| Ltd, 6.4%, 12/15/66 | Baa1 | $— | $440,000 | | 12/20/12 | 95 bp | $(9,695) |
|
| Credit Suisse International | | | | | | |
| General Electric | | | | | | | |
| Capital Corp., | | | | | | | |
| 5 5/8%, 9/15/17 | Aa2 | — | 3,610,000 | | 12/20/13 | 530 bp | 544,566 |
|
| Deutsche Bank AG | | | | | | | |
| General Electric | | | | | | | |
| Capital Corp., 6%, | | | | | | | |
| 6/15/12 | Aa2 | — | 3,150,000 | | 9/20/13 | 109 bp | (507) |
|
| Total | | | | | | | $534,364 |
* Payments related to the referenced debt are made upon a credit default event.
** Upfront premium is based on the difference between the original spread on issue and the market spread on day of execution.
*** Ratings are presented for credit default contracts in which the fund has sold protection on the underlying referenced debt. Ratings for an underlying index represent the average of the ratings of all the securities included in that index. The Moody’s, Standard & Poor’s or Fitch ratings are believed to be the most recent ratings available at April 30, 2010. Securities rated by Putnam are indicated by “/P.” Securities rated by Fitch are indicated by “/F.”
50
ASC 820 establishes a three-level hierarchy for disclosure of fair value measurements. The valuation hierarchy is based upon the transparency of inputs to the valuation of the fund’s investments. The three levels are defined as follows:
Level 1 — Valuations based on quoted prices for identical securities in active markets.
Level 2 — Valuations based on quoted prices in markets that are not active or for which all significant inputs are observable, either directly or indirectly.
Level 3 — Valuations based on inputs that are unobservable and significant to the fair value measurement.
The following is a summary of the inputs used to value the fund’s net assets as of the close of the reporting period:
| | | |
| | | Valuation inputs | |
|
| Investments in securities: | Level 1 | Level 2 | Level 3 |
|
| Asset-backed securities | $— | $74,293,629 | $— |
|
| Corporate bonds and notes | — | 284,136,732 | — |
|
| Mortgage-backed securities | — | 542,231,770 | 2,988,295 |
|
| Municipal bonds and notes | — | 5,516,863 | — |
|
| Purchased options outstanding | — | 10,972,781 | — |
|
| Senior loans | — | 2,184,438 | — |
|
| U.S. Government and agency mortgage obligations | — | 50,170,189 | — |
|
| Short-term investments | 219,239,867 | 373,152,499 | — |
|
| Totals by level | $219,239,867 | $1,342,658,901 | $2,988,295 |
| | |
| | | Valuation inputs | |
|
| Other financial instruments: | Level 1 | Level 2 | Level 3 |
|
| Futures contracts | $9,793,873 | $— | $— |
|
| Written options | — | (74,381,301) | — |
|
| TBA sale commitments | — | (35,232,655) | — |
|
| Receivable purchase agreement | — | — | (916,583) |
|
| Interest rate swap contracts | — | (51,390,347) | — |
|
| Total return swap contracts | — | (568) | — |
|
| Credit default contracts | — | 534,364 | — |
|
| Totals by level | $9,793,873 | $(160,470,507) | $(916,583) |
At the start and close of the reporting period, Level 3 investments in securities/other financial investments are not considered a significant portion of the fund’s portfolio.
The accompanying notes are an integral part of these financial statements.
| |
| Statement of assets and liabilities 4/30/10 (Unaudited) | |
|
| |
| ASSETS | |
|
| Investment in securities, at value (Note 1): | |
| Unaffiliated issuers (identified cost $1,100,905,793) | $1,168,647,196 |
| Affiliated issuers (identified cost $219,239,867) (Note 6) | 219,239,867 |
|
| Repurchase agreements, at value (Note 1) | 177,000,000 |
|
| Interest and other receivables | 11,462,682 |
|
| Receivable for shares of the fund sold | 7,131,713 |
|
| Receivable for investments sold | 73,871,591 |
|
| Receivable for sales of delayed delivery securities (Note 1) | 35,406,938 |
|
| Unrealized appreciation on swap contracts (Note 1) | 25,179,162 |
|
| Receivable for variation margin (Note 1) | 2,863,594 |
|
| Premium paid on swap contracts (Note 1) | 3,987,029 |
|
| Total assets | 1,724,789,772 |
|
| |
| LIABILITIES | |
|
| Payable to custodian (Note 2) | 1,833,624 |
|
| Payable for investments purchased | 244,373,777 |
|
| Payable for purchases of delayed delivery securities (Note 1) | 35,350,219 |
|
| Payable for shares of the fund repurchased | 1,015,214 |
|
| Payable for compensation of Manager (Note 2) | 403,636 |
|
| Payable for investor servicing fees (Note 2) | 153,226 |
|
| Payable for custodian fees (Note 2) | 16,061 |
|
| Payable for Trustee compensation and expenses (Note 2) | 259,062 |
|
| Payable for administrative services (Note 2) | 3,718 |
|
| Payable for distribution fees (Note 2) | 338,325 |
|
| Payable for receivable purchase agreement (Note 2) | 916,583 |
|
| Interest payable (Note 2) | 4,794,289 |
|
| Written options outstanding, at value (premiums received $101,075,504) (Notes 1 and 3) | 74,381,301 |
|
| Premium received on swap contracts (Note 1) | 5,500,168 |
|
| Unrealized depreciation on swap contracts (Note 1) | 74,522,574 |
|
| TBA sales commitments, at value (proceeds receivable $35,340,938) (Note 1) | 35,232,655 |
|
| Other accrued expenses | 170,640 |
|
| Total liabilities | 479,265,072 |
| |
| Net assets | $1,245,524,700 |
|
| REPRESENTED BY | |
|
| Paid-in capital (Unlimited shares authorized) (Notes 1 and 4) | $1,419,514,801 |
|
| Undistributed net investment income (Note 1) | 4,051,445 |
|
| Accumulated net realized loss on investments (Note 1) | (232,119,313) |
|
| Net unrealized appreciation of investments | 54,077,767 |
|
| Total — Representing net assets applicable to capital shares outstanding | $1,245,524,700 |
| |
| (Continued on next page) | |
52
| |
| Statement of assets and liabilities (Continued) | |
|
| |
| COMPUTATION OF NET ASSET VALUE AND OFFERING PRICE | |
|
| Net asset value and redemption price per class A share | |
| ($767,031,456 divided by 112,269,780 shares) | $6.83 |
|
| Offering price per class A share (100/96.00 of $6.83)* | $7.11 |
|
| Net asset value and offering price per class B share ($40,863,785 divided by 6,026,344 shares)** | $6.78 |
|
| Net asset value and offering price per class C share ($85,569,232 divided by 12,590,358 shares)** | $6.80 |
|
| Net asset value and redemption price per class M share ($200,288,120 divided by 29,813,679 shares) | $6.72 |
|
| Offering price per class M share (100/96.75 of $6.72)*** | $6.95 |
|
| Net asset value, offering price and redemption price per class R share | |
| ($2,744,437 divided by 403,230 shares) | $6.81 |
|
| Net asset value, offering price and redemption price per class Y share | |
| ($149,027,670 divided by 21,604,097 shares) | $6.90 |
|
|
| * On single retail sales of less than $100,000. On sales of $100,000 or more the offering price is reduced. |
| |
| ** Redemption price per share is equal to net asset value less any applicable contingent deferred sales charge. |
| |
| *** On single retail sales of less than $50,000. On sales of $50,000 or more the offering price is reduced. |
The accompanying notes are an integral part of these financial statements.
53
| |
| Statement of operations Six months ended 4/30/10 (Unaudited) | |
|
| |
| INVESTMENT INCOME | |
|
| Interest (including interest income of $274,791 from investments in affiliated issuers) (Note 6) | $50,725,384 |
|
| Total investment income | 50,725,384 |
|
| |
| EXPENSES | |
|
| Compensation of Manager (Note 2) | 2,719,421 |
|
| Investor servicing fees (Note 2) | 925,083 |
|
| Custodian fees (Note 2) | 32,102 |
|
| Trustee compensation and expenses (Note 2) | 43,935 |
|
| Administrative services (Note 2) | 32,531 |
|
| Distribution fees — Class A (Note 2) | 883,442 |
|
| Distribution fees — Class B (Note 2) | 214,115 |
|
| Distribution fees — Class C (Note 2) | 293,909 |
|
| Distribution fees — Class M (Note 2) | 488,985 |
|
| Distribution fees — Class R (Note 2) | 6,008 |
|
| Other | 467,525 |
|
| Fees waived and reimbursed by Manager (Note 2) | (342,302) |
|
| Total expenses | 5,764,754 |
| | |
| Expense reduction (Note 2) | (2,534) |
|
| Interest expense (Note 2) | (2,327,838) |
|
| Net expenses | 3,434,382 |
| |
| Net investment income | 47,291,002 |
|
| |
| Net realized gain on investments (Notes 1 and 3) | 13,603,517 |
|
| Net realized loss on swap contracts (Note 1) | (9,079,690) |
|
| Net realized loss on futures contracts (Note 1) | (5,224,498) |
|
| Net realized gain on written options (Notes 1 and 3) | 21,826,377 |
|
| Net unrealized appreciation of investments, futures contracts, swap contracts, | |
| written options, receivable purchase agreement and TBA sale commitments during the period | 12,198,343 |
|
| Net gain on investments | 33,324,049 |
| |
| Net increase in net assets resulting from operations | $80,615,051 |
|
The accompanying notes are an integral part of these financial statements.
54
| | |
| Statement of changes in net assets | | |
|
| |
| INCREASE (DECREASE) IN NET ASSETS | Six months ended 4/30/10* | Year ended 10/31/09 |
|
| Operations: | | |
| Net investment income | $47,291,002 | $51,679,467 |
|
| Net realized gain (loss) on investments | 21,125,706 | (195,590,584) |
|
| Net unrealized appreciation of investments | 12,198,343 | 341,106,027 |
|
| Net increase in net assets resulting from operations | 80,615,051 | 197,194,910 |
|
| Distributions to shareholders (Note 1): | | |
| From ordinary income | | |
| Net investment income | | |
|
| Class A | (25,605,639) | (43,422,739) |
|
| Class B | (1,377,651) | (3,562,131) |
|
| Class C | (1,971,475) | (1,755,323) |
|
| Class M | (7,000,133) | (14,019,078) |
|
| Class R | (85,012) | (143,763) |
|
| Class Y | (5,775,695) | (19,479,382) |
|
| Redemption fees (Note 1) | 2,957 | 4,345 |
|
| Increase in capital from settlement payments | 41,451 | — |
|
| Increase (decrease) from capital share transactions (Note 4) | 26,769,434 | (505,166,663) |
|
| Total increase (decrease) in net assets | 65,613,288 | (390,349,824) |
| |
| NET ASSETS | | |
|
| Beginning of period | 1,179,911,412 | 1,570,261,236 |
|
| End of period (including undistributed net investment income | | |
| of $4,051,445 and distributions in excess of net investment income | |
| of $1,423,952, respectively) | $1,245,524,700 | $1,179,911,412 |
|
* Unaudited
The accompanying notes are an integral part of these financial statements.
55
Financial highlights (For a common share outstanding throughout the period)
| | | | | | | | | | | | | | | |
| INVESTMENT OPERATIONS: | | | | LESS DISTRIBUTIONS: | | | | | | RATIOS AND SUPPLEMENTAL DATA: | |
|
| | | | | | | | | | | | | | Ratio | | |
| | | | | | | | | | | | | | of expenses | Ratio of net | |
| | | | Net realized | | | | | | | | | Ratio | to average | investment | |
| | Net asset | Net | and | | | | | | | | | of expenses | net assets, | income (loss) | |
| | value, | investment | unrealized | Total from | From net | | | Non-recurring | Net asset | Total return at | Net assets, | to average | excluding | to average | |
| | beginning | income | gain (loss) on | investment | investment | Total | Redemption | reimburse- | value, end | net asset | end of period | net assets | interest | net assets | Portfolio |
| Period ended | of period | (loss) a | investments | operations | income | distributions | fees b | ments | of period | value (%) c | (in thousands) | (%) d,e | expense (%) d,e | (%) d | turnover (%) f |
|
| Class A | | | | | | | | | | | | | | | |
| April 30, 2010 ** | $6.61 | .27 | .19 | .46 | (.24) | (.24) | — | — i | $6.83 | 7.11 * | $767,031 | .45 * j | .45 * j | 4.03 * | 46.06 * |
| October 31, 2009 | 5.35 | .29 | 1.44 | 1.73 | (.47) | (.47) | — | — | 6.61 | 34.44 | 667,144 | 1.68 g | .96 | 5.12 | 331.48 |
| October 31, 2008 | 6.77 | .38 | (1.34) | (.96) | (.46) | (.46) | — | — | 5.35 | (15.13) | 537,220 | .99 | .99 | 5.91 | 200.36 |
| October 31, 2007 | 6.74 | .31 | .04 | .35 | (.32) | (.32) | — | — | 6.77 | 5.35 | 768,016 | .98 | .98 | 4.67 | 322.90 |
| October 31, 2006 | 6.73 | .27 h | .03 | .30 | (.29) | (.29) | — | — | 6.74 | 4.53 | 791,970 | .95 h | .95 h | 4.07 h | 238.67 |
| October 31, 2005 | 6.87 | .23 | (.16) | .07 | (.21) | (.21) | — | — | 6.73 | 1.05 | 872,931 | .98 | .98 | 3.42 | 300.04 |
|
| Class B | | | | | | | | | | | | | | | |
| April 30, 2010 ** | $6.56 | .25 | .19 | .44 | (.22) | (.22) | — | — i | $6.78 | 6.75 * | $40,864 | .82 * j | .82 * j | 3.69 * | 46.06 * |
| October 31, 2009 | 5.32 | .24 | 1.43 | 1.67 | (.43) | (.43) | — | — | 6.56 | 33.21 | 45,772 | 2.43 g | 1.71 | 4.31 | 331.48 |
| October 31, 2008 | 6.72 | .34 | (1.33) | (.99) | (.41) | (.41) | — | — | 5.32 | (15.58) | 57,171 | 1.74 | 1.74 | 5.22 | 200.36 |
| October 31, 2007 | 6.70 | .26 | .03 | .29 | (.27) | (.27) | — | — | 6.72 | 4.43 | 110,495 | 1.73 | 1.73 | 3.96 | 322.90 |
| October 31, 2006 | 6.68 | .22 h | .04 | .26 | (.24) | (.24) | — | — | 6.70 | 3.92 | 154,775 | 1.70 h | 1.70 h | 3.37 h | 238.67 |
| October 31, 2005 | 6.82 | .18 | (.16) | .02 | (.16) | (.16) | — | — | 6.68 | .28 | 229,794 | 1.73 | 1.73 | 2.64 | 300.04 |
|
| Class C | | | | | | | | | | | | | | | |
| April 30, 2010 ** | $6.58 | .24 | .20 | .44 | (.22) | (.22) | — | — i | $6.80 | 6.76 * | $85,569 | .82 * j | .82 * j | 3.58 * | 46.06 * |
| October 31, 2009 | 5.33 | .26 | 1.42 | 1.68 | (.43) | (.43) | — | — | 6.58 | 33.40 | 43,310 | 2.43 g | 1.71 | 4.45 | 331.48 |
| October 31, 2008 | 6.74 | .33 | (1.33) | (1.00) | (.41) | (.41) | — | — | 5.33 | (15.67) | 16,414 | 1.74 | 1.74 | 5.16 | 200.36 |
| October 31, 2007 | 6.72 | .26 | .03 | .29 | (.27) | (.27) | — | — | 6.74 | 4.41 | 20,396 | 1.73 | 1.73 | 3.93 | 322.90 |
| October 31, 2006 | 6.70 | .22 h | .04 | .26 | (.24) | (.24) | — | — | 6.72 | 3.92 | 21,736 | 1.70 h | 1.70 h | 3.33 h | 238.67 |
| October 31, 2005 | 6.84 | .18 | (.16) | .02 | (.16) | (.16) | — | — | 6.70 | .28 | 24,644 | 1.73 | 1.73 | 2.66 | 300.04 |
|
| Class M | | | | | | | | | | | | | | | |
| April 30, 2010 ** | $6.50 | .26 | .20 | .46 | (.24) | (.24) | — | — i | $6.72 | 7.12 * | $200,288 | .58 * j | .58 * j | 3.92 * | 46.06 * |
| October 31, 2009 | 5.28 | .27 | 1.41 | 1.68 | (.46) | (.46) | — | — | 6.50 | 33.82 | 194,199 | 1.93 g | 1.21 | 4.83 | 331.48 |
| October 31, 2008 | 6.68 | .36 | (1.31) | (.95) | (.45) | (.45) | — | — | 5.28 | (15.19) | 167,743 | 1.24 | 1.24 | 5.67 | 200.36 |
| October 31, 2007 | 6.67 | .30 | .02 | .32 | (.31) | (.31) | — | — | 6.68 | 4.86 | 253,457 | 1.23 | 1.23 | 4.45 | 322.90 |
| October 31, 2006 | 6.66 | .25 h | .03 | .28 | (.27) | (.27) | — | — | 6.67 | 4.38 | 331,997 | 1.20 h | 1.20 h | 3.85 h | 238.67 |
| October 31, 2005 | 6.80 | .21 | (.15) | .06 | (.20) | (.20) | — | — | 6.66 | .84 | 420,886 | 1.23 | 1.23 | 3.15 | 300.04 |
|
| Class R | | | | | | | | | | | | | | | |
| April 30, 2010 ** | $6.59 | .26 | .20 | .46 | (.24) | (.24) | — | — i | $6.81 | 7.02 * | $2,744 | .58 * j | .58 * j | 3.89 * | 46.06 * |
| October 31, 2009 | 5.34 | .27 | 1.44 | 1.71 | (.46) | (.46) | — | — | 6.59 | 34.02 | 2,353 | 1.93 g | 1.21 | 4.85 | 331.48 |
| October 31, 2008 | 6.76 | .36 | (1.33) | (.97) | (.45) | (.45) | — | — | 5.34 | (15.30) | 1,448 | 1.24 | 1.24 | 5.54 | 200.36 |
| October 31, 2007 | 6.74 | .30 | .03 | .33 | (.31) | (.31) | — | — | 6.76 | 4.98 | 1,062 | 1.23 | 1.23 | 4.38 | 322.90 |
| October 31, 2006 | 6.72 | .25 h | .04 | .29 | (.27) | (.27) | — | — | 6.74 | 4.50 | 755 | 1.20 h | 1.20 h | 3.70 h | 238.67 |
| October 31, 2005 | 6.87 | .23 | (.18) | .05 | (.20) | (.20) | — | — | 6.72 | .72 | 400 | 1.23 | 1.23 | 3.29 | 300.04 |
|
| Class Y | | | | | | | | | | | | | | | |
| April 30, 2010 ** | $6.67 | .28 | .20 | .48 | (.25) | (.25) | — | — i | $6.90 | 7.31 * | $149,028 | .33 * j | .33 * j | 4.20 * | 46.06 * |
| October 31, 2009 | 5.40 | .32 | 1.43 | 1.75 | (.48) | (.48) | — | — | 6.67 | 34.59 | 227,134 | 1.43 g | .71 | 5.87 | 331.48 |
| October 31, 2008 | 6.82 | .40 | (1.35) | (.95) | (.47) | (.47) | — | — | 5.40 | (14.85) | 790,264 | .74 | .74 | 6.14 | 200.36 |
| October 31, 2007 | 6.79 | .33 | .04 | .37 | (.34) | (.34) | — | — | 6.82 | 5.54 | 1,126,527 | .73 | .73 | 4.93 | 322.90 |
| October 31, 2006 | 6.77 | .29 h | .03 | .32 | (.30) | (.30) | — | — | 6.79 | 4.89 | 1,193,654 | .70 h | .70 h | 4.30 h | 238.67 |
| October 31, 2005 | 6.91 | .25 | (.16) | .09 | (.23) | (.23) | — | — | 6.77 | 1.28 | 1,029,647 | .73 | .73 | 3.69 | 300.04 |
|
See notes to financial highlights at the end of this section.
The accompanying notes are an integral part of these financial statements.
Financial highlights (Continued)
* Not annualized.
** Unaudited.
a Per share net investment income has been determined on the basis of the weighted average number of shares outstanding during the period.
b Amount represents less than $0.01 per share.
c Total return assumes dividend reinvestment and does not reflect the effect of sales charges.
d Reflects an involuntary contractual expense limitation in effect during the period. For periods prior to October 31, 2009, certain fund expenses were waived in connection with the fund’s investment in Putnam Prime Money Market Fund. As a result of such limitation and/or waivers, the expenses of each class reflect a reduction of the following amounts (Note 2):
| |
| | Percentage of |
| | average net assets |
|
| April 30, 2010 | 0.03% |
|
| October 31, 2009 | 0.19 |
|
| October 31, 2008 | 0.09 |
|
| October 31, 2007 | 0.08 |
|
| October 31, 2006 | 0.05 |
|
| October 31, 2005 | 0.03 |
|
e Includes amounts paid through expense offset arrangements (Note 2).
f Portfolio turnover excludes dollar roll transactions.
g Includes interest accrued in connection with certain terminated derivatives contracts, which amounted to 0.72% of average net assets as of October 31, 2009 (Note 2).
h Reflects a non-recurring reimbursement to the fund from Putnam Investments relating to the calculation of certain amounts paid by the fund to Putnam in previous years for transfer agent services, which amounted to less than $0.01 per share and 0.03% of average net assets for the period ended October 31, 2006.
i Reflects a non-recurring reimbursement pursuant to a settlement between the Securities and Exchange Commission (the “SEC”) and Prudential Securities, Inc., which amounted to less than $0.01 per share outstanding as of March 30, 2010.
j Excludes the impact of a current period revision to interest expense related to the resolution of certain terminated derivatives contracts, which amounted to 0.20% of average net assets as of April 30, 2010 (Note 2).
The accompanying notes are an integral part of these financial statements.
Notes to financial statements 4/30/10 (Unaudited)
Note 1: Significant accounting policies
Putnam Income Fund (the fund), a Massachusetts business trust, which is registered under the Investment Company Act of 1940, as amended, as a diversified open-end management investment company. The fund seeks high current income consistent with what Putnam Investment Management, LLC (Putnam Management), the fund’s manager, an indirect wholly-owned subsidiary of Putnam Investments, LLC, believes to be prudent risk. The fund invests in a portfolio of debt securities, both government and corporate obligations, and may invest in preferred stocks and common stocks. The fund may invest a significant portion of their assets in securitized debt instruments, including mortgage-backed and asset-backed investments. The yields and values of these investments are sensitive to changes in interest rates, the rate of principal payments on the underlying assets and the market’s perception of the issuers. The market for these investments may be volatile an d limited, which may make them difficult to buy or sell.
The fund offers class A, class B, class C, class M, class R and class Y shares. Class A and class M shares are sold with a maximum front-end sales charge of 4.00% and 3.25%, respectively, and generally do not pay a contingent deferred sales charge. Class B shares, which convert to class A shares after approximately eight years, do not pay a front-end sales charge and are subject to a contingent deferred sales charge, if those shares are redeemed within six years of purchase. Class C shares have a one-year 1.00% contingent deferred sales charge and do not convert to class A shares. Class R shares, which are offered to qualified employee-benefit plans, are sold at net asset value. The expenses for class A, class B, class C, class M and class R shares may differ based on the distribution fee of each class, which is identi-fied in Note 2. Class Y shares, which are sold at net asset value, are generally subject to the same expenses as class A, class B, class C, class M and class R shares, but do not bear a distribution fee. Class Y shares are generally only available to corporate and institutional clients and clients in other approved programs.
A 1.00% redemption fee may apply on any shares that are redeemed (either by selling or exchanging into another fund) within 7 days of purchase. The redemption fee is accounted for as an addition to paid-in-capital.
Investment income, realized and unrealized gains and losses and expenses of the fund are borne pro-rata based on the relative net assets of each class to the total net assets of the fund, except that each class bears expenses unique to that class (including the distribution fees applicable to such classes). Each class votes as a class only with respect to its own distribution plan or other matters on which a class vote is required by law or determined by the Trustees. If the fund were liquidated, shares of each class would receive their pro-rata share of the net assets of the fund. In addition, the Trustees declare separate dividends on each class of shares.
In the normal course of business, the fund enters into contracts that may include agreements to indemnify another party under given circumstances. The fund’s maximum exposure under these arrangements is unknown as this would involve future claims that may be, but have not yet been, made against the fund. However, the fund’s management team expects the risk of material loss to be remote.
The following is a summary of significant accounting policies consistently followed by the fund in the preparation of its financial statements. The preparation of financial statements is in conformity with accounting principles generally accepted in the United States of America and requires management to make estimates and assumptions that affect the reported amounts of assets and liabilities in the financial statements and the reported amounts of increases and decreases in net assets from operations during the period from November 1, 2009 through April 30, 2010 (the reporting period). Actual results could differ from those estimates. Subsequent events after the Statement of assets and liabilities date through the date that the financial statements were issued, June 10, 2010, have been evaluated in the preparation of the financial statements.
A) Security valuation Market quotations are not considered to be readily available for certain debt obligations; such investments are valued on the basis of valuations furnished by an independent pricing service approved by the Trustees or dealers selected by Putnam Management. Such services or dealers determine valuations for normal institutional-size trading units of such securities using methods based on market transactions for comparable securities and various relationships, generally recognized by institutional traders, between securities (which considers such factors as security prices, yields, maturities and ratings). Securities quoted in foreign currencies, if any, are translated into U.S. dollars at the current exchange rate. To the extent a pricing service or dealer is unable to value a security or provides a valuation that Putnam Management does not believe accurately reflects the security� 6;s fair value, the security will be valued at fair value by Putnam Management. Certain investments, including certain restricted and
59
illiquid securities and derivatives, are also valued at fair value following procedures approved by the Trustees. Such valuations and procedures are reviewed periodically by the Trustees. Certain securities may be valued on the basis of a price provided by a single source. The fair value of securities is generally determined as the amount that the fund could reasonably expect to realize from an orderly disposition of such securities over a reasonable period of time. By its nature, a fair value price is a good faith estimate of the value of a security in a current sale and does not reflect an actual market price, which may be different by a material amount.
B) Joint trading account Pursuant to an exemptive order from the Securities and Exchange Commission (the SEC), the fund may transfer uninvested cash balances, including cash collateral received under security lending arrangements, into a joint trading account along with the cash of other registered investment companies and certain other accounts managed by Putnam Management. These balances may be invested in issues of short-term investments having maturities of up to 397 days for collateral received under security lending arrangements and up to 90 days for other cash investments.
C) Repurchase agreements The fund, or any joint trading account, through its custodian, receives delivery of the underlying securities, the market value of which at the time of purchase is required to be in an amount at least equal to the resale price, including accrued interest. Collateral for certain tri-party repurchase agreements is held at the counterparty’s custodian in a segregated account for the benefit of the fund and the counterparty. Putnam Management is responsible for determining that the value of these underlying securities is at all times at least equal to the resale price, including accrued interest. In the event of default or bankruptcy by the other party to the agreement, retention of the collateral may be subject to legal proceedings.
D) Security transactions and related investment income Security transactions are recorded on the trade date (the date the order to buy or sell is executed). Gains or losses on securities sold are determined on the identified cost basis.
Interest income is recorded on the accrual basis. All premiums/discounts are amortized/accreted on a yield-to-maturity basis.
Securities purchased or sold on a delayed delivery basis may be settled a month or more after the trade date; interest income is accrued based on the terms of the securities. Losses may arise due to changes in the market value of the underlying securities or if the counterparty does not perform under the contract.
The fund earned certain fees in connection with its senior loan purchasing activities. These fees are treated as market discount and are amortized into income in the Statement of operations.
E) Stripped securities The fund may invest in stripped securities which represent a participation in securities that may be structured in classes with rights to receive different portions of the interest and principal. Interest-only securities receive all of the interest and principal-only securities receive all of the principal. If the interest-only securities experience greater than anticipated prepayments of principal, the fund may fail to recoup fully its initial investment in these securities. Conversely, principal-only securities increase in value if prepayments are greater than anticipated and decline if prepayments are slower than anticipated. The market value of these securities is highly sensitive to changes in interest rates.
F) Futures and options contracts The fund may use futures and options contracts to hedge against changes in the values of securities the fund owns, owned or expects to purchase, or for other investment purposes. The fund may also write options on swaps or securities it owns or in which it may invest to increase its current returns.
The potential risk to the fund is that the change in value of futures and options contracts may not correspond to the change in value of the hedged instruments. In addition, losses may arise from changes in the value of the underlying instruments, if there is an illiquid secondary market for the contracts, if interest or exchange rates move unexpectedly or if the counterparty to the contract is unable to perform. With futures, there is minimal counterparty credit risk to the fund since futures are exchange traded and the exchange’s clearinghouse, as counterparty to all exchange traded futures, guarantees the futures against default. Risks may exceed amounts recognized on the Statement of assets and liabilities. When the contract is closed, the fund records a realized gain or loss equal to the difference between the value of the contract at the time it was opened and the value at the time it was closed. Realized gains and losses on purchased option s are included in realized gains and losses on investment securities. If a written call option is exercised, the premium originally received is recorded as an addition to sales proceeds. If a written put option is exercised, the premium originally received is recorded as a reduction to the cost of investments.
Futures contracts are valued at the quoted daily settlement prices established by the exchange on which they trade. The fund and the broker agree to exchange an amount of cash equal to the daily fluctuation in the value of the futures contract. Such receipts or payments are known as “variation margin.” Exchange traded options are
60
valued at the last sale price or, if no sales are reported, the last bid price for purchased options and the last ask price for written options. Options traded over-the-counter are valued using prices supplied by dealers. Futures and written option contracts outstanding at period end, if any, are listed after the fund’s portfolio. Outstanding contracts on futures contracts at the close of the reporting period are indicative of the volume of activity during the period. The fund had an average contract amount of approximately $495,600,000 on purchased options contracts for the reporting period. See Note 3 for the volume of written options contracts activity for the reporting period.
G) Total return swap contracts The fund may enter into total return swap contracts, which are arrangements to exchange a market linked return for a periodic payment, both based on a notional principal amount to help enhance the funds return and manage the fund’s exposure to credit risk. To the extent that the total return of the security, index or other financial measure underlying the transaction exceeds or falls short of the offsetting interest rate obligation, the fund will receive a payment from or make a payment to the counterparty. Total return swap contracts are marked to market daily based upon quotations from market makers and the change, if any, is recorded as an unrealized gain or loss. Payments received or made are recorded as realized gains or losses. Certain total return swap contracts may include extended effective dates. Payments related to these swap contracts are accrued based on the ter ms of the contract. The fund could be exposed to credit or market risk due to unfavorable changes in the fluctuation of interest rates or in the price of the underlying security or index, the possibility that there is no liquid market for these agreements or that the counterparty may default on its obligation to perform. The fund’s maximum risk of loss from counterparty risk, is the fair value of the contract. This risk may be mitigated by having a master netting arrangement between the fund and the counterparty. Risk of loss may exceed amounts recognized on the Statement of assets and liabilities. Total return swap contracts outstanding at period end, if any, are listed after the fund’s portfolio. The fund had an average notional amount of approximately $3,400,000 on total return swap contracts for the reporting period.
H) Interest rate swap contracts The fund may enter into interest rate swap contracts, which are arrangements between two parties to exchange cash flows based on a notional principal amount, to manage the fund’s exposure to interest rates. An interest rate swap can be purchased or sold with an upfront premium. An upfront payment received by the fund is recorded as a liability on the fund’s books. An upfront payment made by the fund is recorded as an asset on the fund’s books. Interest rate swap contracts are marked to market daily based upon quotations from an independent pricing service or market makers and the change, if any, is recorded as an unrealized gain or loss. Payments received or made are recorded as realized gains or losses. Certain interest rate swap contracts may include extended effective dates. Payments related to these swap contracts are accrued based on the terms of the contract . The fund could be exposed to credit or market risk due to unfavorable changes in the fluctuation of interest rates or if the counterparty defaults on its obligation to perform. The fund’s maximum risk of loss from counterparty risk, is the fair value of the contract. This risk may be mitigated by having a master netting arrangement between the fund and the counterparty. Risk of loss may exceed amounts recognized on the Statement of assets and liabilities. Interest rate swap contracts outstanding at period end, if any, are listed after the fund’s portfolio. Outstanding notional on interest rate swap contracts at the close of the reporting period are indicative of the volume of activity during the period.
I) Credit default contracts The fund may enter into credit default contracts to provide a measure of protection against risk of loss following a default, or other credit event in respect of issuers within an underlying index or a single issuer, or to gain credit exposure to an underlying index or issuer. In a credit default contract, the protection buyer typically makes an up front payment and a periodic stream of payments to a counterparty, the protection seller, in exchange for the right to receive a contingent payment upon the occurrence of a credit event on the reference obligation or all other equally ranked obligations of the reference entity. Credit events are contract specific but may include bankruptcy, failure to pay, restructuring and obligation acceleration. An upfront payment received by the fund, as the protection seller, is recorded as a liability on the fund’s books. An upfront payment mad e by the fund, as the protection buyer, is recorded as an asset on the fund’s books. Periodic payments received or paid by the fund are recorded as realized gains or losses. The credit default contracts are marked to market daily based upon quotations from an independent pricing service or market makers and the change, if any, is recorded as an unrealized gain or loss. Upon the occurrence of a credit event, the difference between the par value and market value of the reference obligation, net of any proportional amount of the upfront payment, is recorded as a realized gain or loss.
In addition to bearing the risk that the credit event will occur, the fund could be exposed to market risk due to unfavorable changes in interest rates or in the price of the underlying security or index or the possibility that the fund may be unable to close out its position at the same time or at the same price as if it had purchased
61
the underlying reference obligations. In certain circumstances, the fund may enter into offsetting credit default contracts which would mitigate its risk of loss. Risks of loss may exceed amounts recognized on the Statement of assets and liabilities. The fund’s maximum risk of loss from counterparty risk, either as the protection seller or as the protection buyer, is the fair value of the contract. This risk may be mitigated by having a master netting arrangement between the fund and the counterparty. Where the fund is a seller of protection, the maximum potential amount of future payments the fund may be required to make is equal to the notional amount of the relevant credit default contract. Credit default contracts outstanding, including their respective notional amounts at period end, if any, are listed after the fund’s portfolio. The fund had an average notional amount of approximately $31,700,000 on credit default swap contracts for the reporting period.
J) Master agreements The fund is a party to ISDA (International Swap and Derivatives Association, Inc.) Master Agreements (Master Agreements) with certain counterparties that govern over-the-counter derivative and foreign exchange contracts entered into from time to time. The Master Agreements may contain provisions regarding, among other things, the parties’ general obligations, representations, agreements, collateral requirements, events of default and early termination. With respect to certain counterparties, in accordance with the terms of the Master Agreements, collateral posted to the fund is held in a segregated account by the fund’s custodian and with respect to those amounts which can be sold or repledged, are presented in the fund’s portfolio. Collateral pledged by the fund is segregated by the fund’s custodian and identified in the fund’s portfolio. Collateral can be in the form of cash or debt securities issued by the U.S. Government or related agencies or other securities as agreed to by the fund and the applicable counterparty. Collateral requirements are determined based on the fund’s net position with each counterparty. Termination events applicable to the fund may occur upon a decline in the fund’s net assets below a specified threshold over a certain period of time. Termination events applicable to counterparties may occur upon a decline in the counterparty’s long-term and short-term credit ratings below a specified level. In each case, upon occurrence, the other party may elect to terminate early and cause settlement of all derivative and foreign exchange contracts outstanding, including the payment of any losses and costs resulting from such early termination, as reasonably determined by the terminating party. Any decision by one or more of the fund’s counterparties to elect early termination could impact the fund’s future derivative activity.
At the close of the reporting period, the fund had a net liability position of $114,265,070 on derivative contracts subject to the Master Agreements. Collateral posted by the fund totaled $98,174,754.
K) TBA purchase commitments The fund may enter into TBA (to be announced) commitments to purchase securities for a fixed unit price at a future date beyond customary settlement time. Although the unit price has been established, the principal value has not been finalized. However, it is anticipated that the amount of the commitments will not significantly differ from the principal amount. The fund holds, and maintains until settlement date, cash or high-grade debt obligations in an amount sufficient to meet the purchase price, or the fund may enter into offsetting contracts for the forward sale of other securities it owns. Income on the securities will not be earned until settlement date. TBA purchase commitments may be considered securities themselves, and involve a risk of loss if the value of the security to be purchased declines prior to the settlement date, which risk is in addition to the risk of decline in the value of the fund’s other assets. Unsettled TBA purchase commitments are valued at fair value of the underlying securities, according to the procedures described under “Security valuation” above. The contract is marked to market daily and the change in market value is recorded by the fund as an unrealized gain or loss.
Although the fund will generally enter into TBA purchase commitments with the intention of acquiring securities for its portfolio or for delivery pursuant to options contracts it has entered into, the fund may dispose of a commitment prior to settlement if Putnam Management deems it appropriate to do so.
L) TBA sale commitments The fund may enter into TBA sale commitments to hedge its portfolio positions or to sell mortgage-backed securities it owns under delayed delivery arrangements. Proceeds of TBA sale commitments are not received until the contractual settlement date. During the time a TBA sale commitment is outstanding, equivalent deliverable securities or an offsetting TBA purchase commitment deliverable on or before the sale commitment date, are held as “cover” for the transaction.
Unsettled TBA sale commitments are valued at the fair value of the underlying securities, generally according to the procedures described under “Security valuation” above. The contract is marked to market daily and the change in market value is recorded by the fund as an unrealized gain or loss. If the TBA sale commitment is closed through the acquisition of an offsetting TBA purchase commitment, the fund realizes a gain or loss. If the fund delivers securities under the commitment, the fund realizes a gain or a loss from the sale of the securities based upon the unit price established at the date the commitment was entered into. TBA sale commitments outstanding at period end, if any, are listed after the fund’s portfolio.
62
M) Dollar rolls To enhance returns, the fund may enter into dollar rolls (principally using TBAs) in which the fund sells securities for delivery in the current month and simultaneously contracts to purchase similar securities on a specified future date. During the period between the sale and subsequent purchase, the fund will not be entitled to receive income and principal payments on the securities sold. The fund will, however, retain the difference between the initial sales price and the forward price for the future purchase. The fund will also be able to earn interest on the cash proceeds that are received from the initial sale, on settlement date. The fund may be exposed to market or credit risk if the price of the security changes unfavorably or the counterparty fails to perform under the terms of the agreement.
N) Federal taxes It is the policy of the fund to distribute all of its taxable income within the prescribed time and otherwise comply with the provisions of the Internal Revenue Code of 1986, as amended (the Code), applicable to regulated investment companies. It is also the intention of the fund to distribute an amount sufficient to avoid imposition of any excise tax under Section 4982 of the Code. The fund is subject to the provisions of Accounting Standards Codification ASC 740 Income Taxes (ASC 740). ASC 740 sets forth a minimum threshold for financial statement recognition of the benefit of a tax position taken or expected to be taken in a tax return. The fund did not have any unrecognized tax benefits in the accompanying financial statements. No provision has been made for federal taxes on income, capital gains or unrealized a ppreciation on securities held nor for excise tax on income and capital gains. Each of the fund’s federal tax returns for the prior three fiscal years remains subject to examination by the Internal Revenue Service and state departments of revenue.
At October 31, 2009, the fund had a capital loss carryover of $220,270,015 available to the extent allowed by the Code to offset future net capital gain, if any. The amounts of the carryovers and the expiration dates are:
| |
| Loss Carryover | Expiration |
|
| $ 15,454,954 | October 31, 2013 |
|
| 14,607,635 | October 31, 2014 |
|
| 126,895,927 | October 31, 2016 |
|
| 63,311,499 | October 31, 2017 |
|
The aggregate identified cost on a tax basis is $1,527,242,840, resulting in gross unrealized appreciation and depreciation of $100,884,297 and $63,240,074, respectively, or net unrealized appreciation of $37,644,223.
O) Distributions to shareholders Distributions to shareholders from net investment income are recorded by the fund on the ex-dividend date. Distributions from capital gains, if any, are recorded on the ex-dividend date and paid at least annually. The amount and character of income and gains to be distributed are determined in accordance with income tax regulations, which may differ from generally accepted accounting principles. Dividend sources are estimated at the time of declaration. Actual results may vary. Any non-taxable return of capital cannot be determined until final tax calculations are completed after the end of the fund’s fiscal year. Reclassifications are made to the fund’s capital accounts to reflect income and gains available for distribution (or available capital loss carryovers) under income tax regulations.
Note 2: Management fee, administrative services and other transactions
Effective January 1, 2010, the fund pays Putnam Management a management fee (based on the fund’s average net assets and computed and paid monthly) at annual rates that may vary based on the average of the aggregate net assets of most open-end funds, as defined in the fund’s management contract, sponsored by Putnam Management. Such annual rates may vary as follows: 0.55% of the first $5 billion, 0.50% of the next $5 billion, 0.45% of the next $10 billion, 0.40% of the next $10 billion, 0.35% of the next $50 billion, 0.33% of the next $50 billion, and 0.32% of the next $100 billion and 0.315% thereafter.
Prior to January 1, 2010, the fund paid Putnam Management for management and investment advisory services quarterly based on the average net assets of the fund. Such fee was based on the following annual rates: 0.65% of the first $500 million of average net assets, 0.55% of the next $500 million, 0.50% of the next $500 million, 0.45% of the next $5 billion, 0.425% of the next $5 billion, 0.405% of the next $5 billion, 0.39% of the next $5 billion, and 0.38% thereafter.
Effective August 1, 2009 through July 31, 2010, Putnam Management has contractually agreed to reimburse the fund’s expenses to the extent necessary to limit the cumulative expenses of the fund, exclusive of brokerage, interest, taxes, investment-related expenses, extraordinary expenses and payments under the fund’s investor
63
servicing contract, investment management contract and distribution plans, on a fiscal year-to-date basis (or from August 1, 2009 through the fund’s next fiscal year end, as applicable), to an annual rate of 0.20% of the fund’s average net assets over such fiscal year-to-date period (or since August 1, 2009, as applicable). During the reporting period, the fund’s expenses were not reduced as a result of this limit.
Putnam Management has also contractually agreed, from August 1, 2009 through July 31, 2010, to limit the management fee for the fund to an annual rate of 0.412% of the fund’s average net assets. During the reporting period, the fund’s expenses were reduced by $342,302 as a result of this limit.
Effective February 28, 2010, Putnam Investments Limited (PIL), an affiliate of Putnam Management, is authorized by the Trustees to manage a separate portion of the assets of the fund as determined by Putnam Management from time to time. Putnam Management pays a quarterly sub-management fee to PIL for its services at an annual rate of 0.40% of the average net assets of the portion of the fund managed by PIL.
On September 15, 2008, the fund terminated its outstanding derivatives contracts with Lehman Brothers Special Financing, Inc. (LBSF) in connection with the bankruptcy filing of LBSF’s parent company, Lehman Brothers Holdings, Inc. On September 26, 2008, the fund entered into receivable purchase agreements (Agreements) with other registered investment companies (each a Seller) managed by Putnam Management. Under the Agreements, the Seller sold to the fund the right to receive, in the aggregate, $2,948,825 in net payments from LBSF in connection with certain terminated derivatives transactions (the Receivable), in each case in exchange for an initial payment plus (or minus) additional amounts based on the fund’s ultimate realized gain (or loss) with respect to the Receivable. The Receivable offsets against the fund’s net payable to LBSF and is included in the Statement of assets and liabilities in Payable for investments purchased. The fund has accrued interest on the net payable, which is included in the Statement of assets and liabilities in Interest payable. Following the close of the reporting period, the fund paid $916,583 to the Seller in accordance with the terms of the Agreement and the fund paid $177,266,195, including interest, to LBSF in complete satisfaction of the fund’s obligations under the terminated contracts.
The fund reimburses Putnam Management an allocated amount for the compensation and related expenses of certain officers of the fund and their staff who provide administrative services to the fund. The aggregate amount of all such reimbursements is determined annually by the Trustees.
Custodial functions for the fund’s assets are provided by State Street Bank and Trust Company (State Street). Custody fees are based on the fund’s asset level, the number of its security holdings and transaction volumes.
Putnam Investor Services, Inc., an affiliate of Putnam Management, provided investor servicing agent functions to the fund. Putnam Investor Services, Inc. received fees for investor servicing, subject to certain limitations, based on the fund’s retail asset level, the number of shareholder accounts in the fund and the level of defined contribution plan assets in the fund. The amounts incurred for investor servicing agent functions during the reporting period are included in Investor servicing fees in the Statement of operations.
Under the custodian contract between the fund and State Street, the custodian bank has a lien on the securities of the fund to the extent permitted by the fund’s investment restrictions to cover any advances made by the custodian bank for the settlement of securities purchased by the fund. At the close of the reporting period, the payable to the custodian bank represents the amount due for cash advanced for the settlement of securities purchased.
The fund has entered into expense offset arrangements with Putnam Investor Services, Inc. and State Street whereby Putnam Investor Services, Inc.’s and State Street’s fees are reduced by credits allowed on cash balances. For the reporting period, the fund’s expenses were reduced by $2,534 under the expense offset arrangements.
Each independent Trustee of the fund receives an annual Trustee fee, of which $847, as a quarterly retainer, has been allocated to the fund, and an additional fee for each Trustees meeting attended. Trustees receive additional fees for attendance at certain committee meetings and industry seminars and for certain compliance-related matters. Trustees also are reimbursed for expenses they incur relating to their services as Trustees.
The fund has adopted a Trustee Fee Deferral Plan (the Deferral Plan) which allows the Trustees to defer the receipt of all or a portion of Trustees fees payable on or after July 1, 1995. The deferred fees remain invested in certain Putnam funds until distribution in accordance with the Deferral Plan.
The fund has adopted an unfunded noncontributory defined benefit pension plan (the Pension Plan) covering all Trustees of the fund who have served as a Trustee for at least five years and were first elected prior to 2004. Benefits under the Pension Plan are equal to 50% of the Trustee’s average annual attendance and retainer fees for the three years ended December 31, 2005. The retirement benefit is payable during a Trustee’s lifetime, beginning
the year following retirement, for the number of years of service through December 31, 2006. Pension expense for the fund is included in Trustee compensation and expenses in the Statement of operations. Accrued pension liability is included in Payable for Trustee compensation and expenses in the Statement of assets and liabilities. The Trustees have terminated the Pension Plan with respect to any Trustee first elected after 2003.
The fund has adopted distribution plans (the Plans) with respect to its class A, class B, class C, class M and class R shares pursuant to Rule 12b-1 under the Investment Company Act of 1940. The purpose of the Plans is to compensate Putnam Retail Management Limited Partnership, a wholly-owned subsidiary of Putnam Investments, LLC and Putnam Retail Management GP, Inc., for services provided and expenses incurred in distributing shares of the fund. The Plans provide for payments by the fund to Putnam Retail Management Limited Partnership at an annual rate of up to 0.35%, 1.00%, 1.00%, 1.00% and 1.00% of the average net assets attributable to class A, class B, class C, class M and class R shares, respectively. The Trustees have approved payment by the fund at an annual rate of 0.25%, 1.00%, 1.00%, 0.50% and 0.50% of the average net assets attributable to class A, class B, class C, class M and class R shares, respectively.
For the reporting period, Putnam Retail Management Limited Partnership, acting as underwriter, received net commissions of $181,635 and $46,877 from the sale of class A and class M shares, respectively, and received $13,538 and $13,079 in contingent deferred sales charges from redemptions of class B and class C shares, respectively.
A deferred sales charge of up to 1.00% and 0.40% is assessed on certain redemptions of class A and class M shares, respectively. For the reporting period, Putnam Retail Management Limited Partnership, acting as underwriter, received $127 and no monies on class A and class M redemptions, respectively.
Note 3: Purchases and sales of securities
During the reporting period, cost of purchases and proceeds from sales of investment securities other than U.S. government securities and short-term investments aggregated $457,971,249 and $433,134,931, respectively. Purchases and proceeds from sales of U.S. government securities aggregated $3,983,750 and $3,983,750, respectively.
Written option transactions during the reporting period are summarized as follows:
| | |
| | Contract Amounts | Premiums Received |
|
| Written options outstanding | | |
| at beginning of period | $ 2,090,434,800 | $ 113,219,637 |
|
| Options opened | 596,985,680 | 31,508,621 |
| Options exercised | (454,983,000) | (21,826,377) |
| Options expired | (454,983,000) | (21,826,377) |
| Options closed | — | — |
|
| Written options outstanding | | |
| at end of period | $ 1,777,454,480 | $ 101,075,504 |
|
Note 4: Capital shares
At the close of the reporting period, there was an unlimited number of shares of beneficial interest authorized.
Transactions in capital shares were as follows:
| | | | |
| | Six months ended 4/30/10 | Year ended 10/31/09 |
|
| Class A | Shares | Amount | Shares | Amount |
|
| Shares sold | 21,593,771 | $145,678,082 | 32,625,729 | $187,096,754 |
|
| Shares issued in connection with | | | | |
| reinvestment of distributions | 3,288,292 | 22,110,097 | 6,713,193 | 37,197,174 |
|
| | 24,882,063 | 167,788,179 | 39,338,922 | 224,293,928 |
|
| Shares repurchased | (13,561,434) | (91,519,132) | (38,726,811) | (207,445,695) |
|
| Net increase | 11,320,629 | $76,269,047 | 612,111 | $16,848,233 |
|
65
| | | | |
| | Six months ended 4/30/10 | Year ended 10/31/09 |
|
| Class B | Shares | Amount | Shares | Amount |
|
| Shares sold | 885,261 | $5,914,268 | 1,427,892 | $7,867,213 |
|
| Shares issued in connection with | | | | |
| reinvestment of distributions | 181,436 | 1,209,735 | 586,261 | 3,175,208 |
|
| | 1,066,697 | 7,124,003 | 2,014,153 | 11,042,421 |
|
| Shares repurchased | (2,017,273) | (13,479,161) | (5,787,688) | (31,241,436) |
|
| Net decrease | (950,576) | $(6,355,158) | (3,773,535) | $(20,199,015) |
|
| |
| | Six months ended 4/30/10 | Year ended 10/31/09 |
|
| Class C | Shares | Amount | Shares | Amount |
|
| Shares sold | 6,824,509 | $45,871,378 | 4,531,494 | $26,343,431 |
|
| Shares issued in connection with | | | | |
| reinvestment of distributions | 189,637 | 1,270,286 | 228,108 | 1,283,414 |
|
| | 7,014,146 | 47,141,664 | 4,759,602 | 27,626,845 |
|
| Shares repurchased | (1,009,310) | (6,757,890) | (1,252,746) | (6,760,233) |
|
| Net increase | 6,004,836 | $40,383,774 | 3,506,856 | $20,866,612 |
|
| |
| | Six months ended 4/30/10 | Year ended 10/31/09 |
|
| Class M | Shares | Amount | Shares | Amount |
|
| Shares sold | 3,036,173 | $20,144,883 | 2,227,301 | $12,389,909 |
|
| Shares issued in connection with | | | | |
| reinvestment of distributions | 56,066 | 370,802 | 101,022 | 554,587 |
|
| | 3,092,239 | 20,515,685 | 2,328,323 | 12,944,496 |
|
| Shares repurchased | (3,137,469) | (20,814,725) | (4,240,822) | (23,288,316) |
|
| Net decrease | (45,230) | $(299,040) | (1,912,499) | $(10,343,820) |
|
| |
| | Six months ended 4/30/10 | Year ended 10/31/09 |
|
| Class R | Shares | Amount | Shares | Amount |
|
| Shares sold | 127,963 | $860,700 | 151,380 | $846,182 |
|
| Shares issued in connection with | | | | |
| reinvestment of distributions | 12,139 | 81,324 | 24,279 | 134,827 |
|
| | 140,102 | 942,024 | 175,659 | 981,009 |
|
| Shares repurchased | (94,173) | (630,488) | (89,506) | (506,830) |
|
| Net increase | 45,929 | $311,536 | 86,153 | $474,179 |
|
| |
| | Six months ended 4/30/10 | Year ended 10/31/09 |
|
| Class Y | Shares | Amount | Shares | Amount |
|
| Shares sold | 12,093,236 | $82,232,588 | 24,922,212 | $140,437,889 |
|
| Shares issued in connection with | | | | |
| reinvestment of distributions | 586,946 | 3,968,261 | 3,525,189 | 19,057,975 |
|
| | 12,680,182 | 86,200,849 | 28,447,401 | 159,495,864 |
|
| Shares repurchased | (25,132,482) | (169,741,574) | (36,806,873) | (195,273,620) |
|
| Redemptions in kind | — | — | (103,929,215) | (477,035,096) |
|
| Net decrease | (12,452,300) | $(83,540,725) | (112,288,687) | $(512,812,852) |
|
66
Note 5: Summary of derivative activity
The following is a summary of the market values of derivative instruments as of the close of the reporting period:
| | | | |
| | Asset derivatives | Liability derivatives |
|
| Derivatives not | | | | |
| accounted for as | Statement of | | Statement of | |
| hedging instruments | assets and | | assets and | |
| under ASC 815 | liabilities location | Market value | liabilities location | Market value |
|
| Credit contracts | Receivables | $544,566 | Payables | $10,202 |
|
| | Investments, Receivables, | | | |
| | Net assets — | | Payables, Net assets — | |
| Interest rate | Unrealized appreciation/ | | Unrealized appreciation/ | |
| contracts | (depreciation) | 44,029,413* | (depreciation) | 149,034,975* |
|
| Total | | $44,573,979 | | $149,045,177 |
|
* Includes cumulative appreciation/depreciation of futures contracts as reported in The fund’s portfolio. Only current day’s variation margin is reported within the Statement of assets and liabilities.
The following is a summary of realized and change in unrealized gains or losses of derivative instruments on the Statement of operations for the reporting period (see Note 1):
Amount of realized gain or (loss) on derivatives recognized in net gain or (loss) on investments
| | | | |
| Derivatives not | | | | |
| accounted for as | | | | |
| hedging instruments | | | | |
| under ASC 815 | Options | Futures | Swaps | Total |
|
| Credit contracts | $— | $— | $(779,425) | $(779,425) |
|
| Interest rate contracts | 10,085,565 | (5,224,498) | (8,300,265) | $(3,439,198) |
|
| Total | $10,085,565 | $(5,224,498) | $(9,079,690) | $(4,218,623) |
|
Change in unrealized appreciation or (depreciation) on derivatives recognized in net gain or (loss) on investments
| | | | |
| Derivatives not | | | | |
| accounted for as | | | | |
| hedging instruments | | | | |
| under ASC 815 | Options | Futures | Swaps | Total |
|
| Credit contracts | $— | $— | $(635,157) | $(635,157) |
|
| Interest rate contracts | 13,259,082 | 6,916,050 | (32,541,333) | (12,366,201) |
|
| Total | $13,259,082 | $6,916,050 | $(33,176,490) | $(13,001,358) |
|
Note 6: Investment in Putnam Money Market Liquidity Fund
The fund invested in Putnam Money Market Liquidity Fund, an open-end management investment company managed by Putnam Management. Investments in Putnam Money Market Liquidity Fund are valued at its closing net asset value each business day. Income distributions earned by the fund are recorded as interest income in the Statement of operations and totaled $274,791 for the reporting period. During the reporting period, cost of purchases and proceeds of sales of investments in Putnam Money Market Liquidity Fund aggregated $617,997,042 and $635,069,521, respectively. Management fees charged to Putnam Money Market Liquidity Fund have been waived by Putnam Management.
Note 7: Senior loan commitments
Senior loans are purchased or sold on a when-issued or delayed delivery basis and may be settled a month or more after the trade date, which from time to time can delay the actual investment of available cash balances; interest income is accrued based on the terms of the securities. Senior loans can be acquired through an agent, by assignment from another holder of the loan, or as a participation interest in another holder’s portion of the loan. When the fund
67
invests in a loan or participation, the fund is subject to the risk that an intermediate participant between the fund and the borrower will fail to meet its obligations to the fund, in addition to the risk that the borrower under the loan may default on its obligations.
Note 8: Regulatory matters and litigation
In late 2003 and 2004, Putnam Management settled charges brought by the SEC and the Massachusetts Securities Division in connection with excessive short-term trading in Putnam funds. Distribution of payments from Putnam Management to certain open-end Putnam funds and their shareholders is expected to be completed in the next several months. These allegations and related matters have served as the general basis for certain lawsuits, including purported class action lawsuits against Putnam Management and, in a limited number of cases, some Putnam funds. Putnam Management believes that these lawsuits will have no material adverse effect on the funds or on Putnam Management’s ability to provide investment management services. In addition, Putnam Management has agreed to bear any costs incurred by the Putnam funds as a result of these matters.
Note 9: Market and credit risk
In the normal course of business, the fund trades financial instruments and enters into financial transactions where risk of potential loss exists due to changes in the market (market risk) or failure of the contracting party to the transaction to perform (credit risk). The fund may be exposed to additional credit risk that an institution or other entity with which the fund has unsettled or open transactions will default.
68
Shareholder meeting results (Unaudited)
November 19, 2009 meeting
At the meeting, each of the nominees for Trustee was elected, as follows:
| | |
| | Votes for | Votes withheld |
|
| Ravi Akhoury | 115,986,609 | 2,330,142 |
|
| Jameson A. Baxter | 116,034,561 | 2,282,190 |
|
| Charles B. Curtis | 116,008,737 | 2,308,014 |
|
| Robert J. Darretta | 116,010,718 | 2,306,033 |
|
| Myra R. Drucker | 116,052,202 | 2,264,549 |
|
| John A. Hill | 116,022,704 | 2,294,047 |
|
| Paul L. Joskow | 116,091,393 | 2,225,358 |
|
| Elizabeth T. Kennan | 115,931,655 | 2,385,096 |
|
| Kenneth R. Leibler | 116,059,450 | 2,257,301 |
|
| Robert E. Patterson | 115,991,593 | 2,325,158 |
|
| George Putnam, III | 115,966,342 | 2,350,409 |
|
| Robert L. Reynolds | 116,083,267 | 2,233,484 |
|
| W. Thomas Stephens | 116,082,147 | 2,234,604 |
|
| Richard B. Worley | 116,061,669 | 2,255,082 |
|
A proposal to approve a new management contract between the fund and Putnam Management was approved as follows:
| | | |
| Votes | Votes | | Broker |
| for | against | Abstentions | non-votes |
|
| 87,532,037 | 1,276,231 | 1,950,066 | 27,558,417 |
|
All tabulations are rounded to the nearest whole number.
69
The Putnam family of funds
The following is a list of Putnam’s open-end mutual funds offered to the public. Investors should carefully consider the investment objective, risks, charges, and expenses of a fund before investing. For a prospectus , or a summary prospectus if available, containing this and other information for any Putnam fund or product, call your financial advisor at 1-800-225-1581 and ask for a prospectus. Please read the prospectus carefully before investing.
| |
| Growth | Value |
| Growth Opportunities Fund | Convertible Income-Growth Trust |
| International Growth Fund* ** | Equity Income Fund |
| New Opportunities Fund | The George Putnam Fund of Boston |
| Small Cap Growth Fund* | The Putnam Fund for Growth and Income |
| Vista Fund | International Value Fund* †† |
| Voyager Fund | Mid Cap Value Fund |
| Small Cap Value Fund* |
| Blend | |
| Asia Pacific Equity Fund* | Income |
| Capital Opportunities Fund* | American Government Income Fund |
| Capital Spectrum Fund‡ | Diversified Income Trust |
| Emerging Markets Equity Fund* | Floating Rate Income Fund |
| Equity Spectrum Fund‡ | Global Income Trust* |
| Europe Equity Fund* | High Yield Advantage Fund* |
| Global Equity Fund* | High Yield Trust* |
| International Capital Opportunities Fund* | Income Fund |
| International Equity Fund* | Money Market Fund† |
| Investors Fund | U.S. Government Income Trust |
| Research Fund | |
* A 1% redemption fee on total assets redeemed or exchanged within 90 days of purchase may be imposed for all share classes of these funds.
† An investment in a money market fund is not insured or guaranteed by the Federal Deposit Insurance Corporation or any other government agency. Although the fund seeks to preserve the value of your investment at $1.00 per share, it is possible to lose money by investing in the fund.
** Prior to January 1, 2010, the fund was known as Putnam International New Opportunities Fund.
†† Prior to January 1, 2010, the fund was known as Putnam International Growth and Income Fund.
70
Tax-free income
AMT-Free Municipal Fund
Tax Exempt Income Fund
Tax Exempt Money Market Fund†
Tax-Free High Yield Fund
State tax-free income funds:
Arizona, California, Massachusetts, Michigan, Minnesota, New Jersey, New York, Ohio, and Pennsylvania
Absolute Return
Absolute Return 100 Fund
Absolute Return 300 Fund
Absolute Return 500 Fund
Absolute Return 700 Fund
Global Sector*
Global Consumer Fund
Global Energy Fund
Global Financials Fund
Global Health Care Fund
Global Industrials Fund
Global Natural Resources Fund
Global Sector Fund
Global Technology Fund
Global Telecommunications Fund
Global Utilities Fund
Asset allocation
Income Strategies Fund
Putnam Asset Allocation Funds — three investment portfolios that spread your money across a variety of stocks, bonds, and money market investments.
The three portfolios:
Asset Allocation: Balanced Portfolio
Asset Allocation: Conservative Portfolio
Asset Allocation: Growth Portfolio
Putnam RetirementReady®
Putnam RetirementReady Funds — 10 investment portfolios that offer diversification among stocks, bonds, and money market instruments and adjust to become more conservative over time based on a target date for withdrawing assets.
The 10 funds:
Putnam RetirementReady 2050 Fund
Putnam RetirementReady 2045 Fund
Putnam RetirementReady 2040 Fund
Putnam RetirementReady 2035 Fund
Putnam RetirementReady 2030 Fund
Putnam RetirementReady 2025 Fund
Putnam RetirementReady 2020 Fund
Putnam RetirementReady 2015 Fund
Putnam RetirementReady 2010 Fund
Putnam RetirementReady Maturity Fund
‡ A 1% redemption fee on total assets redeemed or exchanged within 30 days of purchase may be imposed for all share classes of these funds.
With the exception of money market funds, a 1% redemption fee may be applied to shares exchanged or sold within 7 days of purchase (90 days, for certain funds).
Check your account balances and the most recent month-end performance in the Individual Investors section at putnam.com.
71
Services for shareholders
Investor services
Systematic investment plan Tell us how much you wish to invest regularly — weekly, semimonthly, or monthly — and the amount you choose will be transferred automatically from your checking or savings account. There’s no additional fee for this service, and you can suspend it at any time. This plan may be a great way to save for college expenses or to plan for your retirement.
Please note that regular investing does not guarantee a profit or protect against loss in a declining market. Before arranging a systematic investment plan, consider your financial ability to continue making purchases in periods when prices are low.
Systematic exchange You can make regular transfers from one Putnam fund to another Putnam fund. There are no additional fees for this service, and you can cancel or change your options at any time.
Dividends PLUS You can choose to have the dividend distributions from one of your Putnam funds automatically reinvested in another Putnam fund at no additional charge.
Free exchange privilege You can exchange money between Putnam funds free of charge, as long as they are the same class of shares. A signature guarantee is required if you are exchanging more than $500,000.
Reinstatement privilege If you’ve sold Putnam shares or received a check for a dividend or capital gain, you may reinvest the proceeds with Putnam within 90 days of the transaction and they will be reinvested at the fund’s current net asset value — with no sales charge. However, reinstatement of class B shares may have special tax consequences. Ask your financial or tax representative for details.
Check-writing service You have ready access to many Putnam accounts. It’s as simple as writing a check, and there are no special fees or service charges. For more information about the check-writing service, call Putnam or visit our Web site.
Dollar cost averaging When you’re investing for long-term goals, it’s time, not timing, that counts. Investing on a systematic basis is a better strategy than trying to figure out when the markets will go up or down. This means investing the same amount of money regularly over a long period. This method of investing is called dollar cost averaging. When a fund’s share price declines, your investment dollars buy more shares at lower prices. When it increases, they buy fewer shares. Over time, you will pay a lower average price per share.
For more information
Visit the Individual Investors section at putnam.com A secure section of our Web site contains complete information on your account, including balances and transactions, updated daily. You may also conduct transactions, such as exchanges, additional investments, and address changes. Log on today to get your password.
Call us toll free at 1-800-225-1581 Ask a helpful Putnam representative or your financial advisor for details about any of these or other services, or see your prospectus.
72
Putnam’s commitment
to confidentiality
In order to conduct business with our shareholders, we must obtain certain personal information such as account holders’ names, addresses, Social Security numbers, and dates of birth. Using this information, we are able to maintain accurate records of accounts and transactions.
It is our policy to protect the confidentiality of our shareholder information, whether or not a shareholder currently owns shares of our funds. In particular, it is our policy not to sell information about you or your accounts to outside marketing firms. We have safeguards in place designed to prevent unauthorized access to our computer systems and procedures to protect personal information from unauthorized use.
Within the Putnam organization, your information is shared with those who need it to service your account or provide you with information about other Putnam products or services. Under certain circumstances, we must also share account information with outside vendors who provide services to us, such as mailings and proxy solicitations. In these cases, the service providers enter into confidentiality agreements with us, and we provide only the information necessary to process transactions and perform other services related to your account. It is also our policy to share account information with your financial advisor, if you've provided us with information about your advisor and that person is listed on your Putnam account.
If you would like clarification about our confidentiality policies or have any questions or concerns, please don't hesitate to contact us at 1-800-225-1581, Monday through Friday, 8:00 a.m. to 8:00 p.m. Eastern Time.
73
Fund information
Founded over 70 years ago, Putnam Investments was built around the concept that a balance between risk and reward is the hallmark of a well-rounded financial program. We manage over 100 funds across income, value, blend, growth, asset allocation, absolute return, and global sector categories.
| | |
| Investment Manager | Kenneth R. Leibler | Beth S. Mazor |
| Putnam Investment | Robert E. Patterson | Vice President |
| Management, LLC | George Putnam, III | |
| One Post Office Square | Robert L. Reynolds | James P. Pappas |
| Boston, MA 02109 | W. Thomas Stephens | Vice President |
| | Richard B. Worley | Francis J. McNamara, III |
| Investment Sub-Manager | | Vice President and Chief |
| Putnam Investments Limited | Officers | |
| 57–59 St James’s Street | Robert L. Reynolds | Legal Officer |
| London, England SW1A 1LD | President | Robert R. Leveille |
| | Vice President and |
| Marketing Services | Jonathan S. Horwitz | Chief Compliance Officer |
| Putnam Retail Management | Executive Vice President, | |
| One Post Office Square | Principal Executive | Mark C. Trenchard |
| Boston, MA 02109 | Officer, Treasurer and | Vice President and |
| Compliance Liaison | BSA Compliance Officer |
| Custodian | | |
| State Street Bank | Charles E. Porter | Judith Cohen |
| and Trust Company | Senior Advisor to the Trustees | Vice President, Clerk and |
| | Assistant Treasurer |
| Legal Counsel | Steven D. Krichmar | |
| Ropes & Gray LLP | Vice President and | Wanda M. McManus |
| Principal Financial Officer | Vice President, Senior Associate |
| Trustees | | Treasurer and Assistant Clerk |
| John A. Hill, Chairman | Janet C. Smith | |
| Jameson A. Baxter, | Vice President, Principal | Nancy E. Florek |
| Vice Chairman | Accounting Officer and | Vice President, Assistant Clerk, |
| Ravi Akhoury | Assistant Treasurer | Assistant Treasurer and |
| Charles B. Curtis | | Proxy Manager |
| Robert J. Darretta | Susan G. Malloy | |
| Myra R. Drucker | Vice President and | |
| Paul L. Joskow | Assistant Treasurer | |
| Elizabeth T. Kennan | | |
74
This report is for the information of shareholders of Putnam Income Fund. It may also be used as sales literature when preceded or accompanied by the current prospectus, the most recent copy of Putnam’s Quarterly Performance Summary, and Putnam’s Quarterly Ranking Summary. For more recent performance, please visit putnam.com. Investors should carefully consider the investment objective, risks, charges, and expenses of a fund, which are described in its prospectus. For this and other information or to request a prospectus, or a summary prospectus if available, call 1-800-225-1581 toll free. Please read the prospectus carefully before investing. The fund’s Statement of Additional Information contains additional information about the fund’s Trustees and is available without charge upon request by calling 1-800-225-1581.
75
|
| This page left blank intentionally. |
76
Item 2. Code of Ethics:
Not applicable
Item 3. Audit Committee Financial Expert:
Not applicable
Item 4. Principal Accountant Fees and Services:
Not applicable
Item 5. Audit Committee of Listed Registrants
Not applicable
Item 6. Schedule of Investments:
The registrant’s schedule of investments in unaffiliated issuers is included in the report to shareholders in Item 1 above.
Item 7. Disclosure of Proxy Voting Policies and Procedures For Closed- End Management Investment Companies:
Not applicable
Item 8. Portfolio Managers of Closed- End Investment Companies
Not Applicable
Item 9. Purchases of Equity Securities by Closed-End Management Investment Companies and Affiliated Purchasers:
Not applicable
Item 10. Submission of Matters to a Vote of Security Holders:
Not applicable
Item 11. Controls and Procedures:
(a) The registrant's principal executive officer and principal financial officer have concluded, based on their evaluation of the effectiveness of the design and operation of the registrant's disclosure controls and procedures as of a date within 90 days of the filing date of this report, that the design and operation of such procedures are generally effective to provide reasonable assurance that information required to be disclosed by the registrant in this report is recorded, processed, summarized and reported within the time periods specified in the Commission's rules and forms.
(b) Changes in internal control over financial reporting: Not applicable
Item 12. Exhibits:
(a)(1) Not applicable
(a)(2) Separate certifications for the principal executive officer and principal financial officer of the registrant as required by Rule 30a-2(a) under the Investment Company Act of 1940, as amended, are filed herewith.
(b) The certifications required by Rule 30a-2(b) under the Investment Company Act of 1940, as amended, are filed herewith.
Putnam Income Fund
By (Signature and Title):
/s/Janet C. Smith
Janet C. Smith
Principal Accounting Officer
Date: June 28, 2010
Pursuant to the requirements of the Securities Exchange Act of 1934 and the Investment Company Act of 1940, this report has been signed below by the following persons on behalf of the registrant and in the capacities and on the dates indicated.
By (Signature and Title):
/s/Jonathan S. Horwitz
Jonathan S. Horwitz
Principal Executive Officer
Date: June 28, 2010
By (Signature and Title):
/s/Steven D. Krichmar
Steven D. Krichmar
Principal Financial Officer
Date: June 28, 2010