| | |
| UNITED STATES
SECURITIES AND EXCHANGE COMMISSION |
| | |
| CERTIFIED SHAREHOLDER REPORT OF REGISTERED
MANAGEMENT INVESTMENT COMPANIES
|
| | |
| Investment Company Act file number: | (811-00653) |
| | |
| Exact name of registrant as specified in charter: | Putnam Income Fund |
| | |
| Address of principal executive offices: | One Post Office Square, Boston, Massachusetts 02109 |
| | |
| Name and address of agent for service: | Robert T. Burns, Vice President
One Post Office Square
Boston, Massachusetts 02109 |
| | |
| Copy to: | John W. Gerstmayr, Esq.
Ropes & Gray LLP
800 Boylston Street
Boston, Massachusetts 02199-3600 |
| | |
| Registrant’s telephone number, including area code: | (617) 292-1000 |
| | |
| Date of fiscal year end: | October 31, 2012 |
| | |
| Date of reporting period: | November 1, 2011 — April 30, 2012 |
| | |
|
Item 1. Report to Stockholders: | |
| | |
| The following is a copy of the report transmitted to stockholders pursuant to Rule 30e-1 under the Investment Company Act of 1940: | |

Putnam
Income
Fund
Semiannual report
4 | 30 | 12
| | |
| Message from the Trustees | 1 | |
| |
| About the fund | 2 | |
| |
| Performance snapshot | 4 | |
| |
| Interview with your fund’s portfolio manager | 5 | |
| |
| Your fund’s performance | 11 | |
| |
| Your fund’s expenses | 13 | |
| |
| Terms and definitions | 15 | |
| |
| Other information for shareholders | 16 | |
| |
| Financial statements | 17 | |
| |
Consider these risks before investing: Funds that invest in government securities are not guaranteed. Mortgage-backed securities are subject to prepayment risk. The use of derivatives involves additional risks, such as the potential inability to terminate or sell derivatives positions and the potential failure of the other party to the instrument to meet its obligations. Funds that invest in bonds are subject to certain risks including interest-rate risk, credit risk, and inflation risk. As interest rates rise, the prices of bonds fall. Long-term bonds are more exposed to interest-rate risk than short-term bonds. Credit risk is generally greater for below-investment-grade bonds (a significant portion of the fund’s investments). Unlike bonds, bond funds have ongoing fees and expenses. The prices of bonds may fall or fail to rise over extended periods of time for a variety of reasons, including both general financial market conditions and factors related to a specific issuer or industry.
Message from the Trustees
Dear Fellow Shareholder:
Since the start of 2012, the economic picture and market performance worldwide have been mixed and volatile, punctuated by periodic worries over Europe’s unresolved sovereign-debt troubles and China’s efforts to maintain its robust economic growth. The U.S. economy has shown signs of gathering steam, but continues to face the dual headwinds of tepid jobs growth and a burgeoning federal debt.
Putnam’s portfolio managers and analysts are trained to uncover opportunities that often emerge in this type of environment, while also seeking to guard against downside risk. During these times, your financial advisor also can be a valuable resource, helping you to maintain a long-term focus and a balanced investment approach.
In other news, please join us in welcoming the return of Elizabeth T. Kennan to the Board of Trustees. Dr. Kennan, who served as a Trustee from 1992 until 2010, has rejoined the Board, effective January 1, 2012. Dr. Kennan is a Partner of Cambus-Kenneth Farm (thoroughbred horse breeding and general farming), and is also President Emeritus of Mount Holyoke College.
We would also like to take this opportunity to welcome new shareholders to the fund and to thank all of our investors for your continued confidence in Putnam.

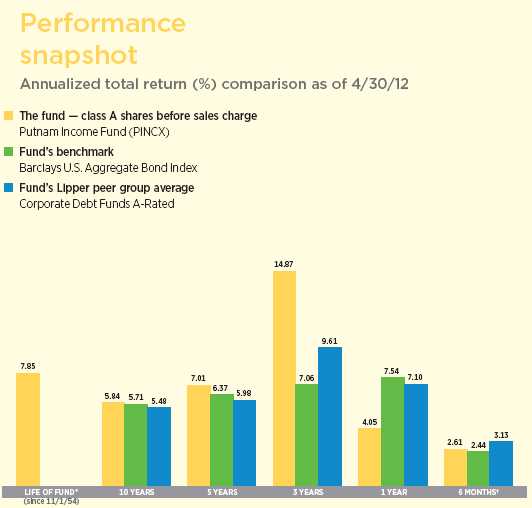
Current performance may be lower or higher than the quoted past performance, which cannot guarantee future results. Share price, principal value, and return will fluctuate, and you may have a gain or a loss when you sell your shares. Performance of class A shares assumes reinvestment of distributions and does not account for taxes. Fund returns in the bar chart do not reflect a sales charge of 4.00%; had they, returns would have been lower. See pages 5 and 11–13 for additional performance information. For a portion of the periods, the fund had expense limitations, without which returns would have been lower. To obtain the most recent month-end performance, visit putnam.com.
* The fund’s benchmark, the Barclays U.S. Aggregate Bond Index, was introduced on 12/31/75, and the fund’s Lipper category was introduced on 12/31/59. Both post-date the inception date of the fund’s class A shares.
† Returns for the six-month period are not annualized, but cumulative.
4
Interview with your fund’s portfolio manager

Mike, what was the bond-market environment like during the six months ended April 30, 2012?
Investor sentiment shifted early in the period, as better U.S. economic data, coordinated central bank efforts to ease pressure on banks in Europe, and an extension of the Federal Reserve’s [the Fed] accommodative monetary policy, bolstered demand for lower-quality, more economically sensitive fixed-income assets. As a result, high-yield bonds, emerging-market debt, and non-government-agency residential mortgage-backed securities [non-agency RMBS] were among the best-performing market sectors.
Intermediate-maturity U.S. Treasury yields declined, helping the broad Barclays U.S. Aggregate Bond Index — the fund’s benchmark — achieve a modestly positive return. Within the index, higher-yielding spread sectors, including corporate and mortgage-backed securities, solidly outpaced Treasuries.
March was the first month since last summer’s eurozone sovereign debt flare-up that the Treasury market began to show signs of any meaningful stress. A string of better-than-expected readings on the domestic economy pushed Treasury prices lower and yields higher. During April, however, Treasuries rallied and yields declined amid renewed concern about Europe’s debt crisis and uncertainty about the impact of a slowing Chinese economy on global economic growth.
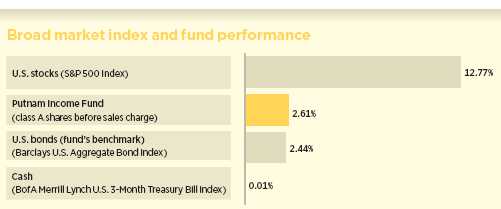
This comparison shows your fund’s performance in the context of broad market indexes for the six months ended 4/30/12. See pages 4 and 11–13 for additional fund performance information. Index descriptions can be found on pages 15–16.
5
Against this backdrop, the fund slightly outperformed its benchmark but trailed the average return of its Lipper peer group.
Which holdings helped the fund outpace its benchmark?
Our out-of-benchmark allocation to non-agency RMBS was a significant contributor for the period. Robust demand from hedge funds and other institutional investors, coupled with reduced supply concerns, drove the sector’s performance.
In 2011, concern about potential forced selling by banks caused investors to retreat from the non-agency RMBS market, prompting the Fed to suspend the auction of its “Maiden Lane” portfolio, which contained a sizable amount of the securities. The Fed resumed the auction in early 2012 and sold its entire portfolio during the first quarter. Completion of the auction helped to greatly diversify the holders of non-agency RMBS, thereby reducing the likelihood that a single seller could flood the market with excess supply.
Our holdings of investment-grade corporate bonds also aided the fund’s relative performance. Within the sector, favorable positioning among financial institutions drove
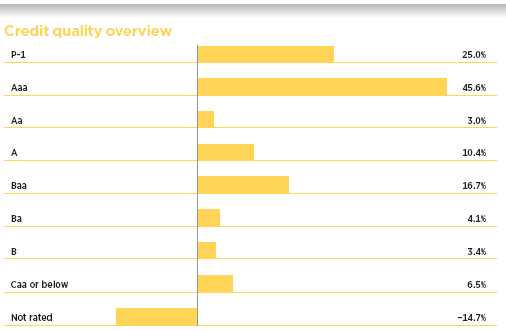
Credit qualities are shown as a percentage of net assets as of 4/30/12. A bond rated Baa or higher (Prime-3 or higher, for short-term debt) is considered investment grade. The chart reflects Moody’s ratings; percentages may include bonds or derivatives not rated by Moody’s but rated by Standard & Poor’s (S&P) or, if unrated by S&P, by Fitch, and then included in the closest equivalent Moody’s rating. Ratings will vary over time.
Credit quality includes bonds and represents only the fixed-income portion of the portfolio. Derivative instruments, including currency forwards, are only included to the extent of any unrealized gain or loss on such instruments and are shown in the not-rated category. The fund itself has not been rated by an independent rating agency.
A negative percentage reflects the effect of fund strategies that are designed to enhance performance if certain securities decline in value.
6
results, as bonds issued by this industry group outperformed those issued by industrial and utility companies.

A significant overweighting in commercial mortgage-backed securities [CMBS] was another notable contributor. We held both AAA-rated CMBS and “seasoned mezzanine” securities. CMBS are created when an underwriter assembles a package of commercial mortgages and issues bonds of varying creditworthiness. AAA-rated CMBS occupy the top of the underwriter’s capital structure, and thus offer the greatest principal protection. Mezzanine CMBS are slightly lower in the capital structure, but still provide a meaningful amount of principal protection along with higher yields. The mezzanine bonds we selected were issued prior to 2006, when CMBS underwriting standards were stronger than they were later in the decade, and provided the fund with a reliable stream of cash flows.
Lastly, collateralized mortgage obligations [CMOs] derived from agency mortgage pass-through securities provided a modest boost versus the index. We favored CMOs created from mortgages that were issued after the cut-off date of the revised Home Affordable Refinance Program [HARP] because we believed they carried lower levels of prepayment risk.
To explain, HARP was introduced by the Obama administration in 2009 to help homeowners who owed more on their mortgages than their homes were worth. When the program was launched, the rules stipulated that mortgages originating before June 1, 2009, would be eligible for a streamlined refinancing process, while mortgages created after that date would not be eligible. Consequently, loans originating after May 31, 2009, would be more cumbersome to refinance, and the securities created from these mortgage pools would have relatively slow prepayment rates. In November 2011, HARP was revised to correct the disparity created by the May 31, 2009 cut-off date by making it easier for borrowers with lower credit ratings and mortgages with relatively high interest rates to refinance.
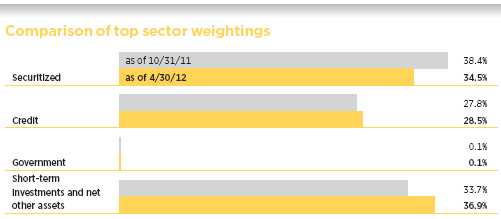
This chart shows how the fund’s top weightings have changed over the past six months. Weightings are shown as a percentage of net assets. Summary information may differ from the portfolio schedule included in the financial statements due to the inclusion of derivative securities and the exclusion of as-of trades, if any. Holdings will vary over time.
7
Seeking to capitalize on the changes to HARP, we executed a twofold strategy: invest in CMOs derived from pass-throughs issued after May 31, 2009, which were created from mortgages not eligible for HARP treatment, and underweight higher-coupon pass-throughs, where prepayment speeds were likely to be much faster. Since, at period-end, the full effect of the HARP revisions were yet to be felt throughout the market, this strategy aided performance only during the period’s second half.
Some readers may not be familiar with the critical role of prepayment risk when investing in mortgage-backed securities [MBS]. Could you provide an explanation?
Sure. All MBS are subject to prepayment risk, because mortgage holders have the right to prepay their loans without penalty. A homeowner can prepay a mortgage by selling the property, refinancing the mortgage, or otherwise paying off the loan in part or whole. Fast prepayments are generally unwelcome for holders of MBS priced above their $100 par value. That’s because prepayment would result in the loss of the security’s price premium on the prepaid balance. For example, if a security is priced at $105 and, hypothetically speaking, all the borrowers prepay, investors would get back $100 on bonds that had been valued at $105.
What factors hampered the fund’s relative results?
Given the low level of Treasury yields and expectations for modestly improving economic growth, we took a cautious approach toward interest-rate risk by generally keeping the fund’s duration — a key measure of interest-rate sensitivity — shorter than that of the benchmark. However, this positioning, which can be beneficial when rates are rising, was the primary detractor from performance, as longer-term yields declined during most of the period and the yield curve flattened.
How did you use derivatives during the period?
We used futures and interest-rate swaps —which allow two parties to exchange one stream of future interest payments for another, based on a specified principal amount — to take tactical positions at various points along the yield curve.
In addition, we employed interest-rate swaps and “swaptions” — which give us the option to enter into a swap contract — to hedge the interest-rate risk associated with our mortgage pass-through and CMO holdings.
What is your outlook for the coming months, and how are you positioning the fund?
Much of the recent data on the domestic economy has been positive and, in my view, modest GDP growth is likely to continue. Overseas, while there are no easy solutions to the fiscal problems plaguing various European economies, I don’t believe weakness in Europe will spill over and lead to recession in the United States. Similarly, I don’t think China’s economy will slow to the point where it will negatively affect U.S. growth.
That said, there is considerable uncertainty on the horizon, given the major fiscal changes that may occur in 2013, such as the possible expiration of the Bush-era tax cuts, surcharges related to health-care reform, and automatic spending cuts. Changes of this magnitude have investors concerned about their potentially detrimental effect on U.S. economic growth.
As we have seen during the past few years, macroeconomic developments can lead to periods of volatility and constrained liquidity in the credit markets. Accordingly, while we remain optimistic about the direction of the U.S. economic recovery, we are taking a cautious approach toward risk, given the potential for increased volatility.
Thanks for your time and for bringing us up to date, Mike.
8
The views expressed in this report are exclusively those of Putnam Management and are subject to change. They are not meant as investment advice.
Please note that the holdings discussed in this report may not have been held by the fund for the entire period. Portfolio composition is subject to review in accordance with the fund’s investment strategy and may vary in the future. Current and future portfolio holdings are subject to risk.
Of special interest
Your fund’s dividend rate was decreased during the semiannual period ended April 30, 2012. The dividend per class A share declined from $0.020 to $0.016, effective April 2012. The reduction was due to the fund’s increased focus on higher-quality, lower-yielding segments of the bond market, and lower overall yields across the market. Similar reductions were made to other share classes.
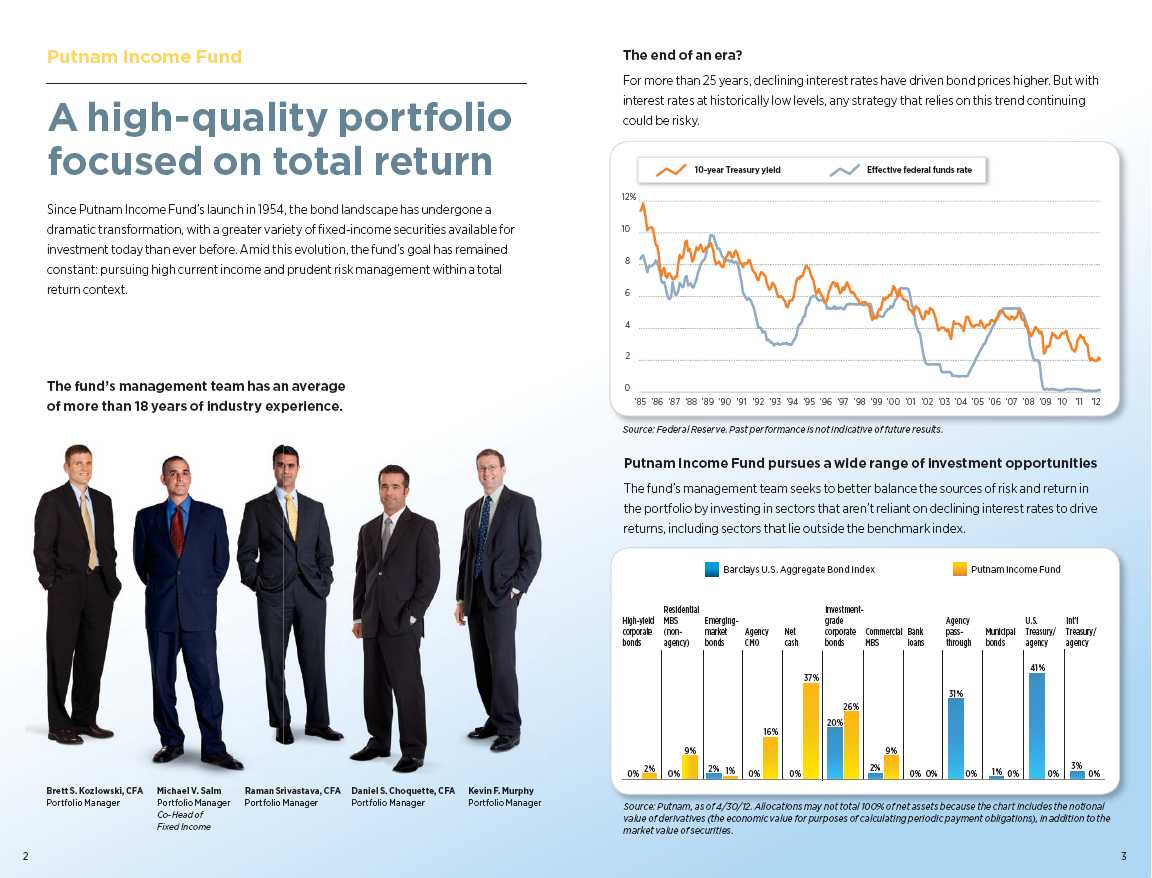
Portfolio Manager Michael V. Salm is Co-Head of Fixed Income at Putnam. He has a B.A. from Cornell University. Michael joined Putnam in 1997 and has been in the investment industry since 1989.
In addition to Michael, your fund’s portfolio managers are Daniel S. Choquette, CFA; Brett S. Kozlowski, CFA; Kevin F. Murphy; and Raman Srivastava, CFA.
A word about derivatives
Derivatives are an increasingly common type of investment instrument, the performance of which is derived from an underlying security, index, currency, or other area of the capital markets. Derivatives employed by the fund’s managers serve one of two main purposes: to implement a strategy that may be difficult or more expensive to invest in through traditional securities, or to hedge unwanted risk associated with a particular position.
For example, the fund’s managers might use forward currency contracts to capitalize on an anticipated change in exchange rates between two currencies. This approach would require a significantly smaller outlay of capital than purchasing traditional bonds denominated in the underlying currencies. In another example, the managers may identify a bond that they believe is undervalued relative to its risk of default, but may seek to reduce the interest-rate risk of that bond by using interest-rate swaps, a derivative through which two parties “swap” payments based on the movement of certain rates.
Like any other investment, derivatives may not appreciate in value and may lose money. Derivatives may in some cases amplify traditional fixed-income risks and may be less liquid than traditional securities. And because derivatives typically represent contractual agreements between two financial institutions, derivatives entail “counterparty risk,” which is the risk that the other party is unable to meet its obligation. Putnam continuously monitors the counterparty risks we assume, and analyzes the cash flows and balance sheets of those institutions we enter into contracts with in much the same way we analyze a company’s financial health before purchasing its stock or debt. Putnam also enters into collateral agreements with counterparties in which collateral is posted on a regular basis to cover the developing gain or loss of open swaps and forward contracts in order to mitigate the level of ongoing counterparty credit risk.
See pages 64–66 for more information on the types of derivatives used.
9
IN THE NEWS
Gasoline prices have dropped in recent weeks from the year-to-date high of $3.94 reached on April 2. As of June 4, 2012, the average price of a gallon of regular gasoline fell to $3.61, the U.S. Energy Information Administration reported. Driving the price declines were waning concerns over Iran’s nuclear program as well as sluggish demand from slow-growing economies in the United States and Europe. Meanwhile, the crude oil supply situation has improved, with some refineries that were slated for closure now coming back online. The recent drop in prices at the pump has led analysts to recalibrate their price predictions for the summer driving season. Just months ago, some predicted that gas prices could shoot above $4 a gallon and reach $5 by the summer. Now those price increases appear unlikely. Because high gas prices can hinder economic growth, falling prices could help by putting more money back into consumers’ pockets.
10
Your fund’s performance
This section shows your fund’s performance, price, and distribution information for periods ended April 30, 2012, the end of the first half of its current fiscal year. In accordance with regulatory requirements for mutual funds, we also include performance information as of the most recent calendar quarter-end and expense information taken from the fund’s current prospectus. Performance should always be considered in light of a fund’s investment strategy. Data represent past performance. Past performance does not guarantee future results. More recent returns may be less or more than those shown. Investment return and principal value will fluctuate, and you may have a gain or a loss when you sell your shares. Performance information does not reflect any deduction for taxes a shareholder may owe on fund distributions or on the redemption of fund shares. For the most recent month-end performance, please visit the Individual Investors section at putnam.com or call Putnam at 1-800-225-1581. Class R and class Y shares are not available to all investors. See the Terms and Definitions section in this report for definitions of the share classes offered by your fund.
Fund performance Total return for periods ended 4/30/12
| | | | | | | | | | |
| | Class A | Class B | Class C | Class M | Class R | Class Y |
| (inception dates) | (11/1/54) | (3/1/93) | (7/26/99) | (12/14/94) | (1/21/03) | (6/16/94) |
|
| | Before | After | | | | | Before | After | Net | Net |
| | sales | sales | Before | After | Before | After | sales | sales | asset | asset |
| charge | charge | CDSC | CDSC | CDSC | CDSC | charge | charge | value | value |
|
| Annual average | | | | | | | | | | |
| (life of fund) | 7.85% | 7.78% | 6.87% | 6.87% | 7.04% | 7.04% | 7.41% | 7.35% | 7.58% | 7.94% |
|
| 10 years | 76.45 | 69.43 | 63.51 | 63.51 | 63.58 | 63.58 | 71.86 | 66.20 | 72.05 | 80.76 |
| Annual average | 5.84 | 5.41 | 5.04 | 5.04 | 5.04 | 5.04 | 5.56 | 5.21 | 5.58 | 6.10 |
|
| 5 years | 40.29 | 34.72 | 34.83 | 32.83 | 35.06 | 35.06 | 38.34 | 33.94 | 38.36 | 41.91 |
| Annual average | 7.01 | 6.14 | 6.16 | 5.84 | 6.20 | 6.20 | 6.71 | 6.02 | 6.71 | 7.25 |
|
| 3 years | 51.56 | 45.41 | 47.74 | 44.74 | 47.94 | 47.94 | 50.26 | 45.38 | 50.12 | 52.58 |
| Annual average | 14.87 | 13.29 | 13.89 | 13.12 | 13.94 | 13.94 | 14.54 | 13.28 | 14.50 | 15.12 |
|
| 1 year | 4.05 | –0.15 | 3.17 | –1.82 | 3.16 | 2.16 | 3.74 | 0.33 | 3.82 | 4.38 |
|
| 6 months | 2.61 | –1.56 | 2.12 | –2.88 | 2.12 | 1.12 | 2.42 | –0.97 | 2.37 | 2.82 |
|
Current performance may be lower or higher than the quoted past performance, which cannot guarantee future results. After-sales-charge returns for class A and M shares reflect the deduction of the maximum 4.00% and 3.25% sales charge, respectively, levied at the time of purchase. Class B share returns after contingent deferred sales charge (CDSC) reflect the applicable CDSC, which is 5% in the first year, declining over time to 1% in the sixth year, and is eliminated thereafter. Class C share returns after CDSC reflect a 1% CDSC for the first year that is eliminated thereafter. Class R and Y shares have no initial sales charge or CDSC. Performance for class B, C, M, R, and Y shares before their inception is derived from the historical performance of class A shares, adjusted for the applicable sales charge (or CDSC) and the higher operating expenses for such shares, except for class Y shares, for which 12b-1 fees are not applicable.
For a portion of the periods, the fund had expense limitations, without which returns would have been lower.
Class B share performance does not reflect conversion to class A shares.
11
Comparative index returns For periods ended 4/30/12
| | |
| | Barclays U.S. Aggregate | Lipper Corporate Debt Funds A-Rated |
| | Bond Index | category average* |
|
| Annual average (life of fund) | —† | —† |
|
| 10 years | 74.29% | 71.54% |
| Annual average | 5.71 | 5.48 |
|
| 5 years | 36.16 | 33.92 |
| Annual average | 6.37 | 5.98 |
|
| 3 years | 22.70 | 31.96 |
| Annual average | 7.06 | 9.61 |
|
| 1 year | 7.54 | 7.10 |
|
| 6 months | 2.44 | 3.13 |
|
Index and Lipper results should be compared with fund performance before sales charge, before CDSC, or at net asset value.
* Over the 6-month, 1-year, 3-year, 5-year, and 10-year periods ended 4/30/12, there were 117, 116, 98, 93, and 58 funds, respectively, in this Lipper category.
† The fund’s benchmark, the Barclays U.S. Aggregate Bond Index, was introduced on 12/31/75, and the fund’s Lipper category was introduced on 12/31/59. Both post-date the inception date of the fund’s class A shares.
Fund price and distribution information For the six-month period ended 4/30/12
| | | | | | | | |
| Distributions | Class A | Class B | Class C | Class M | Class R | Class Y |
|
| Number | 6 | 6 | 6 | 6 | 6 | 6 |
|
| Income | $0.116 | $0.092 | $0.092 | $0.110 | $0.109 | $0.122 |
|
| Capital gains | — | — | — | — | — | — |
|
| Total | $0.116 | $0.092 | $0.092 | $0.110 | $0.109 | $0.122 |
|
| | Before | After | Net | Net | Before | After | Net | Net |
| | sales | sales | asset | asset | sales | sales | asset | asset |
| Share value | charge | charge | value | value | charge | charge | value | value |
|
| 10/31/11 | $6.84 | $7.13 | $6.78 | $6.80 | $6.71 | $6.94 | $6.81 | $6.91 |
|
| 4/30/12 | 6.90 | 7.19 | 6.83 | 6.85 | 6.76 | 6.99 | 6.86 | 6.98 |
|
| | Before | After | Net | Net | Before | After | Net | Net |
| | sales | sales | asset | asset | sales | sales | asset | asset |
| Current yield (end of period) | charge | charge | value | value | charge | charge | value | value |
|
| Current dividend rate 1 | 2.78% | 2.67% | 2.11% | 2.10% | 2.66% | 2.58% | 2.62% | 2.92% |
|
| Current 30-day SEC yield 2 | | | | | | | | |
| (with expense limitation) | N/A | 2.56 | 1.92 | 1.93 | N/A | 2.34 | 2.42 | 2.91 |
|
The classification of distributions, if any, is an estimate. Before-sales-charge share value and current dividend rate for class A and M shares, if applicable, do not take into account any sales charge levied at the time of purchase. After-sales-charge share value, current dividend rate, and current 30-day SEC yield, if applicable, are calculated assuming that the maximum sales charge (4.00% for class A shares and 3.25% for class M shares) was levied at the time of purchase. Final distribution information will appear on your year-end tax forms.
1 Most recent distribution, excluding capital gains, annualized and divided by share price before or after sales charge at period-end.
2 Based only on investment income and calculated using the maximum offering price for each share class, in accordance with SEC guidelines.
12
Fund performance as of most recent calendar quarter
Total return for periods ended 3/31/12
| | | | | | | | | | |
| | Class A | Class B | Class C | Class M | Class R | Class Y |
| (inception dates) | (11/1/54) | (3/1/93) | (7/26/99) | (12/14/94) | (1/21/03) | (6/16/94) |
|
| | Before | After | | | | | Before | After | Net | Net |
| | sales | sales | Before | After | Before | After | sales | sales | asset | asset |
| charge | charge | CDSC | CDSC | CDSC | CDSC | charge | charge | value | value |
|
| Annual average | | | | | | | | | | |
| (life of fund) | 7.85% | 7.77% | 6.86% | 6.86% | 7.04% | 7.04% | 7.41% | 7.35% | 7.58% | 7.93% |
|
| 10 years | 78.04 | 70.85 | 65.22 | 65.22 | 65.28 | 65.28 | 73.65 | 68.10 | 73.86 | 82.39 |
| Annual average | 5.94 | 5.50 | 5.15 | 5.15 | 5.15 | 5.15 | 5.67 | 5.33 | 5.69 | 6.19 |
|
| 5 years | 39.71 | 34.15 | 34.46 | 32.46 | 34.50 | 34.50 | 37.96 | 33.57 | 37.78 | 41.34 |
| Annual average | 6.92 | 6.05 | 6.10 | 5.78 | 6.11 | 6.11 | 6.65 | 5.96 | 6.62 | 7.17 |
|
| 3 years | 57.30 | 50.95 | 53.86 | 50.86 | 53.78 | 53.78 | 56.26 | 51.26 | 56.33 | 58.61 |
| Annual average | 16.30 | 14.71 | 15.45 | 14.69 | 15.43 | 15.43 | 16.04 | 14.79 | 16.06 | 16.62 |
|
| 1 year | 4.86 | 0.72 | 3.98 | –1.03 | 4.12 | 3.12 | 4.57 | 1.24 | 4.64 | 5.03 |
|
| 6 months | 2.38 | –1.66 | 2.04 | –2.96 | 2.03 | 1.03 | 2.34 | –0.93 | 2.29 | 2.44 |
|
Your fund’s expenses
As a mutual fund investor, you pay ongoing expenses, such as management fees, distribution fees (12b-1 fees), and other expenses. Using the following information, you can estimate how these expenses affect your investment and compare them with the expenses of other funds. You may also pay one-time transaction expenses, including sales charges (loads) and redemption fees, which are not shown in this section and would have resulted in higher total expenses. For more information, see your fund’s prospectus or talk to your financial representative.
Expense ratios
| | | | | | |
| | Class A | Class B | Class C | Class M | Class R | Class Y |
|
| Total annual operating expenses for the fiscal year | | | | | | |
| ended 10/31/11 | 0.87% | 1.62% | 1.62% | 1.12% | 1.12% | 0.62% |
|
| Annualized expense ratio for the six-month period | | | | | | |
| ended 4/30/12 | 0.87% | 1.62% | 1.62% | 1.12% | 1.12% | 0.62% |
|
Fiscal-year expense information in this table is taken from the most recent prospectus, is subject to change, and may differ from that shown for the annualized expense ratio and in the financial highlights of this report. Expenses are shown as a percentage of average net assets.
13
Expenses per $1,000
The following table shows the expenses you would have paid on a $1,000 investment in the fund from November 1, 2011, to April 30, 2012. It also shows how much a $1,000 investment would be worth at the close of the period, assuming actual returns and expenses.
| | | | | | |
| | Class A | Class B | Class C | Class M | Class R | Class Y |
|
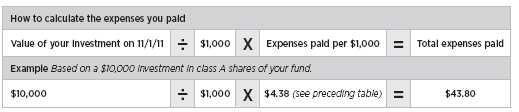
| Expenses paid per $1,000*† | $4.38 | $8.14 | $8.14 | $5.64 | $5.64 | $3.13 |
|
| Ending value (after expenses) | $1,026.10 | $1,021.20 | $1,021.20 | $1,024.20 | $1,023.70 | $1,028.20 |
|
* Expenses for each share class are calculated using the fund’s annualized expense ratio for each class, which represents the ongoing expenses as a percentage of average net assets for the six months ended 4/30/12. The expense ratio may differ for each share class.
† Expenses are calculated by multiplying the expense ratio by the average account value for the period; then multiplying the result by the number of days in the period; and then dividing that result by the number of days in the year.
Estimate the expenses you paid
To estimate the ongoing expenses you paid for the six months ended April 30, 2012, use the following calculation method. To find the value of your investment on November 1, 2011, call Putnam at 1-800-225-1581.
Compare expenses using the SEC’s method
The Securities and Exchange Commission (SEC) has established guidelines to help investors assess fund expenses. Per these guidelines, the following table shows your fund’s expenses based on a $1,000 investment, assuming a hypothetical 5% annualized return. You can use this information to compare the ongoing expenses (but not transaction expenses or total costs) of investing in the fund with those of other funds. All mutual fund shareholder reports will provide this information to help you make this comparison. Please note that you cannot use this information to estimate your actual ending account balance and expenses paid during the period.
| | | | | | |
| | Class A | Class B | Class C | Class M | Class R | Class Y |
|
| Expenses paid per $1,000*† | $4.37 | $8.12 | $8.12 | $5.62 | $5.62 | $3.12 |
|
| Ending value (after expenses) | $1,020.54 | $1,016.81 | $1,016.81 | $1,019.29 | $1,019.29 | $1,021.78 |
|
* Expenses for each share class are calculated using the fund’s annualized expense ratio for each class, which represents the ongoing expenses as a percentage of average net assets for the six months ended 4/30/12. The expense ratio may differ for each share class.
† Expenses are calculated by multiplying the expense ratio by the average account value for the period; then multiplying the result by the number of days in the period; and then dividing that result by the number of days in the year.
14
Important terms
Total return shows how the value of the fund’s shares changed over time, assuming you held the shares through the entire period and reinvested all distributions in the fund.
Before sales charge, or net asset value, is the price, or value, of one share of a mutual fund, without a sales charge. Before-sales-charge figures fluctuate with market conditions, and are calculated by dividing the net assets of each class of shares by the number of outstanding shares in the class.
After sales charge is the price of a mutual fund share plus the maximum sales charge levied at the time of purchase. After-sales-charge performance figures shown here assume the 4.00% maximum sales charge for class A shares and 3.25% for class M shares.
Contingent deferred sales charge (CDSC) is generally a charge applied at the time of the redemption of class B or C shares and assumes redemption at the end of the period. Your fund’s class B CDSC declines over time from a 5% maximum during the first year to 1% during the sixth year. After the sixth year, the CDSC no longer applies. The CDSC for class C shares is 1% for one year after purchase.
Share classes
Class A shares are generally subject to an initial to sales charge and no CDSC (except on certain redemptions of shares bought without an initial sales charge).
Class B shares are not subject to an initial sales charge. They may be subject to a CDSC.
Class C shares are not subject to an initial sales charge and are subject to a CDSC only if the shares are redeemed during the first year.
Class M shares have a lower initial sales charge and a higher 12b-1 fee than class A shares and no CDSC (except on certain redemptions of shares bought without an initial sales charge).
Class R shares are not subject to an initial sales charge or CDSC and are available only to certain defined contribution plans.
Class Y shares are not subject to an initial sales charge or CDSC, and carry no 12b-1 fee. They are generally only available to corporate and institutional clients and clients in other approved programs.
Fixed-income terms
Current yield is the annual rate of return earned from dividends or interest of an investment. Current yield is expressed as a percentage of the price of a security, fund share, or principal investment.
Mortgage-backed security (MBS), also known as a mortgage “pass-through,” is a type of asset-backed security that is secured by a mortgage or collection of mortgages. The following are types of MBSs:
• Agency “pass-through” has its principal and interest backed by a U.S. government agency, such as the Federal National Mortgage Association (Fannie Mae), Government National Mortgage Association (Ginnie Mae), and Federal Home Loan Mortgage Corporation (Freddie Mac).
• Collateralized mortgage obligation (CMO) represents claims to specific cash flows from pools of home mortgages. The streams of principal and interest payments on the mortgages are distributed to the different classes of CMO interests in “tranches.” Each tranche may have different principal balances, coupon rates, prepayment risks, and maturity dates. A CMO is highly sensitive changes in interest rates and any resulting change in the rate at which homeowners sell their properties, refinance, or otherwise prepay loans. CMOs are subject to prepayment, market, and liquidity risks.
• Interest-only (IO) security is a type of CMO in which the underlying asset is the interest portion of mortgage, Treasury, or bond payments.
• Non-agency residential mortgage-backed security (RMBS) is an MBS not backed by Fannie Mae, Ginnie Mae, or Freddie Mac. One type of RMBS is an Alt-A mortgage-backed security.
• Commercial mortgage-backed security (CMBS) is secured by the loan on a commercial property.
Yield curve is a graph that plots the yields of bonds with equal credit quality against their
15
differing maturity dates, ranging from shortest to longest. It is used as a benchmark for other debt, such as mortgage or bank lending rates.
Comparative indexes
Barclays U.S. Aggregate Bond Index is an unmanaged index of U.S. investment-grade fixed-income securities.
BofA (Bank of America) Merrill Lynch U.S. 3-Month Treasury Bill Index is an unmanaged index that seeks to measure the performance of U.S. Treasury bills available in the marketplace.
S&P 500 Index is an unmanaged index of common stock performance.
Indexes assume reinvestment of all distributions and do not account for fees. Securities and performance of a fund and an index will differ. You cannot invest directly in an index.
Lipper is a third-party industry-ranking entity that ranks mutual funds. Its rankings do not reflect sales charges. Lipper rankings are based on total return at net asset value relative to other funds that have similar current investment styles or objectives as determined by Lipper. Lipper may change a fund’s category assignment at its discretion. Lipper category averages reflect performance trends for funds within a category.
Other information for shareholders
Important notice regarding delivery of shareholder documents
In accordance with Securities and Exchange Commission (SEC) regulations, Putnam sends a single copy of annual and semiannual shareholder reports, prospectuses, and proxy statements to Putnam shareholders who share the same address, unless a shareholder requests otherwise. If you prefer to receive your own copy of these documents, please call Putnam at 1-800-225-1581, and Putnam will begin sending individual copies within 30 days.
Proxy voting
Putnam is committed to managing our mutual funds in the best interests of our shareholders. The Putnam funds’ proxy voting guidelines and procedures, as well as information regarding how your fund voted proxies relating to portfolio securities during the 12-month period ended June 30, 2011, are available in the Individual Investors section of putnam.com, and on the SEC’s website, www.sec.gov. If you have questions about finding forms on the SEC’s website, you may call the SEC at 1-800-SEC-0330. You may also obtain the Putnam funds’ proxy voting guidelines and procedures at no charge by calling Putnam’s Shareholder Services at 1-800-225-1581.
Fund portfolio holdings
The fund will file a complete schedule of its portfolio holdings with the SEC for the first and third quarters of each fiscal year on Form N-Q. Shareholders may obtain the fund’s Forms N-Q on the SEC’s website at www.sec.gov. In addition, the fund’s Forms N-Q may be reviewed and copied at the SEC’s Public Reference Room in Washington, D.C. You may call the SEC at 1-800-SEC-0330 for information about the SEC’s website or the operation of the Public Reference Room.
Trustee and employee fund ownership
Putnam employees and members of the Board of Trustees place their faith, confidence, and, most importantly, investment dollars in Putnam mutual funds. As of April 30, 2012, Putnam employees had approximately $350,000,000 and the Trustees had approximately $80,000,000 invested in Putnam mutual funds. These amounts include investments by the Trustees’ and employees’ immediate family members as well as investments through retirement and deferred compensation plans.
16
Financial statements
A guide to financial statements
These sections of the report, as well as the accompanying Notes, constitute the fund’s financial statements.
The fund’s portfolio lists all the fund’s investments and their values as of the last day of the reporting period. Holdings are organized by asset type and industry sector, country, or state to show areas of concentration and diversification.
Statement of assets and liabilities shows how the fund’s net assets and share price are determined. All investment and non-investment assets are added together. Any unpaid expenses and other liabilities are subtracted from this total. The result is divided by the number of shares to determine the net asset value per share, which is calculated separately for each class of shares. (For funds with preferred shares, the amount subtracted from total assets includes the liquidation preference of preferred shares.)
Statement of operations shows the fund’s net investment gain or loss. This is done by first adding up all the fund’s earnings — from dividends and interest income — and subtracting its operating expenses to determine net investment income (or loss). Then, any net gain or loss the fund realized on the sales of its holdings — as well as any unrealized gains or losses over the period — is added to or subtracted from the net investment result to determine the fund’s net gain or loss for the fiscal period.
Statement of changes in net assets shows how the fund’s net assets were affected by the fund’s net investment gain or loss, by distributions to shareholders, and by changes in the number of the fund’s shares. It lists distributions and their sources (net investment income or realized capital gains) over the current reporting period and the most recent fiscal year-end. The distributions listed here may not match the sources listed in the Statement of operations because the distributions are determined on a tax basis and may be paid in a different period from the one in which they were earned. Dividend sources are estimated at the time of declaration. Actual results may vary. Any non-taxable return of capital cannot be determined until final tax calculations are completed after the end of the fund’s fiscal year.
Financial highlights provide an overview of the fund’s investment results, per-share distributions, expense ratios, net investment income ratios, and portfolio turnover in one summary table, reflecting the five most recent reporting periods. In a semiannual report, the highlights table also includes the current reporting period.
17
The fund’s portfolio 4/30/12 (Unaudited)
| | |
| U.S. GOVERNMENT AGENCY MORTGAGE OBLIGATIONS (37.5%)* | Principal amount | Value |
|
| Federal National Mortgage Association | | |
| Pass-Through Certificates | | |
| 7s, January 1, 2017 | $7,596 | $8,001 |
| 4 1/2s, TBA, May 1, 2042 | 9,000,000 | 9,636,328 |
| 4s, TBA, May 1, 2042 | 73,000,000 | 77,220,313 |
| 3 1/2s, TBA, June 1, 2042 | 135,000,000 | 139,809,375 |
| 3 1/2s, TBA, May 1, 2042 | 278,000,000 | 288,685,625 |
|
| Total U.S. government agency mortgage obligations (cost $510,145,501) | $515,359,642 |
|
| |
| MORTGAGE-BACKED SECURITIES (30.1%)* | Principal amount | Value |
|
| Adjustable Rate Mortgage Trust FRB Ser. 05-7, Class 7A21, | | |
| 0.489s, 2035 | $6,581,528 | $5,001,961 |
|
| Banc of America Commercial Mortgage, Inc. | | |
| Ser. 04-4, Class D, 5.073s, 2042 | 1,667,000 | 1,575,315 |
| Ser. 07-1, Class XW, IO, 0.466s, 2049 | 11,438,675 | 113,220 |
|
| Banc of America Commercial Mortgage, Inc. 144A | | |
| Ser. 04-4, Class XC, IO, 1.04s, 2042 | 20,004,590 | 261,760 |
| Ser. 04-5, Class XC, IO, 0.879s, 2041 | 33,624,136 | 446,865 |
| Ser. 02-PB2, Class XC, IO, 0.731s, 2035 | 12,281,447 | 10,734 |
| Ser. 07-5, Class XW, IO, 0.58s, 2051 | 21,744,635 | 329,431 |
| Ser. 05-1, Class XW, IO, 0.075s, 2042 | 314,446,690 | 139,300 |
|
| Bear Stearns Asset Backed Securities Trust FRB Ser. 04-AC6, | | |
| Class A2, 0.639s, 2034 | 4,781,641 | 3,251,516 |
|
| Bear Stearns Commercial Mortgage Securities, Inc. | | |
| Ser. 04-PWR3, Class D, 4.889s, 2041 F | 1,989,000 | 1,944,982 |
| Ser. 04-PR3I, Class X1, IO, 1.158s, 2041 | 8,275,208 | 136,036 |
|
| Bear Stearns Commercial Mortgage Securities, Inc. 144A | | |
| Ser. 06-PW14, Class X1, IO, 0.232s, 2038 F | 17,538,219 | 298,239 |
|
| CFCRE Commercial Mortgage Trust 144A Ser. 11-C1, Class XA, | | |
| IO, 1.674s, 2044 F | 29,151,309 | 2,064,789 |
|
| Citigroup Commercial Mortgage Trust FRB Ser. 05-C3, | | |
| Class AJ, 4.96s, 2043 | 2,050,000 | 1,920,112 |
|
| Citigroup Commercial Mortgage Trust 144A Ser. 06-C5, | | |
| Class XC, IO, 0.154s, 2049 | 79,085,783 | 1,104,038 |
|
| Citigroup/Deutsche Bank Commercial Mortgage Trust | | |
| Ser. 07-CD4, Class A2B, 5.205s, 2049 | 534,224 | 539,728 |
|
| Citigroup/Deutsche Bank Commercial Mortgage Trust 144A | | |
| Ser. 07-CD4, Class XW, IO, 0.573s, 2049 | 50,406,175 | 742,987 |
| Ser. 07-CD4, Class XC, IO, 0.224s, 2049 | 159,839,641 | 1,406,589 |
|
| Commercial Mortgage Acceptance Corp. 144A Ser. 98-C1, | | |
| Class F, 6.23s, 2031 | 351,300 | 358,820 |
|
| Commercial Mortgage Pass-Through Certificates | | |
| Ser. 05-C6, Class AJ, 5.209s, 2044 | 4,547,000 | 4,471,656 |
| Ser. 05-LP5, Class B, 5.105s, 2043 F | 1,755,000 | 1,650,123 |
|
| Commercial Mortgage Pass-Through Certificates 144A | | |
| Ser. 05-LP5, Class XC, IO, 0.23s, 2043 | 26,484,479 | 271,439 |
| Ser. 06-C8, Class XS, IO, 0.207s, 2046 | 59,337,966 | 745,961 |
| Ser. 05-C6, Class XC, IO, 0.112s, 2044 F | 51,670,817 | 277,505 |
|
18
| | |
| MORTGAGE-BACKED SECURITIES (30.1%)* cont. | Principal amount | Value |
|
| Credit Suisse Mortgage Capital Certificates | | |
| FRB Ser. 07-C4, Class A2, 5.967s, 2039 | $4,477,997 | $4,471,979 |
| Ser. 06-C5, Class AX, IO, 0.234s, 2039 | 30,497,166 | 411,601 |
|
| Credit Suisse Mortgage Capital Certificates 144A | | |
| Ser. 07-C2, Class AX, IO, 0.258s, 2049 | 93,105,884 | 558,930 |
|
| CS First Boston Mortgage Securities Corp. | | |
| FRB Ser. 04-C2, Class D, 5.575s, 2036 | 1,733,000 | 1,733,000 |
| Ser. 05-C6, Class AJ, 5.23s, 2040 ∆ F | 1,825,000 | 1,802,459 |
| Ser. 05-C5, Class AJ, 5.1s, 2038 F | 3,941,000 | 3,999,320 |
| FRB Ser. 04-C5, Class B, 4.929s, 2037 | 1,590,000 | 1,594,770 |
| Ser. 03-CPN1, Class E, 4.891s, 2035 | 1,528,000 | 1,515,700 |
|
| CS First Boston Mortgage Securities Corp. 144A | | |
| Ser. 98-C1, Class F, 6s, 2040 | 2,625,429 | 2,825,633 |
| FRB Ser. 03-CK2, Class G, 5.744s, 2036 | 2,984,000 | 2,974,038 |
| Ser. 03-C3, Class AX, IO, 1.937s, 2038 | 63,502,846 | 695,991 |
| Ser. 02-CP3, Class AX, IO, 1.452s, 2035 | 15,802,570 | 8,533 |
| Ser. 04-C4, Class AX, IO, 1.189s, 2039 | 6,152,761 | 94,488 |
|
| Deutsche Mortgage Securities, Inc. Ser. 2009-RS2, | | |
| Class 4A2, 0.372s, 2037 | 8,894,363 | 3,557,745 |
|
| DLJ Commercial Mortgage Corp. 144A FRB Ser. 98-CG1, | | |
| Class B4, 7.444s, 2031 | 3,188,000 | 3,332,456 |
|
| Federal Home Loan Mortgage Corp. | | |
| IFB Ser. 3408, Class EK, 24.826s, 2037 | 1,846,966 | 2,958,982 |
| IFB Ser. 2976, Class LC, 23.539s, 2035 | 260,840 | 414,736 |
| IFB Ser. 2979, Class AS, 23.392s, 2034 | 192,361 | 264,568 |
| IFB Ser. 3072, Class SB, 22.769s, 2035 | 1,005,932 | 1,547,133 |
| IFB Ser. 3249, Class PS, 21.482s, 2036 | 959,881 | 1,415,947 |
| IFB Ser. 3065, Class DC, 19.139s, 2035 | 1,083,876 | 1,662,394 |
| IFB Ser. 2990, Class LB, 16.332s, 2034 | 1,332,734 | 1,832,815 |
| IFB Ser. 3835, Class SN, 15.524s, 2041 | 9,573,624 | 13,320,261 |
| IFB Ser. 3835, Class SC, IO, 6.41s, 2038 | 8,861,160 | 1,629,833 |
| IFB Ser. 3803, Class SP, IO, 6.36s, 2038 | 11,150,148 | 1,448,538 |
| IFB Ser. 3861, Class PS, IO, 6.36s, 2037 | 5,801,568 | 969,558 |
| IFB Ser. 3907, Class KS, IO, 6.31s, 2040 | 6,605,155 | 1,217,030 |
| IFB Ser. 3708, Class SA, IO, 6.21s, 2040 | 20,657,643 | 3,026,758 |
| IFB Ser. 3852, Class NT, 5.76s, 2041 | 3,998,836 | 4,182,022 |
| IFB Ser. 3852, Class TB, 5.76s, 2041 | 3,221,516 | 3,372,766 |
| IFB Ser. 3752, Class PS, IO, 5.76s, 2040 | 9,161,019 | 1,563,878 |
| Ser. 3632, Class CI, IO, 5s, 2038 | 419,098 | 34,048 |
| Ser. 3626, Class DI, IO, 5s, 2037 | 274,947 | 12,909 |
| Ser. 4018, Class DI, IO, 4 1/2s, 2041 | 10,728,345 | 1,544,345 |
| Ser. 3747, Class HI, IO, 4 1/2s, 2037 | 2,563,976 | 302,039 |
| Ser. 3707, Class PI, IO, 4 1/2s, 2025 | 11,158,827 | 887,573 |
| Ser. 3768, Class MI, IO, 4s, 2035 | 58,780,514 | 5,676,975 |
| Ser. 3736, Class QI, IO, 4s, 2034 | 13,221,748 | 628,033 |
| Ser. 3740, Class KI, IO, 4s, 2033 | 17,634,355 | 725,830 |
| Ser. T-56, Class A, IO, 0.524s, 2043 | 13,985,642 | 209,785 |
| Ser. T-56, Class 3, IO, 0.477s, 2043 | 4,947,164 | 64,932 |
| Ser. T-56, Class 1, IO, 0.295s, 2043 | 16,941,617 | 127,062 |
| Ser. T-56, Class 2, IO, 0 1/8s, 2043 | 5,964,862 | 18,640 |
| Ser. 3369, Class BO, PO, zero %, 2037 | 69,532 | 63,707 |
19
| | |
| MORTGAGE-BACKED SECURITIES (30.1%)* cont. | Principal amount | Value |
|
| Federal Home Loan Mortgage Corp. | | |
| Ser. 3391, PO, zero %, 2037 | $184,231 | $162,821 |
| Ser. 3300, PO, zero %, 2037 | 1,148,884 | 1,065,857 |
| Ser. 3206, Class EO, PO, zero %, 2036 | 45,716 | 41,694 |
| Ser. 3175, Class MO, PO, zero %, 2036 | 148,704 | 135,887 |
| Ser. 3210, PO, zero %, 2036 | 37,679 | 34,972 |
| FRB Ser. 3326, Class YF, zero %, 2037 | 33,992 | 33,354 |
| FRB Ser. 3117, Class AF, zero %, 2036 | 47,887 | 39,046 |
| FRB Ser. 3326, Class WF, zero %, 2035 | 116,773 | 102,875 |
| FRB Ser. 3036, Class AS, zero %, 2035 | 67,537 | 55,925 |
|
| Federal National Mortgage Association | | |
| IFB Ser. 06-62, Class PS, 38.468s, 2036 | 1,978,645 | 3,554,050 |
| IFB Ser. 06-8, Class HP, 23.691s, 2036 | 1,027,137 | 1,702,119 |
| IFB Ser. 05-45, Class DA, 23.545s, 2035 | 2,050,473 | 3,296,888 |
| IFB Ser. 05-122, Class SE, 22.264s, 2035 | 1,886,396 | 2,794,784 |
| IFB Ser. 05-75, Class GS, 19.534s, 2035 | 866,241 | 1,239,859 |
| IFB Ser. 05-106, Class JC, 19.384s, 2035 | 1,020,259 | 1,601,051 |
| IFB Ser. 05-83, Class QP, 16.773s, 2034 | 240,133 | 326,581 |
| IFB Ser. 11-4, Class CS, 12.423s, 2040 | 2,467,352 | 2,862,129 |
| IFB Ser. 10-129, Class PS, IO, 6.461s, 2038 | 27,608,976 | 4,762,548 |
| IFB Ser. 12-4, Class SN, IO, 6.361s, 2040 | 7,941,341 | 1,497,657 |
| IFB Ser. 12-3, Class CS, IO, 6.311s, 2040 | 10,751,257 | 2,059,081 |
| IFB Ser. 12-3, Class SD, IO, 6.271s, 2042 | 4,059,642 | 768,774 |
| IFB Ser. 11-67, Class BS, IO, 6.261s, 2041 | 21,630,602 | 3,471,712 |
| IFB Ser. 11-27, Class AS, IO, 6.241s, 2041 | 15,810,076 | 2,331,038 |
| IFB Ser. 12-30, Class HS, IO, 6.211s, 2042 | 32,450,398 | 6,603,007 |
| IFB Ser. 10-35, Class SG, IO, 6.161s, 2040 | 35,252,886 | 5,697,571 |
| IFB Ser. 12-4, Class SY, IO, 5.711s, 2042 | 6,779,277 | 1,125,224 |
| Ser. 03-W10, Class 1, IO, 1.431s, 2043 | 11,848,837 | 559,117 |
| Ser. 01-50, Class B1, IO, 0.408s, 2041 | 1,078,434 | 12,132 |
| Ser. 2002-W6, Class 1AIO, 0.272s, 2042 | 1,275,922 | 12,759 |
| Ser. 2005-W4, Class 1AIO, 0.123s, 2035 | 306,038 | 2,678 |
| Ser. 03-34, Class P1, PO, zero %, 2043 | 280,849 | 224,679 |
| Ser. 07-64, Class LO, PO, zero %, 2037 | 306,113 | 281,299 |
| Ser. 07-14, Class KO, PO, zero %, 2037 | 660,825 | 600,002 |
| Ser. 06-125, Class OX, PO, zero %, 2037 | 118,812 | 111,923 |
| Ser. 06-84, Class OT, PO, zero %, 2036 | 86,407 | 80,357 |
| Ser. 06-46, Class OC, PO, zero %, 2036 | 83,339 | 75,634 |
| Ser. 04-61, Class CO, PO, zero %, 2031 | 81,595 | 81,081 |
| FRB Ser. 06-104, Class EK, zero %, 2036 | 7,310 | 7,091 |
| IFB Ser. 06-48, Class FG, zero %, 2036 | 27,985 | 27,960 |
|
| First Union National Bank-Bank of America Commercial | | |
| Mortgage 144A Ser. 01-C1, Class 3, IO, 1.52s, 2033 | 3,631,488 | 36 |
|
| GE Capital Commercial Mortgage Corp. 144A | | |
| Ser. 05-C2, Class XC, IO, 0.157s, 2043 | 45,071,071 | 332,625 |
| Ser. 07-C1, Class XC, IO, 0.15s, 2049 | 123,413,886 | 748,505 |
| Ser. 05-C3, Class XC, IO, 0.132s, 2045 | 310,956,322 | 1,305,395 |
|
| GMAC Commercial Mortgage Securities, Inc. | | |
| Ser. 97-C1, Class X, IO, 1.336s, 2029 | 3,677,057 | 104,491 |
| Ser. 05-C1, Class X1, IO, 0.308s, 2043 | 34,860,609 | 466,330 |
|
20
| | |
| MORTGAGE-BACKED SECURITIES (30.1%)* cont. | Principal amount | Value |
|
| GMAC Commercial Mortgage Securities, Inc. 144A Ser. 99-C3, | | |
| Class G, 6.974s, 2036 | $6,757 | $6,117 |
|
| Government National Mortgage Association | | |
| IFB Ser. 11-56, Class SA, 23.504s, 2041 | 14,858,416 | 22,891,321 |
| IFB Ser. 10-158, Class SD, 14.281s, 2040 | 2,780,250 | 3,898,272 |
| IFB Ser. 11-70, Class WS, 9.221s, 2040 | 11,858,000 | 13,396,338 |
| IFB Ser. 11-72, Class SE, 7.084s, 2041 | 9,422,000 | 9,654,007 |
| IFB Ser. 11-56, Class MS, 6.831s, 2041 | 6,550,492 | 7,152,286 |
| IFB Ser. 11-56, Class SG, 6.831s, 2041 | 3,742,439 | 4,108,823 |
| IFB Ser. 11-37, Class SB, IO, 6.46s, 2038 | 2,568,074 | 354,132 |
| IFB Ser. 11-61, Class CS, IO, 6.44s, 2035 | 26,557,320 | 4,019,742 |
| IFB Ser. 11-37, Class SD, IO, 6.41s, 2038 | 3,304,672 | 451,696 |
| IFB Ser. 10-42, Class SP, IO, 6.31s, 2039 | 6,518,633 | 1,009,997 |
| IFB Ser. 11-70, Class SM, IO, 5.65s, 2041 | 5,789,000 | 1,700,461 |
| Ser. 11-116, Class IA, IO, 4 1/2s, 2039 | 12,432,384 | 1,587,118 |
| Ser. 12-8, Class PI, IO, 4s, 2041 | 17,219,163 | 3,035,739 |
| Ser. 11-116, Class BI, IO, 4s, 2026 | 10,634,102 | 1,200,696 |
| IFB Ser. 11-70, Class YI, IO, 0.15s, 2040 | 15,722,313 | 83,014 |
| Ser. 11-70, PO, zero %, 2041 | 40,170,678 | 31,525,546 |
| Ser. 10-151, Class KO, PO, zero %, 2037 | 1,384,958 | 1,259,523 |
| Ser. 06-36, Class OD, PO, zero %, 2036 | 83,378 | 76,930 |
| Ser. 99-31, Class MP, PO, zero %, 2029 | 36,853 | 34,229 |
|
| Greenpoint Mortgage Funding Trust FRB Ser. 05-AR2, | | |
| Class A1, 0.469s, 2045 | 4,842,603 | 2,881,349 |
|
| Greenwich Capital Commercial Funding Corp. 144A | | |
| Ser. 03-C1, Class G, 4.773s, 2035 | 1,618,000 | 1,578,796 |
| Ser. 05-GG3, Class XC, IO, 0.917s, 2042 | 75,956,097 | 1,067,563 |
|
| GS Mortgage Securities Corp. II Ser. 06-GG6, Class A2, | | |
| 5.506s, 2038 | 426,032 | 437,415 |
|
| GS Mortgage Securities Corp. II 144A | | |
| Ser. 98-C1, Class F, 6s, 2030 F | 572,611 | 584,066 |
| Ser. 06-GG6, Class XC, IO, 0.151s, 2038 | 108,286,702 | 191,992 |
|
| JPMorgan Chase Commercial Mortgage | | |
| Securities Corp. | | |
| FRB Ser. 07-LD12, Class A3, 6.181s, 2051 | 19,773,000 | 21,150,130 |
| FRB Ser. 04-CB9, Class B, 5.853s, 2041 F | 2,650,000 | 2,531,755 |
| FRB Ser. 02-C2, Class E, 5.518s, 2034 | 1,540,000 | 1,537,505 |
| Ser. 02-C3, Class D, 5.314s, 2035 | 1,521,000 | 1,537,534 |
| Ser. 06-LDP8, Class X, IO, 0.735s, 2045 | 61,222,467 | 1,162,247 |
| Ser. 07-LDPX, Class X, IO, 0.494s, 2049 | 41,405,725 | 452,399 |
|
| JPMorgan Chase Commercial Mortgage | | |
| Securities Corp. 144A | | |
| FRB Ser. 01-C1, Class H, 5.626s, 2035 F | 1,599,000 | 1,613,732 |
| Ser. 05-CB12, Class X1, IO, 0.152s, 2037 | 29,874,828 | 274,221 |
| Ser. 06-LDP6, Class X1, IO, 0.093s, 2043 | 56,850,714 | 193,975 |
|
| LB Commercial Conduit Mortgage Trust 144A | | |
| Ser. 99-C1, Class F, 6.41s, 2031 F | 556,463 | 545,347 |
| Ser. 99-C1, Class G, 6.41s, 2031 F | 601,777 | 607,851 |
| Ser. 98-C4, Class G, 5.6s, 2035 | 456,247 | 472,033 |
| Ser. 98-C4, Class H, 5.6s, 2035 | 808,000 | 879,999 |
|
21
| | |
| MORTGAGE-BACKED SECURITIES (30.1%)* cont. | Principal amount | Value |
|
| LB-UBS Commercial Mortgage Trust | | |
| Ser. 06-C7, Class A2, 5.3s, 2038 | $1,896,408 | $1,896,408 |
| Ser. 03-C5, Class F, 4.843s, 2037 | 2,504,000 | 2,367,532 |
| Ser. 07-C2, Class XW, IO, 0.712s, 2040 | 8,567,218 | 139,252 |
|
| LB-UBS Commercial Mortgage Trust 144A | | |
| Ser. 06-C7, Class XW, IO, 0.843s, 2038 | 41,495,803 | 1,005,277 |
| Ser. 06-C7, Class XCL, IO, 0.335s, 2038 | 69,339,492 | 971,030 |
| Ser. 05-C2, Class XCL, IO, 0.305s, 2040 | 144,795,259 | 1,171,538 |
| Ser. 05-C5, Class XCL, IO, 0.237s, 2040 | 94,361,994 | 1,376,175 |
| Ser. 07-C2, Class XCL, IO, 0.193s, 2040 | 189,767,377 | 1,969,026 |
| Ser. 05-C7, Class XCL, IO, 0.159s, 2040 | 124,064,174 | 720,689 |
|
| Merrill Lynch Mortgage Investors, Inc. Ser. 96-C2, | | |
| Class JS, IO, 2.518s, 2028 F | 188,377 | 4,521 |
|
| Merrill Lynch Mortgage Trust | | |
| FRB Ser. 07-C1, Class A3, 6.032s, 2050 | 475,000 | 493,365 |
| Ser. 03-KEY1, Class C, 5.373s, 2035 | 3,163,000 | 3,164,360 |
| Ser. 05-MCP1, Class XC, IO, 0.257s, 2043 | 39,803,681 | 410,018 |
|
| Merrill Lynch Mortgage Trust 144A Ser. 04-KEY2, Class XC, | | |
| IO, 1.053s, 2039 | 15,836,353 | 241,045 |
|
| Merrill Lynch/Countrywide Commercial Mortgage Trust | | |
| FRB Ser. 06-3, Class AM, 5.456s, 2046 F | 1,347,000 | 1,446,914 |
| FRB Ser. 06-4, Class A2FL, 0.36s, 2049 | 1,453,021 | 1,438,490 |
|
| Mezz Cap Commercial Mortgage Trust 144A | | |
| Ser. 04-C1, Class X, IO, 8.751s, 2037 | 2,788,348 | 209,126 |
| Ser. 06-C4, Class X, IO, 6.274s, 2045 | 6,176,797 | 463,260 |
| Ser. 05-C3, Class X, IO, 6.054s, 2044 | 1,896,501 | 142,238 |
|
| Morgan Stanley Capital I | | |
| FRB Ser. 06-T23, Class A2, 5.918s, 2041 | 1,029,434 | 1,038,174 |
| FRB Ser. 07-HQ12, Class A2, 5.782s, 2049 F | 1,378,720 | 1,404,812 |
| Ser. 07-IQ14, Class A2, 5.61s, 2049 | 2,538,454 | 2,604,756 |
|
| Morgan Stanley Capital I 144A Ser. 03-IQ6, Class C, | | |
| 5.237s, 2041 F | 2,350,000 | 2,363,371 |
|
| Morgan Stanley Dean Witter Capital I Ser. 03-HQ2, Class C, | | |
| 5.15s, 2035 | 2,146,000 | 2,122,330 |
|
| Morgan Stanley ReREMIC Trust 144A FRB Ser. 10-C30A, | | |
| Class A3B, 5.854s, 2043 F | 430,286 | 445,190 |
|
| Nomura Asset Securities Corp. 144A Ser. 98-D6, Class B1, | | |
| 6s, 2030 | 2,002,000 | 2,093,397 |
|
| Opteum Mortgage Acceptance Corp. FRB Ser. 05-3, Class A2, | | |
| 0.579s, 2035 | 6,061,282 | 4,576,268 |
|
| Structured Asset Mortgage Investments, Inc. Ser. 07-AR4, | | |
| Class X2, IO, 0 1/2s, 2047 | 146,083,408 | 3,140,793 |
|
| Structured Asset Securities Corp. IFB Ser. 07-4, Class 1A3, | | |
| IO, 6.009s, 2045 | 32,281,970 | 5,165,115 |
|
| TIAA Seasoned Commercial Mortgage Trust FRB Ser. 07-C4, | | |
| Class AJ, 5.656s, 2039 F | 4,471,000 | 4,718,009 |
|
| Wachovia Bank Commercial Mortgage Trust | | |
| Ser. 06-C29, IO, 0.55s, 2048 | 197,535,177 | 3,237,602 |
| Ser. 07-C34, IO, 0.543s, 2046 | 18,392,778 | 268,535 |
|
22
| | |
| MORTGAGE-BACKED SECURITIES (30.1%)* cont. | Principal amount | Value |
|
| Wachovia Bank Commercial Mortgage Trust 144A | | |
| Ser. 05-C18, Class XC, IO, 0.211s, 2042 | $24,413,078 | $226,797 |
| Ser. 06-C26, Class XC, IO, 0.093s, 2045 | 11,417,344 | 32,425 |
| Ser. 06-C23, Class XC, IO, 0.081s, 2045 | 155,091,764 | 713,422 |
|
| WAMU Commercial Mortgage Securities Trust 144A | | |
| Ser. 05-C1A, Class G, 5.72s, 2036 F | 129,000 | 112,244 |
| Ser. 05-C1A, Class C, 4.9s, 2036 F | 529,000 | 532,889 |
|
| WAMU Mortgage Pass-Through Certificates | | |
| FRB Ser. 05-AR11, Class A1C3, 0.749s, 2045 | 5,818,644 | 3,374,814 |
| FRB Ser. 05-AR19, Class A1C3, 0.739s, 2045 | 14,488,508 | 8,113,565 |
| FRB Ser. 05-AR11, Class A1B2, 0.689s, 2045 | 6,081,992 | 4,470,264 |
| FRB Ser. 05-AR8, Class 2AB2, 0.659s, 2045 | 11,513,430 | 8,750,207 |
| FRB Ser. 2005-AR17, Class A1B2, 0.649s, 2045 | 8,053,120 | 5,315,059 |
| FRB Ser. 05-AR11, Class A1B3, 0.639s, 2045 | 8,120,369 | 5,927,869 |
| FRB Ser. 05-AR2, Class 2A23, 0.619s, 2045 | 12,760,722 | 9,761,953 |
| FRB Ser. 2005-AR17, Class A1B3, 0.589s, 2045 | 2,396,060 | 1,532,101 |
| FRB Ser. 05-AR2, Class 2A21, 0.569s, 2045 | 3,008,361 | 2,358,525 |
| FRB Ser. 05-AR17, Class A1A2, 0.529s, 2045 | 243,552 | 180,229 |
|
| Total mortgage-backed securities (cost $374,103,407) | | $413,520,319 |
|
| |
| CORPORATE BONDS AND NOTES (27.8%)* | Principal amount | Value |
|
| Basic materials (2.2%) | | |
| Allegheny Technologies, Inc. sr. unsec. | | |
| unsub. notes 9 3/8s, 2019 | $835,000 | $1,055,303 |
|
| ArcelorMittal sr. unsec. unsub. 9.85s, 2019 (France) | 935,000 | 1,130,111 |
|
| ArcelorMittal sr. unsec. unsub. notes 7s, 2039 (France) | 1,575,000 | 1,535,786 |
|
| Celanese US Holdings, LLC sr. notes 5 7/8s, 2021 (Germany) | 835,000 | 895,538 |
|
| CF Industries, Inc. company guaranty sr. unsec. | | |
| unsub. notes 6 7/8s, 2018 | 1,210,000 | 1,406,625 |
|
| Dow Chemical Co. (The) sr. unsec. notes 5 1/4s, 2041 | 1,565,000 | 1,625,538 |
|
| Georgia-Pacific, LLC sr. unsec. unsub. notes 7 3/4s, 2029 | 470,000 | 590,513 |
|
| Georgia-Pacific, LLC 144A company guaranty sr. notes | | |
| 5.4s, 2020 | 2,120,000 | 2,416,281 |
|
| International Paper Co. sr. unsec. notes 9 3/8s, 2019 | 958,000 | 1,281,012 |
|
| International Paper Co. sr. unsec. notes 8.7s, 2038 | 510,000 | 694,766 |
|
| International Paper Co. sr. unsec. notes 7.95s, 2018 | 1,400,000 | 1,753,345 |
|
| International Paper Co. sr. unsec. unsub. notes 7.3s, 2039 | 900,000 | 1,113,619 |
|
| LyondellBasell Industries NV 144A company | | |
| guaranty sr. notes 6s, 2021 (Netherlands) | 875,000 | 945,000 |
|
| Mosaic Co. (The) sr. unsec. notes 3 3/4s, 2021 | 640,000 | 663,093 |
|
| PPG Industries, Inc. sr. unsec. unsub. debs. 7.4s, 2019 | 1,130,000 | 1,393,495 |
|
| Rio Tinto Finance USA, Ltd. company guaranty sr. unsec. | | |
| notes 5.2s, 2040 (Australia) | 2,475,000 | 2,756,375 |
|
| Rock-Tenn Co. 144A sr. unsec. notes 4.9s, 2022 | 407,000 | 412,195 |
|
| Rock-Tenn Co. 144A sr. unsec. notes 4.45s, 2019 | 393,000 | 400,156 |
|
| Rohm & Haas Co. sr. unsec. unsub. notes 7.85s, 2029 | 1,815,000 | 2,367,286 |
|
| Sealed Air Corp. sr. notes 7 7/8s, 2017 | 725,000 | 784,575 |
|
| Sealed Air Corp. 144A notes 5 5/8s, 2013 | 678,000 | 698,855 |
|
| Teck Resources Limited sr. notes 10 3/4s, 2019 (Canada) | 82,000 | 101,475 |
|
23
| | |
| CORPORATE BONDS AND NOTES (27.8%)* cont. | Principal amount | Value |
|
| Basic materials cont. | | |
| Teck Resources Limited sr. notes 10 1/4s, 2016 (Canada) | $245,000 | $280,862 |
|
| Temple-Inland, Inc. sr. unsec. unsub. notes 6 5/8s, 2018 | 1,080,000 | 1,255,931 |
|
| Union Carbide Corp. sr. unsec. unsub. bonds 7 3/4s, 2096 | 135,000 | 148,164 |
|
| Xstrata Finance Canada, Ltd. 144A company | | |
| guaranty sr. unsec. notes 6s, 2041 (Canada) | 1,000,000 | 1,041,437 |
|
| Xstrata Finance Canada, Ltd. 144A company | | |
| guaranty sr. unsec. unsub. bonds 5.8s, 2016 (Canada) | 610,000 | 691,257 |
|
| | | 29,438,593 |
| Capital goods (0.5%) | | |
| Allied Waste North America, Inc. company | | |
| guaranty sr. unsec. notes 6 7/8s, 2017 | 850,000 | 882,938 |
|
| BE Aerospace, Inc. sr. unsec. unsub. notes 5 1/4s, 2022 | 1,085,000 | 1,101,275 |
|
| Legrand SA unsec. unsub. debs. 8 1/2s, 2025 (France) | 1,393,000 | 1,808,180 |
|
| Parker Hannifin Corp. sr. unsec. unsub. notes Ser. MTN, | | |
| 6 1/4s, 2038 | 435,000 | 557,466 |
|
| Republic Services, Inc. company guaranty sr. unsec. | | |
| notes 5.7s, 2041 | 595,000 | 700,570 |
|
| Republic Services, Inc. company guaranty sr. unsec. | | |
| notes 3.8s, 2018 | 720,000 | 781,404 |
|
| Republic Services, Inc. company guaranty sr. unsec. | | |
| unsub. notes 5 1/2s, 2019 | 660,000 | 776,653 |
|
| United Technologies Corp. sr. unsec. notes 5.7s, 2040 | 100,000 | 120,462 |
|
| | | 6,728,948 |
| Communication services (2.9%) | | |
| America Movil SAB de CV company guaranty sr. unsec. | | |
| unsub. notes 6 1/8s, 2040 (Mexico) | 880,000 | 1,056,837 |
|
| America Movil SAB de CV company guaranty unsec. | | |
| unsub. notes 2 3/8s, 2016 (Mexico) | 670,000 | 684,168 |
|
| American Tower Corp. sr. unsec. notes 7s, 2017 R | 1,210,000 | 1,414,457 |
|
| American Tower REIT, Inc. sr. unsec. notes 7 1/4s, 2019 R | 1,560,000 | 1,835,182 |
|
| AT&T, Inc. sr. unsec. unsub. bonds 5 1/2s, 2018 | 1,160,000 | 1,368,143 |
|
| AT&T, Inc. sr. unsec. unsub. notes 6.3s, 2038 | 1,535,000 | 1,839,664 |
|
| Bellsouth Capital Funding unsec. notes 7 7/8s, 2030 | 1,570,000 | 2,055,695 |
|
| CenturyLink, Inc. sr. unsec. debs. Ser. G, 6 7/8s, 2028 | 2,025,000 | 1,934,339 |
|
| CenturyLink, Inc. sr. unsec. unsub. notes Ser. P, 7.6s, 2039 | 855,000 | 811,782 |
|
| Comcast Cable Communications company | | |
| guaranty sr. unsub. notes 8 7/8s, 2017 | 785,000 | 1,021,129 |
|
| Comcast Corp. company guaranty sr. unsec. | | |
| unsub. notes 6.95s, 2037 | 700,000 | 889,961 |
|
| Corning, Inc. sr. unsec. unsub. notes 5 3/4s, 2040 | 265,000 | 301,964 |
|
| Cox Communications, Inc. 144A bonds 8 3/8s, 2039 | 470,000 | 674,916 |
|
| Cox Communications, Inc. 144A notes 5 7/8s, 2016 | 390,000 | 455,064 |
|
| Crown Castle Towers, LLC 144A company | | |
| guaranty sr. notes 4.883s, 2020 | 1,915,000 | 2,031,267 |
|
| France Telecom sr. unsec. unsub. notes 5 3/8s, 2019 (France) | 880,000 | 997,956 |
|
| France Telecom sr. unsec. unsub. notes 4 1/8s, 2021 (France) | 886,000 | 911,646 |
|
| Frontier Communications Corp. sr. unsec. notes 8 1/2s, 2020 | 800,000 | 832,000 |
|
| Frontier Communications Corp. sr. unsec. notes 7 7/8s, 2015 | 215,000 | 233,275 |
|
| NBCUniversal Media, LLC sr. unsec. unsub. notes 6.4s, 2040 | 845,000 | 1,025,281 |
|
24
| | |
| CORPORATE BONDS AND NOTES (27.8%)* cont. | Principal amount | Value |
|
| Communication services cont. | | |
| Qwest Corp. notes 6 3/4s, 2021 | $1,767,000 | $1,981,957 |
|
| Rogers Communications, Inc. company guaranty notes 6.8s, | | |
| 2018 (Canada) | 610,000 | 760,051 |
|
| SBA Tower Trust 144A company guaranty sr. notes 5.101s, 2017 | 2,425,000 | 2,613,211 |
|
| TCI Communications, Inc. company guaranty sr. unsec. | | |
| unsub. debs. 7 7/8s, 2026 | 2,435,000 | 3,222,876 |
|
| Telecom Italia Capital SA company guaranty sr. unsec. | | |
| unsub. notes 6.175s, 2014 (Italy) | 955,000 | 985,847 |
|
| Telefonica Emisiones SAU company guaranty sr. unsec. | | |
| notes 5.462s, 2021 (Spain) | 1,500,000 | 1,409,753 |
|
| Telefonica Emisiones SAU company guaranty sr. unsec. | | |
| unsub. notes 6.221s, 2017 (Spain) | 345,000 | 351,972 |
|
| Time Warner Cable, Inc. company guaranty sr. notes 7.3s, 2038 | 1,165,000 | 1,473,496 |
|
| Time Warner Cable, Inc. company guaranty sr. unsec. 6 3/4s, 2018 | 355,000 | 433,855 |
|
| Time Warner Cable, Inc. company guaranty sr. unsec. | | |
| unsub. notes 6 3/4s, 2039 | 350,000 | 422,028 |
|
| Time Warner Cable, Inc. company guaranty sr. unsec. | | |
| unsub. notes 5 1/2s, 2041 | 85,000 | 89,100 |
|
| Verizon Communications, Inc. sr. unsec. notes 7.35s, 2039 | 424,000 | 581,623 |
|
| Verizon Communications, Inc. sr. unsec. | | |
| unsub. notes 8 3/4s, 2018 | 856,000 | 1,170,632 |
|
| Verizon New Jersey, Inc. debs. 8s, 2022 | 640,000 | 838,435 |
|
| Verizon Pennsylvania, Inc. debs. 8.35s, 2030 | 795,000 | 1,014,376 |
|
| Verizon Virginia, Inc. debs. Ser. A, 4 5/8s, 2013 | 219,000 | 226,258 |
|
| | | 39,950,196 |
| Consumer cyclicals (2.7%) | | |
| Advance Auto Parts, Inc. company guaranty sr. unsec. | | |
| notes 5 3/4s, 2020 | 1,095,000 | 1,243,852 |
|
| Autonation, Inc. company guaranty sr. unsec. notes 6 3/4s, 2018 | 645,000 | 699,825 |
|
| Choice Hotels International, Inc. company | | |
| guaranty sr. unsec. unsub. notes 5.7s, 2020 | 1,195,000 | 1,294,766 |
|
| DIRECTV Holdings, LLC/DIRECTV Financing Co., Inc. company | | |
| guaranty sr. unsec. notes 6.35s, 2040 | 805,000 | 894,623 |
|
| DIRECTV Holdings, LLC/DIRECTV Financing Co., Inc. company | | |
| guaranty sr. unsec. unsub. notes 5 7/8s, 2019 | 1,670,000 | 1,921,596 |
|
| DISH DBS Corp. company guaranty sr. unsec. notes 6 3/4s, 2021 | 1,635,000 | 1,790,325 |
|
| Expedia, Inc. company guaranty sr. unsec. | | |
| unsub. notes 5.95s, 2020 | 950,000 | 993,145 |
|
| Ford Motor Credit Co., LLC sr. unsec. notes 5s, 2018 | 950,000 | 1,026,598 |
|
| Ford Motor Credit Co., LLC sr. unsec. unsub. notes 5 3/4s, 2021 | 740,000 | 832,619 |
|
| FUEL Trust 144A company guaranty asset backed notes | | |
| 4.207s, 2016 | 2,760,000 | 2,882,031 |
|
| Lender Processing Services, Inc. company | | |
| guaranty sr. unsec. unsub. notes 8 1/8s, 2016 | 1,769,000 | 1,846,394 |
|
| Limited Brands, Inc. company guaranty sr. unsec. | | |
| notes 6 5/8s, 2021 | 840,000 | 909,300 |
|
| Limited Brands, Inc. sr. notes 5 5/8s, 2022 | 820,000 | 825,125 |
|
| Macy’s Retail Holdings, Inc. company guaranty sr. unsec. | | |
| notes 5 1/8s, 2042 | 240,000 | 242,443 |
|
25
| | |
| CORPORATE BONDS AND NOTES (27.8%)* cont. | Principal amount | Value |
|
| Consumer cyclicals cont. | | |
| Macy’s Retail Holdings, Inc. company guaranty sr. unsec. | | |
| notes 3 7/8s, 2022 | $360,000 | $369,947 |
|
| Marriott International, Inc. sr. unsec. unsub notes 3s, 2019 | 780,000 | 776,852 |
|
| Masco Corp. sr. unsec. bonds 7 1/8s, 2020 | 470,000 | 508,384 |
|
| News America Holdings, Inc. company guaranty sr. unsec. | | |
| debs. 7 3/4s, 2024 | 870,000 | 1,019,569 |
|
| News America Holdings, Inc. debs. 7 3/4s, 2045 | 790,000 | 940,366 |
|
| Omnicom Group, Inc. sr. unsec. unsub. notes 4.45s, 2020 | 1,060,000 | 1,148,834 |
|
| Owens Corning company guaranty sr. unsec. notes 9s, 2019 | 672,000 | 831,600 |
|
| QVC, Inc. 144A sr. notes 7 1/8s, 2017 | 535,000 | 572,450 |
|
| Time Warner Entertainment Co., LP debs. 8 3/8s, 2023 | 1,450,000 | 1,962,324 |
|
| Time Warner, Inc. company guaranty sr. unsec. bonds 7.7s, 2032 | 1,850,000 | 2,423,783 |
|
| Time Warner, Inc. company guaranty sr. unsec. notes 4.7s, 2021 | 365,000 | 404,360 |
|
| Time Warner, Inc. debs. 9.15s, 2023 | 675,000 | 929,858 |
|
| Toyota Motor Credit Corp. sr. unsec. unsub. notes 3.3s, 2022 | 2,075,000 | 2,150,768 |
|
| Viacom, Inc. company guaranty sr. unsec. notes 7 7/8s, 2030 | 2,400,000 | 3,164,261 |
|
| Walt Disney Co. (The) sr. unsec. notes 2 3/4s, 2021 | 1,305,000 | 1,317,209 |
|
| Walt Disney Co. (The) sr. unsec. unsub. notes 4 3/8s, 2041 | 520,000 | 546,242 |
|
| | | 36,469,449 |
| Consumer staples (2.1%) | | |
| Altria Group, Inc. company guaranty sr. unsec. notes 9.7s, 2018 | 910,000 | 1,235,632 |
|
| Altria Group, Inc. company guaranty sr. unsec. | | |
| notes 9 1/4s, 2019 | 1,735,000 | 2,367,409 |
|
| Anheuser-Busch InBev Worldwide, Inc. company | | |
| guaranty sr. unsec. unsub. notes 8.2s, 2039 | 1,313,000 | 2,075,088 |
|
| Bacardi, Ltd. 144A unsec. notes 4 1/2s, 2021 (Bermuda) | 1,430,000 | 1,568,421 |
|
| Campbell Soup Co. debs. 8 7/8s, 2021 | 715,000 | 1,039,408 |
|
| Corrections Corporation of America company | | |
| guaranty sr. notes 7 3/4s, 2017 | 466,000 | 506,193 |
|
| CVS Caremark Corp. sr. unsec. unsub. notes 6.6s, 2019 | 1,310,000 | 1,631,417 |
|
| CVS Pass-Through Trust 144A company | | |
| guaranty sr. notes 7.507s, 2032 | 2,219,863 | 2,751,187 |
|
| Darden Restaurants, Inc. sr. unsec. unsub. notes 6.8s, 2037 | 2,270,000 | 2,627,162 |
|
| Diageo Investment Corp. company guaranty sr. unsec. | | |
| debs. 8s, 2022 (Canada) | 675,000 | 934,646 |
|
| General Mills, Inc. sr. unsec. notes 5.65s, 2019 | 190,000 | 229,552 |
|
| Kraft Foods, Inc. sr. unsec. notes 5 3/8s, 2020 | 590,000 | 688,868 |
|
| Kraft Foods, Inc. sr. unsec. unsub. notes 6 1/2s, 2040 | 3,905,000 | 4,897,462 |
|
| Kroger Co. company guaranty sr. unsec. unsub. notes 6.4s, 2017 | 605,000 | 732,373 |
|
| Kroger Co. sr. notes 6.15s, 2020 | 200,000 | 244,318 |
|
| McDonald’s Corp. sr. unsec. Ser. MTN, 6.3s, 2038 | 680,000 | 915,868 |
|
| McDonald’s Corp. sr. unsec. bond 6.3s, 2037 | 530,000 | 713,355 |
|
| McDonald’s Corp. sr. unsec. notes 5.7s, 2039 | 775,000 | 976,855 |
|
| SABMiller Holdings, Inc. 144A company guaranty sr. unsec. | | |
| notes 4.95s, 2042 | 630,000 | 669,826 |
|
| Tyson Foods, Inc. sr. unsec. unsub. notes 10 1/2s, 2014 | 675,000 | 777,938 |
|
| WPP Finance UK company guaranty sr. unsec. notes 8s, 2014 | | |
| (United Kingdom) | 1,370,000 | 1,573,068 |
|
| | | 29,156,046 |
26
| | |
| CORPORATE BONDS AND NOTES (27.8%)* cont. | Principal amount | Value |
|
| Energy (1.9%) | | |
| Anadarko Finance Co. company guaranty sr. unsec. | | |
| unsub. notes Ser. B, 7 1/2s, 2031 | $2,880,000 | $3,625,209 |
|
| BG Energy Capital PLC 144A company guaranty sr. unsec. | | |
| notes 4s, 2021 (United Kingdom) | 200,000 | 213,883 |
|
| BP Capital Markets PLC company guaranty sr. unsec. | | |
| unsub. notes 4.742s, 2021 (United Kingdom) | 1,860,000 | 2,114,150 |
|
| BP Capital Markets PLC company guaranty sr. unsec. | | |
| unsub. notes 4 1/2s, 2020 (United Kingdom) | 620,000 | 688,911 |
|
| Chesapeake Energy Corp. sr. unsec. notes 7 5/8s, 2013 | 835,000 | 868,400 |
|
| Chesapeake Midstream Partners LP/CHKM Finance Corp. company | | |
| guaranty sr. unsec notes 5 7/8s, 2021 | 602,000 | 571,900 |
|
| DCP Midstream, LLC 144A sr. unsec. notes 5.35s, 2020 | 775,000 | 858,458 |
|
| EOG Resources, Inc. sr. unsec. notes 5 5/8s, 2019 | 340,000 | 407,428 |
|
| Kerr-McGee Corp. company guaranty sr. unsec. | | |
| unsub. notes 7 7/8s, 2031 | 885,000 | 1,144,864 |
|
| Marathon Petroleum Corp. sr. unsec. unsub. notes 6 1/2s, 2041 | 525,000 | 576,621 |
|
| Motiva Enterprises, LLC 144A sr. unsec. notes 6.85s, 2040 | 895,000 | 1,119,814 |
|
| Motiva Enterprises, LLC 144A sr. unsec. unsub. notes 5.2s, 2012 | 195,000 | 197,663 |
|
| Newfield Exploration Co. sr. sub. notes 6 5/8s, 2016 | 550,000 | 561,000 |
|
| Noble Holding International, Ltd. company | | |
| guaranty sr. unsec. notes 6.05s, 2041 | 1,095,000 | 1,214,182 |
|
| Petrohawk Energy Corp. company guaranty sr. unsec. | | |
| notes 7 1/4s, 2018 | 2,910,000 | 3,317,400 |
|
| Petronas Capital, Ltd. 144A company guaranty unsec. | | |
| unsub. notes 5 1/4s, 2019 (Malaysia) | 975,000 | 1,108,166 |
|
| Pride International, Inc. sr. unsec. notes 7 7/8s, 2040 | 2,160,000 | 3,027,633 |
|
| Ras Laffan Liquefied Natural Gas Co., Ltd. 144A company | | |
| guaranty sr. notes 5 1/2s, 2014 (Qatar) | 1,015,000 | 1,094,982 |
|
| Statoil ASA company guaranty sr. unsec. notes 5.1s, 2040 | | |
| (Norway) | 1,900,000 | 2,171,417 |
|
| Weatherford Bermuda company guaranty sr. unsec. | | |
| notes 9 5/8s, 2019 | 584,000 | 772,561 |
|
| Weatherford International, Inc. company guaranty sr. unsec. | | |
| unsub. notes 6.8s, 2037 | 205,000 | 232,245 |
|
| Weatherford International, Inc. company guaranty sr. unsec. | | |
| unsub. notes 6.35s, 2017 | 240,000 | 278,964 |
|
| Weatherford International, Ltd. company guaranty 6 1/2s, | | |
| 2036 (Switzerland) | 470,000 | 508,686 |
|
| | | 26,674,537 |
| Financials (10.4%) | | |
| ABN Amro Bank NV 144A sr. unsec. notes 4 1/4s, 2017 | | |
| (Netherlands) | 4,460,000 | 4,512,137 |
|
| Aflac, Inc. sr. unsec. notes 6.9s, 2039 | 1,395,000 | 1,668,606 |
|
| Aflac, Inc. sr. unsec. notes 6.45s, 2040 | 990,000 | 1,138,317 |
|
| American Express Bank FSB notes Ser. BKN1, 5.55s, 2012 | 995,000 | 1,017,280 |
|
| American Express Bank FSB sr. unsec. FRN Ser. BKNT, 0.54s, 2017 | 1,035,000 | 975,761 |
|
| American Express Co. sr. unsec. notes 8 1/8s, 2019 | 1,450,000 | 1,920,480 |
|
| American International Group, Inc. jr. sub. bonds FRB | | |
| 8.175s, 2068 | 210,000 | 224,438 |
|
27
| | |
| CORPORATE BONDS AND NOTES (27.8%)* cont. | Principal amount | Value |
|
| Financials cont. | | |
| American International Group, Inc. sr. unsec. Ser. MTN, | | |
| 5.85s, 2018 | $2,440,000 | $2,685,094 |
|
| Aon PLC jr. unsec. sub. notes 8.205s, 2027 | 3,255,000 | 3,802,908 |
|
| Associates Corp. of North America sr. unsec. notes 6.95s, 2018 | 2,745,000 | 3,106,742 |
|
| Assurant, Inc. sr. unsec. notes 6 3/4s, 2034 | 1,485,000 | 1,598,830 |
|
| AXA SA 144A jr. unsec. sub. notes FRN 6.463s, 2018 (France) | 1,630,000 | 1,324,375 |
|
| Banco do Brasil SA 144A unsec. sub. notes 5 7/8s, 2022 (Brazil) | 2,665,000 | 2,757,017 |
|
| Bank of America Corp. sr. unsec. unsub notes 5 7/8s, 2042 | 840,000 | 829,119 |
|
| Bank of America Corp. sub. notes 7 3/4s, 2015 | 1,465,000 | 1,612,057 |
|
| Bank of America NA sub. notes Ser. BKNT, 5.3s, 2017 | 905,000 | 943,867 |
|
| Barclays Bank PLC 144A sub. notes 10.179s, 2021 | | |
| (United Kingdom) | 3,331,000 | 3,875,019 |
|
| Barclays Bank PLC 144A unsec. sub. notes 6.05s, 2017 | | |
| (United Kingdom) | 2,815,000 | 2,823,929 |
|
| Bear Stearns Cos., Inc. (The) sr. notes 6.4s, 2017 | 1,020,000 | 1,190,475 |
|
| Bear Stearns Cos., Inc. (The) sr. unsec. notes 7 1/4s, 2018 | 1,685,000 | 2,049,776 |
|
| Capital One Bank USA NA sub. notes 8.8s, 2019 | 1,050,000 | 1,326,009 |
|
| Citigroup, Inc. sr. unsec. notes 6 1/8s, 2018 | 2,245,000 | 2,491,979 |
|
| Citigroup, Inc. sr. unsec. sub. FRN 0.745s, 2016 | 1,961,000 | 1,690,950 |
|
| Citigroup, Inc. sub. notes 5s, 2014 | 1,156,000 | 1,195,488 |
|
| CNA Financial Corp. sr. unsec. unsub. notes 5 3/4s, 2021 | 580,000 | 634,707 |
|
| Commonwealth Bank of Australia 144A sr. unsec. notes 5s, | | |
| 2019 (Australia) | 510,000 | 559,252 |
|
| Commonwealth Bank of Australia 144A sr. unsec. | | |
| notes 3 3/4s, 2014 (Australia) | 100,000 | 103,535 |
|
| Cooperative Centrale Raiffeisen-Boerenleenbank | | |
| BA/Netherlands 144A jr. unsec. sub. notes FRN 11s, | | |
| (perpetual maturity) (Netherlands) | 1,255,000 | 1,593,850 |
|
| Countrywide Financial Corp. company guaranty sr. unsec. | | |
| unsub. notes FRN Ser. MTN, 0.906s, 2012 | 1,090,000 | 1,089,915 |
|
| DDR Corp. sr. unsec. unsub. notes 7 7/8s, 2020 R | 910,000 | 1,092,867 |
|
| Deutsche Bank AG London sr. unsec. unsub. notes Ser. 1, | | |
| 3 1/4s, 2016 (Germany) | 2,290,000 | 2,354,924 |
|
| Duke Realty LP sr. unsec. notes 6 1/2s, 2018 R | 390,000 | 449,503 |
|
| Duke Realty LP sr. unsec. notes 6 1/4s, 2013 R | 64,000 | 66,930 |
|
| Erac USA Finance, Co. 144A sr. notes 4 1/2s, 2021 | 2,235,000 | 2,332,314 |
|
| FIA Card Services, NA sub. notes Ser. BKNT, 7 1/8s, 2012 | 1,695,000 | 1,731,720 |
|
| GATX Financial Corp. notes 5.8s, 2016 | 455,000 | 488,131 |
|
| General Electric Capital Corp. sr. unsec. 5 5/8s, 2018 | 2,405,000 | 2,787,453 |
|
| General Electric Capital Corp. sr. unsec. FRN Ser. MTN, | | |
| 0.71s, 2016 | 895,000 | 854,614 |
|
| General Electric Capital Corp. sr. unsec. notes 6 3/4s, 2032 | 6,305,000 | 7,684,849 |
|
| Genworth Financial, Inc. sr. unsec. unsub. notes 7 5/8s, 2021 | 3,230,000 | 3,189,296 |
|
| Goldman Sachs Group, Inc. (The) sr. notes 7 1/2s, 2019 | 940,000 | 1,085,046 |
|
| Goldman Sachs Group, Inc. (The) sr. unsec. 6.15s, 2018 | 595,000 | 647,652 |
|
| Goldman Sachs Group, Inc. (The) sub. notes 6 3/4s, 2037 | 950,000 | 937,669 |
|
| Hartford Financial Services Group, Inc. (The) sr. unsec. | | |
| unsub. notes 6 5/8s, 2040 | 3,655,000 | 3,776,094 |
|
28
| | |
| CORPORATE BONDS AND NOTES (27.8%)* cont. | Principal amount | Value |
|
| Financials cont. | | |
| HBOS PLC 144A sr. unsec. sub. notes 6 3/4s, 2018 | | |
| (United Kingdom) | $1,175,000 | $1,079,677 |
|
| HBOS PLC 144A unsec. sub. bonds 6s, 2033 (United Kingdom) | 2,520,000 | 1,900,846 |
|
| Health Care REIT, Inc. sr. unsec. notes 4 1/8s, 2019 | 825,000 | 832,865 |
|
| Highwood Realty LP sr. unsec. bonds 5.85s, 2017 R | 835,000 | 902,233 |
|
| HSBC Holdings PLC sub. notes 6 1/2s, 2037 (United Kingdom) | 3,945,000 | 4,377,183 |
|
| Icahn Enterprises LP/Icahn Enterprises Finance Corp. | | |
| company guaranty sr. unsec. notes 7 3/4s, 2016 | 670,000 | 705,175 |
|
| ING Bank NV 144A unsec. notes 3 3/4s, 2017 (Netherlands) | 1,680,000 | 1,659,576 |
|
| International Lease Finance Corp. sr. unsec. notes 6 1/4s, 2019 | 895,000 | 903,950 |
|
| International Lease Finance Corp. sr. unsec. unsub | | |
| notes 4 7/8s, 2015 | 1,149,000 | 1,149,000 |
|
| JPMorgan Chase Bank NA sub. notes Ser. BKNT, 6s, 2017 | 404,000 | 463,870 |
|
| JPMorgan Chase Bank NA sub. notes Ser. BKNT, 6s, 2017 | 1,311,000 | 1,493,955 |
|
| Liberty Mutual Group, Inc. 144A notes 6 1/2s, 2035 | 1,715,000 | 1,786,070 |
|
| Lloyds TSB Bank PLC bank guaranty sr. unsec. | | |
| unsub. notes 6 3/8s, 2021 (United Kingdom) | 520,000 | 562,148 |
|
| Lloyds TSB Bank PLC company guaranty sr. unsec. | | |
| sub. notes Ser. MTN, 6 1/2s, 2020 (United Kingdom) | 4,335,000 | 4,150,225 |
|
| Loews Corp. notes 5 1/4s, 2016 | 385,000 | 428,122 |
|
| Macquarie Bank Ltd. 144A unsec. sub. notes 6 5/8s, | | |
| 2021 (Australia) | 2,880,000 | 2,949,900 |
|
| Massachusetts Mutual Life Insurance Co. 144A notes 8 7/8s, 2039 | 2,305,000 | 3,346,858 |
|
| Merrill Lynch & Co., Inc. jr. sub. bonds 7 3/4s, 2038 | 1,535,000 | 1,699,882 |
|
| MetLife Global Funding I 144A sr. unsub. notes 5 1/8s, 2014 | 715,000 | 772,965 |
|
| Morgan Stanley sr. unsec. notes Ser. MTN, 5 3/4s, 2016 | 970,000 | 1,004,169 |
|
| MPT Operating Partnership LP/MPT Finance Corp. company | | |
| guaranty sr. unsec notes 6 7/8s, 2021 R | 1,090,000 | 1,139,050 |
|
| Nationwide Financial Services, Inc. notes 5 5/8s, 2015 | 500,000 | 529,114 |
|
| Nationwide Health Properties, Inc. unsec. notes 6 1/4s, 2013 R | 660,000 | 679,883 |
|
| Nationwide Mutual Insurance Co. 144A notes 9 3/8s, 2039 | 85,000 | 108,933 |
|
| Nordea Bank AB 144A sub. notes 4 7/8s, 2021 (Sweden) | 5,160,000 | 4,955,881 |
|
| OneAmerica Financial Partners, Inc. 144A bonds 7s, 2033 | 1,010,000 | 1,010,057 |
|
| Pacific LifeCorp 144A sr. notes 6s, 2020 | 1,575,000 | 1,739,685 |
|
| Prudential Covered Trust 2012-1 144A company | | |
| guaranty notes 2.997s, 2015 | 330,000 | 334,587 |
|
| Prudential Financial, Inc. sr. notes 7 3/8s, 2019 | 340,000 | 423,194 |
|
| Prudential Financial, Inc. sr. notes 6.2s, 2015 | 300,000 | 331,877 |
|
| Prudential Financial, Inc. sr. unsec. notes 6 5/8s, 2040 | 1,135,000 | 1,333,214 |
|
| Prudential Holdings, LLC sr. notes FRN Ser. AGM, 1.349s, 2017 | 160,000 | 152,850 |
|
| Rayonier, Inc. company guaranty sr. unsec. | | |
| unsub. notes 3 3/4s, 2022 R | 570,000 | 565,046 |
|
| Royal Bank of Scotland Group PLC sr. unsec. | | |
| unsub. notes 6.4s, 2019 (United Kingdom) | 360,000 | 377,034 |
|
| Santander Issuances S.A. Unipersonal 144A bank | | |
| guaranty unsec. sub. notes 5.911s, 2016 (Spain) | 2,600,000 | 2,450,500 |
|
| SL Green Realty Corp./SL Green Operating | | |
| Partnership/Reckson Operating Part sr. unsec. notes 5s, 2018 R | 1,185,000 | 1,210,600 |
|
29
| | |
| CORPORATE BONDS AND NOTES (27.8%)* cont. | Principal amount | Value |
|
| Financials cont. | | |
| Societe Generale SA 144A jr. unsec. sub. bonds FRB 1.219s, | | |
| 2017 (France) | $1,090,000 | $704,020 |
|
| Tanger Properties, LP sr. unsec. notes 6 1/8s, 2020 R | 645,000 | 739,487 |
|
| TD Ameritrade Holding Corp. company guaranty sr. unsec. | | |
| unsub. notes 5.6s, 2019 | 985,000 | 1,101,104 |
|
| Teachers Insurance & Annuity Association of America 144A | | |
| notes 6.85s, 2039 | 1,555,000 | 1,947,818 |
|
| Ventas Realty LP/Capital Corp. sr. notes 6 3/4s, 2017 R | 390,000 | 402,971 |
|
| Vornado Realty LP sr. unsec. unsub. notes 4 1/4s, 2015 R | 1,180,000 | 1,235,667 |
|
| Wachovia Bank NA sub. notes Ser. BKNT, 6s, 2017 | 1,880,000 | 2,190,463 |
|
| WEA Finance, LLC 144A company guaranty sr. notes 7 1/8s, 2018 | 1,070,000 | 1,271,567 |
|
| WEA Finance, LLC/ WT Finance Aust. Pty. Ltd. 144A company | | |
| guaranty sr. unsec. notes 6 3/4s, 2019 | 810,000 | 949,420 |
|
| Wells Fargo Bank NA unsec. sub. notes 4 3/4s, 2015 | 345,000 | 371,292 |
|
| Wells Fargo Bank NA unsec. sub. notes FRN 0.708s, 2016 | 1,180,000 | 1,109,936 |
|
| Willis Group Holdings Ltd. company guaranty sr. unsec. | | |
| unsub. notes 5 3/4s, 2021 (United Kingdom) | 750,000 | 815,876 |
|
| Willis Group North America, Inc. company guaranty 6.2s, 2017 | 510,000 | 574,926 |
|
| | | 143,145,695 |
| Health care (0.5%) | | |
| Aetna, Inc. sr. unsec. unsub. notes 6 3/4s, 2037 | 1,660,000 | 2,155,057 |
|
| CIGNA Corp. sr. unsec. unsub. notes 5 3/8s, 2042 | 660,000 | 698,949 |
|
| Fresenius Medical Care US Finance II, Inc. 144A company | | |
| guaranty sr. unsec. notes 5 5/8s, 2019 | 356,000 | 362,230 |
|
| Fresenius Medical Care US Finance, Inc. 144A company | | |
| guaranty sr. notes 5 3/4s, 2021 | 839,000 | 853,683 |
|
| Quest Diagnostics, Inc. company guaranty sr. unsec. | | |
| notes 6.95s, 2037 | 1,045,000 | 1,303,533 |
|
| Quest Diagnostics, Inc. company guaranty sr. unsec. | | |
| notes 4 3/4s, 2020 | 244,000 | 266,843 |
|
| UnitedHealth Group, Inc. sr. unsec. unsub. notes 4 5/8s, 2041 | 975,000 | 999,970 |
|
| WellPoint, Inc. notes 7s, 2019 | 225,000 | 283,866 |
|
| | | 6,924,131 |
| Technology (0.5%) | | |
| Brocade Communications Systems, Inc. company | | |
| guaranty sr. notes 6 7/8s, 2020 | 580,000 | 633,650 |
|
| Brocade Communications Systems, Inc. company | | |
| guaranty sr. notes 6 5/8s, 2018 | 230,000 | 241,500 |
|
| Computer Sciences Corp. sr. unsec. notes 6 1/2s, 2018 | 822,000 | 888,788 |
|
| Dell, Inc. sr. unsec. notes 5 7/8s, 2019 | 145,000 | 174,674 |
|
| KLA-Tencor Corp. sr. unsec. notes 6.9s, 2018 | 2,590,000 | 3,133,928 |
|
| Lexmark International Inc, sr. unsec. notes 5.9s, 2013 | 855,000 | 889,783 |
|
| Xerox Corp. sr. unsec. notes 4 1/2s, 2021 | 1,115,000 | 1,164,215 |
|
| | | 7,126,538 |
| Transportation (0.6%) | | |
| American Airlines pass-through certificates Ser. 11-2, | | |
| Class A, 8 5/8s, 2023 | 752,121 | 791,607 |
|
| Burlington Northern Santa Fe Corp. sr. unsec. notes 5 3/4s, 2018 | 365,000 | 436,806 |
|
| Burlington Northern Santa Fe, LLC sr. unsec. notes 5.4s, 2041 | 1,520,000 | 1,693,414 |
|
30
| | |
| CORPORATE BONDS AND NOTES (27.8%)* cont. | Principal amount | Value |
|
| Transportation cont. | | |
| Continental Airlines, Inc. pass-through certificates | | |
| Ser. 97-4A, 6.9s, 2018 | $876,058 | $937,382 |
|
| Continental Airlines, Inc. pass-through certificates | | |
| Ser. 98-1A, 6.648s, 2017 | 413,085 | 435,805 |
|
| CSX Corp. sr. unsec. unsub. notes 4 3/4s, 2042 | 330,000 | 331,148 |
|
| Norfolk Southern Corp. sr. unsec. notes 6s, 2111 | 1,115,000 | 1,308,098 |
|
| Northwest Airlines Corp. pass-through certificates | | |
| Ser. 00-1, 7.15s, 2019 | 1,059,320 | 1,067,265 |
|
| Southwest Airlines Co. pass-through certificates Ser. 07-1, | | |
| 6.15s, 2022 | 209,122 | 236,831 |
|
| Union Pacific Corp. 144A pass-through certificates 5.214s, 2014 | 390,000 | 423,374 |
|
| United AirLines, Inc. pass-through certificates Ser. 07-A, | | |
| 6.636s, 2022 | 472,218 | 495,829 |
|
| | | 8,157,559 |
| Utilities and power (3.5%) | | |
| AEP Texas North Co. sr. notes Ser. B, 5 1/2s, 2013 | 515,000 | 534,565 |
|
| Appalachian Power Co. sr. notes Ser. L, 5.8s, 2035 | 580,000 | 655,790 |
|
| Arizona Public Services Co. sr. unsec. notes 4 1/2s, 2042 | 390,000 | 393,907 |
|
| Atmos Energy Corp. sr. unsub. notes 6.35s, 2017 | 765,000 | 901,543 |
|
| Beaver Valley Funding Corp. sr. bonds 9s, 2017 | 530,000 | 550,368 |
|
| Boardwalk Pipelines LP company guaranty sr. unsec. | | |
| notes 5 7/8s, 2016 | 980,000 | 1,100,396 |
|
| Bruce Mansfield Unit pass-through certificates 6.85s, 2034 | 1,924,854 | 2,107,715 |
|
| CMS Energy Corp. sr. unsec. notes 8 3/4s, 2019 | 2,280,000 | 2,799,560 |
|
| CMS Energy Corp. sr. unsec. unsub. notes FRN 1.417s, 2013 | 625,000 | 621,875 |
|
| Commonwealth Edison Co. 1st mtge. sec. bonds 5 7/8s, 2033 | 480,000 | 589,128 |
|
| Consolidated Edison Co. of New York sr. unsec. | | |
| unsub. notes 4.2s, 2042 | 710,000 | 729,697 |
|
| Dolphin Subsidiary II, Inc. 144A sr. unsec. notes 6 1/2s, 2016 | 850,000 | 922,250 |
|
| Dominion Resources, Inc. sr. unsec. unsub. notes Ser. 07-A, | | |
| 6s, 2017 | 2,460,000 | 2,975,028 |
|
| Duke Energy Carolinas, LLC sr. mtge. notes 4 1/4s, 2041 | 725,000 | 748,847 |
|
| EDP Finance BV 144A sr. unsec. unsub. notes 6s, 2018 | | |
| (Netherlands) | 1,940,000 | 1,716,015 |
|
| El Paso Natural Gas Co. sr. unsec. unsub. bonds 8 3/8s, 2032 | 830,000 | 1,080,679 |
|
| El Paso Pipeline Partners Operating Co., LP company | | |
| guaranty sr. unsec. notes 6 1/2s, 2020 | 750,000 | 858,750 |
|
| Electricite de France SA (EDF) 144A notes 6.95s, 2039 (France) | 970,000 | 1,151,971 |
|
| Enel Finance International SA 144A company | | |
| guaranty sr. unsec. notes 5 1/8s, 2019 (Luxembourg) | 695,000 | 685,698 |
|
| Energy Transfer Partners LP sr. unsec. unsub. notes 6 1/2s, 2042 | 2,265,000 | 2,401,929 |
|
| Energy Transfer Partners LP sr. unsec. unsub. notes 5.2s, 2022 | 780,000 | 827,962 |
|
| Enterprise Products Operating, LLC company | | |
| guaranty sr. unsec. unsub. notes 5.7s, 2042 | 1,350,000 | 1,493,446 |
|
| Iberdrola International BV company guaranty sr. unsec. | | |
| unsub. notes 6 3/4s, 2036 | 510,000 | 554,383 |
|
| ITC Holdings Corp. 144A notes 5 7/8s, 2016 | 890,000 | 1,022,197 |
|
| ITC Holdings Corp. 144A sr. unsec. notes 6.05s, 2018 | 330,000 | 382,636 |
|
| Kansas Gas and Electric Co. bonds 5.647s, 2021 | 608,368 | 665,032 |
|
31
| | |
| CORPORATE BONDS AND NOTES (27.8%)* cont. | Principal amount | Value |
|
| Utilities and power cont. | | |
| KCP&L Greater Missouri Operations Co. sr. unsec. | | |
| unsub. notes 11 7/8s, 2012 | $1,525,000 | $1,551,819 |
|
| Kinder Morgan Energy Partners LP sr. unsec. notes 6.85s, 2020 | 1,425,000 | 1,723,381 |
|
| MidAmerican Energy Holdings Co. bonds 6 1/8s, 2036 | 1,000,000 | 1,218,233 |
|
| MidAmerican Energy Holdings Co. sr. unsec. bond 6 1/2s, 2037 | 410,000 | 525,236 |
|
| MidAmerican Funding, LLC sr. sec. bonds 6.927s, 2029 | 360,000 | 469,403 |
|
| Pacific Gas & Electric Co. sr. unsec. notes 6.35s, 2038 | 295,000 | 379,472 |
|
| Pacific Gas & Electric Co. sr. unsub. 5.8s, 2037 | 785,000 | 948,881 |
|
| PacifiCorp Sinking Fund 1st mtge. 6 1/4s, 2037 | 460,000 | 605,772 |
|
| Potomac Edison Co. 144A 1st mtge. 5.8s, 2016 | 885,000 | 1,006,818 |
|
| PPL WEM Holdings PLC 144A sr. unsec. notes 5 3/8s, 2021 | | |
| (United Kingdom) | 3,220,000 | 3,527,504 |
|
| Spectra Energy Capital, LLC company guaranty sr. unsec. | | |
| notes 5.65s, 2020 | 240,000 | 271,271 |
|
| Spectra Energy Capital, LLC company guaranty sr. unsec. | | |
| unsub. notes 6.2s, 2018 | 135,000 | 158,772 |
|
| Spectra Energy Capital, LLC sr. notes 8s, 2019 | 650,000 | 813,144 |
|
| Teco Finance, Inc. company guaranty sr. unsec. | | |
| unsub. notes 6.572s, 2017 | 340,000 | 400,891 |
|
| Texas-New Mexico Power Co. 144A 1st mtge. sec. 9 1/2s, 2019 | 2,840,000 | 3,785,928 |
|
| Union Electric Co. 1st mtge. sr. sec. bonds 6.7s, 2019 | 560,000 | 697,420 |
|
| West Penn Power Co. 144A 1st mtge. 5.95s, 2017 | 830,000 | 977,305 |
|
| Westar Energy, Inc. sr. mtge. notes 4 1/8s, 2042 | 530,000 | 526,015 |
|
| | | 48,058,632 |
| | |
| Total corporate bonds and notes (cost $351,887,903) | | $381,830,324 |
| | | |
| | | |
| PURCHASED OPTIONS | Expiration date/ | Contract | |
| OUTSTANDING (7.5%)* | strike price | amount | Value |
|
| Option on an interest rate swap with Bank | | | |
| of America, N.A. for the right to receive a | | | |
| fixed rate of 1.683% versus the three month | | | |
| USD-LIBOR-BBA maturing June 2022. | Jun-12/1.683 | $6,556,000 | $3,737 |
|
| Option on an interest rate swap with Bank | | | |
| of America, N.A. for the right to receive a | | | |
| fixed rate of 2.042% versus the three month | | | |
| USD-LIBOR-BBA maturing August 2022. | Aug-12/2.042 | 15,930,000 | 187,496 |
|
| Option on an interest rate swap with Bank | | | |
| of America, N.A. for the right to receive a | | | |
| fixed rate of 2.064% versus the three month | | | |
| USD-LIBOR-BBA maturing September 2022. | Sep-12/2.064 | 15,930,000 | 224,294 |
|
| Option on an interest rate swap with Bank | | | |
| of America, N.A. for the right to receive a | | | |
| fixed rate of 2.085% versus the three month | | | |
| USD-LIBOR-BBA maturing October 2022. | Oct-12/2.085 | 15,930,000 | 256,154 |
|
| Option on an interest rate swap with Barclay’s | | | |
| Bank, PLC for the right to pay a fixed rate | | | |
| of 3.36% versus the three month USD-LIBOR-BBA | | | |
| maturing July 2022. | Jul-12/3.36 | 17,914,396 | 4,120 |
|
32
| | | |
| PURCHASED OPTIONS | Expiration date/ | Contract | |
| OUTSTANDING (7.5%)* cont. | strike price | amount | Value |
|
| |
| Option on an interest rate swap with Barclay’s | | | |
| Bank, PLC for the right to pay a fixed rate | | | |
| of 3.37% versus the three month USD-LIBOR-BBA | | | |
| maturing August 2022. | Aug-12/3.37 | $21,497,275 | $5,374 |
|
| Option on an interest rate swap with Barclay’s | | | |
| Bank, PLC for the right to pay a fixed rate | | | |
| of 3.51% versus the three month USD-LIBOR-BBA | | | |
| maturing July 2022. | Jul-12/3.51 | 7,165,758 | 717 |
|
| Option on an interest rate swap with Barclay’s | | | |
| Bank, PLC for the right to pay a fixed rate | | | |
| of 3.52% versus the three month USD-LIBOR-BBA | | | |
| maturing July 2022. | Jul-12/3.52 | 17,914,396 | 1,971 |
|
| Option on an interest rate swap with Barclay’s | | | |
| Bank, PLC for the right to pay a fixed rate | | | |
| of 3.5375% versus the three month USD-LIBOR-BBA | | | |
| maturing July 2022. | Jul-12/3.5375 | 17,914,396 | 1,433 |
|
| Option on an interest rate swap with Barclay’s | | | |
| Bank, PLC for the right to receive a fixed rate | | | |
| of 1.683% versus the three month USD-LIBOR-BBA | | | |
| June 2022. | Jun-12/1.683 | 6,556,000 | 3,737 |
|
| Option on an interest rate swap with Barclay’s | | | |
| Bank, PLC for the right to receive a fixed rate | | | |
| of 3.36% versus the three month USD-LIBOR-BBA | | | |
| maturing July 2022. | Jul-12/3.36 | 17,914,396 | 2,057,827 |
|
| Option on an interest rate swap with Barclay’s | | | |
| Bank, PLC for the right to receive a fixed rate | | | |
| of 3.37% versus the three month USD-LIBOR-BBA | | | |
| maturing August 2022. | Aug-12/3.37 | 21,497,275 | 2,486,590 |
|
| Option on an interest rate swap with Barclay’s | | | |
| Bank, PLC for the right to receive a fixed rate | | | |
| of 3.51% versus the three month USD-LIBOR-BBA | | | |
| maturing July 2022. | Jul-12/3.51 | 7,165,758 | 922,018 |
|
| Option on an interest rate swap with Barclay’s | | | |
| Bank, PLC for the right to receive a fixed rate | | | |
| of 3.52% versus the three month USD-LIBOR-BBA | | | |
| maturing July 2022. | Jul-12/3.52 | 17,914,396 | 2,319,914 |
|
| Option on an interest rate swap with Barclay’s | | | |
| Bank, PLC for the right to receive a fixed rate | | | |
| of 3.5375% versus the three month USD-LIBOR-BBA | | | |
| maturing July 2022. | Jul-12/3.5375 | 17,914,396 | 2,356,460 |
|
| Option on an interest rate swap with Citibank, | | | |
| N.A. for the right to pay a fixed rate of 4.74% | | | |
| versus the three month USD-LIBOR-BBA July 2026. | Jul-16/4.74 | 30,013,000 | 821,666 |
|
| Option on an interest rate swap with Citibank, | | | |
| N.A. for the right to receive a fixed rate | | | |
| of 1.6714% versus the three month USD-LIBOR-BBA | | | |
| maturing July 2022. | Jul-12/1.6714 | 6,556,000 | 8,523 |
|
| Option on an interest rate swap with Citibank, | | | |
| N.A. for the right to receive a fixed rate | | | |
| of 2.1075% versus the three month USD-LIBOR-BBA | | | |
| maturing July 2022. | Jul-12/2.1075 | 29,847,000 | 398,457 |
|
33
| | | |
| PURCHASED OPTIONS | Expiration date/ | Contract | |
| OUTSTANDING (7.5%)* cont. | strike price | amount | Value |
|
| |
| Option on an interest rate swap with Citibank, | | | |
| N.A. for the right to receive a fixed rate | | | |
| of 4.74% versus the three month USD-LIBOR-BBA | | | |
| July 2026. | Jul-16/4.74 | $30,013,000 | $4,575,902 |
|
| Option on an interest rate swap with Credit | | | |
| Suisse International for the right to pay a | | | |
| fixed rate of 2.855% versus the three month | | | |
| USD-LIBOR-BBA maturing August 2022. | Aug-12/2.855 | 75,721,900 | 155,230 |
|
| Option on an interest rate swap with Credit | | | |
| Suisse International for the right to pay a | | | |
| fixed rate of 4.04% versus the three month | | | |
| USD-LIBOR-BBA maturing September 2025. | Sep-15/4.04 | 62,854,000 | 1,923,332 |
|
| Option on an interest rate swap with Credit | | | |
| Suisse International for the right to pay a | | | |
| fixed rate of 4.28% versus the three month | | | |
| USD-LIBOR-BBA maturing August 2026. | Aug-16/4.28 | 79,271,000 | 2,814,121 |
|
| Option on an interest rate swap with Credit | | | |
| Suisse International for the right to pay a | | | |
| fixed rate of 4.67% versus the three month | | | |
| USD-LIBOR-BBA maturing July 2026. | Jul-16/4.67 | 30,013,000 | 852,369 |
|
| Option on an interest rate swap with Credit | | | |
| Suisse International for the right to receive a | | | |
| fixed rate of 1.6714% versus the three month | | | |
| USD-LIBOR-BBA maturing July 2022. | Jul-12/1.6714 | 6,556,000 | 8,523 |
|
| Option on an interest rate swap with Credit | | | |
| Suisse International for the right to receive a | | | |
| fixed rate of 1.9475% versus the three month | | | |
| USD-LIBOR-BBA maturing August 2022. | Aug-12/1.9475 | 47,396,000 | 400,496 |
|
| Option on an interest rate swap with Credit | | | |
| Suisse International for the right to receive a | | | |
| fixed rate of 2.096% versus the three month | | | |
| USD-LIBOR-BBA maturing June 2022. | Jun-12/2.096 | 17,045,000 | 174,370 |
|
| Option on an interest rate swap with Credit | | | |
| Suisse International for the right to receive a | | | |
| fixed rate of 2.1075% versus the three month | | | |
| USD-LIBOR-BBA maturing July 2022. | Jul-12/2.1075 | 29,847,000 | 398,457 |
|
| Option on an interest rate swap with Credit | | | |
| Suisse International for the right to receive a | | | |
| fixed rate of 2.122% versus the three month | | | |
| USD-LIBOR-BBA maturing July 2022. | Jul-12/2.122 | 17,045,000 | 232,664 |
|
| Option on an interest rate swap with Credit | | | |
| Suisse International for the right to receive a | | | |
| fixed rate of 2.144% versus the three month | | | |
| USD-LIBOR-BBA maturing August 2022. | Aug-12/2.144 | 17,045,000 | 281,754 |
|
| Option on an interest rate swap with Credit | | | |
| Suisse International for the right to receive a | | | |
| fixed rate of 2.169% versus the three month | | | |
| USD-LIBOR-BBA maturing September 2022. | Sep-12/2.169 | 17,045,000 | 323,855 |
|
| Option on an interest rate swap with Credit | | | |
| Suisse International for the right to receive a | | | |
| fixed rate of 2.193% versus the three month | | | |
| USD-LIBOR-BBA maturing October 2022. | Oct-12/2.193 | 17,045,000 | 363,570 |
|
34
| | | |
| PURCHASED OPTIONS | Expiration date/ | Contract | |
| OUTSTANDING (7.5%)* cont. | strike price | amount | Value |
|
| |
| Option on an interest rate swap with Credit | | | |
| Suisse International for the right to receive a | | | |
| fixed rate of 2.855% versus the three month | | | |
| USD-LIBOR-BBA maturing August 2022. | Aug-12/2.855 | $75,721,900 | $5,231,626 |
|
| Option on an interest rate swap with Credit | | | |
| Suisse International for the right to receive a | | | |
| fixed rate of 4.04% versus the three month | | | |
| USD-LIBOR-BBA maturing September 2025. | Sep-15/4.04 | 62,854,000 | 7,303,635 |
|
| Option on an interest rate swap with Credit | | | |
| Suisse International for the right to receive a | | | |
| fixed rate of 4.28% versus the three month | | | |
| USD-LIBOR-BBA maturing August 2026. | Aug-16/4.28 | 79,271,000 | 9,742,406 |
|
| Option on an interest rate swap with Credit | | | |
| Suisse International for the right to receive a | | | |
| fixed rate of 4.67% versus the three month | | | |
| USD-LIBOR-BBA maturing July 2026. | Jul-16/4.67 | 30,013,000 | 4,447,927 |
|
| Option on an interest rate swap with Deutsche | | | |
| Bank AG for the right to pay a fixed rate | | | |
| of 3.625% versus the three month USD-LIBOR-BBA | | | |
| maturing August 2026. | Aug-16/3.625 | 46,515,000 | 2,353,194 |
|
| Option on an interest rate swap with Deutsche | | | |
| Bank AG for the right to pay a fixed rate | | | |
| of 4.375% versus the three month USD-LIBOR-BBA | | | |
| maturing August 2045. | Aug-15/4.375 | 31,254,600 | 1,452,714 |
|
| Option on an interest rate swap with Deutsche | | | |
| Bank AG for the right to pay a fixed rate | | | |
| of 4.46% versus the three month USD-LIBOR-BBA | | | |
| maturing August 2045. | Aug-15/4.46 | 31,254,600 | 1,350,199 |
|
| Option on an interest rate swap with Deutsche | | | |
| Bank AG for the right to pay a fixed rate | | | |
| of 4.765% versus the three month USD-LIBOR-BBA | | | |
| maturing May 2021. | May-16/4.765 | 21,667,000 | 245,487 |
|
| Option on an interest rate swap with Deutsche | | | |
| Bank AG for the right to receive a fixed rate | | | |
| of 1.6714% versus the three month USD-LIBOR-BBA | | | |
| maturing July 2022. | Jul-12/1.6714 | 6,556,000 | 8,523 |
|
| Option on an interest rate swap with Deutsche | | | |
| Bank AG for the right to receive a fixed rate | | | |
| of 1.683% versus the three month USD-LIBOR-BBA | | | |
| maturing June 2022. | Jun-12/1.683 | 6,556,000 | 3,737 |
|
| Option on an interest rate swap with Deutsche | | | |
| Bank AG for the right to receive a fixed rate | | | |
| of 2.1125% versus the three month USD-LIBOR-BBA | | | |
| maturing November 2022. | Nov-12/2.1125 | 15,930,000 | 290,563 |
|
| Option on an interest rate swap with Deutsche | | | |
| Bank AG for the right to receive a fixed rate | | | |
| of 2.13375% versus the three month USD-LIBOR-BBA | | | |
| maturing December 2022. | Dec-12/2.13375 | 15,930,000 | 316,211 |
|
| Option on an interest rate swap with Deutsche | | | |
| Bank AG for the right to receive a fixed rate | | | |
| of 2.225% versus the three month USD-LIBOR-BBA | | | |
| maturing October 2022. | Oct-12/2.225 | 6,027,000 | 139,706 |
|
35
| | | |
| PURCHASED OPTIONS | Expiration date/ | Contract | |
| OUTSTANDING (7.5%)* cont. | strike price | amount | Value |
|
| |
| Option on an interest rate swap with Deutsche | | | |
| Bank AG for the right to receive a fixed rate | | | |
| of 2.2475% versus the three month USD-LIBOR-BBA | | | |
| maturing November 2022. | Nov-12/2.2475 | $6,027,000 | $150,916 |
|
| Option on an interest rate swap with Deutsche | | | |
| Bank AG for the right to receive a fixed rate | | | |
| of 2.27% versus the three month USD-LIBOR-BBA | | | |
| maturing December 2022. | Dec-12/2.27 | 6,027,000 | 160,439 |
|
| Option on an interest rate swap with Deutsche | | | |
| Bank AG for the right to receive a fixed rate | | | |
| of 3.625% versus the three month USD-LIBOR-BBA | | | |
| maturing August 2026. | Aug-16/3.625 | 46,515,000 | 3,844,465 |
|
| Option on an interest rate swap with Deutsche | | | |
| Bank AG for the right to receive a fixed rate | | | |
| of 4.375% versus the three month USD-LIBOR-BBA | | | |
| maturing August 2045. | Aug-15/4.375 | 31,254,600 | 8,439,680 |
|
| Option on an interest rate swap with Deutsche | | | |
| Bank AG for the right to receive a fixed rate | | | |
| of 4.46% versus the three month USD-LIBOR-BBA | | | |
| maturing August 2045. | Aug-15/4.46 | 31,254,600 | 8,845,364 |
|
| Option on an interest rate swap with Deutsche | | | |
| Bank AG for the right to receive a fixed rate | | | |
| of 4.765% versus the three month USD-LIBOR-BBA | | | |
| maturing May 2021. | May-16/4.765 | 21,667,000 | 2,132,466 |
|
| Option on an interest rate swap with Goldman | | | |
| Sachs International for the right to pay a fixed | | | |
| rate of 2.17% versus the three month | | | |
| USD-LIBOR-BBA maturing May 2022. | May-12/2.17 | 3,487,000 | 7,323 |
|
| Option on an interest rate swap with Goldman | | | |
| Sachs International for the right to pay a fixed | | | |
| rate of 2.195% versus the three month | | | |
| USD-LIBOR-BBA maturing June 2022. | Jun-12/2.195 | 3,487,000 | 21,375 |
|
| Option on an interest rate swap with Goldman | | | |
| Sachs International for the right to pay a fixed | | | |
| rate of 2.215% versus the three month | | | |
| USD-LIBOR-BBA maturing July 2022. | Jul-12/2.215 | 3,487,000 | 32,255 |
|
| Option on an interest rate swap with Goldman | | | |
| Sachs International for the right to pay a fixed | | | |
| rate of 2.235% versus the three month | | | |
| USD-LIBOR-BBA maturing August 2022. | Aug-12/2.235 | 3,487,000 | 42,751 |
|
| Option on an interest rate swap with Goldman | | | |
| Sachs International for the right to pay a fixed | | | |
| rate of 2.26% versus the three month | | | |
| USD-LIBOR-BBA maturing September 2022. | Sep-12/2.26 | 3,487,000 | 51,747 |
|
| Option on an interest rate swap with Goldman | | | |
| Sachs International for the right to pay a fixed | | | |
| rate of 2.28% versus the three month | | | |
| USD-LIBOR-BBA maturing October 2022. | Oct-12/2.28 | 3,487,000 | 59,209 |
|
| Option on an interest rate swap with Goldman | | | |
| Sachs International for the right to pay a fixed | | | |
| rate of 2.305% versus the three month | | | |
| USD-LIBOR-BBA maturing November 2022. | Nov-12/2.305 | 3,487,000 | 67,055 |
|
36
| | | |
| PURCHASED OPTIONS | Expiration date/ | Contract | |
| OUTSTANDING (7.5%)* cont. | strike price | amount | Value |
|
| |
| Option on an interest rate swap with Goldman | | | |
| Sachs International for the right to pay a fixed | | | |
| rate of 2.325% versus the three month | | | |
| USD-LIBOR-BBA maturing December 2022. | Dec-12/2.325 | $3,487,000 | $73,994 |
|
| Option on an interest rate swap with Goldman | | | |
| Sachs International for the right to pay a fixed | | | |
| rate of 2.83% versus the three month | | | |
| USD-LIBOR-BBA maturing June 2042. | Jun-12/2.83 | 8,593,000 | 193,944 |
|
| Option on an interest rate swap with Goldman | | | |
| Sachs International for the right to pay a fixed | | | |
| rate of 2.855% versus the three month | | | |
| USD-LIBOR-BBA maturing September 2042. | Sep-12/2.855 | 8,593,000 | 369,327 |
|
| Option on an interest rate swap with Goldman | | | |
| Sachs International for the right to pay a fixed | | | |
| rate of 2.8825% versus the three month | | | |
| USD-LIBOR-BBA maturing December 2042. | Dec-12/2.8825 | 8,593,000 | 483,528 |
|
| Option on an interest rate swap with Goldman | | | |
| Sachs International for the right to pay a fixed | | | |
| rate of 4.17% versus the three month | | | |
| USD-LIBOR-BBA maturing August 2021. | Aug-16/4.17 | 26,937,000 | 478,670 |
|
| Option on an interest rate swap with Goldman | | | |
| Sachs International for the right to pay a fixed | | | |
| rate of 4.705% versus the three month | | | |
| USD-LIBOR-BBA maturing May 2021. | May-16/4.705 | 20,421,000 | 251,178 |
|
| Option on an interest rate swap with Goldman | | | |
| Sachs International for the right to pay a fixed | | | |
| rate of 4.72% versus the three month | | | |
| USD-LIBOR-BBA maturing May 2021. | May-16/4.72 | 21,667,000 | 266,721 |
|
| Option on an interest rate swap with Goldman | | | |
| Sachs International for the right to receive a | | | |
| fixed rate of 1.6714% versus the three month | | | |
| USD-LIBOR-BBA maturing July 2022. | Jul-12/1.6714 | 6,556,000 | 8,523 |
|
| Option on an interest rate swap with Goldman | | | |
| Sachs International for the right to receive a | | | |
| fixed rate of 1.683% versus the three month | | | |
| USD-LIBOR-BBA maturing June 2022. | Jun-12/1.683 | 6,556,000 | 3,737 |
|
| Option on an interest rate swap with Goldman | | | |
| Sachs International for the right to receive a | | | |
| fixed rate of 1.82% versus the three month | | | |
| USD-LIBOR-BBA maturing November 2022. | Nov-12/1.82 | 6,556,000 | 50,743 |
|
| Option on an interest rate swap with Goldman | | | |
| Sachs International for the right to receive a | | | |
| fixed rate of 1.835% versus the three month | | | |
| USD-LIBOR-BBA maturing November 2022. | Nov-12/1.835 | 6,556,000 | 55,005 |
|
| Option on an interest rate swap with Goldman | | | |
| Sachs International for the right to receive a | | | |
| fixed rate of 1.845% versus the three month | | | |
| USD-LIBOR-BBA maturing December 2022. | Dec-12/1.845 | 6,556,000 | 59,397 |
|
| Option on an interest rate swap with Goldman | | | |
| Sachs International for the right to receive a | | | |
| fixed rate of 1.855% versus the three month | | | |
| USD-LIBOR-BBA maturing December 2022. | Dec-12/1.855 | 6,556,000 | 63,659 |
|
37
| | | |
| PURCHASED OPTIONS | Expiration date/ | Contract | |
| OUTSTANDING (7.5%)* cont. | strike price | amount | Value |
|
| |
| Option on an interest rate swap with Goldman | | | |
| Sachs International for the right to receive a | | | |
| fixed rate of 1.8625% versus the three month | | | |
| USD-LIBOR-BBA maturing January 2023. | Jan-13/1.8625 | $6,556,000 | $66,543 |
|
| Option on an interest rate swap with Goldman | | | |
| Sachs International for the right to receive a | | | |
| fixed rate of 2.005% versus the three month | | | |
| USD-LIBOR-BBA maturing May 2022. | May-12/2.005 | 6,543,000 | 16,554 |
|
| Option on an interest rate swap with Goldman | | | |
| Sachs International for the right to receive a | | | |
| fixed rate of 2.03% versus the three month | | | |
| USD-LIBOR-BBA maturing June 2022. | Jun-12/2.03 | 6,543,000 | 47,240 |
|
| Option on an interest rate swap with Goldman | | | |
| Sachs International for the right to receive a | | | |
| fixed rate of 2.055% versus the three month | | | |
| USD-LIBOR-BBA maturing July 2022. | Jul-12/2.055 | 6,543,000 | 68,440 |
|
| Option on an interest rate swap with Goldman | | | |
| Sachs International for the right to receive a | | | |
| fixed rate of 2.11875% versus the three month | | | |
| USD-LIBOR-BBA maturing July 2022. | Jul-12/2.11875 | 29,847,000 | 412,187 |
|
| Option on an interest rate swap with Goldman | | | |
| Sachs International for the right to receive a | | | |
| fixed rate of 2.17% versus the three month | | | |
| USD-LIBOR-BBA maturing May 2022. | May-12/2.17 | 3,487,000 | 45,331 |
|
| Option on an interest rate swap with Goldman | | | |
| Sachs International for the right to receive a | | | |
| fixed rate of 2.1825% versus the three month | | | |
| USD-LIBOR-BBA maturing July 2022. | Jul-12/2.1825 | 6,156,000 | 111,793 |
|
| Option on an interest rate swap with Goldman | | | |
| Sachs International for the right to receive a | | | |
| fixed rate of 2.195% versus the three month | | | |
| USD-LIBOR-BBA maturing June 2022. | Jun-12/2.195 | 3,487,000 | 58,512 |
|
| Option on an interest rate swap with Goldman | | | |
| Sachs International for the right to receive a | | | |
| fixed rate of 2.215% versus the three month | | | |
| USD-LIBOR-BBA maturing July 2022. | Jul-12/2.215 | 3,487,000 | 68,101 |
|
| Option on an interest rate swap with Goldman | | | |
| Sachs International for the right to receive a | | | |
| fixed rate of 2.235% versus the three month | | | |
| USD-LIBOR-BBA maturing August 2022. | Aug-12/2.235 | 3,487,000 | 77,028 |
|
| Option on an interest rate swap with Goldman | | | |
| Sachs International for the right to receive a | | | |
| fixed rate of 2.26% versus the three month | | | |
| USD-LIBOR-BBA maturing September 2022. | Sep-12/2.26 | 3,487,000 | 85,222 |
|
| Option on an interest rate swap with Goldman | | | |
| Sachs International for the right to receive a | | | |
| fixed rate of 2.28% versus the three month | | | |
| USD-LIBOR-BBA maturing October 2022. | Oct-12/2.28 | 3,487,000 | 91,499 |
|
| Option on an interest rate swap with Goldman | | | |
| Sachs International for the right to receive a | | | |
| fixed rate of 2.305% versus the three month | | | |
| USD-LIBOR-BBA maturing November 2022. | Nov-12/2.305 | 3,487,000 | 98,264 |
|
38
| | | |
| PURCHASED OPTIONS | Expiration date/ | Contract | |
| OUTSTANDING (7.5%)* cont. | strike price | amount | Value |
|
| |
| Option on an interest rate swap with Goldman | | | |
| Sachs International for the right to receive a | | | |
| fixed rate of 2.3175% versus the three month | | | |
| USD-LIBOR-BBA maturing October 2022. | Oct-12/2.3175 | $6,027,000 | $171,348 |
|
| Option on an interest rate swap with Goldman | | | |
| Sachs International for the right to receive a | | | |
| fixed rate of 2.325% versus the three month | | | |
| USD-LIBOR-BBA maturing December 2022. | Dec-12/2.325 | 3,487,000 | 103,669 |
|
| Option on an interest rate swap with Goldman | | | |
| Sachs International for the right to receive a | | | |
| fixed rate of 2.34375% versus the three month | | | |
| USD-LIBOR-BBA maturing November 2022. | Nov-12/2.34375 | 6,027,000 | 183,643 |
|
| Option on an interest rate swap with Goldman | | | |
| Sachs International for the right to receive a | | | |
| fixed rate of 2.3675% versus the three month | | | |
| USD-LIBOR-BBA maturing December 2022. | Dec-12/2.3675 | 6,027,000 | 193,165 |
|
| Option on an interest rate swap with Goldman | | | |
| Sachs International for the right to receive a | | | |
| fixed rate of 2.83% versus the three month | | | |
| USD-LIBOR-BBA maturing June 2042. | Jun-12/2.83 | 8,593,000 | 192,913 |
|
| Option on an interest rate swap with Goldman | | | |
| Sachs International for the right to receive a | | | |
| fixed rate of 2.855% versus the three month | | | |
| USD-LIBOR-BBA maturing September 2042. | Sep-12/2.855 | 8,593,000 | 359,961 |
|
| Option on an interest rate swap with Goldman | | | |
| Sachs International for the right to receive a | | | |
| fixed rate of 2.8825% versus the three month | | | |
| USD-LIBOR-BBA maturing December 2042. | Dec-12/2.8825 | 8,593,000 | 470,295 |
|
| Option on an interest rate swap with Goldman | | | |
| Sachs International for the right to receive a | | | |
| fixed rate of 4.17% versus the three month | | | |
| USD-LIBOR-BBA maturing August 2021. | Aug-16/4.17 | 26,937,000 | 2,020,006 |
|
| Option on an interest rate swap with Goldman | | | |
| Sachs International for the right to receive a | | | |
| fixed rate of 4.705% versus the three month | | | |
| USD-LIBOR-BBA maturing May 2021. | May-16/4.705 | 20,421,000 | 1,983,696 |
|
| Option on an interest rate swap with Goldman | | | |
| Sachs International for the right to receive a | | | |
| fixed rate of 4.72% versus the three month | | | |
| USD-LIBOR-BBA maturing May 2021. | May-16/4.72 | 21,667,000 | 2,112,099 |
|
| Option on an interest rate swap with JPMorgan | | | |
| Chase Bank N.A. for the right to pay a fixed | | | |
| rate of 3.49% versus the three month | | | |
| USD-LIBOR-BBA maturing July 2022. | Jul-12/3.49 | 17,910,412 | 1,433 |
|
| Option on an interest rate swap with JPMorgan | | | |
| Chase Bank N.A. for the right to pay a fixed | | | |
| rate of 3.54% versus the three month | | | |
| USD-LIBOR-BBA maturing July 2022. | Jul-12/3.54 | 25,184,158 | 1,763 |
|
| Option on an interest rate swap with JPMorgan | | | |
| Chase Bank N.A. for the right to pay a fixed | | | |
| rate of 4.17% versus the three month | | | |
| USD-LIBOR-BBA maturing August 2021. | Aug-16/4.17 | 26,937,000 | 470,293 |
|
39
| | | |
| PURCHASED OPTIONS | Expiration date/ | Contract | |
| OUTSTANDING (7.5%)* cont. | strike price | amount | Value |
|
| |
| Option on an interest rate swap with JPMorgan | | | |
| Chase Bank N.A. for the right to pay a fixed | | | |
| rate of 4.705% versus the three month | | | |
| USD-LIBOR-BBA maturing May 2021. | May-16/4.705 | $20,421,000 | $248,483 |
|
| Option on an interest rate swap with JPMorgan | | | |
| Chase Bank N.A. for the right to pay a fixed | | | |
| rate of 5.11% versus the three month | | | |
| USD-LIBOR-BBA maturing May 2021. | May-16/5.11 | 53,472,000 | 542,955 |
|
| Option on an interest rate swap with JPMorgan | | | |
| Chase Bank N.A. for the right to receive a fixed | | | |
| rate of 1.6714% versus the three month | | | |
| USD-LIBOR-BBA maturing July 2022. | Jul-12/1.6714 | 6,556,000 | 8,523 |
|
| Option on an interest rate swap with JPMorgan | | | |
| Chase Bank N.A. for the right to receive a fixed | | | |
| rate of 1.683% versus the three month | | | |
| USD-LIBOR-BBA maturing June 2022. | Jun-12/1.683 | 6,556,000 | 3,737 |
|
| Option on an interest rate swap with JPMorgan | | | |
| Chase Bank N.A. for the right to receive a fixed | | | |
| rate of 3.49% versus the three month | | | |
| USD-LIBOR-BBA maturing July 2022. | Jul-12/3.49 | 17,910,412 | 2,281,966 |
|
| Option on an interest rate swap with JPMorgan | | | |
| Chase Bank N.A. for the right to receive a fixed | | | |
| rate of 3.54% versus the three month | | | |
| USD-LIBOR-BBA maturing July 2022. | Jul-12/3.54 | 25,184,158 | 3,322,294 |
|
| Option on an interest rate swap with JPMorgan | | | |
| Chase Bank N.A. for the right to receive a fixed | | | |
| rate of 4.17% versus the three month | | | |
| USD-LIBOR-BBA maturing August 2021. | Aug-16/4.17 | 26,937,000 | 2,074,311 |
|
| Option on an interest rate swap with JPMorgan | | | |
| Chase Bank N.A. for the right to receive a fixed | | | |
| rate of 4.705% versus the three month | | | |
| USD-LIBOR-BBA maturing May 2021. | May-16/4.705 | 20,421,000 | 2,040,671 |
|
| Total purchased options outstanding (cost $108,414,708) | | $103,698,468 |
| | | |
| | |
| ASSET-BACKED SECURITIES (4.2%)* | Principal amount | Value |
|
| Citigroup Mortgage Loan Trust, Inc. Ser. 2005-WF2, | | |
| Class AF4, 4.964s, 2035 | $3,056,789 | $2,812,246 |
|
| Countrywide Asset Backed Certificates | | |
| FRB Ser. 05-AB1, Class A3, 0.539s, 2035 | 15,110,431 | 12,919,419 |
| FRB Ser. 07-11, Class 2A2, 0.359s, 2047 | 8,205,000 | 7,266,348 |
| FRB Ser. 07-1, Class 2A2, 0.339s, 2037 | 6,442,000 | 5,749,485 |
|
| First Plus Home Loan Trust Ser. 97-3, Class B1, 7.79s, | | |
| 2023 (In default) † | 134,710 | 13 |
|
| G-Star, Ltd. 144A FRB Ser. 02-2A, Class BFL, 2.239s, 2037 | 417,000 | 341,940 |
|
| GE Business Loan Trust 144A Ser. 04-2, Class D, 2.99s, 2032 | 293,557 | 117,188 |
|
| GSAA Home Equity Trust | | |
| FRB Ser. 05-8, Class A3, 0.669s, 2035 | 12,631,000 | 8,968,010 |
| FRB Ser. 05-9, Class 2A3, 0.609s, 2035 | 8,000,000 | 5,640,000 |
| FRB Ser. 05-6, Class A3, 0.609s, 2035 | 18,004,810 | 13,108,650 |
|
| Structured Asset Securities Corp. 144A Ser. 98-RF3, | | |
| Class A, IO, 6.1s, 2028 | 910,577 | 138,855 |
|
| TIAA Real Estate CDO, Ltd. Ser. 03-1A, Class E, 8s, 2038 | 1,545,461 | 185,455 |
|
| Total asset-backed securities (cost $57,133,512) | | $57,247,609 |
40
| | | |
| MUNICIPAL BONDS AND NOTES (0.3%)* | | Principal amount | Value |
|
| CA State G.O. Bonds (Build America Bonds), 7 1/2s, 4/1/34 | | $770,000 | $986,794 |
|
| IL State G.O. Bonds | | | |
| 4.421s, 1/1/15 | | 410,000 | 432,964 |
| 4.071s, 1/1/14 | | 1,220,000 | 1,271,252 |
|
| North TX, Thruway Auth. Rev. Bonds (Build America Bonds), | | | |
| 6.718s, 1/1/49 | | 675,000 | 877,541 |
|
| OH State U. Rev. Bonds (Build America Bonds), 4.91s, 6/1/40 | | 845,000 | 977,124 |
|
| Total municipal bonds and notes (cost $3,925,329) | | | $4,545,675 |
|
| |
| FOREIGN GOVERNMENT BONDS AND NOTES (0.1%)* | | Principal amount | Value |
|
| Hungary (Republic of) sr. unsec. unsub. notes 7 5/8s, 2041 | | $748,000 | $699,073 |
|
| Korea Development Bank sr. unsec. unsub. notes 4s, 2016 | | 800,000 | 835,143 |
|
| Total foreign government bonds and notes (cost $1,577,532) | | | $1,534,216 |
|
| |
| SENIOR LOANS (—%)* c | | Principal amount | Value |
|
| Caesars Entertainment Operating Co., Inc. bank term loan | | | |
| FRN Ser. B6, 5.494s, 2018 | | $200,422 | $183,207 |
|
| National Bedding Company, LLC bank term loan FRN Ser. B, | | | |
| 4 1/8s, 2013 | | 148,675 | 148,675 |
|
| SunGard Data Systems, Inc. bank term loan FRN Ser. B, | | | |
| 4.058s, 2016 | | 134,059 | 134,199 |
|
| SunGard Data Systems, Inc. bank term loan FRN Ser. C, 3.994s, 2017 | 6,470 | 6,487 |
|
| Total senior loans (cost $450,370) | | | $472,568 |
|
| |
| U.S. TREASURY OBLIGATIONS (—%)* | | Principal amount | Value |
|
| U.S. Treasury Notes 2 5/8s, November 15, 2020 | | $416,000 | $448,305 |
|
| Total U.S. treasury obligations (cost $392,362) | | | $448,305 |
|
| |
| SHORT-TERM INVESTMENTS (37.9%)* | Principal amount/shares | Value |
|
| Putnam Money Market Liquidity Fund 0.10% e | | 148,897,569 | $148,897,569 |
|
| SSgA Prime Money Market Fund 0.12% P | | 28,770,000 | 28,770,000 |
|
| Federal Home Loan Bank discount notes with an effective | | | |
| yield of 0.060%, May 11, 2012 | | $15,000,000 | 14,999,750 |
|
| Federal National Mortgage Association discount | | | |
| notes with an effective yield of 0.065%, May 23, 2012 | | 25,000,000 | 24,999,007 |
|
| Straight-A Funding, LLC commercial paper with an effective | | | |
| yield of 0.178%, July 23, 2012 | | 10,000,000 | 9,995,850 |
|
| Straight-A Funding, LLC commercial paper with an effective | | | |
| yield of 0.178%, May 14, 2012 | | 3,200,000 | 3,199,792 |
|
| Straight-A Funding, LLC commercial paper with an effective | | | |
| yield of 0.178%, July 11, 2012 | | 8,000,000 | 7,997,664 |
|
| Straight-A Funding, LLC commercial paper with an effective | | | |
| yield of 0.178%, May 17, 2012 | | 20,000,000 | 19,998,400 |
|
| U.S. Treasury Bills with an effective yield of 0.104%, | | | |
| December 13, 2012 ## | | 12,500,000 | 12,488,238 |
|
| U.S. Treasury Bills with effective yields ranging from | | | |
| 0.058% to 0.111%, July 26, 2012 # ## | | 153,605,000 | 153,571,053 |
|
41
| | |
| SHORT-TERM INVESTMENTS (37.9%)* cont. | Principal amount/shares | Value |
|
| U.S. Treasury Bills with effective yields ranging from | | |
| 0.070% to 0.083%, June 28, 2012 # ## | $68,438,000 | $68,429,770 |
|
| U.S. Treasury Bills with effective yields ranging from | | |
| 0.088% to 0.131%, May 3, 2012 ## | 28,090,000 | 28,089,832 |
|
| Total short-term investments (cost $521,440,425) | | $521,436,925 |
| |
| TOTAL INVESTMENTS | | |
|
| Total investments (cost $1,929,471,049) | | $2,000,094,051 |
Key to holding’s abbreviations
| |
| FRB | Floating Rate Bonds: the rate shown is the current interest rate at the close of the reporting period |
| FRN | Floating Rate Notes: the rate shown is the current interest rate at the close of the reporting period |
| G.O. Bonds | General Obligation Bonds |
| IFB | Inverse Floating Rate Bonds, which are securities that pay interest rates that vary inversely to |
| | changes in the market interest rates. As interest rates rise, inverse floaters produce less current |
| income. The rate shown is the current interest rate at the close of the reporting period. |
| IO | Interest Only |
| MTN | Medium Term Notes |
| PO | Principal Only |
| TBA | To Be Announced Commitments |
Notes to the fund’s portfolio
Unless noted otherwise, the notes to the fund’s portfolio are for the close of the fund’s reporting period, which ran from November 1, 2011 through April 30, 2012 (the reporting period). Within the following notes to the portfolio, references to “ASC 820” represent Accounting Standards Codification ASC 820 Fair Value Measurements and Disclosures.
* Percentages indicated are based on net assets of $1,374,166,121.
† Non-income-producing security.
# This security, in part or in entirety, was pledged and segregated with the broker to cover margin requirements for futures contracts at the close of the reporting period.
## This security, in part or in entirety, was pledged and segregated with the custodian for collateral on certain derivative contracts at the close of the reporting period.
∆ Forward commitment, in part or in entirety (Note 1).
c Senior loans are exempt from registration under the Securities Act of 1933, as amended, but contain certain restrictions on resale and cannot be sold publicly. These loans pay interest at rates which adjust periodically. The interest rates shown for senior loans are the current interest rates at the close of the reporting period. Senior loans are also subject to mandatory and/or optional prepayment which cannot be predicted. As a result, the remaining maturity may be substantially less than the stated maturity shown (Notes 1 and 7).
e See Note 6 to the financial statements regarding investments in Putnam Money Market Liquidity Fund. The rate quoted in the security description is the annualized 7-day yield of the fund at the close of the reporting period.
F Is valued at fair value following procedures approved by the Trustees. Securities may be classified as Level 2 or Level 3 for ASC 820 based on the securities’ valuation inputs.
P Security purchased with cash or security received, that was pledged to the fund for collateral on certain derivatives contracts. The rate quoted in the security description is the annualized 7-day yield of the fund at the close of the reporting period (Note 1).
R Real Estate Investment Trust.
At the close of the reporting period, the fund maintained liquid assets totaling $675,827,372 to cover certain derivatives contracts.
42
Debt obligations are considered secured unless otherwise indicated.
144A after the name of an issuer represents securities exempt from registration under Rule 144A under the Securities Act of 1933, as amended. These securities may be resold in transactions exempt from registration, normally to qualified institutional buyers.
See Note 1 to the financial statements regarding TBA’s.
The dates shown on debt obligations are the original maturity dates.
| | | | | |
| FUTURES CONTRACTS OUTSTANDING at 4/30/12 (Unaudited) | | | |
| |
| | Number of | | | Expiration | Unrealized |
| | contracts | Value | | date | appreciation |
|
| U.S. Treasury Bond 30 yr (Long) | 1,308 | $186,880,500 | | Jun-12 | $2,100,746 |
|
| U.S. Treasury Note 10 yr (Long) | 743 | 98,284,969 | | Jun-12 | 996,995 |
|
| Total | | | | | $3,097,741 |
| | | |
| | | | |
| WRITTEN OPTIONS OUTSTANDING at 4/30/12 (premiums received $70,038,539) (Unaudited) | |
| |
| | Contract | | Expiration date/ | |
| | amount | | strike price | Value |
|
| Option on an interest rate swap with Bank of America | | | | |
| N.A. for the obligation to pay a fixed rate of 2.17% | | | | |
| versus the three month USD-LIBOR-BBA maturing | | | | |
| May 2022. | $3,487,000 | | May-12/2.17 | $45,331 |
|
| Option on an interest rate swap with Bank of America | | | | |
| N.A. for the obligation to receive a fixed rate of 2.17% | | | | |
| versus the three month USD-LIBOR-BBA maturing | | | | |
| May 2022. | 3,487,000 | | May-12/2.17 | 7,323 |
|
| Option on an interest rate swap with Bank of America, | | | | |
| N.A. for the obligation to pay a fixed rate of 2.183% | | | | |
| versus the three month USD-LIBOR-BBA maturing | | | | |
| June 2022. | 3,081,000 | | Jun-12/2.183 | 49,727 |
|
| Option on an interest rate swap with Bank of America, | | | | |
| N.A. for the obligation to pay a fixed rate of 4.28% | | | | |
| versus the three month USD-LIBOR-BBA maturing | | | | |
| August 2026. | 78,798,972 | | Aug-16/4.28 | 9,741,917 |
|
| Option on an interest rate swap with Bank of America, | | | | |
| N.A. for the obligation to pay a fixed rate of 4.35% | | | | |
| versus the three month USD-LIBOR-BBA maturing | | | | |
| August 2026. | 1,003,850 | | Aug-16/4.35 | 128,517 |
|
| Option on an interest rate swap with Bank of America, | | | | |
| N.A. for the obligation to receive a fixed rate of 4.28% | | | | |
| versus the three month USD-LIBOR-BBA maturing | | | | |
| August 2026. | 78,798,972 | | Aug-16/4.28 | 2,868,204 |
|
| Option on an interest rate swap with Barclay’s Bank, | | | | |
| PLC for the obligation to pay a fixed rate of 2.183% | | | | |
| versus the three month USD-LIBOR-BBA maturing | | | | |
| June 2022. | 3,081,000 | | Jun-12/2.183 | 49,727 |
|
| Option on an interest rate swap with Barclay’s Bank, | | | | |
| PLC for the obligation to pay a fixed rate of 3.625% | | | | |
| versus the three month USD-LIBOR-BBA maturing | | | | |
| August 2026. | 46,466,969 | | Aug-16/3.625 | 3,935,752 |
|
| Option on an interest rate swap with Barclay’s Bank, | | | | |
| PLC for the obligation to pay a fixed rate of 4.39% | | | | |
| versus the three month USD-LIBOR-BBA maturing | | | | |
| June 2021. | 54,646,220 | | Jun-16/4.39 | 4,628,535 |
|
43
| | | | |
| WRITTEN OPTIONS OUTSTANDING at 4/30/12 (premiums received $70,038,539) (Unaudited) cont. | |
| |
| | Contract | | Expiration date/ | |
| | amount | | strike price | Value |
|
| Option on an interest rate swap with Barclay’s Bank, | | | | |
| PLC for the obligation to pay a fixed rate of 4.67% | | | | |
| versus the three month USD-LIBOR-BBA maturing | | | | |
| July 2026. | $9,528,934 | | Jul-16/4.67 | $1,406,471 |
|
| Option on an interest rate swap with Barclay’s Bank, | | | | |
| PLC for the obligation to pay a fixed rate of 4.80% | | | | |
| versus the three month USD-LIBOR-BBA maturing | | | | |
| July 2026. | 3,811,574 | | Jul-16/4.80 | 596,130 |
|
| Option on an interest rate swap with Barclay’s Bank, | | | | |
| PLC for the obligation to receive a fixed rate of 3.625% | | | | |
| versus the three month USD-LIBOR-BBA maturing | | | | |
| August 2026. | 46,466,969 | | Aug-16/3.625 | 2,444,163 |
|
| Option on an interest rate swap with Barclay’s Bank, | | | | |
| PLC for the obligation to receive a fixed rate of 4.67% | | | | |
| versus the three month USD-LIBOR-BBA maturing | | | | |
| July 2026. | 9,528,934 | | Jul-16/4.67 | 269,669 |
|
| Option on an interest rate swap with Barclay’s Bank, | | | | |
| PLC for the obligation to receive a fixed rate of 4.80% | | | | |
| versus the three month USD-LIBOR-BBA maturing | | | | |
| July 2026. | 3,811,574 | | Jul-16/4.80 | 99,863 |
|
| Option on an interest rate swap with Barclay’s Bank, | | | | |
| PLC for the obligation to receive a fixed rate of 4.89% | | | | |
| versus the three month USD-LIBOR-BBA maturing | | | | |
| June 2021. | 54,646,220 | | Jun-16/4.89 | 633,896 |
|
| Option on an interest rate swap with Citibank, N.A. for | | | | |
| the obligation to pay a fixed rate of 2.1714% versus the | | | | |
| three month USD-LIBOR-BBA maturing July 2022. | 3,147,000 | | Jul-12/2.1714 | 53,845 |
|
| Option on an interest rate swap with Citibank, N.A. for | | | | |
| the obligation to pay a fixed rate of 2.6075% versus the | | | | |
| three month USD-LIBOR-BBA maturing July 2022. | 24,654,000 | | Jul-12/2.6075 | 1,203,362 |
|
| Option on an interest rate swap with Citibank, N.A. for | | | | |
| the obligation to pay a fixed rate of 4.12% versus the | | | | |
| three month USD-LIBOR-BBA maturing June 2021. | 55,533,334 | | Jun-16/4.12 | 4,181,938 |
|
| Option on an interest rate swap with Citibank, N.A. for | | | | |
| the obligation to receive a fixed rate of 5.12% versus the | | | | |
| three month USD-LIBOR-BBA maturing June 2021. | 55,533,334 | | Jun-16/5.12 | 601,759 |
|
| Option on an interest rate swap with Credit Suisse | | | | |
| International for the obligation to pay a fixed rate | | | | |
| of 2.005% versus the three month USD-LIBOR-BBA | | | | |
| maturing May 2022. | 6,543,000 | | May-12/2.005 | 16,554 |
|
| Option on an interest rate swap with Credit Suisse | | | | |
| International for the obligation to pay a fixed rate of | | | | |
| 2.1714% versus the three month USD-LIBOR-BBA | | | | |
| maturing July 2022. | 3,147,000 | | Jul-12/2.1714 | 53,845 |
|
| Option on an interest rate swap with Credit Suisse | | | | |
| International for the obligation to pay a fixed rate | | | | |
| of 2.324% versus the three month USD-LIBOR-BBA | | | | |
| maturing May 2022. | 13,112,000 | | May-12/2.324 | 337,765 |
|
| Option on an interest rate swap with Credit Suisse | | | | |
| International for the obligation to pay a fixed rate | | | | |
| of 2.346% versus the three month USD-LIBOR-BBA | | | | |
| maturing June 2022. | 13,112,000 | | Jun-12/2.346 | 360,842 |
|
44
| | | | |
| WRITTEN OPTIONS OUTSTANDING at 4/30/12 (premiums received $70,038,539) (Unaudited) cont. | |
| |
| | Contract | | Expiration date/ | |
| | amount | | strike price | Value |
|
| Option on an interest rate swap with Credit Suisse | | | | |
| International for the obligation to pay a fixed rate | | | | |
| of 2.372% versus the three month USD-LIBOR-BBA | | | | |
| maturing July 2022. | $13,112,000 | | Jul-12/2.372 | $392,573 |
|
| Option on an interest rate swap with Credit Suisse | | | | |
| International for the obligation to pay a fixed rate | | | | |
| of 2.394% versus the three month USD-LIBOR-BBA | | | | |
| maturing August 2022. | 13,112,000 | | Aug-12/2.394 | 422,075 |
|
| Option on an interest rate swap with Credit Suisse | | | | |
| International for the obligation to pay a fixed rate | | | | |
| of 2.419% versus the three month USD-LIBOR-BBA | | | | |
| maturing September 2022. | 13,112,000 | | Sep-12/2.419 | 449,348 |
|
| Option on an interest rate swap with Credit Suisse | | | | |
| International for the obligation to pay a fixed rate | | | | |
| of 2.443% versus the three month USD-LIBOR-BBA | | | | |
| maturing October 2022. | 13,112,000 | | Oct-12/2.443 | 475,966 |
|
| Option on an interest rate swap with Credit Suisse | | | | |
| International for the obligation to pay a fixed rate of | | | | |
| 2.4475% versus the three month USD-LIBOR-BBA | | | | |
| maturing August 2022. | 32,687,000 | | Aug-12/2.4475 | 1,184,250 |
|
| Option on an interest rate swap with Credit Suisse | | | | |
| International for the obligation to pay a fixed rate of | | | | |
| 2.6075% versus the three month USD-LIBOR-BBA | | | | |
| maturing July 2022. | 24,654,000 | | Jul-12/2.6075 | 1,203,362 |
|
| Option on an interest rate swap with Deutsche Bank AG | | | | |
| for the obligation to pay a fixed rate of 2.1714% versus | | | | |
| the three month USD-LIBOR-BBA maturing July 2022. | 3,147,000 | | Jul-12/2.1714 | 53,845 |
|
| Option on an interest rate swap with Deutsche Bank AG | | | | |
| for the obligation to pay a fixed rate of 2.183% versus | | | | |
| the three month USD-LIBOR-BBA maturing June 2022. | 3,081,000 | | Jun-12/2.183 | 49,727 |
|
| Option on an interest rate swap with Deutsche Bank AG | | | | |
| for the obligation to pay a fixed rate of 2.195% versus | | | | |
| the three month USD-LIBOR-BBA maturing June 2022. | 3,487,000 | | Jun-12/2.195 | 58,512 |
|
| Option on an interest rate swap with Deutsche Bank | | | | |
| AG for the obligation to receive a fixed rate of 2.195% | | | | |
| versus the three month USD-LIBOR-BBA maturing | | | | |
| June 2022. | 3,487,000 | | Jun-12/2.195 | 21,375 |
|
| Option on an interest rate swap with Goldman Sachs | | | | |
| International for the obligation to pay a fixed rate of | | | | |
| 2.1714% versus the three month USD-LIBOR-BBA | | | | |
| maturing July 2022. | 3,147,000 | | Jul-12/2.1714 | 53,845 |
|
| Option on an interest rate swap with Goldman Sachs | | | | |
| International for the obligation to pay a fixed rate | | | | |
| of 2.183% versus the three month USD-LIBOR-BBA | | | | |
| maturing June 2022. | 3,081,000 | | Jun-12/2.183 | 49,727 |
|
| Option on an interest rate swap with Goldman Sachs | | | | |
| International for the obligation to pay a fixed rate | | | | |
| of 2.32% versus the three month USD-LIBOR-BBA | | | | |
| maturing November 2022. | 3,671,000 | | Nov-12/2.32 | 106,826 |
|
| Option on an interest rate swap with Goldman Sachs | | | | |
| International for the obligation to pay a fixed rate | | | | |
| of 2.335% versus the three month USD-LIBOR-BBA | | | | |
| maturing November 2022. | 3,671,000 | | Nov-12/2.335 | 110,093 |
|
45
| | | | |
| WRITTEN OPTIONS OUTSTANDING at 4/30/12 (premiums received $70,038,539) (Unaudited) cont. | |
| |
| | Contract | | Expiration date/ | |
| | amount | | strike price | Value |
|
| Option on an interest rate swap with Goldman Sachs | | | | |
| International for the obligation to pay a fixed rate | | | | |
| of 2.345% versus the three month USD-LIBOR-BBA | | | | |
| maturing December 2022. | $3,671,000 | | Dec-12/2.345 | $112,920 |
|
| Option on an interest rate swap with Goldman Sachs | | | | |
| International for the obligation to pay a fixed rate | | | | |
| of 2.355% versus the three month USD-LIBOR-BBA | | | | |
| maturing December 2022. | 3,671,000 | | Dec-12/2.355 | 115,637 |
|
| Option on an interest rate swap with Goldman Sachs | | | | |
| International for the obligation to pay a fixed rate of | | | | |
| 2.3625% versus the three month USD-LIBOR-BBA | | | | |
| maturing January 2023. | 3,671,000 | | Jan-13/2.3625 | 117,142 |
|
| Option on an interest rate swap with Goldman Sachs | | | | |
| International for the obligation to pay a fixed rate of | | | | |
| 2.61875% versus the three month USD-LIBOR-BBA | | | | |
| maturing July 2022. | 24,654,000 | | Jul-12/2.61875 | 1,226,290 |
|
| Option on an interest rate swap with Goldman Sachs | | | | |
| International for the obligation to pay a fixed rate of | | | | |
| 2.6825% versus the three month USD-LIBOR-BBA | | | | |
| maturing July 2022. | 3,499,000 | | Jul-12/2.6825 | 192,480 |
|
| Option on an interest rate swap with Goldman Sachs | | | | |
| International for the obligation to pay a fixed rate | | | | |
| of 3.49% versus the three month USD-LIBOR-BBA | | | | |
| maturing September 2026. | 25,092,787 | | Sep-16/3.49 | 1,943,185 |
|
| Option on an interest rate swap with Goldman Sachs | | | | |
| International for the obligation to receive a fixed rate | | | | |
| of 3.49% versus the three month USD-LIBOR-BBA | | | | |
| maturing September 2026. | 25,092,787 | | Sep-16/3.49 | 1,448,858 |
|
| Option on an interest rate swap with JPMorgan Chase | | | | |
| Bank N.A. for the obligation to pay a fixed rate of | | | | |
| 2.1714% versus the three month USD-LIBOR-BBA | | | | |
| maturing July 2022. | 3,147,000 | | Jul-12/2.1714 | 53,845 |
|
| Option on an interest rate swap with JPMorgan Chase | | | | |
| Bank N.A. for the obligation to pay a fixed rate of | | | | |
| 2.183% versus the three month USD-LIBOR-BBA | | | | |
| maturing June 2022. | 3,081,000 | | Jun-12/2.183 | 49,727 |
|
| Option on an interest rate swap with JPMorgan Chase | | | | |
| Bank N.A. for the obligation to pay a fixed rate of 4.04% | | | | |
| versus the three month USD-LIBOR-BBA maturing | | | | |
| September 2025. | 62,854,000 | | Sep-15/4.04 | 7,472,272 |
|
| Option on an interest rate swap with JPMorgan Chase | | | | |
| Bank N.A. for the obligation to pay a fixed rate of | | | | |
| 4.375% versus the three month USD-LIBOR-BBA | | | | |
| maturing August 2045. | 31,254,600 | | Aug-15/4.375 | 8,852,959 |
|
| Option on an interest rate swap with JPMorgan Chase | | | | |
| Bank N.A. for the obligation to pay a fixed rate of 4.46% | | | | |
| versus the three month USD-LIBOR-BBA maturing | | | | |
| August 2045. | 31,254,600 | | Aug-15/4.46 | 9,277,428 |
|
| Option on an interest rate swap with JPMorgan Chase | | | | |
| Bank N.A. for the obligation to pay a fixed rate of | | | | |
| 4.575% versus the three month USD-LIBOR-BBA | | | | |
| maturing June 2021. | 54,299,260 | | Jun-16/4.575 | 5,113,741 |
|
46
| | | | |
| WRITTEN OPTIONS OUTSTANDING at 4/30/12 (premiums received $70,038,539) (Unaudited) cont. | |
| |
| | Contract | | Expiration date/ |
| | amount | | strike price | Value |
|
| Option on an interest rate swap with JPMorgan Chase | | | | |
| Bank N.A. for the obligation to pay a fixed rate of 4.74% | | | | |
| versus the three month USD-LIBOR-BBA maturing | | | | |
| July 2026. | $8,176,815 | | Jul-16/4.74 | $1,284,357 |
|
| Option on an interest rate swap with JPMorgan Chase | | | | |
| Bank N.A. for the obligation to pay a fixed rate of 4.79% | | | | |
| versus the three month USD-LIBOR-BBA maturing | | | | |
| July 2026. | 13,395,829 | | Jul-16/4.79 | 2,147,914 |
|
| Option on an interest rate swap with JPMorgan Chase | | | | |
| Bank N.A. for the obligation to pay a fixed rate of 5.51% | | | | |
| versus the three month USD-LIBOR-BBA maturing | | | | |
| May 2022. | 17,335,500 | | May-12/5.51 | 5,552,387 |
|
| Option on an interest rate swap with JPMorgan Chase | | | | |
| Bank N.A. for the obligation to receive a fixed rate | | | | |
| of 4.04% versus the three month USD-LIBOR-BBA | | | | |
| maturing September 2025. | 62,854,000 | | Sep-15/4.04 | 1,879,523 |
|
| Option on an interest rate swap with JPMorgan Chase | | | | |
| Bank N.A. for the obligation to receive a fixed rate | | | | |
| of 4.375% versus the three month USD-LIBOR-BBA | | | | |
| maturing August 2045. | 31,254,600 | | Aug-15/4.375 | 1,494,157 |
|
| Option on an interest rate swap with JPMorgan Chase | | | | |
| Bank N.A. for the obligation to receive a fixed rate | | | | |
| of 4.46% versus the three month USD-LIBOR-BBA | | | | |
| maturing August 2045. | 31,254,600 | | Aug-15/4.46 | 1,388,923 |
|
| Option on an interest rate swap with JPMorgan Chase | | | | |
| Bank N.A. for the obligation to receive a fixed rate | | | | |
| of 4.575% versus the three month USD-LIBOR-BBA | | | | |
| maturing June 2021. | 54,299,260 | | Jun-16/4.575 | 721,203 |
|
| Option on an interest rate swap with JPMorgan Chase | | | | |
| Bank N.A. for the obligation to receive a fixed rate | | | | |
| of 4.74% versus the three month USD-LIBOR-BBA | | | | |
| maturing July 2026. | 8,176,815 | | Jul-16/4.74 | 215,475 |
|
| Option on an interest rate swap with JPMorgan Chase | | | | |
| Bank N.A. for the obligation to receive a fixed rate | | | | |
| of 4.79% versus the three month USD-LIBOR-BBA | | | | |
| maturing July 2026. | 13,395,829 | | Jul-16/4.79 | 343,710 |
|
| Option on an interest rate swap with JPMorgan Chase | | | | |
| Bank N.A. for the obligation to receive a fixed rate | | | | |
| of 5.51% versus the three month USD-LIBOR-BBA | | | | |
| maturing May 2022. | 17,335,500 | | May-12/5.51 | 20 |
|
| Total | | | | $89,350,812 |
|
| |
| TBA SALE COMMITMENTS OUTSTANDING at 4/30/12 (proceeds receivable $149,243,906) (Unaudited) |
| |
| | Principal | | Settlement | |
| Agency | amount | | date | Value |
|
| Federal National Mortgage Association, 4 1/2s, | | | | |
| May 1, 2042 | $9,000,000 | | 5/14/12 | $9,636,328 |
|
| Federal National Mortgage Association, 3 1/2s, | | | | |
| May 1, 2042 | 135,000,000 | | 5/14/12 | 140,189,062 |
|
| Total | | | | $149,825,390 |
47
| | | | | | |
| INTEREST RATE SWAP CONTRACTS OUTSTANDING at 4/30/12 (Unaudited) | | |
| |
| | Upfront | | | Payments | Payments | Unrealized |
| Swap counterparty / | premium | Termination | | made by | received by | appreciation/ |
| Notional amount | received (paid) | date | | fund per annum | fund per annum | (depreciation) |
|
| Bank of America N.A. | | | | | | |
| $63,317,000 | $— | 3/23/14 | | 3 month USD- | | |
| | | | | LIBOR-BBA | 0.643% | $128,221 |
|
| 88,701,000 | — | 3/23/22 | | 2.388% | 3 month USD- | |
| | | | | | LIBOR-BBA | (3,131,832) |
|
| Barclay’s Bank, PLC | | | | | | |
| 12,120,000 | — | 4/17/14 | | 3 month USD- | | |
| | | | | LIBOR-BBA | 0.569% | 5,696 |
|
| 5,917,000 | — | 4/20/14 | | 3 month USD- | | |
| | | | | LIBOR-BBA | 0.56% | 1,591 |
|
| 3,800,000 | — | 4/24/22 | | 3 month USD- | | |
| | | | | LIBOR-BBA | 2.0925% | 20,848 |
|
| 3,589,000 | — | 4/24/14 | | 0.565% | 3 month USD- | |
| | | | | | LIBOR-BBA | (1,254) |
|
| 6,831,000 | — | 4/27/14 | | 0.5725% | 3 month USD- | |
| | | | | | LIBOR-BBA | (3,292) |
|
| 3,153,000 | — | 4/27/22 | | 3 month USD- | | |
| | | | | LIBOR-BBA | 2.1225% | 25,458 |
|
| 5,254,000 | — | 4/27/14 | | 0.5725% | 3 month USD- | |
| | | | | | LIBOR-BBA | (2,532) |
|
| 2,452,000 | — | 4/27/22 | | 3 month USD- | | |
| | | | | LIBOR-BBA | 2.115% | 18,079 |
|
| 18,119,000 | — | 4/27/14 | | 3 month USD- | | |
| | | | | LIBOR-BBA | 0.57% | 7,820 |
|
| 19,906,000 | — | 4/27/22 | | 2.12625% | 3 month USD- | |
| | | | | | LIBOR-BBA | (167,698) |
|
| 3,806,716 | — | 5/2/22 | | 2.047% | 3 month USD- | |
| | | | | | LIBOR-BBA | (2,284) |
|
| 23,727,000 | 676,220 | 4/12/22 | | 2.4275% | 3 month USD- | |
| | | | | | LIBOR-BBA | (212,916) |
|
| 11,757,000 | — | 4/5/22 | | 2.2625% | 3 month USD- | |
| | | | | | LIBOR-BBA | (266,945) |
|
| Citibank, N.A. | | | | | | |
| 2,182,000 E | — | 10/7/21 | | 3 month USD- | | |
| | | | | LIBOR-BBA | 3.0625% | 11,521 |
|
| 23,727,000 | 664,356 | 4/12/22 | | 2.4275% | 3 month USD- | |
| | | | | | LIBOR-BBA | (224,779) |
|
| 10,384,000 | — | 4/12/17 | | 3 month USD- | | |
| | | | | LIBOR-BBA | 1.175% | 49,454 |
|
| Credit Suisse International | | | | | |
| 12,128,000 | — | 4/30/22 | | 3 month USD- | | |
| | | | | LIBOR-BBA | 2.068% | 35,105 |
|
| 3,402,000 | — | 4/30/22 | | 3 month USD- | | |
| | | | | LIBOR-BBA | 2.068% | 9,847 |
|
| 4,333,000 | — | 4/30/22 | | 2.077% | 3 month USD- | |
| | | | | | LIBOR-BBA | (16,139) |
|
| 23,727,000 | 672,660 | 4/12/22 | | 2.4275% | 3 month USD- | |
| | | | | | LIBOR-BBA | (216,475) |
|
48
| | | | | | |
| INTEREST RATE SWAP CONTRACTS OUTSTANDING at 4/30/12 (Unaudited) cont. | |
| |
| | Upfront | | | Payments | Payments | Unrealized |
| Swap counterparty / | premium | Termination | | made by | received by | appreciation/ |
| Notional amount | received (paid) | date | | fund per annum | fund per annum | (depreciation) |
|
| Credit Suisse International cont. | | | | | |
| $2,811,000 E | $— | 8/17/22 | | 3 month USD- | | |
| | | | | LIBOR-BBA | 2.4475% | $82,587 |
|
| 136,690,000 | — | 4/13/14 | | 0.5925% | 3 month USD- | |
| | | | | | LIBOR-BBA | (123,694) |
|
| 52,719,000 | — | 4/13/17 | | 3 month USD- | | |
| | | | | LIBOR-BBA | 1.1675% | 229,825 |
|
| 40,144,000 | — | 4/13/22 | | 2.133% | 3 month USD- | |
| | | | | | LIBOR-BBA | (405,140) |
|
| 12,355,000 | — | 4/17/42 | | 2.8375% | 3 month USD- | |
| | | | | | LIBOR-BBA | (64,520) |
|
| Deutsche Bank AG | | | | | | |
| 4,931,000 | — | 5/2/17 | | 3 month USD- | | |
| | | | | LIBOR-BBA | 1.1066% | 2,120 |
|
| 73,779,000 | — | 5/2/22 | | 2.046% | 3 month USD- | |
| | | | | | LIBOR-BBA | (37,627) |
|
| 32,272,000 | — | 5/2/42 | | 3 month USD- | | |
| | | | | LIBOR-BBA | 2.8115% | (42,276) |
|
| 3,806,716 | — | 5/2/22 | | 3 month USD- | | |
| | | | | LIBOR-BBA | 2.05% | 3,350 |
|
| 1,104,000 E | — | 10/7/21 | | 3 month USD- | | |
| | | | | LIBOR-BBA | 3.0475% | 5,089 |
|
| Goldman Sachs International | | | | | |
| 2,222,300 | — | 4/23/22 | | 2.10375% | 3 month USD- | |
| | | | | | LIBOR-BBA | (14,587) |
|
| 33,777,000 | (938,156) | 3/26/22 | | 2.075% | 3 month USD- | |
| | | | | | LIBOR-BBA | (1,138,917) |
|
| 23,727,000 | 669,101 | 4/12/22 | | 2.4275% | 3 month USD- | |
| | | | | | LIBOR-BBA | (220,034) |
|
| 23,727,000 | 676,220 | 4/13/22 | | 2.498% | 3 month USD- | |
| | | | | | LIBOR-BBA | (366,219) |
|
| 4,814,000 | 140,040 | 4/27/22 | | 2.60% | 3 month USD- | |
| | | | | | LIBOR-BBA | (111,814) |
|
| 6,156,000 | (113,886) | 4/27/22 | | 3 month USD- | | |
| | | | | LIBOR-BBA | 2.35% | 65,557 |
|
| 17,217,000 | — | 4/12/22 | | 2.09542% | 3 month USD- | |
| | | | | | LIBOR-BBA | (114,980) |
|
| 97,327,000 | — | 4/18/22 | | 2.075% | 3 month USD- | |
| | | | | | LIBOR-BBA | (421,538) |
|
| 12,376,000 | — | 4/18/42 | | 2.834375% | 3 month USD- | |
| | | | | | LIBOR-BBA | (55,759) |
|
| JPMorgan Chase Bank, N.A. | | | | | |
| 12,690,200 | — | 4/19/22 | | 2.107% | 3 month USD- | |
| | | | | | LIBOR-BBA | (91,714) |
|
| 1,940,000 | — | 4/20/22 | | 3 month USD- | | |
| | | | | LIBOR-BBA | 2.085% | 9,942 |
|
| 21,872,000 | — | 4/27/14 | | 3 month USD- | | |
| | | | | LIBOR-BBA | 0.568% | 7,969 |
|
49
| | | | | | |
| INTEREST RATE SWAP CONTRACTS OUTSTANDING at 4/30/12 (Unaudited) cont. | |
|
| | Upfront | | | Payments | Payments | Unrealized |
| Swap counterparty / | premium | Termination | | made by | received by | appreciation/ |
| Notional amount | received (paid) | date | | fund per annum | fund per annum | (depreciation) |
|
| JPMorgan Chase Bank, N.A. cont. | | | | | |
| $14,626,000 | $— | 4/27/17 | | 3 month USD- | | |
| | | | | LIBOR-BBA | 1.159% | $47,783 |
|
| 787,000 | — | 4/27/22 | | 2.11% | 3 month USD- | |
| | | | | | LIBOR-BBA | (5,440) |
|
| 515,000 | — | 4/27/42 | | 2.858% | 3 month USD- | |
| | | | | | LIBOR-BBA | (4,545) |
|
| 23,727,000 | 670,584 | 4/12/22 | | 2.4275% | 3 month USD- | |
| | | | | | LIBOR-BBA | (218,552) |
|
| Total | | | | | | $(6,915,640) |
| |
| E See Note 1 to the financial statements regarding extended effective dates. | | |
| |
| |
| TOTAL RETURN SWAP CONTRACTS OUTSTANDING at 4/30/12 (Unaudited) | | |
| |
| | Upfront | | | Fixed payments | Total return | Unrealized |
| Swap counterparty / | premium | Termination | | received (paid) by | received by | appreciation/ |
| Notional amount | received (paid) | date | | fund per annum | or paid by fund | (depreciation) |
|
| Bank of America N.A. | | | | | | |
| $14,460,716 | $(88,120) | 1/12/41 | | (4.50%) 1 month | Synthetic TRS | $41,228 |
| | | | | USD-LIBOR | Index 4.50% | |
| | | | | | 30 year Fannie Mae | |
| | | | | | pools | |
|
| 2,915,195 | — | 1/12/41 | | 4.00% (1 month | Synthetic TRS | (12,588) |
| | | | | USD-LIBOR) | Index 4.00% | |
| | | | | | 30 year Fannie Mae | |
| | | | | | pools | |
|
| 16,991,476 | — | 1/12/40 | | (5.00%) 1 month | Synthetic TRS | 32,543 |
| | | | | USD-LIBOR | Index 5.00% | |
| | | | | | 30 year Fannie Mae | |
| | | | | | pools | |
|
| Barclay’s Bank, PLC | | | | | | |
| 753,573 | — | 1/12/41 | | 5.00% (1 month | Synthetic MBX | 2,000 |
| | | | | USD-LIBOR) | Index 5.00% | |
| | | | | | 30 year Ginnie Mae II |
| | | | | | pools | |
|
| 1,271,594 | — | 1/12/40 | | 5.00% (1 month | Synthetic TRS | (2,435) |
| | | | | USD-LIBOR) | Index 5.00% | |
| | | | | | 30 year Fannie Mae | |
| | | | | | pools | |
|
| 14,813,959 | — | 1/12/36 | | (5.50% ) 1 month | Synthetic TRS | 17,476 |
| | | | | USD-LIBOR | Index 5.50% | |
| | | | | | 30 year Fannie Mae | |
| | | | | | pools | |
|
| 12,385,599 | — | 1/12/38 | | (6.50%) 1 month | Synthetic MBX | (77,480) |
| | | | | USD-LIBOR | Index 6.50% | |
| | | | | | 30 year Fannie Mae | |
| | | | | | pools | |
|
| 10,718,812 | — | 1/12/40 | | 4.50% (1 month | Synthetic MBX | 67,551 |
| | | | | USD-LIBOR) | Index 4.50% | |
| | | | | | 30 year Fannie Mae | |
| | | | | | pools | |
|
50
| | | | | | |
| TOTAL RETURN SWAP CONTRACTS OUTSTANDING at 4/30/12 (Unaudited) cont. | |
|
| | Upfront | | | Fixed payments | Total return | Unrealized |
| Swap counterparty / | premium | Termination | | received (paid) by | received by | appreciation/ |
| Notional amount | received (paid) | date | | fund per annum | or paid by fund | (depreciation) |
|
| Barclay’s Bank, PLC cont. | | | | | |
| $28,032,189 | $— | 1/12/38 | | (6.50%) 1 month | Synthetic MBX | $(175,360) |
| | | | | USD-LIBOR | Index 6.50% | |
| | | | | | 30 year Fannie Mae | |
| | | | | | pools | |
|
| 17,985,172 | — | 1/12/40 | | 5.00% (1 month | Synthetic MBX | 59,023 |
| | | | | USD-LIBOR) | Index 5.00% | |
| | | | | | 30 year Fannie Mae | |
| | | | | | pools | |
|
| 14,149,602 | — | 1/12/41 | | 5.00% (1 month | Synthetic MBX | 53,046 |
| | | | | USD-LIBOR) | Index 5.00% | |
| | | | | | 30 year Fannie Mae | |
| | | | | | pools | |
|
| 73,252,887 | — | 1/12/38 | | (6.50%) 1 month | Synthetic MBX | (458,246) |
| | | | | USD-LIBOR | Index 6.50% | |
| | | | | | 30 year Fannie Mae | |
| | | | | | pools | |
|
| 35,190,755 | — | 1/12/41 | | 5.00% (1 month | Synthetic MBX | 131,928 |
| | | | | USD-LIBOR) | Index 5.00% | |
| | | | | | 30 year Fannie Mae | |
| | | | | | pools | |
|
| 62,718,236 | — | 1/12/38 | | (6.50%) 1 month | Synthetic MBX | (392,344) |
| | | | | USD-LIBOR | Index 6.50% | |
| | | | | | 30 year Fannie Mae | |
| | | | | | pools | |
|
| 46,579,758 | — | 1/12/41 | | 5.00% (1 month | Synthetic MBX | 174,624 |
| | | | | USD-LIBOR) | Index 5.00% | |
| | | | | | 30 year Fannie Mae | |
| | | | | | pools | |
|
| 18,007,453 | — | 1/12/40 | | 4.00% (1 month | Synthetic MBX | 105,951 |
| | | | | USD-LIBOR) | Index 4.00% | |
| | | | | | 30 year Fannie Mae | |
| | | | | | pools | |
|
| 2,105,284 | — | 1/12/40 | | 4.00% (1 month | Synthetic TRS | (1,516) |
| | | | | USD-LIBOR) | Index 4.00% | |
| | | | | | 30 year Fannie Mae | |
| | | | | | pools | |
|
| 5,313,272 | — | 1/12/41 | | 4.50% (1 month | Synthetic MBX | 31,820 |
| | | | | USD-LIBOR) | Index 4.50% | |
| | | | | | 30 year Fannie Mae | |
| | | | | | pools | |
|
| 5,623,919 | — | 1/12/41 | | 5.00% (1 month | Synthetic MBX | 14,928 |
| | | | | USD-LIBOR) | Index 5.00% | |
| | | | | | 30 year Ginnie Mae II |
| | | | | | pools | |
|
| 25,249,384 | — | 1/12/41 | | 5.00% (1 month | Synthetic MBX | 94,658 |
| | | | | USD-LIBOR) | Index 5.00% | |
| | | | | | 30 year Fannie Mae | |
| | | | | | pools | |
|
51
| | | | | | |
| TOTAL RETURN SWAP CONTRACTS OUTSTANDING at 4/30/12 (Unaudited) cont. | |
| |
| | Upfront | | | Fixed payments | Total return | Unrealized |
| Swap counterparty / | premium | Termination | | received (paid) by | received by | appreciation/ |
| Notional amount | received (paid) | date | | fund per annum | or paid by fund | (depreciation) |
|
| Barclay’s Bank, PLC cont. | | | | | |
| $42,385,220 | $— | 1/12/40 | | 5.00% (1 month | Synthetic TRS | $(81,178) |
| | | | | USD-LIBOR) | Index 5.00% | |
| | | | | | 30 year Fannie Mae | |
| | | | | | pools | |
|
| 26,471,611 | — | 1/12/38 | | (6.50%) 1 month | Synthetic MBX | (165,598) |
| | | | | USD-LIBOR | Index 6.50% | |
| | | | | | 30 year Fannie Mae | |
| | | | | | pools | |
|
| 11,976,519 | — | 1/12/40 | | 4.50% (1 month | Synthetic MBX | 75,477 |
| | | | | USD-LIBOR) | Index 4.50% | |
| | | | | | 30 year Fannie Mae | |
| | | | | | pools | |
|
| 40,358,462 | — | 1/12/41 | | 5.00% (1 month | Synthetic MBX | 151,301 |
| | | | | USD-LIBOR) | Index 5.00% | |
| | | | | | 30 year Fannie Mae | |
| | | | | | pools | |
|
| 6,743,116 | — | 1/12/41 | | 5.00% (1 month | Synthetic MBX | 25,279 |
| | | | | USD-LIBOR) | Index 5.00% | |
| | | | | | 30 year Fannie Mae | |
| | | | | | pools | |
|
| 1,336,557 | — | 1/12/40 | | 5.00% (1 month | Synthetic MBX | 4,386 |
| | | | | USD-LIBOR) | Index 5.00% | |
| | | | | | 30 year Fannie Mae | |
| | | | | | pools | |
|
| 4,334,487 | — | 1/12/40 | | 5.00% (1 month | Synthetic MBX | 14,225 |
| | | | | USD-LIBOR) | Index 5.00% | |
| | | | | | 30 year Fannie Mae | |
| | | | | | pools | |
|
| 3,142,292 | — | 1/12/40 | | 5.00% (1 month | Synthetic MBX | 10,312 |
| | | | | USD-LIBOR) | Index 5.00% | |
| | | | | | 30 year Fannie Mae | |
| | | | | | pools | |
|
| Citibank, N.A. | | | | | | |
| 14,899,432 | — | 1/12/41 | | 5.00% (1 month | Synthetic MBX | 55,857 |
| | | | | USD-LIBOR) | Index 5.00% | |
| | | | | | 30 year Fannie Mae | |
| | | | | | pools | |
|
| 20,038,829 | — | 1/12/41 | | 5.00% (1 month | Synthetic MBX | 75,124 |
| | | | | USD-LIBOR) | Index 5.00% | |
| | | | | | 30 year Fannie Mae | |
| | | | | | pools | |
|
| Credit Suisse International | | | | | |
| 3,572,665 | — | 1/12/41 | | 4.50% (1 month | Synthetic MBX | 21,396 |
| | | | | USD-LIBOR) | Index 4.50% | |
| | | | | | 30 year Fannie Mae | |
| | | | | | pools | |
|
| 36,152,192 | — | 1/12/41 | | 4.50% (1 month | Synthetic MBX | 120,396 |
| | | | | USD-LIBOR) | Index 4.50% | |
| | | | | | 30 year Ginnie Mae II |
| | | | | | pools | |
|
52
| | | | | | |
| TOTAL RETURN SWAP CONTRACTS OUTSTANDING at 4/30/12 (Unaudited) cont. | |
| |
| | Upfront | | | Fixed payments | Total return | Unrealized |
| Swap counterparty / | premium | Termination | | received (paid) by | received by | appreciation/ |
| Notional amount | received (paid) | date | | fund per annum | or paid by fund | (depreciation) |
|
| Credit Suisse International cont. | | | | | |
| $13,091,937 | $— | 1/12/39 | | (5.00%) 1 month | Synthetic TRS | $33,171 |
| | | | | USD-LIBOR | Index 5.00% | |
| | | | | | 30 year Fannie Mae | |
| | | | | | pools | |
|
| 2,914,378 | — | 1/12/41 | | 4.00% (1 month | Synthetic TRS | (12,584) |
| | | | | USD-LIBOR) | Index 4.00% | |
| | | | | | 30 year Fannie Mae | |
| | | | | | pools | |
|
| 13,951,441 | — | 1/12/40 | | (5.00%) 1 month | Synthetic TRS | 26,720 |
| | | | | USD-LIBOR | Index 5.00% 30 | |
| | | | | | 30 year Fannie Mae | |
| | | | | | pools | |
|
| 8,885,937 | 31,934 | 1/12/41 | | (4.50%) 1 month | Synthetic MBX | (15,000) |
| | | | | USD-LIBOR | Index 4.50% 30 | |
| | | | | | 30 year Fannie Mae | |
| | | | | | pools | |
|
| Goldman Sachs International | | | | | |
| 28,485,335 | — | 1/12/41 | | 4.50% (1 month | Synthetic TRS | (208,955) |
| | | | | USD-LIBOR) | Index 4.50% | |
| | | | | | 30 year Fannie Mae | |
| | | | | | pools | |
|
| 7,244,684 | 47,543 | 1/12/41 | | 4.00% (1 month | Synthetic TRS | 9,891 |
| | | | | USD-LIBOR) | Index 4.00% | |
| | | | | | 30 year Fannie Mae | |
| | | | | | pools | |
|
| 4,352,053 | 2,720 | 1/12/38 | | 6.50% (1 month | Synthetic TRS | 9,643 |
| | | | | USD-LIBOR) | Index 6.50% | |
| | | | | | 30 year Fannie Mae | |
| | | | | | pools | |
|
| 15,252,714 | (11,916) | 1/12/38 | | 6.50% (1 month | Synthetic TRS | 6,876 |
| | | | | USD-LIBOR) | Index 6.50% | |
| | | | | | 30 year Fannie Mae | |
| | | | | | pools | |
|
| 11,766,294 | (25,739) | 1/12/38 | | 6.50% (1 month | Synthetic TRS | (11,242) |
| | | | | USD-LIBOR) | Index 6.50% | |
| | | | | | 30 year Fannie Mae | |
| | | | | | pools | |
|
| 19,280,450 | (132,553) | 1/12/41 | | (4.50%) 1 month | Synthetic TRS | 39,906 |
| | | | | USD-LIBOR | Index 4.50% | |
| | | | | | 30 year Fannie Mae | |
| | | | | | pools | |
|
| 11,701,189 | — | 1/12/40 | | 5.00% (1 month | Synthetic TRS | (22,411) |
| | | | | USD-LIBOR) | Index 5.00% | |
| | | | | | 30 year Fannie Mae | |
| | | | | | pools | |
|
| 21,832,174 | — | 1/12/38 | | (6.50%) 1 month | Synthetic MBX | (136,575) |
| | | | | USD-LIBOR | Index 6.50% | |
| | | | | | 30 year Fannie Mae | |
| | | | | | pools | |
|
53
| | | | | | |
| TOTAL RETURN SWAP CONTRACTS OUTSTANDING at 4/30/12 (Unaudited) cont. | |
| |
| | Upfront | | | Fixed payments | Total return | Unrealized |
| Swap counterparty / | premium | Termination | | received (paid) by | received by | appreciation/ |
| Notional amount | received (paid) | date | | fund per annum | or paid by fund | (depreciation) |
|
| Goldman Sachs International cont. | | | | | |
| $8,201,746 | $— | 1/12/38 | | (6.50%) 1 month | Synthetic MBX | $(51,307) |
| | | | | USD-LIBOR | Index 6.50% | |
| | | | | | 30 year Fannie Mae | |
| | | | | | pools | |
|
| 3,500,793 | — | 1/12/40 | | 5.00% (1 month | Synthetic TRS | (6,705) |
| | | | | USD-LIBOR) | Index 5.00% | |
| | | | | | 30 year Fannie Mae | |
| | | | | | pools | |
|
| 14,813,959 | — | 1/12/36 | | 5.50% (1 month | Synthetic TRS | (17,476) |
| | | | | USD-LIBOR) | Index 5.50% | |
| | | | | | 30 year Fannie Mae | |
| | | | | | pools | |
|
| 7,507,358 | — | 1/12/41 | | 4.50% (1 month | Synthetic TRS | (55,071) |
| | | | | USD-LIBOR) | Index 4.50% | |
| | | | | | 30 year Fannie Mae | |
| | | | | | pools | |
|
| 5,700,481 | — | 1/12/41 | | 4.00% (1 month | Synthetic TRS | (24,614) |
| | | | | USD-LIBOR) | Index 4.00% | |
| | | | | | 30 year Fannie Mae | |
| | | | | | pools | |
|
| 29,907,770 | — | 1/12/38 | | (6.50%) 1 month | Synthetic MBX | (187,078) |
| | | | | USD-LIBOR | Index 6.50% | |
| | | | | | 30 year Fannie Mae | |
| | | | | | pools | |
|
| 1,918,218 | — | 1/12/40 | | (5.00%) 1 month | Synthetic TRS | 3,674 |
| | | | | USD-LIBOR | Index 5.00% | |
| | | | | | 30 year Fannie Mae | |
| | | | | | pools | |
|
| 1,108,976 | — | 1/12/38 | | (6.50%) 1 month | Synthetic MBX | (6,937) |
| | | | | USD-LIBOR | Index 6.50% | |
| | | | | | 30 year Fannie Mae | |
| | | | | | pools | |
|
| 2,956,938 | — | 1/12/38 | | (6.50%) 1 month | Synthetic MBX | (18,498) |
| | | | | USD-LIBOR | Index 6.50% | |
| | | | | | 30 year Fannie Mae | |
| | | | | | pools | |
|
| 20,831,521 | — | 1/12/40 | | (5.00%) 1 month | Synthetic TRS | 39,897 |
| | | | | USD-LIBOR | Index 5.00% | |
| | | | | | 30 year Fannie Mae | |
| | | | | | pools | |
|
| 2,508,570 | — | 1/12/38 | | 6.50% (1 month | Synthetic TRS | 8,938 |
| | | | | USD-LIBOR) | Index 6.50% | |
| | | | | | 30 year Fannie Mae | |
| | | | | | pools | |
|
| 5,166,141 | (1,614) | 1/12/40 | | (5.00%) 1 month | Synthetic TRS | 8,162 |
| | | | | USD-LIBOR | Index 5.00% | |
| | | | | | 30 year Fannie Mae | |
| | | | | | pools | |
|
| 16,715,756 | (49,625) | 1/12/38 | | 6.50% (1 month | Synthetic TRS | 10,336 |
| | | | | USD-LIBOR) | Index 6.50% | |
| | | | | | 30 year Fannie Mae | |
| | | | | | pools | |
|
| Total | | | | | | $(563,455) |

ASC 820 establishes a three-level hierarchy for disclosure of fair value measurements. The valuation hierarchy is based upon the transparency of inputs to the valuation of the fund’s investments. The three levels are defined as follows:
Level 1: Valuations based on quoted prices for identical securities in active markets.
Level 2: Valuations based on quoted prices in markets that are not active or for which all significant inputs are observable, either directly or indirectly.
Level 3: Valuations based on inputs that are unobservable and significant to the fair value measurement.
The following is a summary of the inputs used to value the fund’s net assets as of the close of the reporting period:
| | | |
| | | Valuation inputs | |
|
| Investments in securities: | Level 1 | Level 2 | Level 3 |
|
| Asset-backed securities | $— | $57,247,609 | $— |
|
| Corporate bonds and notes | — | 381,830,324 | — |
|
| Foreign government bonds and notes | — | 1,534,216 | — |
|
| Mortgage-backed securities | — | 413,520,319 | — |
|
| Municipal bonds and notes | — | 4,545,675 | — |
|
| Purchased options outstanding | — | 103,698,468 | — |
|
| Senior loans | — | 472,568 | — |
|
| U.S. Government Agency Mortgage Obligations | — | 515,359,642 | — |
|
| U.S. Treasury Obligations | — | 448,305 | — |
|
| Short-term investments | 177,667,569 | 343,769,356 | — |
|
| Totals by level | $177,667,569 | $1,822,426,482 | $— |
| | | | |
| | | Valuation inputs | |
|
| Other financial instruments: | Level 1 | Level 2 | Level 3 |
|
| Futures contracts | $3,097,741 | $— | $— |
|
| Written options | — | (89,350,812) | — |
|
| TBA sale commitments | — | (149,825,390) | — |
|
| Interest rate swap contracts | — | (10,032,779) | — |
|
| Total return swap contracts | — | (336,085) | — |
|
| Totals by level | $3,097,741 | $(249,545,066) | $— |
At the start and/or close of the reporting period, Level 3 investments in securities were not considered a significant portion of the fund’s portfolio.
The accompanying notes are an integral part of these financial statements.
55
Statement of assets and liabilities 4/30/12 (Unaudited)
| |
| ASSETS | |
|
| Investment in securities, at value (Note 1): | |
| Unaffiliated issuers (identified cost $1,780,573,480) | $1,851,196,482 |
| Affiliated issuers (identified cost $148,897,569) (Notes 1 and 6) | 148,897,569 |
|
| Cash | 9,930,803 |
|
| Interest and other receivables | 9,459,197 |
|
| Receivable for shares of the fund sold | 2,460,167 |
|
| Receivable for investments sold | 5,786,639 |
|
| Receivable for sales of delayed delivery securities (Note 1) | 149,429,156 |
|
| Unrealized appreciation on swap contracts (Note 1) | 2,345,605 |
|
| Receivable for variation margin (Note 1) | 297,250 |
|
| Premium paid on swap contracts (Note 1) | 1,361,609 |
|
| Total assets | 2,181,164,477 |
| |
| LIABILITIES | |
|
| Payable for investments purchased | 2,760,860 |
|
| Payable for purchases of delayed delivery securities (Note 1) | 511,062,606 |
|
| Payable for shares of the fund repurchased | 9,522,060 |
|
| Payable for compensation of Manager (Note 2) | 454,124 |
|
| Payable for investor servicing fees (Note 2) | 172,685 |
|
| Payable for custodian fees (Note 2) | 34,451 |
|
| Payable for Trustee compensation and expenses (Note 2) | 307,797 |
|
| Payable for administrative services (Note 2) | 15,620 |
|
| Payable for distribution fees (Note 2) | 409,821 |
|
| Written options outstanding, at value (premiums received $70,038,539) (Notes 1 and 3) | 89,350,812 |
|
| Premium received on swap contracts (Note 1) | 4,251,378 |
|
| Unrealized depreciation on swap contracts (Note 1) | 9,824,700 |
|
| TBA sale commitments, at value (proceeds receivable $149,243,906) (Note 1) | 149,825,390 |
|
| Collateral on certain derivative contracts, at value (Note 1) | 28,770,000 |
|
| Other accrued expenses | 236,052 |
|
| Total liabilities | 806,998,356 |
| | |
| Net assets | $1,374,166,121 |
|
| |
| REPRESENTED BY | |
|
| Paid-in capital (Unlimited shares authorized) (Notes 1 and 4) | $1,538,709,449 |
|
| Undistributed net investment income (Note 1) | 2,552,361 |
|
| Accumulated net realized loss on investments (Note 1) | (213,443,580) |
|
| Net unrealized appreciation of investments | 46,347,891 |
|
| Total — Representing net assets applicable to capital shares outstanding | $1,374,166,121 |
(Continued on next page)
56
Statement of assets and liabilities (Continued)
| |
| COMPUTATION OF NET ASSET VALUE AND OFFERING PRICE | |
|
| Net asset value and redemption price per class A share | |
| ($848,622,106 divided by 123,074,774 shares) | $6.90 |
|
| Offering price per class A share (100/96.00 of $6.90)* | $7.19 |
|
| Net asset value and offering price per class B share ($39,610,612 divided by 5,795,459 shares)** | $6.83 |
|
| Net asset value and offering price per class C share ($165,068,078 divided by 24,093,957 shares)** | $6.85 |
|
| Net asset value and redemption price per class M share | |
| ($157,411,835 divided by 23,285,748 shares) | $6.76 |
|
| Offering price per class M share (100/96.75 of $6.76)† | $6.99 |
|
| Net asset value, offering price and redemption price per class R share | |
| ($4,961,689 divided by 723,254 shares) | $6.86 |
|
| Net asset value, offering price and redemption price per class Y share | |
| ($158,491,801 divided by 22,716,905 shares) | $6.98 |
|
* On single retail sales of less than $100,000. On sales of $100,000 or more the offering price is reduced.
** Redemption price per share is equal to net asset value less any applicable contingent deferred sales charge.
† On single retail sales of less than $50,000. On sales of $50,000 or more the offering price is reduced.
The accompanying notes are an integral part of these financial statements.
57
Statement of operations Six months ended 4/30/12 (Unaudited)
| |
| INVESTMENT INCOME | |
|
| Interest (net of foreign tax of $23,808) (including interest income of $99,281 | |
| from investments in affiliated issuers) (Note 6) | $26,645,457 |
|
| Total investment income | 26,645,457 |
| |
| EXPENSES | |
|
| Compensation of Manager (Note 2) | 2,740,277 |
|
| Investor servicing fees (Note 2) | 1,040,777 |
|
| Custodian fees (Note 2) | 39,506 |
|
| Trustee compensation and expenses (Note 2) | 62,504 |
|
| Administrative services (Note 2) | 25,939 |
|
| Distribution fees — Class A (Note 2) | 1,047,606 |
|
| Distribution fees — Class B (Note 2) | 199,027 |
|
| Distribution fees — Class C (Note 2) | 833,987 |
|
| Distribution fees — Class M (Note 2) | 404,405 |
|
| Distribution fees — Class R (Note 2) | 12,228 |
|
| Other | 285,729 |
|
| Total expenses | 6,691,985 |
| Expense reduction (Note 2) | (997) |
|
| Net expenses | 6,690,988 |
| | |
| Net investment income | 19,954,469 |
|
| |
| Net realized loss on investments (Notes 1 and 3) | (18,575,060) |
|
| Net realized loss on swap contracts (Note 1) | (29,794,340) |
|
| Net realized gain on futures contracts (Note 1) | 8,040,769 |
|
| Net realized gain on written options (Notes 1 and 3) | 6,104,159 |
|
| Net unrealized appreciation of investments, futures contracts, swap contracts, written options, | |
| and TBA sale commitments during the period | 47,819,978 |
|
| Net gain on investments | 13,595,506 |
| | |
| Net increase in net assets resulting from operations | $33,549,975 |
|
The accompanying notes are an integral part of these financial statements.
58
Statement of changes in net assets
| | |
| INCREASE/DECREASE IN NET ASSETS | Six months ended 4/30/12* | Year ended 10/31/11 |
|
| Operations: | | |
| Net investment income | $19,954,469 | $53,058,709 |
|
| Net realized gain (loss) on investments | (34,224,472) | 13,122,104 |
|
| Net unrealized appreciation (depreciation) of investments | 47,819,978 | (4,199,417) |
|
| Net increase in net assets resulting from operations | 33,549,975 | 61,981,396 |
|
| Distributions to shareholders (Note 1): | | |
| From ordinary income | | |
| Net investment income | | |
|
| Class A | (14,314,702) | (42,249,610) |
|
| Class B | (543,013) | (1,773,181) |
|
| Class C | (2,274,124) | (7,304,305) |
|
| Class M | (2,670,292) | (10,221,649) |
|
| Class R | (79,045) | (209,934) |
|
| Class Y | (2,538,516) | (6,319,275) |
|
| Increase in capital from settlement payments (Note 9) | — | 433,895 |
|
| Increase (decrease) from capital share transactions (Note 4) | 2,845,899 | (72,913,778) |
|
| Total increase (decrease) in net assets | 13,976,182 | (78,576,441) |
| |
| NET ASSETS | | |
|
| Beginning of period | 1,360,189,939 | 1,438,766,380 |
|
| End of period (including undistributed net investment | | |
| income of $2,552,361 and $5,017,584, respectively) | $1,374,166,121 | $1,360,189,939 |
|
* Unaudited
The accompanying notes are an integral part of these financial statements.
59
Financial highlights (For a common share outstanding throughout the period)
| | | | | | | | | | | | | | | |
| INVESTMENT OPERATIONS: | | LESS DISTRIBUTIONS: | RATIOS AND SUPPLEMENTAL DATA: | |
|
| | | | | | | | | | | | | | Ratio | | |
| | | | | | | | | | | | | | of expenses | | |
| | | | | | | | | | | | | | to average | Ratio | |
| | Net asset | | Net realized | | | | | | | | | Ratio | net assets, | of net investment | |
| | value, | | and unrealized | Total from | From | | | Non-recurring | | Total return | Net assets, | of expenses | excluding | income (loss) | |
| | beginning | Net investment | gain (loss) | investment | net investment | Total | Redemption | reimburse- | Net asset value, | at net asset | end of period | to average | interest expense | to average | Portfolio |
| Period ended | of period | income (loss) a | on investments | operations | income | distributions | fees | ments | end of period | value (%) b | (in thousands) | net assets (%) c | (%) c | net assets (%) | turnover (%) d |
|
| Class A | | | | | | | | | | | | | | | |
| April 30, 2012** | $6.84 | .10 | .08 | .18 | (.12) | (.12) | — | — | $6.90 | 2.61* | $848,622 | .43* | .43* | 1.53* | 79* |
| October 31, 2011 | 6.86 | .28 | .05 | .33 | (.35) | (.35) | — | — e,f | 6.84 | 4.95 | 843,019 | .86 | .86 | 4.02 | 339 |
| October 31, 2010 | 6.61 | .43 | .31 | .74 | (.49) | (.49) | — f | — f,g | 6.86 | 11.45 | 855,659 | .88 h,i | .88 h,i | 6.38 h | 112 |
| October 31, 2009 | 5.35 | .29 | 1.44 | 1.73 | (.47) | (.47) | — f | — | 6.61 | 34.44 | 667,144 | 1.68 h,j | .96 h | 5.12 h | 331 |
| October 31, 2008 | 6.77 | .38 | (1.34) | (.96) | (.46) | (.46) | — f | — | 5.35 | (15.13) | 537,220 | .99 h | .99 h | 5.91 h | 200 |
| October 31, 2007 | 6.74 | .31 | .04 | .35 | (.32) | (.32) | — f | — | 6.77 | 5.35 | 768,016 | .98 h | .98 h | 4.67 h | 323 |
|
| Class B | | | | | | | | | | | | | | | |
| April 30, 2012** | $6.78 | .08 | .06 | .14 | (.09) | (.09) | — | — | $6.83 | 2.12* | $39,611 | .81* | .81* | 1.15* | 79* |
| October 31, 2011 | 6.80 | .22 | .06 | .28 | (.30) | (.30) | — | — e,f | 6.78 | 4.22 | 39,859 | 1.61 | 1.61 | 3.29 | 339 |
| October 31, 2010 | 6.56 | .39 | .28 | .67 | (.43) | (.43) | — f | — f,g | 6.80 | 10.54 | 43,205 | 1.63 h,i | 1.63 h,i | 5.82 h | 112 |
| October 31, 2009 | 5.32 | .24 | 1.43 | 1.67 | (.43) | (.43) | — f | — | 6.56 | 33.21 | 45,772 | 2.43 h,j | 1.71 h | 4.31 h | 331 |
| October 31, 2008 | 6.72 | .34 | (1.33) | (.99) | (.41) | (.41) | — f | — | 5.32 | (15.58) | 57,171 | 1.74 h | 1.74 h | 5.22 h | 200 |
| October 31, 2007 | 6.70 | .26 | .03 | .29 | (.27) | (.27) | — f | — | 6.72 | 4.43 | 110,495 | 1.73 h | 1.73 h | 3.96 h | 323 |
|
| Class C | | | | | | | | | | | | | | | |
| April 30, 2012** | $6.80 | .08 | .06 | .14 | (.09) | (.09) | — | — | $6.85 | 2.12* | $165,068 | .81* | .81* | 1.15* | 79* |
| October 31, 2011 | 6.82 | .22 | .06 | .28 | (.30) | (.30) | — | — e,f | 6.80 | 4.21 | 169,692 | 1.61 | 1.61 | 3.27 | 339 |
| October 31, 2010 | 6.58 | .35 | .33 | .68 | (.44) | (.44) | — f | — f,g | 6.82 | 10.57 | 167,237 | 1.63 h,i | 1.63 h,i | 5.08 h | 112 |
| October 31, 2009 | 5.33 | .26 | 1.42 | 1.68 | (.43) | (.43) | — f | — | 6.58 | 33.40 | 43,310 | 2.43 h,j | 1.71 h | 4.45 h | 331 |
| October 31, 2008 | 6.74 | .33 | (1.33) | (1.00) | (.41) | (.41) | — f | — | 5.33 | (15.67) | 16,414 | 1.74 h | 1.74 h | 5.16 h | 200 |
| October 31, 2007 | 6.72 | .26 | .03 | .29 | (.27) | (.27) | — f | — | 6.74 | 4.41 | 20,396 | 1.73 h | 1.73 h | 3.93 h | 323 |
|
| Class M | | | | | | | | | | | | | | | |
| April 30, 2012** | $6.71 | .09 | .07 | .16 | (.11) | (.11) | — | — | $6.76 | 2.42* | $157,412 | .56* | .56* | 1.40* | 79* |
| October 31, 2011 | 6.74 | .26 | .05 | .31 | (.34) | (.34) | — | — e,f | 6.71 | 4.66 | 170,347 | 1.11 | 1.11 | 3.82 | 339 |
| October 31, 2010 | 6.50 | .42 | .29 | .71 | (.47) | (.47) | — f | — f,g | 6.74 | 11.28 | 222,916 | 1.13 h,i | 1.13 h,i | 6.23 h | 112 |
| October 31, 2009 | 5.28 | .27 | 1.41 | 1.68 | (.46) | (.46) | — f | — | 6.50 | 33.82 | 194,199 | 1.93 h,j | 1.21 h | 4.83 h | 331 |
| October 31, 2008 | 6.68 | .36 | (1.31) | (.95) | (.45) | (.45) | — f | — | 5.28 | (15.19) | 167,743 | 1.24 h | 1.24 h | 5.67 h | 200 |
| October 31, 2007 | 6.67 | .30 | .02 | .32 | (.31) | (.31) | — f | — | 6.68 | 4.86 | 253,457 | 1.23 h | 1.23 h | 4.45 h | 323 |
|
| Class R | | | | | | | | | | | | | | | |
| April 30, 2012** | $6.81 | .10 | .06 | .16 | (.11) | (.11) | — | — | $6.86 | 2.37* | $4,962 | .56* | .56* | 1.40* | 79* |
| October 31, 2011 | 6.83 | .25 | .07 | .32 | (.34) | (.34) | — | — e,f | 6.81 | 4.74 | 4,723 | 1.11 | 1.11 | 3.74 | 339 |
| October 31, 2010 | 6.59 | .40 | .31 | .71 | (.47) | (.47) | — f | — f,g | 6.83 | 11.10 | 4,068 | 1.13 h,i | 1.13 h,i | 5.91 h | 112 |
| October 31, 2009 | 5.34 | .27 | 1.44 | 1.71 | (.46) | (.46) | — f | — | 6.59 | 34.02 | 2,353 | 1.93 h,j | 1.21 h | 4.85 h | 331 |
| October 31, 2008 | 6.76 | .36 | (1.33) | (.97) | (.45) | (.45) | — f | — | 5.34 | (15.30) | 1,448 | 1.24 h | 1.24 h | 5.54 h | 200 |
| October 31, 2007 | 6.74 | .30 | .03 | .33 | (.31) | (.31) | — f | — | 6.76 | 4.98 | 1,062 | 1.23 h | 1.23 h | 4.38 h | 323 |
|
| Class Y | | | | | | | | | | | | | | | |
| April 30, 2012** | $6.91 | .11 | .08 | .19 | (.12) | (.12) | — | — | $6.98 | 2.82* | $158,492 | .31* | .31* | 1.65* | 79* |
| October 31, 2011 | 6.93 | .29 | .06 | .35 | (.37) | (.37) | — | — e,f | 6.91 | 5.12 | 132,550 | .61 | .61 | 4.25 | 339 |
| October 31, 2010 | 6.67 | .46 | .30 | .76 | (.50) | (.50) | — f | — f,g | 6.93 | 11.73 | 145,681 | .63 h,i | .63 h,i | 6.74 h | 112 |
| October 31, 2009 | 5.40 | .32 | 1.43 | 1.75 | (.48) | (.48) | — f | — | 6.67 | 34.59 | 227,134 | 1.43 h,j | .71 h | 5.87 h | 331 |
| October 31, 2008 | 6.82 | .40 | (1.35) | (.95) | (.47) | (.47) | — f | — | 5.40 | (14.85) | 790,264 | .74 h | .74 h | 6.14 h | 200 |
| October 31, 2007 | 6.79 | .33 | .04 | .37 | (.34) | (.34) | — f | — | 6.82 | 5.54 | 1,126,527 | .73 h | .73 h | 4.93 h | 323 |
|
See notes to financial highlights at the end of this section.
The accompanying notes are an integral part of these financial statements.
Financial highlights (Continued)
* Not annualized.
** Unaudited.
a Per share net investment income has been determined on the basis of the weighted average number of shares outstanding during the period.
b Total return assumes dividend reinvestment and does not reflect the effect of sales charges.
c Includes amounts paid through expense offset arrangements (Note 2).
d Portfolio turnover excludes dollar roll transactions.
e Reflects a non-recurring reimbursement related to restitution amounts in connection with a distribution plan approved by the Securities and Exchange Commission (the SEC) which amounted to less than $0.01 per share outstanding on July 21, 2011. Also reflects a non-recurring reimbursement related to short-term trading related lawsuits, which amounted to less than $0.01 per share outstanding on May 11, 2011 (Note 9).
f Amount represents less than $0.01 per share.
g Reflects a non-recurring reimbursement pursuant to a settlement between the SEC and Prudential Securities, Inc., which amounted to less than $0.01 per share outstanding as of March 30, 2010.
h Reflects an involuntary contractual expense limitation in effect during the period. For periods prior to October 31, 2009, certain fund expenses were waived in connection with the fund’s investment in Putnam Prime Money Market Fund. As a result of such limitation and/or waivers, the expenses of each class reflect a reduction of the following amounts:
| |
| | Percentage of |
| | average net assets |
|
| October 31, 2010 | 0.03% |
|
| October 31, 2009 | 0.19 |
|
| October 31, 2008 | 0.09 |
|
| October 31, 2007 | 0.08 |
|
i Excludes the impact of a current period reduction to interest expense related to the resolution of certain terminated derivatives contracts, which amounted to 0.18% of average net assets for the period ended October 31, 2010.
j Includes interest accrued in connection with certain terminated derivatives contracts, which amounted to 0.72% of average net assets for the period ended October 31, 2009.
The accompanying notes are an integral part of these financial statements.
62
Notes to financial statements 4/30/12 (Unaudited)
Within the following Notes to financial statements, references to “State Street” represent State Street Bank and Trust Company, references to “the SEC” represent the Securities and Exchange Commission and references to “Putnam Management” represent Putnam Investment Management, LLC, the fund’s manager, an indirect wholly-owned subsidiary of Putnam Investments, LLC. Unless otherwise noted, the “reporting period” represents the period from November 1, 2011 through April 30, 2012.
Putnam Income Fund (the fund) is a Massachusetts business trust, which is registered under the Investment Company Act of 1940, as amended, as a diversified open-end management investment company. The fund seeks high current income consistent with what Putnam Management believes to be prudent risk. The fund invests mainly in bonds that are securitized debt instruments (such as mortgage-backed investments) and other obligations of companies and governments worldwide denominated in U.S. dollars, are either investment-grade or below investment-grade (sometimes referred to as “junk bonds”) and have intermediate- to long-term maturities (three years or longer). The fund may consider, among other factors, credit, interest rate and prepayment risks, as well as general market conditions, when deciding whether to buy or sell investments. The fund may also use derivatives, such as futures, options and swap contracts, for both hedging and non-hedging purposes.
The fund offers class A, class B, class C, class M, class R and class Y shares. Class A and class M shares are sold with a maximum front-end sales charge of 4.00% and 3.25%, respectively, and generally do not pay a contingent deferred sales charge. Class B shares, which convert to class A shares after approximately eight years, do not pay a front-end sales charge and are subject to a contingent deferred sales charge if those shares are redeemed within six years of purchase. Class C shares have a one-year 1.00% contingent deferred sales charge and do not convert to class A shares. Class R shares, which are not available to all investors, are sold at net asset value. The expenses for class A, class B, class C, class M and class R shares may differ based on the distribution fee of each class, which is identified in Note 2. Class Y shares, which are sold at net asset value, are generally subject to the same expenses as class A, class B, class C, class M and class R shares, but do not bear a distribution fee. Class Y shares are not available to all investors.
In the normal course of business, the fund enters into contracts that may include agreements to indemnify another party under given circumstances. The fund’s maximum exposure under these arrangements is unknown as this would involve future claims that may be, but have not yet been, made against the fund. However, the fund’s management team expects the risk of material loss to be remote.
Note 1: Significant accounting policies
The following is a summary of significant accounting policies consistently followed by the fund in the preparation of its financial statements. The preparation of financial statements is in conformity with accounting principles generally accepted in the United States of America and requires management to make estimates and assumptions that affect the reported amounts of assets and liabilities in the financial statements and the reported amounts of increases and decreases in net assets from operations. Actual results could differ from those estimates. Subsequent events after the Statement of assets and liabilities date through the date that the financial statements were issued have been evaluated in the preparation of the financial statements.
Investment income, realized and unrealized gains and losses and expenses of the fund are borne pro-rata based on the relative net assets of each class to the total net assets of the fund, except that each class bears expenses unique to that class (including the distribution fees applicable to such classes). Each class votes as a class only with respect to its own distribution plan or other matters on which a class vote is required by law or determined by the Trustees. If the fund were liquidated, shares of each class would receive their pro-rata share of the net assets of the fund. In addition, the Trustees declare separate dividends on each class of shares.
Security valuation Market quotations are not considered to be readily available for certain debt obligations and other investments; such investments are valued on the basis of valuations furnished by an independent pricing service approved by the Trustees or dealers selected by Putnam Management. Such services or dealers determine valuations for normal institutional-size trading units of such securities using methods based on market transactions for comparable securities and various relationships, generally recognized by institutional traders, between securities (which considers such factors as security prices, yields, maturities and ratings). These securities will generally be categorized as Level 2. Securities quoted in foreign currencies, if any, are translated into U.S. dollars at the current exchange rate.
63
Investments in other open-end investment companies (excluding exchange traded funds), which are classified as Level 1 securities, are based on their net asset value. The net asset value of an investment company equals the total value of its assets less its liabilities and divided by the number of its outstanding shares. Shares are only valued as of the close of regular trading on the New York Stock Exchange each day that the exchange is open.
To the extent a pricing service or dealer is unable to value a security or provides a valuation that Putnam Management does not believe accurately reflects the security’s fair value, the security will be valued at fair value by Putnam Management. Certain investments, including certain restricted and illiquid securities and derivatives, are also valued at fair value following procedures approved by the Trustees. These valuations consider such factors as significant market or specific security events such as interest rate or credit quality changes, various relationships with other securities, discount rates, U.S. Treasury, U.S. swap and credit yields, index levels, convexity exposures and recovery rates. These securities are classified as Level 2 or as Level 3 depending on the priority of the significant inputs.
Such valuations and procedures are reviewed periodically by the Trustees. Certain securities may be valued on the basis of a price provided by a single source. The fair value of securities is generally determined as the amount that the fund could reasonably expect to realize from an orderly disposition of such securities over a reasonable period of time. By its nature, a fair value price is a good faith estimate of the value of a security in a current sale and does not reflect an actual market price, which may be different by a material amount.
Security transactions and related investment income Security transactions are recorded on the trade date (the date the order to buy or sell is executed). Gains or losses on securities sold are determined on the identified cost basis.
Interest income is recorded on the accrual basis. All premiums/discounts are amortized/accreted on a yield-to-maturity basis.
Securities purchased or sold on a forward commitment or delayed delivery basis may be settled a month or more after the trade date; interest income is accrued based on the terms of the securities. Losses may arise due to changes in the market value of the underlying securities or if the counterparty does not perform under the contract.
The fund earned certain fees in connection with its senior loan purchasing activities. These fees are treated as market discount and are amortized into income in the Statement of operations.
Stripped securities The fund may invest in stripped securities which represent a participation in securities that may be structured in classes with rights to receive different portions of the interest and principal. Interest-only securities receive all of the interest and principal-only securities receive all of the principal. If the interest-only securities experience greater than anticipated prepayments of principal, the fund may fail to recoup fully its initial investment in these securities. Conversely, principal-only securities increase in value if prepayments are greater than anticipated and decline if prepayments are slower than anticipated. The market value of these securities is highly sensitive to changes in interest rates.
Options contracts The fund uses options contracts to hedge duration and convexity, to isolate prepayment risk, to gain exposure to interest rates and to hedge against changes in values of securities it owns, owned or expects to own.
The potential risk to the fund is that the change in value of options contracts may not correspond to the change in value of the hedged instruments. In addition, losses may arise from changes in the value of the underlying instruments if there is an illiquid secondary market for the contracts, if interest or exchange rates move unexpectedly or if the counterparty to the contract is unable to perform. Realized gains and losses on purchased options are included in realized gains and losses on investment securities. If a written call option is exercised, the premium originally received is recorded as an addition to sales proceeds. If a written put option is exercised, the premium originally received is recorded as a reduction to the cost of investments.
Exchange traded options are valued at the last sale price or, if no sales are reported, the last bid price for purchased options and the last ask price for written options. Options traded over-the-counter are valued using prices supplied by dealers.
Written option contracts outstanding at period end, if any, are listed after the fund’s portfolio. See Note 3 for the volume of written options contracts activity for the reporting period. Outstanding contracts on purchased options contracts at the close of the reporting period are indicative of the volume of activity during the reporting period.
Futures contracts The fund uses futures contracts to manage exposure to market risk, to hedge interest rate risk and to gain exposure to interest rates.
64
The potential risk to the fund is that the change in value of futures contracts may not correspond to the change in value of the hedged instruments. In addition, losses may arise from changes in the value of the underlying instruments if there is an illiquid secondary market for the contracts, if interest or exchange rates move unexpectedly or if the counterparty to the contract is unable to perform. With futures, there is minimal counterparty credit risk to the fund since futures are exchange traded and the exchange’s clearinghouse, as counterparty to all exchange traded futures, guarantees the futures against default. Risks may exceed amounts recognized on the Statement of assets and liabilities. When the contract is closed, the fund records a realized gain or loss equal to the difference between the value of the contract at the time it was opened and the value at the time it was closed.
Futures contracts are valued at the quoted daily settlement prices established by the exchange on which they trade. The fund and the broker agree to exchange an amount of cash equal to the daily fluctuation in the value of the futures contract. Such receipts or payments are known as “variation margin.”
Futures contracts outstanding at period end, if any, are listed after the fund’s portfolio. Outstanding number of contracts on futures contracts at the close of the reporting period are indicative of the volume of activity during the reporting period.
Total return swap contracts The fund entered into total return swap contracts, which are arrangements to exchange a market linked return for a periodic payment, both based on a notional principal amount, to hedge sector exposure, to manage exposure to specific sectors or industries and to gain exposure to specific sectors or industries.
To the extent that the total return of the security, index or other financial measure underlying the transaction exceeds or falls short of the offsetting interest rate obligation, the fund will receive a payment from or make a payment to the counterparty. Total return swap contracts are marked to market daily based upon quotations from an independent pricing service or market makers and the change, if any, is recorded as an unrealized gain or loss. Payments received or made are recorded as realized gains or losses. Certain total return swap contracts may include extended effective dates. Payments related to these swap contracts are accrued based on the terms of the contract. The fund could be exposed to credit or market risk due to unfavorable changes in the fluctuation of interest rates or in the price of the underlying security or index, the possibility that there is no liquid market for these agreements or that the counterparty may default on its obligation to perform. The fund’s maximum risk of loss from counterparty risk is the fair value of the contract. This risk may be mitigated by having a master netting arrangement between the fund and the counterparty. Risk of loss may exceed amounts recognized on the Statement of assets and liabilities.
Total return swap contracts outstanding at period end, if any, are listed after the fund’s portfolio. Outstanding notional amount on total return swap contracts at the close of the reporting period are indicative of the volume of activity during the reporting period.
Interest rate swap contracts The fund entered into interest rate swap contracts, which are arrangements between two parties to exchange cash flows based on a notional principal amount, to hedge interest rate risk and to gain exposure on interest rates.
An interest rate swap can be purchased or sold with an upfront premium. An upfront payment received by the fund is recorded as a liability on the fund’s books. An upfront payment made by the fund is recorded as an asset on the fund’s books. Upfront payments are recorded as realized gains and losses at the closing of the contract. Interest rate swap contracts are marked to market daily based upon quotations from an independent pricing service or market makers and the change, if any, is recorded as an unrealized gain or loss. Payments received or made are recorded as realized gains or losses. Certain interest rate swap contracts may include extended effective dates. Payments related to these swap contracts are accrued based on the terms of the contract. The fund could be exposed to credit or market risk due to unfavorable changes in the fluctuation of interest rates or if the counterparty defaults on its obligation to perform. The fund’s maximum risk of loss from counterparty risk is the fair value of the contract. This risk may be mitigated by having a master netting arrangement between the fund and the counterparty. Risk of loss may exceed amounts recognized on the Statement of assets and liabilities.
Interest rate swap contracts outstanding at period end, if any, are listed after the fund’s portfolio. The fund had an average notional amount of approximately $5,258,900,000 on interest rate swap contracts for the reporting period.
Master agreements The fund is a party to ISDA (International Swaps and Derivatives Association, Inc.) Master Agreements (Master Agreements) with certain counterparties that govern over-the-counter derivative and foreign exchange contracts entered into from time to time. The Master Agreements may contain provisions regarding, among other things, the parties’ general obligations, representations, agreements, collateral requirements, events
65
of default and early termination. With respect to certain counterparties, in accordance with the terms of the Master Agreements, collateral posted to the fund is held in a segregated account by the fund’s custodian and with respect to those amounts which can be sold or repledged, are presented in the fund’s portfolio. Collateral posted to the fund which cannot be sold or repledged totaled $33,735,217 at the close of the reporting period.
Collateral pledged by the fund is segregated by the fund’s custodian and identified in the fund’s portfolio. Collateral can be in the form of cash or debt securities issued by the U.S. Government or related agencies or other securities as agreed to by the fund and the applicable counterparty. Collateral requirements are determined based on the fund’s net position with each counterparty.
Termination events applicable to the fund may occur upon a decline in the fund’s net assets below a specified threshold over a certain period of time. Termination events applicable to counterparties may occur upon a decline in the counterparty’s long-term and short-term credit ratings below a specified level. In each case, upon occurrence, the other party may elect to terminate early and cause settlement of all derivative and foreign exchange contracts outstanding, including the payment of any losses and costs resulting from such early termination, as reasonably determined by the terminating party. Any decision by one or more of the fund’s counterparties to elect early termination could impact the fund’s future derivative activity.
At the close of the reporting period, the fund had a net liability position of $57,211,400 on derivative contracts subject to the Master Agreements. Collateral posted by the fund totaled $56,708,000.
TBA purchase commitments The fund may enter into TBA (to be announced) commitments to purchase securities for a fixed unit price at a future date beyond customary settlement time. Although the unit price has been established, the principal value has not been finalized. However, it is anticipated that the amount of the commitments will not significantly differ from the principal amount. The fund holds, and maintains until settlement date, cash or high-grade debt obligations in an amount sufficient to meet the purchase price, or the fund may enter into offsetting contracts for the forward sale of other securities it owns. Income on the securities will not be earned until settlement date. TBA purchase commitments may be considered securities themselves, and involve a risk of loss if the value of the security to be purchased declines prior to the settlement date, which risk is in addition to the risk of decline in the value of the fund’s other assets. Unsettled TBA purchase commitments are valued at fair value of the underlying securities, according to the procedures described under “Security valuation” above. The contract is marked to market daily and the change in market value is recorded by the fund as an unrealized gain or loss.
Although the fund will generally enter into TBA purchase commitments with the intention of acquiring securities for its portfolio or for delivery pursuant to options contracts it has entered into, the fund may dispose of a commitment prior to settlement if Putnam Management deems it appropriate to do so.
TBA sale commitments The fund may enter into TBA sale commitments to hedge its portfolio positions or to sell mortgage-backed securities it owns under delayed delivery arrangements. Proceeds of TBA sale commitments are not received until the contractual settlement date. During the time a TBA sale commitment is outstanding, equivalent deliverable securities, or an offsetting TBA purchase commitment deliverable on or before the sale commitment date, are held as “cover” for the transaction.
Unsettled TBA sale commitments are valued at the fair value of the underlying securities, generally according to the procedures described under “Security valuation” above. The contract is marked to market daily and the change in market value is recorded by the fund as an unrealized gain or loss. If the TBA sale commitment is closed through the acquisition of an offsetting TBA purchase commitment, the fund realizes a gain or loss. If the fund delivers securities under the commitment, the fund realizes a gain or a loss from the sale of the securities based upon the unit price established at the date the commitment was entered into. TBA sale commitments outstanding at period end, if any, are listed after the fund’s portfolio.
Interfund lending The fund, along with other Putnam funds, may participate in an interfund lending program pursuant to an exemptive order issued by the SEC. This program allows the fund to borrow from or lend to other Putnam funds that permit such transactions. Interfund lending transactions are subject to each fund’s investment policies and borrowing and lending limits. Interest earned or paid on the interfund lending transaction will be based on the average of certain current market rates. During the reporting period, the fund did not utilize the program.
Line of credit The fund participates, along with other Putnam funds, in a $325 million unsecured committed line of credit and a $185 million unsecured uncommitted line of credit, both provided by State Street. Borrowings may be made for temporary or emergency purposes, including the funding of shareholder redemption requests and trade settlements. Interest is charged to the fund based on the fund’s borrowing at a rate equal to the Federal Funds rate plus 1.25% for the committed line of credit and the Federal Funds rate plus 1.30% for the uncommitted line of credit.
66
A closing fee equal to 0.02% of the committed line of credit and $50,000 for the uncommitted line of credit has been paid by the participating funds. In addition, a commitment fee of 0.13% per annum on any unutilized portion of the committed line of credit is allocated to the participating funds based on their relative net assets and paid quarterly. During the reporting period, the fund had no borrowings against these arrangements.
Federal taxes It is the policy of the fund to distribute all of its taxable income within the prescribed time period and otherwise comply with the provisions of the Internal Revenue Code of 1986, as amended (the Code), applicable to regulated investment companies. It is also the intention of the fund to distribute an amount sufficient to avoid imposition of any excise tax under Section 4982 of the Code.
The fund is subject to the provisions of Accounting Standards Codification ASC 740 Income Taxes (ASC 740). ASC 740 sets forth a minimum threshold for financial statement recognition of the benefit of a tax position taken or expected to be taken in a tax return. The fund did not have a liability to record for any unrecognized tax benefits in the accompanying financial statements. No provision has been made for federal taxes on income, capital gains or unrealized appreciation on securities held nor for excise tax on income and capital gains. Each of the fund’s federal tax returns for the prior three fiscal years remains subject to examination by the Internal Revenue Service.
| | | |
| Loss carryover |
| Short-term | Long-term | Total | Expiration |
|
| $92,884,454 | $— | $92,884,454 | October 31, 2016 |
|
| 63,311,499 | — | 63,311,499 | October 31, 2017 |
|
Under the recently enacted Regulated Investment Company Modernization Act of 2010, the fund will be permitted to carry forward capital losses incurred in taxable years beginning after December 22, 2010 for an unlimited period. However, any losses incurred during those future years will be required to be utilized prior to the losses incurred in pre-enactment tax years. As a result of this ordering rule, pre-enactment capital loss carryforwards may be more likely to expire unused. Additionally, post-enactment capital losses that are carried forward will retain their character as either short-term or long-term capital losses rather than being considered all short-term as under previous law.
The aggregate identified cost on a tax basis is $1,951,208,655, resulting in gross unrealized appreciation and depreciation of $76,833,699 and $27,948,303, respectively, or net unrealized appreciation of $48,885,396.
Distributions to shareholders Distributions to shareholders from net investment income are recorded by the fund on the ex-dividend date. Distributions from capital gains, if any, are recorded on the ex-dividend date and paid at least annually. The amount and character of income and gains to be distributed are determined in accordance with income tax regulations, which may differ from generally accepted accounting principles. Dividend sources are estimated at the time of declaration. Actual results may vary. Any non-taxable return of capital cannot be determined until final tax calculations are completed after the end of the fund’s fiscal year. Reclassifications are made to the fund’s capital accounts to reflect income and gains available for distribution (or available capital loss carryovers) under income tax regulations.
Note 2: Management fee, administrative services and other transactions
The fund pays Putnam Management a management fee (based on the fund’s average net assets and computed and paid monthly) at annual rates that may vary based on the average of the aggregate net assets of most open-end funds, as defined in the fund’s management contract, sponsored by Putnam Management. Such annual rates may vary as follows:
| |
| 0.550% | of the first $5 billion, |
| 0.500% | of the next $5 billion, |
| 0.450% | of the next $10 billion, |
| 0.400% | of the next $10 billion, |
| 0.350% | of the next $50 billion, |
| 0.330% | of the next $50 billion, |
| 0.320% | of the next $100 billion and |
| 0.315% | of any excess thereafter. |
67
Putnam Management has contractually agreed, through June 30, 2012, to waive fees or reimburse the fund’s expenses to the extent necessary to limit the cumulative expenses of the fund, exclusive of brokerage, interest, taxes, investment-related expenses, extraordinary expenses and payments under the fund’s investor servicing contract, investment management contract and distribution plans, on a fiscal year-to-date basis to an annual rate of 0.20% of the fund’s average net assets over such fiscal year-to-date period. During the reporting period, the fund’s expenses were not reduced as a result of this limit.
Putnam Investments Limited (PIL), an affiliate of Putnam Management, is authorized by the Trustees to manage a separate portion of the assets of the fund as determined by Putnam Management from time to time. Putnam Management pays a quarterly sub-management fee to PIL for its services at an annual rate of 0.40% of the average net assets of the portion of the fund managed by PIL.
The fund reimburses Putnam Management an allocated amount for the compensation and related expenses of certain officers of the fund and their staff who provide administrative services to the fund. The aggregate amount of all such reimbursements is determined annually by the Trustees.
Custodial functions for the fund’s assets are provided by State Street. Custody fees are based on the fund’s asset level, the number of its security holdings and transaction volumes.
Putnam Investor Services, Inc., an affiliate of Putnam Management, provides investor servicing agent functions to the fund. Putnam Investor Services, Inc. received fees for investor servicing based on the fund’s retail asset level, the number of shareholder accounts in the fund and the level of defined contribution plan assets in the fund. Investor servicing fees will not exceed an annual rate of 0.32% of the fund’s average net assets. Prior to March 1, 2012, investor servicing fees could not exceed an annual rate of 0.375% of the fund’s average net assets. The amounts incurred for investor servicing agent functions during the reporting period are included in Investor servicing fees in the Statement of operations.
The fund has entered into expense offset arrangements with Putnam Investor Services, Inc. and State Street whereby Putnam Investor Services, Inc.’s and State Street’s fees are reduced by credits allowed on cash balances. For the reporting period, the fund’s expenses were reduced by $997 under the expense offset arrangements.
Each independent Trustee of the fund receives an annual Trustee fee, of which $1,042, as a quarterly retainer, has been allocated to the fund, and an additional fee for each Trustees meeting attended. Trustees also are reimbursed for expenses they incur relating to their services as Trustees.
The fund has adopted a Trustee Fee Deferral Plan (the Deferral Plan) which allows the Trustees to defer the receipt of all or a portion of Trustees fees payable on or after July 1, 1995. The deferred fees remain invested in certain Putnam funds until distribution in accordance with the Deferral Plan.
The fund has adopted an unfunded noncontributory defined benefit pension plan (the Pension Plan) covering all Trustees of the fund who have served as a Trustee for at least five years and were first elected prior to 2004. Benefits under the Pension Plan are equal to 50% of the Trustee’s average annual attendance and retainer fees for the three years ended December 31, 2005. The retirement benefit is payable during a Trustee’s lifetime, beginning the year following retirement, for the number of years of service through December 31, 2006. Pension expense for the fund is included in Trustee compensation and expenses in the Statement of operations. Accrued pension liability is included in Payable for Trustee compensation and expenses in the Statement of assets and liabilities. The Trustees have terminated the Pension Plan with respect to any Trustee first elected after 2003.
The fund has adopted distribution plans (the Plans) with respect to its class A, class B, class C, class M and class R shares pursuant to Rule 12b–1 under the Investment Company Act of 1940. The purpose of the Plans is to compensate Putnam Retail Management Limited Partnership, a wholly-owned subsidiary of Putnam Investments, LLC and Putnam Retail Management GP, Inc., for services provided and expenses incurred in distributing shares of the fund. The Plans provide for payments by the fund to Putnam Retail Management Limited Partnership at an annual rate of up to 0.35%, 1.00%, 1.00%, 1.00% and 1.00% of the average net assets attributable to class A, class B, class C, class M and class R shares, respectively. The Trustees have approved payment by the fund at an annual rate of 0.25%, 1.00%, 1.00%, 0.50% and 0.50% of the average net assets attributable to class A, class B, class C, class M and class R shares, respectively.
For the reporting period, Putnam Retail Management Limited Partnership, acting as underwriter, received net commissions of $57,840 and $6,488 from the sale of class A and class M shares, respectively, and received $18,931 and $5,190 in contingent deferred sales charges from redemptions of class B and class C shares, respectively.
68
A deferred sales charge of up to 1.00% and 0.40% is assessed on certain redemptions of class A and class M shares, respectively. For the reporting period, Putnam Retail Management Limited Partnership, acting as underwriter, received $2,378 and no monies on class A and class M redemptions, respectively.
Note 3: Purchases and sales of securities
During the reporting period, cost of purchases and proceeds from sales of investment securities other than short-term investments and TBA transactions aggregated $784,219,833 and $724,795,489, respectively. These figures include the cost of purchases and proceeds from sales of long-term U.S. government securities of $5,972,188 and $5,971,484, respectively.
Written option transactions during the reporting period are summarized as follows:
| | |
| | Written swap option | Written swap option |
| | contract amounts | premiums received |
|
| Written options outstanding at the | | |
| beginning of the reporting period | $2,343,944,374 | $125,397,305 |
|
| Options opened | 234,214,000 | 6,166,428 |
| Options exercised | (546,936,954) | (21,591,087) |
| Options expired | — | — |
| Options closed | (786,512,782) | (39,934,107) |
|
| Written options outstanding at the | | |
| end of the reporting period | $1,244,708,638 | $70,038,539 |
|
Note 4: Capital shares
At the close of the reporting period, there was an unlimited number of shares of beneficial interest authorized. Transactions in capital shares were as follows:
| | | | |
| | Six months ended 4/30/12 | Year ended 10/31/11 |
|
| Class A | Shares | Amount | Shares | Amount |
|
| Shares sold | 16,168,425 | $110,275,366 | 31,938,569 | $218,790,518 |
|
| Shares issued in connection with | | | | |
| reinvestment of distributions | 1,820,186 | 12,365,591 | 5,196,313 | 35,449,398 |
|
| | 17,988,611 | 122,640,957 | 37,134,882 | 254,239,916 |
|
| Shares repurchased | (18,181,181) | (123,948,359) | (38,649,700) | (263,845,938) |
|
| Net decrease | (192,570) | $(1,307,402) | (1,514,818) | $(9,606,022) |
|
| |
| | Six months ended 4/30/12 | Year ended 10/31/11 |
|
| Class B | Shares | Amount | Shares | Amount |
|
| Shares sold | 765,743 | $5,174,409 | 2,105,943 | $14,318,416 |
|
| Shares issued in connection with | | | | |
| reinvestment of distributions | 61,340 | 413,262 | 208,992 | 1,412,938 |
|
| | 827,083 | 5,587,671 | 2,314,935 | 15,731,354 |
|
| Shares repurchased | (909,543) | (6,153,665) | (2,787,583) | (18,884,104) |
|
| Net decrease | (82,460) | $(565,994) | (472,648) | $(3,152,750) |
|
69
| | | | |
| | Six months ended 4/30/12 | Year ended 10/31/11 |
|
| Class C | Shares | Amount | Shares | Amount |
|
| Shares sold | 3,113,958 | $21,116,342 | 8,428,929 | $57,395,078 |
|
| Shares issued in connection with | | | | |
| reinvestment of distributions | 213,498 | 1,441,385 | 660,999 | 4,480,909 |
|
| | 3,327,456 | 22,557,727 | 9,089,928 | 61,875,987 |
|
| Shares repurchased | (4,198,821) | (28,497,415) | (8,652,088) | (58,620,817) |
|
| Net increase (decrease) | (871,365) | $(5,939,688) | 437,840 | $3,255,170 |
|
| |
| | Six months ended 4/30/12 | Year ended 10/31/11 |
|
| Class M | Shares | Amount | Shares | Amount |
|
| Shares sold | 617,060 | $4,125,874 | 4,252,299 | $28,443,376 |
|
| Shares issued in connection with | | | | |
| reinvestment of distributions | 32,222 | 214,697 | 96,626 | 646,826 |
|
| | 649,282 | 4,340,571 | 4,348,925 | 29,090,202 |
|
| Shares repurchased | (2,752,669) | (18,406,827) | (12,052,732) | (80,978,751) |
|
| Net decrease | (2,103,387) | $(14,066,256) | (7,703,807) | $(51,888,549) |
|
| |
| | Six months ended 4/30/12 | Year ended 10/31/11 |
|
| Class R | Shares | Amount | Shares | Amount |
|
| Shares sold | 241,794 | $1,634,867 | 308,145 | $2,097,773 |
|
| Shares issued in connection with | | | | |
| reinvestment of distributions | 10,091 | 68,247 | 24,597 | 167,075 |
|
| | 251,885 | 1,703,114 | 332,742 | 2,264,848 |
|
| Shares repurchased | (222,454) | (1,505,622) | (234,689) | (1,602,134) |
|
| Net increase | 29,431 | $197,492 | 98,053 | $662,714 |
|
| |
| | Six months ended 4/30/12 | Year ended 10/31/11 |
|
| Class Y | Shares | Amount | Shares | Amount |
|
| Shares sold | 11,160,744 | $77,058,348 | 19,234,583 | $133,635,790 |
|
| Shares issued in connection with | | | | |
| reinvestment of distributions | 264,389 | 1,818,177 | 554,836 | 3,832,111 |
|
| | 11,425,133 | 78,876,525 | 19,789,419 | 137,467,901 |
|
| Shares repurchased | (7,877,383) | (54,348,778) | (21,652,336) | (149,652,242) |
|
| Net increase (decrease) | 3,547,750 | $24,527,747 | (1,862,917) | $(12,184,341) |
|
70
Note 5: Summary of derivative activity
The following is a summary of the market values of derivative instruments as of the close of the reporting period:
Market values of derivative instruments as of the close of the reporting period
| | | | |
| | Asset derivatives | Liability derivatives |
|
| Derivatives not | | | | |
| accounted for as | Statement of | | Statement of | |
| hedging instruments | assets and | | assets and | |
| under ASC 815 | liabilities location | Market value | liabilities location | Market value |
|
| | Investments, | | | |
| | Receivables, Net | | | |
| | assets — Unrealized | | Payables, Net assets — | |
| | appreciation/ | | Unrealized appreciation/ | |
| Interest rate contracts | (depreciation) | $109,541,414* | (depreciation) | $102,464,881* |
|
| Total | | $109,541,414 | | $102,464,881 |
|
* Includes cumulative appreciation/depreciation of futures contracts as reported in The fund’s portfolio. Only current day’s variation margin is reported within the Statement of assets and liabilities.
The following is a summary of realized and change in unrealized gains or losses of derivative instruments on the Statement of operations for the reporting period (see Note 1):
Amount of realized gain or (loss) on derivatives recognized in net gain or (loss) on investments
| | | | |
| Derivatives not accounted for | | | | |
| as hedging instruments under | | | | |
| ASC 815 | Options | Futures | Swaps | Total |
|
| Interest rate contracts | $(17,467,293) | $8,040,769 | $(29,794,340) | $(39,220,864) |
|
| Total | $(17,467,293) | $8,040,769 | $(29,794,340) | $(39,220,864) |
|
| |
| Change in unrealized appreciation or (depreciation) on derivatives recognized in net gain or (loss) on investments |
| |
| Derivatives not accounted for | | | | |
| as hedging instruments under | | | | |
| ASC 815 | Options | Futures | Swaps | Total |
|
| Interest rate contracts | $(2,995,661) | $1,814,366 | $23,440,279 | $22,258,984 |
|
| Total | $(2,995,661) | $1,814,366 | $23,440,279 | $22,258,984 |
|
Note 6: Investment in Putnam Money Market Liquidity Fund
The fund invested in Putnam Money Market Liquidity Fund, an open-end management investment company managed by Putnam Management. Investments in Putnam Money Market Liquidity Fund are valued at its closing net asset value each business day. Income distributions earned by the fund are recorded as interest income in the Statement of operations and totaled $99,281 for the reporting period. During the reporting period, cost of purchases and proceeds of sales of investments in Putnam Money Market Liquidity Fund aggregated $404,734,116 and $490,975,682, respectively. Management fees charged to Putnam Money Market Liquidity Fund have been waived by Putnam Management.
Note 7: Senior loan commitments
Senior loans are purchased or sold on a when-issued or delayed delivery basis and may be settled a month or more after the trade date, which from time to time can delay the actual investment of available cash balances; interest income is accrued based on the terms of the securities. Senior loans can be acquired through an agent, by assignment from another holder of the loan, or as a participation interest in another holder’s portion of the loan. When the fund invests in a loan or participation, the fund is subject to the risk that an intermediate participant between the fund and the borrower will fail to meet its obligations to the fund, in addition to the risk that the borrower under the loan may default on its obligations.
71
Note 8: Market, credit and other risks
In the normal course of business, the fund trades financial instruments and enters into financial transactions where risk of potential loss exists due to changes in the market (market risk) or failure of the contracting party to the transaction to perform (credit risk). The fund may be exposed to additional credit risk that an institution or other entity with which the fund has unsettled or open transactions will default. The fund may invest a significant portion of its assets in securitized debt instruments, including mortgage-backed and asset-backed investments. The yields and values of these investments are sensitive to changes in interest rates, the rate of principal payments on the underlying assets and the market’s perception of the issuers. The market for these investments may be volatile and limited, which may make them difficult to buy or sell.
Note 9: Regulatory matters and litigation
In late 2003 and 2004, Putnam Management settled charges brought by the SEC and the Massachusetts Securities Division in connection with excessive short-term trading in Putnam funds. In July 2011, the fund recorded a receivable of $424,890 related to restitution amounts in connection with a distribution plan approved by the SEC. This amount, which was received by the fund in December 2011, is reported as part of Increase in capital from settlement payments on the Statement of changes in net assets. These allegations and related matters have served as the general basis for certain lawsuits, including purported class action lawsuits against Putnam Management and, in a limited number of cases, some Putnam funds. In May 2011, the fund received a payment of $9,005 related to settlement of those lawsuits. This amount is reported as a part of Increase in capital from settlement payments on the Statement of changes in net assets. Putnam Management has agreed to bear any costs incurred by the Putnam funds as a result of these matters.
Note 10: New accounting pronouncements
In May 2011, the Financial Accounting Standards Board (FASB) issued Accounting Standards Update (ASU) 2011–04 “Fair Value Measurements and Disclosures (Topic 820) — Amendments to Achieve Common Fair Value Measurement and Disclosure Requirements in U.S. GAAP and IFRS”. ASU 2011–04 amends FASB Topic 820 “Fair Value Measurement” and seeks to develop common requirements for measuring fair value and for disclosing information about fair value measurements in accordance with GAAP. ASU 2011–04 is effective for fiscal years and interim periods beginning after December 15, 2011. The application of ASU 2011–04 will not have a material impact on the fund’s financial statements.
In December 2011, the FASB issued ASU No. 2011–11 “Disclosures about Offsetting Assets and Liabilities”. The update creates new disclosure requirements requiring entities to disclose both gross and net information for derivatives and other financial instruments that are either offset in the Statement of assets and liabilities or subject to an enforceable master netting arrangement or similar agreement. The disclosure requirements are effective for annual reporting periods beginning on or after January 1, 2013 and interim periods within those annual periods. Putnam Management is currently evaluating the application of ASU 2011–11 and its impact, if any, on the fund’s financial statements.
72
The Putnam family of funds
The following is a list of Putnam’s open-end mutual funds offered to the public. Investors should carefully consider the investment objective, risks, charges, and expenses of a fund before investing. For a prospectus, or a summary prospectus if available, containing this and other information for any Putnam fund or product, call your financial advisor at 1-800-225-1581 and ask for a prospectus. Please read the prospectus carefully before investing.
| |
| Growth | Income |
| Growth Opportunities Fund | American Government Income Fund |
| International Growth Fund | Diversified Income Trust |
| Multi-Cap Growth Fund | Floating Rate Income Fund |
| Small Cap Growth Fund | Global Income Trust |
| Voyager Fund | High Yield Advantage Fund |
| | High Yield Trust |
| Blend | Income Fund |
| Asia Pacific Equity Fund | Money Market Fund* |
| Capital Opportunities Fund | Short Duration Income Fund |
| Capital Spectrum Fund | U.S. Government Income Trust |
| Emerging Markets Equity Fund | |
| Equity Spectrum Fund | Tax-free income |
| Europe Equity Fund | AMT-Free Municipal Fund |
| Global Equity Fund | Tax Exempt Income Fund |
| International Capital Opportunities Fund | Tax Exempt Money Market Fund* |
| International Equity Fund | Tax-Free High Yield Fund |
| Investors Fund | |
| Multi-Cap Core Fund | State tax-free income funds: |
| Research Fund | Arizona, California, Massachusetts, Michigan, |
| Minnesota, New Jersey, New York, Ohio, |
| Value | and Pennsylvania. |
| Convertible Securities Fund | |
| Equity Income Fund | Absolute Return |
| George Putnam Balanced Fund | Absolute Return 100 Fund |
| The Putnam Fund for Growth and Income | Absolute Return 300 Fund |
| International Value Fund | Absolute Return 500 Fund |
| Multi-Cap Value Fund | Absolute Return 700 Fund |
| Small Cap Value Fund | |
| |
| |
* An investment in a money market fund is not insured or guaranteed by the Federal Deposit Insurance Corporation or any other government agency. Although the fund seeks to preserve the value of your investment at $1.00 per share, it is possible to lose money by investing in the fund.
73
| |
| Global Sector | Putnam RetirementReady Funds — portfolios |
| Global Consumer Fund | with automatically adjusting allocations to |
| Global Energy Fund | stocks, bonds, and money market instruments, |
| Global Financials Fund | becoming more conservative over time. |
| Global Health Care Fund | |
| Global Industrials Fund | RetirementReady 2055 Fund |
| Global Natural Resources Fund | RetirementReady 2050 Fund |
| Global Sector Fund | RetirementReady 2045 Fund |
| Global Technology Fund | RetirementReady 2040 Fund |
| Global Telecommunications Fund | RetirementReady 2035 Fund |
| Global Utilities Fund | RetirementReady 2030 Fund |
| RetirementReady 2025 Fund |
| Asset Allocation | RetirementReady 2020 Fund |
| Putnam Global Asset Allocation Funds — | RetirementReady 2015 Fund |
| portfolios with allocations to stocks, bonds, | |
| and money market instruments that are | Putnam Retirement Income Lifestyle |
| adjusted dynamically within specified ranges | Funds — portfolios with managed |
| as market conditions change. | allocations to stocks, bonds, and money |
| market investments to generate |
| Dynamic Asset Allocation Balanced Fund | retirement income. |
| Prior to November 30, 2011, this fund was known as | |
| Putnam Asset Allocation: Balanced Portfolio. | Retirement Income Fund Lifestyle 1 |
| Dynamic Asset Allocation | Prior to June 16, 2011, this fund was known as |
| Conservative Fund | Putnam RetirementReady Maturity Fund. |
| Prior to November 30, 2011, this fund was known as | Retirement Income Fund Lifestyle 2 |
| Putnam Asset Allocation: Conservative Portfolio. | Retirement Income Fund Lifestyle 3 |
| Dynamic Asset Allocation Growth Fund | Prior to June 16, 2011, this fund was known as |
| Prior to November 30, 2011, this fund was known as | Putnam Income Strategies Fund. |
| Putnam Asset Allocation: Growth Portfolio. | |
| Dynamic Risk Allocation Fund | |
| |
| |
A short-term trading fee of 1% may apply to redemptions or exchanges from certain funds within the time period specified in the fund's prospectus.
Check your account balances and the most recent month-end performance in the Individual Investors section at putnam.com.
74
Services for shareholders
Investor services
Systematic investment plan Tell us how much you wish to invest regularly — weekly, semimonthly, or monthly — and the amount you choose will be transferred automatically from your checking or savings account. There’s no additional fee for this service, and you can suspend it at any time. This plan may be a great way to save for college expenses or to plan for your retirement.
Please note that regular investing does not guarantee a profit or protect against loss in a declining market. Before arranging a systematic investment plan, consider your financial ability to continue making purchases in periods when prices are low.
Systematic exchange You can make regular transfers from one Putnam fund to another Putnam fund. There are no additional fees for this service, and you can cancel or change your options at any time.
Dividends PLUS You can choose to have the dividend distributions from one of your Putnam funds automatically reinvested in another Putnam fund at no additional charge.
Free exchange privilege You can exchange money between Putnam funds free of charge, as long as they are the same class of shares. A signature guarantee is required if you are exchanging more than $500,000. The fund reserves the right to revise or terminate the exchange privilege.
Reinstatement privilege If you’ve sold Putnam shares or received a check for a dividend or capital gain, you may reinvest the proceeds with Putnam within 90 days of the transaction and they will be reinvested at the fund’s current net asset value — with no sales charge. However, reinstatement of class B shares may have special tax consequences. Ask your financial or tax representative for details.
Check-writing service You have ready access to many Putnam accounts. It’s as simple as writing a check, and there are no special fees or service charges. For more information about the check-writing service, call Putnam or visit our website.
Dollar cost averaging When you’re investing for long-term goals, it’s time, not timing, that counts. Investing on a systematic basis is a better strategy than trying to figure out when the markets will go up or down. This means investing the same amount of money regularly over a long period. This method of investing is called dollar cost averaging. When a fund’s share price declines, your investment dollars buy more shares at lower prices. When it increases, they buy fewer shares. Over time, you will pay a lower average price per share.
For more information
Visit the Individual Investors section at putnam.com A secure section of our website contains complete information on your account, including balances and transactions, updated daily. You may also conduct transactions, such as exchanges, additional investments, and address changes. Log on today to get your password.
Call us toll free at 1-800-225-1581 Ask a helpful Putnam representative or your financial advisor for details about any of these or other services, or see your prospectus.
75
Fund information
Founded 75 years ago, Putnam Investments was built around the concept that a balance between risk and reward is the hallmark of a well-rounded financial program. We manage over 100 funds across income, value, blend, growth, asset allocation, absolute return, and global sector categories.
| | |
| Investment Manager | Elizabeth T. Kennan | Mark C. Trenchard |
| Putnam Investment | Kenneth R. Leibler | Vice President and |
| Management, LLC | Robert E. Patterson | BSA Compliance Officer |
| One Post Office Square | George Putnam, III | |
| Boston, MA 02109 | Robert L. Reynolds | Robert T. Burns |
| | W. Thomas Stephens | Vice President and |
| Investment Sub-Manager | | Chief Legal Officer |
| Putnam Investments Limited | Officers | |
| 57–59 St James’s Street | Robert L. Reynolds | James P. Pappas |
| London, England SW1A 1LD | President | Vice President |
| | | |
| Marketing Services | Jonathan S. Horwitz | Judith Cohen |
| Putnam Retail Management | Executive Vice President, | Vice President, Clerk and |
| One Post Office Square | Principal Executive | Assistant Treasurer |
| Boston, MA 02109 | Officer, Treasurer and | |
| | Compliance Liaison | Michael Higgins |
| Custodian | | Vice President, Senior Associate |
| State Street Bank | Steven D. Krichmar | Treasurer and Assistant Clerk |
| and Trust Company | Vice President and | |
| | Principal Financial Officer | Nancy E. Florek |
| Legal Counsel | | Vice President, Assistant Clerk, |
| Ropes & Gray LLP | Janet C. Smith | Assistant Treasurer and |
| | Vice President, Assistant | Proxy Manager |
| Trustees | Treasurer and Principal | |
| Jameson A. Baxter, Chair | Accounting Officer | Susan G. Malloy |
| Ravi Akhoury | | Vice President and |
| Barbara M. Baumann | Robert R. Leveille | Assistant Treasurer |
| Charles B. Curtis | Vice President and | |
| Robert J. Darretta | Chief Compliance Officer | |
| John A. Hill | | |
| Paul L. Joskow | | |
This report is for the information of shareholders of Putnam Income Fund. It may also be used as sales literature when preceded or accompanied by the current prospectus, the most recent copy of Putnam’s Quarterly Performance Summary, and Putnam’s Quarterly Ranking Summary. For more recent performance, please visit putnam.com. Investors should carefully consider the investment objectives, risks, charges, and expenses of a fund, which are described in its prospectus. For this and other information or to request a prospectus or summary prospectus, call 1-800-225-1581 toll free. Please read the prospectus carefully before investing. The fund’s Statement of Additional Information contains additional information about the fund’s Trustees and is available without charge upon request by calling 1-800-225-1581.
| |
| Item 3. Audit Committee Financial Expert: |
| |
| Item 4. Principal Accountant Fees and Services: |
| |
| Item 5. Audit Committee of Listed Registrants |
| |
| Item 6. Schedule of Investments: |
| |
| The registrant’s schedule of investments in unaffiliated issuers is included in the report to shareholders in Item 1 above. |
| |
| Item 7. Disclosure of Proxy Voting Policies and Procedures For Closed-End Management Investment Companies: |
| |
| Item 8. Portfolio Managers of Closed-End Investment Companies |
| |
| Item 9. Purchases of Equity Securities by Closed-End Management Investment Companies and Affiliated Purchasers: |
| |
| Item 10. Submission of Matters to a Vote of Security Holders: |
| |
| Item 11. Controls and Procedures: |
| |
| (a) The registrant’s principal executive officer and principal financial officer have concluded, based on their evaluation of the effectiveness of the design and operation of the registrant’s disclosure controls and procedures as of a date within 90 days of the filing date of this report, that the design and operation of such procedures are generally effective to provide reasonable assurance that information required to be disclosed by the registrant in this report is recorded, processed, summarized and reported within the time periods specified in the Commission’s rules and forms. |
| |
| (b) Changes in internal control over financial reporting: Not applicable |
| |
| (a)(2) Separate certifications for the principal executive officer and principal financial officer of the registrant as required by Rule 30a-2(a) under the Investment Company Act of 1940, as amended, are filed herewith. |
| |
| (b) The certifications required by Rule 30a-2(b) under the Investment Company Act of 1940, as amended, are filed herewith. |
| |
| By (Signature and Title): |
| |
| /s/Janet C. Smith
Janet C. Smith
Principal Accounting Officer
|
| |
| Pursuant to the requirements of the Securities Exchange Act of 1934 and the Investment Company Act of 1940, this report has been signed below by the following persons on behalf of the registrant and in the capacities and on the dates indicated. |
| |
| By (Signature and Title): |
| |
| /s/Jonathan S. Horwitz
Jonathan S. Horwitz
Principal Executive Officer
|
| |
| By (Signature and Title): |
| |
| /s/Steven D. Krichmar
Steven D. Krichmar
Principal Financial Officer
|