| | |
| UNITED STATES
SECURITIES AND EXCHANGE COMMISSION |
| | |
| CERTIFIED SHAREHOLDER REPORT OF REGISTERED
MANAGEMENT INVESTMENT COMPANIES
|
| | |
| Investment Company Act file number: | (811-00653) |
| | |
| Exact name of registrant as specified in charter: | Putnam Income Fund |
| | |
| Address of principal executive offices: | One Post Office Square, Boston, Massachusetts 02109 |
| | |
| Name and address of agent for service: | Robert T. Burns, Vice President
One Post Office Square
Boston, Massachusetts 02109 |
| | |
| Copy to: | Bryan Chegwidden, Esq.
Ropes & Gray LLP
1211 Avenue of the Americas
New York, New York 10036 |
| | |
| Registrant's telephone number, including area code: | (617) 292-1000 |
| | |
| Date of fiscal year end: | October 31, 2017 |
| | |
| Date of reporting period : | November 1, 2016 — October 31, 2017 |
| | |
|
Item 1. Report to Stockholders: | |
| | |
| The following is a copy of the report transmitted to stockholders pursuant to Rule 30e-1 under the Investment Company Act of 1940: | |
Putnam
Income
Fund
Annual report
10 | 31 | 17
Consider these risks before investing: Funds that invest in government securities are not guaranteed. Mortgage-backed investments carry the risk that they may increase in value when interest rates decline and decline in value when interest rates rise. Bond investments are subject to interest-rate risk (the risk of bond prices falling if interest rates rise) and credit risk (the risk of an issuer defaulting on interest or principal payments). The fund may have to invest the proceeds from prepaid investments, including mortgage-backed investments, in other investments with less attractive terms and yields. Interest-rate risk is greater for longer-term bonds, and credit risk is greater for below-investment-grade bonds. Risks associated with derivatives include increased investment exposure (which may be considered leverage) and, in the case of over-the-counter instruments, the potential inability to terminate or sell derivatives positions and the potential failure of the other party to the instrument to meet its obligations. Unlike bonds, funds that invest in bonds have fees and expenses. Bond prices may fall or fail to rise over time for several reasons, including general financial market conditions, changing market perceptions (including perceptions about the risk of default and expectations about monetary policy or interest rates), changes in government intervention in the financial markets, and factors related to a specific issuer or industry. These and other factors may lead to increased volatility and reduced liquidity in the fund’s portfolio holdings. You can lose money by investing in the fund.
Message from the Trustees
December 12, 2017
Dear Fellow Shareholder:
A fair amount of investor optimism has helped keep financial markets on a steady course throughout 2017. Global stock markets have generally made solid advances with low volatility, while bond market performance has been a bit more uneven. As we look ahead to the new year, it is important to note that a number of macroeconomic and geopolitical risks around the world could disrupt market momentum.
In all market environments, we believe investors should remain focused on time-tested strategies: maintain a well-diversified portfolio, think about long-term goals, and speak regularly with your financial advisor. In the following pages, you will find an overview of your fund’s performance for the reporting period as well as an outlook for the coming months.
We would like to take this opportunity to recognize and thank Robert J. Darretta, John A. Hill, and W. Thomas Stephens, who recently retired from your fund’s Board of Trustees. We are grateful for their years of work on behalf of you and your fellow shareholders, and we wish them well in their future endeavors.
Thank you for investing with Putnam.


Since Putnam Income Fund’s launch in 1954, the bond market landscape has undergone a dramatic transformation, with a greater variety of fixed-income securities available for investment today than ever before. Amid this evolution, the fund’s goal has remained constant: pursuing high current income and prudent risk management.
The fund’s management team has an average of more than 20 years of industry experience.
In pursuit of the fund’s investment goal, the management team seeks to balance the sources of risk and return in the portfolio. They pursue this strategy by investing in sectors that are not reliant on declining interest rates to drive returns, including sectors that lie outside the benchmark index.

The end of an era?
For more than 25 years, declining interest rates have driven bond prices higher. But with interest rates at historically low levels, any strategy that relies on this trend continuing could be risky.
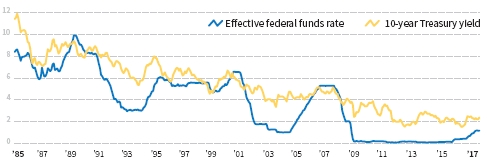
Source: Federal Reserve data as of 10/31/17. Past performance is not indicative of future results.
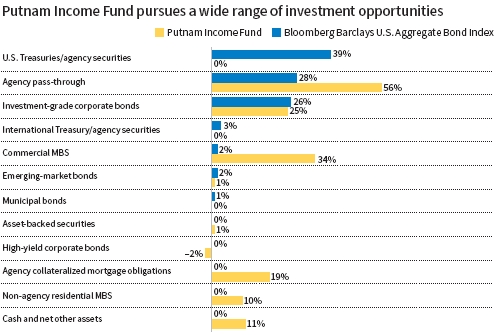
Allocations are shown as a percentage of the fund’s net assets as of 10/31/17. Cash and net other assets, if any, represent the market value weights of cash, derivatives, short-term securities, and other unclassified assets in the portfolio. Summary information may differ from the portfolio schedule included in the financial statements due to the inclusion of derivative securities, any interest accruals, the use of different classifications of securities for presentation purposes, and rounding. Allocations may not total 100% because the table includes the notional value of certain derivatives (the economic value for purposes of calculating periodic payment obligations), in addition to the market value of securities. Holdings and allocations may vary over time.
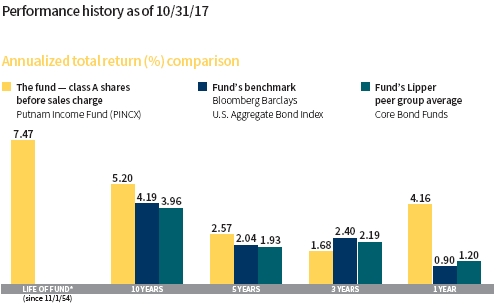
Current performance may be lower or higher than the quoted past performance, which cannot guarantee future results. Share price, principal value, and return will fluctuate, and you may have a gain or a loss when you sell your shares. Performance of class A shares assumes reinvestment of distributions and does not account for taxes. Fund returns in the bar chart do not reflect a sales charge of 4.00%; had they, returns would have been lower. See below and pages 10–13 for additional performance information. For a portion of the periods, the fund had expense limitations, without which returns would have been lower. To obtain the most recent month-end performance, visit putnam.com.
* The fund’s benchmark, the Bloomberg Barclays U.S. Aggregate Bond Index, was introduced on 12/31/75, and the fund’s Lipper category was introduced on 12/31/59. Both post-date the inception of the fund’s class A shares.
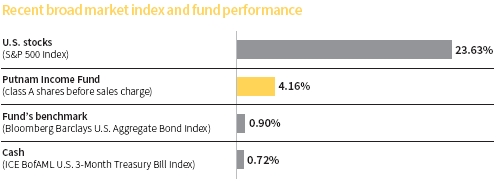
This comparison shows your fund’s performance in the context of broad market indexes for the 12 months ended 10/31/17. See above and pages 10–13 for additional fund performance information. Index descriptions can be found on page 17.


Mike is Co-Head of Fixed Income at Putnam. He has a B.A. from Cornell University. Mike joined Putnam in 1997 and has been in the investment industry since 1989.
In addition to Mike, your fund is managed by Brett S. Kozlowski, CFA, and Emily E. Shanks.
Mike, what was the fund’s investment environment like during the reporting period?
The environment was generally supportive for riskier assets, but rising interest rates, particularly in the early and later months of the period, proved to be a headwind for U.S. Treasuries and other rate-sensitive categories.
Looking first at the economic backdrop, U.S. gross domestic product [GDP] improved as the period progressed, and registered two consecutive quarters of 3% or better annualized growth in the second and third quarters of 2017. Despite economic disruption in Texas and Florida caused by Hurricanes Harvey and Irma, the unemployment rate fell to a 17-year low in October. The jobless rate, which changed little over the course of 2016, dropped from 4.8% to 4.1% since the beginning of 2017, a sign that the labor market has been heating up.
Turning to interest rates, the yield on the benchmark 10-year U.S. Treasury spiked in November and December 2016, as many investors viewed then-President-elect Donald Trump’s economic agenda as stimulative and potentially inflationary. Yields also moved
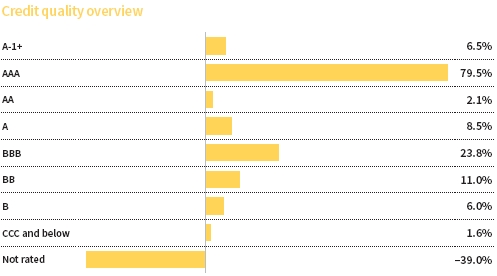
Credit qualities are shown as a percentage of the fund’s net assets as of 10/31/17. A bond rated BBB or higher (A-3 or higher, for short-term debt) is considered investment grade. This chart reflects the highest security rating provided by one or more of Standard & Poor’s, Moody’s, and Fitch. To-be-announced (TBA) mortgage commitments, if any, are included based on their issuer ratings. Ratings may vary over time.
Cash, derivative instruments, and net other assets are shown in the not-rated category. Payables and receivables for TBA mortgage commitments are included in the not-rated category and may result in negative weights. The fund itself has not been rated by an independent rating agency.
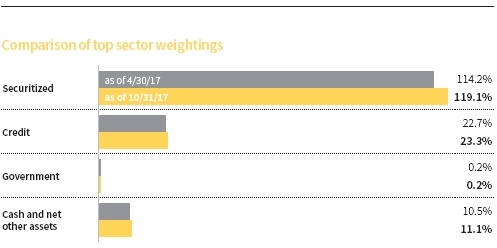
This chart shows how the fund’s sector weightings have changed over the past six months. Allocations are shown as a percentage of the fund’s net assets. Current period summary information may differ from the portfolio schedule included in the financial statements due to the inclusion of derivative securities, any interest accruals, the use of different classifications of securities for presentation purposes, and rounding.
Allocations may not total 100% because the table includes the notional value of certain derivatives (the economic value for purposes of calculating periodic payment obligations), in addition to the market value of securities. Holdings and allocations may vary over time.
higher on the decision by the Federal Reserve to raise policy interest rates. Longer-term yields declined slightly in the first half of 2017, even though the Fed raised rates in June for the third time in as many quarters.
At its policy meetings in September and October 2017, the Fed left the target for short-term interest rates unchanged at a range of 1% to 1.25%. However, the 10-year Treasury yield moved higher, as the central bank indicated that it still saw the potential for raising rates in December and three times in 2018. In October, the Fed began the process of shrinking its massive portfolio of Treasuries and agency mortgage-backed securities [MBS] that it accumulated after the 2008 financial crisis.
For the period as a whole, the 10-year Treasury yield rose from 1.83% to 2.38%.
Overall, market volatility remained low and corporate earnings growth strengthened during the past 12 months. Within this environment, credit spreads continued to tighten, reflecting persistent investor demand for the potentially higher yields available by taking on credit risk versus Treasuries.
The fund comfortably outpaced its benchmark and the average return of its Lipper peer group for the annual reporting period. Which holdings and strategies fueled its relative performance?
Our mortgage-credit strategies accounted for the bulk of the fund’s outperformance, and results were led by our holdings of non-agency residential mortgage-backed securities [RMBS]. Within RMBS, positions in agency credit risk-transfer securities [CRTs] performed particularly well, as a combination of relatively high yields, high-quality collateral, and rising prices for residential real estate continued to attract investors to this growing market. Positions in pay-option adjustable-rate MBS provided a further modest boost within the fund’s RMBS allocation. These securities benefited from a generally favorable risk environment, as well as the fact that there was no new supply of these bonds coming to market.

Early in the period, our positions in mezzanine commercial mortgage-backed securities [CMBS] that were issued before the 2008 financial crisis performed particularly well. However, CMBS as a whole faced headwinds during much of the period due to concerns about softness in the retail industry. Although we agree that retailers face challenges as consumers shift from making purchases in traditional brick-and-mortar stores to shopping online, we believe the CMBS held by the fund have enough credit protection to withstand this trend.
Elsewhere within mortgage credit, CMBS interest-only securities provided steady, modest gains throughout the period.
An overweight allocation to investment-grade corporate bonds also notably contributed versus the benchmark. Corporate credit benefited from positive sentiment immediately following the U.S. presidential election, a strengthening U.S. economy, better-than-expected earnings growth at many firms, and a recovery in crude oil prices.
How did the fund’s interest-rate and yield-curve strategies influence performance?
These strategies also helped the fund outperform the benchmark. We continued our efforts to de-emphasize interest-rate risk by keeping the portfolio’s duration — a key measure of interest-rate sensitivity — shorter than that of the benchmark for most of the period. Also, the portfolio was positioned to benefit if the U.S. Treasury yield curve steepened. This strategy
was particularly helpful in November 2016 when intermediate- and long-term Treasury yields rose sharply in response to the U.S. presidential election outcome.
However, our term-structure positioning stopped working in the fund’s favor near the beginning of calendar-year 2017. During much of the year, a steeper-curve bias has been unproductive and at times adverse.
What impact did prepayment-related strategies have on results relative to the benchmark?
Strategies targeting prepayment risk modestly contributed to relative performance, led by our holdings of agency interest-only collateralized mortgage obligations [IO CMOs]. A combination of investor demand for higher-yielding securities, rising mortgage rates, and constrained lending activity caused by stringent bank underwriting standards resulted in a subdued rate of mortgage refinancing. As a result, prepayment speeds on the mortgages underlying our IO CMO positions stayed below market expectations.
Our holdings of reverse-mortgage IOs posted strong returns late in the period. This was after the Department of Housing and Urban Development [HUD] announced regulatory changes involving reverse mortgages that we think reduce the incentives for holders of such mortgages to refinance.
A reverse mortgage is a special type of loan that lets homeowners who are age 62 or older borrow money against the existing equity in their home. The U.S. government insures reverse mortgages under its “Home Equity Conversion Mortgages” [HECM] program. The mortgages are pooled into HECM MBS and issued by Ginnie Mae. As with conventional agency MBS, HECM MBS can be structured to create a tranche that pays investors interest only. This is the area of the market where we have invested.
Adverse results from our “mortgage basis” positioning — which is a strategy that seeks to exploit the yield differential between current-coupon, 30-year agency pass-throughs and 30-year Treasuries — partially detracted from the overall positive performance of our prepayment strategies.
What else detracted versus the benchmark?
An underweight position in emerging-market [EM] bonds slightly hampered relative performance. EM debt is included in the fund’s benchmark, but has generally not been part of our regular investment strategy.
How did you use derivatives during the period?
We used bond futures and interest-rate swaps to take tactical positions at various points along the yield curve and to hedge the risk associated with these positions. We also employed interest-rate swaps and options to hedge the portfolio’s interest-rate risk, to isolate the prepayment risks associated with our CMO holdings, and to help manage the downside risk of these positions. Lastly, we used credit-default swaps to hedge market and credit risk, and to help us gain access to specific areas of the market.
What is your near-term outlook?
Given the strengthening that we believe is occurring across various global economies, we think bond yields are too low. Although we don’t believe yields are likely to rise significantly this year, partly due to strong global demand for U.S. bonds, we are convinced that they’ll be higher by the end of 2018. There are a lot of variables influencing our rate outlook: potentially significant changes to the Fed’s Board of Governors in 2018; the prospect of tax reform in the United States; the impact of tighter monetary policy in other countries, such as Canada and the United Kingdom; and the ongoing potential for geopolitical flare-ups. So, while there are a variety of cross-currents that could impact the trajectory
of bond yields both in the United States and overseas, we think the overall trend will be for yields to rise next year.
Given this outlook, what areas of the market do you find most attractive?
Prepayment risk remains attractive to us because we think relatively tight mortgage-lending standards may continue to limit refinancing activity.
Within mortgage credit, we think CMBS could benefit from employment growth, low interest rates, and a continuation of the current economic expansion. While we expect some degree of losses related to regional malls, we’re also encouraged by the fact that many malls are attempting to repurpose their space to attract new types of tenants.
We continue to have a constructive outlook for investment-grade credit, despite the fact that valuations are not as attractive as they were a year ago. We plan to continue favoring bonds issued by banks and other types of financial services companies. Many of these firms have strengthened their balance sheets and their earnings have become much less volatile, in our view. We also think financial firms may benefit from a rollback of regulations that is beginning to take shape under the Trump administration.
As of period-end, the fund’s duration was modestly shorter than that of the benchmark. We plan to keep it that way for now, given our expectations for moderately higher interest rates in the months ahead.
Thanks for your time and for bringing us up to date, Mike.
The views expressed in this report are exclusively those of Putnam Management and are subject to change. They are not meant as investment advice.
Please note that the holdings discussed in this report may not have been held by the fund for the entire period. Portfolio composition is subject to review in accordance with the fund’s investment strategy and may vary in the future. Current and future portfolio holdings are subject to risk.
ABOUT DERIVATIVES
Derivatives are an increasingly common type of investment instrument, the performance of which is derived from an underlying security, index, currency, or other area of the capital markets. Derivatives employed by the fund’s managers generally serve one of two main purposes: to implement a strategy that may be difficult or more expensive to invest in through traditional securities, or to hedge unwanted risk associated with a particular position.
For example, the fund’s managers might use currency forward contracts to capitalize on an anticipated change in exchange rates between two currencies. This approach would require a significantly smaller outlay of capital than purchasing traditional bonds denominated in the underlying currencies. In another example, the managers may identify a bond that they believe is undervalued relative to its risk of default, but may seek to reduce the interest-rate risk of that bond by using interest-rate swaps, a derivative through which two parties “swap” payments based on the movement of certain rates.
Like any other investment, derivatives may not appreciate in value and may lose money. Derivatives may amplify traditional investment risks through the creation of leverage and may be less liquid than traditional securities. And because derivatives typically represent contractual agreements between two financial institutions, derivatives entail “counterparty risk,” which is the risk that the other party is unable or unwilling to pay. Putnam monitors the counterparty risks we assume. For example, Putnam often enters into collateral agreements that require the counterparties to post collateral on a regular basis to cover their obligations to the fund. Counterparty risk for exchange-traded futures and centrally cleared swaps is mitigated by the daily exchange of margin and other safeguards against default through their respective clearinghouses.
Your fund’s performance
This section shows your fund’s performance, price, and distribution information for periods ended October 31, 2017, the end of its most recent fiscal year. In accordance with regulatory requirements for mutual funds, we also include performance information as of the most recent calendar quarter-end and expense information taken from the fund’s current prospectus. Performance should always be considered in light of a fund’s investment strategy. Data represent past performance. Past performance does not guarantee future results. More recent returns may be less or more than those shown. Investment return and principal value will fluctuate, and you may have a gain or a loss when you sell your shares. Performance information does not reflect any deduction for taxes a shareholder may owe on fund distributions or on the redemption of fund shares. For the most recent month-end performance, please visit the Individual Investors section at putnam.com or call Putnam at 1-800-225-1581. Class R, R5, R6, and Y shares are not available to all investors. See the Terms and Definitions section in this report for definitions of the share classes offered by your fund.
Fund performance Total return for periods ended 10/31/17
| | | | | | | | |
| | Annual | | | | | | | |
| | average | | Annual | | Annual | | Annual | |
| | (life of fund) | 10 years | average | 5 years | average | 3 years | average | 1 year |
| Class A (11/1/54) | | | | | | | | |
| Before sales charge | 7.47% | 66.07% | 5.20% | 13.55% | 2.57% | 5.13% | 1.68% | 4.16% |
| After sales charge | 7.40 | 59.43 | 4.77 | 9.01 | 1.74 | 0.92 | 0.31 | –0.01 |
| Class B (3/1/93) | | | | | | | | |
| Before CDSC | 7.33 | 56.49 | 4.58 | 9.36 | 1.81 | 2.74 | 0.90 | 3.30 |
| After CDSC | 7.33 | 56.49 | 4.58 | 7.46 | 1.45 | –0.12 | –0.04 | –1.70 |
| Class C (7/26/99) | | | | | | | | |
| Before CDSC | 6.66 | 54.14 | 4.42 | 9.39 | 1.81 | 2.72 | 0.90 | 3.28 |
| After CDSC | 6.66 | 54.14 | 4.42 | 9.39 | 1.81 | 2.72 | 0.90 | 2.28 |
| Class M (12/14/94) | | | | | | | | |
| Before sales charge | 7.05 | 61.91 | 4.94 | 12.10 | 2.31 | 4.22 | 1.39 | 3.77 |
| After sales charge | 6.99 | 56.64 | 4.59 | 8.46 | 1.64 | 0.83 | 0.28 | 0.40 |
| Class R (1/21/03) | | | | | | | | |
| Net asset value | 7.20 | 61.66 | 4.92 | 12.01 | 2.29 | 4.20 | 1.38 | 3.66 |
| Class R5 (7/2/12) | | | | | | | | |
| Net asset value | 7.57 | 70.42 | 5.48 | 15.24 | 2.88 | 5.98 | 1.96 | 4.45 |
| Class R6 (7/2/12) | | | | | | | | |
| Net asset value | 7.58 | 71.15 | 5.52 | 15.58 | 2.94 | 6.27 | 2.05 | 4.45 |
| Class Y (6/16/94) | | | | | | | | |
| Net asset value | 7.57 | 69.97 | 5.45 | 14.80 | 2.80 | 5.74 | 1.88 | 4.30 |
Current performance may be lower or higher than the quoted past performance, which cannot guarantee future results. After-sales-charge returns for class A and M shares reflect the deduction of the maximum 4.00% and 3.25% sales charge, respectively, levied at the time of purchase. Class B share returns after contingent deferred sales charge (CDSC) reflect the applicable CDSC, which is 5% in the first year, declining over time to 1% in the sixth year, and is eliminated thereafter. Class C share returns after CDSC reflect a 1% CDSC for the first year that is eliminated thereafter. Class R, R5, R6, and Y shares have no initial sales charge or CDSC. Performance for class B, C, M, R, and Y shares before their inception is derived from the historical performance of class A shares, adjusted for the applicable sales charge (or CDSC) and the higher operating expenses for such shares, except for class Y shares, for which 12b-1 fees are not applicable. Performance for class R5 and R6 shares prior to their inception is derived from the historical performance
of class Y shares and has not been adjusted for the lower investor servicing fees applicable to class R5 and R6 shares; had it, returns would have been higher.
For a portion of the periods, the fund had expense limitations, without which returns would have been lower.
Class B share performance reflects conversion to class A shares after eight years.
Comparative index returns For periods ended 10/31/17
| | | | | | | | |
| | Annual | | | | | | | |
| | average | | Annual | | Annual | | Annual | |
| | (life of fund) | 10 years | average | 5 years | average | 3 years | average | 1 year |
| Bloomberg Barclays U.S. | | | | | | | | |
| Aggregate Bond Index | —† | 50.69% | 4.19% | 10.60% | 2.04% | 7.37% | 2.40% | 0.90% |
| Lipper Core Bond Funds | | | | | | | | |
| category average* | —† | 47.97 | 3.96 | 10.09 | 1.93 | 6.71 | 2.19 | 1.20 |
Index and Lipper results should be compared with fund performance before sales charge, before CDSC, or at net asset value.
* Over the 1-year, 3-year, 5-year, and 10-year periods ended 10/31/17, there were 489, 422, 379, and 295 funds, respectively, in this Lipper category.
† The fund’s benchmark, the Bloomberg Barclays U.S. Aggregate Bond Index, was introduced on 12/31/75, and the fund’s Lipper category was introduced on 12/31/59. Both post-date the inception of the fund’s class A shares.
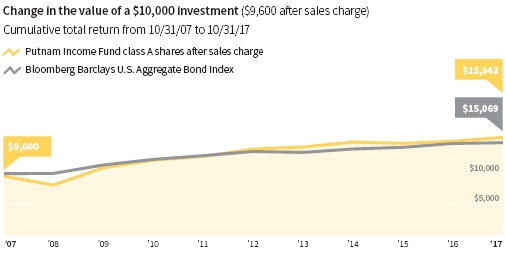
Past performance does not indicate future results. At the end of the same time period, a $10,000 investment in the fund’s class B and C shares would have been valued at $15,649 and $15,414, respectively, and no contingent deferred sales charges would apply. A $10,000 investment in the fund’s class M shares ($9,675 after sales charge) would have been valued at $15,664. A $10,000 investment in the fund’s class R, R5, R6, and Y shares would have been valued at $16,166, $17,042, $17,115, and $16,997, respectively.
Fund price and distribution information For the 12-month period ended 10/31/17
| | | | | | | | | | |
| Distributions | Class A | Class B | Class C | Class M | Class R | ClassR5 | ClassR6 | Class Y |
| Number | 12 | 12 | 12 | 12 | 12 | 12 | 12 | 12 |
| Income | $0.240 | $0.191 | $0.190 | $0.228 | $0.225 | $0.263 | $0.264 | $0.254 |
| Capital gains | — | — | — | — | — | — | — | — |
| Total | $0.240 | $0.191 | $0.190 | $0.228 | $0.225 | $0.263 | $0.264 | $0.254 |
| | Before | After | Net | Net | Before | After | Net | Net | Net | Net |
| | sales | sales | asset | asset | sales | sales | asset | asset | asset | asset |
| Share value | charge | charge | value | value | charge | charge | value | value | value | value |
| 10/31/16 | $6.89 | $7.18 | $6.82 | $6.84 | $6.72 | $6.95 | $6.84 | $6.97 | $7.00 | $6.99 |
| 10/31/17 | 6.93 | 7.22 | 6.85 | 6.87 | 6.74 | 6.97 | 6.86 | 7.01 | 7.04 | 7.03 |
| | Before | After | Net | Net | Before | After | Net | Net | Net | Net |
| Current rate | sales | sales | asset | asset | sales | sales | asset | asset | asset | asset |
| (end of period) | charge | charge | value | value | charge | charge | value | value | value | value |
| Current | | | | | | | | | | |
| dividend rate1 | 3.46% | 3.32% | 2.80% | 2.79% | 3.38% | 3.27% | 3.32% | 3.77% | 3.75% | 3.58% |
| Current 30-day | | | | | | | | | | |
| SEC yield2 | N/A | 3.46 | 2.86 | 2.86 | N/A | 3.25 | 3.35 | 3.91 | 3.97 | 3.86 |
The classification of distributions, if any, is an estimate. Before-sales-charge share value and current dividend rate for class A and M shares, if applicable, do not take into account any sales charge levied at the time of purchase. After-sales-charge share value, current dividend rate, and current 30-day SEC yield, if applicable, are calculated assuming that the maximum sales charge (4.00% for class A shares and 3.25% for class M shares) was levied at the time of purchase. Final distribution information will appear on your year-end tax forms.
1 Most recent distribution, including any return of capital and excluding capital gains, annualized and divided by share price before or after sales charge at period-end.
2 Based only on investment income and calculated using the maximum offering price for each share class, in accordance with SEC guidelines.
Fund performance as of most recent calendar quarter Total return for periods ended 9/30/17
| | | | | | | | |
| | Annual | | | | | | | |
| | average | | Annual | | Annual | | Annual | |
| | (life of fund) | 10 years | average | 5 years | average | 3 years | average | 1 year |
| Class A (11/1/54) | | | | | | | | |
| Before sales charge | 7.48% | 66.99% | 5.26% | 14.57% | 2.76% | 5.16% | 1.69% | 2.96% |
| After sales charge | 7.41 | 60.31 | 4.83 | 9.99 | 1.92 | 0.95 | 0.32 | –1.16 |
| Class B (3/1/93) | | | | | | | | |
| Before CDSC | 7.34 | 57.13 | 4.62 | 10.21 | 1.96 | 2.75 | 0.91 | 2.10 |
| After CDSC | 7.34 | 57.13 | 4.62 | 8.29 | 1.60 | –0.10 | –0.03 | –2.86 |
| Class C (7/26/99) | | | | | | | | |
| Before CDSC | 6.67 | 54.76 | 4.46 | 10.23 | 1.97 | 2.75 | 0.91 | 2.23 |
| After CDSC | 6.67 | 54.76 | 4.46 | 10.23 | 1.97 | 2.75 | 0.91 | 1.24 |
| Class M (12/14/94) | | | | | | | | |
| Before sales charge | 7.05 | 62.56 | 4.98 | 12.98 | 2.47 | 4.23 | 1.39 | 2.70 |
| After sales charge | 6.99 | 57.28 | 4.63 | 9.31 | 1.80 | 0.85 | 0.28 | –0.63 |
| Class R (1/21/03) | | | | | | | | |
| Net asset value | 7.21 | 62.79 | 4.99 | 13.19 | 2.51 | 4.38 | 1.44 | 2.76 |
| Class R5 (7/2/12) | | | | | | | | |
| Net asset value | 7.58 | 71.33 | 5.53 | 16.11 | 3.03 | 6.00 | 1.96 | 3.27 |
| Class R6 (7/2/12) | | | | | | | | |
| Net asset value | 7.59 | 72.07 | 5.58 | 16.61 | 3.12 | 6.30 | 2.06 | 3.42 |
| Class Y (6/16/94) | | | | | | | | |
| Net asset value | 7.57 | 70.91 | 5.51 | 15.84 | 2.98 | 5.78 | 1.89 | 3.12 |
See the discussion following the fund performance table on page 10 for information about the calculation of fund performance.
Your fund’s expenses
As a mutual fund investor, you pay ongoing expenses, such as management fees, distribution fees (12b-1 fees), and other expenses. Using the following information, you can estimate how these expenses affect your investment and compare them with the expenses of other funds. You may also pay one-time transaction expenses, including sales charges (loads) and redemption fees, which are not shown in this section and would have resulted in higher total expenses. For more information, see your fund’s prospectus or talk to your financial representative.
Expense ratios
| | | | | | | | |
| | Class A | Class B | Class C | Class M | Class R | Class R5 | Class R6 | Class Y |
| Total annual operating | | | | | | | | |
| expenses for the fiscal year | | | | | | | | |
| ended 10/31/16 | 0.87% | 1.62% | 1.62% | 1.12% | 1.12% | 0.57% | 0.50% | 0.62% |
| Annualized expense ratio | | | | | | | | |
| for the six-month period | | | | | | | | |
| ended 10/31/17* | 0.88% | 1.63% | 1.63% | 1.13% | 1.13% | 0.58% | 0.51% | 0.63% |
Fiscal-year expense information in this table is taken from the most recent prospectus, is subject to change, and may differ from that shown for the annualized expense ratio and in the financial highlights of this report.
Expenses are shown as a percentage of average net assets.
* Expense ratios for each class are for the fund’s most recent fiscal half year. As a result of this, ratios may differ from expense ratios based on one-year data in the financial highlights.
Expenses per $1,000
The following table shows the expenses you would have paid on a $1,000 investment in each class of the fund from 5/1/17 to 10/31/17. It also shows how much a $1,000 investment would be worth at the close of the period, assuming actual returns and expenses.
| | | | | | | | |
| | Class A | Class B | Class C | Class M | Class R | Class R5 | Class R6 | Class Y |
| Expenses paid per $1,000*† | $4.49 | $8.29 | $8.29 | $5.75 | $5.76 | $2.96 | $2.60 | $3.21 |
| Ending value (after expenses) | $1,023.40 | $1,018.40 | $1,018.40 | $1,020.10 | $1,020.90 | $1,024.70 | $1,024.80 | $1,022.60 |
* Expenses for each share class are calculated using the fund’s annualized expense ratio for each class, which represents the ongoing expenses as a percentage of average net assets for the six months ended 10/31/17. The expense ratio may differ for each share class.
† Expenses are calculated by multiplying the expense ratio by the average account value for the period; then multiplying the result by the number of days in the period; and then dividing that result by the number of days in the year.
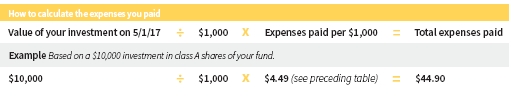
Estimate the expenses you paid
To estimate the ongoing expenses you paid for the six months ended 10/31/17, use the following calculation method. To find the value of your investment on 5/1/17, call Putnam at 1-800-225-1581.
Compare expenses using the SEC’s method
The Securities and Exchange Commission (SEC) has established guidelines to help investors assess fund expenses. Per these guidelines, the following table shows your fund’s expenses based on a $1,000 investment, assuming a hypothetical 5% annualized return. You can use this information to compare the ongoing expenses (but not transaction expenses or total costs) of investing in the fund with those of other funds. All mutual fund shareholder reports will provide this information to help you make this comparison. Please note that you cannot use this information to estimate your actual ending account balance and expenses paid during the period.
| | | | | | | | |
| | Class A | Class B | Class C | Class M | Class R | Class R5 | Class R6 | Class Y |
| Expenses paid per $1,000*† | $4.48 | $8.29 | $8.29 | $5.75 | $5.75 | $2.96 | $2.60 | $3.21 |
| Ending value (after expenses) | $1,020.77 | $1,016.99 | $1,016.99 | $1,019.51 | $1,019.51 | $1,022.28 | $1,022.63 | $1,022.03 |
* Expenses for each share class are calculated using the fund’s annualized expense ratio for each class, which represents the ongoing expenses as a percentage of average net assets for the six months ended 10/31/17. The expense ratio may differ for each share class.
† Expenses are calculated by multiplying the expense ratio by the average account value for the six-month period; then multiplying the result by the number of days in the six-month period; and then dividing that result by the number of days in the year.
Terms and definitions
Important terms
Total return shows how the value of the fund’s shares changed over time, assuming you held the shares through the entire period and reinvested all distributions in the fund.
Before sales charge, or net asset value, is the price, or value, of one share of a mutual fund, without a sales charge. Before-sales-charge figures fluctuate with market conditions, and are calculated by dividing the net assets of each class of shares by the number of outstanding shares in the class.
After sales charge is the price of a mutual fund share plus the maximum sales charge levied at the time of purchase. After-sales-charge performance figures shown here assume the 4.00% maximum sales charge for class A shares and 3.25% for class M shares.
Contingent deferred sales charge (CDSC) is generally a charge applied at the time of the redemption of class B or C shares and assumes redemption at the end of the period. Your fund’s class B CDSC declines over time from a 5% maximum during the first year to 1% during the sixth year. After the sixth year, the CDSC no longer applies. The CDSC for class C shares is 1% for one year after purchase.
Share classes
Class A shares are generally subject to an initial sales charge and no CDSC (except on certain redemptions of shares bought without an initial sales charge).
Class B shares are closed to new investments and are only available by exchange from another Putnam fund or through dividend and/or capital gains reinvestment. They are not subject to an initial sales charge and may be subject to a CDSC.
Class C shares are not subject to an initial sales charge and are subject to a CDSC only if the shares are redeemed during the first year.
Class M shares have a lower initial sales charge and a higher 12b-1 fee than class A shares and no CDSC.
Class R shares are not subject to an initial sales charge or CDSC and are only available to employer-sponsored retirement plans.
Class R5 and R6 shares are not subject to an initial sales charge or CDSC, and carry no 12b-1 fee. They are only available to employer-sponsored retirement plans.
Class Y shares are not subject to an initial sales charge or CDSC, and carry no 12b-1 fee. They are generally only available to corporate and institutional clients and clients in other approved programs.
Fixed-income terms
Current rate is the annual rate of return earned from dividends or interest of an investment. Current rate is expressed as a percentage of the price of a security, fund share, or principal investment.
Mortgage-backed security (MBS), also known as a mortgage “pass-through,” is a type of asset-backed security that is secured by a mortgage or collection of mortgages. The following are types of MBSs:
• Agency credit-risk transfer security (CRT) is backed by a reference pool of agency mortgages. Unlike a regular agency pass-through, the principal invested in a CRT is not backed by a U.S. government agency. To compensate investors for this risk, a CRT typically offers a higher yield than conventional pass-through securities. Similar to a CMBS, a CRT is structured into various tranches for investors, offering different levels of risk and yield based on the underlying reference pool.
• Agency “pass-through” has its principal and interest backed by a U.S. government agency, such as the Federal National Mortgage Association (Fannie Mae),
Government National Mortgage Association (Ginnie Mae), and Federal Home Loan Mortgage Corporation (Freddie Mac).
• Collateralized mortgage obligation (CMO) represents claims to specific cash flows from pools of home mortgages. The streams of principal and interest payments on the mortgages are distributed to the different classes of CMO interests in “tranches.” Each tranche may have different principal balances, coupon rates, prepayment risks, and maturity dates. A CMO is highly sensitive to changes in interest rates and any resulting change in the rate at which homeowners sell their properties, refinance, or otherwise prepay loans. CMOs are subject to prepayment, market, and liquidity risks.
• Interest-only (IO) security is a type of CMO in which the underlying asset is the interest portion of mortgage, Treasury, or bond payments.
• Non-agency residential mortgage-backed security (RMBS) is an MBS not backed by Fannie Mae, Ginnie Mae, or Freddie Mac. One type of RMBS is an Alt-A mortgage-backed security.
• Commercial mortgage-backed security (CMBS) is secured by the loan on a commercial property.
Yield curve is a graph that plots the yields of bonds with equal credit quality against their differing maturity dates, ranging from shortest to longest. It is used as a benchmark for other debt, such as mortgage or bank lending rates.
Comparative indexes
Bloomberg Barclays U.S. Aggregate Bond Index is an unmanaged index of U.S. investment-grade fixed-income securities.
ICE BofAML U.S. 3-Month Treasury Bill Index is an unmanaged index that seeks to measure the performance of U.S. Treasury bills available in the marketplace.
S&P 500 Index is an unmanaged index of common stock performance.
Indexes assume reinvestment of all distributions and do not account for fees. Securities and performance of a fund and an index will differ. You cannot invest directly in an index.
ICE Data Indices, LLC (“ICE BofAML”), used with permission. ICE BofAML permits use of the ICE BofAML indices and related data on an “as is” basis; makes no warranties regarding same; does not guarantee the suitability, quality, accuracy, timeliness, and/or completeness of the ICE BofAML indices or any data included in, related to, or derived therefrom, assumes no liability in connection with the use of the foregoing, and does not sponsor, endorse, or recommend Putnam Investments, or any of its products or services.
Lipper is a third-party industry-ranking entity that ranks mutual funds. Its rankings do not reflect sales charges. Lipper rankings are based on total return at net asset value relative to other funds that have similar current investment styles or objectives as determined by Lipper. Lipper may change a fund’s category assignment at its discretion. Lipper category averages reflect performance trends for funds within a category.
Other information for shareholders
Proxy voting
Putnam is committed to managing our mutual funds in the best interests of our shareholders. The Putnam funds’ proxy voting guidelines and procedures, as well as information regarding how your fund voted proxies relating to portfolio securities during the 12-month period ended June 30, 2017, are available in the Individual Investors section of putnam.com, and on the Securities and Exchange Commission (SEC) website, www.sec.gov. If you have questions about finding forms on the SEC’s website, you may call the SEC at 1-800-SEC-0330. You may also obtain the Putnam funds’ proxy voting guidelines and procedures at no charge by calling Putnam’s Shareholder Services at 1-800-225-1581.
Fund portfolio holdings
The fund will file a complete schedule of its portfolio holdings with the SEC for the first and third quarters of each fiscal year on Form N-Q. Shareholders may obtain the fund’s Form N-Q on the SEC’s website at www.sec.gov. In addition, the fund’s Form N-Q may be reviewed and copied at the SEC’s Public Reference Room in Washington, D.C. You may call the SEC at 1-800-SEC-0330 for information about the SEC’s website or the operation of the Public Reference Room.
Trustee and employee fund ownership
Putnam employees and members of the Board of Trustees place their faith, confidence, and, most importantly, investment dollars in Putnam mutual funds. As of October 31, 2017, Putnam employees had approximately $515,000,000 and the Trustees had approximately $91,000,000 invested in Putnam mutual funds. These amounts include investments by the Trustees’ and employees’ immediate family members as well as investments through retirement and deferred compensation plans.
Important notice regarding Putnam’s privacy policy
In order to conduct business with our shareholders, we must obtain certain personal information such as account holders’ names, addresses, Social Security numbers, and dates of birth. Using this information, we are able to maintain accurate records of accounts and transactions.
It is our policy to protect the confidentiality of our shareholder information, whether or not a shareholder currently owns shares of our funds. In particular, it is our policy not to sell information about you or your accounts to outside marketing firms. We have safeguards in place designed to prevent unauthorized access to our computer systems and procedures to protect personal information from unauthorized use.
Under certain circumstances, we must share account information with outside vendors who provide services to us, such as mailings and proxy solicitations. In these cases, the service providers enter into confidentiality agreements with us, and we provide only the information necessary to process transactions and perform other services related to your account. Finally, it is our policy to share account information with your financial representative, if you’ve listed one on your Putnam account.
Trustee approval of management contract
General conclusions
The Board of Trustees of The Putnam Funds oversees the management of each fund and, as required by law, determines annually whether to approve the continuance of your fund’s management contract with Putnam Investment Management, LLC (“Putnam Management”) and the sub-management contract with respect to your fund between Putnam Management and its affiliate, Putnam Investments Limited (“PIL”). The Board, with the assistance of its Contract Committee, requests and evaluates all information it deems reasonably necessary under the circumstances in connection with its annual contract review. The Contract Committee consists solely of Trustees who are not “interested persons” (as this term is defined in the Investment Company Act of 1940, as amended (the “1940 Act”)) of The Putnam Funds (“Independent Trustees”).
At the outset of the review process, members of the Board’s independent staff and independent legal counsel discussed with representatives of Putnam Management the annual contract review materials furnished to the Contract Committee during the course of the previous year’s review, identifying possible changes in these materials that might be necessary or desirable for the coming year. Following these discussions and in consultation with the Contract Committee, the Independent Trustees’ independent legal counsel requested that Putnam Management and its affiliates furnish specified information, together with any additional information that Putnam Management considered relevant, to the Contract Committee. Over the course of several months ending in June 2017, the Contract Committee met on a number of occasions with representatives of Putnam Management, and separately in executive session, to consider the information that Putnam Management provided. Throughout this process, the Contract Committee was assisted by the members of the Board’s independent staff and by independent legal counsel for The Putnam Funds and the Independent Trustees.
In May 2017, the Contract Committee met in executive session to discuss and consider its recommendations with respect to the continuance of the contracts. At the Trustees’ June 2017 meeting, the Contract Committee met in executive session with the other Independent Trustees to review a summary of the key financial, performance and other data that the Contract Committee considered in the course of its review. The Contract Committee then presented its written report, which summarized the key factors that the Committee had considered and set forth its recommendations. The Contract Committee recommended, and the Independent Trustees approved, the continuance of your fund’s management and sub-management contracts, effective July 1, 2017. (Because PIL is an affiliate of Putnam Management and Putnam Management remains fully responsible for all services provided by PIL, the Trustees have not attempted to evaluate PIL as a separate entity, and all subsequent references to Putnam Management below should be deemed to include reference to PIL as necessary or appropriate in the context.)
The Independent Trustees’ approval was based on the following conclusions:
• That the fee schedule in effect for your fund represented reasonable compensation in light of the nature and quality of the services being provided to the fund, the fees paid by competitive funds, the costs incurred by Putnam Management in providing services to the fund, and the continued application of certain reductions and waivers noted below; and
• That the fee schedule in effect for your fund represented an appropriate sharing between fund shareholders and Putnam Management of such economies of scale as may exist in the management of the fund at current asset levels.
These conclusions were based on a comprehensive consideration of all information provided to the Trustees and were not the result of any single factor. Some of the factors that figured particularly in the Trustees’ deliberations and how the Trustees considered these factors are described below, although individual Trustees may have evaluated the information presented differently, giving different weights to various factors. It is also important to recognize that the management arrangements for your fund and the other Putnam funds are the result of many years of review and discussion between the Independent Trustees and Putnam Management, that some aspects of the arrangements may receive greater scrutiny in some years than others, and that the Trustees’ conclusions may be based, in part, on their consideration of fee arrangements in previous
years. For example, with some minor exceptions, the funds’ current fee arrangements under the management contracts were first implemented at the beginning of 2010 following extensive review by the Contract Committee and discussions with representatives of Putnam Management, as well as approval by shareholders.
Management fee schedules and total expenses
The Trustees reviewed the management fee schedules in effect for all Putnam funds, including fee levels and breakpoints. The Trustees also reviewed the total expenses of each Putnam fund, recognizing that in most cases management fees represented the major, but not the sole, determinant of total costs to fund shareholders. (In a few instances, funds have implemented so-called “all-in” management fees covering substantially all routine fund operating costs.)
In reviewing fees and expenses, the Trustees generally focus their attention on material changes in circumstances — for example, changes in assets under management, changes in a fund’s investment strategy, changes in Putnam Management’s operating costs or profitability, or changes in competitive practices in the mutual fund industry — that suggest that consideration of fee changes might be warranted. The Trustees concluded that the circumstances did not indicate that changes to the management fee structure for your fund would be appropriate at this time.
Under its management contract, your fund has the benefit of breakpoints in its management fee schedule that provide shareholders with economies of scale in the form of reduced fee rates as assets under management in the Putnam family of funds increase. The Trustees concluded that the fee schedule in effect for your fund represented an appropriate sharing of economies of scale between fund shareholders and Putnam Management.
As in the past, the Trustees also focused on the competitiveness of each fund’s total expense ratio. In order to support the effort to have fund expenses meet competitive standards, the Trustees and Putnam Management have implemented certain expense limitations that were in effect during your fund’s fiscal year ending in 2016. These expense limitations were: (i) a contractual expense limitation applicable to specified retail open-end funds, including your fund, of 25 basis points (until September 1, 2016, this limitation was 32 basis points) on investor servicing fees and expenses and (ii) a contractual expense limitation applicable to specified open-end funds, including your fund, of 20 basis points on so-called “other expenses” (i.e., all expenses exclusive of management fees, distribution fees, investor servicing fees, investment-related expenses, interest, taxes, brokerage commissions, acquired fund fees and expenses and extraordinary expenses). These expense limitations attempt to maintain competitive expense levels for the funds. Most funds, including your fund, had sufficiently low expenses that these expense limitations were not operative during their fiscal years ending in 2016. Putnam Management has agreed to maintain these expense limitations until at least February 28, 2019. Putnam Management’s support for these expense limitation arrangements was an important factor in the Trustees’ decision to approve the continuance of your fund’s management and sub-management contracts.
The Trustees reviewed comparative fee and expense information for a custom group of competitive funds selected by Broadridge Financial Solutions, Inc. (“Broadridge”). This comparative information included your fund’s percentile ranking for effective management fees and total expenses (excluding any applicable 12b-1 fee), which provides a general indication of your fund’s relative standing. In the custom peer group, your fund ranked in the second quintile in effective management fees (determined for your fund and the other funds in the custom peer group based on fund asset size and the applicable contractual management fee schedule) and in the fourth quintile in total expenses (excluding any applicable 12b-1 fees) as of December 31, 2016. The first quintile represents the least expensive funds and the fifth quintile the most expensive funds. The fee and expense data reported by Broadridge as of December 31, 2016 reflected the most recent fiscal year-end data available in Broadridge’s database at that time.
In connection with their review of fund management fees and total expenses, the Trustees also reviewed the costs of the services provided and the profits realized by Putnam Management and its affiliates from their contractual relationships with the funds. This information included trends in revenues, expenses and profitability of Putnam Management and its affiliates relating to the investment management, investor servicing and distribution services provided to the funds. In this regard, the Trustees also reviewed an analysis of
Putnam Management’s revenues, expenses and profitability, allocated on a fund-by-fund basis, with respect to the funds’ management, distribution, and investor servicing contracts. For each fund, the analysis presented information about revenues, expenses and profitability for each of the agreements separately and for the agreements taken together on a combined basis. The Trustees concluded that, at current asset levels, the fee schedules in place represented reasonable compensation for the services being provided and represented an appropriate sharing between fund shareholders and Putnam Management of such economies of scale as may exist in the management of the Putnam funds at that time.
The information examined by the Trustees in connection with their annual contract review for the Putnam funds included information regarding fees charged by Putnam Management and its affiliates to institutional clients, including defined benefit pension and profit-sharing plans, charities, college endowments, foundations, sub-advised third-party mutual funds, state, local and non-U.S. government entities, and corporations. This information included, in cases where an institutional product’s investment strategy corresponds with a fund’s strategy, comparisons of those fees with fees charged to the Putnam funds, as well as an assessment of the differences in the services provided to these different types of clients as compared to the services provided to the Putnam Funds. The Trustees observed that the differences in fee rates between these clients and the Putnam funds are by no means uniform when examined by individual asset sectors, suggesting that differences in the pricing of investment management services to these types of clients may reflect, among other things, historical competitive forces operating in separate markets. The Trustees considered the fact that in many cases fee rates across different asset classes are higher on average for mutual funds than for institutional clients, as well as the differences between the services that Putnam Management provides to the Putnam funds and those that it provides to its other clients. The Trustees did not rely on these comparisons to any significant extent in concluding that the management fees paid by your fund are reasonable.
Investment performance
The quality of the investment process provided by Putnam Management represented a major factor in the Trustees’ evaluation of the quality of services provided by Putnam Management under your fund’s management contract. The Trustees were assisted in their review of the Putnam funds’ investment process and performance by the work of the investment oversight committees of the Trustees, which meet on a regular basis with the funds’ portfolio teams and with the Chief Investment Officers and other senior members of Putnam Management’s Investment Division throughout the year. In addition, in response to a request from the Independent Trustees, Putnam Management provided the Trustees with in-depth presentations regarding each of the equity and fixed income investment teams, including the operation of the teams and their investment approaches. The Trustees concluded that Putnam Management generally provides a high-quality investment process — based on the experience and skills of the individuals assigned to the management of fund portfolios, the resources made available to them, and in general Putnam Management’s ability to attract and retain high-quality personnel — but also recognized that this does not guarantee favorable investment results for every fund in every time period.
The Trustees considered that 2016 was a challenging year for the performance of the Putnam funds, with generally disappointing results for the international and global equity funds and taxable fixed income funds, mixed results for small-cap equity, Spectrum, global asset allocation, equity research and tax exempt fixed income funds, but generally strong results for U.S. equity funds. The Trustees noted, however, that they were encouraged by the positive performance trend since mid-year 2016 across most Putnam Funds. In particular, from May 1, 2016 through April 30, 2017, 51% of Putnam Fund assets were in the top quartile and 87% were above the median of the Putnam Funds’ competitive industry rankings. They noted that the longer-term performance of the Putnam funds generally continued to be strong, exemplified by the fact that the Putnam funds were ranked by the Barron’s/Lipper Fund Families survey as the 5th-best performing mutual fund complex out of 54 complexes for the five-year period ended December 31, 2016. In addition, while the survey ranked the Putnam Funds 52nd out of 61 mutual fund complexes for the one-year period ended 2016, the Putnam Funds have ranked 1st or 2nd in the survey for the one-year period three times since 2009 (most recently in 2013). They also
noted, however, the disappointing investment performance of some funds for periods ended December 31, 2016 and considered information provided by Putnam Management regarding the factors contributing to the underperformance and actions being taken to improve the performance of these particular funds. The Trustees indicated their intention to continue to monitor closely the performance of those funds, including the effectiveness of any efforts Putnam Management has undertaken to address underperformance and whether additional actions to address areas of underperformance are warranted.
For purposes of the Trustees’ evaluation of the Putnam Funds’ investment performance, the Trustees generally focus on a competitive industry ranking of each fund’s total net return over a one-year, three-year and five-year period. For a number of Putnam funds with relatively unique investment mandates for which Putnam Management informed the Trustees that meaningful competitive performance rankings are not considered to be available, the Trustees evaluated performance based on their total gross and net returns and, in most cases, comparisons of those returns with the returns of selected investment benchmarks. In the case of your fund, the Trustees considered that its class A share cumulative total return performance at net asset value was in the following quartiles of its Lipper Inc. (“Lipper”) peer group (Lipper Core Bond Funds) for the one-year, three-year and five-year periods ended December 31, 2016 (the first quartile representing the best-performing funds and the fourth quartile the worst-performing funds):
| |
| One-year period | 4th |
| Three-year period | 4th |
| Five-year period | 1st |
For the five-year period ended December 31, 2016, your fund’s performance was in the top decile of its Lipper peer group. Over the one-year, three-year and five-year periods ended December 31, 2016, there were 507, 444 and 399 funds, respectively, in your fund’s Lipper peer group. (When considering performance information, shareholders should be mindful that past performance is not a guarantee of future results.)
The Trustees expressed concern about your fund’s fourth quartile performance over the one-year and three-year periods ended December 31, 2016 and considered the circumstances that may have contributed to this disappointing performance. The Trustees considered Putnam Management’s observation that the fund’s underperformance over the one-year and three-year periods was largely attributable to the fund’s relative emphasis on shorter duration investments (which reduced the fund’s sensitivity to interest rate changes but detracted from performance, particularly during January and February 2016). The Trustees also noted Putnam Management’s view that some of the fund’s mortgage-related investments were negatively impacted by market reactions to the unexpected outcomes of the U.K.’s vote to leave the European Union and the U.S. elections.
The Trustees observed that the fund had delivered top decile returns for the period from July 2016 through January 2017 and for the five-year period ended December 31, 2016. In addition, the Trustees noted that during the second half of 2016 and into 2017, the fund’s emphasis on shorter duration investments had been beneficial. The Trustees considered that Putnam Management remained confident in the fund’s portfolio managers. The Trustees also considered Putnam Management’s continued efforts to support fund performance through the appointment of an additional portfolio manager in February 2017 and through initiatives including structuring compensation for portfolio managers and research analysts to enhance accountability for fund performance, emphasizing accountability in the portfolio management process, and affirming its commitment to a fundamental-driven approach to investing. The Trustees noted further that Putnam Management continued to strengthen its fundamental research capabilities by adding new investment personnel.
As a general matter, the Trustees believe that cooperative efforts between the Trustees and Putnam Management represent the most effective way to address investment performance concerns that may arise from time to time. The Trustees noted that investors in the Putnam funds have, in effect, placed their trust in the Putnam organization, under the oversight of the funds’ Trustees, to make appropriate decisions regarding the management of the funds. Based on Putnam Management’s willingness to take appropriate measures to address fund performance issues and Putnam Management’s responsiveness to Trustee concerns about investment performance, the Trustees concluded that it continues to be advisable to seek change within Putnam Management to address performance shortcomings. In the Trustees’ view, the alternative of engaging a new investment adviser for an underperforming fund
would entail significant disruptions and would not likely provide any greater assurance of improved investment performance.
Brokerage and soft-dollar allocations; investor servicing
The Trustees considered various potential benefits that Putnam Management may receive in connection with the services it provides under the management contract with your fund. These include benefits related to brokerage allocation and the use of soft dollars, whereby a portion of the commissions paid by a fund for brokerage may be used to acquire research services that are expected to be useful to Putnam Management in managing the assets of the fund and of other clients. Subject to policies established by the Trustees, soft dollars generated by these means are used predominantly to acquire brokerage and research services (including third-party research and market data) that enhance Putnam Management’s investment capabilities and supplement Putnam Management’s internal research efforts. However, the Trustees noted that a portion of available soft dollars continues to be used to pay fund expenses. The Trustees indicated their continued intent to monitor regulatory and industry developments in this area with the assistance of their Brokerage Committee, including any developments with respect to the European Union’s updated Markets in Financial Instruments Directive and its potential impact on PIL’s use of client commissions to obtain investment research. The Trustees also indicated their continued intent to monitor the allocation of the Putnam funds’ brokerage in order to ensure that the principle of seeking best price and execution remains paramount in the portfolio trading process.
Putnam Management may also receive benefits from payments that the funds make to Putnam Management’s affiliates for investor or distribution services. In conjunction with the annual review of your fund’s management and sub-management contracts, the Trustees reviewed your fund’s investor servicing agreement with Putnam Investor Services, Inc. (“PSERV”) and its distributor’s contracts and distribution plans with Putnam Retail Management Limited Partnership (“PRM”), both of which are affiliates of Putnam Management. The Trustees concluded that the fees payable by the funds to PSERV and PRM, as applicable, for such services are fair and reasonable in relation to the nature and quality of such services, the fees paid by competitive funds, and the costs incurred by PSERV and PRM, as applicable, in providing such services. Furthermore, the Trustees were of the view that the services provided were required for the operation of the funds, and that they were of a quality at least equal to those provided by other providers.
Financial statements
These sections of the report, as well as the accompanying Notes, preceded by the Report of Independent Registered Public Accounting Firm, constitute the fund’s financial statements.
The fund’s portfolio lists all the fund’s investments and their values as of the last day of the reporting period. Holdings are organized by asset type and industry sector, country, or state to show areas of concentration and diversification.
Statement of assets and liabilities shows how the fund’s net assets and share price are determined. All investment and non-investment assets are added together. Any unpaid expenses and other liabilities are subtracted from this total. The result is divided by the number of shares to determine the net asset value per share, which is calculated separately for each class of shares. (For funds with preferred shares, the amount subtracted from total assets includes the liquidation preference of preferred shares.)
Statement of operations shows the fund’s net investment gain or loss. This is done by first adding up all the fund’s earnings — from dividends and interest income — and subtracting its operating expenses to determine net investment income (or loss). Then, any net gain or loss the fund realized on the sales of its holdings — as well as any unrealized gains or losses over the period — is added to or subtracted from the net investment result to determine the fund’s net gain or loss for the fiscal year.
Statement of changes in net assets shows how the fund’s net assets were affected by the fund’s net investment gain or loss, by distributions to shareholders, and by changes in the number of the fund’s shares. It lists distributions and their sources (net investment income or realized capital gains) over the current reporting period and the most recent fiscal year-end. The distributions listed here may not match the sources listed in the Statement of operations because the distributions are determined on a tax basis and may be paid in a different period from the one in which they were earned.
Financial highlights provide an overview of the fund’s investment results, per-share distributions, expense ratios, net investment income ratios, and portfolio turnover in one summary table, reflecting the five most recent reporting periods. In a semiannual report, the highlights table also includes the current reporting period.
Report of Independent Registered Public Accounting Firm
The Board of Trustees and Shareholders
Putnam Income Fund:
We have audited the accompanying statement of assets and liabilities of Putnam Income Fund (the fund), including the fund’s portfolio, as of October 31, 2017, and the related statement of operations for the year then ended, the statements of changes in net assets for each of the years in the two-year period then ended, and the financial highlights for each of the years in the five-year period then ended. These financial statements and financial highlights are the responsibility of the fund’s management. Our responsibility is to express an opinion on these financial statements and financial highlights based on our audits.
We conducted our audits in accordance with standards of the Public Company Accounting Oversight Board (United States). Those standards require that we plan and perform the audit to obtain reasonable assurance about whether the financial statements and financial highlights are free of material misstatement. An audit includes examining, on a test basis, evidence supporting the amounts and disclosures in the financial statements. Our procedures included confirmation of securities owned as of October 31, 2017, by correspondence with the custodian and brokers or by other appropriate auditing procedures. An audit also includes assessing the accounting principles used and significant estimates made by management, as well as evaluating the overall financial statement presentation. We believe that our audits provide a reasonable basis for our opinion.
In our opinion, the financial statements and financial highlights referred to above present fairly, in all material respects, the financial position of Putnam Income Fund as of October 31, 2017, the results of its operations for the year then ended, the changes in its net assets for each of the years in the two-year period then ended, and the financial highlights for each of the years in the five-year period then ended, in conformity with U.S. generally accepted accounting principles.

Boston, Massachusetts
December 12, 2017
The fund’s portfolio 10/31/17
| | |
| U.S. GOVERNMENT AND AGENCY | Principal | |
| MORTGAGE OBLIGATIONS (85.8%)* | amount | Value |
| U.S. Government Guaranteed Mortgage Obligations (13.9%) | | |
| Government National Mortgage Association Pass-Through Certificates | | |
| 5.00%, with due dates from 7/20/41 to 9/20/42 | $3,219,584 | $3,537,066 |
| 5.00%, TBA, 11/1/47 | 2,000,000 | 2,143,906 |
| 4.70%, 6/20/65 | 24,818 | 27,162 |
| 4.666%, 5/20/65 | 264,554 | 288,845 |
| 4.65%, 6/20/65 | 145,351 | 158,924 |
| 4.591%, 6/20/65 | 41,337 | 44,956 |
| 4.571%, 5/20/65 | 49,865 | 54,401 |
| 4.53%, 8/20/65 | 76,336 | 82,981 |
| 4.50%, with due dates from 5/20/44 to 4/20/46 | 3,791,258 | 4,104,721 |
| 4.50%, TBA, 11/1/47 | 35,000,000 | 37,097,267 |
| 4.499%, 6/20/65 | 39,197 | 42,662 |
| 4.495%, 5/20/65 | 1,064,974 | 1,156,189 |
| 4.471%, 5/20/65 | 78,302 | 84,757 |
| 4.403%, 6/20/65 | 24,651 | 26,718 |
| 4.00%, with due dates from 9/20/40 to 3/20/46 | 9,873,957 | 10,505,333 |
| 4.00%, TBA, 11/1/47 | 61,000,000 | 64,054,764 |
| 3.500%, 4/20/46 i | 36,026 | 37,480 |
| 3.50%, with due dates from 9/15/42 to 2/20/47 | 16,364,072 | 17,042,354 |
| 3.50%, TBA, 11/1/47 | 32,000,000 | 33,195,002 |
| 3.00%, with due dates from 3/20/43 to 10/20/46 | 2,600,804 | 2,633,043 |
| 3.00%, TBA, 11/1/47 | 40,000,000 | 40,471,876 |
| | | 216,790,407 |
| U.S. Government Agency Mortgage Obligations (71.9%) | | |
| Federal Home Loan Mortgage Corporation Pass-Through Certificates | | |
| 5.00%, 3/1/41 | 608,621 | 670,006 |
| 4.50%, with due dates from 7/1/44 to 3/1/45 | 1,737,448 | 1,876,550 |
| 4.00%, with due dates from 12/1/44 to 9/1/45 | 11,801,002 | 12,464,324 |
| 3.50%, with due dates from 4/1/42 to 11/1/47 | 26,874,578 | 27,728,388 |
| 3.50%, TBA, 11/1/47 | 2,000,000 | 2,055,938 |
| 3.00%, 10/1/46 | 3,715,988 | 3,729,052 |
| 2.50%, 4/1/43 | 793,002 | 772,155 |
| Federal National Mortgage Association Pass-Through Certificates | | |
| 6.00%, with due dates from 2/1/36 to 5/1/41 | 4,438,279 | 5,023,231 |
| 6.00%, TBA, 11/1/47 | 2,000,000 | 2,245,156 |
| 5.50%, with due dates from 1/1/33 to 2/1/35 | 733,895 | 815,751 |
| 5.00%, with due dates from 3/1/40 to 1/1/44 | 2,248,566 | 2,446,612 |
| 4.50%, with due dates from 2/1/41 to 10/1/46 | 11,664,529 | 12,558,276 |
| 4.50%, TBA, 11/1/47 | 28,000,000 | 29,935,937 |
| 4.00%, with due dates from 8/1/44 to 7/1/56 | 19,572,469 | 20,691,981 |
| 4.00%, TBA, 11/1/47 | 7,000,000 | 7,346,718 |
| 4.00%, 5/1/43 | 2,173,700 | 2,301,065 |
| 3.50%, with due dates from 5/1/42 to 6/1/56 | 31,884,827 | 32,886,843 |
| 3.50%, 6/1/31 | 885,423 | 928,691 |
| 3.50%, TBA, 12/1/47 | 356,000,000 | 365,303,277 |
| 3.50%, TBA, 11/1/47 | 356,000,000 | 365,929,054 |
| 3.00%, with due dates from 9/1/42 to 3/1/47 | 20,862,493 | 20,980,570 |
| | |
| U.S. GOVERNMENT AND AGENCY | Principal | |
| MORTGAGE OBLIGATIONS (85.8%)* cont. | amount | Value |
| U.S. Government Agency Mortgage Obligations cont. | | |
| Federal National Mortgage Association Pass-Through Certificates | | |
| 3.500%, 11/1/42 i | $692,019 | $695,270 |
| 3.00%, TBA, 12/1/47 | 23,000,000 | 22,977,538 |
| 3.00%, TBA, 11/1/47 | 111,000,000 | 111,069,375 |
| 2.50%, TBA, 11/1/47 | 76,000,000 | 73,381,564 |
| | | 1,126,813,322 |
| Total U.S. government and agency mortgage obligations (cost $1,347,044,814) | $1,343,603,729 |
| | |
| | Principal | |
| U.S. TREASURY OBLIGATIONS (—%)* | amount | Value |
| U.S. Treasury Notes 2.00%, 9/30/20 ∆ § | $429,000 | $432,285 |
| Total U.S. treasury obligations (cost $428,884) | | $432,285 |
| | |
| | Principal | |
| MORTGAGE-BACKED SECURITIES (47.4%)* | amount | Value |
| Agency collateralized mortgage obligations (17.8%) | | |
| Bellemeade Re, Ltd. 144A FRB Ser. 17-1, Class M1, 1 Month | | |
| US LIBOR + 1.70%, 2.738%, 10/25/27 (Bermuda) | $4,200,000 | $4,207,875 |
| Federal Home Loan Mortgage Corporation | | |
| IFB Ser. 3408, Class EK (-4.024 x 1 Month US LIBOR) + 25.79%, | | |
| 20.808%, 4/15/37 | 744,485 | 1,125,255 |
| IFB Ser. 2976, Class LC (-3.667 x 1 Month US LIBOR) + 24.42%, | | |
| 19.877%, 5/15/35 | 96,837 | 139,636 |
| IFB Ser. 3249, Class PS (-3.3 x 1 Month US LIBOR) + 22.28%, | | |
| 18.187%, 12/15/36 | 223,932 | 309,714 |
| IFB Ser. 3065, Class DC (-3 x 1 Month US LIBOR) + 19.86%, | | |
| 16.143%, 3/15/35 | 590,931 | 843,161 |
| IFB Ser. 2990, Class LB (-2.556 x 1 Month US LIBOR) + 16.95%, | | |
| 13.779%, 6/15/34 | 410,744 | 485,924 |
| Structured Agency Credit Risk Debt FRN Ser. 15-DN1, Class M3, | | |
| 1 Month US LIBOR + 4.15%, 5.388%, 1/25/25 | 8,233,285 | 8,867,241 |
| IFB Ser. 3852, Class NT (-1 x 1 Month US LIBOR) + 6.00%, | | |
| 4.761%, 5/15/41 | 1,499,629 | 1,479,174 |
| Ser. 4132, Class IP, IO, 4.50%, 11/15/42 | 5,858,279 | 938,666 |
| Ser. 4122, Class TI, IO, 4.50%, 10/15/42 | 2,397,301 | 464,690 |
| Ser. 4018, Class DI, IO, 4.50%, 7/15/41 | 2,607,513 | 364,381 |
| Ser. 3707, Class PI, IO, 4.50%, 7/15/25 | 1,145,017 | 77,960 |
| Ser. 4546, Class TI, IO, 4.00%, 12/15/45 | 16,355,755 | 2,616,921 |
| Ser. 4500, Class GI, IO, 4.00%, 8/15/45 | 12,779,029 | 2,376,644 |
| Ser. 4121, Class MI, IO, 4.00%, 10/15/42 | 16,345,767 | 3,085,263 |
| Ser. 4116, Class MI, IO, 4.00%, 10/1/42 | 6,355,698 | 1,212,025 |
| Structured Agency Credit Risk Debt FRN Ser. 15-DNA2, Class M2, | | |
| 1 Month US LIBOR + 2.60%, 3.838%, 12/25/27 | 3,359,129 | 3,431,686 |
| Ser. 4165, Class AI, IO, 3.50%, 2/15/43 | 11,240,479 | 1,844,675 |
| Structured Agency Credit Risk Debt FRN Ser. 16-DNA2, Class M2, | | |
| 1 Month US LIBOR + 2.20%, 3.438%, 10/25/28 | 1,100,000 | 1,114,698 |
| Structured Agency Credit Risk Debt FRN Ser. 15-HQ1, Class M2, | | |
| 1 Month US LIBOR + 2.20%, 3.438%, 3/25/25 | 690,351 | 694,548 |
| Ser. 4182, Class GI, IO, 3.00%, 1/15/43 | 18,001,977 | 1,397,650 |
| Ser. 4141, Class PI, IO, 3.00%, 12/15/42 | 6,755,620 | 767,371 |
| | |
| | Principal | |
| MORTGAGE-BACKED SECURITIES (47.4%)* cont. | amount | Value |
| Agency collateralized mortgage obligations cont. | | |
| Federal Home Loan Mortgage Corporation | | |
| Ser. 4158, Class TI, IO, 3.00%, 12/15/42 | $16,014,857 | $1,624,707 |
| Ser. 4176, Class DI, IO, 3.00%, 12/15/42 | 18,660,075 | 1,930,945 |
| Ser. 4171, Class NI, IO, 3.00%, 6/15/42 | 10,176,863 | 1,030,306 |
| Ser. 4183, Class MI, IO, 3.00%, 2/15/42 | 5,848,177 | 536,863 |
| Ser. 4201, Class JI, IO, 3.00%, 12/15/41 | 17,224,864 | 1,460,610 |
| Ser. 4206, Class IP, IO, 3.00%, 12/15/41 | 7,549,305 | 729,183 |
| Ser. 4004, IO, 3.00%, 3/15/26 | 9,306,920 | 501,773 |
| Structured Agency Credit Risk Debt FRN Ser. 16-DNA2, Class M1, | | |
| 1 Month US LIBOR + 1.25%, 2.488%, 10/25/28 | 329,093 | 329,307 |
| Structured Agency Credit Risk Debt FRN Ser. 16-HQA2, Class M1, | | |
| 1 Month US LIBOR + 1.20%, 2.438%, 11/25/28 | 824,605 | 825,836 |
| Ser. 315, PO, zero %, 9/15/43 | 15,144,757 | 12,404,589 |
| Ser. 3835, Class FO, PO, zero %, 4/15/41 | 5,212,103 | 4,477,655 |
| Ser. 3369, Class BO, PO, zero %, 9/15/37 | 12,522 | 10,439 |
| Ser. 3391, PO, zero %, 4/15/37 | 115,962 | 98,520 |
| Ser. 3300, PO, zero %, 2/15/37 | 154,105 | 133,239 |
| Ser. 3206, Class EO, PO, zero %, 8/15/36 | 8,763 | 7,694 |
| Ser. 3175, Class MO, PO, zero %, 6/15/36 | 30,105 | 25,223 |
| Ser. 3210, PO, zero %, 5/15/36 | 24,909 | 22,638 |
| Ser. 3326, Class WF, zero %, 10/15/35 W | 12,144 | 9,072 |
| FRB Ser. 3117, Class AF, 1 Month US LIBOR + 0.00%, | | |
| zero %, 2/15/36 | 14,236 | 10,863 |
| Federal National Mortgage Association | | |
| IFB Ser. 06-62, Class PS (-6 x 1 Month US LIBOR) + 39.90%, | | |
| 32.473%, 7/25/36 | 374,884 | 670,695 |
| IFB Ser. 06-8, Class HP (-3.667 x 1 Month US LIBOR) + 24.57%, | | |
| 20.028%, 3/25/36 | 369,868 | 562,517 |
| IFB Ser. 05-122, Class SE (-3.5 x 1 Month US LIBOR) + 23.10%, | | |
| 18.767%, 11/25/35 | 601,831 | 801,457 |
| IFB Ser. 05-75, Class GS (-3 x 1 Month US LIBOR) + 20.25%, | | |
| 16.536%, 8/25/35 | 181,762 | 233,213 |
| IFB Ser. 05-106, Class JC (-3.101 x 1 Month US LIBOR) + 20.12%, | | |
| 16.286%, 12/25/35 | 463,574 | 669,777 |
| IFB Ser. 05-83, Class QP (-2.6 x 1 Month US LIBOR) + 17.39%, | | |
| 14.176%, 11/25/34 | 74,030 | 89,468 |
| IFB Ser. 11-4, Class CS (-2 x 1 Month US LIBOR) + 12.90%, | | |
| 10.424%, 5/25/40 | 713,580 | 824,892 |
| Connecticut Avenue Securities FRB Ser. 14-C04, Class 1M2, | | |
| 1 Month US LIBOR + 4.90%, 6.138%, 11/25/24 | 4,400,628 | 4,993,657 |
| Ser. 15-3, Class BI, IO, 4.00%, 3/25/44 | 8,896,830 | 1,060,556 |
| Ser. 12-124, Class UI, IO, 4.00%, 11/25/42 | 13,928,452 | 2,827,127 |
| Ser. 12-118, Class PI, IO, 4.00%, 6/25/42 | 13,516,607 | 2,304,488 |
| Ser. 12-62, Class EI, IO, 4.00%, 4/25/41 | 8,983,685 | 1,177,151 |
| Ser. 12-22, Class CI, IO, 4.00%, 3/25/41 | 8,285,155 | 1,128,711 |
| Ser. 15-10, Class AI, IO, 3.50%, 8/25/43 | 16,103,585 | 2,297,115 |
| Ser. 13-18, Class IN, IO, 3.50%, 3/25/43 | 5,570,889 | 739,376 |
| Ser. 14-10, IO, 3.50%, 8/25/42 | 8,070,445 | 1,278,060 |
| Ser. 12-128, Class QI, IO, 3.50%, 6/25/42 | 10,923,248 | 1,198,902 |
| Ser. 12-101, Class PI, IO, 3.50%, 8/25/40 | 13,161,133 | 1,474,810 |
| | |
| | Principal | |
| MORTGAGE-BACKED SECURITIES (47.4%)* cont. | amount | Value |
| Agency collateralized mortgage obligations cont. | | |
| Federal National Mortgage Association | | |
| Ser. 14-20, Class IA, IO, 3.50%, 7/25/39 | $11,668,425 | $955,224 |
| Connecticut Avenue Securities FRB Ser. 16-C03, Class 1M1, | | |
| 1 Month US LIBOR + 2.00%, 3.238%, 10/25/28 | 2,873,865 | 2,922,478 |
| Ser. 13-55, Class IK, IO, 3.00%, 4/25/43 | 5,279,675 | 582,881 |
| Ser. 12-151, Class PI, IO, 3.00%, 1/25/43 | 7,575,150 | 843,743 |
| Ser. 12-144, Class KI, IO, 3.00%, 11/25/42 | 10,822,513 | 1,045,953 |
| Ser. 13-35, Class IP, IO, 3.00%, 6/25/42 | 5,338,525 | 416,101 |
| Ser. 13-55, Class PI, IO, 3.00%, 5/25/42 | 8,730,188 | 713,693 |
| Ser. 13-35, Class PI, IO, 3.00%, 2/25/42 | 15,154,508 | 1,226,151 |
| Ser. 13-67, Class IP, IO, 3.00%, 2/25/42 | 11,714,272 | 890,296 |
| Ser. 13-30, Class IP, IO, 3.00%, 10/25/41 | 4,340,553 | 278,403 |
| Ser. 13-23, Class LI, IO, 3.00%, 6/25/41 | 5,543,081 | 354,269 |
| Ser. 14-59, Class AI, IO, 3.00%, 10/25/40 | 12,248,602 | 1,194,447 |
| Ser. 14-28, Class AI, IO, 3.00%, 3/25/40 | 16,225,627 | 1,723,859 |
| Connecticut Avenue Securities FRB Ser. 14-C03, Class 1M1, | | |
| 1 Month US LIBOR + 1.20%, 2.438%, 7/25/24 | 6,416 | 6,420 |
| FRB Ser. 01-50, Class B1, IO, 0.403%, 10/25/41 W | 413,179 | 4,907 |
| FRB Ser. 05-W4, Class 1A, IO, 0.06%, 8/25/45 W | 120,835 | 76 |
| FRB Ser. 02-W6, Class 1A, IO, 0.012%, 6/25/42 W | 605,208 | 129 |
| Ser. 03-34, Class P1, PO, zero %, 4/25/43 | 147,913 | 122,768 |
| Ser. 07-64, Class LO, PO, zero %, 7/25/37 | 31,334 | 28,850 |
| Ser. 07-14, Class KO, PO, zero %, 3/25/37 | 134,093 | 111,615 |
| Ser. 06-125, Class OX, PO, zero %, 1/25/37 | 13,876 | 11,628 |
| Ser. 06-84, Class OT, PO, zero %, 9/25/36 | 13,143 | 11,039 |
| Ser. 06-46, Class OC, PO, zero %, 6/25/36 | 10,488 | 8,704 |
| Government National Mortgage Association | | |
| Ser. 09-79, Class IC, IO, 6.00%, 8/20/39 | 13,636,577 | 2,613,314 |
| Ser. 14-76, IO, 5.00%, 5/20/44 | 6,995,145 | 1,459,542 |
| Ser. 13-3, Class IT, IO, 5.00%, 1/20/43 | 3,278,967 | 709,057 |
| Ser. 11-116, Class IB, IO, 5.00%, 10/20/40 | 193,975 | 14,275 |
| Ser. 13-16, Class IB, IO, 5.00%, 10/20/40 | 899,392 | 70,393 |
| Ser. 10-35, Class UI, IO, 5.00%, 3/20/40 | 2,209,307 | 479,921 |
| Ser. 10-9, Class UI, IO, 5.00%, 1/20/40 | 19,439,874 | 4,229,242 |
| Ser. 09-121, Class UI, IO, 5.00%, 12/20/39 | 9,128,573 | 1,928,046 |
| IFB Ser. 13-129, Class SN, IO (-1 x 1 Month US LIBOR) + 6.15%, | | |
| 4.911%, 9/20/43 | 2,593,715 | 409,314 |
| Ser. 14-108, Class IP, IO, 4.50%, 12/20/42 | 5,674,372 | 897,232 |
| Ser. 13-20, Class QI, IO, 4.50%, 12/16/42 | 12,870,279 | 2,182,354 |
| Ser. 12-129, IO, 4.50%, 11/16/42 | 6,848,976 | 1,561,361 |
| Ser. 10-35, Class QI, IO, 4.50%, 3/20/40 | 3,354,674 | 659,365 |
| Ser. 10-9, Class QI, IO, 4.50%, 1/20/40 | 3,486,001 | 682,848 |
| Ser. 11-116, Class IA, IO, 4.50%, 10/20/39 | 2,443,482 | 220,475 |
| Ser. 13-34, Class PI, IO, 4.50%, 8/20/39 | 20,382,410 | 2,160,943 |
| Ser. 14-71, Class BI, IO, 4.50%, 5/20/29 | 10,273,436 | 1,174,665 |
| Ser. 15-149, Class KI, IO, 4.00%, 10/20/45 | 20,070,185 | 3,545,197 |
| Ser. 15-94, IO, 4.00%, 7/20/45 | 803,606 | 181,037 |
| Ser. 15-99, Class LI, IO, 4.00%, 7/20/45 | 4,475,514 | 469,310 |
| Ser. 15-60, Class IP, IO, 4.00%, 4/20/45 | 18,507,516 | 3,380,398 |
| | |
| | Principal | |
| MORTGAGE-BACKED SECURITIES (47.4%)* cont. | amount | Value |
| Agency collateralized mortgage obligations cont. | | |
| Government National Mortgage Association | | |
| Ser. 15-53, Class MI, IO, 4.00%, 4/16/45 | $18,723,095 | $4,148,420 |
| Ser. 14-2, Class IL, IO, 4.00%, 1/16/44 | 6,297,773 | 1,127,616 |
| Ser. 14-63, Class PI, IO, 4.00%, 7/20/43 | 9,704,547 | 1,373,009 |
| Ser. 15-52, Class IE, IO, 4.00%, 1/16/43 | 12,655,921 | 2,057,894 |
| Ser. 13-4, Class IC, IO, 4.00%, 9/20/42 | 14,919,941 | 3,329,996 |
| Ser. 12-56, Class IB, IO, 4.00%, 4/20/42 | 7,002,867 | 1,248,572 |
| Ser. 12-50, Class PI, IO, 4.00%, 12/20/41 | 15,699,966 | 2,370,506 |
| Ser. 14-4, Class IK, IO, 4.00%, 7/20/39 | 5,072,011 | 474,655 |
| Ser. 11-71, Class IK, IO, 4.00%, 4/16/39 | 9,275,041 | 965,328 |
| Ser. 14-162, Class DI, IO, 4.00%, 11/20/38 | 11,538,692 | 668,204 |
| Ser. 14-133, Class AI, IO, 4.00%, 10/20/36 | 11,752,827 | 1,137,715 |
| Ser. 15-69, Class XI, IO, 3.50%, 5/20/45 | 16,941,682 | 2,177,294 |
| Ser. 15-77, Class DI, IO, 3.50%, 5/20/45 | 9,771,309 | 1,419,478 |
| Ser. 16-136, Class YI, IO, 3.50%, 3/20/45 | 16,560,464 | 2,214,962 |
| Ser. 15-20, Class PI, IO, 3.50%, 2/20/45 | 10,464,819 | 1,852,200 |
| Ser. 15-24, Class CI, IO, 3.50%, 2/20/45 | 7,900,345 | 1,561,298 |
| Ser. 15-24, Class IA, IO, 3.50%, 2/20/45 | 11,373,862 | 1,720,365 |
| Ser. 13-100, Class MI, IO, 3.50%, 2/20/43 | 4,660,483 | 644,638 |
| Ser. 13-37, Class JI, IO, 3.50%, 1/20/43 | 3,866,073 | 597,888 |
| Ser. 12-145, IO, 3.50%, 12/20/42 | 6,825,175 | 1,355,411 |
| Ser. 13-27, Class PI, IO, 3.50%, 12/20/42 | 4,628,334 | 708,876 |
| Ser. 12-136, IO, 3.50%, 11/20/42 | 16,496,838 | 3,353,015 |
| Ser. 12-113, Class ID, IO, 3.50%, 9/20/42 | 22,201,917 | 4,722,237 |
| Ser. 14-46, Class JI, IO, 3.50%, 10/20/41 | 6,633,510 | 884,983 |
| Ser. 14-141, Class GI, IO, 3.50%, 6/20/41 | 10,048,924 | 1,027,509 |
| Ser. 15-36, Class GI, IO, 3.50%, 6/16/41 | 10,306,864 | 1,180,136 |
| Ser. 13-18, Class GI, IO, 3.50%, 5/20/41 | 5,828,613 | 624,373 |
| Ser. 14-102, Class IG, IO, 3.50%, 3/16/41 | 8,552,524 | 1,105,696 |
| Ser. 15-52, Class KI, IO, 3.50%, 11/20/40 | 16,993,282 | 2,240,683 |
| Ser. 12-48, Class KI, IO, 3.50%, 12/16/39 | 3,341,194 | 304,009 |
| Ser. 15-26, Class AI, IO, 3.50%, 5/20/39 | 34,475,701 | 3,421,610 |
| Ser. 15-87, Class AI, IO, 3.50%, 12/20/38 | 17,143,324 | 1,583,219 |
| Ser. 15-24, Class IC, IO, 3.50%, 11/20/37 | 11,525,819 | 1,264,071 |
| Ser. 14-100, Class JI, IO, 3.50%, 7/16/29 | 16,824,151 | 1,815,561 |
| Ser. 13-8, Class BI, IO, 3.00%, 11/20/42 | 13,574,731 | 1,952,007 |
| Ser. 13-53, Class PI, IO, 3.00%, 4/20/41 | 8,362,411 | 881,649 |
| Ser. 14-141, Class CI, IO, 3.00%, 3/20/40 | 7,900,571 | 642,751 |
| Ser. 13-23, Class IK, IO, 3.00%, 9/20/37 | 17,910,500 | 1,740,292 |
| Ser. 14-46, Class KI, IO, 3.00%, 6/20/36 | 4,937,866 | 380,428 |
| Ser. 14-30, Class KI, IO, 3.00%, 2/16/29 | 7,102,589 | 627,024 |
| Ser. 14-5, Class LI, IO, 3.00%, 1/16/29 | 7,430,448 | 649,384 |
| Ser. 13-164, Class CI, IO, 3.00%, 11/16/28 | 14,065,056 | 1,291,144 |
| Ser. 16-H23, Class NI, IO, 2.422%, 10/20/66 W | 44,463,665 | 6,060,398 |
| Ser. 16-H27, Class BI, IO, 2.353%, 12/20/66 W | 13,632,975 | 1,753,201 |
| Ser. 16-H24, Class JI, IO, 2.275%, 11/20/66 W | 16,609,689 | 2,180,022 |
| FRB Ser. 15-H16, Class XI, IO, 2.226%, 7/20/65 | 24,860,809 | 2,873,909 |
| Ser. 17-H08, Class NI, IO, 2.223%, 3/20/67 W | 16,147,870 | 2,102,453 |
| Ser. 17-H18, Class CI, IO, 2.205%, 9/20/67 W | 14,454,819 | 2,086,914 |
| | |
| | Principal | |
| MORTGAGE-BACKED SECURITIES (47.4%)* cont. | amount | Value |
| Agency collateralized mortgage obligations cont. | | |
| Government National Mortgage Association | | |
| Ser. 16-H11, Class HI, IO, 2.083%, 1/20/66 W | $37,297,967 | $4,009,531 |
| Ser. 17-H12, Class QI, IO, 2.058%, 5/20/67 W | 24,446,101 | 3,210,751 |
| Ser. 15-H25, Class CI, IO, 1.954%, 10/20/65 W | 25,798,002 | 2,788,764 |
| Ser. 15-H15, Class JI, IO, 1.951%, 6/20/65 W | 19,350,224 | 2,116,915 |
| Ser. 15-H26, Class DI, IO, 1.95%, 10/20/65 W | 20,476,673 | 2,258,577 |
| Ser. 15-H12, Class AI, IO, 1.855%, 5/20/65 W | 29,267,258 | 2,961,203 |
| Ser. 15-H20, Class AI, IO, 1.822%, 8/20/65 W | 26,713,939 | 2,700,779 |
| Ser. 15-H10, Class CI, IO, 1.811%, 4/20/65 W | 29,350,223 | 3,095,245 |
| Ser. 15-H12, Class GI, IO, 1.794%, 5/20/65 W | 37,763,593 | 3,659,292 |
| Ser. 17-H10, Class MI, IO, 1.753%, 4/20/67 W | 20,586,805 | 2,248,079 |
| Ser. 16-H02, Class HI, IO, 1.714%, 1/20/66 W | 50,249,830 | 4,924,483 |
| Ser. 16-H04, Class KI, IO, 1.708%, 2/20/66 W | 32,730,112 | 2,802,516 |
| Ser. 15-H12, Class EI, IO, 1.696%, 4/20/65 W | 29,696,291 | 2,687,514 |
| Ser. 15-H09, Class BI, IO, 1.691%, 3/20/65 W | 34,239,468 | 3,007,047 |
| Ser. 15-H04, Class AI, IO, 1.686%, 12/20/64 W | 33,129,866 | 3,064,513 |
| Ser. 15-H01, Class CI, IO, 1.641%, 12/20/64 W | 27,960,031 | 1,680,650 |
| Ser. 15-H17, Class CI, IO, 1.619%, 6/20/65 W | 29,478,706 | 1,780,985 |
| Ser. 15-H25, Class AI, IO, 1.617%, 9/20/65 W | 25,146,626 | 2,205,359 |
| Ser. 15-H14, Class BI, IO, 1.587%, 5/20/65 W | 2,459,666 | 147,073 |
| Ser. 17-H14, Class EI, IO, 1.576%, 6/20/67 W | 25,608,821 | 2,352,810 |
| Ser. 15-H28, Class DI, IO, 1.553%, 8/20/65 W | 28,708,374 | 2,136,219 |
| Ser. 14-H11, Class GI, IO, 1.489%, 6/20/64 W | 52,570,317 | 4,152,635 |
| Ser. 14-H07, Class BI, IO, 1.462%, 5/20/64 W | 41,704,064 | 3,492,715 |
| Ser. 10-H19, Class GI, IO, 1.412%, 8/20/60 W | 34,063,215 | 2,158,177 |
| IFB Ser. 11-70, Class YI, IO (-1 x 1 Month US LIBOR) + 5.00%, | | |
| 0.15%, 12/20/40 | 13,597,929 | 63,716 |
| Ser. 10-151, Class KO, PO, zero %, 6/16/37 | 271,190 | 230,067 |
| Ser. 06-36, Class OD, PO, zero %, 7/16/36 | 19,679 | 16,529 |
| | | 278,683,662 |
| Commercial mortgage-backed securities (19.8%) | | |
| Banc of America Commercial Mortgage Trust FRB Ser. 07-1, | | |
| Class XW, IO, 0.218%, 1/15/49 W | 2,262,912 | 8,499 |
| Banc of America Commercial Mortgage Trust 144A | | |
| FRB Ser. 07-5, Class XW, IO, 0.083%, 2/10/51 W | 5,267,844 | 53 |
| FRB Ser. 04-4, Class XC, IO, 0.048%, 7/10/42 W | 461,453 | 160 |
| Banc of America Merrill Lynch Commercial Mortgage, Inc. 144A | | |
| FRB Ser. 04-5, Class XC, IO, 0.428%, 11/10/41 W | 1,345,115 | 10,488 |
| FRB Ser. 05-1, Class XW, IO, zero %, 11/10/42 W | 21,901,844 | 22 |
| Bear Stearns Commercial Mortgage Securities Trust | | |
| FRB Ser. 07-T26, Class AJ, 5.531%, 1/12/45 W | 5,791,000 | 5,240,855 |
| FRB Ser. 04-PR3I, Class X1, IO, zero %, 2/11/41 W | 147,033 | 74 |
| Bear Stearns Commercial Mortgage Securities Trust 144A | | |
| FRB Ser. 06-PW11, Class B, 5.301%, 3/11/39 W | 6,785,879 | 5,304,182 |
| FRB Ser. 06-PW14, Class X1, IO, 0.336%, 12/11/38 W | 1,487,489 | 21,569 |
| Capmark Mortgage Securities, Inc. FRB Ser. 97-C1, Class X, IO, | | |
| 1.433%, 7/15/29 W | 637,393 | 12,567 |
| CD Commercial Mortgage Trust 144A FRB Ser. 07-CD4, Class XW, IO, | | |
| 0.549%, 12/11/49 W | 1,203,481 | 120 |
| | |
| | Principal | |
| MORTGAGE-BACKED SECURITIES (47.4%)* cont. | amount | Value |
| Commercial mortgage-backed securities cont. | | |
| CFCRE Commercial Mortgage Trust 144A | | |
| FRB Ser. 11-C2, Class D, 5.754%, 12/15/47 W | $1,108,000 | $1,118,227 |
| FRB Ser. 11-C2, Class E, 5.754%, 12/15/47 W | 3,258,000 | 3,287,164 |
| Citigroup Commercial Mortgage Trust | | |
| FRB Ser. 06-C4, Class C, 6.048%, 3/15/49 W | 2,410,000 | 2,434,100 |
| FRB Ser. 13-GC17, Class XA, IO, 1.422%, 11/10/46 W | 45,481,796 | 1,870,985 |
| FRB Ser. 14-GC19, Class XA, IO, 1.204%, 3/10/47 W | 102,160,661 | 5,403,277 |
| Citigroup Commercial Mortgage Trust 144A | | |
| FRB Ser. 14-GC21, Class D, 4.835%, 5/10/47 W | 2,744,000 | 2,436,203 |
| FRB Ser. 13-GC11, Class E, 4.455%, 4/10/46 W | 7,414,000 | 5,632,994 |
| FRB Ser. 06-C5, Class XC, IO, 0.422%, 10/15/49 W | 13,430,045 | 2,686 |
| COBALT CMBS Commercial Mortgage Trust FRB Ser. 07-C3, | | |
| Class AJ, 5.842%, 5/15/46 W | 3,985,863 | 4,072,623 |
| COMM Mortgage Trust | | |
| FRB Ser. 14-CR18, Class C, 4.735%, 7/15/47 W | 889,000 | 895,836 |
| FRB Ser. 14-CR17, Class C, 4.735%, 5/10/47 W | 1,619,000 | 1,591,936 |
| Ser. 13-CR11, Class AM, 4.715%, 8/10/50 W | 949,000 | 1,025,205 |
| FRB Ser. 14-UBS6, Class C, 4.465%, 12/10/47 W | 1,688,000 | 1,709,580 |
| FRB Ser. 12-CR1, Class XA, IO, 1.879%, 5/15/45 W | 20,968,765 | 1,455,658 |
| FRB Ser. 14-LC15, Class XA, IO, 1.33%, 4/10/47 W | 89,169,692 | 4,587,602 |
| FRB Ser. 13-LC13, Class XA, IO, 1.315%, 8/10/46 W | 84,484,179 | 3,324,452 |
| FRB Ser. 14-CR19, Class XA, IO, 1.23%, 8/10/47 W | 39,978,959 | 2,064,194 |
| FRB Ser. 14-UBS4, Class XA, IO, 1.226%, 8/10/47 W | 43,219,747 | 2,402,017 |
| FRB Ser. 14-CR18, Class XA, IO, 1.226%, 7/15/47 W | 57,188,667 | 2,850,283 |
| FRB Ser. 14-CR17, Class XA, IO, 1.134%, 5/10/47 W | 52,623,936 | 2,502,110 |
| FRB Ser. 14-UBS6, Class XA, IO, 1.024%, 12/10/47 W | 56,716,536 | 2,741,677 |
| FRB Ser. 14-LC17, Class XA, IO, 0.957%, 10/10/47 W | 28,196,962 | 1,053,326 |
| COMM Mortgage Trust 144A | | |
| Ser. 12-LC4, Class E, 4.25%, 12/10/44 | 1,918,000 | 1,523,845 |
| Ser. 13-LC13, Class E, 3.719%, 8/10/46 W | 2,278,000 | 1,533,383 |
| Ser. 14-CR18, Class E, 3.60%, 7/15/47 | 6,808,000 | 4,327,662 |
| FRB Ser. 12-LC4, Class XA, IO, 2.21%, 12/10/44 W | 44,436,631 | 3,033,644 |
| FRB Ser. 06-C8, Class XS, IO, 0.648%, 12/10/46 W | 6,128,100 | 61 |
| Credit Suisse Commercial Mortgage Trust 144A | | |
| FRB Ser. 08-C1, Class AJ, 6.307%, 2/15/41 W | 9,861,000 | 7,987,410 |
| FRB Ser. 07-C2, Class AX, IO, 0.041%, 1/15/49 W | 8,763,929 | 438 |
| Credit Suisse First Boston Mortgage Securities Corp. 144A | | |
| Ser. 98-C1, Class F, 6.00%, 5/17/40 | 205,732 | 206,623 |
| FRB Ser. 03-C3, Class AX, IO, 2.048%, 5/15/38 W | 939,901 | 9 |
| CSAIL Commercial Mortgage Trust 144A FRB Ser. 15-C1, Class D, | | |
| 3.798%, 4/15/50 W | 5,324,000 | 4,675,281 |
| DBUBS Mortgage Trust 144A FRB Ser. 11-LC3A, Class D, | | |
| 5.34%, 8/10/44 W | 5,299,500 | 5,521,994 |
| GE Capital Commercial Mortgage Corp. 144A FRB Ser. 05-C3, | | |
| Class XC, IO, 0.075%, 7/10/45 W | 3,408,476 | 34 |
| GE Commercial Mortgage Corp. Trust 144A FRB Ser. 07-C1, | | |
| Class XC, IO, 0.253%, 12/10/49 W | 37,295,603 | 76,642 |
| GMAC Commercial Mortgage Securities, Inc. Trust 144A FRB | | |
| Ser. 05-C1, Class X1, IO, 0.612%, 5/10/43 W | 2,592,193 | 7,744 |
| | |
| | Principal | |
| MORTGAGE-BACKED SECURITIES (47.4%)* cont. | amount | Value |
| Commercial mortgage-backed securities cont. | | |
| GS Mortgage Securities Trust FRB Ser. 13-GC10, Class XA, IO, | | |
| 1.561%, 2/10/46 W | $72,022,715 | $4,507,902 |
| GS Mortgage Securities Trust 144A FRB Ser. 13-GC10, Class E, | | |
| 4.412%, 2/10/46 W | 3,347,000 | 2,618,368 |
| GS Mortgage Securities Trust | | |
| FRB Ser. 14-GC18, Class C, 4.944%, 1/10/47 W | 3,103,000 | 3,215,434 |
| FRB Ser. 13-GC12, Class XA, IO, 1.541%, 6/10/46 W | 37,852,674 | 2,240,765 |
| FRB Ser. 14-GC18, Class XA, IO, 1.12%, 1/10/47 W | 48,004,085 | 2,305,444 |
| FRB Ser. 14-GC22, Class XA, IO, 1.026%, 6/10/47 W | 73,235,845 | 3,521,399 |
| FRB Ser. 14-GC24, Class XA, IO, 0.84%, 9/10/47 W | 47,364,118 | 1,955,380 |
| GS Mortgage Securities Trust 144A | | |
| FRB Ser. 12-GC6, Class D, 5.652%, 1/10/45 W | 7,889,376 | 7,583,268 |
| Ser. 11-GC3, Class E, 5.00%, 3/10/44 W | 1,692,000 | 1,568,185 |
| FRB Ser. 14-GC18, Class D, 4.944%, 1/10/47 W | 1,074,000 | 922,412 |
| FRB Ser. 13-GC12, Class D, 4.446%, 6/10/46 W | 8,055,000 | 7,201,170 |
| FRB Ser. 06-GG6, Class XC, IO, zero %, 4/10/38 W | 482,569 | 5 |
| JPMBB Commercial Mortgage Securities Trust | | |
| FRB Ser. 13-C14, Class C, 4.569%, 8/15/46 W | 1,111,000 | 1,141,110 |
| FRB Ser. 14-C25, Class XA, IO, 0.971%, 11/15/47 W | 33,729,163 | 1,589,116 |
| JPMBB Commercial Mortgage Securities Trust 144A | | |
| FRB Ser. 13-C14, Class E, 4.569%, 8/15/46 W | 4,051,000 | 3,319,637 |
| FRB Ser. C14, Class D, 4.569%, 8/15/46 W | 5,919,000 | 5,280,646 |
| FRB Ser. 14-C25, Class D, 3.946%, 11/15/47 W | 4,634,000 | 3,641,244 |
| Ser. 14-C25, Class E, 3.332%, 11/15/47 W | 4,818,000 | 2,938,951 |
| JPMorgan Chase Commercial Mortgage Securities Corp. FRB | | |
| Ser. 12-LC9, Class XA, IO, 1.628%, 12/15/47 W | 48,887,951 | 3,050,608 |
| JPMorgan Chase Commercial Mortgage Securities Trust 144A FRB | | |
| Ser. 12-LC9, Class D, 4.373%, 12/15/47 W | 621,000 | 634,543 |
| JPMorgan Chase Commercial Mortgage Securities Trust | | |
| FRB Ser. 06-LDP7, Class B, 5.943%, 4/17/45 W | 3,516,000 | 527,400 |
| Ser. 04-LN2, Class A2, 5.115%, 7/15/41 | 7,233 | 7,233 |
| FRB Ser. 13-LC11, Class XA, IO, 1.341%, 4/15/46 W | 54,656,443 | 2,972,217 |
| FRB Ser. 13-C10, Class XA, IO, 1.118%, 12/15/47 W | 94,512,532 | 4,347,387 |
| FRB Ser. 13-C16, Class XA, IO, 1.111%, 12/15/46 W | 56,894,405 | 2,255,300 |
| FRB Ser. 06-LDP8, Class X, IO, 0.308%, 5/15/45 W | 1,260,938 | 13 |
| FRB Ser. 07-LDPX, Class X, IO, 0.142%, 1/15/49 W | 9,792,747 | 83,316 |
| JPMorgan Chase Commercial Mortgage Securities Trust 144A | | |
| FRB Ser. 07-CB20, Class B, 6.322%, 2/12/51 W | 1,592,453 | 1,592,453 |
| FRB Ser. 07-CB20, Class C, 6.322%, 2/12/51 W | 1,298,000 | 1,272,040 |
| FRB Ser. 10-C1, Class D, 6.194%, 6/15/43 W | 3,646,000 | 2,151,140 |
| FRB Ser. 11-C3, Class E, 5.615%, 2/15/46 W | 1,050,000 | 1,048,630 |
| FRB Ser. 11-C3, Class F, 5.615%, 2/15/46 W | 4,436,000 | 4,309,113 |
| FRB Ser. 11-C5, Class D, 5.408%, 8/15/46 W | 2,715,000 | 2,733,734 |
| FRB Ser. 12-C6, Class E, 5.136%, 5/15/45 W | 3,917,000 | 3,547,619 |
| FRB Ser. 12-C8, Class D, 4.652%, 10/15/45 W | 2,751,000 | 2,721,149 |
| FRB Ser. 12-C8, Class E, 4.652%, 10/15/45 W | 678,000 | 648,217 |
| FRB Ser. 13-LC11, Class E, 3.25%, 4/15/46 W | 2,038,000 | 1,442,219 |
| FRB Ser. 05-CB12, Class X1, IO, 0.378%, 9/12/37 W | 2,406,470 | 5,043 |
| FRB Ser. 06-LDP6, Class X1, IO, 0.006%, 4/15/43 W | 927,078 | 9 |
| | |
| | Principal | |
| MORTGAGE-BACKED SECURITIES (47.4%)* cont. | amount | Value |
| Commercial mortgage-backed securities cont. | | |
| LB Commercial Mortgage Trust 144A Ser. 99-C1, Class G, | | |
| 6.41%, 6/15/31 | $87,613 | $88,748 |
| LB-UBS Commercial Mortgage Trust | | |
| FRB Ser. 06-C6, Class C, 5.482%, 9/15/39 (In default) † W | 3,606,000 | 323,711 |
| FRB Ser. 06-C6, Class B, 5.472%, 9/15/39 (In default) † W | 5,115,000 | 485,925 |
| FRB Ser. 07-C2, Class XW, IO, 0.26%, 2/15/40 W | 588,393 | 74 |
| LB-UBS Commercial Mortgage Trust 144A | | |
| FRB Ser. 05-C5, Class XCL, IO, 0.453%, 9/15/40 W | 5,201,185 | 48,488 |
| FRB Ser. 05-C7, Class XCL, IO, 0.341%, 11/15/40 W | 4,437,620 | 22,747 |
| FRB Ser. 07-C2, Class XCL, IO, 0.26%, 2/15/40 W | 13,033,135 | 1,640 |
| FRB Ser. 05-C2, Class XCL, IO, 0.195%, 4/15/40 W | 1,851,216 | 100 |
| LSTAR Commercial Mortgage Trust 144A FRB Ser. 15-3, Class C, | | |
| 3.178%, 4/20/48 W | 3,057,000 | 2,704,406 |
| Merrill Lynch Mortgage Trust FRB Ser. 08-C1, Class AJ, | | |
| 6.444%, 2/12/51 W | 854,000 | 864,504 |
| Merrill Lynch Mortgage Trust 144A | | |
| FRB Ser. 04-KEY2, Class XC, IO, 0.676%, 8/12/39 W | 645,504 | 3,321 |
| FRB Ser. 05-MCP1, Class XC, IO, 0.005%, 6/12/43 W | 1,005,442 | 10 |
| Mezz Cap Commercial Mortgage Trust 144A | | |
| FRB Ser. 04-C1, Class X, IO, 9.321%, 1/15/37 W | 73,590 | 662 |
| FRB Ser. 05-C3, Class X, IO, 6.741%, 5/15/44 W | 35,817 | 1,612 |
| FRB Ser. 06-C4, Class X, IO, 6.377%, 7/15/45 W | 228,952 | 12,592 |
| Morgan Stanley Bank of America Merrill Lynch Trust | | |
| FRB Ser. 13-C7, Class XA, IO, 1.479%, 2/15/46 W | 62,815,614 | 3,730,933 |
| FRB Ser. 13-C12, Class XA, IO, 0.884%, 10/15/46 W | 118,180,233 | 3,293,707 |
| Morgan Stanley Bank of America Merrill Lynch Trust 144A | | |
| FRB Ser. 14-C15, Class E, 4.892%, 4/15/47 W | 4,378,000 | 3,215,571 |
| Ser. 14-C17, Class D, 4.697%, 8/15/47 W | 4,368,000 | 3,712,659 |
| FRB Ser. 13-C11, Class D, 4.369%, 8/15/46 W | 5,438,000 | 4,733,382 |
| FRB Ser. 13-C11, Class F, 4.369%, 8/15/46 W | 6,212,000 | 4,483,648 |
| FRB Ser. 13-C10, Class E, 4.082%, 7/15/46 W | 5,447,000 | 4,387,248 |
| Ser. 14-C17, Class E, 3.50%, 8/15/47 | 4,422,000 | 2,851,973 |
| Ser. 14-C18, Class D, 3.389%, 10/15/47 | 2,500,000 | 1,798,505 |
| Morgan Stanley Capital I Trust | | |
| Ser. 07-HQ11, Class D, 5.587%, 2/12/44 W | 3,784,000 | 227,144 |
| Ser. 07-HQ11, Class AJ, 5.508%, 2/12/44 W | 1,991,046 | 1,978,104 |
| Morgan Stanley Capital I Trust 144A | | |
| FRB Ser. 08-T29, Class C, 6.311%, 1/11/43 W | 3,069,000 | 3,083,731 |
| FRB Ser. 08-T29, Class D, 6.311%, 1/11/43 W | 6,823,000 | 6,804,578 |
| FRB Ser. 08-T29, Class F, 6.311%, 1/11/43 W | 3,094,000 | 2,970,240 |
| FRB Ser. 11-C3, Class E, 5.155%, 7/15/49 W | 308,000 | 295,433 |
| TIAA Real Estate CDO, Ltd. 144A Ser. 03-1A, Class E, | | |
| 8.00%, 12/28/38 | 1,638,511 | 98,311 |
| UBS Commercial Mortgage Trust 144A FRB Ser. 12-C1, Class XA, IO, | | |
| 2.083%, 5/10/45 W | 12,955,485 | 972,505 |
| UBS-Barclays Commercial Mortgage Trust 144A | | |
| Ser. 12-C2, Class F, 4.898%, 5/10/63 W | 2,565,000 | 1,691,458 |
| Ser. 13-C6, Class E, 3.50%, 4/10/46 | 3,489,000 | 2,408,729 |
| FRB Ser. 12-C4, Class XA, IO, 1.66%, 12/10/45 W | 61,804,384 | 3,970,845 |
| | |
| | Principal | |
| MORTGAGE-BACKED SECURITIES (47.4%)* cont. | amount | Value |
| Commercial mortgage-backed securities cont. | | |
| Wachovia Bank Commercial Mortgage Trust | | |
| FRB Ser. 06-C26, Class AJ, 6.027%, 6/15/45 W | $2,110,395 | $1,588,072 |
| FRB Ser. 06-C29, IO, 0.271%, 11/15/48 W | 16,864,519 | 675 |
| FRB Ser. 07-C34, IO, 0.173%, 5/15/46 W | 3,415,265 | 3,415 |
| Wachovia Bank Commercial Mortgage Trust 144A | | |
| FRB Ser. 05-C21, Class E, 5.291%, 10/15/44 W | 4,945,000 | 4,722,475 |
| FRB Ser. 06-C26, Class XC, IO, 0.053%, 6/15/45 W | 924,115 | 185 |
| FRB Ser. 05-C18, Class XC, IO, zero %, 4/15/42 W | 287,914 | 29 |
| Wells Fargo Commercial Mortgage Trust FRB Ser. 14-LC16, | | |
| Class XA, IO, 1.372%, 8/15/50 W | 72,232,119 | 3,899,090 |
| Wells Fargo Commercial Mortgage Trust 144A Ser. 12-LC5, Class E, | | |
| 4.765%, 10/15/45 W | 1,206,000 | 946,318 |
| WF-RBS Commercial Mortgage Trust | | |
| Ser. 13-C12, Class AS, 3.56%, 3/15/48 | 2,875,000 | 2,939,458 |
| FRB Ser. 14-C22, Class XA, IO, 0.915%, 9/15/57 W | 37,228,073 | 1,631,706 |
| FRB Ser. 13-C14, Class XA, IO, 0.804%, 6/15/46 W | 123,047,109 | 4,012,566 |
| WF-RBS Commercial Mortgage Trust 144A | | |
| FRB Ser. 11-C2, Class D, 5.652%, 2/15/44 W | 5,677,438 | 5,801,325 |
| Ser. 11-C4, Class E, 5.247%, 6/15/44 W | 1,764,768 | 1,706,294 |
| Ser. 11-C4, Class F, 5.00%, 6/15/44 W | 6,151,000 | 5,228,467 |
| Ser. 11-C3, Class E, 5.00%, 3/15/44 W | 1,601,000 | 1,409,352 |
| FRB Ser. 14-C19, Class E, 4.971%, 3/15/47 W | 2,794,000 | 2,049,514 |
| FRB Ser. 12-C7, Class D, 4.826%, 6/15/45 W | 4,142,000 | 3,870,492 |
| FRB Ser. 13-UBS1, Class E, 4.624%, 3/15/46 W | 2,010,000 | 1,536,633 |
| FRB Ser. 12-C10, Class E, 4.448%, 12/15/45 W | 3,645,000 | 2,756,531 |
| Ser. 14-C19, Class D, 4.234%, 3/15/47 | 1,017,000 | 883,664 |
| Ser. 14-C20, Class D, 3.986%, 5/15/47 | 2,506,000 | 1,986,331 |
| Ser. 13-C12, Class E, 3.50%, 3/15/48 | 3,607,000 | 2,649,360 |
| Ser. 13-C14, Class E, 3.25%, 6/15/46 | 3,222,000 | 2,236,738 |
| FRB Ser. 12-C9, Class XA, IO, 1.995%, 11/15/45 W | 65,002,329 | 4,929,777 |
| FRB Ser. 11-C5, Class XA, IO, 1.759%, 11/15/44 W | 34,113,551 | 1,878,974 |
| FRB Ser. 12-C10, Class XA, IO, 1.582%, 12/15/45 W | 43,768,028 | 2,817,348 |
| FRB Ser. 13-C12, Class XA, IO, 1.362%, 3/15/48 W | 18,282,240 | 948,197 |
| FRB Ser. 13-C11, Class XA, IO, 1.289%, 3/15/45 W | 23,860,456 | 1,208,728 |
| | | 309,764,271 |
| Residential mortgage-backed securities (non-agency) (9.8%) | | |
| BCAP, LLC Trust 144A FRB Ser. 15-RR5, Class 2A2, 1.959%, 1/26/46 W | 8,733,000 | 8,138,099 |
| Bellemeade Re, Ltd. 144A FRB Ser. 17-1, Class M2, 1 Month | | |
| US LIBOR + 3.35%, 4.738%, 10/25/27 (Bermuda) | 11,470,000 | 11,495,096 |
| Federal Home Loan Mortgage Corporation | | |
| Structured Agency Credit Risk Debt FRN Ser. 16-HQA1, Class M3, | | |
| 1 Month US LIBOR + 6.35%, 7.588%, 9/25/28 | 10,997,870 | 13,215,886 |
| Structured Agency Credit Risk Debt FRN Ser. 16-HQA2, Class M3, | | |
| 1 Month US LIBOR + 5.15%, 6.388%, 11/25/28 | 6,718,200 | 7,738,304 |
| FRB Ser. 16-DNA3, Class M3, 1 Month US LIBOR + 5.00%, | | |
| 6.238%, 12/25/28 | 4,290,000 | 4,966,174 |
| Structured Agency Credit Risk Debt FRN Ser. 16-DNA2, Class M3, | | |
| 1 Month US LIBOR + 4.65%, 5.888%, 10/25/28 | 5,830,000 | 6,586,476 |
| | |
| | Principal | |
| MORTGAGE-BACKED SECURITIES (47.4%)* cont. | amount | Value |
| Residential mortgage-backed securities (non-agency) cont. | | |
| Federal Home Loan Mortgage Corporation | | |
| Structured Agency Credit Risk Debt FRN Ser. 14-DN2, Class M3, | | |
| 1 Month US LIBOR + 3.60%, 4.838%, 4/25/24 | $2,690,000 | $2,959,283 |
| Structured Agency Credit Risk Debt FRN Ser. 17-DNA1, Class M2, | | |
| 1 Month US LIBOR + 3.25%, 4.488%, 7/25/29 | 403,000 | 423,884 |
| Federal National Mortgage Association | | |
| Connecticut Avenue Securities FRB Ser. 16-C01, Class 2M2, | | |
| 1 Month US LIBOR + 6.95%, 8.188%, 8/25/28 | 8,800,000 | 10,399,129 |
| Connecticut Avenue Securities FRB Ser. 16-C02, Class 1M2, | | |
| 1 Month US LIBOR + 6.00%, 7.238%, 9/25/28 | 11,518,000 | 13,297,409 |
| Connecticut Avenue Securities FRB Ser. 16-C03, Class 2M2, | | |
| 1 Month US LIBOR + 5.90%, 7.138%, 10/25/28 | 14,657,880 | 16,811,611 |
| Connecticut Avenue Securities FRB Ser. 16-C03, Class 1M2, | | |
| 1 Month US LIBOR + 5.30%, 6.538%, 10/25/28 | 16,603,000 | 19,020,393 |
| Connecticut Avenue Securities FRB Ser. 16-C05, Class 2M2, | | |
| 1 Month US LIBOR + 4.45%, 5.688%, 1/25/29 | 3,641,000 | 4,007,994 |
| Connecticut Avenue Securities FRB Ser. 16-C07, Class 2M2, | | |
| 1 Month US LIBOR + 4.35%, 5.588%, 5/25/29 | 260,000 | 284,222 |
| Connecticut Avenue Securities FRB Ser. 16-C06, Class 1M2, | | |
| 1 Month US LIBOR + 4.25%, 5.488%, 4/25/29 | 800,000 | 894,922 |
| Connecticut Avenue Securities FRB Ser. 15-C02, Class 2M2, | | |
| 1 Month US LIBOR + 4.00%, 5.238%, 5/25/25 | 1,565,004 | 1,655,836 |
| Connecticut Avenue Securities FRB Ser. 17-C01, Class 1M2, | | |
| 1 Month US LIBOR + 3.55%, 4.788%, 7/25/29 | 218,000 | 231,953 |
| Connecticut Avenue Securities FRB Ser. 17-C06, Class 2M2, | | |
| 1 Month US LIBOR + 2.80%, 4.038%, 2/25/30 | 900,000 | 917,429 |
| Connecticut Avenue Securities FRB Ser. 14-C02, Class 1M2, | | |
| 1 Month US LIBOR + 2.60%, 3.838%, 5/25/24 | 2,543,000 | 2,666,775 |
| FIRSTPLUS Home Loan Owner Trust Ser. 97-3, Class B1, 7.79%, | | |
| 11/10/23 (In default) † | 134,710 | 13 |
| Morgan Stanley Resecuritization Trust 144A Ser. 15-R4, Class CB1, | | |
| 0.598%, 8/26/47 | 4,746,000 | 3,939,180 |
| NovaStar Mortgage Funding Trust FRB Ser. 04-2, Class M4, 1 Month | | |
| US LIBOR + 1.80%, 3.038%, 9/25/34 | 2,801,191 | 2,791,537 |
| WaMu Mortgage Pass-Through Certificates Trust | | |
| FRB Ser. 05-AR1, Class A2B, 1 Month US LIBOR + 0.80%, | | |
| 2.038%, 1/25/45 | 1,490,316 | 1,424,725 |
| FRB Ser. 05-AR11, Class A1C3, 1 Month US LIBOR + 0.51%, | | |
| 1.748%, 8/25/45 | 2,733,062 | 2,712,197 |
| FRB Ser. 05-AR13, Class A1C4, 1 Month US LIBOR + 0.43%, | | |
| 1.668%, 10/25/45 | 11,384,118 | 10,825,330 |
| FRB Ser. 05-AR17, Class A1B2, 1 Month US LIBOR + 0.41%, | | |
| 1.647%, 12/25/45 | 4,073,977 | 3,876,389 |
| FRB Ser. 05-AR2, Class 2A1B, 1 Month US LIBOR + 0.37%, | | |
| 1.608%, 1/25/45 | 1,450,757 | 1,422,322 |
| FRB Ser. 05-AR17, Class A1B3, 1 Month US LIBOR + 0.35%, | | |
| 1.587%, 12/25/45 | 1,212,138 | 1,154,510 |
| | | 153,857,078 |
| Total mortgage-backed securities (cost $763,905,309) | | $742,305,011 |
| | |
| | Principal | |
| CORPORATE BONDS AND NOTES (28.2%)* | amount | Value |
| Basic materials (1.8%) | | |
| Celanese US Holdings, LLC company guaranty sr. unsec. notes | | |
| 5.875%, 6/15/21 (Germany) | $626,000 | $690,382 |
| Celanese US Holdings, LLC company guaranty sr. unsec. unsub. | | |
| notes 4.625%, 11/15/22 (Germany) | 615,000 | 661,990 |
| Eastman Chemical Co. sr. unsec. notes 3.80%, 3/15/25 | 1,578,000 | 1,642,231 |
| Georgia-Pacific, LLC sr. unsec. unsub. notes 7.75%, 11/15/29 | 352,000 | 492,538 |
| Glencore Finance Canada, Ltd. 144A company guaranty sr. unsec. | | |
| unsub. notes 6.00%, 11/15/41 (Canada) | 442,000 | 509,958 |
| Glencore Funding, LLC 144A company guaranty sr. unsec. unsub. | | |
| notes 4.625%, 4/29/24 | 3,213,000 | 3,422,835 |
| Glencore Funding, LLC 144A company guaranty sr. unsec. unsub. | | |
| notes 4.00%, 4/16/25 | 2,142,000 | 2,187,625 |
| International Paper Co. sr. unsec. notes 8.70%, 6/15/38 | 382,000 | 564,910 |
| Sherwin-Williams Co. (The) sr. unsec. unsub. bonds 3.45%, 6/1/27 | 2,085,000 | 2,118,049 |
| Southern Copper Corp. sr. unsec. unsub. notes 5.375%, | | |
| 4/16/20 (Peru) | 200,000 | 214,959 |
| Steel Dynamics, Inc. 144A company guaranty sr. unsec. notes | | |
| 4.125%, 9/15/25 | 3,175,000 | 3,182,938 |
| Westlake Chemical Corp. company guaranty sr. unsec. unsub. | | |
| notes 3.60%, 8/15/26 | 4,117,000 | 4,153,865 |
| WestRock MWV, LLC company guaranty sr. unsec. unsub. notes | | |
| 8.20%, 1/15/30 | 4,481,000 | 6,296,816 |
| WestRock MWV, LLC company guaranty sr. unsec. unsub. notes | | |
| 7.95%, 2/15/31 | 478,000 | 669,468 |
| Weyerhaeuser Co. sr. unsec. unsub. notes 7.375%, 3/15/32 R | 1,039,000 | 1,444,585 |
| | | 28,253,149 |
| Capital goods (0.7%) | | |
| Johnson Controls International PLC sr. unsec. unsub. bonds | | |
| 4.50%, 2/15/47 | 1,980,000 | 2,081,458 |
| L3 Technologies, Inc. company guaranty sr. unsec. bonds | | |
| 3.85%, 12/15/26 | 185,000 | 192,099 |
| Legrand France SA sr. unsec. unsub. notes 8.50%, 2/15/25 (France) | 1,045,000 | 1,355,270 |
| Northrop Grumman Systems Corp. company guaranty sr. unsec. | | |
| unsub. notes 7.875%, 3/1/26 | 1,016,000 | 1,338,464 |
| Rockwell Collins, Inc. sr. unsec. bonds 4.35%, 4/15/47 | 3,574,000 | 3,831,954 |
| United Technologies Corp. sr. unsec. unsub. notes 5.70%, 4/15/40 | 75,000 | 93,901 |
| ZF North America Capital, Inc. 144A company guaranty sr. unsec. | | |
| unsub. notes 4.50%, 4/29/22 | 1,770,000 | 1,849,650 |
| | | 10,742,796 |
| Communication services (2.8%) | | |
| America Movil SAB de CV company guaranty sr. unsec. unsub. | | |
| notes 6.125%, 3/30/40 (Mexico) | 880,000 | 1,085,767 |
| American Tower Corp. sr. unsec. notes 4.00%, 6/1/25 R | 3,086,000 | 3,205,373 |
| AT&T, Inc. sr. unsec. unsub. bonds 5.15%, 2/14/50 | 5,195,000 | 5,121,121 |
| AT&T, Inc. sr. unsec. unsub. notes 4.25%, 3/1/27 | 6,170,000 | 6,332,002 |
| CC Holdings GS V, LLC/Crown Castle GS III Corp. company guaranty | | |
| sr. notes 3.849%, 4/15/23 | 577,000 | 599,375 |
| Charter Communications Operating, LLC/Charter | | |
| Communications Operating Capital Corp. company guaranty sr. | | |
| sub. bonds 6.484%, 10/23/45 | 3,044,000 | 3,485,460 |
| | |
| | Principal | |
| CORPORATE BONDS AND NOTES (28.2%)* cont. | amount | Value |
| Communication services cont. | | |
| Charter Communications Operating, LLC/Charter | | |
| Communications Operating Capital Corp. company guaranty sr. | | |
| sub. notes 4.908%, 7/23/25 | $1,360,000 | $1,446,794 |
| Charter Communications Operating, LLC/Charter | | |
| Communications Operating Capital Corp. 144A company guaranty | | |
| sr. bonds 5.375%, 5/1/47 | 2,211,000 | 2,238,321 |
| Comcast Cable Communications Holdings, Inc. company | | |
| guaranty sr. unsec. notes 9.455%, 11/15/22 | 1,486,000 | 1,972,208 |
| Comcast Corp. company guaranty sr. unsec. unsub. notes | | |
| 6.50%, 11/15/35 | 525,000 | 701,986 |
| Comcast Corp. 144A company guaranty sr. unsec. unsub. bonds | | |
| 4.049%, 11/1/52 | 961,000 | 953,591 |
| Comcast Corp. 144A company guaranty sr. unsec. unsub. bonds | | |
| 3.999%, 11/1/49 | 694,000 | 691,016 |
| Cox Communications, Inc. 144A sr. unsec. bonds 3.50%, 8/15/27 | 2,985,000 | 2,951,875 |
| Crown Castle International Corp. sr. unsec. bonds 3.65%, 9/1/27 R | 2,401,000 | 2,395,979 |
| Crown Castle International Corp. sr. unsec. notes 5.25%, 1/15/23 R | 385,000 | 426,115 |
| Crown Castle International Corp. sr. unsec. notes 4.875%, 4/15/22 R | 545,000 | 590,575 |
| Crown Castle International Corp. sr. unsec. notes 4.75%, 5/15/47 R | 1,450,000 | 1,506,943 |
| Crown Castle Towers, LLC 144A company guaranty sr. notes | | |
| 4.883%, 8/15/20 | 781,000 | 824,681 |
| Rogers Communications, Inc. company guaranty sr. unsec. unsub. | | |
| notes 4.50%, 3/15/43 (Canada) | 319,000 | 336,759 |
| Sprint Spectrum Co., LLC/Sprint Spectrum Co. II, LLC/ | | |
| Sprint Spectrum Co. III, LL 144A company guaranty sr. notes | | |
| 3.36%, 9/20/21 | 1,254,000 | 1,272,183 |
| Verizon Communications, Inc. sr. unsec. unsub. notes | | |
| 4.522%, 9/15/48 | 753,000 | 719,416 |
| Verizon Communications, Inc. sr. unsec. unsub. notes | | |
| 4.125%, 3/16/27 | 1,790,000 | 1,867,925 |
| Videotron, Ltd./Videotron Ltee. 144A sr. unsec. notes 5.125%, | | |
| 4/15/27 (Canada) | 2,615,000 | 2,749,019 |
| | | 43,474,484 |
| Conglomerates (0.3%) | | |
| General Electric Co. jr. unsec. sub. FRB Ser. D, 5.00%, | | |
| perpetual maturity | 4,118,000 | 4,298,163 |
| | | 4,298,163 |
| Consumer cyclicals (4.1%) | | |
| 21st Century Fox America, Inc. company guaranty sr. unsec. notes | | |
| 7.85%, 3/1/39 | 799,000 | 1,161,645 |
| 21st Century Fox America, Inc. company guaranty sr. unsec. notes | | |
| 7.75%, 1/20/24 | 652,000 | 802,752 |
| 21st Century Fox America, Inc. company guaranty sr. unsec. unsub. | | |
| notes 7.75%, 12/1/45 | 3,517,000 | 5,354,547 |
| Alimentation Couche-Tard, Inc. 144A company guaranty sr. unsec. | | |
| notes 3.55%, 7/26/27 (Canada) | 1,416,000 | 1,417,599 |
| Amazon.com, Inc. 144A sr. unsec. bonds 4.05%, 8/22/47 | 1,843,000 | 1,890,915 |
| Amazon.com, Inc. 144A sr. unsec. notes 3.15%, 8/22/27 | 1,604,000 | 1,613,598 |
| Autonation, Inc. company guaranty sr. unsec. unsub. notes | | |
| 5.50%, 2/1/20 | 1,773,000 | 1,887,756 |
| | |
| | Principal | |
| CORPORATE BONDS AND NOTES (28.2%)* cont. | amount | Value |
| Consumer cyclicals cont. | | |
| CBS Corp. company guaranty sr. unsec. unsub. bonds | | |
| 2.90%, 1/15/27 | $1,903,000 | $1,802,547 |
| CBS Corp. company guaranty sr. unsec. unsub. notes | | |
| 4.60%, 1/15/45 | 3,965,000 | 3,975,671 |
| CBS Corp. company guaranty sr. unsec. unsub. notes | | |
| 3.50%, 1/15/25 | 423,000 | 429,445 |
| Expedia, Inc. company guaranty sr. unsec. unsub. notes | | |
| 5.00%, 2/15/26 | 644,000 | 696,283 |
| Ford Motor Co. sr. unsec. unsub. notes 4.346%, 12/8/26 | 3,170,000 | 3,303,312 |
| General Motors Financial Co., Inc. company guaranty sr. unsec. | | |
| notes 4.00%, 10/6/26 | 845,000 | 852,085 |
| General Motors Financial Co., Inc. company guaranty sr. unsec. | | |
| unsub. notes 4.30%, 7/13/25 | 703,000 | 728,534 |
| General Motors Financial Co., Inc. company guaranty sr. unsec. | | |
| unsub. notes 4.00%, 1/15/25 | 1,230,000 | 1,260,019 |
| Grupo Televisa SAB sr. unsec. unsub. bonds 6.625%, | | |
| 1/15/40 (Mexico) | 510,000 | 616,972 |
| Grupo Televisa SAB sr. unsec. unsub. notes 5.00%, 5/13/45 (Mexico) | 2,120,000 | 2,115,800 |
| Hilton Domestic Operating Co., Inc. company guaranty sr. unsec. | | |
| sub. notes 4.25%, 9/1/24 | 915,000 | 934,444 |
| Hilton Worldwide Finance, LLC/Hilton Worldwide Finance Corp. | | |
| company guaranty sr. unsec. notes 4.875%, 4/1/27 | 4,395,000 | 4,614,750 |
| Historic TW, Inc. company guaranty sr. unsec. unsub. bonds | | |
| 9.15%, 2/1/23 | 506,000 | 651,598 |
| Host Hotels & Resorts LP sr. unsec. unsub. notes 6.00%, 10/1/21 R | 108,000 | 119,970 |
| Host Hotels & Resorts LP sr. unsec. unsub. notes 5.25%, 3/15/22 R | 866,000 | 942,413 |
| Hyatt Hotels Corp. sr. unsec. unsub. notes 3.375%, 7/15/23 | 269,000 | 275,096 |
| IHS Markit, Ltd. 144A company guaranty notes 4.75%, 2/15/25 | | |
| (United Kingdom) | 4,655,000 | 4,911,025 |
| L Brands, Inc. company guaranty sr. unsec. sub. notes | | |
| 5.625%, 2/15/22 | 820,000 | 877,400 |
| Lear Corp. sr. unsec. unsub. bonds 3.80%, 9/15/27 | 2,678,000 | 2,687,003 |
| Moody’s Corp. 144A sr. unsec. bonds 3.25%, 1/15/28 | 1,079,000 | 1,073,519 |
| NVR, Inc. sr. unsec. notes 3.95%, 9/15/22 | 302,000 | 317,758 |
| O’Reilly Automotive, Inc. company guaranty sr. unsec. notes | | |
| 3.85%, 6/15/23 | 261,000 | 274,321 |
| O’Reilly Automotive, Inc. company guaranty sr. unsec. sub. notes | | |
| 3.55%, 3/15/26 | 1,050,000 | 1,062,387 |
| Omnicom Group, Inc. company guaranty sr. unsec. unsub. notes | | |
| 3.60%, 4/15/26 | 1,033,000 | 1,047,305 |
| Priceline Group, Inc. (The) sr. unsec. notes 3.65%, 3/15/25 | 1,260,000 | 1,295,771 |
| QVC, Inc. company guaranty sr. notes 4.85%, 4/1/24 | 829,000 | 871,997 |
| QVC, Inc. company guaranty sr. sub. notes 4.45%, 2/15/25 | 708,000 | 722,283 |
| S&P Global, Inc. company guaranty sr. unsec. unsub. notes | | |
| 4.40%, 2/15/26 | 1,394,000 | 1,506,195 |
| Sirius XM Radio, Inc. 144A sr. unsec. bonds 5.00%, 8/1/27 | 4,014,000 | 4,049,123 |
| Standard Industries, Inc. 144A sr. unsec. notes 5.00%, 2/15/27 | 2,630,000 | 2,740,986 |
| Time Warner, Inc. company guaranty sr. unsec. unsub. bonds | | |
| 3.80%, 2/15/27 | 454,000 | 453,802 |
| Time Warner, Inc. company guaranty sr. unsec. unsub. bonds | | |
| 2.95%, 7/15/26 | 577,000 | 547,127 |
| | |
| | Principal | |
| CORPORATE BONDS AND NOTES (28.2%)* cont. | amount | Value |
| Consumer cyclicals cont. | | |
| Vulcan Materials Co. sr. unsec. unsub. notes 4.50%, 4/1/25 | $371,000 | $396,313 |
| Walt Disney Co. (The) sr. unsec. unsub. notes 4.375%, 8/16/41 | 212,000 | 231,912 |
| Wyndham Worldwide Corp. sr. unsec. unsub. bonds 4.50%, 4/1/27 | 1,990,000 | 2,032,709 |
| | | 64,546,687 |
| Consumer staples (2.9%) | | |
| Altria Group, Inc. company guaranty sr. unsec. unsub. notes | | |
| 4.00%, 1/31/24 | 283,000 | 302,036 |
| Anheuser-Busch InBev Finance, Inc. company guaranty sr. unsec. | | |
| unsub. bonds 4.90%, 2/1/46 | 8,223,000 | 9,247,667 |
| Anheuser-Busch InBev Finance, Inc. company guaranty sr. unsec. | | |
| unsub. bonds 3.65%, 2/1/26 | 476,000 | 491,175 |
| Anheuser-Busch InBev Worldwide, Inc. company guaranty sr. | | |
| unsec. unsub. bonds 4.95%, 1/15/42 | 430,000 | 483,998 |
| Ashtead Capital, Inc. 144A notes 4.375%, 8/15/27 | 4,175,000 | 4,227,188 |
| Bacardi, Ltd. 144A unsec. notes 4.50%, 1/15/21 (Bermuda) | 583,000 | 619,351 |
| Constellation Brands, Inc. company guaranty sr. unsec. notes | | |
| 3.875%, 11/15/19 | 149,000 | 154,295 |
| Constellation Brands, Inc. company guaranty sr. unsec. unsub. | | |
| bonds 3.70%, 12/6/26 | 367,000 | 377,485 |
| CVS Health Corp. sr. unsec. notes 4.75%, 12/1/22 | 1,033,000 | 1,125,100 |
| CVS Health Corp. sr. unsec. unsub. notes 5.125%, 7/20/45 | 3,281,000 | 3,666,287 |
| CVS Pass-Through Trust sr. notes 6.036%, 12/10/28 | 51,773 | 58,493 |
| CVS Pass-Through Trust 144A sr. mtge. notes 7.507%, 1/10/32 | 1,487,569 | 1,834,611 |
| Diageo Investment Corp. company guaranty sr. unsec. notes | | |
| 8.00%, 9/15/22 | 275,000 | 342,355 |
| ERAC USA Finance, LLC 144A company guaranty sr. unsec. bonds | | |
| 4.50%, 2/15/45 | 1,961,000 | 1,965,980 |
| ERAC USA Finance, LLC 144A company guaranty sr. unsec. notes | | |
| 7.00%, 10/15/37 | 1,161,000 | 1,539,943 |
| ERAC USA Finance, LLC 144A company guaranty sr. unsec. notes | | |
| 5.625%, 3/15/42 | 1,882,000 | 2,183,114 |
| ERAC USA Finance, LLC 144A company guaranty sr. unsec. notes | | |
| 3.85%, 11/15/24 | 391,000 | 405,999 |
| Grupo Bimbo SAB de CV 144A company guaranty sr. unsec. notes | | |
| 3.875%, 6/27/24 (Mexico) | 715,000 | 736,519 |
| Grupo Bimbo SAB de CV 144A company guaranty sr. unsec. unsub. | | |
| notes 4.875%, 6/27/44 (Mexico) | 400,000 | 397,589 |
| Kraft Heinz Co. (The) company guaranty sr. unsec. bonds | | |
| 4.375%, 6/1/46 | 1,117,000 | 1,090,736 |
| Kraft Heinz Co. (The) company guaranty sr. unsec. notes Ser. 144A, | | |
| 6.875%, 1/26/39 | 1,361,000 | 1,762,191 |
| Kraft Heinz Co. (The) company guaranty sr. unsec. unsub. notes | | |
| 6.50%, 2/9/40 | 2,929,000 | 3,673,930 |
| Lamb Weston Holdings, Inc. 144A company guaranty sr. unsec. | | |
| unsub. notes 4.875%, 11/1/26 | 2,799,000 | 2,942,449 |
| Newell Brands, Inc. sr. unsec. unsub. notes 4.20%, 4/1/26 | 1,976,000 | 2,082,389 |
| Tyson Foods, Inc. company guaranty sr. unsec. bonds | | |
| 4.875%, 8/15/34 | 346,000 | 382,867 |
| Tyson Foods, Inc. company guaranty sr. unsec. unsub. bonds | | |
| 5.15%, 8/15/44 | 490,000 | 561,462 |
| Walgreens Boots Alliance, Inc. sr. unsec. bonds 3.45%, 6/1/26 | 2,659,000 | 2,615,607 |
| | | 45,270,816 |
| | |
| | Principal | |
| CORPORATE BONDS AND NOTES (28.2%)* cont. | amount | Value |
| Energy (2.7%) | | |
| Canadian Natural Resources, Ltd. sr. unsec. unsub. bonds 3.85%, | | |
| 6/1/27 (Canada) | $1,565,000 | $1,604,641 |
| Cenovus Energy, Inc. sr. unsec. bonds 6.75%, 11/15/39 (Canada) | 1,718,000 | 2,029,388 |
| Cenovus Energy, Inc. 144A sr. unsec. notes 4.25%, | | |
| 4/15/27 (Canada) | 2,650,000 | 2,659,033 |
| Cheniere Corpus Christi Holdings, LLC 144A company guaranty sr. | | |
| bonds 5.125%, 6/30/27 | 2,085,000 | 2,150,156 |
| Concho Resources, Inc. company guaranty sr. unsec. notes | | |
| 3.75%, 10/1/27 | 4,123,000 | 4,167,756 |
| Devon Energy Corp. sr. unsec. unsub. notes 3.25%, 5/15/22 | 513,000 | 520,613 |
| EQT Corp. sr. unsec. unsub. notes 3.90%, 10/1/27 | 3,170,000 | 3,150,461 |
| Marathon Petroleum Corp. sr. unsec. unsub. notes 6.50%, 3/1/41 | 394,000 | 483,349 |
| MPLX LP sr. unsec. unsub. notes 4.125%, 3/1/27 | 2,385,000 | 2,453,435 |
| Petroleos Mexicanos company guaranty sr. unsec. unsub. notes | | |
| 4.50%, 1/23/26 (Mexico) | 1,853,000 | 1,829,838 |
| Philips 66 Partners LP sr. unsec. bonds 3.75%, 3/1/28 | 2,631,000 | 2,640,996 |
| Sabine Pass Liquefaction, LLC sr. bonds 4.20%, 3/15/28 | 1,110,000 | 1,132,271 |
| Sabine Pass Liquefaction, LLC sr. notes 5.00%, 3/15/27 | 4,279,000 | 4,603,732 |
| Spectra Energy Partners LP sr. unsec. notes 3.375%, 10/15/26 | 836,000 | 832,049 |
| Statoil ASA company guaranty sr. unsec. notes 5.10%, | | |
| 8/17/40 (Norway) | 1,425,000 | 1,674,925 |
| Targa Resources Partners LP/Targa Resources Partners | | |
| Finance Corp. 144A company guaranty sr. unsec. unsub. bonds | | |
| 5.00%, 1/15/28 | 1,890,000 | 1,894,725 |
| Transcanada Trust company guaranty jr. unsec. sub. FRB 5.30%, | | |
| 3/15/77 (Canada) | 4,570,000 | 4,755,085 |
| Valero Energy Partners LP sr. unsec. unsub. notes | | |
| 4.375%, 12/15/26 | 562,000 | 587,578 |
| Williams Cos., Inc. (The) sr. unsec. unsub. notes 8.75%, 3/15/32 | 383,000 | 504,603 |
| Williams Partners LP sr. unsec. sub. notes 4.30%, 3/4/24 | 1,083,000 | 1,144,721 |
| Williams Partners LP sr. unsec. sub. notes 3.60%, 3/15/22 | 259,000 | 267,856 |
| Williams Partners LP/ACMP Finance Corp. sr. unsec. sub. notes | | |
| 4.875%, 3/15/24 | 642,000 | 673,259 |
| | | 41,760,470 |
| Financials (7.2%) | | |
| Aflac, Inc. sr. unsec. notes 6.45%, 8/15/40 | 177,000 | 232,132 |
| Air Lease Corp. sr. unsec. unsub. notes 3.625%, 4/1/27 | 1,425,000 | 1,432,742 |
| Air Lease Corp. sr. unsec. unsub. notes 3.00%, 9/15/23 | 408,000 | 410,965 |
| Ally Financial, Inc. sub. unsec. notes 5.75%, 11/20/25 | 3,485,000 | 3,846,569 |
| American International Group, Inc. jr. unsec. sub. FRB | | |
| 8.175%, 5/15/58 | 1,930,000 | 2,634,450 |
| Aon PLC company guaranty sr. unsec. unsub. notes | | |
| 4.25%, 12/12/42 | 2,441,000 | 2,473,186 |
| Australia & New Zealand Banking Group, Ltd./United | | |
| Kingdom 144A jr. unsec. sub. FRB 6.75%, perpetual maturity | | |
| (United Kingdom) | 585,000 | 672,107 |
| AXA SA 144A jr. unsec. sub. FRN 6.463%, perpetual | | |
| maturity (France) | 1,630,000 | 1,669,739 |
| Banco del Estado de Chile 144A sr. unsec. notes 2.00%, | | |
| 11/9/17 (Chile) | 1,000,000 | 999,891 |
| | |
| | Principal | |
| CORPORATE BONDS AND NOTES (28.2%)* cont. | amount | Value |
| Financials cont. | | |
| Barclays Bank PLC 144A unsec. sub. notes 10.179%, 6/12/21 | | |
| (United Kingdom) | $899,000 | $1,106,811 |
| Barclays PLC unsec. sub. bonds 4.836%, 5/9/28 (United Kingdom) | 240,000 | 250,360 |
| Bear Stearns Cos., LLC (The) sr. unsec. unsub. notes 7.25%, 2/1/18 | 687,000 | 696,369 |
| Berkshire Hathaway Finance Corp. company guaranty sr. unsec. | | |
| notes 4.30%, 5/15/43 | 842,000 | 917,218 |
| BGC Partners, Inc. sr. unsec. notes 5.125%, 5/27/21 | 127,000 | 134,511 |
| BPCE SA 144A unsec. sub. notes 5.15%, 7/21/24 (France) | 260,000 | 282,947 |
| BPCE SA 144A unsec. sub. notes 4.50%, 3/15/25 (France) | 6,840,000 | 7,142,006 |
| Cantor Fitzgerald LP 144A unsec. notes 6.50%, 6/17/22 | 5,245,000 | 5,871,617 |
| Capital One Bank USA NA unsec. sub. notes 3.375%, 2/15/23 | 514,000 | 522,592 |
| Capital One Financial Corp. unsec. sub. notes 4.20%, 10/29/25 | 1,437,000 | 1,481,616 |
| CBRE Services, Inc. company guaranty sr. unsec. notes | | |
| 5.25%, 3/15/25 | 966,000 | 1,063,179 |
| CBRE Services, Inc. company guaranty sr. unsec. unsub. notes | | |
| 4.875%, 3/1/26 | 2,319,000 | 2,503,162 |
| Citigroup, Inc. unsec. sub. bonds 4.75%, 5/18/46 | 2,420,000 | 2,626,933 |
| Citigroup, Inc. unsec. sub. bonds 4.125%, 7/25/28 | 4,450,000 | 4,584,293 |
| CNO Financial Group, Inc. sr. unsec. unsub. notes 5.25%, 5/30/25 | 1,755,000 | 1,864,688 |
| Commerzbank AG 144A unsec. sub. notes 8.125%, | | |
| 9/19/23 (Germany) | 1,399,000 | 1,700,577 |
| Cooperatieve Rabobank UA 144A jr. unsec. sub. FRN 11.00%, | | |
| perpetual maturity (Netherlands) | 512,000 | 581,120 |
| Credit Agricole SA 144A unsec. sub. notes 4.375%, 3/17/25 (France) | 1,950,000 | 2,041,170 |
| Credit Suisse Group AG 144A jr. unsec. sub. FRN 6.25%, perpetual | | |
| maturity (Switzerland) | 293,000 | 319,370 |
| Credit Suisse Group AG 144A sr. unsec. bonds 4.282%, | | |
| 1/9/28 (Switzerland) | 1,770,000 | 1,845,232 |
| Duke Realty LP company guaranty sr. unsec. unsub. notes | | |
| 4.375%, 6/15/22 R | 385,000 | 411,663 |
| Fairfax US, Inc. 144A company guaranty sr. unsec. notes | | |
| 4.875%, 8/13/24 | 773,000 | 796,757 |
| Fifth Third Bancorp jr. unsec. sub. FRB 5.10%, perpetual maturity | 469,000 | 479,553 |
| Goldman Sachs Group, Inc. (The) sr. unsec. unsub. notes | | |
| 3.85%, 1/26/27 | 984,000 | 1,006,809 |
| Goldman Sachs Group, Inc. (The) unsec. sub. notes 6.75%, 10/1/37 | 712,000 | 938,849 |
| Hartford Financial Services Group, Inc. (The) sr. unsec. unsub. | | |
| notes 6.625%, 3/30/40 | 2,661,000 | 3,652,374 |
| Healthcare Realty Trust, Inc. sr. unsec. unsub. notes | | |
| 3.875%, 5/1/25 R | 2,250,000 | 2,271,108 |
| Hospitality Properties Trust sr. unsec. unsub. notes | | |
| 4.65%, 3/15/24 R | 184,000 | 194,366 |
| Hospitality Properties Trust sr. unsec. unsub. notes | | |
| 4.50%, 3/15/25 R | 656,000 | 682,771 |
| HSBC Bank USA, NA unsec. sub. notes 7.00%, 1/15/39 | 1,500,000 | 2,140,271 |
| HSBC Capital Funding LP 144A company guaranty jr. unsec. sub. | | |
| FRB 10.176%, perpetual maturity (Jersey) | 3,420,000 | 5,465,570 |
| HSBC Finance Corp. unsec. sub. notes 6.676%, 1/15/21 | 146,000 | 164,201 |
| ING Bank NV 144A unsec. sub. notes 5.80%, 9/25/23 (Netherlands) | 1,103,000 | 1,256,613 |
| JPMorgan Chase & Co. sr. unsec. notes Ser. MTN, 2.295%, 8/15/21 | 1,291,000 | 1,285,618 |
| | |
| | Principal | |
| CORPORATE BONDS AND NOTES (28.2%)* cont. | amount | Value |
| Financials cont. | | |
| KKR Group Finance Co., LLC 144A company guaranty sr. unsec. | | |
| unsub. notes 6.375%, 9/29/20 | $1,082,000 | $1,203,968 |
| Liberty Mutual Group, Inc. 144A company guaranty jr. unsec. sub. | | |
| bonds 7.80%, 3/15/37 | 57,000 | 72,248 |
| Liberty Property LP sr. unsec. unsub. notes 3.375%, 6/15/23 R | 92,000 | 93,551 |
| Lloyds Banking Group PLC unsec. sub. bonds 5.30%, 12/1/45 | | |
| (United Kingdom) | 1,655,000 | 1,945,750 |
| Lloyds Banking Group PLC unsec. sub. notes 4.50%, 11/4/24 | | |
| (United Kingdom) | 1,609,000 | 1,694,514 |
| Massachusetts Mutual Life Insurance Co. 144A unsec. sub. notes | | |
| 8.875%, 6/1/39 | 1,949,000 | 3,185,612 |
| Metropolitan Life Insurance Co. 144A unsec. sub. notes | | |
| 7.80%, 11/1/25 | 3,218,000 | 4,153,318 |
| Mid-America Apartments LP sr. unsec. notes 4.30%, 10/15/23 R | 61,000 | 64,713 |
| Mitsubishi UFJ Financial Group, Inc. sr. unsec. unsub. notes 3.85%, | | |
| 3/1/26 (Japan) | 626,000 | 652,800 |
| Neuberger Berman Group, LLC/Neuberger Berman Finance Corp. | | |
| 144A sr. unsec. notes 4.875%, 4/15/45 | 1,875,000 | 1,872,688 |
| OneAmerica Financial Partners, Inc. 144A sr. unsec. notes | | |
| 7.00%, 10/15/33 | 757,000 | 958,456 |
| Peachtree Corners Funding Trust 144A company guaranty sr. | | |
| unsec. unsub. bonds 3.976%, 2/15/25 | 481,000 | 490,419 |
| Primerica, Inc. sr. unsec. notes 4.75%, 7/15/22 | 146,000 | 158,324 |
| Prudential Financial, Inc. sr. unsec. notes 6.625%, 6/21/40 | 851,000 | 1,170,096 |
| Royal Bank of Canada unsec. sub. notes Ser. GMTN, 4.65%, | | |
| 1/27/26 (Canada) | 1,522,000 | 1,637,788 |
| Royal Bank of Scotland Group PLC sr. unsec. unsub. notes 3.875%, | | |
| 9/12/23 (United Kingdom) | 465,000 | 476,923 |
| Santander Issuances SAU company guaranty unsec. sub. notes | | |
| 5.179%, 11/19/25 (Spain) | 2,000,000 | 2,154,320 |
| Santander UK Group Holdings PLC 144A unsec. sub. notes 4.75%, | | |
| 9/15/25 (United Kingdom) | 460,000 | 481,944 |
| Santander UK PLC 144A unsec. sub. notes 5.00%, 11/7/23 | | |
| (United Kingdom) | 2,092,000 | 2,265,571 |
| Select Income REIT sr. unsec. unsub. notes 3.60%, 2/1/20 R | 844,000 | 855,047 |
| Select Income REIT sr. unsec. unsub. notes 2.85%, 2/1/18 R | 459,000 | 459,635 |
| SL Green Realty Corp company guaranty sr. unsec. unsub. notes | | |
| 5.00%, 8/15/18 R | 483,000 | 490,986 |
| Sumitomo Mitsui Financial Group, Inc. 144A unsec. sub. bonds | | |
| 4.436%, 4/2/24 (Japan) | 1,785,000 | 1,884,887 |
| Teachers Insurance & Annuity Association of America 144A unsec. | | |
| sub. bonds 4.90%, 9/15/44 | 311,000 | 353,271 |
| Teachers Insurance & Annuity Association of America 144A unsec. | | |
| sub. notes 6.85%, 12/16/39 | 667,000 | 923,209 |
| TIAA Asset Management Finance Co., LLC 144A sr. unsec. sub. | | |
| notes 4.125%, 11/1/24 | 33,000 | 34,897 |
| Toronto-Dominion Bank (The) unsec. sub. FRB 3.625%, | | |
| 9/15/31 (Canada) | 2,216,000 | 2,203,086 |
| UBS Group AG jr. unsec. sub. FRN 6.875%, perpetual | | |
| maturity (Switzerland) | 200,000 | 224,395 |
| | |
| | Principal | |
| CORPORATE BONDS AND NOTES (28.2%)* cont. | amount | Value |
| Financials cont. | | |
| UBS Group Funding Jersey, Ltd. 144A company guaranty sr. unsec. | | |
| notes 4.125%, 4/15/26 (Switzerland) | $2,110,000 | $2,219,047 |
| VEREIT Operating Partnership LP company guaranty sr. unsec. | | |
| notes 4.60%, 2/6/24 R | 2,925,000 | 3,078,878 |
| VEREIT Operating Partnership LP company guaranty sr. unsec. | | |
| unsub. bonds 4.875%, 6/1/26 R | 154,000 | 164,395 |
| Wells Fargo Bank, NA unsec. sub. notes Ser. BKNT, 6.60%, 1/15/38 | 250,000 | 341,036 |
| Willis Towers Watson PLC company guaranty sr. unsec. unsub. | | |
| notes 5.75%, 3/15/21 | 306,000 | 335,600 |
| WP Carey, Inc. sr. unsec. unsub. notes 4.60%, 4/1/24 R | 2,242,000 | 2,344,690 |
| | | 113,300,137 |
| Health care (1.7%) | | |
| AbbVie, Inc. sr. unsec. notes 3.60%, 5/14/25 | 431,000 | 443,048 |
| Amgen, Inc. sr. unsec. bonds 4.663%, 6/15/51 | 2,400,000 | 2,595,601 |
| Amgen, Inc. sr. unsec. unsub. notes 2.60%, 8/19/26 | 652,000 | 624,787 |
| Anthem, Inc. sr. unsec. unsub. notes 4.625%, 5/15/42 | 499,000 | 537,409 |
| Becton Dickinson and Co. sr. unsec. unsub. bonds 4.669%, 6/6/47 | 4,172,000 | 4,373,700 |
| Becton Dickinson and Co. sr. unsec. unsub. bonds 3.70%, 6/6/27 | 3,584,000 | 3,610,349 |
| HCA, Inc. company guaranty sr. bonds 5.25%, 6/15/26 | 454,000 | 482,943 |
| HCA, Inc. company guaranty sr. sub. bonds 5.50%, 6/15/47 | 980,000 | 997,150 |
| HCA, Inc. company guaranty sr. sub. notes 5.00%, 3/15/24 | 1,725,000 | 1,817,719 |
| Omega Healthcare Investors, Inc. company guaranty sr. unsec. | | |
| notes 4.50%, 4/1/27 R | 2,115,000 | 2,104,425 |
| Omega Healthcare Investors, Inc. company guaranty sr. unsec. | | |
| unsub. notes 4.95%, 4/1/24 R | 1,651,000 | 1,743,129 |
| Roche Holdings, Inc. 144A company guaranty sr. unsec. bonds | | |
| 4.00%, 11/28/44 (Switzerland) | 642,000 | 669,972 |
| Shire Acquisitions Investments Ireland DAC company guaranty sr. | | |
| unsec. unsub. notes 3.20%, 9/23/26 (Ireland) | 1,657,000 | 1,614,685 |
| Shire Acquisitions Investments Ireland DAC company guaranty sr. | | |
| unsec. unsub. notes 2.875%, 9/23/23 (Ireland) | 1,380,000 | 1,366,107 |
| Teva Pharmaceutical Finance Netherlands III BV company | | |
| guaranty sr. unsec. unsub. bonds 3.15%, 10/1/26 (Netherlands) | 2,768,000 | 2,448,429 |
| UnitedHealth Group, Inc. sr. unsec. unsub. notes 4.625%, 11/15/41 | 731,000 | 825,101 |
| | | 26,254,554 |
| Technology (1.5%) | | |
| Apple, Inc. sr. unsec. notes 3.45%, 5/6/24 | 1,643,000 | 1,711,625 |
| Apple, Inc. sr. unsec. unsub. notes 4.375%, 5/13/45 | 363,000 | 398,968 |
| Apple, Inc. sr. unsec. unsub. notes 3.85%, 5/4/43 | 502,000 | 508,833 |
| Broadcom Corp./Broadcom Cayman Finance, Ltd. 144A company | | |
| guaranty sr. unsec. unsub. notes 3.875%, 1/15/27 | 4,773,000 | 4,910,578 |
| Diamond 1 Finance Corp./Diamond 2 Finance Corp. 144A | | |
| company guaranty sr. unsec. notes 7.125%, 6/15/24 | 3,787,000 | 4,179,901 |
| Diamond 1 Finance Corp./Diamond 2 Finance Corp. 144A sr. bonds | | |
| 8.35%, 7/15/46 | 946,000 | 1,225,894 |
| Diamond 1 Finance Corp./Diamond 2 Finance Corp. 144A sr. notes | | |
| 5.45%, 6/15/23 | 4,299,000 | 4,710,592 |
| Jabil Circuit, Inc. sr. unsec. sub. notes 8.25%, 3/15/18 | 173,000 | 176,806 |
| Microsoft Corp. sr. unsec. unsub. bonds 2.40%, 8/8/26 | 1,292,000 | 1,247,270 |
| | |
| | Principal | |
| CORPORATE BONDS AND NOTES (28.2%)* cont. | amount | Value |
| Technology cont. | | |
| Oracle Corp. sr. unsec. unsub. notes 2.65%, 7/15/26 | $2,799,000 | $2,746,364 |
| VMware, Inc. sr. unsec. notes 3.90%, 8/21/27 | 1,800,000 | 1,803,256 |
| | | 23,620,087 |
| Transportation (0.3%) | | |
| Burlington Northern Santa Fe, LLC sr. unsec. notes 5.40%, 6/1/41 | 1,140,000 | 1,394,445 |
| Continental Airlines, Inc. Pass-Through Trust pass-through | | |
| certificates Ser. 97-4, Class A, 6.90%, 1/2/18 | 40,873 | 40,975 |
| Norfolk Southern Corp. 144A sr. unsec. unsub. bonds | | |
| 4.05%, 8/15/52 | 603,000 | 613,810 |
| Penske Truck Leasing Co. LP/PTL Finance Corp. 144A sr. unsec. | | |
| bonds 3.40%, 11/15/26 | 1,732,000 | 1,716,501 |
| Southwest Airlines Co. Pass Through Trust pass-through | | |
| certificates Ser. 07-1, Class A, 6.15%, 8/1/22 | 126,698 | 138,697 |
| United AirLines, Inc. Pass-Through Trust pass-through certificates | | |
| Ser. 07-1, Class A, 6.636%, 7/2/22 | 310,240 | 336,857 |
| United Airlines, Inc. Pass-Through Trust pass-through certificates | | |
| Ser. 14-2, Class A, 3.75%, 9/3/26 | 185,913 | 191,709 |
| | | 4,432,994 |
| Utilities and power (2.2%) | | |
| AES Corp./Virginia (The) sr. unsec. unsub. bonds 5.125%, 9/1/27 | 1,300,000 | 1,334,450 |
| American Transmission Systems, Inc. 144A sr. unsec. unsub. bonds | | |
| 5.00%, 9/1/44 | 1,421,000 | 1,613,255 |
| Appalachian Power Co. sr. unsec. unsub. notes Ser. L, | | |
| 5.80%, 10/1/35 | 435,000 | 525,974 |
| Arizona Public Services Co. sr. unsec. notes 4.50%, 4/1/42 | 159,000 | 176,250 |
| Berkshire Hathaway Energy Co. sr. unsec. bonds 6.50%, 9/15/37 | 307,000 | 416,441 |
| Berkshire Hathaway Energy Co. sr. unsec. unsub. bonds | | |
| 6.125%, 4/1/36 | 750,000 | 982,142 |
| Boardwalk Pipelines LP company guaranty sr. unsec. unsub. | | |
| 4.45%, 7/15/27 | 379,000 | 389,120 |
| Commonwealth Edison Co. sr. mtge. bonds 5.875%, 2/1/33 | 360,000 | 447,094 |
| Consolidated Edison Co. of New York, Inc. sr. unsec. unsub. notes | | |
| 4.20%, 3/15/42 | 532,000 | 573,040 |
| Duke Energy Carolinas, LLC sr. mtge. notes 4.25%, 12/15/41 | 296,000 | 322,660 |
| EDP Finance BV 144A sr. unsec. unsub. notes 5.25%, | | |
| 1/14/21 (Netherlands) | 345,000 | 372,505 |
| El Paso Natural Gas Co., LLC company guaranty sr. unsec. unsub. | | |
| notes 8.375%, 6/15/32 | 622,000 | 810,668 |
| Emera US Finance LP company guaranty sr. unsec. notes | | |
| 3.55%, 6/15/26 | 826,000 | 833,845 |
| Enbridge, Inc. sr. unsec. unsub. bonds 4.25%, 12/1/26 (Canada) | 927,000 | 977,512 |
| Energy Transfer Equity LP sr. sub. notes 5.875%, 1/15/24 | 4,189,000 | 4,545,065 |
| Energy Transfer Partners LP sr. unsec. unsub. bonds | | |
| 6.125%, 12/15/45 | 487,000 | 532,130 |
| Energy Transfer Partners LP sr. unsec. unsub. bonds | | |
| 4.20%, 4/15/27 | 169,000 | 170,978 |
| Energy Transfer Partners LP sr. unsec. unsub. notes 6.50%, 2/1/42 | 1,699,000 | 1,936,515 |
| Energy Transfer Partners LP sr. unsec. unsub. notes 5.20%, 2/1/22 | 318,000 | 343,843 |
| FirstEnergy Corp. sr. unsec. unsub. bonds Ser. B, 3.90%, 7/15/27 | 590,000 | 602,203 |
| FirstEnergy Corp. sr. unsec. unsub. bonds Ser. C, 4.85%, 7/15/47 | 985,000 | 1,061,883 |
| | |
| | Principal | |
| CORPORATE BONDS AND NOTES (28.2%)* cont. | amount | Value |
| Utilities and power cont. | | |
| FirstEnergy Transmission, LLC 144A sr. unsec. unsub. notes | | |
| 5.45%, 7/15/44 | $2,032,000 | $2,350,401 |
| Iberdrola International BV company guaranty sr. unsec. unsub. | | |
| bonds 6.75%, 7/15/36 (Spain) | 382,000 | 498,315 |
| IPALCO Enterprises, Inc. 144A sr. notes 3.70%, 9/1/24 | 1,140,000 | 1,142,945 |
| Kinder Morgan Energy Partners LP company guaranty sr. unsec. | | |
| notes 5.40%, 9/1/44 | 955,000 | 999,994 |
| Kinder Morgan Energy Partners LP company guaranty sr. unsec. | | |
| notes 3.50%, 3/1/21 | 593,000 | 607,000 |
| Kinder Morgan, Inc. company guaranty sr. unsec. unsub. notes | | |
| 3.15%, 1/15/23 | 899,000 | 904,381 |
| MidAmerican Funding, LLC sr. bonds 6.927%, 3/1/29 | 270,000 | 356,331 |
| NextEra Energy Capital Holdings, Inc. company guaranty jr. unsec. | | |
| sub. FRB BBA LIBOR USD 3 Month + 2.41%, 4.80%, 12/1/77 | 1,300,000 | 1,300,000 |
| Oncor Electric Delivery Co., LLC sr. notes 4.10%, 6/1/22 | 593,000 | 630,670 |
| Pacific Gas & Electric Co. sr. unsec. notes 6.35%, 2/15/38 | 221,000 | 285,678 |
| Pacific Gas & Electric Co. sr. unsec. unsub. notes 5.80%, 3/1/37 | 589,000 | 720,362 |
| PacifiCorp sr. mtge. bonds 6.25%, 10/15/37 | 188,000 | 252,865 |
| PPL WEM Ltd./Western Power Distribution, Ltd. 144A sr. unsec. | | |
| unsub. notes 5.375%, 5/1/21 (United Kingdom) | 1,313,000 | 1,420,125 |
| Puget Energy, Inc. sr. sub. notes 3.65%, 5/15/25 | 858,000 | 878,498 |
| Texas Gas Transmission, LLC 144A sr. unsec. notes 4.50%, 2/1/21 | 1,053,000 | 1,105,478 |
| Texas-New Mexico Power Co. 144A 1st sr. bonds Ser. A, | | |
| 9.50%, 4/1/19 | 2,130,000 | 2,325,883 |
| | | 34,746,499 |
| Total corporate bonds and notes (cost $420,764,588) | | $440,700,836 |
| | | |
| PURCHASED SWAP OPTIONS OUTSTANDING (1.6%)* | | | |
| Counterparty | | Notional/ | |
| Fixed right % to receive or (pay)/ | Expiration | contract | |
| Floating rate index/Maturity date | date/strike | amount | Value |
| Bank of America N.A. | | | |
| (1.9325)/3 month USD-LIBOR-BBA/Aug-19 | Aug-18/1.9325 | $556,570,000 | $1,836,681 |
| (2.2625)/3 month USD-LIBOR-BBA/Aug-22 | Aug-21/2.2625 | 250,456,300 | 1,440,124 |
| 2.2625/3 month USD-LIBOR-BBA/Aug-22 | Aug-21/2.2625 | 250,456,300 | 1,242,263 |
| 1.9325/3 month USD-LIBOR-BBA/Aug-19 | Aug-18/1.9325 | 556,570,000 | 740,238 |
| 2.234/3 month USD-LIBOR-BBA/Nov-27 | Nov-17/2.234 | 202,712,250 | 231,092 |
| 2.172/3 month USD-LIBOR-BBA/Nov-27 | Nov-17/2.172 | 202,712,250 | 93,248 |
| 2.214/3 month USD-LIBOR-BBA/Nov-27 | Nov-17/2.214 | 222,628,000 | 28,942 |
| Citibank, N.A. | | | |
| (2.518)/3 month USD-LIBOR-BBA/May-49 | May-19/2.518 | 24,489,050 | 2,089,406 |
| (1.896)/3 month USD-LIBOR-BBA/Dec-22 | Dec-17/1.896 | 71,465,000 | 747,524 |
| (1.975)/3 month USD-LIBOR-BBA/Nov-22 | Nov-17/1.975 | 111,313,400 | 723,537 |
| 2.276/3 month USD-LIBOR-BBA/Nov-27 | Nov-17/2.276 | 324,339,500 | 684,356 |
| (2.57)/3 month USD-LIBOR-BBA/Nov-22 | Nov-17/2.57 | 111,313,400 | 528,739 |
| (2.464)/3 month USD-LIBOR-BBA/Nov-27 | Nov-17/2.464 | 324,339,500 | 460,562 |
| 1.9175/3 month USD-LIBOR-BBA/Mar-19 | Mar-18/1.9175 | 333,940,000 | 270,491 |
| 2.57/3 month USD-LIBOR-BBA/Nov-22 | Nov-17/2.57 | 111,313,400 | 165,857 |
| 2.301/3 month USD-LIBOR-BBA/Nov-27 | Nov-17/2.301 | 162,169,800 | 142,709 |
| (2.429)/3 month USD-LIBOR-BBA/Nov-27 | Nov-17/2.429 | 243,494,800 | 136,357 |
| | | |
| PURCHASED SWAP OPTIONS OUTSTANDING (1.6%)* cont. | | |
| Counterparty | | Notional/ | |
| Fixed right % to receive or (pay)/ | Expiration | contract | |
| Floating rate index/Maturity date | date/strike | amount | Value |
| Citibank, N.A. cont. | | | |
| 2.175/3 month USD-LIBOR-BBA/Nov-27 | Nov-17/2.175 | $222,628,000 | $93,504 |
| 2.248/3 month USD-LIBOR-BBA/Nov-27 | Nov-17/2.248 | 111,314,000 | 90,164 |
| 1.975/3 month USD-LIBOR-BBA/Nov-22 | Nov-17/1.975 | 111,313,400 | 80,146 |
| 2.245/3 month USD-LIBOR-BBA/Nov-27 | Nov-17/2.245 | 243,494,800 | 77,918 |
| 1.6525/3 month USD-LIBOR-BBA/Dec-18 | Dec-17/1.6525 | 333,942,000 | 53,431 |
| 1.896/3 month USD-LIBOR-BBA/Dec-22 | Dec-17/1.896 | 71,465,000 | 36,447 |
| 1.541/3 month USD-LIBOR-BBA/Nov-18 | Nov-17/1.541 | 445,256,000 | 445 |
| Credit Suisse International | | | |
| (2.18)/3 month USD-LIBOR-BBA/Nov-27 | Nov-17/2.18 | 111,314,000 | 1,691,973 |
| (2.32)/3 month USD-LIBOR-BBA/Nov-27 | Nov-17/2.32 | 445,255,400 | 1,300,146 |
| 2.2655/3 month USD-LIBOR-BBA/Nov-27 | Nov-17/2.2655 | 111,314,000 | 248,230 |
| 2.1975/3 month USD-LIBOR-BBA/Nov-27 | Nov-17/2.1975 | 225,550,000 | 2,256 |
| Goldman Sachs International | | | |
| (1.6775)/3 month USD-LIBOR-BBA/Nov-18 | Nov-17/1.6775 | 267,153,600 | 865,578 |
| 2.695/3 month USD-LIBOR-BBA/Oct-23 | Oct-18/2.695 | 46,751,900 | 568,503 |
| 2.30/3 month USD-LIBOR-BBA/Nov-27 | Nov-17/2.30 | 162,169,800 | 538,404 |
| 2.27/3 month USD-LIBOR-BBA/Mar-28 | Mar-18/2.27 | 53,430,800 | 506,524 |
| 2.485/3 month USD-LIBOR-BBA/Mar-48 | Mar-18/2.485 | 22,262,850 | 494,458 |
| (2.41875)/3 month USD-LIBOR-BBA/Nov-27 | Nov-17/2.41875 | 324,339,500 | 470,292 |
| 1.9175/3 month USD-LIBOR-BBA/Oct-19 | Oct-18/1.9175 | 202,591,450 | 287,680 |
| 2.2245/3 month USD-LIBOR-BBA/Nov-27 | Nov-17/2.2245 | 202,712,250 | 285,824 |
| 2.156/3 month USD-LIBOR-BBA/Nov-27 | Nov-17/2.156 | 202,712,250 | 123,654 |
| 2.20125/3 month USD-LIBOR-BBA/Nov-27 | Nov-17/2.20125 | 324,339,500 | 110,275 |
| 1.6775/3 month USD-LIBOR-BBA/Nov-18 | Nov-17/1.6775 | 267,153,600 | 2,672 |
| 1.95/3 month USD-LIBOR-BBA/Nov-27 | Nov-17/1.95 | 121,747,000 | 122 |
| JPMorgan Chase Bank N.A. | | | |
| (1.919)/3 month USD-LIBOR-BBA/Aug-19 | Aug-18/1.919 | 556,570,000 | 1,881,207 |
| (2.25)/3 month USD-LIBOR-BBA/Aug-22 | Aug-21/2.25 | 250,456,300 | 1,452,647 |
| 2.25/3 month USD-LIBOR-BBA/Aug-22 | Aug-21/2.25 | 250,456,300 | 1,227,236 |
| 1.919/3 month USD-LIBOR-BBA/Aug-19 | Aug-18/1.919 | 556,570,000 | 712,410 |
| 2.2425/3 month USD-LIBOR-BBA/Dec-27 | Dec-17/2.2425 | 162,169,800 | 385,964 |
| (1.964)/3 month USD-LIBOR-BBA/Jan-21 | Jan-18/1.964 | 111,312,000 | 306,108 |
| 1.964/3 month USD-LIBOR-BBA/Jan-21 | Jan-18/1.964 | 111,312,000 | 240,432 |
| Total purchased swap options outstanding (cost $41,615,393) | | $25,696,776 |
| | | | |
| PURCHASED OPTIONS | Expiration | | | |
| OUTSTANDING (0.1%)* | date/strike | Notional | Contract | |
| Counterparty | price | amount | amount | Value |
| JPMorgan Chase Bank N.A. | | | | |
| Federal National Mortgage | | | | |
| Association 30 yr 3.00% TBA | | | | |
| commitments (Call) | Nov-17/$100.24 | $52,000,000 | $52,000,000 | $67,028 |
| Federal National Mortgage | | | | |
| Association 30 yr 3.00% TBA | | | | |
| commitments (Put) | Dec-17/100.52 | 68,000,000 | 68,000,000 | 556,716 |
| Federal National Mortgage | | | | |
| Association 30 yr 3.00% TBA | | | | |
| commitments (Put) | Dec-17/100.42 | 68,000,000 | 68,000,000 | 514,080 |
| | | | |
| PURCHASED OPTIONS | Expiration | | | |
| OUTSTANDING (0.1%)* cont. | date/strike | Notional | Contract | |
| Counterparty | price | amount | amount | Value |
| JPMorgan Chase Bank N.A. cont. | | | | |
| Federal National Mortgage | | | | |
| Association 30 yr 3.00% TBA | | | | |
| commitments (Put) | Dec-17/$100.33 | $68,000,000 | $68,000,000 | $473,416 |
| Total purchased options outstanding (cost $1,718,125) | | | $1,611,240 |
| | |
| | Principal | |
| ASSET-BACKED SECURITIES (0.5%)* | amount | Value |
| Mortgage Repurchase Agreement Financing Trust 144A FRB | | |
| Ser. 16-5, Class A, 1 Month US LIBOR + 1.17%, 2.405%, 6/10/19 | $5,948,000 | $5,948,000 |
| Station Place Securitization Trust 144A FRB Ser. 17-1, Class A, | | |
| 1 Month US LIBOR + 0.90%, 2.138%, 2/25/49 | 2,552,333 | 2,552,333 |
| Total asset-backed securities (cost $8,500,333) | | $8,500,333 |
| | |
| | Principal | |
| MUNICIPAL BONDS AND NOTES (0.2%)* | amount | Value |
| CA State G.O. Bonds (Build America Bonds), 7.50%, 4/1/34 | $770,000 | $1,128,774 |
| North TX, Tollway Auth. Rev. Bonds (Build America Bonds), | | |
| 6.718%, 1/1/49 | 675,000 | 1,010,711 |
| OH State U. Rev. Bonds (Build America Bonds), 4.91%, 6/1/40 | 845,000 | 1,010,907 |
| Total municipal bonds and notes (cost $2,294,663) | | $3,150,392 |
| | | |
| | Principal amount/ | |
| SHORT-TERM INVESTMENTS (7.9%)* | | shares | Value |
| Putnam Short Term Investment Fund 1.22% L | Shares | 20,657,092 | $20,657,092 |
| State Street Institutional U.S. Government Money Market Fund, | | | |
| Premier Class 0.96% P | Shares | 1,429,000 | 1,429,000 |
| U.S. Treasury Bills 1.033%, 12/14/17 # ∆ § | | $20,435,000 | 20,411,354 |
| U.S. Treasury Bills 1.037%, 12/7/17 # ∆ § | | 33,798,000 | 33,764,709 |
| U.S. Treasury Bills 1.063%, 1/11/18 ∆ § | | 7,577,000 | 7,561,421 |
| U.S. Treasury Bills 1.065%, 2/1/18 ∆ § | | 37,751,000 | 37,641,501 |
| U.S. Treasury Bills 1.068%, 2/8/18 ∆ § | | 949,000 | 946,077 |
| U.S. Treasury Bills 1.073%, 1/25/18 ∆ § | | 1,779,000 | 1,774,422 |
| Total short-term investments (cost $124,192,089) | | | $124,185,576 |
| |
| TOTAL INVESTMENTS | |
| Total investments (cost $2,710,464,198) | $2,690,186,178 |
Key to holding’s abbreviations
| |
| DAC | Designated Activity Company |
| FRB | Floating Rate Bonds: the rate shown is the current interest rate at the close of the reporting period. Rates may be subject to a cap or floor. For certain securities, the rate may represent a fixed rate |
| | currently in place at the close of the reporting period. |
| FRN | Floating Rate Notes: the rate shown is the current interest rate or yield at the close of the reporting period. Rates may be subject to a cap or floor. For certain securities, the rate may represent a fixed |
| | rate currently in place at the close of the reporting period. |
| G.O. Bonds | General Obligation Bonds |
| IFB | Inverse Floating Rate Bonds, which are securities that pay interest rates that vary inversely to changes in the market interest rates. As interest rates rise, inverse floaters produce less current |
| | income. The rate shown is the current interest rate at the close of the reporting period. Rates may be subject to a cap or floor. |
| |
| IO | Interest Only |
| PO | Principal Only |
| TBA | To Be Announced Commitments |
Notes to the fund’s portfolio
Unless noted otherwise, the notes to the fund’s portfolio are for the close of the fund’s reporting period, which ran from November 1, 2016 through October 31, 2017 (the reporting period). Within the following notes to the portfolio, references to “ASC 820” represent Accounting Standards Codification 820 Fair Value Measurements and Disclosures, references to “Putnam Management” represent Putnam Investment Management, LLC, the fund’s manager, an indirect wholly-owned subsidiary of Putnam Investments, LLC and references to “OTC”, if any, represent over-the-counter.
* Percentages indicated are based on net assets of $1,565,242,117.
† This security is non-income-producing.
# This security, in part or in entirety, was pledged and segregated with the broker to cover margin requirements for futures contracts at the close of the reporting period. Collateral at period end totaled $4,492,147 and is included in Investments in securities on the Statement of assets and liabilities (Notes 1 and 8).
∆ This security, in part or in entirety, was pledged and segregated with the custodian for collateral on certain derivative contracts at the close of the reporting period. Collateral at period end totaled $17,957,934 and is included in Investments in securities on the Statement of assets and liabilities (Notes 1 and 8).
§ This security, in part or in entirety, was pledged and segregated with the custodian for collateral on the initial margin on certain centrally cleared derivative contracts at the close of the reporting period. Collateral at period end totaled $48,468,853 and is included in Investments in securities on the Statement of assets and liabilities (Notes 1 and 8).
i This security was pledged, or purchased with cash that was pledged, to the fund for collateral on certain derivative contracts (Note 1).
L Affiliated company (Note 5). The rate quoted in the security description is the annualized 7-day yield of the fund at the close of the reporting period.
P This security was pledged, or purchased with cash that was pledged, to the fund for collateral on certain derivative contracts. The rate quoted in the security description is the annualized 7-day yield of the fund at the close of the reporting period (Note 1).
R Real Estate Investment Trust.
W The rate shown represents the weighted average coupon associated with the underlying mortgage pools. Rates may be subject to a cap or floor.
At the close of the reporting period, the fund maintained liquid assets totaling $718,900,378 to cover certain derivative contracts and delayed delivery securities.
Unless otherwise noted, the rates quoted in Short-term investments security descriptions represent the weighted average yield to maturity.
Debt obligations are considered secured unless otherwise indicated.
144A after the name of an issuer represents securities exempt from registration under Rule 144A of the Securities Act of 1933, as amended. These securities may be resold in transactions exempt from registration, normally to qualified institutional buyers.
See Note 1 to the financial statements regarding TBA commitments.
The dates shown on debt obligations are the original maturity dates.
| | | | | |
| FUTURES CONTRACTS OUTSTANDING at 10/31/17 | | | |
| | | | | | Unrealized |
| | Number of | Notional | | Expiration | appreciation/ |
| | contracts | amount | Value | date | (depreciation) |
| U.S. Treasury Bond Ultra 30 yr (Long) | 1,074 | $176,975,063 | $176,975,063 | Dec-17 | $(3,551,036) |
| Unrealized appreciation | | | | | — |
| Unrealized depreciation | | | | | (3,551,036) |
| Total | | | | | $(3,551,036) |
| | | |
| WRITTEN SWAP OPTIONS OUTSTANDING at 10/31/17 (premiums $45,135,373) | |
| Counterparty | | Notional/ | |
| Fixed Obligation % to receive or (pay)/ | Expiration | contract | |
| Floating rate index/Maturity date | date/strike | amount | Value |
| Bank of America N.A. | | | |
| 2.506/3 month USD-LIBOR-BBA/Nov-27 | Nov-17/2.506 | $222,628,000 | $13,358 |
| (2.296)/3 month USD-LIBOR-BBA/Nov-27 | Nov-17/2.296 | 202,712,250 | 506,781 |
| (2.2625)/3 month USD-LIBOR-BBA/Aug-19 | Aug-18/2.2625 | 250,456,300 | 548,499 |
| 2.2625/3 month USD-LIBOR-BBA/Aug-19 | Aug-18/2.2625 | 250,456,300 | 743,855 |
| (1.9325)/3 month USD-LIBOR-BBA/Aug-20 | Aug-19/1.9325 | 556,570,000 | 1,163,231 |
| 1.9325/3 month USD-LIBOR-BBA/Aug-20 | Aug-19/1.9325 | 556,570,000 | 2,259,674 |
| Citibank, N.A. | | | |
| (1.755)/3 month USD-LIBOR-BBA/Nov-18 | Nov-17/1.755 | 445,256,000 | 445 |
| (2.212)/3 month USD-LIBOR-BBA/Nov-27 | Nov-17/2.212 | 162,169,800 | 8,108 |
| (1.642)/3 month USD-LIBOR-BBA/Dec-19 | Dec-17/1.642 | 222,628,000 | 11,131 |
| (2.00)/3 month USD-LIBOR-BBA/Dec-18 | Dec-17/2.00 | 333,942,000 | 56,770 |
| 2.39/3 month USD-LIBOR-BBA/Nov-27 | Nov-17/2.39 | 162,169,800 | 162,170 |
| (2.257)/3 month USD-LIBOR-BBA/Nov-27 | Nov-17/2.257 | 111,313,400 | 225,966 |
| (2.05)/3 month USD-LIBOR-BBA/Mar-19 | Mar-18/2.05 | 333,940,000 | 270,491 |
| (2.337)/3 month USD-LIBOR-BBA/Nov-27 | Nov-17/2.337 | 121,747,400 | 283,671 |
| 2.398/3 month USD-LIBOR-BBA/Nov-27 | Nov-17/2.398 | 166,970,700 | 332,272 |
| 2.337/3 month USD-LIBOR-BBA/Nov-27 | Nov-17/2.337 | 121,747,400 | 410,289 |
| 2.37/3 month USD-LIBOR-BBA/Nov-27 | Nov-17/2.37 | 162,169,800 | 673,005 |
| 2.3635/3 month USD-LIBOR-BBA/Nov-27 | Nov-17/2.3635 | 222,628,000 | 899,417 |
| (2.37)/3 month USD-LIBOR-BBA/Nov-27 | Nov-17/2.37 | 162,169,800 | 900,042 |
| 1.642/3 month USD-LIBOR-BBA/Dec-19 | Dec-17/1.642 | 222,628,000 | 941,716 |
| 2.257/3 month USD-LIBOR-BBA/Nov-27 | Nov-17/2.257 | 111,313,400 | 1,231,126 |
| 2.208/3 month USD-LIBOR-BBA/May-24 | May-19/2.208 | 111,314,000 | 2,111,627 |
| Credit Suisse International | | | |
| (2.32)/3 month USD-LIBOR-BBA/Nov-27 | Nov-17/2.32 | 445,255,400 | 231,533 |
| 2.4155/3 month USD-LIBOR-BBA/Nov-27 | Nov-17/2.4155 | 166,970,700 | 512,600 |
| 2.295/3 month USD-LIBOR-BBA/Nov-27 | Nov-17/2.295 | 333,942,000 | 1,749,856 |
| Goldman Sachs International | | | |
| 2.5525/3 month USD-LIBOR-BBA/Nov-27 | Nov-17/2.5525 | 121,747,000 | 122 |
| (1.495)/3 month USD-LIBOR-BBA/Nov-18 | Nov-17/1.495 | 445,256,000 | 445 |
| 2.6025/3 month USD-LIBOR-BBA/Nov-27 | Nov-17/2.6025 | 162,169,800 | 56,759 |
| (2.31)/3 month USD-LIBOR-BBA/Nov-27 | Nov-17/2.31 | 162,169,800 | 353,530 |
| (2.293)/3 month USD-LIBOR-BBA/Nov-27 | Nov-17/2.293 | 202,712,250 | 600,028 |
| 1.495/3 month USD-LIBOR-BBA/Nov-18 | Nov-17/1.495 | 445,256,000 | 854,892 |
| (2.3025)/3 month USD-LIBOR-BBA/Oct-19 | Oct-18/2.3025 | 445,256,000 | 948,395 |
| 2.31/3 month USD-LIBOR-BBA/Nov-27 | Nov-17/2.31 | 162,169,800 | 956,802 |
| (2.46)/3 month USD-LIBOR-BBA/Mar-38 | Mar-18/2.46 | 60,109,450 | 1,003,227 |
| JPMorgan Chase Bank N.A. | | | |
| 2.6525/3 month USD-LIBOR-BBA/Dec-27 | Dec-17/2.6525 | 162,169,800 | 58,381 |
| (2.3205)/3 month USD-LIBOR-BBA/Jan-28 | Jan-18/2.3205 | 35,842,500 | 252,331 |
| 2.4115/3 month USD-LIBOR-BBA/Jan-28 | Jan-18/2.4115 | 35,842,500 | 273,837 |
| (6.00 Floor)//Mar-18 | Mar-18/6.00 Floor | 21,202,000 | 489,766 |
| (2.25)/3 month USD-LIBOR-BBA/Aug-19 | Aug-18/2.25 | 250,456,300 | 533,472 |
| 2.25/3 month USD-LIBOR-BBA/Aug-19 | Aug-18/2.25 | 250,456,300 | 758,883 |
| | | |
| WRITTEN SWAP OPTIONS OUTSTANDING at 10/31/17 (premiums $45,135,373) cont. | |
| Counterparty | | Notional/ | |
| Fixed Obligation % to receive or (pay)/ | Expiration | contract | |
| Floating rate index/Maturity date | date/strike | amount | Value |
| JPMorgan Chase Bank N.A. cont. | | | |
| (1.919)/3 month USD-LIBOR-BBA/Aug-20 | Aug-19/1.919 | $556,570,000 | $1,129,837 |
| 1.919/3 month USD-LIBOR-BBA/Aug-20 | Aug-19/1.919 | 556,570,000 | 2,298,636 |
| Total | | | $26,816,976 |
| | | | |
| WRITTEN OPTIONS OUTSTANDING at 10/31/17 (premiums $1,718,125) | | |
| | Expiration | Notional | Contract | |
| | date/strike price | amount | amount | Value |
| JPMorgan Chase Bank N.A. | | | | |
| Federal National Mortgage | | | | |
| Association 30 yr 3.00% TBA | | | | |
| commitments (Put) | Dec-17/$99.96 | $68,000,000 | $68,000,000 | $332,928 |
| Federal National Mortgage | | | | |
| Association 30 yr 3.00% TBA | | | | |
| commitments (Put) | Dec-17/99.86 | 68,000,000 | 68,000,000 | 302,668 |
| Federal National Mortgage | | | | |
| Association 30 yr 3.00% TBA | | | | |
| commitments (Put) | Dec-17/99.77 | 68,000,000 | 68,000,000 | 274,448 |
| Federal National Mortgage | | | | |
| Association 30 yr 3.00% TBA | | | | |
| commitments (Put) | Dec-17/99.40 | 68,000,000 | 68,000,000 | 182,240 |
| Federal National Mortgage | | | | |
| Association 30 yr 3.00% TBA | | | | |
| commitments (Put) | Dec-17/99.30 | 68,000,000 | 68,000,000 | 163,472 |
| Federal National Mortgage | | | | |
| Association 30 yr 3.00% TBA | | | | |
| commitments (Put) | Nov-17/100.24 | 52,000,000 | 52,000,000 | 150,332 |
| Federal National Mortgage | | | | |
| Association 30 yr 3.00% TBA | | | | |
| commitments (Put) | Dec-17/99.21 | 68,000,000 | 68,000,000 | 146,336 |
| Total | | | | $1,552,424 |
| | | | |
| FORWARD PREMIUM SWAP OPTION CONTRACTS OUTSTANDING at 10/31/17 | | |
| Counterparty | | | | |
| Fixed right or obligation % to receive | | Notional/ | Premium | Unrealized |
| or (pay)/Floating rate index/ | Expiration | contract | receivable/ | appreciation/ |
| Maturity date | date/strike | amount | (payable) | (depreciation) |
| Bank of America N.A. | | | | |
| (2.647)/3 month USD-LIBOR-BBA/ | | | | |
| Jun-29 (Purchased) | Jun-24/2.647 | $55,656,700 | $(2,176,177) | $5,566 |
| (2.203)/3 month USD-LIBOR-BBA/ | | | | |
| Jun-24 (Purchased) | Jun-19/2.203 | 55,656,700 | (1,113,134) | (2,783) |
| 2.785/3 month USD-LIBOR-BBA/ | | | | |
| Jan-47 (Purchased) | Jan-27/2.785 | 33,394,000 | (3,583,176) | (144,596) |
| 2.5925/3 month USD-LIBOR-BBA/ | | | | |
| Jan-27 (Purchased) | Jan-19/2.5925 | 33,394,000 | (1,177,139) | (176,988) |
| 2.647/3 month USD-LIBOR-BBA/ | | | | |
| Jun-29 (Purchased) | Jun-24/2.647 | 55,656,700 | (2,176,177) | (208,156) |
| | | | |
| FORWARD PREMIUM SWAP OPTION CONTRACTS OUTSTANDING at 10/31/17 cont. | |
| Counterparty | | | | |
| Fixed right or obligation % to receive | | Notional/ | Premium | Unrealized |
| or (pay)/Floating rate index/ | Expiration | contract | receivable/ | appreciation/ |
| Maturity date | date/strike | amount | (payable) | (depreciation) |
| Bank of America N.A. cont. | | | | |
| (2.785)/3 month USD-LIBOR-BBA/ | | | | |
| Jan-47 (Purchased) | Jan-27/2.785 | $33,394,000 | $(3,583,176) | $(237,097) |
| 2.203/3 month USD-LIBOR-BBA/ | | | | |
| Jun-24 (Purchased) | Jun-19/2.203 | 55,656,700 | (1,113,134) | (318,913) |
| (2.5925)/3 month USD-LIBOR-BBA/ | | | | |
| Jan-27 (Purchased) | Jan-19/2.5925 | 33,394,000 | (1,177,139) | (589,738) |
| 2.7175/3 month USD-LIBOR-BBA/ | | | | |
| Jan-47 (Written) | Jan-19/2.7175 | 33,394,000 | 3,017,148 | 1,204,856 |
| (2.7175)/3 month USD-LIBOR-BBA/ | | | | |
| Jan-47 (Written) | Jan-19/2.7175 | 33,394,000 | 3,017,148 | 692,926 |
| (2.413)/3 month USD-LIBOR-BBA/ | | | | |
| Jun-29 (Written) | Jun-19/2.413 | 55,656,700 | 2,140,000 | 571,594 |
| 2.413/3 month USD-LIBOR-BBA/ | | | | |
| Jun-29 (Written) | Jun-19/2.413 | 55,656,700 | 2,140,000 | 43,969 |
| Barclays Bank PLC | | | | |
| (2.205)/3 month USD-LIBOR-BBA/ | | | | |
| Jun-24 (Purchased) | Jun-19/2.205 | 55,656,700 | (1,113,134) | (5,566) |
| 2.43/3 month USD-LIBOR-BBA/ | | | | |
| Feb-22 (Purchased) | Feb-19/2.43 | 33,394,000 | (465,846) | (41,743) |
| (2.43)/3 month USD-LIBOR-BBA/ | | | | |
| Feb-22 (Purchased) | Feb-19/2.43 | 33,394,000 | (465,846) | (277,838) |
| 2.205/3 month USD-LIBOR-BBA/ | | | | |
| Jun-24 (Purchased) | Jun-19/2.205 | 55,656,700 | (1,113,134) | (316,687) |
| Citibank, N.A. | | | | |
| 2.206/3 month USD-LIBOR-BBA/ | | | | |
| Nov-27 (Purchased) | Nov-17/2.206 | 111,314,000 | (166,971) | (2,226) |
| (2.654)/3 month USD-LIBOR-BBA/ | | | | |
| Jun-29 (Purchased) | Jun-24/2.654 | 55,656,700 | (2,176,177) | (2,783) |
| 2.654/3 month USD-LIBOR-BBA/ | | | | |
| Jun-29 (Purchased) | Jun-24/2.654 | 55,656,700 | (2,176,177) | (200,364) |
| (2.42)/3 month USD-LIBOR-BBA/ | | | | |
| Jun-29 (Written) | Jun-19/2.42 | 55,656,700 | 2,142,783 | 558,793 |
| 2.42/3 month USD-LIBOR-BBA/ | | | | |
| Jun-29 (Written) | Jun-19/2.42 | 55,656,700 | 2,131,652 | 54,544 |
| 2.507/3 month USD-LIBOR-BBA/ | | | | |
| Nov-27 (Written) | Nov-17/2.507 | 111,314,000 | 166,971 | (4,453) |
| Credit Suisse International | | | | |
| (2.18)/3 month USD-LIBOR-BBA/ | | | | |
| Nov-27 (Written) | Nov-17/2.18 | 111,314,000 | 5,566 | 5,566 |
| Goldman Sachs International | | | | |
| 2.8175/3 month USD-LIBOR-BBA/ | | | | |
| Mar-47 (Purchased) | Mar-27/2.8175 | 6,678,900 | (843,211) | (6,011) |
| (2.8175)/3 month USD-LIBOR-BBA/ | | | | |
| Mar-47 (Purchased) | Mar-27/2.8175 | 6,678,900 | (843,211) | (53,164) |
| | | | |
| FORWARD PREMIUM SWAP OPTION CONTRACTS OUTSTANDING at 10/31/17 cont. | |
| Counterparty | | | | |
| Fixed right or obligation % to receive | | Notional/ | Premium | Unrealized |
| or (pay)/Floating rate index/ | Expiration | contract | receivable/ | appreciation/ |
| Maturity date | date/strike | amount | (payable) | (depreciation) |
| JPMorgan Chase Bank N.A. | | | | |
| 2.8325/3 month USD-LIBOR-BBA/ | | | | |
| Feb-52 (Purchased) | Feb-22/2.8325 | $33,394,000 | $(4,662,637) | $(155,616) |
| (2.8325)/3 month USD-LIBOR-BBA/ | | | | |
| Feb-52 (Purchased) | Feb-22/2.8325 | 33,394,000 | (4,662,637) | (1,033,210) |
| 2.79/3 month USD-LIBOR-BBA/ | | | | |
| Feb-49 (Written) | Feb-19/2.79 | 33,394,000 | 3,170,760 | 1,446,628 |
| (2.79)/3 month USD-LIBOR-BBA/ | | | | |
| Feb-49 (Written) | Feb-19/2.79 | 33,394,000 | 3,170,760 | 390,042 |
| (5.00 Floor)//Mar-21 (Written) | Mar-21/5.00 | 1,000,000 | 222,000 | 102,420 |
| Morgan Stanley & Co. International PLC | | | | |
| 1.85125/3 month USD-LIBOR-BBA/ | | | | |
| Apr-19 (Purchased) | Apr-18/1.85125 | 333,942,000 | (350,639) | (46,752) |
| (2.01)/3 month USD-LIBOR-BBA/ | | | | |
| Apr-19 (Written) | Apr-18/2.01 | 333,942,000 | 350,639 | (335) |
| Unrealized appreciation | | | | 5,076,904 |
| Unrealized depreciation | | | | (3,825,019) |
| Total | | | | $1,251,885 |
| | | |
| TBA SALE COMMITMENTS OUTSTANDING at 10/31/17 (proceeds receivable $458,989,180) | |
| | Principal | Settlement | |
| Agency | amount | date | Value |
| Federal Home Loan Mortgage Corporation, 3.50%, 11/1/47 | $2,000,000 | 11/13/17 | $2,055,938 |
| Federal Home Loan Mortgage Corporation, 3.00%, 11/1/47 | 2,000,000 | 11/13/17 | 2,001,797 |
| Federal National Mortgage Association, 4.50%, 11/1/47 | 16,000,000 | 11/13/17 | 17,106,250 |
| Federal National Mortgage Association, 4.00%, 11/1/47 | 11,000,000 | 11/13/17 | 11,544,843 |
| Federal National Mortgage Association, 3.50%, 11/1/47 | 358,000,000 | 11/13/17 | 367,984,835 |
| Federal National Mortgage Association, 3.00%, 11/1/47 | 58,000,000 | 11/13/17 | 58,036,249 |
| Total | | | $458,729,912 |
| | | | | | |
| CENTRALLY CLEARED INTEREST RATE SWAP CONTRACTS OUTSTANDING at 10/31/17 | |
| | | Upfront | | | | |
| | | premium | | | | Unrealized |
| | | received | Termination | Payments | Payments | appreciation/ |
| Notional amount | Value | (paid) | date | made by fund | received by fund | (depreciation) |
| $111,314,000 | $1,645,221 | $(741,046) | 10/31/27 | 2.18%— | 3 month USD- | $908,442 |
| | | | | Semiannually | LIBOR-BBA— | |
| | | | | | Quarterly | |
| 333,942,000 | 1,455,987 | 1,082,887 | 10/31/27 | 3 month USD- | 2.295%— | (385,902) |
| | | | | LIBOR-BBA— | Semiannually | |
| | | | | Quarterly | | |
| 111,314,000 | 1,420,367 | (223,436) | 10/3/27 | 2.201%— | 3 month USD- | 1,125,983 |
| | | | | Semiannually | LIBOR-BBA— | |
| | | | | | Quarterly | |
| 111,314,000 | 935,038 | (190,042) | 10/3/27 | 2.2495%— | 3 month USD- | 669,849 |
| | | | | Semiannually | LIBOR-BBA— | |
| | | | | | Quarterly | |
| | | | | | |
| CENTRALLY CLEARED INTEREST RATE SWAP CONTRACTS OUTSTANDING at 10/31/17 cont. | |
| | | Upfront | | | | |
| | | premium | | | | Unrealized |
| | | received | Termination | Payments | Payments | appreciation/ |
| Notional amount | Value | (paid) | date | made by fund | received by fund | (depreciation) |
| $111,314,000 | $1,025,202 | $(190,042) | 10/3/27 | 2.2405%— | 3 month USD- | $760,792 |
| | | | | Semiannually | LIBOR-BBA— | |
| | | | | | Quarterly | |
| 168,768,000 | 3,869,850 | (1,092,592) | 10/31/27 | 2.09%— | 3 month USD- | 2,783,728 |
| | | | | Semiannually | LIBOR-BBA— | |
| | | | | | Quarterly | |
| 506,304,000 | 6,106,026 | 1,436,478 | 10/31/27 | 3 month USD- | 2.21%— | (4,688,958) |
| | | | | LIBOR-BBA— | Semiannually | |
| | | | | Quarterly | | |
| 337,536,000 | 172,143 | (351,238) | 10/31/27 | 2.34875%— | 3 month USD- | (510,441) |
| | | | | Semiannually | LIBOR-BBA— | |
| | | | | | Quarterly | |
| 41,743,100 | 633,243 | (257,385) | 10/18/27 | 2.176%— | 3 month USD- | 365,035 |
| | | | | Semiannually | LIBOR-BBA— | |
| | | | | | Quarterly | |
| 166,970,700 | 1,407,563 | (1,069,825) | 10/31/27 | 2.25%— | 3 month USD- | 344,139 |
| | | | | Semiannually | LIBOR-BBA— | |
| | | | | | Quarterly | |
| 500,912,700 | 991,807 | 1,198,554 | 10/31/27 | 3 month USD- | 2.365%— | 2,171,158 |
| | | | | LIBOR-BBA— | Semiannually | |
| | | | | Quarterly | | |
| 83,485,350 | 866,578 | (494,728) | 10/25/27 | 2.23%— | 3 month USD- | 363,019 |
| | | | | Semiannually | LIBOR-BBA— | |
| | | | | | Quarterly | |
| 250,456,350 | 125,228 | 540,281 | 10/25/27 | 3 month USD- | 2.33925%— | 446,106 |
| | | | | LIBOR-BBA— | Semiannually | |
| | | | | Quarterly | | |
| 605,968,600 | 781,699 E | (24,803) | 12/20/19 | 1.80%— | 3 month USD- | 756,897 |
| | | | | Semiannually | LIBOR-BBA— | |
| | | | | | Quarterly | |
| 577,400 | 1,674 E | 295 | 12/20/22 | 2.05%— | 3 month USD- | 1,969 |
| | | | | Semiannually | LIBOR-BBA— | |
| | | | | | Quarterly | |
| 227,288,700 | 659,137 E | (119,168) | 12/20/22 | 3 month USD- | 2.05%— | (778,306) |
| | | | | LIBOR-BBA— | Semiannually | |
| | | | | Quarterly | | |
| 285,609,700 | 3,004,614 E | (1,386,761) | 12/20/27 | 2.25%— | 3 month USD- | 1,617,853 |
| | | | | Semiannually | LIBOR-BBA— | |
| | | | | | Quarterly | |
| 44,344,400 | 925,911 E | (460,237) | 12/20/47 | 2.50%— | 3 month USD- | 465,674 |
| | | | | Semiannually | LIBOR-BBA— | |
| | | | | | Quarterly | |
| 40,216,000 | 178,961 | (292) | 10/2/27 | 2.2935%— | 3 month USD- | 149,034 |
| | | | | Semiannually | LIBOR-BBA— | |
| | | | | | Quarterly | |
| 117,933,000 | 423,379 | 730,328 | 11/1/27 | 3 month USD- | 2.306%— | 306,949 |
| | | | | LIBOR-BBA— | Semiannually | |
| | | | | Quarterly | | |
| | | | | | |
| CENTRALLY CLEARED INTEREST RATE SWAP CONTRACTS OUTSTANDING at 10/31/17 cont. | |
| | | Upfront | | | | |
| | | premium | | | | Unrealized |
| | | received | Termination | Payments | Payments | appreciation/ |
| Notional amount | Value | (paid) | date | made by fund | received by fund | (depreciation) |
| $67,615,000 | $269,108 | $(552) | 10/17/27 | 2.30%— | 3 month USD- | $246,205 |
| | | | | Semiannually | LIBOR-BBA— | |
| | | | | | Quarterly | |
| 26,715,400 | 100,717 | (218) | 11/1/27 | 2.304%— | 3 month USD- | 100,499 |
| | | | | Semiannually | LIBOR-BBA— | |
| | | | | | Quarterly | |
| 117,933,000 | 469,373 | 470,876 | 10/17/27 | 2.30%— | 3 month USD- | 901,266 |
| | | | | Semiannually | LIBOR-BBA— | |
| | | | | | Quarterly | |
| 41,095,500 | 175,478 | (298) | 10/4/27 | 2.2955%— | 3 month USD- | 147,117 |
| | | | | Semiannually | LIBOR-BBA— | |
| | | | | | Quarterly | |
| 108,735,000 | 428,416 | (789) | 10/10/27 | 2.30%— | 3 month USD- | 371,465 |
| | | | | Semiannually | LIBOR-BBA— | |
| | | | | | Quarterly | |
| 61,341,500 | 206,721 | (445) | 10/5/27 | 2.3057%— | 3 month USD- | 165,891 |
| | | | | Semiannually | LIBOR-BBA— | |
| | | | | | Quarterly | |
| 61,341,500 | 217,762 | (445) | 10/5/27 | 2.30369%— | 3 month USD- | 177,022 |
| | | | | Semiannually | LIBOR-BBA— | |
| | | | | | Quarterly | |
| 81,084,900 | 347,043 E | (662) | 11/7/27 | 2.301%— | 3 month USD- | 346,382 |
| | | | | Semiannually | LIBOR-BBA— | |
| | | | | | Quarterly | |
| 18,361,500 | 118,432 | (133) | 10/6/27 | 3 month USD- | 2.2715%— | (107,459) |
| | | | | LIBOR-BBA— | Semiannually | |
| | | | | Quarterly | | |
| 22,675,000 | 102,718 | (165) | 10/10/27 | 3 month USD- | 2.2935%— | (91,257) |
| | | | | LIBOR-BBA— | Semiannually | |
| | | | | Quarterly | | |
| 12,721,000 | 55,972 | (92) | 10/10/27 | 3 month USD- | 2.2949%— | (49,532) |
| | | | | LIBOR-BBA— | Semiannually | |
| | | | | Quarterly | | |
| 10,636,000 | 30,632 | (77) | 10/10/27 | 2.31178%— | 3 month USD- | 24,988 |
| | | | | Semiannually | LIBOR-BBA— | |
| | | | | | Quarterly | |
| 12,721,000 | 62,078 | (92) | 10/10/27 | 3 month USD- | 2.28962%— | (55,678) |
| | | | | LIBOR-BBA— | Semiannually | |
| | | | | Quarterly | | |
| 19,210,400 | 33,426 | (140) | 10/10/27 | 2.3245%— | 3 month USD- | 23,090 |
| | | | | Semiannually | LIBOR-BBA— | |
| | | | | | Quarterly | |
| 19,210,400 | 36,116 | (140) | 10/10/27 | 2.32295%— | 3 month USD- | 25,797 |
| | | | | Semiannually | LIBOR-BBA— | |
| | | | | | Quarterly | |
| 30,974,000 | 5,266 | (224) | 10/10/27 | 2.34566%— | 3 month USD- | (22,313) |
| | | | | Semiannually | LIBOR-BBA— | |
| | | | | | Quarterly | |
| | | | | | |
| CENTRALLY CLEARED INTEREST RATE SWAP CONTRACTS OUTSTANDING at 10/31/17 cont. | |
| | | Upfront | | | | |
| | | premium | | | | Unrealized |
| | | received | Termination | Payments | Payments | appreciation/ |
| Notional amount | Value | (paid) | date | made by fund | received by fund | (depreciation) |
| $30,974,000 | $36,859 | $(224) | 10/10/27 | 2.357%— | 3 month USD- | $(54,112) |
| | | | | Semiannually | LIBOR-BBA— | |
| | | | | | Quarterly | |
| 86,824,900 | 121,555 E | (708) | 11/8/27 | 2.364%— | 3 month USD- | (122,263) |
| | | | | Semiannually | LIBOR-BBA— | |
| | | | | | Quarterly | |
| 20,291,000 | 44,234 | (147) | 10/17/27 | 2.32%— | 3 month USD- | 37,222 |
| | | | | Semiannually | LIBOR-BBA— | |
| | | | | | Quarterly | |
| 73,467,100 | 209,381 | (533) | 10/18/27 | 3 month USD- | 2.3125%— | (187,246) |
| | | | | LIBOR-BBA— | Semiannually | |
| | | | | Quarterly | | |
| 15,253,000 | 84,807 | (110) | 10/17/27 | 3 month USD- | 2.2825%— | (79,979) |
| | | | | LIBOR-BBA— | Semiannually | |
| | | | | Quarterly | | |
| 27,828,300 | 261,308 | (202) | 10/18/27 | 2.24%— | 3 month USD- | 253,248 |
| | | | | Semiannually | LIBOR-BBA— | |
| | | | | | Quarterly | |
| 122,445,200 | 873,034 E | (999) | 11/20/27 | 2.275%— | 3 month USD- | 872,035 |
| | | | | Semiannually | LIBOR-BBA— | |
| | | | | | Quarterly | |
| 42,993,600 | 335,780 | (312) | 10/18/27 | 3 month USD- | 2.2576%— | (323,678) |
| | | | | LIBOR-BBA— | Semiannually | |
| | | | | Quarterly | | |
| 42,993,600 | 316,433 | (312) | 10/18/27 | 3 month USD- | 2.26256%— | (304,254) |
| | | | | LIBOR-BBA— | Semiannually | |
| | | | | Quarterly | | |
| 42,993,600 | 325,032 | (312) | 10/18/27 | 3 month USD- | 2.6031%— | (312,888) |
| | | | | LIBOR-BBA— | Semiannually | |
| | | | | Quarterly | | |
| 42,993,600 | 279,888 | (312) | 10/18/27 | 3 month USD- | 2.27191%— | (267,565) |
| | | | | LIBOR-BBA— | Semiannually | |
| | | | | Quarterly | | |
| 42,993,600 | 288,057 | (312) | 10/18/27 | 3 month USD- | 2.26987%— | (275,765) |
| | | | | LIBOR-BBA— | Semiannually | |
| | | | | Quarterly | | |
| 445,255,400 | 1,073,066 E | (3,233) | 11/3/27 | 3 month USD- | 2.32%— | (1,076,298) |
| | | | | LIBOR-BBA— | Semiannually | |
| | | | | Quarterly | | |
| 41,742,675 | 434,541 | (354,281) | 10/27/27 | 2.23%— | 3 month USD- | 77,886 |
| | | | | Semiannually | LIBOR-BBA— | |
| | | | | | Quarterly | |
| 125,228,175 | 105,192 | 180,755 | 10/27/27 | 3 month USD- | 2.35425%— | 294,799 |
| | | | | LIBOR-BBA— | Semiannually | |
| | | | | Quarterly | | |
| 31,275,000 | 117,907 | (227) | 10/23/27 | 2.303%— | 3 month USD- | 112,327 |
| | | | | Semiannually | LIBOR-BBA— | |
| | | | | | Quarterly | |
| | | | | | |
| CENTRALLY CLEARED INTEREST RATE SWAP CONTRACTS OUTSTANDING at 10/31/17 cont. | |
| | | Upfront | | | | |
| | | premium | | | | Unrealized |
| | | received | Termination | Payments | Payments | appreciation/ |
| Notional amount | Value | (paid) | date | made by fund | received by fund | (depreciation) |
| $87,419,000 | $85,671 | $(635) | 10/24/27 | 2.35552%— | 3 month USD- | $(99,833) |
| | | | | Semiannually | LIBOR-BBA— | |
| | | | | | Quarterly | |
| 260,000 | 159 | (2) | 10/25/27 | 2.338%— | 3 month USD- | 125 |
| | | | | Semiannually | LIBOR-BBA— | |
| | | | | | Quarterly | |
| 51,343,600 | 4,621 | (373) | 10/25/27 | 2.3457%— | 3 month USD- | (11,415) |
| | | | | Semiannually | LIBOR-BBA— | |
| | | | | | Quarterly | |
| 51,343,600 | 10,782 | (373) | 10/25/27 | 2.34705%— | 3 month USD- | (17,588) |
| | | | | Semiannually | LIBOR-BBA— | |
| | | | | | Quarterly | |
| 52,580,000 | 159,317 | (382) | 10/26/27 | 2.3784%— | 3 month USD- | (165,057) |
| | | | | Semiannually | LIBOR-BBA— | |
| | | | | | Quarterly | |
| 53,430,600 | 159,757 | (388) | 10/27/27 | 3 month USD- | 2.378%— | 163,287 |
| | | | | LIBOR-BBA— | Semiannually | |
| | | | | Quarterly | | |
| 23,563,000 | 87,654 | (171) | 10/26/27 | 2.386%— | 3 month USD- | (90,251) |
| | | | | Semiannually | LIBOR-BBA— | |
| | | | | | Quarterly | |
| 17,908,000 | 93,301 | (130) | 10/26/27 | 2.4025%— | 3 month USD- | (95,315) |
| | | | | Semiannually | LIBOR-BBA— | |
| | | | | | Quarterly | |
| 41,314,000 | 286,719 | (300) | 10/27/27 | 2.42166%— | 3 month USD- | (290,249) |
| | | | | Semiannually | LIBOR-BBA— | |
| | | | | | Quarterly | |
| 41,314,000 | 304,071 | (300) | 10/27/27 | 2.4264%— | 3 month USD- | (307,623) |
| | | | | Semiannually | LIBOR-BBA— | |
| | | | | | Quarterly | |
| 48,497,000 | 414,649 | (352) | 10/27/27 | 2.4395%— | 3 month USD- | (418,889) |
| | | | | Semiannually | LIBOR-BBA— | |
| | | | | | Quarterly | |
| 71,354,900 | 602,235 E | (582) | 11/29/27 | 2.45%— | 3 month USD- | (602,818) |
| | | | | Semiannually | LIBOR-BBA— | |
| | | | | | Quarterly | |
| 48,650,900 | 360,503 E | (397) | 12/6/27 | 2.4425%— | 3 month USD- | (360,900) |
| | | | | Semiannually | LIBOR-BBA— | |
| | | | | | Quarterly | |
| 22,154,500 | 118,083 | (161) | 10/30/27 | 2.4026%— | 3 month USD- | (118,027) |
| | | | | Semiannually | LIBOR-BBA— | |
| | | | | | Quarterly | |
| 22,154,500 | 119,634 | (161) | 10/30/27 | 2.40336%— | 3 month USD- | (119,578) |
| | | | | Semiannually | LIBOR-BBA— | |
| | | | | | Quarterly | |
| 22,698,000 | 174,548 | (165) | 10/31/27 | 2.428%— | 3 month USD- | (173,843) |
| | | | | Semiannually | LIBOR-BBA— | |
| | | | | | Quarterly | |
| | | | | | |
| CENTRALLY CLEARED INTEREST RATE SWAP CONTRACTS OUTSTANDING at 10/31/17 cont. | |
| | | Upfront | | | | |
| | | premium | | | | Unrealized |
| | | received | Termination | Payments | Payments | appreciation/ |
| Notional amount | Value | (paid) | date | made by fund | received by fund | (depreciation) |
| $55,302,300 | $235,035 | $(401) | 10/31/27 | 2.38997%— | 3 month USD- | $(233,316) |
| | | | | Semiannually | LIBOR-BBA— | |
| | | | | | Quarterly | |
| 55,302,300 | 224,527 | (401) | 10/31/27 | 2.38792%— | 3 month USD- | (222,809) |
| | | | | Semiannually | LIBOR-BBA— | |
| | | | | | Quarterly | |
| 55,302,300 | 240,565 | (401) | 10/31/27 | 2.39108%— | 3 month USD- | (238,846) |
| | | | | Semiannually | LIBOR-BBA— | |
| | | | | | Quarterly | |
| 34,323,000 | 68,989 | (249) | 11/1/27 | 2.36789%— | 3 month USD- | (69,238) |
| | | | | Semiannually | LIBOR-BBA— | |
| | | | | | Quarterly | |
| 34,323,000 | 57,663 | (249) | 11/1/27 | 2.36421%— | 3 month USD- | (57,912) |
| | | | | Semiannually | LIBOR-BBA— | |
| | | | | | Quarterly | |
| 34,323,000 | 61,438 | (249) | 11/1/27 | 2.3654%— | 3 month USD- | (61,687) |
| | | | | Semiannually | LIBOR-BBA— | |
| | | | | | Quarterly | |
| 18,255,500 | 9,858 E | (133) | 11/6/27 | 3 month USD- | 2.342%— | (9,991) |
| | | | | LIBOR-BBA— | Semiannually | |
| | | | | Quarterly | | |
| 37,846,700 | 13,246 E | (314) | 12/4/27 | 2.356%— | 3 month USD- | 12,939 |
| | | | | Semiannually | LIBOR-BBA— | |
| | | | | | Quarterly | |
| 5,000,000 | 1,950 | (31) | 5/26/20 | 3 month USD- | 6 month USD- | (1,041) |
| | | | | LIBOR-BBA | LIBOR-BBA— | |
| | | | | plus 12.70%— | Semiannually | |
| | | | | Semiannually | | |
| Total | | $(1,335,137) | | | | $4,130,097 |
E Extended effective date.
| | | | | | |
| OTC TOTAL RETURN SWAP CONTRACTS OUTSTANDING at 10/31/17 | | |
| | | Upfront | | | | |
| | | premium | Termina- | Payments | Total return | Unrealized |
| Swap counterparty/ | | received | tion | received (paid) | received by | appreciation/ |
| Notional amount | Value | (paid) | date | by fund | or paid by fund | (depreciation) |
| Bank of America N.A. | | | | | | |
| $174,469 | $174,982 | $— | 1/12/41 | 4.00% (1 month | Synthetic TRS | $2,123 |
| | | | | USD-LIBOR)— | Index 4.00% 30 year | |
| | | | | Monthly | Fannie Mae pools— | |
| | | | | | Monthly | |
| 314,981 | 312,809 | — | 1/12/41 | 4.50% (1 month | Synthetic TRS | 913 |
| | | | | USD-LIBOR)— | Index 4.50% 30 year | |
| | | | | Monthly | Fannie Mae pools— | |
| | | | | | Monthly | |
| | | | | | |
| OTC TOTAL RETURN SWAP CONTRACTS OUTSTANDING at 10/31/17 cont. | | |
| | | Upfront | | | | |
| | | premium | Termina- | Payments | Total return | Unrealized |
| Swap counterparty/ | | received | tion | received (paid) | received by | appreciation/ |
| Notional amount | Value | (paid) | date | by fund | or paid by fund | (depreciation) |
| Barclays Bank PLC | | | | | | |
| $604,087 | $597,290 | $— | 1/12/36 | (5.50%) 1 month | Synthetic TRS | $(215) |
| | | | | USD-LIBOR— | Index 5.50% 30 year | |
| | | | | Monthly | Fannie Mae pools— | |
| | | | | | Monthly | |
| 214,626 | 214,035 | — | 1/12/40 | 4.50% (1 month | Synthetic MBX | (266) |
| | | | | USD-LIBOR)— | Index 4.50% 30 year | |
| | | | | Monthly | Fannie Mae pools— | |
| | | | | | Monthly | |
| 137,306 | 137,710 | — | 1/12/41 | 4.00% (1 month | Synthetic TRS | 1,671 |
| | | | | USD-LIBOR)— | Index 4.00% 30 year | |
| | | | | Monthly | Fannie Mae pools— | |
| | | | | | Monthly | |
| 481,146 | 480,434 | — | 1/12/40 | 4.00% (1 month | Synthetic MBX | (81) |
| | | | | USD-LIBOR)— | Index 4.00% 30 year | |
| | | | | Monthly | Fannie Mae pools— | |
| | | | | | Monthly | |
| 216,123 | 213,910 | — | 1/12/39 | 6.00% (1 month | Synthetic TRS | 441 |
| | | | | USD-LIBOR)— | Index 6.00% 30 year | |
| | | | | Monthly | Fannie Mae pools— | |
| | | | | | Monthly | |
| 3,177,947 | 3,173,246 | — | 1/12/40 | 4.00% (1 month | Synthetic MBX | (535) |
| | | | | USD-LIBOR)— | Index 4.00% 30 year | |
| | | | | Monthly | Fannie Mae pools— | |
| | | | | | Monthly | |
| 48,747 | 48,098 | — | 1/12/38 | 6.50% (1 month | Synthetic TRS | (63) |
| | | | | USD-LIBOR)— | Index 6.50% 30 year | |
| | | | | Monthly | Fannie Mae pools— | |
| | | | | | Monthly | |
| 374,572 | 374,892 | — | 1/12/41 | 5.00% (1 month | Synthetic MBX Index | 965 |
| | | | | USD-LIBOR)— | 5.00% 30 year Ginnie | |
| | | | | Monthly | Mae II pools— | |
| | | | | | Monthly | |
| 446,197 | 447,508 | — | 1/12/41 | 4.00% (1 month | Synthetic TRS | 5,430 |
| | | | | USD-LIBOR)— | Index 4.00% 30 year | |
| | | | | Monthly | Fannie Mae pools— | |
| | | | | | Monthly | |
| 2,396,720 | 2,390,120 | — | 1/12/40 | 4.50% (1 month | Synthetic MBX | (2,968) |
| | | | | USD-LIBOR)— | Index 4.50% 30 year | |
| | | | | Monthly | Fannie Mae pools— | |
| | | | | | Monthly | |
| 3,369,942 | 3,389,913 | — | 1/12/39 | (6.00%) 1 month | Synthetic MBX | (27,066) |
| | | | | USD-LIBOR— | Index 6.00% 30 year | |
| | | | | Monthly | Fannie Mae pools— | |
| | | | | | Monthly | |
| 431,882 | 426,137 | — | 1/12/38 | 6.50% (1 month | Synthetic TRS | (558) |
| | | | | USD-LIBOR)— | Index 6.50% 30 year | |
| | | | | Monthly | Fannie Mae pools— | |
| | | | | | Monthly | |
| | | | | | |
| OTC TOTAL RETURN SWAP CONTRACTS OUTSTANDING at 10/31/17 cont. | | |
| | | Upfront | | | | |
| | | premium | Termina- | Payments | Total return | Unrealized |
| Swap counterparty/ | | received | tion | received (paid) | received by | appreciation/ |
| Notional amount | Value | (paid) | date | by fund | or paid by fund | (depreciation) |
| Barclays Bank PLC cont. | | | | | |
| $110,551 | $109,574 | $— | 1/12/41 | (5.00%) 1 month | Synthetic TRS | $(216) |
| | | | | USD-LIBOR— | Index 5.00% 30 year | |
| | | | | Monthly | Fannie Mae pools— | |
| | | | | | Monthly | |
| 678,020 | 674,446 | — | 1/12/43 | 3.50% (1 month | Synthetic TRS | 1,996 |
| | | | | USD-LIBOR)— | Index 3.50% 30 year | |
| | | | | Monthly | Fannie Mae pools— | |
| | | | | | Monthly | |
| 67,911 | 67,553 | — | 1/12/43 | 3.50% (1 month | Synthetic TRS | 200 |
| | | | | USD-LIBOR)— | Index 3.50% 30 year | |
| | | | | Monthly | Fannie Mae pools— | |
| | | | | | Monthly | |
| 4,936,325 | 4,916,672 | — | 1/12/40 | 5.00% (1 month | Synthetic MBX | (11,193) |
| | | | | USD-LIBOR)— | Index 5.00% 30 year | |
| | | | | Monthly | Fannie Mae pools— | |
| | | | | | Monthly | |
| 51,423,147 | 51,225,956 | — | 1/12/41 | 5.00% (1 month | Synthetic MBX | (109,207) |
| | | | | USD-LIBOR)— | Index 5.00% 30 year | |
| | | | | Monthly | Fannie Mae pools— | |
| | | | | | Monthly | |
| 56,852,160 | 57,220,731 | — | 1/12/38 | (6.50%) 1 month | Synthetic MBX | (498,064) |
| | | | | USD-LIBOR— | Index 6.50% 30 year | |
| | | | | Monthly | Fannie Mae pools— | |
| | | | | | Monthly | |
| Citibank, N.A. | | | | | | |
| 4,206,983 | 4,190,851 | — | 1/12/41 | 5.00% (1 month | Synthetic MBX | (8,934) |
| | | | | USD-LIBOR)— | Index 5.00% 30 year | |
| | | | | Monthly | Fannie Mae pools— | |
| | | | | | Monthly | |
| 996,817 | 992,995 | — | 1/12/41 | 5.00% (1 month | Synthetic MBX | (2,117) |
| | | | | USD-LIBOR)— | Index 5.00% 30 year | �� |
| | | | | Monthly | Fannie Mae pools— | |
| | | | | | Monthly | |
| Credit Suisse International | | | | | |
| 9,475,764 | 9,440,110 | — | 1/12/41 | 4.50% (1 month | Synthetic MBX Index | (21,326) |
| | | | | USD-LIBOR)— | 4.50% 30 year Ginnie | |
| | | | | Monthly | Mae II pools— | |
| | | | | | Monthly | |
| 303,229 | 300,391 | — | 1/12/39 | (5.00%) 1 month | Synthetic TRS | (640) |
| | | | | USD-LIBOR— | Index 5.00% 30 year | |
| | | | | Monthly | Fannie Mae pools— | |
| | | | | | Monthly | |
| 195,481 | 194,451 | — | 1/12/43 | 3.50% (1 month | Synthetic TRS | 575 |
| | | | | USD-LIBOR)— | Index 3.50% 30 year | |
| | | | | Monthly | Fannie Mae pools— | |
| | | | | | Monthly | |
| 534,986 | 530,255 | — | 1/12/41 | (5.00%) 1 month | Synthetic TRS | (1,047) |
| | | | | USD-LIBOR— | Index 5.00% 30 year | |
| | | | | Monthly | Fannie Mae pools— | |
| | | | | | Monthly | |
| | | | | | |
| OTC TOTAL RETURN SWAP CONTRACTS OUTSTANDING at 10/31/17 cont. | | |
| | | Upfront | | | | |
| | | premium | Termina- | Payments | Total return | Unrealized |
| Swap counterparty/ | | received | tion | received (paid) | received by | appreciation/ |
| Notional amount | Value | (paid) | date | by fund | or paid by fund | (depreciation) |
| Credit Suisse International cont. | | | | | |
| $1,102,497 | $1,094,319 | $— | 1/12/41 | 5.00% (1 month | Synthetic MBX Index | $3,620 |
| | | | | USD-LIBOR)— | 5.00% 30 year Ginnie | |
| | | | | Monthly | Mae II pools— | |
| | | | | | Monthly | |
| 592,674 | 594,466 | — | 1/12/44 | 3.50% (1 month | Synthetic TRS | 6,680 |
| | | | | USD-LIBOR)— | Index 3.50% 30 year | |
| | | | | Monthly | Fannie Mae pools— | |
| | | | | | Monthly | |
| 668,244 | 670,207 | — | 1/12/41 | 4.00% (1 month | Synthetic TRS | 8,132 |
| | | | | USD-LIBOR)— | Index 4.00% 30 year | |
| | | | | Monthly | Fannie Mae pools— | |
| | | | | | Monthly | |
| 533,051 | 534,663 | — | 1/12/44 | 3.50% (1 month | Synthetic TRS | 6,008 |
| | | | | USD-LIBOR)— | Index 3.50% 30 year | |
| | | | | Monthly | Fannie Mae pools— | |
| | | | | | Monthly | |
| 388,438 | 389,613 | — | 1/12/44 | 3.50% (1 month | Synthetic TRS | 4,378 |
| | | | | USD-LIBOR)— | Index 3.50% 30 year | |
| | | | | Monthly | Fannie Mae pools— | |
| | | | | | Monthly | |
| 564,352 | 566,526 | — | 1/12/45 | 3.50% (1 month | Synthetic TRS | 6,926 |
| | | | | USD-LIBOR)— | Index 3.50% 30 year | |
| | | | | Monthly | Fannie Mae pools— | |
| | | | | | Monthly | |
| 1,819,552 | 1,781,726 | — | 1/12/45 | 4.00% (1 month | Synthetic TRS | (21,454) |
| | | | | USD-LIBOR)— | Index 4.00% 30 year | |
| | | | | Monthly | Fannie Mae pools— | |
| | | | | | Monthly | |
| 637,203 | 623,956 | — | 1/12/45 | 4.00% (1 month | Synthetic TRS | (7,513) |
| | | | | USD-LIBOR)— | Index 4.00% 30 year | |
| | | | | Monthly | Fannie Mae pools— | |
| | | | | | Monthly | |
| 605,776 | 608,109 | — | 1/12/45 | 3.50% (1 month | Synthetic TRS | 7,434 |
| | | | | USD-LIBOR)— | Index 3.50% 30 year | |
| | | | | Monthly | Fannie Mae pools— | |
| | | | | | Monthly | |
| 2,708,771 | 2,716,727 | — | 1/12/41 | (4.00%) 1 month | Synthetic TRS | (32,964) |
| | | | | USD-LIBOR— | Index 4.00% 30 year | |
| | | | | Monthly | Fannie Mae pools— | |
| | | | | | Monthly | |
| Goldman Sachs International | | | | | |
| 619,323 | 611,084 | — | 1/12/38 | 6.50% (1 month | Synthetic TRS | (800) |
| | | | | USD-LIBOR)— | Index 6.50% 30 year | |
| | | | | Monthly | Fannie Mae pools— | |
| | | | | | Monthly | |
| 477,760 | 471,404 | — | 1/12/38 | 6.50% (1 month | Synthetic TRS | (617) |
| | | | | USD-LIBOR)— | Index 6.50% 30 year | |
| | | | | Monthly | Fannie Mae pools— | |
| | | | | | Monthly | |
| | | | | | |
| OTC TOTAL RETURN SWAP CONTRACTS OUTSTANDING at 10/31/17 cont. | | |
| | | Upfront | | | | |
| | | premium | Termina- | Payments | Total return | Unrealized |
| Swap counterparty/ | | received | tion | received (paid) | received by | appreciation/ |
| Notional amount | Value | (paid) | date | by fund | or paid by fund | (depreciation) |
| Goldman Sachs International cont. | | | | |
| $1,349,180 | $1,335,369 | $— | 1/12/39 | 6.00% (1 month | Synthetic TRS | $2,755 |
| | | | | USD-LIBOR)— | Index 6.00% 30 year | |
| | | | | Monthly | Fannie Mae pools— | |
| | | | | | Monthly | |
| 600,097 | 592,114 | — | 1/12/38 | 6.50% (1 month | Synthetic TRS | (775) |
| | | | | USD-LIBOR)— | Index 6.50% 30 year | |
| | | | | Monthly | Fannie Mae pools— | |
| | | | | | Monthly | |
| 228,352 | 226,777 | — | 1/12/41 | 4.50% (1 month | Synthetic TRS | 662 |
| | | | | USD-LIBOR)— | Index 4.50% 30 year | |
| | | | | Monthly | Fannie Mae pools— | |
| | | | | | Monthly | |
| 3,796,106 | 3,820,716 | — | 1/12/38 | (6.50%) 1 month | Synthetic MBX | (33,257) |
| | | | | USD-LIBOR— | Index 6.50% 30 year | |
| | | | | Monthly | Fannie Mae pools— | |
| | | | | | Monthly | |
| 1,426,092 | 1,435,338 | — | 1/12/38 | (6.50%) 1 month | Synthetic MBX | (12,494) |
| | | | | USD-LIBOR— | Index 6.50% 30 year | |
| | | | | Monthly | Fannie Mae pools— | |
| | | | | | Monthly | |
| 604,087 | 597,290 | — | 1/12/36 | 5.50% (1 month | Synthetic TRS | 215 |
| | | | | USD-LIBOR)— | Index 5.50% 30 year | |
| | | | | Monthly | Fannie Mae pools— | |
| | | | | | Monthly | |
| 46,551 | 46,688 | — | 1/12/41 | 4.00% (1 month | Synthetic TRS | 566 |
| | | | | USD-LIBOR)— | Index 4.00% 30 year | |
| | | | | Monthly | Fannie Mae pools— | |
| | | | | | Monthly | |
| 17,449 | 17,270 | — | 1/12/39 | 6.00% (1 month | Synthetic TRS | 36 |
| | | | | USD-LIBOR)— | Index 6.00% 30 year | |
| | | | | Monthly | Fannie Mae pools— | |
| | | | | | Monthly | |
| 536,619 | 531,125 | — | 1/12/39 | 6.00% (1 month | Synthetic TRS | 1,096 |
| | | | | USD-LIBOR)— | Index 6.00% 30 year | |
| | | | | Monthly | Fannie Mae pools— | |
| | | | | | Monthly | |
| 5,200,263 | 5,233,977 | — | 1/12/38 | (6.50%) 1 month | Synthetic MBX | (45,558) |
| | | | | USD-LIBOR— | Index 6.50% 30 year | |
| | | | | Monthly | Fannie Mae pools— | |
| | | | | | Monthly | |
| 192,825 | 194,075 | — | 1/12/38 | (6.50%) 1 month | Synthetic MBX | (1,689) |
| | | | | USD-LIBOR— | Index 6.50% 30 year | |
| | | | | Monthly | Fannie Mae pools— | |
| | | | | | Monthly | |
| 514,143 | 517,476 | — | 1/12/38 | (6.50%) 1 month | Synthetic MBX | (4,504) |
| | | | | USD-LIBOR— | Index 6.50% 30 year | |
| | | | | Monthly | Fannie Mae pools— | |
| | | | | | Monthly | |
| | | | | | |
| OTC TOTAL RETURN SWAP CONTRACTS OUTSTANDING at 10/31/17 cont. | | |
| | | Upfront | | | | |
| | | premium | Termina- | Payments | Total return | Unrealized |
| Swap counterparty/ | | received | tion | received (paid) | received by | appreciation/ |
| Notional amount | Value | (paid) | date | by fund | or paid by fund | (depreciation) |
| Goldman Sachs International cont. | | | | |
| $206,363 | $203,618 | $— | 1/12/38 | 6.50% (1 month | Synthetic TRS | $(267) |
| | | | | USD-LIBOR)— | Index 6.50% 30 year | |
| | | | | Monthly | Fannie Mae pools— | |
| | | | | | Monthly | |
| 678,728 | 669,699 | — | 1/12/38 | 6.50% (1 month | Synthetic TRS | (877) |
| | | | | USD-LIBOR)— | Index 6.50% 30 year | |
| | | | | Monthly | Fannie Mae pools— | |
| | | | | | Monthly | |
| 968,705 | 958,788 | — | 1/12/39 | 6.00% (1 month | Synthetic TRS | 1,978 |
| | | | | USD-LIBOR)— | Index 6.00% 30 year | |
| | | | | Monthly | Fannie Mae pools— | |
| | | | | | Monthly | |
| 1,093,660 | 1,096,872 | — | 1/12/41 | 4.00% (1 month | Synthetic TRS | 13,309 |
| | | | | USD-LIBOR)— | Index 4.00% 30 year | |
| | | | | Monthly | Fannie Mae pools— | |
| | | | | | Monthly | |
| 1,043,766 | 1,034,535 | — | 1/12/41 | (5.00%) 1 month | Synthetic TRS | (2,044) |
| | | | | USD-LIBOR— | Index 5.00% 30 year | |
| | | | | Monthly | Fannie Mae pools— | |
| | | | | | Monthly | |
| 1,077,007 | 1,080,263 | — | 1/12/44 | 3.50% (1 month | Synthetic TRS | 12,140 |
| | | | | USD-LIBOR)— | Index 3.50% 30 year | |
| | | | | Monthly | Fannie Mae pools— | |
| | | | | | Monthly | |
| 632,409 | 619,262 | — | 1/12/45 | 4.00% (1 month | Synthetic TRS | (7,457) |
| | | | | USD-LIBOR)— | Index 4.00% 30 year | |
| | | | | Monthly | Fannie Mae pools— | |
| | | | | | Monthly | |
| 705,960 | 702,239 | — | 1/12/43 | (3.50%) 1 month | Synthetic TRS | (2,078) |
| | | | | USD-LIBOR— | Index 3.50% 30 year | |
| | | | | Monthly | Fannie Mae pools— | |
| | | | | | Monthly | |
| 1,255,799 | 1,253,730 | — | 1/12/44 | (3.00%) 1 month | Synthetic TRS | (7,550) |
| | | | | USD-LIBOR— | Index 3.00% 30 year | |
| | | | | Monthly | Fannie Mae pools— | |
| | | | | | Monthly | |
| JPMorgan Chase Bank N.A. | | | | | |
| 142,343 | 142,761 | — | 1/12/41 | 4.00% (1 month | Synthetic TRS | 1,732 |
| | | | | USD-LIBOR)— | Index 4.00% 30 year | |
| | | | | Monthly | Fannie Mae pools— | |
| | | | | | Monthly | |
| 1,043,811 | 1,034,580 | — | 1/12/41 | (5.00%) 1 month | Synthetic TRS | (2,044) |
| | | | | USD-LIBOR— | Index 5.00% 30 year | |
| | | | | Monthly | Fannie Mae pools— | |
| | | | | | Monthly | |
| | | | | | |
| OTC TOTAL RETURN SWAP CONTRACTS OUTSTANDING at 10/31/17 cont. | | |
| | | Upfront | | | | |
| | | premium | Termina- | Payments | Total return | Unrealized |
| Swap counterparty/ | | received | tion | received (paid) | received by | appreciation/ |
| Notional amount | Value | (paid) | date | by fund | or paid by fund | (depreciation) |
| JPMorgan Securities LLC | | | | | |
| $2,210,226 | $2,204,000 | $— | 1/12/44 | 4.00% (1 month | Synthetic TRS | $13,284 |
| | | | | USD-LIBOR)— | Index 4.00% 30 year | |
| | | | | Monthly | Fannie Mae pools— | |
| | | | | | Monthly | |
| 1,998,496 | 2,004,539 | — | 1/12/44 | (3.50%) 1 month | Synthetic TRS | (22,526) |
| | | | | USD-LIBOR— | Index 3.50% 30 year | |
| | | | | Monthly | Fannie Mae pools— | |
| | | | | | Monthly | |
| 2,210,226 | 2,204,000 | — | 1/12/44 | (4.00%) 1 month | Synthetic TRS | (13,284) |
| | | | | USD-LIBOR— | Index 4.00% 30 year | |
| | | | | Monthly | Fannie Mae pools— | |
| | | | | | Monthly | |
| 718,254 | 712,927 | — | 1/12/41 | (5.00%) 1 month | Synthetic MBX Index | (2,355) |
| | | | | USD-LIBOR— | 5.00% 30 year Ginnie | |
| | | | | Monthly | Mae II pools— | |
| | | | | | Monthly | |
| Upfront premium received | — | | Unrealized appreciation | 105,265 |
| Upfront premium (paid) | — | | Unrealized depreciation | (906,603) |
| Total | | $— | | Total | | $(801,338) |
| | | | | | |
| CENTRALLY CLEARED TOTAL RETURN SWAP CONTRACTS OUTSTANDING at 10/31/17 | |
| | | Upfront | | | | |
| | | premium | Termina- | Payments | Total return | Unrealized |
| | | received | tion | received (paid) | received by | appreciation/ |
| Notional amount | Value | (paid) | date | by fund | or paid by fund | (depreciation) |
| $9,405,000 | $48,248 | $— | 7/3/22 | (1.9225%)—At | USA Non Revised | $48,248 |
| | | | | maturity | Consumer Price | |
| | | | | | Index-Urban | |
| | | | | | (CPI-U)—At maturity | |
| 9,405,000 | 45,332 | — | 7/3/27 | 2.085%—At | USA Non Revised | (45,332) |
| | | | | maturity | Consumer Price | |
| | | | | | Index-Urban | |
| | | | | | (CPI-U)—At maturity | |
| 10,792,000 | 75,835 | — | 7/5/22 | (1.89%)—At | USA Non Revised | 75,835 |
| | | | | maturity | Consumer Price | |
| | | | | | Index-Urban | |
| | | | | | (CPI-U)—At maturity | |
| 10,792,000 | 90,545 | — | 7/5/27 | 2.05%—At | USA Non Revised | (90,545) |
| | | | | maturity | Consumer Price | |
| | | | | | Index-Urban | |
| | | | | | (CPI-U)—At maturity | |
| Total | | $— | | | | $(11,794) |
| | | | | | | |
| OTC CREDIT DEFAULT CONTRACTS OUTSTANDING—PROTECTION SOLD at 10/31/17 | |
| | | Upfront | | | | | |
| | | premium | | | Termi- | Payments | Unrealized |
| Swap counterparty/ | | received | Notional | | nation | received | appreciation/ |
| Referenced debt* | Rating*** | (paid)** | amount | Value | date | by fund | (depreciation) |
| Bank of America N.A. | | | | | | |
| CMBX NA BBB–.6 | BBB–/P | $13,534 | $198,000 | $33,125 | 5/11/63 | 300 bp— | $(19,476) |
| Index | | | | | | Monthly | |
| CMBX NA BBB–.6 | BBB–/P | 26,395 | 438,000 | 73,277 | 5/11/63 | 300 bp— | (46,627) |
| Index | | | | | | Monthly | |
| CMBX NA BBB–.6 | BBB–/P | 54,079 | 876,000 | 146,555 | 5/11/63 | 300 bp— | (91,964) |
| Index | | | | | | Monthly | |
| CMBX NA BBB–.6 | BBB–/P | 51,528 | 904,000 | 151,239 | 5/11/63 | 300 bp— | (99,184) |
| Index | | | | | | Monthly | |
| Credit Suisse International | | | | | | |
| CMBX NA A.6 | A/P | 3,634,420 | 71,614,000 | 4,275,356 | 5/11/63 | 200 bp— | (613,086) |
| Index | | | | | | Monthly | |
| CMBX NA A.7 | A–/P | 11,938 | 287,000 | 9,069 | 1/17/47 | 200 bp— | 2,981 |
| Index | | | | | | Monthly | |
| CMBX NA A.7 | A–/P | 159,923 | 4,345,000 | 137,302 | 1/17/47 | 200 bp— | 24,311 |
| Index | | | | | | Monthly | |
| CMBX NA BBB–.6 | BBB–/P | 214,399 | 1,693,000 | 283,239 | 5/11/63 | 300 bp— | (67,852) |
| Index | | | | | | Monthly | |
| CMBX NA BBB–.6 | BBB–/P | 271,905 | 2,342,000 | 391,817 | 5/11/63 | 300 bp— | (118,545) |
| Index | | | | | | Monthly | |
| CMBX NA BBB–.6 | BBB–/P | 264,277 | 2,500,000 | 418,250 | 5/11/63 | 300 bp— | (152,515) |
| Index | | | | | | Monthly | |
| CMBX NA BBB–.6 | BBB–/P | 1,801,294 | 16,847,000 | 2,818,503 | 5/11/63 | 300 bp— | (1,007,382) |
| Index | | | | | | Monthly | |
| CMBX NA BBB–.7 | BBB–/P | 143,564 | 2,186,000 | 255,106 | 1/17/47 | 300 bp— | (110,267) |
| Index | | | | | | Monthly | |
| CMBX NA BBB–.7 | BBB–/P | 1,003,542 | 13,577,000 | 1,584,436 | 1/17/47 | 300 bp— | (572,974) |
| Index | | | | | | Monthly | |
| Goldman Sachs International | | | | | | |
| CMBX NA A.6 | A/P | 5,271 | 168,000 | 10,030 | 5/11/63 | 200 bp— | (4,694) |
| Index | | | | | | Monthly | |
| CMBX NA A.6 | A/P | 16,026 | 526,000 | 31,402 | 5/11/63 | 200 bp— | (15,171) |
| Index | | | | | | Monthly | |
| CMBX NA A.6 | A/P | 65,795 | 1,256,000 | 74,983 | 5/11/63 | 200 bp— | (8,700) |
| Index | | | | | | Monthly | |
| CMBX NA A.6 | A/P | 88,084 | 1,783,000 | 106,445 | 5/11/63 | 200 bp— | (17,668) |
| Index | | | | | | Monthly | |
| CMBX NA A.6 | A/P | 55,332 | 1,789,000 | 106,803 | 5/11/63 | 200 bp— | (50,776) |
| Index | | | | | | Monthly | |
| CMBX NA A.6 | A/P | 109,667 | 1,964,000 | 117,251 | 5/11/63 | 200 bp— | (6,820) |
| Index | | | | | | Monthly | |
| CMBX NA A.6 | A/P | 165,367 | 2,518,000 | 150,325 | 5/11/63 | 200 bp— | 16,021 |
| Index | | | | | | Monthly | |
| CMBX NA A.6 | A/P | 148,581 | 3,016,000 | 180,055 | 5/11/63 | 200 bp— | (30,301) |
| Index | | | | | | Monthly | |
| CMBX NA A.6 | A/P | 224,300 | 3,497,000 | 208,771 | 5/11/63 | 200 bp— | 16,889 |
| Index | | | | | | Monthly | |
| | | | | | | |
| OTC CREDIT DEFAULT CONTRACTS OUTSTANDING—PROTECTION SOLD at 10/31/17 cont. | |
| | | Upfront | | | | | |
| | | premium | | | Termi- | Payments | Unrealized |
| Swap counterparty/ | | received | Notional | | nation | received | appreciation/ |
| Referenced debt* | Rating*** | (paid)** | amount | Value | date | by fund | (depreciation) |
| Goldman Sachs International cont. | | | | | |
| CMBX NA A.6 | A/P | $293,870 | $5,647,000 | $337,126 | 5/11/63 | 200 bp— | $(41,060) |
| Index | | | | | | Monthly | |
| CMBX NA A.6 | A/P | 285,860 | 5,647,000 | 337,126 | 5/11/63 | 200 bp— | (49,069) |
| Index | | | | | | Monthly | |
| CMBX NA A.6 | A/P | 285,860 | 5,647,000 | 337,126 | 5/11/63 | 200 bp— | (49,069) |
| Index | | | | | | Monthly | |
| CMBX NA A.6 | A/P | 388,995 | 7,644,000 | 456,347 | 5/11/63 | 200 bp— | (64,379) |
| Index | | | | | | Monthly | |
| CMBX NA BBB–.6 | BBB–/P | 12,607 | 146,000 | 24,426 | 5/11/63 | 300 bp— | (11,733) |
| Index | | | | | | Monthly | |
| CMBX NA BBB–.6 | BBB–/P | 18,143 | 375,000 | 62,738 | 5/11/63 | 300 bp— | (44,376) |
| Index | | | | | | Monthly | |
| CMBX NA BBB–.6 | BBB–/P | 43,557 | 401,000 | 67,087 | 5/11/63 | 300 bp— | (23,296) |
| Index | | | | | | Monthly | |
| CMBX NA BBB–.6 | BBB–/P | 43,389 | 401,000 | 67,087 | 5/11/63 | 300 bp— | (23,465) |
| Index | | | | | | Monthly | |
| CMBX NA BBB–.6 | BBB–/P | 39,801 | 503,000 | 84,152 | 5/11/63 | 300 bp— | (44,057) |
| Index | | | | | | Monthly | |
| CMBX NA BBB–.6 | BBB–/P | 34,791 | 667,000 | 111,589 | 5/11/63 | 300 bp— | (76,409) |
| Index | | | | | | Monthly | |
| CMBX NA BBB–.6 | BBB–/P | 32,711 | 671,000 | 112,258 | 5/11/63 | 300 bp— | (79,155) |
| Index | | | | | | Monthly | |
| CMBX NA BBB–.6 | BBB–/P | 33,283 | 671,000 | 112,258 | 5/11/63 | 300 bp— | (78,584) |
| Index | | | | | | Monthly | |
| CMBX NA BBB–.6 | BBB–/P | 77,301 | 714,000 | 119,452 | 5/11/63 | 300 bp— | (41,734) |
| Index | | | | | | Monthly | |
| CMBX NA BBB–.6 | BBB–/P | 68,535 | 1,006,000 | 168,304 | 5/11/63 | 300 bp— | (99,182) |
| Index | | | | | | Monthly | |
| CMBX NA BBB–.6 | BBB–/P | 134,237 | 1,144,000 | 191,391 | 5/11/63 | 300 bp— | (56,487) |
| Index | | | | | | Monthly | |
| CMBX NA BBB–.6 | BBB–/P | 200,757 | 1,446,000 | 241,916 | 5/11/63 | 300 bp— | (40,315) |
| Index | | | | | | Monthly | |
| CMBX NA BBB–.7 | BBB–/P | 93,005 | 1,144,000 | 133,505 | 1/17/47 | 300 bp— | (39,833) |
| Index | | | | | | Monthly | |
| CMBX NA BBB–.7 | BBB–/P | 93,576 | 1,266,000 | 147,742 | 1/17/47 | 300 bp— | (53,427) |
| Index | | | | | | Monthly | |
| CMBX NA BBB–.7 | BBB–/P | 126,786 | 1,819,000 | 212,277 | 1/17/47 | 300 bp— | (84,431) |
| Index | | | | | | Monthly | |
| JPMorgan Securities LLC | | | | | | |
| CMBX NA A.6 | A/P | 5,502 | 168,000 | 10,030 | 5/11/63 | 200 bp— | (4,462) |
| Index | | | | | | Monthly | |
| CMBX NA A.6 | A/P | 106,467 | 1,965,000 | 117,311 | 5/11/63 | 200 bp— | (10,079) |
| Index | | | | | | Monthly | |
| CMBX NA A.6 | A/P | 105,771 | 1,984,000 | 118,445 | 5/11/63 | 200 bp— | (11,902) |
| Index | | | | | | Monthly | |
| CMBX NA A.6 | A/P | 88,458 | 2,688,000 | 160,474 | 5/11/63 | 200 bp— | (70,970) |
| Index | | | | | | Monthly | |
| | | | | | | |
| OTC CREDIT DEFAULT CONTRACTS OUTSTANDING—PROTECTION SOLD at 10/31/17 cont. | |
| | | Upfront | | | | | |
| | | premium | | | Termi- | Payments | Unrealized |
| Swap counterparty/ | | received | Notional | | nation | received | appreciation/ |
| Referenced debt* | Rating*** | (paid)** | amount | Value | date | by fund | (depreciation) |
| JPMorgan Securities LLC cont. | | | | | | |
| CMBX NA A.6 | A/P | $132,031 | $2,730,000 | $162,981 | 5/11/63 | 200 bp— | $(29,889) |
| Index | | | | | | Monthly | |
| CMBX NA A.6 | A/P | 87,171 | 3,039,000 | 181,428 | 5/11/63 | 200 bp— | (93,076) |
| Index | | | | | | Monthly | |
| CMBX NA A.6 | A/P | 173,376 | 3,385,000 | 202,085 | 5/11/63 | 200 bp— | (27,393) |
| Index | | | | | | Monthly | |
| CMBX NA A.6 | A/P | 218,564 | 4,026,000 | 240,352 | 5/11/63 | 200 bp— | (20,223) |
| Index | | | | | | Monthly | |
| CMBX NA A.6 | A/P | 249,808 | 5,000,000 | 298,500 | 5/11/63 | 200 bp— | (46,748) |
| Index | | | | | | Monthly | |
| CMBX NA A.6 | A/P | 325,181 | 5,254,000 | 313,664 | 5/11/63 | 200 bp— | 13,561 |
| Index | | | | | | Monthly | |
| CMBX NA A.6 | A/P | 530,174 | 9,000,000 | 537,300 | 5/11/63 | 200 bp— | (3,626) |
| Index | | | | | | Monthly | |
| CMBX NA A.6 | A/P | 590,493 | 11,640,000 | 694,908 | 5/11/63 | 200 bp— | (99,888) |
| Index | | | | | | Monthly | |
| CMBX NA A.6 | A/P | 1,032,363 | 17,500,000 | 1,044,750 | 5/11/63 | 200 bp— | (5,582) |
| Index | | | | | | Monthly | |
| CMBX NA BBB–.6 | BBB–/P | 48,180 | 330,000 | 55,209 | 5/11/63 | 300 bp— | (6,836) |
| Index | | | | | | Monthly | |
| CMBX NA BBB–.6 | BBB–/P | 59,512 | 383,000 | 64,076 | 5/11/63 | 300 bp— | (4,341) |
| Index | | | | | | Monthly | |
| CMBX NA BBB–.6 | BBB–/P | 75,904 | 613,000 | 102,555 | 5/11/63 | 300 bp— | (26,294) |
| Index | | | | | | Monthly | |
| CMBX NA BBB–.6 | BBB–/P | 75,500 | 664,000 | 111,087 | 5/11/63 | 300 bp— | (35,200) |
| Index | | | | | | Monthly | |
| CMBX NA BBB–.6 | BBB–/P | 78,081 | 688,000 | 115,102 | 5/11/63 | 300 bp— | (36,620) |
| Index | | | | | | Monthly | |
| CMBX NA BBB–.6 | BBB–/P | 79,859 | 712,000 | 119,118 | 5/11/63 | 300 bp— | (38,843) |
| Index | | | | | | Monthly | |
| CMBX NA BBB–.6 | BBB–/P | 78,422 | 714,000 | 119,452 | 5/11/63 | 300 bp— | (40,613) |
| Index | | | | | | Monthly | |
| CMBX NA BBB–.6 | BBB–/P | 87,751 | 718,000 | 120,121 | 5/11/63 | 300 bp— | (31,951) |
| Index | | | | | | Monthly | |
| CMBX NA BBB–.6 | BBB–/P | 87,751 | 718,000 | 120,121 | 5/11/63 | 300 bp— | (31,951) |
| Index | | | | | | Monthly | |
| CMBX NA BBB–.6 | BBB–/P | 103,193 | 732,000 | 122,464 | 5/11/63 | 300 bp— | (18,843) |
| Index | | | | | | Monthly | |
| CMBX NA BBB–.6 | BBB–/P | 102,625 | 821,000 | 137,353 | 5/11/63 | 300 bp— | (34,249) |
| Index | | | | | | Monthly | |
| CMBX NA BBB–.6 | BBB–/P | 118,604 | 823,000 | 137,688 | 5/11/63 | 300 bp— | (18,604) |
| Index | | | | | | Monthly | |
| CMBX NA BBB–.6 | BBB–/P | 132,197 | 908,000 | 151,908 | 5/11/63 | 300 bp— | (19,181) |
| Index | | | | | | Monthly | |
| CMBX NA BBB–.6 | BBB–/P | 117,980 | 1,072,000 | 179,346 | 5/11/63 | 300 bp— | (60,741) |
| Index | | | | | | Monthly | |
| | | | | | | |
| OTC CREDIT DEFAULT CONTRACTS OUTSTANDING—PROTECTION SOLD at 10/31/17 cont. | |
| | | Upfront | | | | | |
| | | premium | | | Termi- | Payments | Unrealized |
| Swap counterparty/ | | received | Notional | | nation | received | appreciation/ |
| Referenced debt* | Rating*** | (paid)** | amount | Value | date | by fund | (depreciation) |
| JPMorgan Securities LLC cont. | | | | | | |
| CMBX NA BBB–.6 | BBB–/P | $130,849 | $1,173,000 | $196,243 | 5/11/63 | 300 bp— | $(64,710) |
| Index | | | | | | Monthly | |
| CMBX NA BBB–.6 | BBB–/P | 251,940 | 1,702,000 | 284,745 | 5/11/63 | 300 bp— | (31,812) |
| Index | | | | | | Monthly | |
| CMBX NA BBB–.6 | BBB–/P | 251,940 | 1,702,000 | 284,745 | 5/11/63 | 300 bp— | (31,812) |
| Index | | | | | | Monthly | |
| CMBX NA BBB–.6 | BBB–/P | 197,015 | 1,785,000 | 298,631 | 5/11/63 | 300 bp— | (100,574) |
| Index | | | | | | Monthly | |
| CMBX NA BBB–.6 | BBB–/P | 227,587 | 1,838,000 | 307,497 | 5/11/63 | 300 bp— | (78,838) |
| Index | | | | | | Monthly | |
| CMBX NA BBB–.6 | BBB–/P | 260,606 | 2,345,000 | 392,319 | 5/11/63 | 300 bp— | (130,345) |
| Index | | | | | | Monthly | |
| CMBX NA BBB–.6 | BBB–/P | 309,169 | 2,891,000 | 483,664 | 5/11/63 | 300 bp— | (172,809) |
| Index | | | | | | Monthly | |
| CMBX NA BBB–.6 | BBB–/P | 1,113,381 | 9,297,000 | 1,555,388 | 5/11/63 | 300 bp— | (436,584) |
| Index | | | | | | Monthly | |
| CMBX NA BBB–.7 | BBB–/P | 93,740 | 709,000 | 82,740 | 1/17/47 | 300 bp— | 11,414 |
| Index | | | | | | Monthly | |
| CMBX NA BBB–.7 | BBB–/P | 19,528 | 747,000 | 87,175 | 1/17/47 | 300 bp— | (67,211) |
| Index | | | | | | Monthly | |
| CMBX NA BBB–.7 | BBB–/P | 436,274 | 3,609,000 | 421,170 | 1/17/47 | 300 bp— | 17,209 |
| Index | | | | | | Monthly | |
| Upfront premium received | 19,019,232 | | Unrealized appreciation | 102,386 |
| Upfront premium (paid) | — | | Unrealized depreciation | (5,976,863) |
| Total | | $19,019,232 | | Total | | $(5,874,477) |
* Payments related to the referenced debt are made upon a credit default event.
** Upfront premium is based on the difference between the original spread on issue and the market spread on day of execution.
*** Ratings for an underlying index represent the average of the ratings of all the securities included in that index. The Moody’s, Standard & Poor’s or Fitch ratings are believed to be the most recent ratings available at October 31, 2017. Securities rated by Fitch are indicated by “/F.” Securities rated by Putnam are indicated by “/P.” The Putnam rating categories are comparable to the Standard & Poor’s classifications.
| | | | | | |
| OTC CREDIT DEFAULT CONTRACTS OUTSTANDING—PROTECTION PURCHASED at 10/31/17 | |
| | Upfront | | | | | |
| | premium | | | Termi- | Payments | Unrealized |
| Swap counterparty/ | received | Notional | | nation | (paid) | appreciation/ |
| Referenced debt* | (paid)** | amount | Value | date | by fund | (depreciation) |
| Citigroup Global Markets, Inc. | | | | | | |
| CMBX NA BB.7 Index | $(103,689) | $635,000 | $122,174 | 1/17/47 | (500 bp)— | $17,868 |
| | | | | | Monthly | |
| CMBX NA BB.7 Index | (99,731) | 635,000 | 122,174 | 1/17/47 | (500 bp)— | 21,826 |
| | | | | | Monthly | |
| | | | | | |
| OTC CREDIT DEFAULT CONTRACTS OUTSTANDING—PROTECTION PURCHASED at 10/31/17 cont. |
| | Upfront | | | | | |
| | premium | | | Termi- | Payments | Unrealized |
| Swap counterparty/ | received | Notional | | nation | (paid) | appreciation/ |
| Referenced debt* | (paid)** | amount | Value | date | by fund | (depreciation) |
| Credit Suisse International | | | | | | |
| CMBX NA BB.7 Index | $(171,916) | $9,740,000 | $2,558,698 | 5/11/63 | (500 bp)— | $2,377,313 |
| | | | | | Monthly | |
| CMBX NA BB.7 Index | (1,058,637) | 6,436,000 | 1,238,286 | 1/17/47 | (500 bp)— | 173,392 |
| | | | | | Monthly | |
| Goldman Sachs International | | | | | |
| CMBX NA BB.6 Index | (528,785) | 5,169,000 | 1,357,896 | 5/11/63 | (500 bp)— | 824,086 |
| | | | | | Monthly | |
| CMBX NA BB.7 Index | (241,670) | 1,597,000 | 307,263 | 1/17/47 | (500 bp)— | 64,040 |
| | | | | | Monthly | |
| CMBX NA BB.6 Index | (44,124) | 302,000 | 79,335 | 5/11/63 | (500 bp)— | 34,917 |
| | | | | | Monthly | |
| CMBX NA BB.7 Index | (691,993) | 3,408,000 | 655,699 | 1/17/47 | (500 bp)— | (39,607) |
| | | | | | Monthly | |
| CMBX NA BB.7 Index | (204,744) | 1,211,000 | 232,996 | 1/17/47 | (500 bp)— | 27,075 |
| | | | | | Monthly | |
| CMBX NA BB.7 Index | (194,318) | 1,186,000 | 228,186 | 1/17/47 | (500 bp)— | 32,715 |
| | | | | | Monthly | |
| JPMorgan Securities LLC | | | | | | |
| CMBX NA A.7 Index | (63,877) | 3,030,000 | 95,748 | 1/17/47 | (200 bp)— | 30,693 |
| | | | | | Monthly | |
| CMBX NA BB.6 Index | (279,973) | 1,931,000 | 507,274 | 5/11/63 | (500 bp)— | 225,423 |
| | | | | | Monthly | |
| CMBX NA BB.6 Index | (173,900) | 1,308,000 | 343,612 | 5/11/63 | (500 bp)— | 168,440 |
| | | | | | Monthly | |
| CMBX NA BB.6 Index | (146,989) | 1,022,000 | 268,479 | 5/11/63 | (500 bp)— | 120,496 |
| | | | | | Monthly | |
| CMBX NA BB.6 Index | (111,356) | 792,000 | 208,058 | 5/11/63 | (500 bp)— | 95,932 |
| | | | | | Monthly | |
| CMBX NA BB.7 Index | (914,337) | 5,341,000 | 1,027,608 | 1/17/47 | (500 bp)— | 108,079 |
| | | | | | Monthly | |
| CMBX NA BB.7 Index | (265,535) | 1,635,000 | 314,574 | 1/17/47 | (500 bp)— | 47,449 |
| | | | | | Monthly | |
| CMBX NA BB.7 Index | (197,861) | 1,264,000 | 243,194 | 1/17/47 | (500 bp)— | 44,104 |
| | | | | | Monthly | |
| CMBX NA BB.7 Index | (99,731) | 635,000 | 122,174 | 1/17/47 | (500 bp)— | 21,826 |
| | | | | | Monthly | |
| CMBX NA BBB–.7 Index | (81,685) | 732,000 | 85,424 | 1/17/47 | (300 bp)— | 3,309 |
| | | | | | Monthly | |
| Upfront premium received | — | | Unrealized appreciation | 4,438,983 |
| Upfront premium (paid) | (5,674,851) | | Unrealized depreciation | (39,607) |
| Total | $(5,674,851) | | Total | | $4,399,376 |
* Payments related to the referenced debt are made upon a credit default event.
** Upfront premium is based on the difference between the original spread on issue and the market spread on day of execution.
| | | | | | |
| CENTRALLY CLEARED CREDIT DEFAULT CONTRACTS OUTSTANDING—PROTECTION PURCHASED at 10/31/17 |
| | Upfront | | | | | |
| | premium | | | Termi- | Payments | Unrealized |
| Referenced | received | Notional | | nation | (paid) | appreciation/ |
| debt * | (paid)** | amount | Value | date | by fund | (depreciation) |
| NA HY Series 29 | $5,511,340 | $73,976,000 | $6,218,053 | 12/20/22 | (500 bp)— | $(1,045,770) |
| Index | | | | | Quarterly | |
| Total | $5,511,340 | | | | | $(1,045,770) |
* Payments related to the referenced debt are made upon a credit default event.
** Upfront premium is based on the difference between the original spread on issue and the market spread on day of execution.
ASC 820 establishes a three-level hierarchy for disclosure of fair value measurements. The valuation hierarchy is based upon the transparency of inputs to the valuation of the fund’s investments. The three levels are defined as follows:
Level 1: Valuations based on quoted prices for identical securities in active markets.
Level 2: Valuations based on quoted prices in markets that are not active or for which all significant inputs are observable, either directly or indirectly.
Level 3: Valuations based on inputs that are unobservable and significant to the fair value measurement.
The following is a summary of the inputs used to value the fund’s net assets as of the close of the reporting period:
| | | |
| | | | Valuation inputs | |
| Investments in securities: | Level 1 | Level 2 | Level 3 |
| Asset-backed securities | $— | $8,500,333 | $— |
| Corporate bonds and notes | — | 440,700,836 | — |
| Mortgage-backed securities | — | 742,305,011 | — |
| Municipal bonds and notes | — | 3,150,392 | — |
| Purchased options outstanding | — | 1,611,240 | — |
| Purchased swap options outstanding | — | 25,696,776 | — |
| U.S. government and agency mortgage obligations | — | 1,343,603,729 | — |
| U.S. treasury obligations | — | 432,285 | — |
| Short-term investments | 22,086,092 | 102,099,484 | — |
| Totals by level | $22,086,092 | $2,668,100,086 | $— |
| | | | |
| | | | Valuation inputs | |
| Other financial instruments: | Level 1 | Level 2 | Level 3 |
| Futures contracts | $(3,551,036) | $— | $— |
| Written options outstanding | — | (1,552,424) | — |
| Written swap options outstanding | — | (26,816,976) | — |
| Forward premium swap option contracts | — | 1,251,885 | — |
| TBA sale commitments | — | (458,729,912) | — |
| Interest rate swap contracts | — | 5,465,234 | — |
| Total return swap contracts | — | (813,132) | — |
| Credit default contracts | — | (21,376,592) | — |
| Totals by level | $(3,551,036) | $(502,571,917) | $— |
During the reporting period, transfers within the fair value hierarchy, if any, did not represent, in the aggregate, more than 1% of the fund’s net assets measured as of the end of the period. Transfers are accounted for using the end of period pricing valuation method.
At the start and close of the reporting period, Level 3 investments in securities represented less than 1% of the fund’s net assets and were not considered a significant portion of the fund’s portfolio.
The accompanying notes are an integral part of these financial statements.
Statement of assets and liabilities 10/31/17
| |
| ASSETS | |
| Investment in securities, at value (Note 1): | |
| Unaffiliated issuers (identified cost $2,689,807,106) | $2,669,529,086 |
| Affiliated issuers (identified cost $20,657,092) (Notes 1 and 5) | 20,657,092 |
| Cash | 1,519,713 |
| Interest and other receivables | 15,919,241 |
| Receivable for shares of the fund sold | 2,051,751 |
| Receivable for investments sold | 77,891,795 |
| Receivable for sales of delayed delivery securities (Note 1) | 397,061,104 |
| Receivable for variation margin on futures contracts (Note 1) | 268,500 |
| Receivable for variation margin on centrally cleared swap contracts (Note 1) | 496,034 |
| Unrealized appreciation on forward premium swap option contracts (Note 1) | 5,076,904 |
| Unrealized appreciation on OTC swap contracts (Note 1) | 4,646,634 |
| Premium paid on OTC swap contracts (Note 1) | 5,674,851 |
| Prepaid assets | 50,047 |
| Total assets | 3,200,842,752 |
| |
| LIABILITIES | |
| Payable for investments purchased | 1,400,372 |
| Payable for purchases of delayed delivery securities (Note 1) | 1,109,951,935 |
| Payable for shares of the fund repurchased | 1,795,494 |
| Payable for compensation of Manager (Note 2) | 523,668 |
| Payable for custodian fees (Note 2) | 81,531 |
| Payable for investor servicing fees (Note 2) | 421,120 |
| Payable for Trustee compensation and expenses (Note 2) | 532,971 |
| Payable for administrative services (Note 2) | 6,780 |
| Payable for distribution fees (Note 2) | 312,771 |
| Payable for variation margin on centrally cleared swap contracts (Note 1) | 1,226,240 |
| Unrealized depreciation on OTC swap contracts (Note 1) | 6,923,073 |
| Premium received on OTC swap contracts (Note 1) | 19,019,232 |
| Unrealized depreciation on forward premium swap option contracts (Note 1) | 3,825,019 |
| Written options outstanding, at value (premiums $46,853,498) (Note 1) | 28,369,400 |
| TBA sale commitments, at value (proceeds receivable $458,989,180) (Note 1) | 458,729,912 |
| Collateral on certain derivative contracts, at value (Notes 1 and 8) | 2,161,750 |
| Other accrued expenses | 319,367 |
| Total liabilities | 1,635,600,635 |
| | |
| Net assets | $1,565,242,117 |
| |
| REPRESENTED BY | |
| Paid-in capital (Unlimited shares authorized) (Notes 1 and 4) | $1,626,235,180 |
| Undistributed net investment income (Note 1) | 16,374,064 |
| Accumulated net realized loss on investments (Note 1) | (74,329,416) |
| Net unrealized depreciation of investments | (3,037,711) |
| Total — Representing net assets applicable to capital shares outstanding | $1,565,242,117 |
(Continued on next page)
Statement of assets and liabilities cont.
| |
| COMPUTATION OF NET ASSET VALUE AND OFFERING PRICE | |
| Net asset value and redemption price per class A share | |
| ($668,023,855 divided by 96,458,290 shares) | $6.93 |
| Offering price per class A share (100/96.00 of $6.93)* | $7.22 |
| Net asset value and offering price per class B share ($19,401,692 divided by 2,832,338 shares)** | $6.85 |
| Net asset value and offering price per class C share ($131,467,459 divided by 19,148,651 shares)** | $6.87 |
| Net asset value and redemption price per class M share | |
| ($79,485,305 divided by 11,790,324 shares) | $6.74 |
| Offering price per class M share (100/96.75 of $6.74)† | $6.97 |
| Net asset value, offering price and redemption price per class R share | |
| ($15,674,915 divided by 2,283,748 shares) | $6.86 |
| Net asset value, offering price and redemption price per class R5 share | |
| ($3,510,430 divided by 500,916 shares) | $7.01 |
| Net asset value, offering price and redemption price per class R6 share | |
| ($73,329,452 divided by 10,421,265 shares) | $7.04 |
| Net asset value, offering price and redemption price per class Y share | |
| ($574,349,009 divided by 81,657,541 shares) | $7.03 |
* On single retail sales of less than $100,000. On sales of $100,000 or more the offering price is reduced.
** Redemption price per share is equal to net asset value less any applicable contingent deferred sales charge.
† On single retail sales of less than $50,000. On sales of $50,000 or more the offering price is reduced.
The accompanying notes are an integral part of these financial statements.
Statement of operations Year ended 10/31/17
| |
| INVESTMENT INCOME | |
| Interest (including interest income of $791,394 from investments in affiliated issuers) (Note 5) | $75,282,292 |
| Total investment income | 75,282,292 |
| |
| EXPENSES | |
| Compensation of Manager (Note 2) | 6,541,919 |
| Investor servicing fees (Note 2) | 2,705,853�� |
| Custodian fees (Note 2) | 206,835 |
| Trustee compensation and expenses (Note 2) | 93,501 |
| Distribution fees (Note 2) | 4,031,271 |
| Administrative services (Note 2) | 51,767 |
| Other | 692,405 |
| Total expenses | 14,323,551 |
| Expense reduction (Note 2) | (5,144) |
| Net expenses | 14,318,407 |
| |
| Net investment income | 60,963,885 |
| |
| Net realized loss on securities from unaffiliated issuers (Notes 1 and 3) | (54,637,801) |
| Net realized gain on swap contracts (Note 1) | 27,030,376 |
| Net realized loss on futures contracts (Note 1) | (13,339,492) |
| Net realized gain on written options (Note 1) | 14,655,176 |
| Net unrealized appreciation of securities in unaffiliated issuers and TBA sale commitments | |
| during the year | 3,407,305 |
| Net unrealized depreciation of swap contracts during the year | (2,862,392) |
| Net unrealized appreciation of futures contracts during the year | 6,388,736 |
| Net unrealized appreciation of written options during the year | 20,935,235 |
| Net gain on investments | 1,577,143 |
| |
| Net increase in net assets resulting from operations | $62,541,028 |
The accompanying notes are an integral part of these financial statements.
Statement of changes in net assets
| | |
| DECREASE IN NET ASSETS | Year ended 10/31/17 | Year ended 10/31/16 |
| Operations | | |
| Net investment income | $60,963,885 | $74,333,163 |
| Net realized loss on investments | (26,291,741) | (18,581,231) |
| Net unrealized appreciation (depreciation) of investments | 27,868,884 | (7,275,351) |
| Net increase in net assets resulting from operations | 62,541,028 | 48,476,581 |
| Distributions to shareholders (Note 1): | | |
| From ordinary income | | |
| Net investment income | | |
| Class A | (24,946,481) | (28,623,921) |
| Class B | (607,066) | (631,520) |
| Class C | (4,182,614) | (4,581,717) |
| Class M | (2,814,911) | (2,712,807) |
| Class R | (670,673) | (809,709) |
| Class R5 | (154,890) | (161,676) |
| Class R6 | (2,721,115) | (3,805,161) |
| Class Y | (21,292,845) | (22,926,353) |
| Decrease from capital share transactions (Note 4) | (331,228,696) | (473,197,169) |
| Total decrease in net assets | (326,078,263) | (488,973,452) |
| |
| NET ASSETS | | |
| Beginning of year | 1,891,320,380 | 2,380,293,832 |
| End of year (including undistributed net investment | | |
| income of $16,374,064 and $22,168,353, respectively) | $1,565,242,117 | $1,891,320,380 |
The accompanying notes are an integral part of these financial statements.
|
| This page left blank intentionally. |
Financial highlights (For a common share outstanding throughout the period)
| | | | | | | | | | | | |
| | INVESTMENT OPERATIONS | | | LESS DISTRIBUTIONS | | RATIOS AND SUPPLEMENTAL DATA | |
| | | | | | | | | | | | Ratio | |
| | | | Net realized | | | | | | | | of net investment | |
| | Net asset value, | | and unrealized | Total from | From | | | Total return | Net assets, | Ratio of expenses | income (loss) | |
| | beginning | Net investment | gain (loss) | investment | net investment | Total | Net asset value, | at net asset value | end of period | to average | to average | Portfolio |
| Period ended | of period | income (loss)a | on investments | operations | income | distributions | end of period | (%)b | (in thousands) | net assets (%)c | net assets (%) | turnover (%) |
| Class A | | | | | | | | | | | | |
| October 31, 2017 | $6.89 | .25 | .03 | .28 | (.24) | (.24) | $6.93 | 4.16 | $668,024 | .88 | 3.67 | 1,055f |
| October 31, 2016 | 6.94 | .24 | (.08) | .16 | (.21) | (.21) | 6.89 | 2.33 | 829,643 | .87g | 3.45g | 981f |
| October 31, 2015 | 7.26 | .18 | (.28) | (.10) | (.22) | (.22) | 6.94 | (1.37) | 1,087,633 | .85 | 2.52 | 793f |
| October 31, 2014 | 7.20 | .27 | .12 | .39 | (.33) | (.33) | 7.26 | 5.57 | 1,004,198 | .85 | 3.67 | 505f |
| October 31, 2013 | 7.27 | .29 | (.12) | .17 | (.24) | (.24) | 7.20 | 2.31 | 783,735 | .87 | 4.03 | 267h |
| Class B | | | | | | | | | | | | |
| October 31, 2017 | $6.82 | .20 | .02 | .22 | (.19) | (.19) | $6.85 | 3.30 | $19,402 | 1.63 | 2.92 | 1,055f |
| October 31, 2016 | 6.87 | .18 | (.07) | .11 | (.16) | (.16) | 6.82 | 1.59 | 24,859 | 1.62g | 2.70g | 981f |
| October 31, 2015 | 7.19 | .13 | (.28) | (.15) | (.17) | (.17) | 6.87 | (2.11) | 30,089 | 1.60 | 1.77 | 793f |
| October 31, 2014 | 7.13 | .21 | .13 | .34 | (.28) | (.28) | 7.19 | 4.79 | 32,142 | 1.60 | 2.94 | 505f |
| October 31, 2013 | 7.20 | .23 | (.12) | .11 | (.18) | (.18) | 7.13 | 1.58 | 34,514 | 1.62 | 3.28 | 267h |
| Class C | | | | | | | | | | | | |
| October 31, 2017 | $6.84 | .20 | .02 | .22 | (.19) | (.19) | $6.87 | 3.28 | $131,467 | 1.63 | 2.92 | 1,055f |
| October 31, 2016 | 6.88 | .18 | (.06) | .12 | (.16) | (.16) | 6.84 | 1.74 | 180,492 | 1.62g | 2.70g | 981f |
| October 31, 2015 | 7.21 | .13 | (.29) | (.16) | (.17) | (.17) | 6.88 | (2.24) | 221,882 | 1.60 | 1.76 | 793f |
| October 31, 2014 | 7.15 | .21 | .13 | .34 | (.28) | (.28) | 7.21 | 4.84 | 181,142 | 1.60 | 2.96 | 505f |
| October 31, 2013 | 7.22 | .24 | (.13) | .11 | (.18) | (.18) | 7.15 | 1.58 | 133,269 | 1.62 | 3.28 | 267h |
| Class M | | | | | | | | | | | | |
| October 31, 2017 | $6.72 | .23 | .02 | .25 | (.23) | (.23) | $6.74 | 3.77 | $79,485 | 1.13 | 3.42 | 1,055f |
| October 31, 2016 | 6.77 | .21 | (.06) | .15 | (.20) | (.20) | 6.72 | 2.21 | 88,869 | 1.12g | 3.20g | 981f |
| October 31, 2015 | 7.10 | .16 | (.28) | (.12) | (.21) | (.21) | 6.77 | (1.74) | 103,524 | 1.10 | 2.26 | 793f |
| October 31, 2014 | 7.05 | .24 | .13 | .37 | (.32) | (.32) | 7.10 | 5.31 | 121,065 | 1.10 | 3.43 | 505f |
| October 31, 2013 | 7.12 | .27 | (.12) | .15 | (.22) | (.22) | 7.05 | 2.15 | 128,376 | 1.12 | 3.79 | 267h |
| Class R | | | | | | | | | | | | |
| October 31, 2017 | $6.84 | .23 | .02 | .25 | (.23) | (.23) | $6.86 | 3.66 | $15,675 | 1.13 | 3.43 | 1,055f |
| October 31, 2016 | 6.88 | .22 | (.07) | .15 | (.19) | (.19) | 6.84 | 2.29 | 25,266 | 1.12g | 3.21g | 981f |
| October 31, 2015 | 7.21 | .16 | (.28) | (.12) | (.21) | (.21) | 6.88 | (1.73) | 29,237 | 1.10 | 2.25 | 793f |
| October 31, 2014 | 7.16 | .25 | .12 | .37 | (.32) | (.32) | 7.21 | 5.27 | 21,255 | 1.10 | 3.42 | 505f |
| October 31, 2013 | 7.23 | .27 | (.12) | .15 | (.22) | (.22) | 7.16 | 2.11 | 8,040 | 1.12 | 3.79 | 267h |
| Class R5 | | | | | | | | | | | | |
| October 31, 2017 | $6.97 | .26e | .04 | .30 | (.26) | (.26) | $7.01 | 4.45 | $3,510 | .58 | 3.81e | 1,055f |
| October 31, 2016 | 7.02 | .26 | (.08) | .18 | (.23) | (.23) | 6.97 | 2.66 | 5,069 | .57g | 3.76g | 981f |
| October 31, 2015 | 7.35 | .20 | (.28) | (.08) | (.25) | (.25) | 7.02 | (1.16) | 4,463 | .56 | 2.77 | 793f |
| October 31, 2014 | 7.29 | .27 | .15 | .42 | (.36) | (.36) | 7.35 | 5.83 | 2,683 | .58 | 3.71 | 505f |
| October 31, 2013 | 7.35 | .32 | (.12) | .20 | (.26) | (.26) | 7.29 | 2.75 | 11 | .58 | 4.33 | 267h |
See notes to financial highlights at the end of this section.
The accompanying notes are an integral part of these financial statements.
| |
| 78 Income Fund | Income Fund 79 |
Financial highlights cont.
| | | | | | | | | | | | |
| | INVESTMENT OPERATIONS | | | LESS DISTRIBUTIONS | | RATIOS AND SUPPLEMENTAL DATA | |
| | | | | | | | | | | | Ratio | |
| | | | Net realized | | | | | | | | of net investment | |
| | Net asset value, | | and unrealized | Total from | From | | | Total return | Net assets, | Ratio of expenses | income (loss) | |
| | beginning | Net investment | gain (loss) | investment | net investment | Total | Net asset value, | at net asset value | end of period | to average | to average | Portfolio |
| Period ended | of period | income (loss)a | on investments | operations | income | distributions | end of period | (%)b | (in thousands) | net assets (%)c | net assets (%) | turnover (%) |
| Class R6 | | | | | | | | | | | | |
| October 31, 2017 | $7.00 | .28 | .02 | .30 | (.26) | (.26) | $7.04 | 4.45 | $73,329 | .51 | 4.05 | 1,055f |
| October 31, 2016 | 7.04 | .27 | (.08) | .19 | (.23) | (.23) | 7.00 | 2.80 | 76,616 | .50g | 3.82g | 981f |
| October 31, 2015 | 7.36 | .20 | (.27) | (.07) | (.25) | (.25) | 7.04 | (1.02) | 123,635 | .49 | 2.82 | 793f |
| October 31, 2014 | 7.29 | .29 | .14 | .43 | (.36) | (.36) | 7.36 | 5.98�� | 48,755 | .51 | 3.97 | 505f |
| October 31, 2013 | 7.36 | .31 | (.12) | .19 | (.26) | (.26) | 7.29 | 2.62 | 6,188 | .51 | 4.25 | 267h |
| Class Y | | | | | | | | | | | | |
| October 31, 2017 | $6.99 | .27 | .02 | .29 | (.25) | (.25) | $7.03 | 4.30 | $574,349 | .63 | 3.92 | 1,055f |
| October 31, 2016 | 7.03 | .26 | (.08) | .18 | (.22) | (.22) | 6.99 | 2.68 | 660,506 | .62g | 3.71g | 981f |
| October 31, 2015 | 7.36 | .20 | (.29) | (.09) | (.24) | (.24) | 7.03 | (1.27) | 779,830 | .60 | 2.76 | 793f |
| October 31, 2014 | 7.29 | .29 | .13 | .42 | (.35) | (.35) | 7.36 | 5.90 | 461,835 | .60 | 3.93 | 505f |
| October 31, 2013 | 7.36 | .31 | (.13) | .18 | (.25) | (.25) | 7.29 | 2.52 | 133,717 | .62 | 4.30 | 267h |
a Per share net investment income has been determined on the basis of the weighted average number of shares outstanding during the period.
b Total return assumes dividend reinvestment and does not reflect the effect of sales charges.
c Includes amounts paid through expense offset and/or brokerage/service arrangements, if any (Note 2). Also excludes acquired fund fees and expenses, if any.
e The net investment income and per share amount shown for the period ending October 31, 2017, may not correspond with the expected class specific differences for the period due to the timing of redemptions out of the class.
f Portfolio turnover includes TBA purchase and sale commitments.
g Reflects a voluntary waiver of certain fund expenses in effect during the period. As a result of such waivers, the expenses of each class reflect a reduction of less than 0.01% as a percentage of average net assets.
h Portfolio turnover excludes TBA purchase and sale commitments. Including TBA purchase and sale commitments to conform with current year presentation, the portfolio turnover would have been the following:
| |
| | Portfolio turnover % |
| October 31, 2013 | 730% |
The accompanying notes are an integral part of these financial statements.
| |
| 80 Income Fund | Income Fund 81 |
Notes to financial statements 10/31/17
Within the following Notes to financial statements, references to “State Street” represent State Street Bank and Trust Company, references to “the SEC” represent the Securities and Exchange Commission, references to “Putnam Management” represent Putnam Investment Management, LLC, the fund’s manager, an indirect wholly-owned subsidiary of Putnam Investments, LLC and references to “OTC”, if any, represent over-the-counter. Unless otherwise noted, the “reporting period” represents the period from November 1, 2016 through October 31, 2017.
Putnam Income Fund (the fund) is a Massachusetts business trust, which is registered under the Investment Company Act of 1940, as amended, as a diversified open-end management investment company. The goal of the fund is to seek high current income consistent with what Putnam Management believes to be prudent risk. The fund invests mainly in bonds that are securitized debt instruments (such as mortgage-backed investments) and other obligations of companies and governments worldwide denominated in U.S. dollars, are either investment-grade or below-investment-grade in quality (sometimes referred to as “junk bonds”) and have intermediate- to long-term maturities (three years or longer). Putnam Management may consider, among other factors, credit, interest rate and prepayment risks, as well as general market conditions, when deciding whether to buy or sell investments. The fund typically uses to a significant extent derivatives, such as futures, options, and swap contracts, for both hedging and non-hedging purposes.
The fund offers class A, class B, class C, class M, class R, class R5, class R6 and class Y shares. Effective April 1, 2017, purchases of class B shares are closed to new and existing investors except by exchange from class B shares of another Putnam fund or through dividend and/or capital gains reinvestment. The fund registered class T shares in February 2017, however, as of the date of this report, class T shares had not commenced operations and are not available for purchase. Class A and class M shares are sold with a maximum front-end sales charge of 4.00% and 3.25%, respectively. Class A shares generally are not subject to a contingent deferred sales charge, and class M, class R, class R5, class R6 and class Y shares are not subject to a contingent deferred sales charge. Class B shares, which convert to class A shares after approximately eight years, are not subject to a front-end sales charge and are subject to a contingent deferred sales charge if those shares are redeemed within six years of purchase. Class C shares are subject to a one-year 1.00% contingent deferred sales charge and do not convert to class A shares. Class R shares, which are not available to all investors, are sold at net asset value. The expenses for class A, class B, class C, class M and class R shares may differ based on the distribution fee of each class, which is identified in Note 2. Class R5, class R6 and class Y shares, which are sold at net asset value, are generally subject to the same expenses as class A, class B, class C, class M and class R shares, but do not bear a distribution fee and in the case of class R5 and class R6 shares, bear a lower investor servicing fee, which is identified in Note 2. Class R5, class R6 and class Y shares are not available to all investors.
In the normal course of business, the fund enters into contracts that may include agreements to indemnify another party under given circumstances. The fund’s maximum exposure under these arrangements is unknown as this would involve future claims that may be, but have not yet been, made against the fund. However, the fund’s management team expects the risk of material loss to be remote.
The fund has entered into contractual arrangements with an investment adviser, administrator, distributor, shareholder servicing agent and custodian, who each provide services to the fund. Unless expressly stated otherwise, shareholders are not parties to, or intended beneficiaries of these contractual arrangements, and these contractual arrangements are not intended to create any shareholder right to enforce them against the service providers or to seek any remedy under them against the service providers, either directly or on behalf of the fund.
Under the fund’s Declaration of Trust, any claims asserted against or on behalf of the Putnam Funds, including claims against Trustees and Officers, must be brought in state and federal courts located within the Commonwealth of Massachusetts.
Note 1: Significant accounting policies
The following is a summary of significant accounting policies consistently followed by the fund in the preparation of its financial statements. The preparation of financial statements is in conformity with accounting principles generally accepted in the United States of America and requires management to make estimates and assumptions that affect the reported amounts of assets and liabilities in the financial statements and the reported amounts of increases and decreases in net assets from operations. Actual results could differ from those estimates. Subsequent events after the Statement of assets and liabilities date through the date that the financial statements were issued have been evaluated in the preparation of the financial statements.
Investment income, realized and unrealized gains and losses and expenses of the fund are borne pro-rata based on the relative net assets of each class to the total net assets of the fund, except that each class bears expenses unique to that class (including the distribution fees applicable to such classes). Each class votes as a class only with respect to its own distribution plan or other matters on which a class vote is required by law or determined by the Trustees. If the fund were liquidated, shares of each class would receive their pro-rata share of the net assets of the fund. In addition, the Trustees declare separate dividends on each class of shares.
Security valuation Portfolio securities and other investments are valued using policies and procedures adopted by the Board of Trustees. The Trustees have formed a Pricing Committee to oversee the implementation of these procedures and have delegated responsibility for valuing the fund’s assets in accordance with these procedures to Putnam Management. Putnam Management has established an internal Valuation Committee that is responsible for making fair value determinations, evaluating the effectiveness of the pricing policies of the fund and reporting to the Pricing Committee.
Market quotations are not considered to be readily available for certain debt obligations (including short-term investments with remaining maturities of 60 days or less) and other investments; such investments are valued on the basis of valuations furnished by an independent pricing service approved by the Trustees or dealers selected by Putnam Management. Such services or dealers determine valuations for normal institutional-size trading units of such securities using methods based on market transactions for comparable securities and various relationships, generally recognized by institutional traders, between securities (which consider such factors as security prices, yields, maturities and ratings). These securities will generally be categorized as Level 2. Securities quoted in foreign currencies, if any, are translated into U.S. dollars at the current exchange rate.
Investments in open-end investment companies (excluding exchange-traded funds), if any, which can be classified as Level 1 or Level 2 securities, are valued based on their net asset value. The net asset value of such investment companies equals the total value of their assets less their liabilities and divided by the number of their outstanding shares.
To the extent a pricing service or dealer is unable to value a security or provides a valuation that Putnam Management does not believe accurately reflects the security’s fair value, the security will be valued at fair value by Putnam Management in accordance with policies and procedures approved by the Trustees. Certain investments, including certain restricted and illiquid securities and derivatives, are also valued at fair value following procedures approved by the Trustees. These valuations consider such factors as significant market or specific security events such as interest rate or credit quality changes, various relationships with other securities, discount rates, U.S. Treasury, U.S. swap and credit yields, index levels, convexity exposures, recovery rates, sales and other multiples and resale restrictions. These securities are classified as Level 2 or as Level 3 depending on the priority of the significant inputs.
To assess the continuing appropriateness of fair valuations, the Valuation Committee reviews and affirms the reasonableness of such valuations on a regular basis after considering all relevant information that is reasonably available. Such valuations and procedures are reviewed periodically by the Trustees. Certain securities may be valued on the basis of a price provided by a single source. The fair value of securities is generally determined as the amount that the fund could reasonably expect to realize from an orderly disposition of such securities over a reasonable period of time. By its nature, a fair value price is a good faith estimate of the value of a security in a current sale and does not reflect an actual market price, which may be different by a material amount.
Security transactions and related investment income Security transactions are recorded on the trade date (the date the order to buy or sell is executed). Gains or losses on securities sold are determined on the identified cost basis. Interest income, net of any applicable withholding taxes, is recorded on the accrual basis. All premiums/discounts are amortized/accreted on a yield-to-maturity basis.
Securities purchased or sold on a delayed delivery basis may be settled at a future date beyond customary settlement time; interest income is accrued based on the terms of the securities. Losses may arise due to changes in the fair value of the underlying securities or if the counterparty does not perform under the contract.
Stripped securities The fund may invest in stripped securities which represent a participation in securities that may be structured in classes with rights to receive different portions of the interest and principal. Interest-only securities receive all of the interest and principal-only securities receive all of the principal. If the interest-only securities experience greater than anticipated prepayments of principal, the fund may fail to recoup fully its initial investment in these securities. Conversely, principal-only securities increase in value if prepayments are greater than anticipated and decline if prepayments are slower than anticipated. The fair value of these securities is highly sensitive to changes in interest rates.
Options contracts The fund uses options contracts to hedge duration and convexity, to isolate prepayment risk and to manage downside risks.
The potential risk to the fund is that the change in value of options contracts may not correspond to the change in value of the hedged instruments. In addition, losses may arise from changes in the value of the underlying instruments if there is an illiquid secondary market for the contracts, if interest or exchange rates move unexpectedly or if the counterparty to the contract is unable to perform. Realized gains and losses on purchased options are included in realized gains and losses on investment securities. If a written call option is exercised, the premium originally received is recorded as an addition to sales proceeds. If a written put option is exercised, the premium originally received is recorded as a reduction to the cost of investments.
Exchange-traded options are valued at the last sale price or, if no sales are reported, the last bid price for purchased options and the last ask price for written options. OTC traded options are valued using prices supplied by dealers.
Options on swaps are similar to options on securities except that the premium paid or received is to buy or grant the right to enter into a previously agreed upon interest rate or credit default contract. Forward premium swap option contracts include premiums that have extended settlement dates. The delayed settlement of the premiums is factored into the daily valuation of the option contracts. In the case of interest rate cap and floor contracts, in return for a premium, ongoing payments between two parties are based on interest rates exceeding a specified rate, in the case of a cap contract, or falling below a specified rate in the case of a floor contract.
Written option contracts outstanding at period end, if any, are listed after the fund’s portfolio.
Futures contracts The fund uses futures contracts for hedging treasury term structure risk and for yield curve positioning.
The potential risk to the fund is that the change in value of futures contracts may not correspond to the change in value of the hedged instruments. In addition, losses may arise from changes in the value of the underlying instruments, if there is an illiquid secondary market for the contracts, if interest or exchange rates move unexpectedly or if the counterparty to the contract is unable to perform. With futures, there is minimal counterparty credit risk to the fund since futures are exchange traded and the exchange’s clearinghouse, as counterparty to all exchange traded futures, guarantees the futures against default. Risks may exceed amounts recognized on the Statement of assets and liabilities. When the contract is closed, the fund records a realized gain or loss equal to the difference between the value of the contract at the time it was opened and the value at the time it was closed.
Futures contracts are valued at the quoted daily settlement prices established by the exchange on which they trade. The fund and the broker agree to exchange an amount of cash equal to the daily fluctuation in the value of the futures contract. Such receipts or payments are known as “variation margin.”
Futures contracts outstanding at period end, if any, are listed after the fund’s portfolio.
Interest rate swap contracts The fund entered into OTC and/or centrally cleared interest rate swap contracts, which are arrangements between two parties to exchange cash flows based on a notional principal amount, for hedging term structure risk and for yield curve positioning.
An OTC and centrally cleared interest rate swap can be purchased or sold with an upfront premium. For OTC interest rate swap contracts, an upfront payment received by the fund is recorded as a liability on the fund’s books. An upfront payment made by the fund is recorded as an asset on the fund’s books. OTC and centrally cleared interest rate swap contracts are marked to market daily based upon quotations from an independent pricing service or market makers. Any change is recorded as an unrealized gain or loss on OTC interest rate swaps. Daily fluctuations in the value of centrally cleared interest rate swaps are settled through a central clearing agent and are recorded in variation margin on the Statement of assets and liabilities and recorded as unrealized gain or loss. Payments, including upfront premiums, received or made are recorded as realized gains or losses at the reset date or the closing of the contract. Certain OTC and centrally cleared interest rate swap contracts may include extended effective dates. Payments related to these swap contracts are accrued based on the terms of the contract.
The fund could be exposed to credit or market risk due to unfavorable changes in the fluctuation of interest rates or if the counterparty defaults, in the case of OTC interest rate contracts, or the central clearing agency or a clearing member defaults, in the case of centrally cleared interest rate swap contracts, on its respective obligation to perform under the contract. The fund’s maximum risk of loss from counterparty risk or central clearing risk is the fair value of the contract. This risk may be mitigated for OTC interest rate swap contracts by having
a master netting arrangement between the fund and the counterparty and for centrally cleared interest rate swap contracts through the daily exchange of variation margin. There is minimal counterparty risk with respect to centrally cleared interest rate swap contracts due to the clearinghouse guarantee fund and other resources that are available in the event of a clearing member default. Risk of loss may exceed amounts recognized on the Statement of assets and liabilities.
OTC and centrally cleared interest rate swap contracts outstanding, including their respective notional amounts at period end, if any, are listed after the fund’s portfolio.
Total return swap contracts The fund entered into OTC and/or centrally cleared total return swap contracts, which are arrangements to exchange a market-linked return for a periodic payment, both based on a notional principal amount, to hedge sector exposure and for gaining exposure to specific sectors.
To the extent that the total return of the security, index or other financial measure underlying the transaction exceeds or falls short of the offsetting interest rate obligation, the fund will receive a payment from or make a payment to the counterparty. OTC and/or centrally cleared total return swap contracts are marked to market daily based upon quotations from an independent pricing service or market maker. Any change is recorded as an unrealized gain or loss on OTC total return swaps. Daily fluctuations in the value of centrally cleared total return swaps are settled through a central clearing agent and are recorded in variation margin on the Statement of assets and liabilities and recorded as unrealized gain or loss. Payments received or made are recorded as realized gains or losses. Certain OTC and/or centrally cleared total return swap contracts may include extended effective dates. Payments related to these swap contracts are accrued based on the terms of the contract. The fund could be exposed to credit or market risk due to unfavorable changes in the fluctuation of interest rates or in the price of the underlying security or index, the possibility that there is no liquid market for these agreements or that the counterparty may default on its obligation to perform. The fund’s maximum risk of loss from counterparty risk or central clearing risk is the fair value of the contract. This risk may be mitigated for OTC total return swap contracts by having a master netting arrangement between the fund and the counterparty and for centrally cleared total return swap contracts through the daily exchange of variation margin. There is minimal counterparty risk with respect to centrally cleared total return swap contracts due to the clearinghouse guarantee fund and other resources that are available in the event of a clearing member default. Risk of loss may exceed amounts recognized on the Statement of assets and liabilities.
OTC and/or centrally cleared total return swap contracts outstanding, including their respective notional amounts at period end, if any, are listed after the fund’s portfolio.
Credit default contracts The fund entered into OTC and/or centrally cleared credit default contracts to hedge credit risk, for gaining liquid exposure to individual names, to hedge market risk and for gaining exposure to specific sectors.
In OTC and centrally cleared credit default contracts, the protection buyer typically makes a periodic stream of payments to a counterparty, the protection seller, in exchange for the right to receive a contingent payment upon the occurrence of a credit event on the reference obligation or all other equally ranked obligations of the reference entity. Credit events are contract specific but may include bankruptcy, failure to pay, restructuring and obligation acceleration. For OTC credit default contracts, an upfront payment received by the fund is recorded as a liability on the fund’s books. An upfront payment made by the fund is recorded as an asset on the fund’s books. Centrally cleared credit default contracts provide the same rights to the protection buyer and seller except the payments between parties, including upfront premiums, are settled through a central clearing agent through variation margin payments. Upfront and periodic payments received or paid by the fund for OTC and centrally cleared credit default contracts are recorded as realized gains or losses at the reset date or close of the contract. The OTC and centrally cleared credit default contracts are marked to market daily based upon quotations from an independent pricing service or market makers. Any change in value of OTC credit default contracts is recorded as an unrealized gain or loss. Daily fluctuations in the value of centrally cleared credit default contracts are recorded in variation margin on the Statement of assets and liabilities and recorded as unrealized gain or loss. Upon the occurrence of a credit event, the difference between the par value and fair value of the reference obligation, net of any proportional amount of the upfront payment, is recorded as a realized gain or loss.
In addition to bearing the risk that the credit event will occur, the fund could be exposed to market risk due to unfavorable changes in interest rates or in the price of the underlying security or index or the possibility that the fund may be unable to close out its position at the same time or at the same price as if it had purchased the underlying reference obligations. In certain circumstances, the fund may enter into offsetting OTC and centrally
cleared credit default contracts which would mitigate its risk of loss. Risks of loss may exceed amounts recognized on the Statement of assets and liabilities. The fund’s maximum risk of loss from counterparty risk, either as the protection seller or as the protection buyer, is the fair value of the contract. This risk may be mitigated for OTC credit default contracts by having a master netting arrangement between the fund and the counterparty and for centrally cleared credit default contracts through the daily exchange of variation margin. Counterparty risk is further mitigated with respect to centrally cleared credit default swap contracts due to the clearinghouse guarantee fund and other resources that are available in the event of a clearing member default. Where the fund is a seller of protection, the maximum potential amount of future payments the fund may be required to make is equal to the notional amount.
OTC and centrally cleared credit default contracts outstanding, including their respective notional amounts at period end, if any, are listed after the fund’s portfolio.
TBA commitments The fund may enter into TBA (to be announced) commitments to purchase securities for a fixed unit price at a future date beyond customary settlement time. Although the unit price and par amount have been established, the actual securities have not been specified. However, it is anticipated that the amount of the commitments will not significantly differ from the principal amount. The fund holds, and maintains until settlement date, cash or high-grade debt obligations in an amount sufficient to meet the purchase price, or the fund may enter into offsetting contracts for the forward sale of other securities it owns. Income on the securities will not be earned until settlement date.
The fund may also enter into TBA sale commitments to hedge its portfolio positions, to sell mortgage-backed securities it owns under delayed delivery arrangements or to take a short position in mortgage-backed securities. Proceeds of TBA sale commitments are not received until the contractual settlement date. During the time a TBA sale commitment is outstanding, either equivalent deliverable securities or an offsetting TBA purchase commitment deliverable on or before the sale commitment date are held as “cover” for the transaction, or other liquid assets in an amount equal to the notional value of the TBA sale commitment are segregated. If the TBA sale commitment is closed through the acquisition of an offsetting TBA purchase commitment, the fund realizes a gain or loss. If the fund delivers securities under the commitment, the fund realizes a gain or a loss from the sale of the securities based upon the unit price established at the date the commitment was entered into.
TBA commitments, which are accounted for as purchase and sale transactions, may be considered securities themselves, and involve a risk of loss due to changes in the value of the security prior to the settlement date as well as the risk that the counterparty to the transaction will not perform its obligations. Counterparty risk is mitigated by having a master agreement between the fund and the counterparty.
Unsettled TBA commitments are valued at their fair value according to the procedures described under “Security valuation” above. The contract is marked to market daily and the change in fair value is recorded by the fund as an unrealized gain or loss. Based on market circumstances, Putnam Management will determine whether to take delivery of the underlying securities or to dispose of the TBA commitments prior to settlement.
TBA purchase commitments outstanding at period end, if any, are listed within the fund’s portfolio and TBA sale commitments outstanding at period end, if any, are listed after the fund’s portfolio.
Master agreements The fund is a party to ISDA (International Swaps and Derivatives Association, Inc.) Master Agreements that govern OTC derivative and foreign exchange contracts and Master Securities Forward Transaction Agreements that govern transactions involving mortgage-backed and other asset-backed securities that may result in delayed delivery (Master Agreements) with certain counterparties entered into from time to time. The Master Agreements may contain provisions regarding, among other things, the parties’ general obligations, representations, agreements, collateral requirements, events of default and early termination. With respect to certain counterparties, in accordance with the terms of the Master Agreements, collateral posted to the fund is held in a segregated account by the fund’s custodian and, with respect to those amounts which can be sold or repledged, are presented in the fund’s portfolio.
Collateral pledged by the fund is segregated by the fund’s custodian and identified in the fund’s portfolio. Collateral can be in the form of cash or debt securities issued by the U.S. Government or related agencies or other securities as agreed to by the fund and the applicable counterparty. Collateral requirements are determined based on the fund’s net position with each counterparty.
With respect to ISDA Master Agreements, termination events applicable to the fund may occur upon a decline in the fund’s net assets below a specified threshold over a certain period of time. Termination events applicable to counterparties may occur upon a decline in the counterparty’s long-term or short-term credit ratings below
a specified level. In each case, upon occurrence, the other party may elect to terminate early and cause settlement of all derivative and foreign exchange contracts outstanding, including the payment of any losses and costs resulting from such early termination, as reasonably determined by the terminating party. Any decision by one or more of the fund’s counterparties to elect early termination could impact the fund’s future derivative activity.
At the close of the reporting period, the fund had a net liability position of $17,711,141 on open derivative contracts subject to the Master Agreements. Collateral posted by the fund at period end for these agreements totaled $17,957,934 and may include amounts related to unsettled agreements.
Interfund lending The fund, along with other Putnam funds, may participate in an interfund lending program pursuant to an exemptive order issued by the SEC. This program allows the fund to borrow from or lend to other Putnam funds that permit such transactions. Interfund lending transactions are subject to each fund’s investment policies and borrowing and lending limits. Interest earned or paid on the interfund lending transaction will be based on the average of certain current market rates. During the reporting period, the fund did not utilize the program.
Lines of credit The fund participates, along with other Putnam funds, in a $317.5 million unsecured committed line of credit and a $235.5 million unsecured uncommitted line of credit, both provided by State Street. Borrowings may be made for temporary or emergency purposes, including the funding of shareholder redemption requests and trade settlements. Interest is charged to the fund based on the fund’s borrowing at a rate equal to 1.25% plus the higher of (1) the Federal Funds rate and (2) the overnight LIBOR for the committed line of credit and the Federal Funds rate plus 1.30% for the uncommitted line of credit. A closing fee equal to 0.04% of the committed line of credit plus a $25,000 flat fee and 0.04% of the uncommitted line of credit has been paid by the participating funds. In addition, a commitment fee of 0.21% per annum on any unutilized portion of the committed line of credit is allocated to the participating funds based on their relative net assets and paid quarterly. During the reporting period, the fund had no borrowings against these arrangements.
Federal taxes It is the policy of the fund to distribute all of its taxable income within the prescribed time period and otherwise comply with the provisions of the Internal Revenue Code of 1986, as amended (the Code), applicable to regulated investment companies. It is also the intention of the fund to distribute an amount sufficient to avoid imposition of any excise tax under Section 4982 of the Code.
The fund is subject to the provisions of Accounting Standards Codification 740 Income Taxes (ASC 740). ASC 740 sets forth a minimum threshold for financial statement recognition of the benefit of a tax position taken or expected to be taken in a tax return. The fund did not have a liability to record for any unrecognized tax benefits in the accompanying financial statements. No provision has been made for federal taxes on income, capital gains or unrealized appreciation on securities held nor for excise tax on income and capital gains. Each of the fund’s federal tax returns for the prior three fiscal years remains subject to examination by the Internal Revenue Service.
Under the Regulated Investment Company Modernization Act of 2010, the fund will be permitted to carry forward capital losses incurred for an unlimited period and the carry forwards will retain their character as either short-term or long-term capital losses. At October 31, 2017, the fund had the following capital loss carryovers available, to the extent allowed by the Code, to offset future net capital gain, if any:
| | |
| Loss carryover |
| Short-term | Long-term | Total |
| $32,316,987 | $— | $32,316,987 |
Distributions to shareholders Distributions to shareholders from net investment income are recorded by the fund on the ex-dividend date. Distributions from capital gains, if any, are recorded on the ex-dividend date and paid at least annually. The amount and character of income and gains to be distributed are determined in accordance with income tax regulations, which may differ from generally accepted accounting principles. These differences include temporary and/or permanent differences from the expiration of a capital loss carryover, from unrealized gains and losses on certain futures contracts, from income on swap contracts, from interest only securities and from Real Estate Mortgage Investment Conduits “REMIC” securities. Reclassifications are made to the fund’s capital accounts to reflect income and gains available for distribution (or available capital loss carryovers) under income tax regulations. At the close of the reporting period, the fund reclassified $9,367,579 to decrease undistributed net investment income, $63,311,499 to decrease paid-in capital and $72,679,078 to decrease accumulated net realized loss.
Tax cost of investments includes adjustments to net unrealized appreciation (depreciation) which may not necessarily be final tax cost basis adjustments, but closely approximate the tax basis unrealized gains and losses that may be realized and distributed to shareholders. The tax basis components of distributable earnings and the federal tax cost as of the close of the reporting period were as follows:
| |
| Unrealized appreciation | $63,331,652 |
| Unrealized depreciation | (107,921,580) |
| Net unrealized depreciation | (44,589,928) |
| Undistributed ordinary income | 15,913,852 |
| Capital loss carryforward | (32,316,987) |
| Cost for federal income tax purposes | $2,228,653,153 |
Note 2: Management fee, administrative services and other transactions
The fund pays Putnam Management a management fee (based on the fund’s average net assets and computed and paid monthly) at annual rates that may vary based on the average of the aggregate net assets of all open-end mutual funds sponsored by Putnam Management (excluding net assets of funds that are invested in, or that are invested in by, other Putnam funds to the extent necessary to avoid “double counting” of those assets). Such annual rates may vary as follows:
| | | | |
| 0.550% | of the first $5 billion, | | 0.350% | of the next $50 billion, |
| 0.500% | of the next $5 billion, | | 0.330% | of the next $50 billion, |
| 0.450% | of the next $10 billion, | | 0.320% | of the next $100 billion and |
| 0.400% | of the next $10 billion, | | 0.315% | of any excess thereafter. |
For the reporting period, the management fee represented an effective rate (excluding the impact from any expense waivers in effect) of 0.395% of the fund’s average net assets.
Putnam Management has contractually agreed, through February 28, 2019, to waive fees or reimburse the fund’s expenses to the extent necessary to limit the cumulative expenses of the fund, exclusive of brokerage, interest, taxes, investment-related expenses, extraordinary expenses, acquired fund fees and expenses and payments under the fund’s investor servicing contract, investment management contract and distribution plans, on a fiscal year-to-date basis to an annual rate of 0.20% of the fund’s average net assets over such fiscal year-to-date period. During the reporting period, the fund’s expenses were not reduced as a result of this limit.
Putnam Investments Limited (PIL), an affiliate of Putnam Management, is authorized by the Trustees to manage a separate portion of the assets of the fund as determined by Putnam Management from time to time. PIL did not manage any portion of the assets of the fund during the reporting period. If Putnam Management were to engage the services of PIL, Putnam Management would pay a quarterly sub-management fee to PIL for its services at an annual rate of 0.25% of the average net assets of the portion of the fund managed by PIL.
The fund reimburses Putnam Management an allocated amount for the compensation and related expenses of certain officers of the fund and their staff who provide administrative services to the fund. The aggregate amount of all such reimbursements is determined annually by the Trustees.
Custodial functions for the fund’s assets are provided by State Street. Custody fees are based on the fund’s asset level, the number of its security holdings and transaction volumes.
Putnam Investor Services, Inc., an affiliate of Putnam Management, provides investor servicing agent functions to the fund. Putnam Investor Services, Inc. received fees for investor servicing for class A, class B, class C, class M, class R and class Y shares that included (1) a per account fee for each direct and underlying non-defined contribution account (“retail account”) of the fund; (2) a specified rate of the fund’s assets attributable to defined contribution plan accounts; and (3) a specified rate based on the average net assets in retail accounts. Putnam Investor Services, Inc. has agreed that the aggregate investor servicing fees for each fund’s retail and defined contribution accounts for these share classes will not exceed an annual rate of 0.25% of the fund’s average assets attributable to such accounts.
Class R5 shares paid a monthly fee based on the average net assets of class R5 shares at an annual rate of 0.12%.
Class R6 shares paid a monthly fee based on the average net assets of class R6 shares at an annual rate of 0.05%.
During the reporting period, the expenses for each class of shares related to investor servicing fees were as follows:
| | | | |
| Class A | $1,211,312 | | Class R5 | 4,906 |
| Class B | 36,617 | | Class R6 | 36,061 |
| Class C | 254,378 | | Class Y | 988,644 |
| Class M | 139,545 | | Total | $2,705,853 |
| Class R | 34,390 | | | |
The fund has entered into expense offset arrangements with Putnam Investor Services, Inc. and State Street whereby Putnam Investor Services, Inc.’s and State Street’s fees are reduced by credits allowed on cash balances. For the reporting period, the fund’s expenses were reduced by $5,144 under the expense offset arrangements.
Each Independent Trustee of the fund receives an annual Trustee fee, of which $1,146, as a quarterly retainer, has been allocated to the fund, and an additional fee for each Trustees meeting attended. Trustees also are reimbursed for expenses they incur relating to their services as Trustees.
The fund has adopted a Trustee Fee Deferral Plan (the Deferral Plan) which allows the Trustees to defer the receipt of all or a portion of Trustees fees payable on or after July 1, 1995. The deferred fees remain invested in certain Putnam funds until distribution in accordance with the Deferral Plan.
The fund has adopted an unfunded noncontributory defined benefit pension plan (the Pension Plan) covering all Trustees of the fund who have served as a Trustee for at least five years and were first elected prior to 2004. Benefits under the Pension Plan are equal to 50% of the Trustee’s average annual attendance and retainer fees for the three years ended December 31, 2005. The retirement benefit is payable during a Trustee’s lifetime, beginning the year following retirement, for the number of years of service through December 31, 2006. Pension expense for the fund is included in Trustee compensation and expenses in the Statement of operations. Accrued pension liability is included in Payable for Trustee compensation and expenses in the Statement of assets and liabilities. The Trustees have terminated the Pension Plan with respect to any Trustee first elected after 2003.
The fund has adopted distribution plans (the Plans) with respect to the following share classes pursuant to Rule 12b–1 under the Investment Company Act of 1940. The purpose of the Plans is to compensate Putnam Retail Management Limited Partnership, an indirect wholly-owned subsidiary of Putnam Investments, LLC, for services provided and expenses incurred in distributing shares of the fund. The Plans provide payments by the fund to Putnam Retail Management Limited Partnership at an annual rate of up to the following amounts (“Maximum %”) of the average net assets attributable to each class. The Trustees have approved payment by the fund at the following annual rate (“Approved %”) of the average net assets attributable to each class. During the reporting period, the class-specific expenses related to distribution fees were as follows:
| | | |
| | Maximum % | Approved % | Amount |
| Class A | 0.35% | 0.25% | $1,792,916 |
| Class B | 1.00% | 1.00% | 216,900 |
| Class C | 1.00% | 1.00% | 1,506,153 |
| Class M | 1.00% | 0.50% | 413,613 |
| Class R | 1.00% | 0.50% | 101,689 |
| Total | | | $4,031,271 |
For the reporting period, Putnam Retail Management Limited Partnership, acting as underwriter, received net commissions of $52,651 and $1,035 from the sale of class A and class M shares, respectively, and received $7,773 and $1,455 in contingent deferred sales charges from redemptions of class B and class C shares, respectively.
A deferred sales charge of up to 1.00% is assessed on certain redemptions of class A shares. For the reporting period, Putnam Retail Management Limited Partnership, acting as underwriter, received $840 on class A redemptions.
Note 3: Purchases and sales of securities
During the reporting period, the cost of purchases and the proceeds from sales, excluding short-term investments, were as follows:
| | |
| | Cost of purchases | Proceeds from sales |
| Investments in securities, including TBA commitments (Long-term) | $23,921,661,868 | $24,406,906,220 |
| U.S. government securities (Long-term) | — | — |
| Total | $23,921,661,868 | $24,406,906,220 |
The fund may purchase or sell investments from or to other Putnam funds in the ordinary course of business, which can reduce the fund’s transaction costs, at prices determined in accordance with SEC requirements and policies approved by the Trustees. During the reporting period, purchases or sales of long-term securities from or to other Putnam funds, if any, did not represent more than 5% of the fund’s total cost of purchases and/or total proceeds from sales.
Note 4: Capital shares
At the close of the reporting period, there were an unlimited number of shares of beneficial interest authorized. Transactions in capital shares were as follows:
| | | | |
| | YEAR ENDED 10/31/17 | YEAR ENDED 10/31/16 |
| Class A | Shares | Amount | Shares | Amount |
| Shares sold | 11,937,181 | $82,101,703 | 17,420,831 | $119,476,416 |
| Shares issued in connection with | | | | |
| reinvestment of distributions | 3,202,893 | 21,954,903 | 3,638,187 | 24,927,008 |
| | 15,140,074 | 104,056,606 | 21,059,018 | 144,403,424 |
| Shares repurchased | (39,037,327) | (267,532,889) | (57,474,861) | (394,878,288) |
| Net decrease | (23,897,253) | $(163,476,283) | (36,415,843) | $(250,474,864) |
| |
| | YEAR ENDED 10/31/17 | YEAR ENDED 10/31/16 |
| Class B | Shares | Amount | Shares | Amount |
| Shares sold | 161,340 | $1,095,040 | 473,905 | $3,215,137 |
| Shares issued in connection with | | | | |
| reinvestment of distributions | 76,098 | 516,308 | 80,018 | 543,022 |
| | 237,438 | 1,611,348 | 553,923 | 3,758,159 |
| Shares repurchased | (1,048,641) | (7,121,027) | (1,291,032) | (8,770,404) |
| Net decrease | (811,203) | $(5,509,679) | (737,109) | $(5,012,245) |
| |
| | YEAR ENDED 10/31/17 | YEAR ENDED 10/31/16 |
| Class C | Shares | Amount | Shares | Amount |
| Shares sold | 2,030,543 | $13,835,244 | 4,430,148 | $30,109,030 |
| Shares issued in connection with | | | | |
| reinvestment of distributions | 506,429 | 3,442,806 | 530,664 | 3,609,062 |
| | 2,536,972 | 17,278,050 | 4,960,812 | 33,718,092 |
| Shares repurchased | (9,788,422) | (66,604,219) | (10,799,205) | (73,554,564) |
| Net decrease | (7,251,450) | $(49,326,169) | (5,838,393) | $(39,836,472) |
| | | | |
| | YEAR ENDED 10/31/17 | YEAR ENDED 10/31/16 |
| Class M | Shares | Amount | Shares | Amount |
| Shares sold | 163,274 | $1,094,644 | 482,758 | $3,218,271 |
| Shares issued in connection with | | | | |
| reinvestment of distributions | 58,133 | 388,227 | 75,824 | 506,747 |
| | 221,407 | 1,482,871 | 558,582 | 3,725,018 |
| Shares repurchased | (1,653,408) | (11,079,153) | (2,618,370) | (17,563,768) |
| Net decrease | (1,432,001) | $(9,596,282) | (2,059,788) | $(13,838,750) |
| |
| | YEAR ENDED 10/31/17 | YEAR ENDED 10/31/16 |
| Class R | Shares | Amount | Shares | Amount |
| Shares sold | 644,367 | $4,386,003 | 1,215,839 | $8,277,029 |
| Shares issued in connection with | | | | |
| reinvestment of distributions | 81,700 | 555,126 | 101,647 | 691,080 |
| | 726,067 | 4,941,129 | 1,317,486 | 8,968,109 |
| Shares repurchased | (2,138,164) | (14,557,577) | (1,868,141) | (12,738,129) |
| Net decrease | (1,412,097) | $(9,616,448) | (550,655) | $(3,770,020) |
| |
| | YEAR ENDED 10/31/17 | YEAR ENDED 10/31/16 |
| Class R5 | Shares | Amount | Shares | Amount |
| Shares sold | 154,014 | $1,073,749 | 201,050 | $1,396,092 |
| Shares issued in connection with | | | | |
| reinvestment of distributions | 22,361 | 154,890 | 23,308 | 161,676 |
| | 176,375 | 1,228,639 | 224,358 | 1,557,768 |
| Shares repurchased | (402,215) | (2,797,260) | (133,296) | (926,116) |
| Net increase (decrease) | (225,840) | $(1,568,621) | 91,062 | $631,652 |
| |
| | YEAR ENDED 10/31/17 | YEAR ENDED 10/31/16 |
| Class R6 | Shares | Amount | Shares | Amount |
| Shares sold | 2,570,365 | $17,907,590 | 6,606,750 | $45,915,509 |
| Shares issued in connection with | | | | |
| reinvestment of distributions | 390,605 | 2,721,115 | 547,491 | 3,805,161 |
| | 2,960,970 | 20,628,705 | 7,154,241 | 49,720,670 |
| Shares repurchased | (3,487,648) | (24,310,473) | (13,772,333) | (96,559,360) |
| Net decrease | (526,678) | $(3,681,768) | (6,618,092) | $(46,838,690) |
| |
| | YEAR ENDED 10/31/17 | YEAR ENDED 10/31/16 |
| Class Y | Shares | Amount | Shares | Amount |
| Shares sold | 32,506,895 | $226,547,340 | 39,476,008 | $274,933,198 |
| Shares issued in connection with | | | | |
| reinvestment of distributions | 2,523,080 | 17,557,650 | 2,737,526 | 19,027,590 |
| | 35,029,975 | 244,104,990 | 42,213,534 | 293,960,788 |
| Shares repurchased | (47,813,719) | (332,558,436) | (58,632,097) | (408,018,568) |
| Net decrease | (12,783,744) | $(88,453,446) | (16,418,563) | $(114,057,780) |
At the close of the reporting period, Putnam Investments, LLC owned the following shares of the fund:
| | | |
| | Shares owned | Percentage of ownership | Value |
| Class R5 | 1,716 | 0.34% | $12,029 |
Note 5: Affiliated transactions
Transactions during the reporting period with any company which is under common ownership or control were as follows:
| | | | | |
| | | | | | Shares |
| | | | | | outstanding |
| | | | | | and fair |
| | Fair value as | Purchase | Sale | Investment | value as |
| Name of affiliate | of 10/31/16 | cost | proceeds | income | of 10/31/17 |
| Short-term investments | | | | | |
| Putnam Short Term | | | | | |
| Investment Fund* | $185,198,930 | $605,329,949 | $769,871,787 | $791,394 | $20,657,092 |
| Total Short-term | | | | | |
| investments | $185,198,930 | $605,329,949 | $769,871,787 | $791,394 | $20,657,092 |
* Management fees charged to Putnam Short Term Investment Fund have been waived by Putnam Management. There were no realized or unrealized gains or losses during the period.
Note 6: Market, credit and other risks
In the normal course of business, the fund trades financial instruments and enters into financial transactions where risk of potential loss exists due to changes in the market (market risk) or failure of the contracting party to the transaction to perform (credit risk). The fund may be exposed to additional credit risk that an institution or other entity with which the fund has unsettled or open transactions will default. The fund may invest a significant portion of its assets in securitized debt instruments, including mortgage-backed and asset-backed investments. The yields and values of these investments are sensitive to changes in interest rates, the rate of principal payments on the underlying assets and the market’s perception of the issuers. The market for these investments may be volatile and limited, which may make them difficult to buy or sell.
Note 7: Summary of derivative activity
The volume of activity for the reporting period for any derivative type that was held during the period is listed below and was based on an average of the holdings at the end of each fiscal quarter:
| |
| Purchased TBA commitment option contracts (contract amount) | $292,300,000 |
| Purchased swap option contracts (contract amount) | $6,264,000,000 |
| Written TBA commitment option contracts (contract amount) | $536,600,000 |
| Written swap option contracts (contract amount) | $6,304,500,000 |
| Futures contracts (number of contracts) | 1,000 |
| Centrally cleared interest rate swap contracts (notional) | $3,692,700,000 |
| OTC total return swap contracts (notional) | $217,100,000 |
| Centrally cleared total return swap contracts (notional) | $9,300,000 |
| OTC credit default contracts (notional) | $223,700,000 |
| Centrally cleared credit default contracts (notional) | $51,200,000 |
The following is a summary of the fair value of derivative instruments as of the close of the reporting period:
| | | | |
| Fair value of derivative instruments as of the close of the reporting period | |
| | ASSET DERIVATIVES | LIABILITY DERIVATIVES |
| Derivatives not | | | | |
| accounted for as | Statement of | | Statement of | |
| hedging instruments | assets and | | assets and | |
| under ASC 815 | liabilities location | Fair value | liabilities location | Fair value |
| | | | Payables, Net assets — | |
| Credit contracts | Receivables | $10,074,227 | Unrealized depreciation | $31,450,819* |
| | Investments, | | | |
| | Receivables, Net | | | |
| | assets — Unrealized | | Payables, Net assets — | |
| Interest rate contracts | appreciation | 54,092,465* | Unrealized depreciation | 52,800,898* |
| Total | | $64,166,692 | | $84,251,717 |
* Includes cumulative appreciation/depreciation of futures contracts and/or centrally cleared swaps as reported in the fund’s portfolio. Only current day’s variation margin is reported within the Statement of assets and liabilities.
The following is a summary of realized and change in unrealized gains or losses of derivative instruments in the Statement of operations for the reporting period (see Note 1):
| | | | |
| Amount of realized gain or (loss) on derivatives recognized in net gain or (loss) on investments | |
| Derivatives not | | | | |
| accounted for as | | | | |
| hedging instruments | | | | |
| under ASC 815 | Options | Futures | Swaps | Total |
| Credit contracts | $— | $— | $(713,886) | $(713,886) |
| Interest rate contracts | (15,074,881) | (13,339,492) | 27,744,262 | $(670,111) |
| Total | $(15,074,881) | $(13,339,492) | $27,030,376 | $(1,383,997) |
| | | | |
| Change in unrealized appreciation or (depreciation) on derivatives recognized in net gain or (loss) |
| on investments | | | | |
| Derivatives not | | | | |
| accounted for as | | | | |
| hedging instruments | | | | |
| under ASC 815 | Options | Futures | Swaps | Total |
| Credit contracts | $— | $— | $(3,919,516) | $(3,919,516) |
| Interest rate contracts | 733,251 | 6,388,736 | 1,057,124 | $8,179,111 |
| Total | $733,251 | $6,388,736 | $(2,862,392) | $4,259,595 |
Note 8: Offsetting of financial and derivative assets and liabilities
The following table summarizes any derivatives, repurchase agreements and reverse repurchase agreements, at the end of the reporting period, that are subject to an enforceable master netting agreement or similar agreement. For securities lending transactions or borrowing transactions associated with securities sold short, if any, see Note 1. For financial reporting purposes, the fund does not offset financial assets and financial liabilities that are subject to the master netting agreements in the Statement of assets and liabilities.
| | | | | | | | | | | | |
| | | Barclays | | | | | | | | Morgan | |
| | | Capital, Inc. | | Citigroup | | Goldman | JPMorgan | | Merrill Lynch, | Stanley & Co. | |
| Bank of | Barclays Bank | (clearing | | Global | Credit Suisse | Sachs | Chase Bank | JPMorgan | Pierce, Fenner | International | |
| | America N.A. | PLC | broker) | Citibank, N.A. | Markets, Inc. | International | International | N.A. | Securities LLC | & Smith, Inc. | PLC | Total |
| Assets: | | | | | | | | | | | | |
| Centrally cleared interest rate | | | | | | | | | | | | |
| swap contracts§ | $— | $— | $ 488,584 | $— | $— | $— | $— | $— | $— | $— | $— | $ 488,584 |
| OTC Total return swap contracts*# | 3,036 | 10,703 | — | — | — | 43,753 | 32,757 | 1,732 | 13,284 | — | — | 105,265 |
| Centrally cleared total return | | | | | | | | | | | | |
| swap contracts§ | — | — | 7,450 | — | — | — | — | — | — | — | — | 7,450 |
| OTC Credit default contracts — | | | | | | | | | | | | |
| protection sold *# | — | — | — | — | — | — | — | — | — | — | — | — |
| OTC Credit default contracts — | | | | | | | | | | | | |
| protection purchased*# | — | — | — | — | 243,114 | 3,781,258 | 2,848,860 | — | 3,200,995 | — | — | 10,074,227 |
| Centrally cleared credit | | | | | | | | | | | | |
| default contracts§ | — | — | — | — | — | — | — | — | — | — | — | — |
| Futures contracts§ | — | — | — | — | — | — | — | — | — | 268,500 | — | 268,500 |
| Forward premium swap | | | | | | | | | | | | |
| option contracts # | 2,518,911 | — | — | 613,337 | — | 5,566 | — | 1,939,090 | — | — | — | 5,076,904 |
| Purchased swap options **# | 5,612,588 | — | — | 6,381,593 | — | 3,242,605 | 4,253,986 | 6,206,004 | — | — | — | 25,696,776 |
| Purchased options **# | — | — | — | — | — | — | — | 1,611,240 | — | — | — | 1,611,240 |
| Total Assets | $8,134,535 | $10,703 | $496,034 | $6,994,930 | $243,114 | $7,073,182 | $7,135,603 | $9,758,066 | $3,214,279 | $268,500 | $— | $43,328,946 |
| Liabilities: | | | | | | | | | | | | |
| Centrally cleared interest rate | | | | | | | | | | | | |
| swap contracts§ | — | — | 1,108,086 | — | — | — | — | — | — | — | — | 1,108,086 |
| OTC Total return swap contracts*# | — | 650,432 | — | 11,051 | — | 84,944 | 119,967 | 2,044 | 38,165 | — | — | 906,603 |
| Centrally cleared total return | | | | | | | | | | | | |
| swap contracts§ | — | — | 6,078 | — | — | — | — | — | — | — | — | 6,078 |
| OTC Credit default contracts — | | | | | | | | | | | | |
| protection sold *# | 402,787 | — | — | — | — | 10,120,591 | 4,286,768 | — | 10,083,563 | — | — | 24,893,709 |
| OTC Credit default contracts - | | | | | | | | | | | | |
| protection purchased*# | — | — | — | — | — | — | — | — | — | — | — | — |
| Centrally cleared credit | | | | | | | | | | | | |
| default contracts§ | — | — | 112,076 | — | — | — | — | — | — | — | — | 112,076 |
| Futures contracts§ | — | — | — | — | — | — | — | — | — | — | — | — |
| Forward premium swap | | | | | | | | | | | | |
| option contracts # | 1,678,271 | 641,834 | — | 209,826 | — | — | 59,175 | 1,188,826 | — | — | 47,087 | 3,825,019 |
| Written swap options # | 5,235,398 | — | — | 8,518,246 | — | 2,493,989 | 4,774,200 | 5,795,143 | — | — | — | 26,816,976 |
| Written options # | — | — | — | — | — | — | — | 1,552,424 | — | — | — | 1,552,424 |
| Total Liabilities | $7,316,456 | $1,292,266 | $1,226,240 | $8,739,123 | $— | $12,699,524 | $9,240,110 | $8,538,437 | $10,121,728 | $— | $47,087 | $59,220,971 |
| |
| 94 Income Fund | Income Fund 95 |
| | | | | | | | | | | | |
| | | Barclays | | | | | | | | Morgan | |
| | | Capital, Inc. | | Citigroup | | Goldman | JPMorgan | | Merrill Lynch, | Stanley & Co. | |
| Bank of | Barclays Bank | (clearing | | Global | Credit Suisse | Sachs | Chase Bank | JPMorgan | Pierce, Fenner | International | |
| | America N.A. | PLC | broker) | Citibank, N.A. | Markets, Inc. | International | International | N.A. | Securities LLC | & Smith, Inc. | PLC | Total |
| Total Financial and Derivative | | | | | | | | | | | | |
| Net Assets | $818,079 | $(1,281,563) | $(730,206) | $(1,744,193) | $243,114 | $(5,626,342) | $(2,104,507) | $1,219,629 | $(6,907,449) | $268,500 | $(47,087) | $(15,892,025) |
| Total collateral received | | | | | | | | | | | | |
| (pledged)†## | $732,750 | $(1,225,675) | $— | $(1,730,129) | $220,000 | $(5,626,342) | $(2,059,018) | $1,209,000 | $(6,907,449) | $— | $— | |
| Net amount | $85,329 | $(55,888) | $(730,206) | $(14,064) | $23,114 | $— | $(45,489) | $10,629 | $— | $268,500 | $(47,087) | |
| Controlled collateral received | | | | | | | | | | | | |
| (including TBA commitments)** | $732,750 | $— | $— | $— | $220,000 | $— | $— | $1,209,000 | $— | $— | $— | $2,161,750 |
| Uncontrolled collateral received | $— | $— | $— | $— | $— | $— | $— | $— | $— | $— | $— | $— |
| Collateral (pledged) (including | | | | | | | | | | | | |
| TBA commitments)** | $— | $(1,225,675) | $— | $(1,730,129) | $— | $(5,945,326) | $(2,059,018) | $— | $(6,997,786) | $— | $— | $(17,957,934) |
* Excludes premiums, if any. Included in unrealized appreciation and depreciation on OTC swap contracts on the Statement of assets and liabilities.
** Included with Investments in securities on the Statement of assets and liabilities.
† Additional collateral may be required from certain brokers based on individual agreements.
# Covered by master netting agreement (Note 1).
## Any over-collateralization of total financial and derivative net assets is not shown. Collateral may include amounts related to unsettled agreements.
§ Includes current day’s variation margin only as reported on the Statement of assets and liabilities, which is not collateralized. Cumulative appreciation/(depreciation) for futures contracts and centrally cleared swap contracts is represented in the tables listed after the fund’s portfolio. Collateral pledged for initial margin on futures contracts and centrally cleared swap contracts, which is not included in the table above, amounted to $4,492,147 and $48,468,853, respectively.
Federal tax information (Unaudited)
For the reporting period, pursuant to §871(k) of the Internal Revenue Code, the fund hereby designates $55,295,570 of distributions paid as qualifying to be taxed as interest-related dividends, and no monies to be taxed as short-term capital gain dividends for nonresident alien shareholders.
The Form 1099 that will be mailed to you in January 2018 will show the tax status of all distributions paid to your account in calendar 2017.
| |
| 96 Income Fund | Income Fund 97 |


* Mr. Reynolds is an “interested person” (as defined in the Investment Company Act of 1940) of the fund and Putnam Investments. He is President and Chief Executive Officer of Putnam Investments, as well as the President of your fund and each of the other Putnam funds.
The address of each Trustee is One Post Office Square, Boston, MA 02109.
As of October 31, 2017, there were 106 Putnam funds. All Trustees serve as Trustees of all Putnam funds.
Each Trustee serves for an indefinite term, until his or her resignation, retirement at age 75, removal, or death.
Officers
In addition to Robert L. Reynolds, the other officers of the fund are shown below:
| |
| Jonathan S. Horwitz (Born 1955) | Susan G. Malloy (Born 1957) |
| Executive Vice President, Principal Executive Officer, | Vice President and Assistant Treasurer |
| and Compliance Liaison | Since 2007 |
| Since 2004 | Head of Accounting, Middle Office, & Control Services, |
| | Putnam Investments and Putnam Management |
| Robert T. Burns (Born 1961) | |
| Vice President and Chief Legal Officer | Mark C. Trenchard (Born 1962) |
| Since 2011 | Vice President and BSA Compliance Officer |
| General Counsel, Putnam Investments, | Since 2002 |
| Putnam Management, and Putnam Retail Management | Director of Operational Compliance, Putnam |
| | Investments and Putnam Retail Management |
| James F. Clark (Born 1974) | |
| Vice President and Chief Compliance Officer | Nancy E. Florek (Born 1957) |
| Since 2016 | Vice President, Director of Proxy Voting and Corporate |
| Chief Compliance Officer, Putnam Investments | Governance, Assistant Clerk, and Assistant Treasurer |
| and Putnam Management | Since 2000 |
| | |
| Michael J. Higgins (Born 1976) | Denere P. Poulack (Born 1968) |
| Vice President, Treasurer, and Clerk | Assistant Vice President, Assistant Clerk, |
| Since 2010 | and Assistant Treasurer |
| | Since 2004 |
| Janet C. Smith (Born 1965) | |
| Vice President, Principal Financial Officer, Principal | |
| Accounting Officer, and Assistant Treasurer | |
| Since 2007 | |
| Head of Fund Administration Services, | |
| Putnam Investments and Putnam Management | |
The principal occupations of the officers for the past five years have been with the employers as shown above, although in some cases they have held different positions with such employers. The address of each officer is One Post Office Square, Boston, MA 02109.
Fund information
Founded over 80 years ago, Putnam Investments was built around the concept that a balance between risk and reward is the hallmark of a well-rounded financial program. We manage over 100 funds across income, value, blend, growth, asset allocation, absolute return, and global sector categories.
| | |
| Investment Manager | Trustees | Michael J. Higgins |
| Putnam Investment | Jameson A. Baxter, Chair | Vice President, Treasurer, |
| Management, LLC | Kenneth R. Leibler, Vice Chair | and Clerk |
| One Post Office Square | Liaquat Ahamed | |
| Boston, MA 02109 | Ravi Akhoury | Janet C. Smith |
| | Barbara M. Baumann | Vice President, Principal Financial |
| Investment Sub-Advisor | Katinka Domotorffy | Officer, |
| Putnam Investments Limited | Catharine Bond Hill | Principal Accounting Officer, and |
| 16 St James’s Street | Paul L. Joskow | Assistant Treasurer |
| London, England SW1A 1ER | Robert E. Patterson | |
| | George Putnam, III | Susan G. Malloy |
| Marketing Services | Robert L. Reynolds | Vice President and |
| Putnam Retail Management | Manoj P. Singh | Assistant Treasurer |
| One Post Office Square | | |
| Boston, MA 02109 | Officers | Mark C. Trenchard |
| | Robert L. Reynolds | Vice President and |
| Custodian | President | BSA Compliance Officer |
| State Street Bank | | |
| and Trust Company | Jonathan S. Horwitz | Nancy E. Florek |
| | Executive Vice President, | Vice President, Director of |
| Legal Counsel | Principal Executive Officer, and | Proxy Voting and Corporate |
| Ropes & Gray LLP | Compliance Liaison | Governance, Assistant Clerk, |
| | | and Assistant Treasurer |
| Independent Registered | Robert T. Burns | |
| Public Accounting Firm | Vice President and | Denere P. Poulack |
| KPMG LLP | Chief Legal Officer | Assistant Vice President, Assistant |
| | | Clerk, and Assistant Treasurer |
| | James F. Clark | |
| | Vice President and | |
| | Chief Compliance Officer | |
This report is for the information of shareholders of Putnam Income Fund. It may also be used as sales literature when preceded or accompanied by the current prospectus, the most recent copy of Putnam’s Quarterly Performance Summary, and Putnam’s Quarterly Ranking Summary. For more recent performance, please visit putnam.com. Investors should carefully consider the investment objectives, risks, charges, and expenses of a fund, which are described in its prospectus. For this and other information or to request a prospectus or summary prospectus, call 1-800-225-1581 toll free. Please read the prospectus carefully before investing. The fund’s Statement of Additional Information contains additional information about the fund’s Trustees and is available without charge upon request by calling 1-800-225-1581.

| |
| (a) The fund's principal executive, financial and accounting officers are employees of Putnam Investment Management, LLC, the Fund's investment manager. As such they are subject to a comprehensive Code of Ethics adopted and administered by Putnam Investments which is designed to protect the interests of the firm and its clients. The Fund has adopted a Code of Ethics which incorporates the Code of Ethics of Putnam Investments with respect to all of its officers and Trustees who are employees of Putnam Investment Management, LLC. For this reason, the Fund has not adopted a separate code of ethics governing its principal executive, financial and accounting officers. |
| |
| Item 3. Audit Committee Financial Expert: |
| |
| The Funds' Audit, Compliance and Distributions Committee is comprised solely of Trustees who are “independent” (as such term has been defined by the Securities and Exchange Commission (“SEC”) in regulations implementing Section 407 of the Sarbanes-Oxley Act (the “Regulations”)). The Trustees believe that each of the members of the Audit, Compliance and Distributions Committee also possess a combination of knowledge and experience with respect to financial accounting matters, as well as other attributes, that qualify them for service on the Committee. In addition, the Trustees have determined that each of Mr. Patterson, Ms. Baumann and Mr. Singh qualifies as an “audit committee financial expert” (as such term has been defined by the Regulations) based on their review of his or her pertinent experience and education. The SEC has stated, and the funds' amended and restated agreement and Declaration of Trust provides, that the designation or identification of a person as an audit committee financial expert pursuant to this Item 3 of Form N-CSR does not impose on such person any duties, obligations or liability that are greater than the duties, obligations and liability imposed on such person as a member of the Audit, Compliance and Distribution Committee and the Board of Trustees in the absence of such designation or identification. |
| |
| Item 4. Principal Accountant Fees and Services: |
| |
| The following table presents fees billed in each of the last two fiscal years for services rendered to the fund by the fund's independent auditor: |
| | | | | |
| Fiscal year ended | Audit Fees | Audit-Related Fees | Tax Fees | All Other Fees |
|
|
| | | | | |
| October 31, 2017 | $132,794 | $ — | $7,187 | $ — |
| October 31, 2016 | $127,571 | $ — | $7,000 | $ — |
| |
| For the fiscal years ended October 31, 2017 and October 31, 2016, the fund's independent auditor billed aggregate non-audit fees in the amounts of $7,187 and $7,000 respectively, to the fund, Putnam Management and any entity controlling, controlled by or under common control with Putnam Management that provides ongoing services to the fund. |
| |
| Audit Fees represent fees billed for the fund's last two fiscal years relating to the audit and review of the financial statements included in annual reports and registration statements, and other services that are normally provided in connection with statutory and regulatory filings or engagements. |
| |
| Audit-Related Fees represent fees billed in the fund's last two fiscal years for services traditionally performed by the fund's auditor, including accounting consultation for proposed transactions or concerning financial accounting and reporting standards and other audit or attest services not required by statute or regulation. |
| |
| Tax Fees represent fees billed in the fund's last two fiscal years for tax compliance, tax planning and tax advice services. Tax planning and tax advice services include assistance with tax audits, employee benefit plans and requests for rulings or technical advice from taxing authorities. |
| |
| Pre-Approval Policies of the Audit, Compliance and Distributions Committee. The Audit, Compliance and Distributions Committee of the Putnam funds has determined that, as a matter of policy, all work performed for the funds by the funds' independent auditors will be pre-approved by the Committee itself and thus will generally not be subject to pre-approval procedures. |
| |
| The Audit, Compliance and Distributions Committee also has adopted a policy to pre-approve the engagement by Putnam Management and certain of its affiliates of the funds' independent auditors, even in circumstances where pre-approval is not required by applicable law. Any such requests by Putnam Management or certain of its affiliates are typically submitted in writing to the Committee and explain, among other things, the nature of the proposed engagement, the estimated fees, and why this work should be performed by that particular audit firm as opposed to another one. In reviewing such requests, the Committee considers, among other things, whether the provision of such services by the audit firm are compatible with the independence of the audit firm. |
| |
| The following table presents fees billed by the fund's independent auditor for services required to be approved pursuant to paragraph (c)(7)(ii) of Rule 2-01 of Regulation S-X. |
| | | | | |
| Fiscal year ended | Audit-Related Fees | Tax Fees | All Other Fees | Total Non-Audit Fees |
|
|
| | | | | |
| October 31, 2017 | $ — | $ — | $ — | $ — |
| October 31, 2016 | $ — | $ — | $ — | $ — |
| |
| Item 5. Audit Committee of Listed Registrants |
| |
|
Item 6. Schedule of Investments: |
| |
| The registrant's schedule of investments in unaffiliated issuers is included in the report to shareholders in Item 1 above. |
| |
| Item 7. Disclosure of Proxy Voting Policies and Procedures For Closed-End Management Investment Companies: |
| |
|
Item 8. Portfolio Managers of Closed-End Investment Companies |
| |
|
Item 9. Purchases of Equity Securities by Closed-End Management Investment Companies and Affiliated Purchasers: |
| |
|
Item 10. Submission of Matters to a Vote of Security Holders: |
| |
|
Item 11. Controls and Procedures: |
| |
| (a) The registrant's principal executive officer and principal financial officer have concluded, based on their evaluation of the effectiveness of the design and operation of the registrant's disclosure controls and procedures as of a date within 90 days of the filing date of this report, that the design and operation of such procedures are generally effective to provide reasonable assurance that information required to be disclosed by the registrant in this report is recorded, processed, summarized and reported within the time periods specified in the Commission's rules and forms. |
| |
| (b) Changes in internal control over financial reporting: Not applicable |
| |
| (a)(1) The Code of Ethics of The Putnam Funds, which incorporates the Code of Ethics of Putnam Investments, is filed herewith. |
| |
| (a)(2) Separate certifications for the principal executive officer and principal financial officer of the registrant as required by Rule 30a-2(a) under the Investment Company Act of 1940, as amended, are filed herewith. |
| |
| (b) The certifications required by Rule 30a-2(b) under the Investment Company Act of 1940, as amended, are filed herewith. |
| |
| Pursuant to the requirements of the Securities Exchange Act of 1934 and the Investment Company Act of 1940, the registrant has duly caused this report to be signed on its behalf by the undersigned, thereunto duly authorized. |
| |
| By (Signature and Title): |
| |
| /s/ Janet C. Smith
Janet C. Smith
Principal Accounting Officer
|
| |
| Pursuant to the requirements of the Securities Exchange Act of 1934 and the Investment Company Act of 1940, this report has been signed below by the following persons on behalf of the registrant and in the capacities and on the dates indicated. |
| |
| By (Signature and Title): |
| |
| /s/ Jonathan S. Horwitz
Jonathan S. Horwitz
Principal Executive Officer
|
| |
| By (Signature and Title): |
| |
| /s/ Janet C. Smith
Janet C. Smith
Principal Financial Officer
|