| | |
| UNITED STATES
SECURITIES AND EXCHANGE COMMISSION |
| | |
| CERTIFIED SHAREHOLDER REPORT OF REGISTERED
MANAGEMENT INVESTMENT COMPANIES
|
| | |
| Investment Company Act file number: | (811-00653) |
| | |
| Exact name of registrant as specified in charter: | Putnam Income Fund |
| | |
| Address of principal executive offices: | 100 Federal Street, Boston, Massachusetts 02110 |
| | |
| Name and address of agent for service: | Stephen Tate, Vice President
100 Federal Street
Boston, Massachusetts 02110 |
| | |
| Copy to: | Bryan Chegwidden, Esq.
Ropes & Gray LLP
1211 Avenue of the Americas
New York, New York 10036 |
| | |
| | James E. Thomas, Esq.
Ropes & Gray LLP
800 Boylston Street
Boston, Massachusetts 02199 |
| | |
| Registrant’s telephone number, including area code: | (617) 292-1000 |
| | |
| Date of fiscal year end: | October 31, 2023 |
| | |
| Date of reporting period: | November 1 , 2022 – October 31, 2023 |
| | |
|
Item 1. Report to Stockholders: | |
| | |
| The following is a copy of the report transmitted to stockholders pursuant to Rule 30e-1 under the Investment Company Act of 1940: | |
Putnam
Income
Fund
Annual report
10 | 31 | 23
Message from the Trustees
December 7, 2023
Dear Fellow Shareholder:
The U.S. economy has defied expectations of a recession year to date, with the pace of growth picking up speed in the third quarter. At the same time, volatility in financial markets has increased. Stock prices fell in late summer and early fall. Bond prices also declined during this time, while yields, which move in the opposite direction, rose. In October 2023, the 10-year U.S. Treasury yield, a key benchmark for setting mortgage rates, briefly rose above 5% for the first time since 2007.
Markets have been pressured by inflation, which has moderated but remains above the U.S. Federal Reserve’s target rate of 2%. In its continuing effort to bring down inflation, the Fed has indicated short-term interest rates will remain high heading into next year. This restrictive policy may keep the risk of recession alive in 2024 unless the U.S. economy slows without contracting.
Your investment team is analyzing shifting market conditions, actively navigating risks, and identifying attractive opportunities for your fund. An update on your fund is in the report that follows.
Thank you for investing with Putnam.

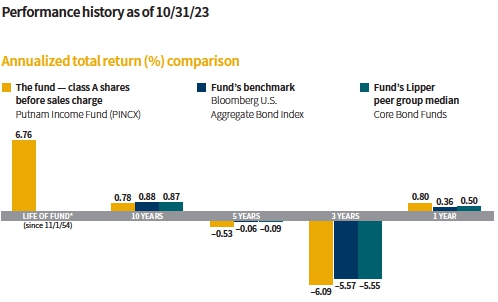
Current performance may be lower or higher than the quoted past performance, which cannot guarantee future results. Share price, principal value, and return will fluctuate, and you may have a gain or a loss when you sell your shares. Performance of class A shares assumes reinvestment of distributions and does not account for taxes. Fund returns in the bar chart do not reflect a sales charge of 4.00%; had they, returns would have been lower. See below and pages 8–11 for additional performance information. For a portion of the periods, the fund had expense limitations, without which returns would have been lower. To obtain the most recent month-end performance, visit putnam.com.
All Bloomberg indices are provided by Bloomberg Index Services Limited.
Lipper peer group median is provided by Lipper, an LSEG company.
* The fund’s benchmark, the Bloomberg U.S. Aggregate Bond Index, was introduced on 12/31/75, and the fund’s Lipper category was introduced on 12/31/59. Both post-date the inception of the fund’s class A shares.
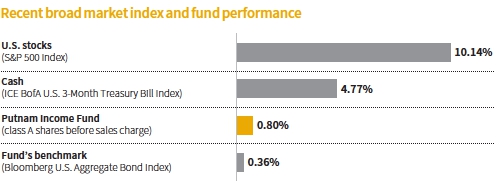
This comparison shows your fund’s performance in the context of broad market indexes for the 12 months ended 10/31/23. See above and pages 8–11 for additional fund performance information. Index descriptions can be found on page 14.
All Bloomberg indices are provided by Bloomberg Index Services Limited.
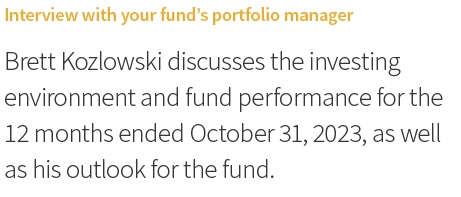

Brett, please describe investing conditions during the reporting period.
Bond markets faced several headwinds over the period. Stubborn inflation, rising interest rates, banking turmoil, and a U.S. debt ceiling crisis weighed on investor sentiment. The U.S. Federal Reserve continued to raise short-term interest rates to counter high inflation, which remained above its 2% target rate.
In December 2022, as inflation gradually declined, the Fed began to reduce the size and pace of its interest-rate hikes. The U.S. economy, buoyed by a strong labor market, remained in expansion. Company fundamentals were positive, with quarterly earnings reports largely better than expected. Concerns that the Fed’s monetary tightening would tip the U.S. economy into a recession began to subside.
In calendar 2023, new risks emerged. Sticky inflation caused the Fed to keep interest rates higher for longer than anticipated. The failure of several U.S. regional banks in March and concern over the large federal deficit also cautioned investors. In May, U.S. Treasury yields moved higher following a resolution to the months-long U.S. debt ceiling debate. After skipping a rate hike in June, the Fed lifted rates
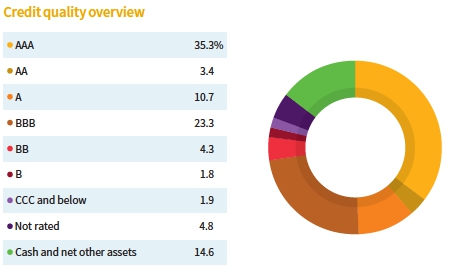
Credit qualities are shown as a percentage of the fund’s net assets as of 10/31/23. A bond rated BBB or higher (A-3 or higher, for short-term debt) is considered investment grade. This chart reflects the highest security rating provided by one or more of Standard & Poor’s, Moody’s, and Fitch. Ratings and portfolio credit quality will vary over time. Due to rounding, percentages may not equal 100%.
Cash and net other assets, if any, represent the market value weights of cash, derivatives, and short-term securities in the portfolio. The fund itself has not been rated by an independent rating agency.

in July. This brought the federal funds rate to a 22-year high of 5.25%–5.50%. The Fed held rates steady thereafter, but indicated another rate hike was possible before year-end calendar 2023.
Against this backdrop, credit spreads largely tightened over the period. [Credit spreads are the yield advantage credit-sensitive bonds offer over comparable-maturity U.S. Treasuries. Bond prices rise as yield spreads tighten and decline as spreads widen.] The yield on the benchmark 10-year U.S. Treasury fluctuated during the period. It began the period at 4.10%, declined to a low of 3.30% in April 2023, and ended the period at 4.88%.
How did the fund perform for the 12 months ended October 31, 2023?
The fund returned 0.80%, outperforming its benchmark, the Bloomberg U.S. Aggregate Bond Index, which returned 0.36%.
Which holdings and strategies detracted from the fund’s performance relative to the benchmark for the reporting period?
The fund’s interest-rate and yield curve positioning were the primary detractors for the reporting period. In January 2023, Treasury rates rallied significantly across most of the curve, with the 10-year Treasury declining 37 basis points by month’s end. As rates rallied, interest-rate volatility fell, which weighed on our term structure positioning. Interest-rate volatility picked up after January 2023 as Treasury rates sold off. However, this was not enough to offset earlier losses.
Our exposure to commercial mortgage-backed securities [CMBS] also weighed on returns. Negative headlines surrounding office properties, along with regional U.S. banking stress, contributed to a broad decline in the CMBS market in the first quarter of 2023. The CMBS market stabilized thereafter but remained challenged by an uncertain economic outlook and weakening liquidity through period-end.
Can you discuss some contributors to fund performance relative to the benchmark for the reporting period?
Prepayment risk strategies, led by our agency interest-only [IO] securities, were notable contributors to relative performance during the period. Prepayment speeds fell over the period, benefiting our agency IO securities. Our tactical mortgage basis positioning also helped results. During the period, we maintained a long mortgage basis, but remained tactical. Our tactical decisions benefited the fund as the basis tightened in the first half of the period and minimized the impact of the basis widening in the second half of the period. [Our long mortgage basis positioning is a strategy that capitalizes on the difference between longer-term U.S. Treasury yields and the interest rates on 30-year home mortgages.]

Mortgage credit investments, led by our residential MBS, added to fund returns. Despite higher mortgage rates, the U.S. housing market proved to be resilient given constrained supply. Corporate credit holdings, led by our high-grade collateralized loan obligations [CLOs], also was additive. Loan prices recovered in calendar 2023 and CLO spreads tightened, which provided a tailwind for our holdings rated AAA and AA.
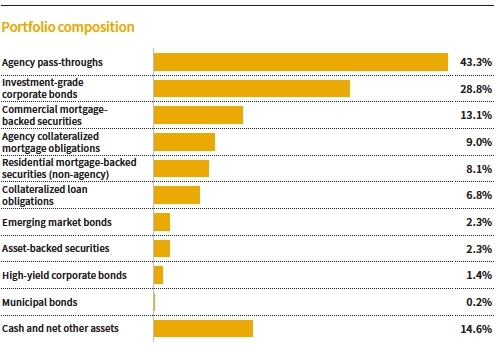
Allocations are shown as a percentage of the fund’s net assets as of 10/31/23. Cash and net other assets, if any, represent the market value weights of cash, derivatives, short-term securities, and other unclassified assets in the portfolio. Summary information may differ from the portfolio schedule included in the financial statements due to the inclusion of derivative securities, any interest accruals, the use of different classifications of securities for presentation purposes, and rounding. Allocations may not total 100% because the chart includes the notional value of certain derivatives (the economic value for purposes of calculating periodic payment obligations), in addition to the market value of securities. Holdings and allocations may vary over time.
How did you use derivatives during the reporting period?
We used futures for yield curve positioning and to hedge Treasury term structure risk. Interest-rate swaps were used to hedge term structure risk and for yield curve positioning. Options known as swaptions were used for hedging duration and convexity and for managing downside risks. Credit default swaps were used to hedge credit and market risks, to gain liquid exposure to individual names, and to gain exposure to specific sectors.
What is the team’s near-term outlook?
Our base-case scenario is that the rate of inflation will settle around 3.0%–3.5% and the U.S. will avoid a recession, in our view. In this case, we believe the Fed will have to keep rates higher for longer while quantitative tightening continues in the background. We expect fixed income spreads to stay flat to slightly tighter. Our alternate scenario is that the U.S. will experience a recession in late 2024, when the Fed’s tightening fully impacts the economy. If a recession does not arrive in calendar 2024, the Fed may not cut interest rates at all, in our view. As liquidity continues to be withdrawn, we expect financial market risks to increase.
What are your current views on the sectors in which the fund invests?
U.S. Treasury rates have traded higher since the resolution of the debt ceiling debate in May 2023. More recently, Treasury rates have rallied significantly on market expectations that point to a pause in the Fed’s rate hikes. Despite the Treasury rally, we believe the Fed will continue to keep interest rates higher for longer on the back of a strengthening U.S. economy and heavy Treasury issuance.
Healthy market technicals [supply/demand metrics] and positive macroeconomic data have kept investment-grade spread volatility low, in our view. These conditions were supportive of high-yield bonds, along with other risk assets. Year to date, corporate fundamentals have been resilient; most quarterly earnings reports surpassed expectations. Technicals also improved with a pickup in inflows in recent months. Low new issuance in high yield, coupled with an increased number of rising stars [companies that show the potential to improve their credit quality], also supported technicals, in our view. We believe valuations are modestly attractive. Credit spreads are pricing in a continued increase in defaults along with slower growth. However, these conditions do not indicate a harsh recession, in our view. Low U.S. dollar prices remain attractive with spreads at their long-term median. We believe risks to our outlook include increased banking volatility, policy missteps from global central banks, a more severe slowdown or recession than anticipated, and heightened geopolitical tensions.
We believe commercial real estate is facing meaningful headwinds and risks from a shift in office demand and rising costs of capital. Property values will likely face pressure over the medium term, with prices varying significantly by geography and property type, in our view. We believe much of the risk has been priced into the market based on substantial spread widening over the past 12 months. The most attractive relative value opportunities require detailed loan-level analysis and security selection, in our view.
U.S. homeowner balance sheets remain well positioned, supported by locked-in, ultra-low mortgage rates and substantial home price appreciation in recent years. We expect changes in home prices to be relatively flat through year-end calendar 2023. However, certain geographies that became overheated during the pandemic may begin to retract, in our view. At current levels, we believe attractive risk-adjusted return opportunities can be found across the capital stack.
We have a cautious intermediate outlook for emerging market [EM] credit. EM sovereigns appear overvalued across the quality spectrum.
We see the risks of recession and inflation in EM economies declining, which may be supportive of EM credit in the near term. We expect slightly more downside within the next three to nine months. We prefer to stay beta neutral [where portfolio risk is not correlated to broader market volatility] and seek relative value opportunities. We remain very selective when adding high-yield risk exposure.
We currently maintain a neutral to slightly long position to the mortgage basis but remain tactical. The systemic risk posed by regional bank failures appears to be behind us, and market supply should taper down in the near term. However, the future of bank demand remains uncertain and may hinge upon regulatory changes.
We expect mortgage prepayment speeds will be stable going forward. We believe our prepayment strategies can offer good protection against a recession that negatively impacts home prices or employment. In our view, many prepayment-sensitive assets now offer an attractive risk-adjusted return at current price levels, and significant upside potential if rates stabilize and volatility declines.
Thank you for your time and for bringing us up to date, Brett.
The views expressed in this report are exclusively those of Putnam Management and are subject to change. They are not meant as investment advice.
Please note that the holdings discussed in this report may not have been held by the fund for the entire period. Portfolio composition is subject to review in accordance with the fund’s investment strategy and may vary in the future. Current and future portfolio holdings are subject to risk.
Of special interest
The fund’s monthly dividend rate for class A shares increased from $0.017 to $0.021 per share in February 2023. This adjustment reflects Putnam Management’s expectations for fund earnings in the current fixed income environment. Similar increases were made to other share classes of the fund.
Your fund’s performance
This section shows your fund’s performance, price, and distribution information for periods ended October 31, 2023, the end of its most recent fiscal year. In accordance with regulatory requirements for mutual funds, we also include performance information as of the most recent calendar quarter-end and expense information taken from the fund’s current prospectus. Performance should always be considered in light of a fund’s investment strategy. Data represent past performance. Past performance does not guarantee future results. More recent returns may be less or more than those shown. Investment return and principal value will fluctuate, and you may have a gain or a loss when you sell your shares. Performance information does not reflect any deduction for taxes a shareholder may owe on fund distributions or on the redemption of fund shares. For the most recent month-end performance, please visit the Individual Investors section at putnam.com or call Putnam at 1-800-225-1581. Class M, R, R5, R6, and Y shares are not available to all investors.
Annualized fund performance Total return for periods ended 10/31/23
| | | | | |
| | Life of fund | 10 years | 5 years | 3 years | 1 year |
| Class A (11/1/54) | | | | | |
| Before sales charge | 6.76% | 0.78% | –0.53% | –6.09% | 0.80% |
| After sales charge | 6.70 | 0.37 | –1.34 | –7.36 | –3.23 |
| Class B (3/1/93) | | | | | |
| Before CDSC | 6.63 | 0.18 | –1.27 | –6.76 | 0.18 |
| After CDSC | 6.63 | 0.18 | –1.59 | –7.56 | –4.44 |
| Class C (7/26/99) | | | | | |
| Before CDSC | 6.67 | 0.18 | –1.28 | –6.77 | 0.04 |
| After CDSC | 6.67 | 0.18 | –1.28 | –6.77 | –0.88 |
| Class M (12/14/94) | | | | | |
| Before sales charge | 6.35 | 0.51 | –0.80 | –6.34 | 0.59 |
| After sales charge | 6.30 | 0.18 | –1.45 | –7.37 | –2.68 |
| Class R (1/21/03) | | | | | |
| Net asset value | 6.49 | 0.52 | –0.77 | –6.32 | 0.58 |
| Class R5 (7/2/12) | | | | | |
| Net asset value | 6.88 | 1.06 | –0.25 | –5.79 | 1.05 |
| Class R6 (7/2/12) | | | | | |
| Net asset value | 6.89 | 1.14 | –0.17 | –5.73 | 1.20 |
| Class Y (6/16/94) | | | | | |
| Net asset value | 6.87 | 1.03 | –0.27 | –5.82 | 1.19 |
Current performance may be lower or higher than the quoted past performance, which cannot guarantee future results. After-sales-charge returns for class A and M shares reflect the deduction of the maximum 4.00% and 3.25% sales charge, respectively, levied at the time of purchase. Class B share returns after contingent deferred sales charge (CDSC) reflect the applicable CDSC, which is 5% in the first year, declining over time to 1% in the sixth year, and is eliminated thereafter. Class C share returns after CDSC reflect a 1% CDSC for the first year that is eliminated thereafter. Class R, R5, R6, and Y shares have no initial sales charge or CDSC. Performance for class B, C, M, R, and Y shares before their inception is derived from the historical performance of class A shares, adjusted for the applicable sales charge (or CDSC) and the higher operating expenses for such shares, except for class Y shares, for which 12b-1 fees are not applicable. Performance for class R5 and R6 shares prior to their inception is derived from the historical performance of class Y shares and has not been adjusted for the lower investor servicing fees applicable to class R5 and R6 shares; had it, returns would have been higher.
For a portion of the periods, the fund had expense limitations, without which returns would have been lower.
Class B and C share performance reflects conversion to class A shares after eight years.
Comparative annualized index returns For periods ended 10/31/23
| | | | | |
| | Life of fund | 10 years | 5 years | 3 years | 1 year |
| Bloomberg U. S. Aggregate | | | | | |
| Bond Index | —* | 0.88% | –0.06% | –5.57% | 0.36% |
| Lipper Core Bond Funds | | | | | |
| category median† | —* | 0.87 | –0.09 | –5.55 | 0.50 |
Index and Lipper results should be compared with fund performance before sales charge, before CDSC, or at net asset value.
All Bloomberg indices are provided by Bloomberg Index Services Limited.
Lipper peer group median is provided by Lipper, an LSEG company.
* The fund’s benchmark, the Bloomberg U.S. Aggregate Bond Index, was introduced on 12/31/75, and the fund’s Lipper category was introduced on 12/31/59. Both post-date the inception of the fund’s class A shares.
† Over the 1-year, 3-year, 5-year, and 10-year periods ended 10/31/23, there were 520, 490, 464, and 339 funds, respectively, in this Lipper category.

Past performance does not indicate future results. At the end of the same time period, a $10,000 investment in the fund’s class B and C shares would have been valued at $10,177 and $10,178, respectively, and no contingent deferred sales charges would apply. A $10,000 investment in the fund’s class M shares ($9,675 after sales charge) would have been valued at $10,183. A $10,000 investment in the fund’s class R, R5, R6, and Y shares would have been valued at $10,531, $11,114, $11,205, and $11,080, respectively.
All Bloomberg indices are provided by Bloomberg Index Services Limited.
Fund price and distribution information For the 12-month period ended 10/31/23
| | | | | | | | | | |
| Distributions | Class A | Class B | Class C | Class M | Class R | Class R5 | Class R6 | Class Y |
| Number | 12 | 12 | 12 | 12 | 12 | 12 | 12 | 12 |
| Income | $0.483 | $0.439 | $0.442 | $0.471 | $0.471 | $0.497 | $0.506 | $0.495 |
| Capital gains | — | — | — | — | — | — | — | — |
| Total | $0.483 | $0.439 | $0.442 | $0.471 | $0.471 | $0.497 | $0.506 | $0.495 |
| | Before | After | Net | Net | Before | After | Net | Net | Net | Net |
| | sales | sales | asset | asset | sales | sales | asset | asset | asset | asset |
| Share value | charge | charge | value | value | charge | charge | value | value | value | value |
| 10/31/22 | $5.47 | $5.70 | $5.39 | $5.41 | $5.27 | $5.45 | $5.40 | $5.54 | $5.58 | $5.58 |
| 10/31/23 | 5.05 | 5.26 | 4.98 | 4.99 | 4.85 | 5.01 | 4.98 | 5.12 | 5.16 | 5.17 |
| Current rate | Before | After | Net | Net | Before | After | Net | Net | Net | Net |
| (end of | sales | sales | asset | asset | sales | sales | asset | asset | asset | asset |
| period) | charge | charge | value | value | charge | charge | value | value | value | value |
| Current | | | | | | | | | | |
| dividend rate1 | 4.99% | 4.79% | 4.34% | 4.33% | 4.95% | 4.79% | 4.82% | 5.16% | 5.35% | 5.11% |
| Current | | | | | | | | | | |
| 30-day | | | | | | | | | | |
| SEC yield | | | | | | | | | | |
| (with expense | | | | | | | | | | |
| limitation)2,3 | N/A | 5.61 | 5.09 | 5.09 | N/A | 5.42 | 5.60 | 6.15 | 6.22 | 6.10 |
| Current | | | | | | | | | | |
| 30-day | | | | | | | | | | |
| SEC yield | | | | | | | | | | |
| (without | | | | | | | | | | |
| expense | | | | | | | | | | |
| limitation)3 | N/A | 5.47 | 4.94 | 4.94 | N/A | 5.28 | 5.45 | 6.00 | 6.07 | 5.95 |
The classification of distributions, if any, is an estimate. Before-sales-charge share value and current dividend rate for class A and M shares, if applicable, do not take into account any sales charge levied at the time of purchase. After-sales-charge share value, current dividend rate, and current 30-day SEC yield, if applicable, are calculated assuming that the maximum sales charge (4.00% for class A shares and 3.25% for class M shares) was levied at the time of purchase. Final distribution information will appear on your year-end tax forms.
1 Most recent distribution, including any return of capital and excluding capital gains, annualized and divided by share price before or after sales charge at period-end.
2 For a portion of the period, the fund had expense limitations, without which yields would have been lower.
3 Based only on investment income and calculated using the maximum offering price for each share class, in accordance with SEC guidelines.
Annualized fund performance as of most recent calendar quarter
Total return for periods ended 9/30/23
| | | | | |
| | Life of fund | 10 years | 5 years | 3 years | 1 year |
| Class A (11/1/54) | | | | | |
| Before sales charge | 6.79% | 1.07% | –0.44% | –5.70% | 0.84% |
| After sales charge | 6.73 | 0.66 | –1.25 | –6.97 | –3.20 |
| Class B (3/1/93) | | | | | |
| Before CDSC | 6.66 | 0.47 | –1.14 | –6.35 | 0.23 |
| After CDSC | 6.66 | 0.47 | –1.46 | –7.16 | –4.39 |
| Class C (7/26/99) | | | | | |
| Before CDSC | 6.69 | 0.47 | –1.15 | –6.36 | 0.28 |
| After CDSC | 6.69 | 0.47 | –1.15 | –6.36 | –0.65 |
| Class M (12/14/94) | | | | | |
| Before sales charge | 6.38 | 0.83 | –0.66 | –5.87 | 0.65 |
| After sales charge | 6.33 | 0.50 | –1.31 | –6.90 | –2.62 |
| Class R (1/21/03) | | | | | |
| Net asset value | 6.53 | 0.83 | –0.66 | –5.90 | 0.64 |
| Class R5 (7/2/12) | | | | | |
| Net asset value | 6.91 | 1.37 | –0.12 | –5.39 | 1.28 |
| Class R6 (7/2/12) | | | | | |
| Net asset value | 6.92 | 1.45 | –0.07 | –5.33 | 1.25 |
| Class Y (6/16/94) | | | | | |
| Net asset value | 6.90 | 1.34 | –0.18 | –5.42 | 1.23 |
See the discussion following the fund performance table on page 8 for information about the calculation of fund performance.
Your fund’s expenses
As a mutual fund investor, you pay ongoing expenses, such as management fees, distribution fees (12b-1 fees), and other expenses. In the most recent six-month period, your fund’s expenses were limited; had expenses not been limited, they would have been higher. Using the following information, you can estimate how these expenses affect your investment and compare them with the expenses of other funds. You may also pay one-time transaction expenses, including sales charges (loads) and redemption fees, which are not shown in this section and would have resulted in higher total expenses. For more information, see your fund’s prospectus or talk to your financial representative.
Expense ratios
| | | | | | | | |
| | Class A | Class B | Class C | Class M | Class R | Class R5 | Class R6 | Class Y |
| Net expenses for the fiscal | | | | | | | | |
| year ended 10/31/22* | 0.75% | 1.50% | 1.50% | 1.00% | 1.00% | 0.45% | 0.38% | 0.50% |
| Total annual operating | | | | | | | | |
| expenses for the fiscal year | | | | | | | | |
| ended 10/31/22* | 0.85% | 1.60% | 1.60% | 1.10% | 1.10% | 0.55% | 0.48% | 0.60% |
| Annualized expense ratio | | | | | | | | |
| for the six-month period | | | | | | | | |
| ended 10/31/23† | 0.75% | 1.50% | 1.50% | 1.00% | 1.00% | 0.45% | 0.38% | 0.50% |
Fiscal year expense information in this table is taken from the most recent prospectus, is subject to change, and may differ from that shown for the annualized expense ratio and in the financial highlights of this report.
Expenses are shown as a percentage of average net assets.
* Restated to reflect current fees.
† Expense ratios for each class are for the fund’s most recent fiscal half year. As a result of this, ratios may differ from expense ratios based on one-year data in the financial highlights.
Expenses per $1,000
The following table shows the expenses you would have paid on a $1,000 investment in each class of the fund from 5/1/23 to 10/31/23. It also shows how much a $1,000 investment would be worth at the close of the period, assuming actual returns and expenses.
| | | | | | | | |
| | Class A | Class B | Class C | Class M | Class R | Class R5 | Class R6 | Class Y |
| Expenses paid per $1,000*† | $3.67 | $7.34 | $7.33 | $4.90 | $4.89 | $2.21 | $1.86 | $2.45 |
| Ending value (after expenses) | $943.80 | $941.10 | $939.60 | $942.40 | $942.00 | $945.60 | $945.30 | $944.40 |
* Expenses for each share class are calculated using the fund’s annualized expense ratio for each class, which represents the ongoing expenses as a percentage of average net assets for the six months ended 10/31/23. The expense ratio may differ for each share class.
† Expenses are calculated by multiplying the expense ratio by the average account value for the period; then multiplying the result by the number of days in the period (184); and then dividing that result by the number of days in the year (365).
Estimate the expenses you paid
To estimate the ongoing expenses you paid for the six months ended 10/31/23, use the following calculation method. To find the value of your investment on 5/1/23, call Putnam at 1-800-225-1581.

Compare expenses using the SEC’s method
The Securities and Exchange Commission (SEC) has established guidelines to help investors assess fund expenses. Per these guidelines, the following table shows your fund’s expenses based on a $1,000 investment, assuming a hypothetical 5% annualized return. You can use this information to compare the ongoing expenses (but not transaction expenses or total costs) of investing in the fund with those of other funds. All mutual fund shareholder reports will provide this information to help you make this comparison. Please note that you cannot use this information to estimate your actual ending account balance and expenses paid during the period.
| | | | | | | | |
| | Class A | Class B | Class C | Class M | Class R | Class R5 | Class R6 | Class Y |
| Expenses paid per $1,000*† | $3.82 | $7.63 | $7.63 | $5.09 | $5.09 | $2.29 | $1.94 | $2.55 |
| Ending value (after expenses) | $1,021.42 | $1,017.64 | $1,017.64 | $1,020.16 | $1,020.16 | $1,022.94 | $1,023.29 | $1,022.68 |
* Expenses for each share class are calculated using the fund’s annualized expense ratio for each class, which represents the ongoing expenses as a percentage of average net assets for the six months ended 10/31/23. The expense ratio may differ for each share class.
† Expenses are calculated by multiplying the expense ratio by the average account value for the six-month period; then multiplying the result by the number of days in the six-month period (184); and then dividing that result by the number of days in the year (365).
Comparative index definitions
Bloomberg U.S. Aggregate Bond Index is an unmanaged index of U.S. investment-grade fixed income securities.
ICE BofA (Intercontinental Exchange Bank of America) U.S. 3-Month Treasury Bill Index is an unmanaged index that seeks to measure the performance of U.S. Treasury bills available in the marketplace.
S&P 500® Index is an unmanaged index of common stock performance.
Indexes assume reinvestment of all distributions and do not account for fees. Securities and performance of a fund and an index will differ. You cannot invest directly in an index.
BLOOMBERG® is a trademark and service mark of Bloomberg Finance L.P. and its affiliates (collectively “Bloomberg”). Bloomberg or Bloomberg’s licensors own all proprietary rights in the Bloomberg Indices. Neither Bloomberg nor Bloomberg’s licensors approve or endorse this material, or guarantee the accuracy or completeness of any information herein, or make any warranty, express or implied, as to the results to be obtained therefrom, and to the maximum extent allowed by law, neither shall have any liability or responsibility for injury or damages arising in connection therewith.
ICE Data Indices, LLC (“ICE BofA”), used with permission. ICE BofA permits use of the ICE BofA indices and related data on an “as is” basis; makes no warranties regarding same; does not guarantee the suitability, quality, accuracy, timeliness, and/or completeness of the ICE BofA indices or any data included in, related to, or derived therefrom; assumes no liability in connection with the use of the foregoing; and does not sponsor, endorse, or recommend Putnam Investments, or any of its products or services.
Lipper, an LSEG company, is a third-party industry-ranking entity that ranks funds. Its rankings do not reflect sales charges. Lipper rankings are based on total return at net asset value relative to other funds that have similar current investment styles or objectives as determined by Lipper. Lipper may change a fund’s category assignment at its discretion. Lipper category medians reflect performance trends for funds within a category.
Other information for shareholders
Important notice regarding delivery of shareholder documents
In accordance with Securities and Exchange Commission (SEC) regulations, Putnam sends a single notice of internet availability, or a single printed copy, of annual and semiannual shareholder reports, prospectuses, and proxy statements to Putnam shareholders who share the same address, unless a shareholder requests otherwise. If you prefer to receive your own copy of these documents, please call Putnam at 1-800-225-1581 or, for exchange-traded funds only, 1-833-228-5577. We will begin sending individual copies within 30 days.
Proxy voting
Putnam is committed to managing our funds in the best interests of our shareholders. The Putnam funds’ proxy voting guidelines and procedures, as well as information regarding how your fund voted proxies relating to portfolio securities during the 12-month period ended June 30, 2023, are available in the Individual Investors section of putnam.com and on the SEC’s website, www.sec.gov. If you have questions about finding forms on the SEC’s website, you may call the SEC at 1-800-SEC-0330. You may also obtain the Putnam funds’ proxy voting guidelines and procedures at no charge by calling Putnam’s Shareholder Services at 1-800-225-1581 or, for exchange-traded funds only, 1-833-228-5577.
Fund portfolio holdings
The fund will file a complete schedule of its portfolio holdings with the SEC for the first and third quarters of each fiscal year on Form N-PORT within 60 days of the end of such fiscal quarter. Shareholders may obtain the fund’s Form N-PORT on the SEC’s website at www.sec.gov.
Trustee and employee fund ownership
Putnam employees and members of the Board of Trustees place their faith, confidence, and, most importantly, investment dollars in Putnam funds. As of October 31, 2023, Putnam employees had approximately $466,000,000 and the Trustees had approximately $64,000,000 invested in Putnam funds. These amounts include investments by the Trustees’ and employees’ immediate family members as well as investments through retirement and deferred compensation plans.
Liquidity risk management program
Putnam, as the administrator of the fund’s liquidity risk management program (appointed by the Board of Trustees), presented the most recent annual report on the program to the Trustees in May 2023. The report covered the structure of the program, including the program documents and related policies and procedures adopted to comply with Rule 22e-4 under the Investment Company Act of 1940, and reviewed the operation of the program from January 2022 through December 2022. The report included a description of the annual liquidity assessment of the fund that Putnam performed in November 2022. The report noted that there were no material compliance exceptions identified under Rule 22e-4 during the period. The report included a review of the governance of the program and the methodology for classification of the fund’s investments. Putnam concluded that the program has been operating effectively and adequately to ensure compliance with Rule 22e-4.
Important notice regarding Putnam’s privacy policy
In order to conduct business with our shareholders, we must obtain certain personal information such as account holders’ names, addresses, Social Security numbers, and dates of birth. Using this information, we are able to maintain accurate records of accounts and transactions.
It is our policy to protect the confidentiality of our shareholder information, whether or not a shareholder currently owns shares of our funds. In particular, it is our policy not to sell information about you or your accounts to outside marketing firms. We have safeguards in place designed to prevent unauthorized access to our computer systems and procedures to protect personal information from unauthorized use.
Under certain circumstances, we must share account information with outside vendors who provide services to us, such as mailings and proxy solicitations. In these cases, the service providers enter into confidentiality agreements with us, and we provide only the information necessary to process transactions and perform other services related to your account. Finally, it is our policy to share account information with your financial representative, if you’ve listed one on your Putnam account.
Trustee approval of management contracts
Consideration of your fund’s new and interim management and sub-management contracts
At their meeting on June 23, 2023, the Board of Trustees of your fund, including all of the Trustees who are not “interested persons” (as this term is defined in the Investment Company Act of 1940, as amended (the “1940 Act”)) of the Putnam mutual funds, closed-end funds and exchange-traded funds (collectively, the “funds”) (the “Independent Trustees”) approved, subject to approval by your fund’s shareholders, a new management contract with Putnam Investment Management (“Putnam Management”) and a new sub-management contract between Putnam Management and its affiliate, Putnam Investments Limited (“PIL”) (collectively, the “New Management Contracts”). The Trustees considered the proposed New Management Contracts in connection with the planned acquisition of Putnam U.S. Holdings I, LLC (“Putnam Holdings”) by a subsidiary of Franklin Resources, Inc. (“Franklin Templeton”). The Trustees considered that, on May 31, 2023, Franklin Templeton and Great-West Lifeco Inc., the parent company of Putnam Holdings, announced that they had entered into a definitive agreement for a subsidiary of Franklin Templeton to acquire Putnam Holdings in a stock and cash transaction (the “Transaction”). The Trustees noted that Putnam Holdings was the parent company of Putnam Management and PIL. The Trustees were advised that the Transaction would result in a “change of control” of Putnam Management and PIL and would cause your fund’s current Management Contract with Putnam Management and Sub-Management Contract with PIL (collectively, the “Current Management Contracts”) to terminate in accordance with the 1940 Act. The Trustees considered that the New Management Contracts would take effect upon the closing of the Transaction, which was expected to occur in the fourth quarter of 2023.
In addition to the New Management Contracts, the Trustees also approved interim management and sub-management contracts with Putnam Management and PIL, respectively (the “Interim Management Contracts”), which would take effect in the event that for any reason shareholder approval of a New Management Contract was not received by the time of the Transaction closing. The Trustees considered that each Interim Management Contract that became effective would remain in effect until shareholders approved the proposed New Management Contract, or until 150 days elapse after the closing of the Transaction, whichever occurred first. The considerations and conclusions discussed in connection with the Trustees’ consideration of the New Management Contracts and the continuance of your fund’s Current Management Contracts also apply to the Trustees’ consideration of the Interim Management Contracts, supplemented by consideration of the terms, nature and reason for any Interim Management Contract.
The Independent Trustees met with their independent legal counsel, as defined in Rule 0–1(a)(6) under the 1940 Act (their “independent legal counsel”), and representatives of Putnam Management and its parent company, Power Corporation of Canada, to discuss the potential Transaction, including the timing and structure of the Transaction and its implications for Putnam Management and the funds, during their regular meeting on November 18, 2022, and the full Board of Trustees further discussed these matters with representatives of Putnam Management at its regular meeting on December 15, 2022. At a special meeting on December 20, 2022, the full Board of Trustees met with representatives of Putnam Management, Power Corporation of Canada and Franklin Templeton to further discuss the potential Transaction, including Franklin Templeton’s strategic plans for Putnam Management’s asset management business and the funds, potential sources of synergy between Franklin Templeton and Putnam Management, potential areas of partnership between Power Corporation of Canada and Franklin Templeton, Franklin Templeton’s distribution capabilities, Franklin Templeton’s existing service provider relationships and Franklin Templeton’s recent acquisitions of other asset management firms.
In order to assist the Independent Trustees in their consideration of the New Management Contracts and other anticipated impacts of the Transaction on the funds and their shareholders, independent legal counsel for the Independent Trustees furnished an initial information request to Franklin Templeton (the “Initial Franklin Request”). At a special meeting of the full Board of Trustees held on January 25, 2023, representatives of Franklin Templeton addressed the firm’s responses to the Initial Franklin Request. At the meeting, representatives of Franklin Templeton
discussed, among other things, the business and financial condition of Franklin Templeton and its affiliates, Franklin Templeton’s U.S. registered fund operations, its recent acquisition history, Franklin Templeton’s intentions regarding the operation of Putnam Management and the funds following the completion of the potential Transaction and expected benefits to the funds and Putnam Management that might result from the Transaction.
The Board of Trustees actively monitored developments with respect to the potential Transaction throughout the period leading up to the public announcement of a final sale agreement on May 31, 2023. The Independent Trustees met to discuss these matters at their regular meetings on January 27, April 20 and May 19, 2023. The full Board of Trustees also discussed developments at their regular meeting on February 23, 2023. Following the public announcement of the Transaction on May 31, 2023, independent legal counsel for the Independent Trustees furnished a supplemental information request (the “Supplemental Franklin Request”) to Franklin Templeton. At the Board of Trustees’ regular in-person meeting held on June 22–23, 2023, representatives of Putnam Management and Power Corporation of Canada provided further information regarding, among other matters, the final terms of the Transaction and efforts undertaken to retain Putnam employees. The Contract Committee of the Board of Trustees also met on June 22, 2023 to discuss Franklin Templeton’s responses to the Supplemental Franklin Request. Mr. Reynolds, the only Trustee affiliated with Putnam Management, participated in portions of these meetings to provide the perspective of the Putnam organization, but did not otherwise participate in the deliberations of the Independent Trustees or the Contract Committee regarding the potential Transaction.
After the presentations and after reviewing the written materials provided, the Independent Trustees met at their in-person meeting on June 23, 2023 to consider the New Management Contracts for each fund, proposed to become effective upon the closing of the Transaction, and the filing of a preliminary proxy statement. At this meeting and throughout the process, the Independent Trustees also received advice from their independent legal counsel regarding their responsibilities in evaluating the potential Transaction and the New Management Contracts. The Independent Trustees reviewed the terms of the proposed New Management Contracts and the differences between the New Management Contracts and the Current Management Contracts. They noted that the terms of the proposed New Management Contracts were substantially identical to the Current Management Contracts, except for certain changes designed largely to address differences among various of the existing contracts, which had been developed and implemented at different times in the past.
In considering the approval of the proposed New Management Contracts, the Board of Trustees took into account a number of factors, including:1
(i) Franklin Templeton’s and Putnam Management’s belief that the Transaction would not adversely affect the funds or their shareholders and their belief that the Transaction was likely to result in certain benefits (described below) for the funds and their shareholders;
(ii) That Franklin Templeton did not intend to make any material change in Putnam Management’s senior investment professionals (other than certain changes related to reporting structure and organization of personnel discussed below), including the portfolio managers of the funds, or to the firm’s operating locations as a result of the Transaction;
(iii) That Franklin Templeton intended for Putnam Management’s equity investment professionals to continue to operate largely independently from Franklin Templeton, reporting to Franklin Templeton’s Head of Public Markets following the Transaction;
(iv) That, while Putnam Management’s organizational structure was not expected to change immediately following the Transaction, Franklin Templeton intended to revise Putnam Management’s reporting structure in order to include Putnam Management’s fixed income investment professionals in Franklin Templeton’s fixed income group and to include Putnam Management’s Global Asset Allocation (“GAA”) investment professionals in Franklin Templeton’s investment solutions group, with both Franklin Templeton

1All subsequent references to Putnam Management describing the Board of Trustees’ considerations should be deemed to include references to PIL as necessary or appropriate in the context.
groups reporting to Franklin Templeton’s Head of Public Markets;
(v) Franklin Templeton’s expectation that there would not be any changes in the investment objectives, strategies or portfolio holdings of the funds as a result of the Transaction;
(vi) That neither Franklin Templeton nor Putnam Management had any current plans to propose changes to the funds’ existing management fees or expense limitations, or current plans to make changes to the funds’ existing distribution arrangements;
(vii) Franklin Templeton’s and Putnam Management’s representations that, following the Transaction, there was not expected to be any diminution in the nature, quality and extent of services provided to the funds and their shareholders by Putnam Management and PIL, including compliance and other non-advisory services;
(viii) That Franklin Templeton did not currently plan to change the branding of the funds or to change the lineup of funds in connection with the Transaction but would continue to evaluate how best to position the funds in the market;
(ix) The possible benefits accruing to the funds and their shareholders as a result of the Transaction, including:
a. That the scale of Franklin Templeton’s investment operations platform would increase the investment and operational resources available to the funds;
b. That the Putnam open-end funds would benefit from Franklin Templeton’s large retail and institutional global distribution capabilities and significant network of intermediary relationships, which may provide additional opportunities for the funds to increase assets and reduce expenses by spreading expenses over a larger asset base; and
c. Potential benefits to shareholders of the Putnam open-end funds that could result from the alignment of certain fund features and shareholder benefits with those of other funds sponsored by Franklin Templeton and its affiliates and access to a broader array of investment opportunities;
(x) The financial strength, reputation, experience and resources of Franklin Templeton and its investment advisory subsidiaries;
(xi) Franklin Templeton’s expectation that the Transaction would not impact the capabilities or responsibilities of Putnam Management’s Investment Division (other than any impact related to reporting structure changes for Putnam Management’s equity, fixed income and GAA investment groups and to including Putnam Management’s fixed income and GAA investment professionals in existing Franklin Templeton investment groups, as discussed above) and that any changes to the Investment Division over the longer term would be made in order to achieve perceived operational efficiencies or improvements to the portfolio management process;
(xii) Franklin Templeton’s commitment to maintaining competitive compensation arrangements to allow Putnam Management to continue to attract and retain highly qualified personnel and Putnam Management’s and Franklin Templeton’s efforts to retain personnel, including efforts implemented since the Transaction was announced;
(xiii) That the current senior management teams at Putnam Management and Power Corporation of Canada had indicated their strong support of the Transaction and that Putnam Management had recommended that the Board of Trustees approve the New Management Contracts; and
(xiv) Putnam Management’s and Great-West Lifeco Inc.’s commitment to bear all expenses incurred by the funds in connection with the Transaction, including all costs associated with the proxy solicitation in connection with seeking shareholder approval of the New Management Contracts.
Finally, in considering the proposed New Management Contracts, the Board of Trustees also took into account their concurrent deliberations and conclusions, as described below, in connection with their annual review of the funds’ Current Management Contracts and the approval of their continuance, effective July 1, 2023, and the extensive materials that they had reviewed in connection with that review process.
Based upon the foregoing considerations, on June 23, 2023, the Board of Trustees, including all of the Independent Trustees, unanimously approved the proposed New Management Contracts and determined to recommend their approval to the shareholders of the funds.
General conclusions — Current Management Contracts
The Board of Trustees oversees the management of each fund and, as required by law, determines annually whether to approve the continuance of your fund’s management contract with Putnam Management and the sub-management contract with respect to your fund between Putnam Management and PIL. (Because PIL is an affiliate of Putnam Management and Putnam Management remains fully responsible for all services provided by PIL, the Trustees did not attempt to evaluate PIL as a separate entity.) The Board of Trustees, with the assistance of its Contract Committee, requests and evaluates all information it deems reasonably necessary under the circumstances in connection with its annual contract review. The Contract Committee consists solely of Independent Trustees.
At the outset of the review process, members of the Board of Trustees’ independent staff and independent legal counsel considered any possible changes to the annual contract review materials furnished to the Contract Committee during the course of the previous year’s review and, as applicable, identified those changes to Putnam Management. Following these discussions and in consultation with the Contract Committee, the Independent Trustees’ independent legal counsel requested that Putnam Management and its affiliates furnish specified information, together with any additional information that Putnam Management considered relevant, to the Contract Committee. Over the course of several months ending in June 2023, the Contract Committee met on a number of occasions with representatives of Putnam Management, and separately in executive session, to consider the information that Putnam Management provided. Throughout this process, the Contract Committee was assisted by the members of the Board of Trustees’ independent staff and by independent legal counsel for the funds and the Independent Trustees.
At the Board of Trustees’ June 2023 meeting, the Contract Committee met in executive session to discuss and consider its recommendations with respect to the continuance of the contracts. At that meeting, the Contract Committee also met in executive session with the other Independent Trustees to review a summary of the key financial, performance and other data that the Contract Committee considered in the course of its review. The Contract Committee recommended, and the Independent Trustees approved, the continuance of your fund’s Current Management Contracts, effective July 1, 2023, and the approval of your fund’s New Management Contracts and Interim Management Contracts, as discussed above.
The Independent Trustees’ approvals were based on the following conclusions:
• That the fee schedule in effect for your fund represented reasonable compensation in light of the nature and quality of the services being provided to the fund, the fees paid by competitive funds, the costs incurred by Putnam Management in providing services to the fund and the application of certain reductions and waivers noted below; and
• That the fee schedule in effect for your fund represented an appropriate sharing between fund shareholders and Putnam Management of any economies of scale as may exist in the management of the fund at current asset levels.
These conclusions were based on a comprehensive consideration of all information provided to the Trustees and were not the result of any single factor. Some of the factors that figured particularly in the Trustees’ deliberations and how the Trustees considered these factors are described below, although individual Trustees may have evaluated the information presented differently, giving different weights to various factors. It is also important to recognize that the management arrangements for your fund and the other Putnam mutual funds and closed-end funds are the result of many years of review and discussion between the Independent Trustees and Putnam Management, that some aspects of the arrangements may receive greater scrutiny in some years than others and that the Trustees’ conclusions may be based, in part, on their consideration of fee arrangements in previous years. For example, with certain exceptions primarily involving newer funds (including the exchange-traded funds) or repositioned funds, the current fee arrangements under the vast majority of the funds’ management contracts were first implemented at the beginning of 2010 following extensive review by the Contract Committee and discussions with representatives of Putnam Management, as well as approval by shareholders. The Trustees also took into account their concurrent deliberations and conclusions, and the materials that they had reviewed, in connection with their approval on June 23, 2023 of the Interim Management Contracts and the New Management Contracts, which had been proposed in light of the Transaction (which would
cause the fund’s Current Management Contracts to terminate in accordance with applicable law or the terms of each contract).
Management fee schedules and total expenses
The Trustees reviewed the management fee schedules in effect for all funds, including fee levels and any breakpoints. Under its management contract, your fund has the benefit of breakpoints in its management fee schedule that provide shareholders with reduced fee levels as assets under management in the Putnam family of funds increase. The Trustees also reviewed the total expenses of each Putnam fund, recognizing that in most cases management fees represented the major, but not the sole, determinant of total costs to fund shareholders. (Two mutual funds and each of the exchange-traded funds have implemented so-called “all-in” or unitary management fees covering substantially all routine fund operating costs.)
In reviewing fees and expenses, the Trustees generally focus their attention on material changes in circumstances — for example, changes in assets under management, changes in a fund’s investment strategy, changes in Putnam Management’s operating costs or profitability, or changes in competitive practices in the fund industry — that suggest that consideration of fee changes might be warranted. The Trustees concluded that the circumstances did not indicate that changes to the management fee schedule for your fund would be appropriate at this time.
As in the past, the Trustees also focused on the competitiveness of each fund’s total expense ratio. The Trustees, Putnam Management and the funds’ investor servicing agent, Putnam Investor Services, Inc. (“PSERV”), have implemented expense limitations that were in effect during your fund’s fiscal year ending in 2022. These expense limitations were: (i) a contractual expense limitation applicable to specified mutual funds, including your fund, of 25 basis points on investor servicing fees and expenses and (ii) a contractual expense limitation applicable to specified mutual funds, including your fund, of 20 basis points on so-called “other expenses” (i.e., all expenses exclusive of management fees, distribution fees, investor servicing fees, investment-related expenses, interest, taxes, brokerage commissions, acquired fund fees and expenses and extraordinary expenses). These expense limitations attempt to maintain competitive expense levels for the funds. Most funds, including your fund, had sufficiently low expenses that these expense limitations were not operative during their fiscal years ending in 2022. Putnam Management and PSERV have agreed to maintain these expense limitations until at least February 28, 2025. In addition, Putnam Management contractually agreed to waive fees and/or reimburse expenses of your fund to the extent that expenses of the fund (excluding payments under the fund’s distribution plans, investor servicing fees, brokerage, interest, taxes, investment-related expenses, extraordinary expenses and acquired fund fees and expenses) would exceed an annual rate of 0.33% of its average net assets through at least February 28, 2025. Putnam Management and PSERV’s commitment to these expense limitation arrangements, which were intended to support an effort to have the mutual fund expenses meet competitive standards, was an important factor in the Trustees’ decision to approve your fund’s New Management Contracts and Interim Management Contracts and the continuance of your fund’s Current Management Contracts.
The Trustees reviewed comparative fee and expense information for a custom group of competitive funds selected by Broadridge Financial Solutions, Inc. (“Broadridge”). This comparative information included your fund’s percentile ranking for effective management fees and total expenses (excluding any applicable 12b-1 fees), which provides a general indication of your fund’s relative standing. In the custom peer group, your fund ranked in the third quintile in effective management fees (determined for your fund and the other funds in the custom peer group based on fund asset size and the applicable contractual management fee schedule) and in the fourth quintile in total expenses (excluding any applicable 12b-1 fees) as of December 31, 2022. The first quintile represents the least expensive funds and the fifth quintile the most expensive funds. The fee and expense data reported by Broadridge as of December 31, 2022 reflected the most recent fiscal year-end data available in Broadridge’s database at that time.
In connection with their review of fund management fees and total expenses, the Trustees also reviewed the costs of the services provided and the profits realized by Putnam Management and its affiliates from their contractual relationships with the funds. This information included trends in revenues, expenses and profitability of Putnam Management and its affiliates relating to
the investment management, investor servicing and distribution services provided to the funds, as applicable. In this regard, the Trustees also reviewed an analysis of the revenues, expenses and profitability of Putnam Management and its affiliates, allocated on a fund-by-fund basis, with respect to (as applicable) the funds’ management, distribution and investor servicing contracts. For each fund, the analysis presented information about revenues, expenses and profitability in 2022 for each of the applicable agreements separately and for the agreements taken together on a combined basis. The Trustees concluded that, at current asset levels, the fee schedules in place for each of the funds, including the fee schedule for your fund, represented reasonable compensation for the services being provided and represented an appropriate sharing between fund shareholders and Putnam Management of any economies of scale as may exist in the management of the funds at that time.
The information examined by the Trustees in connection with their annual contract review for the funds included information regarding services provided and fees charged by Putnam Management and its affiliates to other clients, including collective investment trusts offered in the defined contribution and defined benefit retirement plan markets, sub-advised mutual funds, private funds sponsored by affiliates of Putnam Management, model-only separately managed accounts and Putnam Management’s manager-traded separately managed account programs. This information included, in cases where a product’s investment strategy corresponds with a fund’s strategy, comparisons of those fees with fees charged to the funds, as well as an assessment of the differences in the services provided to these clients as compared to the services provided to the funds. The Trustees observed that the differences in fee rates between these clients and the funds are by no means uniform when examined by individual asset sectors, suggesting that differences in the pricing of investment management services to these types of clients may reflect, among other things, historical competitive forces operating in separate marketplaces. The Trustees considered the fact that in many cases fee rates across different asset classes are higher on average for 1940 Act-registered funds than for other clients, and the Trustees also considered the differences between the services that Putnam Management provides to the funds and those that it provides to its other clients. The Trustees did not rely on these comparisons to any significant extent in concluding that the management fees paid by your fund are reasonable.
Investment performance
The quality of the investment process provided by Putnam Management represented a major factor in the Trustees’ evaluation of the quality of services provided by Putnam Management under your fund’s management contract. The Trustees were assisted in their review of Putnam Management’s investment process and performance by the work of the investment oversight committees of the Trustees and the full Board of Trustees, which meet on a regular basis with individual portfolio managers and with senior management of Putnam Management’s Investment Division throughout the year. The Trustees concluded that Putnam Management generally provides a high-quality investment process — based on the experience and skills of the individuals assigned to the management of fund portfolios, the resources made available to them and in general Putnam Management’s ability to attract and retain high-quality personnel — but also recognized that this does not guarantee favorable investment results for every fund in every time period.
The Trustees considered that, in the aggregate, peer-relative and benchmark-relative Putnam fund performance was generally encouraging in 2022 against a backdrop of volatile equity and fixed income markets, driven by factors such as Russia’s invasion of Ukraine, increased tensions with China, disruptions in energy markets and broader supply chains, rising inflation and the significant tightening of monetary policy by the Board of Governors of the Federal Reserve in an effort to combat inflation. The Trustees further noted that, in the face of these numerous economic headwinds, corporate earnings and employment data had been generally robust throughout 2022. For the one-year period ended December 31, 2022, the Trustees noted that the Putnam funds, on an asset-weighted basis, ranked in the 41st percentile of their peers as determined by Lipper Inc. (“Lipper”) and, on an asset-weighted-basis, outperformed their benchmarks by 1.3% gross of fees over the one-year period. The Committee also noted that the funds’ aggregate performance over longer-term periods continued to be strong, with the funds, on an asset-weighted basis, ranking in the 34th, 27th and 22nd percentiles of their Lipper peers over the three-year, five-year and ten-year periods ended
December 31, 2022, respectively. The Trustees further noted that the funds, in the aggregate, outperformed their benchmarks on a gross basis for each of the three-year, five-year and ten-year periods. The Trustees also considered the Morningstar Inc. ratings assigned to the funds and that 40 funds were rated four or five stars at the end of 2022, which represented an increase of 15 funds year-over-year. The Trustees also considered that seven funds were five-star rated at the end of 2022, which was a year-over-year decrease of two funds, and that 83% of the funds’ aggregate assets were in four- or five-star rated funds at year end.
In addition to the performance of the individual Putnam funds, the Trustees considered, as they had in prior years, the performance of The Putnam Fund complex versus competitor fund complexes, as reported in the Barron’s/Lipper Fund Families survey (the “Survey”). The Trustees noted that the Survey ranks mutual fund companies based on their performance across a variety of asset types, and that The Putnam Fund complex had performed exceptionally well in 2022. In this regard, the Trustees considered that the funds had ranked 9th out of 49 fund companies, 3rd out of 49 fund companies and 2nd out of 47 fund companies for the one-year, five-year and ten-year periods, respectively. The Trustees also noted that The Putnam Fund complex had been the only fund family to rank in the top ten in all three time periods. They also noted, however, the disappointing investment performance of some Putnam funds for periods ended December 31, 2022 and considered information provided by Putnam Management regarding the factors contributing to the underperformance and, where relevant, actions being taken to improve the performance of these particular funds. The Trustees indicated their intention to continue to monitor the performance of those funds.
For purposes of the Trustees’ evaluation of the Putnam funds’ investment performance, the Trustees generally focus on a competitive industry ranking of each fund’s total net return over a one-year, three-year and five-year period. For a number of Putnam funds with relatively unique investment mandates for which Putnam Management informed the Trustees that meaningful competitive performance rankings are not considered to be available, the Trustees evaluated performance based on their total gross and net returns and comparisons of those returns to the returns of selected investment benchmarks. In the case of your fund, the Trustees considered that its class A share cumulative total return performance at net asset value was in the following quartiles of its Lipper peer group (Lipper Core Bond Funds) for the one-year, three-year and five-year periods ended December 31, 2022 (the first quartile representing the best-performing funds and the fourth quartile the worst-performing funds):
| |
| One-year period | 1st |
| Three-year period | 4th |
| Five-year period | 2nd |
Over the one-year, three-year and five-year periods ended December 31, 2022, there were 509, 476 and 445 funds, respectively, in your fund’s Lipper peer group. (When considering performance information, shareholders should be mindful that past performance is not a guarantee of future results.)
The Trustees expressed concern about your fund’s fourth quartile performance over the three-year period ended December 31, 2022 and considered the circumstances that may have contributed to this disappointing performance. The Trustees considered Putnam Management’s observation that the fund’s underperformance over those periods was driven by disappointing performance in 2020 and 2021. The Trustees observed that significant underperformance in the securitized products sector in 2021 had contributed to the fund’s disappointing results, noting that prepayment strategies had suffered as a result of significantly elevated refinancing (given strong home price appreciation and low interest rates) relative to expectations. The Trustees considered that the fund’s underperformance was also driven by significant underperformance in the securitized products sector in 2020, which resulted from the outsized impact of the COVID-19 pandemic on the commercial mortgage sector. In addition, the Trustees considered the negative impact that the fund’s term structure strategies had on performance in 2021.
The Trustees noted Putnam Management’s observation that term structure strategies positively contributed to the fund’s performance over the three-year period ended December 31, 2022. The Trustees considered Putnam Management’s discussion regarding the ways in which the fund’s investment approach was evolving. The Trustees also considered that the fund had top quintile performance relative to its peers in 2022, partly due to the solid performance of the commercial mortgage sector. The Trustees noted that Putnam
Management remained confident in the fund’s portfolio managers. The Trustees also considered Putnam Management’s continued efforts to support fund performance through certain initiatives, including structuring compensation for portfolio managers to enhance accountability for fund performance, emphasizing accountability in the portfolio management process and affirming its commitment to a fundamental-driven approach to investing.
As a general matter, the Trustees believe that cooperative efforts between the Trustees and Putnam Management represent the most effective way to address investment performance concerns that may arise from time to time. The Trustees noted that investors in the Putnam funds have, in effect, placed their trust in the Putnam organization, under the oversight of the funds’ Trustees, to make appropriate decisions regarding the management of the funds. The Trustees also considered that Putnam Management has made changes in light of subpar investment performance when warranted. Based on Putnam Management’s willingness to take appropriate measures to address fund performance issues, the Trustees concluded that it continued to be advisable to seek change within Putnam Management to address performance shortcomings. In the Trustees’ view, the alternative of engaging a new investment adviser for an underperforming fund, with all the attendant risks and disruptions, would not likely provide any greater assurance of improved investment performance.
Brokerage and soft-dollar allocations; distribution and investor servicing
The Trustees considered various potential benefits that Putnam Management may receive in connection with the services it provides under the management contract with your fund. These include benefits related to brokerage allocation and the use of soft dollars, whereby a portion of the commissions paid by a fund for brokerage may be used to acquire research services that are expected to be useful to Putnam Management in managing the assets of the fund and of other clients. Subject to policies established by the Trustees, soft dollars generated by these means are used predominantly to acquire brokerage and research services (including third-party research and market data) that enhance Putnam Management’s investment capabilities and supplement Putnam Management’s internal research efforts. The Trustees indicated their continued intent to monitor regulatory and industry developments in this area with the assistance of their Brokerage Committee. In addition, with the assistance of their Brokerage Committee, the Trustees indicated their continued intent to monitor the allocation of the funds’ brokerage in order to ensure that the principle of seeking best price and execution remains paramount in the portfolio trading process.
Putnam Management may also receive benefits from payments made to Putnam Management’s affiliates by the mutual funds for distribution services and investor services. In conjunction with the review of your fund’s management and sub-management contracts, the Trustees reviewed your fund’s investor servicing agreement with PSERV and its distributor’s contract and distribution plans with Putnam Retail Management Limited Partnership (“PRM”), both of which are affiliates of Putnam Management. The Trustees concluded that the fees payable by the mutual funds to PSERV and PRM for such services were fair and reasonable in relation to the nature and quality of such services, the fees paid by competitive funds and the costs incurred by PSERV and PRM in providing such services. Furthermore, the Trustees were of the view that the investor services provided by PSERV were required for the operation of the mutual funds, and that they were of a quality at least equal to those provided by other providers.
Audited financial statements
These sections of the report, as well as the accompanying Notes, preceded by the Report of Independent Registered Public Accounting Firm, constitute the fund’s audited financial statements.
The fund’s portfolio lists all the fund’s investments and their values as of the last day of the reporting period. Holdings are organized by asset type and industry sector, country, or state to show areas of concentration and diversification.
Statement of assets and liabilities shows how the fund’s net assets and share price are determined. All investment and non-investment assets are added together. Any unpaid expenses and other liabilities are subtracted from this total. The result is divided by the number of shares to determine the net asset value per share, which is calculated separately for each class of shares. (For funds with preferred shares, the amount subtracted from total assets includes the liquidation preference of preferred shares.)
Statement of operations shows the fund’s net investment gain or loss. This is done by first adding up all the fund’s earnings — from dividends and interest income — and subtracting its operating expenses to determine net investment income (or loss). Then, any net gain or loss the fund realized on the sales of its holdings — as well as any unrealized gains or losses over the period — is added to or subtracted from the net investment result to determine the fund’s net gain or loss for the fiscal period.
Statement of changes in net assets shows how the fund’s net assets were affected by the fund’s net investment gain or loss, by distributions to shareholders, and by changes in the number of the fund’s shares. It lists distributions and their sources (net investment income or realized capital gains) over the current reporting period and the most recent fiscal year-end. The distributions listed here may not match the sources listed in the Statement of operations because the distributions are determined on a tax basis and may be paid in a different period from the one in which they were earned.
Financial highlights provide an overview of the fund’s investment results, per-share distributions, expense ratios, net investment income ratios, and portfolio turnover (not required for money market funds) in one summary table, reflecting the five most recent reporting periods. In a semiannual report, the highlights table also includes the current reporting period.
Report of Independent Registered Public Accounting Firm
To the Board of Trustees and Shareholders of
Putnam Income Fund:
Opinion on the Financial Statements
We have audited the accompanying statement of assets and liabilities, including the fund’s portfolio, of Putnam Income Fund (the “Fund”) as of October 31, 2023, the related statement of operations for the year ended October 31, 2023, the statement of changes in net assets for each of the two years in the period ended October 31, 2023, including the related notes, and the financial highlights for each of the four years in the period ended October 31, 2023 (collectively referred to as the “financial statements”). In our opinion, the financial statements present fairly, in all material respects, the financial position of the Fund as of October 31, 2023, the results of its operations for the year then ended, the changes in its net assets for each of the two years in the period ended October 31, 2023 and the financial highlights for each of the four years in the period ended October 31, 2023 in conformity with accounting principles generally accepted in the United States of America.
The financial statements of the Fund as of and for the year ended October 31, 2019 and the financial highlights for the period ended on October 31, 2019 (not presented herein, other than the financial highlights) were audited by other auditors whose report dated December 11, 2019 expressed an unqualified opinion on those financial statements and financial highlights.
Basis for Opinion
These financial statements are the responsibility of the Fund’s management. Our responsibility is to express an opinion on the Fund’s financial statements based on our audits. We are a public accounting firm registered with the Public Company Accounting Oversight Board (United States) (“PCAOB”) and are required to be independent with respect to the Fund in accordance with the U.S. federal securities laws and the applicable rules and regulations of the Securities and Exchange Commission and the PCAOB.
We conducted our audits of these financial statements in accordance with the standards of the PCAOB. Those standards require that we plan and perform the audit to obtain reasonable assurance about whether the financial statements are free of material misstatement, whether due to error or fraud.
Our audits included performing procedures to assess the risks of material misstatement of the financial statements, whether due to error or fraud, and performing procedures that respond to those risks. Such procedures included examining, on a test basis, evidence regarding the amounts and disclosures in the financial statements. Our audits also included evaluating the accounting principles used and significant estimates made by management, as well as evaluating the overall presentation of the financial statements. Our procedures included confirmation of securities owned as of October 31, 2023 by correspondence with the custodian, transfer agent, agent banks and brokers; when replies were not received from brokers, we performed other auditing procedures. We believe that our audits provide a reasonable basis for our opinion.
PricewaterhouseCoopers LLP
Boston, Massachusetts
December 7, 2023
We have served as the auditor of one or more investment companies in the Putnam Investments family of funds since at least 1957. We have not been able to determine the specific year we began serving as auditor.
| | |
| The fund’s portfolio 10/31/23 | | |
|
| | |
U.S. GOVERNMENT AND AGENCY
MORTGAGE OBLIGATIONS (59.0%)* | Principal
amount | Value |
| U.S. Government Guaranteed Mortgage Obligations (15.5%) | | |
| Government National Mortgage Association (ICE LIBOR USD 12 Month + 1.41%), 3.469%, 12/20/68 | $1,020,503 | $1,026,456 |
| Government National Mortgage Association Pass-Through Certificates | | |
| 6.50%, with due dates from 3/15/31 to 9/20/53 | 12,423,966 | 12,473,166 |
| 6.00%, TBA, 11/1/53 | 2,000,000 | 1,959,276 |
| 6.00%, with due dates from 12/20/48 to 9/20/53 | 12,525,666 | 12,317,861 |
| 5.50%, with due dates from 1/20/49 to 8/20/53 | 7,409,510 | 7,133,843 |
| 5.00%, with due dates from 6/15/40 to 10/20/49 | 4,986,776 | 4,732,716 |
| 4.70%, with due dates from 6/20/65 to 6/20/65 | 73,982 | 72,454 |
| 4.646%, 5/20/65 | 133,738 | 131,298 |
| 4.63%, 5/20/65 | 21,748 | 21,276 |
| 4.596%, 6/20/65 | 4,719 | 4,608 |
| 4.50%, TBA, 11/1/53 | 71,000,000 | 64,081,015 |
| 4.50%, with due dates from 5/20/44 to 7/20/52 | 3,832,293 | 3,506,606 |
| 4.438%, 5/20/65 | 490,115 | 477,306 |
| 4.421%, 8/20/65 | 26,311 | 25,534 |
| 4.405%, 6/20/65 | 22,087 | 21,434 |
| 4.356%, 5/20/65 | 24,277 | 23,742 |
| 4.28%, 6/20/65 | 17,038 | 16,532 |
| 4.00%, TBA, 11/1/53 | 50,000,000 | 43,925,636 |
| 4.00%, with due dates from 2/20/48 to 3/20/50 | 3,509,839 | 3,100,131 |
| 4.00%, 2/20/48 ## | 1,999,973 | 1,785,856 |
| 3.50%, TBA, 11/1/53 | 6,000,000 | 5,112,829 |
| 3.50%, with due dates from 11/15/42 to 3/20/50 | 18,317,527 | 15,711,181 |
| 3.50%, 9/20/48 ## | 1,035,315 | 894,614 |
| 3.50%, 8/20/48 ## | 1,309,219 | 1,130,477 |
| 3.00%, TBA, 11/1/52 | 15,000,000 | 12,351,000 |
| 3.00%, with due dates from 3/20/43 to 2/20/50 | 2,593,155 | 2,139,481 |
| | 194,176,328 |
| U.S. Government Agency Mortgage Obligations (43.5%) | | |
| 3.50%, TBA, 11/1/31 | 1,000,000 | 912,969 |
| Federal Home Loan Mortgage Corporation Pass-Through Certificates | | |
| 5.50%, 9/1/53 | 5,074,478 | 4,835,765 |
| 5.00%, with due dates from 3/1/41 to 7/1/52 | 1,107,223 | 1,028,473 |
| 4.50%, with due dates from 7/1/44 to 11/1/49 | 504,541 | 464,054 |
| 4.00%, with due dates from 12/1/44 to 7/1/49 | 2,709,014 | 2,409,798 |
| 3.50%, with due dates from 4/1/42 to 11/1/47 | 2,925,313 | 2,495,697 |
| 3.00%, 10/1/46 | 1,236,077 | 1,016,698 |
| 3.00%, 5/1/38 | 4,141,040 | 3,619,609 |
| 3.00%, with due dates from 7/1/34 to 5/1/35 | 1,905,842 | 1,722,013 |
| 2.50%, with due dates from 4/1/43 to 1/1/52 | 9,653,515 | 7,527,781 |
| 2.00%, with due dates from 2/1/51 to 5/1/51 | 1,733,628 | 1,283,669 |
| Federal National Mortgage Association Pass-Through Certificates | | |
| 6.00%, with due dates from 2/1/36 to 4/1/53 | 2,038,522 | 2,028,334 |
| 5.50%, with due dates from 1/1/33 to 8/1/53 | 7,121,956 | 6,772,833 |
| 5.00%, with due dates from 3/1/40 to 9/1/52 | 8,800,717 | 8,166,864 |
| 4.50%, with due dates from 7/1/44 to 11/1/49 | 2,482,989 | 2,274,037 |
| | |
U.S. GOVERNMENT AND AGENCY
MORTGAGE OBLIGATIONS (59.0%)* cont. | Principal
amount | Value |
| U.S. Government Agency Mortgage Obligations cont. | | |
| Federal National Mortgage Association Pass-Through Certificates | | |
| 4.00%, 1/1/57 | $3,371,951 | $2,896,037 |
| 4.00%, with due dates from 8/1/44 to 11/1/49 | 3,266,701 | 2,902,248 |
| 3.50%, with due dates from 5/1/56 to 9/1/57 | 8,454,271 | 6,994,690 |
| 3.50%, with due dates from 5/1/42 to 5/1/52 | 9,657,709 | 8,221,451 |
| 3.50%, 6/1/31 | 200,246 | 190,832 |
| 3.00%, with due dates from 9/1/42 to 3/1/47 | 8,886,475 | 7,319,611 |
| 3.00%, 5/1/37 | 2,007,610 | 1,794,449 |
| 2.50%, with due dates from 12/1/47 to 2/1/52 | 13,008,871 | 10,190,570 |
| 2.50%, 5/1/51 ## | 2,916,550 | 2,260,277 |
| 2.50%, 9/1/36 | 4,946,191 | 4,340,929 |
| 2.00%, with due dates from 2/1/51 to 3/1/52 | 6,123,866 | 4,544,650 |
| 2.00%, with due dates from 2/1/37 to 3/1/37 | 7,142,171 | 6,083,220 |
| 2.00%, 3/1/37 ## | 2,000,000 | 1,701,860 |
| Uniform Mortgage-Backed Securities | | |
| 6.50%, TBA, 11/1/53 | 28,000,000 | 27,822,813 |
| 6.00%, TBA, 11/1/53 | 152,000,000 | 147,891,258 |
| 4.00%, TBA, 11/1/53 | 4,000,000 | 3,455,937 |
| 3.50%, TBA, 11/1/53 | 33,000,000 | 27,466,055 |
| 3.00%, TBA, 11/1/53 | 43,000,000 | 34,361,369 |
| 3.00%, TBA, 11/1/37 | 1,000,000 | 893,047 |
| 2.50%, TBA, 11/1/53 | 126,000,000 | 96,552,427 |
| 2.50%, TBA, 11/1/38 | 3,000,000 | 2,612,930 |
| 2.00%, TBA, 11/1/53 | 117,000,000 | 85,879,369 |
| 2.00%, TBA, 11/1/38 | 9,000,000 | 7,619,098 |
| 1.50%, TBA, 11/1/38 | 8,000,000 | 6,571,001 |
| | 547,124,722 |
| Total U.S. government and agency mortgage obligations (cost $767,772,123) | $741,301,050 |
|
| | |
| U.S. TREASURY OBLIGATIONS (—%)* | Principal
amount | Value |
| U.S. Treasury Notes 1.625%, 5/15/31 i | $556,000 | $446,863 |
| Total U.S. treasury obligations (cost $446,863) | $446,863 |
|
| | | |
| MORTGAGE-BACKED SECURITIES (30.8%)* | Principal
amount | Value |
| Agency collateralized mortgage obligations (9.0%) |
| Federal Home Loan Mortgage Corporation | | | |
| Strips FRB Ser. 406, Class F30, (US 30 Day Average SOFR + 1.15%), 6.471%, 10/25/53 | | $2,628,988 | $2,628,505 |
| REMICs Ser. 4132, Class IP, IO, 4.50%, 11/15/42 | | 770,564 | 79,775 |
| REMICs Ser. 4018, Class DI, IO, 4.50%, 7/15/41 | | 252,568 | 14,384 |
| REMICs Ser. 23-5349, Class IB, IO, 4.00%, 12/15/46 | | 3,870,207 | 800,219 |
| REMICs IFB Ser. 3408, Class EK, ((-4.024 x US 30 Day Average SOFR) + 25.33%), 3.924%, 4/15/37 | | 239,962 | 248,924 |
| REMICs IFB Ser. 3065, Class DC, ((-3 x US 30 Day Average SOFR) + 19.52%), 3.556%, 3/15/35 | | 174,995 | 169,033 |
| REMICs Ser. 5050, Class IM, IO, 3.50%, 10/25/50 | | 2,756,199 | 504,746 |
| REMICs Ser. 23-5349, Class IA, IO, 3.00%, 12/15/42 | | 8,479,968 | 785,339 |
| | | |
| MORTGAGE-BACKED SECURITIES (30.8%)* cont. | Principal
amount | Value |
| Agency collateralized mortgage obligations cont. |
| Federal Home Loan Mortgage Corporation | | | |
| REMICs IFB Ser. 4738, Class QS, IO, ((-1 x US 30 Day Average SOFR) + 6.09%), 0.765%, 12/15/47 | | $10,646,869 | $957,310 |
| REMICs IFB Ser. 4461, Class SB, IO, ((-1 x US 30 Day Average SOFR) + 6.09%), 0.765%, 4/15/45 | | 9,342,439 | 761,057 |
| REMICs IFB Ser. 4839, Class WS, IO, ((-1 x US 30 Day Average SOFR) + 5.99%), 0.665%, 8/15/56 | | 14,419,708 | 1,266,195 |
| REMICs IFB Ser. 4077, Class HS, IO, ((-1 x US 30 Day Average SOFR) + 5.99%), 0.665%, 7/15/42 | | 5,478,927 | 395,717 |
| REMICs IFB Ser. 4839, Class AS, IO, ((-1 x US 30 Day Average SOFR) + 5.94%), 0.615%, 6/15/42 | | 6,557,554 | 237,299 |
| REMICs IFB Ser. 4994, Class SD, IO, ((-1 x US 30 Day Average SOFR) + 5.49%), 0.165%, 2/25/49 | | 27,821,136 | 1,282,276 |
| REMICs Ser. 3369, Class BO, PO, zero %, 9/15/37 | | 3,818 | 2,909 |
| REMICs Ser. 3391, PO, zero %, 4/15/37 | | 37,424 | 30,047 |
| REMICs Ser. 3210, PO, zero %, 5/15/36 | | 784 | 772 |
| REMICs FRB Ser. 3117, Class AF, zero %, 2/15/36 | | 8,321 | 6,756 |
| Federal National Mortgage Association | | | |
| REMICs Ser. 15-33, Class AI, IO, 5.00%, 6/25/45 | | 9,269,109 | 1,417,290 |
| Interest Strip Ser. 409, Class C24, IO, 4.50%, 4/25/42 | | 3,792,007 | 728,394 |
| REMICs Ser. 18-3, Class AI, IO, 4.50%, 12/25/47 | | 8,022,132 | 1,423,928 |
| REMICs Ser. 17-72, Class ID, IO, 4.50%, 9/25/47 | | 13,371,862 | 2,474,330 |
| REMICs Ser. 23-49, Class IB, IO, 3.50%, 3/25/47 | | 3,835,306 | 622,835 |
| REMICs Ser. 12-128, Class QI, IO, 3.50%, 6/25/42 | | 2,054,459 | 112,930 |
| REMICs Ser. 23-49, Class IA, IO, 3.00%, 8/25/46 | | 5,217,654 | 626,792 |
| REMICs Ser. 21-12, Class NI, IO, 2.50%, 3/25/51 | | 26,337,785 | 4,263,561 |
| REMICs IFB Ser. 18-44, Class SA, IO, ((-1 x US 30 Day Average SOFR) + 6.09%), 0.765%, 6/25/48 | | 16,737,085 | 1,469,684 |
| REMICs IFB Ser. 18-29, Class S, IO, ((-1 x US 30 Day Average SOFR) + 6.09%), 0.765%, 5/25/48 | | 8,367,562 | 734,755 |
| REMICs IFB Ser. 18-1, Class MS, IO, ((-1 x US 30 Day Average SOFR) + 6.04%), 0.715%, 2/25/48 | | 5,138,911 | 451,247 |
| REMICs IFB Ser. 19-3, Class SA, IO, ((-1 x US 30 Day Average SOFR) + 5.99%), 0.665%, 2/25/49 | | 14,499,060 | 801,943 |
| REMICs IFB Ser. 18-94, Class SA, IO, ((-1 x US 30 Day Average SOFR) + 5.99%), 0.665%, 1/25/49 | | 3,049,412 | 179,863 |
| REMICs IFB Ser. 20-12, Class SK, IO, ((-1 x US 30 Day Average SOFR) + 5.94%), 0.615%, 3/25/50 | | 28,003,720 | 2,246,739 |
| REMICs IFB Ser. 19-59, Class SD, IO, ((-1 x US 30 Day Average SOFR) + 5.94%), 0.615%, 10/25/49 | | 9,912,197 | 757,553 |
| REMICs IFB Ser. 16-8, Class SA, IO, ((-1 x US 30 Day Average SOFR) + 5.94%), 0.615%, 3/25/46 | | 25,140,389 | 1,986,787 |
| REMICs FRB Ser. 19-74, Class S, IO, ((-1 x US 30 Day Average SOFR) + 5.89%), 0.565%, 12/25/49 | | 22,613,923 | 1,825,174 |
| REMICs IFB Ser. 19-71, Class CS, IO, ((-1 x US 30 Day Average SOFR) + 5.89%), 0.565%, 11/25/49 | | 7,202,347 | 771,018 |
| REMICs IFB Ser. 19-57, Class LS, IO, ((-1 x US 30 Day Average SOFR) + 5.89%), 0.565%, 10/25/49 | | 18,988,738 | 1,635,198 |
| REMICs Ser. 03-34, PO, zero %, 4/25/43 | | 61,869 | 51,192 |
| REMICs Ser. 07-14, Class KO, PO, zero %, 3/25/37 | | 38,055 | 29,344 |
| REMICs Ser. 06-84, Class OT, PO, zero %, 9/25/36 | | 3,855 | 2,933 |
| | | |
| MORTGAGE-BACKED SECURITIES (30.8%)* cont. | Principal
amount | Value |
| Agency collateralized mortgage obligations cont. |
| Government National Mortgage Association | | | |
| FRB Ser. 23-152, Class FB, IO, 6.462%, 4/20/51 W | | $3,221,000 | $3,218,648 |
| Ser. 09-79, Class IC, IO, 6.00%, 8/20/39 | | 3,171,573 | 432,634 |
| Ser. 14-180, IO, 5.00%, 12/20/44 | | 6,846,156 | 1,350,267 |
| Ser. 14-76, IO, 5.00%, 5/20/44 | | 1,803,172 | 357,564 |
| Ser. 10-35, Class UI, IO, 5.00%, 3/20/40 | | 556,889 | 113,989 |
| Ser. 10-9, Class UI, IO, 5.00%, 1/20/40 | | 5,011,109 | 1,046,069 |
| Ser. 09-121, Class UI, IO, 5.00%, 12/20/39 | | 2,350,398 | 475,226 |
| Ser. 19-83, IO, 4.50%, 6/20/49 | | 8,924,723 | 1,806,900 |
| Ser. 15-13, Class BI, IO, 4.50%, 1/20/45 | | 9,991,994 | 1,933,023 |
| Ser. 10-35, Class QI, IO, 4.50%, 3/20/40 | | 791,656 | 137,264 |
| Ser. 14-71, Class BI, IO, 4.50%, 5/20/29 | | 622,791 | 13,602 |
| Ser. 20-46, Class MI, IO, 4.00%, 4/20/50 | | 16,818,593 | 3,161,970 |
| Ser. 15-149, Class KI, IO, 4.00%, 10/20/45 | | 4,853,091 | 822,744 |
| Ser. 15-53, Class MI, IO, 4.00%, 4/16/45 | | 6,511,942 | 1,190,134 |
| Ser. 14-2, Class IL, IO, 4.00%, 1/16/44 | | 1,835,079 | 304,142 |
| Ser. 12-56, Class IB, IO, 4.00%, 4/20/42 | | 1,762,834 | 299,825 |
| Ser. 12-38, Class MI, IO, 4.00%, 3/20/42 | | 12,960,727 | 2,180,513 |
| Ser. 19-158, Class PI, IO, 3.50%, 12/20/49 | | 3,616,081 | 641,131 |
| Ser. 19-151, Class NI, IO, 3.50%, 10/20/49 | | 16,555,596 | 2,718,710 |
| Ser. 12-136, IO, 3.50%, 11/20/42 | | 5,840,068 | 831,336 |
| Ser. 12-113, Class ID, IO, 3.50%, 9/20/42 | | 7,453,143 | 1,179,203 |
| Ser. 14-102, Class IG, IO, 3.50%, 3/16/41 | | 981,744 | 41,845 |
| Ser. 15-52, Class KI, IO, 3.50%, 11/20/40 | | 1,831,392 | 110,160 |
| Ser. 14-100, Class JI, IO, 3.50%, 7/16/29 | | 2,603,033 | 121,155 |
| Ser. 20-186, Class DI, IO, 3.00%, 12/20/50 | | 4,526,663 | 714,573 |
| Ser. 14-30, Class KI, IO, 3.00%, 2/16/29 | | 945,872 | 33,224 |
| Ser. 14-5, Class LI, IO, 3.00%, 1/16/29 | | 947,294 | 34,390 |
| Ser. 13-164, Class CI, IO, 3.00%, 11/16/28 | | 1,861,878 | 69,777 |
| IFB Ser. 23-140, Class JS, IO, ((-2.488 x US 30 Day Average SOFR) + 16.05%), 2.809%, 9/20/53 | | 1,424,539 | 1,213,304 |
| Ser. 20-151, Class MI, IO, 2.50%, 10/20/50 | | 28,884,152 | 3,935,466 |
| Ser. 16-H11, Class HI, IO, 2.083%, 1/20/66 W | | 16,979,820 | 494,362 |
| IFB Ser. 23-66, Class PS, ((-2.5 x US 30 Day Average SOFR) + 15.38%), 2.072%, 5/20/53 | | 3,353,719 | 2,988,839 |
| Ser. 17-H23, Class BI, IO, 1.86%, 11/20/67 W | | 11,535,825 | 508,730 |
| Ser. 15-H12, Class AI, IO, 1.83%, 5/20/65 W | | 15,027,664 | 455,339 |
| Ser. 15-H12, Class GI, IO, 1.814%, 5/20/65 W | | 18,294,036 | 735,420 |
| Ser. 15-H20, Class AI, IO, 1.812%, 8/20/65 W | | 14,936,360 | 504,849 |
| Ser. 15-H10, Class CI, IO, 1.784%, 4/20/65 W | | 16,496,799 | 577,388 |
| Ser. 15-H12, Class EI, IO, 1.668%, 4/20/65 W | | 15,445,228 | 480,347 |
| Ser. 15-H25, Class AI, IO, 1.577%, 9/20/65 W | | 12,985,826 | 345,423 |
| Ser. 15-H01, Class CI, IO, 1.54%, 12/20/64 W | | 5,604,261 | 108,785 |
| Ser. 14-H11, Class GI, IO, 1.494%, 6/20/64 W | | 26,527,263 | 747,830 |
| Ser. 10-H19, Class GI, IO, 1.426%, 8/20/60 W | | 8,733,704 | 265,758 |
| IFB Ser. 23-84, Class UA, ((-2 x US 30 Day Average SOFR) + 12.00%), 1.357%, 6/20/53 | | 1,201,986 | 955,994 |
| IFB Ser. 10-9, Class YD, IO, ((-1 x CME Term SOFR 1 Month) + 6.69%), 1.355%, 1/16/40 | | 6,337,152 | 626,111 |
| | | |
| MORTGAGE-BACKED SECURITIES (30.8%)* cont. | Principal
amount | Value |
| Agency collateralized mortgage obligations cont. |
| Government National Mortgage Association | | | |
| Ser. 18-H17, Class GI, IO, 1.308%, 10/20/68 W | | $15,636,266 | $548,554 |
| IFB Ser. 20-142, Class SB, IO, ((-1 x CME Term SOFR 1 Month) + 6.19%), 0.846%, 9/20/50 | | 27,781,475 | 2,691,191 |
| IFB Ser. 20-112, Class MS, IO, ((-1 x CME Term SOFR 1 Month) + 6.19%), 0.846%, 8/20/50 | | 4,981,343 | 465,364 |
| IFB Ser. 14-131, Class BS, IO, ((-1 x CME Term SOFR 1 Month) + 6.09%), 0.751%, 9/16/44 | | 8,983,398 | 872,065 |
| IFB Ser. 20-98, Class KS, IO, ((-1 x CME Term SOFR 1 Month) + 6.09%), 0.746%, 7/20/50 | | 26,784,044 | 2,329,181 |
| IFB Ser. 12-149, Class GS, IO, ((-1 x CME Term SOFR 1 Month) + 6.09%), 0.746%, 12/20/42 | | 8,314,995 | 568,081 |
| IFB Ser. 19-123, Class SL, IO, ((-1 x CME Term SOFR 1 Month) + 6.04%), 0.696%, 10/20/49 | | 14,347,245 | 976,594 |
| IFB Ser. 18-168, Class KS, IO, ((-1 x CME Term SOFR 1 Month) + 6.04%), 0.696%, 12/20/48 | | 17,210,309 | 1,349,197 |
| IFB Ser. 18-148, Class GS, IO, ((-1 x CME Term SOFR 1 Month) + 5.99%), 0.651%, 2/16/46 | | 10,417,635 | 733,559 |
| IFB Ser. 20-32, Class GS, IO, ((-1 x CME Term SOFR 1 Month) + 5.99%), 0.646%, 3/20/50 | | 14,140,114 | 1,169,362 |
| IFB Ser. 20-11, Class SY, IO, ((-1 x CME Term SOFR 1 Month) + 5.99%), 0.646%, 1/20/50 | | 30,756,843 | 2,430,406 |
| IFB Ser. 19-83, Class JS, IO, ((-1 x CME Term SOFR 1 Month) + 5.99%), 0.646%, 7/20/49 | | 10,555,792 | 839,502 |
| IFB Ser. 19-83, Class SW, IO, ((-1 x CME Term SOFR 1 Month) + 5.99%), 0.646%, 7/20/49 | | 15,020,708 | 1,229,295 |
| IFB Ser. 19-65, Class BS, IO, ((-1 x CME Term SOFR 1 Month) + 5.99%), 0.646%, 5/20/49 | | 6,828,175 | 458,239 |
| IFB Ser. 19-20, Class SB, IO, ((-1 x CME Term SOFR 1 Month) + 5.99%), 0.646%, 2/20/49 | | 14,549,231 | 1,120,338 |
| IFB Ser. 18-155, Class SE, IO, ((-1 x CME Term SOFR 1 Month) + 5.99%), 0.646%, 11/20/48 | | 7,586,309 | 582,491 |
| IFB Ser. 19-119, Class KS, IO, ((-1 x CME Term SOFR 1 Month) + 5.94%), 0.601%, 9/16/49 | | 18,853,593 | 1,838,563 |
| IFB Ser. 20-55, Class SA, IO, ((-1 x CME Term SOFR 1 Month) + 5.94%), 0.596%, 4/20/50 | | 39,009,636 | 3,012,714 |
| IFB Ser. 19-125, Class SG, IO, ((-1 x CME Term SOFR 1 Month) + 5.94%), 0.596%, 10/20/49 | | 3,913,471 | 364,956 |
| IFB Ser. 20-34, Class SQ, IO, ((-1 x CME Term SOFR 1 Month) + 5.94%), 0.596%, 10/20/49 | | 15,567,738 | 1,185,263 |
| IFB Ser. 19-108, Class S, IO, ((-1 x CME Term SOFR 1 Month) + 5.94%), 0.596%, 8/20/49 | | 11,140,706 | 757,568 |
| IFB Ser. 19-44, Class SA, IO, ((-1 x CME Term SOFR 1 Month) + 5.94%), 0.596%, 4/20/49 | | 8,676,247 | 535,264 |
| IFB Ser. 19-30, Class SH, IO, ((-1 x CME Term SOFR 1 Month) + 5.94%), 0.596%, 3/20/49 | | 12,824,074 | 914,736 |
| FRB Ser. 20-47, Class SG, IO, ((-1 x CME Term SOFR 1 Month) + 5.89%), 0.546%, 2/20/49 | | 34,944,576 | 2,231,910 |
| IFB Ser. 19-121, Class SD, IO, ((-1 x CME Term SOFR 1 Month) + 5.89%), 0.546%, 10/20/49 | | 2,777,321 | 262,351 |
| FRB Ser. 15-H16, Class XI, IO, 0.519%, 7/20/65 W | | 11,897,869 | 575,857 |
| | | |
| MORTGAGE-BACKED SECURITIES (30.8%)* cont. | Principal
amount | Value |
| Agency collateralized mortgage obligations cont. |
| Government National Mortgage Association | | | |
| Ser. 16-H23, Class NI, IO, 0.457%, 10/20/66 W | | $21,605,231 | $820,999 |
| IFB Ser. 10-31, Class SA, IO, ((-1 x CME Term SOFR 1 Month) + 5.64%), 0.296%, 3/20/40 | | 9,351,588 | 513,963 |
| Ser. 17-H12, Class QI, IO, 0.238%, 5/20/67 W | | 10,695,419 | 340,082 |
| Ser. 17-H18, Class CI, IO, 0.215%, 9/20/67 W | | 8,047,870 | 568,311 |
| Ser. 16-H24, Class JI, IO, 0.102%, 11/20/66 W | | 9,107,226 | 427,088 |
| Ser. 15-H26, Class DI, IO, 0.09%, 10/20/65 W | | 11,104,084 | 403,556 |
| Ser. 18-H02, Class EI, IO, 0.05%, 1/20/68 W | | 9,015,592 | 372,849 |
| Ser. 15-H25, Class CI, IO, 0.046%, 10/20/65 W | | 11,146,183 | 381,200 |
| Ser. 18-H05, Class AI, IO, 0.036%, 2/20/68 W | | 12,095,490 | 483,131 |
| Ser. 15-H04, Class AI, IO, 0.023%, 12/20/64 W | | 15,229,579 | 406,120 |
| Ser. 17-H10, Class MI, IO, 0.02%, 4/20/67 W | | 10,055,605 | 270,496 |
| Ser. 17-H08, Class NI, IO, 0.019%, 3/20/67 W | | 7,394,927 | 226,285 |
| Ser. 20-H02, Class GI, IO, zero %, 1/20/70 W | | 20,222,268 | 940,153 |
| Ser. 19-H14, Class IB, IO, zero %, 8/20/69 W | | 15,645,298 | 682,774 |
| Ser. 19-H02, Class DI, IO, zero %, 11/20/68 W | | 13,156,821 | 598,956 |
| IFB Ser. 11-70, Class YI, IO, ((-1 x CME Term SOFR 1 Month) + 4.89%), zero %, 12/20/40 | | 3,452,720 | 9,105 |
| | | 112,556,385 |
| Commercial mortgage-backed securities (13.7%) |
ACRES Commercial Realty, Ltd. 144A FRB Ser. 21-FL1, Class A,
(CME Term SOFR 1 Month + 1.31%), 6.65%, 6/15/36 | | 433,151 | 426,806 |
| AREIT CRE Trust 144A FRB Ser. 20-CRE4, Class D, 8.64%, 4/15/37 | | 5,788,000 | 5,396,153 |
| Banc of America Commercial Mortgage Trust | | | |
| FRB Ser. 16-UB10, Class C, 4.825%, 7/15/49 W | | 167,000 | 143,013 |
| FRB Ser. 15-UBS7, Class B, 4.343%, 9/15/48 W | | 4,306,000 | 3,876,707 |
| FRB Ser. 07-1, Class XW, IO, 0.313%, 1/15/49 W | | 133,828 | 274 |
| BANK | | | |
| FRB Ser. 20-BN26, Class XA, IO, 1.211%, 3/15/63 W | | 39,602,848 | 2,083,644 |
| FRB Ser. 18-BN13, Class XA, IO, 0.435%, 8/15/61 W | | 173,608,220 | 3,231,943 |
| Barclays Commercial Mortgage Trust 144A | | | |
| FRB Ser. 19-C5, Class F, 2.601%, 11/15/52 W | | 4,179,000 | 2,070,886 |
| Ser. 19-C5, Class D, 2.50%, 11/15/52 | | 528,000 | 305,252 |
| BDS Ltd. 144A FRB Ser. 21-FL8, Class A, 6.369%, 1/18/36 (Cayman Islands) | | 177,357 | 174,254 |
| BDS, Ltd. 144A | | | |
| FRB Ser. 21-FL10, Class A, (CME Term SOFR 1 Month + 1.46%), 6.799%, 12/16/36 (Cayman Islands) | | 1,387,000 | 1,369,259 |
| FRB Ser. 21-FL9, Class A, (CME Term SOFR 1 Month + 1.18%), 6.519%, 11/16/38 (Cayman Islands) | | 305,998 | 299,824 |
| CD Commercial Mortgage Trust FRB Ser. 17-CD6, Class C, 4.231%, 11/13/50 W | | 3,594,000 | 2,776,392 |
| CD Commercial Mortgage Trust 144A Ser. 17-CD3, Class D, 3.25%, 2/10/50 | | 416,000 | 166,308 |
| CFCRE Commercial Mortgage Trust 144A | | | |
| FRB Ser. 11-C2, Class D, 5.249%, 12/15/47 W | | 333,800 | 313,772 |
| FRB Ser. 11-C2, Class E, 5.249%, 12/15/47 W | | 175,000 | 142,891 |
| | | |
| MORTGAGE-BACKED SECURITIES (30.8%)* cont. | Principal
amount | Value |
| Commercial mortgage-backed securities cont. |
| Citigroup Commercial Mortgage Trust | | | |
| FRB Ser. 16-P6, Class B, 4.159%, 12/10/49 W | | $1,631,000 | $1,430,059 |
| FRB Ser. 14-GC19, Class XA, IO, 1.018%, 3/11/47 W | | 35,378,697 | 34,176 |
| FRB Ser. 13-GC17, Class XA, IO, 0.795%, 11/10/46 W | | 2,831,206 | 28 |
| COMM Mortgage Trust | | | |
| Ser. 12-LC4, Class B, 4.934%, 12/10/44 W | | 1,939,789 | 1,745,735 |
| FRB Ser. 14-CR17, Class C, 4.76%, 5/10/47 W | | 300,000 | 275,167 |
| FRB Ser. 14-CR18, Class C, 4.734%, 7/15/47 W | | 2,758,000 | 2,666,584 |
| FRB Ser. 18-COR3, Class C, 4.559%, 5/10/51 W | | 6,172,000 | 4,160,155 |
| Ser. 14-LC17, Class B, 4.49%, 10/10/47 W | | 2,308,000 | 2,188,858 |
| FRB Ser. 14-UBS6, Class C, 4.433%, 12/10/47 W | | 591,000 | 497,856 |
| FRB Ser. 14-UBS4, Class XA, IO, 1.082%, 8/10/47 W | | 26,219,506 | 69,744 |
| FRB Ser. 14-LC15, Class XA, IO, 1.035%, 4/10/47 W | | 53,883,041 | 13,546 |
| FRB Ser. 15-CR23, Class XA, IO, 0.841%, 5/10/48 W | | 27,025,418 | 237,848 |
| FRB Ser. 14-LC17, Class XA, IO, 0.654%, 10/10/47 W | | 15,047,942 | 50,456 |
| FRB Ser. 19-GC44, Class XA, IO, 0.633%, 8/15/57 W | | 89,242,414 | 2,197,157 |
| COMM Mortgage Trust 144A | | | |
| FRB Ser. 13-LC13, Class D, 5.419%, 8/10/46 W | | 720,000 | 632,627 |
| FRB Ser. 12-CR1, Class D, 5.137%, 5/15/45 W | | 1,281,935 | 880,370 |
| FRB Ser. 13-CR13, Class E, 5.01%, 11/10/46 W | | 1,524,000 | 785,336 |
| FRB Ser. 14-CR17, Class D, 4.824%, 5/10/47 W | | 233,000 | 187,154 |
| FRB Ser. 14-CR19, Class D, 4.629%, 8/10/47 W | | 1,540,000 | 1,384,203 |
| FRB Ser. 14-CR14, Class D, 4.612%, 2/10/47 W | | 2,864,000 | 2,152,536 |
| Ser. 12-LC4, Class E, 4.25%, 12/10/44 | | 1,918,000 | 356,886 |
| FRB Ser. 13-CR6, Class D, 3.859%, 3/10/46 W | | 1,683,000 | 1,144,440 |
| Ser. 13-LC6, Class E, 3.50%, 1/10/46 | | 2,370,000 | 1,857,085 |
| Ser. 15-LC19, Class D, 2.867%, 2/10/48 | | 4,252,000 | 3,617,350 |
| Credit Suisse Commercial Mortgage Trust 144A | | | |
| FRB Ser. 08-C1, Class AJ, 5.816%, 2/15/41 W | | 9,821,289 | 3,014,655 |
| FRB Ser. 07-C2, Class AX, IO, 0.013%, 1/15/49 W | | 6,131,637 | 61 |
| CSAIL Commercial Mortgage Trust | | | |
| FRB Ser. 15-C1, Class C, 4.25%, 4/15/50 W | | 3,954,000 | 2,993,476 |
| FRB Ser. 19-C17, Class XA, IO, 1.344%, 9/15/52 W | | 59,360,345 | 3,145,760 |
| CSAIL Commercial Mortgage Trust 144A FRB Ser. 15-C1, Class D, 3.75%, 4/15/50 W | | 219,000 | 133,638 |
| CSMC Trust FRB Ser. 16-NXSR, Class XA, IO, 0.679%, 12/15/49 W | | 97,609,785 | 1,505,631 |
| DBUBS Mortgage Trust 144A FRB Ser. 11-LC3A, Class D, 5.359%, 8/10/44 W | | 5,263,148 | 4,695,771 |
| Federal Home Loan Mortgage Corporation 144A Multifamily Structured Credit Risk FRB Ser. 21-MN3, Class M2, 9.321%, 11/25/51 | | 478,000 | 453,826 |
| FREMF Mortgage Trust 144A FRB Ser. 18-KF43, Class B, (US 30 Day Average SOFR + 2.15%), 7.581%, 1/25/28 | | 2,579,818 | 2,401,924 |
| GS Mortgage Securities Corp., II 144A Ser. 13-GC10, Class C, 4.285%, 2/10/46 W | | 8,476,911 | 8,123,329 |
| GS Mortgage Securities Trust | | | |
| FRB Ser. 14-GC18, Class C, 5.089%, 1/10/47 W | | 276,000 | 207,034 |
| FRB Ser. 14-GC22, Class C, 4.685%, 6/10/47 W | | 1,990,000 | 1,179,863 |
| FRB Ser. 14-GC18, Class XA, IO, 0.969%, 1/10/47 W | | 14,709,494 | 147 |
| FRB Ser. 14-GC22, Class XA, IO, 0.93%, 6/10/47 W | | 63,805,604 | 116,662 |
| FRB Ser. 14-GC26, Class XA, IO, 0.903%, 11/10/47 W | | 31,612,652 | 193,201 |
| | | |
| MORTGAGE-BACKED SECURITIES (30.8%)* cont. | Principal
amount | Value |
| Commercial mortgage-backed securities cont. |
| JPMBB Commercial Mortgage Securities Trust | | | |
| FRB Ser. 13-C12, Class C, 3.958%, 7/15/45 W | | $245,582 | $219,125 |
| FRB Ser. 14-C25, Class XA, IO, 0.797%, 11/15/47 W | | 23,156,293 | 111,683 |
| FRB Ser. 14-C22, Class XA, IO, 0.785%, 9/15/47 W | | 18,115,842 | 61,288 |
| JPMBB Commercial Mortgage Securities Trust 144A | | | |
| FRB Ser. C14, Class D, 4.15%, 8/15/46 W | | 3,534,000 | 1,805,222 |
| FRB Ser. 14-C25, Class D, 3.933%, 11/15/47 W | | 3,567,000 | 1,929,779 |
| Ser. 14-C25, Class E, 3.332%, 11/15/47 W | | 4,818,000 | 1,206,461 |
| JPMDB Commercial Mortgage Securities Trust | | | |
| FRB Ser. 18-C8, Class C, 4.764%, 6/15/51 W | | 226,000 | 177,163 |
| FRB Ser. 19-COR6, Class XA, IO, 0.924%, 11/13/52 W | | 68,469,681 | 2,605,847 |
| JPMorgan Chase Commercial Mortgage Securities Trust | | | |
| Ser. 06-LDP9, Class AMS, 5.337%, 5/15/47 | | 2,084,954 | 1,970,740 |
| Ser. 13-LC11, Class B, 3.499%, 4/15/46 | | 858,000 | 716,345 |
| FRB Ser. 13-LC11, Class XA, IO, 0.951%, 4/15/46 W | | 1,900,063 | 19 |
| FRB Ser. 13-C16, Class XA, IO, 0.44%, 12/15/46 W | | 3,555,617 | 36 |
| JPMorgan Chase Commercial Mortgage Securities Trust 144A | | | |
| FRB Ser. 11-C3, Class D, 5.526%, 2/15/46 W | | 1,395,000 | 948,259 |
| FRB Ser. 11-C3, Class F, 5.526%, 2/15/46 W | | 4,436,000 | 1,019,136 |
| FRB Ser. 12-C6, Class E, 4.964%, 5/15/45 W | | 1,443,000 | 1,181,804 |
| FRB Ser. 12-LC9, Class D, 3.784%, 12/15/47 W | | 621,000 | 482,394 |
| FRB Ser. 13-LC11, Class E, 3.25%, 4/15/46 W | | 2,038,000 | 509,500 |
| FRB Ser. 21-1MEM, Class E, 2.654%, 10/9/42 W | | 5,750,000 | 3,181,826 |
| MF1 Multifamily Housing Mortgage Loan Trust 144A FRB Ser. 21-FL5, Class A, 6.30%, 7/15/36 | | 184,804 | 182,537 |
| MF1 Multifamily Housing Mortgage Loan, Ltd. 144A FRB Ser. 21-FL7, Class C, IO, (CME Term SOFR 1 Month + 2.16%), 7.499%, 10/16/36 (Cayman Islands) | | 1,304,500 | 1,226,058 |
| MF1 Multifamily Housing Mortgage, Ltd. 144A FRB Ser. 21-FL6, Class A, (CME Term SOFR 1 Month + 1.21%), 6.549%, 7/16/36 (Cayman Islands) | | 769,310 | 755,963 |
| Morgan Stanley Bank of America Merrill Lynch Trust | | | |
| FRB Ser. 15-C27, Class C, 4.493%, 12/15/47 W | | 4,917,000 | 4,238,691 |
| FRB Ser. 14-C16, Class B, 4.281%, 6/15/47 W | | 289,000 | 264,146 |
| FRB Ser. 15-C21, Class C, 4.126%, 3/15/48 W | | 300,000 | 233,746 |
| FRB Ser. 15-C26, Class XA, IO, 0.963%, 10/15/48 W | | 31,568,157 | 313,582 |
| Morgan Stanley Bank of America Merrill Lynch Trust 144A | | | |
| FRB Ser. 12-C5, Class E, 4.618%, 8/15/45 W | | 540,000 | 488,430 |
| FRB Ser. 13-C10, Class E, 3.962%, 7/15/46 W | | 4,172,000 | 972,155 |
| FRB Ser. 13-C10, Class F, 3.962%, 7/15/46 W | | 2,331,000 | 117,254 |
| Ser. 14-C17, Class E, 3.50%, 8/15/47 | | 2,709,000 | 2,215,049 |
| Morgan Stanley Capital I Trust | | | |
| FRB Ser. 18-L1, Class C, 4.782%, 10/15/51 W | | 263,000 | 200,195 |
| Ser. 15-UBS8, Class B, 4.315%, 12/15/48 W | | 319,000 | 255,371 |
| FRB Ser. 16-BNK2, Class XA, IO, 0.956%, 11/15/49 W | | 22,549,209 | 489,532 |
| FRB Ser. 18-H4, Class XA, IO, 0.822%, 12/15/51 W | | 51,802,571 | 1,700,782 |
| FRB Ser. 18-H3, Class XA, IO, 0.801%, 7/15/51 W | | 50,461,445 | 1,425,071 |
| FRB Ser. 16-UB12, Class XA, IO, 0.649%, 12/15/49 W | | 64,794,602 | 1,033,461 |
| | | |
| MORTGAGE-BACKED SECURITIES (30.8%)* cont. | Principal
amount | Value |
| Commercial mortgage-backed securities cont. |
| Morgan Stanley Capital I Trust 144A FRB Ser. 12-C4, Class E, 5.164%, 3/15/45 W | | $1,406,000 | $1,015,273 |
| Multifamily Connecticut Avenue Securities Trust 144A | | | |
| FRB Ser. 20-01, Class M10, 9.185%, 3/25/50 | | 3,346,953 | 3,196,564 |
| FRB Ser. 19-01, Class M10, 8.685%, 10/25/49 | | 5,961,657 | 5,740,565 |
| PFP, Ltd. 144A | | | |
| FRB Ser. 21-7, Class AS, 6.599%, 4/14/38 (Cayman Islands) | | 2,102,940 | 2,075,800 |
| FRB Ser. 21-8, Class A, 6.448%, 8/9/37 (Cayman Islands) | | 48,072 | 47,271 |
| Ready Capital Mortgage Financing, LLC 144A | | | |
| FRB Ser. 22-FL8, Class AS, 7.421%, 1/25/37 | | 313,000 | 312,478 |
| FRB Ser. 21-FL7, Class AS, 6.939%, 11/25/36 | | 3,900,000 | 3,796,111 |
| FRB Ser. 21-FL7, Class A, 6.639%, 11/25/36 | | 667,744 | 659,687 |
| TIAA Real Estate CDO, Ltd. 144A Ser. 03-1A, Class E, 8.00%, 12/28/38 (In default) † | | 1,661,295 | 17 |
| UBS Commercial Mortgage Trust | | | |
| FRB Ser. 17-C7, Class XA, IO, 1.001%, 12/15/50 W | | 62,567,809 | 1,912,035 |
| FRB Ser. 18-C12, Class XA, IO, 0.865%, 8/15/51 W | | 105,566,401 | 3,590,904 |
| UBS-Barclays Commercial Mortgage Trust 144A Ser. 13-C6, Class E, 3.50%, 4/10/46 | | 1,319,000 | 624,726 |
| Wachovia Bank Commercial Mortgage Trust FRB Ser. 06-C29, IO, 0.258%, 11/15/48 W | | 974,548 | 1,520 |
| Wachovia Bank Commercial Mortgage Trust 144A FRB Ser. 05-C21, Class E, 5.097%, 10/15/44 W | | 2,583,892 | 2,061,688 |
| Wells Fargo Commercial Mortgage Trust | | | |
| FRB Ser. 18-C46, Class C, 4.97%, 8/15/51 W | | 412,000 | 308,825 |
| Ser. 15-LC20, Class C, 4.056%, 4/15/50 W | | 2,575,000 | 2,294,075 |
| FRB Ser. 20-C57, Class C, 4.023%, 8/15/53 W | | 1,121,000 | 854,423 |
| FRB Ser. 19-C50, Class XA, IO, 1.41%, 5/15/52 W | | 44,373,924 | 2,448,677 |
| FRB Ser. 20-C55, Class XA, IO, 1.293%, 2/15/53 W | | 64,703,103 | 3,681,212 |
| FRB Ser. 17-C41, Class XA, IO, 1.153%, 11/15/50 W | | 78,702,091 | 2,890,224 |
| FRB Ser. 14-LC16, Class XA, IO, 1.047%, 8/15/50 W | | 45,901,859 | 87,452 |
| Wells Fargo Commercial Mortgage Trust 144A | | | |
| Ser. 16-C33, Class D, 3.123%, 3/15/59 | | 2,203,000 | 1,583,545 |
| Ser. 19-C50, Class D, 3.00%, 5/15/52 | | 8,290,000 | 4,688,589 |
| WF-RBS Commercial Mortgage Trust | | | |
| Ser. 14-C21, Class C, 4.234%, 8/15/47 W | | 1,812,000 | 1,530,734 |
| Ser. 13-C11, Class B, 3.714%, 3/15/45 W | | 1,483,740 | 1,301,982 |
| FRB Ser. 14-C22, Class XA, IO, 0.761%, 9/15/57 W | | 26,324,282 | 89,292 |
| FRB Ser. 14-C23, Class XA, IO, 0.546%, 10/15/57 W | | 52,785,400 | 158,166 |
| FRB Ser. 13-C14, Class XA, IO, 0.348%, 6/15/46 W | | 3,029,678 | 30 |
| WF-RBS Commercial Mortgage Trust 144A | | | |
| FRB Ser. 13-UBS1, Class D, 5.052%, 3/15/46 W | | 3,873,000 | 3,737,257 |
| Ser. 11-C4, Class F, 5.00%, 6/15/44 W | | 6,151,000 | 4,015,035 |
| Ser. 11-C4, Class E, 4.979%, 6/15/44 W | | 1,776,768 | 1,224,199 |
| FRB Ser. 11-C4, Class C, 4.979%, 6/15/44 W | | 1,409,558 | 1,306,823 |
| FRB Ser. 12-C10, Class D, 4.394%, 12/15/45 W | | 1,105,000 | 614,564 |
| FRB Ser. 12-C10, Class E, 4.394%, 12/15/45 W | | 3,645,000 | 1,002,375 |
| | | 172,598,480 |
| | | |
| MORTGAGE-BACKED SECURITIES (30.8%)* cont. | Principal
amount | Value |
| Residential mortgage-backed securities (non-agency) (8.1%) |
| Angel Oak Mortgage Trust 144A Ser. 23-3, Class A1, 4.80%, 9/26/67 | | $1,381,067 | $1,285,730 |
| Arroyo Mortgage Trust 144A | | | |
| Ser. 19-3, Class M1, 4.204%, 10/25/48 W | | 3,050,000 | 2,357,239 |
| Ser. 20-1, Class A3, 3.328%, 3/25/55 | | 150,000 | 124,801 |
| Bellemeade Re, Ltd. 144A | | | |
| FRB Ser. 20-2A, Class B1, (US 30 Day Average SOFR + 8.50%), 13.935%, 8/26/30 (Bermuda) | | 1,278,000 | 1,289,914 |
| FRB Ser. 19-4A, Class M1C, (ICE LIBOR USD 1 Month + 2.50%), 7.939%, 10/25/29 (Bermuda) | | 2,646,347 | 2,649,609 |
| BRAVO Residential Funding Trust 144A | | | |
| FRB Ser. 21-HE2, Class B1, (US 30 Day Average SOFR + 2.40%), 7.721%, 11/25/69 | | 3,000,000 | 2,840,232 |
| Ser. 20-RPL1, Class M1, 3.25%, 5/26/59 W | | 5,430,000 | 4,703,846 |
| Bunker Hill Loan Depositary Trust 144A FRB Ser. 20-1, Class A3, 3.253%, 2/25/55 W | | 2,100,000 | 1,774,968 |
| Cascade Funding Mortgage Trust 144A Ser. 21-HB6, Class M3, 3.735%, 6/25/36 W | | 2,000,000 | 1,903,022 |
| Chevy Chase Funding, LLC Mortgage-Backed Certificates 144A FRB Ser. 04-3A, Class A2, (CME Term SOFR 1 Month + 0.41%), 5.739%, 8/25/35 | | 532,105 | 474,372 |
| Citigroup Mortgage Loan Trust. Inc. 144A Ser. 22-A, Class A1, 6.17%, 9/25/62 | | 512,073 | 492,852 |
| COLT Funding, LLC 144A Ser. 21-1, Class B1, 3.144%, 6/25/66 W | | 2,996,000 | 1,702,874 |
| COLT Mortgage Loan Trust 144A Ser. 20-2, Class A2, 3.094%, 3/25/65 W | | 175,000 | 166,030 |
| Credit Suisse Mortgage Trust 144A FRB Ser. 20-RPL3, Class A1, 4.064%, 3/25/60 W | | 66,100 | 64,014 |
| Deephaven Residential Mortgage Trust Ser. 22-3, Class A3, 5.30%, 7/25/67 W | | 3,112,507 | 2,937,907 |
| Eagle Re, Ltd. 144A FRB Ser. 18-1, Class M1, (ICE LIBOR USD 1 Month + 1.70%), 7.139%, 11/25/28 (Bermuda) | | 1,755,056 | 1,756,284 |
| Ellington Financial Mortgage Trust 144A FRB Ser. 20-1, Class A2, 3.149%, 5/25/65 W | | 131,000 | 119,391 |
| Federal Home Loan Mortgage Corporation | | | |
| Structured Agency Credit Risk Debt FRN Ser. 16-DNA3, Class M3, (US 30 Day Average SOFR + 5.11%), 10.435%, 12/25/28 | | 98,081 | 104,335 |
| Structured Agency Credit Risk Debt FRN Ser. 15-DNA3, Class M3, (US 30 Day Average SOFR + 4.81%), 10.135%, 4/25/28 | | 77,518 | 81,135 |
| Seasoned Credit Risk Transfer Trust Ser. 19-3, Class M, 4.75%, 10/25/58 W | | 4,560,000 | 4,148,614 |
| Federal Home Loan Mortgage Corporation 144A | | | |
| Structured Agency Credit Risk Trust REMICs FRB Ser. 22-HQA1, Class M2, (US 30 Day Average SOFR + 5.25%), 10.571%, 3/25/42 | | 6,323,000 | 6,672,738 |
| Structured Agency Credit Risk Trust REMICs FRB Ser. 20-DNA5, Class B1, (US 30 Day Average SOFR + 4.80%), 10.121%, 10/25/50 | | 2,275,000 | 2,474,417 |
| Structured Agency Credit Risk Debt FRN Ser. 22-HQA2, Class M1B, (US 30 Day Average SOFR + 4.00%), 9.321%, 7/25/42 | | 1,000,000 | 1,047,286 |
| Structured Agency Credit Risk Trust REMICs FRB Ser. 20-HQA2, Class M2, (US 30 Day Average SOFR + 3.21%), 8.535%, 3/25/50 | | 43,500 | 44,988 |
| Structured Agency Credit Risk Trust REMICs FRB Ser. 20-DNA2, Class B1, (US 30 Day Average SOFR + 2.61%), 7.935%, 2/25/50 | | 83,000 | 83,243 |
| | | |
| MORTGAGE-BACKED SECURITIES (30.8%)* cont. | Principal
amount | Value |
| Residential mortgage-backed securities (non-agency) cont. |
| Federal Home Loan Mortgage Corporation 144A | | | |
| Structured Agency Credit Risk Trust REMICs FRB Ser. 21-HQA4, Class M2, (US 30 Day Average SOFR + 2.35%), 7.671%, 12/25/41 | | $3,732,140 | $3,624,052 |
| Structured Agency Credit Risk Debt FRN Ser. 21-DNA2, Class M2, (US 30 Day Average SOFR + 2.30%), 7.621%, 8/25/33 | | 738,225 | 740,988 |
| Structured Agency Credit Risk Trust REMICs FRB Ser. 22-HQA3, Class M1A, (US 30 Day Average SOFR + 2.30%), 7.621%, 8/25/42 | | 1,039,866 | 1,052,165 |
| Structured Agency Credit Risk Trust FRB Ser. 19-FTR2, Class M2, (US 30 Day Average SOFR + 2.26%), 7.585%, 11/25/48 | | 928,000 | 937,280 |
| Structured Agency Credit Risk Trust FRB Ser. 19-DNA3, Class M2, (US 30 Day Average SOFR + 2.16%), 7.485%, 7/25/49 | | 223,816 | 224,936 |
| Structured Agency Credit Risk Trust REMICs FRB Ser. 22-DNA6, Class M1A, (US 30 Day Average SOFR + 2.15%), 7.471%, 9/25/42 | | 336,152 | 339,049 |
| Structured Agency Credit Risk Trust REMICs FRB Ser. 20-HQA1, Class M2, (US 30 Day Average SOFR + 2.01%), 7.335%, 1/25/50 | | 634,665 | 637,728 |
| Structured Agency Credit Risk Trust REMICs FRB Ser. 20-DNA2, Class M2, (US 30 Day Average SOFR + 1.96%), 7.285%, 2/25/50 | | 882,661 | 890,109 |
| Structured Agency Credit Risk Trust REMICs FRB Ser. 20-DNA1, Class M2, (US 30 Day Average SOFR + 1.81%), 7.135%, 1/25/50 | | 3,233 | 3,242 |
| Structured Agency Credit Risk Trust REMICs FRB Ser. 22-DNA1, Class M1A, (US 30 Day Average SOFR + 1.00%), 6.321%, 1/25/42 | | 771,370 | 764,737 |
| Seasoned Credit Risk Transfer Trust Ser. 19-2, Class M, 4.75%, 8/25/58 W | | 539,000 | 457,395 |
| Seasoned Credit Risk Transfer Trust Ser. 19-4, Class M, 4.50%, 2/25/59 W | | 2,024,000 | 1,705,984 |
| Federal National Mortgage Association | | | |
| Connecticut Avenue Securities FRB Ser. 16-C01, Class 1M2, (US 30 Day Average SOFR + 6.86%), 12.185%, 8/25/28 | | 22,456 | 23,947 |
| Connecticut Avenue Securities FRB Ser. 15-C04, Class 2M2, (US 30 Day Average SOFR + 5.66%), 10.985%, 4/25/28 | | 3,486 | 3,630 |
| Connecticut Avenue Securities FRB Ser. 14-C04, Class 1M2, (US 30 Day Average SOFR + 4.90%), 10.335%, 11/25/24 | | 6,195 | 6,430 |
| Connecticut Avenue Securities Trust FRB Ser. 18-C05, Class 1M2, (US 30 Day Average SOFR + 2.46%), 7.785%, 1/25/31 | | 1,122,374 | 1,146,131 |
| Connecticut Avenue Securities FRB Ser. 17-C01, Class 1EB1, (US 30 Day Average SOFR + 1.36%), 6.685%, 7/25/29 | | 11,362 | 11,366 |
| Connecticut Avenue Securities FRB Ser. 17-C07, Class 1EB2, (US 30 Day Average SOFR + 1.11%), 6.435%, 5/25/30 | | 71,874 | 71,880 |
| Federal National Mortgage Association 144A | | | |
| Connecticut Avenue Securities Trust FRB Ser. 19-R01, Class 2B1, (US 30 Day Average SOFR + 4.46%), 9.785%, 7/25/31 | | 100,000 | 106,500 |
| Connecticut Avenue Securities Trust FRB Ser. 18-R07, Class 1B1, (US 30 Day Average SOFR + 4.46%), 9.785%, 4/25/31 | | 4,500,000 | 4,771,179 |
| Connecticut Avenue Securities Trust FRB Ser. 19-R02, Class 1B1, (US 30 Day Average SOFR + 4.26%), 9.585%, 8/25/31 | | 1,521,780 | 1,597,010 |
| Connecticut Avenue Securities Trust FRB Ser. 22-R02, Class 2M2, (US 30 Day Average SOFR + 3.00%), 8.321%, 1/25/42 | | 884,000 | 884,553 |
| Connecticut Avenue Securities Trust FRB Ser. 22-R07, Class 1M1, (US 30 Day Average SOFR + 2.95%), 8.271%, 6/25/42 | | 919,737 | 943,385 |
| Connecticut Avenue Securities Trust FRB Ser. 22-R06, Class 1M1, (US 30 Day Average SOFR + 2.75%), 8.071%, 5/25/42 | | 830,684 | 849,616 |
| | | |
| MORTGAGE-BACKED SECURITIES (30.8%)* cont. | Principal
amount | Value |
| Residential mortgage-backed securities (non-agency) cont. |
| Federal National Mortgage Association 144A | | | |
| Connecticut Avenue Securities Trust FRB Ser. 19-R01, Class 2M2, (US 30 Day Average SOFR + 2.56%), 7.885%, 7/25/31 | | $71,472 | $71,738 |
| Connecticut Avenue Securities Trust FRB Ser. 22-R08, Class 1M1, (US 30 Day Average SOFR + 2.55%), 7.871%, 7/25/42 | | 484,607 | 492,620 |
| Connecticut Avenue Securities Trust FRB Ser. 18-R07, Class 1M2, (US 30 Day Average SOFR + 2.51%), 7.835%, 4/25/31 | | 13,073 | 13,115 |
| Connecticut Avenue Securities Trust FRB Ser. 19-HRP1, Class M2, (US 30 Day Average SOFR + 2.26%), 7.585%, 11/25/39 | | 607,929 | 612,556 |
| Connecticut Avenue Securities Trust FRB Ser. 20-R01, Class 1M2, (US 30 Day Average SOFR + 2.16%), 7.485%, 1/25/40 | | 1,296,882 | 1,310,884 |
| Connecticut Avenue Securities Trust FRB Ser. 20-R02, Class 2M2, (US 30 Day Average SOFR + 2.11%), 7.435%, 1/25/40 | | 719,688 | 721,615 |
| Connecticut Avenue Securities Trust FRB Ser. 22-R05, Class 2M1, (US 30 Day Average SOFR + 1.90%), 7.221%, 4/25/42 | | 1,461,875 | 1,465,529 |
| Connecticut Avenue Securities Trust FRB Ser. 23-R06, Class 1M1, (US 30 Day Average SOFR + 1.70%), 7.021%, 7/25/43 | | 934,464 | 934,456 |
| Connecticut Avenue Securities Trust FRB Ser. 22-R02, Class 2M1, (US 30 Day Average SOFR + 1.10%), 6.521%, 1/25/42 | | 190,397 | 189,608 |
| Finance of America HECM Buyout 144A Ser. 22-HB2, Class A1A, 4.00%, 8/1/32 W | | 2,693,111 | 2,578,205 |
| GCAT Trust 144A Ser. 20-NQM2, Class A3, 2.935%, 4/25/65 | | 1,826,554 | 1,678,609 |
| GS Mortgage-Backed Securities Trust 144A FRB Ser. 20-RPL1, Class M2, 3.835%, 7/25/59 W | | 1,125,000 | 811,042 |
| Morgan Stanley Resecuritization Trust 144A Ser. 15-R4, Class CB1, 4.638%, 8/26/47 W | | 2,700,052 | 2,573,060 |
| New York Mortgage Trust 144A Ser. 21-BPL1, Class A1, 2.239%, 5/25/26 | | 2,162,692 | 2,142,080 |
| NRZ Excess Spread-Collateralized Notes 144A Ser. 20-PLS1, Class A, 3.844%, 12/25/25 | | 661,269 | 617,668 |
| NYMT Loan Trust 144A Ser. 22-SP1, Class A1, 5.25%, 7/25/62 | | 3,185,845 | 3,074,567 |
| OBX Trust 144A Ser. 23-NQM7, Class A1, 6.844%, 4/25/63 | | 1,847,418 | 1,843,908 |
| PRKCM Trust 144A Ser. 23-AFC2, Class A1, 6.482%, 6/25/58 | | 6,866,410 | 6,866,410 |
| RMF Proprietary Issuance Trust 144A Ser. 22-3, Class A, 4.00%, 8/25/62 W | | 1,903,000 | 1,492,517 |
| Towd Point Mortgage Trust 144A | | | |
| Ser. 19-2, Class A2, 3.75%, 12/25/58 W | | 327,000 | 271,410 |
| FRB Ser. 15-6, Class M1, 3.75%, 4/25/55 W | | 865,423 | 842,608 |
| Ser. 18-5, Class M1, 3.25%, 7/25/58 W | | 209,000 | 149,481 |
| Verus Securitization Trust 144A Ser. 20-INV1, Class A3, 3.889%, 3/25/60 W | | 1,990,000 | 1,862,766 |
| Visio Trust 144A Ser. 22-1, Class A2, 5.85%, 8/25/57 | | 1,633,348 | 1,575,113 |
| Vista Point Securitization Trust 144A Ser. 20-1, Class A2, 2.77%, 3/25/65 W | | 196,981 | 194,224 |
| WaMu Mortgage Pass-Through Certificates Trust | | | |
| FRB Ser. 05-AR13, Class A1B2, (CME Term SOFR 1 Month + 0.97%), 6.299%, 10/25/45 | | 797,078 | 720,989 |
| FRB Ser. 05-AR13, Class A1C4, (CME Term SOFR 1 Month + 0.97%), 6.299%, 10/25/45 | | 2,690,050 | 2,433,258 |
| | | |
| MORTGAGE-BACKED SECURITIES (30.8%)* cont. | Principal
amount | Value |
| Residential mortgage-backed securities (non-agency) cont. |
| WaMu Mortgage Pass-Through Certificates Trust | | | |
| FRB Ser. 05-AR17, Class A1B2, (CME Term SOFR 1 Month + 0.93%), 6.259%, 12/25/45 | | $1,424,788 | $1,230,631 |
| FRB Ser. 05-AR2, Class 2A1B, (CME Term SOFR 1 Month + 0.85%), 6.179%, 1/25/45 | | 290,673 | 280,571 |
| | | 102,144,371 |
| Total mortgage-backed securities (cost $462,077,923) | $387,299,236 |
|
| | | |
| CORPORATE BONDS AND NOTES (30.1%)* | Principal
amount | Value |
| Basic materials (1.8%) |
| Air Products & Chemicals, Inc. sr. unsec. notes 1.50%, 10/15/25 | | $419,000 | $388,005 |
| Axalta Coating Systems, LLC 144A company guaranty sr. unsec. notes 3.375%, 2/15/29 | | 240,000 | 197,272 |
| Boise Cascade Co. 144A company guaranty sr. unsec. notes 4.875%, 7/1/30 | | 110,000 | 94,625 |
| Builders FirstSource, Inc. 144A company guaranty sr. unsec. bonds 6.375%, 6/15/32 | | 105,000 | 96,103 |
| Cabot Corp. sr. unsec. bonds 5.00%, 6/30/32 | | 333,000 | 296,579 |
| Celanese US Holdings, LLC company guaranty sr. unsec. bonds 6.379%, 7/15/32 (Germany) | | 495,000 | 464,615 |
| Celanese US Holdings, LLC company guaranty sr. unsec. notes 6.55%, 11/15/30 (Germany) | | 900,000 | 865,667 |
| Celanese US Holdings, LLC company guaranty sr. unsec. notes 6.33%, 7/15/29 (Germany) | | 793,000 | 764,401 |
| Celanese US Holdings, LLC company guaranty sr. unsec. notes 6.165%, 7/15/27 (Germany) | | 4,090,000 | 3,992,038 |
| Celanese US Holdings, LLC company guaranty sr. unsec. notes 1.40%, 8/5/26 (Germany) | | 240,000 | 209,015 |
| CF Industries, Inc. company guaranty sr. unsec. bonds 4.95%, 6/1/43 | | 1,487,000 | 1,147,936 |
| CF Industries, Inc. 144A company guaranty sr. notes 4.50%, 12/1/26 | | 42,000 | 40,023 |
| Commercial Metals Co. sr. unsec. notes 4.375%, 3/15/32 | | 115,000 | 92,484 |
| FMC Corp. sr. unsec. unsub. notes 5.65%, 5/18/33 | | 1,379,000 | 1,215,695 |
| Freeport-McMoRan, Inc. company guaranty sr. unsec. notes 5.25%, 9/1/29 (Indonesia) | | 485,000 | 456,223 |
| Georgia-Pacific, LLC 144A sr. unsec. notes 0.95%, 5/15/26 | | 461,000 | 408,959 |
| Glencore Funding, LLC 144A company guaranty sr. unsec. notes 6.375%, 10/6/30 | | 1,285,000 | 1,258,906 |
| Glencore Funding, LLC 144A company guaranty sr. unsec. notes 2.50%, 9/1/30 | | 1,883,000 | 1,462,667 |
| Glencore Funding, LLC 144A company guaranty sr. unsec. notes 1.625%, 9/1/25 | | 384,000 | 354,627 |
| Graphic Packaging International, LLC 144A company guaranty sr. unsec. notes 3.50%, 3/1/29 | | 490,000 | 407,053 |
| HudBay Minerals, Inc. 144A company guaranty sr. unsec. notes 6.125%, 4/1/29 (Canada) | | 105,000 | 93,955 |
| Huntsman International, LLC sr. unsec. notes 4.50%, 5/1/29 | | 1,695,000 | 1,516,066 |
| International Flavors & Fragrances, Inc. sr. unsec. bonds 5.00%, 9/26/48 | | 380,000 | 273,399 |
| | | |
| CORPORATE BONDS AND NOTES (30.1%)* cont. | Principal
amount | Value |
| Basic materials cont. |
| International Flavors & Fragrances, Inc. sr. unsec. notes 4.45%, 9/26/28 | | $775,000 | $708,791 |
| International Flavors & Fragrances, Inc. 144A sr. unsec. notes 2.30%, 11/1/30 | | 334,000 | 248,040 |
| International Flavors & Fragrances, Inc. 144A sr. unsec. unsub. notes 1.23%, 10/1/25 | | 220,000 | 198,339 |
| International Paper Co. sr. unsec. bonds 5.00%, 9/15/35 | | 405,000 | 367,533 |
| Minsur SA sr. unsec. notes Ser. REGS, 4.50%, 10/28/31 (Peru) | | 510,000 | 413,738 |
| Nutrien, Ltd. sr. unsec. sub. bonds 4.20%, 4/1/29 (Canada) | | 1,231,000 | 1,129,546 |
| Resideo Funding, Inc. 144A company guaranty sr. unsec. unsub. notes 4.00%, 9/1/29 | | 120,000 | 96,300 |
| Sherwin-Williams Co. (The) sr. unsec. unsub. bonds 3.45%, 6/1/27 | | 401,000 | 371,417 |
| Westlake Corp. sr. unsec. bonds 2.875%, 8/15/41 | | 1,123,000 | 659,865 |
| Westlake Corp. sr. unsec. notes 0.875%, 8/15/24 | | 230,000 | 220,610 |
| Westlake Corp. sr. unsec. unsub. notes 3.60%, 8/15/26 | | 634,000 | 595,324 |
| WestRock Co. company guaranty sr. unsec. unsub. notes 3.75%, 3/15/25 | | 240,000 | 232,472 |
| WestRock MWV, LLC company guaranty sr. unsec. unsub. notes 8.20%, 1/15/30 | | 585,000 | 633,984 |
| Weyerhaeuser Co. sr. unsec. unsub. bonds 3.375%, 3/9/33 R | | 410,000 | 325,362 |
| WR Grace Holdings, LLC 144A sr. notes 7.375%, 3/1/31 | | 100,000 | 92,500 |
| | | 22,390,134 |
| Capital goods (1.9%) |
| Benteler International AG 144A company guaranty sr. notes 10.50%, 5/15/28 (Austria) | | 225,000 | 226,406 |
| Berry Global Escrow Corp. 144A sr. notes 4.875%, 7/15/26 | | 600,000 | 572,514 |
| Berry Global, Inc. 144A company guaranty sr. notes 1.65%, 1/15/27 | | 4,144,000 | 3,570,930 |
| Berry Global, Inc. 144A company guaranty sr. notes 1.57%, 1/15/26 | | 2,653,000 | 2,396,906 |
| Boeing Co. (The) sr. unsec. notes 3.625%, 2/1/31 | | 599,000 | 504,877 |
| Boeing Co. (The) sr. unsec. notes 2.196%, 2/4/26 | | 2,865,000 | 2,632,451 |
| Boeing Co. (The) sr. unsec. unsub. bonds 3.375%, 6/15/46 | | 1,005,000 | 606,328 |
| Boeing Co. (The) sr. unsec. unsub. notes 6.125%, 2/15/33 | | 1,840,000 | 1,810,962 |
| Caterpillar, Inc. sr. unsec. sub. notes 2.60%, 9/19/29 | | 583,000 | 502,669 |
DP World Salaam jr. unsec. sub. FRN 6.00%, 1/1/26
(United Arab Emirates) | | 310,000 | 302,250 |
| General Dynamics Corp. company guaranty sr. unsec. unsub. notes 2.25%, 6/1/31 | | 615,000 | 486,041 |
| GFL Environmental, Inc. 144A company guaranty sr. notes 3.50%, 9/1/28 (Canada) | | 115,000 | 98,467 |
| Howmet Aerospace, Inc. sr. unsec. unsub. bonds 5.95%, 2/1/37 | | 45,000 | 41,108 |
| Howmet Aerospace, Inc. sr. unsec. unsub. notes 3.00%, 1/15/29 | | 1,170,000 | 987,558 |
| L3Harris Technologies, Inc. sr. unsec. notes 3.85%, 12/15/26 | | 1,084,000 | 1,021,171 |
| Lockheed Martin Corp. sr. unsec. unsub. notes 3.90%, 6/15/32 | | 546,000 | 477,920 |
| Northrop Grumman Corp. sr. unsec. notes 2.93%, 1/15/25 | | 227,000 | 219,249 |
| Northrop Grumman Corp. sr. unsec. unsub. notes 3.25%, 1/15/28 | | 1,472,000 | 1,341,429 |
| Oshkosh Corp. sr. unsec. sub. notes 4.60%, 5/15/28 | | 2,776,000 | 2,630,587 |
| RTX Corp. sr. unsec. bonds 5.375%, 2/27/53 | | 475,000 | 402,643 |
| Republic Services, Inc. sr. unsec. notes 0.875%, 11/15/25 | | 492,000 | 446,423 |
| Ritchie Bros Holdings, Inc. 144A company guaranty sr. unsec. unsub. notes 7.75%, 3/15/31 | | 95,000 | 95,119 |
| | | |
| CORPORATE BONDS AND NOTES (30.1%)* cont. | Principal
amount | Value |
| Capital goods cont. |
| RTX Corp. sr. unsec. notes 5.15%, 2/27/33 | | $488,000 | $450,215 |
| Terex Corp. 144A company guaranty sr. unsec. notes 5.00%, 5/15/29 | | 110,000 | 96,288 |
| TransDigm, Inc. 144A sr. notes 6.875%, 12/15/30 | | 100,000 | 96,556 |
| Waste Connections, Inc. sr. unsec. bonds 4.20%, 1/15/33 | | 73,000 | 63,348 |
| Waste Connections, Inc. sr. unsec. bonds 3.20%, 6/1/32 | | 515,000 | 416,883 |
| Waste Connections, Inc. sr. unsec. notes 4.25%, 12/1/28 | | 181,000 | 169,504 |
| Waste Management, Inc. company guaranty sr. unsec. notes 4.875%, 2/15/29 | | 1,187,000 | 1,143,963 |
| Waste Management, Inc. company guaranty sr. unsec. notes 0.75%, 11/15/25 | | 72,000 | 65,596 |
| | | 23,876,361 |
| Communication services (2.4%) |
| American Tower Corp. sr. unsec. bonds 2.70%, 4/15/31 R | | 962,000 | 743,817 |
| American Tower Corp. sr. unsec. notes 2.90%, 1/15/30 R | | 1,505,000 | 1,227,330 |
| American Tower Corp. sr. unsec. sub. bonds 3.70%, 10/15/49 R | | 690,000 | 427,737 |
| American Tower Corp. sr. unsec. sub. notes 2.75%, 1/15/27 R | | 637,000 | 571,884 |
| AT&T, Inc. company guaranty sr. unsec. unsub. notes 2.30%, 6/1/27 | | 3,101,000 | 2,739,688 |
| AT&T, Inc. sr. unsec. unsub. bonds 4.50%, 3/9/48 | | 450,000 | 325,837 |
| AT&T, Inc. sr. unsec. unsub. bonds 4.35%, 3/1/29 | | 1,907,000 | 1,755,558 |
| AT&T, Inc. sr. unsec. unsub. bonds 2.55%, 12/1/33 | | 976,000 | 700,476 |
| AT&T, Inc. sr. unsec. unsub. notes 4.25%, 3/1/27 | | 1,581,000 | 1,500,385 |
| AT&T, Inc. sr. unsec. unsub. notes 1.65%, 2/1/28 | | 309,000 | 258,332 |
| Bell Canada (The) company guaranty sr. unsec. unsub. bonds 2.15%, 2/15/32 (Canada) | | 625,000 | 465,952 |
| CCO Holdings, LLC/CCO Holdings Capital Corp. 144A sr. unsec. unsub. notes 4.75%, 2/1/32 | | 285,000 | 222,460 |
| Charter Communications Operating, LLC/Charter Communications Operating Capital Corp. company guaranty sr. notes 5.05%, 3/30/29 | | 303,000 | 280,281 |
| Charter Communications Operating, LLC/Charter Communications Operating Capital Corp. company guaranty sr. sub. bonds 4.80%, 3/1/50 | | 309,000 | 203,690 |
| Charter Communications Operating, LLC/Charter Communications Operating Capital Corp. company guaranty sr. sub. notes 4.908%, 7/23/25 | | 678,000 | 662,934 |
| Comcast Corp. company guaranty sr. unsec. unsub. bonds 2.35%, 1/15/27 | | 568,000 | 513,452 |
| Crown Castle, Inc. sr. unsec. bonds 3.80%, 2/15/28 R | | 971,000 | 875,714 |
| Crown Castle, Inc. sr. unsec. bonds 3.65%, 9/1/27 R | | 1,055,000 | 959,091 |
| Crown Castle, Inc. sr. unsec. sub. bonds 3.30%, 7/1/30 R | | 1,119,000 | 919,831 |
| DIRECTV Holdings, LLC/DIRECTV Financing Co., Inc. 144A sr. notes 5.875%, 8/15/27 | | 73,000 | 63,965 |
| Equinix, Inc. sr. unsec. sub. notes 3.20%, 11/18/29 R | | 3,053,000 | 2,579,739 |
| Equinix, Inc. sr. unsec. sub. notes 1.00%, 9/15/25 R | | 270,000 | 245,858 |
| Rogers Communications, Inc. company guaranty sr. unsec. unsub. bonds 4.30%, 2/15/48 (Canada) | | 150,000 | 100,716 |
| Rogers Communications, Inc. company guaranty sr. unsec. unsub. notes 4.50%, 3/15/43 (Canada) | | 440,000 | 317,424 |
| | | |
| CORPORATE BONDS AND NOTES (30.1%)* cont. | Principal
amount | Value |
| Communication services cont. |
| Rogers Communications, Inc. company guaranty sr. unsec. unsub. notes Ser. REGS, 3.80%, 3/15/32 (Canada) | | $732,000 | $593,617 |
| SBA Communications Corp. sr. unsec. notes 3.125%, 2/1/29 R | | 120,000 | 99,216 |
| Sprint Capital Corp. company guaranty sr. unsec. unsub. notes 6.875%, 11/15/28 | | 2,207,000 | 2,263,447 |
| T-Mobile USA, Inc. company guaranty sr. notes 3.875%, 4/15/30 | | 44,000 | 38,311 |
| T-Mobile USA, Inc. company guaranty sr. notes 3.75%, 4/15/27 | | 4,348,000 | 4,043,490 |
| T-Mobile USA, Inc. company guaranty sr. unsec. bonds 5.75%, 1/15/54 | | 412,000 | 361,684 |
| T-Mobile USA, Inc. company guaranty sr. unsec. bonds 5.05%, 7/15/33 | | 1,320,000 | 1,188,426 |
| Telefonica Europe BV company guaranty sr. unsec. unsub. notes 8.25%, 9/15/30 (Spain) | | 435,000 | 472,977 |
| Time Warner Cable Enterprises, LLC company guaranty sr. unsub. notes 8.375%, 7/15/33 | | 1,955,000 | 2,039,655 |
| Verizon Communications, Inc. sr. unsec. unsub. notes 4.329%, 9/21/28 | | 567,000 | 527,921 |
| Verizon Communications, Inc. sr. unsec. unsub. notes 2.10%, 3/22/28 | | 381,000 | 324,992 |
| Vmed O2 UK Financing I PLC 144A sr. notes 4.75%, 7/15/31 (United Kingdom) | | 210,000 | 169,030 |
| | | 30,784,917 |
| Consumer cyclicals (2.4%) |
| Alimentation Couche-Tard, Inc. 144A company guaranty sr. unsec. notes 3.55%, 7/26/27 (Canada) | | 1,679,000 | 1,544,680 |
| Alimentation Couche-Tard, Inc. 144A sr. unsec. notes 2.95%, 1/25/30 (Canada) | | 1,260,000 | 1,042,958 |
| Amazon.com, Inc. sr. unsec. unsub. bonds 2.70%, 6/3/60 | | 407,000 | 218,273 |
| Amazon.com, Inc. sr. unsec. unsub. notes 2.10%, 5/12/31 | | 1,523,000 | 1,200,538 |
| American Builders & Contractors Supply Co., Inc. 144A sr. notes 4.00%, 1/15/28 | | 500,000 | 448,828 |
| Autonation, Inc. company guaranty sr. unsec. notes 4.50%, 10/1/25 | | 228,000 | 220,118 |
| Bath & Body Works, Inc. 144A company guaranty sr. unsec. unsub. bonds 6.625%, 10/1/30 | | 235,000 | 217,562 |
| Block, Inc. sr. unsec. notes 3.50%, 6/1/31 | | 1,785,000 | 1,377,582 |
| Booking Holdings, Inc. sr. unsec. sub. notes 4.625%, 4/13/30 | | 1,430,000 | 1,332,302 |
| Boyd Gaming Corp. 144A sr. unsec. bonds 4.75%, 6/15/31 | | 115,000 | 95,438 |
| Caesars Entertainment, Inc. 144A sr. notes 7.00%, 2/15/30 | | 100,000 | 96,509 |
| Carnival Corp. 144A notes 9.875%, 8/1/27 | | 100,000 | 104,230 |
| Dick’s Sporting Goods, Inc. sr. unsec. notes 3.15%, 1/15/32 | | 657,000 | 495,806 |
| Discovery Communications, LLC company guaranty sr. unsec. unsub. notes 4.90%, 3/11/26 | | 1,270,000 | 1,237,434 |
| Gartner, Inc. 144A company guaranty sr. unsec. bonds 3.75%, 10/1/30 | | 1,341,000 | 1,109,932 |
| Gartner, Inc. 144A company guaranty sr. unsec. notes 3.625%, 6/15/29 | | 255,000 | 215,337 |
| Global Payments, Inc. sr. unsec. notes 1.20%, 3/1/26 | | 290,000 | 258,565 |
| Hanesbrands, Inc. 144A company guaranty sr. unsec. unsub. notes 9.00%, perpetual maturity | | 100,000 | 93,000 |
| Hyatt Hotels Corp. sr. unsec. notes 5.75%, 4/23/30 | | 410,000 | 388,704 |
| Hyatt Hotels Corp. sr. unsec. notes 5.375%, 4/23/25 | | 1,007,000 | 994,046 |
| | | |
| CORPORATE BONDS AND NOTES (30.1%)* cont. | Principal
amount | Value |
| Consumer cyclicals cont. |
| iHeartCommunications, Inc. company guaranty sr. notes 6.375%, 5/1/26 | | $120,000 | $97,812 |
| IHO Verwaltungs, GmbH 144A sr. notes 6.375%, 5/15/29 (Germany) ‡‡ | | 250,000 | 217,651 |
| Interpublic Group of Cos., Inc. (The) sr. unsec. unsub. notes 2.40%, 3/1/31 | | 495,000 | 381,162 |
| JELD-WEN, Inc. 144A company guaranty sr. unsec. notes 4.875%, 12/15/27 | | 115,000 | 97,479 |
| Kontoor Brands, Inc. 144A company guaranty sr. unsec. notes 4.125%, 11/15/29 | | 120,000 | 98,700 |
| Las Vegas Sands Corp. sr. unsec. unsub. notes 3.90%, 8/8/29 | | 115,000 | 99,290 |
| Lennar Corp. company guaranty sr. unsec. unsub. notes 4.75%, 11/29/27 | | 2,769,000 | 2,634,497 |
| Levi Strauss & Co. 144A sr. unsec. sub. bonds 3.50%, 3/1/31 | | 285,000 | 221,891 |
| Light & Wonder International, Inc. 144A company guaranty sr. unsec. notes 7.25%, 11/15/29 | | 230,000 | 223,047 |
| Masonite International Corp. 144A company guaranty sr. unsec. notes 3.50%, 2/15/30 | | 120,000 | 95,019 |
| Mattamy Group Corp. 144A sr. unsec. notes 4.625%, 3/1/30 (Canada) | | 260,000 | 212,279 |
| Mattel, Inc. 144A company guaranty sr. unsec. notes 3.75%, 4/1/29 | | 182,000 | 155,690 |
| McGraw-Hill Education, Inc. 144A sr. notes 5.75%, 8/1/28 | | 120,000 | 101,136 |
| Moody’s Corp. sr. unsec. notes 3.25%, 1/15/28 | | 1,475,000 | 1,340,070 |
| Neptune Bidco US, Inc. 144A sr. notes 9.29%, 4/15/29 | | 110,000 | 97,080 |
| Netflix, Inc. sr. unsec. notes 5.875%, 2/15/25 | | 90,000 | 89,986 |
| Netflix, Inc. sr. unsec. unsub. notes 4.375%, 11/15/26 | | 1,627,000 | 1,564,936 |
| Netflix, Inc. 144A sr. unsec. bonds 5.375%, 11/15/29 | | 1,236,000 | 1,198,391 |
| News Corp. 144A sr. unsec. notes 3.875%, 5/15/29 | | 115,000 | 98,438 |
| Nexstar Media, Inc. 144A company guaranty sr. unsec. notes 4.75%, 11/1/28 | | 115,000 | 96,587 |
| O’Reilly Automotive, Inc. sr. unsec. notes 4.35%, 6/1/28 | | 530,000 | 500,496 |
| Paramount Global sr. unsec. notes 4.75%, 5/15/25 | | 115,000 | 112,351 |
| Paramount Global sr. unsec. unsub. notes 4.20%, 6/1/29 | | 223,000 | 188,770 |
| PetSmart, Inc./PetSmart Finance Corp. 144A company guaranty sr. notes 4.75%, 2/15/28 | | 275,000 | 243,342 |
| PulteGroup, Inc. company guaranty sr. unsec. notes 5.00%, 1/15/27 | | 495,000 | 481,043 |
| Royal Caribbean Cruises, Ltd. 144A company guaranty sr. unsec. unsub. notes 9.25%, 1/15/29 | | 95,000 | 99,165 |
| S&P Global, Inc. company guaranty sr. unsec. bonds 2.50%, 12/1/29 | | 1,993,000 | 1,667,484 |
| S&P Global, Inc. company guaranty sr. unsec. notes 2.45%, 3/1/27 | | 386,000 | 349,302 |
| S&P Global, Inc. company guaranty sr. unsec. notes 1.25%, 8/15/30 | | 439,000 | 326,408 |
| Sands China, Ltd. sr. unsec. notes 5.65%, 8/8/28 (Hong Kong) | | 550,000 | 508,783 |
| Sirius XM Radio, Inc. 144A company guaranty sr. unsec. notes 4.125%, 7/1/30 | | 125,000 | 99,252 |
| Spectrum Brands, Inc. 144A company guaranty sr. unsec. bonds 5.00%, 10/1/29 | | 115,000 | 103,165 |
| Standard Industries, Inc. 144A sr. unsec. notes 4.375%, 7/15/30 | | 120,000 | 98,043 |
| Stellantis Finance US, Inc. 144A company guaranty sr. unsec. notes 1.711%, 1/29/27 | | 422,000 | 366,220 |
| | | |
| CORPORATE BONDS AND NOTES (30.1%)* cont. | Principal
amount | Value |
| Consumer cyclicals cont. |
| Tapestry, Inc. sr. unsec. notes 4.125%, 7/15/27 | | $552,000 | $499,977 |
| Taylor Morrison Communities, Inc. 144A sr. unsec. bonds 5.125%, 8/1/30 | | 255,000 | 214,303 |
| TJX Cos., Inc. (The) sr. unsec. notes 3.875%, 4/15/30 | | 548,000 | 493,066 |
| Vulcan Materials Co. sr. unsec. unsub. bonds 4.70%, 3/1/48 | | 385,000 | 299,391 |
| Walt Disney Co. (The) company guaranty sr. unsec. notes 3.35%, 3/24/25 | | 604,000 | 585,081 |
| Warnermedia Holdings, Inc. company guaranty sr. unsec. notes 4.279%, 3/15/32 | | 2,070,000 | 1,716,269 |
| | | 30,764,894 |
| Consumer staples (1.3%) |
| 1011778 BC ULC/New Red Finance, Inc. 144A company guaranty sr. notes 3.50%, 2/15/29 (Canada) | | 115,000 | 98,322 |
| Albertsons Cos., Inc./Safeway, Inc./New Albertsons LP/Albertsons, LLC 144A company guaranty sr. unsec. notes 3.50%, 3/15/29 | | 120,000 | 102,312 |
| Aramark Services, Inc. 144A company guaranty sr. unsec. notes 5.00%, 2/1/28 | | 109,000 | 99,969 |
| Ashtead Capital, Inc. 144A company guaranty sr. unsec. bonds 5.95%, 10/15/33 | | 570,000 | 520,047 |
| Ashtead Capital, Inc. 144A company guaranty sr. unsec. notes 2.45%, 8/12/31 | | 505,000 | 372,444 |
| Ashtead Capital, Inc. 144A notes 4.375%, 8/15/27 | | 2,395,000 | 2,217,536 |
| Avis Budget Car Rental, LLC/Avis Budget Finance, Inc. 144A company guaranty sr. unsec. notes 4.75%, 4/1/28 | | 110,000 | 94,388 |
| ERAC USA Finance, LLC 144A company guaranty sr. unsec. notes 7.00%, 10/15/37 | | 331,000 | 344,295 |
| ERAC USA Finance, LLC 144A company guaranty sr. unsec. notes 5.625%, 3/15/42 | | 470,000 | 422,868 |
| ERAC USA Finance, LLC 144A company guaranty sr. unsec. notes 3.85%, 11/15/24 | | 815,000 | 797,308 |
| Haleon US Capital, LLC company guaranty sr. unsec. unsub. notes 3.375%, 3/24/27 | | 1,331,000 | 1,227,410 |
| Haleon US Capital, LLC sr. unsec. unsub. bonds 4.00%, 3/24/52 | | 670,000 | 470,567 |
| Herc Holdings, Inc. 144A company guaranty sr. unsec. notes 5.50%, 7/15/27 | | 105,000 | 98,698 |
| JBS USA LUX SA/JBS USA Food Co./JBS Luxembourg SARL 144A company guaranty sr. unsec. bonds 6.75%, 3/15/34 | | 1,605,000 | 1,504,013 |
| JBS USA LUX SA/JBS USA Food Co./JBS USA Finance, Inc. company guaranty sr. unsec. notes 5.75%, 4/1/33 | | 520,000 | 459,274 |
| JBS USA LUX SA/JBS USA Food Co./JBS USA Finance, Inc. company guaranty sr. unsec. notes 3.00%, 2/2/29 | | 1,240,000 | 1,020,911 |
| Kenvue, Inc. company guaranty sr. unsec. notes Ser. REGS, 4.90%, 3/22/33 | | 2,170,000 | 2,033,375 |
| Kenvue, Inc. company guaranty sr. unsec. unsub. notes Ser. REGS, 5.05%, 3/22/53 | | 393,000 | 337,664 |
| Kenvue, Inc. company guaranty sr. unsec. unsub. notes Ser. REGS, 5.05%, 3/22/28 | | 1,115,000 | 1,094,183 |
| Keurig Dr Pepper, Inc. company guaranty sr. unsec. notes 4.05%, 4/15/32 | | 565,000 | 486,028 |
| Keurig Dr Pepper, Inc. company guaranty sr. unsec. unsub. notes 4.417%, 5/25/25 | | 126,000 | 123,258 |
| | | |
| CORPORATE BONDS AND NOTES (30.1%)* cont. | Principal
amount | Value |
| Consumer staples cont. |
| Lamb Weston Holdings, Inc. 144A company guaranty sr. unsec. notes 4.375%, 1/31/32 | | $120,000 | $99,284 |
| Match Group Holdings II, LLC 144A sr. unsec. notes 4.125%, 8/1/30 | | 120,000 | 97,504 |
| McCormick & Co., Inc. sr. unsec. notes 1.85%, 2/15/31 | | 215,000 | 159,365 |
| McDonald’s Corp. sr. unsec. unsub. bonds Ser. MTN, 6.30%, 10/15/37 | | 770,000 | 778,183 |
| McDonald’s Corp. sr. unsec. unsub. bonds Ser. MTN, 3.625%, 9/1/49 | | 635,000 | 420,866 |
| Unilever Capital Corp. company guaranty sr. unsec. unsub. bonds 5.90%, 11/15/32 (Netherlands) | | 477,000 | 483,073 |
| US Foods, Inc. 144A company guaranty sr. unsec. notes 4.75%, 2/15/29 | | 110,000 | 97,037 |
| | | 16,060,182 |
| Energy (1.9%) |
| Antero Resources Corp. 144A sr. unsec. notes 5.375%, 3/1/30 | | 110,000 | 100,377 |
| Callon Petroleum Co. 144A company guaranty sr. unsec. notes 7.50%, 6/15/30 | | 105,000 | 101,699 |
| Centennial Resource Production, LLC 144A company guaranty sr. unsec. notes 6.875%, 4/1/27 | | 100,000 | 98,114 |
| Cheniere Energy Partners LP company guaranty sr. unsec. notes 4.50%, 10/1/29 | | 3,440,000 | 3,079,997 |
| Cheniere Energy Partners LP company guaranty sr. unsec. unsub. notes 4.00%, 3/1/31 | | 90,000 | 75,363 |
| Cheniere Energy Partners LP company guaranty sr. unsec. unsub. notes 3.25%, 1/31/32 | | 710,000 | 550,561 |
| Civitas Resources, Inc. 144A company guaranty sr. unsec. unsub. notes 8.75%, 7/1/31 | | 225,000 | 227,085 |
| Columbia Pipelines Operating Co., LLC 144A sr. unsec. bonds 6.544%, 11/15/53 | | 724,000 | 663,712 |
| Columbia Pipelines Operating Co., LLC 144A sr. unsec. notes 5.927%, 8/15/30 | | 1,145,000 | 1,105,444 |
| Diamondback Energy, Inc. company guaranty sr. unsec. notes 6.25%, 3/15/33 | | 2,045,000 | 2,018,475 |
| Diamondback Energy, Inc. company guaranty sr. unsec. notes 3.25%, 12/1/26 | | 1,366,000 | 1,273,221 |
| Endeavor Energy Resources LP/EER Finance, Inc. 144A sr. unsec. bonds 5.75%, 1/30/28 | | 101,000 | 96,888 |
| EnLink Midstream, LLC 144A company guaranty sr. unsec. unsub. notes 6.50%, 9/1/30 | | 105,000 | 100,786 |
| Hess Midstream Operations LP 144A company guaranty sr. unsec. notes 4.25%, 2/15/30 | | 115,000 | 98,403 |
| KazMunayGas National Co. JSC sr. unsec. notes Ser. REGS, 4.75%, 4/19/27 (Kazakhstan) | | 330,000 | 307,725 |
| Kinetik Holdings LP 144A company guaranty sr. unsec. notes 5.875%, 6/15/30 | | 722,000 | 662,471 |
| Occidental Petroleum Corp. sr. unsec. sub. bonds 6.20%, 3/15/40 | | 115,000 | 106,628 |
| Occidental Petroleum Corp. sr. unsec. sub. notes 8.50%, 7/15/27 | | 3,189,000 | 3,397,784 |
| Occidental Petroleum Corp. sr. unsec. sub. notes 7.50%, 5/1/31 | | 40,000 | 41,944 |
| Occidental Petroleum Corp. sr. unsec. sub. notes 6.45%, 9/15/36 | | 415,000 | 403,081 |
| ONEOK, Inc. company guaranty sr. unsec. notes 6.35%, 1/15/31 | | 390,000 | 384,693 |
| ONEOK, Inc. company guaranty sr. unsec. sub. bonds 6.05%, 9/1/33 | | 1,200,000 | 1,150,029 |
| | | |
| CORPORATE BONDS AND NOTES (30.1%)* cont. | Principal
amount | Value |
| Energy cont. |
| ONEOK, Inc. company guaranty sr. unsec. unsub. notes 6.10%, 11/15/32 | | $1,136,000 | $1,094,702 |
| Ovintiv, Inc. company guaranty sr. unsec. bonds 6.50%, 8/15/34 | | 490,000 | 468,750 |
| Ovintiv, Inc. company guaranty sr. unsec. bonds 6.25%, 7/15/33 | | 167,000 | 158,746 |
| Ovintiv, Inc. company guaranty sr. unsec. notes 5.65%, 5/15/28 | | 852,000 | 827,202 |
| Ovintiv, Inc. company guaranty sr. unsec. notes 5.65%, 5/15/25 | | 120,000 | 119,343 |
| Ovintiv, Inc. company guaranty sr. unsec. unsub. notes 8.125%, 9/15/30 | | 70,000 | 74,776 |
| Patterson-UTI Energy, Inc. sr. unsec. sub. notes 5.15%, 11/15/29 | | 555,000 | 496,306 |
| Petrobras Global Finance BV company guaranty sr. unsec. unsub. bonds 6.50%, 7/3/33 (Brazil) | | 386,000 | 359,428 |
| Petroleos Mexicanos company guaranty sr. unsec. notes Ser. REGS, 10.00%, 2/7/33 (Mexico) | | 50,000 | 44,213 |
| Petroleos Mexicanos company guaranty sr. unsec. unsub. FRB 5.95%, 1/28/31 (Mexico) | | 110,000 | 78,705 |
| Petroleos Mexicanos company guaranty sr. unsec. unsub. notes 6.70%, 2/16/32 (Mexico) | | 642,000 | 473,357 |
| Petroleos Mexicanos company guaranty sr. unsec. unsub. notes 6.49%, 1/23/27 (Mexico) | | 260,000 | 230,262 |
| Rockcliff Energy II, LLC 144A sr. unsec. notes 5.50%, 10/15/29 | | 110,000 | 99,284 |
| SM Energy Co. sr. unsec. unsub. notes 6.50%, 7/15/28 | | 105,000 | 101,085 |
| Southwestern Energy Co. company guaranty sr. unsec. notes 5.375%, 2/1/29 | | 110,000 | 101,616 |
| Targa Resources Partners LP/Targa Resources Partners Finance Corp. company guaranty sr. unsec. unsub. notes 4.875%, 2/1/31 | | 2,571,000 | 2,266,421 |
| Venture Global LNG, Inc. 144A sr. notes 8.375%, 6/1/31 | | 230,000 | 219,479 |
| | | 23,258,155 |
| Financials (10.7%) |
| AerCap Ireland Capital DAC/AerCap Global Aviation Trust company guaranty sr. unsec. bonds 3.40%, 10/29/33 (Ireland) | | 495,000 | 370,161 |
| AerCap Ireland Capital DAC/AerCap Global Aviation Trust company guaranty sr. unsec. bonds 3.30%, 1/30/32 (Ireland) | | 1,881,000 | 1,456,249 |
| Air Lease Corp. sr. unsec. sub. bonds 4.625%, 10/1/28 | | 1,245,000 | 1,142,264 |
| Air Lease Corp. sr. unsec. sub. notes 3.25%, 10/1/29 | | 976,000 | 821,564 |
| Air Lease Corp. sr. unsec. unsub. notes 4.25%, 9/15/24 | | 155,000 | 152,312 |
| Ally Financial, Inc. company guaranty sr. unsec. notes 8.00%, 11/1/31 | | 1,027,000 | 1,002,396 |
| Ally Financial, Inc. sr. unsec. notes 4.75%, 6/9/27 | | 386,000 | 349,496 |
| American Express Co. sr. unsec. unsub. notes 3.375%, 5/3/24 | | 694,000 | 685,436 |
| American International Group, Inc. sr. unsec. sub. notes 2.50%, 6/30/25 | | 415,000 | 391,662 |
| Aon PLC company guaranty sr. unsec. unsub. notes 4.25%, 12/12/42 | | 1,034,000 | 728,639 |
| Ares Capital Corp. sr. unsec. sub. notes 7.00%, 1/15/27 | | 220,000 | 219,194 |
| Ares Capital Corp. sr. unsec. sub. notes 3.875%, 1/15/26 | | 6,952,000 | 6,501,516 |
| Athene Global Funding 144A notes 2.55%, 11/19/30 | | 495,000 | 372,816 |
| Athene Global Funding 144A notes 1.73%, 10/2/26 | | 1,043,000 | 906,308 |
| Australia and New Zealand Banking Group, Ltd. 144A unsec. sub. FRB 2.57%, 11/25/35 (Australia) | | 1,345,000 | 971,002 |
| | | |
| CORPORATE BONDS AND NOTES (30.1%)* cont. | Principal
amount | Value |
| Financials cont. |
| Australia and New Zealand Banking Group, Ltd. 144A unsec. sub. notes 4.40%, 5/19/26 (Australia) | | $482,000 | $458,723 |
| Banco Santander SA unsec. sub. notes 5.179%, 11/19/25 (Spain) | | 5,600,000 | 5,405,838 |
| Bank of America Corp. sr. unsec. FRN Ser. MTN, 2.496%, 2/13/31 | | 1,673,000 | 1,318,657 |
| Bank of America Corp. unsec. sub. FRB 3.846%, 3/8/37 | | 2,800,000 | 2,208,886 |
| Bank of America Corp. unsec. sub. notes Ser. L, 4.183%, 11/25/27 | | 9,134,000 | 8,401,708 |
| Bank of America Corp. unsec. sub. notes Ser. MTN, 4.00%, 1/22/25 | | 862,000 | 838,938 |
| Bank of Montreal sr. unsec. unsub. notes Ser. MTN, 1.85%, 5/1/25 (Canada) | | 747,000 | 702,038 |
| Bank of Nova Scotia (The) sr. unsec. notes 1.30%, 6/11/25 (Canada) | | 1,022,000 | 947,841 |
| BNP Paribas SA 144A jr. unsec. sub. FRN 4.625%, perpetual maturity (France) | | 565,000 | 391,812 |
| BNP Paribas SA 144A unsec. sub. notes 4.375%, 5/12/26 (France) | | 636,000 | 604,259 |
| BPCE SA 144A unsec. sub. FRB 3.648%, 1/14/37 (France) | | 577,000 | 430,559 |
| BPCE SA 144A unsec. sub. notes 4.50%, 3/15/25 (France) | | 3,886,000 | 3,748,713 |
| Capital One Financial Corp. sr. unsec. unsub. FRN 7.624%, 10/30/31 | | 1,340,000 | 1,339,350 |
| Capital One Financial Corp. unsec. sub. FRB 2.359%, 7/29/32 | | 810,000 | 534,308 |
| Capital One Financial Corp. unsec. sub. notes 4.20%, 10/29/25 | | 885,000 | 839,204 |
| Citigroup, Inc. jr. unsec. sub. FRN 3.875%, perpetual maturity | | 1,608,000 | 1,348,172 |
| Citigroup, Inc. unsec. sub. bonds 4.75%, 5/18/46 | | 487,000 | 363,659 |
| Citigroup, Inc. unsec. sub. bonds 4.45%, 9/29/27 | | 6,259,000 | 5,781,698 |
| CNO Financial Group, Inc. sr. unsec. unsub. notes 5.25%, 5/30/25 | | 364,000 | 355,471 |
| Commonwealth Bank of Australia 144A unsec. sub. notes 4.50%, 12/9/25 (Australia) | | 401,000 | 387,147 |
| Commonwealth Bank of Australia 144A unsec. sub. notes 2.688%, 3/11/31 (Australia) | | 700,000 | 519,311 |
| Corebridge Financial, Inc. sr. unsec. notes 3.85%, 4/5/29 | | 1,433,000 | 1,266,445 |
| Danske Bank A/S 144A sr. unsec. FRN 3.244%, 12/20/25 (Denmark) | | 401,000 | 384,497 |
| Deutsche Bank AG unsec. sub. FRB 4.875%, 12/1/32 (Germany) | | 470,000 | 395,753 |
| Deutsche Bank AG unsec. sub. notes 4.50%, 4/1/25 (Germany) | | 3,176,000 | 3,036,221 |
| Deutsche Bank AG/New York, NY sr. unsec. unsub. FRN 2.311%, 11/16/27 (Germany) | | 345,000 | 298,401 |
| Deutsche Bank AG/New York, NY sr. unsec. unsub. FRN 2.129%, 11/24/26 (Germany) | | 904,000 | 816,278 |
| Discover Bank unsec. sub. FRN Ser. BKNT, 5.974%, 8/9/28 | | 490,000 | 441,000 |
| EPR Properties company guaranty sr. unsec. unsub. notes 4.50%, 6/1/27 R | | 485,000 | 428,057 |
| EPR Properties sr. unsec. notes 3.60%, 11/15/31 R | | 630,000 | 453,479 |
| Fairfax Financial Holdings, Ltd. sr. unsec. notes 4.85%, 4/17/28 (Canada) | | 2,898,000 | 2,734,765 |
| Fairfax US, Inc. 144A company guaranty sr. unsec. notes 4.875%, 8/13/24 | | 310,000 | 306,172 |
| Fidelity National Financial, Inc. sr. unsec. bonds 3.20%, 9/17/51 | | 811,000 | 422,573 |
| Fifth Third Bancorp sr. unsec. sub. notes 2.375%, 1/28/25 | | 624,000 | 592,697 |
| Fifth Third Bancorp sr. unsec. unsub. FRN 6.339%, 7/27/29 | | 685,000 | 663,489 |
| First-Citizens Bank & Trust Co. unsec. sub. notes 6.125%, 3/9/28 | | 3,271,000 | 3,171,603 |
| Five Corners Funding Trust 144A sr. unsec. bonds 4.419%, 11/15/23 | | 280,000 | 279,828 |
| General Motors Financial Co., Inc. sr. unsec. notes 6.40%, 1/9/33 | | 1,106,000 | 1,059,627 |
| General Motors Financial Co., Inc. sr. unsec. sub. notes 2.75%, 6/20/25 | | 893,000 | 842,716 |
| | | |
| CORPORATE BONDS AND NOTES (30.1%)* cont. | Principal
amount | Value |
| Financials cont. |
| GLP Capital LP/GLP Financing II, Inc. company guaranty sr. unsec. notes 4.00%, 1/15/31 R | | $475,000 | $386,313 |
| GLP Capital LP/GLP Financing II, Inc. company guaranty sr. unsec. unsub. notes 5.375%, 4/15/26 | | 1,779,000 | 1,704,997 |
| Goldman Sachs Group, Inc. (The) jr. unsec. sub. FRN 3.65%, 7/28/51 | | 441,000 | 341,754 |
| Goldman Sachs Group, Inc. (The) sr. unsec. notes 3.50%, 4/1/25 | | 1,700,000 | 1,636,140 |
| Goldman Sachs Group, Inc. (The) sr. unsec. unsub. notes 2.60%, 2/7/30 | | 632,000 | 507,419 |
| ING Groep NV sr. unsec. unsub. FRN 6.083%, 9/11/27 (Netherlands) | | 2,025,000 | 2,005,678 |
| Intercontinental Exchange, Inc. company guaranty sr. unsec. unsub. notes 3.75%, 12/1/25 | | 260,000 | 249,527 |
| Intercontinental Exchange, Inc. sr. unsec. bonds 2.65%, 9/15/40 | | 1,113,000 | 697,001 |
| Intercontinental Exchange, Inc. sr. unsec. bonds 1.85%, 9/15/32 | | 504,000 | 356,752 |
| Intercontinental Exchange, Inc. sr. unsec. notes 4.35%, 6/15/29 | | 1,615,000 | 1,489,025 |
| Intesa Sanpaolo SpA 144A unsec. sub. bonds 4.198%, 6/1/32 (Italy) | | 1,920,000 | 1,364,723 |
| JPMorgan Chase & Co. jr. unsec. sub. FRB Ser. W, (CME Term SOFR 3 Month + 1.26%), 6.626%, 5/15/47 | | 933,000 | 791,888 |
| JPMorgan Chase & Co. sr. unsec. unsub. FRB 3.964%, 11/15/48 | | 817,000 | 571,134 |
| JPMorgan Chase & Co. sr. unsec. unsub. FRN 4.323%, 4/26/28 | | 5,187,000 | 4,872,365 |
| JPMorgan Chase & Co. sr. unsec. unsub. FRN 2.083%, 4/22/26 | | 1,440,000 | 1,353,348 |
| JPMorgan Chase & Co. unsec. sub. FRB 2.956%, 5/13/31 | | 2,595,000 | 2,092,562 |
| KKR Group Finance Co. VI, LLC 144A company guaranty sr. unsec. bonds 3.75%, 7/1/29 | | 1,413,000 | 1,230,726 |
| Lloyds Banking Group PLC jr. unsec. sub. FRB 7.50%, perpetual maturity (United Kingdom) | | 730,000 | 711,437 |
| Lloyds Banking Group PLC unsec. sub. FRB 3.369%, 12/14/46 (United Kingdom) | | 2,172,000 | 1,258,589 |
| Marsh & McLennan Cos., Inc. sr. unsec. sub. notes 3.875%, 3/15/24 | | 525,000 | 520,985 |
| MassMutual Global Funding II 144A sr. notes 2.75%, 6/22/24 | | 401,000 | 393,146 |
| Metropolitan Life Global Funding I 144A sr. notes 2.95%, 4/9/30 | | 1,742,000 | 1,437,413 |
| Metropolitan Life Insurance Co. 144A unsec. sub. notes 7.80%, 11/1/25 | | 2,131,000 | 2,189,486 |
| Mitsubishi UFJ Financial Group, Inc. sr. unsec. unsub. notes 3.85%, 3/1/26 (Japan) | | 747,000 | 711,761 |
| Morgan Stanley unsec. sub. notes Ser. GMTN, 4.35%, 9/8/26 | | 7,865,000 | 7,441,112 |
| MPT Operating Partnership LP/MPT Finance Corp. company guaranty sr. unsec. bonds 3.50%, 3/15/31 | | 495,000 | 300,095 |
| Nasdaq, Inc. sr. unsec. bonds 5.95%, 8/15/53 | | 50,000 | 44,608 |
| Nasdaq, Inc. sr. unsec. sub. bonds 5.55%, 2/15/34 | | 45,000 | 41,742 |
| NatWest Group PLC unsec. sub. notes 6.00%, 12/19/23 (United Kingdom) | | 723,000 | 722,447 |
| PNC Financial Services Group, Inc. (The) unsec. sub. FRB 4.626%, 6/6/33 | | 3,705,000 | 3,091,115 |
| Principal Life Global Funding II 144A company guaranty sr. unsub. notes 3.00%, 4/18/26 | | 535,000 | 496,408 |
| Royal Bank of Canada unsec. sub. notes Ser. GMTN, 4.65%, 1/27/26 (Canada) | | 932,000 | 903,566 |
| SITE Centers Corp. sr. unsec. unsub. notes 4.70%, 6/1/27 | | 455,000 | 418,984 |
| Societe Generale SA 144A jr. unsec. sub. notes 5.375%, perpetual maturity (France) | | 1,682,000 | 1,206,341 |
| | | |
| CORPORATE BONDS AND NOTES (30.1%)* cont. | Principal
amount | Value |
| Financials cont. |
| Societe Generale SA 144A unsec. sub. notes 4.25%, 4/14/25 (France) | | $403,000 | $386,033 |
| Toronto-Dominion Bank (The) jr. sub. unsec. FRB 8.125%, 10/31/82 (Canada) | | 1,085,000 | 1,064,452 |
| Toronto-Dominion Bank (The) sr. unsec. unsub. notes Ser. MTN, 1.15%, 6/12/25 (Canada) | | 947,000 | 877,548 |
| UBS Group AG 144A sr. unsec. FRB 6.537%, 8/12/33 (Switzerland) | | 1,520,000 | 1,460,646 |
| UBS Group AG 144A sr. unsec. FRB 9.016%, 11/15/33 (Switzerland) | | 430,000 | 481,693 |
| UBS Group AG 144A sr. unsec. FRN 2.193%, 6/5/26 (Switzerland) | | 7,413,000 | 6,900,720 |
| UBS Group AG 144A sr. unsec. unsub. FRN 1.305%, 2/2/27 (Switzerland) | | 617,000 | 546,197 |
| US Bancorp unsec. sub. FRB 2.491%, 11/3/36 | | 926,000 | 632,735 |
| VICI Properties LP sr. unsec. unsub. bonds 5.625%, 5/15/52 R | | 550,000 | 430,518 |
| VICI Properties LP sr. unsec. unsub. notes 4.75%, 2/15/28 R | | 1,587,000 | 1,461,468 |
| VICI Properties LP/VICI Note Co., Inc. 144A company guaranty sr. unsec. notes 3.75%, 2/15/27 R | | 940,000 | 845,835 |
| Wells Fargo & Co. jr. unsec. sub. FRN 3.90%, perpetual maturity | | 655,000 | 567,335 |
| Wells Fargo & Co. sr. unsec. unsub. FRN Ser. MTN, 5.574%, 7/25/29 | | 445,000 | 429,106 |
| Wells Fargo & Co. sr. unsec. unsub. FRN Ser. MTN, 3.584%, 5/22/28 | | 2,689,000 | 2,447,631 |
| Westpac Banking Corp. sr. unsec. unsub. notes 3.35%, 3/8/27 (Australia) | | 714,000 | 662,140 |
| Westpac Banking Corp. unsec. sub. bonds 4.421%, 7/24/39 (Australia) | | 592,000 | 432,710 |
| Westpac Banking Corp. unsec. sub. bonds 2.963%, 11/16/40 (Australia) | | 727,000 | 424,294 |
| | | 134,182,556 |
| Health care (2.1%) |
| AbbVie, Inc. sr. unsec. sub. notes 3.80%, 3/15/25 | | 804,000 | 782,645 |
| Amgen, Inc. sr. unsec. sub. notes 3.20%, 11/2/27 | | 509,000 | 464,505 |
| Amgen, Inc. sr. unsec. unsub. bonds 5.65%, 3/2/53 | | 862,000 | 758,308 |
| Amgen, Inc. sr. unsec. unsub. notes 5.25%, 3/2/30 | | 1,709,000 | 1,639,117 |
| Becton, Dickinson and Co. sr. unsec. notes 3.70%, 6/6/27 | | 1,584,000 | 1,473,900 |
| Biogen, Inc. sr. unsec. sub. notes 2.25%, 5/1/30 | | 560,000 | 439,808 |
| Bristol-Myers Squibb Co. sr. unsec. sub. notes 0.75%, 11/13/25 | | 64,000 | 58,366 |
| Charles River Laboratories International, Inc. 144A company guaranty sr. unsec. notes 4.00%, 3/15/31 | | 120,000 | 98,100 |
| CVS Health Corp. sr. unsec. notes 1.30%, 8/21/27 | | 169,000 | 142,546 |
| CVS Health Corp. sr. unsec. unsub. notes 4.30%, 3/25/28 | | 445,000 | 416,915 |
| CVS Health Corp. sr. unsec. unsub. notes 3.875%, 7/20/25 | | 849,000 | 821,297 |
| DH Europe Finance II SARL company guaranty sr. unsec. notes 2.60%, 11/15/29 (Luxembourg) | | 2,468,000 | 2,090,630 |
| Elanco Animal Health, Inc. sr. unsec. notes Ser. WI, 6.65%, 8/28/28 | | 100,000 | 95,500 |
| Eli Lilly and Co. sr. unsec. unsub. bonds 4.875%, 2/27/53 | | 277,000 | 240,069 |
| GE Healthcare Holding, LLC company guaranty sr. unsec. notes 5.65%, 11/15/27 | | 1,675,000 | 1,657,820 |
| HCA, Inc. company guaranty sr. bonds 5.25%, 6/15/26 | | 603,000 | 588,744 |
| HCA, Inc. company guaranty sr. notes 4.50%, 2/15/27 | | 306,000 | 289,416 |
| HCA, Inc. company guaranty sr. unsec. sub. notes 3.625%, 3/15/32 | | 422,000 | 338,979 |
| Humana, Inc. sr. unsec. unsub. bonds 5.50%, 3/15/53 | | 463,000 | 396,758 |
| Humana, Inc. sr. unsec. unsub. bonds 2.15%, 2/3/32 | | 515,000 | 380,356 |
| | | |
| CORPORATE BONDS AND NOTES (30.1%)* cont. | Principal
amount | Value |
| Health care cont. |
| Humana, Inc. sr. unsec. unsub. notes 5.75%, 3/1/28 | | $2,016,000 | $2,008,222 |
| Mozart Debt Merger Sub, Inc. 144A sr. notes 3.875%, 4/1/29 | | 115,000 | 97,102 |
| Organon Finance 1, LLC 144A sr. notes 4.125%, 4/30/28 | | 210,000 | 181,390 |
| Pfizer Investment Enterprises PTE, Ltd. company guaranty sr. unsec. notes 5.30%, 5/19/53 (Singapore) | | 1,072,000 | 937,837 |
| Pfizer Investment Enterprises PTE, Ltd. company guaranty sr. unsec. notes 4.75%, 5/19/33 (Singapore) | | 767,000 | 704,875 |
| Pfizer Investment Enterprises PTE, Ltd. company guaranty sr. unsec. notes 4.45%, 5/19/28 (Singapore) | | 3,568,000 | 3,410,337 |
| Service Corp. International sr. unsec. sub. notes 4.00%, 5/15/31 | | 120,000 | 97,129 |
| Tenet Healthcare Corp. 144A company guaranty sr. notes 6.75%, 5/15/31 | | 235,000 | 223,164 |
| Teva Pharmaceutical Finance Netherlands III BV company guaranty sr. unsec. unsub. notes 8.125%, 9/15/31 (Israel) | | 220,000 | 216,700 |
| Teva Pharmaceutical Finance Netherlands III BV company guaranty sr. unsec. unsub. notes 5.125%, 5/9/29 (Israel) | | 200,000 | 174,500 |
| UnitedHealth Group, Inc. sr. unsec. unsub. notes 0.55%, 5/15/24 | | 842,000 | 819,785 |
| Universal Health Services, Inc. company guaranty sr. notes 2.65%, 10/15/30 | | 495,000 | 378,410 |
| Wyeth, LLC company guaranty sr. unsec. bonds 5.95%, 4/1/37 | | 295,000 | 290,900 |
| Zoetis, Inc. sr. unsec. notes 3.90%, 8/20/28 | | 1,868,000 | 1,736,503 |
| Zoetis, Inc. sr. unsec. sub. notes 2.00%, 5/15/30 | | 1,671,000 | 1,316,084 |
| | | 25,766,717 |
| Technology (2.6%) |
| Alphabet, Inc. sr. unsec. bonds 2.25%, 8/15/60 | | 1,236,000 | 624,993 |
| Analog Devices, Inc. sr. unsec. notes 2.95%, 4/1/25 | | 240,000 | 231,107 |
| Apple, Inc. sr. unsec. bonds 3.95%, 8/8/52 | | 820,000 | 607,935 |
| Apple, Inc. sr. unsec. notes 4.30%, 5/10/33 | | 667,000 | 616,781 |
| Apple, Inc. sr. unsec. notes 3.00%, 11/13/27 | | 1,216,000 | 1,118,002 |
| Broadcom Corp./Broadcom Cayman Finance, Ltd. company guaranty sr. unsec. unsub. notes 3.875%, 1/15/27 | | 3,435,000 | 3,210,568 |
| Broadcom, Inc. company guaranty sr. unsec. bonds 4.15%, 11/15/30 | | 808,000 | 703,318 |
| Broadcom, Inc. company guaranty sr. unsec. sub. notes 5.00%, 4/15/30 | | 1,379,000 | 1,288,733 |
| Broadcom, Inc. 144A sr. unsec. bonds 4.926%, 5/15/37 | | 2,768,000 | 2,306,915 |
| CrowdStrike Holdings, Inc. company guaranty sr. unsec. notes 3.00%, 2/15/29 | | 120,000 | 100,304 |
| Fidelity National Information Services, Inc. sr. unsec. bonds 3.10%, 3/1/41 | | 382,000 | 241,021 |
| Fidelity National Information Services, Inc. sr. unsec. notes 2.25%, 3/1/31 | | 236,000 | 179,859 |
| Fidelity National Information Services, Inc. sr. unsec. unsub. notes 5.10%, 7/15/32 | | 396,000 | 365,369 |
| Imola Merger Corp. 144A sr. notes 4.75%, 5/15/29 | | 115,000 | 100,256 |
| Marvell Technology, Inc. sr. unsec. notes 5.95%, 9/15/33 | | 1,609,000 | 1,528,239 |
| Marvell Technology, Inc. sr. unsec. notes 5.75%, 2/15/29 | | 1,611,000 | 1,566,132 |
| Meta Platforms, Inc. sr. unsec. bonds 5.60%, 5/15/53 | | 1,395,000 | 1,261,662 |
| Meta Platforms, Inc. sr. unsec. notes 4.95%, 5/15/33 | | 853,000 | 799,630 |
| Meta Platforms, Inc. sr. unsec. unsub. bonds 4.45%, 8/15/52 | | 1,647,000 | 1,245,230 |
| | | |
| CORPORATE BONDS AND NOTES (30.1%)* cont. | Principal
amount | Value |
| Technology cont. |
| Meta Platforms, Inc. sr. unsec. unsub. notes 3.50%, 8/15/27 | | $1,417,000 | $1,332,220 |
| Microsoft Corp. sr. unsec. unsub. bonds 2.921%, 3/17/52 | | 970,000 | 598,790 |
| Microsoft Corp. sr. unsec. unsub. bonds 3.45%, 8/8/36 | | 198,000 | 161,459 |
| MSCI, Inc. 144A company guaranty sr. unsec. notes 3.625%, 9/1/30 | | 3,358,000 | 2,778,680 |
| MSCI, Inc. 144A company guaranty sr. unsec. sub. notes 3.875%, 2/15/31 | | 580,000 | 478,730 |
| NCR Corp. 144A company guaranty sr. unsec. sub. notes 5.125%, 4/15/29 | | 115,000 | 98,890 |
| Oracle Corp. sr. unsec. bonds 3.95%, 3/25/51 | | 416,000 | 270,042 |
| Oracle Corp. sr. unsec. bonds 3.65%, 3/25/41 | | 1,648,000 | 1,122,229 |
| Oracle Corp. sr. unsec. notes 2.95%, 4/1/30 | | 651,000 | 539,552 |
| Oracle Corp. sr. unsec. notes 2.875%, 3/25/31 | | 500,000 | 400,780 |
| Oracle Corp. sr. unsec. notes 2.50%, 4/1/25 | | 209,000 | 199,374 |
| Oracle Corp. sr. unsec. notes 2.30%, 3/25/28 | | 2,833,000 | 2,432,560 |
| Oracle Corp. sr. unsec. notes 1.65%, 3/25/26 | | 341,000 | 309,283 |
| Oracle Corp. sr. unsec. unsub. bonds 4.00%, 11/15/47 | | 62,000 | 41,220 |
| salesforce.com, Inc. sr. unsec. bonds 3.05%, 7/15/61 | | 1,230,000 | 685,058 |
| salesforce.com, Inc. sr. unsec. bonds 2.90%, 7/15/51 | | 1,126,000 | 662,234 |
| salesforce.com, Inc. sr. unsec. notes 0.625%, 7/15/24 | | 501,000 | 483,519 |
| Sensata Technologies, Inc. 144A company guaranty sr. unsec. notes 3.75%, 2/15/31 | | 1,494,000 | 1,195,718 |
| ServiceNow, Inc. sr. unsec. notes 1.40%, 9/1/30 | | 520,000 | 391,974 |
| Twilio, Inc. company guaranty sr. unsec. notes 3.625%, 3/15/29 | | 120,000 | 99,762 |
| VMware, Inc. sr. unsec. notes 1.40%, 8/15/26 | | 472,000 | 415,771 |
| | | 32,793,899 |
| Transportation (0.1%) |
| Penske Truck Leasing Co. LP/PTL Finance Corp. 144A sr. unsec. notes 4.40%, 7/1/27 | | 1,740,000 | 1,619,199 |
| Penske Truck Leasing Co. LP/PTL Finance Corp. 144A sr. unsec. notes 3.95%, 3/10/25 | | 200,000 | 193,651 |
| | | 1,812,850 |
| Utilities and power (2.9%) |
| AES Corp. (The) sr. unsec. notes 1.375%, 1/15/26 | | 238,000 | 211,532 |
| AES Corp. (The) sr. unsec. unsub. notes 2.45%, 1/15/31 | | 1,059,000 | 795,757 |
| Alexander Funding Trust II 144A sr. notes 7.467%, 7/31/28 | | 898,000 | 891,547 |
| American Electric Power Co., Inc. sr. unsec. unsub. bonds 5.625%, 3/1/33 | | 722,000 | 675,376 |
| American Electric Power Co., Inc. sr. unsec. unsub. notes 1.00%, 11/1/25 | | 521,000 | 472,771 |
| American Transmission Systems, Inc. 144A sr. unsec. bonds 2.65%, 1/15/32 | | 542,000 | 417,171 |
| Berkshire Hathaway Energy Co. sr. unsec. notes 4.05%, 4/15/25 | | 423,000 | 413,155 |
| Constellation Energy Generation, LLC sr. unsec. bonds 6.50%, 10/1/53 | | 989,000 | 928,911 |
| Constellation Energy Generation, LLC sr. unsec. bonds 6.125%, 1/15/34 | | 406,000 | 392,447 |
| Duke Energy Ohio, Inc. sr. bonds 3.65%, 2/1/29 | | 1,818,000 | 1,641,218 |
| Electricite De France SA 144A jr. unsec. sub. FRB 9.125%, perpetual maturity (France) | | 210,000 | 214,463 |
| | | |
| CORPORATE BONDS AND NOTES (30.1%)* cont. | Principal
amount | Value |
| Utilities and power cont. |
| Enbridge, Inc. company guaranty sr. unsec. notes 1.60%, 10/4/26 (Canada) | | $462,000 | $410,169 |
| Energy Transfer LP company guaranty sr. unsec. notes 2.90%, 5/15/25 | | 372,000 | 354,366 |
| Energy Transfer LP jr. unsec. sub. FRN 6.625%, perpetual maturity | | 2,011,000 | 1,553,498 |
| Energy Transfer LP sr. unsec. unsub. notes 5.75%, 2/15/33 | | 490,000 | 459,350 |
| Enterprise Products Operating, LLC company guaranty sr. unsec. notes 2.80%, 1/31/30 | | 1,450,000 | 1,211,211 |
| Enterprise Products Operating, LLC company guaranty sr. unsec. unsub. notes 3.95%, 2/15/27 | | 495,000 | 468,378 |
| Eversource Energy sr. unsec. unsub. notes 5.45%, 3/1/28 | | 1,228,000 | 1,198,797 |
| Eversource Energy sr. unsec. unsub. notes 5.125%, 5/15/33 | | 1,717,000 | 1,551,959 |
| Georgia Power Co. sr. unsec. unsub. notes 4.95%, 5/17/33 | | 1,041,000 | 950,184 |
| Georgia Power Co. sr. unsec. unsub. notes 4.70%, 5/15/32 | | 505,000 | 457,198 |
| IPALCO Enterprises, Inc. sr. notes 4.25%, 5/1/30 | | 1,892,000 | 1,629,306 |
| Kinder Morgan, Inc. company guaranty sr. unsec. notes Ser. GMTN, 7.75%, 1/15/32 | | 2,471,000 | 2,622,595 |
| NextEra Energy Capital Holdings, Inc. company guaranty sr. unsec. unsub. notes 6.051%, 3/1/25 | | 1,184,000 | 1,183,322 |
| NRG Energy, Inc. 144A company guaranty sr. notes 3.75%, 6/15/24 | | 1,580,000 | 1,550,888 |
| NRG Energy, Inc. 144A company guaranty sr. unsec. bonds 3.875%, 2/15/32 | | 130,000 | 96,611 |
| Oncor Electric Delivery Co., LLC 144A sr. bonds 4.95%, 9/15/52 | | 2,070,000 | 1,699,823 |
| Pacific Gas and Electric Co. sr. bonds 5.90%, 6/15/32 | | 1,405,000 | 1,281,466 |
| Pacific Gas and Electric Co. sr. bonds 4.95%, 7/1/50 | | 688,000 | 480,244 |
| Pacific Gas and Electric Co. sr. notes 6.10%, 1/15/29 | | 1,938,000 | 1,864,629 |
| PG&E Corp. sr. sub. notes 5.25%, 7/1/30 | | 115,000 | 100,729 |
| Puget Sound Energy, Inc. sr. bonds 5.448%, 6/1/53 | | 862,000 | 746,267 |
| Sempra sr. unsec. unsub. notes 3.25%, 6/15/27 | | 1,350,000 | 1,223,112 |
| Sempra Energy sr. unsec. unsub. bonds 5.50%, 8/1/33 | | 1,214,000 | 1,128,999 |
| Southern Co. (The) sr. unsec. bonds 5.70%, 3/15/34 | | 255,000 | 242,582 |
| Southern Co. (The) sr. unsec. unsub. notes 3.25%, 7/1/26 | | 1,321,000 | 1,234,747 |
| Vistra Operations Co., LLC 144A company guaranty sr. notes 4.30%, 7/15/29 | | 1,147,000 | 998,061 |
| Vistra Operations Co., LLC 144A company guaranty sr. notes 3.55%, 7/15/24 | | 820,000 | 799,894 |
| Vistra Operations Co., LLC 144A company guaranty sr. unsec. unsub. notes 4.375%, 5/1/29 | | 115,000 | 97,680 |
| Vistra Operations Co., LLC 144A sr. bonds 6.95%, 10/15/33 | | 1,305,000 | 1,242,995 |
| Xcel Energy, Inc. sr. unsec. bonds 5.45%, 8/15/33 | | 1,110,000 | 1,034,236 |
| | | 36,927,644 |
| Total corporate bonds and notes (cost $420,269,562) | $378,618,309 |
|
| | | |
| COLLATERALIZED LOAN OBLIGATIONS (6.8%)* | Principal
amount | Value |
| AB BSL CLO 2, Ltd. 144A FRB Ser. 21-2A, Class A, (CME Term SOFR 3 Month + 1.36%), 6.755%, 4/15/34 (Cayman Islands) | | $850,000 | $840,572 |
| AIG CLO, Ltd. 144A FRB Ser. 21-1A, Class A, (CME Term SOFR 3 Month + 1.36%), 6.774%, 4/22/34 | | 250,000 | 246,824 |
| | | |
| COLLATERALIZED LOAN OBLIGATIONS (6.8%)* cont. | Principal
amount | Value |
| Ares LXIV CLO, Ltd. 144A FRB Ser. 22-64A, Class A1, (CME Term SOFR 3 Month + 1.44%), 6.834%, 4/15/35 (Cayman Islands) | | $3,890,000 | $3,845,701 |
Bain Capital Credit CLO, Ltd. 144A FRB Ser. 23-3A, Class A,
(CME Term SOFR 3 Month + 1.80%), 7.171%, 7/24/36 (Jersey) | | 2,032,000 | 2,027,503 |
| Bain Capital Credit CLO, Ltd. 144A FRB Ser. 23-4A, Class A1R, (CME Term SOFR 3 Month + 1.75%), 7.166%, 10/20/36 (Cayman Islands) | | 1,000,000 | 992,624 |
| Ballyrock CLO 17, Ltd. 144A FRB Ser. 21-17A, Class A1A, (CME Term SOFR 3 Month + 1.41%), 6.827%, 10/20/34 (Cayman Islands) | | 450,000 | 446,471 |
| Barings CLO, Ltd. 144A FRB Ser. 23-1A, Class A, (CME Term SOFR 3 Month + 1.75%), 7.166%, 4/20/36 (Cayman Islands) | | 250,000 | 248,191 |
| Benefit Street Partners CLO XXII, Ltd. 144A FRB Ser. 22-22A, Class AR, (CME Term SOFR 3 Month + 1.35%), 6.766%, 4/20/35 (Cayman Islands) | | 250,000 | 246,549 |
| Black Diamond CLO, Ltd. 144A FRB Ser. 21-1A, Class A1A, (CME Term SOFR 3 Month + 1.51%), 6.924%, 11/22/34 (Cayman Islands) | | 1,500,000 | 1,473,092 |
| BlueMountain CLO XXXII, Ltd. 144A FRB Ser. 21-32A, Class A, (CME Term SOFR 3 Month + 1.43%), 6.825%, 10/15/34 (Cayman Islands) | | 2,920,000 | 2,887,022 |
| Crown Point CLO 10, Ltd. 144A FRB Ser. 21-10A, Class A, (CME Term SOFR 3 Month + 1.43%), 6.847%, 7/20/34 (Cayman Islands) | | 250,000 | 246,823 |
Diameter Capital CLO 1, Ltd. 144A FRB Ser. 21-1A, Class A1A,
(CME Term SOFR 3 Month + 1.50%), 6.895%, 7/15/36 | | 2,587,000 | 2,566,586 |
| Elevation CLO, Ltd. 144A FRB Ser. 21-13A, Class A1, (CME Term SOFR 3 Month + 1.45%), 6.845%, 7/15/34 (Cayman Islands) | | 700,000 | 687,290 |
| Ellington CLO III, Ltd. 144A FRB Ser. 18-3A, Class A1, (CME Term SOFR 3 Month + 1.91%), 7.327%, 7/20/30 | | 1,195,063 | 1,192,555 |
| Ellington CLO III, Ltd. 144A FRB Ser. 21-3A, Class A2R, (CME Term SOFR 3 Month + 2.01%), 7.427%, 7/20/30 | | 836,440 | 832,129 |
| Elmwood CLO 15, Ltd. 144A FRB Ser. 22-2A, Class A1, (CME Term SOFR 3 Month + 1.34%), 6.752%, 4/22/35 | | 1,500,000 | 1,485,573 |
| Elmwood CLO 19, Ltd. 144A FRB Ser. 23-6A, Class AR, (CME Term SOFR 3 Month + 1.70%), 7.097%, 10/17/36 (Cayman Islands) | | 1,500,000 | 1,500,156 |
| Elmwood CLO 21, Ltd. 144A FRB Ser. 23-8A, Class AR, (CME Term SOFR 3 Month + 1.65%), 7.06%, 10/20/36 (Cayman Islands) | | 2,250,000 | 2,249,921 |
| Elmwood CLO 23, Ltd. 144A FRB Ser. 23-2A, Class A, (CME Term SOFR 3 Month + 1.80%), 7.194%, 4/16/36 (Cayman Islands) | | 1,250,000 | 1,252,039 |
| Guggenheim 1828 CLO, Ltd. 144A FRB Ser. 18-1A, Class A1S1, (CME Term SOFR 3 Month + 1.49%), 6.885%, 10/15/31 (Cayman Islands) | | 1,444,509 | 1,441,702 |
| Gulf Stream Meridian 1, Ltd. 144A FRB Ser. 20-IA, Class A1, (CME Term SOFR 3 Month + 1.63%), 7.025%, 4/15/33 (Cayman Islands) | | 4,095,000 | 4,075,046 |
| Gulf Stream Meridian 4, Ltd. 144A FRB Ser. 21-4A, Class A1, (CME Term SOFR 3 Month + 1.46%), 6.855%, 7/15/34 (Cayman Islands) | | 2,750,000 | 2,734,565 |
| ICG US CLO, Ltd. 144A FRB Ser. 21-1A, Class A1, (CME Term SOFR 3 Month + 1.53%), 6.934%, 4/17/34 (Cayman Islands) | | 648,000 | 640,651 |
| ICG US CLO, Ltd. 144A FRB Ser. 21-1A, Class ARR, (CME Term SOFR 3 Month + 1.43%), 6.822%, 7/28/34 | | 1,000,000 | 982,645 |
| Invesco U.S. CLO, Ltd. 144A FRB Ser. 23-3A, Class A, (CME Term SOFR 3 Month + 1.80%), 7.219%, 7/15/36 (Jersey) | | 1,810,000 | 1,807,525 |
| Jamestown CLO IX, Ltd. 144A FRB Ser. 21-9A, Class A1RR, (CME Term SOFR 3 Month + 1.50%), 6.88%, 7/25/34 (Cayman Islands) | | 1,000,000 | 989,527 |
Juniper Valley Park CLO, LLC 144A FRB Ser. 23-1A, Class A1,
(CME Term SOFR 3 Month + 1.85%), 7.266%, 7/20/35 | | 1,000,000 | 1,000,960 |
| KKR Financial CLO 52, Ltd. 144A FRB Ser. 23-52A, Class A2, (CME Term SOFR 3 Month + 2.25%), 7.531%, 7/16/36 (Cayman Islands) | | 250,000 | 250,382 |
| | | |
| COLLATERALIZED LOAN OBLIGATIONS (6.8%)* cont. | Principal
amount | Value |
| LCM, Ltd. 144A FRB Ser. 30A, Class AR, (CME Term SOFR 3 Month + 1.34%), 6.757%, 4/20/31 (Cayman Islands) | | $3,017,000 | $2,989,612 |
| Marathon CLO XIII, Ltd. 144A FRB Ser. 21-1A, Class AANR, (CME Term SOFR 3 Month + 1.58%), 6.975%, 4/15/32 (Cayman Islands) | | 2,276,000 | 2,259,233 |
| Nassau, Ltd. 144A FRB Ser. 21-1A, Class A1R, (CME Term SOFR 3 Month + 1.55%), 6.945%, 1/15/35 (Cayman Islands) | | 250,000 | 245,746 |
| Nassau, Ltd. 144A FRB Ser. 21-IA, Class A1, (CME Term SOFR 3 Month + 1.51%), 6.905%, 8/26/34 (Cayman Islands) | | 750,000 | 736,106 |
| Park Avenue Institutional Advisers CLO, Ltd. 144A FRB Ser. 19-1A, Class A2A, (CME Term SOFR 3 Month + 2.26%), 7.626%, 5/15/32 (Cayman Islands) | | 4,226,000 | 4,204,435 |
| Park Avenue Institutional Advisers CLO, Ltd. 144A FRB Ser. 21-1A, Class A1A, (CME Term SOFR 3 Month + 1.65%), 7.067%, 1/20/34 (Cayman Islands) | | 1,150,000 | 1,146,253 |
| Rad CLO 22, Ltd. 144A FRB Ser. 23-22A, Class A1, (CME Term SOFR 3 Month + 1.83%), 7.213%, 1/20/37 (Cayman Islands) ## | | 1,650,000 | 1,650,000 |
| RR 14, Ltd. 144A FRB Ser. 21-14A, Class A1, (CME Term SOFR 3 Month + 1.38%), 6.775%, 4/15/36 (Cayman Islands) | | 250,000 | 247,376 |
| Saranac CLO VII, Ltd. 144A FRB Ser. 17-2A, Class BR, (CME Term SOFR 3 Month + 2.01%), 7.391%, 11/20/29 (Jersey) | | 1,700,000 | 1,686,222 |
| Sound Point CLO IX, Ltd. 144A FRB Ser. 21-2A, Class ARRR, (CME Term SOFR 3 Month + 1.47%), 6.887%, 7/20/32 (Cayman Islands) | | 425,000 | 420,748 |
| Sound Point CLO XXIII, Ltd. 144A FRB Ser. 21-2A, Class AR, (CME Term SOFR 3 Month + 1.43%), 6.825%, 7/15/34 (Cayman Islands) | | 2,700,000 | 2,648,878 |
| Sound Point CLO XXV, Ltd. 144A FRB Ser. 22-4A, Class A1R, (CME Term SOFR 3 Month + 1.28%), 6.658%, 4/25/33 (Cayman Islands) | | 1,750,000 | 1,708,725 |
| Sound Point CLO XXVI, Ltd. 144A FRB Ser. 21-1A, Class AR, (CME Term SOFR 3 Month + 1.43%), 6.847%, 7/20/34 (Cayman Islands) | | 3,310,000 | 3,253,098 |
| Steele Creek CLO, Ltd. 144A FRB Ser. 17-1A, Class A, (CME Term SOFR 3 Month + 1.51%), 6.905%, 10/15/30 (Cayman Islands) | | 2,854,048 | 2,839,492 |
| TCW CLO, Ltd. 144A FRB Ser. 21-2A, Class AS, (ICE LIBOR USD 3 Month + 1.18%), 6.82%, 7/25/34 (Cayman Islands) | | 1,500,000 | 1,485,153 |
| TCW Gem CLO, Ltd. 144A FRB Ser. 23-1A, Class A1N, (CME Term SOFR 3 Month + 2.07%), 7.46%, 4/28/36 (Cayman Islands) | | 250,000 | 250,284 |
| Texas Debt Capital CLO, Ltd. 144A FRB Ser. 23-1A, Class A, (CME Term SOFR 3 Month + 1.80%), 7.216%, 4/20/36 (Cayman Islands) | | 1,500,000 | 1,495,557 |
| Trestles CLO V, Ltd. 144A FRB Ser. 21-5A, Class A1, (CME Term SOFR 3 Month + 1.43%), 6.847%, 10/20/34 (Cayman Islands) | | 3,622,000 | 3,582,701 |
| Venture 37 CLO, Ltd. 144A FRB Ser. 21-37A, Class A1R, (CME Term SOFR 3 Month + 1.41%), 6.805%, 7/15/32 (Cayman Islands) | | 2,900,000 | 2,850,723 |
| Venture CLO XV, Ltd. 144A FRB Ser. 21-15A, Class AR3, (CME Term SOFR 3 Month + 1.44%), 6.835%, 7/15/32 (Cayman Islands) | | 1,150,000 | 1,138,523 |
| Venture XIX CLO, Ltd. 144A FRB Ser. 18-19A, Class ARR, (CME Term SOFR 3 Month + 1.52%), 6.915%, 1/15/32 (Cayman Islands) | | 250,000 | 247,621 |
| Wind River CLO, Ltd. 144A FRB Ser. 21-4A, Class A, (CME Term SOFR 3 Month + 1.43%), 6.847%, 1/20/35 (Cayman Islands) | | 1,500,000 | 1,470,678 |
| Zais CLO 17, Ltd. 144A FRB Ser. 21-17A, Class A1A, (CME Term SOFR 3 Month + 1.59%), 7.007%, 10/20/33 | | 4,406,000 | 4,348,775 |
| Zais CLO, Ltd. 144A FRB Ser. 19-13A, Class A1A, (CME Term SOFR 3 Month + 1.75%), 7.145%, 7/15/32 | | 2,858,000 | 2,824,819 |
| Total collateralized loan obligations (cost $84,656,298) | $84,921,382 |
|
| | | |
| ASSET-BACKED SECURITIES (2.3%)* | Principal
amount | Value |
| American Express Credit Account Master Trust Ser. 22-3, Class A, 3.75%, 8/15/27 | | $2,504,000 | $2,415,979 |
| Carvana Auto Receivables Trust 144A Ser. 23-P3, Class A3, 5.82%, 8/10/28 | | 1,000,000 | 990,087 |
| Citizens Auto Receivables Trust 144A Ser. 23-2, Class A3, 5.83%, 2/15/28 | | 500,000 | 497,304 |
| Honda Auto Receivables Owner Trust Ser. 23-3, Class A3, 5.41%, 2/18/28 | | 3,273,000 | 3,267,181 |
| LAD Auto Receivables Trust 144A Ser. 23-3A, Class A3, 6.12%, 9/15/27 | | 1,500,000 | 1,491,575 |
| Mello Warehouse Securitization Trust 144A | | | |
| FRB Ser. 21-3, Class E, (CME Term SOFR 1 Month + 3.36%), 8.689%, 10/22/24 | | 5,905,000 | 5,831,217 |
| FRB Ser. 21-3, Class D, (CME Term SOFR 1 Month + 2.11%), 7.439%, 10/22/24 | | 5,073,000 | 5,000,101 |
| NewRez Warehouse Securitization Trust 144A FRB Ser. 21-1, Class A, (CME Term SOFR 1 Month + 0.86%), 6.189%, 5/7/24 | | 3,683,334 | 3,671,274 |
| Station Place Securitization Trust 144A FRB Ser. 23-2, Class A1, (CME Term SOFR 1 Month + 0.95%), 6.282%, 6/29/24 | | 4,220,000 | 4,219,245 |
| Toyota Auto Receivables Owner Trust Ser. 23-C, Class A3, 5.16%, 4/17/28 | | 920,000 | 904,791 |
| Total asset-backed securities (cost $27,846,163) | $28,288,754 |
|
| | | |
FOREIGN GOVERNMENT AND AGENCY
BONDS AND NOTES (0.9%)* | Principal
amount | Value |
| Benin (Republic of) sr. unsec. notes Ser. REGS, 4.875%, 1/19/32 (Benin) | EUR | 350,000 | $275,814 |
| Brazil (Federal Republic of) sr. unsec. unsub. bonds 5.00%, 1/27/45 (Brazil) | | $700,000 | 497,945 |
| Brazil (Federal Republic of) sr. unsec. unsub. notes 3.875%, 6/12/30 (Brazil) | | 288,000 | 247,692 |
| Chile (Republic of) sr. unsec. unsub. bonds 4.34%, 3/7/42 (Chile) | | 830,000 | 636,154 |
| Colombia (Republic of) sr. unsec. notes 3.875%, 4/25/27 (Colombia) | | 200,000 | 181,607 |
| Colombia (Republic of) sr. unsec. unsub. notes 7.50%, 2/2/34 (Colombia) | | 560,000 | 523,705 |
| Colombia (Republic of) sr. unsec. unsub. notes 3.125%, 4/15/31 (Colombia) | | 200,000 | 147,857 |
| Cote d’lvoire (Republic of) sr. unsec. unsub. notes Ser. REGS, 6.375%, 3/3/28 (Cote d’lvoire) | | 780,000 | 725,400 |
| Dominican (Republic of) sr. unsec. bonds Ser. REGS, 4.875%, 9/23/32 (Dominican Republic) | | 2,040,000 | 1,654,950 |
| Guatemala (Republic of) 144A sr. unsec. notes 7.05%, 10/4/32 (Guatemala) | | 320,000 | 314,800 |
| Indonesia (Republic of) sr. unsec. unsub. notes 4.65%, 9/20/32 (Indonesia) | | 1,810,000 | 1,650,237 |
| Kazakhstan (Republic of) sr. unsec. unsub. bonds Ser. REGS, 6.50%, 7/21/45 (Kazakhstan) | | 990,000 | 970,339 |
| Panama (Republic of) sr. unsec. unsub. bonds 3.298%, 1/19/33 (Panama) | | 630,000 | 467,775 |
| Paraguay (Republic of) 144A sr. unsec. bonds 3.849%, 6/28/33 (Paraguay) | | 690,000 | 555,450 |
| | | |
FOREIGN GOVERNMENT AND AGENCY
BONDS AND NOTES (0.9%)* cont. | Principal
amount | Value |
| Romania (Government of) sr. unsec. notes Ser. REGS, 3.00%, 2/14/31 (Romania) | | $420,000 | $331,271 |
| Romania (Government of) sr. unsec. unsub. notes 7.125%, 1/17/33 (Romania) | | 370,000 | 367,273 |
| South Africa (Republic of) sr. unsec. unsub. notes 4.85%, 9/30/29 (South Africa) | | 330,000 | 280,913 |
| United Mexican States sr. unsec. unsub. bonds 4.28%, 8/14/41 (Mexico) | | 1,400,000 | 1,000,664 |
| United Mexican States sr. unsec. unsub. notes 6.338%, 5/4/53 (Mexico) | | 380,000 | 332,204 |
| Uruguay (Oriental Republic of) sr. unsec. bonds 5.10%, 6/18/50 (Uruguay) | | 230,000 | 198,853 |
| Total foreign government and agency bonds and notes (cost $12,848,913) | $11,360,903 |
|
| | | |
| MUNICIPAL BONDS AND NOTES (0.2%)* | Principal
amount | Value |
| CA State G.O. Bonds, (Build America Bonds), 7.50%, 4/1/34 | | $770,000 | $863,115 |
| North TX, Tollway Auth. Rev. Bonds, (Build America Bonds), 6.718%, 1/1/49 | | 675,000 | 735,478 |
| OH State U. Rev. Bonds, (Build America Bonds), 4.91%, 6/1/40 | | 845,000 | 751,867 |
| Total municipal bonds and notes (cost $2,293,555) | $2,350,460 |
|
| | | |
| SENIOR LOANS (—%)*c | Principal
amount | Value |
| Axalta Coating Systems US Holdings, Inc. bank term loan FRN Ser. B4, (CME Term SOFR 1 Month + 2.50%), 7.89%, 12/20/29 | | $18,404 | $18,411 |
| DIRECTV Financing, LLC bank term loan FRN (CME Term SOFR 3 Month + 5.00%), 10.325%, 7/22/27 | | 39,196 | 38,083 |
| Gray Television, Inc. bank term loan FRN Ser. D, (CME Term SOFR 1 Month + 3.00%), 8.435%, 10/27/28 | | 104,734 | 100,270 |
| Nouryon USA, LLC bank term loan FRN Ser. B, (CME Term SOFR 1 Month + 4.00%), 9.419%, 4/3/28 | | 104,738 | 102,152 |
| Penn Entertainment, Inc. bank term loan FRN (CME Term SOFR 1 Month + 2.75%), 8.174%, 5/3/29 | | 124,684 | 124,442 |
| Proofpoint, Inc. bank term loan FRN Ser. B, (CME Term SOFR 3 Month + 3.25%), 8.519%, 6/9/28 | | 104,734 | 102,871 |
| Total senior loans (cost $493,047) | $486,229 |
|
| | | |
| SHORT-TERM INVESTMENTS (17.2%)* | Principal amount/
shares | Value |
| Putnam Short Term Investment Fund Class P 5.59% L | Shares | 130,924,039 | $130,924,039 |
| State Street Institutional U.S. Government Money Market Fund, Premier Class 5.30% P | Shares | 60,301,000 | 60,301,000 |
| U.S. Treasury Bills 4.992%, 11/2/23 # ∆ Φ | | $16,673,000 | 16,670,567 |
| U.S. Treasury Bills 5.144%, 11/9/23 # ∆ Φ | | 6,800,000 | 6,791,997 |
| U.S. Treasury Bills 5.338%, 11/16/23 # ∆ Φ | | 1,800,000 | 1,796,049 |
| Total short-term investments (cost $216,484,518) | $216,483,652 |
|
| |
| TOTAL INVESTMENTS |
| Total investments (cost $1,995,188,965) | $1,851,556,838 |
|
| |
| Key to holding’s currency abbreviations |
| EUR | Euro |
| USD /$ | United States Dollar |
|
| |
| Key to holding’s abbreviations |
| CME | Chicago Mercantile Exchange |
| DAC | Designated Activity Company |
| FRB | Floating Rate Bonds: The rate shown is the current interest rate at the close of the reporting period. Rates may be subject to a cap or floor. For certain securities, the rate may represent a fixed rate currently in place at the close of the reporting period. |
| FRN | Floating Rate Notes: The rate shown is the current interest rate or yield at the close of the reporting period. Rates may be subject to a cap or floor. For certain securities, the rate may represent a fixed rate currently in place at the close of the reporting period. |
| G.O. Bonds | General Obligation Bonds |
| ICE | Intercontinental Exchange |
| IFB | Inverse Floating Rate Bonds, which are securities that pay interest rates that vary inversely to changes in the market interest rates. As interest rates rise, inverse floaters produce less current income. The rate shown is the current interest rate at the close of the reporting period. Rates may be subject to a cap or floor. |
| IO | Interest Only |
| JSC | Joint Stock Company |
| LIBOR | London Interbank Offered Rate |
| PO | Principal Only |
| REMICs | Real Estate Mortgage Investment Conduits |
| SOFR | Secured Overnight Financing Rate |
| TBA | To Be Announced Commitments |
|
| | | |
| Notes to the fund’s portfolio |
| Unless noted otherwise, the notes to the fund’s portfolio are for the close of the fund’s reporting period, which ran from November 1, 2022 through October 31, 2023 (the reporting period). Within the following notes to the portfolio, references to “Putnam Management” represent Putnam Investment Management, LLC, the fund’s manager, an indirect wholly-owned subsidiary of Putnam Investments, LLC and references to “ASC 820” represent Accounting Standards Codification 820 Fair Value Measurements and Disclosures. |
| * | Percentages indicated are based on net assets of $1,256,687,370. |
| † | This security is non-income-producing. |
| ‡‡ | Income may be received in cash or additional securities at the discretion of the issuer. The rate shown in parenthesis is the rate paid in kind, if applicable. |
| # | This security, in part or in entirety, was pledged and segregated with the broker to cover margin requirements for futures contracts at the close of the reporting period. Collateral at period end totaled $13,177,739 and is included in Investments in securities on the Statement of assets and liabilities (Notes 1 and 9). |
| ∆ | This security, in part or in entirety, was pledged and segregated with the custodian for collateral on certain derivative contracts at the close of the reporting period. Collateral at period end totaled $5,604,649 and is included in Investments in securities on the Statement of assets and liabilities (Notes 1 and 9). |
| Φ | This security, in part or in entirety, was pledged and segregated with the custodian for collateral on certain TBA commitments at the close of the reporting period. Collateral at period end totaled $2,311,453 and is included in Investments in securities on the Statement of assets and liabilities (Notes 1 and 9). |
| ## | Forward commitment(s), in part or in entirety (Note 1). |
| c | Senior loans are exempt from registration under the Securities Act of 1933, as amended, but contain certain restrictions on resale and cannot be sold publicly. These loans pay interest at rates which adjust periodically. The interest rates shown for senior loans are the current interest rates at the close of the reporting period. Senior loans are also subject to mandatory and/or optional prepayment which cannot be predicted. As a result, the remaining maturity may be substantially less than the stated maturity shown (Notes 1 and 7). |
| | | |
| i | This security was pledged, or purchased with cash that was pledged, to the fund for collateral on certain derivative contracts (Note 1). |
| L | Affiliated company (Note 5). The rate quoted in the security description is the annualized 7-day yield of the fund at the close of the reporting period. |
| P | This security was pledged, or purchased with cash that was pledged, to the fund for collateral on certain derivative contracts and TBA commitments. The rate quoted in the security description is the annualized 7-day yield of the fund at the close of the reporting period. |
| R | Real Estate Investment Trust. |
| W | The rate shown represents the weighted average coupon associated with the underlying mortgage pools. Rates may be subject to a cap or floor. |
| Unless otherwise noted, the rates quoted in Short-term investments security descriptions represent the weighted average yield to maturity. |
| Debt obligations are considered secured unless otherwise indicated. |
| 144A after the name of an issuer represents securities exempt from registration under Rule 144A of the Securities Act of 1933, as amended. These securities may be resold in transactions exempt from registration, normally to qualified institutional buyers. |
| See Note 1 to the financial statements regarding TBA commitments. |
| The dates shown on debt obligations are the original maturity dates. |
|
| | | | | | |
| FORWARD CURRENCY CONTRACTS at 10/31/23 (aggregate face value $306,166) |
| Counterparty | Currency | Contract
type* | Delivery
date | Value | Aggregate
face value | Unrealized
appreciation/
(depreciation) |
| Morgan Stanley & Co. International PLC |
| Euro | Sell | 12/20/23 | $300,534 | $306,166 | $5,632 |
| Unrealized appreciation | 5,632 |
| Unrealized (depreciation) | — |
| Total | $5,632 |
| * The exchange currency for all contracts listed is the United States Dollar. |
|
| | | | | |
| FUTURES CONTRACTS OUTSTANDING at 10/31/23 |
| Number of
contracts | Notional
amount | Value | Expiration
date | Unrealized
appreciation/
(depreciation) |
| U.S. Treasury Bond 30 yr (Long) | 286 | $31,299,125 | $31,299,125 | Dec-23 | $(3,094,831) |
| U.S. Treasury Bond Ultra 30 yr (Long) | 827 | 93,089,188 | 93,089,188 | Dec-23 | (12,384,367) |
| U.S. Treasury Note 2 yr (Long) | 409 | 82,790,547 | 82,790,547 | Dec-23 | (446,039) |
| U.S. Treasury Note 5 yr (Long) | 1,752 | 183,042,938 | 183,042,938 | Dec-23 | (3,101,926) |
| U.S. Treasury Note 10 yr (Long) | 955 | 101,394,141 | 101,394,141 | Dec-23 | (3,633,057) |
| U.S. Treasury Note Ultra 10 yr (Long) | 622 | 67,691,094 | 67,691,094 | Dec-23 | (3,780,332) |
| Unrealized appreciation | | | | — |
| Unrealized (depreciation) | | | | (26,440,552) |
| Total | $(26,440,552) |
|
| | | | | |
| FORWARD PREMIUM SWAP OPTION CONTRACTS OUTSTANDING at 10/31/23 |
Counterparty
Fixed right or obligation % to receive or (pay)/Floating rate index/
Maturity date | Expiration
date/strike | | Notional/
contract
amount | Premium
receivable/
(payable) | Unrealized
appreciation/
(depreciation) |
| Bank of America N.A. |
| (0.7988)/US SOFR/Apr-34 (Written) | Apr-24/0.7988 | | $123,169,700 | $152,089 | $147,804 |
| (3.073)/US SOFR/Jun-37 (Written) | Jun-27/3.073 | | 96,522,000 | 7,021,975 | 4,307,777 |
| 3.073/US SOFR/Jun-37 (Written) | Jun-27/3.073 | | 96,522,000 | 7,021,975 | (5,440,945) |
| 1.8838/US SOFR/Apr-34 (Purchased) | Apr-24/1.8838 | | 61,584,900 | (450,440) | (434,174) |
| (3.101)/US SOFR/Jun-39 (Written) | Jun-29/3.101 | | 38,222,600 | 2,985,185 | 1,530,815 |
| 3.101/US SOFR/Jun-39 (Written) | Jun-29/3.101 | | 38,222,600 | 2,985,185 | (2,076,634) |
| (3.32)/US SOFR/Oct-39 (Purchased) | Oct-29/3.32 | | 33,520,700 | (2,664,896) | 1,465,525 |
| 3.32/US SOFR/Oct-39 (Purchased) | Oct-29/3.32 | | 33,520,700 | (2,664,896) | (1,210,768) |
| (1.0035)/US SOFR/Mar-34 (Written) | Mar-24/1.0035 | | 30,792,400 | 46,647 | 45,573 |
| (3.03)/US SOFR/Mar-36 (Purchased) | Mar-26/3.03 | | 29,935,200 | (2,846,370) | 1,808,684 |
| 3.03/US SOFR/Mar-36 (Purchased) | Mar-26/3.03 | | 29,935,200 | (2,846,370) | (1,325,530) |
| (3.095)/US SOFR/Mar-36 (Written) | Mar-26/3.095 | | 29,183,400 | 1,931,941 | 1,322,884 |
| 3.095/US SOFR/Mar-36 (Written) | Mar-26/3.095 | | 29,183,400 | 1,931,941 | (1,596,040) |
| (3.03)/US SOFR/Feb-33 (Written) | Feb-28/3.03 | | 26,831,500 | 1,827,162 | 488,870 |
| 3.03/US SOFR/Feb-33 (Written) | Feb-28/3.03 | | 26,831,500 | 1,827,162 | (963,251) |
| (3.17)/US SOFR/Dec-35 (Purchased) | Dec-25/3.17 | | 26,320,900 | (2,155,410) | 1,622,947 |
| 2.67/US SOFR/Dec-35 (Purchased) | Dec-25/2.67 | | 26,320,900 | (2,113,960) | (1,007,301) |
| 2.0035/US SOFR/Mar-34 (Purchased) | Mar-24/2.0035 | | 21,554,700 | (167,399) | (163,385) |
| (3.857)/US SOFR/Sep-38 (Written) | Sep-28/3.857 | | 20,905,300 | 1,439,330 | 403,472 |
| (3.887)/US SOFR/Sep-40 (Written) | Sep-30/3.887 | | 20,905,300 | 1,572,079 | 365,007 |
| 3.887/US SOFR/Sep-40 (Written) | Sep-30/3.887 | | 20,905,300 | 1,572,079 | (547,301) |
| 3.857/US SOFR/Sep-38 (Written) | Sep-28/3.857 | | 20,905,300 | 1,439,330 | (605,208) |
| (0.9876)/US SOFR/Mar-50 (Purchased) | Mar-30/0.9876 | | 19,218,800 | (6,206,884) | 1,836,356 |
| 0.9876/US SOFR/Mar-50 (Purchased) | Mar-30/0.9876 | | 19,218,800 | (417,464) | (213,136) |
| (2.47)/US SOFR/Dec-57 (Purchased) | Dec-27/2.47 | | 16,558,800 | (2,458,982) | 2,265,409 |
| 2.47/US SOFR/Dec-57 (Purchased) | Dec-27/2.47 | | 16,558,800 | (2,458,982) | (1,649,753) |
| (2.558)/US SOFR/Dec-57 (Purchased) | Dec-27/2.558 | | 10,940,800 | (1,617,050) | 1,393,749 |
| 2.558/US SOFR/Dec-57 (Purchased) | Dec-27/2.558 | | 10,940,800 | (1,617,050) | (1,058,413) |
| Barclays Bank PLC |
| (3.09)/US SOFR/Dec-42 (Purchased) | Dec-32/3.09 | | 41,997,900 | (3,416,529) | 2,009,600 |
| 3.09/US SOFR/Dec-42 (Purchased) | Dec-32/3.09 | | 41,997,900 | (3,416,529) | (1,344,353) |
| (1.945)/US SOFR/Jun-51 (Purchased) | Jun-31/1.945 | | 41,524,500 | (8,803,194) | 3,561,972 |
| 1.945/US SOFR/Jun-51 (Purchased) | Jun-31/1.945 | | 41,524,500 | (2,238,171) | (955,064) |
| Citibank, N.A. |
| (1.84)/US SOFR/Jan-42 (Purchased) | Jan-32/1.84 | | 38,370,100 | (5,732,493) | 2,234,675 |
| 1.84/US SOFR/Jan-42 (Purchased) | Jan-32/1.84 | | 38,370,100 | (1,592,359) | (777,378) |
| (2.00)/US SOFR/Mar-51 (Purchased) | Mar-41/2.00 | | 27,212,800 | (3,167,570) | 860,469 |
| 2.00/US SOFR/Mar-51 (Purchased) | Mar-41/2.00 | | 27,212,800 | (1,785,160) | (386,966) |
| (1.99)/US SOFR/Feb-42 (Purchased) | Feb-32/1.99 | | 22,986,200 | (1,810,163) | 2,292,644 |
| 1.99/US SOFR/Feb-42 (Purchased) | Feb-32/1.99 | | 22,986,200 | (1,810,163) | (1,030,931) |
| (1.34)/US SOFR/Jan-61 (Purchased) | Jan-41/1.34 | | 15,357,200 | (3,589,899) | 789,667 |
| 1.34/US SOFR/Jan-61 (Purchased) | Jan-41/1.34 | | 15,357,200 | (1,282,326) | (283,033) |
| | | | | |
| FORWARD PREMIUM SWAP OPTION CONTRACTS OUTSTANDING at 10/31/23 cont. |
Counterparty
Fixed right or obligation % to receive or (pay)/Floating rate index/
Maturity date | Expiration
date/strike | | Notional/
contract
amount | Premium
receivable/
(payable) | Unrealized
appreciation/
(depreciation) |
| Citibank, N.A. cont. |
| (2.14)/US SOFR/Jun-41 (Purchased) | Jun-31/2.14 | | $7,183,900 | $(927,010) | $429,094 |
| 2.14/US SOFR/Jun-41 (Purchased) | Jun-31/2.14 | | 7,183,900 | (278,735) | (122,629) |
| Deutsche Bank AG |
| (3.19)/US SOFR/Mar-38 (Written) | Mar-28/3.19 | | 24,677,900 | 1,718,816 | 900,497 |
| 3.19/US SOFR/Mar-38 (Written) | Mar-28/3.19 | | 24,677,900 | 1,718,816 | (1,370,857) |
| Goldman Sachs International |
| (2.41)/US SOFR/May-57 (Purchased) | May-27/2.41 | | 27,456,100 | (4,898,168) | 3,303,243 |
| 2.41/US SOFR/May-57 (Purchased) | May-27/2.41 | | 27,456,100 | (3,124,504) | (2,120,435) |
| (2.525)/US SOFR/Mar-47 (Purchased) | Mar-27/2.525 | | 6,678,900 | (941,725) | 721,254 |
| 2.525/US SOFR/Mar-47 (Purchased) | Mar-27/2.525 | | 6,678,900 | (393,053) | (244,982) |
| JPMorgan Chase Bank N.A. |
| (1.75)/US SOFR/Feb-41 (Purchased) | Feb-31/1.75 | | 96,022,800 | (14,969,955) | 5,820,902 |
| 1.75/US SOFR/Feb-41 (Purchased) | Feb-31/1.75 | | 96,022,800 | (2,371,763) | (981,353) |
| (1.70)/US SOFR/Jan-29 (Written) | Jan-24/1.70 | | 62,686,100 | 1,337,565 | 1,322,050 |
| 1.70/US SOFR/Jan-29 (Written) | Jan-24/1.70 | | 62,686,100 | 1,337,565 | (6,363,893) |
| (3.1525)/US SOFR/Mar-40 (Written) | Mar-30/3.1525 | | 39,229,100 | 3,108,906 | 1,464,030 |
| 3.1525/US SOFR/Mar-40 (Written) | Mar-30/3.1525 | | 39,229,100 | 3,108,906 | (2,006,960) |
| 3.475/US SOFR/Oct-34 (Purchased) | Oct-24/3.475 | | 24,313,600 | (291,763) | (28,204) |
| 5.775/US SOFR/Oct-34 (Written) | Oct-24/5.775 | | 24,313,600 | 291,763 | 44,980 |
| (3.0175)/US SOFR/Dec-42 (Purchased) | Dec-32/3.0175 | | 21,881,900 | (1,843,550) | 1,063,460 |
| 3.0175/US SOFR/Dec-42 (Purchased) | Dec-32/3.0175 | | 21,881,900 | (1,843,550) | (765,429) |
| (1.81)/US SOFR/Jan-37 (Written) | Jan-27/1.81 | | 9,726,100 | 574,813 | 456,057 |
| 1.81/US SOFR/Jan-37 (Written) | Jan-27/1.81 | | 9,726,100 | 574,813 | (1,379,745) |
| Morgan Stanley & Co. International PLC |
| 2.1175/US SOFR/Oct-57 (Purchased) | Oct-27/2.1175 | | 50,000,000 | (3,365,000) | (2,015,500) |
| Toronto-Dominion Bank |
| (2.118)/US SOFR/Mar-41 (Purchased) | Mar-31/2.118 | | 3,001,800 | (398,003) | 176,596 |
| 2.118/US SOFR/Mar-41 (Purchased) | Mar-31/2.118 | | 3,001,800 | (99,960) | (41,036) |
| Unrealized appreciation | 46,456,062 |
| Unrealized (depreciation) | (40,510,587) |
| Total | $5,945,475 |
|
| | | |
| TBA SALE COMMITMENTS OUTSTANDING at 10/31/23 (proceeds receivable $199,389,375) |
| Agency | Principal
amount | Settlement
date | Value |
| Government National Mortgage Association, 5.50%, 11/1/53 | $3,000,000 | 11/20/23 | $2,868,690 |
| Government National Mortgage Association, 4.00%, 11/1/53 | 2,000,000 | 11/20/23 | 1,757,025 |
| Government National Mortgage Association, 3.50%, 11/1/53 | 15,000,000 | 11/20/23 | 12,782,072 |
| Uniform Mortgage-Backed Securities, 6.00%, 11/1/53 | 37,000,000 | 11/13/23 | 35,999,846 |
| Uniform Mortgage-Backed Securities, 5.50%, 11/1/53 | 39,000,000 | 11/13/23 | 37,008,868 |
| Uniform Mortgage-Backed Securities, 5.00%, 11/1/53 | 34,000,000 | 11/13/23 | 31,342,421 |
| Uniform Mortgage-Backed Securities, 4.50%, 11/1/53 | 31,000,000 | 11/13/23 | 27,696,563 |
| Uniform Mortgage-Backed Securities, 3.50%, 11/1/53 | 8,000,000 | 11/13/23 | 6,658,438 |
| | | |
| TBA SALE COMMITMENTS OUTSTANDING at 10/31/23 (proceeds receivable $199,389,375) cont. |
| Agency | Principal
amount | Settlement
date | Value |
| Uniform Mortgage-Backed Securities, 3.00%, 11/1/53 | $6,000,000 | 11/13/23 | $4,794,610 |
| Uniform Mortgage-Backed Securities, 2.50%, 11/1/53 | 29,000,000 | 11/13/23 | 22,222,384 |
| Uniform Mortgage-Backed Securities, 2.50%, 11/1/38 | 2,000,000 | 11/15/23 | 1,741,952 |
| Uniform Mortgage-Backed Securities, 2.00%, 11/1/53 | 14,000,000 | 11/13/23 | 10,276,164 |
| Uniform Mortgage-Backed Securities, 2.00%, 11/1/38 | 2,000,000 | 11/15/23 | 1,693,133 |
| Total | $196,842,166 |
|
| | | | | | | |
| OTC INTEREST RATE SWAP CONTRACTS OUTSTANDING at 10/31/23 |
Swap counterparty/
Notional amount | Value | Upfront
premium
received
(paid) | Termination
date | Payments
made by fund | Payments
received by fund | Unrealized
appreciation/
(depreciation) |
| Morgan Stanley & Co. International PLC |
| | $800,000,000 | $36,656,000 | $18,605,714 | 9/21/27 | 3.30% — Annually | US SOFR — Annually | $57,107,426 |
| | 300,000,000 | 5,310,000 | 1,409,327 | 9/21/24 | 3.40% — Annually | US SOFR — Annually | 7,382,900 |
| Upfront premium received | 20,015,041 | | Unrealized appreciation | 64,490,326 |
| Upfront premium (paid) | — | | Unrealized (depreciation) | — |
| Total | $20,015,041 | | Total | $64,490,326 |
|
| | | | | | | |
| CENTRALLY CLEARED INTEREST RATE SWAP CONTRACTS OUTSTANDING at 10/31/23 |
| Notional amount | Value | Upfront
premium
received
(paid) | Termination
date | Payments
made by fund | Payments
received by fund | Unrealized
appreciation/
(depreciation) |
| | $3,704,000 | $142,345 | $(30) | 1/6/28 | 3.5615% — Annually | US SOFR — Annually | $187,211 |
| | 6,183,000 | 612,364 | (82) | 3/15/33 | 3.234% — Annually | US SOFR — Annually | 688,355 |
| | 4,546,000 | 429,461 | (60) | 3/24/33 | US SOFR — Annually | 3.2975% — Annually | (482,003) |
| | 8,223,000 | 937,258 | (109) | 4/6/33 | 3.45% — Annually | US SOFR — Annually | 1,039,813 |
| | 8,188,000 | 788,013 | (108) | 4/20/33 | US SOFR — Annually | 3.283% — Annually | (873,659) |
| | 6,685,000 | 660,745 | (88) | 5/3/33 | 3.253% — Annually | US SOFR — Annually | 727,768 |
| | 12,301,000 | 1,333,182 | (162) | 5/5/33 | 3.129% — Annually | US SOFR — Annually | 1,462,987 |
| | 7,471,000 | 395,814 | (60) | 5/17/28 | US SOFR — Annually | 3.261% — Annually | (465,346) |
| | 7,786,000 | 491,530 | (89) | 5/23/30 | US SOFR — Annually | 3.4095% — Annually | (556,339) |
| | 534,469,000 | 4,147,479 | (164,103) | 6/23/25 | US SOFR — Annually | 4.625% — Annually | (5,583,694) |
| | 260,890,000 | 8,750,251 | 138,327 | 6/23/28 | 3.753% — Annually | US SOFR — Annually | 10,337,365 |
| | 25,899,000 | 868,652 | (15,413) | 6/23/28 | US SOFR — Annually | 3.753% — Annually | (1,027,889) |
| | 157,031,000 | 13,019,440 | 246,486 | 6/23/33 | 3.475% — Annually | US SOFR — Annually | 14,296,813 |
| | | | | | | |
| CENTRALLY CLEARED INTEREST RATE SWAP CONTRACTS OUTSTANDING at 10/31/23 cont. |
| Notional amount | Value | Upfront
premium
received
(paid) | Termination
date | Payments
made by fund | Payments
received by fund | Unrealized
appreciation/
(depreciation) |
| | $30,913,000 | $2,562,997 | $(52,140) | 6/23/33 | US SOFR — Annually | 3.475% — Annually | $(2,818,076) |
| | 13,396,000 | 2,595,877 | 56,591 | 6/23/53 | 3.17% — Annually | US SOFR — Annually | 2,755,278 |
| | 81,977,000 | 15,885,503 | (368,784) | 6/23/53 | US SOFR — Annually | 3.17% — Annually | (16,883,438) |
| | 2,479,000 | 195,767 | (33) | 6/26/33 | 3.527% — Annually | US SOFR — Annually | 211,205 |
| | 9,987,000 | 591,230 | (132) | 7/12/33 | US SOFR — Annually | 3.785% — Annually | (638,495) |
| | 6,000,000 | 408,240 | (79) | 8/2/33 | US SOFR — Annually | 3.6755% — Annually | (433,576) |
| | 33,934,000 | 2,016,019 | (448) | 8/4/33 | US SOFR — Annually | 3.7865% — Annually | (2,146,813) |
| | 7,296,000 | 353,345 | (96) | 8/18/33 | US SOFR — Annually | 3.929% — Annually | (374,815) |
| | 2,531,000 | 105,037 | (33) | 8/21/33 | US SOFR — Annually | 4.018% — Annually | (111,733) |
| | 2,056,000 | 45,417 | (19) | 9/5/28 | 4.041% — Annually | US SOFR — Annually | 49,594 |
| | 18,404,727 | 784,594 E | (359) | 12/17/41 | US SOFR — Annually | 3.85% — Annually | (784,952) |
| | 22,297,000 | 37,459 | (84) | 9/19/25 | 4.9135% — Annually | US SOFR — Annually | 48,358 |
| | 256,795,000 | 315,858 E | (174,117) | 12/20/25 | 4.80% — Annually | US SOFR — Annually | 141,741 |
| | 387,505,000 | 476,631 E | 299,126 | 12/20/25 | US SOFR — Annually | 4.80% — Annually | (177,505) |
| | 81,423,000 | 413,629 E | 279,454 | 12/20/28 | 4.40% — Annually | US SOFR — Annually | 693,084 |
| | 219,811,000 | 1,116,640 E | (843,853) | 12/20/28 | US SOFR — Annually | 4.40% — Annually | (1,960,493) |
| | 267,233,000 | 11,263,871 E | (4,751,587) | 12/20/33 | 4.00% — Annually | US SOFR — Annually | 6,512,285 |
| | 10,167,000 | 1,222,277 E | (601,722) | 12/20/53 | 3.60% — Annually | US SOFR — Annually | 620,554 |
| | 17,258,000 | 2,074,757 E | 1,020,640 | 12/20/53 | US SOFR — Annually | 3.60% — Annually | (1,054,118) |
| | 1,423,000 | 90,019 | (48) | 9/27/53 | US SOFR — Annually | 3.965% — Annually | (91,947) |
| | 1,577,000 | 101,843 | (54) | 9/28/53 | 3.957% — Annually | US SOFR — Annually | 103,825 |
| | 481,000 | 13,045 | (6) | 9/29/33 | US SOFR — Annually | 4.204% — Annually | (13,545) |
| | 28,167,000 | 2,817 | (106) | 9/29/25 | US SOFR — Annually | 4.99% — Annually | (11,529) |
| | 6,446,000 | 443,163 | (219) | 9/29/53 | 3.9315% — Annually | US SOFR — Annually | 451,167 |
| | | | | | | |
| CENTRALLY CLEARED INTEREST RATE SWAP CONTRACTS OUTSTANDING at 10/31/23 cont. |
| Notional amount | Value | Upfront
premium
received
(paid) | Termination
date | Payments
made by fund | Payments
received by fund | Unrealized
appreciation/
(depreciation) |
| | $10,089,000 | $143,667 | $(133) | 10/2/33 | 4.367% — Annually | US SOFR — Annually | $151,566 |
| | 2,500,000 | 44,500 | (33) | 10/2/33 | US SOFR — Annually | 4.322% — Annually | (46,617) |
| | 1,706,000 | 734 | (6) | 10/3/25 | 4.9665% — Annually | US SOFR — Annually | 1,217 |
| | 535,000 | 12,316 | (7) | 10/3/33 | 4.256% — Annually | US SOFR — Annually | 12,768 |
| | 3,295,000 | 158,226 | (112) | 10/4/53 | 4.0575% — Annually | US SOFR — Annually | 161,353 |
| | 13,557,000 | 49,076 | (109) | 10/4/28 | US SOFR — Annually | 4.468% — Annually | (58,186) |
| | 7,525,000 | 200,918 | (255) | 10/5/53 | US SOFR — Annually | 4.1875% — Annually | (207,564) |
| | 3,626,000 | 96,778 | (123) | 10/6/53 | 4.1875% — Annually | US SOFR — Annually | 99,624 |
| | 12,327,000 | 1,479 | (47) | 10/6/25 | US SOFR — Annually | 4.993% — Annually | (1,469) |
| | 12,366,000 | 105,482 | (163) | 10/6/33 | US SOFR — Annually | 4.439% — Annually | (113,504) |
| | 9,349,000 | 79,747 | (123) | 10/11/33 | 4.439% — Annually | US SOFR — Annually | 84,399 |
| | 6,576,000 | 723 | (25) | 10/11/25 | 4.9835% — Annually | US SOFR — Annually | 523 |
| | 32,708,000 | 142,934 | (432) | 10/11/33 | US SOFR — Annually | 4.4915% — Annually | (159,071) |
| | 3,022,000 | 76,940 | (103) | 10/12/53 | 4.1945% — Annually | US SOFR — Annually | 78,720 |
| | 6,712,000 | 28,056 | (54) | 10/16/28 | US SOFR — Annually | 4.454% — Annually | (30,665) |
| | 10,514,000 | 182,523 | (139) | 10/17/33 | 4.328% — Annually | US SOFR — Annually | 186,685 |
| | 3,628,000 | 46,112 | (48) | 10/18/33 | US SOFR — Annually | 4.3865% — Annually | (47,461) |
| | 13,662,940 | 203,851 | (180) | 10/23/33 | US SOFR — Annually | 4.359% — Annually | (201,215) |
| | 1,394,000 | 15,822 | (47) | 10/20/53 | US SOFR — Annually | 4.28% — Annually | (16,347) |
| | 8,000,000 | 24,160 | (106) | 10/20/33 | US SOFR — Annually | 4.5845% — Annually | 22,125 |
| | 233,000 | 1,163 | (8) | 10/23/53 | US SOFR — Annually | 4.3185% — Annually | (1,228) |
| | 295,000 | 2,333 | (10) | 10/24/53 | 4.397% — Annually | US SOFR — Annually | (2,284) |
| | 8,796,400 | 15,306 E | (124) | 10/23/34 | 4.475% — Annually | US SOFR — Annually | (15,430) |
| | 26,233,000 | 9,444 | (98) | 10/25/25 | 4.9805% — Annually | US SOFR — Annually | (7,902) |
| | | | | | | |
| CENTRALLY CLEARED INTEREST RATE SWAP CONTRACTS OUTSTANDING at 10/31/23 cont. |
| Notional amount | Value | Upfront
premium
received
(paid) | Termination
date | Payments
made by fund | Payments
received by fund | Unrealized
appreciation/
(depreciation) |
| | $3,000,000 | $7,740 | $(40) | 10/25/33 | US SOFR — Annually | 4.514% — Annually | $(8,239) |
| | 13,909,000 | 16,969 | (184) | 10/31/33 | 4.531% — Annually | US SOFR — Annually | 17,086 |
| | 10,558,000 | 67,571 | (140) | 11/2/33 | 4.4655% — Annually | US SOFR — Annually | 67,432 |
| Total | $(4,936,448) | $3,803,754 |
| E Extended effective date. |
|
| | | | | | | |
| OTC TOTAL RETURN SWAP CONTRACTS OUTSTANDING at 10/31/23 |
Swap counterparty/
Notional amount | Value | Upfront
premium
received
(paid) | Termination
date | Payments
received (paid)
by fund | Total return
received by
or paid by fund | Unrealized
appreciation/
(depreciation) |
| Morgan Stanley & Co. International PLC |
| | $8,936,746 | $7,798,973 | $— | 9/29/25 | (0.165%) — Annually | Ephesus Funding DAC, 3.80%, Series 2020−01, 9/22/2025 — Annually | $(1,100,069) |
| | 6,989,566 | 6,510,838 | — | 7/17/24 | 3.825% (US SOFR minus 0.14161%) — Quarterly | Pera Funding DAC, 3.825%, Series 2019−01, 7/10/24 — Quarterly | (458,115) |
| Upfront premium received | — | | Unrealized appreciation | — |
| Upfront premium (paid) | — | | Unrealized (depreciation) | (1,558,184) |
| Total | $— | | Total | $(1,558,184) |
|
| | | | | | | | |
| OTC CREDIT DEFAULT CONTRACTS OUTSTANDING — PROTECTION SOLD at 10/31/23 |
Swap counterparty/
Referenced debt* | Rating*** | Upfront
premium
received
(paid)** | | Notional
amount | Value | Termi-
nation
date | Payments
received
by fund | Unrealized
appreciation/
(depreciation) |
| Bank of America N.A. |
| CMBX NA BBB−.6 Index | BB/P | $13,534 | | $93,732 | $12,560 | 5/11/63 | 300 bp — Monthly | $1,029 |
| CMBX NA BBB−.6 Index | BB/P | 26,395 | | 207,346 | 27,784 | 5/11/63 | 300 bp — Monthly | (1,268) |
| CMBX NA BBB−.6 Index | BB/P | 54,079 | | 414,692 | 55,569 | 5/11/63 | 300 bp — Monthly | (1,247) |
| CMBX NA BBB−.6 Index | BB/P | 51,528 | | 427,947 | 57,345 | 5/11/63 | 300 bp — Monthly | (5,567) |
| Citigroup Global Markets, Inc. |
| CMBX NA BB.11 Index | B+/P | 1,234,525 | | 2,185,000 | 924,255 | 11/18/54 | 500 bp — Monthly | 312,394 |
| CMBX NA BB.13 Index | BB−/P | 57,085 | | 571,000 | 257,749 | 12/16/72 | 500 bp — Monthly | (200,109) |
| CMBX NA BB.13 Index | BB−/P | 249,052 | | 2,639,000 | 1,191,245 | 12/16/72 | 500 bp — Monthly | (939,627) |
| | | | | | | | |
| OTC CREDIT DEFAULT CONTRACTS OUTSTANDING — PROTECTION SOLD at 10/31/23 cont. |
Swap counterparty/
Referenced debt* | Rating*** | Upfront
premium
received
(paid)** | | Notional
amount | Value | Termi-
nation
date | Payments
received
by fund | Unrealized
appreciation/
(depreciation) |
| Citigroup Global Markets, Inc. cont. |
| CMBX NA BB.14 Index | BB/P | $47,145 | | $430,000 | $189,974 | 12/16/72 | 500 bp — Monthly | $(142,411) |
| CMBX NA BB.6 Index | B/P | 588,327 | | 2,159,954 | 646,906 | 5/11/63 | 500 bp — Monthly | (56,480) |
| CMBX NA BB.7 Index | B-/P | 132,687 | | 2,434,145 | 800,590 | 1/17/47 | 500 bp — Monthly | (665,536) |
| CMBX NA BB.9 Index | B/P | 7,533 | | 37,000 | 15,688 | 9/17/58 | 500 bp — Monthly | (8,119) |
| CMBX NA BB.9 Index | B/P | 172,160 | | 843,000 | 357,432 | 9/17/58 | 500 bp — Monthly | (182,815) |
| CMBX NA BBB−.10 Index | BB/P | 196,421 | | 1,583,000 | 512,417 | 11/17/59 | 300 bp — Monthly | (315,073) |
| CMBX NA BBB−.10 Index | BB/P | 288,987 | | 2,649,000 | 857,481 | 11/17/59 | 300 bp — Monthly | (566,950) |
| CMBX NA BBB−.12 Index | BBB−/P | 13,304 | | 319,000 | 101,570 | 8/17/61 | 300 bp — Monthly | (88,079) |
| CMBX NA BBB−.15 Index | BBB−/P | 17,094 | | 64,000 | 17,453 | 11/18/64 | 300 bp — Monthly | (321) |
| CMBX NA BBB−.15 Index | BBB−/P | 31,945 | | 188,000 | 51,268 | 11/18/64 | 300 bp — Monthly | (19,213) |
| CMBX NA BBB−.8 Index | BB−/P | 5,490 | | 36,000 | 7,434 | 10/17/57 | 300 bp — Monthly | (1,923) |
| Credit Suisse International |
| CMBX NA A.7 Index | BBB+/P | 11,938 | | 178,029 | 17,037 | 1/17/47 | 200 bp — Monthly | (5,030) |
| CMBX NA A.7 Index | BBB+/P | 102,321 | | 1,724,459 | 165,031 | 1/17/47 | 200 bp — Monthly | (62,039) |
| CMBX NA BB.7 Index | B-/P | 97,913 | | 685,305 | 225,397 | 1/17/47 | 500 bp — Monthly | (126,818) |
| CMBX NA BBB−.7 Index | BB/P | 143,564 | | 1,726,506 | 295,060 | 1/17/47 | 300 bp — Monthly | (150,489) |
| Goldman Sachs International |
| CMBX NA BB.13 Index | BB−/P | 5,770 | | 60,000 | 27,084 | 12/16/72 | 500 bp — Monthly | (21,256) |
| CMBX NA BBB−.11 Index | BBB−/P | 254 | | 4,000 | 977 | 11/18/54 | 300 bp — Monthly | (720) |
| CMBX NA BBB−.11 Index | BBB−/P | 318 | | 5,000 | 1,221 | 11/18/54 | 300 bp — Monthly | (901) |
| CMBX NA BBB−.15 Index | BBB−/P | 65,904 | | 713,000 | 194,435 | 11/18/64 | 300 bp — Monthly | (128,115) |
| CMBX NA BBB−.7 Index | BB/P | 7,806 | | 88,458 | 15,117 | 1/17/47 | 300 bp — Monthly | (7,259) |
| CMBX NA BBB−.7 Index | BB/P | 49,185 | | 477,830 | 81,661 | 1/17/47 | 300 bp — Monthly | (32,197) |
| | | | | | | | |
| OTC CREDIT DEFAULT CONTRACTS OUTSTANDING — PROTECTION SOLD at 10/31/23 cont. |
Swap counterparty/
Referenced debt* | Rating*** | Upfront
premium
received
(paid)** | | Notional
amount | Value | Termi-
nation
date | Payments
received
by fund | Unrealized
appreciation/
(depreciation) |
| JPMorgan Securities LLC |
| CMBX NA BB.8 Index | CCC+/P | $684,367 | | $1,921,134 | $874,884 | 10/17/57 | 500 bp — Monthly | $(188,649) |
| CMBX NA BBB−.13 Index | BBB−/P | 1,439,696 | | 10,892,000 | 3,468,013 | 12/16/72 | 300 bp — Monthly | (2,021,963) |
| CMBX NA BBB−.7 Index | BB/P | 115,034 | | 387,003 | 66,139 | 1/17/47 | 300 bp — Monthly | 49,121 |
| CMBX NA BBB−.8 Index | BB−/P | 177,457 | | 1,138,000 | 234,997 | 10/17/57 | 300 bp — Monthly | (56,877) |
| Merrill Lynch International |
| CMBX NA A.13 Index | A-/P | 127,730 | | 980,000 | 123,774 | 12/16/72 | 200 bp — Monthly | 4,337 |
| CMBX NA A.13 Index | A-/P | 130,453 | | 980,000 | 123,774 | 12/16/72 | 200 bp — Monthly | 7,060 |
| Morgan Stanley & Co. International PLC |
| CMBX NA A.13 Index | A-/P | (5,632) | | 939,000 | 118,596 | 12/16/72 | 200 bp — Monthly | (123,862) |
| CMBX NA BB.11 Index | B+/P | 21,160 | | 250,000 | 105,750 | 11/18/54 | 500 bp — Monthly | (84,347) |
| CMBX NA BB.13 Index | BB−/P | 101,143 | | 1,110,000 | 501,054 | 12/16/72 | 500 bp — Monthly | (398,832) |
| CMBX NA BB.13 Index | BB−/P | 143,825 | | 1,524,000 | 687,934 | 12/16/72 | 500 bp — Monthly | (542,627) |
| CMBX NA BB.14 Index | BB/P | 2,447 | | 20,000 | 8,836 | 12/16/72 | 500 bp — Monthly | (6,369) |
| CMBX NA BB.8 Index | CCC+/P | 191,058 | | 536,333 | 244,246 | 10/17/57 | 500 bp — Monthly | (52,666) |
| CMBX NA BBB−.13 Index | BBB−/P | 46,856 | | 715,000 | 227,656 | 12/16/72 | 300 bp — Monthly | (180,383) |
| CMBX NA BBB−.13 Index | BBB−/P | 59,870 | | 812,000 | 258,541 | 12/16/72 | 300 bp — Monthly | (198,197) |
| CMBX NA BBB−.13 Index | BBB−/P | 115,928 | | 1,559,000 | 496,386 | 12/16/72 | 300 bp — Monthly | (379,548) |
| CMBX NA BBB−.13 Index | BBB−/P | 116,678 | | 1,714,000 | 545,738 | 12/16/72 | 300 bp — Monthly | (428,060) |
| Upfront premium received | 7,145,966 | | | Unrealized appreciation | 373,941 |
| Upfront premium (paid) | (5,632) | | | Unrealized (depreciation) | (8,391,942) |
| Total | $7,140,334 | | | Total | $(8,018,001) |
| * Payments related to the referenced debt are made upon a credit default event. |
| ** Upfront premium is based on the difference between the original spread on issue and the market spread on day of execution. |
| *** Ratings for an underlying index represent the average of the ratings of all the securities included in that index. The Moody’s, Standard & Poor’s or Fitch ratings are believed to be the most recent ratings available at October 31, 2023. Securities rated by Putnam are indicated by “/P.” The Putnam rating categories are comparable to the Standard & Poor’s classifications. |
|
| | | | | | | | |
| OTC CREDIT DEFAULT CONTRACTS OUTSTANDING — PROTECTION PURCHASED at 10/31/23 |
Swap counterparty/
Referenced debt* | | Upfront
premium
received
(paid)** | | Notional
amount | Value | Termi-
nation
date | Payments
(paid)
by fund | Unrealized
appreciation/
(depreciation) |
| Citigroup Global Markets, Inc. |
| CMBX NA A.7 Index | | $(1,164) | | $97,389 | $9,320 | 1/17/47 | (200 bp) — Monthly | $8,118 |
| CMBX NA BB.10 Index | | (934,830) | | 3,666,000 | 1,741,350 | 11/17/59 | (500 bp) — Monthly | 802,956 |
| CMBX NA BB.10 Index | | (273,409) | | 1,134,000 | 538,650 | 11/17/59 | (500 bp) — Monthly | 264,139 |
| CMBX NA BB.10 Index | | (46,755) | | 448,000 | 212,800 | 11/17/59 | (500 bp) — Monthly | 165,610 |
| CMBX NA BB.10 Index | | (40,460) | | 369,000 | 175,275 | 11/17/59 | (500 bp) — Monthly | 134,456 |
| CMBX NA BB.11 Index | | (75,168) | | 1,041,000 | 440,343 | 11/18/54 | (500 bp) — Monthly | 364,163 |
| CMBX NA BB.11 Index | | (24,952) | | 481,000 | 203,463 | 11/18/54 | (500 bp) — Monthly | 178,044 |
| CMBX NA BB.11 Index | | (24,535) | | 481,000 | 203,463 | 11/18/54 | (500 bp) — Monthly | 178,461 |
| CMBX NA BB.8 Index | | (310,911) | | 869,728 | 396,074 | 10/17/57 | (500 bp) — Monthly | 84,318 |
| CMBX NA BB.8 Index | | (220,857) | | 619,440 | 282,093 | 10/17/57 | (500 bp) — Monthly | 60,634 |
| CMBX NA BB.8 Index | | (63,199) | | 491,880 | 224,002 | 10/17/57 | (500 bp) — Monthly | 160,325 |
| CMBX NA BBB−.10 Index | | (605,828) | | 3,841,000 | 1,243,332 | 11/17/59 | (300 bp) — Monthly | 635,263 |
| CMBX NA BBB−.10 Index | | (402,513) | | 1,734,000 | 561,296 | 11/17/59 | (300 bp) — Monthly | 157,771 |
| CMBX NA BBB−.10 Index | | (122,025) | | 961,000 | 311,076 | 11/17/59 | (300 bp) — Monthly | 188,490 |
| CMBX NA BBB−.10 Index | | (85,530) | | 393,000 | 127,214 | 11/17/59 | (300 bp) — Monthly | 41,455 |
| CMBX NA BBB−.10 Index | | (77,019) | | 313,000 | 101,318 | 11/17/59 | (300 bp) — Monthly | 24,116 |
| CMBX NA BBB−.12 Index | | (47,141) | | 292,000 | 92,973 | 8/17/61 | (300 bp) — Monthly | 45,661 |
| CMBX NA BBB−.13 Index | | (302,127) | | 3,987,000 | 1,269,461 | 12/16/72 | (300 bp) — Monthly | 965,008 |
| CMBX NA BBB−.13 Index | | (197,220) | | 3,602,000 | 1,146,877 | 12/16/72 | (300 bp) — Monthly | 947,556 |
| CMBX NA BBB−.13 Index | | (109,020) | | 2,162,000 | 688,381 | 12/16/72 | (300 bp) — Monthly | 578,100 |
| CMBX NA BBB−.13 Index | | (110,039) | | 2,161,000 | 688,062 | 12/16/72 | (300 bp) — Monthly | 576,763 |
| CMBX NA BBB−.13 Index | | (112,582) | | 1,925,000 | 612,920 | 12/16/72 | (300 bp) — Monthly | 499,215 |
| CMBX NA BBB−.7 Index | | (105,219) | | 379,895 | 64,924 | 1/17/47 | (300 bp) — Monthly | (40,516) |
| | | | | | | | |
| OTC CREDIT DEFAULT CONTRACTS OUTSTANDING — PROTECTION PURCHASED at 10/31/23 cont. |
Swap counterparty/
Referenced debt* | | Upfront
premium
received
(paid)** | | Notional
amount | Value | Termi-
nation
date | Payments
(paid)
by fund | Unrealized
appreciation/
(depreciation) |
| Citigroup Global Markets, Inc. cont. |
| CMBX NA BBB−.8 Index | | $(118,050) | | $787,000 | $162,516 | 10/17/57 | (300 bp) — Monthly | $44,006 |
| CMBX NA BBB−.8 Index | | (45,371) | | 327,000 | 67,526 | 10/17/57 | (300 bp) — Monthly | 21,964 |
| Credit Suisse International |
| CMBX NA BB.10 Index | | (123,951) | | 929,000 | 441,275 | 11/17/59 | (500 bp) — Monthly | 316,421 |
| CMBX NA BB.10 Index | | (110,117) | | 926,000 | 439,850 | 11/17/59 | (500 bp) — Monthly | 328,832 |
| CMBX NA BB.10 Index | | (60,658) | | 488,000 | 231,800 | 11/17/59 | (500 bp) — Monthly | 170,668 |
| CMBX NA BB.7 Index | | (173,028) | | 878,165 | 288,828 | 1/17/47 | (500 bp) — Monthly | 114,946 |
| CMBX NA BB.7 Index | | (140,307) | | 798,587 | 262,655 | 1/17/47 | (500 bp) — Monthly | 121,571 |
| CMBX NA BB.7 Index | | (11,314) | | 382,361 | 114,517 | 5/11/63 | (500 bp) — Monthly | 102,832 |
| Goldman Sachs International |
| CMBX NA BB.10 Index | | (281,681) | | 1,245,000 | 591,375 | 11/17/59 | (500 bp) — Monthly | 308,483 |
| CMBX NA BB.10 Index | | (61,756) | | 205,000 | 97,375 | 11/17/59 | (500 bp) — Monthly | 35,419 |
| CMBX NA BB.6 Index | | (227,615) | | 329,869 | 98,796 | 5/11/63 | (500 bp) — Monthly | (129,140) |
| CMBX NA BB.6 Index | | (120,100) | | 165,829 | 49,666 | 5/11/63 | (500 bp) — Monthly | (70,595) |
| CMBX NA BB.7 Index | | (203,659) | | 939,018 | 308,843 | 1/17/47 | (500 bp) — Monthly | 104,271 |
| CMBX NA BB.7 Index | | (81,414) | | 503,681 | 165,661 | 1/17/47 | (500 bp) — Monthly | 83,757 |
| CMBX NA BB.9 Index | | (30,702) | | 258,000 | 109,392 | 9/17/58 | (500 bp) — Monthly | 78,439 |
| CMBX NA BB.9 Index | | (15,654) | | 150,000 | 63,600 | 9/17/58 | (500 bp) — Monthly | 47,801 |
| CMBX NA BBB−.13 Index | | (128,898) | | 1,701,000 | 541,598 | 12/16/72 | (300 bp) — Monthly | 411,708 |
| CMBX NA BBB−.8 Index | | (6,339) | | 49,000 | 10,119 | 10/17/57 | (300 bp) — Monthly | 3,751 |
| JPMorgan Securities LLC |
| CMBX NA A.7 Index | | (61,347) | | 1,805,099 | 172,748 | 1/17/47 | (200 bp) — Monthly | 110,699 |
| CMBX NA BB.11 Index | | (235,607) | | 432,000 | 182,736 | 11/18/54 | (500 bp) — Monthly | (53,291) |
| CMBX NA BB.11 Index | | (490,603) | | 568,472 | 170,257 | 5/11/63 | (500 bp) — Monthly | (320,899) |
| CMBX NA BBB−.11 Index | | (991) | | 9,000 | 2,198 | 11/18/54 | (300 bp) — Monthly | 1,201 |
| | | | | | | | |
| OTC CREDIT DEFAULT CONTRACTS OUTSTANDING — PROTECTION PURCHASED at 10/31/23 cont. |
Swap counterparty/
Referenced debt* | | Upfront
premium
received
(paid)** | | Notional
amount | Value | Termi-
nation
date | Payments
(paid)
by fund | Unrealized
appreciation/
(depreciation) |
| JPMorgan Securities LLC cont. |
| CMBX NA BBB−.12 Index | | $(38,327) | | $319,000 | $101,570 | 8/17/61 | (300 bp) — Monthly | $63,057 |
| CMBX NA BBB−.6 Index | | (538,787) | | 1,143,716 | 153,258 | 5/11/63 | (300 bp) — Monthly | (386,196) |
| Merrill Lynch International |
| CMBX NA BB.10 Index | | (50,925) | | 895,000 | 425,125 | 11/17/59 | (500 bp) — Monthly | 373,330 |
| CMBX NA BBB−.7 Index | | (69,410) | | 668,962 | 114,326 | 1/17/47 | (300 bp) — Monthly | 44,526 |
| CMBX NA BBB−.9 Index | | (29,455) | | 159,000 | 37,556 | 9/17/58 | (300 bp) — Monthly | 8,009 |
| Morgan Stanley & Co. International PLC |
| CMBX NA BB.10 Index | | (516,438) | | 2,199,000 | 1,044,525 | 11/17/59 | (500 bp) — Monthly | 525,949 |
| CMBX NA BB.10 Index | | (348,098) | | 1,146,000 | 544,350 | 11/17/59 | (500 bp) — Monthly | 195,138 |
| CMBX NA BB.6 Index | | (113,683) | | 158,075 | 47,343 | 5/11/63 | (500 bp) — Monthly | (66,494) |
| CMBX NA BB.7 Index | | (705,538) | | 1,744,158 | 573,654 | 1/17/47 | (500 bp) — Monthly | (133,580) |
| CMBX NA BB.9 Index | | (8,575) | | 173,000 | 73,352 | 9/17/58 | (500 bp) — Monthly | 64,609 |
| CMBX NA BB.9 Index | | (13,649) | | 148,000 | 62,752 | 9/17/58 | (500 bp) — Monthly | 48,959 |
| CMBX NA BB.9 Index | | (6,858) | | 127,000 | 53,848 | 9/17/58 | (500 bp) — Monthly | 46,867 |
| CMBX NA BB.9 Index | | (938) | | 24,000 | 10,176 | 9/17/58 | (500 bp) — Monthly | 9,214 |
| CMBX NA BBB−.10 Index | | (662,986) | | 3,807,000 | 1,232,326 | 11/17/59 | (300 bp) — Monthly | 567,119 |
| CMBX NA BBB−.10 Index | | (278,002) | | 2,192,000 | 709,550 | 11/17/59 | (300 bp) — Monthly | 430,269 |
| CMBX NA BBB−.10 Index | | (96,213) | | 803,000 | 259,931 | 11/17/59 | (300 bp) — Monthly | 163,250 |
| CMBX NA BBB−.10 Index | | (155,861) | | 659,000 | 213,318 | 11/17/59 | (300 bp) — Monthly | 57,073 |
| CMBX NA BBB−.10 Index | | (75,985) | | 592,000 | 191,630 | 11/17/59 | (300 bp) — Monthly | 115,300 |
| CMBX NA BBB−.10 Index | | (42,815) | | 347,000 | 112,324 | 11/17/59 | (300 bp) — Monthly | 69,307 |
| CMBX NA BBB−.12 Index | | (136,210) | | 1,046,000 | 333,046 | 8/17/61 | (300 bp) — Monthly | 194,821 |
| CMBX NA BBB−.7 Index | | (148,658) | | 1,152,320 | 196,932 | 1/17/47 | (300 bp) — Monthly | 47,602 |
| | | | | | | | |
| OTC CREDIT DEFAULT CONTRACTS OUTSTANDING — PROTECTION PURCHASED at 10/31/23 cont. |
Swap counterparty/
Referenced debt* | | Upfront
premium
received
(paid)** | | Notional
amount | Value | Termi-
nation
date | Payments
(paid)
by fund | Unrealized
appreciation/
(depreciation) |
| Morgan Stanley & Co. International PLC cont. |
| CMBX NA BBB−.7 Index | | $(8,254) | | $102,674 | $17,547 | 1/17/47 | (300 bp) — Monthly | $9,233 |
| CMBX NA BBB−.8 Index | | (1,713) | | 11,000 | 2,272 | 10/17/57 | (300 bp) — Monthly | 550 |
| Upfront premium received | — | | | Unrealized appreciation | 12,501,573 |
| Upfront premium (paid) | (11,069,043) | | | Unrealized (depreciation) | (1,200,711) |
| Total | $(11,069,043) | | | Total | $11,300,862 |
| * Payments related to the referenced debt are made upon a credit default event. |
| ** Upfront premium is based on the difference between the original spread on issue and the market spread on day of execution. |
|
ASC 820 establishes a three-level hierarchy for disclosure of fair value measurements. The valuation hierarchy is based upon the transparency of inputs to the valuation of the fund’s investments. The three levels are defined as follows:
Level 1: Valuations based on quoted prices for identical securities in active markets.
Level 2: Valuations based on quoted prices in markets that are not active or for which all significant inputs are observable, either directly or indirectly.
Level 3: Valuations based on inputs that are unobservable and significant to the fair value measurement.
The following is a summary of the inputs used to value the fund’s net assets as of the close of the reporting period:
| | | |
| | Valuation inputs |
| Investments in securities: | Level 1 | Level 2 | Level 3 |
| Asset-backed securities | $— | $28,288,754 | $— |
| Collateralized loan obligations | — | 84,921,382 | — |
| Corporate bonds and notes | — | 378,618,309 | — |
| Foreign government and agency bonds and notes | — | 11,360,903 | — |
| Mortgage-backed securities | — | 387,299,236 | — |
| Municipal bonds and notes | — | 2,350,460 | — |
| Senior loans | — | 486,229 | — |
| U.S. government and agency mortgage obligations | — | 741,301,050 | — |
| U.S. treasury obligations | — | 446,863 | — |
| Short-term investments | 60,301,000 | 156,182,652 | — |
| Totals by level | $60,301,000 | $1,791,255,838 | $— |
|
| | | |
| | Valuation inputs |
| Other financial instruments: | Level 1 | Level 2 | Level 3 |
| Forward currency contracts | $— | $5,632 | $— |
| Futures contracts | (26,440,552) | — | — |
| Forward premium swap option contracts | — | 5,945,475 | — |
| TBA sale commitments | — | (196,842,166) | — |
| Interest rate swap contracts | — | 53,215,487 | — |
| Total return swap contracts | — | (1,558,184) | — |
| Credit default contracts | — | 7,211,570 | — |
| Totals by level | $(26,440,552) | $(132,022,186) | $— |
The accompanying notes are an integral part of these financial statements.
Statement of assets and liabilities 10/31/23
| |
| ASSETS | |
| Investment in securities, at value (Notes 1 and 9): | |
| Unaffiliated issuers (identified cost $1,864,264,926) | $1,720,632,799 |
| Affiliated issuers (identified cost $130,924,039) (Note 5) | 130,924,039 |
| Cash | 2,518 |
| Foreign currency (cost $36) (Note 1) | 36 |
| Interest and other receivables | 11,254,250 |
| Receivable for shares of the fund sold | 1,018,335 |
| Receivable for investments sold | 8,541,758 |
| Receivable for sales of delayed delivery securities (Note 1) | 241,544 |
| Receivable for sales of TBA securities (Note 1) | 197,521,201 |
| Receivable for variation margin on futures contracts (Note 1) | 235,333 |
| Receivable for variation margin on centrally cleared swap contracts (Note 1) | 475,957 |
| Unrealized appreciation on forward premium swap option contracts (Note 1) | 46,456,062 |
| Unrealized appreciation on forward currency contracts (Note 1) | 5,632 |
| Unrealized appreciation on OTC swap contracts (Note 1) | 77,365,840 |
| Premium paid on OTC swap contracts (Note 1) | 11,074,675 |
| Deposits with broker (Note 1) | 8,284,400 |
| Prepaid assets | 56,054 |
| Total assets | 2,214,090,433 |
| |
| LIABILITIES | |
| Payable for investments purchased | 29,341,023 |
| Payable for purchases of delayed delivery securities (Note 1) | 9,422,243 |
| Payable for purchases of TBA securities (Note 1) | 577,540,290 |
| Payable for shares of the fund repurchased | 1,975,070 |
| Payable for compensation of Manager (Note 2) | 126,679 |
| Payable for custodian fees (Note 2) | 37,936 |
| Payable for investor servicing fees (Note 2) | 340,565 |
| Payable for Trustee compensation and expenses (Note 2) | 320,150 |
| Payable for administrative services (Note 2) | 2,233 |
| Payable for distribution fees (Note 2) | 134,091 |
| Payable for variation margin on futures contracts (Note 1) | 235,961 |
| Payable for variation margin on centrally cleared swap contracts (Note 1) | 741,980 |
| Unrealized depreciation on forward premium swap option contracts (Note 1) | 40,510,587 |
| Unrealized depreciation on OTC swap contracts (Note 1) | 11,150,837 |
| Premium received on OTC swap contracts (Note 1) | 27,161,007 |
| TBA sale commitments, at value (proceeds receivable $199,389,375) (Note 1) | 196,842,166 |
| Collateral on certain derivative contracts and TBA commitments, at value (Notes 1 and 9) | 60,747,863 |
| Payable to broker (Note 1) | 465,471 |
| Other accrued expenses | 306,911 |
| Total liabilities | 957,403,063 |
| | |
| Net assets | $1,256,687,370 |
(Continued on next page)
Statement of assets and liabilities cont.
| |
| REPRESENTED BY | |
| Paid-in capital (Unlimited shares authorized) (Notes 1 and 4) | $2,085,524,622 |
| Total distributable earnings (Note 1) | (828,837,252) |
| Total — Representing net assets applicable to capital shares outstanding | $1,256,687,370 |
| |
| COMPUTATION OF NET ASSET VALUE AND OFFERING PRICE | |
| Net asset value and redemption price per class A share | |
| ($421,320,699 divided by 83,432,290 shares) | $5.05 |
| Offering price per class A share (100/96.00 of $5.05)* | $5.26 |
| Net asset value and offering price per class B share ($715,380 divided by 143,626 shares)** | $4.98 |
| Net asset value and offering price per class C share ($29,291,339 divided by 5,868,878 shares)** | $4.99 |
| Net asset value and redemption price per class M share ($34,081,176 divided by 7,021,200 shares) | $4.85 |
| Offering price per class M share (100/96.75 of $4.85)† | $5.01 |
| Net asset value, offering price and redemption price per class R share | |
| ($6,266,162 divided by 1,257,299 shares) | $4.98 |
| Net asset value, offering price and redemption price per class R5 share | |
| ($3,173,253 divided by 619,664 shares) | $5.12 |
| Net asset value, offering price and redemption price per class R6 share | |
| ($170,838,068 divided by 33,101,826 shares) | $5.16 |
| Net asset value, offering price and redemption price per class Y share | |
| ($591,001,293 divided by 114,333,799 shares) | $5.17 |
*On single retail sales of less than $100,000. On sales of $100,000 or more the offering price is reduced.
**Redemption price per share is equal to net asset value less any applicable contingent deferred sales charge.
†On single retail sales of less than $50,000. On sales of $50,000 or more the offering price is reduced.
The accompanying notes are an integral part of these financial statements.
Statement of operations Year ended 10/31/23
| |
| INVESTMENT INCOME | |
| Interest (including interest income of $8,710,312 from investments in affiliated issuers) (Note 5) | $77,059,901 |
| Total investment income | 77,059,901 |
| |
| EXPENSES | |
| Compensation of Manager (Note 2) | 5,918,424 |
| Investor servicing fees (Note 2) | 2,374,566 |
| Custodian fees (Note 2) | 140,152 |
| Trustee compensation and expenses (Note 2) | 67,247 |
| Distribution fees (Note 2) | 1,783,423 |
| Administrative services (Note 2) | 47,989 |
| Other | 726,177 |
| Fees waived and reimbursed by Manager (Note 2) | (1,891,138) |
| Total expenses | 9,166,840 |
| Expense reduction (Note 2) | (67,434) |
| Net expenses | 9,099,406 |
| | |
| Net investment income | 67,960,495 |
| |
| REALIZED AND UNREALIZED GAIN (LOSS) | |
| Net realized gain (loss) on: | |
| Securities from unaffiliated issuers (Notes 1 and 3) | (64,348,215) |
| Foreign currency transactions (Note 1) | (328) |
| Forward currency contracts (Note 1) | (16,426) |
| Futures contracts (Note 1) | (74,573,998) |
| Swap contracts (Note 1) | 20,257,917 |
| Written options (Note 1) | (6,261,875) |
| Total net realized loss | (124,942,925) |
| Change in net unrealized appreciation (depreciation) on: | |
| Securities from unaffiliated issuers and TBA sale commitments | 70,237,847 |
| Assets and liabilities in foreign currencies | 474 |
| Forward currency contracts | (1,171) |
| Futures contracts | 46,274,500 |
| Swap contracts | (5,033,065) |
| Written options | (5,428,558) |
| Total change in net unrealized appreciation | 106,050,027 |
| | |
| Net loss on investments | (18,892,898) |
| |
| Net increase in net assets resulting from operations | $49,067,597 |
The accompanying notes are an integral part of these financial statements.
Statement of changes in net assets
| | |
| DECREASE IN NET ASSETS | Year ended 10/31/23 | Year ended 10/31/22 |
| Operations | | |
| Net investment income | $67,960,495 | $83,636,734 |
| Net realized loss on investments | | |
| and foreign currency transactions | (124,942,925) | (516,501,341) |
| Change in net unrealized appreciation (depreciation) | | |
| of investments and assets and liabilities | | |
| in foreign currencies | 106,050,027 | (33,550,948) |
| Net increase (decrease) in net assets resulting | | |
| from operations | 49,067,597 | (466,415,555) |
| Distributions to shareholders (Note 1): | | |
| From ordinary income | | |
| Net investment income | | |
| Class A | (42,165,406) | (25,861,854) |
| Class B | (120,833) | (110,317) |
| Class C | (3,008,647) | (2,128,301) |
| Class M | (3,406,830) | (1,999,164) |
| Class R | (626,871) | (393,845) |
| Class R5 | (279,061) | (242,018) |
| Class R6 | (14,913,797) | (8,559,833) |
| Class Y | (68,034,875) | (80,635,541) |
| Decrease from capital share transactions (Note 4) | (623,949,901) | (919,404,843) |
| Total decrease in net assets | (707,438,624) | (1,505,751,271) |
| |
| NET ASSETS | | |
| Beginning of year | 1,964,125,994 | 3,469,877,265 |
| End of year | $1,256,687,370 | $1,964,125,994 |
The accompanying notes are an integral part of these financial statements.
|
| This page left blank intentionally. |
Financial highlights
(For a common share outstanding throughout the period)
| | | | | | | | | | | | | |
| | INVESTMENT OPERATIONS | | | LESS DISTRIBUTIONS | | | | | RATIOS AND SUPPLEMENTAL DATA | |
| | | | | | | | | | | | | Ratio of net | |
| | Net asset | | Net realized | | | | | | | | Ratio | investment | |
| | value, | | and unrealized | Total from | From net | From net | | Net asset | Total return | Net assets, | of expenses | income (loss) | Portfolio |
| | beginning | Net investment | gain (loss) | investment | investment | realized gain | Total | value, end | at net asset | end of period | to average | to average | turnover |
| Period ended | of period | income (loss)a | on investments | operations | income | on investments | distributions | of period | value (%)b | (in thousands) | net assets (%)c | net assets (%) | (%)d |
| Class A | | | | | | | | | | | | | |
| October 31, 2023 | $5.47 | .23 | (.17) | .06 | (.48) | — | (.48) | $5.05 | .80 | $421,321 | .75e | 4.32e | 1,123 |
| October 31, 2022 | 6.88 | .19 | (1.33) | (1.14) | (.27) | — | (.27) | 5.47 | (17.05) | 489,179 | .75e | 3.06e | 865 |
| October 31, 2021 | 7.31 | .16 | (.22) | (.06) | (.14) | (.23) | (.37) | 6.88 | (.94) | 705,423 | .73e | 2.30e | 1,038 |
| October 31, 2020 | 7.25 | .16 | .17 | .33 | (.06) | (.21) | (.27) | 7.31 | 4.80 | 814,135 | .74e | 2.19e | 1,025 |
| October 31, 2019 | 6.69 | .23 | .57 | .80 | (.24) | — | (.24) | 7.25 | 12.18 | 731,358 | .85 | 3.25 | 820 |
| Class B | | | | | | | | | | | | | |
| October 31, 2023 | $5.39 | .20 | (.17) | .03 | (.44) | — | (.44) | $4.98 | .18 | $715 | 1.50e | 3.64e | 1,123 |
| October 31, 2022 | 6.79 | .14 | (1.32) | (1.18) | (.22) | — | (.22) | 5.39 | (17.78) | 1,947 | 1.50e | 2.24e | 865 |
| October 31, 2021 | 7.21 | .11 | (.21) | (.10) | (.09) | (.23) | (.32) | 6.79 | (1.59) | 4,027 | 1.48e | 1.53e | 1,038 |
| October 31, 2020 | 7.16 | .11 | .16 | .27 | (.01) | (.21) | (.22) | 7.21 | 3.96 | 6,557 | 1.49e | 1.49e | 1,025 |
| October 31, 2019 | 6.61 | .17 | .57 | .74 | (.19) | — | (.19) | 7.16 | 11.34 | 9,471 | 1.60 | 2.55 | 820 |
| Class C | | | | | | | | | | | | | |
| October 31, 2023 | $5.41 | .19 | (.17) | .02 | (.44) | — | (.44) | $4.99 | .04 | $29,291 | 1.50e | 3.60e | 1,123 |
| October 31, 2022 | 6.81 | .14 | (1.32) | (1.18) | (.22) | — | (.22) | 5.41 | (17.72) | 40,130 | 1.50e | 2.27e | 865 |
| October 31, 2021 | 7.23 | .11 | (.21) | (.10) | (.09) | (.23) | (.32) | 6.81 | (1.56) | 75,865 | 1.48e | 1.55e | 1,038 |
| October 31, 2020 | 7.18 | .10 | .17 | .27 | (.01) | (.21) | (.22) | 7.23 | 3.95 | 120,340 | 1.49e | 1.46e | 1,025 |
| October 31, 2019 | 6.63 | .17 | .57 | .74 | (.19) | — | (.19) | 7.18 | 11.31 | 125,300 | 1.60 | 2.50 | 820 |
| Class M | | | | | | | | | | | | | |
| October 31, 2023 | $5.27 | .21 | (.16) | .05 | (.47) | — | (.47) | $4.85 | .59 | $34,081 | 1.00e | 4.06e | 1,123 |
| October 31, 2022 | 6.65 | .17 | (1.29) | (1.12) | (.26) | — | (.26) | 5.27 | (17.36) | 38,812 | 1.00e | 2.82e | 865 |
| October 31, 2021 | 7.08 | .14 | (.21) | (.07) | (.13) | (.23) | (.36) | 6.65 | (1.16) | 53,418 | .98e | 2.05e | 1,038 |
| October 31, 2020 | 7.03 | .14 | .17 | .31 | (.05) | (.21) | (.26) | 7.08 | 4.57 | 60,661 | .99e | 1.97e | 1,025 |
| October 31, 2019 | 6.50 | .20 | .56 | .76 | (.23) | — | (.23) | 7.03 | 11.85 | 76,324 | 1.10 | 3.01 | 820 |
| Class R | | | | | | | | | | | | | |
| October 31, 2023 | $5.40 | .22 | (.17) | .05 | (.47) | — | (.47) | $4.98 | .58 | $6,266 | 1.00e | 4.09e | 1,123 |
| October 31, 2022 | 6.81 | .17 | (1.32) | (1.15) | (.26) | — | (.26) | 5.40 | (17.41) | 7,488 | 1.00e | 2.82e | 865 |
| October 31, 2021 | 7.23 | .14 | (.20) | (.06) | (.13) | (.23) | (.36) | 6.81 | (1.03) | 11,023 | .98e | 2.05e | 1,038 |
| October 31, 2020 | 7.18 | .14 | .17 | .31 | (.05) | (.21) | (.26) | 7.23 | 4.46 | 11,932 | .99e | 1.95e | 1,025 |
| October 31, 2019 | 6.62 | .21 | .57 | .78 | (.22) | — | (.22) | 7.18 | 12.04 | 12,699 | 1.10 | 3.02 | 820 |
| Class R5 | | | | | | | | | | | | | |
| October 31, 2023 | $5.54 | .25 | (.17) | .08 | (.50) | — | (.50) | $5.12 | 1.05 | $3,173 | .45e | 4.58e | 1,123 |
| October 31, 2022 | 6.97 | .21 | (1.35) | (1.14) | (.29) | — | (.29) | 5.54 | (16.87) | 4,572 | .45e | 3.38e | 865 |
| October 31, 2021 | 7.39 | .18 | (.20) | (.02) | (.17) | (.23) | (.40) | 6.97 | (.48) | 5,843 | .45e | 2.57e | 1,038 |
| October 31, 2020 | 7.33 | .18 | .18 | .36 | (.09) | (.21) | (.30) | 7.39 | 5.09 | 5,408 | .45e | 2.48e | 1,025 |
| October 31, 2019 | 6.77 | .25 | .57 | .82 | (.26) | — | (.26) | 7.33 | 12.41 | 5,105 | .57 | 3.55 | 820 |
See notes to financial highlights at the end of this section.
The accompanying notes are an integral part of these financial statements.
| |
| 76 Income Fund | Income Fund 77 |
Financial highlights cont.
| | | | | | | | | | | | | |
| | INVESTMENT OPERATIONS | | | LESS DISTRIBUTIONS | | | | | RATIOS AND SUPPLEMENTAL DATA | |
| | | | | | | | | | | | | Ratio of net | |
| | Net asset | | Net realized | | | | | | | | Ratio | investment | |
| | value, | | and unrealized | Total from | From net | From net | | Net asset | Total return | Net assets, | of expenses | income (loss) | Portfolio |
| | beginning | Net investment | gain (loss) | investment | investment | realized gain | Total | value, end | at net asset | end of period | to average | to average | turnover |
| Period ended | of period | income (loss)a | on investments | operations | income | on investments | distributions | of period | value (%)b | (in thousands) | net assets (%)c | net assets (%) | (%)d |
| Class R6 | | | | | | | | | | | | | |
| October 31, 2023 | $5.58 | .26 | (.17) | .09 | (.51) | — | (.51) | $5.16 | 1.20 | $170,838 | .38e | 4.66e | 1,123 |
| October 31, 2022 | 7.02 | .22 | (1.37) | (1.15) | (.29) | — | (.29) | 5.58 | (16.83) | 158,971 | .38e | 3.45e | 865 |
| October 31, 2021 | 7.44 | .19 | (.21) | (.02) | (.17) | (.23) | (.40) | 7.02 | (.46) | 202,650 | .38e | 2.65e | 1,038 |
| October 31, 2020 | 7.38 | .18 | .18 | .36 | (.09) | (.21) | (.30) | 7.44 | 5.06 | 187,674 | .38e | 2.51e | 1,025 |
| October 31, 2019 | 6.80 | .25 | .59 | .84 | (.26) | — | (.26) | 7.38 | 12.65 | 129,746 | .50 | 3.57 | 820 |
| Class Y | | | | | | | | | | | | | |
| October 31, 2023 | $5.58 | .26 | (.17) | .09 | (.50) | — | (.50) | $5.17 | 1.19 | $591,001 | .50e | 4.62e | 1,123 |
| October 31, 2022 | 7.02 | .21 | (1.37) | (1.16) | (.28) | — | (.28) | 5.58 | (16.97) | 1,223,027 | .50e | 3.25e | 865 |
| October 31, 2021 | 7.44 | .18 | (.21) | (.03) | (.16) | (.23) | (.39) | 7.02 | (.57) | 2,411,628 | .48e | 2.55e | 1,038 |
| October 31, 2020 | 7.38 | .17 | .18 | .35�� | (.08) | (.21) | (.29) | 7.44 | 4.95 | 2,708,880 | .49e | 2.36e | 1,025 |
| October 31, 2019 | 6.80 | .24 | .60 | .84 | (.26) | — | (.26) | 7.38 | 12.51 | 1,380,554 | .60 | 3.42 | 820 |
a Per share net investment income has been determined on the basis of the weighted average number of shares outstanding during the period.
b Total return assumes dividend reinvestment and does not reflect the effect of sales charges.
c Includes amounts paid through expense offset and/or brokerage/service arrangements, if any (Note 2). Also excludes acquired fund fees and expenses, if any.
d Portfolio turnover includes TBA purchase and sale commitments.
e Reflects an involuntary contractual expense limitation in effect during the period. As a result of such limitation, the expenses of each class reflect a reduction of the following amounts (Note 2):
| | |
| | Percentage of average net assets | |
| October 31, 2023 | 0.12% | |
| October 31, 2022 | 0.11 | |
| October 31, 2021 | 0.10 | |
| October 31, 2020 | 0.10 | |
The accompanying notes are an integral part of these financial statements.
| |
| 78 Income Fund | Income Fund 79 |
Notes to financial statements 10/31/23
Unless otherwise noted, the “reporting period” represents the period from November 1, 2022 through October 31, 2023. The following table defines commonly used references within the Notes to financial statements:
| |
| References to | Represent |
| Putnam Management | Putnam Investment Management, LLC, the fund’s manager, an indirect wholly-owned |
| | subsidiary of Putnam Investments, LLC |
| State Street | State Street Bank and Trust Company |
| JPMorgan | JPMorgan Chase Bank, N.A. |
| the SEC | the Securities and Exchange Commission |
| OTC | over-the-counter |
| PIL | Putnam Investments Limited, an affiliate of Putnam Management |
Putnam Income Fund (the fund) is a Massachusetts business trust, which is registered under the Investment Company Act of 1940, as amended, as a diversified open-end management investment company. The goal of the fund is to seek high current income consistent with what Putnam Management believes to be prudent risk. The fund invests mainly in bonds that are securitized debt instruments (such as mortgage-backed investments) and related derivative instruments, and other obligations of companies and governments worldwide denominated in U.S. dollars or (to a lesser extent) foreign currencies, are either investment-grade or below-investment-grade in quality (sometimes referred to as “junk bonds”) and have intermediate- to long-term maturities (three years or longer). The fund currently has significant investment exposure to residential and commercial mortgage-backed securities. Putnam Management may consider, among other factors, credit, interest rate and prepayment risks, as well as general market conditions, when deciding whether to buy or sell investments. The fund typically uses to a significant extent derivatives, including credit default swaps, interest rate swaps, total return swaps, to-be-announced (TBA) commitments, futures, options, and swaptions, including on mortgage-backed securities and indices, and certain foreign currency transactions, for both hedging and non-hedging purposes including to obtain or adjust exposure to mortgage-backed investments.
The fund offers the following share classes. The expenses for each class of shares may differ based on the distribution and investor servicing fees of each class, which are identified in Note 2.
| | | |
| Share class | Sales charge | Contingent deferred sales charge | Conversion feature |
| | | 1.00% on certain redemptions of shares | |
| Class A | Up to 4.00% | bought with no initial sales charge | None |
| | | | Converts to class A shares |
| Class B* | None | 5.00% phased out over six years | after 8 years |
| | | | Converts to class A shares |
| Class C | None | 1.00% eliminated after one year | after 8 years |
| Class M† | Up to 3.25% | None | None |
| Class R† | None | None | None |
| Class R5† | None | None | None |
| Class R6† | None | None | None |
| Class Y† | None | None | None |
* Purchases of class B shares are closed to new and existing investors except by exchange from class B shares of another Putnam fund or through dividend and/or capital gains reinvestment.
† Not available to all investors.
In the normal course of business, the fund enters into contracts that may include agreements to indemnify another party under given circumstances. The fund’s maximum exposure under these arrangements is unknown as this would involve future claims that may be, but have not yet been, made against the fund. However, the fund’s management team expects the risk of material loss to be remote.
The fund has entered into contractual arrangements with an investment adviser, administrator, distributor, shareholder servicing agent and custodian, who each provide services to the fund. Unless expressly stated otherwise, shareholders are not parties to, or intended beneficiaries of these contractual arrangements, and these contractual arrangements are not intended to create any shareholder right to enforce them against the service providers or to seek any remedy under them against the service providers, either directly or on behalf of the fund.
Under the fund’s Amended and Restated Agreement and Declaration of Trust, any claims asserted by a shareholder against or on behalf of the fund, including claims against Trustees and Officers, must be brought in state and federal courts located within the Commonwealth of Massachusetts.
Note 1: Significant accounting policies
The fund is an investment company and applies the accounting and reporting guidance of the Financial Accounting Standards Board (FASB) Accounting Standards Codification Topic 946 Financial Services - Investment Companies. The following is a summary of significant accounting policies consistently followed by the fund in the preparation of its financial statements. The preparation of financial statements is in conformity with accounting principles generally accepted in the United States of America and requires management to make estimates and assumptions that affect the reported amounts of assets and liabilities in the financial statements and the reported amounts of increases and decreases in net assets from operations. Actual results could differ from those estimates. Subsequent events after the Statement of assets and liabilities date through the date that the financial statements were issued have been evaluated in the preparation of the financial statements.
Investment income, realized and unrealized gains and losses and expenses of the fund are borne pro-rata based on the relative net assets of each class to the total net assets of the fund, except that each class bears expenses unique to that class (including the distribution fees applicable to such classes). Each class votes as a class only with respect to its own distribution plan or other matters on which a class vote is required by law or determined by the Trustees. If the fund were liquidated, shares of each class would receive their pro-rata share of the net assets of the fund. In addition, the Trustees declare separate dividends on each class of shares.
Security valuation Portfolio securities and other investments are valued using policies and procedures adopted by the Board of Trustees. The Trustees have formed a Pricing Committee to oversee the implementation of these procedures and have delegated responsibility for valuing the fund’s assets in accordance with these procedures to Putnam Management. Putnam Management has established an internal Valuation Committee that is responsible for making fair value determinations, evaluating the effectiveness of the pricing policies of the fund and reporting to the Pricing Committee.
Market quotations are not considered to be readily available for certain debt obligations (including short-term investments with remaining maturities of 60 days or less) and other investments; such investments are valued on the basis of valuations furnished by an independent pricing service approved by the Trustees or dealers selected by Putnam Management. Such services or dealers determine valuations for normal institutional-size trading units of such securities using methods based on market transactions for comparable securities and various relationships, generally recognized by institutional traders, between securities (which consider such factors as security prices, yields, maturities and ratings). These securities will generally be categorized as Level 2. Securities quoted in foreign currencies, if any, are translated into U.S. dollars at the current exchange rate.
Investments in open-end investment companies (excluding exchange-traded funds), if any, which can be classified as Level 1 or Level 2 securities, are valued based on their net asset value. The net asset value of such investment companies equals the total value of their assets less their liabilities and divided by the number of their outstanding shares.
To the extent a pricing service or dealer is unable to value a security or provides a valuation that Putnam Management does not believe accurately reflects the security’s fair value, the security will be valued at fair value by Putnam Management, which has been designated as valuation designee pursuant to Rule 2a–5 under the Investment Company Act of 1940, in accordance with policies and procedures approved by the Trustees. Certain investments, including certain restricted and illiquid securities and derivatives, are also valued at fair value following procedures approved by the Trustees. These valuations consider such factors as significant market or specific security events such as interest rate or credit quality changes, various relationships with other securities, discount rates, U.S. Treasury, U.S. swap and credit yields, index levels, convexity exposures, recovery rates, sales and other multiples and resale restrictions. These securities are classified as Level 2 or as Level 3 depending on the priority of the significant inputs.
To assess the continuing appropriateness of fair valuations, the Valuation Committee reviews and affirms the reasonableness of such valuations on a regular basis after considering all relevant information that is reasonably available. Such valuations and procedures are reviewed periodically by the Trustees. Certain securities may be valued on the basis of a price provided by a single source. The fair value of securities is generally determined as the amount that the fund could reasonably expect to realize from an orderly disposition of such securities over a reasonable period of time. By its nature, a fair value price is a good faith estimate of the value of a security in a current sale and does not reflect an actual market price, which may be different by a material amount.
Joint trading account Pursuant to an exemptive order from the SEC, the fund may transfer uninvested cash balances into a joint trading account along with the cash of other registered investment companies and certain other accounts managed by Putnam Management. These balances may be invested in issues of short-term investments having maturities of up to 90 days.
Repurchase agreements The fund, or any joint trading account, through its custodian, receives delivery of the underlying securities, the fair value of which at the time of purchase is required to be in an amount at least equal to the resale price, including accrued interest. Collateral for certain tri-party repurchase agreements is held at the counterparty’s custodian in a segregated account for the benefit of the fund and the counterparty. Putnam Management is responsible for determining that the value of these underlying securities is at all times at least equal to the resale price, including accrued interest. In the event of default or bankruptcy by the other party to the agreement, retention of the collateral may be subject to legal proceedings.
Security transactions and related investment income Security transactions are recorded on the trade date (the date the order to buy or sell is executed). Gains or losses on securities sold are determined on the identified cost basis.
Interest income, net of any applicable withholding taxes, if any, is recorded on the accrual basis. Amortization and accretion of premiums and discounts on debt securities, if any, is recorded on the accrual basis.
The fund may have earned certain fees in connection with its senior loan purchasing activities. These fees, if any, are treated as market discount and are amortized into income in the Statement of operations.
Securities purchased or sold on a forward commitment or delayed delivery basis may be settled at a future date beyond customary settlement time; interest income is accrued based on the terms of the securities. Losses may arise due to changes in the fair value of the underlying securities or if the counterparty does not perform under the contract.
Stripped securities The fund may invest in stripped securities which represent a participation in securities that may be structured in classes with rights to receive different portions of the interest and principal. Interest-only securities receive all of the interest and principal-only securities receive all of the principal. If the interest-only securities experience greater than anticipated prepayments of principal, the fund may fail to recoup fully its initial investment in these securities. Conversely, principal-only securities increase in value if prepayments are greater than anticipated and decline if prepayments are slower than anticipated. The fair value of these securities is highly sensitive to changes in interest rates.
Foreign currency translation The accounting records of the fund are maintained in U.S. dollars. The fair value of foreign securities, currency holdings, and other assets and liabilities is recorded in the books and records of the fund after translation to U.S. dollars based on the exchange rates on that day. The cost of each security is determined using historical exchange rates. Income and withholding taxes are translated at prevailing exchange rates when earned or incurred. The fund does not isolate that portion of realized or unrealized gains or losses resulting from changes in the foreign exchange rate on investments from fluctuations arising from changes in the market prices of the securities. Such gains and losses are included with the net realized and unrealized gain or loss on investments. Net realized gains and losses on foreign currency transactions represent net realized exchange gains or losses on disposition of foreign currencies, currency gains and losses realized between the trade and settlement dates on securities transactions and the difference between the amount of investment income and foreign withholding taxes recorded on the fund’s books and the U.S. dollar equivalent amounts actually received or paid. Net unrealized appreciation and depreciation of assets and liabilities in foreign currencies arise from changes in the value of assets and liabilities other than investments at the period end, resulting from changes in the exchange rate.
Options contracts The fund uses options contracts to hedge duration and convexity, to isolate prepayment risk and to manage downside risks.
The potential risk to the fund is that the change in value of options contracts may not correspond to the change in value of the hedged instruments. In addition, losses may arise from changes in the value of the underlying instruments if there is an illiquid secondary market for the contracts, if interest or exchange rates move unexpectedly or if the counterparty to the contract is unable to perform. Realized gains and losses on purchased options are included in realized gains and losses on investment securities. If a written call option is exercised, the premium originally received is recorded as an addition to sales proceeds. If a written put option is exercised, the premium originally received is recorded as a reduction to the cost of investments.
Exchange-traded options are valued at the last sale price or, if no sales are reported, the last bid price for purchased options and the last ask price for written options. OTC traded options are valued using prices supplied by dealers.
Options on swaps are similar to options on securities except that the premium paid or received is to buy or grant the right to enter into a previously agreed upon interest rate or credit default contract. Forward premium swap option contracts include premiums that have extended settlement dates. The delayed settlement of the premiums is factored into the daily valuation of the option contracts. In the case of interest rate cap and floor contracts, in return for a premium, ongoing payments between two parties are based on interest rates exceeding a specified rate, in the case of a cap contract, or falling below a specified rate in the case of a floor contract.
Written option contracts outstanding at period end, if any, are listed after the fund’s portfolio.
Futures contracts The fund uses futures contracts for hedging treasury term structure risk and for yield curve positioning.
The potential risk to the fund is that the change in value of futures contracts may not correspond to the change in value of the hedged instruments. In addition, losses may arise from changes in the value of the underlying instruments, if there is an illiquid secondary market for the contracts, if interest or exchange rates move unexpectedly or if the counterparty to the contract is unable to perform. With futures, there is minimal counterparty credit risk to the fund since futures are exchange traded and the exchange’s clearinghouse, as counterparty to all exchange traded futures, guarantees the futures against default. Risks may exceed amounts recognized on the Statement of assets and liabilities. When the contract is closed, the fund records a realized gain or loss equal to the difference between the value of the contract at the time it was opened and the value at the time it was closed.
Futures contracts are valued at the quoted daily settlement prices established by the exchange on which they trade. The fund and the broker agree to exchange an amount of cash equal to the daily fluctuation in the value of the futures contract. Such receipts or payments are known as “variation margin.”
Futures contracts outstanding at period end, if any, are listed after the fund’s portfolio.
Forward currency contracts The fund buys and sells forward currency contracts, which are agreements between two parties to buy and sell currencies at a set price on a future date. These contracts are used for hedging currency exposures.
The U.S. dollar value of forward currency contracts is determined using current forward currency exchange rates supplied by a quotation service. The fair value of the contract will fluctuate with changes in currency exchange rates. The contract is marked to market daily and the change in fair value is recorded as an unrealized gain or loss. The fund records a realized gain or loss equal to the difference between the value of the contract at the time it was opened and the value at the time it was closed when the contract matures or by delivery of the currency. The fund could be exposed to risk if the value of the currency changes unfavorably, if the counterparties to the contracts are unable to meet the terms of their contracts or if the fund is unable to enter into a closing position. Risks may exceed amounts recognized on the Statement of assets and liabilities.
Forward currency contracts outstanding at period end, if any, are listed after the fund’s portfolio.
Interest rate swap contracts The fund entered into OTC and/or centrally cleared interest rate swap contracts, which are arrangements between two parties to exchange cash flows based on a notional principal amount, for hedging term structure risk and for yield curve positioning.
An OTC and centrally cleared interest rate swap can be purchased or sold with an upfront premium. For OTC interest rate swap contracts, an upfront payment received by the fund is recorded as a liability on the fund’s books. An upfront payment made by the fund is recorded as an asset on the fund’s books. OTC and centrally cleared interest rate swap contracts are marked to market daily based upon quotations from an independent pricing service or market makers. Any change is recorded as an unrealized gain or loss on OTC interest rate swaps. Daily fluctuations in the value of centrally cleared interest rate swaps are settled through a central clearing agent
and are recorded in variation margin on the Statement of assets and liabilities and recorded as unrealized gain or loss. Payments, including upfront premiums, received or made are recorded as realized gains or losses at the reset date or the closing of the contract. Certain OTC and centrally cleared interest rate swap contracts may include extended effective dates. Payments related to these swap contracts are accrued based on the terms of the contract.
The fund could be exposed to credit or market risk due to unfavorable changes in the fluctuation of interest rates or if the counterparty defaults, in the case of OTC interest rate contracts, or the central clearing agency or a clearing member defaults, in the case of centrally cleared interest rate swap contracts, on its respective obligation to perform under the contract. The fund’s maximum risk of loss from counterparty risk or central clearing risk is the fair value of the contract. This risk may be mitigated for OTC interest rate swap contracts by having a master netting arrangement between the fund and the counterparty and for centrally cleared interest rate swap contracts through the daily exchange of variation margin. There is minimal counterparty risk with respect to centrally cleared interest rate swap contracts due to the clearinghouse guarantee fund and other resources that are available in the event of a clearing member default. Risk of loss may exceed amounts recognized on the Statement of assets and liabilities.
OTC and centrally cleared interest rate swap contracts outstanding, including their respective notional amounts at period end, if any, are listed after the fund’s portfolio.
At the close of the reporting period, the fund has deposited cash valued at $8,284,400 in a segregated account to cover margin requirements on open centrally cleared interest rate swap contracts.
Total return swap contracts The fund entered into OTC and/or centrally cleared total return swap contracts, which are arrangements to exchange a market-linked return for a periodic payment, both based on a notional principal amount, to hedge sector exposure and for gaining exposure to specific sectors.
To the extent that the total return of the security, index or other financial measure underlying the transaction exceeds or falls short of the offsetting interest rate obligation, the fund will receive a payment from or make a payment to the counterparty. OTC and/or centrally cleared total return swap contracts are marked to market daily based upon quotations from an independent pricing service or market maker. Any change is recorded as an unrealized gain or loss on OTC total return swaps. Daily fluctuations in the value of centrally cleared total return swaps are settled through a central clearing agent and are recorded in variation margin on the Statement of assets and liabilities and recorded as unrealized gain or loss. Payments received or made are recorded as realized gains or losses. Certain OTC and/or centrally cleared total return swap contracts may include extended effective dates. Payments related to these swap contracts are accrued based on the terms of the contract. The fund could be exposed to credit or market risk due to unfavorable changes in the fluctuation of interest rates or in the price of the underlying security or index, the possibility that there is no liquid market for these agreements or that the counterparty may default on its obligation to perform. The fund’s maximum risk of loss from counterparty risk or central clearing risk is the fair value of the contract. This risk may be mitigated for OTC total return swap contracts by having a master netting arrangement between the fund and the counterparty and for centrally cleared total return swap contracts through the daily exchange of variation margin. There is minimal counterparty risk with respect to centrally cleared total return swap contracts due to the clearinghouse guarantee fund and other resources that are available in the event of a clearing member default. Risk of loss may exceed amounts recognized on the Statement of assets and liabilities.
OTC and/or centrally cleared total return swap contracts outstanding, including their respective notional amounts at period end, if any, are listed after the fund’s portfolio.
Credit default contracts The fund entered into OTC and/or centrally cleared credit default contracts to hedge credit risk, for gaining liquid exposure to individual names, to hedge market risk and for gaining exposure to specific sectors.
In OTC and centrally cleared credit default contracts, the protection buyer typically makes a periodic stream of payments to a counterparty, the protection seller, in exchange for the right to receive a contingent payment upon the occurrence of a credit event on the reference obligation or all other equally ranked obligations of the reference entity. Credit events are contract specific but may include bankruptcy, failure to pay, restructuring and obligation acceleration. For OTC credit default contracts, an upfront payment received by the fund is recorded as a liability on the fund’s books. An upfront payment made by the fund is recorded as an asset on the fund’s books. Centrally cleared credit default contracts provide the same rights to the protection buyer and seller except the payments between parties, including upfront premiums, are settled through a central clearing agent through variation margin payments. Upfront and periodic payments received or paid by the fund for OTC and centrally
cleared credit default contracts are recorded as realized gains or losses at the reset date or close of the contract. The OTC and centrally cleared credit default contracts are marked to market daily based upon quotations from an independent pricing service or market makers. Any change in value of OTC credit default contracts is recorded as an unrealized gain or loss. Daily fluctuations in the value of centrally cleared credit default contracts are recorded in variation margin on the Statement of assets and liabilities and recorded as unrealized gain or loss. Upon the occurrence of a credit event, the difference between the par value and fair value of the reference obligation, net of any proportional amount of the upfront payment, is recorded as a realized gain or loss.
In addition to bearing the risk that the credit event will occur, the fund could be exposed to market risk due to unfavorable changes in interest rates or in the price of the underlying security or index or the possibility that the fund may be unable to close out its position at the same time or at the same price as if it had purchased the underlying reference obligations. In certain circumstances, the fund may enter into offsetting OTC and centrally cleared credit default contracts which would mitigate its risk of loss. Risks of loss may exceed amounts recognized on the Statement of assets and liabilities. The fund’s maximum risk of loss from counterparty risk, either as the protection seller or as the protection buyer, is the fair value of the contract. This risk may be mitigated for OTC credit default contracts by having a master netting arrangement between the fund and the counterparty and for centrally cleared credit default contracts through the daily exchange of variation margin. Counterparty risk is further mitigated with respect to centrally cleared credit default swap contracts due to the clearinghouse guarantee fund and other resources that are available in the event of a clearing member default. Where the fund is a seller of protection, the maximum potential amount of future payments the fund may be required to make is equal to the notional amount.
OTC and centrally cleared credit default contracts outstanding, including their respective notional amounts at period end, if any, are listed after the fund’s portfolio.
TBA commitments The fund may enter into TBA (to be announced) commitments to purchase securities for a fixed unit price at a future date beyond customary settlement time. Although the unit price and par amount have been established, the actual securities have not been specified. However, it is anticipated that the amount of the commitments will not significantly differ from the principal amount. The fund holds, and maintains until settlement date, cash or high-grade debt obligations in an amount sufficient to meet the purchase price, or the fund may enter into offsetting contracts for the forward sale of other securities it owns. Income on the securities will not be earned until settlement date.
The fund may also enter into TBA sale commitments to hedge its portfolio positions, to sell mortgage-backed securities it owns under delayed delivery arrangements or to take a short position in mortgage-backed securities. Proceeds of TBA sale commitments are not received until the contractual settlement date. During the time a TBA sale commitment is outstanding, either equivalent deliverable securities or an offsetting TBA purchase commitment deliverable on or before the sale commitment date are held as “cover” for the transaction, or other liquid assets in an amount equal to the notional value of the TBA sale commitment are segregated. If the TBA sale commitment is closed through the acquisition of an offsetting TBA purchase commitment, the fund realizes a gain or loss. If the fund delivers securities under the commitment, the fund realizes a gain or a loss from the sale of the securities based upon the unit price established at the date the commitment was entered into.
TBA commitments, which are accounted for as purchase and sale transactions, may be considered securities themselves, and involve a risk of loss due to changes in the value of the security prior to the settlement date as well as the risk that the counterparty to the transaction will not perform its obligations. Counterparty risk is mitigated by having a master agreement between the fund and the counterparty.
Unsettled TBA commitments are valued at their fair value according to the procedures described under “Security valuation” above. The contract is marked to market daily and the change in fair value is recorded by the fund as an unrealized gain or loss. Based on market circumstances, Putnam Management will determine whether to take delivery of the underlying securities or to dispose of the TBA commitments prior to settlement.
TBA purchase commitments outstanding at period end, if any, are listed within the fund’s portfolio and TBA sale commitments outstanding at period end, if any, are listed after the fund’s portfolio.
Master agreements The fund is a party to ISDA (International Swaps and Derivatives Association, Inc.) Master Agreements that govern OTC derivative and foreign exchange contracts and Master Securities Forward Transaction Agreements that govern transactions involving mortgage-backed and other asset-backed securities that may result in delayed delivery (Master Agreements) with certain counterparties entered into from time to time. The Master Agreements may contain provisions regarding, among other things, the parties’ general obligations, representations, agreements, collateral requirements, events of default and early termination. With respect to
certain counterparties, in accordance with the terms of the Master Agreements, collateral pledged to the fund is held in a segregated account by the fund’s custodian and, with respect to those amounts which can be sold or repledged, are presented in the fund’s portfolio.
Collateral pledged by the fund is segregated by the fund’s custodian and identified in the fund’s portfolio. Collateral can be in the form of cash or debt securities issued by the U.S. Government or related agencies or other securities as agreed to by the fund and the applicable counterparty. Collateral requirements are determined based on the fund’s net position with each counterparty.
With respect to ISDA Master Agreements, termination events applicable to the fund may occur upon a decline in the fund’s net assets below a specified threshold over a certain period of time. Termination events applicable to counterparties may occur upon a decline in the counterparty’s long-term or short-term credit ratings below a specified level. In each case, upon occurrence, the other party may elect to terminate early and cause settlement of all derivative and foreign exchange contracts outstanding, including the payment of any losses and costs resulting from such early termination, as reasonably determined by the terminating party. Any decision by one or more of the fund’s counterparties to elect early termination could impact the fund’s future derivative activity.
At the close of the reporting period, the fund had a net liability position of $5,679,154 on open derivative contracts subject to the Master Agreements. Collateral pledged by the fund at period end for these agreements totaled $5,604,649 and may include amounts related to unsettled agreements.
Interfund lending The fund, along with other Putnam funds, may participate in an interfund lending program pursuant to an exemptive order issued by the SEC. This program allows the fund to borrow from or lend to other Putnam funds that permit such transactions. Interfund lending transactions are subject to each fund’s investment policies and borrowing and lending limits. Interest earned or paid on the interfund lending transaction will be based on the average of certain current market rates. During the reporting period, the fund did not utilize the program.
Lines of credit The fund participates, along with other Putnam funds, in a $320 million syndicated unsecured committed line of credit, provided by State Street ($160 million) and JPMorgan ($160 million), and a $235.5 million unsecured uncommitted line of credit, provided by State Street. Borrowings may be made for temporary or emergency purposes, including the funding of shareholder redemption requests and trade settlements. Interest is charged to the fund based on the fund’s borrowing at a rate equal to 1.25% plus the higher of (1) the Federal Funds rate and (2) the Overnight Bank Funding Rate for the committed line of credit and 1.30% plus the higher of (1) the Federal Funds rate and (2) the Overnight Bank Funding Rate for the uncommitted line of credit. A closing fee equal to 0.04% of the committed line of credit and 0.04% of the uncommitted line of credit has been paid by the participating funds and a $75,000 fee has been paid by the participating funds to State Street as agent of the syndicated committed line of credit. In addition, a commitment fee of 0.21% per annum on any unutilized portion of the committed line of credit is allocated to the participating funds based on their relative net assets and paid quarterly. During the reporting period, the fund had no borrowings against these arrangements.
Federal taxes It is the policy of the fund to distribute all of its taxable income within the prescribed time period and otherwise comply with the provisions of the Internal Revenue Code of 1986, as amended (the Code), applicable to regulated investment companies. It is also the intention of the fund to distribute an amount sufficient to avoid imposition of any excise tax under Section 4982 of the Code.
The fund is subject to the provisions of Accounting Standards Codification 740 Income Taxes (ASC 740). ASC 740 sets forth a minimum threshold for financial statement recognition of the benefit of a tax position taken or expected to be taken in a tax return. The fund did not have a liability to record for any unrecognized tax benefits in the accompanying financial statements. No provision has been made for federal taxes on income, capital gains or unrealized appreciation on securities held nor for excise tax on income and capital gains. Each of the fund’s federal tax returns for the prior three fiscal years remains subject to examination by the Internal Revenue Service.
The fund may also be subject to taxes imposed by governments of countries in which it invests. Such taxes are generally based on either income or gains earned or repatriated. The fund accrues and applies such taxes to net investment income, net realized gains and net unrealized gains as income and/or capital gains are earned. In some cases, the fund may be entitled to reclaim all or a portion of such taxes, and such reclaim amounts, if any, are reflected as an asset on the fund’s books. In many cases, however, the fund may not receive such amounts for an extended period of time, depending on the country of investment.
Under the Regulated Investment Company Modernization Act of 2010, the fund will be permitted to carry forward capital losses incurred for an unlimited period and the carry forwards will retain their character as either
short-term or long-term capital losses. At October 31, 2023, the fund had the following capital loss carryovers available, to the extent allowed by the Code, to offset future net capital gain, if any:
| | |
| | Loss carryover | |
| Short-term | Long-term | Total |
| $275,226,496 | $374,959,989 | $650,186,485 |
Distributions to shareholders Distributions to shareholders from net investment income, if any, are recorded by the fund on the ex-dividend date. Distributions from capital gains, if any, are recorded on the ex-dividend date and paid at least annually. The amount and character of income and gains to be distributed are determined in accordance with income tax regulations, which may differ from generally accepted accounting principles. These differences include temporary and/or permanent differences from unrealized gains and losses on certain futures contracts, from income on swap contracts and from interest-only securities. Reclassifications are made to the fund’s capital accounts to reflect income and gains available for distribution (or available capital loss carryovers) under income tax regulations. At the close of the reporting period, the fund reclassified $27,434,107 to increase undistributed net investment income and $27,434,107 to increase accumulated net realized loss.
Tax cost of investments includes adjustments to net unrealized appreciation (depreciation) which may not necessarily be final tax cost basis adjustments, but closely approximate the tax basis unrealized gains and losses that may be realized and distributed to shareholders. The tax basis components of distributable earnings and the federal tax cost as of the close of the reporting period were as follows:
| |
| Unrealized appreciation | $191,789,613 |
| Unrealized depreciation | (429,131,596) |
| Net unrealized depreciation | (237,341,983) |
| Undistributed ordinary income | 58,691,658 |
| Capital loss carryforward | (650,186,485) |
| Cost for federal income tax purposes | $1,930,436,083 |
Note 2: Management fee, administrative services and other transactions
The fund pays Putnam Management a management fee (based on the fund’s average net assets and computed and paid monthly) at annual rates that may vary based on the average of the aggregate net assets of all open-end mutual funds sponsored by Putnam Management (excluding net assets of funds that are invested in, or that are invested in by, other Putnam funds to the extent necessary to avoid “double counting” of those assets). Such annual rates may vary as follows:
| | | | |
| 0.550% | of the first $5 billion, | | 0.350% | of the next $50 billion, |
| 0.500% | of the next $5 billion, | | 0.330% | of the next $50 billion, |
| 0.450% | of the next $10 billion, | | 0.320% | of the next $100 billion and |
| 0.400% | of the next $10 billion, | | 0.315% | of any excess thereafter. |
For the reporting period, the management fee represented an effective rate (excluding the impact from any expense waivers in effect) of 0.391% of the fund’s average net assets.
Putnam Management has contractually agreed, through February 28, 2025, to waive fees and/or reimburse the fund’s expenses to the extent necessary to limit the cumulative expenses of the fund, exclusive of brokerage, interest, taxes, investment-related expenses, extraordinary expenses, acquired fund fees and expenses and payments under the fund’s investor servicing contract, investment management contract and distribution plans, on a fiscal year-to-date basis to an annual rate of 0.20% of the fund’s average net assets over such fiscal year-to-date period. During the reporting period, the fund’s expenses were not reduced as a result of this limit.
Putnam Management has also contractually agreed to waive fees (and, to the extent necessary, bear other expenses) of the fund through February 28, 2025, to the extent that total expenses of the fund (excluding brokerage, interest, taxes, investment-related expenses, payments under distribution plans, extraordinary expenses, payments under the fund’s investor servicing contract and acquired fund fees and expenses, but including payments under the fund’s investment management contract) would exceed an annual rate of 0.33% of
the fund’s average net assets. During the reporting period, the fund’s expenses were reduced by $1,891,138 as a result of this limit.
PIL is authorized by the Trustees to manage a separate portion of the assets of the fund as determined by Putnam Management from time to time. PIL did not manage any portion of the assets of the fund during the reporting period. If Putnam Management were to engage the services of PIL, Putnam Management would pay a quarterly sub-management fee to PIL for its services at an annual rate of 0.20% of the average net assets of the portion of the fund managed by PIL.
The fund reimburses Putnam Management an allocated amount for the compensation and related expenses of certain officers of the fund and their staff who provide administrative services to the fund. The aggregate amount of all such reimbursements is determined annually by the Trustees.
Custodial functions for the fund’s assets are provided by State Street. Custody fees are based on the fund’s asset level, the number of its security holdings and transaction volumes.
Putnam Investor Services, Inc., an affiliate of Putnam Management, provides investor servicing agent functions to the fund. Putnam Investor Services, Inc. received fees for investor servicing for class A, class B, class C, class M, class R and class Y shares that included (1) a per account fee for each direct and underlying non-defined contribution account (retail account) of the fund; (2) a specified rate of the fund’s assets attributable to defined contribution plan accounts; and (3) a specified rate based on the average net assets in retail accounts. Putnam Investor Services, Inc. has agreed that the aggregate investor servicing fees for each fund’s retail and defined contribution accounts for these share classes will not exceed an annual rate of 0.25% of the fund’s average assets attributable to such accounts.
Class R5 shares paid a monthly fee based on the average net assets of class R5 shares at an annual rate of 0.12%.
Class R6 shares paid a monthly fee based on the average net assets of class R6 shares at an annual rate of 0.05%.
During the reporting period, the expenses for each class of shares related to investor servicing fees were as follows:
| | | | |
| Class A | $807,994 | | Class R | 12,024 |
| Class B | 2,164 | | Class R5 | 3,862 |
| Class C | 60,835 | | Class R6 | 84,270 |
| Class M | 63,522 | | Class Y | 1,339,895 |
| | | | Total | $2,374,566 |
The fund has entered into expense offset arrangements with Putnam Investor Services, Inc. and State Street whereby Putnam Investor Services, Inc.’s and State Street’s fees are reduced by credits allowed on cash balances. For the reporting period, the fund’s expenses were reduced by $67,434 under the expense offset arrangements.
Each Independent Trustee of the fund receives an annual Trustee fee, of which $1,146, as a quarterly retainer, has been allocated to the fund, and an additional fee for each Trustees meeting attended. Trustees also are reimbursed for expenses they incur relating to their services as Trustees.
The fund has adopted a Trustee Fee Deferral Plan (the Deferral Plan) which allows the Trustees to defer the receipt of all or a portion of Trustees fees payable on or after July 1, 1995. The deferred fees remain invested in certain Putnam funds until distribution in accordance with the Deferral Plan.
The fund has adopted an unfunded noncontributory defined benefit pension plan (the Pension Plan) covering all Trustees of the fund who have served as a Trustee for at least five years and were first elected prior to 2004. Benefits under the Pension Plan are equal to 50% of the Trustee’s average annual attendance and retainer fees for the three years ended December 31, 2005. The retirement benefit is payable during a Trustee’s lifetime, beginning the year following retirement, for the number of years of service through December 31, 2006. Pension expense for the fund is included in Trustee compensation and expenses in the Statement of operations. Accrued pension liability is included in Payable for Trustee compensation and expenses in the Statement of assets and liabilities. The Trustees have terminated the Pension Plan with respect to any Trustee first elected after 2003.
The fund has adopted distribution plans (the Plans) with respect to the following share classes pursuant to Rule 12b–1 under the Investment Company Act of 1940. The purpose of the Plans is to compensate Putnam Retail Management Limited Partnership, an indirect wholly-owned subsidiary of Putnam Investments, LLC, for services provided and expenses incurred in distributing shares of the fund. The Plans provide payments by the fund to
Putnam Retail Management Limited Partnership at an annual rate of up to the following amounts (Maximum %) of the average net assets attributable to each class. The Trustees have approved payment by the fund at the following annual rate (Approved %) of the average net assets attributable to each class. During the reporting period, the class-specific expenses related to distribution fees were as follows:
| | | |
| | Maximum % | Approved % | Amount |
| Class A | 0.35% | 0.25% | $1,189,912 |
| Class B | 1.00% | 1.00% | 12,700 |
| Class C | 1.00% | 1.00% | 358,230 |
| Class M | 1.00% | 0.50% | 187,153 |
| Class R | 1.00% | 0.50% | 35,428 |
| Total | | | $1,783,423 |
For the reporting period, Putnam Retail Management Limited Partnership, acting as underwriter, received net commissions of $29,450 and $345 from the sale of class A and class M shares, respectively, and received $1 and $164 in contingent deferred sales charges from redemptions of class B and class C shares, respectively.
A deferred sales charge of up to 1.00% is assessed on certain redemptions of class A shares. For the reporting period, Putnam Retail Management Limited Partnership, acting as underwriter, received $79 on class A redemptions.
Note 3: Purchases and sales of securities
During the reporting period, the cost of purchases and the proceeds from sales, excluding short-term investments, were as follows:
| | |
| | Cost of purchases | Proceeds from sales |
| Investments in securities, including TBA commitments (Long-term) | $22,969,748,280 | $23,283,523,152 |
| U.S. government securities (Long-term) | — | — |
| Total | $22,969,748,280 | $23,283,523,152 |
The fund may purchase or sell investments from or to other Putnam funds in the ordinary course of business, which can reduce the fund’s transaction costs, at prices determined in accordance with SEC requirements and policies approved by the Trustees. During the reporting period, purchases or sales of long-term securities from or to other Putnam funds, if any, did not represent more than 5% of the fund’s total cost of purchases and/or total proceeds from sales.
Note 4: Capital shares
At the close of the reporting period, there were an unlimited number of shares of beneficial interest authorized. Transactions, including, if applicable, direct exchanges pursuant to share conversions, in capital shares were as follows:
| | | | |
| | YEAR ENDED 10/31/23 | YEAR ENDED 10/31/22 |
| Class A | Shares | Amount | Shares | Amount |
| Shares sold | 10,661,800 | $57,902,284 | 9,740,305 | $61,101,138 |
| Shares issued in connection with | | | | |
| reinvestment of distributions | 6,991,064 | 37,919,910 | 3,664,577 | 23,237,918 |
| | 17,652,864 | 95,822,194 | 13,404,882 | 84,339,056 |
| Shares repurchased | (23,687,656) | (128,190,790) | (26,419,370) | (166,453,706) |
| Net decrease | (6,034,792) | $(32,368,596) | (13,014,488) | $(82,114,650) |
| | | | |
| | YEAR ENDED 10/31/23 | YEAR ENDED 10/31/22 |
| Class B | Shares | Amount | Shares | Amount |
| Shares sold | 1,965 | $10,814 | 11,705 | $73,365 |
| Shares issued in connection with | | | | |
| reinvestment of distributions | 20,997 | 112,772 | 16,202 | 102,463 |
| | 22,962 | 123,586 | 27,907 | 175,828 |
| Shares repurchased | (240,312) | (1,290,265) | (259,842) | (1,608,822) |
| Net decrease | (217,350) | $(1,166,679) | (231,935) | $(1,432,994) |
| |
| | YEAR ENDED 10/31/23 | YEAR ENDED 10/31/22 |
| Class C | Shares | Amount | Shares | Amount |
| Shares sold | 962,446 | $5,197,719 | 800,371 | $5,104,489 |
| Shares issued in connection with | | | | |
| reinvestment of distributions | 501,779 | 2,695,024 | 299,003 | 1,894,883 |
| | 1,464,225 | 7,892,743 | 1,099,374 | 6,999,372 |
| Shares repurchased | (3,015,180) | (16,165,821) | (4,818,465) | (30,040,568) |
| Net decrease | (1,550,955) | $(8,273,078) | (3,719,091) | $(23,041,196) |
| |
| | YEAR ENDED 10/31/23 | YEAR ENDED 10/31/22 |
| Class M | Shares | Amount | Shares | Amount |
| Shares sold | 21,400 | $113,073 | 9,700 | $57,338 |
| Shares issued in connection with | | | | |
| reinvestment of distributions | — | — | — | — |
| | 21,400 | 113,073 | 9,700 | 57,338 |
| Shares repurchased | (358,500) | (1,864,380) | (680,000) | (4,069,027) |
| Net decrease | (337,100) | $(1,751,307) | (670,300) | $(4,011,689) |
| |
| | YEAR ENDED 10/31/23 | YEAR ENDED 10/31/22 |
| Class R | Shares | Amount | Shares | Amount |
| Shares sold | 167,043 | $892,671 | 234,482 | $1,483,222 |
| Shares issued in connection with | | | | |
| reinvestment of distributions | 114,435 | 612,894 | 60,371 | 378,194 |
| | 281,478 | 1,505,565 | 294,853 | 1,861,416 |
| Shares repurchased | (409,953) | (2,189,197) | (528,089) | (3,256,551) |
| Net decrease | (128,475) | $(683,632) | (233,236) | $(1,395,135) |
| |
| | YEAR ENDED 10/31/23 | YEAR ENDED 10/31/22 |
| Class R5 | Shares | Amount | Shares | Amount |
| Shares sold | 71,095 | $391,270 | 85,113 | $545,157 |
| Shares issued in connection with | | | | |
| reinvestment of distributions | 50,862 | 279,061 | 37,836 | 242,018 |
| | 121,957 | 670,331 | 122,949 | 787,175 |
| Shares repurchased | (328,225) | (1,823,233) | (135,820) | (858,175) |
| Net decrease | (206,268) | $(1,152,902) | (12,871) | $(71,000) |
| | | | |
| | YEAR ENDED 10/31/23 | YEAR ENDED 10/31/22 |
| Class R6 | Shares | Amount | Shares | Amount |
| Shares sold | 11,519,587 | $63,213,239 | 12,562,706 | $80,476,951 |
| Shares issued in connection with | | | | |
| reinvestment of distributions | 2,466,161 | 13,645,370 | 1,214,857 | 7,831,268 |
| | 13,985,748 | 76,858,609 | 13,777,563 | 88,308,219 |
| Shares repurchased | (9,371,916) | (51,855,503) | (14,155,558) | (90,199,613) |
| Net increase (decrease) | 4,613,832 | $25,003,106 | (377,995) | $(1,891,394) |
| |
| | YEAR ENDED 10/31/23 | YEAR ENDED 10/31/22 |
| Class Y | Shares | Amount | Shares | Amount |
| Shares sold | 46,908,523 | $261,636,157 | 66,769,661 | $429,071,062 |
| Shares issued in connection with | | | | |
| reinvestment of distributions | 11,008,288 | 61,131,329 | 11,251,631 | 73,347,944 |
| | 57,916,811 | 322,767,486 | 78,021,292 | 502,419,006 |
| Shares repurchased | (162,588,983) | (926,324,299) | (202,478,351) | (1,307,865,791) |
| Net decrease | (104,672,172) | $(603,556,813) | (124,457,059) | $(805,446,785) |
Note 5: Affiliated transactions
Transactions during the reporting period with any company which is under common ownership or control were as follows:
| | | | | |
| | | | | | Shares |
| | | | | | outstanding |
| | | | | | and fair |
| | Fair value as | Purchase | Sale | Investment | value as |
| Name of affiliate | of 10/31/22 | cost | proceeds | income | of 10/31/23 |
| Short-term investments | | | | | |
| Putnam Short Term | | | | | |
| Investment Fund* | $177,618,143 | $300,870,558 | $347,564,662 | $8,710,312 | $130,924,039 |
| Total Short-term | | | | | |
| investments | $177,618,143 | $300,870,558 | $347,564,662 | $8,710,312 | $130,924,039 |
* Management fees charged to Putnam Short Term Investment Fund have been waived by Putnam Management. There were no realized or unrealized gains or losses during the period.
Note 6: Market, credit and other risks
In the normal course of business, the fund trades financial instruments and enters into financial transactions where risk of potential loss exists due to changes in the market (market risk) or failure of the contracting party to the transaction to perform (credit risk). The fund may be exposed to additional credit risk that an institution or other entity with which the fund has unsettled or open transactions will default. Investments in foreign securities involve certain risks, including those related to economic instability, unfavorable political developments, and currency fluctuations. The fund may invest in higher-yielding, lower-rated bonds that may have a higher rate of default. The fund may invest a significant portion of its assets in securitized debt instruments, including mortgage-backed and asset-backed investments. The yields and values of these investments are sensitive to changes in interest rates, the rate of principal payments on the underlying assets and the market’s perception of the issuers. The market for these investments may be volatile and limited, which may make them difficult to buy or sell.
Note 7: Senior loan commitments
Senior loans are purchased or sold on a when-issued or delayed delivery basis and may be settled a month or more after the trade date, which from time to time can delay the actual investment of available cash balances; interest income is accrued based on the terms of the securities. Senior loans can be acquired through an agent, by assignment from another holder of the loan, or as a participation interest in another holder’s portion of the loan. When the fund invests in a loan or participation, the fund is subject to the risk that an intermediate participant between the fund and the borrower will fail to meet its obligations to the fund, in addition to the risk that the borrower under the loan may default on its obligations.
Note 8: Summary of derivative activity
The volume of activity for the reporting period for any derivative type that was held during the period is listed below and was based on an average of the holdings at the end of each fiscal quarter:
| |
| Purchased swap option contracts (contract amount) | $1,774,900,000 |
| Written swap option contracts (contract amount) | $883,000,000 |
| Futures contracts (number of contracts) | 5,000 |
| Forward currency contracts (contract amount) | $250,000 |
| OTC interest rate swap contracts (notional) | $1,330,800,000 |
| Centrally cleared interest rate swap contracts (notional) | $5,558,900,000 |
| OTC total return swap contracts (notional) | $15,900,000 |
| OTC credit default contracts (notional) | $153,400,000 |
The following is a summary of the fair value of derivative instruments as of the close of the reporting period:
| | | | |
| Fair value of derivative instruments as of the close of the reporting period | |
| | ASSET DERIVATIVES | LIABILITY DERIVATIVES |
| Derivatives not | | | | |
| accounted for as | Statement of | | Statement of | |
| hedging instruments | assets and | | assets and | |
| under ASC 815 | liabilities location | Fair value | liabilities location | Fair value |
| Credit contracts | Receivables | $22,369,905 | Payables | $16,716,519 |
| Foreign exchange | | | | |
| contracts | Receivables | 5,632 | Payables | — |
| | Receivables, Net | | | |
| | assets — Unrealized | | Payables, Net assets — | |
| Interest rate contracts | appreciation | 136,950,897* | Unrealized depreciation | 104,230,487* |
| Total | | $159,326,434 | | $120,947,006 |
* Includes cumulative appreciation/depreciation of futures contracts and/or centrally cleared swaps as reported in the fund’s portfolio. Only current day’s variation margin is reported within the Statement of assets and liabilities.
The following is a summary of realized and change in unrealized gains or losses of derivative instruments in the Statement of operations for the reporting period (see Note 1):
| | | | | |
| Amount of realized gain or (loss) on derivatives recognized in net gain or (loss) on investments |
| Derivatives not accounted | | | Forward | | |
| for as hedging instruments | | | currency | | |
| under ASC 815 | Options | Futures | contracts | Swaps | Total |
| Credit contracts | $— | $— | $— | $(1,303,054) | $(1,303,054) |
| Foreign exchange contracts | — | — | (16,426) | — | $(16,426) |
| Interest rate contracts | 12,109,292 | (74,573,998) | — | 21,560,971 | $(40,903,735) |
| Total | $12,109,292 | $(74,573,998) | $(16,426) | $20,257,917 | $(42,223,215) |
| | | | | |
| Change in unrealized appreciation or (depreciation) on derivatives recognized in net gain or (loss) |
| on investments | | | | | |
| Derivatives not accounted | | | Forward | | |
| for as hedging instruments | | | currency | | |
| under ASC 815 | Options | Futures | contracts | Swaps | Total |
| Credit contracts | $— | $— | $— | $4,877,382 | $4,877,382 |
| Foreign exchange contracts | — | — | (1,171) | — | $(1,171) |
| Interest rate contracts | (22,520,526) | 46,274,500 | — | (9,910,447) | $13,843,527 |
| Total | $(22,520,526) | $46,274,500 | $(1,171) | $(5,033,065) | $18,719,738 |
Note 9: Offsetting of financial and derivative assets and liabilities
The following table summarizes any derivatives, repurchase agreements and reverse repurchase agreements, at the end of the reporting period, that are subject to an enforceable master netting agreement or similar agreement. For securities lending transactions or borrowing transactions associated with securities sold short, if any, see Note 1. For financial reporting purposes, the fund does not offset financial assets and financial liabilities that are subject to the master netting agreements in the Statement of assets and liabilities.
| | | | | | | | | | | | | | | | |
| | Bank of America N.A. | Barclays Bank PLC | Barclays Capital, Inc. (clearing broker) | BofA Securities, Inc. | Citibank, N.A. | Citigroup Global Markets, Inc. | Credit Suisse International | Deutsche Bank AG | Goldman Sachs International | JPMorgan Chase Bank N.A. | JPMorgan Securities LLC | Merrill Lynch International | Morgan Stanley & Co. International PLC | Toronto-Dominion Bank | Wells Fargo Bank, N.A. | Total |
| Assets: | | | | | | | | | | | | | | | | |
| OTC Interest rate | | | | | | | | | | | | | | | | |
| swap contracts*# | $— | $— | $— | $— | $— | $— | $— | $— | $— | $— | $— | $— | $44,475,285 | $— | $— | $44,475,285 |
| Centrally cleared interest | | | | | | | | | | | | | | | | |
| rate swap contracts§ | — | — | 475,957 | — | — | — | — | — | — | — | — | — | — | — | — | 475,957 |
| OTC Total return | | | | | | | | | | | | | | | | |
| swap contracts*# | — | — | — | — | — | — | — | — | — | — | — | — | — | — | — | — |
| OTC Credit default | | | | | | | | | | | | | | | | |
| contracts — protection | | | | | | | | | | | | | | | | |
| sold*# | — | — | — | — | — | — | — | — | — | — | — | — | — | — | — | — |
| OTC Credit default | | | | | | | | | | | | | | | | |
| contracts — protection | | | | | | | | | | | | | | | | |
| purchased*# | — | — | — | — | — | 11,542,000 | 1,774,645 | — | 2,031,712 | — | 780,233 | 575,655 | 5,665,660 | — | — | 22,369,905 |
| Futures contracts§ | — | — | — | — | — | — | — | — | — | — | 235,333 | — | — | — | — | 235,333 |
| Forward currency | | | | | | | | | | | | | | | | |
| contracts# | — | — | — | — | — | — | — | — | — | — | — | — | 5,632 | — | — | 5,632 |
| Forward premium swap | | | | | | | | | | | | | | | | |
| option contracts# | 19,004,872 | 5,571,572 | — | — | 6,606,549 | — | — | 900,497 | 4,024,497 | 10,171,479 | — | — | — | 176,596 | — | 46,456,062 |
| Total Assets | $19,004,872 | $5,571,572 | $475,957 | $— | $6,606,549 | $11,542,000 | $1,774,645 | $900,497 | $6,056,209 | $10,171,479 | $1,015,566 | $575,655 | $50,146,577 | $176,596 | $— | $114,018,174 |
| Liabilities: | | | | | | | | | | | | | | | | |
| OTC Interest rate | | | | | | | | | | | | | | | | |
| swap contracts*# | — | — | — | — | — | — | — | — | — | — | — | — | — | — | — | — |
| Centrally cleared interest | | | | | | | | | | | | | | | | |
| rate swap contracts§ | — | — | 741,980 | — | — | — | — | — | — | — | — | — | — | — | — | 741,980 |
| OTC Total return | | | | | | | | | | | | | | | | |
| swap contracts*# | — | — | — | — | — | — | — | — | — | — | — | — | 1,558,184 | — | — | 1,558,184 |
| OTC Credit default | | | | | | | | | | | | | | | | |
| contracts — protection | | | | | | | | | | | | | | | | |
| sold*# | 152,589 | — | — | — | — | 5,916,017 | 700,112 | — | 319,685 | — | 4,634,922 | 246,786 | 3,188,224 | — | — | 15,158,335 |
| OTC Credit default | | | | | | | | | | | | | | | | |
| contracts — protection | | | | | | | | | | | | | | | | |
| purchased*# | — | — | — | — | — | — | — | — | — | — | — | — | — | — | — | — |
| Futures contracts§ | — | — | — | — | — | — | — | — | — | — | 235,961 | — | — | — | — | 235,961 |
| Forward currency | | | | | | | | | | | | | | | | |
| contracts# | — | — | — | — | — | — | — | — | — | — | — | — | — | — | — | — |
| Forward premium swap | | | | | | | | | | | | | | | | |
| option contracts# | 18,291,839 | 2,299,417 | — | — | 2,600,937 | — | — | 1,370,857 | 2,365,417 | 11,525,584 | — | — | 2,015,500 | 41,036 | — | 40,510,587 |
| Total Liabilities | $18,444,428 | $2,299,417 | $741,980 | $— | $2,600,937 | $5,916,017 | $700,112 | $1,370,857 | $2,685,102 | $11,525,584 | $4,870,883 | $246,786 | $6,761,908 | $41,036 | $— | $58,205,047 |
| |
| 94 Income Fund | Income Fund 95 |
| | | | | | | | | | | | | | | | |
| | Bank of America N.A. | Barclays Bank PLC | Barclays Capital, Inc. (clearing broker) | BofA Securities, Inc. | Citibank, N.A. | Citigroup Global Markets, Inc. | Credit Suisse International | Deutsche Bank AG | Goldman Sachs International | JPMorgan Chase Bank N.A. | JPMorgan Securities LLC | Merrill Lynch International | Morgan Stanley & Co. International PLC | Toronto-Dominion Bank | Wells Fargo Bank, N.A. | Total |
| Total Financial and | | | | | | | | | | | | | | | | |
| Derivative Net Assets | $560,444 | $3,272,155 | $(266,023) | $— | $4,005,612 | $5,625,983 | $1,074,533 | $(470,360) | $3,371,107 | $(1,354,105) | $(3,855,317) | $328,869 | $43,384,669 | $135,560 | $— | $55,813,127 |
| Total collateral | | | | | | | | | | | | | | | | |
| received (pledged)†## | $446,863 | $3,272,155 | $— | $— | $3,949,000 | $4,904,000 | $1,030,000 | $(470,360) | $3,371,107 | $(1,247,897) | $(3,838,781) | $323,000 | $42,468,000 | $130,000 | $— | |
| Net amount | $113,581 | $— | $(266,023) | $— | $56,612 | $721,983 | $44,533 | $— | $— | $(106,208) | $(16,536) | $5,869 | $916,669 | $5,560 | $— | |
| Controlled collateral | | | | | | | | | | | | | | | | |
| received (including | | | | | | | | | | | | | | | | |
| TBA commitments)** | $446,863 | $3,438,000 | $— | $639,000 | $3,949,000 | $4,904,000 | $1,030,000 | $— | $3,420,000 | $— | $— | $323,000 | $42,468,000 | $130,000 | $— | $60,747,863 |
| Uncontrolled collateral | | | | | | | | | | | | | | | | |
| received | $— | $— | $— | $— | $— | $— | $— | $— | $— | $— | $— | $— | $— | $— | $— | $— |
| Collateral (pledged) | | | | | | | | | | | | | | | | |
| (including TBA | | | | | | | | | | | | | | | | |
| commitments)** | $— | $— | $— | $— | $— | $(357,508) | $— | $(517,971) | $— | $(1,247,897) | $(5,236,023) | $— | $— | $— | $(556,703) | $(7,916,102) |
* Excludes premiums, if any. Included in unrealized appreciation and depreciation on OTC swap contracts on the Statement of assets and liabilities.
** Included with Investments in securities on the Statement of assets and liabilities.
† Additional collateral may be required from certain brokers based on individual agreements.
# Covered by master netting agreement (Note 1).
## Any over-collateralization of total financial and derivative net assets is not shown. Collateral may include amounts related to unsettled agreements.
§ Includes current day’s variation margin only as reported on the Statement of assets and liabilities, which is not collateralized. Cumulative appreciation/(depreciation) for futures contracts and centrally cleared swap contracts is represented in the tables listed after the fund’s portfolio. Collateral pledged for initial margin on futures contracts and centrally cleared swap contracts, which is not included in the table above, amounted to $13,177,739 and $8,284,400 respectively.
Note 10: Of special note
On May 31, 2023, Franklin Resources, Inc. (“Franklin Resources”) and Great-West Lifeco Inc., the parent company of Putnam U.S. Holdings I, LLC (“Putnam Holdings”), announced that they have entered into a definitive agreement for a subsidiary of Franklin Resources to acquire Putnam Holdings in a stock and cash transaction.
As part of this transaction, Putnam Management, a wholly-owned subsidiary of Putnam Holdings and investment manager to the Putnam family of funds (the “Putnam Funds”), would become an indirect wholly-owned subsidiary of Franklin Resources.
The transaction is subject to customary closing conditions, including receipt of applicable regulatory approvals. Subject to such approvals and the satisfaction of these conditions, the transaction is currently expected to be consummated in the fourth quarter of 2023 or early 2024.
Under the Investment Company Act of 1940, as amended, consummation of the transaction will result in the automatic termination of the investment management contract between each Putnam Fund and Putnam Management and any related sub-management and sub-advisory contracts, where applicable. In anticipation of this automatic termination, on June 23, 2023, the Board of Trustees of the Putnam Funds approved a new investment management contract between each Putnam Fund and Putnam Management (and new sub-management and sub-advisory contracts, if applicable).
On November 17, 2023, the fund’s shareholders approved the new investment management contract with Putnam Management and the new sub-management contract for the fund between Putnam Management and PIL, each to take effect upon the consummation of the transaction. The terms of the new investment management and sub-management contracts are substantially similar to those of the previous investment management and sub-management contracts, and the fee rates payable under the new investment management and sub-management contracts are the same as the fee rates under the previous investment management and sub-management contracts.
| |
| 96 Income Fund | Income Fund 97 |
Federal tax information (Unaudited)
For the reporting period, pursuant to §871(k) of the Internal Revenue Code, the fund hereby designates $61,385,699 of distributions paid as qualifying to be taxed as interest-related dividends, and no monies to be taxed as short-term capital gain dividends for nonresident alien shareholders.
The Form 1099 that will be mailed to you in January 2024 will show the tax status of all distributions paid to your account in calendar 2023.
Shareholder meeting results (Unaudited)
November 17, 2023 special meeting
At the meeting, a new Management Contract for your fund with Putnam Investment Management, LLC was approved, as follows:
| | |
| Votes for | Votes against | Abstentions/Votes withheld |
| 132,273,233 | 1,414,707 | 2,967,163 |
At the meeting, a new Sub-Management Contract for your fund between Putnam Investment Management, LLC and Putnam Investments Limited was approved, as follows:
| | |
| Votes for | Votes against | Abstentions/Votes withheld |
| 131,984,716 | 1,585,562 | 3,084,825 |
All tabulations are rounded to the nearest whole number.


* Mr. Reynolds is an “interested person” (as defined in the Investment Company Act of 1940) of the fund and Putnam Investments. He is President and Chief Executive Officer of Putnam Investments, as well as the President of your fund and each of the other Putnam funds.
The address of each Trustee is 100 Federal Street, Boston, MA 02110.
As of October 31, 2023, there were 89 mutual funds, 4 closed-end funds, and 12 exchange-traded funds in the Putnam funds complex. Each Trustee serves as Trustee of all funds in the Putnam funds complex.
Each Trustee serves for an indefinite term, until his or her resignation, retirement at age 75, removal, or death.
Officers
In addition to Robert L. Reynolds, the other officers of the fund are shown below:
| |
| James F. Clark (Born 1974) | Alan G. McCormack (Born 1964) |
| Vice President and Chief Compliance Officer | Vice President and Derivatives Risk Manager |
| Since 2016 | Since 2022 |
| Chief Compliance Officer and Chief Risk Officer, | Head of Quantitative Equities and Risk, |
| Putnam Investments, and Chief Compliance Officer, | Putnam Investments |
| Putnam Management | |
| | Denere P. Poulack (Born 1968) |
| Michael J. Higgins (Born 1976) | Assistant Vice President, Assistant Clerk, |
| Vice President, Treasurer, and Clerk | and Assistant Treasurer |
| Since 2010 | Since 2004 |
| | |
| Jonathan S. Horwitz (Born 1955) | Janet C. Smith (Born 1965) |
| Executive Vice President, Principal Executive Officer, | Vice President, Principal Financial Officer, Principal |
| and Compliance Liaison | Accounting Officer, and Assistant Treasurer |
| Since 2004 | Since 2007 |
| | Head of Fund Administration Services, |
| Richard T. Kircher (Born 1962) | Putnam Investments and Putnam Management |
| Vice President and BSA Compliance Officer | |
| Since 2019 | Stephen J. Tate (Born 1974) |
| Assistant Director, Operational Compliance, Putnam | Vice President and Chief Legal Officer |
| Investments and Putnam Retail Management | Since 2021 |
| | General Counsel, Putnam Investments, |
| Martin Lemaire (Born 1984) | Putnam Management, and Putnam Retail Management |
| Vice President and Derivatives Risk Manager | |
| Since 2022 | Mark C. Trenchard (Born 1962) |
| Risk Manager and Risk Analyst, Putnam Investments | Vice President |
| | Since 2002 |
| Susan G. Malloy (Born 1957) | Director of Operational Compliance, Putnam |
| Vice President and Assistant Treasurer | Investments and Putnam Retail Management |
| Since 2007 | |
| Head of Accounting and Middle Office Services, | |
| Putnam Investments and Putnam Management | |
The principal occupations of the officers for the past five years have been with the employers as shown above, although in some cases they have held different positions with such employers. The address of each officer is 100 Federal Street, Boston, MA 02110.
Fund information
Founded over 85 years ago, Putnam Investments was built around the concept that a balance between risk and reward is the hallmark of a well-rounded financial program. We manage funds across income, value, blend, growth, sustainable, and asset allocation categories.
| | |
| Investment Manager | Trustees | Richard T. Kircher |
| Putnam Investment | Kenneth R. Leibler, Chair | Vice President and |
| Management, LLC | Barbara M. Baumann, Vice Chair | BSA Compliance Officer |
| 100 Federal Street | Liaquat Ahamed | |
| Boston, MA 02110 | Katinka Domotorffy | Martin Lemaire |
| | Catharine Bond Hill | Vice President and |
| Investment Sub-Advisor | Jennifer Williams Murphy | Derivatives Risk Manager |
| Putnam Investments Limited | Marie Pillai | |
| 16 St James’s Street | George Putnam III | Susan G. Malloy |
| London, England SW1A 1ER | Robert L. Reynolds | Vice President and |
| | Manoj P. Singh | Assistant Treasurer |
| Marketing Services | Mona K. Sutphen | |
| Putnam Retail Management | | Alan G. McCormack |
| Limited Partnership | Officers | Vice President and |
| 100 Federal Street | Robert L. Reynolds | Derivatives Risk Manager |
| Boston, MA 02110 | President | |
| | | Denere P. Poulack |
| Custodian | James F. Clark | Assistant Vice President, |
| State Street Bank | Vice President and | Assistant Clerk, and |
| and Trust Company | Chief Compliance Officer | Assistant Treasurer |
| | | |
| Legal Counsel | Michael J. Higgins | Janet C. Smith |
| Ropes & Gray LLP | Vice President, Treasurer, | Vice President, |
| | and Clerk | Principal Financial Officer, |
| Independent Registered | | Principal Accounting Officer, |
| Public Accounting Firm | Jonathan S. Horwitz | and Assistant Treasurer |
| PricewaterhouseCoopers LLP | Executive Vice President, | |
| | Principal Executive Officer, | Stephen J. Tate |
| | and Compliance Liaison | Vice President and |
| | | Chief Legal Officer |
| | |
| | | Mark C. Trenchard |
| | | Vice President |
This report is for the information of shareholders of Putnam Income Fund. It may also be used as sales literature when preceded or accompanied by the current prospectus, the most recent copy of Putnam’s Quarterly Performance Summary, and Putnam’s Quarterly Ranking Summary. For more recent performance, please visit putnam.com. Investors should carefully consider the investment objectives, risks, charges, and expenses of a fund, which are described in its prospectus. For this and other information or to request a prospectus or summary prospectus, call 1-800-225-1581 toll free. Please read the prospectus carefully before investing. The fund’s Statement of Additional Information contains additional information about the fund’s Trustees and is available without charge upon request by calling 1-800-225-1581.
|
| This page left blank intentionally. |
|
| This page left blank intentionally. |
| |
| (a) The fund’s principal executive, financial and accounting officers are employees of Putnam Investment Management, LLC, the Fund’s investment manager. As such they are subject to a comprehensive Code of Ethics adopted and administered by Putnam Investments which is designed to protect the interests of the firm and its clients. The Fund has adopted a Code of Ethics which incorporates the Code of Ethics of Putnam Investments with respect to all of its officers and Trustees who are employees of Putnam Investment Management, LLC. For this reason, the Fund has not adopted a separate code of ethics governing its principal executive, financial and accounting officers. |
| |
| (c) In January 2023, the Code of Ethics of Putnam Investments and Code of Ethics of Putnam Funds were amended. The key changes to the Putnam Investments Code of Ethics are as follows: (i) Prohibition on investments in a single stock ETFs and (ii) Revision to the 7-day blackout rule for Analysts. The key change to the Putnam Funds Code of Ethics was that the provisions of the Code of Ethics for employees of PanAgora Asset Management, inc. and any of its subsidiaries are excluded from the Putnam Funds’ Code of Ethics. |
| |
| Item 3. Audit Committee Financial Expert: |
| |
| The Funds’ Audit, Compliance and Risk Committee is comprised solely of Trustees who are “independent” (as such term has been defined by the Securities and Exchange Commission (“SEC”) in regulations implementing Section 407 of the Sarbanes-Oxley Act (the “Regulations”)). The Trustees believe that each member of the Audit, Compliance and Risk Committee also possesses a combination of knowledge and experience with respect to financial accounting matters, as well as other attributes, that qualifies him or her for service on the Committee. In addition, the Trustees have determined that each of Dr. Hill, Ms. Murphy and Mr. Singh qualifies as an “audit committee financial expert” (as such term has been defined by the Regulations) based on their review of his or her pertinent experience and education.The SEC has stated, and the funds’ amended and restated agreement and Declaration of Trust provides, that the designation or identification of a person as an audit committee financial expert pursuant to this Item 3 of Form N-CSR does not impose on such person any duties, obligations or liability that are greater than the duties, obligations and liability imposed on such person as a member of the Audit, Compliance and Risk Committee and the Board of Trustees in the absence of such designation or identification. |
| |
| Item 4. Principal Accountant Fees and Services: |
| |
| The following table presents fees billed in each of the last two fiscal years for services rendered to the fund by the fund’s independent auditor: |
| | | | | |
| Fiscal year ended | Audit Fees | Audit-Related Fees | Tax Fees | All Other Fees |
|
|
| | | | | |
| October 31, 2023 | $161,752 | $ — | $11,021 | $ — |
| October 31, 2022 | $157,519 | $ — | $10,700 | $ — |
| |
| For the fiscal years ended October 31, 2023 and October 31, 2022, the fund’s independent auditor billed aggregate non-audit fees in the amounts of $231,653 and $308,983 respectively, to the fund, Putnam Management and any entity controlling, controlled by or under common control with Putnam Management that provides ongoing services to the fund. |
| |
| Audit Fees represent fees billed for the fund’s last two fiscal years relating to the audit and review of the financial statements included in annual reports and registration statements, and other services that are normally provided in connection with statutory and regulatory filings or engagements. |
| |
| Audit-Related Fees represent fees billed in the fund’s last two fiscal years for services traditionally performed by the fund’s auditor, including accounting consultation for proposed transactions or concerning financial accounting and reporting standards and other audit or attest services not required by statute or regulation. |
| |
| Tax Fees represent fees billed in the fund’s last two fiscal years for tax compliance, tax planning and tax advice services. Tax planning and tax advice services include assistance with tax audits, employee benefit plans and requests for rulings or technical advice from taxing authorities. |
| |
| Pre-Approval Policies of the Audit, Compliance and Risk Committee. The Audit, Compliance and Risk Committee of the Putnam funds has determined that, as a matter of policy, all work performed for the funds by the funds’ independent auditors will be pre-approved by the Committee itself and thus will generally not be subject to pre-approval procedures. |
| |
| The Audit, Compliance and Risk Committee also has adopted a policy to pre-approve the engagement by Putnam Management and certain of its affiliates of the funds’ independent auditors, even in circumstances where pre-approval is not required by applicable law. Any such requests by Putnam Management or certain of its affiliates are typically submitted in writing to the Committee and explain, among other things, the nature of the proposed engagement, the estimated fees, and why this work should be performed by that particular audit firm as opposed to another one. In reviewing such requests, the Committee considers, among other things, whether the provision of such services by the audit firm are compatible with the independence of the audit firm. |
| |
| The following table presents fees billed by the fund’s independent auditor for services required to be approved pursuant to paragraph (c)(7)(ii) of Rule 2–01 of Regulation S-X. |
| | | | | |
| Fiscal year ended | Audit-Related Fees | Tax Fees | All Other Fees | Total Non-Audit Fees |
|
|
| October 31, 2023 | $ — | $220,632 | $ — | $ — |
| October 31, 2022 | $ — | $298,283 | $ — | $ — |
| |
| Item 5. Audit Committee of Listed Registrants |
| |
| Item 6. Schedule of Investments: |
| |
| The registrant’s schedule of investments in unaffiliated issuers is included in the report to shareholders in Item 1 above. |
| |
| Item 7. Disclosure of Proxy Voting Policies and Procedures For Closed-End Management Investment Companies: |
| |
| Item 8. Portfolio Managers of Closed-End Investment Companies |
| |
| Item 9. Purchases of Equity Securities by Closed-End Management Investment Companies and Affiliated Purchasers: |
| |
| Item 10. Submission of Matters to a Vote of Security Holders: |
| |
| Item 11. Controls and Procedures: |
| |
| (a) The registrant’s principal executive officer and principal financial officer have concluded, based on their evaluation of the effectiveness of the design and operation of the registrant’s disclosure controls and procedures as of a date within 90 days of the filing date of this report, that the design and operation of such procedures are generally effective to provide reasonable assurance that information required to be disclosed by the registrant in this report is recorded, processed, summarized and reported within the time periods specified in the Commission’s rules and forms. |
| |
| (b) Changes in internal control over financial reporting: Not applicable |
| |
| Item 12. Disclosures of Securities Lending Activities for Closed-End Management Investment Companies: |
| |
| Item 13. Recovery of Erroneously Awarded Compensation. |
| |
| (a)(1) The Code of Ethics of The Putnam Funds, which incorporates the Code of Ethics of Putnam Investments, is filed herewith. |
| |
| (a)(2) Any policy required by the listing standards adopted pursuant to Rule 10D-1 under the Exchange Act (17 CFR 240.10D-1) by the registered national securities exchange or registered national securities association upon which the registrant’s securities are listed. Not Applicable |
| |
| Pursuant to the requirements of the Securities Exchange Act of 1934 and the Investment Company Act of 1940, the registrant has duly caused this report to be signed on its behalf by the undersigned, thereunto duly authorized. |
| |
| By (Signature and Title): |
| |
| /s/ Janet C. Smith
Janet C. Smith
Principal Accounting Officer
|
| |
| Pursuant to the requirements of the Securities Exchange Act of 1934 and the Investment Company Act of 1940, this report has been signed below by the following persons on behalf of the registrant and in the capacities and on the dates indicated. |
| |
| By (Signature and Title): |
| |
| /s/ Jonathan S. Horwitz
Jonathan S. Horwitz
Principal Executive Officer
|
| |
| By (Signature and Title): |
| |
| /s/ Janet C. Smith
Janet C. Smith
Principal Financial Officer
|
