| |
| SECURITIES AND EXCHANGE COMMISSION |
| |
| CERTIFIED SHAREHOLDER REPORT OF REGISTERED |
| |
| MANAGEMENT INVESTMENT COMPANIES |
| | |
| Investment Company Act file number: | (811-00653) |
| | |
| Exact name of registrant as specified in charter: | Putnam Income Fund |
| | |
| Address of principal executive offices: | 100 Federal Street, Boston, Massachusetts 02110 |
| | |
| Name and address of agent for service: | Stephen Tate, Vice President |
| | |
| | Boston, Massachusetts 02110 |
| | |
| Copy to: | Bryan Chegwidden, Esq. |
| | |
| | 1211 Avenue of the Americas |
| | |
| | Boston, Massachusetts 02199 |
| | |
| Registrant’s telephone number, including area code: | (617) 292-1000 |
| | |
| Date of fiscal year end: | October 31, 2024 |
| | |
| Date of reporting period: | November 1, 2023 – October 31, 2024 |
| |
| Item 1. Report to Stockholders: |
| |
| The following is a copy of the report transmitted to stockholders pursuant to Rule 30e-1 under the Investment Company Act of 1940: |
| | |
Putnam Income Fund | |
| Class A [PINCX] |
| Annual Shareholder Report | October 31, 2024 |
|
This annual shareholder report contains important information about Putnam Income Fund for the period November 1, 2023, to October 31, 2024.
You can find additional information about the Fund at https://www.franklintempleton.com/regulatory-fund-documents. You can also request this information by contacting us at (800) 225-1581.
This report describes changes to the Fund that occurred during the reporting period.
WHAT WERE THE FUND COSTS FOR THE LAST YEAR? (based on a hypothetical $10,000 investment)
| | |
Class Name | Costs of a $10,000 investment | Costs paid as a percentage of a $10,000 investment* |
| Class A | $78 | 0.74% |
| * | Reflects fee waivers and/or expense reimbursements, without which expenses would have been higher. |
HOW DID THE FUND PERFORM LAST YEAR AND WHAT AFFECTED ITS PERFORMANCE?
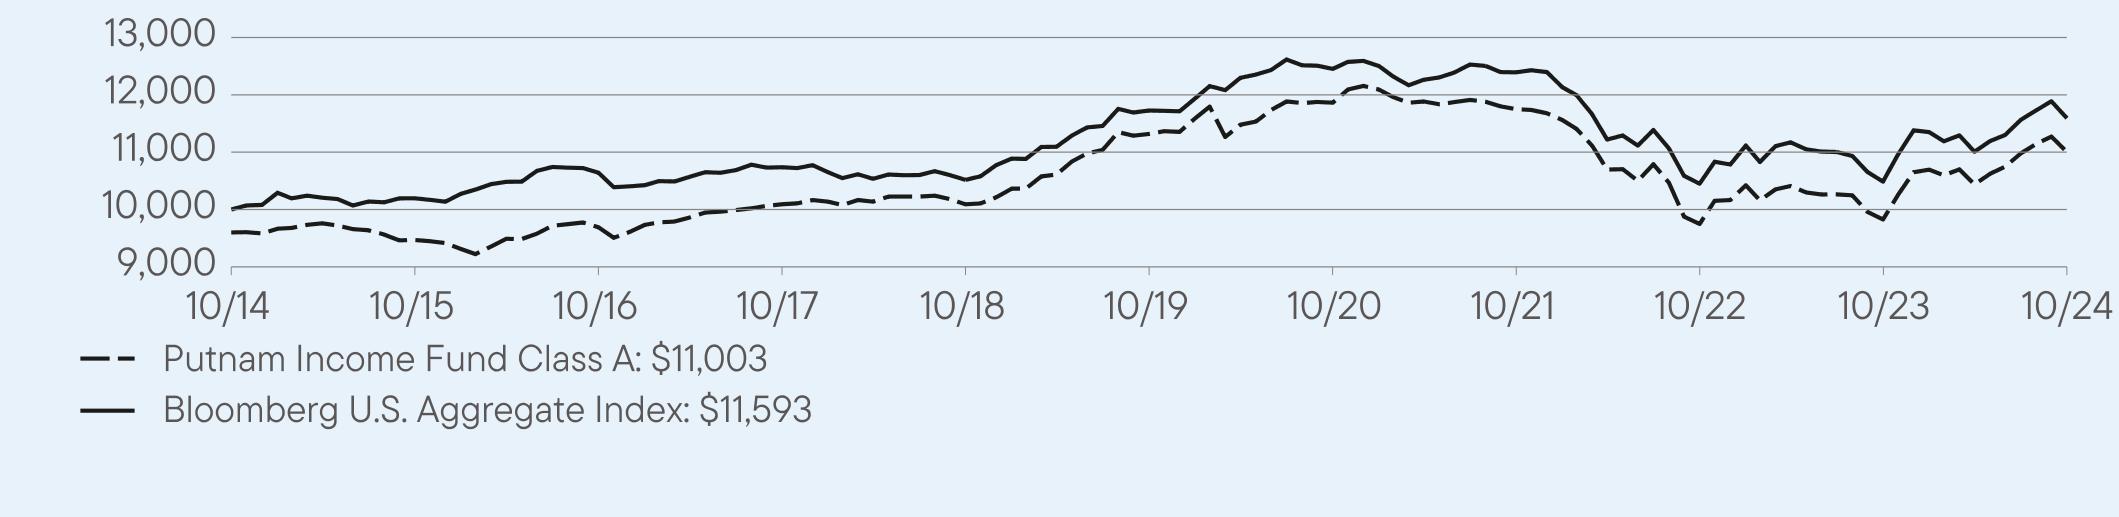
For the twelve months ended October 31, 2024, Class A shares of Putnam Income Fund returned 11.99%. The Fund compares its performance to the Bloomberg U.S. Aggregate Index, which returned 10.55% for the same period.
| |
Top contributors to performance: |
| ↑ | Commercial mortgage-backed securities (CMBS) as the liquidity landscape improved significantly in 2024. Investor demand for CMBS was strong, and supply was well absorbed despite changes to expectations for the timing and number of rate cuts. Additionally, Non-agency residential mortgage-backed securities continued to benefit from U.S. housing market strength, solid borrower fundamentals, and low expectations for a U.S. recession. |
| ↑ | Prepayment strategies were also a notable driver of positive relative returns, driven by exposure to agency interest-only (IO) inverse IO (IIO) securities. Seasoned agency IO and IIO bonds continued to carry well and spreads were supportive. |
| ↑ | Corporate credit exposure contributed to relative returns, particularly exposure to investment grade corporate bonds and collateralized loan obligations. |
| |
Top detractors from performance: |
| ↓ | There were no significant detractors to performance. |
Use of derivatives and impact on performance:
The Fund used futures and interest rate swaps for hedging term structure risk and for yield curve positioning. In aggregate these derivatives minimally contributed to performance.
| Putnam Income Fund | PAGE 1 | 38901-ATSA-1224 |
HOW DID THE FUND PERFORM OVER THE LAST 10 YEARS?
The Fund’s past performance is not necessarily an indication of how the Fund will perform in the future. The graph and table do not reflect the deduction of taxes that a shareholder would pay on Fund distributions or redemption of Fund shares.
VALUE OF A $10,000 INVESTMENT ($9,600 AFTER MAXIMUM APPLICABLE SALES CHARGE) –
Class A 10/31/2014 — 10/31/2024
AVERAGE ANNUAL TOTAL RETURNS (%) Period Ended October 31, 2024
| | | |
| | 1 Year | 5 Year | 10 Year |
Class A | 11.99 | -0.57 | 1.37 |
Class A (with sales charge) | 7.51 | -1.37 | 0.96 |
Bloomberg U.S. Aggregate Index | 10.55 | -0.23 | 1.49 |
Fund performance figures may reflect fee waivers and/or expense reimbursements, without which the performance would have been lower.
For current month-end performance, please call Franklin Templeton at (800) 225-1581 or visit https://www.franklintempleton.com/investments/options/mutual-funds.
Important data provider notices and terms available at www.franklintempletondatasources.com.
KEY FUND STATISTICS (as of October 31, 2024)
| |
Total Net Assets | $1,133,540,937 |
Total Number of Portfolio Holdings* | 1,249 |
Total Management Fee Paid | $3,255,329 |
Portfolio Turnover Rate | 900% |
| * | Includes derivatives, if applicable. |
| Putnam Income Fund | PAGE 2 | 38901-ATSA-1224 |
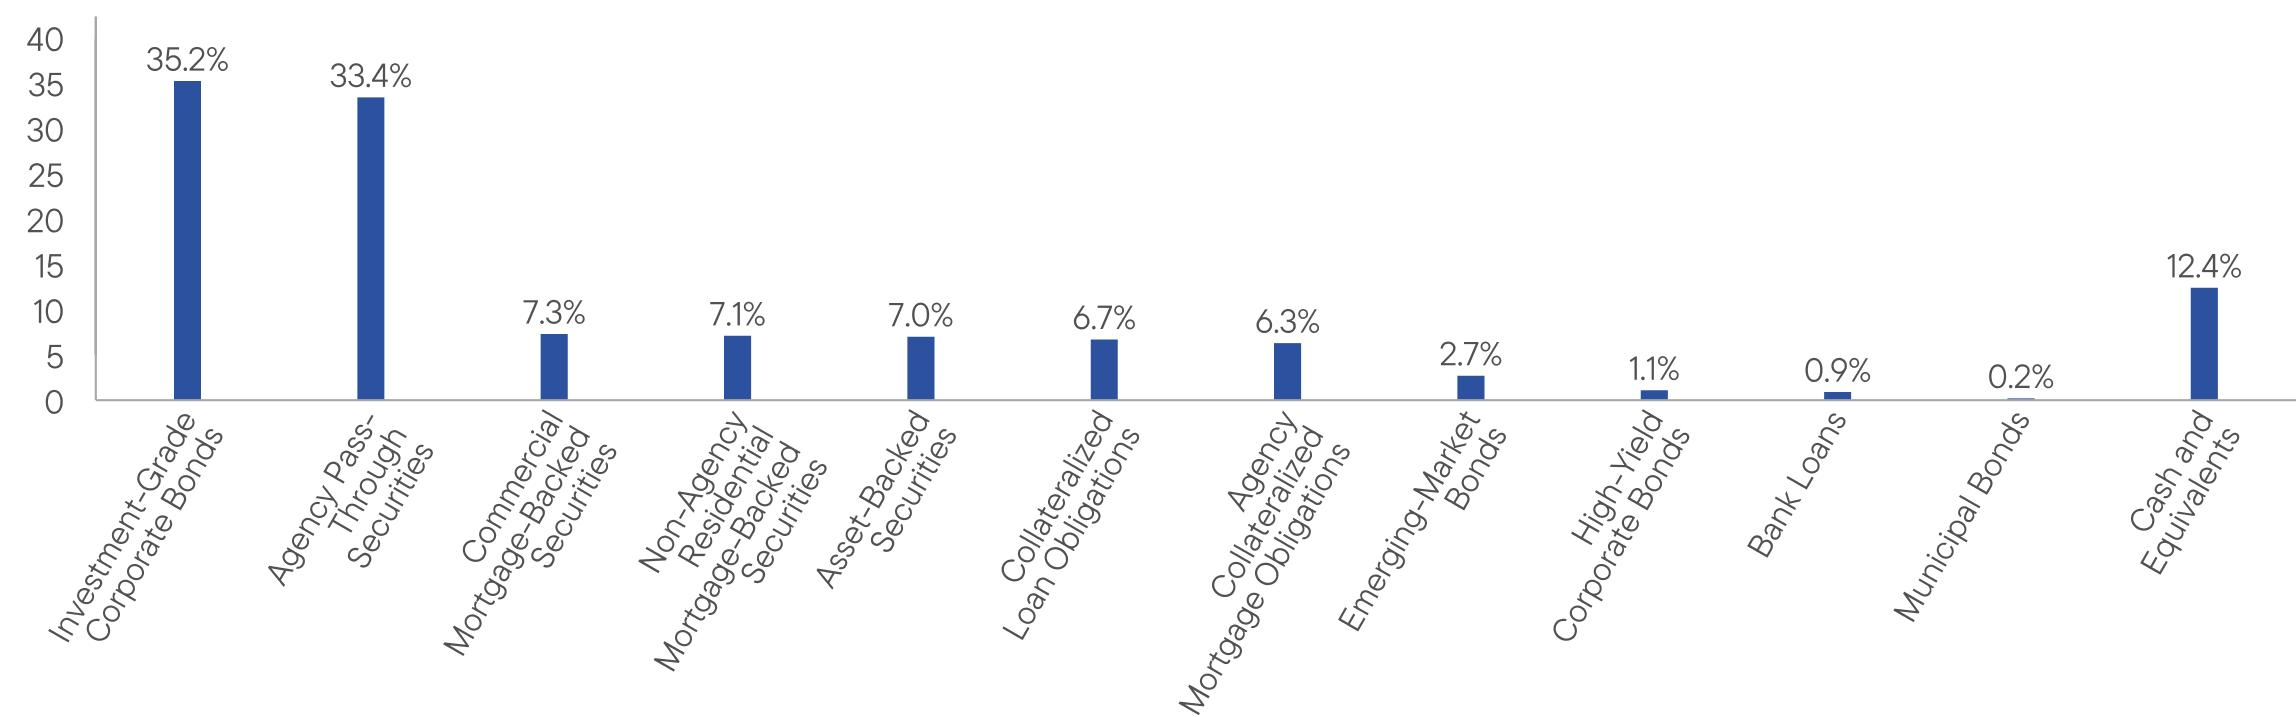
WHAT DID THE FUND INVEST IN? (as of October 31, 2024)
Portfolio Composition (% of Total Net Assets)
| Cash and Equivalents, if any, represent the market value weights of cash, derivatives, short-term securities, and other unclassified assets in the portfolio. Allocations may not total 100% because the chart includes the notional value of certain derivatives (the economic value for purposes of calculating periodic payment obligations), including to-be-announced mortgage security trades, if any, in addition to the market value of securities. Holdings and allocations may vary over time. |
HOW HAS THE FUND CHANGED?
On May 31, 2023, Franklin Resources, Inc. (“Franklin Templeton”) and Great-West Lifeco Inc., the parent company of Putnam U.S. Holdings I, LLC (“Putnam Holdings”), announced that they had entered into a definitive agreement for a subsidiary of Franklin Templeton to acquire Putnam Holdings in a stock and cash transaction (the “Transaction”). The Transaction was completed on January 1, 2024. As part of the Transaction, your Fund’s then-current investment advisor, Putnam Investment Management, LLC (“Putnam Management”), a wholly-owned subsidiary of Putnam Holdings, and your Fund’s then-current sub-advisor, Putnam Investments Limited (“PIL”), an indirect, wholly-owned subsidiary of Putnam Holdings, became indirect, wholly-owned subsidiaries of Franklin Templeton. In connection with the Transaction, shareholders of your Fund approved a new management contract with Putnam Management and a new sub-advisory contract with PIL. The new contracts are identical to the previous contracts, except for the effective dates, initial terms, updates to fund names as necessary to reflect previous name changes, and certain non-substantive changes.
Effective July 15, 2024, Putnam Management transferred its management contract for your Fund to Franklin Advisers, Inc. (“Franklin Advisers”), and Franklin Advisers replaced Putnam Management as the investment advisor to your Fund. In connection with the transfer, your Fund’s portfolio managers, along with supporting research analysts and certain other investment staff of Putnam Management, also became employees of Franklin Advisers. Putnam Management also transferred to Franklin Advisers its sub-management agreement with PIL in respect of your Fund. Franklin Advisers is an indirect, wholly-owned subsidiary of Franklin Templeton. In addition, effective July 15, 2024, Franklin Advisers retained Putnam Management as a sub-adviser to your Fund pursuant to a new subadvisory agreement.
Effective November 1, 2024 (the “Effective Date”), PIL, a sub-advisor of the Fund prior to the Effective Date, merged with and into Franklin Templeton Investment Management Limited (“FTIML”), a wholly-owned subsidiary of Franklin Templeton (the “Merger”). As of the Effective Date, PIL investment professionals became employees of FTIML, and the sub-advisory agreement between Franklin Advisers and PIL with respect to the Fund was terminated. In connection with the Merger, the Fund’s Trustees approved a new sub-advisory agreement between Franklin Advisers and FTIML, pursuant to which FTIML became a sub-advisor of the Fund on the Effective Date.
Effective September 30, 2024, the portfolio managers for the Fund are Michael Salm, Albert Chan, Tina Chou, Patrick Klein and Matthew Walkup.
This is a summary of certain changes to the Fund since November 1, 2023. For more complete information, you may review the Fund’s current prospectus and any applicable supplements and the Fund’s next prospectus, which we expect to be available by March 1, 2025, at https://www.franklintempleton.com/regulatory-fund-documents or upon request at (800) 225-1581 or
funddocuments@putnam.com.
| Putnam Income Fund | PAGE 3 | 38901-ATSA-1224 |
| |
| WHERE CAN I FIND ADDITIONAL INFORMATION ABOUT THE FUND? |
Additional information is available on https://www.franklintempleton.com/regulatory-fund-documents, including its: |
| • prospectus • proxy voting information • financial information • holdings • tax information |
HOUSEHOLDING
You will receive the Fund’s shareholder reports every six months. In addition, you will receive an annual updated summary prospectus (detail prospectus available upon request). To reduce Fund expenses, we try to identify related shareholders in a household and send only one copy of the shareholder reports and summary prospectus. This process, called “householding,” will continue indefinitely unless you instruct us otherwise. If you prefer not to have these documents householded, please call us at (800) 225-1581. At any time, you may view current prospectuses/summary prospectuses and shareholder reports on our website. If you choose, you may receive these documents through electronic delivery.
| Putnam Income Fund | PAGE 4 | 38901-ATSA-1224 |
96009468968910092100911131911863117519747982511003100001019610641107371051711727124531239310450104871159335.233.47.37.17.06.76.32.71.10.90.212.4
| | |
Putnam Income Fund | |
| Class C [PUICX] |
| Annual Shareholder Report | October 31, 2024 |
|
This annual shareholder report contains important information about Putnam Income Fund for the period November 1, 2023, to October 31, 2024.
You can find additional information about the Fund at https://www.franklintempleton.com/regulatory-fund-documents. You can also request this information by contacting us at (800) 225-1581.
This report describes changes to the Fund that occurred during the reporting period.
WHAT WERE THE FUND COSTS FOR THE LAST YEAR? (based on a hypothetical $10,000 investment)
| | |
Class Name | Costs of a $10,000 investment | Costs paid as a percentage of a $10,000 investment* |
| Class C | $157 | 1.49% |
| * | Reflects fee waivers and/or expense reimbursements, without which expenses would have been higher. |
HOW DID THE FUND PERFORM LAST YEAR AND WHAT AFFECTED ITS PERFORMANCE?
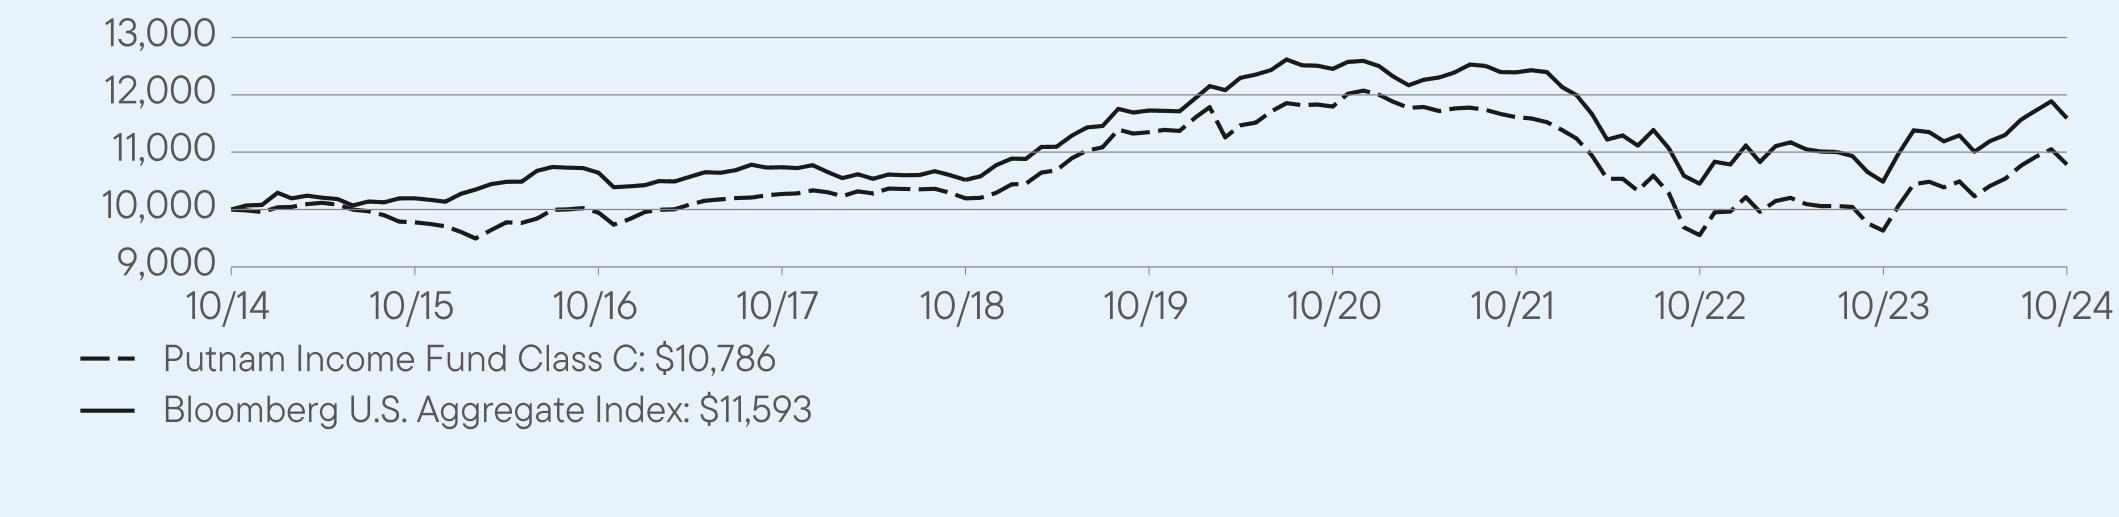
For the twelve months ended October 31, 2024, Class C shares of Putnam Income Fund returned 11.32%. The Fund compares its performance to the Bloomberg U.S. Aggregate Index, which returned 10.55% for the same period.
| |
Top contributors to performance: |
| ↑ | Commercial mortgage-backed securities (CMBS) as the liquidity landscape improved significantly in 2024. Investor demand for CMBS was strong, and supply was well absorbed despite changes to expectations for the timing and number of rate cuts. Additionally, Non-agency residential mortgage-backed securities continued to benefit from U.S. housing market strength, solid borrower fundamentals, and low expectations for a U.S. recession. |
| ↑ | Prepayment strategies were also a notable driver of positive relative returns, driven by exposure to agency interest-only (IO) inverse IO (IIO) securities. Seasoned agency IO and IIO bonds continued to carry well and spreads were supportive. |
| ↑ | Corporate credit exposure contributed to relative returns, particularly exposure to investment grade corporate bonds and collateralized loan obligations. |
| |
Top detractors from performance: |
| ↓ | There were no significant detractors to performance. |
Use of derivatives and impact on performance:
The Fund used futures and interest rate swaps for hedging term structure risk and for yield curve positioning. In aggregate these derivatives minimally contributed to performance.
| Putnam Income Fund | PAGE 1 | 38901-ATSC-1224 |
HOW DID THE FUND PERFORM OVER THE LAST 10 YEARS?
The Fund’s past performance is not necessarily an indication of how the Fund will perform in the future. The graph and table do not reflect the deduction of taxes that a shareholder would pay on Fund distributions or redemption of Fund shares.
VALUE OF A $10,000 INVESTMENT – Class C 10/31/2014 — 10/31/2024
AVERAGE ANNUAL TOTAL RETURNS (%) Period Ended October 31, 2024
| | | |
| | 1 Year | 5 Year | 10 Year |
Class C | 11.32 | -1.28 | 0.76 |
Class C (with sales charge) | 10.32 | -1.28 | 0.76 |
Bloomberg U.S. Aggregate Index | 10.55 | -0.23 | 1.49 |
Fund performance figures may reflect fee waivers and/or expense reimbursements, without which the performance would have been lower.
For current month-end performance, please call Franklin Templeton at (800) 225-1581 or visit https://www.franklintempleton.com/investments/options/mutual-funds.
Important data provider notices and terms available at www.franklintempletondatasources.com.
KEY FUND STATISTICS (as of October 31, 2024)
| |
Total Net Assets | $1,133,540,937 |
Total Number of Portfolio Holdings* | 1,249 |
Total Management Fee Paid | $3,255,329 |
Portfolio Turnover Rate | 900% |
| * | Includes derivatives, if applicable. |
| Putnam Income Fund | PAGE 2 | 38901-ATSC-1224 |
WHAT DID THE FUND INVEST IN? (as of October 31, 2024)
Portfolio Composition (% of Total Net Assets)
| Cash and Equivalents, if any, represent the market value weights of cash, derivatives, short-term securities, and other unclassified assets in the portfolio. Allocations may not total 100% because the chart includes the notional value of certain derivatives (the economic value for purposes of calculating periodic payment obligations), including to-be-announced mortgage security trades, if any, in addition to the market value of securities. Holdings and allocations may vary over time. |
HOW HAS THE FUND CHANGED?
On May 31, 2023, Franklin Resources, Inc. (“Franklin Templeton”) and Great-West Lifeco Inc., the parent company of Putnam U.S. Holdings I, LLC (“Putnam Holdings”), announced that they had entered into a definitive agreement for a subsidiary of Franklin Templeton to acquire Putnam Holdings in a stock and cash transaction (the “Transaction”). The Transaction was completed on January 1, 2024. As part of the Transaction, your Fund’s then-current investment advisor, Putnam Investment Management, LLC (“Putnam Management”), a wholly-owned subsidiary of Putnam Holdings, and your Fund’s then-current sub-advisor, Putnam Investments Limited (“PIL”), an indirect, wholly-owned subsidiary of Putnam Holdings, became indirect, wholly-owned subsidiaries of Franklin Templeton. In connection with the Transaction, shareholders of your Fund approved a new management contract with Putnam Management and a new sub-advisory contract with PIL. The new contracts are identical to the previous contracts, except for the effective dates, initial terms, updates to fund names as necessary to reflect previous name changes, and certain non-substantive changes.
Effective July 15, 2024, Putnam Management transferred its management contract for your Fund to Franklin Advisers, Inc. (“Franklin Advisers”), and Franklin Advisers replaced Putnam Management as the investment advisor to your Fund. In connection with the transfer, your Fund’s portfolio managers, along with supporting research analysts and certain other investment staff of Putnam Management, also became employees of Franklin Advisers. Putnam Management also transferred to Franklin Advisers its sub-management agreement with PIL in respect of your Fund. Franklin Advisers is an indirect, wholly-owned subsidiary of Franklin Templeton. In addition, effective July 15, 2024, Franklin Advisers retained Putnam Management as a sub-adviser to your Fund pursuant to a new subadvisory agreement.
Effective November 1, 2024 (the “Effective Date”), PIL, a sub-advisor of the Fund prior to the Effective Date, merged with and into Franklin Templeton Investment Management Limited (“FTIML”), a wholly-owned subsidiary of Franklin Templeton (the “Merger”). As of the Effective Date, PIL investment professionals became employees of FTIML, and the sub-advisory agreement between Franklin Advisers and PIL with respect to the Fund was terminated. In connection with the Merger, the Fund’s Trustees approved a new sub-advisory agreement between Franklin Advisers and FTIML, pursuant to which FTIML became a sub-advisor of the Fund on the Effective Date.
Effective September 30, 2024, the portfolio managers for the Fund are Michael Salm, Albert Chan, Tina Chou, Patrick Klein and Matthew Walkup.
This is a summary of certain changes to the Fund since November 1, 2023. For more complete information, you may review the Fund’s current prospectus and any applicable supplements and the Fund’s next prospectus, which we expect to be available by March 1, 2025, at https://www.franklintempleton.com/regulatory-fund-documents or upon request at (800) 225-1581 or
funddocuments@putnam.com.
| Putnam Income Fund | PAGE 3 | 38901-ATSC-1224 |
| |
| WHERE CAN I FIND ADDITIONAL INFORMATION ABOUT THE FUND? |
Additional information is available on https://www.franklintempleton.com/regulatory-fund-documents, including its: |
| • prospectus • proxy voting information • financial information • holdings • tax information |
HOUSEHOLDING
You will receive the Fund’s shareholder reports every six months. In addition, you will receive an annual updated summary prospectus (detail prospectus available upon request). To reduce Fund expenses, we try to identify related shareholders in a household and send only one copy of the shareholder reports and summary prospectus. This process, called “householding,” will continue indefinitely unless you instruct us otherwise. If you prefer not to have these documents householded, please call us at (800) 225-1581. At any time, you may view current prospectuses/summary prospectuses and shareholder reports on our website. If you choose, you may receive these documents through electronic delivery.
| Putnam Income Fund | PAGE 4 | 38901-ATSC-1224 |
100009776994610272101951134811796116119554963110786100001019610641107371051711727124531239310450104871159335.233.47.37.17.06.76.32.71.10.90.212.4
| | |
Putnam Income Fund | |
| Class M [PNCMX] |
| Annual Shareholder Report | October 31, 2024 |
|
This annual shareholder report contains important information about Putnam Income Fund for the period November 1, 2023, to October 31, 2024.
You can find additional information about the Fund at https://www.franklintempleton.com/regulatory-fund-documents. You can also request this information by contacting us at (800) 225-1581.
This report describes changes to the Fund that occurred during the reporting period.
WHAT WERE THE FUND COSTS FOR THE LAST YEAR? (based on a hypothetical $10,000 investment)
| | |
Class Name | Costs of a $10,000 investment | Costs paid as a percentage of a $10,000 investment* |
| Class M | $105 | 0.99% |
| * | Reflects fee waivers and/or expense reimbursements, without which expenses would have been higher. |
HOW DID THE FUND PERFORM LAST YEAR AND WHAT AFFECTED ITS PERFORMANCE?
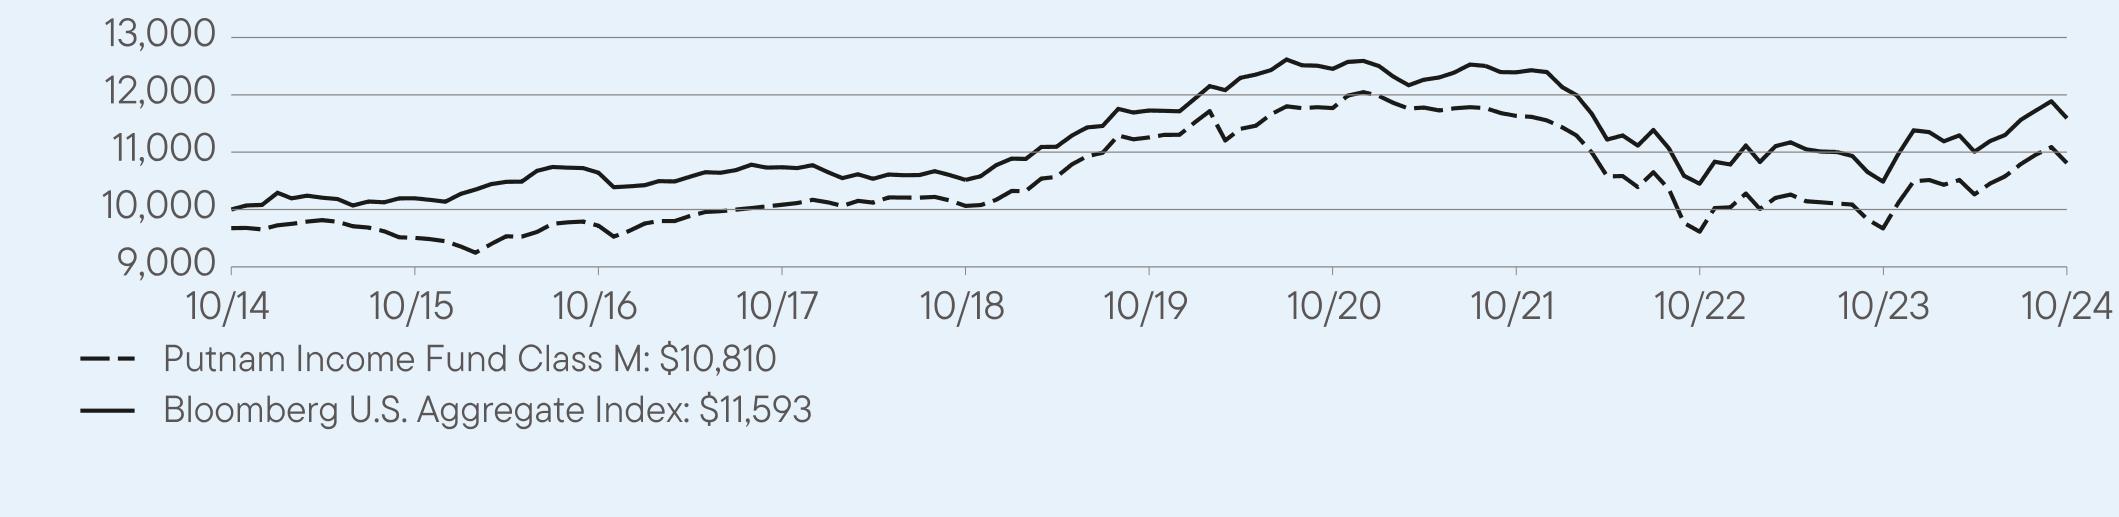
For the twelve months ended October 31, 2024, Class M shares of Putnam Income Fund returned 11.80%. The Fund compares its performance to the Bloomberg U.S. Aggregate Index, which returned 10.55% for the same period.
| |
Top contributors to performance: |
| ↑ | Commercial mortgage-backed securities (CMBS) as the liquidity landscape improved significantly in 2024. Investor demand for CMBS was strong, and supply was well absorbed despite changes to expectations for the timing and number of rate cuts. Additionally, Non-agency residential mortgage-backed securities continued to benefit from U.S. housing market strength, solid borrower fundamentals, and low expectations for a U.S. recession. |
| ↑ | Prepayment strategies were also a notable driver of positive relative returns, driven by exposure to agency interest-only (IO) inverse IO (IIO) securities. Seasoned agency IO and IIO bonds continued to carry well and spreads were supportive. |
| ↑ | Corporate credit exposure contributed to relative returns, particularly exposure to investment grade corporate bonds and collateralized loan obligations. |
| |
Top detractors from performance: |
| ↓ | There were no significant detractors to performance. |
Use of derivatives and impact on performance:
The Fund used futures and interest rate swaps for hedging term structure risk and for yield curve positioning. In aggregate these derivatives minimally contributed to performance.
| Putnam Income Fund | PAGE 1 | 38901-ATSM-1224 |
HOW DID THE FUND PERFORM OVER THE LAST 10 YEARS?
The Fund’s past performance is not necessarily an indication of how the Fund will perform in the future. The graph and table do not reflect the deduction of taxes that a shareholder would pay on Fund distributions or redemption of Fund shares.
VALUE OF A $10,000 INVESTMENT ($9,675 AFTER MAXIMUM APPLICABLE SALES CHARGE) –
Class M 10/31/2014 — 10/31/2024
AVERAGE ANNUAL TOTAL RETURNS (%) Period Ended October 31, 2024
| | | |
| | 1 Year | 5 Year | 10 Year |
Class M | 11.80 | -0.80 | 1.12 |
Class M (with sales charge) | 8.17 | -1.46 | 0.78 |
Bloomberg U.S. Aggregate Index | 10.55 | -0.23 | 1.49 |
Fund performance figures may reflect fee waivers and/or expense reimbursements, without which the performance would have been lower.
For current month-end performance, please call Franklin Templeton at (800) 225-1581 or visit https://www.franklintempleton.com/investments/options/mutual-funds.
Important data provider notices and terms available at www.franklintempletondatasources.com.
KEY FUND STATISTICS (as of October 31, 2024)
| |
Total Net Assets | $1,133,540,937 |
Total Number of Portfolio Holdings* | 1,249 |
Total Management Fee Paid | $3,255,329 |
Portfolio Turnover Rate | 900% |
| * | Includes derivatives, if applicable. |
| Putnam Income Fund | PAGE 2 | 38901-ATSM-1224 |
WHAT DID THE FUND INVEST IN? (as of October 31, 2024)
Portfolio Composition (% of Total Net Assets)
| Cash and Equivalents, if any, represent the market value weights of cash, derivatives, short-term securities, and other unclassified assets in the portfolio. Allocations may not total 100% because the chart includes the notional value of certain derivatives (the economic value for purposes of calculating periodic payment obligations), including to-be-announced mortgage security trades, if any, in addition to the market value of securities. Holdings and allocations may vary over time. |
HOW HAS THE FUND CHANGED?
On May 31, 2023, Franklin Resources, Inc. (“Franklin Templeton”) and Great-West Lifeco Inc., the parent company of Putnam U.S. Holdings I, LLC (“Putnam Holdings”), announced that they had entered into a definitive agreement for a subsidiary of Franklin Templeton to acquire Putnam Holdings in a stock and cash transaction (the “Transaction”). The Transaction was completed on January 1, 2024. As part of the Transaction, your Fund’s then-current investment advisor, Putnam Investment Management, LLC (“Putnam Management”), a wholly-owned subsidiary of Putnam Holdings, and your Fund’s then-current sub-advisor, Putnam Investments Limited (“PIL”), an indirect, wholly-owned subsidiary of Putnam Holdings, became indirect, wholly-owned subsidiaries of Franklin Templeton. In connection with the Transaction, shareholders of your Fund approved a new management contract with Putnam Management and a new sub-advisory contract with PIL. The new contracts are identical to the previous contracts, except for the effective dates, initial terms, updates to fund names as necessary to reflect previous name changes, and certain non-substantive changes.
Effective July 15, 2024, Putnam Management transferred its management contract for your Fund to Franklin Advisers, Inc. (“Franklin Advisers”), and Franklin Advisers replaced Putnam Management as the investment advisor to your Fund. In connection with the transfer, your Fund’s portfolio managers, along with supporting research analysts and certain other investment staff of Putnam Management, also became employees of Franklin Advisers. Putnam Management also transferred to Franklin Advisers its sub-management agreement with PIL in respect of your Fund. Franklin Advisers is an indirect, wholly-owned subsidiary of Franklin Templeton. In addition, effective July 15, 2024, Franklin Advisers retained Putnam Management as a sub-adviser to your Fund pursuant to a new subadvisory agreement.
Effective November 1, 2024 (the “Effective Date”), PIL, a sub-advisor of the Fund prior to the Effective Date, merged with and into Franklin Templeton Investment Management Limited (“FTIML”), a wholly-owned subsidiary of Franklin Templeton (the “Merger”). As of the Effective Date, PIL investment professionals became employees of FTIML, and the sub-advisory agreement between Franklin Advisers and PIL with respect to the Fund was terminated. In connection with the Merger, the Fund’s Trustees approved a new sub-advisory agreement between Franklin Advisers and FTIML, pursuant to which FTIML became a sub-advisor of the Fund on the Effective Date.
Effective September 30, 2024, the portfolio managers for the Fund are Michael Salm, Albert Chan, Tina Chou, Patrick Klein and Matthew Walkup.
This is a summary of certain changes to the Fund since November 1, 2023. For more complete information, you may review the Fund’s current prospectus and any applicable supplements and the Fund’s next prospectus, which we expect to be available by March 1, 2025, at https://www.franklintempleton.com/regulatory-fund-documents or upon request at (800) 225-1581 or
funddocuments@putnam.com.
| Putnam Income Fund | PAGE 3 | 38901-ATSM-1224 |
| |
| WHERE CAN I FIND ADDITIONAL INFORMATION ABOUT THE FUND? |
Additional information is available on https://www.franklintempleton.com/regulatory-fund-documents, including its: |
| • prospectus • proxy voting information • financial information • holdings • tax information |
HOUSEHOLDING
You will receive the Fund’s shareholder reports every six months. In addition, you will receive an annual updated summary prospectus (detail prospectus available upon request). To reduce Fund expenses, we try to identify related shareholders in a household and send only one copy of the shareholder reports and summary prospectus. This process, called “householding,” will continue indefinitely unless you instruct us otherwise. If you prefer not to have these documents householded, please call us at (800) 225-1581. At any time, you may view current prospectuses/summary prospectuses and shareholder reports on our website. If you choose, you may receive these documents through electronic delivery.
| Putnam Income Fund | PAGE 4 | 38901-ATSM-1224 |
96759506971610083100631125611770116339613967010810100001019610641107371051711727124531239310450104871159335.233.47.37.17.06.76.32.71.10.90.212.4
| | |
Putnam Income Fund | |
| Class R [PIFRX] |
| Annual Shareholder Report | October 31, 2024 |
|
This annual shareholder report contains important information about Putnam Income Fund for the period November 1, 2023, to October 31, 2024.
You can find additional information about the Fund at https://www.franklintempleton.com/regulatory-fund-documents. You can also request this information by contacting us at (800) 225-1581.
This report describes changes to the Fund that occurred during the reporting period.
WHAT WERE THE FUND COSTS FOR THE LAST YEAR? (based on a hypothetical $10,000 investment)
| | |
Class Name | Costs of a $10,000 investment | Costs paid as a percentage of a $10,000 investment* |
| Class R | $105 | 0.99% |
| * | Reflects fee waivers and/or expense reimbursements, without which expenses would have been higher. |
HOW DID THE FUND PERFORM LAST YEAR AND WHAT AFFECTED ITS PERFORMANCE?
For the twelve months ended October 31, 2024, Class R shares of Putnam Income Fund returned 11.90%. The Fund compares its performance to the Bloomberg U.S. Aggregate Index, which returned 10.55% for the same period.
| |
Top contributors to performance: |
| ↑ | Commercial mortgage-backed securities (CMBS) as the liquidity landscape improved significantly in 2024. Investor demand for CMBS was strong, and supply was well absorbed despite changes to expectations for the timing and number of rate cuts. Additionally, Non-agency residential mortgage-backed securities continued to benefit from U.S. housing market strength, solid borrower fundamentals, and low expectations for a U.S. recession. |
| ↑ | Prepayment strategies were also a notable driver of positive relative returns, driven by exposure to agency interest-only (IO) inverse IO (IIO) securities. Seasoned agency IO and IIO bonds continued to carry well and spreads were supportive. |
| ↑ | Corporate credit exposure contributed to relative returns, particularly exposure to investment grade corporate bonds and collateralized loan obligations. |
| |
Top detractors from performance: |
| ↓ | There were no significant detractors to performance. |
Use of derivatives and impact on performance:
The Fund used futures and interest rate swaps for hedging term structure risk and for yield curve positioning. In aggregate these derivatives minimally contributed to performance.
| Putnam Income Fund | PAGE 1 | 38901-ATSR-1224 |
HOW DID THE FUND PERFORM OVER THE LAST 10 YEARS?
The Fund’s past performance is not necessarily an indication of how the Fund will perform in the future. The graph and table do not reflect the deduction of taxes that a shareholder would pay on Fund distributions or redemption of Fund shares.
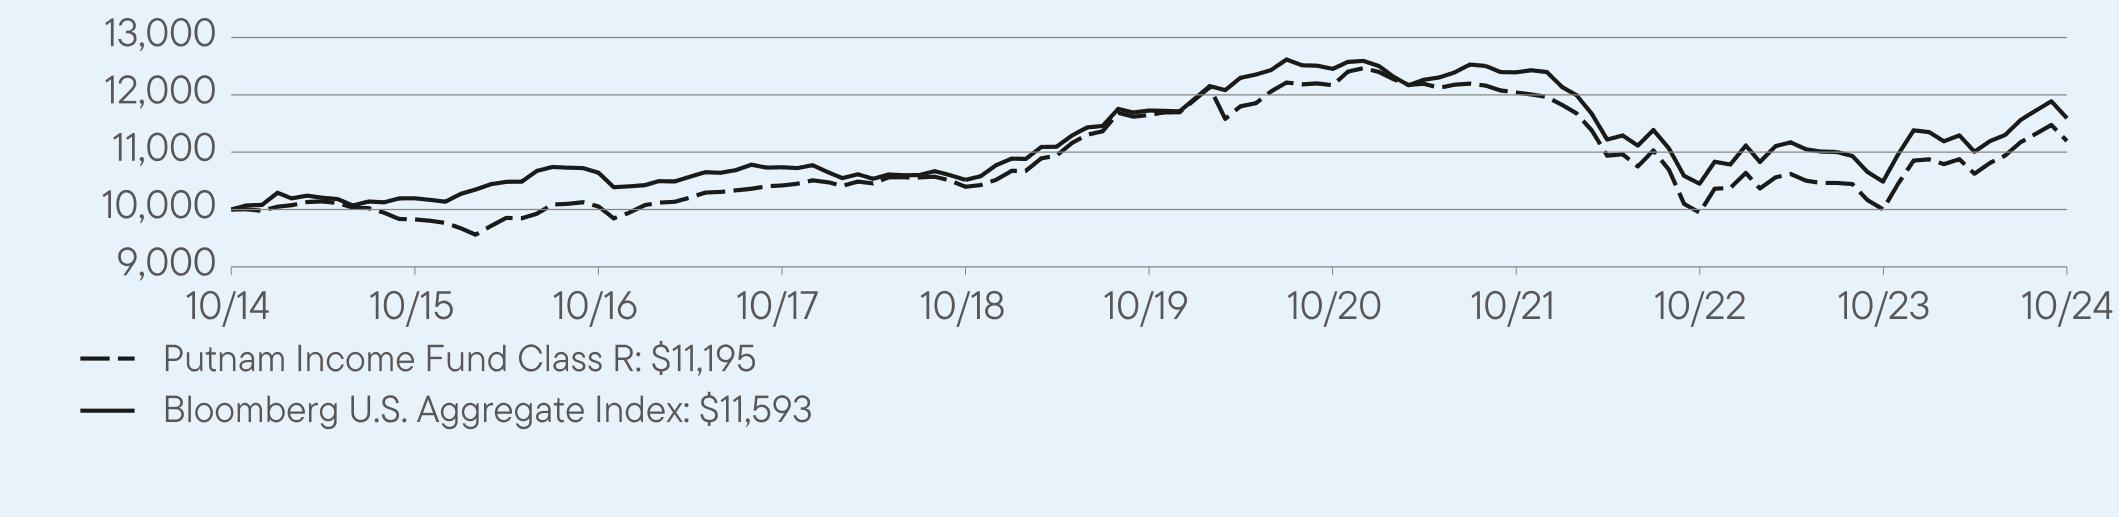
VALUE OF A $10,000 INVESTMENT – Class R 10/31/2014 — 10/31/2024
AVERAGE ANNUAL TOTAL RETURNS (%) Period Ended October 31, 2024
| | | |
| | 1 Year | 5 Year | 10 Year |
Class R | 11.90 | -0.79 | 1.14 |
Bloomberg U.S. Aggregate Index | 10.55 | -0.23 | 1.49 |
Fund performance figures may reflect fee waivers and/or expense reimbursements, without which the performance would have been lower.
For current month-end performance, please call Franklin Templeton at (800) 225-1581 or visit https://www.franklintempleton.com/investments/options/mutual-funds.
Important data provider notices and terms available at www.franklintempletondatasources.com.
KEY FUND STATISTICS (as of October 31, 2024)
| |
Total Net Assets | $1,133,540,937 |
Total Number of Portfolio Holdings* | 1,249 |
Total Management Fee Paid | $3,255,329 |
Portfolio Turnover Rate | 900% |
| * | Includes derivatives, if applicable. |
| Putnam Income Fund | PAGE 2 | 38901-ATSR-1224 |
WHAT DID THE FUND INVEST IN? (as of October 31, 2024)
Portfolio Composition (% of Total Net Assets)
| Cash and Equivalents, if any, represent the market value weights of cash, derivatives, short-term securities, and other unclassified assets in the portfolio. Allocations may not total 100% because the chart includes the notional value of certain derivatives (the economic value for purposes of calculating periodic payment obligations), including to-be-announced mortgage security trades, if any, in addition to the market value of securities. Holdings and allocations may vary over time. |
HOW HAS THE FUND CHANGED?
On May 31, 2023, Franklin Resources, Inc. (“Franklin Templeton”) and Great-West Lifeco Inc., the parent company of Putnam U.S. Holdings I, LLC (“Putnam Holdings”), announced that they had entered into a definitive agreement for a subsidiary of Franklin Templeton to acquire Putnam Holdings in a stock and cash transaction (the “Transaction”). The Transaction was completed on January 1, 2024. As part of the Transaction, your Fund’s then-current investment advisor, Putnam Investment Management, LLC (“Putnam Management”), a wholly-owned subsidiary of Putnam Holdings, and your Fund’s then-current sub-advisor, Putnam Investments Limited (“PIL”), an indirect, wholly-owned subsidiary of Putnam Holdings, became indirect, wholly-owned subsidiaries of Franklin Templeton. In connection with the Transaction, shareholders of your Fund approved a new management contract with Putnam Management and a new sub-advisory contract with PIL. The new contracts are identical to the previous contracts, except for the effective dates, initial terms, updates to fund names as necessary to reflect previous name changes, and certain non-substantive changes.
Effective July 15, 2024, Putnam Management transferred its management contract for your Fund to Franklin Advisers, Inc. (“Franklin Advisers”), and Franklin Advisers replaced Putnam Management as the investment advisor to your Fund. In connection with the transfer, your Fund’s portfolio managers, along with supporting research analysts and certain other investment staff of Putnam Management, also became employees of Franklin Advisers. Putnam Management also transferred to Franklin Advisers its sub-management agreement with PIL in respect of your Fund. Franklin Advisers is an indirect, wholly-owned subsidiary of Franklin Templeton. In addition, effective July 15, 2024, Franklin Advisers retained Putnam Management as a sub-adviser to your Fund pursuant to a new subadvisory agreement.
Effective November 1, 2024 (the “Effective Date”), PIL, a sub-advisor of the Fund prior to the Effective Date, merged with and into Franklin Templeton Investment Management Limited (“FTIML”), a wholly-owned subsidiary of Franklin Templeton (the “Merger”). As of the Effective Date, PIL investment professionals became employees of FTIML, and the sub-advisory agreement between Franklin Advisers and PIL with respect to the Fund was terminated. In connection with the Merger, the Fund’s Trustees approved a new sub-advisory agreement between Franklin Advisers and FTIML, pursuant to which FTIML became a sub-advisor of the Fund on the Effective Date.
Effective September 30, 2024, the portfolio managers for the Fund are Michael Salm, Albert Chan, Tina Chou, Patrick Klein and Matthew Walkup.
This is a summary of certain changes to the Fund since November 1, 2023. For more complete information, you may review the Fund’s current prospectus and any applicable supplements and the Fund’s next prospectus, which we expect to be available by March 1, 2025, at https://www.franklintempleton.com/regulatory-fund-documents or upon request at (800) 225-1581 or
funddocuments@putnam.com.
| Putnam Income Fund | PAGE 3 | 38901-ATSR-1224 |
| |
| WHERE CAN I FIND ADDITIONAL INFORMATION ABOUT THE FUND? |
Additional information is available on https://www.franklintempleton.com/regulatory-fund-documents, including its: |
| • prospectus • proxy voting information • financial information • holdings • tax information |
HOUSEHOLDING
You will receive the Fund’s shareholder reports every six months. In addition, you will receive an annual updated summary prospectus (detail prospectus available upon request). To reduce Fund expenses, we try to identify related shareholders in a household and send only one copy of the shareholder reports and summary prospectus. This process, called “householding,” will continue indefinitely unless you instruct us otherwise. If you prefer not to have these documents householded, please call us at (800) 225-1581. At any time, you may view current prospectuses/summary prospectuses and shareholder reports on our website. If you choose, you may receive these documents through electronic delivery.
| Putnam Income Fund | PAGE 4 | 38901-ATSR-1224 |
10000982710052104201039711649121681204399461000411195100001019610641107371051711727124531239310450104871159335.233.47.37.17.06.76.32.71.10.90.212.4
| | |
Putnam Income Fund | |
| Class R5 [PINFX] |
| Annual Shareholder Report | October 31, 2024 |
|
This annual shareholder report contains important information about Putnam Income Fund for the period November 1, 2023, to October 31, 2024.
You can find additional information about the Fund at https://www.franklintempleton.com/regulatory-fund-documents. You can also request this information by contacting us at (800) 225-1581.
This report describes changes to the Fund that occurred during the reporting period.
WHAT WERE THE FUND COSTS FOR THE LAST YEAR? (based on a hypothetical $10,000 investment)
| | |
Class Name | Costs of a $10,000 investment | Costs paid as a percentage of a $10,000 investment* |
| Class R5 | $48 | 0.45% |
| * | Reflects fee waivers and/or expense reimbursements, without which expenses would have been higher. |
HOW DID THE FUND PERFORM LAST YEAR AND WHAT AFFECTED ITS PERFORMANCE?
For the twelve months ended October 31, 2024, Class R5 shares of Putnam Income Fund returned 12.47%. The Fund compares its performance to the Bloomberg U.S. Aggregate Index, which returned 10.55% for the same period.
| |
Top contributors to performance: |
| ↑ | Commercial mortgage-backed securities (CMBS) as the liquidity landscape improved significantly in 2024. Investor demand for CMBS was strong, and supply was well absorbed despite changes to expectations for the timing and number of rate cuts. Additionally, Non-agency residential mortgage-backed securities continued to benefit from U.S. housing market strength, solid borrower fundamentals, and low expectations for a U.S. recession. |
| ↑ | Prepayment strategies were also a notable driver of positive relative returns, driven by exposure to agency interest-only (IO) inverse IO (IIO) securities. Seasoned agency IO and IIO bonds continued to carry well and spreads were supportive. |
| ↑ | Corporate credit exposure contributed to relative returns, particularly exposure to investment grade corporate bonds and collateralized loan obligations. |
| |
Top detractors from performance: |
| ↓ | There were no significant detractors to performance. |
Use of derivatives and impact on performance:
The Fund used futures and interest rate swaps for hedging term structure risk and for yield curve positioning. In aggregate these derivatives minimally contributed to performance.
| Putnam Income Fund | PAGE 1 | 38901-ATSR5-1224 |
HOW DID THE FUND PERFORM OVER THE LAST 10 YEARS?
The Fund’s past performance is not necessarily an indication of how the Fund will perform in the future. The graph and table do not reflect the deduction of taxes that a shareholder would pay on Fund distributions or redemption of Fund shares.
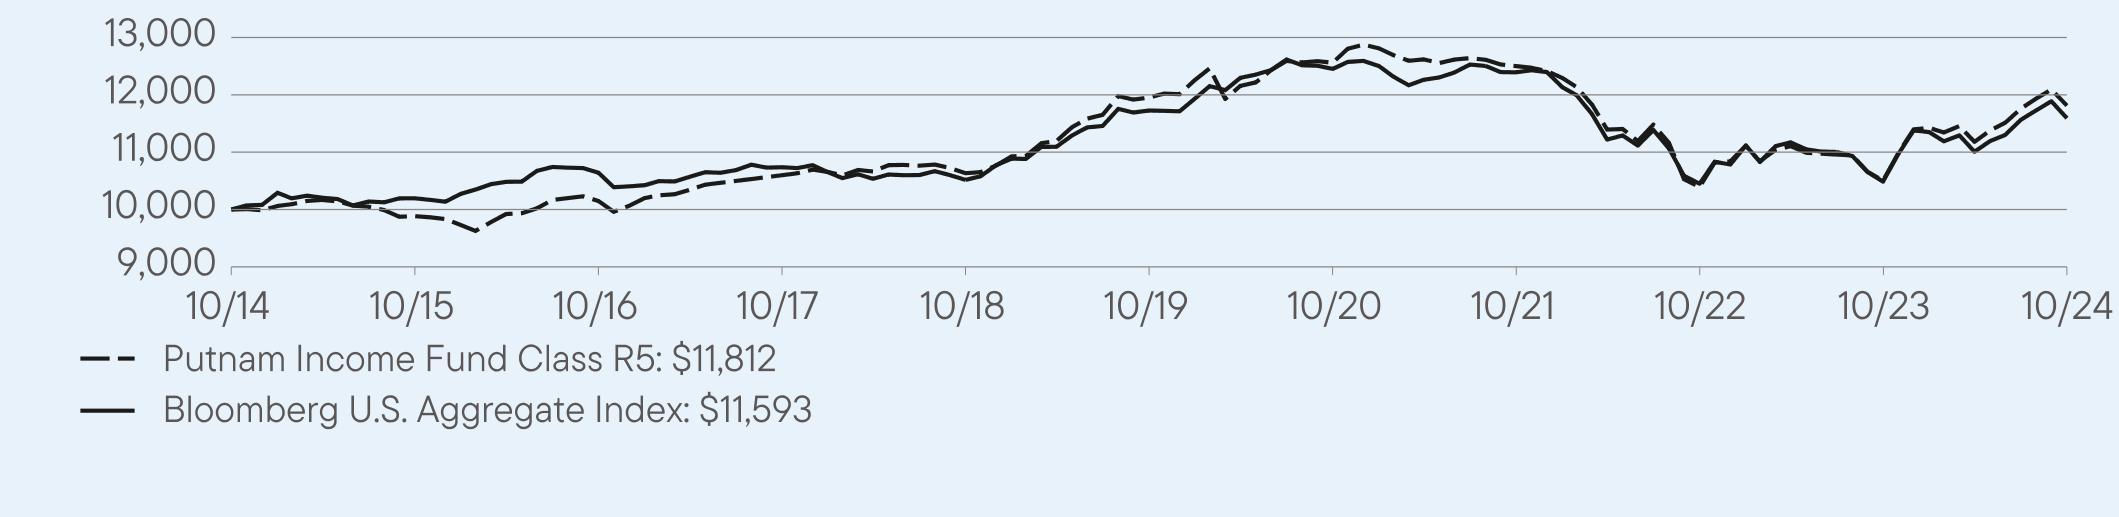
VALUE OF A $10,000 INVESTMENT – Class R5 10/31/2014 — 10/31/2024
AVERAGE ANNUAL TOTAL RETURNS (%) Period Ended October 31, 2024
| | | |
| | 1 Year | 5 Year | 10 Year |
Class R5 | 12.47 | -0.24 | 1.68 |
Bloomberg U.S. Aggregate Index | 10.55 | -0.23 | 1.49 |
Fund performance figures may reflect fee waivers and/or expense reimbursements, without which the performance would have been lower.
For current month-end performance, please call Franklin Templeton at (800) 225-1581 or visit https://www.franklintempleton.com/investments/options/mutual-funds.
Important data provider notices and terms available at www.franklintempletondatasources.com.
KEY FUND STATISTICS (as of October 31, 2024)
| |
Total Net Assets | $1,133,540,937 |
Total Number of Portfolio Holdings* | 1,249 |
Total Management Fee Paid | $3,255,329 |
Portfolio Turnover Rate | 900% |
| * | Includes derivatives, if applicable. |
| Putnam Income Fund | PAGE 2 | 38901-ATSR5-1224 |
WHAT DID THE FUND INVEST IN? (as of October 31, 2024)
Portfolio Composition (% of Total Net Assets)
| Cash and Equivalents, if any, represent the market value weights of cash, derivatives, short-term securities, and other unclassified assets in the portfolio. Allocations may not total 100% because the chart includes the notional value of certain derivatives (the economic value for purposes of calculating periodic payment obligations), including to-be-announced mortgage security trades, if any, in addition to the market value of securities. Holdings and allocations may vary over time. |
HOW HAS THE FUND CHANGED?
On May 31, 2023, Franklin Resources, Inc. (“Franklin Templeton”) and Great-West Lifeco Inc., the parent company of Putnam U.S. Holdings I, LLC (“Putnam Holdings”), announced that they had entered into a definitive agreement for a subsidiary of Franklin Templeton to acquire Putnam Holdings in a stock and cash transaction (the “Transaction”). The Transaction was completed on January 1, 2024. As part of the Transaction, your Fund’s then-current investment advisor, Putnam Investment Management, LLC (“Putnam Management”), a wholly-owned subsidiary of Putnam Holdings, and your Fund’s then-current sub-advisor, Putnam Investments Limited (“PIL”), an indirect, wholly-owned subsidiary of Putnam Holdings, became indirect, wholly-owned subsidiaries of Franklin Templeton. In connection with the Transaction, shareholders of your Fund approved a new management contract with Putnam Management and a new sub-advisory contract with PIL. The new contracts are identical to the previous contracts, except for the effective dates, initial terms, updates to fund names as necessary to reflect previous name changes, and certain non-substantive changes.
Effective July 15, 2024, Putnam Management transferred its management contract for your Fund to Franklin Advisers, Inc. (“Franklin Advisers”), and Franklin Advisers replaced Putnam Management as the investment advisor to your Fund. In connection with the transfer, your Fund’s portfolio managers, along with supporting research analysts and certain other investment staff of Putnam Management, also became employees of Franklin Advisers. Putnam Management also transferred to Franklin Advisers its sub-management agreement with PIL in respect of your Fund. Franklin Advisers is an indirect, wholly-owned subsidiary of Franklin Templeton. In addition, effective July 15, 2024, Franklin Advisers retained Putnam Management as a sub-adviser to your Fund pursuant to a new subadvisory agreement.
Effective November 1, 2024 (the “Effective Date”), PIL, a sub-advisor of the Fund prior to the Effective Date, merged with and into Franklin Templeton Investment Management Limited (“FTIML”), a wholly-owned subsidiary of Franklin Templeton (the “Merger”). As of the Effective Date, PIL investment professionals became employees of FTIML, and the sub-advisory agreement between Franklin Advisers and PIL with respect to the Fund was terminated. In connection with the Merger, the Fund’s Trustees approved a new sub-advisory agreement between Franklin Advisers and FTIML, pursuant to which FTIML became a sub-advisor of the Fund on the Effective Date.
Effective September 30, 2024, the portfolio managers for the Fund are Michael Salm, Albert Chan, Tina Chou, Patrick Klein and Matthew Walkup.
This is a summary of certain changes to the Fund since November 1, 2023. For more complete information, you may review the Fund’s current prospectus and any applicable supplements and the Fund’s next prospectus, which we expect to be available by March 1, 2025, at https://www.franklintempleton.com/regulatory-fund-documents or upon request at (800) 225-1581 or
funddocuments@putnam.com.
| Putnam Income Fund | PAGE 3 | 38901-ATSR5-1224 |
| |
| WHERE CAN I FIND ADDITIONAL INFORMATION ABOUT THE FUND? |
Additional information is available on https://www.franklintempleton.com/regulatory-fund-documents, including its: |
| • prospectus • proxy voting information • financial information • holdings • tax information |
HOUSEHOLDING
You will receive the Fund’s shareholder reports every six months. In addition, you will receive an annual updated summary prospectus (detail prospectus available upon request). To reduce Fund expenses, we try to identify related shareholders in a household and send only one copy of the shareholder reports and summary prospectus. This process, called “householding,” will continue indefinitely unless you instruct us otherwise. If you prefer not to have these documents householded, please call us at (800) 225-1581. At any time, you may view current prospectuses/summary prospectuses and shareholder reports on our website. If you choose, you may receive these documents through electronic delivery.
| Putnam Income Fund | PAGE 4 | 38901-ATSR5-1224 |
100009884101471059810634119531256112501103931050211812100001019610641107371051711727124531239310450104871159335.233.47.37.17.06.76.32.71.10.90.212.4
| | |
Putnam Income Fund | |
| Class R6 [PINHX] |
| Annual Shareholder Report | October 31, 2024 |
|
This annual shareholder report contains important information about Putnam Income Fund for the period November 1, 2023, to October 31, 2024.
You can find additional information about the Fund at https://www.franklintempleton.com/regulatory-fund-documents. You can also request this information by contacting us at (800) 225-1581.
This report describes changes to the Fund that occurred during the reporting period.
WHAT WERE THE FUND COSTS FOR THE LAST YEAR? (based on a hypothetical $10,000 investment)
| | |
Class Name | Costs of a $10,000 investment | Costs paid as a percentage of a $10,000 investment* |
| Class R6 | $40 | 0.38% |
| * | Reflects fee waivers and/or expense reimbursements, without which expenses would have been higher. |
HOW DID THE FUND PERFORM LAST YEAR AND WHAT AFFECTED ITS PERFORMANCE?
For the twelve months ended October 31, 2024, Class R6 shares of Putnam Income Fund returned 12.38%. The Fund compares its performance to the Bloomberg U.S. Aggregate Index, which returned 10.55% for the same period.
| |
Top contributors to performance: |
| ↑ | Commercial mortgage-backed securities (CMBS) as the liquidity landscape improved significantly in 2024. Investor demand for CMBS was strong, and supply was well absorbed despite changes to expectations for the timing and number of rate cuts. Additionally, Non-agency residential mortgage-backed securities continued to benefit from U.S. housing market strength, solid borrower fundamentals, and low expectations for a U.S. recession. |
| ↑ | Prepayment strategies were also a notable driver of positive relative returns, driven by exposure to agency interest-only (IO) inverse IO (IIO) securities. Seasoned agency IO and IIO bonds continued to carry well and spreads were supportive. |
| ↑ | Corporate credit exposure contributed to relative returns, particularly exposure to investment grade corporate bonds and collateralized loan obligations. |
| |
Top detractors from performance: |
| ↓ | There were no significant detractors to performance. |
Use of derivatives and impact on performance:
The Fund used futures and interest rate swaps for hedging term structure risk and for yield curve positioning. In aggregate these derivatives minimally contributed to performance.
| Putnam Income Fund | PAGE 1 | 38901-ATSR6-1224 |
HOW DID THE FUND PERFORM OVER THE LAST 10 YEARS?
The Fund’s past performance is not necessarily an indication of how the Fund will perform in the future. The graph and table do not reflect the deduction of taxes that a shareholder would pay on Fund distributions or redemption of Fund shares.
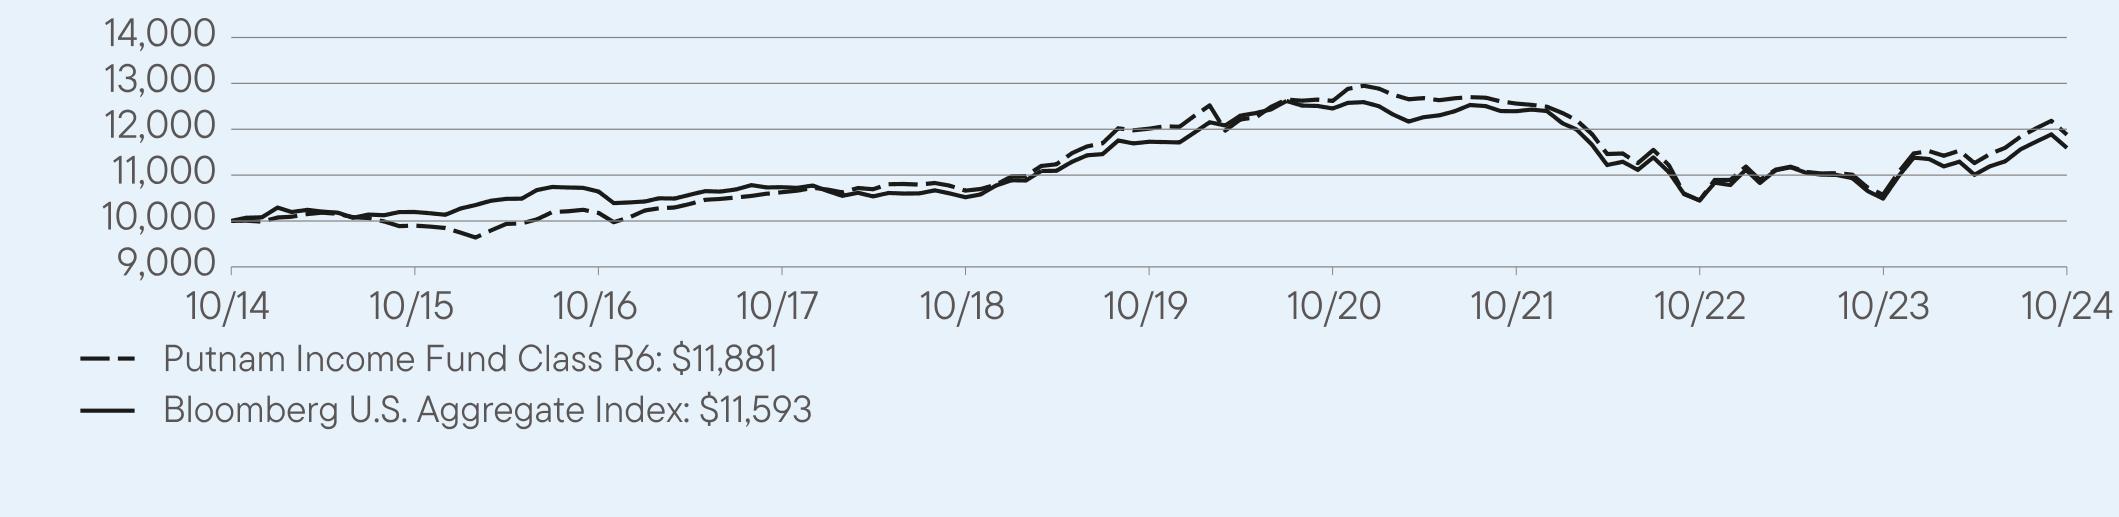
VALUE OF A $10,000 INVESTMENT – Class R6 10/31/2014 — 10/31/2024
AVERAGE ANNUAL TOTAL RETURNS (%) Period Ended October 31, 2024
| | | |
| | 1 Year | 5 Year | 10 Year |
Class R6 | 12.38 | -0.22 | 1.74 |
Bloomberg U.S. Aggregate Index | 10.55 | -0.23 | 1.49 |
Total return information is based on net asset values calculated for shareholder transactions. Certain adjustments were made to the net assets of the Fund at the end of the period for financial reporting purposes. Accordingly, adjusted total returns have been disclosed in the Financial Highlights and differ from those reported here.
Fund performance figures may reflect fee waivers and/or expense reimbursements, without which the performance would have been lower.
For current month-end performance, please call Franklin Templeton at (800) 225-1581 or visit https://www.franklintempleton.com/investments/options/mutual-funds.
Important data provider notices and terms available at www.franklintempletondatasources.com.
KEY FUND STATISTICS (as of October 31, 2024)
| |
Total Net Assets | $1,133,540,937 |
Total Number of Portfolio Holdings* | 1,249 |
Total Management Fee Paid | $3,255,329 |
Portfolio Turnover Rate | 900% |
| * | Includes derivatives, if applicable. |
| Putnam Income Fund | PAGE 2 | 38901-ATSR6-1224 |
WHAT DID THE FUND INVEST IN? (as of October 31, 2024)
Portfolio Composition (% of Total Net Assets)
| Cash and Equivalents, if any, represent the market value weights of cash, derivatives, short-term securities, and other unclassified assets in the portfolio. Allocations may not total 100% because the chart includes the notional value of certain derivatives (the economic value for purposes of calculating periodic payment obligations), including to-be-announced mortgage security trades, if any, in addition to the market value of securities. Holdings and allocations may vary over time. |
HOW HAS THE FUND CHANGED?
On May 31, 2023, Franklin Resources, Inc. (“Franklin Templeton”) and Great-West Lifeco Inc., the parent company of Putnam U.S. Holdings I, LLC (“Putnam Holdings”), announced that they had entered into a definitive agreement for a subsidiary of Franklin Templeton to acquire Putnam Holdings in a stock and cash transaction (the “Transaction”). The Transaction was completed on January 1, 2024. As part of the Transaction, your Fund’s then-current investment advisor, Putnam Investment Management, LLC (“Putnam Management”), a wholly-owned subsidiary of Putnam Holdings, and your Fund’s then-current sub-advisor, Putnam Investments Limited (“PIL”), an indirect, wholly-owned subsidiary of Putnam Holdings, became indirect, wholly-owned subsidiaries of Franklin Templeton. In connection with the Transaction, shareholders of your Fund approved a new management contract with Putnam Management and a new sub-advisory contract with PIL. The new contracts are identical to the previous contracts, except for the effective dates, initial terms, updates to fund names as necessary to reflect previous name changes, and certain non-substantive changes.
Effective July 15, 2024, Putnam Management transferred its management contract for your Fund to Franklin Advisers, Inc. (“Franklin Advisers”), and Franklin Advisers replaced Putnam Management as the investment advisor to your Fund. In connection with the transfer, your Fund’s portfolio managers, along with supporting research analysts and certain other investment staff of Putnam Management, also became employees of Franklin Advisers. Putnam Management also transferred to Franklin Advisers its sub-management agreement with PIL in respect of your Fund. Franklin Advisers is an indirect, wholly-owned subsidiary of Franklin Templeton. In addition, effective July 15, 2024, Franklin Advisers retained Putnam Management as a sub-adviser to your Fund pursuant to a new subadvisory agreement.
Effective November 1, 2024 (the “Effective Date”), PIL, a sub-advisor of the Fund prior to the Effective Date, merged with and into Franklin Templeton Investment Management Limited (“FTIML”), a wholly-owned subsidiary of Franklin Templeton (the “Merger”). As of the Effective Date, PIL investment professionals became employees of FTIML, and the sub-advisory agreement between Franklin Advisers and PIL with respect to the Fund was terminated. In connection with the Merger, the Fund’s Trustees approved a new sub-advisory agreement between Franklin Advisers and FTIML, pursuant to which FTIML became a sub-advisor of the Fund on the Effective Date.
Effective September 30, 2024, the portfolio managers for the Fund are Michael Salm, Albert Chan, Tina Chou, Patrick Klein and Matthew Walkup.
This is a summary of certain changes to the Fund since November 1, 2023. For more complete information, you may review the Fund’s current prospectus and any applicable supplements and the Fund’s next prospectus, which we expect to be available by March 1, 2025, at https://www.franklintempleton.com/regulatory-fund-documents or upon request at (800) 225-1581 or
funddocuments@putnam.com.
| Putnam Income Fund | PAGE 3 | 38901-ATSR6-1224 |
| |
| WHERE CAN I FIND ADDITIONAL INFORMATION ABOUT THE FUND? |
Additional information is available on https://www.franklintempleton.com/regulatory-fund-documents, including its: |
| • prospectus • proxy voting information • financial information • holdings • tax information |
HOUSEHOLDING
You will receive the Fund’s shareholder reports every six months. In addition, you will receive an annual updated summary prospectus (detail prospectus available upon request). To reduce Fund expenses, we try to identify related shareholders in a household and send only one copy of the shareholder reports and summary prospectus. This process, called “householding,” will continue indefinitely unless you instruct us otherwise. If you prefer not to have these documents householded, please call us at (800) 225-1581. At any time, you may view current prospectuses/summary prospectuses and shareholder reports on our website. If you choose, you may receive these documents through electronic delivery.
| Putnam Income Fund | PAGE 4 | 38901-ATSR6-1224 |
100009898101751062710662120121261912561104471057311881100001019610641107371051711727124531239310450104871159335.233.47.37.17.06.76.32.71.10.90.212.4
| | |
Putnam Income Fund | |
| Class Y [PNCYX] |
| Annual Shareholder Report | October 31, 2024 |
|
This annual shareholder report contains important information about Putnam Income Fund for the period November 1, 2023, to October 31, 2024.
You can find additional information about the Fund at https://www.franklintempleton.com/regulatory-fund-documents. You can also request this information by contacting us at (800) 225-1581.
This report describes changes to the Fund that occurred during the reporting period.
WHAT WERE THE FUND COSTS FOR THE LAST YEAR? (based on a hypothetical $10,000 investment)
| | |
Class Name | Costs of a $10,000 investment | Costs paid as a percentage of a $10,000 investment* |
| Class Y | $52 | 0.49% |
| * | Reflects fee waivers and/or expense reimbursements, without which expenses would have been higher. |
HOW DID THE FUND PERFORM LAST YEAR AND WHAT AFFECTED ITS PERFORMANCE?
For the twelve months ended October 31, 2024, Class Y shares of Putnam Income Fund returned 12.35%. The Fund compares its performance to the Bloomberg U.S. Aggregate Index, which returned 10.55% for the same period.
| |
Top contributors to performance: |
| ↑ | Commercial mortgage-backed securities (CMBS) as the liquidity landscape improved significantly in 2024. Investor demand for CMBS was strong, and supply was well absorbed despite changes to expectations for the timing and number of rate cuts. Additionally, Non-agency residential mortgage-backed securities continued to benefit from U.S. housing market strength, solid borrower fundamentals, and low expectations for a U.S. recession. |
| ↑ | Prepayment strategies were also a notable driver of positive relative returns, driven by exposure to agency interest-only (IO) inverse IO (IIO) securities. Seasoned agency IO and IIO bonds continued to carry well and spreads were supportive. |
| ↑ | Corporate credit exposure contributed to relative returns, particularly exposure to investment grade corporate bonds and collateralized loan obligations. |
| |
Top detractors from performance: |
| ↓ | There were no significant detractors to performance. |
Use of derivatives and impact on performance:
The Fund used futures and interest rate swaps for hedging term structure risk and for yield curve positioning. In aggregate these derivatives minimally contributed to performance.
| Putnam Income Fund | PAGE 1 | 38901-ATSY-1224 |
HOW DID THE FUND PERFORM OVER THE LAST 10 YEARS?
The Fund’s past performance is not necessarily an indication of how the Fund will perform in the future. The graph and table do not reflect the deduction of taxes that a shareholder would pay on Fund distributions or redemption of Fund shares.
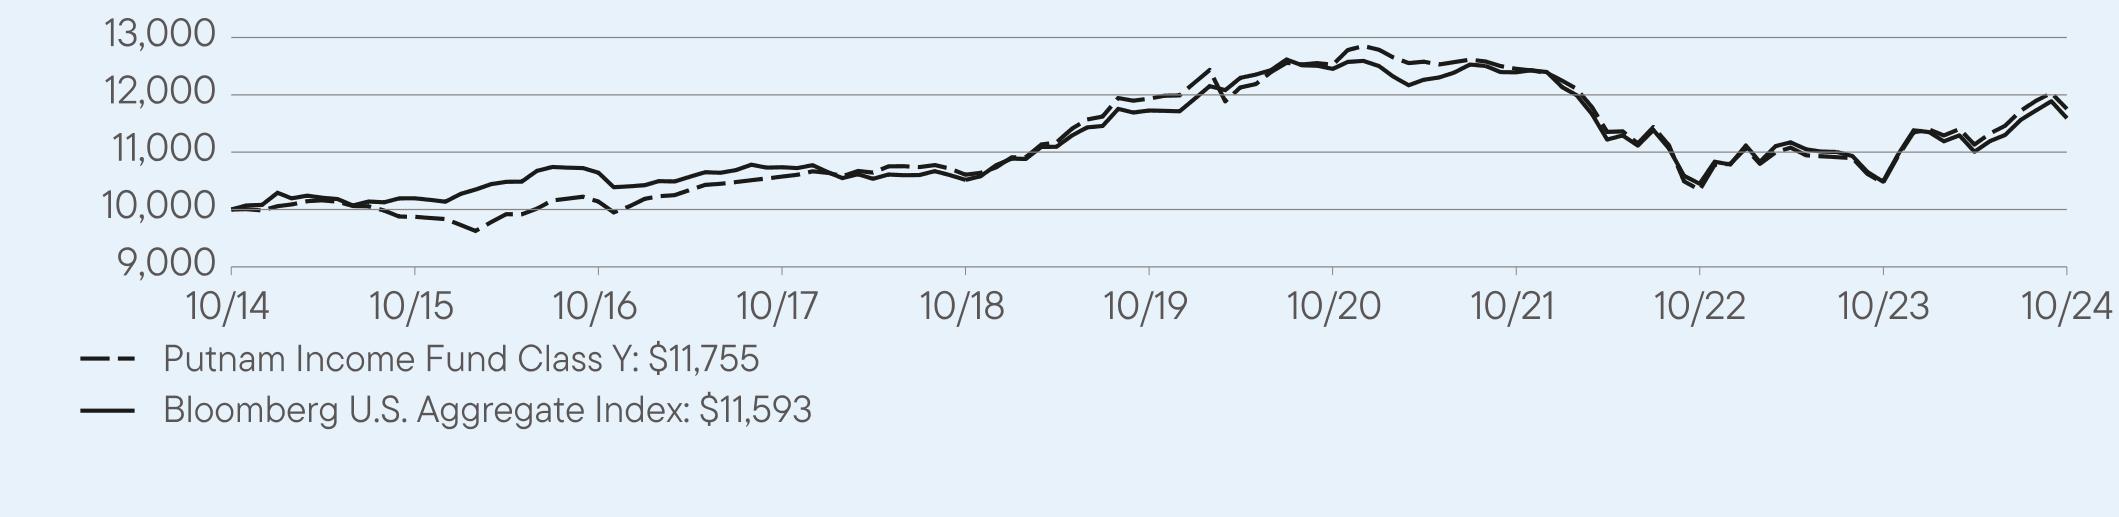
VALUE OF A $10,000 INVESTMENT – Class Y 10/31/2014 — 10/31/2024
AVERAGE ANNUAL TOTAL RETURNS (%) Period Ended October 31, 2024
| | | |
| | 1 Year | 5 Year | 10 Year |
Class Y | 12.35 | -0.30 | 1.63 |
Bloomberg U.S. Aggregate Index | 10.55 | -0.23 | 1.49 |
Fund performance figures may reflect fee waivers and/or expense reimbursements, without which the performance would have been lower.
For current month-end performance, please call Franklin Templeton at (800) 225-1581 or visit https://www.franklintempleton.com/investments/options/mutual-funds.
Important data provider notices and terms available at www.franklintempletondatasources.com.
KEY FUND STATISTICS (as of October 31, 2024)
| |
Total Net Assets | $1,133,540,937 |
Total Number of Portfolio Holdings* | 1,249 |
Total Management Fee Paid | $3,255,329 |
Portfolio Turnover Rate | 900% |
| * | Includes derivatives, if applicable. |
| Putnam Income Fund | PAGE 2 | 38901-ATSY-1224 |
WHAT DID THE FUND INVEST IN? (as of October 31, 2024)
Portfolio Composition (% of Total Net Assets)
| Cash and Equivalents, if any, represent the market value weights of cash, derivatives, short-term securities, and other unclassified assets in the portfolio. Allocations may not total 100% because the chart includes the notional value of certain derivatives (the economic value for purposes of calculating periodic payment obligations), including to-be-announced mortgage security trades, if any, in addition to the market value of securities. Holdings and allocations may vary over time. |
HOW HAS THE FUND CHANGED?
On May 31, 2023, Franklin Resources, Inc. (“Franklin Templeton”) and Great-West Lifeco Inc., the parent company of Putnam U.S. Holdings I, LLC (“Putnam Holdings”), announced that they had entered into a definitive agreement for a subsidiary of Franklin Templeton to acquire Putnam Holdings in a stock and cash transaction (the “Transaction”). The Transaction was completed on January 1, 2024. As part of the Transaction, your Fund’s then-current investment advisor, Putnam Investment Management, LLC (“Putnam Management”), a wholly-owned subsidiary of Putnam Holdings, and your Fund’s then-current sub-advisor, Putnam Investments Limited (“PIL”), an indirect, wholly-owned subsidiary of Putnam Holdings, became indirect, wholly-owned subsidiaries of Franklin Templeton. In connection with the Transaction, shareholders of your Fund approved a new management contract with Putnam Management and a new sub-advisory contract with PIL. The new contracts are identical to the previous contracts, except for the effective dates, initial terms, updates to fund names as necessary to reflect previous name changes, and certain non-substantive changes.
Effective July 15, 2024, Putnam Management transferred its management contract for your Fund to Franklin Advisers, Inc. (“Franklin Advisers”), and Franklin Advisers replaced Putnam Management as the investment advisor to your Fund. In connection with the transfer, your Fund’s portfolio managers, along with supporting research analysts and certain other investment staff of Putnam Management, also became employees of Franklin Advisers. Putnam Management also transferred to Franklin Advisers its sub-management agreement with PIL in respect of your Fund. Franklin Advisers is an indirect, wholly-owned subsidiary of Franklin Templeton. In addition, effective July 15, 2024, Franklin Advisers retained Putnam Management as a sub-adviser to your Fund pursuant to a new subadvisory agreement.
Effective November 1, 2024 (the “Effective Date”), PIL, a sub-advisor of the Fund prior to the Effective Date, merged with and into Franklin Templeton Investment Management Limited (“FTIML”), a wholly-owned subsidiary of Franklin Templeton (the “Merger”). As of the Effective Date, PIL investment professionals became employees of FTIML, and the sub-advisory agreement between Franklin Advisers and PIL with respect to the Fund was terminated. In connection with the Merger, the Fund’s Trustees approved a new sub-advisory agreement between Franklin Advisers and FTIML, pursuant to which FTIML became a sub-advisor of the Fund on the Effective Date.
Effective September 30, 2024, the portfolio managers for the Fund are Michael Salm, Albert Chan, Tina Chou, Patrick Klein and Matthew Walkup.
This is a summary of certain changes to the Fund since November 1, 2023. For more complete information, you may review the Fund’s current prospectus and any applicable supplements and the Fund’s next prospectus, which we expect to be available by March 1, 2025, at https://www.franklintempleton.com/regulatory-fund-documents or upon request at (800) 225-1581 or
funddocuments@putnam.com.
| Putnam Income Fund | PAGE 3 | 38901-ATSY-1224 |
| |
| WHERE CAN I FIND ADDITIONAL INFORMATION ABOUT THE FUND? |
Additional information is available on https://www.franklintempleton.com/regulatory-fund-documents, including its: |
| • prospectus • proxy voting information • financial information • holdings • tax information |
HOUSEHOLDING
You will receive the Fund’s shareholder reports every six months. In addition, you will receive an annual updated summary prospectus (detail prospectus available upon request). To reduce Fund expenses, we try to identify related shareholders in a household and send only one copy of the shareholder reports and summary prospectus. This process, called “householding,” will continue indefinitely unless you instruct us otherwise. If you prefer not to have these documents householded, please call us at (800) 225-1581. At any time, you may view current prospectuses/summary prospectuses and shareholder reports on our website. If you choose, you may receive these documents through electronic delivery.
| Putnam Income Fund | PAGE 4 | 38901-ATSY-1224 |
100009873101371057410607119341252512454103401046311755100001019610641107371051711727124531239310450104871159335.233.47.37.17.06.76.32.71.10.90.212.4
| |
| (a) The fund’s principal executive, financial and accounting officers are employees of Putnam Investment Management, LLC, the Fund’s investment manager, or Franklin Templeton. As such they are subject to a comprehensive Code of Ethics adopted and administered by Putnam Investment Management, LLC and Franklin Templeton which is designed to protect the interests of the firm and its clients. The Fund has adopted a Code of Ethics which incorporates the Code of Ethics of Franklin Templeton with respect to all of its officers and Trustees who are employees of Putnam Investment Management, LLC and Franklin Templeton. For this reason, the Fund has not adopted a separate code of ethics governing its principal executive, financial and accounting officers. |
| |
| (c) In connection with the acquisition of Putnam Investments by Franklin Templeton, the Putnam Investments Code of Ethics was amended effective January 1, 2024 to reflect revised compliance processes, including: (i) Compliance with the Putnam Investments Code of Ethics will be viewed as compliance with the Franklin Templeton Code for certain Putnam employees who are dual-hatted in Franklin Templeton advisory entities (ii) Certain Franklin Templeton employees are required to hold shares of Putnam mutual funds at Putnam Investor Services, Inc. and (iii) Certain provisions of the Putnam Investments Code of Ethics are amended that are no longer needed due to organizational changes. Effective March 4, 2024, the majority of legacy Putnam employees transitioned to Franklin Templeton policies outlined in the Franklin Templeton Code. |
| |
| Item 3. Audit Committee Financial Expert: |
| |
| The Funds’ Audit, Compliance and Risk Committee is comprised solely of Trustees who are “independent” (as such term has been defined by the Securities and Exchange Commission (“SEC”) in regulations implementing Section 407 of the Sarbanes-Oxley Act (the “Regulations”)). The Trustees believe that each member of the Audit, Compliance and Risk Committee also possesses a combination of knowledge and experience with respect to financial accounting matters, as well as other attributes, that qualifies him or her for service on the Committee. In addition, the Trustees have determined that each of Mr. McGreevey and Mr. Singh qualifies as an “audit committee financial expert” (as such term has been defined by the Regulations) based on their review of his or her pertinent experience and education.The SEC has stated, and the funds’ amended and restated agreement and Declaration of Trust provides, that the designation or identification of a person as an audit committee financial expert pursuant to this Item 3 of Form N-CSR does not impose on such person any duties, obligations or liability that are greater than the duties, obligations and liability imposed on such person as a member of the Audit, Compliance and Risk Committee and the Board of Trustees in the absence of such designation or identification. |
| |
| Item 4. Principal Accountant Fees and Services: |
| |
| The following table presents fees billed in each of the last two fiscal years for services rendered to the fund by the fund’s independent auditor: |
Fiscal year ended | Audit Fees | Audit-Related Fees | Tax Fees | All Other Fees |
October 31, 2024 | $133,574 | $ — | $11,021 | $ — |
October 31, 2023 | $161,752 | $ — | $11,021 | $ — |
| |
| For the fiscal years ended October 31, 2024 and October 31, 2023, the fund’s independent auditor billed aggregate non-audit fees in the amounts of $883,057 and $231,653 respectively, to the fund, Putnam Management and any entity controlling, controlled by or under common control with Putnam Management that provides ongoing services to the fund. |
| |
| Audit Fees represent fees billed for the fund’s last two fiscal years relating to the audit and review of the financial statements included in annual reports and registration statements, and other services that are normally provided in connection with statutory and regulatory filings or engagements. |
| |
| Audit-Related Fees represent fees billed in the fund’s last two fiscal years for services traditionally performed by the fund’s auditor, including accounting consultation for proposed transactions or concerning financial accounting and reporting standards and other audit or attest services not required by statute or regulation. |
| |
| Tax Fees represent fees billed in the fund’s last two fiscal years for tax compliance, tax planning and tax advice services. Tax planning and tax advice services include assistance with tax audits, employee benefit plans and requests for rulings or technical advice from taxing authorities. |
| |
| Pre-Approval Policies of the Audit, Compliance and Risk Committee. The Audit, Compliance and Risk Committee of the Putnam funds has determined that, as a matter of policy, all work performed for the funds by the funds’ independent auditors will be pre-approved by the Committee itself and thus will generally not be subject to pre-approval procedures. |
| |
| The Audit, Compliance and Risk Committee also has adopted a policy to pre-approve the engagement by Putnam Management and certain of its affiliates of the funds’ independent auditors, even in circumstances where pre-approval is not required by applicable law. Any such requests by Putnam Management or certain of its affiliates are typically submitted in writing to the Committee and explain, among other things, the nature of the proposed engagement, the estimated fees, and why this work should be performed by that particular audit firm as opposed to another one. In reviewing such requests, the Committee considers, among other things, whether the provision of such services by the audit firm are compatible with the independence of the audit firm. |
| |
| The following table presents fees billed by the fund’s independent auditor for services required to be approved pursuant to paragraph (c)(7)(ii) of Rule 2–01 of Regulation S-X. |
Fiscal year ended | Audit-Related Fees | Tax Fees | All Other Fees | Total Non-Audit Fees |
October 31, 2024 | $ — | $791,963 | $80,073 | $872,036 |
October 31, 2023 | $ — | $220,632 | $ — | $220,632 |
| |
| Item 5. Audit Committee of Listed Registrants |
| |
| The registrant’s schedule of investments in unaffiliated issuers is included in the Financial Statements and Other Important Information in Item 7 below. |
| |
| Item 7. Financial Statements and Financial Highlights for Open-End Management Investment Companies. |

Putnam
Income
Fund
Financial Statements and Other Important Information
Annual | October 31, 2024

Table of Contents
| | Financial Statements and Other Important Information—Annual | franklintempleton.com |
Report of Independent Registered Public Accounting Firm
To the Board of Trustees and Shareholders of
Putnam Income Fund:
Opinion on the Financial Statements
We have audited the accompanying statement of assets and liabilities, including the fund's portfolio, of Putnam Income Fund (the “Fund”) as of October 31, 2024, the related statement of operations for the year ended October 31, 2024, the statement of changes in net assets for each of the two years in the period ended October 31, 2024, including the related notes, and the financial highlights for each of the five years in the period ended October 31, 2024 (collectively referred to as the “financial statements”). In our opinion, the financial statements present fairly, in all material respects, the financial position of the Fund as of October 31, 2024, the results of its operations for the year then ended, the changes in its net assets for each of the two years in the period ended October 31, 2024 and the financial highlights for each of the five years in the period ended October 31, 2024 indicated therein in conformity with accounting principles generally accepted in the United States of America.
Basis for Opinion
These financial statements are the responsibility of the Fund's management. Our responsibility is to express an opinion on the Fund's financial statements based on our audits. We are a public accounting firm registered with the Public Company Accounting Oversight Board (United States) (“PCAOB”) and are required to be independent with respect to the Fund in accordance with the U.S. federal securities laws and the applicable rules and regulations of the Securities and Exchange Commission and the PCAOB.
We conducted our audits of these financial statements in accordance with the standards of the PCAOB. Those standards require that we plan and perform the audit to obtain reasonable assurance about whether the financial statements are free of material misstatement, whether due to error or fraud.
Our audits included performing procedures to assess the risks of material misstatement of the financial statements, whether due to error or fraud, and performing procedures that respond to those risks. Such procedures included examining, on a test basis, evidence regarding the amounts and disclosures in the financial statements. Our audits also included evaluating the accounting principles used and significant estimates made by management, as well as evaluating the overall presentation of the financial statements. Our procedures included confirmation of securities owned as of October 31, 2024 by correspondence with the custodian, transfer agent, agent banks and brokers; when replies were not received from brokers or agent banks, we performed other auditing procedures. We believe that our audits provide a reasonable basis for our opinion.
PricewaterhouseCoopers LLP
Boston, Massachusetts
December 17, 2024
We have served as the auditor of one or more investment companies in the Putnam Investments family of funds since at least 1957. We have not been able to determine the specific year we began serving as auditor.
| The fund’s portfolio 10/31/24 |
| | U.S. GOVERNMENT AND AGENCY MORTGAGE OBLIGATIONS (47.2%)* | Principal amount | Value |
| | U.S. Government Guaranteed Mortgage Obligations (17.4%) | | |
| | Government National Mortgage Association (ICE LIBOR USD 12 Month + 1.41%), 3.469%, 12/20/68 | $960,027 | $1,003,894 |
| | Government National Mortgage Association Pass-Through Certificates | | |
| | 6.50%, with due dates from 3/15/31 to 9/20/53 | 11,946,939 | 12,354,317 |
| | 6.00%, TBA, 11/1/54 | 2,000,000 | 2,014,852 |
| | 6.00%, with due dates from 12/20/48 to 11/20/53 | 11,505,297 | 11,749,366 |
| | 5.50%, TBA, 11/1/54 | 3,000,000 | 2,983,704 |
| | 5.50%, with due dates from 1/20/49 to 8/20/53 | 6,961,474 | 7,018,488 |
| | 5.00%, TBA, 11/1/54 | 5,000,000 | 4,884,337 |
| | 5.00%, with due dates from 6/15/40 to 10/20/49 | 4,465,183 | 4,437,582 |
| | 4.70%, with due dates from 6/20/65 to 6/20/65 | 40,908 | 40,548 |
| | 4.644%, 5/20/65 | 44,259 | 43,795 |
| | 4.576%, 5/20/65 | 10,729 | 10,647 |
| | 4.572%, 6/20/65 | 2,858 | 2,830 |
| | 4.50%, TBA, 11/1/54 | 71,000,000 | 67,775,464 |
| | 4.50%, with due dates from 5/20/44 to 7/20/52 | 3,399,701 | 3,324,110 |
| | 4.436%, 8/20/65 | 20,243 | 19,962 |
| | 4.353%, 5/20/65 | 369,857 | 366,031 |
| | 4.336%, 5/20/65 | 9,122 | 8,994 |
| | 4.25%, 6/20/65 | 12,558 | 12,309 |
| | 4.225%, 6/20/65 | 11,789 | 11,612 |
| | 4.00%, TBA, 11/1/54 | 48,000,000 | 44,688,750 |
| | 4.00%, with due dates from 2/20/48 to 9/20/49 | 4,238,797 | 3,953,236 |
| | 3.50%, TBA, 11/1/54 | 9,000,000 | 8,134,115 |
| | 3.50%, with due dates from 11/15/47 to 3/20/50 | 5,783,686 | 5,249,844 |
| | 3.00%, TBA, 11/1/54 | 14,000,000 | 12,277,420 |
| | 3.00%, with due dates from 3/20/43 to 2/20/53 | 3,417,404 | 2,969,393 |
| | 2.50%, 2/20/53 | 1,964,489 | 1,667,392 |
| | | | 197,002,992 |
| | U.S. Government Agency Mortgage Obligations (29.8%) | | |
| | Federal Home Loan Mortgage Corporation Pass-Through Certificates | | |
| | 6.00%, 9/1/53 | 2,662,287 | 2,681,487 |
| | 5.50%, with due dates from 9/1/53 to 11/1/53 | 8,136,732 | 8,128,879 |
| | 5.00%, with due dates from 3/1/41 to 7/1/52 | 997,076 | 975,549 |
| | 4.50%, with due dates from 8/1/44 to 11/1/49 | 375,921 | 367,668 |
| | 4.00%, with due dates from 12/1/44 to 7/1/49 | 2,337,827 | 2,219,027 |
| | 3.50%, with due dates from 4/1/42 to 2/1/47 | 2,128,593 | 1,940,812 |
| | 3.00%, 10/1/46 | 1,111,559 | 978,651 |
| | 3.00%, with due dates from 7/1/34 to 5/1/35 | 1,612,370 | 1,517,801 |
| | 2.50%, with due dates from 4/1/43 to 1/1/52 | 3,099,115 | 2,607,857 |
| | 2.00%, with due dates from 2/1/51 to 5/1/51 | 1,597,300 | 1,277,969 |
| | Federal National Mortgage Association Pass-Through Certificates | | |
| | 6.00%, with due dates from 2/1/36 to 4/1/53 | 1,195,486 | 1,233,325 |
| | 5.50%, with due dates from 1/1/33 to 11/1/53 | 10,730,924 | 10,703,430 |
| | 5.00%, with due dates from 3/1/40 to 9/1/52 | 8,044,454 | 7,890,769 |
| | 4.50%, with due dates from 7/1/44 to 11/1/49 | 1,335,204 | 1,296,089 |
| | 4.00%, 1/1/57 | 3,106,507 | 2,880,455 |
| | 4.00%, with due dates from 8/1/44 to 11/1/49 | 2,849,952 | 2,685,915 |
| | 3.50%, with due dates from 5/1/56 to 9/1/57 | 7,868,377 | 7,030,782 |
| | 3.50%, with due dates from 5/1/42 to 4/1/52 | 4,499,219 | 4,100,437 |
| | 3.50%, 6/1/31 | 148,806 | 145,541 |
| | 3.00%, with due dates from 9/1/42 to 4/1/52 | 9,009,993 | 7,956,383 |
| | 3.00%, 5/1/37 | 1,766,903 | 1,651,187 |
| | 2.50%, with due dates from 12/1/50 to 2/1/52 | 4,461,986 | 3,745,310 |
| | 2.50%, 9/1/36 | 4,260,881 | 3,912,212 |
| | 2.00%, with due dates from 9/1/50 to 4/1/52 | 3,380,490 | 2,712,044 |
| | 2.00%, with due dates from 2/1/37 to 3/1/37 | 8,102,979 | 7,271,753 |
| | 1.50%, 11/1/41 | 7,136,626 | 5,855,289 |
| | | | |
| | U.S. GOVERNMENT AND AGENCY MORTGAGE OBLIGATIONS (47.2%)* cont. | Principal amount | Value |
| | U.S. Government Agency Mortgage Obligations cont. | | |
| | Uniform Mortgage-Backed Securities | | |
| | 6.50%, TBA, 11/1/54 | $15,000,000 | $15,311,443 |
| | 6.00%, TBA, 11/1/54 | 34,000,000 | 34,222,054 |
| | 5.50%, TBA, 11/1/54 | 14,000,000 | 13,869,174 |
| | 5.00%, TBA, 11/1/54 | 2,000,000 | 1,943,574 |
| | 4.00%, TBA, 11/1/54 | 3,000,000 | 2,771,963 |
| | 3.50%, TBA, 11/1/54 | 30,000,000 | 26,823,092 |
| | 3.50%, TBA, 11/1/39 | 1,000,000 | 952,540 |
| | 3.00%, TBA, 11/1/54 | 25,000,000 | 21,525,527 |
| | 3.00%, TBA, 11/1/39 | 1,000,000 | 934,257 |
| | 2.50%, TBA, 11/1/54 | 54,000,000 | 44,680,637 |
| | 2.50%, TBA, 11/1/39 | 3,000,000 | 2,739,156 |
| | 2.00%, TBA, 11/1/54 | 82,000,000 | 65,009,230 |
| | 2.00%, TBA, 11/1/39 | 7,000,000 | 6,235,834 |
| | 1.50%, TBA, 11/1/39 | 8,000,000 | 6,929,168 |
| | | | 337,714,270 |
| | Total U.S. government and agency mortgage obligations (cost $551,028,304) | $534,717,262 |
| | CORPORATE BONDS AND NOTES (36.5%)* | Principal amount | Value |
| | Basic materials (1.8%) | | | |
| | Axalta Coating Systems, LLC 144A company guaranty sr. unsec. notes 3.375%, 2/15/29 | | $240,000 | $220,960 |
| | Boise Cascade Co. 144A company guaranty sr. unsec. notes 4.875%, 7/1/30 | | 110,000 | 104,452 |
| | Builders FirstSource, Inc. 144A company guaranty sr. unsec. bonds 6.375%, 6/15/32 | | 105,000 | 105,696 |
| | Celanese US Holdings, LLC company guaranty sr. unsec. bonds 6.379%, 7/15/32 (Germany) | | 391,000 | 405,975 |
| | Celanese US Holdings, LLC company guaranty sr. unsec. notes 6.55%, 11/15/30 (Germany) | | 720,000 | 754,861 |
| | Celanese US Holdings, LLC company guaranty sr. unsec. notes 6.33%, 7/15/29 (Germany) | | 645,000 | 667,553 |
| | Celanese US Holdings, LLC company guaranty sr. unsec. notes 6.165%, 7/15/27 (Germany) | | 3,330,000 | 3,406,915 |
| | Celanese US Holdings, LLC company guaranty sr. unsec. notes 1.40%, 8/5/26 (Germany) | | 238,000 | 223,789 |
| | CF Industries, Inc. company guaranty sr. unsec. bonds 4.95%, 6/1/43 | | 850,000 | 764,552 |
| | CF Industries, Inc. 144A company guaranty sr. notes 4.50%, 12/1/26 | | 42,000 | 41,712 |
| | Commercial Metals Co. sr. unsec. notes 4.375%, 3/15/32 | | 115,000 | 105,903 |
| | FMC Corp. sr. unsec. unsub. notes 5.65%, 5/18/33 | | 1,099,000 | 1,108,350 |
| | Georgia-Pacific, LLC 144A sr. unsec. notes 0.95%, 5/15/26 | | 457,000 | 432,630 |
| | Glencore Funding, LLC 144A company guaranty sr. unsec. bonds 5.634%, 4/4/34 | | 984,000 | 1,000,007 |
| | Glencore Funding, LLC 144A company guaranty sr. unsec. notes 6.375%, 10/6/30 | | 1,027,000 | 1,091,582 |
| | Glencore Funding, LLC 144A company guaranty sr. unsec. notes 6.125%, 10/6/28 | | 721,000 | 751,662 |
| | Glencore Funding, LLC 144A company guaranty sr. unsec. notes 2.50%, 9/1/30 | | 1,493,000 | 1,304,041 |
| | HudBay Minerals, Inc. 144A company guaranty sr. unsec. notes 6.125%, 4/1/29 (Canada) | | 105,000 | 105,857 |
| | Huntsman International, LLC sr. unsec. bonds 5.70%, 10/15/34 | | 1,720,000 | 1,671,126 |
| | Huntsman International, LLC sr. unsec. notes 4.50%, 5/1/29 | | 1,371,000 | 1,317,739 |
| | International Flavors & Fragrances, Inc. sr. unsec. bonds 5.00%, 9/26/48 | | 302,000 | 268,746 |
| | International Flavors & Fragrances, Inc. sr. unsec. notes 4.45%, 9/26/28 | | 619,000 | 609,882 |
| | International Flavors & Fragrances, Inc. 144A sr. unsec. notes 2.30%, 11/1/30 | | 264,000 | 226,221 |
| | International Flavors & Fragrances, Inc. 144A sr. unsec. unsub. notes 1.23%, 10/1/25 | | 218,000 | 210,814 |
| | Minsur SA sr. unsec. notes Ser. REGS, 4.50%, 10/28/31 (Peru) | | 510,000 | 458,996 |
| | Nutrien, Ltd. sr. unsec. sub. bonds 4.20%, 4/1/29 (Canada) | | 983,000 | 961,241 |
| | Sherwin-Williams Co. (The) sr. unsec. unsub. bonds 3.45%, 6/1/27 | | 397,000 | 385,750 |
| | Westlake Corp. sr. unsec. bonds 2.875%, 8/15/41 | | 891,000 | 618,953 |
| | WestRock Co. company guaranty sr. unsec. unsub. notes 3.75%, 3/15/25 | | 238,000 | 236,771 |
| | WestRock MWV, LLC company guaranty sr. unsec. unsub. notes 8.20%, 1/15/30 | | 426,000 | 487,656 |
| | WR Grace Holdings, LLC 144A sr. notes 7.375%, 3/1/31 | | 100,000 | 103,446 |
| | | | | 20,153,838 |
| | Capital goods (2.1%) | | | |
| | BAE Systems PLC 144A sr. unsec. bonds 5.50%, 3/26/54 (United Kingdom) | | 900,000 | 908,665 |
| | BAE Systems PLC 144A sr. unsec. notes 5.125%, 3/26/29 (United Kingdom) | | 1,745,000 | 1,762,144 |
| | Benteler International AG 144A company guaranty sr. notes 10.50%, 5/15/28 (Austria) | | 225,000 | 232,840 |
| | Berry Global, Inc. company guaranty sr. notes 5.50%, 4/15/28 | | 263,000 | 263,890 |
| | Berry Global, Inc. 144A company guaranty sr. notes 4.875%, 7/15/26 | | 208,000 | 206,729 |
| | Berry Global, Inc. 144A company guaranty sr. notes 1.65%, 1/15/27 | | 3,143,000 | 2,931,471 |
| | Berry Global, Inc. 144A company guaranty sr. notes 1.57%, 1/15/26 | | 715,000 | 686,534 |
| | | | | |
| | CORPORATE BONDS AND NOTES (36.5%)* cont. | Principal amount | Value |
| | Capital goods cont. | | | |
| | Boeing Co. (The) sr. unsec. bonds 3.95%, 8/1/59 | | $1,095,000 | $735,713 |
| | Boeing Co. (The) sr. unsec. bonds 5.805%, 5/1/50 | | 91,000 | 85,894 |
| | Boeing Co. (The) sr. unsec. notes 3.625%, 2/1/31 | | 475,000 | 429,279 |
| | Boeing Co. (The) sr. unsec. notes 2.95%, 2/1/30 | | 145,000 | 128,430 |
| | Boeing Co. (The) sr. unsec. notes 2.70%, 2/1/27 | | 584,000 | 551,403 |
| | Boeing Co. (The) sr. unsec. notes 2.196%, 2/4/26 | | 1,424,000 | 1,371,818 |
| | Boeing Co. (The) sr. unsec. unsub. bonds 3.375%, 6/15/46 | | 797,000 | 524,536 |
| | Boeing Co. (The) sr. unsec. unsub. notes 6.125%, 2/15/33 | | 1,472,000 | 1,505,519 |
| | Boeing Co. (The) 144A sr. unsec. bonds 6.858%, 5/1/54 | | 767,000 | 823,026 |
| | Boeing Co. (The) 144A sr. unsec. bonds 6.528%, 5/1/34 | | 262,000 | 276,353 |
| | Boeing Co. (The) 144A sr. unsec. notes 6.298%, 5/1/29 | | 55,000 | 56,990 |
| | Boeing Co. (The) 144A sr. unsec. notes 6.259%, 5/1/27 | | 36,000 | 36,839 |
| | DP World Salaam jr. unsec. sub. notes 6.00%, 1/1/26 (United Arab Emirates) | | 310,000 | 309,550 |
| | GFL Environmental, Inc. 144A company guaranty sr. notes 3.50%, 9/1/28 (Canada) | | 115,000 | 107,914 |
| | Howmet Aerospace, Inc. sr. unsec. unsub. bonds 5.95%, 2/1/37 | | 453,000 | 478,715 |
| | Howmet Aerospace, Inc. sr. unsec. unsub. notes 3.00%, 1/15/29 | | 1,183,000 | 1,104,004 |
| | MasTec, Inc. company guaranty sr. unsec. unsub. notes 5.90%, 6/15/29 | | 1,758,000 | 1,798,353 |
| | Northrop Grumman Corp. sr. unsec. notes 2.93%, 1/15/25 | | 225,000 | 223,991 |
| | Oshkosh Corp. sr. unsec. sub. notes 4.60%, 5/15/28 | | 2,330,000 | 2,314,092 |
| | Republic Services, Inc. sr. unsec. unsub. notes 5.00%, 11/15/29 | | 772,000 | 780,248 |
| | Ritchie Bros Holdings, Inc. 144A company guaranty sr. unsec. unsub. notes 7.75%, 3/15/31 | | 95,000 | 100,210 |
| | RTX Corp. sr. unsec. bonds 5.375%, 2/27/53 | | 377,000 | 371,660 |
| | RTX Corp. sr. unsec. notes 5.15%, 2/27/33 | | 70,000 | 70,603 |
| | RTX Corp. sr. unsec. unsub. bonds 6.40%, 3/15/54 | | 452,000 | 509,145 |
| | Terex Corp. 144A company guaranty sr. unsec. notes 5.00%, 5/15/29 | | 110,000 | 105,828 |
| | TransDigm, Inc. 144A sr. notes 6.875%, 12/15/30 | | 100,000 | 102,596 |
| | Waste Connections, Inc. sr. unsec. bonds 5.00%, 3/1/34 | | 1,036,000 | 1,028,712 |
| | Waste Connections, Inc. sr. unsec. notes 4.25%, 12/1/28 | | 179,000 | 176,245 |
| | Waste Management, Inc. company guaranty sr. unsec. notes 4.875%, 2/15/29 | | 185,000 | 187,321 |
| | | | | 23,287,260 |
| | Communication services (2.3%) | | | |
| | American Tower Corp. sr. unsec. bonds 2.70%, 4/15/31 R | | 1,651,000 | 1,439,777 |
| | American Tower Corp. sr. unsec. notes 2.90%, 1/15/30 R | | 1,095,000 | 991,505 |
| | American Tower Corp. sr. unsec. sub. notes 2.75%, 1/15/27 R | | 1,724,000 | 1,653,355 |
| | AT&T, Inc. sr. unsec. notes 4.10%, 2/15/28 | | 1,520,000 | 1,493,682 |
| | AT&T, Inc. sr. unsec. unsub. bonds 4.50%, 3/9/48 | | 356,000 | 303,040 |
| | AT&T, Inc. sr. unsec. unsub. bonds 4.35%, 3/1/29 | | 1,525,000 | 1,504,574 |
| | AT&T, Inc. sr. unsec. unsub. bonds 2.55%, 12/1/33 | | 774,000 | 629,859 |
| | AT&T, Inc. sr. unsec. unsub. notes 1.65%, 2/1/28 | | 305,000 | 277,101 |
| | Charter Communications Operating, LLC/Charter Communications Operating Capital Corp. company guaranty sr. notes 5.05%, 3/30/29 | | 299,000 | 293,567 |
| | Charter Communications Operating, LLC/Charter Communications Operating Capital Corp. company guaranty sr. sub. bonds 4.80%, 3/1/50 | | 245,000 | 183,972 |
| | Charter Communications Operating, LLC/Charter Communications Operating Capital Corp. company guaranty sr. sub. notes 4.908%, 7/23/25 | | 155,000 | 154,866 |
| | Crown Castle, Inc. sr. unsec. bonds 3.80%, 2/15/28 R | | 777,000 | 751,104 |
| | Crown Castle, Inc. sr. unsec. bonds 3.65%, 9/1/27 R | | 953,000 | 922,723 |
| | Crown Castle, Inc. sr. unsec. notes 4.90%, 9/1/29 R | | 1,151,000 | 1,143,428 |
| | DIRECTV Holdings, LLC/DIRECTV Financing Co., Inc. 144A sr. notes 5.875%, 8/15/27 | | 73,000 | 70,368 |
| | Equinix, Inc. sr. unsec. sub. notes 3.20%, 11/18/29 R | | 2,563,000 | 2,368,864 |
| | Equinix, Inc. sr. unsec. sub. notes 1.00%, 9/15/25 R | | 268,000 | 258,978 |
| | Rogers Communications, Inc. company guaranty sr. unsec. notes 5.00%, 2/15/29 (Canada) | | 1,882,000 | 1,883,403 |
| | Rogers Communications, Inc. company guaranty sr. unsec. unsub. bonds 4.30%, 2/15/48 (Canada) | | 118,000 | 95,299 |
| | Rogers Communications, Inc. company guaranty sr. unsec. unsub. notes 4.50%, 3/15/43 (Canada) | | 348,000 | 297,276 |
| | Rogers Communications, Inc. company guaranty sr. unsec. unsub. notes Ser. REGS, 3.80%, 3/15/32 (Canada) | | 580,000 | 528,861 |
| | SBA Communications Corp. sr. unsec. notes 3.125%, 2/1/29 R | | 120,000 | 109,286 |
| | Sprint Capital Corp. company guaranty sr. unsec. unsub. notes 6.875%, 11/15/28 | | 1,702,000 | 1,826,872 |
| | T-Mobile USA, Inc. company guaranty sr. notes 3.875%, 4/15/30 | | 34,000 | 32,301 |
| | T-Mobile USA, Inc. company guaranty sr. notes 3.75%, 4/15/27 | | 1,976,000 | 1,934,967 |
| | T-Mobile USA, Inc. company guaranty sr. unsec. bonds 5.75%, 1/15/54 | | 243,000 | 246,719 |
| | T-Mobile USA, Inc. company guaranty sr. unsec. bonds 5.05%, 7/15/33 | | 1,054,000 | 1,049,851 |
| | | | | |
| | CORPORATE BONDS AND NOTES (36.5%)* cont. | Principal amount | Value |
| | Communication services cont. | | | |
| | T-Mobile USA, Inc. company guaranty sr. unsec. notes 3.375%, 4/15/29 | | $1,307,000 | $1,228,222 |
| | Time Warner Cable Enterprises, LLC company guaranty sr. unsub. notes 8.375%, 7/15/33 | | 1,556,000 | 1,747,489 |
| | Verizon Communications, Inc. sr. unsec. unsub. notes 4.329%, 9/21/28 | | 561,000 | 554,093 |
| | Verizon Communications, Inc. sr. unsec. unsub. notes 2.10%, 3/22/28 | | 377,000 | 346,375 |
| | Vmed O2 UK Financing I PLC 144A sr. notes 4.75%, 7/15/31 (United Kingdom) | | 210,000 | 182,069 |
| | | | | 26,503,846 |
| | Consumer cyclicals (2.6%) | | | |
| | Alimentation Couche-Tard, Inc. 144A company guaranty sr. unsec. notes 3.55%, 7/26/27 (Canada) | | 1,437,000 | 1,390,265 |
| | Alimentation Couche-Tard, Inc. 144A sr. unsec. notes 2.95%, 1/25/30 (Canada) | | 916,000 | 828,736 |
| | Autonation, Inc. company guaranty sr. unsec. notes 4.50%, 10/1/25 | | 226,000 | 224,994 |
| | Block, Inc. sr. unsec. notes 3.50%, 6/1/31 | | 125,000 | 110,922 |
| | Booking Holdings, Inc. sr. unsec. sub. notes 4.625%, 4/13/30 | | 1,134,000 | 1,130,833 |
| | Boyd Gaming Corp. 144A sr. unsec. bonds 4.75%, 6/15/31 | | 115,000 | 107,416 |
| | Brunswick Corp/DE sr. unsec. notes 5.85%, 3/18/29 | | 830,000 | 845,354 |
| | Caesars Entertainment, Inc. 144A sr. notes 7.00%, 2/15/30 | | 100,000 | 102,584 |
| | D.R. Horton, Inc. company guaranty sr. unsec. bonds 5.00%, 10/15/34 | | 2,787,000 | 2,730,230 |
| | Dick’s Sporting Goods, Inc. sr. unsec. bonds 4.10%, 1/15/52 | | 1,055,000 | 775,214 |
| | Discovery Communications, LLC company guaranty sr. unsec. unsub. notes 4.90%, 3/11/26 | | 1,256,000 | 1,249,217 |
| | Global Payments, Inc. sr. unsec. notes 1.20%, 3/1/26 | | 286,000 | 272,924 |
| | Home Depot, Inc./The sr. unsec. unsub. bonds 5.30%, 6/25/54 | | 747,000 | 742,790 |
| | Home Depot, Inc./The sr. unsec. unsub. notes 4.95%, 6/25/34 | | 747,000 | 747,541 |
| | Home Depot, Inc./The sr. unsec. unsub. notes 4.75%, 6/25/29 | | 779,000 | 784,867 |
| | Hyatt Hotels Corp. sr. unsec. notes 5.375%, 4/23/25 | | 997,000 | 997,800 |
| | Hyundai Capital America 144A sr. unsec. notes 6.375%, 4/8/30 (South Korea) | | 181,000 | 190,298 |
| | Hyundai Capital America 144A sr. unsec. notes 5.40%, 1/8/31 (South Korea) | | 481,000 | 485,672 |
| | Hyundai Capital America 144A sr. unsec. notes 4.55%, 9/26/29 (South Korea) | | 485,000 | 473,318 |
| | Hyundai Capital America 144A sr. unsec. notes 6.50%, 1/16/29 (South Korea) | | 1,195,000 | 1,256,557 |
| | Hyundai Capital America 144A sr. unsec. notes 5.35%, 3/19/29 (South Korea) | | 918,000 | 927,382 |
| | IHO Verwaltungs, GmbH 144A sr. notes 6.375%, 5/15/29 ‡‡(Germany) | | 250,000 | 241,896 |
| | Interpublic Group of Cos., Inc. (The) sr. unsec. unsub. notes 2.40%, 3/1/31 | | 391,000 | 333,561 |
| | Levi Strauss & Co. 144A sr. unsec. sub. bonds 3.50%, 3/1/31 | | 285,000 | 252,048 |
| | Light & Wonder International, Inc. 144A company guaranty sr. unsec. notes 7.25%, 11/15/29 | | 230,000 | 235,324 |
| | Mattel, Inc. 144A company guaranty sr. unsec. notes 3.75%, 4/1/29 | | 110,000 | 103,600 |
| | McGraw-Hill Education, Inc. 144A sr. notes 5.75%, 8/1/28 | | 52,000 | 51,019 |
| | Neptune Bidco US, Inc. 144A sr. notes 9.29%, 4/15/29 | | 110,000 | 102,876 |
| | Netflix, Inc. sr. unsec. bonds 5.40%, 8/15/54 | | 503,000 | 506,285 |
| | Netflix, Inc. sr. unsec. bonds 4.90%, 8/15/34 | | 133,000 | 132,779 |
| | Netflix, Inc. 144A sr. unsec. bonds 5.375%, 11/15/29 | | 2,596,000 | 2,668,756 |
| | News Corp. 144A sr. unsec. notes 3.875%, 5/15/29 | | 113,000 | 105,257 |
| | Paramount Global sr. unsec. unsub. FRB 4.375%, 3/15/43 | | 630,000 | 454,264 |
| | Paramount Global sr. unsec. unsub. notes 4.20%, 6/1/29 | | 1,100,000 | 1,028,949 |
| | Paramount Global sr. unsec. unsub. notes 3.70%, 6/1/28 | | 974,000 | 911,306 |
| | PetSmart, Inc./PetSmart Finance Corp. 144A company guaranty sr. notes 4.75%, 2/15/28 | | 275,000 | 261,728 |
| | S&P Global, Inc. company guaranty sr. unsec. bonds 2.50%, 12/1/29 | | 840,000 | 757,981 |
| | Sands China, Ltd. sr. unsec. sub. notes 3.80%, 1/8/26 (Hong Kong) | | 1,795,000 | 1,760,643 |
| | Sirius XM Radio, Inc. 144A company guaranty sr. unsec. notes 4.125%, 7/1/30 | | 125,000 | 111,935 |
| | Standard Industries, Inc. 144A sr. unsec. notes 4.375%, 7/15/30 | | 120,000 | 110,363 |
| | Stellantis Finance US, Inc. 144A company guaranty sr. unsec. notes 1.711%, 1/29/27 | | 300,000 | 278,729 |
| | Taylor Morrison Communities, Inc. 144A sr. unsec. bonds 5.125%, 8/1/30 | | 255,000 | 246,853 |
| | Toll Brothers Finance Corp. company guaranty sr. unsec. notes 3.80%, 11/1/29 | | 864,000 | 820,963 |
| | Toll Brothers Finance Corp. company guaranty sr. unsec. unsub. notes 4.35%, 2/15/28 | | 773,000 | 758,945 |
| | Warnermedia Holdings, Inc. company guaranty sr. unsec. notes 4.279%, 3/15/32 | | 1,648,000 | 1,444,763 |
| | | | | 30,055,737 |
| | Consumer staples (1.4%) | | | |
| | 1011778 BC ULC/New Red Finance, Inc. 144A company guaranty sr. notes 3.50%, 2/15/29 (Canada) | | 115,000 | 106,279 |
| | Aramark Services, Inc. 144A company guaranty sr. unsec. notes 5.00%, 2/1/28 | | 109,000 | 107,137 |
| | Ashtead Capital, Inc. 144A company guaranty sr. unsec. bonds 5.95%, 10/15/33 | | 370,000 | 378,581 |
| | Ashtead Capital, Inc. 144A company guaranty sr. unsec. notes 2.45%, 8/12/31 | | 505,000 | 420,103 |
| | Ashtead Capital, Inc. 144A notes 4.375%, 8/15/27 | | 1,995,000 | 1,966,196 |
| | Avis Budget Car Rental, LLC/Avis Budget Finance, Inc. 144A company guaranty sr. unsec. notes 4.75%, 4/1/28 | | 110,000 | 103,472 |
| | ERAC USA Finance, LLC 144A company guaranty sr. unsec. notes 7.00%, 10/15/37 | | 263,000 | 303,407 |
| | | | | |
| | CORPORATE BONDS AND NOTES (36.5%)* cont. | Principal amount | Value |
| | Consumer staples cont. | | | |
| | ERAC USA Finance, LLC 144A company guaranty sr. unsec. notes 5.625%, 3/15/42 | | $372,000 | $380,492 |
| | ERAC USA Finance, LLC 144A company guaranty sr. unsec. notes 3.85%, 11/15/24 | | 806,000 | 805,597 |
| | Haleon US Capital, LLC company guaranty sr. unsec. unsub. notes 3.375%, 3/24/27 | | 1,331,000 | 1,292,648 |
| | Herc Holdings, Inc. 144A company guaranty sr. unsec. notes 5.50%, 7/15/27 | | 105,000 | 104,390 |
| | JBS USA LUX SA/JBS USA Food Co./JBS Luxembourg SARL 144A company guaranty sr. unsec. bonds 6.75%, 3/15/34 (Luxembourg) | | 1,183,000 | 1,272,870 |
| | JBS USA LUX SA/JBS USA Food Co./JBS USA Finance, Inc. company guaranty sr. unsec. notes 5.75%, 4/1/33 (Luxembourg) | | 300,000 | 303,206 |
| | JBS USA LUX SA/JBS USA Food Co./JBS USA Finance, Inc. company guaranty sr. unsec. notes 3.00%, 2/2/29 (Luxembourg) | | 1,324,000 | 1,217,356 |
| | Kenvue, Inc. company guaranty sr. unsec. notes Ser. REGS, 4.90%, 3/22/33 | | 1,720,000 | 1,721,007 |
| | Kenvue, Inc. company guaranty sr. unsec. unsub. notes Ser. REGS, 5.05%, 3/22/53 | | 313,000 | 304,516 |
| | Kroger Co. (The) sr. unsec. notes 4.70%, 8/15/26 | | 1,813,000 | 1,819,344 |
| | Mars, Inc. 144A sr. unsec. unsub. notes 4.65%, 4/20/31 | | 363,000 | 359,892 |
| | Match Group Holdings II, LLC 144A sr. unsec. notes 4.125%, 8/1/30 | | 120,000 | 109,227 |
| | Philip Morris International, Inc. sr. unsec. unsub. notes 5.125%, 2/15/30 | | 2,232,000 | 2,260,317 |
| | Philip Morris International, Inc. sr. unsec. unsub. notes 4.75%, 11/1/31 | | 780,000 | 768,330 |
| | | | | 16,104,367 |
| | Energy (2.6%) | | | |
| | 6297782 LLC 144A company guaranty sr. unsec. bonds 5.584%, 10/1/34 | | 624,000 | 616,849 |
| | 6297782 LLC 144A company guaranty sr. unsec. notes 5.026%, 10/1/29 | | 1,325,000 | 1,304,121 |
| | Aker BP ASA 144A sr. unsec. bonds 5.80%, 10/1/54 (Norway) | | 947,000 | 887,734 |
| | Antero Resources Corp. 144A sr. unsec. notes 5.375%, 3/1/30 | | 90,000 | 87,468 |
| | Canadian Natural Resources, Ltd. sr. unsec. unsub. notes 7.20%, 1/15/32 (Canada) | | 856,000 | 953,744 |
| | Cheniere Energy Partners LP company guaranty sr. unsec. notes 4.50%, 10/1/29 | | 2,912,000 | 2,805,640 |
| | Cheniere Energy Partners LP company guaranty sr. unsec. unsub. notes 4.00%, 3/1/31 | | 72,000 | 66,624 |
| | Cheniere Energy Partners LP company guaranty sr. unsec. unsub. notes 3.25%, 1/31/32 | | 562,000 | 489,434 |
| | Civitas Resources, Inc. 144A company guaranty sr. unsec. unsub. notes 8.75%, 7/1/31 | | 225,000 | 235,937 |
| | Columbia Pipelines Operating Co., LLC 144A sr. unsec. bonds 6.544%, 11/15/53 | | 574,000 | 617,551 |
| | Columbia Pipelines Operating Co., LLC 144A sr. unsec. notes 5.927%, 8/15/30 | | 915,000 | 951,616 |
| | Diamondback Energy, Inc. company guaranty sr. unsec. notes 6.25%, 3/15/33 | | 1,599,000 | 1,686,201 |
| | EnLink Midstream, LLC 144A company guaranty sr. unsec. unsub. notes 6.50%, 9/1/30 | | 85,000 | 89,589 |
| | Expand Energy Corp. company guaranty sr. unsec. notes 5.375%, 2/1/29 | | 110,000 | 108,442 |
| | Hess Midstream Operations LP 144A company guaranty sr. unsec. notes 4.25%, 2/15/30 | | 115,000 | 107,471 |
| | KazMunayGas National Co. JSC sr. unsec. notes Ser. REGS, 5.375%, 4/24/30 (Kazakhstan) | | 400,000 | 395,127 |
| | KazMunayGas National Co. JSC sr. unsec. unsub. bonds Ser. REGS, 6.375%, 10/24/48 (Kazakhstan) | | 400,000 | 379,551 |
| | Kinetik Holdings LP 144A company guaranty sr. unsec. notes 5.875%, 6/15/30 | | 105,000 | 104,281 |
| | Occidental Petroleum Corp. sr. unsec. sub. bonds 6.20%, 3/15/40 | | 93,000 | 92,895 |
| | Occidental Petroleum Corp. sr. unsec. sub. notes 8.50%, 7/15/27 | | 2,685,000 | 2,882,320 |
| | Occidental Petroleum Corp. sr. unsec. sub. notes 7.50%, 5/1/31 | | 32,000 | 35,435 |
| | Occidental Petroleum Corp. sr. unsec. sub. notes 6.45%, 9/15/36 | | 329,000 | 340,491 |
| | Occidental Petroleum Corp. sr. unsec. unsub. bonds 5.55%, 10/1/34 | | 815,000 | 802,865 |
| | Occidental Petroleum Corp. sr. unsec. unsub. notes 5.20%, 8/1/29 | | 328,000 | 327,430 |
| | ONEOK, Inc. company guaranty sr. unsec. notes 6.35%, 1/15/31 | | 310,000 | 329,672 |
| | ONEOK, Inc. company guaranty sr. unsec. notes 4.75%, 10/15/31 | | 665,000 | 649,712 |
| | ONEOK, Inc. company guaranty sr. unsec. sub. bonds 6.05%, 9/1/33 | | 964,000 | 1,003,784 |
| | ONEOK, Inc. company guaranty sr. unsec. unsub. notes 6.10%, 11/15/32 | | 906,000 | 954,023 |
| | Ovintiv, Inc. company guaranty sr. unsec. bonds 6.50%, 8/15/34 | | 389,000 | 408,758 |
| | Ovintiv, Inc. company guaranty sr. unsec. bonds 6.25%, 7/15/33 | | 133,000 | 137,238 |
| | Ovintiv, Inc. company guaranty sr. unsec. notes 5.65%, 5/15/28 | | 2,036,000 | 2,065,223 |
| | Ovintiv, Inc. company guaranty sr. unsec. notes 5.65%, 5/15/25 | | 118,000 | 118,413 |
| | Ovintiv, Inc. company guaranty sr. unsec. unsub. notes 8.125%, 9/15/30 | | 57,000 | 64,364 |
| | Patterson-UTI Energy, Inc. sr. unsec. sub. notes 5.15%, 11/15/29 | | 403,000 | 394,868 |
| | Petrobras Global Finance BV company guaranty sr. unsec. unsub. bonds 6.50%, 7/3/33 (Brazil) | | 100,000 | 101,996 |
| | Petroleos Mexicanos company guaranty sr. unsec. unsub. FRB 5.95%, 1/28/31 (Mexico) | | 110,000 | 94,884 |
| | Petroleos Mexicanos company guaranty sr. unsec. unsub. notes 6.70%, 2/16/32 (Mexico) | | 642,000 | 571,369 |
| | Petroleos Mexicanos company guaranty sr. unsec. unsub. notes 6.49%, 1/23/27 (Mexico) | | 260,000 | 256,449 |
| | Rockcliff Energy II, LLC 144A sr. unsec. notes 5.50%, 10/15/29 | | 110,000 | 103,943 |
| | SM Energy Co. sr. unsec. unsub. notes 6.50%, 7/15/28 | | 105,000 | 104,796 |
| | Targa Resources Partners LP/Targa Resources Partners Finance Corp. company guaranty sr. unsec. unsub. notes 5.00%, 1/15/28 | | 1,076,000 | 1,070,068 |
| | | | | |
| | CORPORATE BONDS AND NOTES (36.5%)* cont. | Principal amount | Value |
| | Energy cont. | | | |
| | Targa Resources Partners LP/Targa Resources Partners Finance Corp. company guaranty sr. unsec. unsub. notes 4.875%, 2/1/31 | | $2,053,000 | $1,993,618 |
| | Venture Global Calcasieu Pass, LLC 144A company guaranty sr. notes 6.25%, 1/15/30 | | 2,600,000 | 2,659,233 |
| | Venture Global LNG, Inc. 144A sr. notes 8.375%, 6/1/31 | | 230,000 | 239,072 |
| | | | | 29,690,299 |
| | Financials (13.7%) | | | |
| | AerCap Ireland Capital DAC/AerCap Global Aviation Trust company guaranty sr. unsec. bonds 3.40%, 10/29/33 (Ireland) | | 345,000 | 295,981 |
| | AerCap Ireland Capital DAC/AerCap Global Aviation Trust company guaranty sr. unsec. bonds 3.30%, 1/30/32 (Ireland) | | 1,581,000 | 1,390,692 |
| | AerCap Ireland Capital DAC/AerCap Global Aviation Trust company guaranty sr. unsec. notes 5.10%, 1/19/29 (Ireland) | | 1,240,000 | 1,243,812 |
| | AerCap Ireland Capital DAC/AerCap Global Aviation Trust company guaranty sr. unsec. sub. notes 4.625%, 9/10/29 (Ireland) | | 565,000 | 554,823 |
| | AerCap Ireland Capital DAC/AerCap Global Aviation Trust jr. sub. bonds 6.95%, 3/10/55 (Ireland) | | 425,000 | 438,288 |
| | Air Lease Corp. sr. unsec. sub. bonds 4.625%, 10/1/28 | | 1,045,000 | 1,034,625 |
| | Air Lease Corp. sr. unsec. sub. notes 5.85%, 12/15/27 | | 1,494,000 | 1,538,434 |
| | Air Lease Corp. sr. unsec. sub. notes 3.25%, 10/1/29 | | 780,000 | 720,167 |
| | Ally Financial, Inc. company guaranty sr. unsec. notes 8.00%, 11/1/31 | | 544,000 | 605,580 |
| | Ally Financial, Inc. sr. unsec. notes 4.75%, 6/9/27 | | 382,000 | 379,532 |
| | American Express Co. sr. unsec. unsub. notes 5.098%, 2/16/28 | | 524,000 | 528,221 |
| | Aon PLC company guaranty sr. unsec. unsub. notes 4.25%, 12/12/42 | | 820,000 | 675,687 |
| | Ares Capital Corp. sr. unsec. sub. notes 7.00%, 1/15/27 | | 218,000 | 225,344 |
| | Ares Capital Corp. sr. unsec. sub. notes 3.875%, 1/15/26 | | 5,612,000 | 5,519,334 |
| | Athene Global Funding 144A notes 5.526%, 7/11/31 | | 1,439,000 | 1,458,446 |
| | Athene Global Funding 144A notes 2.55%, 11/19/30 | | 391,000 | 336,910 |
| | Athene Global Funding 144A notes 1.73%, 10/2/26 | | 1,031,000 | 972,036 |
| | Athene Holding, Ltd. sr. unsec. bonds 5.875%, 1/15/34 | | 1,328,000 | 1,352,736 |
| | Australia and New Zealand Banking Group, Ltd. 144A unsec. sub. FRB 2.57%, 11/25/35 (Australia) | | 1,145,000 | 974,117 |
| | Australia and New Zealand Banking Group, Ltd. 144A unsec. sub. notes 4.40%, 5/19/26 (Australia) | | 482,000 | 477,324 |
| | Aviation Capital Group, LLC 144A sr. unsec. notes 5.375%, 7/15/29 | | 1,552,000 | 1,561,979 |
| | Banco Santander SA jr. unsec. sub. FRB 9.625%, 11/21/53 (Spain) | | 600,000 | 692,495 |
| | Banco Santander SA unsec. sub. notes 5.179%, 11/19/25 (Spain) | | 4,600,000 | 4,599,005 |
| | Bank of America Corp. sr. unsec. FRN Ser. MTN, 2.496%, 2/13/31 | | 1,325,000 | 1,171,904 |
| | Bank of America Corp. sr. unsec. notes 6.204%, 11/10/28 | | 375,000 | 390,011 |
| | Bank of America Corp. unsec. sub. FRB 3.846%, 3/8/37 | | 2,220,000 | 1,990,375 |
| | Bank of America Corp. unsec. sub. notes Ser. L, 4.183%, 11/25/27 | | 6,510,000 | 6,394,877 |
| | Bank of America Corp. unsec. sub. notes Ser. MTN, 5.425%, 8/15/35 | | 1,798,000 | 1,771,866 |
| | Bank of America Corp. unsec. sub. notes Ser. MTN, 4.00%, 1/22/25 | | 852,000 | 849,958 |
| | Bank of Nova Scotia (The) sr. unsec. notes 1.30%, 6/11/25 (Canada) | | 1,010,000 | 988,966 |
| | Bank of Nova Scotia (The) sr. unsec. unsub. notes 5.35%, 12/7/26 (Canada) | | 1,649,000 | 1,675,546 |
| | Blackstone Private Credit Fund sr. unsec. unsub. notes 3.25%, 3/15/27 | | 874,000 | 827,996 |
| | BNP Paribas SA 144A unsec. sub. notes 4.375%, 5/12/26 (France) | | 636,000 | 627,976 |
| | BPCE SA 144A unsec. sub. FRB 3.648%, 1/14/37 (France) | | 577,000 | 493,833 |
| | BPCE SA 144A unsec. sub. notes 4.50%, 3/15/25 (France) | | 3,286,000 | 3,274,013 |
| | CaixaBank SA 144A sr. unsec. notes 5.673%, 3/15/30 (Spain) | | 810,000 | 823,615 |
| | Capital One Financial Corp. sr. unsec. unsub. FRN 7.624%, 10/30/31 | | 1,068,000 | 1,187,265 |
| | Capital One Financial Corp. unsec. sub. FRB 2.359%, 7/29/32 | | 642,000 | 518,574 |
| | Capital One Financial Corp. unsec. sub. notes 4.20%, 10/29/25 | | 875,000 | 868,768 |
| | Citigroup, Inc. jr. unsec. sub. bonds Ser. CC, 7.125%, 5/29/74 | | 1,367,000 | 1,407,857 |
| | Citigroup, Inc. jr. unsec. sub. FRN 3.875%, perpetual maturity | | 1,275,000 | 1,235,424 |
| | Citigroup, Inc. unsec. sub. bonds 4.75%, 5/18/46 | | 386,000 | 344,599 |
| | Citigroup, Inc. unsec. sub. bonds 4.45%, 9/29/27 | | 5,743,000 | 5,673,085 |
| | CNA Financial Corp. sr. unsec. notes 5.125%, 2/15/34 | | 953,000 | 943,820 |
| | CNO Financial Group, Inc. sr. unsec. bonds 6.45%, 6/15/34 | | 1,875,000 | 1,932,169 |
| | CNO Financial Group, Inc. sr. unsec. unsub. notes 5.25%, 5/30/25 | | 360,000 | 360,029 |
| | CNO Global Funding 144A notes 4.95%, 9/9/29 | | 610,000 | 603,306 |
| | Commonwealth Bank of Australia 144A unsec. sub. notes 5.837%, 3/13/34 (Australia) | | 855,000 | 880,615 |
| | Commonwealth Bank of Australia 144A unsec. sub. notes 4.50%, 12/9/25 (Australia) | | 401,000 | 398,381 |
| | Commonwealth Bank of Australia 144A unsec. sub. notes 2.688%, 3/11/31 (Australia) | | 500,000 | 431,933 |
| | Corebridge Financial, Inc. sr. unsec. notes 3.85%, 4/5/29 | | 1,209,000 | 1,156,004 |
| | | | | |
| | CORPORATE BONDS AND NOTES (36.5%)* cont. | Principal amount | Value |
| | Financials cont. | | | |
| | Corebridge Global Funding 144A sr. unsec. unsub. notes 5.20%, 6/24/29 | | $917,000 | $923,955 |
| | Danske Bank A/S 144A sr. unsec. FRN 3.244%, 12/20/25 (Denmark) | | 401,000 | 399,697 |
| | Deutsche Bank AG unsec. sub. FRB 4.875%, 12/1/32 (Germany) | | 470,000 | 456,930 |
| | Deutsche Bank AG unsec. sub. notes 4.50%, 4/1/25 (Germany) | | 2,576,000 | 2,567,560 |
| | Deutsche Bank AG/New York, NY sr. unsec. unsub. FRN 2.311%, 11/16/27 (Germany) | | 345,000 | 326,492 |
| | Deutsche Bank AG/New York, NY sr. unsec. unsub. FRN 2.129%, 11/24/26 (Germany) | | 904,000 | 875,946 |
| | EPR Properties company guaranty sr. unsec. unsub. notes 4.50%, 6/1/27 R | | 407,000 | 398,818 |
| | EPR Properties sr. unsec. notes 3.60%, 11/15/31 R | | 498,000 | 439,218 |
| | Extra Space Storage LP company guaranty sr. unsec. notes 5.90%, 1/15/31 R | | 1,255,000 | 1,300,853 |
| | F&G Annuities & Life, Inc. company guaranty sr. unsec. notes 6.50%, 6/4/29 | | 1,104,000 | 1,119,396 |
| | Fairfax Financial Holdings, Ltd. sr. unsec. notes 4.85%, 4/17/28 (Canada) | | 784,000 | 780,899 |
| | Fidelity National Financial, Inc. sr. unsec. bonds 3.20%, 9/17/51 | | 645,000 | 414,482 |
| | Fifth Third Bancorp sr. unsec. notes 4.895%, 9/6/30 | | 470,000 | 464,806 |
| | Fifth Third Bancorp sr. unsec. sub. notes 2.375%, 1/28/25 | | 618,000 | 614,016 |
| | Fifth Third Bancorp sr. unsec. unsub. FRN 6.339%, 7/27/29 | | 591,000 | 616,920 |
| | First-Citizens Bank & Trust Co. unsec. sub. notes 6.125%, 3/9/28 | | 2,279,000 | 2,356,564 |
| | Ford Motor Co. sr. unsec. unsub. notes 5.80%, 3/5/27 | | 970,000 | 978,810 |
| | Ford Motor Co. sr. unsec. unsub. notes 4.125%, 8/17/27 | | 805,000 | 778,172 |
| | General Motors Financial Co., Inc. sr. sub. notes 5.80%, 1/7/29 | | 1,056,000 | 1,081,449 |
| | General Motors Financial Co., Inc. sr. unsec. notes 4.90%, 10/6/29 | | 389,000 | 383,708 |
| | General Motors Financial Co., Inc. sr. unsec. sub. notes 2.75%, 6/20/25 | | 883,000 | 870,329 |
| | GLP Capital LP/GLP Financing II, Inc. company guaranty sr. unsec. notes 4.00%, 1/15/31 R | | 377,000 | 346,963 |
| | GLP Capital LP/GLP Financing II, Inc. company guaranty sr. unsec. sub. notes 6.75%, 12/1/33 R | | 650,000 | 694,948 |
| | GLP Capital LP/GLP Financing II, Inc. company guaranty sr. unsec. unsub. notes 5.375%, 4/15/26 R | | 1,625,000 | 1,627,280 |
| | Goldman Sachs Group, Inc. (The) jr. unsec. sub. bonds Ser. Y, 6.125%, 9/26/54 | | 2,680,000 | 2,664,873 |
| | Goldman Sachs Group, Inc. (The) jr. unsec. sub. FRN 3.65%, 7/28/51 | | 350,000 | 334,000 |
| | ING Groep NV sr. unsec. unsub. FRN 6.083%, 9/11/27 (Netherlands) | | 1,625,000 | 1,661,146 |
| | Intercontinental Exchange, Inc. sr. unsec. bonds 2.65%, 9/15/40 | | 883,000 | 632,921 |
| | Intercontinental Exchange, Inc. sr. unsec. bonds 1.85%, 9/15/32 | | 400,000 | 320,625 |
| | Intercontinental Exchange, Inc. sr. unsec. notes 4.35%, 6/15/29 | | 655,000 | 645,957 |
| | Intesa Sanpaolo SpA 144A unsec. sub. bonds 4.198%, 6/1/32 (Italy) | | 1,520,000 | 1,331,646 |
| | Jefferies Financial Group, Inc. sr. unsec. notes Ser. MTN, 5.15%, 9/15/25 | | 1,230,000 | 1,230,139 |
| | Jefferies Financial Group, Inc. sr. unsec. notes 6.20%, 4/14/34 | | 733,000 | 763,716 |
| | JPMorgan Chase & Co. jr. unsec. sub. FRB Ser. W, (CME Term SOFR 3 Month + 1.26%), 6.38%, 5/15/47 | | 740,000 | 676,547 |
| | JPMorgan Chase & Co. sr. unsec. unsub. bonds 5.294%, 7/22/35 | | 1,354,000 | 1,362,081 |
| | JPMorgan Chase & Co. sr. unsec. unsub. FRN 4.323%, 4/26/28 | | 5,131,000 | 5,079,269 |
| | JPMorgan Chase & Co. unsec. sub. FRB 5.717%, 9/14/33 | | 647,000 | 666,417 |
| | JPMorgan Chase & Co. unsec. sub. FRB 2.956%, 5/13/31 | | 2,057,000 | 1,844,588 |
| | KKR Group Finance Co. VI, LLC 144A company guaranty sr. unsec. bonds 3.75%, 7/1/29 | | 1,161,000 | 1,105,259 |
| | Lloyds Banking Group PLC unsec. sub. FRB 3.369%, 12/14/46 (United Kingdom) | | 1,772,000 | 1,264,077 |
| | LPL Holdings, Inc. company guaranty sr. unsec. notes 6.75%, 11/17/28 | | 855,000 | 901,611 |
| | Metropolitan Life Global Funding I 144A sr. notes 2.95%, 4/9/30 | | 1,442,000 | 1,318,208 |
| | Metropolitan Life Insurance Co. 144A unsec. sub. notes 7.80%, 11/1/25 | | 1,881,000 | 1,931,509 |
| | Mitsubishi UFJ Financial Group, Inc. sr. unsec. unsub. notes 3.85%, 3/1/26 (Japan) | | 747,000 | 739,630 |
| | Morgan Stanley sr. unsec. notes 5.123%, 2/1/29 | | 1,276,000 | 1,286,522 |
| | Morgan Stanley sr. unsec. sub. bonds 5.942%, 2/7/39 | | 1,201,000 | 1,218,990 |
| | Morgan Stanley unsec. sub. notes Ser. GMTN, 4.35%, 9/8/26 | | 5,792,000 | 5,754,405 |
| | Nasdaq, Inc. sr. unsec. sub. bonds 5.55%, 2/15/34 | | 37,000 | 37,831 |
| | PNC Financial Services Group, Inc. (The) unsec. sub. FRB 4.626%, 6/6/33 | | 2,951,000 | 2,824,928 |
| | Prologis LP sr. unsec. unsub. bonds 5.00%, 3/15/34 R | | 987,000 | 978,897 |
| | Protective Life Global Funding 144A 5.467%, 12/8/28 | | 885,000 | 906,693 |
| | Royal Bank of Canada unsec. sub. notes Ser. GMTN, 4.65%, 1/27/26 (Canada) | | 922,000 | 918,544 |
| | Societe Generale SA 144A jr. unsec. sub. FRB 10.00%, 11/14/73 (France) | | 532,000 | 568,194 |
| | Societe Generale SA 144A unsec. sub. notes 4.25%, 4/14/25 (France) | | 403,000 | 400,378 |
| | Toronto-Dominion Bank (The) jr. sub. unsec. FRB 8.125%, 10/31/82 (Canada) | | 885,000 | 934,697 |
| | Toronto-Dominion Bank (The) sr. unsec. unsub. notes Ser. MTN, 1.15%, 6/12/25 (Canada) | | 937,000 | 916,611 |
| | Truist Bank unsec. sub. FRN Ser. BKNT, 4.632%, 9/17/29 | | 410,000 | 399,530 |
| | Truist Financial Corp. sr. unsec. unsub. notes Ser. MTN, 5.435%, 1/24/30 | | 1,143,000 | 1,157,073 |
| | Truist Financial Corp. sr. unsec. unsub. bonds Ser. MTN, 5.711%, 1/24/35 | | 893,000 | 909,587 |
| | UBS Group AG 144A jr. unsec. sub. bonds 6.85%, 9/10/54 (Switzerland) | | 3,055,000 | 3,035,830 |
| | UBS Group AG 144A sr. unsec. FRB 6.537%, 8/12/33 (Switzerland) | | 1,270,000 | 1,364,637 |
| | | | | |
| | CORPORATE BONDS AND NOTES (36.5%)* cont. | Principal amount | Value |
| | Financials cont. | | | |
| | UBS Group AG 144A sr. unsec. FRN 2.193%, 6/5/26 (Switzerland) | | $4,913,000 | $4,824,940 |
| | UBS Group AG 144A sr. unsec. unsub. FRN 1.305%, 2/2/27 (Switzerland) | | 617,000 | 589,164 |
| | US Bancorp unsec. sub. FRB 2.491%, 11/3/36 | | 734,000 | 600,928 |
| | VICI Properties LP sr. unsec. unsub. bonds 5.75%, 4/1/34 R | | 460,000 | 467,636 |
| | VICI Properties LP sr. unsec. unsub. notes 4.75%, 2/15/28 R | | 1,339,000 | 1,328,430 |
| | VICI Properties LP/VICI Note Co., Inc. 144A company guaranty sr. unsec. notes 3.875%, 2/15/29 R | | 972,000 | 915,505 |
| | VICI Properties LP/VICI Note Co., Inc. 144A company guaranty sr. unsec. notes 3.75%, 2/15/27 R | | 844,000 | 816,566 |
| | VICI Properties LP/VICI Note Co., Inc. 144A company guaranty sr. unsec. notes 4.50%, 1/15/28 R | | 1,605,000 | 1,566,138 |
| | Wells Fargo & Co. jr. unsec. sub. FRN 3.90%, perpetual maturity | | 476,000 | 461,295 |
| | Wells Fargo & Co. sr. unsec. unsub. FRN Ser. MTN, 5.574%, 7/25/29 | | 2,647,000 | 2,703,780 |
| | Wells Fargo & Co. sr. unsec. unsub. FRN Ser. MTN, 3.584%, 5/22/28 | | 2,660,000 | 2,579,352 |
| | Westpac Banking Corp. unsec. sub. bonds 4.421%, 7/24/39 (Australia) | | 470,000 | 426,752 |
| | Westpac Banking Corp. unsec. sub. bonds 2.963%, 11/16/40 (Australia) | | 577,000 | 421,230 |
| | | | | 155,405,826 |
| | Health care (2.4%) | | | |
| | AbbVie, Inc. sr. unsec. bonds 5.40%, 3/15/54 | | 648,000 | 653,379 |
| | AbbVie, Inc. sr. unsec. bonds 5.05%, 3/15/34 | | 261,000 | 263,035 |
| | AbbVie, Inc. sr. unsec. notes 4.95%, 3/15/31 | | 907,000 | 916,576 |
| | AbbVie, Inc. sr. unsec. notes 4.80%, 3/15/29 | | 1,018,000 | 1,026,404 |
| | Amgen, Inc. sr. unsec. sub. notes 3.20%, 11/2/27 | | 216,000 | 208,036 |
| | Amgen, Inc. sr. unsec. unsub. bonds 5.65%, 3/2/53 | | 686,000 | 690,618 |
| | Amgen, Inc. sr. unsec. unsub. notes 5.25%, 3/2/30 | | 1,361,000 | 1,388,612 |
| | Bristol-Myers Squibb Co. sr. unsec. notes 5.20%, 2/22/34 | | 744,000 | 757,591 |
| | Bristol-Myers Squibb Co. sr. unsec. notes 4.90%, 2/22/29 | | 1,685,000 | 1,707,225 |
| | Centene Corp. sr. unsec. sub. notes 2.625%, 8/1/31 | | 1,380,000 | 1,149,185 |
| | Charles River Laboratories International, Inc. 144A company guaranty sr. unsec. notes 4.00%, 3/15/31 | | 98,000 | 87,657 |
| | CVS Health Corp. sr. unsec. unsub. notes 4.78%, 3/25/38 | | 687,000 | 613,406 |
| | DH Europe Finance II SARL company guaranty sr. unsec. notes 2.60%, 11/15/29 (Luxembourg) | | 1,042,000 | 947,672 |
| | Elanco Animal Health, Inc. sr. unsec. notes Ser. WI, 6.65%, 8/28/28 | | 100,000 | 102,661 |
| | Eli Lilly and Co. sr. unsec. unsub. bonds 4.875%, 2/27/53 | | 84,000 | 79,549 |
| | GE HealthCare Technologies, Inc. company guaranty sr. unsub. notes 5.65%, 11/15/27 | | 814,000 | 835,015 |
| | GE HealthCare Technologies, Inc. sr. unsec. notes 4.80%, 8/14/29 | | 413,000 | 412,422 |
| | HCA, Inc. company guaranty sr. bonds 5.25%, 6/15/26 | | 597,000 | 599,364 |
| | HCA, Inc. company guaranty sr. notes 4.50%, 2/15/27 | | 302,000 | 299,596 |
| | HCA, Inc. company guaranty sr. unsec. bonds 6.00%, 4/1/54 | | 962,000 | 967,291 |
| | HCA, Inc. company guaranty sr. unsec. bonds 5.60%, 4/1/34 | | 731,000 | 735,229 |
| | HCA, Inc. company guaranty sr. unsec. sub. notes 3.625%, 3/15/32 | | 334,000 | 300,487 |
| | Humana, Inc. sr. unsec. unsub. bonds 2.15%, 2/3/32 | | 409,000 | 330,789 |
| | Humana, Inc. sr. unsec. unsub. notes 5.75%, 3/1/28 | | 1,700,000 | 1,736,733 |
| | Icon Investments Six DAC company guaranty sr. notes 5.849%, 5/8/29 (Ireland) | | 406,000 | 417,459 |
| | Icon Investments Six DAC company guaranty sr. notes 5.809%, 5/8/27 (Ireland) | | 874,000 | 891,604 |
| | Illumina, Inc. sr. unsec. sub. notes 4.65%, 9/9/26 | | 819,000 | 817,304 |
| | Medline Borrower LP 144A sr. notes 3.875%, 4/1/29 | | 115,000 | 107,673 |
| | Pfizer Investment Enterprises PTE, Ltd. company guaranty sr. unsec. notes 5.30%, 5/19/53 (Singapore) | | 854,000 | 836,286 |
| | Pfizer Investment Enterprises PTE, Ltd. company guaranty sr. unsec. notes 4.75%, 5/19/33 (Singapore) | | 613,000 | 604,139 |
| | Pfizer Investment Enterprises PTE, Ltd. company guaranty sr. unsec. notes 4.45%, 5/19/28 (Singapore) | | 1,594,000 | 1,588,442 |
| | Pharmacia, LLC company guaranty sr. unsec. notes 6.60%, 12/1/28 | | 1,780,000 | 1,905,057 |
| | Royalty Pharma PLC company guaranty sr. unsec. bonds 5.40%, 9/2/34 | | 1,168,000 | 1,160,267 |
| | Royalty Pharma PLC company guaranty sr. unsec. notes 5.15%, 9/2/29 | | 982,000 | 988,275 |
| | Tenet Healthcare Corp. company guaranty sr. notes 6.75%, 5/15/31 | | 235,000 | 240,405 |
| | Teva Pharmaceutical Finance Netherlands III BV company guaranty sr. unsec. unsub. notes 8.125%, 9/15/31 (Israel) | | 220,000 | 246,329 |
| | Teva Pharmaceutical Finance Netherlands III BV company guaranty sr. unsec. unsub. notes 5.125%, 5/9/29 (Israel) | | 200,000 | 194,388 |
| | Wyeth, LLC company guaranty sr. unsec. bonds 5.95%, 4/1/37 | | 233,000 | 247,892 |
| | Zoetis, Inc. sr. unsec. sub. notes 2.00%, 5/15/30 | | 244,000 | 210,678 |
| | | | | 27,264,730 |
| | Technology (2.6%) | | | |
| | Analog Devices, Inc. sr. unsec. notes 5.05%, 4/1/34 | | 353,000 | 357,369 |
| | Analog Devices, Inc. sr. unsec. notes 2.95%, 4/1/25 | | 238,000 | 236,057 |
| | Atlassian Corp. sr. unsec. bonds 5.50%, 5/15/34 | | 326,000 | 331,790 |
| | | | | |
| | CORPORATE BONDS AND NOTES (36.5%)* cont. | Principal amount | Value |
| | Technology cont. | | | |
| | Atlassian Corp. sr. unsec. notes 5.25%, 5/15/29 | | $520,000 | $526,843 |
| | Broadcom Corp./Broadcom Cayman Finance, Ltd. company guaranty sr. unsec. unsub. notes 3.875%, 1/15/27 | | 2,814,000 | 2,768,262 |
| | Broadcom, Inc. sr. unsec. notes 5.05%, 7/12/29 | | 434,000 | 437,854 |
| | Cisco Systems, Inc. sr. unsec. bonds 5.30%, 2/26/54 | | 621,000 | 625,198 |
| | Cisco Systems, Inc. sr. unsec. notes 5.05%, 2/26/34 | | 872,000 | 885,555 |
| | Flex, Ltd. sr. unsec. notes 5.25%, 1/15/32 | | 1,255,000 | 1,244,264 |
| | Gartner, Inc. 144A company guaranty sr. unsec. bonds 3.75%, 10/1/30 | | 1,063,000 | 978,538 |
| | Gartner, Inc. 144A company guaranty sr. unsec. notes 3.625%, 6/15/29 | | 185,000 | 172,828 |
| | Hewlett Packard Enterprise Co. sr. unsec. bonds 5.60%, 10/15/54 | | 913,000 | 879,348 |
| | Hewlett Packard Enterprise Co. sr. unsec. bonds 5.00%, 10/15/34 | | 457,000 | 443,645 |
| | Hewlett Packard Enterprise Co. sr. unsec. notes 4.85%, 10/15/31 | | 914,000 | 896,182 |
| | Hewlett Packard Enterprise Co. sr. unsec. notes 4.55%, 10/15/29 | | 786,000 | 771,340 |
| | Imola Merger Corp. 144A sr. notes 4.75%, 5/15/29 | | 115,000 | 111,279 |
| | Marvell Technology, Inc. sr. unsec. notes 5.95%, 9/15/33 | | 520,000 | 544,477 |
| | Marvell Technology, Inc. sr. unsec. notes 5.75%, 2/15/29 | | 637,000 | 656,104 |
| | Meta Platforms, Inc. sr. unsec. bonds 5.75%, 5/15/63 | | 1,758,000 | 1,836,431 |
| | Meta Platforms, Inc. sr. unsec. bonds 5.40%, 8/15/54 | | 2,964,000 | 2,979,734 |
| | Meta Platforms, Inc. sr. unsec. bonds 5.55%, 8/15/64 | | 369,000 | 374,327 |
| | Meta Platforms, Inc. sr. unsec. notes 4.95%, 5/15/33 | | 130,000 | 132,088 |
| | Meta Platforms, Inc. sr. unsec. notes 4.75%, 8/15/34 | | 369,000 | 365,134 |
| | MSCI, Inc. 144A company guaranty sr. unsec. notes 3.625%, 9/1/30 | | 2,688,000 | 2,465,218 |
| | MSCI, Inc. 144A company guaranty sr. unsec. sub. notes 3.875%, 2/15/31 | | 460,000 | 424,943 |
| | Oracle Corp. sr. unsec. bonds 3.95%, 3/25/51 | | 330,000 | 251,777 |
| | Oracle Corp. sr. unsec. bonds 3.65%, 3/25/41 | | 1,308,000 | 1,035,783 |
| | Oracle Corp. sr. unsec. notes 2.875%, 3/25/31 | | 842,000 | 745,952 |
| | Oracle Corp. sr. unsec. notes 2.50%, 4/1/25 | | 207,000 | 204,956 |
| | Oracle Corp. sr. unsec. notes 2.30%, 3/25/28 | | 2,276,000 | 2,106,540 |
| | Oracle Corp. sr. unsec. notes 1.65%, 3/25/26 | | 337,000 | 322,969 |
| | Oracle Corp. sr. unsec. unsub. bonds 6.50%, 4/15/38 | | 330,000 | 360,863 |
| | Oracle Corp. sr. unsec. unsub. bonds 4.00%, 11/15/47 | | 48,000 | 37,444 |
| | salesforce.com, Inc. sr. unsec. bonds 2.90%, 7/15/51 | | 894,000 | 594,908 |
| | Sensata Technologies, Inc. 144A company guaranty sr. unsec. notes 3.75%, 2/15/31 | | 1,225,000 | 1,094,361 |
| | ServiceNow, Inc. sr. unsec. notes 1.40%, 9/1/30 | | 412,000 | 343,980 |
| | VMware, LLC sr. unsec. notes 1.40%, 8/15/26 | | 466,000 | 439,438 |
| | | | | 28,983,779 |
| | Transportation (0.7%) | | | |
| | AS Mileage Plan IP, Ltd. 144A sr. notes 5.021%, 10/20/29 (Cayman Islands) | | 1,790,000 | 1,739,326 |
| | Penske Truck Leasing Co. LP/PTL Finance Corp. 144A sr. unsec. notes 4.40%, 7/1/27 | | 1,546,000 | 1,527,802 |
| | Penske Truck Leasing Co. LP/PTL Finance Corp. 144A sr. unsec. notes 3.95%, 3/10/25 | | 198,000 | 197,168 |
| | Ryder System, Inc. sr. unsec. unsub. notes 4.95%, 9/1/29 | | 759,000 | 758,666 |
| | SMBC Aviation Capital Finance DAC 144A company guaranty sr. unsec. notes 5.70%, 7/25/33 (Ireland) | | 800,000 | 819,096 |
| | SMBC Aviation Capital Finance DAC 144A company guaranty sr. unsec. notes 5.55%, 4/3/34 (Ireland) | | 615,000 | 618,427 |
| | SMBC Aviation Capital Finance DAC 144A company guaranty sr. unsec. notes 5.30%, 4/3/29 (Ireland) | | 1,402,000 | 1,417,469 |
| | Westinghouse Air Brake Technologies Corp. company guaranty sr. unsec. unsub. bonds 5.611%, 3/11/34 | | 1,209,000 | 1,243,253 |
| | | | | 8,321,207 |
| | Utilities and power (4.3%) | | | |
| | AES Corp. (The) sr. unsec. notes 1.375%, 1/15/26 | | 236,000 | 226,081 |
| | AES Corp. (The) sr. unsec. unsub. notes 2.45%, 1/15/31 | | 841,000 | 707,751 |
| | Alexander Funding Trust II 144A sr. notes 7.467%, 7/31/28 | | 798,000 | 845,600 |
| | Ameren Corp. sr. unsec. unsub. notes 5.00%, 1/15/29 | | 757,000 | 761,196 |
| | American Electric Power Co., Inc. sr. unsec. unsub. bonds 5.625%, 3/1/33 | | 572,000 | 584,401 |
| | American Electric Power Co., Inc. sr. unsec. unsub. notes 1.00%, 11/1/25 | | 515,000 | 496,351 |
| | American Transmission Systems, Inc. 144A sr. unsec. bonds 2.65%, 1/15/32 | | 430,000 | 367,823 |
| | CenterPoint Energy Resources Corp. sr. unsec. unsub. bonds 5.40%, 7/1/34 | | 817,000 | 827,471 |
| | Constellation Energy Generation, LLC sr. unsec. bonds 6.50%, 10/1/53 | | 785,000 | 864,577 |
| | Constellation Energy Generation, LLC sr. unsec. bonds 6.125%, 1/15/34 | | 320,000 | 341,674 |
| | Constellation Energy Generation, LLC sr. unsec. bonds 5.75%, 3/15/54 | | 485,000 | 489,163 |
| | Constellation Energy Generation, LLC sr. unsec. notes 5.60%, 3/1/28 | | 1,245,000 | 1,279,171 |
| | Duke Energy Corp. sr. unsec. bonds 5.80%, 6/15/54 | | 1,267,000 | 1,271,377 |
| | Duke Energy Corp. sr. unsec. notes 5.45%, 6/15/34 | | 1,774,000 | 1,795,711 |
| | | | | |
| | CORPORATE BONDS AND NOTES (36.5%)* cont. | Principal amount | Value |
| | Utilities and power cont. | | | |
| | Duke Energy Corp. sr. unsec. notes 4.85%, 1/5/29 | | $85,000 | $85,117 |
| | Duke Energy Ohio, Inc. sr. bonds 3.65%, 2/1/29 | | 758,000 | 728,739 |
| | Electricite De France SA 144A jr. unsec. sub. FRB 9.125%, perpetual maturity (France) | | 210,000 | 238,378 |
| | Electricite De France SA 144A sr. unsec. unsub. bonds 4.75%, 10/13/35 (France) | | 1,114,000 | 1,067,988 |
| | Enbridge, Inc. company guaranty sr. unsec. notes 1.60%, 10/4/26 (Canada) | | 456,000 | 430,366 |
| | Enel Finance International NV 144A company guaranty sr. unsec. notes 2.50%, 7/12/31 (Netherlands) | | 785,000 | 665,721 |
| | Enel Finance International NV 144A company guaranty sr. unsec. unsub. notes 7.50%, 10/14/32 (Netherlands) | | 1,255,000 | 1,428,968 |
| | Energy Transfer LP company guaranty sr. unsec. notes 2.90%, 5/15/25 | | 368,000 | 363,853 |
| | Energy Transfer LP jr. unsec. sub. FRN 6.625%, perpetual maturity | | 1,817,000 | 1,785,436 |
| | Energy Transfer LP sr. unsec. notes 5.25%, 7/1/29 | | 1,424,000 | 1,439,177 |
| | Energy Transfer LP sr. unsec. unsub. notes 5.75%, 2/15/33 | | 388,000 | 395,818 |
| | Eversource Energy sr. unsec. unsub. notes 5.45%, 3/1/28 | | 1,078,000 | 1,099,892 |
| | Eversource Energy sr. unsec. unsub. notes 5.125%, 5/15/33 | | 1,367,000 | 1,349,222 |
| | Exelon Corp. sr. unsec. unsub. bonds 5.45%, 3/15/34 | | 709,000 | 721,770 |
| | Exelon Corp. sr. unsec. unsub. notes 5.15%, 3/15/29 | | 1,242,000 | 1,259,562 |
| | FirstEnergy Transmission, LLC 144A sr. unsec. notes 4.55%, 1/15/30 | | 425,000 | 417,439 |
| | Georgia Power Co. sr. unsec. unsub. bonds 5.25%, 3/15/34 | | 297,000 | 301,877 |
| | Georgia Power Co. sr. unsec. unsub. notes 4.95%, 5/17/33 | | 829,000 | 827,157 |
| | Georgia Power Co. sr. unsec. unsub. notes 4.70%, 5/15/32 | | 401,000 | 397,171 |
| | IPALCO Enterprises, Inc. sr. notes 4.25%, 5/1/30 | | 1,500,000 | 1,421,637 |
| | Kinder Morgan, Inc. company guaranty sr. unsec. notes Ser. GMTN, 7.75%, 1/15/32 | | 1,976,000 | 2,264,797 |
| | Kinder Morgan, Inc. company guaranty sr. unsec. unsub. notes 5.00%, 2/1/29 | | 128,000 | 128,182 |
| | NiSource, Inc. sr. unsec. unsub. notes 5.20%, 7/1/29 | | 1,710,000 | 1,736,318 |
| | NRG Energy, Inc. 144A sr. notes 2.00%, 12/2/25 | | 868,000 | 836,416 |
| | Oncor Electric Delivery Co., LLC sr. bonds 4.95%, 9/15/52 | | 1,648,000 | 1,539,810 |
| | Pacific Gas and Electric Co. sr. bonds 6.95%, 3/15/34 | | 543,000 | 602,459 |
| | Pacific Gas and Electric Co. sr. bonds 6.75%, 1/15/53 | | 245,000 | 268,253 |
| | Pacific Gas and Electric Co. sr. bonds 5.90%, 6/15/32 | | 1,117,000 | 1,156,498 |
| | Pacific Gas and Electric Co. sr. bonds 4.95%, 7/1/50 | | 545,000 | 478,443 |
| | Pacific Gas and Electric Co. sr. notes 6.10%, 1/15/29 | | 1,834,000 | 1,905,386 |
| | PG&E Corp. sr. sub. notes 5.25%, 7/1/30 | | 115,000 | 112,166 |
| | Puget Sound Energy, Inc. sr. bonds 5.448%, 6/1/53 | | 684,000 | 681,175 |
| | Sempra sr. unsec. unsub. notes 3.25%, 6/15/27 | | 1,336,000 | 1,284,122 |
| | Sempra Energy sr. unsec. unsub. bonds 5.50%, 8/1/33 | | 964,000 | 984,230 |
| | Southern Co. (The) sr. unsec. bonds 5.70%, 3/15/34 | | 642,000 | 667,721 |
| | Southern Co. (The) sr. unsec. notes 5.50%, 3/15/29 | | 763,000 | 785,125 |
| | Southern Co. Gas Capital Corp. company guaranty sr. unsec. unsub. notes 4.95%, 9/15/34 | | 340,000 | 332,728 |
| | Virginia Electric and Power Co. sr. unsec. unsub. notes 5.05%, 8/15/34 | | 691,000 | 686,998 |
| | Vistra Operations Co., LLC 144A company guaranty sr. notes 6.00%, 4/15/34 | | 769,000 | 794,142 |
| | Vistra Operations Co., LLC 144A company guaranty sr. notes 4.30%, 7/15/29 | | 915,000 | 878,216 |
| | Vistra Operations Co., LLC 144A company guaranty sr. notes 3.70%, 1/30/27 | | 904,000 | 878,742 |
| | Vistra Operations Co., LLC 144A company guaranty sr. unsec. unsub. notes 4.375%, 5/1/29 | | 115,000 | 109,560 |
| | Vistra Operations Co., LLC 144A sr. bonds 6.95%, 10/15/33 | | 1,045,000 | 1,141,223 |
| | Xcel Energy, Inc. sr. unsec. bonds 5.45%, 8/15/33 | | 880,000 | 888,090 |
| | | | | 48,424,435 |
| | Total corporate bonds and notes (cost $418,740,733) | $414,195,324 |
| | MORTGAGE-BACKED SECURITIES (21.2%)* | Principal amount | Value |
| | Agency collateralized mortgage obligations (6.2%) | | | |
| | Federal Home Loan Mortgage Corporation | | | |
| | Strips FRB Ser. 406, Class F30, (US 30 Day Average SOFR + 1.15%), 6.007%, 10/25/53 | | $2,259,413 | $2,275,816 |
| | REMICs IFB Ser. 3408, Class EK, ((-4.024 x US 30 Day Average SOFR) + 25.33%), 5.174%, 4/15/37 | | 200,658 | 223,299 |
| | REMICs Ser. 4132, Class IP, IO, 4.50%, 11/15/42 | | 595,141 | 49,155 |
| | REMICs Ser. 4018, Class DI, IO, 4.50%, 7/15/41 | | 158,142 | 4,408 |
| | REMICs IFB Ser. 3065, Class DC, ((-3 x US 30 Day Average SOFR) + 19.52%), 4.487%, 3/15/35 | | 139,406 | 148,189 |
| | REMICs Ser. 23-5349, Class IB, IO, 4.00%, 12/15/46 | | 3,531,774 | 773,514 |
| | REMICs Ser. 5050, Class IM, IO, 3.50%, 10/25/50 | | 2,481,719 | 483,619 |
| | REMICs IFB Ser. 4839, Class WS, IO, ((-1 x US 30 Day Average SOFR) + 5.99%), 0.976%, 8/15/56 | | 13,566,937 | 1,806,535 |
| | REMICs Ser. 3369, Class BO, PO, zero %, 9/15/37 | | 2,340 | 1,940 |
| | REMICs Ser. 3391, PO, zero %, 4/15/37 | | 33,253 | 28,339 |
| | REMICs FRB Ser. 3117, Class AF, zero %, 2/15/36 | | 7,451 | 6,393 |
| | | | | |
| | MORTGAGE-BACKED SECURITIES (21.2%)* cont. | Principal amount | Value |
| | Agency collateralized mortgage obligations cont. | | | |
| | Federal National Mortgage Association | | | |
| | REMICs Ser. 15-33, Class AI, IO, 5.00%, 6/25/45 | | $7,553,936 | $1,039,110 |
| | Interest Strip Ser. 409, Class C24, IO, 4.50%, 4/25/42 | | 3,424,023 | 672,553 |
| | REMICs Ser. 18-3, Class AI, IO, 4.50%, 12/25/47 | | 7,052,589 | 1,248,742 |
| | REMICs Ser. 17-72, Class ID, IO, 4.50%, 9/25/47 | | 11,757,235 | 2,294,400 |
| | REMICs Ser. 23-49, Class IB, IO, 3.50%, 3/25/47 | | 3,537,243 | 563,813 |
| | REMICs Ser. 12-128, Class QI, IO, 3.50%, 6/25/42 | | 1,454,508 | 62,572 |
| | REMICs Ser. 23-49, Class IA, IO, 3.00%, 8/25/46 | | 4,494,320 | 569,216 |
| | REMICs Ser. 21-12, Class NI, IO, 2.50%, 3/25/51 | | 24,611,479 | 4,095,701 |
| | REMICs IFB Ser. 18-44, Class SA, IO, ((-1 x US 30 Day Average SOFR) + 6.09%), 1.229%, 6/25/48 | | 15,193,313 | 1,809,551 |
| | REMICs Ser. 03-34, PO, zero %, 4/25/43 | | 56,468 | 50,972 |
| | REMICs Ser. 07-14, Class KO, PO, zero %, 3/25/37 | | 30,165 | 24,790 |
| | REMICs Ser. 06-84, Class OT, PO, zero %, 9/25/36 | | 3,310 | 2,710 |
| | Government National Mortgage Association | | | |
| | FRB Ser. 23-152, Class FB, IO, 6.04%, 4/20/51 W | | 2,926,181 | 2,936,315 |
| | Ser. 09-79, Class IC, IO, 6.00%, 8/20/39 | | 2,657,150 | 316,674 |
| | Ser. 14-180, IO, 5.00%, 12/20/44 | | 6,178,377 | 1,248,069 |
| | Ser. 14-76, IO, 5.00%, 5/20/44 | | 1,617,161 | 321,889 |
| | Ser. 10-9, Class UI, IO, 5.00%, 1/20/40 | | 2,629,067 | 551,736 |
| | Ser. 19-83, IO, 4.50%, 6/20/49 | | 7,912,351 | 1,676,223 |
| | Ser. 15-13, Class BI, IO, 4.50%, 1/20/45 | | 9,013,459 | 1,789,007 |
| | Ser. 14-71, Class BI, IO, 4.50%, 5/20/29 | | 102,810 | 1,066 |
| | Ser. 20-46, Class MI, IO, 4.00%, 4/20/50 | | 15,040,628 | 2,962,193 |
| | Ser. 15-53, Class MI, IO, 4.00%, 4/16/45 | | 5,783,702 | 1,139,239 |
| | Ser. 12-38, Class MI, IO, 4.00%, 3/20/42 | | 11,749,204 | 2,073,212 |
| | IFB Ser. 23-140, Class JS, IO, ((-2.488 x US 30 Day Average SOFR) + 16.05%), 3.881%, 9/20/53 | | 1,282,842 | 1,267,378 |
| | Ser. 21-91, Class AI, IO, 3.50%, 5/20/51 | | 16,338,598 | 3,074,334 |
| | Ser. 12-136, IO, 3.50%, 11/20/42 | | 5,248,507 | 719,905 |
| | Ser. 12-113, Class ID, IO, 3.50%, 9/20/42 | | 6,629,324 | 1,042,665 |
| | Ser. 14-102, Class IG, IO, 3.50%, 3/16/41 | | 634,488 | 18,386 |
| | Ser. 15-52, Class KI, IO, 3.50%, 11/20/40 | | 1,395,422 | 82,895 |
| | Ser. 14-100, Class JI, IO, 3.50%, 7/16/29 | | 1,706,439 | 70,876 |
| | IFB Ser. 23-66, Class PS, IO, ((-2.5 x US 30 Day Average SOFR) + 15.38%), 3.149%, 5/20/53 | | 3,159,219 | 3,226,975 |
| | Ser. 14-30, Class KI, IO, 3.00%, 2/16/29 | | 573,233 | 15,399 |
| | Ser. 14-5, Class LI, IO, 3.00%, 1/16/29 | | 558,833 | 14,585 |
| | Ser. 13-164, Class CI, IO, 3.00%, 11/16/28 | | 1,148,984 | 30,891 |
| | Ser. 20-151, Class MI, IO, 2.50%, 10/20/50 | | 26,317,779 | 3,729,774 |
| | Ser. 20-123, Class NI, IO, 2.50%, 8/20/50 | | 14,875,015 | 1,992,697 |
| | Ser. 17-H18, Class CI, IO, 2.461%, 9/20/67 W | | 6,951,165 | 472,141 |
| | Ser. 16-H11, Class HI, IO, 2.026%, 1/20/66 W | | 9,149,530 | 199,972 |
| | FRB Ser. 15-H16, Class XI, IO, 2.002%, 7/20/65 W | | 8,252,174 | 441,508 |
| | Ser. 16-H23, Class NI, IO, 1.906%, 10/20/66 W | | 16,319,052 | 701,785 |
| | Ser. 17-H23, Class BI, IO, 1.888%, 11/20/67 W | | 9,367,115 | 356,934 |
| | Ser. 15-H12, Class GI, IO, 1.847%, 5/20/65 W | | 14,121,329 | 474,011 |
| | Ser. 15-H12, Class AI, IO, 1.84%, 5/20/65 W | | 10,097,480 | 216,712 |
| | Ser. 15-H10, Class CI, IO, 1.816%, 4/20/65 W | | 12,944,100 | 331,434 |
| | Ser. 15-H20, Class AI, IO, 1.814%, 8/20/65 W | | 11,013,911 | 282,308 |
| | Ser. 15-H12, Class EI, IO, 1.689%, 4/20/65 W | | 12,143,685 | 287,684 |
| | Ser. 17-H12, Class QI, IO, 1.648%, 5/20/67 W | | 8,815,828 | 316,779 |
| | Ser. 16-H24, Class JI, IO, 1.61%, 11/20/66 W | | 6,942,330 | 369,602 |
| | Ser. 15-H25, Class AI, IO, 1.61%, 9/20/65 W | | 10,015,491 | 179,978 |
| | Ser. 15-H01, Class CI, IO, 1.586%, 12/20/64 W | | 2,916,643 | 68,494 |
| | Ser. 14-H11, Class GI, IO, 1.512%, 6/20/64 W | | 22,083,872 | 556,161 |
| | Ser. 19-H02, Class DI, IO, 1.486%, 11/20/68 W | | 11,039,308 | 543,542 |
| | Ser. 10-H19, Class GI, IO, 1.454%, 8/20/60 W | | 4,860,597 | 165,416 |
| | IFB Ser. 20-142, Class SB, IO, ((-1 x CME Term SOFR 1 Month) + 6.19%), 1.426%, 9/20/50 | | 25,302,544 | 3,467,777 |
| | IFB Ser. 20-112, Class MS, IO, ((-1 x CME Term SOFR 1 Month) + 6.19%), 1.426%, 8/20/50 | | 4,552,807 | 600,162 |
| | Ser. 17-H08, Class NI, IO, 1.401%, 3/20/67 W | | 6,073,103 | 205,495 |
| | Ser. 20-H02, Class GI, IO, 1.328%, 1/20/70 W | | 17,095,770 | 872,449 |
| | Ser. 19-H14, Class IB, IO, 1.307%, 8/20/69 W | | 13,188,015 | 616,289 |
| | IFB Ser. 14-131, Class BS, IO, ((-1 x CME Term SOFR 1 Month) + 6.09%), 1.30%, 9/16/44 | | 8,370,293 | 1,014,776 |
| | | | | |
| | MORTGAGE-BACKED SECURITIES (21.2%)* cont. | Principal amount | Value |
| | Agency collateralized mortgage obligations cont. | | | |
| | Government National Mortgage Association | | | |
| | Ser. 18-H02, Class EI, IO, 1.277%, 1/20/68 W | | $8,355,483 | $417,791 |
| | IFB Ser. 19-123, Class SL, IO, ((-1 x CME Term SOFR 1 Month) + 6.04%), 1.276%, 10/20/49 | | 12,523,155 | 1,325,390 |
| | IFB Ser. 19-65, Class BS, IO, ((-1 x CME Term SOFR 1 Month) + 5.99%), 1.226%, 5/20/49 | | 6,144,629 | 592,014 |
| | IFB Ser. 23-19, Class S, IO, ((-1 x CME Term SOFR 1 Month) + 5.94%), 1.176%, 11/20/49 | | 17,740,085 | 1,947,918 |
| | IFB Ser. 19-125, Class SG, IO, ((-1 x CME Term SOFR 1 Month) + 5.94%), 1.176%, 10/20/49 | | 3,652,840 | 427,535 |
| | Ser. 18-H17, Class GI, IO, 1.165%, 10/20/68 W | | 13,639,160 | 551,186 |
| | IFB Ser. 19-119, Class KS, IO, ((-1 x CME Term SOFR 1 Month) + 5.94%), 1.15%, 9/16/49 | | 18,030,919 | 2,285,870 |
| | Ser. 17-H10, Class MI, IO, 1.143%, 4/20/67 W | | 8,411,798 | 237,137 |
| | IFB Ser. 19-121, Class SD, IO, ((-1 x CME Term SOFR 1 Month) + 5.89%), 1.126%, 10/20/49 | | 2,573,409 | 275,316 |
| | Ser. 15-H26, Class DI, IO, 0.839%, 10/20/65 W | | 7,035,551 | 327,336 |
| | Ser. 15-H25, Class CI, IO, 0.674%, 10/20/65 W | | 8,132,873 | 310,415 |
| | Ser. 15-H04, Class AI, IO, 0.211%, 12/20/64 W | | 12,255,512 | 401,209 |
| | IFB Ser. 11-70, Class YI, IO, ((-1 x CME Term SOFR 1 Month) + 4.89%), 0.126%, 12/20/40 | | 3,112,301 | 22,707 |
| | | | | 70,400,953 |
| | Commercial mortgage-backed securities (7.9%) | | | |
| | ACRES Commercial Realty, Ltd. 144A | | | |
| | FRB Ser. 21-FL1, Class AS, 6.495%, 6/15/36 | | 899,000 | 888,355 |
| | FRB Ser. 21-FL1, Class A, (CME Term SOFR 1 Month + 1.31%), 6.095%, 6/15/36 | | 988,761 | 984,798 |
| | AREIT CRE Trust 144A FRB Ser. 22-CRE6, Class A, 6.14%, 1/20/37 (Cayman Islands) | | 734,389 | 732,902 |
| | Banc of America Commercial Mortgage Trust | | | |
| | FRB Ser. 16-UB10, Class C, 4.824%, 7/15/49 W | | 167,000 | 159,462 |
| | FRB Ser. 15-UBS7, Class B, 4.335%, 9/15/48 W | | 4,306,000 | 3,940,053 |
| | BANK | | | |
| | FRB Ser. 20-BN26, Class XA, IO, 1.203%, 3/15/63 W | | 39,273,606 | 1,906,054 |
| | FRB Ser. 18-BN13, Class XA, IO, 0.451%, 8/15/61 W | | 166,925,230 | 2,422,068 |
| | Barclays Commercial Mortgage Trust 144A | | | |
| | FRB Ser. 19-C5, Class F, 2.574%, 11/15/52 W | | 4,179,000 | 2,589,856 |
| | Ser. 19-C5, Class D, 2.50%, 11/15/52 | | 528,000 | 419,191 |
| | Bayview Opportunity Master Fund VII Trust 144A Ser. 23-1A, Class A, 6.93%, 10/28/60 | | 1,130,355 | 1,148,400 |
| | BBCMS Mortgage Trust FRB Ser. 24-5C29, Class XA, IO, 1.60%, 9/15/57 W | | 22,899,419 | 1,538,988 |
| | BDS, Ltd. 144A | | | |
| | FRB Ser. 21-FL10, Class A, (CME Term SOFR 1 Month + 1.46%), 6.224%, 12/16/36 (Cayman Islands) | | 1,009,764 | 1,008,366 |
| | FRB Ser. 21-FL9, Class A, (CME Term SOFR 1 Month + 1.18%), 5.944%, 11/16/38 (Cayman Islands) | | 190,054 | 189,534 |
| | CFCRE Commercial Mortgage Trust 144A | | | |
| | FRB Ser. 11-C2, Class D, 5.249%, 12/15/47 W | | 122,995 | 114,043 |
| | FRB Ser. 11-C2, Class E, 5.249%, 12/15/47 W | | 175,000 | 152,288 |
| | Citigroup Commercial Mortgage Trust FRB Ser. 16-P6, Class B, 4.156%, 12/10/49 W | | 1,631,000 | 1,433,102 |
| | COMM Mortgage Trust | | | |
| | Ser. 12-LC4, Class B, 4.934%, 12/10/44 W | | 1,344,379 | 1,262,037 |
| | FRB Ser. 14-CR17, Class C, 4.779%, 5/10/47 W | | 634,000 | 580,973 |
| | FRB Ser. 14-UBS6, Class C, 4.374%, 12/10/47 W | | 591,000 | 563,562 |
| | FRB Ser. 15-CR23, Class XA, IO, 0.843%, 5/10/48 W | | 22,436,885 | 37,575 |
| | FRB Ser. 14-UBS4, Class XA, IO, 0.813%, 8/10/47 W | | 4,812,811 | 48 |
| | FRB Ser. 19-GC44, Class XA, IO, 0.624%, 8/15/57 W | | 88,582,237 | 1,827,912 |
| | COMM Mortgage Trust 144A | | | |
| | FRB Ser. 12-CR1, Class D, 5.137%, 5/15/45 W | | 1,054,493 | 854,876 |
| | FRB Ser. 14-CR17, Class D, 4.843%, 5/10/47 W | | 233,000 | 186,395 |
| | FRB Ser. 14-CR19, Class D, 4.539%, 8/10/47 W | | 774,396 | 737,824 |
| | Ser. 12-LC4, Class E, 4.25%, 12/10/44 | | 1,918,000 | 218,554 |
| | Credit Suisse Commercial Mortgage Trust 144A FRB Ser. 07-C2, Class AX, IO, zero %, 1/15/49 W | | 5,858,089 | 713 |
| | CSAIL Commercial Mortgage Trust | | | |
| | FRB Ser. 15-C1, Class C, 4.24%, 4/15/50 W | | 1,507,000 | 1,335,727 |
| | FRB Ser. 19-C17, Class XA, IO, 1.32%, 9/15/52 W | | 55,627,618 | 2,741,129 |
| | CSMC Trust FRB Ser. 16-NXSR, Class XA, IO, 0.673%, 12/15/49 W | | 96,289,188 | 917,905 |
| | DBUBS Mortgage Trust 144A FRB Ser. 11-LC3A, Class D, 5.354%, 8/10/44 W | | 3,009,173 | 2,818,655 |
| | Federal Home Loan Mortgage Corporation 144A Multifamily Structured Credit Risk FRB Ser. 21-MN3, Class M2, 8.857%, 11/25/51 | | 478,000 | 489,373 |
| | FREMF Mortgage Trust 144A | | | |
| | FRB Ser. 18-KF43, Class B, (US 30 Day Average SOFR + 2.15%), 7.428%, 1/25/28 | | 2,579,818 | 2,481,816 |
| | FRB Ser. 15-K51, Class B, 3.956%, 10/25/48 W | | 1,402,000 | 1,384,175 |
| | | | | |
| | MORTGAGE-BACKED SECURITIES (21.2%)* cont. | Principal amount | Value |
| | Commercial mortgage-backed securities cont. | | | |
| | GS Mortgage Securities Corp., II 144A Ser. 13-GC10, Class C, 4.285%, 2/10/46 W | | $8,273,760 | $8,133,106 |
| | GS Mortgage Securities Trust | | | |
| | FRB Ser. 14-GC26, Class XA, IO, 0.725%, 11/10/47 W | | 9,490,189 | 95 |
| | FRB Ser. 14-GC22, Class XA, IO, 0.594%, 6/10/47 W | | 13,401,070 | 134 |
| | JPMBB Commercial Mortgage Securities Trust | | | |
| | FRB Ser. 13-C12, Class C, 3.939%, 7/15/45 W | | 153,209 | 143,081 |
| | FRB Ser. 14-C25, Class XA, IO, 0.687%, 11/15/47 W | | 9,394,482 | 94 |
| | FRB Ser. 14-C22, Class XA, IO, 0.389%, 9/15/47 W | | 1,698,455 | 17 |
| | JPMBB Commercial Mortgage Securities Trust 144A FRB Ser. C14, Class D, 4.039%, 8/15/46 W | | 917,000 | 705,834 |
| | JPMDB Commercial Mortgage Securities Trust | | | |
| | FRB Ser. 18-C8, Class C, 4.757%, 6/15/51 W | | 387,000 | 330,095 |
| | FRB Ser. 19-COR6, Class XA, IO, 0.917%, 11/13/52 W | | 68,092,637 | 2,258,803 |
| | JPMorgan Chase Commercial Mortgage Securities Trust FRB Ser. 13-LC11, Class XA, IO, 1.157%, 4/15/46 W | | 1,517,690 | 9,372 |
| | JPMorgan Chase Commercial Mortgage Securities Trust 144A | | | |
| | FRB Ser. 12-C6, Class E, 4.964%, 5/15/45 W | | 614,000 | 568,130 |
| | FRB Ser. 12-LC9, Class D, 3.567%, 12/15/47 W | | 621,000 | 538,175 |
| | FRB Ser. 13-LC11, Class E, 3.25%, 4/15/46 (In default) † W | | 2,038,000 | 317,806 |
| | MF1 Multifamily Housing Mortgage Loan Trust 144A FRB Ser. 21-FL5, Class A, 5.745%, 7/15/36 | | 152,957 | 152,670 |
| | MF1 Multifamily Housing Mortgage, Ltd. 144A FRB Ser. 21-FL6, Class A, (CME Term SOFR 1 Month + 1.21%), 5.974%, 7/16/36 (Cayman Islands) | | 485,304 | 482,865 |
| | Morgan Stanley Bank of America Merrill Lynch Trust | | | |
| | FRB Ser. 15-C27, Class C, 4.485%, 12/15/47 W | | 3,614,000 | 3,474,885 |
| | FRB Ser. 14-C16, Class B, 4.284%, 6/15/47 W | | 105,501 | 100,916 |
| | FRB Ser. 15-C26, Class XA, IO, 0.957%, 10/15/48 W | | 30,150,925 | 68,922 |
| | Morgan Stanley Bank of America Merrill Lynch Trust 144A | | | |
| | FRB Ser. 12-C5, Class E, 4.641%, 8/15/45 W | | 540,000 | 526,345 |
| | FRB Ser. 13-C10, Class F, 3.982%, 7/15/46 W | | 2,331,000 | 151,443 |
| | Morgan Stanley Capital I Trust | | | |
| | FRB Ser. 18-L1, Class C, 4.781%, 10/15/51 W | | 341,000 | 315,219 |
| | Ser. 15-UBS8, Class B, 4.315%, 12/15/48 W | | 319,000 | 294,554 |
| | Ser. 15-UBS8, Class A4, 3.809%, 12/15/48 | | 403,000 | 395,900 |
| | FRB Ser. 16-BNK2, Class XA, IO, 0.95%, 11/15/49 W | | 21,981,776 | 300,539 |
| | FRB Ser. 18-H4, Class XA, IO, 0.805%, 12/15/51 W | | 52,825,407 | 1,455,588 |
| | FRB Ser. 18-H3, Class XA, IO, 0.80%, 7/15/51 W | | 49,776,873 | 1,119,104 |
| | FRB Ser. 16-UB12, Class XA, IO, 0.645%, 12/15/49 W | | 63,414,315 | 637,117 |
| | Morgan Stanley Capital I Trust 144A FRB Ser. 12-C4, Class E, 5.164%, 3/15/45 W | | 1,406,000 | 660,891 |
| | Multifamily Connecticut Avenue Securities Trust 144A | | | |
| | FRB Ser. 20-01, Class M10, 8.721%, 3/25/50 | | 3,243,782 | 3,305,924 |
| | FRB Ser. 19-01, Class M10, 8.221%, 10/25/49 | | 2,794,047 | 2,829,602 |
| | Ready Capital Mortgage Financing, LLC 144A | | | |
| | FRB Ser. 22-FL8, Class AS, 6.957%, 1/25/37 | | 313,000 | 312,587 |
| | FRB Ser. 21-FL7, Class AS, 6.352%, 11/25/36 | | 3,900,000 | 3,882,418 |
| | FRB Ser. 21-FL7, Class A, 6.052%, 11/25/36 | | 399,222 | 398,259 |
| | Shelter Growth CRE Issuer, Ltd. 144A FRB Ser. 23-FL5, Class A, 7.513%, 5/19/38 (Bermuda) | | 585,345 | 586,814 |
| | TIAA Real Estate CDO, Ltd. 144A Ser. 03-1A, Class E, 8.00%, 12/28/38 (In default) † | | 1,661,295 | 125 |
| | UBS Commercial Mortgage Trust | | | |
| | FRB Ser. 17-C7, Class XA, IO, 0.979%, 12/15/50 W | | 56,680,104 | 1,437,770 |
| | FRB Ser. 18-C12, Class XA, IO, 0.853%, 8/15/51 W | | 105,165,374 | 2,784,590 |
| | Wachovia Bank Commercial Mortgage Trust FRB Ser. 06-C29, IO, 0.293%, 11/15/48 W | | 82,212 | 218 |
| | Wells Fargo Commercial Mortgage Trust | | | |
| | FRB Ser. 18-C46, Class C, 4.965%, 8/15/51 W | | 412,000 | 368,437 |
| | Ser. 15-LC20, Class C, 4.056%, 4/15/50 W | | 1,287,000 | 1,208,664 |
| | Ser. 15-C31, Class AS, 4.049%, 11/15/48 | | 712,000 | 700,240 |
| | FRB Ser. 20-C57, Class C, 4.023%, 8/15/53 W | | 1,121,000 | 1,012,255 |
| | FRB Ser. 19-C50, Class XA, IO, 1.404%, 5/15/52 W | | 43,066,751 | 1,978,495 |
| | FRB Ser. 20-C55, Class XA, IO, 1.287%, 2/15/53 W | | 63,732,445 | 3,221,458 |
| | FRB Ser. 17-C41, Class XA, IO, 1.152%, 11/15/50 W | | 77,143,118 | 2,141,277 |
| | WF-RBS Commercial Mortgage Trust | | | |
| | Ser. 14-C21, Class C, 4.234%, 8/15/47 W | | 1,285,000 | 1,186,849 |
| | Ser. 13-C11, Class B, 3.714%, 3/15/45 W | | 1,105,459 | 1,071,426 |
| | FRB Ser. 13-C14, Class XA, IO, 0.348%, 6/15/46 W | | 1,776,145 | 18 |
| | | | | |
| | MORTGAGE-BACKED SECURITIES (21.2%)* cont. | Principal amount | Value |
| | Commercial mortgage-backed securities cont. | | | |
| | WF-RBS Commercial Mortgage Trust | | | |
| | FRB Ser. 14-C22, Class XA, IO, 0.339%, 9/15/57 W | | $4,582,102 | $46 |
| | FRB Ser. 14-C23, Class XA, IO, 0.327%, 10/15/57 W | | 6,706,572 | 67 |
| | | | | 89,635,948 |
| | Residential mortgage-backed securities (non-agency) (7.1%) | | | |
| | A&D Mortgage Trust 144A Ser. 23-NQM4, Class A2, stepped-coupon 7.826% (8.826%, 10/1/27), 9/25/68 †† | | 766,066 | 781,306 |
| | Angel Oak Mortgage Trust 144A | | | |
| | Ser. 24-9, Class A1, stepped-coupon 5.138% (6.138%, 9/1/28), 9/25/69 †† | | 943,444 | 937,168 |
| | Ser. 23-3, Class A1, 4.80%, 9/26/67 | | 1,254,431 | 1,230,990 |
| | Arroyo Mortgage Trust 144A | | | |
| | Ser. 19-3, Class M1, 4.204%, 10/25/48 W | | 3,050,000 | 2,712,299 |
| | Ser. 20-1, Class A3, 3.328%, 3/25/55 | | 150,000 | 133,281 |
| | BRAVO Residential Funding Trust 144A | | | |
| | FRB Ser. 21-HE2, Class B1, (US 30 Day Average SOFR + 2.40%), 7.257%, 11/25/69 | | 3,000,000 | 3,003,284 |
| | Ser. 20-RPL1, Class M1, 3.25%, 5/26/59 W | | 5,430,000 | 5,043,646 |
| | Bunker Hill Loan Depositary Trust 144A FRB Ser. 20-1, Class A3, 3.253%, 2/25/55 W | | 2,100,000 | 1,917,834 |
| | Chevy Chase Funding, LLC Mortgage-Backed Certificates 144A FRB Ser. 04-3A, Class A2, (CME Term SOFR 1 Month + 0.41%), 5.152%, 8/25/35 | | 451,894 | 430,641 |
| | Citigroup Mortgage Loan Trust, Inc. 144A Ser. 22-A, Class A1, 6.17%, perpetual maturity | | 460,860 | 461,148 |
| | COLT Funding, LLC 144A Ser. 21-1, Class B1, 3.144%, 6/25/66 W | | 2,996,000 | 2,128,743 |
| | COLT Mortgage Loan Trust 144A | | | |
| | Ser. 23-3, Class A1, 7.18%, 9/25/68 | | 1,151,294 | 1,169,655 |
| | Ser. 20-2, Class A2, 3.094%, 3/25/65 W | | 100,495 | 98,652 |
| | Cross Mortgage Trust 144A Ser. 24-H4, Class A1, stepped-coupon 6.147% (7.147%, 6/1/28), 7/25/69 †† | | 1,521,297 | 1,531,460 |
| | Deephaven Residential Mortgage Trust Ser. 22-3, Class A3, 5.30%, 7/25/67 W | | 2,607,911 | 2,591,141 |
| | Ellington Financial Mortgage Trust 144A FRB Ser. 20-1, Class A2, 3.149%, 5/25/65 W | | 131,000 | 125,936 |
| | Federal Home Loan Mortgage Corporation | | | |
| | Structured Agency Credit Risk Debt FRN Ser. 15-DNA3, Class M3, (US 30 Day Average SOFR + 4.81%), 9.671%, 4/25/28 | | 58,637 | 60,634 |
| | Seasoned Credit Risk Transfer Trust Ser. 19-3, Class M, 4.75%, 10/25/58 W | | 4,240,090 | 4,100,811 |
| | Federal Home Loan Mortgage Corporation 144A | | | |
| | Structured Agency Credit Risk Trust REMICs FRB Ser. 22-HQA1, Class M2, (US 30 Day Average SOFR + 5.25%), 10.107%, 3/25/42 | | 6,323,000 | 6,822,270 |
| | Structured Agency Credit Risk Debt FRN Ser. 22-HQA2, Class M1B, (US 30 Day Average SOFR + 4.00%), 8.857%, 7/25/42 | | 1,000,000 | 1,064,218 |
| | Structured Agency Credit Risk Trust REMICs FRB Ser. 22-DNA6, Class M1B, (US 30 Day Average SOFR + 3.70%), 8.557%, 9/25/42 | | 27,000 | 28,481 |
| | Structured Agency Credit Risk Debt FRN Ser. 22-DNA5, Class M1A, (US 30 Day Average SOFR + 2.95%), 7.807%, 6/25/42 | | 34,897 | 35,770 |
| | Structured Agency Credit Risk Trust REMICs FRB Ser. 22-DNA3, Class M1B, (US 30 Day Average SOFR + 2.90%), 7.757%, 4/25/42 | | 10,000 | 10,356 |
| | Structured Agency Credit Risk Debt FRN Ser. 22-HQA2, Class M1A, (US 30 Day Average SOFR + 2.65%), 7.507%, 7/25/42 | | 171,012 | 175,308 |
| | Structured Agency Credit Risk Trust REMICs FRB Ser. 21-HQA4, Class M2, (US 30 Day Average SOFR + 2.35%), 7.207%, 12/25/41 | | 3,732,140 | 3,772,409 |
| | Structured Agency Credit Risk Trust REMICs FRB Ser. 22-HQA3, Class M1A, (US 30 Day Average SOFR + 2.30%), 7.157%, 8/25/42 | | 897,007 | 916,184 |
| | Structured Agency Credit Risk Trust REMICs FRB Ser. 22-DNA4, Class M1A, (US 30 Day Average SOFR + 2.20%), 7.057%, 5/25/42 | | 27,651 | 28,114 |
| | Structured Agency Credit Risk Trust REMICs FRB Ser. 22-DNA6, Class M1A, (US 30 Day Average SOFR + 2.15%), 7.007%, 9/25/42 | | 223,224 | 225,508 |
| | Structured Agency Credit Risk Trust REMICs FRB Ser. 23-DNA1, Class M1A, (US 30 Day Average SOFR + 2.10%), 6.957%, 3/25/43 | | 71,027 | 71,784 |
| | Structured Agency Credit Risk Trust REMICs FRB Ser. 22-HQA1, Class M1A, (US 30 Day Average SOFR + 2.10%), 6.957%, 3/25/42 | | 6,657 | 6,713 |
| | Structured Agency Credit Risk Trust REMICs FRB Ser. 21-DNA3, Class M2, (US 30 Day Average SOFR + 2.10%), 6.957%, 10/25/33 | | 30,722 | 31,505 |
| | Structured Agency Credit Risk Debt FRN Ser. 23-HQA2, Class M1A, (US 30 Day Average SOFR + 2.00%), 6.857%, 6/25/43 | | 64,237 | 64,565 |
| | Structured Agency Credit Risk Trust REMICs FRB Ser. 22-DNA3, Class M1A, (US 30 Day Average SOFR + 2.00%), 6.857%, 4/25/42 | | 5,466 | 5,529 |
| | Structured Agency Credit Risk Trust REMICs FRB Ser. 23-HQA3, Class A1, (US 30 Day Average SOFR + 1.85%), 6.707%, 11/25/43 | | 98,766 | 99,958 |
| | | | | |
| | MORTGAGE-BACKED SECURITIES (21.2%)* cont. | Principal amount | Value |
| | Residential mortgage-backed securities (non-agency) cont. | | | |
| | Federal Home Loan Mortgage Corporation 144A | | | |
| | Structured Agency Credit Risk Trust REMICs FRB Ser. 23-HQA3, Class M1, (US 30 Day Average SOFR + 1.85%), 6.707%, 11/25/43 | | $33,804 | $34,008 |
| | Structured Agency Credit Risk Trust REMICs FRB Ser. 22-DNA1, Class M1B, (US 30 Day Average SOFR + 1.85%), 6.707%, 1/25/42 | | 33,000 | 33,365 |
| | Structured Agency Credit Risk Debt FRN Ser. 21-DNA7, Class M2, (US 30 Day Average SOFR + 1.80%), 6.657%, 11/25/41 | | 394,000 | 397,524 |
| | Structured Agency Credit Risk Trust REMICs FRB Ser. 21-DNA5, Class M2, (US 30 Day Average SOFR + 1.65%), 6.507%, 1/25/34 | | 22,228 | 22,330 |
| | Structured Agency Credit Risk Trust REMICs FRB Ser. 21-DNA6, Class M2, (US 30 Day Average SOFR + 1.50%), 6.357%, 10/25/41 | | 127,000 | 127,479 |
| | Structured Agency Credit Risk Trust REMICs FRB Ser. 24-DNA1, Class A1, (US 30 Day Average SOFR + 1.35%), 6.207%, 2/25/44 | | 116,774 | 117,106 |
| | Structured Agency Credit Risk Debt FRN Ser. 22-DNA2, Class M1A, (US 30 Day Average SOFR + 1.30%), 6.157%, 2/25/42 | | 7,600 | 7,621 |
| | Structured Agency Credit Risk Trust REMICs FRB Ser. 24-DNA2, Class A1, (US 30 Day Average SOFR + 1.25%), 6.107%, 5/25/44 | | 123,263 | 123,515 |
| | Structured Agency Credit Risk Trust REMICs FRB Ser. 22-DNA1, Class M1A, (US 30 Day Average SOFR + 1.00%), 5.857%, 1/25/42 | | 1,842,403 | 1,843,069 |
| | Structured Agency Credit Risk Trust REMICs FRB Ser. 21-HQA4, Class M1, (US 30 Day Average SOFR + 0.95%), 5.807%, 12/25/41 | | 34,664 | 34,649 |
| | Structured Agency Credit Risk Trust REMICs FRB Ser. 21-DNA6, Class M1, (US 30 Day Average SOFR + 0.80%), 5.657%, 10/25/41 | | 5,129 | 5,126 |
| | Seasoned Credit Risk Transfer Trust Ser. 19-2, Class M, 4.75%, 8/25/58 W | | 539,000 | 517,614 |
| | Seasoned Credit Risk Transfer Trust Ser. 19-4, Class M, 4.50%, 2/25/59 W | | 2,024,000 | 1,872,887 |
| | Federal National Mortgage Association | | | |
| | Connecticut Avenue Securities FRB Ser. 16-C01, Class 1M2, (US 30 Day Average SOFR + 6.86%), 11.721%, 8/25/28 | | 14,922 | 15,598 |
| | Connecticut Avenue Securities FRB Ser. 17-C06, Class 1M2B, (US 30 Day Average SOFR + 2.76%), 7.621%, 2/25/30 | | 21,069 | 21,205 |
| | Connecticut Avenue Securities Trust FRB Ser. 18-C05, Class 1M2, (US 30 Day Average SOFR + 2.46%), 7.321%, 1/25/31 | | 920,505 | 944,891 |
| | Connecticut Avenue Securities FRB Ser. 18-C02, Class 2M2, (US 30 Day Average SOFR + 2.31%), 7.171%, 8/25/30 | | 7,840 | 8,053 |
| | Federal National Mortgage Association 144A | | | |
| | Connecticut Avenue Securities Trust FRB Ser. 22-R03, Class 1M2, (US 30 Day Average SOFR + 3.50%), 8.357%, 3/25/42 | | 38,000 | 39,910 |
| | Connecticut Avenue Securities Trust FRB Ser. 22-R04, Class 1M2, (US 30 Day Average SOFR + 3.10%), 7.957%, 3/25/42 | | 53,000 | 55,107 |
| | Connecticut Avenue Securities Trust FRB Ser. 22-R02, Class 2M2, (US 30 Day Average SOFR + 3.00%), 7.857%, 1/25/42 | | 1,549,000 | 1,590,116 |
| | Connecticut Avenue Securities Trust FRB Ser. 22-R07, Class 1M1, (US 30 Day Average SOFR + 2.95%), 7.807%, 6/25/42 | | 733,184 | 754,988 |
| | Connecticut Avenue Securities Trust FRB Ser. 22-R06, Class 1M1, (US 30 Day Average SOFR + 2.75%), 7.607%, 5/25/42 | | 650,391 | 666,895 |
| | Connecticut Avenue Securities Trust FRB Ser. 22-R08, Class 1M1, (US 30 Day Average SOFR + 2.55%), 7.407%, 7/25/42 | | 438,680 | 449,897 |
| | Connecticut Avenue Securities Trust FRB Ser. 23-R01, Class 1M1, (US 30 Day Average SOFR + 2.40%), 7.257%, 12/25/42 | | 18,021 | 18,487 |
| | Connecticut Avenue Securities Trust FRB Ser. 23-R02, Class 1M1, (US 30 Day Average SOFR + 2.30%), 7.157%, 1/25/43 | | 35,071 | 35,943 |
| | Connecticut Avenue Securities Trust FRB Ser. 19-HRP1, Class M2, (US 30 Day Average SOFR + 2.26%), 7.121%, 11/25/39 | | 255,976 | 257,396 |
| | Connecticut Avenue Securities Trust FRB Ser. 22-R03, Class 1M1, (US 30 Day Average SOFR + 2.10%), 6.957%, 3/25/42 | | 168,882 | 171,629 |
| | Connecticut Avenue Securities Trust FRB Ser. 22-R04, Class 1M1, (US 30 Day Average SOFR + 2.00%), 6.857%, 3/25/42 | | 141,755 | 143,575 |
| | Connecticut Avenue Securities Trust FRB Ser. 23-R07, Class 2M1, (US 30 Day Average SOFR + 1.95%), 6.807%, 9/25/43 | | 39,450 | 39,614 |
| | Connecticut Avenue Securities Trust FRB Ser. 22-R05, Class 2M1, (US 30 Day Average SOFR + 1.90%), 6.757%, 4/25/42 | | 921,500 | 927,721 |
| | Connecticut Avenue Securities Trust FRB Ser. 22-R01, Class 1M2, (US 30 Day Average SOFR + 1.90%), 6.757%, 12/25/41 | | 215,000 | 217,856 |
| | | | | |
| | MORTGAGE-BACKED SECURITIES (21.2%)* cont. | Principal amount | Value |
| | Residential mortgage-backed securities (non-agency) cont. | | | |
| | Federal National Mortgage Association 144A | | | |
| | Connecticut Avenue Securities Trust FRB Ser. 23-R06, Class 1M1, (US 30 Day Average SOFR + 1.70%), 6.557%, 7/25/43 | | $705,212 | $707,774 |
| | Connecticut Avenue Securities Trust FRB Ser. 21-R03, Class 1M2, (US 30 Day Average SOFR + 1.65%), 6.507%, 12/25/41 | | 123,000 | 123,889 |
| | Connecticut Avenue Securities Trust FRB Ser. 22-R02, Class 2M1, (US 30 Day Average SOFR + 1.10%), 6.057%, 1/25/42 | | 109,046 | 109,165 |
| | Connecticut Avenue Securities Trust FRB Ser. 24-R06, Class 1A1, (US 30 Day Average SOFR + 1.15%), 6.007%, 9/25/44 | | 120,473 | 120,570 |
| | Connecticut Avenue Securities Trust FRB Ser. 24-R03, Class 2M1, (US 30 Day Average SOFR + 1.15%), 6.007%, 3/25/44 | | 39,333 | 39,385 |
| | Connecticut Avenue Securities Trust FRB Ser. 24-R02, Class 1M1, (US 30 Day Average SOFR + 1.10%), 5.957%, 2/25/44 | | 8,833 | 8,837 |
| | Connecticut Avenue Securities Trust FRB Ser. 24-R04, Class 1M1, (US 30 Day Average SOFR + 1.10%), 5.957%, 5/25/44 | | 87,188 | 87,235 |
| | Connecticut Avenue Securities Trust FRB Ser. 24-R06, Class 1M1, (US 30 Day Average SOFR + 1.05%), 5.907%, 9/25/44 | | 42,462 | 42,491 |
| | GCAT Trust 144A Ser. 20-NQM2, Class A3, 3.935%, 4/25/65 | | 1,428,462 | 1,380,836 |
| | GS Mortgage-Backed Securities Trust 144A | | | |
| | Ser. 24-RPL4, Class A1, stepped-coupon 3.90% (4.90%, 7/1/28), 9/25/61 †† | | 505,131 | 485,929 |
| | FRB Ser. 20-RPL1, Class M2, 3.817%, 7/25/59 W | | 1,125,000 | 959,470 |
| | JPMorgan Mortgage Trust 144A FRB Ser. 24-VIS2, Class A1, 5.853%, 11/25/64 | | 523,109 | 526,233 |
| | Morgan Stanley Resecuritization Trust 144A Ser. 15-R4, Class CB1, 4.783%, 8/26/47 W | | 1,905,308 | 1,902,736 |
| | Morgan Stanley Residential Mortgage Loan Trust 144A FRB Ser. 24-3, Class AF, (US 30 Day Average SOFR + 1.35%), 6.207%, 7/25/54 | | 287,480 | 287,645 |
| | NRZ Excess Spread-Collateralized Notes 144A Ser. 20-PLS1, Class A, 3.844%, 12/25/25 | | 483,665 | 473,930 |
| | NYMT Loan Trust 144A Ser. 22-SP1, Class A1, 5.25%, 7/25/62 | | 2,928,091 | 2,904,488 |
| | OBX Trust 144A Ser. 23-NQM7, Class A1, 6.844%, 4/25/63 | | 1,487,284 | 1,510,380 |
| | PRKCM Trust 144A Ser. 23-AFC2, Class A1, 6.482%, 6/25/58 | | 5,386,284 | 5,422,531 |
| | RMF Proprietary Issuance Trust 144A Ser. 22-3, Class A, 4.00%, 8/25/62 W | | 1,903,000 | 1,760,272 |
| | Towd Point Mortgage Trust 144A | | | |
| | Ser. 19-2, Class A2, 3.75%, 12/25/58 W | | 327,000 | 293,223 |
| | FRB Ser. 15-6, Class M1, 3.75%, 4/25/55 W | | 329,965 | 327,629 |
| | Ser. 18-5, Class M1, 3.25%, 7/25/58 W | | 209,000 | 173,312 |
| | Verus Securitization Trust 144A FRB Ser. 24-1, Class A1, 5.712%, 1/25/69 | | 2,075,547 | 2,078,552 |
| | Visio Trust 144A Ser. 22-1, Class A2, 5.85%, 8/25/57 | | 1,461,801 | 1,455,272 |
| | WaMu Mortgage Pass-Through Certificates Trust | | | |
| | FRB Ser. 05-AR13, Class A1B2, (CME Term SOFR 1 Month + 0.97%), 5.712%, 10/25/45 | | 666,506 | 645,513 |
| | FRB Ser. 05-AR13, Class A1C4, (CME Term SOFR 1 Month + 0.97%), 5.712%, 10/25/45 | | 2,249,382 | 2,158,627 |
| | FRB Ser. 05-AR17, Class A1B2, (CME Term SOFR 1 Month + 0.93%), 5.672%, 12/25/45 | | 1,195,737 | 1,075,744 |
| | FRB Ser. 05-AR2, Class 2A1B, (CME Term SOFR 1 Month + 0.85%), 5.592%, 1/25/45 | | 238,214 | 237,957 |
| | | | | 80,612,100 |
| | Total mortgage-backed securities (cost $255,166,510) | $240,649,001 |
| | ASSET-BACKED SECURITIES (7.0%)* | Principal amount | Value |
| | American Express Credit Account Master Trust Ser. 22-3, Class A, 3.75%, 8/15/27 | | $5,554,000 | $5,516,309 |
| | BA Credit Card Trust Ser. 24-A1, Class A, 4.93%, 5/15/29 | | 5,680,000 | 5,746,862 |
| | Capital One Multi-Asset Execution Trust Ser. 22-A2, Class A, 3.49%, 5/15/27 | | 5,944,000 | 5,905,780 |
| | Capital One Prime Auto Receivables Trust Ser. 22-1, Class A3, 3.17%, 4/15/27 | | 3,769,060 | 3,731,168 |
| | CarMax Auto Owner Trust Ser. 24-2, Class A3, 5.50%, 1/16/29 | | 1,592,000 | 1,620,432 |
| | Carvana Auto Receivables Trust 144A Ser. 23-P3, Class A3, 5.82%, 8/10/28 | | 1,000,000 | 1,012,064 |
| | Chase Auto Owner Trust 144A Ser. 24-1A, Class A3, 5.13%, 5/25/29 | | 4,211,000 | 4,248,096 |
| | Citizens Auto Receivables Trust 144A | | | |
| | Ser. 23-2, Class A3, 5.83%, 2/15/28 | | 500,000 | 507,009 |
| | FRB Ser. 24-2, Class A2B, (US 30 Day Average SOFR + 0.54%), 5.55%, 11/16/26 | | 1,332,000 | 1,332,927 |
| | Discover Card Execution Note Trust Ser. 22-A3, Class A3, 3.56%, 7/15/27 | | 5,958,000 | 5,910,937 |
| | Ford Credit Auto Owner Trust | | | |
| | Ser. 24-B, Class A3, 5.10%, 4/15/29 | | 3,669,000 | 3,711,749 |
| | Ser. 24-A, Class A3, 5.09%, 12/15/28 | | 5,827,000 | 5,890,281 |
| | GM Financial Consumer Automobile Receivables Trust | | | |
| | Ser. 24-2, Class A3, 5.10%, 3/16/29 | | 2,147,000 | 2,169,639 |
| | Ser. 23-1, Class A3, 4.66%, 2/16/28 | | 965,000 | 965,534 |
| | | | | |
| | ASSET-BACKED SECURITIES (7.0%)* cont. | Principal amount | Value |
| | Golden Credit Card Trust 144A Ser. 22-4A, Class A, 4.31%, 9/15/27 | | $5,492,000 | $5,475,266 |
| | GreenState Auto Receivables Trust 144A Ser. 24-1A, Class A3, 5.19%, 1/16/29 | | 2,000,000 | 2,013,315 |
| | Harley-Davidson Motorcycle Trust Ser. 24-A, Class A3, 5.37%, 3/15/29 | | 1,500,000 | 1,514,989 |
| | Honda Auto Receivables Owner Trust Ser. 23-3, Class A3, 5.41%, 2/18/28 | | 3,273,000 | 3,305,405 |
| | Hyundai Auto Receivables Trust | | | |
| | Ser. 24-A, Class A3, 4.99%, 2/15/29 | | 2,750,000 | 2,773,737 |
| | Ser. 23-A, Class A3, 4.58%, 4/15/27 | | 2,496,000 | 2,494,133 |
| | LAD Auto Receivables Trust 144A Ser. 23-3A, Class A3, 6.12%, 9/15/27 | | 1,500,000 | 1,509,288 |
| | Station Place Securitization Trust 144A | | | |
| | FRB Ser. 24-10, Class A, (CME Term SOFR 1 Month + 0.90%), 5.643%, 10/27/25 | | 4,000,000 | 3,989,404 |
| | FRB Ser. 24-5, Class A, (CME Term SOFR 1 Month + 0.90%), 5.643%, 8/4/25 | | 3,620,000 | 3,621,806 |
| | FRB Ser. 24-2, Class A, (CME Term SOFR 1 Month + 0.90%), 5.643%, 6/22/25 | | 3,840,000 | 3,841,902 |
| | Toyota Auto Receivables Owner Trust Ser. 23-C, Class A3, 5.16%, 4/17/28 | | 920,000 | 926,948 |
| | Total asset-backed securities (cost $78,974,091) | $79,734,980 |
| | COLLATERALIZED LOAN OBLIGATIONS (6.7%)* | Principal amount | Value |
| | AB BSL CLO 3, Ltd. 144A FRB Ser. 21-3A, Class B, (CME Term SOFR 3 Month + 1.96%), 6.579%, 10/20/34 (Cayman Islands) | | $1,600,000 | $1,603,915 |
| | AGL Core CLO 31, Ltd. 144A FRB Ser. 24-31A, Class A, (CME Term SOFR 3 Month + 1.40%), 6.60%, 7/20/37 (Cayman Islands) | | 750,000 | 754,483 |
| | AIMCO CLO 17, Ltd. 144A FRB Ser. 24-17A, Class AIR, (CME Term SOFR 3 Month + 1.35%), 5.982%, 7/20/37 (Jersey) | | 1,850,000 | 1,857,862 |
| | Allegro CLO XII, Ltd. 144A FRB Ser. 24-1A, Class A1R, (CME Term SOFR 3 Month + 1.44%), 6.724%, 7/21/37 (Cayman Islands) | | 800,000 | 802,095 |
| | Apex Credit CLO II, Ltd. 144A FRB Ser. 24-2A, Class A, (CME Term SOFR 3 Month + 1.52%), 6.689%, 7/25/37 (Cayman Islands) | | 1,500,000 | 1,506,384 |
| | Bain Capital Credit CLO, Ltd. 144A FRB Ser. 24-1A, Class A1, (CME Term SOFR 3 Month + 1.55%), 6.197%, 4/16/37 (Jersey) | | 551,000 | 552,976 |
| | Balboa Bay Loan Funding, Ltd. 144A FRB Ser. 21-1A, Class B, (CME Term SOFR 3 Month + 1.91%), 6.529%, 7/20/34 | | 1,850,000 | 1,854,701 |
| | Birch Grove CLO 2, Ltd. 144A FRB Ser. 24-2A, Class A1R, (CME Term SOFR 3 Month + 1.40%), 6.017%, 10/19/37 (Cayman Islands) | | 1,750,000 | 1,756,373 |
| | Birch Grove CLO 8, Ltd. 144A FRB Ser. 24-8A, Class A1, (CME Term SOFR 3 Month + 1.63%), 6.247%, 4/20/37 (Jersey) | | 1,500,000 | 1,508,820 |
| | Black Diamond CLO, Ltd. 144A FRB Ser. 21-1A, Class A1A, (CME Term SOFR 3 Month + 1.51%), 6.143%, 11/22/34 (Cayman Islands) | | 400,000 | 400,386 |
| | BlueMountain CLO XXXII, Ltd. 144A FRB Ser. 21-32A, Class A, (CME Term SOFR 3 Month + 1.43%), 6.088%, 10/15/34 (Cayman Islands) | | 1,170,000 | 1,172,780 |
| | CBAM CLO Management, Ltd. 144A FRB Ser. 21-12A, Class AR, (CME Term SOFR 3 Month + 1.44%), 6.059%, 7/20/34 (Cayman Islands) | | 750,000 | 752,100 |
| | CBAM CLO Management, Ltd. 144A FRB Ser. 21-2A, Class AR, (CME Term SOFR 3 Month + 1.45%), 6.099%, 7/17/34 (Cayman Islands) | | 1,650,000 | 1,653,102 |
| | CIFC Funding II, Ltd. 144A FRB Ser. 24-2RA, Class AR, (CME Term SOFR 3 Month + 1.36%), 5.995%, 10/24/37 (Cayman Islands) | | 1,500,000 | 1,504,776 |
| | CIFC Funding, Ltd. 144A FRB Ser. 21-1A, Class BRR, (CME Term SOFR 3 Month + 1.96%), 7.244%, 10/21/31 | | 2,600,000 | 2,607,945 |
| | CIFC Funding, Ltd. 144A FRB Ser. 24-4A, Class AR, (CME Term SOFR 3 Month + 1.36%), 6.533%, 7/23/37 (Cayman Islands) | | 1,650,000 | 1,650,753 |
| | CQS US CLO, Ltd. 144A FRB Ser. 21-1A, Class A, (CME Term SOFR 3 Month + 1.48%), 6.099%, 1/20/35 (Cayman Islands) | | 1,050,000 | 1,051,889 |
| | Crown Point CLO 10, Ltd. 144A FRB Ser. 21-10A, Class A, (CME Term SOFR 3 Month + 1.43%), 6.049%, 7/20/34 (Cayman Islands) | | 250,000 | 250,825 |
| | Diameter Capital CLO, Ltd. 144A FRB Ser. 24-7A, Class A1A, (CME Term SOFR 3 Month + 1.48%), 6.806%, 7/20/37 (Cayman Islands) | | 1,600,000 | 1,601,420 |
| | Elevation CLO, Ltd. 144A FRB Ser. 21-13A, Class A1, (CME Term SOFR 3 Month + 1.45%), 6.108%, 7/15/34 (Cayman Islands) | | 700,000 | 701,684 |
| | Ellington CLO III, Ltd. 144A FRB Ser. 18-3A, Class B, (CME Term SOFR 3 Month + 2.26%), 6.879%, 7/20/30 | | 1,500,000 | 1,504,718 |
| | Elmwood CLO 27, Ltd. 144A FRB Ser. 24-3A, Class A, (CME Term SOFR 3 Month + 1.52%), 6.152%, 4/18/37 | | 1,250,000 | 1,257,204 |
| | Elmwood CLO 33, Ltd. 144A FRB Ser. 24-9RA, Class AR, (CME Term SOFR 3 Month + 1.38%), 6.503%, 10/21/37 (Cayman Islands) | | 1,500,000 | 1,509,638 |
| | Elmwood CLO I, Ltd. 144A FRB Ser. 24-1A, Class A1RR, (CME Term SOFR 3 Month + 1.52%), 6.137%, 4/20/37 (Cayman Islands) | | 1,400,000 | 1,405,474 |
| | Elmwood CLO III, Ltd. 144A FRB Ser. 24-3A, Class A1RR, (CME Term SOFR 3 Month + 1.38%), 6.012%, 7/18/37 (Cayman Islands) | | 1,700,000 | 1,711,701 |
| | | | | |
| | COLLATERALIZED LOAN OBLIGATIONS (6.7%)* cont. | Principal amount | Value |
| | GoldenTree Loan Management US CLO 9, Ltd. 144A FRB Ser. 24-9A, Class AR, (CME Term SOFR 3 Month + 1.50%), 6.117%, 4/20/37 | | $1,500,000 | $1,507,108 |
| | Hayfin US XIV, Ltd. 144A FRB Ser. 21-14A, Class A1, (CME Term SOFR 3 Month + 1.49%), 6.109%, 7/20/34 (Cayman Islands) | | 1,650,000 | 1,654,823 |
| | ICG US CLO, Ltd. 144A FRB Ser. 21-1A, Class ARR, (CME Term SOFR 3 Month + 1.43%), 6.049%, 7/28/34 | | 2,500,000 | 2,503,742 |
| | Jamestown CLO IX, Ltd. 144A FRB Ser. 21-9A, Class A1RR, (CME Term SOFR 3 Month + 1.50%), 6.127%, 7/25/34 (Cayman Islands) | | 1,000,000 | 1,003,535 |
| | Jamestown CLO IX, Ltd. 144A FRB Ser. 21-9A, Class A2RR, (CME Term SOFR 3 Month + 2.11%), 6.737%, 7/25/34 (Cayman Islands) | | 700,000 | 702,590 |
| | KKR Financial CLO 52, Ltd. 144A FRB Ser. 23-52A, Class A2, (CME Term SOFR 3 Month + 2.25%), 6.897%, 7/16/36 (Cayman Islands) | | 250,000 | 251,523 |
| | LCM 41, Ltd. 144A FRB Ser. 41A, Class A1, (CME Term SOFR 3 Month + 1.46%), 6.116%, 4/15/36 (Jersey) | | 500,000 | 500,928 |
| | Magnetite XL, Ltd. 144A FRB Ser. 24-40A, Class A1, (CME Term SOFR 3 Month + 1.45%), 6.782%, 7/15/37 (Cayman Islands) | | 2,000,000 | 2,005,266 |
| | Magnetite XXXVII, Ltd. 144A FRB Ser. 23-37A, Class A, (CME Term SOFR 3 Month + 1.65%), 6.267%, 10/20/36 (Cayman Islands) | | 500,000 | 503,257 |
| | Nassau, Ltd. 144A FRB Ser. 21-1A, Class A1, (CME Term SOFR 3 Month + 1.51%), 6.168%, 8/26/34 (Cayman Islands) | | 3,115,000 | 3,123,527 |
| | Nassau, Ltd. 144A FRB Ser. 21-1A, Class A1R, (CME Term SOFR 3 Month + 1.55%), 6.208%, 1/15/35 (Cayman Islands) | | 250,000 | 250,412 |
| | Neuberger Berman CLO XVII, Ltd. 144A FRB Ser. 24-17A, Class AR3, (CME Term SOFR 3 Month + 1.40%), 6.032%, 7/22/38 (Cayman Islands) | | 1,000,000 | 1,004,432 |
| | Palmer Square CLO, Ltd. 144A FRB Ser. 21-3A, Class B, (CME Term SOFR 3 Month + 1.91%), 6.568%, 1/15/35 (Cayman Islands) | | 2,925,000 | 2,931,735 |
| | Park Avenue Institutional Advisers CLO, Ltd. 144A FRB Ser. 21-1A, Class A1A, (CME Term SOFR 3 Month + 1.65%), 6.269%, 1/20/34 (Cayman Islands) | | 500,000 | 501,000 |
| | Rockland Park CLO, Ltd. 144A FRB Ser. 21-1A, Class B, (CME Term SOFR 3 Month + 1.91%), 6.529%, 4/20/34 (Cayman Islands) | | 2,000,000 | 2,005,551 |
| | RR 29, Ltd. 144A FRB Ser. 24-29RA, Class A1R, (CME Term SOFR 3 Month + 1.39%), 6.046%, 7/15/39 (Cayman Islands) | | 1,150,000 | 1,153,933 |
| | Shackleton XIV CLO, Ltd. 144A FRB Ser. 21-14A, Class BR, (CME Term SOFR 3 Month + 2.06%), 6.679%, 7/20/34 (Cayman Islands) | | 1,650,000 | 1,655,813 |
| | Signal Peak CLO 5, Ltd. 144A FRB Ser. 24-5A, Class A1R, (CME Term SOFR 3 Month + 1.55%), 6.176%, 4/25/37 (Cayman Islands) | | 1,900,000 | 1,910,726 |
| | Sound Point CLO XXVI, Ltd. 144A FRB Ser. 21-1A, Class AR, (CME Term SOFR 3 Month + 1.43%), 6.049%, 7/20/34 (Cayman Islands) | | 2,460,000 | 2,465,083 |
| | Sound Point CLO XXXII, Ltd. 144A FRB Ser. 21-4A, Class A, (CME Term SOFR 3 Month + 1.41%), 6.037%, 10/25/34 (Cayman Islands) | | 1,000,000 | 1,002,411 |
| | TCW CLO, Ltd. 144A FRB Ser. 21-2A, Class AS, (CME Term SOFR 3 Month + 1.44%), 6.067%, 7/25/34 (Cayman Islands) | | 1,500,000 | 1,503,612 |
| | TICP CLO XII, Ltd. 144A FRB Ser. 21-12A, Class BR, (CME Term SOFR 3 Month + 1.91%), 6.568%, 7/15/34 (Cayman Islands) | | 1,950,000 | 1,954,843 |
| | Trestles CLO IV, Ltd. 144A FRB Ser. 21-4A, Class A, (CME Term SOFR 3 Month + 1.43%), 6.049%, 7/21/34 (Cayman Islands) | | 1,350,000 | 1,353,947 |
| | Trinitas CLO XVIII, Ltd. 144A FRB Ser. 21-18A, Class A1, (CME Term SOFR 3 Month + 1.43%), 6.049%, 1/20/35 (Cayman Islands) | | 750,000 | 751,524 |
| | Venture 44 CLO ,Ltd. 144A FRB Ser. 21-44A, Class A1N, (CME Term SOFR 3 Month + 1.46%), 6.079%, 10/20/34 (Cayman Islands) | | 550,000 | 551,505 |
| | Venture XIX CLO, Ltd. 144A FRB Ser. 18-19A, Class ARR, (CME Term SOFR 3 Month + 1.52%), 6.178%, 1/15/32 (Cayman Islands) | | 229,391 | 229,800 |
| | Venture XV CLO, Ltd. 144A FRB Ser. 21-15A, Class AR3, (CME Term SOFR 3 Month + 1.44%), 6.098%, 7/15/32 (Cayman Islands) | | 1,150,000 | 1,151,370 |
| | Voya CLO, Ltd. 144A FRB Ser. 24-4A, Class A1, (CME Term SOFR 3 Month + 1.35%), 6.534%, 7/20/37 (Cayman Islands) | | 1,850,000 | 1,853,154 |
| | Wind River CLO, Ltd. 144A FRB Ser. 21-4A, Class A, (CME Term SOFR 3 Month + 1.43%), 6.049%, 1/20/35 (Cayman Islands) | | 1,200,000 | 1,201,406 |
| | Wise CLO, Ltd. 144A FRB Ser. 23-2A, Class A, (CME Term SOFR 3 Month + 1.80%), 6.456%, 1/15/37 (Jersey) | | 1,500,000 | 1,512,460 |
| | Wise CLO, Ltd. 144A FRB Ser. 24-2A, Class A, (CME Term SOFR 3 Month + 1.46%), 6.76%, 7/15/37 (Cayman Islands) | | 750,000 | 753,570 |
| | Zais CLO 16, Ltd. 144A FRB Ser. 21-16A, Class A1R, (CME Term SOFR 3 Month + 1.68%), 6.299%, 10/20/34 | | 1,600,000 | 1,605,348 |
| | Total collateralized loan obligations (cost $75,623,647) | $75,993,938 |
| | FOREIGN GOVERNMENT AND AGENCY BONDS AND NOTES (1.2%)* | Principal amount | Value |
| | Benin (Republic of) sr. unsec. notes Ser. REGS, 4.875%, 1/19/32 (Benin) | EUR | 350,000 | $340,648 |
| | Brazil (Federal Republic of) sr. unsec. unsub. bonds 5.00%, 1/27/45 (Brazil) | | $700,000 | 552,763 |
| | Brazil (Federal Republic of) sr. unsec. unsub. notes 3.875%, 6/12/30 (Brazil) | | 288,000 | 262,748 |
| | Chile (Republic of) sr. unsec. unsub. bonds 4.85%, 1/22/29 (Chile) | | 740,000 | 742,389 |
| | Colombia (Republic of) sr. unsec. notes 3.875%, 4/25/27 (Colombia) | | 200,000 | 192,020 |
| | Colombia (Republic of) sr. unsec. unsub. notes 7.50%, 2/2/34 (Colombia) | | 560,000 | 555,621 |
| | Colombia (Republic of) sr. unsec. unsub. notes 3.125%, 4/15/31 (Colombia) | | 200,000 | 159,932 |
| | Cote d’lvoire (Republic of) sr. unsec. unsub. notes Ser. REGS, 6.375%, 3/3/28 (Cote d’lvoire) | | 780,000 | 775,554 |
| | Dominican (Republic of) sr. unsec. bonds Ser. REGS, 4.875%, 9/23/32 (Dominican Republic) | | 640,000 | 586,664 |
| | Dominican (Republic of) sr. unsec. unsub. notes Ser. REGS, 6.00%, 7/19/28 (Dominican Republic) | | 700,000 | 704,485 |
| | Guatemala (Republic of) sr. unsec. unsub. bonds Ser. REGS, 6.60%, 6/13/36 (Guatemala) | | 480,000 | 488,820 |
| | Guatemala (Republic of) 144A sr. unsec. notes 7.05%, 10/4/32 (Guatemala) | | 320,000 | 337,640 |
| | Indonesia (Republic of) sr. unsec. unsub. bonds 2.85%, 2/14/30 (Indonesia) | | 600,000 | 546,171 |
| | Indonesia (Republic of) sr. unsec. unsub. bonds Ser. REGS, 4.35%, 1/8/27 (Indonesia) | | 1,800,000 | 1,793,529 |
| | Panama (Republic of) sr. unsec. unsub. bonds 7.50%, 3/1/31 (Panama) | | 760,000 | 800,272 |
| | Paraguay (Republic of) 144A sr. unsec. bonds 3.849%, 6/28/33 (Paraguay) | | 690,000 | 612,548 |
| | Poland (Republic of) company guaranty sr. unsec. unsub. notes Ser. REGS, 5.375%, 5/22/33 (Poland) | | 400,000 | 398,039 |
| | Romania (Government of) sr. unsec. notes Ser. REGS, 3.00%, 2/14/31 (Romania) | | 420,000 | 356,154 |
| | Romania (Government of) sr. unsec. unsub. notes 7.125%, 1/17/33 (Romania) | | 370,000 | 392,594 |
| | Romania (Government of) 144A sr. unsec. notes 6.375%, 1/30/34 (Romania) | | 110,000 | 110,301 |
| | South Africa (Republic of) sr. unsec. bonds 5.00%, 10/12/46 (South Africa) | | 300,000 | 218,894 |
| | South Africa (Republic of) sr. unsec. unsub. notes 4.85%, 9/30/29 (South Africa) | | 330,000 | 311,909 |
| | South Africa (Republic of) sr. unsec. unsub. notes 4.85%, 9/27/27 (South Africa) | | 200,000 | 196,134 |
| | United Mexican States sr. unsec. unsub. bonds 2.659%, 5/24/31 (Mexico) | | 1,770,000 | 1,472,120 |
| | Uruguay (Oriental Republic of) sr. unsec. unsub. bonds 7.875%, 1/15/33 (Uruguay) | | 650,000 | 773,403 |
| | Total foreign government and agency bonds and notes (cost $13,811,002) | $13,681,352 |
| | SENIOR LOANS (0.9%)*c | Principal amount | Value |
| | Axalta Coating Systems US Holdings, Inc. bank term loan FRN Ser. B6, (CME Term SOFR 1 Month + 2.00%), 6.604%, 12/20/29 | | $17,021 | $17,092 |
| | Caesars Entertainment, Inc. bank term loan FRN Ser. B, (CME Term SOFR 1 Month + 2.75%), 7.435%, 1/24/31 | | 1,080,000 | 1,082,279 |
| | DIRECTV Financing, LLC bank term loan FRN Ser. B, (CME Term SOFR 1 Month + 5.25%), 10.097%, 8/2/29 | | 35,547 | 34,647 |
| | Genesee & Wyoming, Inc. bank term loan FRN Class B, (CME Term SOFR 1 Month + 2.00%), 6.604%, 4/5/31 | | 1,080,000 | 1,078,385 |
| | Gray Television, Inc. bank term loan FRN Ser. D, (CME Term SOFR 1 Month + 3.00%), 7.786%, 10/27/28 | | 103,401 | 97,570 |
| | Hunter Douglas, Inc. bank term loan FRN Ser. B, (CME Term SOFR 3 Month + 3.50%), 8.571%, 2/25/29 | | 1,070,000 | 1,068,267 |
| | Nouryon USA, LLC bank term loan FRN Class B, (CME Term SOFR 1 Month + 3.50%), 7.784%, 4/3/28 | | 103,952 | 104,504 |
| | Penn Entertainment, Inc. bank term loan FRN (CME Term SOFR 1 Month + 2.75%), 7.535%, 5/3/29 | | 123,422 | 123,733 |
| | PetSmart, LLC bank term loan FRN Ser. B, (CME Term SOFR 1 Month + 3.75%), 8.535%, 1/29/28 | | 1,080,000 | 1,075,275 |
| | Proofpoint, Inc. bank term loan FRN Class B, (CME Term SOFR 1 Month + 3.00%), 7.685%, 8/31/28 | | 103,680 | 103,866 |
| | TAMKO Building Products, LLC bank term loan FRN Ser. B, (CME Term SOFR 1 Month + 1.75%), 9.75%, 9/20/30 | | 350,000 | 350,875 |
| | TransDigm, Inc. bank term loan FRN Ser. L, (CME Term SOFR 1 Month + 2.50%), 7.32%, 1/5/32 | | 1,080,000 | 1,081,685 |
| | Treasure Holdco, Inc. bank term loan FRN Ser. B, (CME Term SOFR 1 Month + 4.25%), 8.786%, 10/10/31 | | 1,085,000 | 1,076,526 |
| | UKG, Inc. bank term loan FRN Ser. B, (CME Term SOFR 1 Month + 3.25%), 7.617%, 1/31/31 | | 1,055,000 | 1,057,390 |
| | USI, Inc./NY bank term loan FRN Ser. B, (CME Term SOFR 1 Month + 2.75%), 8.078%, 11/23/29 | | 1,070,000 | 1,070,936 |
| | Zegona Finance, LLC bank term loan FRN (CME Term SOFR 1 Month + 4.25%), 9.354%, 7/16/29 | | 1,080,000 | 1,081,350 |
| | Total senior loans (cost $10,509,505) | $10,504,380 |
| | MUNICIPAL BONDS AND NOTES (0.2%)* | Principal amount | Value |
| | CA State G.O. Bonds, (Build America Bonds), 7.50%, 4/1/34 | | $770,000 | $899,810 |
| | North TX, Tollway Auth. Rev. Bonds, (Build America Bonds), 6.718%, 1/1/49 | | 675,000 | 768,971 |
| | OH State U. Rev. Bonds, (Build America Bonds), 4.91%, 6/1/40 | | 845,000 | 799,772 |
| | Total municipal bonds and notes (cost $2,293,318) | $2,468,553 |
| | SHORT-TERM INVESTMENTS (13.3%)* | Principal amount/shares | Value |
| | Putnam Short Term Investment Fund Class P 4.95% L | Shares 112,870,623 | $112,870,623 |
| | State Street Institutional U.S. Government Money Market Fund, Premier Class 4.82% P | Shares 15,735,000 | 15,735,000 |
| | U.S. Treasury Bills 4.624%, 1/16/25 # Δ Ф | $19,600,000 | 19,415,786 |
| | U.S. Treasury Bills 5.155%, 11/19/24 Δ Ф | 800,000 | 798,153 |
| | U.S. Treasury Bills 4.711%, 12/17/24 Δ Ф | 2,300,000 | 2,286,575 |
| | Total short-term investments (cost $151,103,506) | $151,106,137 |
| | TOTAL INVESTMENTS |
| | Total investments (cost $1,557,250,616) | $1,523,050,927 |
| | Key to holding’s currency abbreviations |
| | EUR | Euro |
| | USD/$ | United States Dollar |
| | Key to holding’s abbreviations |
| | CME | Chicago Mercantile Exchange |
| | DAC | Designated Activity Company |
| | FRB | Floating Rate Bonds: The rate shown is the current interest rate at the close of the reporting period. Rates may be subject to a cap or floor. For certain securities, the rate may represent a fixed rate currently in place at the close of the reporting period. |
| | FRN | Floating Rate Notes: The rate shown is the current interest rate or yield at the close of the reporting period. Rates may be subject to a cap or floor. For certain securities, the rate may represent a fixed rate currently in place at the close of the reporting period. |
| | G.O. Bonds | General Obligation Bonds |
| | ICE | Intercontinental Exchange |
| | IFB | Inverse Floating Rate Bonds, which are securities that pay interest rates that vary inversely to changes in the market interest rates. As interest rates rise, inverse floaters produce less current income. The rate shown is the current interest rate at the close of the reporting period. Rates may be subject to a cap or floor. |
| | IO | Interest Only |
| | JSC | Joint Stock Company |
| | LIBOR | London Interbank Offered Rate |
| | PO | Principal Only |
| | REGS | Securities sold under Regulation S may not be offered, sold or delivered within the United States except pursuant to an exemption from, or in a transaction not subject to, the registration requirements of the Securities Act of 1933. |
| | REMICs | Real Estate Mortgage Investment Conduits |
| | SOFR | Secured Overnight Financing Rate |
| | TBA | To Be Announced Commitments |
| | Notes to the fund’s portfolio |
| | Unless noted otherwise, the notes to the fund’s portfolio are for the close of the fund’s reporting period, which ran from November 1, 2023 through October 31, 2024 (the reporting period). Within the following notes to the portfolio, references to “Franklin Advisers” represent Franklin Advisers, Inc., the fund’s investment manager, a direct wholly-owned subsidiary of Franklin Resources, Inc., and references to “ASC 820” represent Accounting Standards Codification 820 Fair Value Measurements and Disclosures. |
| * | Percentages indicated are based on net assets of $1,133,540,937. |
| † | This security is non-income-producing. |
| †† | The interest rate and date shown parenthetically represent the new interest rate to be paid and the date the fund will begin accruing interest at this rate. |
| ‡‡ | Income may be received in cash or additional securities at the discretion of the issuer. The rate shown in parenthesis is the rate paid in kind, if applicable. |
| # | This security, in part or in entirety, was pledged and segregated with the broker to cover margin requirements for futures contracts at the close of the reporting period. Collateral at period end totaled $9,928,748 and is included in Investments in securities on the Statement of assets and liabilities (Notes 1 and 9). |
| Δ | This security, in part or in entirety, was pledged and segregated with the custodian for collateral on certain derivative contracts at the close of the reporting period. Collateral at period end totaled $815,525 and is included in Investments in securities on the Statement of assets and liabilities (Notes 1 and 9). |
| Ф | This security, in part or in entirety, was pledged and segregated with the custodian for collateral on certain TBA commitments at the close of the reporting period. Collateral at period end totaled $7,722,275 and is included in Investments in securities on the Statement of assets and liabilities (Notes 1 and 9). |
| c | Senior loans are exempt from registration under the Securities Act of 1933, as amended, but contain certain restrictions on resale and cannot be sold publicly. These loans pay interest at rates which adjust periodically. The interest rates shown for senior loans are the current interest rates at the close of the reporting period. Senior loans are also subject to mandatory and/or optional prepayment which cannot be predicted. As a result, the remaining maturity may be substantially less than the stated maturity shown (Notes 1 and 7). |
| L | Affiliated company (Note 5). The rate quoted in the security description is the annualized 7-day yield of the fund at the close of the reporting period. |
| P | This security was pledged, or purchased with cash that was pledged, to the fund for collateral on certain derivative contracts. The rate quoted in the security description is the annualized 7-day yield of the fund at the close of the reporting period. |
| R | Real Estate Investment Trust. |
| W | The rate shown represents the weighted average coupon associated with the underlying mortgage pools. Rates may be subject to a cap or floor. |
| | Debt obligations are considered secured unless otherwise indicated. |
| | 144A after the name of an issuer represents securities exempt from registration under Rule 144A of the Securities Act of 1933, as amended. These securities may be resold in transactions exempt from registration, normally to qualified institutional buyers. |
| | See Note 1 to the financial statements regarding TBA commitments. |
| | The dates shown on debt obligations are the original maturity dates. |
| | FORWARD CURRENCY CONTRACTS at 10/31/24 (aggregate face value $315,574) |
| | Counterparty | Currency | Contract type* | Delivery date | Value | Aggregate face value | Unrealized appreciation/ (depreciation) |
| | Morgan Stanley & Co. International PLC |
| | | Euro | Sell | 12/18/24 | $308,845 | $315,574 | $6,729 |
| | Unrealized appreciation | 6,729 |
| | Unrealized (depreciation) | — |
| | Total | $6,729 |
| * | The exchange currency for all contracts listed is the United States Dollar. |
| | FUTURES CONTRACTS OUTSTANDING at 10/31/24 |
| | | Number of contracts | Notional amount | Value | Expiration date | Unrealized appreciation/ (depreciation) |
| | U.S. Treasury Bond 30 yr (Long) | 234 | $27,604,688 | $27,604,687 | Dec-24 | $(1,584,929) |
| | U.S. Treasury Bond Ultra 30 yr (Long) | 694 | 87,183,750 | 87,183,750 | Dec-24 | (5,919,555) |
| | U.S. Treasury Note 2 yr (Long) | 259 | 53,339,836 | 53,339,836 | Dec-24 | (475,984) |
| | U.S. Treasury Note 5 yr (Long) | 1,535 | 164,604,766 | 164,604,766 | Dec-24 | (3,930,920) |
| | U.S. Treasury Note 10 yr (Long) | 440 | 48,606,250 | 48,606,251 | Dec-24 | (1,640,501) |
| | U.S. Treasury Note Ultra 10 yr (Long) | 566 | 64,382,500 | 64,382,500 | Dec-24 | (2,559,078) |
| | Unrealized appreciation | | | | | — |
| | Unrealized (depreciation) | | | | | (16,110,967) |
| | Total | $(16,110,967) |
| | FORWARD PREMIUM SWAP OPTION CONTRACTS OUTSTANDING at 10/31/24 |
| | Counterparty Fixed right or obligation % to receive or (pay)/Floating rate index/ Maturity date | Expiration date/strike | | Notional/ Contract amount | Premium receivable/ (payable) | Unrealized appreciation/ (depreciation) |
| | Bank of America N.A. |
| | (4.225)/US SOFR/Nov-36 (Purchased) | Nov-26/4.225 | | $17,129,000 | $(877,005) | $(275,109) |
| | 3.725/US SOFR/Nov-36 (Purchased) | Nov-26/3.725 | | 17,129,000 | (837,608) | (23,775) |
| | Barclays Bank PLC |
| | 3.00/US SOFR/Dec-48 (Purchased) | Dec-38/3.00 | | 99,931,700 | (7,963,565) | 196,965 |
| | 3.10/US SOFR/Dec-42 (Purchased) | Dec-32/3.10 | | 53,869,800 | (3,559,181) | 337,764 |
| | (1.945)/US SOFR/Jun-51 (Purchased) | Jun-31/1.945 | | 18,865,000 | (8,803,194) | 902,351 |
| | 1.945/US SOFR/Jun-51 (Purchased) | Jun-31/1.945 | | 18,865,000 | (2,238,171) | (323,723) |
| | Morgan Stanley & Co. International PLC |
| | 2.48/US SOFR/Feb-59 (Purchased) | Feb-29/2.48 | | 37,620,500 | (2,334,766) | (228,357) |
| | Unrealized appreciation | 1,437,080 |
| | Unrealized (depreciation) | (850,964) |
| | Total | $586,116 |
| | TBA SALE COMMITMENTS OUTSTANDING at 10/31/24 (proceeds receivable $159,719,258) |
| | Agency | Principal amount | Settlement date | Value |
| | Government National Mortgage Association, 6.00%, 11/1/54 | $2,000,000 | 11/20/24 | $2,014,852 |
| | Government National Mortgage Association, 5.50%, 11/1/54 | 3,000,000 | 11/20/24 | 2,983,704 |
| | Government National Mortgage Association, 5.00%, 11/1/54 | 1,000,000 | 11/20/24 | 976,867 |
| | Government National Mortgage Association, 4.00%, 11/1/54 | 2,000,000 | 11/20/24 | 1,862,031 |
| | Government National Mortgage Association, 3.50%, 11/1/54 | 2,000,000 | 11/20/24 | 1,807,581 |
| | Uniform Mortgage-Backed Securities, 6.50%, 11/1/54 | 15,000,000 | 11/14/24 | 15,311,443 |
| | Uniform Mortgage-Backed Securities, 6.00%, 11/1/54 | 35,000,000 | 11/14/24 | 35,228,585 |
| | TBA SALE COMMITMENTS OUTSTANDING at 10/31/24 (proceeds receivable $159,719,258) cont. |
| | Agency | Principal amount | Settlement date | Value |
| | Uniform Mortgage-Backed Securities, 5.50%, 11/1/54 | $20,000,000 | 11/14/24 | $19,813,106 |
| | Uniform Mortgage-Backed Securities, 5.00%, 11/1/54 | 21,000,000 | 11/14/24 | 20,407,526 |
| | Uniform Mortgage-Backed Securities, 4.50%, 11/1/54 | 31,000,000 | 11/14/24 | 29,433,302 |
| | Uniform Mortgage-Backed Securities, 4.00%, 11/1/54 | 29,000,000 | 11/14/24 | 26,795,645 |
| | Total | $156,634,642 |
| | OTC INTEREST RATE SWAP CONTRACTS OUTSTANDING at 10/31/24 |
| | Swap counterparty/ Notional amount | Value | Upfront premium received (paid) | Termination date | Payments made by fund | Payments received by fund | Unrealized appreciation/ (depreciation) |
| | Morgan Stanley & Co. International PLC |
| | | $700,000,000 | $10,852,800 | $16,280,000 | 9/21/27 | 3.30% — Annually | US SOFR — Annually | $28,330,661 |
| | Upfront premium received | 16,280,000 | | Unrealized appreciation | 28,330,661 |
| | Upfront premium (paid) | — | | Unrealized (depreciation) | — |
| | Total | $16,280,000 | | Total | $28,330,661 |
| | |
| | CENTRALLY CLEARED INTEREST RATE SWAP CONTRACTS OUTSTANDING at 10/31/24 |
| | Notional amount | Value | Upfront premium received (paid) | Termination date | Payments made by fund | Payments received by fund | Unrealized appreciation/ (depreciation) |
| | | $9,987,000 | $8,489 | $(132) | 7/12/33 | US SOFR — Annually | 3.785% — Annually | $(35,667) |
| | | 62,628,700 | 115,613E | (1,221) | 11/27/39 | 3.869% — Annually | US SOFR — Annually | (116,834) |
| | | 13,317,000 | 12,704E | (260) | 12/6/42 | US SOFR — Annually | 3.887% — Annually | 12,445 |
| | | 6,523,000 | 7,169E | (98) | 3/18/36 | 3.757% — Annually | US SOFR — Annually | (7,267) |
| | | 6,930,700 | 22,254E | (236) | 2/20/59 | 3.485% — Annually | US SOFR — Annually | 22,019 |
| | | 8,250,900 | 120,290E | (116) | 4/17/35 | 3.919% — Annually | US SOFR — Annually | (120,406) |
| | | 14,062,400 | 238,245E | (198) | 4/17/35 | 3.948% — Annually | US SOFR — Annually | (238,443) |
| | | 4,275,300 | 42,415E | (64) | 3/31/38 | US SOFR — Annually | 3.93% — Annually | 42,351 |
| | | 1,739,500 | 12,846E | (59) | 3/14/59 | US SOFR — Annually | 3.456% — Annually | (12,905) |
| | | 7,035,000 | 73,825 | (59,041) | 9/18/26 | US SOFR — Annually | 4.55% — Annually | 13,862 |
| | | 156,827,000 | 1,645,743 | 1,735,033 | 9/18/26 | 4.55% — Annually | US SOFR — Annually | 109,868 |
| | | 102,668,000 | 2,554,585 | (1,976,350) | 9/18/29 | US SOFR — Annually | 4.35% — Annually | 539,668 |
| | | 25,726,000 | 640,114 | 558,711 | 9/18/29 | 4.35% — Annually | US SOFR — Annually | (71,739) |
| | | 63,892,000 | 1,962,698 | (2,094,787) | 9/18/34 | US SOFR — Annually | 4.15% — Annually | (171,707) |
| | | 12,059,800 | 370,465 | 560,058 | 9/18/34 | 4.15% — Annually | US SOFR — Annually | 197,072 |
| | | 2,842,000 | 154,076 | (348,437) | 9/18/54 | US SOFR — Annually | 3.95% — Annually | (196,818) |
| | | 31,965,000 | 1,732,951 | 3,799,502 | 9/18/54 | 3.95% — Annually | US SOFR — Annually | 2,094,187 |
| | | 255,110,000 | 356,644E | 3,260,572 | 12/18/26 | 3.80% — Annually | US SOFR — Annually | 3,617,216 |
| | | 500,165,000 | 699,231E | (5,117,360) | 12/18/26 | US SOFR — Annually | 3.80% — Annually | (5,816,590) |
| | | 165,483,000 | 1,149,279E | (4,329,979) | 12/18/29 | US SOFR — Annually | 3.60% — Annually | (5,479,258) |
| | | 159,102,000 | 4,740,921E | 3,400,492 | 12/18/34 | 3.40% — Annually | US SOFR — Annually | 8,141,413 |
| | | 688,000 | 20,501E | 18,636 | 12/18/34 | US SOFR — Annually | 3.40% — Annually | (1,866) |
| | | 14,040,000 | 1,091,399E | (700,942) | 12/18/54 | 3.20% — Annually | US SOFR — Annually | 390,460 |
| | | 17,469,000 | 1,357,953E | (265,877) | 12/18/54 | US SOFR — Annually | 3.20% — Annually | (1,623,830) |
| | | 30,519,000 | 13,642E | 385,672 | 12/18/26 | 3.85% — Annually | US SOFR — Annually | 399,314 |
| | | 31,293,000 | 146,827E | (434,200) | 12/18/29 | US SOFR — Annually | 3.65% — Annually | (581,026) |
| | | 23,248,000 | 596,823E | (211,310) | 12/18/34 | 3.45% — Annually | US SOFR — Annually | 385,513 |
| | | 1,911,000 | 49,059E | 20,647 | 12/18/34 | US SOFR — Annually | 3.45% — Annually | (28,413) |
| | | 4,587,000 | 315,553E | 221,793 | 12/18/54 | US SOFR — Annually | 3.25% — Annually | (93,768) |
| | Total | $(1,579,551) | $1,368,851 |
| E | Extended effective date. |
| | OTC TOTAL RETURN SWAP CONTRACTS OUTSTANDING at 10/31/24 |
| | Swap counterparty/ Notional amount | Value | Upfront premium received (paid) | Termination date | Payments received (paid) by fund | Total return received by or paid by fund | Unrealized appreciation/ (depreciation) |
| | Morgan Stanley & Co. International PLC |
| | | $8,936,746 | $8,576,841 | $— | 9/29/25 | (0.165%) — Annually | Ephesus Funding DAC, 3.80%, Series 2020–01, 9/22/2025 — Annually | $(322,202) |
| | Upfront premium received | — | Unrealized appreciation | — |
| | Upfront premium (paid) | — | Unrealized (depreciation) | (322,202) |
| | Total | $— | Total | $(322,202) |
| | OTC CREDIT DEFAULT CONTRACTS OUTSTANDING — PROTECTION SOLD at 10/31/24 |
| | Swap counterparty/ Referenced debt* | Rating*** | Upfront premium received (paid)** | | Notional amount | Value | Termination date | Payments received by fund | Unrealized appreciation/ (depreciation) |
| | Bank of America N.A. |
| | CMBX NA BBB–.6 Index | CCC/P | $13,534 | | $87,365 | $12,030 | 5/11/63 | 300 bp — Monthly | $1,555 |
| | CMBX NA BBB–.6 Index | CCC/P | 26,395 | | 193,261 | 26,612 | 5/11/63 | 300 bp — Monthly | (104) |
| | CMBX NA BBB–.6 Index | CCC/P | 54,079 | | 386,523 | 53,224 | 5/11/63 | 300 bp — Monthly | 1,081 |
| | CMBX NA BBB–.6 Index | CCC/P | 51,528 | | 398,877 | 54,925 | 5/11/63 | 300 bp — Monthly | (3,165) |
| | Citigroup Global Markets, Inc. |
| | CMBX NA BB.13 Index | B+/P | 1,372,459 | | 3,210,000 | 1,108,092 | 12/16/72 | 500 bp — Monthly | 267,488 |
| | CMBX NA BB.6 Index | CCC-/P | 605,950 | | 1,791,676 | 470,853 | 5/11/63 | 500 bp — Monthly | 136,840 |
| | CMBX NA BBB–.12 Index | BB+/P | 90,530 | | 319,000 | 62,939 | 8/17/61 | 300 bp — Monthly | 27,777 |
| | JPMorgan Securities LLC |
| | CMBX NA BB.8 Index | CCC/P | 684,367 | | 1,856,824 | 714,320 | 10/17/57 | 500 bp — Monthly | (28,148) |
| | Merrill Lynch International |
| | CMBX NA A.13 Index | A-/P | 127,730 | | 980,000 | 78,596 | 12/16/72 | 200 bp — Monthly | 49,515 |
| | CMBX NA A.13 Index | A-/P | 130,453 | | 980,000 | 78,596 | 12/16/72 | 200 bp — Monthly | 52,238 |
| | Morgan Stanley & Co. International PLC |
| | CMBX NA A.13 Index | A-/P | 118,473 | | 939,000 | 75,308 | 12/16/72 | 200 bp — Monthly | 43,530 |
| | CMBX NA BB.13 Index | B+/P | 761,311 | | 1,688,000 | 582,698 | 12/16/72 | 500 bp — Monthly | 180,254 |
| | CMBX NA BB.8 Index | CCC/P | 243,767 | | 518,379 | 199,420 | 10/17/57 | 500 bp — Monthly | 44,851 |
| | CMBX NA BBB–.13 Index | BB+/P | 36,898 | | 116,000 | 26,494 | 12/16/72 | 300 bp — Monthly | 10,471 |
| | Upfront premium received | 4,317,474 | Unrealized appreciation | 815,600 |
| | Upfront premium (paid) | — | Unrealized (depreciation) | (31,417) |
| | Total | $4,317,474 | Total | $784,183 |
| * | Payments related to the referenced debt are made upon a credit default event. |
| ** | Upfront premium is based on the difference between the original spread on issue and the market spread on day of execution. |
| *** | Ratings for an underlying index represent the average of the ratings of all the securities included in that index. The Moody’s, Standard & Poor’s or Fitch ratings are believed to be the most recent ratings available at October 31, 2024. Securities rated by Putnam are indicated by “/P.” The Putnam rating categories are comparable to the Standard & Poor’s classifications. |
| | OTC CREDIT DEFAULT CONTRACTS OUTSTANDING — PROTECTION PURCHASED at 10/31/24 |
| | Swap counterparty/ Referenced debt* | | Upfront premium received (paid)** | | Notional amount | Value | Termination date | Payments (paid) by fund | Unrealized appreciation/ (depreciation) |
| | Citigroup Global Markets, Inc. |
| | CMBX NA BB.10 Index | | $(2,510,135) | | $5,409,000 | $2,199,840 | 11/17/59 | (500 bp) — Monthly | $(315,553) |
| | CMBX NA BB.10 Index | | (374,392) | | 929,000 | 377,824 | 11/17/59 | (500 bp) — Monthly | 2,529 |
| | CMBX NA BB.10 Index | | (373,183) | | 926,000 | 376,604 | 11/17/59 | (500 bp) — Monthly | 2,521 |
| | CMBX NA BB.10 Index | | (196,667) | | 488,000 | 198,470 | 11/17/59 | (500 bp) — Monthly | 1,328 |
| | CMBX NA BB.6 Index | | (84,659) | | 329,545 | 86,604 | 5/11/63 | (500 bp) — Monthly | 1,625 |
| | CMBX NA BB.8 Index | | (887,643) | | 1,914,732 | 736,598 | 10/17/57 | (500 bp) — Monthly | (152,907) |
| | CMBX NA BBB–.10 Index | | (904,696) | | 3,010,000 | 541,499 | 11/17/59 | (300 bp) — Monthly | (364,953) |
| | CMBX NA BBB–.12 Index | | (82,867) | | 292,000 | 57,612 | 8/17/61 | (300 bp) — Monthly | (25,426) |
| | |
| | OTC CREDIT DEFAULT CONTRACTS OUTSTANDING — PROTECTION PURCHASED at 10/31/24 cont. |
| | Swap counterparty/ Referenced debt* | | Upfront premium received (paid)** | | Notional amount | Value | Termination date | Payments (paid) by fund | Unrealized appreciation/ (depreciation) |
| | Goldman Sachs International |
| | CMBX NA BB.10 Index | | $(653,058) | | $1,450,000 | $589,715 | 11/17/59 | (500 bp) — Monthly | $(64,753) |
| | CMBX NA BB.6 Index | | (144,263) | | 427,226 | 112,275 | 5/11/63 | (500 bp) — Monthly | (32,403) |
| | JPMorgan Securities LLC |
| | CMBX NA BB.11 Index | | (490,603) | | 489,948 | 128,758 | 5/11/63 | (500 bp) — Monthly | (362,322) |
| | CMBX NA BBB–.12 Index | | (38,327) | | 319,000 | 62,939 | 8/17/61 | (300 bp) — Monthly | 24,426 |
| | CMBX NA BBB–.6 Index | | (538,787) | | 1,066,026 | 146,792 | 5/11/63 | (300 bp) — Monthly | (392,617) |
| | Merrill Lynch International |
| | CMBX NA BB.10 Index | | (50,925) | | 895,000 | 363,997 | 11/17/59 | (500 bp) — Monthly | 312,201 |
| | Morgan Stanley & Co. International PLC |
| | CMBX NA BB.6 Index | | (47,174) | | 136,239 | 35,804 | 5/11/63 | (500 bp) — Monthly | (11,502) |
| | CMBX NA BBB–.10 Index | | (1,898,461) | | 5,871,000 | 1,056,193 | 11/17/59 | (300 bp) — Monthly | (845,693) |
| | CMBX NA BBB–.12 Index | | (325,089) | | 1,022,000 | 201,641 | 8/17/61 | (300 bp) — Monthly | (124,045) |
| | Upfront premium received | — | Unrealized appreciation | 344,630 |
| | Upfront premium (paid) | (9,600,929) | Unrealized (depreciation) | (2,692,174) |
| | Total | $(9,600,929) | Total | $(2,347,544) |
| * | Payments related to the referenced debt are made upon a credit default event. |
| ** | Upfront premium is based on the difference between the original spread on issue and the market spread on day of execution. |
| | ASC 820 establishes a three-level hierarchy for disclosure of fair value measurements. The valuation hierarchy is based upon the transparency of inputs to the valuation of the fund’s investments. The three levels are defined as follows: |
| | Level 1: Valuations based on quoted prices for identical securities in active markets. |
| | Level 2: Valuations based on quoted prices in markets that are not active or for which all significant inputs are observable, either directly or indirectly. |
| | Level 3: Valuations based on inputs that are unobservable and significant to the fair value measurement. |
| | The following is a summary of the inputs used to value the fund’s net assets as of the close of the reporting period: |
| | | Valuation inputs |
| | Investments in securities: | Level 1 | Level 2 | Level 3 |
| | Asset-backed securities | $— | $79,734,980 | $— |
| | Collateralized loan obligations | — | 75,993,938 | — |
| | Corporate bonds and notes | — | 414,195,324 | — |
| | Foreign government and agency bonds and notes | — | 13,681,352 | — |
| | Mortgage-backed securities | — | 240,649,001 | — |
| | Municipal bonds and notes | — | 2,468,553 | — |
| | Senior loans | — | 10,504,380 | — |
| | U.S. government and agency mortgage obligations | — | 534,717,262 | — |
| | Short-term investments | 15,735,000 | 135,371,137 | — |
| | Totals by level | $15,735,000 | $1,507,315,927 | $— |
| | | Valuation inputs |
| | Other financial instruments: | Level 1 | Level 2 | Level 3 |
| | Forward currency contracts | $— | $6,729 | $— |
| | Futures contracts | (16,110,967) | — | — |
| | Forward premium swap option contracts | — | 586,116 | — |
| | TBA sale commitments | — | (156,634,642) | — |
| | Interest rate swap contracts | — | 14,999,063 | — |
| | Total return swap contracts | — | (322,202) | — |
| | Credit default contracts | — | 3,720,094 | — |
| | Totals by level | $(16,110,967) | $(137,644,842) | $— |
The accompanying notes are an integral part of these financial statements.
Financial Statements
Statement of assets and liabilities
10/31/24
| ASSETS | |
| Investment in securities, at value (Notes 1 and 9): | |
| Unaffiliated issuers (identified cost $1,444,379,993) | $1,410,180,304 |
| Affiliated issuers (identified cost $112,870,623) (Note 5) | 112,870,623 |
| Cash | 818,378 |
| Interest and other receivables | 9,595,848 |
| Receivable for shares of the fund sold | 706,140 |
| Receivable for investments sold | 230,441 |
| Receivable for sales of delayed delivery securities (Note 1) | 1,891,788 |
| Receivable for sales of TBA securities (Note 1) | 103,490,242 |
| Receivable for variation margin on futures contracts (Note 1) | 43,375 |
| Receivable for variation margin on centrally cleared swap contracts (Note 1) | 655,270 |
| Unrealized appreciation on forward premium swap option contracts (Note 1) | 1,437,080 |
| Unrealized appreciation on forward currency contracts (Note 1) | 6,729 |
| Unrealized appreciation on OTC swap contracts (Note 1) | 29,490,891 |
| Premium paid on OTC swap contracts (Note 1) | 9,600,929 |
| Deposits with broker (Note 1) | 6,545,091 |
| Receivable from broker (Note 1) | 230,093 |
| Prepaid assets | 50,777 |
| Total assets | 1,687,843,999 |
| | |
| LIABILITIES | |
| Payable for investments purchased | 11,261,262 |
| Payable for purchases of TBA securities (Note 1) | 342,189,946 |
| Payable for shares of the fund repurchased | 1,317,899 |
| Payable for compensation of Manager (Note 2) | 38,248 |
| Payable for custodian fees (Note 2) | 51,300 |
| Payable for investor servicing fees (Note 2) | 431,391 |
| Payable for Trustee compensation and expenses (Note 2) | 347,063 |
| Payable for administrative services (Note 2) | 3,779 |
| Payable for distribution fees (Note 2) | 126,111 |
| Payable for variation margin on futures contracts (Note 1) | 465,253 |
| Payable for variation margin on centrally cleared swap contracts (Note 1) | 911,178 |
| Unrealized depreciation on forward premium swap option contracts (Note 1) | 850,964 |
| Unrealized depreciation on OTC swap contracts (Note 1) | 3,045,793 |
| Premium received on OTC swap contracts (Note 1) | 20,597,474 |
| TBA sale commitments, at value (proceeds receivable $159,719,258) (Note 1) | 156,634,642 |
| Collateral on certain derivative contracts, at value (Notes 1 and 9) | 15,735,000 |
| Other accrued expenses | 295,759 |
| Total liabilities | 554,303,062 |
| Net assets | $1,133,540,937 |
| | |
| Represented by | |
| Paid-in capital (Unlimited shares authorized) (Notes 1 and 4) | $1,908,900,064 |
| Total distributable earnings (Note 1) | (775,359,127) |
| Total — Representing net assets applicable to capital shares outstanding | $1,133,540,937 |
| (Continued on next page) |
Statement of assets and liabilities cont.
| | |
| COMPUTATION OF NET ASSET VALUE AND OFFERING PRICE | |
| Net asset value and redemption price per class A share ($407,325,298 divided by 77,533,565 shares) | $5.25 |
| Offering price per class A share (100/96.00 of $5.25)* | $5.47 |
| Net asset value and offering price per class C share ($26,518,085 divided by 5,112,953 shares)** | $5.19 |
| Net asset value and redemption price per class M share ($32,681,602 divided by 6,492,900 shares) | $5.03 |
| Offering price per class M share (100/96.75 of $5.03)*** | $5.20 |
| Net asset value, offering price and redemption price per class R share ($4,714,634 divided by 910,428 shares) | $5.18 |
| Net asset value, offering price and redemption price per class R5 share ($3,326,758 divided by 623,347 shares) | $5.34 |
| Net asset value, offering price and redemption price per class R6 share ($122,354,278 divided by 22,763,279 shares) | $5.38 |
| Net asset value, offering price and redemption price per class Y share ($536,620,282 divided by 99,581,641 shares) | $5.39 |
| * | On single retail sales of less than $100,000. On sales of $100,000 or more the offering price is reduced. |
| ** | Redemption price per share is equal to net asset value less any applicable contingent deferred sales charge. |
| *** | On single retail sales of less than $50,000. On sales of $50,000 or more the offering price is reduced. |
The accompanying notes are an integral part of these financial statements.
Statement of operations
Year ended 10/31/24
| Investment income | |
| Interest (including interest income of $5,241,496 from investments in affiliated issuers) (Note 5) | $62,949,387 |
| Total investment income | 62,949,387 |
| | |
| EXPENSES | |
| Compensation of Manager (Note 2) | 4,665,181 |
| Investor servicing fees (Note 2) | 1,808,963 |
| Custodian fees (Note 2) | 104,276 |
| Trustee compensation and expenses (Note 2) | 58,426 |
| Distribution fees (Note 2) | 1,529,433 |
| Administrative services (Note 2) | 31,485 |
| Other | 595,160 |
| Fees waived and reimbursed by Manager (Note 2) | (1,409,852) |
| Total expenses | 7,383,072 |
| Expense reduction (Note 2) | (29,202) |
| Net expenses | 7,353,870 |
| Net investment income | 55,595,517 |
| | |
| REALIZED AND UNREALIZED GAIN (LOSS) | |
| Net realized gain (loss) on: | |
| Securities from unaffiliated issuers (Notes 1 and 3) | (15,746,393) |
| Foreign currency transactions (Note 1) | (32) |
| Forward currency contracts (Note 1) | (4,567) |
| Futures contracts (Note 1) | 6,742,919 |
| Swap contracts (Note 1) | 28,872,828 |
| Written options (Note 1) | (1,539,443) |
| Total net realized gain | 18,325,312 |
| Change in net unrealized appreciation (depreciation) on: | |
| Securities from unaffiliated issuers and TBA sale commitments | 95,059,468 |
| Assets and liabilities in foreign currencies | 452 |
| Forward currency contracts | 1,097 |
| Futures contracts | 10,329,585 |
| Swap contracts | (42,204,808) |
| Written options | 9,551,018 |
| Total change in net unrealized appreciation | 72,736,812 |
| Net gain on investments | 91,062,124 |
| Net increase in net assets resulting from operations | $146,657,641 |
The accompanying notes are an integral part of these financial statements.
Statement of changes in net assets
| | Year ended 10/31/24 | Year ended 10/31/23 |
| Decrease in net assets | | |
| Operations | | |
| Net investment income | $55,595,517 | $67,960,495 |
| Net realized gain (loss) on investments and foreign currency transactions | 18,325,312 | (124,942,925) |
| Change in net unrealized appreciation of investments and assets and liabilities in foreign currencies | 72,736,812 | 106,050,027 |
| Net increase in net assets resulting from operations | 146,657,641 | 49,067,597 |
| Distributions to shareholders (Note 1): | | |
| From ordinary income | | |
| Net investment income | | |
| Class A | (31,337,602) | (42,165,406) |
| Class B | (32,538) | (120,833) |
| Class C | (1,958,364) | (3,008,647) |
| Class M | (2,598,444) | (3,406,830) |
| Class R | (449,746) | (626,871) |
| Class R5 | (255,653) | (279,061) |
| Class R6 | (12,497,037) | (14,913,797) |
| Class Y | (44,050,132) | (68,034,875) |
| Decrease from capital share transactions (Note 4) | (176,624,558) | (623,949,901) |
| Total decrease in net assets | (123,146,433) | (707,438,624) |
| Net assets | | |
| Beginning of year | 1,256,687,370 | 1,964,125,994 |
| End of year | $1,133,540,937 | $1,256,687,370 |
Financial highlights
(For a common share outstanding throughout the period)
| INVESTMENT OPERATIONS | LESS DISTRIBUTIONS | RATIOS AND SUPPLEMENTAL DATA |
| Period ended | Net asset value, beginning of period | Net investment income (loss)a | Net realized and unrealized gain (loss) on investments | Total from investment operations | From net investment income | From net realized gain on investments | Total distributions | Net asset value, end of period | Total return at net asset value (%)b | Net assets, end of period (in thousands) | Ratio of expenses to average net assets (%)c,d | Ratio of net investment income (loss) to average net assets (%)d | Portfolio turnover (%)e |
| Class A |
| October 31, 2024 | $5.05 | .23 | .36 | .59 | (.39) | — | (.39) | $5.25 | 11.99 | $407,325 | .74 | 4.41 | 900 |
| October 31, 2023 | 5.47 | .23 | (.17) | .06 | (.48) | — | (.48) | 5.05 | .80 | 421,321 | .75 | 4.32 | 1,123 |
| October 31, 2022 | 6.88 | .19 | (1.33) | (1.14) | (.27) | — | (.27) | 5.47 | (17.05) | 489,179 | .75 | 3.06 | 865 |
| October 31, 2021 | 7.31 | .16 | (.22) | (.06) | (.14) | (.23) | (.37) | 6.88 | (.94) | 705,423 | .73 | 2.30 | 1,038 |
| October 31, 2020 | 7.25 | .16 | .17 | .33 | (.06) | (.21) | (.27) | 7.31 | 4.80 | 814,135 | .74 | 2.19 | 1,025 |
| Class C |
| October 31, 2024 | $4.99 | .19 | .37 | .56 | (.36) | — | (.36) | $5.19 | 11.32 | $26,518 | 1.49 | 3.66 | 900 |
| October 31, 2023 | 5.41 | .19 | (.17) | .02 | (.44) | — | (.44) | 4.99 | .04 | 29,291 | 1.50 | 3.60 | 1,123 |
| October 31, 2022 | 6.81 | .14 | (1.32) | (1.18) | (.22) | — | (.22) | 5.41 | (17.72) | 40,130 | 1.50 | 2.27 | 865 |
| October 31, 2021 | 7.23 | .11 | (.21) | (.10) | (.09) | (.23) | (.32) | 6.81 | (1.56) | 75,865 | 1.48 | 1.55 | 1,038 |
| October 31, 2020 | 7.18 | .10 | .17 | .27 | (.01) | (.21) | (.22) | 7.23 | 3.95 | 120,340 | 1.49 | 1.46 | 1,025 |
| Class M |
| October 31, 2024 | $4.85 | .21 | .35 | .56 | (.38) | — | (.38) | $5.03 | 11.80 | $32,682 | .99 | 4.16 | 900 |
| October 31, 2023 | 5.27 | .21 | (.16) | .05 | (.47) | — | (.47) | 4.85 | .59 | 34,081 | 1.00 | 4.06 | 1,123 |
| October 31, 2022 | 6.65 | .17 | (1.29) | (1.12) | (.26) | — | (.26) | 5.27 | (17.36) | 38,812 | 1.00 | 2.82 | 865 |
| October 31, 2021 | 7.08 | .14 | (.21) | (.07) | (.13) | (.23) | (.36) | 6.65 | (1.16) | 53,418 | .98 | 2.05 | 1,038 |
| October 31, 2020 | 7.03 | .14 | .17 | .31 | (.05) | (.21) | (.26) | 7.08 | 4.57 | 60,661 | .99 | 1.97 | 1,025 |
| Class R |
| October 31, 2024 | $4.98 | .21 | .37 | .58 | (.38) | — | (.38) | $5.18 | 11.90 | $4,715 | .99 | 4.15 | 900 |
| October 31, 2023 | 5.40 | .22 | (.17) | .05 | (.47) | — | (.47) | 4.98 | .58 | 6,266 | 1.00 | 4.09 | 1,123 |
| October 31, 2022 | 6.81 | .17 | (1.32) | (1.15) | (.26) | — | (.26) | 5.40 | (17.41) | 7,488 | 1.00 | 2.82 | 865 |
| October 31, 2021 | 7.23 | .14 | (.20) | (.06) | (.13) | (.23) | (.36) | 6.81 | (1.03) | 11,023 | .98 | 2.05 | 1,038 |
| October 31, 2020 | 7.18 | .14 | .17 | .31 | (.05) | (.21) | (.26) | 7.23 | 4.46 | 11,932 | .99 | 1.95 | 1,025 |
| Class R5 |
| October 31, 2024 | $5.12 | .25 | .38 | .63 | (.41) | — | (.41) | $5.34 | 12.47 | $3,327 | .45 | 4.70 | 900 |
| October 31, 2023 | 5.54 | .25 | (.17) | .08 | (.50) | — | (.50) | 5.12 | 1.05 | 3,173 | .45 | 4.58 | 1,123 |
| October 31, 2022 | 6.97 | .21 | (1.35) | (1.14) | (.29) | — | (.29) | 5.54 | (16.87) | 4,572 | .45 | 3.38 | 865 |
| October 31, 2021 | 7.39 | .18 | (.20) | (.02) | (.17) | (.23) | (.40) | 6.97 | (.48) | 5,843 | .45 | 2.57 | 1,038 |
| October 31, 2020 | 7.33 | .18 | .18 | .36 | (.09) | (.21) | (.30) | 7.39 | 5.09 | 5,408 | .45 | 2.48 | 1,025 |
| Class R6 |
| October 31, 2024 | $5.16 | .25 | .39 | .64 | (.42) | — | (.42) | $5.38 | 12.58 | $122,354 | .38 | 4.74 | 900 |
| October 31, 2023 | 5.58 | .26 | (.17) | .09 | (.51) | — | (.51) | 5.16 | 1.20 | 170,838 | .38 | 4.66 | 1,123 |
| October 31, 2022 | 7.02 | .22 | (1.37) | (1.15) | (.29) | — | (.29) | 5.58 | (16.83) | 158,971 | .38 | 3.45 | 865 |
| October 31, 2021 | 7.44 | .19 | (.21) | (.02) | (.17) | (.23) | (.40) | 7.02 | (.46) | 202,650 | .38 | 2.65 | 1,038 |
| October 31, 2020 | 7.38 | .18 | .18 | .36 | (.09) | (.21) | (.30) | 7.44 | 5.06 | 187,674 | .38 | 2.51 | 1,025 |
| Class Y |
| October 31, 2024 | $5.17 | .25 | .38 | .63 | (.41) | — | (.41) | $5.39 | 12.35 | $536,620 | .49 | 4.67 | 900 |
| October 31, 2023 | 5.58 | .26 | (.17) | .09 | (.50) | — | (.50) | 5.17 | 1.19 | 591,001 | .50 | 4.62 | 1,123 |
| October 31, 2022 | 7.02 | .21 | (1.37) | (1.16) | (.28) | — | (.28) | 5.58 | (16.97) | 1,223,027 | .50 | 3.25 | 865 |
| October 31, 2021 | 7.44 | .18 | (.21) | (.03) | (.16) | (.23) | (.39) | 7.02 | (.57) | 2,411,628 | .48 | 2.55 | 1,038 |
| October 31, 2020 | 7.38 | .17 | .18 | .35 | (.08) | (.21) | (.29) | 7.44 | 4.95 | 2,708,880 | .49 | 2.36 | 1,025 |
The accompanying notes are an integral part of these financial statements.
| a | Per share net investment income has been determined on the basis of the weighted average number of shares outstanding during the period. |
| b | Total return assumes dividend reinvestment and does not reflect the effect of sales charges. |
| c | Includes amounts paid through expense offset and/or brokerage/service arrangements, if any (Note 2). Also excludes acquired fund fees and expenses, if any. |
| d | Reflects an involuntary contractual expense limitation in effect during the period. As a result of such limitation, the expenses of each class reflect a reduction of the following amounts (Note 2): |
| | Percentage of average net assets |
| October 31, 2024 | 0.12% |
| October 31, 2023 | 0.12 |
| October 31, 2022 | 0.11 |
| October 31, 2021 | 0.10 |
| October 31, 2020 | 0.10 |
| e | Portfolio turnover includes TBA purchase and sale commitments. |
The accompanying notes are an integral part of these financial statements.
Notes to financial statements 10/31/24
Unless otherwise noted, the “reporting period” represents the period from November 1, 2023 through October 31, 2024. The following table defines commonly used references within the Notes to financial statements:
| References to | Represent |
| 1940 Act | Investment Company Act of 1940, as amended |
| Franklin Advisers | Franklin Advisers, Inc., a direct wholly-owned subsidiary of Franklin Templeton, and the fund’s investment manager for periods on or after July 15, 2024 |
| Franklin Distributors | Franklin Distributors, LLC, an indirect wholly-owned subsidiary of Franklin Templeton, and the fund’s distributor and principal underwriter for periods on or after August 2, 2024 |
| Franklin Templeton | Franklin Resources, Inc. |
| JPMorgan | JPMorgan Chase Bank, N.A. |
| OTC | Over-the-counter |
| PIL | Putnam Investments Limited, an indirect wholly-owned subsidiary of Franklin Templeton |
| PSERV | Putnam Investor Services, Inc., a wholly-owned subsidiary of Franklin Templeton |
| Putnam Management | Putnam Investment Management, LLC, an indirect wholly-owned subsidiary of Franklin Templeton, and the fund’s investment manager for periods prior to July 15, 2024 |
| Putnam Retail Management | Putnam Retail Management Limited Partnership, an indirect wholly-owned subsidiary of Franklin Templeton, and the fund’s distributor and principal underwriter for periods prior to August 2, 2024 |
| SEC | Securities and Exchange Commission |
| State Street | State Street Bank and Trust Company |
Putnam Income Fund (the fund) is a Massachusetts business trust, which is registered under the 1940 Act, as a diversified open-end management investment company. The goal of the fund is to seek high current income consistent with what Franklin Advisers believes to be prudent risk. The fund invests mainly in bonds that are securitized debt instruments (such as mortgage-backed investments) and related derivative instruments, and other obligations of companies and governments worldwide denominated in U.S. dollars or (to a lesser extent) foreign currencies, are either investment-grade or below-investment-grade in quality (sometimes referred to as “junk bonds”) and have intermediate- to long-term maturities (three years or longer). The fund currently has significant investment exposure to residential and commercial mortgage-backed securities. Franklin Advisers may consider, among other factors, credit, interest rate and prepayment risks, as well as general market conditions, when deciding whether to buy or sell investments. The fund typically uses to a significant extent derivatives, including credit default swaps, interest rate swaps, total return swaps, to-be announced (TBA) commitments, futures, options, and swaptions, including on mortgage-backed securities and indices, and certain foreign currency transactions, for both hedging and non-hedging purposes including to obtain or adjust exposure to mortgage-backed investments.
The fund offers the following share classes. The expenses for each class of shares may differ based on the distribution and investor servicing fees of each class, which are identified in Note 2.
| Share class | Sales charge | Contingent deferred sales charge | Conversion feature |
| Class A | Up to 4.00% | 1.00% on certain redemptions of shares bought with no initial sales charge | None |
| Class C | None | 1.00% eliminated after one year | Converts to class A shares after 8 years |
| Class M † | Up to 3.25% | None | None |
| Class R † | None | None | None |
| Class R5 † | None | None | None |
| Class R6 † | None | None | None |
| Class Y † | None | None | None |
| † Not available to all investors. |
Effective September 5, 2024, the fund converted all of its class B shares into class A shares, and subsequently terminated its class B shares as a fund offering.
In the normal course of business, the fund enters into contracts that may include agreements to indemnify another party under given circumstances. The fund’s maximum exposure under these arrangements is unknown as this would involve future claims that may be, but have not yet been, made against the fund. However, the fund’s management team expects the risk of material loss to be remote.
The fund has entered into contractual arrangements with an investment adviser, administrator, distributor, shareholder servicing agent and custodian, who each provide services to the fund. Unless expressly stated otherwise, shareholders are not parties to, or intended beneficiaries of these contractual arrangements, and these contractual arrangements are not intended to create any shareholder right to enforce them against the service providers or to seek any remedy under them against the service providers, either directly or on behalf of the fund.
Under the fund’s Agreement and Declaration of Trust, any claims asserted by a shareholder against or on behalf of the fund, including claims against Trustees and Officers, must be brought in courts located within the Commonwealth of Massachusetts.
Note 1: Significant accounting policies
The fund follows the accounting and reporting guidance in Financial Accounting Standards Board (FASB) Accounting Standards Codification Topic 946, Financial Services – Investment Companies (ASC 946) and applies the specialized accounting and reporting guidance in U.S. Generally Accepted Accounting Principles (U.S. GAAP), including, but not limited to, ASC 946. The following is a summary of significant accounting policies consistently followed by the fund in the preparation of its financial statements. The preparation of financial statements is in conformity with accounting principles generally accepted in the United States of America and requires management to make estimates and assumptions that affect the reported amounts of assets and liabilities in the financial statements and the reported amounts of increases and decreases in net assets from operations. Actual results could differ from those estimates. Subsequent events after the Statement of assets and liabilities date through the date that the financial statements were issued have been evaluated in the preparation of the financial statements.
Investment income, realized and unrealized gains and losses and expenses of the fund are borne pro-rata based on the relative net assets of each class to the total net assets of the fund, except that each class bears expenses unique to that class (including the distribution fees applicable to such classes). Each class votes as a class only with respect to its own distribution plan or other matters on which a class vote is required by law or determined by the Trustees. If the fund were liquidated, shares of each class would receive their pro-rata share of the net assets of the fund. In addition, the Trustees declare separate dividends on each class of shares.
Security valuation Portfolio securities and other investments are valued using policies and procedures adopted by the Board of Trustees (Trustees). The Trustees have formed a Pricing Committee to oversee the implementation of these procedures. Under compliance policies and procedures approved by the Trustees, the Trustees have designated the fund’s investment manager as the valuation designee and has responsibility for oversight of valuation. The investment manager is assisted by the fund’s administrator in performing this responsibility, including leading the cross-functional Valuation Committee (VC). The VC is responsible for making fair value determinations, evaluating the effectiveness of the pricing policies of the fund and reporting to the Trustees.
Market quotations are not considered to be readily available for certain debt obligations (including short-term investments with remaining maturities of 60 days or less) and other investments; such investments are valued on the basis of valuations furnished by an independent pricing service approved by the Trustees or dealers selected by the fund’s investment manager. Such services or dealers determine valuations for normal institutional-size trading units of such securities using methods based on market transactions for comparable securities and various relationships, generally recognized by institutional traders, between securities (which consider such factors as security prices, yields, maturities and ratings). These securities will generally be categorized as Level 2. Securities quoted in foreign currencies, if any, are translated into U.S. dollars at the current exchange rate.
Investments in open-end investment companies (excluding exchange-traded funds), if any, which can be classified as Level 1 or Level 2 securities, are valued based on their net asset value. The net asset value of such investment companies equals the total value of their assets less their liabilities and divided by the number of their outstanding shares.
To the extent a pricing service or dealer is unable to value a security or provides a valuation that the fund’s investment manager does not believe accurately reflects the security’s fair value, the security will be valued at fair value by the fund’s investment manager, which has been designated as valuation designee pursuant to Rule 2a–5 under the 1940 Act, in accordance with policies and procedures approved by the Trustees. Certain investments, including certain restricted and illiquid securities and derivatives, are also valued at fair value following procedures approved by the Trustees. These valuations consider such factors as significant market or specific security events such as interest rate or credit quality changes, various relationships with other securities, discount rates, U.S. Treasury, U.S. swap and credit yields, index levels, convexity exposures, recovery rates, sales and other multiples and resale restrictions. These securities are classified as Level 2 or as Level 3 depending on the priority of the significant inputs.
To assess the continuing appropriateness of fair valuations, the Valuation Committee reviews and affirms the reasonableness of such valuations on a regular basis after considering all relevant information that is reasonably available. Such valuations and procedures are reviewed periodically by the Trustees. Certain securities may be valued on the basis of a price provided by a single source. The fair value of securities is generally determined as the amount that the fund could reasonably expect to realize from an orderly disposition of such securities over a reasonable period of time. By its nature, a fair value price is a good faith estimate of the value of a security in a current sale and does not reflect an actual market price, which may be different by a material amount.
Joint trading account Pursuant to an exemptive order from the SEC, the fund may transfer uninvested cash balances into a joint trading account along with the cash of other registered investment companies and certain other accounts managed by Franklin Advisers. These balances may be invested in issues of short-term investments having maturities of up to 90 days.
Repurchase agreements The fund, or any joint trading account, through its custodian, receives delivery of the underlying securities, the fair value of which at the time of purchase is required to be in an amount at least equal to the resale price, including accrued interest. Collateral for certain tri-party repurchase agreements is held at the counterparty’s custodian in a segregated account for the benefit of the fund and the counterparty. Franklin Advisers is responsible for determining that the value of these underlying securities is at all times at least equal to the resale price, including accrued interest. In the event of default or bankruptcy by the other party to the agreement, retention of the collateral may be subject to legal proceedings.
Security transactions and related investment income Security transactions are recorded on the trade date (the date the order to buy or sell is executed). Gains or losses on securities sold are determined on the identified cost basis.
Interest income, net of any applicable withholding taxes, if any, is recorded on the accrual basis. Amortization and accretion of premiums and discounts on debt securities, if any, is recorded on the accrual basis.
The fund may have earned certain fees in connection with its senior loan purchasing activities. These fees, if any, are treated as market discount and are amortized into income in the Statement of operations.
Securities purchased or sold on a forward commitment or delayed delivery basis may be settled at a future date beyond customary settlement time; interest income is accrued based on the terms of the securities. Losses may arise due to changes in the fair value of the underlying securities or if the counterparty does not perform under the contract.
Stripped securities The fund may invest in stripped securities which represent a participation in securities that may be structured in classes with rights to receive different portions of the interest and principal. Interest-only securities receive all of the interest and principal-only securities receive all of the principal. If the interest-only securities experience greater than anticipated prepayments of principal, the fund may fail to recoup fully its initial investment in these securities. Conversely, principal-only securities increase in value if prepayments are greater than anticipated and decline if prepayments are slower than anticipated. The fair value of these securities is highly sensitive to changes in interest rates.
Foreign currency translation The accounting records of the fund are maintained in U.S. dollars. The fair value of foreign securities, currency holdings, and other assets and liabilities is recorded in the books and records of the fund after translation to U.S. dollars based on the exchange rates on that day. The cost of each security is determined using historical exchange rates. Income and withholding taxes are translated at prevailing exchange rates when earned or incurred. The fund does not isolate that portion of realized or unrealized gains or losses resulting from changes in the foreign exchange rate on investments from fluctuations arising from changes in the market prices of the securities. Such gains and losses are included with the net realized and unrealized gain or loss on investments. Net realized gains and losses on foreign currency transactions represent net realized exchange gains or losses on disposition of foreign currencies, currency gains and losses realized between the trade and settlement dates on securities transactions and the difference between the amount of investment income and foreign withholding taxes recorded on the fund’s books and the U.S. dollar equivalent amounts actually received or paid. Net unrealized appreciation and depreciation of assets and liabilities in foreign currencies arise from changes in the value of assets and liabilities other than investments at the period end, resulting from changes in the exchange rate.
Options contracts The fund uses options contracts for hedging duration and convexity, for isolating prepayment risk and for managing downside risks.
The potential risk to the fund is that the change in value of options contracts may not correspond to the change in value of the hedged instruments. In addition, losses may arise from changes in the value of the underlying instruments if there is an illiquid secondary market for the contracts, if interest or exchange rates move unexpectedly or if the counterparty to the contract is unable to perform. Realized gains and losses on purchased options are included in realized gains and losses on investment securities. If a written call option is exercised, the premium originally received is recorded as an addition to sales proceeds. If a written put option is exercised, the premium originally received is recorded as a reduction to the cost of investments.
Exchange-traded options are valued at the last sale price. OTC traded options are valued using quotations from an independent pricing service.
Options on swaps are similar to options on securities except that the premium paid or received is to buy or grant the right to enter into a previously agreed upon interest rate or credit default contract. Forward premium swap option contracts include premiums that have extended settlement dates. The delayed settlement of the premiums is factored into the daily valuation of the option contracts. In the case of interest rate cap and floor contracts, in return for a premium, ongoing payments between two parties are based on interest rates exceeding a specified rate, in the case of a cap contract, or falling below a specified rate in the case of a floor contract.
Written option contracts outstanding at period end, if any, are listed after the fund’s portfolio .
Futures contracts The fund uses futures contracts for hedging treasury term structure risk and for yield curve positioning.
The potential risk to the fund is that the change in value of futures contracts may not correspond to the change in value of the hedged instruments. In addition, losses may arise from changes in the value of the underlying instruments, if there is an illiquid secondary market for the contracts, if interest or exchange rates move unexpectedly or if the counterparty to the contract is unable to perform. With futures, there is minimal counterparty credit risk to the fund since futures are exchange traded and the exchange’s clearinghouse, as counterparty to all
exchange traded futures, guarantees the futures against default. Risks may exceed amounts recognized on the Statement of assets and liabilities. When the contract is closed, the fund records a realized gain or loss equal to the difference between the value of the contract at the time it was opened and the value at the time it was closed.
Futures contracts are valued at the quoted daily settlement prices established by the exchange on which they trade. The fund and the broker agree to exchange an amount of cash equal to the daily fluctuation in the value of the futures contract. Such receipts or payments are known as “variation margin.”
Futures contracts outstanding at period end, if any, are listed after the fund’s portfolio.
Forward currency contracts The fund buys and sells forward currency contracts, which are agreements between two parties to buy and sell currencies at a set price on a future date. These contracts are used for hedging currency exposures.
The U.S. dollar value of forward currency contracts is determined using current forward currency exchange rates supplied by a quotation service. The fair value of the contract will fluctuate with changes in currency exchange rates. The contract is marked to market daily and the change in fair value is recorded as an unrealized gain or loss. The fund records a realized gain or loss equal to the difference between the value of the contract at the time it was opened and the value at the time it was closed when the contract matures or by delivery of the currency. The fund could be exposed to risk if the value of the currency changes unfavorably, if the counterparties to the contracts are unable to meet the terms of their contracts or if the fund is unable to enter into a closing position. Risks may exceed amounts recognized on the Statement of assets and liabilities.
Forward currency contracts outstanding at period end, if any, are listed after the fund’s portfolio.
Interest rate swap contracts The fund entered into OTC and/or centrally cleared interest rate swap contracts, which are arrangements between two parties to exchange cash flows based on a notional principal amount, for hedging term structure risk and for yield curve positioning.
An OTC and centrally cleared interest rate swap can be purchased or sold with an upfront premium. For OTC interest rate swap contracts, an upfront payment received by the fund is recorded as a liability on the fund’s books. An upfront payment made by the fund is recorded as an asset on the fund’s books. OTC and centrally cleared interest rate swap contracts are marked to market daily based upon quotations from an independent pricing service or market makers. Any change is recorded as an unrealized gain or loss on OTC interest rate swaps. Daily fluctuations in the value of centrally cleared interest rate swaps are settled through a central clearing agent and are recorded in variation margin on the Statement of assets and liabilities and recorded as unrealized gain or loss. Payments, including upfront premiums, received or made are recorded as realized gains or losses at the reset date or the closing of the contract. Certain OTC and centrally cleared interest rate swap contracts may include extended effective dates. Payments related to these swap contracts are accrued based on the terms of the contract.
The fund could be exposed to credit or market risk due to unfavorable changes in the fluctuation of interest rates or if the counterparty defaults, in the case of OTC interest rate contracts, or the central clearing agency or a clearing member defaults, in the case of centrally cleared interest rate swap contracts, on its respective obligation to perform under the contract. The fund’s maximum risk of loss from counterparty risk or central clearing risk is the fair value of the contract. This risk may be mitigated for OTC interest rate swap contracts by having a master netting arrangement between the fund and the counterparty and for centrally cleared interest rate swap contracts through the daily exchange of variation margin. There is minimal counterparty risk with respect to centrally cleared interest rate swap contracts due to the clearinghouse guarantee fund and other resources that are available in the event of a clearing member default. Risk of loss may exceed amounts recognized on the Statement of assets and liabilities.
OTC and centrally cleared interest rate swap contracts outstanding, including their respective notional amounts at period end, if any, are listed after the fund’s portfolio.
At the close of the reporting period, the fund has deposited cash valued at $6,545,091 in a segregated account to cover margin requirements on open centrally cleared interest rate swap contracts.
Total return swap contracts The fund entered into OTC and/or centrally cleared total return swap contracts, which are arrangements to exchange a market-linked return for a periodic payment, both based on a notional principal amount, for hedging sector exposure and for gaining exposure to specific sectors.
To the extent that the total return of the security, index or other financial measure underlying the transaction exceeds or falls short of the offsetting interest rate obligation, the fund will receive a payment from or make a payment to the counterparty. OTC and/or centrally cleared total return swap contracts are marked to market daily based upon quotations from an independent pricing service or market maker. Any change is recorded as an unrealized gain or loss on OTC total return swaps. Daily fluctuations in the value of centrally cleared total return swaps are settled through a central clearing agent and are recorded in variation margin on the Statement of assets and liabilities and recorded as unrealized gain or loss. Payments received or made are recorded as realized gains or losses. Certain OTC and/or centrally cleared total return swap contracts may include extended effective dates. Payments related to these swap contracts are accrued based on the terms of the contract. The fund could be exposed to credit or market risk due to unfavorable changes in the fluctuation of interest rates or in the price of the underlying security or index, the possibility that there is no liquid market for these agreements or that the counterparty may default on its obligation to perform. The fund’s maximum risk of loss from counterparty risk or central clearing risk is the fair value of the contract. This risk may be mitigated for OTC total return swap contracts by having a master netting arrangement between the fund and the counterparty and for centrally cleared total return swap contracts through the daily exchange of variation margin. There is minimal counterparty risk with respect to centrally cleared total return swap contracts due to the clearinghouse guarantee fund and other resources that are available in the event of a clearing member default. Risk of loss may exceed amounts recognized on the Statement of assets and liabilities.
OTC and/or centrally cleared total return swap contracts outstanding, including their respective notional amounts at period end, if any, are listed after the fund’s portfolio.
Credit default contracts The fund entered into OTC and/or centrally cleared credit default contracts for hedging credit risk, for gaining liquid exposure to individual names, for hedging market risk and for gaining exposure to specific sectors.
In OTC and centrally cleared credit default contracts, the protection buyer typically makes a periodic stream of payments to a counterparty, the protection seller, in exchange for the right to receive a contingent payment upon the occurrence of a credit event on the reference obligation or all other equally ranked obligations of the reference entity. Credit events are contract specific but may include bankruptcy, failure to pay, restructuring and obligation acceleration. For OTC credit default contracts, an upfront payment received by the fund is recorded as a liability on the fund’s books. An upfront payment made by the fund is recorded as an asset on the fund’s books. Centrally cleared credit default contracts provide the same rights to the protection buyer and seller except the payments between parties, including upfront premiums, are settled through a central clearing agent through variation margin payments. Upfront and periodic payments received or paid by the fund for OTC and centrally cleared credit default contracts are recorded as realized gains or losses at the reset date or close of the contract. The OTC and centrally cleared credit default contracts are marked to market daily based upon quotations from an independent pricing service or market makers. Any change in value of OTC credit default contracts is recorded as an unrealized gain or loss. Daily fluctuations in the value of centrally cleared credit default contracts are recorded in variation margin on the Statement of assets and liabilities and recorded as unrealized gain or loss. Upon the occurrence of a credit event, the difference between the par value and fair value of the reference obligation, net of any proportional amount of the upfront payment, is recorded as a realized gain or loss.
In addition to bearing the risk that the credit event will occur, the fund could be exposed to market risk due to unfavorable changes in interest rates or in the price of the underlying security or index or the possibility that the fund may be unable to close out its position at the same time or at the same price as if it had purchased the underlying reference obligations. In certain circumstances, the fund may enter into offsetting OTC and centrally cleared credit default contracts which would mitigate its risk of loss. Risks of loss may exceed amounts recognized on the Statement of assets and liabilities. The fund’s maximum risk of loss from counterparty risk, either as the protection seller or as the protection buyer, is the fair value of the contract. This risk may be mitigated for OTC credit default contracts by having a master netting arrangement between the fund and the counterparty and for centrally cleared credit default contracts through the daily exchange of variation margin. Counterparty risk is further mitigated with respect to centrally cleared credit default swap contracts due to the clearinghouse guarantee fund and other resources that are available in the event of a clearing member default. Where the fund is a seller of protection, the maximum potential amount of future payments the fund may be required to make is equal to the notional amount.
OTC and centrally cleared credit default contracts outstanding, including their respective notional amounts at period end, if any, are listed after the fund’s portfolio.
TBA commitments The fund may enter into TBA (to be announced) commitments to purchase securities for a fixed unit price at a future date beyond customary settlement time. Although the unit price and par amount have been established, the actual securities have not been specified. However, it is anticipated that the amount of the commitments will not significantly differ from the principal amount. The fund holds, and maintains until settlement date, cash or high-grade debt obligations in an amount sufficient to meet the purchase price, or the fund may enter into offsetting contracts for the forward sale of other securities it owns. Income on the securities will not be earned until settlement date.
The fund may also enter into TBA sale commitments to hedge its portfolio positions, to sell mortgage-backed securities it owns under delayed delivery arrangements or to take a short position in mortgage-backed securities. Proceeds of TBA sale commitments are not received until the contractual settlement date. During the time a TBA sale commitment is outstanding, either equivalent deliverable securities or an offsetting TBA purchase commitment deliverable on or before the sale commitment date are held as “cover” for the transaction, or other liquid assets in an amount equal to the notional value of the TBA sale commitment are segregated. If the TBA sale commitment is closed through the acquisition of an offsetting TBA purchase commitment, the fund realizes a gain or loss. If the fund delivers securities under the commitment, the fund realizes a gain or a loss from the sale of the securities based upon the unit price established at the date the commitment was entered into.
TBA commitments, which are accounted for as purchase and sale transactions, may be considered securities themselves, and involve a risk of loss due to changes in the value of the security prior to the settlement date as well as the risk that the counterparty to the transaction will not perform its obligations. Counterparty risk is mitigated by having a master agreement between the fund and the counterparty.
Unsettled TBA commitments are valued at their fair value according to the procedures described under “Security valuation” above. The contract is marked to market daily and the change in fair value is recorded by the fund as an unrealized gain or loss. Based on market circumstances, Franklin Advisers will determine whether to take delivery of the underlying securities or to dispose of the TBA commitments prior to settlement.
TBA purchase commitments outstanding at period end, if any, are listed within the fund’s portfolio and TBA sale commitments outstanding at period end, if any, are listed after the fund’s portfolio.
Master agreements The fund is a party to ISDA (International Swaps and Derivatives Association, Inc.) Master Agreements that govern OTC derivative and foreign exchange contracts and Master Securities Forward Transaction Agreements that govern transactions involving mortgage-backed and other asset-backed securities that may result in delayed delivery (Master Agreements) with certain counterparties entered into from time to time. The Master Agreements may contain provisions regarding, among other things, the parties’ general obligations, representations, agreements, collateral requirements, events of default and early termination. With respect to certain counterparties, in accordance with the terms of the Master Agreements, collateral pledged to the fund is held in a segregated account by the fund’s custodian and, with respect to those amounts which can be sold or repledged, are presented in the fund’s portfolio.
Collateral pledged by the fund is segregated by the fund’s custodian and identified in the fund’s portfolio. Collateral can be in the form of cash or debt securities issued by the U.S. Government or related agencies or other securities as agreed to by the fund and the applicable counterparty. Collateral requirements are determined based on the fund’s net position with each counterparty.
With respect to ISDA Master Agreements, termination events applicable to the fund may occur upon a decline in the fund’s net assets below a specified threshold over a certain period of time. Termination events applicable to counterparties may occur upon a decline in the counterparty’s long-term or short-term credit ratings below a specified level. In each case, upon occurrence, the other party may elect to terminate early and cause settlement of all derivative and foreign exchange contracts outstanding, including the payment of any losses and costs resulting from such early termination, as reasonably determined by the terminating party. Any decision by one or more of the fund’s counterparties to elect early termination could impact the fund’s future derivative activity.
At the close of the reporting period, the fund had a net liability position of $820,364 on open derivative contracts subject to the Master Agreements. Collateral pledged by the fund at period end for these agreements totaled $815,525 and may include amounts related to unsettled agreements.
Interfund lending The fund, along with other Putnam funds, may participate in an interfund lending program pursuant to an exemptive order issued by the SEC. This program allows the fund to borrow from or lend to other Putnam funds that permit such transactions. Interfund lending transactions are subject to each fund’s investment policies and borrowing and lending limits. Interest earned or paid on the interfund lending transaction will be based on the average of certain current market rates. During the reporting period, the fund did not utilize the program.
Lines of credit The fund participates, along with other Putnam funds, in a $320 million syndicated unsecured committed line of credit, provided by State Street ($160 million) and JPMorgan ($160 million), and a $235.5 million unsecured uncommitted line of credit, provided by State Street. Borrowings may be made for temporary or emergency purposes, including the funding of shareholder redemption requests and trade settlements. Interest is charged to the fund based on the fund’s borrowing at a rate equal to 1.25% plus the higher of (1) the Federal Funds rate and (2) the Overnight Bank Funding Rate for the committed line of credit and 1.30% plus the higher of (1) the Federal Funds rate and (2) the Overnight Bank Funding Rate for the uncommitted line of credit. A closing fee equal to 0.04% of the committed line of credit and 0.04% of the uncommitted line of credit has been paid by the participating funds and a $75,000 fee has been paid by the participating funds to State Street as agent of the syndicated committed line of credit. In addition, a commitment fee of 0.21% per annum on any unutilized portion of the committed line of credit is allocated to the participating funds based on their relative net assets and paid quarterly. During the reporting period, the fund had no borrowings against these arrangements.
Federal taxes It is the policy of the fund to distribute all of its taxable income within the prescribed time period and otherwise comply with the provisions of the Internal Revenue Code of 1986, as amended (the Code), applicable to regulated investment companies. It is also the intention of the fund to distribute an amount sufficient to avoid imposition of any excise tax under Section 4982 of the Code.
The fund is subject to the provisions of Accounting Standards Codification 740 Income Taxes (ASC 740). ASC 740 sets forth a minimum threshold for financial statement recognition of the benefit of a tax position taken or expected to be taken in a tax return. The fund did not have a liability to record for any unrecognized tax benefits in the accompanying financial statements. No provision has been made for federal taxes on income, capital gains or unrealized appreciation on securities held nor for excise tax on income and capital gains. Each of the fund’s federal tax returns for the prior three fiscal years remains subject to examination by the Internal Revenue Service.
The fund may also be subject to taxes imposed by governments of countries in which it invests. Such taxes are generally based on either income or gains earned or repatriated. The fund accrues and applies such taxes to net investment income, net realized gains and net unrealized gains as income and/or capital gains are earned. In some cases, the fund may be entitled to reclaim all or a portion of such taxes, and such reclaim amounts, if any, are reflected as an asset and other income on the fund’s books. In many cases, however, the fund may not receive such amounts for an extended period of time, depending on the country of investment.
Under the Regulated Investment Company Modernization Act of 2010, the fund will be permitted to carry forward capital losses incurred for an unlimited period and the carry forwards will retain their character as either short-term or long-term capital losses. At October 31, 2024, the fund had the following capital loss carryovers available, to the extent allowed by the Code, to offset future net capital gain, if any:
| Loss carryover |
| Short-term | Long-term | Total |
| $244,958,815 | $488,863,446 | $733,822,261 |
Distributions to shareholders Distributions to shareholders from net investment income, if any, are recorded by the fund on the ex-dividend date. Distributions from capital gains, if any, are recorded on the ex-dividend date and paid at least annually. The amount and character of income and gains to be distributed are determined in accordance with income tax regulations, which may differ from generally accepted accounting principles. These differences include temporary and/or permanent differences from unrealized gains and losses on certain futures contracts, from income on swap contracts and from interest-only securities. Reclassifications are made to the fund’s capital accounts to reflect income and gains available for distribution (or available capital loss carryovers) under income tax regulations. At the close of the reporting period, the fund reclassified $27,211,734 to increase undistributed net investment income and $27,211,734 to increase accumulated net realized loss.
Tax cost of investments includes adjustments to net unrealized appreciation (depreciation) which may not necessarily be final tax cost basis adjustments, but closely approximate the tax basis unrealized gains and losses that may be realized and distributed to shareholders. The tax basis components of distributable earnings and the federal tax cost as of the close of the reporting period were as follows:
| Unrealized appreciation | $79,835,733 |
| Unrealized depreciation | (164,447,574) |
| Net unrealized depreciation | (84,611,841) |
| Undistributed ordinary income | 43,074,960 |
| Capital loss carryforward | (733,822,261) |
| Cost for federal income tax purposes | $1,453,906,959 |
Note 2: Management fee, administrative services and other transactions
Effective July 15, 2024, Putnam Management transferred its management contract with the fund to Franklin Advisers. As a result of the transfer, Franklin Advisers replaced Putnam Management as the investment adviser of the fund. In connection with the transfer, the fund’s portfolio managers, along with supporting research analysts and certain other investment staff of Putnam Management, also became employees of Franklin Advisers.
In addition, Putnam Management transferred to Franklin Advisers the sub-management contract between Putnam Management and PIL in respect of the fund.
The fund pays Franklin Advisers a management fee (based on the fund’s average net assets and computed and paid monthly) at annual rates that may vary based on the average of the aggregate net assets of all open-end mutual funds sponsored by Putnam Management (including open-end funds managed by affiliates of Putnam Management that have been deemed to be sponsored by Putnam Management for this purpose) (excluding net assets of such funds that are invested in, or that are invested in by, other such funds to the extent necessary to avoid “double counting” of those assets). Such annual rates may vary as follows:
| 0.550% | of the first $5 billion, |
| 0.500% | of the next $5 billion, |
| 0.450% | of the next $10 billion, |
| 0.400% | of the next $10 billion, |
| 0.350% | of the next $50 billion, |
| 0.330% | of the next $50 billion, |
| 0.320% | of the next $100 billion and |
| 0.315% | of any excess thereafter. |
For the reporting period, the management fee represented an effective rate (excluding the impact from any expense waivers in effect) of 0.382% of the fund’s average net assets.
Franklin Advisers has contractually agreed, through February 28, 2026, to waive fees and/or reimburse the fund’s expenses to the extent necessary to limit the cumulative expenses of the fund, exclusive of brokerage, interest, taxes, investment-related expenses, extraordinary expenses, acquired fund fees and expenses and payments under the fund’s investor servicing contract, investment management contract and distribution plans, on a fiscal year-to-date basis to an annual rate of 0.20% of the fund’s average net assets over such fiscal year-to-date period. During the reporting period, the fund’s expenses were not reduced as a result of this limit.
Franklin Advisers has also contractually agreed to waive fees (and, to the extent necessary, bear other expenses) of the fund through February 28, 2026, to the extent that total expenses of the fund (excluding brokerage, interest, taxes, investment-related expenses, payments under distribution plans, extraordinary expenses, payments under the fund’s investor servicing contract and acquired fund fees and expenses, but including payments under the fund’s investment management contract) would exceed an annual rate of 0.33% of the fund’s average net assets. During the reporting period, the fund’s expenses were reduced by $1,409,852 as a result of this limit.
Effective July 15, 2024, Franklin Advisers retained Putnam Management as sub-adviser for the fund pursuant to a new sub-advisory agreement. Pursuant to the agreement, Putnam Management provides certain advisory and related services to the fund. Franklin Advisers pays a monthly fee to Putnam Management based on the costs of Putnam Management in providing these services to the fund, which may include a mark-up not to exceed 15% over such costs.
During the reporting period, PIL was authorized by the Trustees to manage a separate portion of the assets of the fund as determined by Franklin Advisers from time to time. PIL did not manage any portion of the assets of the fund during the reporting period. Effective November 1, 2024, PIL, and its investment professionals, merged into Franklin Templeton Investment Management Limited (FTIML), an affiliate of the investment manager, and FTIML became a sub-advisor to the fund. If Franklin Advisers were to engage the services of FTIML or PIL, Franklin Advisers would pay a monthly sub-management fee to FTIML or PIL for its services at an annual rate of 0.20% of the average net assets of the portion of the fund managed by FTIML or PIL.
On January 1, 2024, a subsidiary of Franklin Templeton acquired Putnam U.S. Holdings I, LLC (“Putnam Holdings”), the parent company of Putnam Management and PIL, in a stock and cash transaction (the “Transaction”). As a result of the Transaction, Putnam Management and PIL became indirect, wholly-owned subsidiaries of Franklin Templeton. The Transaction also resulted in the automatic termination of the investment management contract between the fund and Putnam Management and the sub-management contract for the fund between Putnam Management and PIL that were in place for the fund before the Transaction (together, the “Previous Advisory Contracts”). However, Putnam Management and PIL continued to provide uninterrupted services with respect to the fund pursuant to new investment management and sub-management contracts that were approved by fund shareholders at a shareholder meeting held in connection with the Transaction and that took effect on January 1, 2024 (together, the “New Advisory Contracts”). The terms of the New Advisory Contracts are substantially similar to those of the Previous Advisory Contracts, and the fee rates payable under the New Advisory Contracts are the same as the fee rates under the Previous Advisory Contracts.
Effective June 1, 2024, Franklin Templeton Services provides certain administrative services to the fund. The fee for those services is paid by the fund’s investment manager based on the fund’s average daily net assets and is not an additional expense of the fund.
The fund reimburses Franklin Advisers an allocated amount for the compensation and related expenses of certain officers of the fund and their staff who provide administrative services to the fund. The aggregate amount of all such reimbursements is determined annually by the Trustees.
Custodial functions for the fund’s assets are provided by State Street. Custody fees are based on the fund’s asset level, the number of its security holdings and transaction volumes.
PSERV, an affiliate of Franklin Advisers, provides investor servicing agent functions to the fund. PSERV received fees for investor servicing for class A, class B, class C, class M, class R and class Y shares that included (1) a per account fee for each direct and underlying non-defined contribution account (retail account) of the fund; (2) a specified rate of the fund’s assets attributable to defined contribution plan accounts; and (3) a specified rate based on the average net assets in retail accounts. PSERV has agreed that the aggregate investor servicing fees for each fund’s retail and defined contribution accounts for these share classes will not exceed an annual rate of 0.25% of the fund’s average assets attributable to such accounts.
Class R5 shares paid a monthly fee based on the average net assets of class R5 shares at an annual rate of 0.12%.
Class R6 shares paid a monthly fee based on the average net assets of class R6 shares at an annual rate of 0.05%.
During the reporting period, the expenses for each class of shares related to investor servicing fees were as follows:
| Class A | $676,788 |
| Class B | 641 |
| Class C | 45,798 |
| Class M | 55,403 |
| Class R | 9,531 |
| Class R5 | 4,072 |
| Class R6 | 77,747 |
| Class Y | 938,983 |
| Total | $1,808,963 |
The fund has entered into expense offset arrangements with PSERV and State Street whereby PSERV’s and State Street’s fees are reduced by credits allowed on cash balances. For the reporting period, the fund’s expenses were reduced by $29,202 under the expense offset arrangements.
Each Independent Trustee of the fund receives an annual Trustee fee, of which $823, as a quarterly retainer, has been allocated to the fund, and an additional fee
for each Trustees meeting attended. Trustees also are reimbursed for expenses they incur relating to their services as Trustees.
The fund has adopted a Trustee Fee Deferral Plan (the Deferral Plan) which allows the Trustees to defer the receipt of all or a portion of Trustees fees payable from July 1, 1995 through December 31, 2023. The deferred fees remain invested in certain Putnam funds until distribution in accordance with the Deferral Plan.
The fund has adopted an unfunded noncontributory defined benefit pension plan (the Pension Plan) covering all Trustees of the fund who have served as a Trustee for at least five years and were first elected prior to 2004. Benefits under the Pension Plan are equal to 50% of the Trustee’s average annual attendance and retainer fees for the three years ended December 31, 2005. The retirement benefit is payable during a Trustee’s lifetime, beginning the year following retirement, for the number of years of service through December 31, 2006. Pension expense for the fund is included in Trustee compensation and expenses in the Statement of operations. Accrued pension liability is included in Payable for Trustee compensation and expenses in the Statement of assets and liabilities. The Trustees have terminated the Pension Plan with respect to any Trustee first elected after 2003.
The fund has adopted distribution plans (the Plans) with respect to the following share classes pursuant to Rule 12b–1 under the 1940 Act. The purpose of the Plans is to compensate Franklin Distributors, or for periods prior to August 2, 2024, Putnam Retail Management, for services provided and expenses incurred in distributing shares of the fund. The Plans provide payments by the fund to Franklin Distributors and to Putnam Retail Management at an annual rate of up to the following amounts (Maximum %) of the average net assets attributable to each class. The Trustees have approved payment by the fund at the following annual rate (Approved %) of the average net assets attributable to each class. During the reporting period, the class-specific expenses related to distribution fees were as follows:
| | Maximum % | Approved % | Franklin Distributors Amount | Putnam Retail Management Amount | Totals |
| Class A | 0.35% | 0.25% | $261,905 | $781,283 | $1,043,188 |
| Class B | 1.00% | 1.00% | 243 | 3,666 | $3,909 |
| Class C | 1.00% | 1.00% | 68,148 | 214,083 | $282,231 |
| Class M | 1.00% | 0.50% | 42,603 | 128,199 | $170,802 |
| Class R | 1.00% | 0.50% | 5,929 | 23,374 | $29,303 |
| Total | | | $378,828 | $1,150,605 | $1,529,433 |
For the period from August 2, 2024 through October 31, 2024, Franklin Distributors, acting as underwriter, received net commissions of $9,630 and no monies from the sale of class A and class M shares, respectively, and received no monies and $876 in contingent deferred sales charges from redemptions of class B and class C shares, respectively. For the period November 1, 2023 through August 1, 2024, Putnam Retail Management, acting as underwriter, received net commissions of $29,156 and $283 from the sale of class A and class M shares, respectively, and received no monies and $942 in contingent deferred sales charges from redemptions of class B and class C shares, respectively.
A deferred sales charge of up to 1.00% is accessed on certain redemptions of class A shares. For the period from August 2, 2024 through October 31, 2024, Franklin Distributors, acting as underwriter, received $30 on class A redemptions. For the period from November 1, 2023 through August 1, 2024, Putnam Retail Management, acting as underwriter, received $578 on class A redemptions.
Note 3: Purchases and sales of securities
During the reporting period, the cost of purchases and the proceeds from sales, excluding short-term investments, were as follows:
| | Cost of purchases | Proceeds from sales |
| Investments in securities, including TBA commitments (Long-term) | $12,353,137,742 | $12,632,123,046 |
| U.S. government securities (Long-term) | — | — |
| Total | $12,353,137,742 | $12,632,123,046 |
The fund may purchase or sell investments from or to other Putnam funds in the ordinary course of business, which can reduce the fund’s transaction costs, at prices determined in accordance with SEC requirements and policies approved by the Trustees. During the reporting period, purchases or sales of long-term securities from or to other Putnam funds, if any, did not represent more than 5% of the fund’s total cost of purchases and/or total proceeds from sales.
Note 4: Capital shares
At the close of the reporting period, there were an unlimited number of shares of beneficial interest authorized. Transactions, including, if applicable, direct exchanges pursuant to share conversions, in capital shares were as follows:
| | YEAR ENDED 10/31/24 | YEAR ENDED 10/31/23 |
| Class A | Shares | Amount | Shares | Amount |
| Shares sold | 9,496,678 | $50,069,714 | 10,661,800 | $57,902,284 |
| Shares issued in connection with reinvestment of distributions | 5,362,519 | 28,130,561 | 6,991,064 | 37,919,910 |
| | 14,859,197 | 78,200,275 | 17,652,864 | 95,822,194 |
| Shares repurchased | (20,757,922) | (109,230,408) | (23,687,656) | (128,190,790) |
| Net decrease | (5,898,725) | $(31,030,133) | (6,034,792) | $(32,368,596) |
| | YEAR ENDED 10/31/24 * | YEAR ENDED 10/31/23 |
| Class B | Shares | Amount | Shares | Amount |
| Shares sold | — | $— | 1,965 | $10,814 |
| Shares issued in connection with reinvestment of distributions | 6,257 | 32,330 | 20,997 | 112,772 |
| | 6,257 | 32,330 | 22,962 | 123,586 |
| Shares repurchased | (149,883) | (781,143) | (240,312) | (1,290,265) |
| Net decrease | (143,626) | $(748,813) | (217,350) | $(1,166,679) |
| | YEAR ENDED 10/31/24 | YEAR ENDED 10/31/23 |
| Class C | Shares | Amount | Shares | Amount |
| Shares sold | 792,858 | $4,131,626 | 962,446 | $5,197,719 |
| Shares issued in connection with reinvestment of distributions | 347,630 | 1,802,294 | 501,779 | 2,695,024 |
| | 1,140,488 | 5,933,920 | 1,464,225 | 7,892,743 |
| Shares repurchased | (1,896,413) | (9,844,007) | (3,015,180) | (16,165,821) |
| Net decrease | (755,925) | $(3,910,087) | (1,550,955) | $(8,273,078) |
| | YEAR ENDED 10/31/24 | YEAR ENDED 10/31/23 |
| Class M | Shares | Amount | Shares | Amount |
| Shares sold | 19,200 | $96,088 | 21,400 | $113,073 |
| Shares issued in connection with reinvestment of distributions | — | — | — | — |
| | 19,200 | 96,088 | 21,400 | 113,073 |
| Shares repurchased | (547,500) | (2,761,131) | (358,500) | (1,864,380) |
| Net decrease | (528,300) | $(2,665,043) | (337,100) | $(1,751,307) |
| | YEAR ENDED 10/31/24 | YEAR ENDED 10/31/23 |
| Class R | Shares | Amount | Shares | Amount |
| Shares sold | 280,524 | $1,465,714 | 167,043 | $892,671 |
| Shares issued in connection with reinvestment of distributions | 84,889 | 438,983 | 114,435 | 612,894 |
| | 365,413 | 1,904,697 | 281,478 | 1,505,565 |
| Shares repurchased | (712,284) | (3,664,745) | (409,953) | (2,189,197) |
| Net decrease | (346,871) | $(1,760,048) | (128,475) | $(683,632) |
| | YEAR ENDED 10/31/24 | YEAR ENDED 10/31/23 |
| Class R5 | Shares | Amount | Shares | Amount |
| Shares sold | 55,480 | $294,573 | 71,095 | $391,270 |
| Shares issued in connection with reinvestment of distributions | 47,999 | 255,653 | 50,862 | 279,061 |
| | 103,479 | 550,226 | 121,957 | 670,331 |
| Shares repurchased | (99,796) | (530,527) | (328,225) | (1,823,233) |
| Net increase (decrease) | 3,683 | $19,699 | (206,268) | $(1,152,902) |
| | YEAR ENDED 10/31/24 | YEAR ENDED 10/31/23 |
| Class R6 | Shares | Amount | Shares | Amount |
| Shares sold | 9,528,180 | $51,193,925 | 11,519,587 | $63,213,239 |
| Shares issued in connection with reinvestment of distributions | 2,119,500 | 11,367,166 | 2,466,161 | 13,645,370 |
| | 11,647,680 | 62,561,091 | 13,985,748 | 76,858,609 |
| Shares repurchased | (21,986,227) | (118,501,669) | (9,371,916) | (51,855,503) |
| Net increase (decrease) | (10,338,547) | $(55,940,578) | 4,613,832 | $25,003,106 |
| | YEAR ENDED 10/31/24 | YEAR ENDED 10/31/23 |
| Class Y | Shares | Amount | Shares | Amount |
| Shares sold | 39,290,494 | $211,825,188 | 46,908,523 | $261,636,157 |
| Shares issued in connection with reinvestment of distributions | 7,482,629 | 40,232,778 | 11,008,288 | 61,131,329 |
| | 46,773,123 | 252,057,966 | 57,916,811 | 322,767,486 |
| Shares repurchased | (61,525,281) | (332,647,521) | (162,588,983) | (926,324,299) |
| Net decrease | (14,752,158) | $(80,589,555) | (104,672,172) | $(603,556,813) |
| * Effective September 5, 2024, the fund has terminated its class B shares. |
Note 5: Affiliated transactions
Transactions during the reporting period with any company which is under common ownership or control were as follows:
| Name of affiliate | Fair value as of 10/31/23 | Purchase cost | Sale proceeds | Investment income | Shares outstanding and fair value as of 10/31/24 |
| Short-term investments | | | | | |
| Putnam Short Term Investment Fund Class P * | $130,924,039 | $570,548,736 | $588,602,152 | $5,241,496 | $112,870,623 |
| Total Short-term investments | $130,924,039 | $570,548,736 | $588,602,152 | $5,241,496 | $112,870,623 |
| * Management fees charged to Putnam Short Term Investment Fund have been waived by Putnam Management and Franklin Advisers, as applicable. There were no realized or unrealized gains or losses during the period. |
Note 6: Market, credit and other risks
In the normal course of business, the fund trades financial instruments and enters into financial transactions where risk of potential loss exists due to changes in the market (market risk) or failure of the contracting party to the transaction to perform (credit risk). The fund may be exposed to additional credit risk that an institution or other entity with which the fund has unsettled or open transactions will default. Investments in foreign securities involve certain risks, including those related to economic instability, unfavorable political developments, and currency fluctuations. The fund may invest in higher-yielding, lower-rated bonds that may have a higher rate of default. The fund may invest a significant portion of its assets in securitized debt instruments, including mortgage-backed and asset-backed investments. The yields and values of these investments are sensitive to changes in interest rates, the rate of principal payments on the underlying assets and the market’s perception of the issuers. The market for these investments may be volatile and limited, which may make them difficult to buy or sell.
Note 7: Senior loan commitments
Senior loans are purchased or sold on a when-issued or delayed delivery basis and may be settled a month or more after the trade date, which from time to time can delay the actual investment of available cash balances; interest income is accrued based on the terms of the securities. Senior loans can be acquired through an agent, by assignment from another holder of the loan, or as a participation interest in another holder’s portion of the loan. When the fund invests in a loan or participation, the fund is subject to the risk that an intermediate participant between the fund and the borrower will fail to meet its obligations to the fund, in addition to the risk that the borrower under the loan may default on its obligations.
Note 8: Summary of derivative activity
The volume of activity for the reporting period for any derivative type that was held during the period is listed below and was based on an average of the holdings at the end of each fiscal quarter:
| Purchased swap option contracts (contract amount) | $477,800,000 |
| Written swap option contracts (contract amount) | $230,700,000 |
| Futures contracts (number of contracts) | 4,000 |
| Forward currency contracts (contract amount) | $310,000 |
| OTC interest rate swap contracts (notional) | $961,500,000 |
| Centrally cleared interest rate swap contracts (notional) | $1,671,400,000 |
| OTC total return swap contracts (notional) | $12,700,000 |
| OTC credit default contracts (notional) | $79,000,000 |
The following is a summary of the fair value of derivative instruments as of the close of the reporting period:
| Fair value of derivative instruments as of the close of the reporting period |
| | Asset derivatives | Liability derivatives |
| Derivatives not accounted for as hedging instruments under ASC 815 | Statement of assets and liabilities location | Fair value | Statement of assets and liabilities location | Fair value |
| Credit contracts | Receivables | $7,253,385 | Payables | $3,855,493 |
| Foreign exchange contracts | Receivables | 6,729 | Payables | — |
| Interest rate contracts | Receivables, Net assets — Unrealized appreciation | 25,028,168 * | Payables, Net assets — Unrealized depreciation | 25,553,956 * |
| Total | | $32,288,282 | | $29,409,449 |
| * Includes cumulative appreciation/depreciation of futures contracts and/or centrally cleared swaps as reported in the fund’s portfolio. Only current day’s variation margin is reported within the Statement of assets and liabilities. |
The following is a summary of realized and change in unrealized gains or losses of derivative instruments in the Statement of operations for the reporting period (see Note 1):
| Amount of realized gain or (loss) on derivatives recognized in net gain or (loss) on investments |
| Derivatives not accounted for as hedging instruments under ASC 815 | Options | Futures | Forward currency contracts | Swaps | Total |
| Credit contracts | $— | $— | $— | $2,618,246 | $2,618,246 |
| Foreign exchange contracts | — | — | (4,567) | — | $(4,567) |
| Interest rate contracts | 2,954,959 | 6,742,919 | — | 26,254,582 | $35,952,460 |
| Total | $2,954,959 | $6,742,919 | $(4,567) | $28,872,828 | $38,566,139 |
| Change in unrealized appreciation or (depreciation) on derivatives recognized in net gain or (loss) on investments |
| Derivatives not accounted for as hedging instruments under ASC 815 | Options | Futures | Forward currency contracts | Swaps | Total |
| Credit contracts | $— | $— | $— | $(3,610,240) | $(3,610,240) |
| Foreign exchange contracts | — | — | 1,097 | — | $1,097 |
| Interest rate contracts | (5,359,359) | 10,329,585 | — | (38,594,568) | $(33,624,342) |
| Total | $(5,359,359) | $10,329,585 | $1,097 | $(42,204,808) | $(37,233,485) |
Note 9: Offsetting of financial and derivative assets and liabilities
The following table summarizes any derivatives, repurchase agreements and reverse repurchase agreements, at the end of the reporting period, that are subject to an enforceable master netting agreement or similar agreement. For securities lending transactions or borrowing transactions associated with securities sold short, if any, see Note 1. For financial reporting purposes, the fund does not offset financial assets and financial liabilities that are subject to the master netting agreements in the Statement of assets and liabilities.
| | | | | | |
| | Bank of America N.A. | Barclays Bank PLC | Barclays Capital, Inc. (clearing broker) | Citigroup Global Markets, Inc. | Goldman Sachs International |
| Assets: | | | | | |
| OTC Interest rate swap contracts *# | $— | $— | $— | $— | $— |
| Centrally cleared interest rate swap contracts § | — | — | 655,270 | — | — |
| OTC Total return swap contracts *# | — | — | — | — | — |
| OTC Credit default contracts — protection sold *# | — | — | — | — | — |
| OTC Credit default contracts — protection purchased *# | — | — | — | 4,563,406 | 700,165 |
| Futures contracts § | — | — | — | — | — |
| Forward currency contracts # | — | — | — | — | — |
| Forward premium swap option contracts # | — | 1,437,080 | — | — | — |
| Total Assets | $— | $1,437,080 | $655,270 | $4,563,406 | $700,165 |
| Liabilities: | | | | | |
| OTC Interest rate swap contracts *# | — | — | — | — | — |
| Centrally cleared interest rate swap contracts § | — | — | 911,178 | — | — |
| OTC Total return swap contracts *# | — | — | — | — | — |
| OTC Credit default contracts — protection sold *# | 146,169 | — | — | 1,636,834 | — |
| OTC Credit default contracts — protection purchased *# | — | — | — | — | — |
| Futures contracts § | — | — | — | — | — |
| Forward currency contracts # | — | — | — | — | — |
| Forward premium swap option contracts # | 298,884 | 323,723 | — | — | — |
| Total Liabilities | $445,053 | $323,723 | $911,178 | $1,636,834 | $— |
| Total Financial and Derivative Net Assets | $(445,053) | $1,113,357 | $(255,908) | $2,926,572 | $700,165 |
| Total collateral received (pledged) †## | $(431,946) | $898,000 | $— | $2,914,000 | $690,000 |
| Net amount | $(13,107) | $215,357 | $(255,908) | $12,572 | $10,165 |
| Controlled collateral received (including TBA commitments) ** | $— | $898,000 | $— | $2,914,000 | $690,000 |
| Uncontrolled collateral received | $— | $— | $— | $— | $— |
| Collateral (pledged) (including TBA commitments) ** | $(431,946) | $— | $— | $(238,662) | $(3,100,848) |
| | | | | | | | |
| | JPMorgan Securities LLC | Merrill Lynch International | Mizuho Capital Markets LLC | Morgan Stanley & Co. LLC | Morgan Stanley & Co. International PLC | Wells Fargo Bank, N.A. | Total |
| Assets: | | | | | | | |
| OTC Interest rate swap contracts *# | $— | $— | $— | $— | $12,050,661 | $— | $12,050,661 |
| Centrally cleared interest rate swap contracts § | — | — | — | — | — | — | 655,270 |
| OTC Total return swap contracts *# | — | — | — | — | — | — | — |
| OTC Credit default contracts — protection sold *# | — | — | — | — | — | — | — |
| OTC Credit default contracts — protection purchased *# | 337,204 | 363,126 | — | — | 1,289,484 | — | 7,253,385 |
| Futures contracts § | 43,375 | — | — | — | — | — | 43,375 |
| Forward currency contracts # | — | — | — | — | 6,729 | — | 6,729 |
| Forward premium swap option contracts # | — | — | — | — | — | — | 1,437,080 |
| Total Assets | $380,579 | $363,126 | $— | $— | $13,346,874 | $— | $21,446,500 |
| Liabilities: | | | | | | | |
| OTC Interest rate swap contracts *# | — | — | — | — | — | — | — |
| Centrally cleared interest rate swap contracts § | — | — | — | — | — | — | 911,178 |
| OTC Total return swap contracts *# | — | — | — | — | 322,202 | — | 322,202 |
| OTC Credit default contracts — protection sold *# | 712,515 | 156,430 | — | — | 881,343 | — | 3,533,291 |
| OTC Credit default contracts — protection purchased *# | — | — | — | — | — | — | — |
| Futures contracts § | 465,253 | — | — | — | — | — | 465,253 |
| Forward currency contracts # | — | — | — | — | — | — | — |
| Forward premium swap option contracts # | — | — | — | — | 228,357 | — | 850,964 |
| Total Liabilities | $1,177,768 | $156,430 | $— | $— | $1,431,902 | $— | $6,082,888 |
| Total Financial and Derivative Net Assets | $(797,189) | $206,696 | $— | $— | $11,914,972 | $— | $15,363,612 |
| Total collateral received (pledged) †## | $(383,579) | $203,000 | $— | $— | $11,030,000 | $— | |
| Net amount | $(413,610) | $3,696 | $— | $— | $884,972 | $— | |
| Controlled collateral received (including TBA commitments) ** | $— | $203,000 | $— | $— | $11,030,000 | $— | $15,735,000 |
| Uncontrolled collateral received | $— | $— | $— | $— | $— | $— | $— |
| Collateral (pledged) (including TBA commitments) ** | $(2,143,112) | $— | $(1,951,881) | $(111,904) | $— | $(559,447) | $(8,537,800) |
| * | Excludes premiums, if any. Included in unrealized appreciation and depreciation on OTC swap contracts on the Statement of assets and liabilities. |
| ** | Included with Investments in securities on the Statement of assets and liabilities. |
| † | Additional collateral may be required from certain brokers based on individual agreements. |
| # | Covered by master netting agreement (Note 1). |
| ## | Any over-collateralization of total financial and derivative net assets is not shown. Collateral may include amounts related to unsettled agreements. |
| § | Includes current day’s variation margin only as reported on the Statement of assets and liabilities, which is not collateralized. Cumulative appreciation/(depreciation) for futures contracts and centrally cleared swap contracts is represented in the tables listed after the fund’s portfolio. Collateral pledged for initial margin on futures contracts and centrally cleared swap contracts, which is not included in the table above, amounted to $9,928,748 and $6,545,091, respectively. |
Federal tax information (Unaudited)
For the reporting period, pursuant to §871(k) of the Internal Revenue Code, the fund hereby designates $43,620,356 of distributions paid as qualifying to be taxed as interest-related dividends, and $— to be taxed as short-term capital gain dividends for nonresident alien shareholders.
The Form 1099 that will be mailed to you in January 2025 will show the tax status of all distributions paid to your account in calendar 2024.
Changes in and disagreements with accountants
Not applicable
Results of any shareholder votes (Unaudited)
| November 17, 2023 special meeting |
| At the meeting, a new Management Contract for your fund with Putnam Investment Management, LLC was approved, as follows: |
| Votes for | Votes against | Abstentions/Votes withheld |
| 132,273,233 | 1,414,707 | 2,967,163 |
| At the meeting, a new Sub-Management Contract for your fund between Putnam Investment Management, LLC and Putnam Investments Limited was approved, as follows: |
| Votes for | Votes against | Abstentions/Votes withheld |
| 131,984,716 | 1,585,562 | 3,084,825 |
| All tabulations are rounded to the nearest whole number. |
Remuneration paid to directors, officers, and others
Remuneration paid to directors, officers, and others is included in the Notes to financial statements above.
Board approval of management and subadvisory agreements (Unaudited)
At its meeting on September 27, 2024, the Board of Trustees of your fund, including all of the Trustees who are not “interested persons” (as this term is defined in the Investment Company Act of 1940, as amended (the “1940 Act”)) of the Putnam mutual funds, closed-end funds and exchange-traded funds (collectively, the “funds”) (the “Independent Trustees”), approved a new Sub-Advisory Agreement (the “New FTIML Sub-Advisory Agreement”) between Franklin Advisers, Inc. (“Franklin Advisers”) and its affiliate, Franklin Templeton Investment Management Limited (“FTIML”). Franklin Advisers and FTIML are each direct or indirect, wholly-owned subsidiaries of Franklin Resources, Inc. (“Franklin Templeton”). (Because FTIML is an affiliate of Franklin Advisers and Franklin Advisers remains fully responsible for all services provided by FTIML, the Trustees did not attempt to evaluate FTIML as a separate entity.)
The Board of Trustees, with the assistance of its Contract Committee (which consists solely of Independent Trustees) and its independent legal counsel (as that term is defined in Rule 0-1(a)(6)(i) under the 1940 Act), requested and evaluated all information it deemed reasonably necessary under the circumstances in connection with its review of the New FTIML Sub-Advisory Agreement. At its September 2024 meeting, the Contract Committee met with representatives of Franklin Templeton, and separately in executive session, to consider the information provided. At the September Trustees’ meetings, the Contract Committee also met in executive session with the other Independent Trustees to discuss its observations and recommendations. Throughout this process, the Contract Committee was assisted by the members of the Board of Trustees’ independent staff and by independent legal counsel for the Independent Trustees.
Considerations in connection with the Trustees’ approval of the New FTIML Sub-Advisory Agreement
The Trustees considered the proposed New FTIML Sub-Advisory Agreement in connection with the planned November 1, 2024 merger (the “Merger”) of Putnam Investments Limited (“PIL”), an affiliate of Franklin Advisers and a sub-adviser to your fund prior to the Merger, with and into FTIML. In connection with the Merger, PIL investment professionals would become employees of FTIML, and, upon consummation of the Merger, PIL would cease to exist as a separate legal entity.
The Trustees noted that Franklin Templeton viewed the Merger as a further step in the integration of the legacy Putnam and Franklin Templeton organizations, offering potential operational efficiencies and enhanced investment resources for the funds. The Trustees also considered, among other factors, that:
• The Merger and the New FTIML Sub-Advisory Agreement would not result in any reduction or material change in the nature or the level of the sub-advisory services provided to the funds;
• The PIL portfolio managers who are responsible for the day-to-day management of the applicable funds would be the same immediately prior to, and immediately after, the Merger, and these investment personnel would have access to the same research and other resources to support their respective investment advisory functions and operate under the same conditions both immediately before and after the Merger;
• Despite a change in the sub-advisory fee structure for certain funds, the New FTIML Sub-Advisory Agreement would not result in an increase in the advisory fee rates payable by each fund, as Franklin Advisers would be responsible for overseeing the investment advisory services provided to the applicable funds by FTIML under the New FTIML Sub-Advisory Agreement and would compensate FTIML for such services out of the fees it receives under each fund’s Management Contract with Franklin Advisers; and
• The terms of the New FTIML Sub-Advisory Agreement were substantially similar to those under the New PIL Sub-Management Contract (defined below) 1 between Franklin Advisers and PIL.
The Trustees also considered that, prior to the Merger, counsel to Franklin Advisers and FTIML had provided a legal opinion that the Merger and the appointment of FTIML as sub-adviser to the funds would not result in an “assignment” under the 1940 Act of the New PIL Sub-Management Contract and that the New FTIML Sub-Advisory Agreement did not require shareholder approval.
The Trustees also took into account that they had most recently approved the fund’s New PIL Sub-Management Contract in June 2024. Because, other than the parties to the contract, the revised sub-advisory fee structure for certain funds, and certain other non-substantive changes to contractual terms, the New FTIML Sub-Advisory Agreement was substantially similar to the New PIL Sub-Management Contract, the Trustees relied to a considerable extent on their previous approval of the New PIL Sub-Management Contract, which is described below.
Board of Trustees’ Conclusions
After considering the factors described above and those described below under the heading “Considerations and conclusions in connection with the Trustees’ June 2024 approvals,” as well as other factors, the Board of Trustees, including all of the Independent Trustees, concluded that the fees payable under the New FTIML Sub-Advisory Agreement represented reasonable compensation in light of the nature and quality of the services that would be provided to the funds, and determined to approve the New FTIML Sub-Advisory Agreement for your fund. These conclusions were based on a comprehensive consideration of all information provided to the Trustees and were not the result of any single factor.
Considerations and conclusions in connection with the Trustees’ June 2024 approvals
At its meeting on June 28, 2024, the Board of Trustees of your fund, including all of the Independent Trustees, approved a New Management Contract (defined below) between your fund and Franklin Advisers, a New PIL Sub-Management Contract (defined below) for your fund between Franklin Advisers and its affiliate, PIL, and a new subadvisory agreement (the “New Putnam Management Subadvisory Agreement”) for your fund between Franklin Advisers and Putnam Investment Management, LLC (“Putnam Management”) (collectively, the “New Advisory Contracts”). Franklin Advisers, Putnam Management, and PIL are each direct or indirect, wholly-owned subsidiaries of Franklin Templeton.
The Trustees considered the proposed New Advisory Contracts in connection with an internal reorganization (the “Reorganization”) whereby the fixed income and Investment Solutions investment operations of Putnam Management, your fund’s investment adviser prior to the Reorganization, were combined with those of Franklin Advisers. As part of the Reorganization, Franklin Advisers assumed the role of investment
1 The New PIL Sub-Management Contract was operative until the effective date of the Merger, November 1, 2024, and was replaced by the New FTIML Sub-Advisory Agreement effective as of that date.
adviser for your fund and the other Putnam fixed income and Investment Solutions mutual funds, exchange-traded funds and closed-end funds (collectively, the “FI/IS Funds”), which was accomplished through a transfer by Putnam Management of all of its rights and obligations under the previous management contracts between Putnam Management and the FI/IS Funds (the “Previous Management Contracts”) and the previous sub-management contract between Putnam Management and its affiliate, PIL, with respect to the FI/IS Funds (the “Previous Sub-Management Contract,” and, together with the Previous Management Contracts, the “Previous Contracts”) to Franklin Advisers (the “Contract Transfers”) by means of assignment and assumption agreements (the Previous Management Contracts and the Previous Sub-Management Contract, as modified by the terms of the related assignment and assumption agreements, are hereinafter referred to as the “New Management Contracts” and the “New PIL Sub-Management Contract,” respectively). (Because PIL is an affiliate of Franklin Advisers and Franklin Advisers remains fully responsible for all services provided by PIL, the Trustees did not attempt to evaluate PIL as a separate entity.)
In addition to the New Management Contracts and New PIL Sub-Management Contract, the Board of Trustees of your fund considered and approved the New Putnam Management Subadvisory Agreement pursuant to which Franklin Advisers retained Putnam Management as sub-adviser for each FI/IS Fund so that, following the Reorganization, Putnam Management’s equity team, which was not part of the Reorganization, could continue to provide certain services that it had historically provided to the FI/IS Funds, including, as applicable, the management of the equity portion of a FI/IS Fund’s portfolio, including equity trade execution services, the provision of derivatives and other investment trading facilities for a transitional period, and the provision of proxy voting services for a transitional period (the “Services”).
In connection with the review process, the Independent Trustees’ independent legal counsel (as that term is defined in Rule 0-1(a)(6)(i) under the 1940 Act) met with representatives of Putnam Management and Franklin Templeton to discuss the contract review materials that would be furnished to the Contract Committee. The Board of Trustees, with the assistance of its Contract Committee (which consists solely of Independent Trustees) and its independent legal counsel, requested and evaluated all information it deemed reasonably necessary under the circumstances in connection with its review of the New Management Contracts. Over the course of several months ending in June 2024, the Contract Committee met on a number of occasions with representatives of Putnam Management and Franklin Templeton, and separately in executive session, to consider the information provided. Throughout this process, the Contract Committee was assisted by the members of the Board of Trustees’ independent staff and by independent legal counsel for the Independent Trustees.
At the Board of Trustees’ June 2024 meeting, the Contract Committee met in executive session to discuss and consider its recommendations with respect to the approval of the New Advisory Contracts. At that meeting, the Contract Committee also met in executive session with the other Independent Trustees to discuss its observations and recommendations.
The Trustees noted that Franklin Templeton viewed the Reorganization as a further step in the integration of the legacy Putnam Management and Franklin Advisers fixed income and Investment Solutions organizations, offering potential operational efficiencies and enhanced investment resources for the FI/IS Funds. The Trustees also considered, among other factors, that:
• The Contract Transfers would not result in a change in the senior management at Franklin Templeton, so that the same management will be in place before and after the Contract Transfers, which contemplate no reduction in the nature and level of the advisory and administrative services provided to the FI/IS Funds;
• The portfolio managers who are responsible for the day-to-day management of the FI/IS Funds would be the same immediately prior to, and immediately after, the Contract Transfers, and these investment personnel would have access to the same research and other resources to support their respective investment management functions both before and immediately after the Contract Transfers; and
• The Contract Transfers would not result in an increase in the advisory fee rates payable by each FI/IS Fund and that, other than an acknowledgment by Franklin Advisers and Putnam Management that for purposes of the New Management Contracts, each applicable FI/IS Fund will continue to be “an open-end fund sponsored by Putnam Management,” for purposes of calculating the advisory fee rates, and updating the parties to the agreements, the terms of the New Management Contracts and New PIL Sub-Management Contract were substantially identical to those under the Previous Contracts (including with respect to the term of the New Management Contracts and New PIL Sub-Management Contract, which run through June 30, 2025, unless the contracts are sooner terminated or continued pursuant to their terms).
With respect to the New Putnam Management Subadvisory Agreement, the Trustees considered that, under the agreement, Putnam Management would provide any necessary Services to the applicable FI/IS Fund under generally the same terms and conditions related to the FI/IS Fund as such Services were previously provided by Putnam Management under the FI/IS Fund’s Previous Management Contract. The Trustees also considered that Franklin Advisers would be responsible for overseeing the Services provided to the FI/IS Funds by Putnam Management under the New Putnam Management Subadvisory Agreement and would compensate Putnam Management for such services out of the fees it receives under the New Management Contracts. The Trustees further noted Franklin Advisers’ and Putnam Management’s representations that Putnam Management’s appointment as sub-adviser to the FI/IS Funds would not result in any material change in the nature or level of investment advisory services provided to the FI/IS Funds.
The Trustees also considered that, prior to the Reorganization, counsel to Franklin Advisers and Putnam Management had provided a legal opinion that the Contract Transfers would not result in an “assignment” under the 1940 Act of the Previous Contracts or a material amendment of those contracts, and, therefore, the New Management Contracts and New PIL Sub-Management Contract did not require shareholder approval. In addition, the Trustees considered that counsel to Franklin Advisers and Putnam Management had provided a legal opinion that shareholder approval of the New Putnam Management Subadvisory Agreement was not required under the 1940 Act.
General conclusions
In addition to the above considerations, the Independent Trustees’ approvals were based on the following conclusions:
• That the fee schedule in effect for your fund represented reasonable compensation in light of the nature and quality of the services being provided to the fund, the fees paid by competitive funds and the application of certain reductions and waivers noted below; and
• That the fee schedule in effect for your fund represented an appropriate sharing between fund shareholders and Franklin Advisers of any
• economies of scale as may exist in the management of the fund at current asset levels.
These conclusions were based on a comprehensive consideration of all information provided to the Trustees and were not the result of any single factor. Some of the factors that figured particularly in the Trustees’ deliberations and how the Trustees considered these factors are described below, although individual Trustees may have evaluated the information presented differently, giving different weights to various factors. The considerations and conclusions discussed herein were also informed by the fact that there would be continuity in the management of the FI/IS Funds, including your fund, immediately following the Reorganization (i.e., the same portfolio managers that managed the fund prior to the Reorganization would be in place immediately following the Reorganization). The Trustees also considered that the FI/IS Funds had no operating history with Franklin Templeton or its affiliates prior to 2024.
Management fee schedules and total expenses
Under its Previous Management Contract and under its New Management Contract, your fund has the benefit of breakpoints in its management fee schedule that provide shareholders with reduced fee levels as assets under management in the Putnam family of funds increase (“Fund Family Breakpoints”). The Trustees considered that breakpoints in a fund’s management fee schedule, such as the Fund Family Breakpoints in place for your fund, were one way in which economies of scale in managing a fund can be shared with the fund’s shareholders. The Trustees reviewed the total expenses of each Putnam fund, recognizing that in most cases management fees represented the major, but not the sole, determinant of total costs to fund shareholders. (Two mutual funds and each of the exchange-traded funds have implemented so-called “all-in” or unitary management fees covering substantially all routine fund operating costs.)
As in the past, the Trustees also focused on the competitiveness of each fund’s total expense ratio. The Trustees, Putnam Management and the funds’ investor servicing agent, Putnam Investor Services, Inc. (“PSERV”), have implemented expense limitations. These expense limitations were: (i) a contractual expense limitation applicable to specified mutual funds, including your fund, of 25 basis points on investor servicing fees and expenses and (ii) a contractual expense limitation applicable to specified mutual funds, including your fund, of 20 basis points on so-called “other expenses” (i.e., all expenses exclusive of management fees, distribution fees, investor servicing fees, investment-related expenses, interest, taxes, brokerage commissions, acquired fund fees and expenses and extraordinary expenses). These expense limitations attempt to maintain competitive expense levels for the funds. Most funds, including your fund, had sufficiently low expenses that these expense limitations were not operative during their fiscal years ending in 2023. Franklin Advisers, who now serves as your fund’s investment adviser following the Reorganization, and PSERV have agreed to maintain these expense limitations until at least February 28, 2026. In addition, Franklin Advisers contractually agreed to waive fees and/or reimburse expenses of your fund to the extent that expenses of the fund (excluding payments under the fund’s distribution plans, investor servicing fees, brokerage, interest, taxes, investment-related expenses, extraordinary expenses and acquired fund fees and expenses) would exceed an annual rate of 0.33% of its average net assets through at least February 28, 2026. During its fiscal year ending in 2023, your fund’s expenses were reduced as a result of this expense limitation. Franklin Advisers’ and PSERV’s commitment to these expense limitation arrangements, which were intended to support an effort to have fund expenses meet competitive standards, was an important factor in the Trustees’ decision to approve your fund’s New Advisory Contracts.
The Trustees reviewed comparative fee and expense information for a custom group of competitive funds selected by Broadridge Financial Solutions, Inc. (“Broadridge”). This comparative information included your fund’s percentile ranking for effective management fees and total expenses (excluding any applicable 12b-1 fees), which provides a general indication of your fund’s relative standing. In the custom peer group, your fund ranked in the third quintile in effective management fees (determined for your fund and the other funds in the custom peer group based on fund asset size and the applicable contractual management fee schedule) and in the third quintile in total expenses (excluding any applicable 12b-1 fees) as of December 31, 2023. The first quintile represents the least expensive funds and the fifth quintile the most expensive funds. The fee and expense data reported by Broadridge as of December 31, 2023 reflected the most recent fiscal year-end data available in Broadridge’s database at that time.
In connection with their review of fund management fees and total expenses, the Trustees also reviewed the costs of the services provided and the profits realized by Putnam Management and its affiliates from their contractual relationships with the funds. This information included year-over-year data with respect to revenues, expenses and profitability of Putnam Management and its affiliates relating to the investment management, investor servicing and distribution services provided to the funds, as applicable. In this regard, the Trustees also reviewed an analysis of the revenues, expenses and profitability of Putnam Management and its affiliates, allocated on a fund-by-fund basis, with respect to (as applicable) the funds’ management, distribution and investor servicing contracts. For each fund, the analysis presented information about revenues, expenses and profitability in 2023 for each of the applicable agreements separately and for the agreements taken together on a combined basis. The Trustees also reviewed the revenues, expenses and profitability of Franklin Templeton’s global investment management business and its U.S. registered investment company business, which includes the financial results of Franklin Advisers. Because the FI/IS Funds had no operating history with Franklin Templeton or its affiliates, the Trustees did not review fund-by-fund profitability information for Franklin Templeton. The Trustees concluded that, at current asset levels, the fee schedules in place for each of the funds, including the fee schedule for your fund, represented reasonable compensation for the services to be provided by Franklin Advisers (which are substantially identical to those historically provided by Putnam Management) and represented an appropriate sharing between fund shareholders and Franklin Advisers of any economies of scale as may exist in the management of the funds at that time.
The information examined by the Trustees in connection with their review of the New Advisory Contracts included information regarding services provided and fees charged by Putnam Management and its affiliates to other clients, including collective investment trusts offered in the defined contribution retirement plan market, sub-advised mutual funds, private funds sponsored by affiliates of Putnam Management, model-only separately managed accounts and Putnam Management’s manager-traded separately managed account programs. This information included, in cases where a product’s investment strategy corresponds with a FI/IS Fund’s strategy, comparisons of those fees with fees charged to the funds, as well as an assessment of the differences in the services provided to these clients as compared to the services provided to the funds. The Trustees also considered information regarding
services provided and fees charged by Franklin Advisers and its other Franklin Templeton affiliates to other clients, including U.S. registered mutual funds, funds organized outside of the United States (i.e., offshore funds), separate accounts (including separately managed accounts), collective investment trusts and sub-advised funds, which included, where applicable, the specific fees charged to strategies that are comparable to those of the FI/IS Funds. The Trustees observed that the differences in fee rates between these clients and the funds are by no means uniform when examined by individual asset sectors, suggesting that differences in the pricing of investment management services to these types of clients may reflect, among other things, historical competitive forces operating in separate marketplaces. The Trustees considered the fact that in many cases fee rates across different asset classes are higher on average for 1940 Act-registered funds than for other clients, and the Trustees also considered the differences between the services that Putnam Management historically provided and that Franklin Advisers will provide to the FI/IS Funds as investment adviser and those that they provide to their other clients. The Trustees did not rely on these comparisons to any significant extent in concluding that the management fees paid by your fund are reasonable.
Investment performance
The quality of the investment process provided by Putnam Management represented a major factor in the Trustees’ evaluation of the quality of services provided by Putnam Management under your fund’s Previous Management Contract and was also a significant factor in considering approval of your fund’s New Management Contract, since the portfolio managers of your fund that were employed by Putnam Management prior to the Reorganization would continue to serve as portfolio managers of your fund immediately following the Reorganization as employees of Franklin Advisers. The Trustees were assisted in their review of Putnam Management’s investment process and performance by the work of the investment oversight committees of the Trustees and the full Board of Trustees, which met on a regular basis with individual portfolio managers and with senior management of Putnam Management’s Investment Division throughout the year. The Trustees concluded that Putnam Management generally provided a high-quality investment process — based on the experience and skills of the individuals assigned to the management of fund portfolios, the resources made available to them and in general Putnam Management’s ability to attract and retain high-quality personnel — but also recognized that this does not guarantee favorable investment results for every fund in every time period. In addition to Putnam Management’s investment process and performance, the Trustees considered aggregate performance information for Franklin Advisers’ fixed income and Investment Solutions investment strategies, and also met with senior investment leadership at Franklin Advisers, including the respective heads of the fixed income and Investment Solutions teams and the Head of Public Market Investments.
The Trustees considered that, in the aggregate, peer-relative and benchmark-relative Putnam fund performance was generally strong in 2023 against a backdrop of largely solid fixed income markets and strong but volatile equity markets, which were characterized by a concentration of performance among large-cap growth stocks. The Trustees also noted that corporate earnings and employment figures continued to generally show strength, underpinning market rallies in 2023, while inflation concerns, Federal Reserve actions to reduce inflation and geopolitical tensions continued to be a focus of investors. For the one-year period ended December 31, 2023, the Trustees considered that the Putnam funds, on an asset-weighted basis, ranked in the 32nd percentile of their peers as determined by LSEG Lipper (“Lipper”) and, on an asset-weighted-basis, outperformed their benchmarks by 2.8% gross of fees over the one-year period. The Committee also noted that the funds’ aggregate performance over longer-term periods continued to be strong, with the funds, on an asset-weighted basis, ranking in the 31st, 21st, and 22nd percentiles of their Lipper peers over the three-year, five-year and ten-year periods ended December 31, 2023, respectively. The Trustees further noted that the funds, in the aggregate, outperformed their benchmarks on a gross basis for each of the three-year, five-year and ten-year periods. The Trustees also considered the Morningstar, Inc. ratings assigned to the funds, noting that 45 funds were rated four or five stars at the end of 2023, which represented an increase of 5 funds year-over-year. The Trustees also considered that 18 funds were five-star rated at the end of 2023, which was a year-over-year increase of 11 funds, and that 90% of the funds’ aggregate assets were in four- or five-star rated funds at year end.
In addition to the performance of the individual Putnam funds, the Trustees considered, as they had in prior years, the performance of The Putnam Fund complex versus competitor fund complexes, as reported in the Barron’s/Lipper Fund Families survey (the “Survey”). The Trustees noted that the Survey ranks mutual fund companies based on their performance across a variety of asset types, and that The Putnam Fund complex had performed exceptionally well in 2023. In this regard, the Trustees considered that The Putnam Fund complex had ranked 1st out of 49 fund companies, 1st out of 47 fund companies and 5th out of 46 fund companies for the one-year, five-year and ten-year periods, respectively. The Trustees also noted that 2023 had marked the seventh year in a row that The Putnam Fund complex had ranked in the top ten fund companies. They also noted, however, the disappointing investment performance of some Putnam funds for periods ended December 31, 2023 and considered information provided by Putnam Management regarding the factors contributing to the underperformance and, where relevant, actions being taken to improve the performance of these particular funds. The Trustees indicated their intention to continue to monitor the performance of those funds.
For purposes of the Trustees’ evaluation of the Putnam funds’ investment performance, the Trustees generally focus on a competitive industry ranking of each fund’s total net return over a one-year, three-year and five-year period. In the case of your fund, the Trustees considered that its class A share cumulative total return performance at net asset value was in the following quartiles of its Lipper peer group (Lipper Core Bond Funds) for the one-year, three-year and five-year periods ended December 31, 2023 (the first quartile representing the best-performing funds and the fourth quartile the worst-performing funds):
| One-year period | Three-year period | Five-year period |
| 4th | 4th | 4th |
Over the one-year, three-year and five-year periods ended December 31, 2023, there were 518, 487, and 459 funds, respectively, in your fund’s Lipper peer group. (When considering performance information, shareholders should be mindful that past performance is not a guarantee of future results.)
The Trustees expressed concern about your fund’s fourth quartile performance over the one-year, three-year and five-year periods ended December 31, 2023 and considered the circumstances that may have contributed to this disappointing performance. The Trustees considered Putnam Management’s observation that the fund’s underperformance over those periods was primarily driven by the fund’s overweight allocation to the securitized products sector. The Trustees observed that significant underperformance in the securitized products sector
in 2021 had contributed to the fund’s disappointing results, noting that prepayment strategies had suffered as a result of significantly elevated refinancing (given strong home price appreciation and low interest rates) relative to expectations. The Trustees considered that the fund’s underperformance was also driven by significant underperformance in the securitized products sector in 2020 and 2023. In addition, the Trustees considered the negative impact that the fund’s term structure strategies had on performance in 2021.
The Trustees noted Putnam Management’s observation that the fund had generally not actively employed term structure strategies over the previous two years. The Trustees considered Putnam Management’s discussion regarding the ways in which the fund’s investment approach was evolving and Putnam Management’s progress with respect to reducing the fund’s exposure to securitized products. The Trustees considered the fund’s top quartile performance over the one-year period ended March 31, 2024. The Trustees also noted that Putnam Management remained confident in the fund’s portfolio managers.
As a general matter, the Trustees believe that cooperative efforts between the Trustees and a fund’s investment adviser represent the most effective way to address investment performance concerns that may arise from time to time. The Trustees noted that investors in the Putnam funds have, in effect, placed their trust in the Putnam organization, under the oversight of the funds’ Trustees, to make appropriate decisions regarding the management of the funds. The Trustees also considered that Putnam Management has made changes in light of subpar investment performance when warranted. The Trustees concluded that it continued to be advisable to seek change within the fund’s investment adviser to address performance shortcomings. In the Trustees’ view, the alternative of engaging a new investment adviser for an underperforming fund, with all the attendant risks and disruptions, would not likely provide any greater assurance of improved investment performance.
Brokerage and soft-dollar allocations and other benefits; distribution
The Trustees considered various potential benefits that Franklin Advisers and Putnam Management may receive in connection with the services provided under the New Advisory Contracts to your fund. These include benefits related to brokerage allocation and the use of soft dollars, whereby a portion of the commissions paid by a fund for brokerage may be used to acquire research services that are expected to be useful to Franklin Advisers and Putnam Management in managing the assets of the fund and of other clients. Subject to policies established by the Trustees, soft dollars generated by these means are used predominantly to acquire brokerage and research services (including third-party research and market data) that would enhance Franklin Advisers’ and Putnam Management’s investment capabilities and supplement their internal research efforts. The Trustees intend to continue to monitor regulatory and industry developments in this area with the assistance of their Brokerage Committee. In addition, with the assistance of their Brokerage Committee, the Trustees intend to continue to monitor the allocation of the funds’ brokerage in order to ensure that the principle of seeking best price and execution remains paramount in the portfolio trading process. Your fund is not expected to generate a significant amount of soft-dollar credits.
The Trustees also considered other potential benefits that Franklin Advisers and Putnam Management may receive in connection with the services provided under the New Advisory Contracts to your fund. These potential benefits included, among others, Franklin Advisers’ and Putnam Management’s registered fund businesses aiding in the growth of their non-registered fund businesses and the use of an affiliated transfer agent’s services (in the case of your fund, PSERV, which is affiliated with Franklin Advisers and Putnam Management), where the fees for those services are paid by the fund.
Franklin Advisers may also receive benefits from payments made to Franklin Advisers’ affiliates by the mutual funds for distribution services. In connection with the consolidation of Putnam Retail Management Limited Partnership (“PRM”) with Franklin Distributors, LLC (“FD”), which took place on August 2, 2024 (the “Consolidation”), the Trustees appointed FD as principal underwriter of the mutual funds, effective on August 2, 2024. Both PRM and FD are affiliates of Franklin Advisers and Putnam Management. In approving the continuation of your fund’s distribution plans, the Trustees concluded that the fees payable by the mutual funds to PRM, prior to FD succeeding PRM as principal underwriter for the mutual funds, and to be paid to FD, once it assumed the role of principal underwriter, for distribution services were fair and reasonable in relation to the nature and quality of such services, the fees paid by competitive funds and the costs incurred by PRM and FD, as applicable, in providing such services.
| |
 | | |
| © 2024 Franklin Templeton. All rights reserved. | 38901-AFSOI 12/24 |
| |
| Item 8. Changes in and Disagreements with Accountants for Open-End Management Investment Companies. |
| |
| Included in Item 7 above. |
| |
| Item 9. Proxy Disclosure for Open-End Management Investment Companies. |
| |
| Included in Item 7 above. |
| |
| Item 10. Remuneration Paid to Directors, Officers, and Others of Open-End Management Investment Companies. |
| |
| Included in Item 7 above. |
| |
| Item 11. Statement Regarding Basis for Approval of Investment Advisory Contract. |
| |
| Included in Item 7 above. |
| |
| Item 12. Disclosure of Proxy Voting Policies and Procedures For Closed-End Management Investment Companies: |
| |
| Item 13. Portfolio Managers of Closed-End Investment Companies |
| |
| Item 14. Purchases of Equity Securities by Closed-End Management Investment Companies and Affiliated Purchasers: |
| |
| Item 15. Submission of Matters to a Vote of Security Holders: |
| |
| Item 16. Controls and Procedures: |
| |
| (a) The registrant’s principal executive officer and principal financial officer have concluded, based on their evaluation of the effectiveness of the design and operation of the registrant’s disclosure controls and procedures as of a date within 90 days of the filing date of this report, that the design and operation of such procedures are generally effective to provide reasonable assurance that information required to be disclosed by the registrant in this report is recorded, processed, summarized and reported within the time periods specified in the Commission’s rules and forms. |
| |
| (b) Changes in internal control over financial reporting: Not applicable |
| |
| Item 17. Disclosures of Securities Lending Activities for Closed-End Investment Companies: |
| |
| Item 18. Recovery of Erroneously Awarded Compensation. |
| |
| (a)(1) The Code of Ethics of The Putnam Funds and Franklin Templeton are filed herewith. |
| |
| (a)(2) Any policy required by the listing standards adopted pursuant to Rule 10D-1 under the Exchange Act (17 CFR 240.10D-1) by the registered national securities exchange or registered national securities association upon which the registrant’s securities are listed. |
| |
| Pursuant to the requirements of the Securities Exchange Act of 1934 and the Investment Company Act of 1940, the registrant has duly caused this report to be signed on its behalf by the undersigned, thereunto duly authorized. |
| |
| By (Signature and Title): |
| |
| Jeffrey White
Principal Accounting Officer |
| |
| Pursuant to the requirements of the Securities Exchange Act of 1934 and the Investment Company Act of 1940, this report has been signed below by the following persons on behalf of the registrant and in the capacities and on the dates indicated. |
| |
| By (Signature and Title): |
| |
| Jonathan S. Horwitz
Principal Executive Officer |
| |
| By (Signature and Title): |
| |
| Jeffrey White
Principal Financial Officer |