| | | |
| UNITED STATES |
| SECURITIES AND EXCHANGE COMMISSION |
| Washington, D.C. 20549 |
| |
| FORM N-CSR |
|
| CERTIFIED SHAREHOLDER REPORT OF REGISTERED |
| MANAGEMENT INVESTMENT COMPANIES |
| | |
| Investment Company Act file number: (811-00159) | |
| | |
| Exact name of registrant as specified in charter: | Putnam Investors Fund |
| |
| Address of principal executive offices: One Post Office Square, Boston, Massachusetts 02109 |
| | |
| Name and address of agent for service: | Beth S. Mazor, Vice President |
| | One Post Office Square |
| | Boston, Massachusetts 02109 |
| | |
| Copy to: | | John W. Gerstmayr, Esq. |
| | Ropes & Gray LLP |
| | 800 Boylston Street |
| | Boston, Massachusetts 02199-3600 |
| | |
| Registrant’s telephone number, including area code: | (617) 292-1000 |
| | | |
| Date of fiscal year end: July 31, 2011 | | |
| |
| Date of reporting period: August 1, 2010 — January 31, 2011 |
Item 1. Report to Stockholders:
The following is a copy of the report transmitted to stockholders pursuant to Rule 30e-1 under the Investment Company Act of 1940:

Putnam
Investors
Fund
Semiannual report
1 | 31 | 11
| | |
| Message from the Trustees | 1 | |
| |
| About the fund | 2 | |
| |
| Performance snapshot | 4 | |
| |
| Interview with your fund’s portfolio manager | 5 | |
| |
| Your fund’s performance | 10 | |
| |
| Your fund’s expenses | 12 | |
| |
| Terms and definitions | 14 | |
| |
| Other information for shareholders | 15 | |
| |
| Financial statements | 16 | |
| |
Message from the Trustees
Dear Fellow Shareholder:
The U.S. economy and most economies around the world have continued to strengthen in early 2011, building on last year’s solid growth. The U.S. stock market added gains, delivering one of the best January returns in several years. Investors are encouraged by positive economic data, healthy corporate earnings, extended tax cuts, and historically low interest rates. Bond markets remain mixed, however, as U.S. Treasury yields have risen from their historic lows and investors have sought returns in riskier asset classes.
Putnam’s investment team maintains a positive outlook for U.S. equities in 2011, encouraged by steadily improving conditions in both the economy and in corporate America. The global outlook is less certain, with ongoing European debt issues, signs of inflation in emerging markets, and recent political uprisings in Egypt and other countries. While these global developments may well lead to future market volatility, we also believe that an active, research-focused manager like Putnam can uncover opportunities for shareholders in this environment.
In developments affecting oversight of your fund, we wish to thank Richard B. Worley and Myra R. Drucker, who have retired from the Board of Trustees, for their many years of dedicated and thoughtful leadership.
Lastly, we would like to take this opportunity to welcome new shareholders to the fund and to thank all of our investors for your continued confidence in Putnam.

About the fund
Investing in America’s large, growing companies
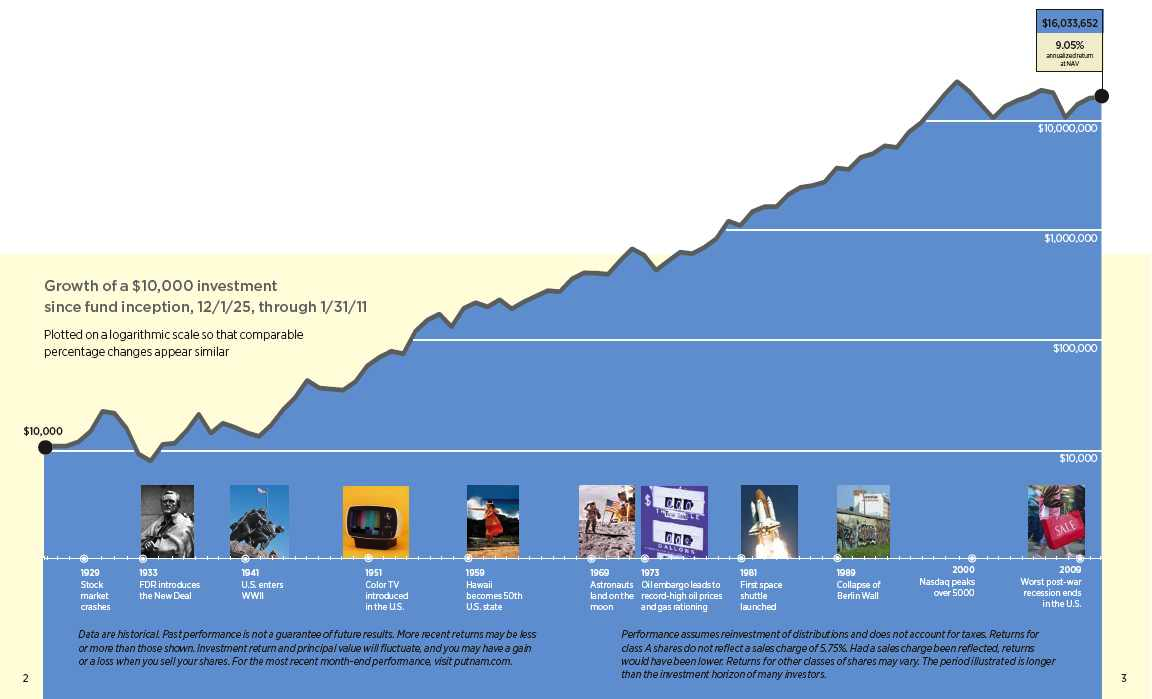
Putnam Investors Fund was founded in 1925 — the age of Model-T Fords, jazz, and the boundless optimism of one of the great American bull markets. Today, more than 85 years later, the fund continues to target leading American businesses, armed with the flexibility to invest across a range of stocks.
In the tradition of successful American stockpickers, the fund’s portfolio manager seeks opportunities that others may have overlooked.
The manager may see potential in value stocks, where investors may have temporarily pushed prices too low, or in fast-rising growth stocks, where investors have misjudged a company’s future growth.
The manager is supported by Putnam’s equity research analysts, who conduct thorough fundamental research, visiting companies and talking to their management, suppliers, and competitors to find out what each business is really worth. This research helps to identify companies whose stock prices may not reflect their long-range prospects.
While much has changed since 1925, Putnam Investors Fund continues to pursue a goal that never goes out of style — finding great companies for investors.
Consider these risks before investing: Growth stocks may be more susceptible to earnings disappointments, and value stocks may fail to rebound. The market may not favor growth- or value-style investing.

Current performance may be lower or higher than the quoted past performance, which cannot guarantee future results. Share price, principal value, and return will fluctuate, and you may have a gain or a loss when you sell your shares. Performance of class A shares assumes reinvestment of distributions and does not account for taxes. Fund returns in the bar chart do not reflect a sales charge of 5.75%; had they, returns would have been lower. See pages 5 and 10–11 for additional performance information. For a portion of the periods, the fund had expense limitations, without which returns would have been lower. To obtain the most recent month-end performance, visit putnam.com.
* The fund’s benchmark and Lipper category, the Standard & Poor’s 500 Index and Lipper Large-Cap Core Funds category, were introduced on 12/31/69 and 12/31/59, respectively, which post-date the inception of the fund’s class A shares.
† Returns for the six-month period are not annualized, but cumulative.
4
Interview with your fund’s portfolio manager
Gerard Sullivan
Jerry, how did Putnam Investors Fund perform for the six months ended January 31, 2011?
I am pleased to report that the fund’s class A shares delivered a positive return of 18.00% at net asset value, outperforming the fund’s benchmark, the S&P 500 Index, which advanced 17.93%. The fund’s performance also topped the average 17.00% return for funds in its Lipper peer group, Large-Cap Core Funds.
The fund’s solid performance was due in part to my emphasis on cyclical businesses — those whose performance is tied to the overall economy. I positioned the portfolio in anticipation of improving economic conditions, and sectors such as materials and industrials were among the strongest performers for the fund.
What can you tell us about market conditions during this time?
The period began during a volatile time for the markets. Stocks had declined sharply for several months, largely in response to the sovereign debt crisis in Greece, which led to broader worries about debt issues in other European Union countries. In August, the first month of the semiannual period, stocks declined sharply as investors continued to become discouraged about the slow pace of the U.S. economic recovery.
September, however, marked a turning point, when the S&P 500 Index, the fund’s benchmark and a broad measure of U.S. stock performance, advanced 8.92% — its best September in 71 years. The U.S. economy continued to find its footing, and investors grew slightly less concerned about the possibility of a double-dip recession. Investors remained energized by this September rally, and stocks delivered strong results through January.
A number of positive factors drove the market advance, including the fact that so many businesses have aggressively managed their

This comparison shows your fund’s performance in the context of broad market indexes for the six months ended 1/31/11. See pages 4 and 10–11 for additional fund performance information. Index descriptions can be found on page 14.
5
inventories, pared back costs, and refinanced debt at historically low interest rates. Because companies today are so lean, a bit of demand can go a long way in terms of profitability, and stock valuations had the potential to improve vastly. The November elections also helped stocks, as investors were encouraged by the extension of current tax rates and the expectation of less-onerous legislation. Continued monetary policy accommodations worldwide were also beneficial. In the United States, the Federal Reserve announced that it would implement another round of quantitative easing, known as “QE2” — a plan to buy $600 billion in Treasury bonds to help stimulate the economy. This boosted investor confidence as well as stock prices.
Could you highlight some holdings or strategies that helped performance for the period?
A top performer for the fund was National Oilwell Varco, a manufacturer of equipment and components used in oil and gas drilling. Despite the oil spill in the Gulf of Mexico in April 2010, which halted offshore drilling activity, investment in drilling equipment has remained strong. This has contributed significantly to the profitability of National Oilwell, whose products are used on most major oil rigs.
Fund performance was also boosted by my decision to avoid the stock of Merck, a pharmaceutical giant that is a significant component of our benchmark, the S&P 500 Index. This stock, which did not meet my criteria for holding it in the portfolio, struggled during the period, due in part to setbacks in clinical trials for some of its products.
It is also worth noting that a number of stocks in the fund’s portfolio have benefited from overall improvement in the automotive industry. I maintained relatively small positions in several auto-related stocks that, as a group, made a positive contribution to returns. As a result of the economic downturn, automotive companies — car manufacturers as well as those that supply equipment and components — have

Allocations are represented as a percentage of the fund’s net assets. Summary information may differ from the portfolio schedule included in the financial statements due to the inclusion of derivative securities and the exclusion of as-of trades, if any, and the use of different classifications of securities for presentation purposes. Holdings and allocations may vary over time.
6
restructured their businesses significantly, with some filing for bankruptcy protection. Many of these companies are now leaner and well positioned for continued improvement in auto sales. Among the top performers for the period was Sensata Technologies, which produces sensors and controls for automobiles. Other fund holdings that benefited from this automotive theme were Ford Motor, TRW Automotive Holdings, Lear, a supplier of automotive seat systems, and Autoliv, a supplier of automotive safety systems.

What were some holdings or strategies that detracted from returns?
One example was Iridium Communications, which provides mobile voice and data communications via satellite. In my view, this is a fundamentally strong company whose stock tends to be volatile, in large part because it is misunderstood by many investors. It is not a well-known company, but it provides an important service — 100% global coverage — to users such as military personnel, first responders in crisis situations, and freight trucking companies. Some investors are concerned about the cost of replacing its satellites in the coming years, but, in my opinion, Iridium has a strong management team and all of its businesses have been growing. I believe there are a number of catalysts for long-term growth from this company, and I continued to hold it in the portfolio at the close of the period.
In the struggling health-care sector, Johnson & Johnson and Omnicare were detractors. Johnson & Johnson is working through some manufacturing issues, and Omnicare’s shares struggled following the resignation of the company’s CEO, which created uncertainty among investors. By the close of the period, I had sold Omnicare from the portfolio.

This table shows the fund’s top 10 holdings and the percentage of the fund’s net assets that each represented as of 1/31/11. Short-term holdings are excluded. Holdings will vary over time.
7
Fund performance was also dampened by my decision not to hold Internet retailers Amazon and eBay. Both stocks were solid performers for the period, and both companies took a significant amount of market share from traditional retailers during the critical holiday shopping season. While I continue to believe these stocks are too expensive, I underestimated their competitive power, and not owning them detracted from the fund’s relative performance for the six-month period.
What is your outlook as you enter the second half of the fund’s fiscal year?
I believe the business outlook remains positive, domestically and internationally. Central banks around the world appear to be committed to stimulating economic growth. And while unemployment rates are still fairly high around the world, they seem to be stabilizing. These are good signs for the market. At the same time, we have companies that have retrenched enormously in the past two years. U.S. companies continue to post record profits and have record amounts of cash on their balance sheets. These cash levels bode well for stocks because companies can use the money for stock buybacks and merger-and-acquisition activity, both potentially positive for share prices. We are seeing cost structures that are already leading to high profit margins — at a fairly low level of economic activity. If economic growth continues, profitability could surge, and as investors, we don’t want to miss that.
Of course, while we have seen some bright spots in the areas of industrial production and factory activity, housing and automobile sales remain weak. However, there seems to be a general sense that the economy will not slip back into recession. And finally, the federal government’s compromise to extend the Bush-era tax cuts resolved investors’ uncertainty and helped avoid tax increases that might have stalled the economic recovery.
My focus remains on fundamental research and bottom-up stock selection, which means

This chart shows the fund’s largest allocation shifts, by percentage, over the past six months. Weightings are shown as a percentage of net assets. Summary information may differ from the portfolio schedule included in the financial statements due to the inclusion of derivative securities and the exclusion of as-of trades, if any, and the use of different classifications of securities for presentation purposes. Holdings will vary over time.
8
I’m more concerned with the long-term potential of individual companies than short-term developments in the markets or economy. I don’t get caught up in the day-to-day movements, but rather I make sure my research-intensive investment process stays intact, regardless of the macroeconomic environment.
Jerry, thank you for your time and insights today.
The views expressed in this report are exclusively those of Putnam Management. They are not meant as investment advice.
Please note that the holdings discussed in this report may not have been held by the fund for the entire period. Portfolio composition is subject to review in accordance with the fund’s investment strategy and may vary in the future. Current and future portfolio holdings are subject to risk.

Portfolio Manager Gerard Sullivan has an M.B.A. from the Columbia University Graduate School of Business and a B.A. from Columbia University. Jerry joined Putnam in 2008 and has been in the investment industry since 1982.
IN THE NEWS
The U.S. economic recovery is progressing, although the unemployment rate remains persistently high. Increases in exports, consumer spending, and existing home sales drove the fourth-quarter GDP growth of 2.8%, the Commerce Department reported. At its December meeting, the Federal Open Market Committee noted that the recent economic growth has been “insufficient to bring about a significant improvement in labor market conditions.” In January, the U.S. unemployment rate did inch down to 9.0% from 9.4%. Consumer spending remains constrained by high unemployment, while businesses may be investing more in equipment and less on new hires.
9
Your fund’s performance
This section shows your fund’s performance, price, and distribution information for periods ended January 31, 2011, the end of the first half of its current fiscal year. In accordance with regulatory requirements for mutual funds, we also include performance as of the most recent calendar quarter-end and expense information taken from the fund’s current prospectus. Performance should always be considered in light of a fund’s investment strategy. Data represent past performance. Past performance does not guarantee future results. More recent returns may be less or more than those shown. Investment return and principal value will fluctuate, and you may have a gain or a loss when you sell your shares. Performance information does not reflect any deduction for taxes a shareholder may owe on fund distributions or on the redemption of fund shares. For the most recent month-end performance, please visit the Individual Investors section at putnam.com or call Putnam at 1-800-225-1581. Class R and class Y shares are not available to all investors. See the Terms and Definitions section in this report for definitions of the share classes offered by your fund.
Fund performance Total return for periods ended 1/31/11
| | | | | | | | | | |
| | Class A | Class B | Class C | Class M | Class R | Class Y |
| (inception dates) | (12/1/25) | (3/1/93) | (7/26/99) | (12/2/94) | (1/21/03) | (1/7/97) |
|
| | NAV | POP | NAV | CDSC | NAV | CDSC | NAV | POP | NAV | NAV |
|
| Annual average | | | | | | | | | | |
| (life of fund) | 9.05% | 8.98% | 8.02% | 8.02% | 8.23% | 8.23% | 8.29% | 8.25% | 8.78% | 9.10% |
|
| 10 years | –10.03 | –15.18 | –16.64 | –16.64 | –16.52 | –16.52 | –14.45 | –17.43 | –12.08 | –7.84 |
| Annual average | –1.05 | –1.63 | –1.80 | –1.80 | –1.79 | –1.79 | –1.55 | –1.90 | –1.28 | –0.81 |
|
| 5 years | –4.04 | –9.54 | –7.72 | –9.55 | –7.59 | –7.59 | –6.46 | –9.77 | –5.21 | –2.85 |
| Annual average | –0.82 | –1.99 | –1.59 | –1.99 | –1.57 | –1.57 | –1.33 | –2.04 | –1.06 | –0.58 |
|
| 3 years | –0.03 | –5.80 | –2.40 | –5.31 | –2.25 | –2.25 | –1.53 | –4.97 | –0.76 | 0.64 |
| Annual average | –0.01 | –1.97 | –0.81 | –1.80 | –0.76 | –0.76 | –0.51 | –1.68 | –0.25 | 0.21 |
|
| 1 year | 21.49 | 14.51 | 20.59 | 15.59 | 20.63 | 19.63 | 20.86 | 16.65 | 21.20 | 21.77 |
|
| 6 months | 18.00 | 11.22 | 17.58 | 12.58 | 17.66 | 16.66 | 17.76 | 13.65 | 17.90 | 18.11 |
|
Current performance may be lower or higher than the quoted past performance, which cannot guarantee future results. After-sales-charge returns (public offering price, or POP) for class A and M shares reflect a maximum 5.75% and 3.50% load, respectively. Class B share returns reflect the applicable contingent deferred sales charge (CDSC), which is 5% in the first year, declining over time to 1% in the sixth year, and is eliminated thereafter. Class C shares reflect a 1% CDSC for the first year that is eliminated thereafter. Class R and Y shares have no initial sales charge or CDSC. Performance for class B, C, M, R, and Y shares before their inception is derived from the historical performance of class A shares, adjusted for the applicable sales charge (or CDSC) and the higher operating expenses for such shares, except for class Y shares, for which 12b-1 fees are not applicable.
For a portion of the periods, the fund had expense limitations, without which returns would have been lower.
Prior performance benefited from the receipt of a Tyco International, Ltd. class action settlement pertaining to investments made prior to 2003.
Class B share performance does not reflect conversion to class A shares.
10
Comparative index returns For periods ended 1/31/11
| | |
| | | Lipper Large-Cap Core Funds |
| | S&P 500 Index | category average* |
|
| Annual average (life of fund) | —† | —† |
|
| 10 years | 13.76% | 16.34% |
| Annual average | 1.30 | 1.30 |
|
| 5 years | 11.69 | 9.58 |
| Annual average | 2.24 | 1.77 |
|
| 3 years | –0.16 | –1.29 |
| Annual average | –0.05 | –0.49 |
|
| 1 year | 22.19 | 19.55 |
|
| 6 months | 17.93 | 17.00 |
|
Index and Lipper results should be compared to fund performance at net asset value.
* Over the 6-month, 1-year, 3-year, 5-year, and 10-year periods ended 1/31/11, there were 1,081, 1,063, 914, 769, and 462 funds, respectively, in this Lipper category.
† The fund’s benchmark and Lipper category, the Standard & Poor’s 500 Index and Lipper Large-Cap Core Funds category, were introduced on 12/31/69 and 12/31/59, respectively, which post-date the inception of the fund’s class A shares.
Fund price and distribution information For the six-month period ended 1/31/11
| | | | | | | | |
| Distributions | Class A | Class B | Class C | Class M | Class R | Class Y |
|
| Number | 1 | — | 1 | 1 | 1 | 1 |
|
| Income | $0.092 | — | $0.005 | $0.036 | $0.065 | $0.123 |
|
| Capital gains | — | — | — | — | — | — |
|
| Total | $0.092 | — | $0.005 | $0.036 | $0.065 | $0.123 |
|
| Share value | NAV | POP | NAV | NAV | NAV | POP | NAV | NAV |
|
| 7/31/10 | $11.15 | $11.83 | $10.01 | $10.56 | $10.52 | $10.90 | $11.00 | $11.32 |
|
| 1/31/11 | 13.06 | 13.86 | 11.77 | 12.42 | 12.35 | 12.80 | 12.90 | 13.24 |
|
The classification of distributions, if any, is an estimate. Final distribution information will appear on your year-end tax forms.
Fund performance as of most recent calendar quarter
Total return for periods ended 12/31/10
| | | | | | | | | | |
| | Class A | Class B | Class C | Class M | Class R | Class Y |
| (inception dates) | (12/1/25) | (3/1/93) | (7/26/99) | (12/2/94) | (1/21/03) | (1/7/97) |
|
| | NAV | POP | NAV | CDSC | NAV | CDSC | NAV | POP | NAV | NAV |
|
| Annual average | | | | | | | | | | |
| (life of fund) | 9.03% | 8.96% | 8.00% | 8.00% | 8.21% | 8.21% | 8.27% | 8.23% | 8.76% | 9.07% |
|
| 10 years | –13.36 | –18.35 | –19.72 | –19.72 | –19.69 | –19.69 | –17.63 | –20.50 | –15.41 | –11.22 |
| Annual average | –1.42 | –2.01 | –2.17 | –2.17 | –2.17 | –2.17 | –1.92 | –2.27 | –1.66 | –1.18 |
|
| 5 years | –3.41 | –8.98 | –7.01 | –8.85 | –7.00 | –7.00 | –5.84 | –9.13 | –4.66 | –2.22 |
| Annual average | –0.69 | –1.86 | –1.44 | –1.84 | –1.44 | –1.44 | –1.20 | –1.90 | –0.95 | –0.45 |
|
| 3 years | –10.67 | –15.79 | –12.75 | –15.34 | –12.70 | –12.70 | –12.07 | –15.12 | –11.38 | –10.05 |
| Annual average | –3.69 | –5.57 | –4.44 | –5.40 | –4.43 | –4.43 | –4.20 | –5.32 | –3.95 | –3.47 |
|
| 1 year | 14.06 | 7.48 | 13.29 | 8.29 | 13.30 | 12.29 | 13.47 | 9.47 | 13.81 | 14.34 |
|
| 6 months | 23.61 | 16.55 | 23.23 | 18.23 | 23.18 | 22.18 | 23.29 | 18.93 | 23.46 | 23.76 |
|
11
Your fund’s expenses
As a mutual fund investor, you pay ongoing expenses, such as management fees, distribution fees (12b-1 fees), and other expenses. Using the following information, you can estimate how these expenses affect your investment and compare them with the expenses of other funds. You may also pay one-time transaction expenses, including sales charges (loads) and redemption fees, which are not shown in this section and would have resulted in higher total expenses. For more information, see your fund’s prospectus or talk to your financial representative.
Expense ratios
| | | | | | |
| | Class A | Class B | Class C | Class M | Class R | Class Y |
|
| Total annual operating expenses for the fiscal year | | | | | | |
| ended 7/31/10 | 1.25% | 2.00% | 2.00% | 1.75% | 1.50% | 1.00% |
|
| Annualized expense ratio for the six-month period | | | | | | |
| ended 1/31/11 | 1.20% | 1.95% | 1.95% | 1.70% | 1.45% | 0.95% |
|
Fiscal-year expense information in this table is taken from the most recent prospectus, is subject to change, and may differ from that shown for the annualized expense ratio and in the financial highlights of this report. Expenses are shown as a percentage of average net assets.
Expenses per $1,000
The following table shows the expenses you would have paid on a $1,000 investment in the fund from August 1, 2010, to January 31, 2011. It also shows how much a $1,000 investment would be worth at the close of the period, assuming actual returns and expenses.
| | | | | | |
| | Class A | Class B | Class C | Class M | Class R | Class Y |
|
| Expenses paid per $1,000*† | $6.59 | $10.69 | $10.70 | $9.33 | $7.96 | $5.22 |
|
| Ending value (after expenses) | $1,180.00 | $1,175.80 | $1,176.60 | $1,177.60 | $1,179.00 | $1,181.10 |
|
* Expenses for each share class are calculated using the fund’s annualized expense ratio for each class, which represents the ongoing expenses as a percentage of average net assets for the six months ended 1/31/11. The expense ratio may differ for each share class.
† Expenses are calculated by multiplying the expense ratio by the average account value for the period; then multiplying the result by the number of days in the period; and then dividing that result by the number of days in the year.
12
Estimate the expenses you paid
To estimate the ongoing expenses you paid for the six months ended January 31, 2011, use the following calculation method. To find the value of your investment on August 1, 2010, call Putnam at 1-800-225-1581.

Compare expenses using the SEC’s method
The Securities and Exchange Commission (SEC) has established guidelines to help investors assess fund expenses. Per these guidelines, the following table shows your fund’s expenses based on a $1,000 investment, assuming a hypothetical 5% annualized return. You can use this information to compare the ongoing expenses (but not transaction expenses or total costs) of investing in the fund with those of other funds. All mutual fund shareholder reports will provide this information to help you make this comparison. Please note that you cannot use this information to estimate your actual ending account balance and expenses paid during the period.
| | | | | | |
| | Class A | Class B | Class C | Class M | Class R | Class Y |
|
| Expenses paid per $1,000*† | $6.11 | $9.91 | $9.91 | $8.64 | $7.37 | $4.84 |
|
| Ending value (after expenses) | $1,019.16 | $1,015.38 | $1,015.38 | $1,016.64 | $1,017.90 | $1,020.42 |
|
* Expenses for each share class are calculated using the fund’s annualized expense ratio for each class, which represents the ongoing expenses as a percentage of average net assets for the six months ended 1/31/11. The expense ratio may differ for each share class.
† Expenses are calculated by multiplying the expense ratio by the average account value for the period; then multiplying the result by the number of days in the period; and then dividing that result by the number of days in the year.
13
Terms and definitions
Important terms
Total return shows how the value of the fund’s shares changed over time, assuming you held the shares through the entire period and reinvested all distributions in the fund.
Net asset value (NAV) is the price, or value, of one share of a mutual fund, without a sales charge. NAVs fluctuate with market conditions. NAV is calculated by dividing the net assets of each class of shares by the number of outstanding shares in the class.
Public offering price (POP) is the price of a mutual fund share plus the maximum sales charge levied at the time of purchase. POP performance figures shown here assume the 5.75% maximum sales charge for class A shares and 3.50% for class M shares.
Contingent deferred sales charge (CDSC) is generally a charge applied at the time of the redemption of class B or C shares and assumes redemption at the end of the period. Your fund’s class B CDSC declines over time from a 5% maximum during the first year to 1% during the sixth year. After the sixth year, the CDSC no longer applies. The CDSC for class C shares is 1% for one year after purchase.
Share classes
Class A shares are generally subject to an initial sales charge and no CDSC (except on certain redemptions of shares bought without an initial sales charge).
Class B shares are not subject to an initial sales charge. They may be subject to a CDSC.
Class C shares are not subject to an initial sales charge and are subject to a CDSC only if the shares are redeemed during the first year.
Class M shares have a lower initial sales charge and a higher 12b-1 fee than class A shares and no CDSC (except on certain redemptions of shares bought without an initial sales charge).
Class R shares are not subject to an initial sales charge or CDSC and are available only to certain defined contribution plans.
Class Y shares are not subject to an initial sales charge or CDSC, and carry no 12b-1 fee. They are generally only available to corporate and institutional clients and clients in other approved programs.
Comparative indexes
Barclays Capital Aggregate Bond Index is an unmanaged index of U.S. investment-grade fixed-income securities.
BofA (Bank of America) Merrill Lynch U.S.
3-Month Treasury Bill Index is an unmanaged index that seeks to measure the performance of U.S. Treasury bills available in the marketplace.
S&P 500 Index is an unmanaged index of common stock performance.
Indexes assume reinvestment of all distributions and do not account for fees. Securities and performance of a fund and an index will differ. You cannot invest directly in an index.
Lipper is a third-party industry-ranking entity that ranks mutual funds. Its rankings do not reflect sales charges. Lipper rankings are based on total return at net asset value relative to other funds that have similar current investment styles or objectives as determined by Lipper. Lipper may change a fund’s category assignment at its discretion. Lipper category averages reflect performance trends for funds within a category.
14
Other information for shareholders
Important notice regarding delivery of shareholder documents
In accordance with SEC regulations, Putnam sends a single copy of annual and semiannual shareholder reports, prospectuses, and proxy statements to Putnam shareholders who share the same address, unless a shareholder requests otherwise. If you prefer to receive your own copy of these documents, please call Putnam at 1-800-225-1581, and Putnam will begin sending individual copies within 30 days.
Proxy voting
Putnam is committed to managing our mutual funds in the best interests of our shareholders. The Putnam funds’ proxy voting guidelines and procedures, as well as information regarding how your fund voted proxies relating to portfolio securities during the 12-month period ended June 30, 2010, are available in the Individual Investors section of putnam.com, and on the SEC’s Web site, www.sec.gov. If you have questions about finding forms on the SEC’s Web site, you may call the SEC at 1-800-SEC-0330. You may also obtain the Putnam funds’ proxy voting guidelines and procedures at no charge by calling Putnam’s Shareholder Services at 1-800-225-1581.
Fund portfolio holdings
The fund will file a complete schedule of its portfolio holdings with the SEC for the first and third quarters of each fiscal year on Form N-Q. Shareholders may obtain the fund’s Forms N-Q on the SEC’s Web site at www.sec.gov. In addition, the fund’s Forms N-Q may be reviewed and copied at the SEC’s Public Reference Room in Washington, D.C. You may call the SEC at 1-800-SEC-0330 for information about the SEC’s Web site or the operation of the Public Reference Room.
Trustee and employee fund ownership
Putnam employees and members of the Board of Trustees place their faith, confidence, and, most importantly, investment dollars in Putnam mutual funds. As of January 31, 2011, Putnam employees had approximately $352,000,000 and the Trustees had approximately $68,000,000 invested in Putnam mutual funds. These amounts include investments by the Trustees’ and employees’ immediate family members as well as investments through retirement and deferred compensation plans.
15
Financial statements
A guide to financial statements
These sections of the report, as well as the accompanying Notes, constitute the fund’s financial statements.
The fund’s portfolio lists all the fund’s investments and their values as of the last day of the reporting period. Holdings are organized by asset type and industry sector, country, or state to show areas of concentration and diversification.
Statement of assets and liabilities shows how the fund’s net assets and share price are determined. All investment and non-investment assets are added together. Any unpaid expenses and other liabilities are subtracted from this total. The result is divided by the number of shares to determine the net asset value per share, which is calculated separately for each class of shares. (For funds with preferred shares, the amount subtracted from total assets includes the liquidation preference of preferred shares.)
Statement of operations shows the fund’s net investment gain or loss. This is done by first adding up all the fund’s earnings — from dividends and interest income — and subtracting its operating expenses to determine net investment income (or loss). Then, any net gain or loss the fund realized on the sales of its holdings — as well as any unrealized gains or losses over the period — is added to or subtracted from the net investment result to determine the fund’s net gain or loss for the fiscal period.
Statement of changes in net assets shows how the fund’s net assets were affected by the fund’s net investment gain or loss, by distributions to shareholders, and by changes in the number of the fund’s shares. It lists distributions and their sources (net investment income or realized capital gains) over the current reporting period and the most recent fiscal year-end. The distributions listed here may not match the sources listed in the Statement of operations because the distributions are determined on a tax basis and may be paid in a different period from the one in which they were earned. Dividend sources are estimated at the time of declaration. Actual results may vary. Any non-taxable return of capital cannot be determined until final tax calculations are completed after the end of the fund’s fiscal year.
Financial highlights provide an overview of the fund’s investment results, per-share distributions, expense ratios, net investment income ratios, and portfolio turnover in one summary table, reflecting the five most recent reporting periods. In a semiannual report, the highlights table also includes the current reporting period.
16
The fund’s portfolio 1/31/11 (Unaudited)
| | |
| COMMON STOCKS (99.8%)* | Shares | Value |
|
| Aerospace and defense (2.5%) | | |
| General Dynamics Corp. | 66,800 | $5,036,720 |
|
| L-3 Communications Holdings, Inc. | 69,700 | 5,454,025 |
|
| Northrop Grumman Corp. | 82,500 | 5,717,250 |
|
| Precision Castparts Corp. S | 36,900 | 5,276,331 |
|
| Raytheon Co. S | 75,060 | 3,752,249 |
|
| Safran SA (France) | 80,104 | 2,894,828 |
|
| United Technologies Corp. | 122,000 | 9,918,600 |
|
| | | 38,050,003 |
| Airlines (0.1%) | | |
| Delta Air Lines, Inc. † S | 155,000 | 1,808,850 |
|
| | | 1,808,850 |
| Automotive (1.2%) | | |
| Ford Motor Co. † S | 431,900 | 6,888,805 |
|
| General Motors Co. † | 96,100 | 3,506,689 |
|
| Lear Corp. † S | 37,800 | 3,992,814 |
|
| TRW Automotive Holdings Corp. † S | 77,111 | 4,600,442 |
|
| | | 18,988,750 |
| Banking (6.8%) | | |
| Bank of America Corp. | 1,335,242 | 18,332,873 |
|
| Bond Street Holdings, LLC 144A Class A † F | 274,548 | 5,614,507 |
|
| Citigroup, Inc. † S | 2,377,100 | 11,457,622 |
|
| First Southern Bancorp, Inc. Class B † F | 112,320 | 1,906,632 |
|
| JPMorgan Chase & Co. | 749,473 | 33,681,317 |
|
| NBH Holdings Corp. 144A Class A † | 159,300 | 2,668,275 |
|
| PNC Financial Services Group, Inc. | 76,600 | 4,596,000 |
|
| SunTrust Banks, Inc. S | 103,400 | 3,146,462 |
|
| Wells Fargo & Co. | 723,098 | 23,442,837 |
|
| | | 104,846,525 |
| Beverage (3.0%) | | |
| Coca-Cola Co. (The) | 352,300 | 22,142,055 |
|
| Coca-Cola Enterprises, Inc. | 256,200 | 6,445,992 |
|
| Dr. Pepper Snapple Group, Inc. | 96,000 | 3,401,280 |
|
| Molson Coors Brewing Co. Class B | 56,600 | 2,652,842 |
|
| PepsiCo, Inc. | 181,200 | 11,652,972 |
|
| | | 46,295,141 |
| Biotechnology (0.9%) | | |
| Amgen, Inc. † S | 130,200 | 7,171,416 |
|
| Celgene Corp. † | 82,600 | 4,256,378 |
|
| Dendreon Corp. † | 51,900 | 1,818,576 |
|
| | | 13,246,370 |
| Broadcasting (0.2%) | | |
| CBS Corp. Class B | 168,100 | 3,333,423 |
|
| | | 3,333,423 |
| Cable television (2.0%) | | |
| Comcast Corp. Class A S | 685,600 | 15,597,400 |
|
| DIRECTV Class A † | 197,564 | 8,374,738 |
|
| Time Warner Cable, Inc. | 111,400 | 7,556,262 |
|
| | | 31,528,400 |
17
| | |
| COMMON STOCKS (99.8%)* cont. | Shares | Value |
|
| Chemicals (2.5%) | | |
| Albemarle Corp. S | 62,458 | $3,507,641 |
|
| Dow Chemical Co. (The) | 182,143 | 6,462,434 |
|
| E.I. du Pont de Nemours & Co. | 155,400 | 7,875,672 |
|
| Huntsman Corp. | 218,321 | 3,800,969 |
|
| Lubrizol Corp. (The) | 36,500 | 3,922,290 |
|
| LyondellBasell Industries NV Class A (Netherlands) † | 134,900 | 4,848,306 |
|
| PPG Industries, Inc. | 53,900 | 4,542,692 |
|
| W.R. Grace & Co. † | 84,737 | 3,007,316 |
|
| | | 37,967,320 |
| Coal (0.4%) | | |
| Alpha Natural Resources, Inc. † | 79,100 | 4,250,043 |
|
| Walter Energy, Inc. | 18,400 | 2,396,968 |
|
| | | 6,647,011 |
| Commercial and consumer services (0.7%) | | |
| Alliance Data Systems Corp. † S | 61,100 | 4,322,214 |
|
| Booz Allen Hamilton Holding Corp. † S | 193,860 | 3,617,428 |
|
| Mastercard, Inc. Class A | 12,000 | 2,838,120 |
|
| | | 10,777,762 |
| Communications equipment (2.6%) | | |
| Cisco Systems, Inc. † | 669,000 | 14,149,350 |
|
| Harris Corp. | 75,100 | 3,495,154 |
|
| Motorola Solutions, Inc. † | 64,257 | 2,491,244 |
|
| Nokia Corp. ADR (Finland) S | 222,100 | 2,376,470 |
|
| Qualcomm, Inc. | 324,500 | 17,565,185 |
|
| | | 40,077,403 |
| Computers (7.4%) | | |
| Apple, Inc. † | 115,667 | 39,248,126 |
|
| EMC Corp. † S | 486,000 | 12,096,540 |
|
| Hewlett-Packard Co. | 520,640 | 23,788,042 |
|
| IBM Corp. | 225,200 | 36,482,400 |
|
| Seagate Technology † | 223,200 | 3,124,800 |
|
| | | 114,739,908 |
| Conglomerates (2.7%) | | |
| General Electric Co. | 1,216,800 | 24,506,352 |
|
| Honeywell International, Inc. | 77,200 | 4,323,972 |
|
| Tyco International, Ltd. | 293,400 | 13,153,122 |
|
| | | 41,983,446 |
| Consumer (0.2%) | | |
| Signet Jewelers, Ltd. (Bermuda) † S | 55,000 | 2,336,400 |
|
| | | 2,336,400 |
| Consumer finance (0.5%) | | |
| Capital One Financial Corp. S | 91,800 | 4,421,088 |
|
| Discover Financial Services | 130,900 | 2,695,231 |
|
| | | 7,116,319 |
| Consumer goods (3.0%) | | |
| Colgate-Palmolive Co. | 95,900 | 7,362,243 |
|
| Energizer Holdings, Inc. † | 42,500 | 3,091,450 |
|
| Estee Lauder Cos., Inc. (The) Class A S | 25,300 | 2,036,650 |
|
| Kimberly-Clark Corp. | 115,600 | 7,482,788 |
|
| Newell Rubbermaid, Inc. | 213,100 | 4,102,175 |
|
| Procter & Gamble Co. (The) | 350,500 | 22,127,065 |
|
| | | 46,202,371 |
18
| | |
| COMMON STOCKS (99.8%)* cont. | Shares | Value |
|
| Consumer services (0.4%) | | |
| Avis Budget Group, Inc. † S | 214,700 | $2,971,448 |
|
| Hertz Global Holdings, Inc. † S | 170,600 | 2,509,526 |
|
| | | 5,480,974 |
| Electric utilities (2.1%) | | |
| AES Corp. (The) † | 596,600 | 7,397,840 |
|
| Ameren Corp. S | 253,128 | 7,181,241 |
|
| CMS Energy Corp. S | 194,200 | 3,786,900 |
|
| Edison International | 228,200 | 8,279,096 |
|
| Entergy Corp. | 31,600 | 2,280,572 |
|
| NV Energy, Inc. | 270,100 | 3,881,337 |
|
| | | 32,806,986 |
| Electrical equipment (0.2%) | | |
| Emerson Electric Co. | 45,400 | 2,673,152 |
|
| | | 2,673,152 |
| Electronics (3.1%) | | |
| Agilent Technologies, Inc. † | 147,300 | 6,161,559 |
|
| Altera Corp. S | 99,700 | 3,745,729 |
|
| Garmin, Ltd. S | 72,400 | 2,232,092 |
|
| Intel Corp. | 465,200 | 9,983,192 |
|
| SanDisk Corp. † | 229,200 | 10,398,804 |
|
| Sensata Technologies Holding NV (Netherlands) † | 108,500 | 3,418,835 |
|
| Texas Instruments, Inc. | 343,900 | 11,661,649 |
|
| | | 47,601,860 |
| Energy (oil field) (1.9%) | | |
| National Oilwell Varco, Inc. | 112,800 | 8,335,920 |
|
| Schlumberger, Ltd. | 218,824 | 19,473,148 |
|
| Transocean, Ltd. (Switzerland) † S | 28,400 | 2,270,012 |
|
| | | 30,079,080 |
| Energy (other) (0.2%) | | |
| First Solar, Inc. † S | 22,900 | 3,539,882 |
|
| | | 3,539,882 |
| Engineering and construction (0.2%) | | |
| KBR, Inc. S | 95,100 | 3,052,710 |
|
| | | 3,052,710 |
| Financial (0.8%) | | |
| Assurant, Inc. | 151,200 | 5,931,576 |
|
| CME Group, Inc. | 19,200 | 5,924,352 |
|
| | | 11,855,928 |
| Food (0.4%) | | |
| H.J. Heinz Co. | 77,100 | 3,662,250 |
|
| Hershey Co. (The) S | 68,700 | 3,207,603 |
|
| | | 6,869,853 |
| Forest products and packaging (0.9%) | | |
| International Paper Co. | 86,200 | 2,489,456 |
|
| MeadWestvaco Corp. | 135,900 | 3,890,817 |
|
| Sealed Air Corp. S | 120,500 | 3,216,145 |
|
| Weyerhaeuser Co. | 171,200 | 3,968,416 |
|
| | | 13,564,834 |
| Health-care services (3.8%) | | |
| Aetna, Inc. | 328,600 | 10,824,084 |
|
| AmerisourceBergen Corp. | 90,700 | 3,252,502 |
|
| Cardinal Health, Inc. | 221,400 | 9,190,314 |
|
19
| | |
| COMMON STOCKS (99.8%)* cont. | Shares | Value |
|
| Health-care services cont. | | |
| CIGNA Corp. | 166,562 | $6,998,935 |
|
| Community Health Systems, Inc. † | 72,600 | 2,549,712 |
|
| HealthSouth Corp. † S | 134,000 | 3,031,080 |
|
| Lincare Holdings, Inc. S | 102,200 | 2,764,510 |
|
| McKesson Corp. | 141,300 | 10,621,521 |
|
| Quest Diagnostics, Inc. | 43,700 | 2,488,715 |
|
| WellPoint, Inc. † | 108,100 | 6,715,172 |
|
| | | 58,436,545 |
| Insurance (3.9%) | | |
| ACE, Ltd. | 167,900 | 10,340,961 |
|
| Aflac, Inc. | 53,800 | 3,097,804 |
|
| Assured Guaranty, Ltd. (Bermuda) | 190,950 | 2,761,137 |
|
| Berkshire Hathaway, Inc. Class B † | 71,880 | 5,876,190 |
|
| Hartford Financial Services Group, Inc. (The) | 120,500 | 3,347,490 |
|
| MBIA, Inc. † S | 127,178 | 1,360,805 |
|
| MetLife, Inc. | 121,300 | 5,551,901 |
|
| Prudential Financial, Inc. | 217,300 | 13,366,123 |
|
| RenaissanceRe Holdings, Ltd. S | 48,400 | 3,176,008 |
|
| Travelers Cos., Inc. (The) | 135,100 | 7,600,726 |
|
| XL Group PLC | 136,000 | 3,117,120 |
|
| | | 59,596,265 |
| Investment banking/Brokerage (2.6%) | | |
| Ameriprise Financial, Inc. S | 63,300 | 3,902,445 |
|
| BlackRock, Inc. S | 43,503 | 8,614,464 |
|
| Goldman Sachs Group, Inc. (The) | 106,800 | 17,474,616 |
|
| Legg Mason, Inc. | 90,400 | 2,994,952 |
|
| Morgan Stanley | 246,400 | 7,244,160 |
|
| | | 40,230,637 |
| Lodging/Tourism (0.2%) | | |
| Wyndham Worldwide Corp. S | 131,600 | 3,701,908 |
|
| | | 3,701,908 |
| Machinery (1.6%) | | |
| AGCO Corp. † S | 56,700 | 2,874,690 |
|
| CNH Global NV (Netherlands) † | 95,825 | 4,640,805 |
|
| Cummins, Inc. | 28,800 | 3,049,344 |
|
| Parker Hannifin Corp. S | 114,000 | 10,192,740 |
|
| Timken Co. S | 96,900 | 4,556,238 |
|
| | | 25,313,817 |
| Manufacturing (1.4%) | | |
| Eaton Corp. S | 56,700 | 6,121,332 |
|
| Illinois Tool Works, Inc. | 118,500 | 6,338,565 |
|
| Ingersoll-Rand PLC S | 188,400 | 8,892,480 |
|
| | | 21,352,377 |
| Media (1.0%) | | |
| Interpublic Group of Companies, Inc. (The) † | 574,900 | 6,145,681 |
|
| Time Warner, Inc. | 149,766 | 4,710,141 |
|
| Walt Disney Co. (The) | 98,300 | 3,820,921 |
|
| | | 14,676,743 |
20
| | |
| COMMON STOCKS (99.8%)* cont. | Shares | Value |
|
| Medical technology (1.5%) | | |
| Baxter International, Inc. | 148,900 | $7,220,161 |
|
| Medtronic, Inc. | 260,900 | 9,997,688 |
|
| Pall Corp. | 46,600 | 2,582,106 |
|
| Waters Corp. † S | 38,300 | 2,925,737 |
|
| | | 22,725,692 |
| Metals (0.8%) | | |
| Freeport-McMoRan Copper & Gold, Inc. Class B | 91,300 | 9,928,875 |
|
| Teck Resources Limited Class B (Canada) | 41,100 | 2,490,660 |
|
| | | 12,419,535 |
| Office equipment and supplies (0.2%) | | |
| Avery Dennison Corp. S | 73,000 | 3,072,570 |
|
| | | 3,072,570 |
| Oil and gas (10.0%) | | |
| Chevron Corp. | 401,400 | 38,104,902 |
|
| Cimarex Energy Co. | 55,400 | 5,768,802 |
|
| ConocoPhillips S | 146,600 | 10,476,036 |
|
| Devon Energy Corp. S | 48,800 | 4,328,072 |
|
| Exxon Mobil Corp. | 520,162 | 41,966,668 |
|
| Hess Corp. | 114,200 | 9,606,504 |
|
| Linn Energy, LLC (Units) | 90,400 | 3,578,936 |
|
| Marathon Oil Corp. | 192,100 | 8,778,970 |
|
| Occidental Petroleum Corp. | 245,700 | 23,754,276 |
|
| Plains Exploration & Production Co. † | 92,300 | 3,267,420 |
|
| QEP Resources, Inc. | 87,700 | 3,564,128 |
|
| Seadrill, Ltd. (Norway) | 76,970 | 2,551,556 |
|
| | | 155,746,270 |
| Pharmaceuticals (5.3%) | | |
| Abbott Laboratories | 211,400 | 9,546,824 |
|
| GlaxoSmithKline PLC ADR (United Kingdom) S | 54,800 | 1,990,884 |
|
| Johnson & Johnson | 555,400 | 33,196,258 |
|
| Novartis AG ADR (Switzerland) | 74,600 | 4,167,156 |
|
| Pfizer, Inc. | 1,716,326 | 31,271,460 |
|
| Somaxon Pharmaceuticals, Inc. † S | 517,123 | 1,561,711 |
|
| | | 81,734,293 |
| Publishing (0.3%) | | |
| McGraw-Hill Cos., Inc. (The) | 99,600 | 3,882,408 |
|
| | | 3,882,408 |
| Railroads (0.8%) | | |
| CSX Corp. | 51,900 | 3,664,140 |
|
| Kansas City Southern † S | 39,500 | 1,974,210 |
|
| Union Pacific Corp. | 65,700 | 6,217,191 |
|
| | | 11,855,541 |
| Real estate (0.8%) | | |
| Annaly Capital Management, Inc. R S | 205,492 | 3,663,922 |
|
| Campus Crest Communities, Inc. R S | 180,321 | 2,380,237 |
|
| CBL & Associates Properties, Inc. R S | 130,201 | 2,221,229 |
|
| HCP, Inc. R | 84,549 | 3,135,922 |
|
| Terreno Realty Corp. † R | 76,874 | 1,370,663 |
|
| | | 12,771,973 |
21
| | |
| COMMON STOCKS (99.8%)* cont. | Shares | Value |
|
| Regional Bells (2.0%) | | |
| AT&T, Inc. | 599,505 | $16,498,378 |
|
| Verizon Communications, Inc. S | 417,100 | 14,857,102 |
|
| | | 31,355,480 |
| Restaurants (0.9%) | | |
| McDonald’s Corp. | 192,900 | 14,210,943 |
|
| | | 14,210,943 |
| Retail (4.7%) | | |
| AnnTaylor Stores Corp. † S | 191,700 | 4,240,404 |
|
| Bed Bath & Beyond, Inc. † S | 44,800 | 2,150,400 |
|
| Best Buy Co., Inc. | 88,200 | 2,998,800 |
|
| Coach, Inc. | 43,400 | 2,347,506 |
|
| CVS Caremark Corp. | 176,310 | 6,029,802 |
|
| Dollar General Corp. † S | 131,218 | 3,649,173 |
|
| Home Depot, Inc. (The) S | 208,300 | 7,659,191 |
|
| Limited Brands, Inc. | 164,500 | 4,809,980 |
|
| Lowe’s Cos., Inc. | 107,300 | 2,661,040 |
|
| OfficeMax, Inc. † | 155,200 | 2,494,064 |
|
| Ross Stores, Inc. | 51,200 | 3,338,240 |
|
| Safeway, Inc. S | 220,100 | 4,553,869 |
|
| Target Corp. | 158,600 | 8,696,038 |
|
| Urban Outfitters, Inc. † | 68,100 | 2,303,142 |
|
| Wal-Mart Stores, Inc. S | 271,700 | 15,234,219 |
|
| | | 73,165,868 |
| Schools (0.1%) | | |
| Career Education Corp. † S | 89,300 | 2,003,892 |
|
| | | 2,003,892 |
| Semiconductor (0.6%) | | |
| Applied Materials, Inc. | 254,800 | 3,997,812 |
|
| Novellus Systems, Inc. † | 134,600 | 4,855,022 |
|
| | | 8,852,834 |
| Shipping (0.8%) | | |
| Ryder System, Inc. S | 85,200 | 4,096,416 |
|
| Scorpio Tankers, Inc. (Monaco) † S | 199,955 | 1,961,559 |
|
| United Parcel Service, Inc. Class B | 96,400 | 6,904,168 |
|
| | | 12,962,143 |
| Software (4.0%) | | |
| Adobe Systems, Inc. † | 82,100 | 2,713,405 |
|
| Autodesk, Inc. † S | 77,200 | 3,140,496 |
|
| BMC Software, Inc. † | 87,400 | 4,168,980 |
|
| CA, Inc. | 281,200 | 6,692,560 |
|
| Microsoft Corp. | 796,300 | 22,077,418 |
|
| Oracle Corp. | 722,300 | 23,135,269 |
|
| | | 61,928,128 |
| Technology services (2.5%) | | |
| Accenture PLC Class A | 123,063 | 6,334,053 |
|
| Check Point Software Technologies, Ltd. (Israel) † S | 51,900 | 2,312,145 |
|
| Google, Inc. Class A † | 34,713 | 20,840,297 |
|
| Unisys Corp. † | 93,880 | 2,659,620 |
|
| VeriSign, Inc. S | 123,100 | 4,142,315 |
|
| Western Union Co. (The) | 120,600 | 2,445,768 |
|
| | | 38,734,198 |
22
| | |
| COMMON STOCKS (99.8%)* cont. | Shares | Value |
|
| Telecommunications (0.5%) | | |
| Iridium Communications, Inc. † S | 920,324 | $7,068,088 |
|
| | | 7,068,088 |
| Textiles (0.3%) | | |
| Hanesbrands, Inc. † | 84,200 | 1,938,284 |
|
| VF Corp. | 28,400 | 2,349,248 |
|
| | | 4,287,532 |
| Tobacco (1.5%) | | |
| Philip Morris International, Inc. | 398,300 | 22,798,692 |
|
| | | 22,798,692 |
| Toys (0.5%) | | |
| Hasbro, Inc. | 164,100 | 7,235,169 |
|
| | | 7,235,169 |
| Trucks and parts (0.3%) | | |
| Autoliv, Inc. (Sweden) S | 54,100 | 4,154,880 |
|
| | | 4,154,880 |
| | | |
| Total common stocks (cost $1,434,339,438) | | $1,539,745,082 |
| | | |
| | | | |
| WARRANTS (—%)* † | Expiration | Strike | | |
| | date | price | Warrants | Value |
|
| Citigroup, Inc. | 1/4/19 | $10.61 | 697,374 | $690,400 |
|
| Total warrants (cost $704,348) | | | | $690,400 |
| | | |
| | |
| PREFERRED STOCKS (—%)* | Shares | Value |
|
| First Southern Bancorp 5.00% cum. pfd. (acquired 12/17/09, | | |
| cost $192,000) † ‡ F | 192 | $192,000 |
|
| Total preferred stocks (cost $192,000) | | $192,000 |
| |
| SHORT-TERM INVESTMENTS (11.6%)* | Shares | Value |
|
| Putnam Cash Collateral Pool, LLC 0.20% d | 177,033,909 | $177,033,909 |
|
| Putnam Money Market Liquidity Fund 0.17% e | 2,473,750 | 2,473,750 |
|
| Total short-term investments (cost $179,507,659) | | $179,507,659 |
| |
| TOTAL INVESTMENTS | | |
|
| Total investments (cost $1,614,743,445) | | $1,720,135,141 |
Key to holding’s abbreviations
| |
| ADR | American Depository Receipts |
Notes to the fund’s portfolio
Unless noted otherwise, the notes to the fund’s portfolio are for the close of the fund’s reporting period, which ran from August 1, 2010 through January 31, 2011 (the reporting period).
* Percentages indicated are based on net assets of $1,543,211,284.
† Non-income-producing security.
‡ Restricted, excluding 144A securities, as to public resale. The total market value of restricted securities held at the close of the reporting period was $192,000, or less than 0.1% of net assets.
d See Note 1 to the financial statements regarding securities lending. The rate quoted in the security description is the annualized 7-day yield of the fund at the close of the reporting period.
e See Note 6 to the financial statements regarding investments in Putnam Money Market Liquidity Fund. The rate quoted in the security description is the annualized 7-day yield of the fund at the close of the reporting period.
23
F Is valued at fair value following procedures approved by the Trustees. Securities may be classified as Level 2 or Level 3 for Accounting Standards Codification ASC 820 Fair Value Measurements and Disclosures (ASC 820) based on the securities’ valuation inputs. At the close of the reporting period, fair value pricing was also used for certain foreign securities in the portfolio (Note 1).
R Real Estate Investment Trust.
S Securities on loan, in part or in entirety, at the close of the reporting period.
144A after the name of an issuer represents securities exempt from registration under Rule 144A under the Securities Act of 1933, as amended. These securities may be resold in transactions exempt from registration, normally to qualified institutional buyers.
ADR after the name of a foreign holding represents ownership of foreign securities on deposit with a custodian bank.
ASC 820 establishes a three-level hierarchy for disclosure of fair value measurements. The valuation hierarchy is based upon the transparency of inputs to the valuation of the fund’s investments. The three levels are defined as follows:
Level 1 — Valuations based on quoted prices for identical securities in active markets.
Level 2 — Valuations based on quoted prices in markets that are not active or for which all significant inputs are observable, either directly or indirectly.
Level 3 — Valuations based on inputs that are unobservable and significant to the fair value measurement.
The following is a summary of the inputs used to value the fund’s net assets as of the close of the reporting period:
| | | |
| | | Valuation inputs | |
|
| Investments in securities: | Level 1 | Level 2 | Level 3 |
|
| Common stocks: | | | |
|
| Basic materials | $63,951,689 | $— | $— |
|
| Capital goods | 94,774,681 | 2,894,828 | — |
|
| Communication services | 69,951,968 | — | — |
|
| Conglomerates | 41,983,446 | — | — |
|
| Consumer cyclicals | 131,802,292 | — | — |
|
| Consumer staples | 154,445,537 | — | — |
|
| Energy | 196,012,243 | — | — |
|
| Financials | 226,228,233 | 2,668,275 | 7,521,139 |
|
| Health care | 176,142,900 | — | — |
|
| Technology | 311,934,331 | — | — |
|
| Transportation | 26,626,534 | — | — |
|
| Utilities and power | 32,806,986 | — | — |
|
| Total common stocks | 1,526,660,840 | 5,563,103 | 7,521,139 |
| Preferred stocks | — | — | 192,000 |
|
| Warrants | 690,400 | — | — |
|
| Short-term investments | 2,473,750 | 177,033,909 | — |
|
| Totals by level | $1,529,824,990 | $182,597,012 | $7,713,139 |
At the start and/or close of the reporting period, Level 3 investments in securities were not considered a significant portion of the fund’s portfolio.
The accompanying notes are an integral part of these financial statements.
24
Statement of assets and liabilities 1/31/11 (Unaudited)
| |
| ASSETS | |
|
| Investment in securities, at value, including $173,572,122 of securities on loan (Note 1): | |
| Unaffiliated issuers (identified cost $1,435,235,786) | $1,540,627,482 |
| Affiliated issuers (identified cost $179,507,659) (Notes 1 and 6) | 179,507,659 |
|
| Dividends, interest and other receivables | 1,471,846 |
|
| Receivable for shares of the fund sold | 474,805 |
|
| Receivable for investments sold | 25,283,318 |
|
| Total assets | 1,747,365,110 |
| |
| LIABILITIES | |
|
| Payable for investments purchased | 22,264,137 |
|
| Payable for shares of the fund repurchased | 2,496,209 |
|
| Payable for compensation of Manager (Note 2) | 737,408 |
|
| Payable for investor servicing fees (Note 2) | 344,772 |
|
| Payable for custodian fees (Note 2) | 10,803 |
|
| Payable for Trustee compensation and expenses (Note 2) | 647,410 |
|
| Payable for administrative services (Note 2) | 2,836 |
|
| Payable for distribution fees (Note 2) | 405,834 |
|
| Collateral on securities loaned, at value (Note 1) | 177,033,909 |
|
| Other accrued expenses | 210,508 |
|
| Total liabilities | 204,153,826 |
| |
| Net assets | $1,543,211,284 |
|
| |
| REPRESENTED BY | |
|
| Paid-in capital (Unlimited shares authorized) (Notes 1 and 4) | $3,200,029,757 |
|
| Undistributed net investment income (Note 1) | 5,730,115 |
|
| Accumulated net realized loss on investments and foreign currency transactions (Note 1) | (1,767,940,284) |
|
| Net unrealized appreciation of investments | 105,391,696 |
|
| Total — Representing net assets applicable to capital shares outstanding | $1,543,211,284 |
| |
| COMPUTATION OF NET ASSET VALUE AND OFFERING PRICE | |
|
| Net asset value and redemption price per class A share | |
| ($1,366,262,237 divided by 104,599,084 shares) | $13.06 |
|
| Offering price per class A share (100/94.25 of $13.06)* | $13.86 |
|
| Net asset value and offering price per class B share ($80,511,542 divided by 6,838,664 shares)** | $11.77 |
|
| Net asset value and offering price per class C share ($36,009,880 divided by 2,900,276 shares)** | $12.42 |
|
| Net asset value and redemption price per class M share ($22,431,352 divided by 1,815,942 shares) | $12.35 |
|
| Offering price per class M share (100/96.50 of $12.35)* | $12.80 |
|
| Net asset value, offering price and redemption price per class R share | |
| ($1,584,462 divided by 122,831 shares) | $12.90 |
|
| Net asset value, offering price and redemption price per class Y share | |
| ($36,411,811 divided by 2,749,187 shares) | $13.24 |
|
* On single retail sales of less than $50,000. On sales of $50,000 or more the offering price is reduced.
** Redemption price per share is equal to net asset value less any applicable contingent deferred sales charge.
The accompanying notes are an integral part of these financial statements.
25
Statement of operations Six months ended 1/31/11 (Unaudited)
| |
| INVESTMENT INCOME | |
|
| Dividends (net of foreign tax of $18,815) | $15,264,699 |
|
| Interest (including interest income of $1,232 from investments in affiliated issuers) (Note 6) | 23,442 |
|
| Securities lending (Note 1) | 154,163 |
|
| Total investment income | 15,442,304 |
| |
| EXPENSES | |
|
| Compensation of Manager (Note 2) | 4,164,714 |
|
| Investor servicing fees (Note 2) | 2,509,896 |
|
| Custodian fees (Note 2) | 11,813 |
|
| Trustee compensation and expenses (Note 2) | 78,485 |
|
| Administrative services (Note 2) | 20,942 |
|
| Distribution fees — Class A (Note 2) | 1,635,633 |
|
| Distribution fees — Class B (Note 2) | 404,393 |
|
| Distribution fees — Class C (Note 2) | 172,319 |
|
| Distribution fees — Class M (Note 2) | 81,201 |
|
| Distribution fees — Class R (Note 2) | 3,780 |
|
| Other | 249,666 |
|
| Total expenses | 9,332,842 |
| | |
| Expense reduction (Note 2) | (78,270) |
|
| Net expenses | 9,254,572 |
| |
| Net investment income | 6,187,732 |
|
| |
| Net realized gain on investments (Notes 1 and 3) | 71,726,136 |
|
| Net realized loss on foreign currency transactions (Note 1) | (8,664) |
|
| Net unrealized appreciation of investments during the period | 166,469,950 |
|
| Net gain on investments | 238,187,422 |
| |
| Net increase in net assets resulting from operations | $244,375,154 |
|
The accompanying notes are an integral part of these financial statements.
26
Statement of changes in net assets
| | |
| INCREASE (DECREASE) IN NET ASSETS | Six months ended 1/31/11* | Year ended 7/31/10 |
|
| Operations: | | |
| Net investment income | $6,187,732 | $10,320,991 |
|
| Net realized gain on investments and | | |
| foreign currency transactions | 71,717,472 | 137,678,716 |
|
| Net unrealized appreciation of investments | 166,469,950 | 45,902,633 |
|
| Net increase in net assets resulting from operations | 244,375,154 | 193,902,340 |
|
| Distributions to shareholders (Note 1): | | |
| From ordinary income | | |
| Net investment income | | |
|
| Class A | (9,767,573) | (18,402,894) |
|
| Class B | — | (828,039) |
|
| Class C | (14,861) | (284,625) |
|
| Class M | (67,456) | (227,779) |
|
| Class R | (8,308) | (18,263) |
|
| Class Y | (355,636) | (1,596,496) |
|
| Redemption fees (Note 1) | — | 1,201 |
|
| Decrease from capital share transactions (Note 4) | (114,422,829) | (275,273,864) |
|
| Total increase (decrease) in net assets | 119,738,491 | (102,728,419) |
| |
| NET ASSETS | | |
|
| Beginning of period | 1,423,472,793 | 1,526,201,212 |
|
| End of period (including undistributed net investment income | | |
| of $5,730,115 and $9,756,217, respectively) | $1,543,211,284 | $1,423,472,793 |
|
| * Unaudited | | |
The accompanying notes are an integral part of these financial statements.
27
Financial highlights (For a common share outstanding throughout the period)
| | | | | | | | | | | | | | |
| INVESTMENT OPERATIONS: | LESS DISTRIBUTIONS: | RATIOS AND SUPPLEMENTAL DATA: | |
|
| | | | | | | | | | | | | Ratio | Ratio | |
| | | | Net realized | | | | | | | | | of expenses | of net investment | |
| | Net asset value, | | and unrealized | Total from | From | | | | | Total return | Net assets, | to average | income (loss) | Portfolio |
| | beginning | Net investment | gain (loss) | investment | net investment | Total | Redemption | Non-recurring | Net asset value, | at net asset | end of period | net assets | to average | turnover |
| Period ended | of period | income (loss) a | on investments | operations | income | distributions | fees | reimbursements | end of period | value (%) b | (in thousands) | (%) c | net assets (%) | (%) |
|
| Class A | | | | | | | | | | | | | | |
| January 31, 2011** | $11.15 | .05 | 1.95 | 2.00 | (.09) | (.09) | — | — | $13.06 | 18.00 * | $1,366,262 | .60* | .45* | 37.80* |
| July 31, 2010 | 10.04 | .08 | 1.18 | 1.26 | (.15) | (.15) | — d | — | 11.15 | 12.59 | 1,252,067 | 1.27 | .72 | 97.47 |
| July 31, 2009 | 12.05 | .13 | (2.12) e | (1.99) | (.02) | (.02) | — d | — d,f | 10.04 | (16.44) e | 1,263,196 | 1.21 g | 1.36 g | 105.72 |
| July 31, 2008 | 15.35 | .03 | (3.33) | (3.30) | — | — | — d | — | 12.05 | (21.50) | 1,520,659 | 1.16 g | .22 g | 126.73 |
| July 31, 2007 | 13.49 | .01 | 1.88 | 1.89 | (.03) | (.03) | — d | — | 15.35 | 14.03 | 2,449,873 | 1.08 g | .06 g | 83.62 |
| July 31, 2006 | 13.21 | .05 h | .37 | .42 | (.14) | (.14) | — d | — | 13.49 | 3.17 h | 2,163,353 | 1.02 g,h | .40 g,h | 111.46 |
|
| Class B | | | | | | | | | | | | | | |
| January 31, 2011** | $10.01 | .01 | 1.75 | 1.76 | — | — | — | — | $11.77 | 17.58 * | $80,512 | .98* | .08* | 37.80* |
| July 31, 2010 | 9.02 | — d | 1.07 | 1.07 | (.08) | (.08) | — d | — | 10.01 | 11.81 | 82,483 | 2.02 | (.01) | 97.47 |
| July 31, 2009 | 10.89 | .05 | (1.92) e | (1.87) | — | — | — d | — d,f | 9.02 | (17.17) e | 114,357 | 1.96 g | .63 g | 105.72 |
| July 31, 2008 | 13.99 | (.07) | (3.03) | (3.10) | — | — | — d | — | 10.89 | (22.16) | 193,547 | 1.91 g | (.55) g | 126.73 |
| July 31, 2007 | 12.36 | (.09) | 1.72 | 1.63 | — | — | — d | — | 13.99 | 13.19 | 520,001 | 1.83 g | (.67) g | 83.62 |
| July 31, 2006 | 12.11 | (.04) h | .33 | .29 | (.04) | (.04) | — d | — | 12.36 | 2.39 h | 852,123 | 1.77 g,h | (.33) g,h | 111.46 |
|
| Class C | | | | | | | | | | | | | | |
| January 31, 2011** | $10.56 | .01 | 1.86 | 1.87 | (.01) | (.01) | — | — | $12.42 | 17.66 * | $36,010 | .98* | .07* | 37.80* |
| July 31, 2010 | 9.53 | — d | 1.11 | 1.11 | (.08) | (.08) | — d | — | 10.56 | 11.67 | 32,969 | 2.02 | (.03) | 97.47 |
| July 31, 2009 | 11.49 | .06 | (2.02) e | (1.96) | — | — | — d | — d,f | 9.53 | (17.06) e | 35,155 | 1.96 g | .62 g | 105.72 |
| July 31, 2008 | 14.75 | (.07) | (3.19) | (3.26) | — | — | — d | — | 11.49 | (22.10) | 36,892 | 1.91 g | (.54) g | 126.73 |
| July 31, 2007 | 13.03 | (.10) | 1.82 | 1.72 | — | — | — d | — | 14.75 | 13.20 | 72,429 | 1.83 g | (.69) g | 83.62 |
| July 31, 2006 | 12.77 | (.05) h | .35 | .30 | (.04) | (.04) | — d | — | 13.03 | 2.38 h | 55,484 | 1.77 g,h | (.35) g,h | 111.46 |
|
| Class M | | | | | | | | | | | | | | |
| January 31, 2011** | $10.52 | .02 | 1.85 | 1.87 | (.04) | (.04) | — | — | $12.35 | 17.76 * | $22,431 | .86* | .20* | 37.80* |
| July 31, 2010 | 9.49 | .02 | 1.12 | 1.14 | (.11) | (.11) | — d | — | 10.52 | 11.99 | 20,818 | 1.77 | .22 | 97.47 |
| July 31, 2009 | 11.42 | .08 | (2.01) e | (1.93) | — | — | — d | — d,f | 9.49 | (16.90) e | 20,862 | 1.71 g | .87 g | 105.72 |
| July 31, 2008 | 14.62 | (.04) | (3.16) | (3.20) | — | — | — d | — | 11.42 | (21.89) | 21,936 | 1.66 g | (.28) g | 126.73 |
| July 31, 2007 | 12.88 | (.06) | 1.80 | 1.74 | — | — | — d | — | 14.62 | 13.51 | 39,263 | 1.58 g | (.43) g | 83.62 |
| July 31, 2006 | 12.62 | (.01) h | .34 | .33 | (.07) | (.07) | — d | — | 12.88 | 2.62 h | 41,165 | 1.52 g,h | (.09) g,h | 111.46 |
|
| Class R | | | | | | | | | | | | | | |
| January 31, 2011** | $11.00 | .04 | 1.93 | 1.97 | (.07) | (.07) | — | — | $12.90 | 17.90 * | $1,584 | .73* | .32* | 37.80* |
| July 31, 2010 | 9.91 | .05 | 1.17 | 1.22 | (.13) | (.13) | — d | — | 11.00 | 12.34 | 1,410 | 1.52 | .46 | 97.47 |
| July 31, 2009 | 11.90 | .11 | (2.10) e | (1.99) | — d | — d | — d | — d,f | 9.91 | (16.70) e | 1,309 | 1.46 g | 1.11 g | 105.72 |
| July 31, 2008 | 15.20 | — d | (3.30) | (3.30) | — | — | — d | — | 11.90 | (21.71) | 1,446 | 1.41 g | — g,i | 126.73 |
| July 31, 2007 | 13.39 | (.03) | 1.87 | 1.84 | (.03) | (.03) | — d | — | 15.20 | 13.77 | 1,354 | 1.33 g | (.20) g | 83.62 |
| July 31, 2006 | 13.16 | .01 h | .37 | .38 | (.15) | (.15) | — d | — | 13.39 | 2.87 h | 541 | 1.27 g,h | .11 g,h | 111.46 |
|
| Class Y | | | | | | | | | | | | | | |
| January 31, 2011** | $11.32 | .07 | 1.97 | 2.04 | (.12) | (.12) | — | — | $13.24 | 18.11 * | $36,412 | .48* | .58* | 37.80* |
| July 31, 2010 | 10.18 | .11 | 1.21 | 1.32 | (.18) | (.18) | — d | — | 11.32 | 12.96 | 33,725 | 1.02 | 1.02 | 97.47 |
| July 31, 2009 | 12.25 | .13 | (2.14) e | (2.01) | (.06) | (.06) | — d | — d,f | 10.18 | (16.31) e | 91,321 | .95 g | 1.58 g | 105.72 |
| July 31, 2008 | 15.56 | .07 | (3.38) | (3.31) | — | — | — d | — | 12.25 | (21.27) | 707,086 | .91 g | .48 g | 126.73 |
| July 31, 2007 | 13.67 | .05 | 1.91 | 1.96 | (.07) | (.07) | — d | — | 15.56 | 14.33 | 716,713 | .83 g | .31 g | 83.62 |
| July 31, 2006 | 13.39 | .09 h | .36 | .45 | (.17) | (.17) | — d | — | 13.67 | 3.38 h | 631,912 | .77 g,h | .65 g,h | 111.46 |
|
See notes to financial highlights at the end of this section.
The accompanying notes are an integral part of these financial statements.
Financial highlights (Continued)
* Not annualized.
** Unaudited.
a Per share net investment income (loss) has been determined on the basis of the weighted average number of shares outstanding during the period.
b Total return assumes dividend reinvestment and does not reflect the effect of sales charges.
c Includes amounts paid through expense offset and brokerage/service arrangements (Note 2).
d Amount represents less than $0.01 per share.
e Reflects a non-recurring litigation payment received by the fund from Tyco International, Ltd. which amounted to the following amounts per share outstanding on March 13, 2009:
| |
| | Per share |
|
| Class A | $0.03 |
|
| Class B | 0.03 |
|
| Class C | 0.03 |
|
| Class M | 0.03 |
|
| Class R | 0.03 |
|
| Class Y | 0.04 |
|
This payment resulted in an increase to total returns of 0.25% for the year ended July 31, 2009.
f Reflects a non-recurring reimbursement pursuant to a settlement between the Securities and Exchange Commission (the SEC) and Bear Stearns & Co., Inc. and Bear Stearns Securities Corp., which amounted to less than $0.01 per share outstanding on May 21, 2009.
g Reflects an involuntary contractual expense limitation and/or waivers of certain fund expenses in connection with investments in Putnam Prime Money Market Fund in effect during the period. As a result of such limitation and/or waivers, the expenses of each class, reflect a reduction of the following amounts:
| |
| | Percentage of |
| | average net assets |
|
| July 31, 2009 | 0.09% |
|
| July 31, 2008 | <0.01 |
|
| July 31, 2007 | <0.01 |
|
| July 31, 2006 | <0.01 |
|
h Reflects a non-recurring reimbursement from Putnam Investments relating to the calculation of certain amounts paid by the fund to Putnam in previous years for transfer agent services, which amounted to $0.01 per share and 0.06% of average net assets for the period ended July 31, 2006.
i Amount represents less than 0.01% of average net assets.
The accompanying notes are an integral part of these financial statements.
30
Notes to financial statements 1/31/11 (Unaudited)
Note 1: Significant accounting policies
Putnam Investors Fund (the fund), is a Massachusetts business trust, which is registered under the Investment Company Act of 1940, as amended, as a diversified open-end management investment company. The investment objective of the fund is to seek long-term growth of capital and any increased income that results from this growth by investing in a portfolio primarily consisting of common stocks of large U.S. companies that Putnam Investment Management, LLC (Putnam Management), the fund’s manager, an indirect wholly-owned subsidiary of Putnam Investments, LLC, believes have favorable investment potential.
The fund offers class A, class B, class C, class M, class R and class Y shares. Class A and class M shares are sold with a maximum front-end sales charge of 5.75% and 3.50%, respectively, and generally do not pay a contingent deferred sales charge. Class B shares, which convert to class A shares after approximately eight years, do not pay a front-end sales charge and are subject to a contingent deferred sales charge if those shares are redeemed within six years of purchase. Class C shares have a one-year 1.00% contingent deferred sales charge and do not convert to class A shares. Class R shares, which are not available to all investors, are sold at net asset value. The expenses for class A, class B, class C, class M and class R shares may differ based on the distribution fee of each class, which is identified in Note 2. Class Y shares, which are sold at net asset value, are generally subject to the same expenses as class A, class B, class C, class M and class R shares, but do not bear a distribution fee. Class Y shares are not available to all investors.
Prior to August 2, 2010, a 1.00% redemption fee applied to certain shares that were redeemed (either by selling or exchanging into another fund) within 7 days of purchase. The redemption fee was accounted for as an addition to paid-in-capital. Effective August 2, 2010, this redemption fee no longer applies to shares redeemed.
Investment income, realized and unrealized gains and losses and expenses of the fund are borne pro-rata based on the relative net assets of each class to the total net assets of the fund, except that each class bears expenses unique to that class (including the distribution fees applicable to such classes). Each class votes as a class only with respect to its own distribution plan or other matters on which a class vote is required by law or determined by the Trustees. If the fund were liquidated, shares of each class would receive their pro-rata share of the net assets of the fund. In addition, the Trustees declare separate dividends on each class of shares.
In the normal course of business, the fund enters into contracts that may include agreements to indemnify another party under given circumstances. The fund’s maximum exposure under these arrangements is unknown as this would involve future claims that may be, but have not yet been, made against the fund. However, the fund’s management team expects the risk of material loss to be remote.
The following is a summary of significant accounting policies consistently followed by the fund in the preparation of its financial statements. The preparation of financial statements is in conformity with accounting principles generally accepted in the United States of America and requires management to make estimates and assumptions that affect the reported amounts of assets and liabilities in the financial statements and the reported amounts of increases and decreases in net assets from operations. Actual results could differ from those estimates. Subsequent events after the Statement of assets and liabilities date through the date that the financial statements were issued have been evaluated in the preparation of the financial statements. Unless otherwise noted, the “reporting period” represents the period from August 1, 2010 through January 31, 2011.
A) Security valuation Investments for which market quotations are readily available are valued at the last reported sales price on their principal exchange, or official closing price for certain markets, and are classified as Level 1 securities. If no sales are reported — as in the case of some securities traded over-the-counter — a security is valued at its last reported bid price and is generally categorized as a Level 2 security.
Market quotations are not considered to be readily available for certain debt obligations; such investments are valued on the basis of valuations furnished by an independent pricing service approved by the Trustees or dealers selected by Putnam Management. Such services or dealers determine valuations for normal institutional-size trading units of such securities using methods based on market transactions for comparable securities and various relationships, generally recognized by institutional traders, between securities (which considers such factors as security prices, yields, maturities and ratings). These securities will generally be categorized as Level 2.
Many securities markets and exchanges outside the U.S. close prior to the close of the New York Stock Exchange and therefore the closing prices for securities in such markets or on such exchanges may not fully reflect events that occur after such close but before the close of the New York Stock Exchange. Accordingly, on certain days,
31
the fund will fair value foreign equity securities taking into account multiple factors including movements in the U.S. securities markets, currency valuations and comparisons to the valuation of American Depository Receipts, exchange-traded funds and futures contracts. These securities, which will generally represent a transfer from a Level 1 to a Level 2 security, will be classified as Level 2. The number of days on which fair value prices will be used will depend on market activity and it is possible that fair value prices will be used by the fund to a significant extent. At the close of the reporting period, fair value pricing was used for certain foreign securities in the portfolio. Securities quoted in foreign currencies, if any, are translated into U.S. dollars at the current exchange rate.
To the extent a pricing service or dealer is unable to value a security or provides a valuation that Putnam Management does not believe accurately reflects the security’s fair value, the security will be valued at fair value by Putnam Management. Certain investments, including certain restricted and illiquid securities and derivatives, are also valued at fair value following procedures approved by the Trustees. These valuations consider such factors as significant market or specific security events such as interest rate or credit quality changes, various relationships with other securities, discount rates, U.S. Treasury, U.S. swap and credit yields, index levels, convexity exposures and recovery rates. These securities are classified as Level 2 or as Level 3 depending on the priority of the significant inputs.
Such valuations and procedures are reviewed periodically by the Trustees. The fair value of securities is generally determined as the amount that the fund could reasonably expect to realize from an orderly disposition of such securities over a reasonable period of time. By its nature, a fair value price is a good faith estimate of the value of a security in a current sale and does not reflect an actual market price, which may be different by a material amount.
B) Security transactions and related investment income Security transactions are recorded on the trade date (the date the order to buy or sell is executed). Gains or losses on securities sold are determined on the identified cost basis.
Interest income is recorded on the accrual basis. Dividend income, net of applicable withholding taxes, is recognized on the ex-dividend date except that certain dividends from foreign securities, if any, are recognized as soon as the fund is informed of the ex-dividend date. Non-cash dividends, if any, are recorded at the fair market value of the securities received. Dividends representing a return of capital or capital gains, if any, are reflected as a reduction of cost and/or as a realized gain.
C) Foreign currency translation The accounting records of the fund are maintained in U.S. dollars. The market value of foreign securities, currency holdings, and other assets and liabilities is recorded in the books and records of the fund after translation to U.S. dollars based on the exchange rates on that day. The cost of each security is determined using historical exchange rates. Income and withholding taxes are translated at prevailing exchange rates when earned or incurred. The fund does not isolate that portion of realized or unrealized gains or losses resulting from changes in the foreign exchange rate on investments from fluctuations arising from changes in the market prices of the securities. Such gains and losses are included with the net realized and unrealized gain or loss on investments. Net realized gains and losses on foreign currency transactions represent net realized exchange gains or losses on closed forward currency contracts, disposition of foreign currencies, currency gains and losses realized between the trade and settlement dates on securities transactions and the difference between the amount of investment income and foreign withholding taxes recorded on the fund’s books and the U.S. dollar equivalent amounts actually received or paid. Net unrealized appreciation and depreciation of assets and liabilities in foreign currencies arise from changes in the value of open forward currency contracts and assets and liabilities other than investments at the period end, resulting from changes in the exchange rate. Investments in foreign securities involve certain risks, including those related to economic instability, unfavorable political developments, and currency fluctuations, not present with domestic investments.
D) Securities lending The fund may lend securities, through its agent, to qualified borrowers in order to earn additional income. The loans are collateralized by cash in an amount at least equal to the market value of the securities loaned. The market value of securities loaned is determined daily and any additional required collateral is allocated to the fund on the next business day. The risk of borrower default will be borne by the fund’s agent; the fund will bear the risk of loss with respect to the investment of the cash collateral. Income from securities lending is included in investment income on the Statement of operations. Effective August 2010, cash collateral is invested in Putnam Cash Collateral Pool, LLC, a limited liability company managed by an affiliate of Putnam Management. Investments in Putnam Cash Collateral Pool, LLC are valued at its closing net asset value each business day. There are no management fees charged by Putnam Cash Collateral Pool, LLC. At the close of the reporting period, the value of securities loaned amounted to $173,572,122 and the fund received cash collateral of $177,033,909.
32
E) Interfund lending Effective July 2010, the fund, along with other Putnam funds, may participate in an inter-fund lending program pursuant to an exemptive order issued by the Securities and Exchange Commission (the SEC). This program allows the fund to borrow from or lend to other Putnam funds that permit such transactions. Interfund lending transactions are subject to each fund’s investment policies and borrowing and lending limits. Interest earned or paid on the interfund lending transaction will be based on the average of certain current market rates. During the reporting period, the fund did not utilize the program.
F) Line of credit Effective July 2010, the fund participates, along with other Putnam funds, in a $285 million unsecured committed line of credit and a $165 million unsecured uncommitted line of credit, both provided by State Street Bank and Trust Company (State Street). Borrowings may be made for temporary or emergency purposes, including the funding of shareholder redemption requests and trade settlements. Interest is charged to the fund based on the fund’s borrowing at a rate equal to the Federal Funds rate plus 1.25% for the committed line of credit and the Federal Funds rate plus 1.30% for the uncommitted line of credit. A closing fee equal to 0.03% of the committed line of credit and $100,000 for the uncommitted line of credit has been paid by the participating funds. In addition, a commitment fee of 0.15% per annum on any unutilized portion of the committed line of credit is allocated to the participating funds based on their relative net assets and paid quarterly. During the reporting period, the fund had no borrowings against these arrangements.
G) Federal taxes It is the policy of the fund to distribute all of its taxable income within the prescribed time period and otherwise comply with the provisions of the Internal Revenue Code of 1986, as amended (the Code), applicable to regulated investment companies. It is also the intention of the fund to distribute an amount sufficient to avoid imposition of any excise tax under Section 4982 of the Code. The fund is subject to the provisions of Accounting Standards Codification ASC 740 Income Taxes (ASC 740). ASC 740 sets forth a minimum threshold for financial statement recognition of the benefit of a tax position taken or expected to be taken in a tax return. The fund did not have a liability to record for any unrecognized tax benefits in the accompanying financial statements. No provision has been made for federal taxes on income, capital gains or unrealized appreciation on securities held nor for excise tax on income and capital gains. Each of the fund’s federal tax returns for the prior three fiscal years remains subject to examination by the Internal Revenue Service.
At July 31, 2010, the fund had a capital loss carryover of $1,831,117,602 available to the extent allowed by the Code to offset future net capital gain, if any. The amounts of the carryovers and the expiration dates are:
| | |
| Loss carryover | | Expiration |
|
| $852,424,683 | | July 31, 2011 |
|
| 27,643,525 | | July 31, 2015 |
|
| 87,393,172 | | July 31, 2016 |
|
| 600,896,767 | | July 31, 2017 |
|
| 262,759,455 | | July 31, 2018 |
|
Pursuant to federal income tax regulations applicable to regulated investment companies, the fund has elected to defer to its fiscal year ending July 31, 2011 $3,984,358 of losses recognized during the period November 1, 2009 to July 31, 2010.
The aggregate identified cost on a tax basis is $1,619,299,241, resulting in gross unrealized appreciation and depreciation of $207,180,265 and $106,344,365, respectively, or net unrealized appreciation of $100,835,900.
H) Distributions to shareholders Distributions to shareholders from net investment income are recorded by the fund on the ex-dividend date. Distributions from capital gains, if any, are recorded on the ex-dividend date and paid at least annually. The amount and character of income and gains to be distributed are determined in accordance with income tax regulations, which may differ from generally accepted accounting principles. Dividend sources are estimated at the time of declaration. Actual results may vary. Any non-taxable return of capital cannot be determined until final tax calculations are completed after the end of the fund’s fiscal year. Reclassifications are made to the fund’s capital accounts to reflect income and gains available for distribution (or available capital loss carryovers) under income tax regulations.
33
Note 2: Management fee, administrative services and other transactions
The fund pays Putnam Management a management fee (based on the fund’s average net assets and computed and paid monthly) at annual rates that may vary based on the average of the aggregate net assets of most open-end funds, as defined in the fund’s management contract, sponsored by Putnam Management. Such annual rates may vary as follows: 0.710% of the first $5 billion, 0.660% of the next $5 billion, 0.610% of the next $10 billion, 0.560% of the next $10 billion, 0.510% of the next $50 billion, 0.490% of the next $50 billion, 0.480% of the next $100 billion and 0.475% of any excess thereafter.
Putnam Management has contractually agreed, through June 30, 2011, to waive fees or reimburse the fund’s expenses to the extent necessary to limit the cumulative expenses of the fund, exclusive of brokerage, interest, taxes, investment-related expenses, extraordinary expenses and payments under the fund’s investor servicing contract, investment management contract and distribution plans, on a fiscal year-to-date basis to an annual rate of 0.20% of the fund’s average net assets over such fiscal year-to-date period. During the reporting period, the fund’s expenses were not reduced as a result of this limit.
Putnam Investments Limited (PIL), an affiliate of Putnam Management, is authorized by the Trustees to manage a separate portion of the assets of the fund as determined by Putnam Management from time to time. Putnam Management pays a quarterly sub-management fee to PIL for its services at an annual rate of 0.35% of the average net assets of the portion of the fund managed by PIL.
The fund reimburses Putnam Management an allocated amount for the compensation and related expenses of certain officers of the fund and their staff who provide administrative services to the fund. The aggregate amount of all such reimbursements is determined annually by the Trustees.
Custodial functions for the fund’s assets are provided by State Street. Custody fees are based on the fund’s asset level, the number of its security holdings and transaction volumes.
Putnam Investor Services, Inc., an affiliate of Putnam Management, provides investor servicing agent functions to the fund. Putnam Investor Services, Inc. received fees for investor servicing based on the fund’s retail asset level, the number of shareholder accounts in the fund and the level of defined contribution plan assets in the fund. Investor servicing fees will not exceed an annual rate of 0.375% of the fund’s average net assets. The amounts incurred for investor servicing agent functions during the reporting period are included in Investor servicing fees in the Statement of operations.
The fund has entered into expense offset arrangements with Putnam Investor Services, Inc. and State Street whereby Putnam Investor Services, Inc.’s and State Street’s fees are reduced by credits allowed on cash balances. The fund also reduced expenses through brokerage/service arrangements. For the reporting period, the fund’s expenses were reduced by $3,553 under the expense offset arrangements and by $74,717 under the brokerage/service arrangements.
Each independent Trustee of the fund receives an annual Trustee fee, of which $968, as a quarterly retainer, has been allocated to the fund, and an additional fee for each Trustees meeting attended. Trustees also are reimbursed for expenses they incur relating to their services as Trustees.
The fund has adopted a Trustee Fee Deferral Plan (the Deferral Plan) which allows the Trustees to defer the receipt of all or a portion of Trustees fees payable on or after July 1, 1995. The deferred fees remain invested in certain Putnam funds until distribution in accordance with the Deferral Plan.
The fund has adopted an unfunded noncontributory defined benefit pension plan (the Pension Plan) covering all Trustees of the fund who have served as a Trustee for at least five years and were first elected prior to 2004. Benefits under the Pension Plan are equal to 50% of the Trustee’s average annual attendance and retainer fees for the three years ended December 31, 2005. The retirement benefit is payable during a Trustee’s lifetime, beginning the year following retirement, for the number of years of service through December 31, 2006. Pension expense for the fund is included in Trustee compensation and expenses in the Statement of operations. Accrued pension liability is included in Payable for Trustee compensation and expenses in the Statement of assets and liabilities. The Trustees have terminated the Pension Plan with respect to any Trustee first elected after 2003.
The fund has adopted distribution plans (the Plans) with respect to its class A, class B, class C, class M and class R shares pursuant to Rule 12b-1 under the Investment Company Act of 1940. The purpose of the Plans is to compensate Putnam Retail Management Limited Partnership, a wholly-owned subsidiary of Putnam Investments, LLC and Putnam Retail Management GP, Inc., for services provided and expenses incurred in distributing shares of the fund. The Plans provide for payments by the fund to Putnam Retail Management Limited Partnership at an annual rate of up to 0.35%, 1.00%, 1.00%, 1.00% and 1.00% of the average net assets attributable to class A, class B, class C,
34
class M and class R shares, respectively. The Trustees have approved payment by the fund at an annual rate of 0.25%, 1.00%, 1.00%, 0.75% and 0.50% of the average net assets attributable to class A, class B, class C, class M and class R shares, respectively.
For the reporting period, Putnam Retail Management Limited Partnership, acting as underwriter, received net commissions of $29,487 and $608 from the sale of class A and class M shares, respectively, and received $46,543 and $330 in contingent deferred sales charges from redemptions of class B and class C shares, respectively.
A deferred sales charge of up to 1.00% and 0.65% is assessed on certain redemptions of class A and class M shares, respectively. For the reporting period, Putnam Retail Management Limited Partnership, acting as underwriter, received no monies on class A and class M redemptions.
Note 3: Purchases and sales of securities
During the reporting period, cost of purchases and proceeds from sales of investment securities other than short-term investments aggregated $548,590,817 and $665,475,336, respectively. There were no purchases or proceeds from sales of long-term U.S. government securities.
Note 4: Capital shares
At the close of the reporting period, there was an unlimited number of shares of beneficial interest authorized.
Transactions in capital shares were as follows:
| | | | |
| | Six months ended 1/31/11 | Year ended 7/31/10 |
|
| Class A | Shares | Amount | Shares | Amount |
|
| Shares sold | 2,421,532 | $29,183,068 | 7,977,475 | $89,504,471 |
|
| Shares issued in connection with | | | | |
| reinvestment of distributions | 714,149 | 8,819,737 | 1,509,488 | 16,770,633 |
|
| | 3,135,681 | 38,002,805 | 9,486,963 | 106,275,104 |
|
| Shares repurchased | (10,853,856) | (130,076,802) | (23,031,758) | (256,477,196) |
|
| Net decrease | (7,718,175) | $(92,073,997) | (13,544,795) | $(150,202,092) |
|
| |
| | Six months ended 1/31/11 | Year ended 7/31/10 |
|
| Class B | Shares | Amount | Shares | Amount |
|
| Shares sold | 229,411 | $2,470,910 | 635,223 | $6,380,036 |
|
| Shares issued in connection with | | | | |
| reinvestment of distributions | — | — | 79,873 | 801,130 |
|
| | 229,411 | 2,470,910 | 715,096 | 7,181,166 |
|
| Shares repurchased | (1,630,065) | (17,560,167) | (5,147,332) | (51,740,585) |
|
| Net decrease | (1,400,654) | $(15,089,257) | (4,432,236) | $(44,559,419) |
|
| |
| | Six months ended 1/31/11 | Year ended 7/31/10 |
|
| Class C | Shares | Amount | Shares | Amount |
|
| Shares sold | 100,104 | $1,123,646 | 215,901 | $2,277,837 |
|
| Shares issued in connection with | | | | |
| reinvestment of distributions | 1,084 | 12,733 | 23,353 | 247,072 |
|
| | 101,188 | 1,136,379 | 239,254 | 2,524,909 |
|
| Shares repurchased | (322,289) | (3,647,888) | (808,623) | (8,565,194) |
|
| Net decrease | (221,101) | $(2,511,509) | (569,369) | $(6,040,285) |
|
35
| | | | |
| | Six months ended 1/31/11 | Year ended 7/31/10 |
|
| Class M | Shares | Amount | Shares | Amount |
|
| Shares sold | 52,913 | $605,454 | 124,781 | $1,306,948 |
|
| Shares issued in connection with | | | | |
| reinvestment of distributions | 5,637 | 65,893 | 20,924 | 220,116 |
|
| | 58,550 | 671,347 | 145,705 | 1,527,064 |
|
| Shares repurchased | (220,971) | (2,514,062) | (365,961) | (3,841,058) |
|
| Net decrease | (162,421) | $(1,842,715) | (220,256) | $(2,313,994) |
|
| |
| | Six months ended 1/31/11 | Year ended 7/31/10 |
|
| Class R | Shares | Amount | Shares | Amount |
|
| Shares sold | 12,692 | $149,810 | 33,652 | $369,744 |
|
| Shares issued in connection with | | | | |
| reinvestment of distributions | 681 | 8,308 | 1,659 | 18,217 |
|
| | 13,373 | 158,118 | 35,311 | 387,961 |
|
| Shares repurchased | (18,728) | (222,645) | (39,231) | (441,164) |
|
| Net decrease | (5,355) | $(64,527) | (3,920) | $(53,203) |
|
| |
| | Six months ended 1/31/11 | Year ended 7/31/10 |
|
| Class Y | Shares | Amount | Shares | Amount |
|
| Shares sold | 270,680 | $3,310,558 | 1,129,352 | $12,623,876 |
|
| Shares issued in connection with | | | | |
| reinvestment of distributions | 26,586 | 332,855 | 140,368 | 1,580,539 |
|
| | 297,266 | 3,643,413 | 1,269,720 | 14,204,415 |
|
| Shares repurchased | (528,452) | (6,484,237) | (7,257,640) | (86,309,286) |
|
| Net decrease | (231,186) | $(2,840,824) | (5,987,920) | $(72,104,871) |
|
Note 5: Summary of derivative activity
The following is a summary of the market values of derivative instruments as of the close of the reporting period:
Market values of derivative instruments as of the close of the reporting period
| | | | |
| | Asset derivatives | Liability derivatives |
|
| Derivatives not | | | | |
| accounted for as | Statement of | | Statement of | |
| hedging instruments | assets and | | assets and | |
| under ASC 815 | liabilities location | Market value | liabilities location | Market value |
|
| |
| Equity contracts | Investments | $690,400 | Payables | $— |
|
| Total | | $690,400 | | $— |
|
The following is a summary of change in unrealized gains or losses of derivative instruments on the Statement of operations for the reporting period (see Note 1) (there were no realized gains or losses on derivative instruments):
Change in unrealized appreciation or (depreciation) on derivatives recognized in net gain or (loss) on investments
| | |
| Derivatives not accounted for as hedging | | |
| instruments under ASC 815 | Warrants | Total |
|
| Equity contracts | $(13,948) | $(13,948) |
|
| Total | $(13,948) | $(13,948) |
|
36
Note 6: Investment in Putnam Money Market Liquidity Fund
The fund invested in Putnam Money Market Liquidity Fund, an open-end management investment company managed by Putnam Management. Investments in Putnam Money Market Liquidity Fund are valued at its closing net asset value each business day. Income distributions earned by the fund are recorded as interest income in the Statement of operations and totaled $1,232 for the reporting period. During the reporting period, cost of purchases and proceeds of sales of investments in Putnam Money Market Liquidity Fund aggregated $71,925,063 and $71,526,670, respectively. Management fees charged to Putnam Money Market Liquidity Fund have been waived by Putnam Management.
Note 7: Regulatory matters and litigation
In late 2003 and 2004, Putnam Management settled charges brought by the SEC and the Massachusetts Securities Division in connection with excessive short-term trading in Putnam funds. Distribution of payments from Putnam Management to certain open-end Putnam funds and their shareholders is expected to be completed in the next several months. These allegations and related matters have served as the general basis for certain lawsuits, including purported class action lawsuits against Putnam Management and, in a limited number of cases, some Putnam funds. Putnam Management believes that these lawsuits will have no material adverse effect on the funds or on Putnam Management’s ability to provide investment management services. In addition, Putnam Management has agreed to bear any costs incurred by the Putnam funds as a result of these matters.
Note 8: Market and credit risk
In the normal course of business, the fund trades financial instruments and enters into financial transactions where risk of potential loss exists due to changes in the market (market risk) or failure of the contracting party to the transaction to perform (credit risk). The fund may be exposed to additional credit risk that an institution or other entity with which the fund has unsettled or open transactions will default.
37
The Putnam family of funds
The following is a list of Putnam’s open-end mutual funds offered to the public. Investors should carefully consider the investment objective, risks, charges, and expenses of a fund before investing. For a prospectus, or a summary prospectus if available, containing this and other information for any Putnam fund or product, call your financial advisor at 1-800-225-1581 and ask for a prospectus. Please read the prospectus carefully before investing.
| |
| Growth | Value |
| Growth Opportunities Fund | Convertible Securities Fund |
| International Growth Fund | Prior to September 30, 2010, the fund was known as |
| Prior to January 1, 2010, the fund was known as | Putnam Convertible Income-Growth Trust |
| Putnam International New Opportunities Fund | Equity Income Fund |
| Multi-Cap Growth Fund | George Putnam Balanced Fund |
| Prior to September 1, 2010, the fund was known as | Prior to September 30, 2010, the fund was known as |
| Putnam New Opportunities Fund | The George Putnam Fund of Boston |
| Small Cap Growth Fund | The Putnam Fund for Growth and Income |
| Voyager Fund | International Value Fund |
| | Prior to January 1, 2010, the fund was known as |
| Blend | Putnam International Growth and Income Fund |
| Asia Pacific Equity Fund | Multi-Cap Value Fund |
| Capital Opportunities Fund | Prior to September 1, 2010, the fund was known as |
| Capital Spectrum Fund | Putnam Mid Cap Value Fund |
| Emerging Markets Equity Fund | Small Cap Value Fund |
| Equity Spectrum Fund | |
| Europe Equity Fund | Income |
| Global Equity Fund | American Government Income Fund |
| International Capital Opportunities Fund | Diversified Income Trust |
| International Equity Fund | Floating Rate Income Fund |
| Investors Fund | Global Income Trust |
| Multi-Cap Core Fund | High Yield Advantage Fund |
| Research Fund | High Yield Trust |
| Income Fund |
| | Money Market Fund* |
| | U.S. Government Income Trust |
* An investment in a money market fund is not insured or guaranteed by the Federal Deposit Insurance Corporation or any other government agency. Although the fund seeks to preserve the value of your investment at $1.00 per share, it is possible to lose money by investing in the fund.
38
| |
| Tax-free income | Asset allocation |
| AMT-Free Municipal Fund | Income Strategies Fund |
| Tax Exempt Income Fund | Putnam Asset Allocation Funds — three |
| Tax Exempt Money Market Fund* | investment portfolios that spread your |
| Tax-Free High Yield Fund | money across a variety of stocks, bonds, |
| | and money market investments. |
| State tax-free income funds: | |
| Arizona, California, Massachusetts, Michigan, | The three portfolios: |
| Minnesota, New Jersey, New York, Ohio, | Asset Allocation: Balanced Portfolio |
| and Pennsylvania | Asset Allocation: Conservative Portfolio |
| | Asset Allocation: Growth Portfolio |
| Absolute Return | |
| Absolute Return 100 Fund | Putnam RetirementReady® |
| Absolute Return 300 Fund | Putnam RetirementReady Funds — 10 |
| Absolute Return 500 Fund | investment portfolios that offer diversifi- |
| Absolute Return 700 Fund | cation among stocks, bonds, and money |
| | market instruments and adjust to become |
| Global Sector | more conservative over time based on a |
| Global Consumer Fund | target date for withdrawing assets. |
| Global Energy Fund | |
| Global Financials Fund | The 10 funds: |
| Global Health Care Fund | Putnam RetirementReady 2055 Fund |
| Global Industrials Fund | Putnam RetirementReady 2050 Fund |
| Global Natural Resources Fund | Putnam RetirementReady 2045 Fund |
| Global Sector Fund | Putnam RetirementReady 2040 Fund |
| Global Technology Fund | Putnam RetirementReady 2035 Fund |
| Global Telecommunications Fund | Putnam RetirementReady 2030 Fund |
| Global Utilities Fund | Putnam RetirementReady 2025 Fund |
| | Putnam RetirementReady 2020 Fund |
| | Putnam RetirementReady 2015 Fund |
| | Putnam RetirementReady Maturity Fund |
A short-term trading fee of 1% may apply to redemptions or exchanges from certain funds within the time period specified in the fund's prospectus.
Check your account balances and the most recent month-end performance in the Individual Investors section at putnam.com.
39
Services for shareholders
Investor services
Systematic investment plan Tell us how much you wish to invest regularly — weekly, semimonthly, or monthly — and the amount you choose will be transferred automatically from your checking or savings account. There’s no additional fee for this service, and you can suspend it at any time. This plan may be a great way to save for college expenses or to plan for your retirement.
Please note that regular investing does not guarantee a profit or protect against loss in a declining market. Before arranging a systematic investment plan, consider your financial ability to continue making purchases in periods when prices are low.
Systematic exchange You can make regular transfers from one Putnam fund to another Putnam fund. There are no additional fees for this service, and you can cancel or change your options at any time.
Dividends PLUS You can choose to have the dividend distributions from one of your Putnam funds automatically reinvested in another Putnam fund at no additional charge.
Free exchange privilege You can exchange money between Putnam funds free of charge, as long as they are the same class of shares. A signature guarantee is required if you are exchanging more than $500,000. The fund reserves the right to revise or terminate the exchange privilege.
Reinstatement privilege If you’ve sold Putnam shares or received a check for a dividend or capital gain, you may reinvest the proceeds with Putnam within 90 days of the transaction and they will be reinvested at the fund’s current net asset value — with no sales charge. However, reinstatement of class B shares may have special tax consequences. Ask your financial or tax representative for details.
Check-writing service You have ready access to many Putnam accounts. It’s as simple as writing a check, and there are no special fees or service charges. For more information about the check-writing service, call Putnam or visit our Web site.
Dollar cost averaging When you’re investing for long-term goals, it’s time, not timing, that counts. Investing on a systematic basis is a better strategy than trying to figure out when the markets will go up or down. This means investing the same amount of money regularly over a long period. This method of investing is called dollar cost averaging. When a fund’s share price declines, your investment dollars buy more shares at lower prices. When it increases, they buy fewer shares. Over time, you will pay a lower average price per share.
For more information
Visit the Individual Investors section at putnam.com A secure section of our Web site contains complete information on your account, including balances and transactions, updated daily. You may also conduct transactions, such as exchanges, additional investments, and address changes. Log on today to get your password.
Call us toll free at 1-800-225-1581 Ask a helpful Putnam representative or your financial advisor for details about any of these or other services, or see your prospectus.
40
Fund information
Founded over 70 years ago, Putnam Investments was built around the concept that a balance between risk and reward is the hallmark of a well-rounded financial program. We manage over 100 funds across income, value, blend, growth, asset allocation, absolute return, and global sector categories.
| | |
| Investment Manager | Kenneth R. Leibler | Mark C. Trenchard |
| Putnam Investment | Robert E. Patterson | Vice President and |
| Management, LLC | George Putnam, III | BSA Compliance Officer |
| One Post Office Square | Robert L. Reynolds | |
| Boston, MA 02109 | W. Thomas Stephens | Francis J. McNamara, III |
| | | Vice President and |
| Investment Sub-Manager | Officers | Chief Legal Officer |
| Putnam Investments Limited | Robert L. Reynolds | |
| 57–59 St James’s Street | President | James P. Pappas |
| London, England SW1A 1LD | | Vice President |
| | Jonathan S. Horwitz | |
| Marketing Services | Executive Vice President, | Judith Cohen |
| Putnam Retail Management | Principal Executive | Vice President, Clerk and |
| One Post Office Square | Officer, Treasurer and | Assistant Treasurer |
| Boston, MA 02109 | Compliance Liaison | |
| | | Michael Higgins |
| Custodian | Steven D. Krichmar | Vice President, Senior Associate |
| State Street Bank | Vice President and | Treasurer and Assistant Clerk |
| and Trust Company | Principal Financial Officer | |
| | | Nancy E. Florek |
| Legal Counsel | Janet C. Smith | Vice President, Assistant Clerk, |
| Ropes & Gray LLP | Vice President, Assistant | Assistant Treasurer and |
| | Treasurer and Principal | Proxy Manager |
| Trustees | Accounting Officer | |
| John A. Hill, Chairman | | Susan G. Malloy |
| Jameson A. Baxter, | Beth S. Mazor | Vice President and |
| Vice Chairman | Vice President | Assistant Treasurer |
| Ravi Akhoury | | |
| Barbara M. Baumann | Robert R. Leveille | |
| Charles B. Curtis | Vice President and | |
| Robert J. Darretta | Chief Compliance Officer | |
| Paul L. Joskow | | |
| | |
41
This report is for the information of shareholders of Putnam Investors Fund. It may also be used as sales literature when preceded or accompanied by the current prospectus, the most recent copy of Putnam’s Quarterly Performance Summary, and Putnam’s Quarterly Ranking Summary. For more recent performance, please visit putnam.com. Investors should carefully consider the investment objective, risks, charges, and expenses of a fund, which are described in its prospectus. For this and other information or to request a prospectus, or a summary prospectus if available, call 1-800-225-1581 toll free. Please read the prospectus carefully before investing. The fund’s Statement of Additional Information contains additional information about the fund’s Trustees and is available without charge upon request by calling 1-800-225-1581.
42
|
| This page left blank intentionally. |
43
|
| This page left blank intentionally. |
44

Item 2. Code of Ethics:
Not applicable
Item 3. Audit Committee Financial Expert:
Not applicable
Item 4. Principal Accountant Fees and Services:
Not applicable
Item 5. Audit Committee of Listed Registrants
Not applicable
Item 6. Schedule of Investments:
The registrant’s schedule of investments in unaffiliated issuers is included in the report to shareholders in Item 1 above.
Item 7. Disclosure of Proxy Voting Policies and Procedures For Closed-End Management Investment Companies:
Not applicable
Item 8. Portfolio Managers of Closed-End Investment Companies
Not Applicable
Item 9. Purchases of Equity Securities by Closed-End Management Investment Companies and Affiliated Purchasers:
Not applicable
Item 10. Submission of Matters to a Vote of Security Holders:
Not applicable
Item 11. Controls and Procedures:
(a) The registrant's principal executive officer and principal financial officer have concluded, based on their evaluation of the effectiveness of the design and operation of the registrant's disclosure controls and procedures as of a date within 90 days of the filing date of this report, that the design and operation of such procedures are generally effective to provide reasonable assurance that information required to be disclosed by the registrant in this report is recorded, processed, summarized and reported within the time periods specified in the Commission's rules and forms.
(b) Changes in internal control over financial reporting: Not applicable
Item 12. Exhibits:
(a)(1) Not applicable
(a)(2) Separate certifications for the principal executive officer and principal financial officer of the registrant as required by Rule 30a-2(a) under the Investment Company Act of 1940, as amended, are filed herewith.
(b) The certifications required by Rule 30a-2(b) under the Investment Company Act of 1940, as amended, are filed herewith.
Putnam Investors Fund
By (Signature and Title):
/s/Janet C. Smith
Janet C. Smith
Principal Accounting Officer
Date: March 31, 2011
Pursuant to the requirements of the Securities Exchange Act of 1934 and the Investment Company Act of 1940, this report has been signed below by the following persons on behalf of the registrant and in the capacities and on the dates indicated.
By (Signature and Title):
/s/Jonathan S. Horwitz
Jonathan S. Horwitz
Principal Executive Officer
Date: March 31, 2011
By (Signature and Title):
/s/Steven D. Krichmar
Steven D. Krichmar
Principal Financial Officer
Date: March 31, 2011