| UNITED STATES SECURITIES AND EXCHANGE COMMISSION | ||
| Washington, D.C. 20549 | ||
FORM N-CSR | ||
| CERTIFIED SHAREHOLDER REPORT OF REGISTERED MANAGEMENT INVESTMENT COMPANIES | ||
| Investment Company Act file number: | (811-00159) |
| Exact name of registrant as specified in charter: | Putnam Investors Fund |
| Address of principal executive offices: | One Post Office Square, Boston, Massachusetts 02109 |
| Name and address of agent for service: | Robert T. Burns, Vice President One Post Office Square Boston, Massachusetts 02109 |
| Copy to: | John W. Gerstmayr, Esq. Ropes & Gray LLP 800 Boylston Street Boston, Massachusetts 02199-3600 |
| Registrant’s telephone number, including area code: | (617) 292-1000 |
| Date of fiscal year end: | July 31, 2012 |
| Date of reporting period: | August 1, 2011 — July 31, 2012 |
Item 1. Report to Stockholders: |
| The following is a copy of the report transmitted to stockholders pursuant to Rule 30e-1 under the Investment Company Act of 1940: | |||
Putnam
Investors
Fund
Annual report
7 | 31 | 12
| Message from the Trustees | 1 | |
| About the fund | 2 | |
| Performance snapshot | 4 | |
| Interview with your fund’s portfolio manager | 5 | |
| Your fund’s performance | 10 | |
| Your fund’s expenses | 13 | |
| Terms and definitions | 15 | |
| Other information for shareholders | 16 | |
| Trustee approval of management contract | 17 | |
| Financial statements | 22 | |
| Federal tax information | 47 | |
| About the Trustees | 48 | |
| Officers | 50 | |
Consider these risks before investing: The price of stocks in the fund’s portfolio may fall or fail to rise over extended periods of time for a variety of reasons, including both general financial market conditions and factors relating to a specific country or industry. Growth stocks may be more susceptible to earnings disappointments, and value stocks may fail to rebound.
Message from the Trustees
Dear Fellow Shareholder:
High volatility continues to challenge stock and bond investors around the globe. Year-to-date through July 2012, markets have made major advances and suffered sharp declines. Investor confidence has accordingly waxed, waned, and rebounded with renewed strength. These fluctuations reflect fast-changing perceptions of global macroeconomic data and policymakers’ inability to decisively solve problems ranging from deep structural issues in Europe’s economy to China’s fluctuating growth rate and U.S. fiscal risks. Amid the uncertainties these challenges engender, taking the long view becomes all the more critical for investors, as does relying on the expertise of a financial advisor, who can help you maintain a balanced investment approach.
We would like to take this opportunity to announce the arrival of two new Trustees, Liaquat Ahamed and Katinka Domotorffy, CFA, to your fund’s Board of Trustees. Mr. Ahamed, who in 2010 won the Pulitzer Prize for History with his book, Lords of Finance: The Bankers Who Broke the World, also serves on the Board of Aspen Insurance and the Board of the Rohatyn Group, an emerging-market fund complex that manages money for institutional investors. Ms. Domotorffy, who until year-end 2011 was a Partner, Chief Investment Officer, and Global Head of Quantitative Investment Strategies at Goldman Sachs Asset Management, currently serves as a director for Reach Out and Read of Greater New York, an organization dedicated to promoting early childhood literacy.
We would also like to extend a welcome to new shareholders of the fund and to thank all of our investors for your continued confidence in Putnam.

About the fund
Investing in America’s large, growing companies
Putnam Investors Fund was founded in 1925 — the age of Model-T Fords, jazz, and the boundless optimism of one of the great American bull markets. Today, more than 85 years later, the fund continues to target leading American businesses, armed with the flexibility to invest across a range of stocks.
In the tradition of successful American stockpickers, the fund’s portfolio manager seeks opportunities that others may have overlooked.
The manager may see potential in value stocks, where investors may have temporarily pushed prices too low, or in fast-rising growth stocks, where investors have misjudged a company’s future growth potential.
The manager is supported by Putnam’s equity analysts, who conduct thorough fundamental research, visiting companies and talking to their management, suppliers, and competitors to find out what each business is really worth. This research helps to identify companies whose stock prices may not reflect their long-range prospects.
While much has changed since 1925, Putnam Investors Fund continues to pursue a goal that never goes out of style — finding great companies for investors.
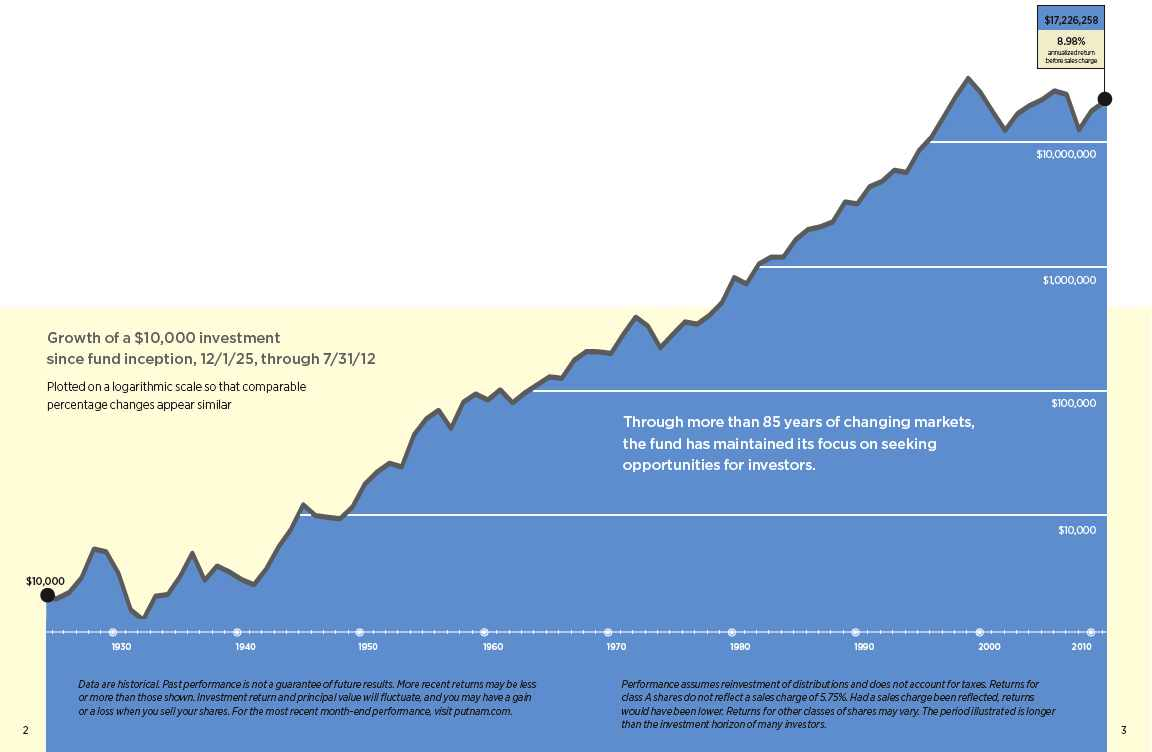
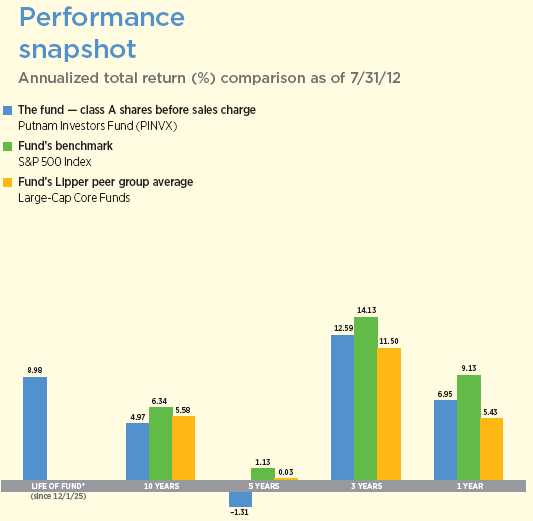
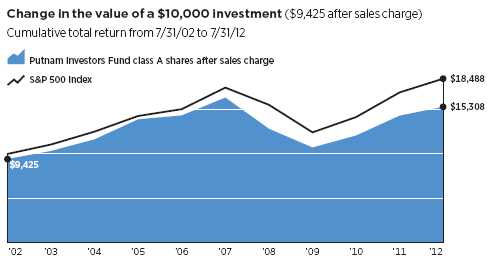
Current performance may be lower or higher than the quoted past performance, which cannot guarantee future results. Share price, principal value, and return will fluctuate, and you may have a gain or a loss when you sell your shares. Performance of class A shares assumes reinvestment of distributions and does not account for taxes. Fund returns in the bar chart do not reflect a sales charge of 5.75%; had they, returns would have been lower. See pages 5 and 10–12 for additional performance information. For a portion of the periods, the fund had expense limitations, without which returns would have been lower. To obtain the most recent month-end performance, visit putnam.com.
* The fund’s benchmark and Lipper category, the Standard & Poor’s 500 Index and Lipper Large-Cap Core Funds category, were introduced on 3/4/57 and 12/31/59, respectively, which post-date the inception of the fund’s class A shares.
4
Interview with your fund’s portfolio manager

Jerry, tell us about the investing environment for the 12 months ended July 31, 2012.
Although the fund and its benchmark posted positive returns for the period, it was a challenging and volatile 12 months for stock market investors. In August, when the fund’s fiscal year began, financial markets were enduring a series of setbacks that unnerved investors and created renewed uncertainty regarding the strength of the U.S. economic recovery. Worsening sovereign credit woes in Europe and a generally dismal outlook for global economic growth resulted in sharp declines across world stock markets. Debt issues in the United States added to the pressure as lawmakers struggled to reach an agreement over the federal debt ceiling. Despite the stock market’s dramatic recovery in October, heightened levels of volatility continued through the close of 2011.
In the first three months of 2012, U.S. stocks staged an impressive rally, rebounding considerably from their 2011 lows. In fact, major indexes posted their strongest first-quarter gains in over a decade. However, this was followed by an abrupt shift as volatility returned and a steep market decline in May cast a cloud on the first-quarter rally. Most notable for U.S. equities was a shift toward more defensive stocks — a flight to safety as investor sentiment dampened and worries
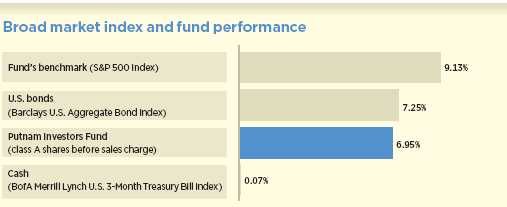
This comparison shows your fund’s performance in the context of broad market indexes for the 12 months ended 7/31/12. See pages 4 and 10–12 for additional fund performance information. Index descriptions can be found on page 15.
5
reemerged about global economic issues, particularly the European debt crisis. These conditions were reminiscent of 2011, when investors avoided cyclical stocks — whose performance is tied to the overall economy —and fled to sectors that are perceived as safe havens when economic growth is weak and markets are volatile.
For the fiscal year, the fund outperformed the average return for funds in its Lipper peer group but lagged its benchmark, the S&P 500 Index.
Within the fund’s portfolio, what strategies or holdings helped fund performance for the period?
Among the top contributors to fund performance was Spirit Airlines. I added this stock to the portfolio after its initial public offering in May 2011. Its stock price remained essentially flat until October, when it began to perform well as the company reported significant increases in passenger traffic. Spirit is a Florida-based airline that offers ultra-low fares for flights to and from South Florida, the Caribbean, and Latin America. In this economy, the airline has been particularly appealing to consumers looking for an inexpensive way to visit family members.
Another portfolio highlight was Fortune Brands Home & Security, which specializes in kitchen and bath cabinetry, plumbing, and security and storage systems. This is a strong business that had been embedded in a large conglomerate, Fortune Brands. Last October, it was spun off from the holding company and now operates independently. During the period, the company benefited from increased consumer spending for home repairs and remodeling, and stronger-than-expected sales in the first quarter of 2012.
Wyndham Worldwide, an operator of hotels and time-share properties, was a
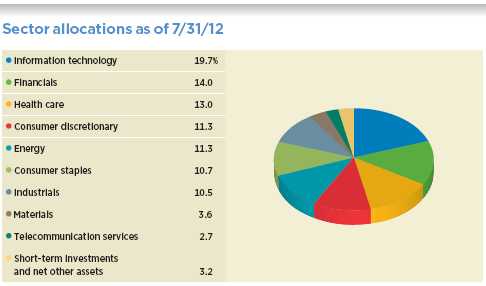
Allocations are represented as a percentage of the fund’s net assets. Summary information may differ from the portfolio schedule included in the financial statements due to the inclusion of derivative securities, the exclusion of as-of trades, if any, and the use of different classifications of securities for presentation purposes. Holdings and allocations may vary over time.
6
strong performer for the fund. The stock fell to very cheap levels when investors became concerned about the funding for its time-share financing business following the 2008 financial crisis. As the economy began to recover, so did business travel and lodging demand, and investors gained confidence in the strength of Wyndham’s businesses. The stock declined sharply again in the volatile markets of 2011 but has since recovered considerably.

Which holdings detracted from performance?
The stock of Hewlett-Packard has struggled for some time. In addition to disappointing earnings as a result of an overall decline in personal computer sales, the company has been dealing with management issues. Investors were not happy with the company’s decision in September 2011 to buy Autonomy — a search software company —for $10.3 billion, or its announcement that it might exit the PC business. Later that month, Hewlett-Packard appointed a new CEO and announced that it was remaining in the PC business. As the company grappled with these issues, its stock price declined to multi-year lows.
Another detractor was Camelot Information Systems, a holding company for information technology businesses in China. It provides software, system support and maintenance, and IT consulting services primarily for the financial services industry. I added the stock to the portfolio given its low valuation, but the company’s business and employee retention have been eroding. We mistakenly assumed
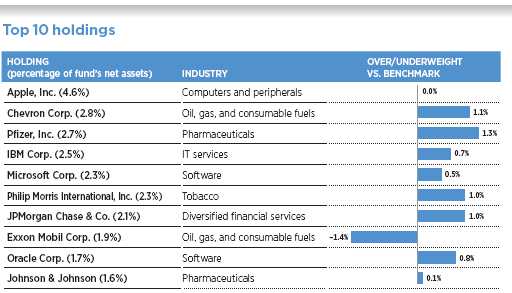
This table shows the fund’s top 10 holdings by percentage of the fund’s net assets as of 7/31/12.
Options and short-term holdings are excluded. Holdings will vary over time.
7
that Camelot would be a major beneficiary of a competitor’s fraud investigation. Given the challenges facing Camelot, I sold the stock from the portfolio by the close of the period.
Another weak performer was Huntsman, which has faced severe margin pressures. The company, which produces chemicals used for paint, has struggled as a result of the historic downturn in the housing market and rising prices for titanium ore.
As the fund enters a new fiscal year, what is your outlook?
Despite the turbulence of the past 12 months, I believe stocks continue to offer attractive opportunities for patient investors. The U.S. economy appears to be improving, housing prices are stabilizing and moving up in some markets, and employment data is looking more positive. Many U.S. companies have continued to report solid earnings growth that has surpassed analyst expectations. In addition, many businesses have record amounts of cash on their balance sheets, which could bode well for stocks if companies use this cash for stock buybacks and merger-and-acquisition activity. In fact, another positive sign, in my view, has been a notable increase in stock buybacks, even among companies that have struggled. This is often a sign that company managements are confident in the prospects for their businesses.
Of course, we cannot ignore the macroeconomic factors — such as the eurozone crisis, U.S. debt issues, and slowing growth in global economies — that are still unresolved. However, I believe most of these risks are priced into stocks, and that valuation and company fundamentals should become more important to investors in the months ahead.
Thank you, Jerry, for your time and insights.
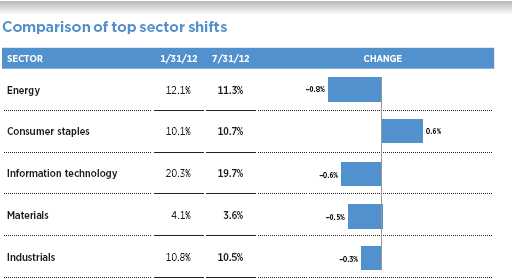
This chart shows the fund’s largest allocation shifts, by percentage, over the past six months. Weightings are shown as a percentage of net assets. Summary information may differ from the portfolio schedule included in the financial statements due to the inclusion of derivative securities, the exclusion of as-of trades, if any, and the use of different classifications of securities for presentation purposes. Holdings will vary over time.
8
The views expressed in this report are exclusively those of Putnam Management and are subject to change. They are not meant as investment advice.
Please note that the holdings discussed in this report may not have been held by the fund for the entire period. Portfolio composition is subject to review in accordance with the fund’s investment strategy and may vary in the future. Current and future portfolio holdings are subject to risk.
Portfolio Manager Gerard P. Sullivan has an M.B.A. from the Columbia University Graduate School of Business and a B.A. from Columbia University. Jerry joined Putnam in 2008 and has been in the investment industry since 1982.
IN THE NEWS
Despite an unsteady economic recovery, corporate earnings have continued to surprise on the upside. Through early August, nearly two thirds of the S&P 500 companies that had reported second-quarter earnings beat consensus estimates. That rate is slightly higher than the 10-year average of 62%, according to research by S&P Capital IQ. Some market watchers worry that a number of headwinds could derail the streak of higher corporate profits that began in 2009, including a strengthening U.S. dollar and a potentially deteriorating situation in Europe. Analysts currently expect S&P 500 earnings in the third quarter to be slightly lower than those recorded a year ago. But for now, the second quarter of 2012 could mark the 10th straight quarter of higher earnings for the S&P 500.
9
Your fund’s performance
This section shows your fund’s performance, price, and distribution information for periods ended July 31, 2012, the end of its most recent fiscal year. In accordance with regulatory requirements for mutual funds, we also include performance as of the most recent calendar quarter-end and expense information taken from the fund’s current prospectus. Performance should always be considered in light of a fund’s investment strategy. Data represent past performance. Past performance does not guarantee future results. More recent returns may be less or more than those shown. Investment return and principal value will fluctuate, and you may have a gain or a loss when you sell your shares. Performance information does not reflect any deduction for taxes a shareholder may owe on fund distributions or on the redemption of fund shares. For the most recent month-end performance, please visit the Individual Investors section at putnam.com or call Putnam at 1-800-225-1581. Class R, class R5, class R6, and class Y shares are not available to all investors. See the Terms and Definitions section in this report for definitions of the share classes offered by your fund.
Fund performance Total return for periods ended 7/31/12
| Class A | Class B | Class C | Class M | Class R | Class R5 | Class R6 | Class Y | |||||
| (inception dates) | (12/1/25) | (3/1/93) | (7/26/99) | (12/2/94) | (1/21/03) | (7/2/12) | (7/2/12) | (1/7/97) | ||||
| Before | After | Before | After | Net | Net | Net | Net | |||||
| sales | sales | Before | After | Before | After | sales | sales | asset | asset | asset | asset | |
| charge | charge | CDSC | CDSC | CDSC | CDSC | charge | charge | value | value | value | value | |
| Annual average | ||||||||||||
| (life of fund) | 8.98% | 8.91% | 7.95% | 7.95% | 8.16% | 8.16% | 8.23% | 8.18% | 8.71% | 4.22% | 4.22% | 9.03% |
| 10 years | 62.43 | 53.08 | 50.68 | 50.68 | 50.79 | 50.79 | 54.59 | 49.26 | 58.64 | 66.50 | 66.50 | 66.50 |
| Annual average | 4.97 | 4.35 | 4.19 | 4.19 | 4.19 | 4.19 | 4.45 | 4.09 | 4.72 | 5.23 | 5.23 | 5.23 |
| 5 years | –6.37 | –11.78 | –9.92 | –11.71 | –9.83 | –9.83 | –8.72 | –11.91 | –7.57 | –5.19 | –5.19 | –5.19 |
| Annual average | –1.31 | –2.48 | –2.07 | –2.46 | –2.05 | –2.05 | –1.81 | –2.50 | –1.56 | –1.06 | –1.06 | –1.06 |
| 3 years | 42.74 | 34.56 | 39.71 | 36.71 | 39.57 | 39.57 | 40.62 | 35.76 | 41.73 | 43.89 | 43.89 | 43.89 |
| Annual average | 12.59 | 10.40 | 11.79 | 10.99 | 11.75 | 11.75 | 12.03 | 10.73 | 12.33 | 12.90 | 12.90 | 12.90 |
| 1 year | 6.95 | 0.80 | 6.09 | 1.09 | 6.14 | 5.14 | 6.37 | 2.64 | 6.59 | 7.21 | 7.21 | 7.21 |
Current performance may be lower or higher than the quoted past performance, which cannot guarantee future results. After-sales-charge returns for class A and M shares reflect the deduction of the maximum 5.75% and 3.50% sales charge, respectively, levied at the time of purchase. Class B share returns after contingent deferred sales charge (CDSC) reflect the applicable CDSC, which is 5% in the first year, declining over time to 1% in the sixth year, and is eliminated thereafter. Class C share returns after CDSC reflect a 1% CDSC for the first year that is eliminated thereafter. Class R and Y shares have no initial sales charge or CDSC. Performance for class B, C, M, R, and Y shares before their inception is derived from the historical performance of class A shares, adjusted for the applicable sales charge (or CDSC) and the higher operating expenses for such shares, except for class Y shares, for which 12b-1 fees are not applicable. Class R5 and class R6 shares, available to qualified employee-benefit plans only, are sold without an initial sales charge and have no CDSC. Performance for class R5 and class R6 shares prior to their inception is derived from the historical performance of class Y shares, beginning with inception of the Y share class, and has not been adjusted for the lower investor servicing fees applicable to class R5 and class R6 shares; had they, returns would have been higher.
Recent performance may have benefited from one or more legal settlements.
For a portion of the periods, the fund had expense limitations, without which returns would have been lower.
Class B share performance does not reflect conversion to class A shares.
10
Comparative index returns For periods ended 7/31/12
| Lipper Large-Cap Core Funds | ||
| S&P 500 Index | category average* | |
| Annual average | ||
| (life of fund) | —† | —† |
| 10 years | 84.88% | 73.44% |
| Annual average | 6.34 | 5.58 |
| 5 years | 5.78 | 0.59 |
| Annual average | 1.13 | 0.03 |
| 3 years | 48.64 | 38.83 |
| Annual average | 14.13 | 11.50 |
| 1 year | 9.13 | 5.43 |
Index and Lipper results should be compared with fund performance before sales charge, before CDSC, or at net asset value.
* Over the 1-year, 3-year, 5-year, and 10-year periods ended 7/31/12, there were 971, 878, 766, and 501 funds, respectively, in this Lipper category.
† The fund’s benchmark and Lipper category, the Standard & Poor’s 500 Index and Lipper Large-Cap Core Funds category, were introduced on 3/4/57 and 12/31/59, respectively, which post-date the inception of the fund’s class A shares.
Past performance does not indicate future results. At the end of the same time period, a $10,000 investment in the fund’s class B and class C shares would have been valued at $15,068 and $15,079, respectively, and no contingent deferred sales charges would apply. A $10,000 investment in the fund’s class M shares ($9,650 after sales charge) would have been valued at $14,926. A $10,000 investment in the fund’s class R, R5, R6, and Y shares would have been valued at $15,864, $16,650, $16,650, and $16,650, respectively.
11
Fund price and distribution information For the 12-month period ended 7/31/12
| Distributions | Class A | Class B | Class C | Class M | Class R | Class R5 | Class R6 | Class Y | ||
| Number | 1 | 1 | 1 | 1 | 1 | — | — | 1 | ||
| Income | $0.129 | $0.026 | $0.030 | $0.063 | $0.113 | — | — | $0.164 | ||
| Capital gains | — | — | — | — | — | — | — | — | ||
| Total | $0.129 | $0.026 | $0.030 | $0.063 | $0.113 | — | — | $0.164 | ||
| Before | After | Net | Net | Before | After | Net | Net | Net | Net | |
| sales | sales | asset | asset | sales | sales | asset | asset | asset | asset | |
| Share value | charge | charge | value | value | charge | charge | value | value | value | value |
| 7/31/11 | $13.12 | $13.92 | $11.79 | $12.43 | $12.38 | $12.83 | $12.95 | — | — | $13.32 |
| 7/2/12* | — | — | — | — | — | — | — | $13.97 | $13.97 | — |
| 7/31/12 | 13.89 | 14.74 | 12.48 | 13.16 | 13.10 | 13.58 | 13.68 | 14.10 | 14.10 | 14.10 |
The classification of distributions, if any, is an estimate. Before-sales-charge share value and current dividend rate for class A and M shares, if applicable, do not take into account any sales charge levied at the time of purchase. After-sales-charge share value, current dividend rate, and current 30-day SEC yield, if applicable, are calculated assuming that the maximum sales charge (5.75% for class A shares and 3.50% for class M shares) was levied at the time of purchase. Final distribution information will appear on your year-end tax forms.
* Inception date of class R5 and R6 shares.
Fund performance as of most recent calendar quarter
Total return for periods ended 6/30/12
| Class A | Class B | Class C | Class M | Class R | Class Y | |||||
| (inception dates) | (12/1/25) | (3/1/93) | (7/26/99) | (12/2/94) | (1/21/03) | (1/7/97) | ||||
| Before | After | Before | After | Net | Net | |||||
| sales | sales | Before | After | Before | After | sales | sales | asset | asset | |
| charge | charge | CDSC | CDSC | CDSC | CDSC | charge | charge | value | value | |
| Annual average | ||||||||||
| (life of fund) | 8.97% | 8.90% | 7.94% | 7.94% | 8.15% | 8.15% | 8.22% | 8.18% | 8.70% | 9.02% |
| 10 years | 48.26 | 39.80 | 37.25 | 37.25 | 37.46 | 37.46 | 40.96 | 36.05 | 44.89 | 51.98 |
| Annual average | 4.02 | 3.41 | 3.22 | 3.22 | 3.23 | 3.23 | 3.49 | 3.13 | 3.78 | 4.27 |
| 5 years | –12.53 | –17.56 | –15.82 | –17.49 | –15.78 | –15.78 | –14.67 | –17.65 | –13.60 | –11.41 |
| Annual average | –2.64 | –3.79 | –3.39 | –3.77 | –3.38 | –3.38 | –3.12 | –3.81 | –2.88 | –2.39 |
| 3 years | 52.04 | 43.27 | 48.57 | 45.57 | 48.63 | 48.63 | 49.74 | 44.49 | 50.88 | 53.14 |
| Annual average | 14.99 | 12.73 | 14.11 | 13.33 | 14.12 | 14.12 | 14.41 | 13.05 | 14.69 | 15.26 |
| 1 year | 2.66 | –3.21 | 1.88 | –3.12 | 1.90 | 0.90 | 2.18 | –1.38 | 2.42 | 2.98 |
12
Your fund’s expenses
As a mutual fund investor, you pay ongoing expenses, such as management fees, distribution fees (12b-1 fees), and other expenses. Using the following information, you can estimate how these expenses affect your investment and compare them with the expenses of other funds. You may also pay one-time transaction expenses, including sales charges (loads) and redemption fees, which are not shown in this section and would have resulted in higher total expenses. For more information, see your fund’s prospectus or talk to your financial representative.
Expense ratios
| Class A | Class B | Class C | Class M | Class R | Class R5 | Class R6 | Class Y | |
| Total annual operating expenses | ||||||||
| for the fiscal year ended 7/31/11 | 1.18% | 1.93% | 1.93% | 1.68% | 1.43% | 0.76%* | 0.66%* | 0.93% |
| Annualized expense ratio for the | ||||||||
| six-month period ended 7/31/12† | 1.19% | 1.94% | 1.94% | 1.69% | 1.44% | 0.77% | 0.67% | 0.94% |
Fiscal-year expense information in this table is taken from the most recent prospectus, is subject to change, and may differ from that shown for the annualized expense ratio and in the financial highlights of this report. Expenses are shown as a percentage of average net assets.
* Expenses for class R5 and R6 shares are based on expenses of class A shares for the fund’s last fiscal year, adjusted to reflect the lower investor servicing fees applicable to class R5 and class R6 shares.
† For the fund’s most recent fiscal half year or, in the case of class R5 and R6 shares, for the period from 7/3/12 (commencement of operations) to 7/31/12; may differ from expense ratios based on one-year data in the financial highlights.
Expenses per $1,000
The following table shows the expenses you would have paid on a $1,000 investment in the fund from February 1, 2012 (or, in the case of class R5 and R6 shares, from July 3, 2012 (commencement of operations)), to July 31, 2012. It also shows how much a $1,000 investment would be worth at the close of the period, assuming actual returns and expenses.
| Class A | Class B | Class C | Class M | Class R | Class R5 | Class R6 | Class Y | |
| Expenses paid | ||||||||
| per $1,000*† | $6.06 | $9.86 | $9.86 | $8.59 | $7.32 | $0.61‡ | $0.53‡ | $4.79 |
| Ending value | ||||||||
| (after expenses) | $1,047.50 | $1,043.50 | $1,043.60 | $1,044.70 | $1,045.90 | $1,009.30 | $1,009.30 | $1,048.30 |
* Expenses for each share class are calculated using the fund’s annualized expense ratio for each class, which represents the ongoing expenses as a percentage of average net assets for the six months ended 7/31/12 (for class R5 and R6 shares, the period from 7/3/12 (commencement of operations) to 7/31/12). The expense ratio may differ for each share class.
† Expenses are calculated by multiplying the expense ratio by the average account value for the period; then multiplying the result by the number of days in the period; and then dividing that result by the number of days in the year.
‡ Had expenses for class R5 and R6 shares been shown for the entire period from 2/1/12, to 7/31/12, they would have been higher.
13
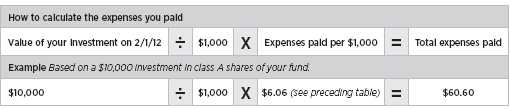
Estimate the expenses you paid
To estimate the ongoing expenses you paid for the six months ended July 31, 2012, use the following calculation method. To find the value of your investment on February 1, 2012, call Putnam at 1-800-225-1581.
Compare expenses using the SEC’s method
The Securities and Exchange Commission (SEC) has established guidelines to help investors assess fund expenses. Per these guidelines, the following table shows your fund’s expenses based on a $1,000 investment from February 1, 2012 (or, in the case of class R5 and R6 shares, from July 3, 2012 (commencement of operations)), to July 31, 2012, assuming a hypothetical 5% annualized return. You can use this information to compare the ongoing expenses (but not transaction expenses or total costs) of investing in the fund with those of other funds. All mutual fund shareholder reports will provide this information to help you make this comparison. Please note that you cannot use this information to estimate your actual ending account balance and expenses paid during the period.
| Class A | Class B | Class C | Class M | Class R | Class R5 | Class R6 | Class Y | |
| Expenses paid | ||||||||
| per $1,000*† | $5.97 | $9.72 | $9.72 | $8.47 | $7.22 | $0.61‡ | $0.53‡ | $4.72 |
| Ending value | ||||||||
| (after expenses) | $1,018.95 | $1,015.22 | $1,015.22 | $1,016.46 | $1,017.70 | $1,003.35 | $1,003.43 | $1,020.19 |
* Expenses for each share class are calculated using the fund’s annualized expense ratio for each class, which represents the ongoing expenses as a percentage of average net assets for the six months ended 7/31/12 (for class R5 and R6 shares, the period from 7/3/12 (commencement of operations) to 7/31/12). The expense ratio may differ for each share class.
† Expenses are calculated by multiplying the expense ratio by the average account value for the period; then multiplying the result by the number of days in the period; and then dividing that result by the number of days in the year.
‡ Had expenses for class R5 and R6 shares been shown for the entire period from 2/1/12, to 7/31/12, they would have been higher.
14
Terms and definitions
Important terms
Total return shows how the value of the fund’s shares changed over time, assuming you held the shares through the entire period and reinvested all distributions in the fund.
Before sales charge, or net asset value, is the price, or value, of one share of a mutual fund, without a sales charge. Before-sales-charge figures fluctuate with market conditions, and are calculated by dividing the net assets of each class of shares by the number of outstanding shares in the class.
After sales charge is the price of a mutual fund share plus the maximum sales charge levied at the time of purchase. After-sales-charge performance figures shown here assume the 5.75% maximum sales charge for class A shares and 3.50% for class M shares.
Contingent deferred sales charge (CDSC) is generally a charge applied at the time of the redemption of class B or C shares and assumes redemption at the end of the period. Your fund’s class B CDSC declines over time from a 5% maximum during the first year to 1% during the sixth year. After the sixth year, the CDSC no longer applies. The CDSC for class C shares is 1% for one year after purchase.
Share classes
Class A shares are generally subject to an initial sales charge and no CDSC (except on certain redemptions of shares bought without an initial sales charge).
Class B shares are not subject to an initial sales charge. They may be subject to a CDSC.
Class C shares are not subject to an initial sales charge and are subject to a CDSC only if the shares are redeemed during the first year.
Class M shares have a lower initial sales charge and a higher 12b-1 fee than class A shares and no CDSC (except on certain redemptions of shares bought without an initial sales charge).
Class R shares are not subject to an initial sales charge or CDSC and are available only to certain defined contribution plans.
Class R5 shares and class R6 shares are not subject to an initial sales charge or CDSC, and carry no 12b-1 fee. They are only available to certain defined contribution plans with assets of at least $50 million.
Class Y shares are not subject to an initial sales charge or CDSC, and carry no 12b-1 fee. They are generally only available to corporate and institutional clients and clients in other approved programs.
Comparative indexes
Barclays U.S. Aggregate Bond Index is an unmanaged index of U.S. investment-grade fixed-income securities.
BofA (Bank of America) Merrill Lynch U.S. 3-Month Treasury Bill Index is an unmanaged index that seeks to measure the performance of U.S. Treasury bills available in the marketplace.
S&P 500 Index is an unmanaged index of common stock performance.
Indexes assume reinvestment of all distributions and do not account for fees. Securities and performance of a fund and an index will differ. You cannot invest directly in an index.
Lipper is a third-party industry-ranking entity that ranks mutual funds. Its rankings do not reflect sales charges. Lipper rankings are based on total return at net asset value relative to other funds that have similar current investment styles or objectives as determined by Lipper. Lipper may change a fund’s category assignment at its discretion. Lipper category averages reflect performance trends for funds within a category.
15
Other information for shareholders
Important notice regarding Putnam’s privacy policy
In order to conduct business with our shareholders, we must obtain certain personal information such as account holders’ names, addresses, Social Security numbers, and dates of birth. Using this information, we are able to maintain accurate records of accounts and transactions.
It is our policy to protect the confidentiality of our shareholder information, whether or not a shareholder currently owns shares of our funds. In particular, it is our policy not to sell information about you or your accounts to outside marketing firms. We have safeguards in place designed to prevent unauthorized access to our computer systems and procedures to protect personal information from unauthorized use.
Under certain circumstances, we must share account information with outside vendors who provide services to us, such as mailings and proxy solicitations. In these cases, the service providers enter into confidentiality agreements with us, and we provide only the information necessary to process transactions and perform other services related to your account. Finally, it is our policy to share account information with your financial representative, if you’ve listed one on your Putnam account.
Proxy voting
Putnam is committed to managing our mutual funds in the best interests of our shareholders. The Putnam funds’ proxy voting guidelines and procedures, as well as information regarding how your fund voted proxies relating to portfolio securities during the 12-month period ended June 30, 2012, are available in the Individual Investors section at putnam.com, and on the Securities and Exchange Commission (SEC) website, www.sec.gov. If you have questions about finding forms on the SEC’s website, you may call the SEC at 1-800-SEC-0330. You may also obtain the Putnam funds’ proxy voting guidelines and procedures at no charge by calling Putnam’s Shareholder Services at 1-800-225-1581.
Fund portfolio holdings
The fund will file a complete schedule of its portfolio holdings with the SEC for the first and third quarters of each fiscal year on Form N-Q. Shareholders may obtain the fund’s Forms N-Q on the SEC’s website at www.sec.gov. In addition, the fund’s Forms N-Q may be reviewed and copied at the SEC’s Public Reference Room in Washington, D.C. You may call the SEC at 1-800-SEC-0330 for information about the SEC’s website or the operation of the Public Reference Room.
Trustee and employee fund ownership
Putnam employees and members of the Board of Trustees place their faith, confidence, and, most importantly, investment dollars in Putnam mutual funds. As of July 31, 2012, Putnam employees had approximately $332,000,000 and the Trustees had approximately $79,000,000 invested in Putnam mutual funds. These amounts include investments by the Trustees’ and employees’ immediate family members as well as investments through retirement and deferred compensation plans.
16
Trustee approval of management contract
General conclusions
The Board of Trustees of the Putnam funds oversees the management of each fund and, as required by law, determines annually whether to approve the continuance of your fund’s management contract with Putnam Investment Management (“Putnam Management”) and the sub-management contract with respect to your fund between Putnam Management and its affiliate, Putnam Investments Limited (“PIL”).
The Board of Trustees, with the assistance of its Contract Committee, requests and evaluates all information it deems reasonably necessary under the circumstances in connection with its annual contract review. The Contract Committee consists solely of Trustees who are not “interested persons” (as this term is defined in the Investment Company Act of 1940, as amended (the “1940 Act”)) of the Putnam funds (“Independent Trustees”).
At the outset of the review process, members of the Board’s independent staff and independent legal counsel met with representatives of Putnam Management to review the annual contract review materials furnished to the Contract Committee during the course of the previous year’s review and to discuss possible changes in these materials that might be necessary or desirable for the coming year. Following these discussions and in consultation with the Contract Committee, the Independent Trustees’ independent legal counsel requested that Putnam Management furnish specified information, together with any additional information that Putnam Management considered relevant, to the Contract Committee. Over the course of several months ending in June 2012, the Contract Committee met on a number of occasions with representatives of Putnam Management, and separately in executive session, to consider the information that Putnam Management provided. Throughout this process, the Contract Committee was assisted by the members of the Board’s independent staff and by independent legal counsel for the Putnam funds and the Independent Trustees.
In May 2012, the Contract Committee met in executive session with the other Independent Trustees to discuss the Contract Committee’s preliminary recommendations with respect to the continuance of the contracts. At the Trustees’ June 22, 2012 meeting, the Contract Committee met in executive session with the other Independent Trustees to review a summary of the key financial data that the Contract Committee considered in the course of its review. The Contract Committee then presented its written report, which summarized the key factors that the Committee had considered and set forth its final recommendations. The Contract Committee then recommended, and the Independent Trustees approved, the continuance of your fund’s management and sub-management contracts, effective July 1, 2012. (Because PIL is an affiliate of Putnam Management and Putnam Management remains fully responsible for all services provided by PIL, the Trustees have not evaluated PIL as a separate entity, and all subsequent references to Putnam Management below should be deemed to include reference to PIL as necessary or appropriate in the context.)
The Independent Trustees’ approval was based on the following conclusions:
• That the fee schedule in effect for your fund represented reasonable compensation in light of the nature and quality of the services being provided to the fund, the fees paid by competitive funds, and the costs incurred by Putnam Management in providing services, and
• That the fee schedule represented an appropriate sharing between fund shareholders and Putnam Management of such economies of scale as may exist in the management of the fund at current asset levels.
17
These conclusions were based on a comprehensive consideration of all information provided to the Trustees and were not the result of any single factor. Some of the factors that figured particularly in the Trustees’ deliberations and how the Trustees considered these factors are described below, although individual Trustees may have evaluated the information presented differently, giving different weights to various factors. It is also important to recognize that the management arrangements for your fund and the other Putnam funds are the result of many years of review and discussion between the Independent Trustees and Putnam Management, that some aspects of the arrangements may receive greater scrutiny in some years than others, and that the Trustees’ conclusions may be based, in part, on their consideration of fee arrangements in previous years.
Management fee schedules and total expenses
The Trustees reviewed the management fee schedules in effect for all Putnam funds, including fee levels and breakpoints. In reviewing management fees, the Trustees generally focus their attention on material changes in circumstances — for example, changes in assets under management, changes in a fund’s investment style, changes in Putnam Management’s operating costs, or changes in competitive practices in the mutual fund industry — that suggest that consideration of fee changes might be warranted. The Trustees concluded that the circumstances did not warrant changes to the management fee structure of your fund.
Most of the open-end Putnam funds, including your fund, have relatively new management contracts, which introduced fee schedules that reflect more competitive fee levels for many funds, complex-wide breakpoints for the open-end funds, and performance fees for some funds. These new management contracts have been in effect for two years — since January or, for a few funds, February 2010. The Trustees approved the new management contracts on July 10, 2009, and fund shareholders subsequently approved the contracts by overwhelming majorities of the shares voted.
Under its management contract, your fund has the benefit of breakpoints in its management fee that provide shareholders with significant economies of scale in the form of reduced fee levels as assets under management in the Putnam family of funds increase. The Contract Committee observed that the complex-wide breakpoints of the open-end funds had only been in place for two years, and the Trustees will continue to examine the operation of this new breakpoint structure in future years in light of further experience.
As in the past, the Trustees also focused on the competitiveness of each fund’s total expense ratio. In order to ensure that expenses of the Putnam funds continue to meet evolving competitive standards, the Trustees and Putnam Management agreed in 2009 to implement certain expense limitations. These expense limitations serve in particular to maintain competitive expense levels for funds with large numbers of small shareholder accounts and funds with relatively small net assets. Most funds had sufficiently low expenses that these expense limitations did not apply. However, in the case of your fund, the first of the expense limitations applied during its fiscal year ending in 2011. The expense limitations were: (i) a contractual expense limitation applicable to all retail open-end funds of 37.5 basis points (effective March 1, 2012, this expense limitation was reduced to 32 basis points) on investor servicing fees and expenses and (ii) a contractual expense limitation applicable to all open-end funds of 20 basis points on so-called “other expenses” (i.e., all expenses exclusive of management fees, investor servicing fees, distribution fees, investment-related expenses, interest, taxes, brokerage commissions, extraordinary expenses, and acquired fund fees and expenses). Putnam Management’s support for these expense limitations, including its agreement to reduce the expense limitation applicable to the open-end funds’ investor servicing fees
18
and expenses as noted above, was an important factor in the Trustees’ decision to approve the continuance of your fund’s management and sub-management contracts.
The Trustees reviewed comparative fee and expense information for a custom group of competitive funds selected by Lipper Inc. This comparative information included your fund’s percentile ranking for effective management fees and total expenses (excluding any applicable 12b-1 fee), which provides a general indication of your fund’s relative standing. In the custom peer group, your fund ranked in the 2nd quintile in effective management fees (determined for your fund and the other funds in the custom peer group based on fund asset size and the applicable contractual management fee schedule) and in the 4th quintile in total expenses (excluding any applicable 12b-1 fees) as of December 31, 2011 (the first quintile representing the least expensive funds and the fifth quintile the most expensive funds). The fee and expense data reported by Lipper as of December 31, 2011 reflected the most recent fiscal year-end data available in Lipper’s database at that time.
In connection with their review of the management fees and total expenses of the Putnam funds, the Trustees also reviewed the costs of the services provided and the profits realized by Putnam Management and its affiliates from their contractual relationships with the funds. This information included trends in revenues, expenses and profitability of Putnam Management and its affiliates relating to the investment management, investor servicing and distribution services provided to the funds. In this regard, the Trustees also reviewed an analysis of Putnam Management’s revenues, expenses and profitability, allocated on a fund-by-fund basis, with respect to the funds’ management, distribution, and investor servicing contracts. For each fund, the analysis presented information about revenues, expenses and profitability for each of the agreements separately and for the agreements taken together on a combined basis. The Trustees concluded that, at current asset levels, the fee schedules in place represented reasonable compensation for the services being provided and represented an appropriate sharing of such economies of scale as may exist in the management of the funds at that time.
The information examined by the Trustees as part of their annual contract review for the Putnam funds has included for many years information regarding fees charged by Putnam Management and its affiliates to institutional clients such as defined benefit pension plans, college endowments, and the like. This information included comparisons of those fees with fees charged to the funds, as well as an assessment of the differences in the services provided to these different types of clients. The Trustees observed that the differences in fee rates between institutional clients and mutual funds are by no means uniform when examined by individual asset sectors, suggesting that differences in the pricing of investment management services to these types of clients may reflect historical competitive forces operating in separate markets. The Trustees considered the fact that in many cases fee rates across different asset classes are higher on average for mutual funds than for institutional clients, as well as the differences between the services that Putnam Management provides to the Putnam funds and those that it provides to its institutional clients. The Trustees did not rely on these comparisons to any significant extent in concluding that the management fees paid by your fund are reasonable.
Investment performance
The quality of the investment process provided by Putnam Management represented a major factor in the Trustees’ evaluation of the quality of services provided by Putnam Management under your fund’s management contract. The Trustees were assisted in their review of the Putnam funds’ investment process and performance by the work of the investment
19
oversight committees of the Trustees, which meet on a regular basis with the funds’ portfolio teams and with the Chief Investment Officer and other members of Putnam Management’s Investment Division throughout the year. The Trustees concluded that Putnam Management generally provides a high-quality investment process — based on the experience and skills of the individuals assigned to the management of fund portfolios, the resources made available to them, and in general Putnam Management’s ability to attract and retain high-quality personnel — but also recognized that this does not guarantee favorable investment results for every fund in every time period.
The Trustees considered the investment performance of each fund over multiple time periods and considered information comparing each fund’s performance with various benchmarks and, where applicable, with the performance of competitive funds or targeted annualized return. They noted that since 2009, when Putnam Management began implementing major changes to strengthen its investment personnel and processes, there has been a steady improvement in the number of Putnam funds showing above-median three-year performance results. They also noted the disappointing investment performance of some funds for periods ended December 31, 2011 and considered information provided by Putnam Management regarding the factors contributing to the underperformance and actions being taken to improve the performance of these particular funds. The Trustees indicated their intention to continue to monitor performance trends to assess the effectiveness of these efforts and to evaluate whether additional actions to address areas of underperformance are warranted.
In the case of your fund, the Trustees considered that its class A share cumulative total return performance at net asset value was in the following quartiles of its Lipper Inc. peer group (Lipper Large-Cap Core Funds) for the one-year, three-year and five-year periods ended December 31, 2011 (the first quartile representing the best-performing funds and the fourth quartile the worst-performing funds):
| One-year period | 2nd | ||
| Three-year period | 1st | ||
| Five-year period | 4th | ||
Over the one-year, three-year and five-year periods ended December 31, 2011, there were 1,064, 956 and 825 funds, respectively, in your fund’s Lipper peer group. (When considering performance information, shareholders should be mindful that past performance is not a guarantee of future results.)
The Trustees, while noting that your fund’s investment performance over the one- and three-year periods ended December 31, 2011 had been favorable, expressed concern about your fund’s fourth quartile performance over the five-year period ended December 31, 2011 and considered the circumstances that may have contributed to this disappointing performance. The Trustees considered Putnam Management’s observation that the fund’s underperformance over this period was due in significant part to the fund’s particularly weak performance in 2007 and 2008. They noted Putnam Management’s view that performance beginning in 2007 was hurt by the fund’s overweight exposure to the financials sector, which began to experience extreme distress in the summer of 2007.
The Trustees also considered steps that Putnam Management had taken to support improved performance. They observed that, since March 2009, a single portfolio manager (who had joined the fund in July 2008) had taken sole responsibility for managing the fund’s investments. The Trustees noted that the fund’s relative performance had improved under this portfolio manager, with the fund ranking in the first quartile for the three-year period ended December 31, 2011. The Trustees also considered a number of other changes that Putnam Management had made in recent years in efforts to support and improve
20
fund performance generally. These changes included Putnam Management’s efforts to increase accountability and to reduce complexity in the portfolio management process for the Putnam equity funds by moving generally from a portfolio management team structure to a decision-making process that vests full authority and responsibility with individual portfolio managers and by affirming its commitment to a fundamental-driven approach to investing. The Trustees noted that Putnam Management had also worked to strengthen its fundamental research capabilities by adding new investment personnel to the large-cap equities research team and by bringing U.S. and international research under common leadership. In addition, the Trustees recognized that Putnam Management has adjusted the compensation structure for portfolio managers and research analysts so that only those who achieve top-quartile returns over a rolling three-year basis are eligible for full bonuses.
As a general matter, the Trustees believe that cooperative efforts between the Trustees and Putnam Management represent the most effective way to address investment performance problems. The Trustees noted that investors in the Putnam funds have, in effect, placed their trust in the Putnam organization, under the oversight of the funds’ Trustees, to make appropriate decisions regarding the management of the funds. Based on the responsiveness of Putnam Management in the recent past to performance issues, the Trustees concluded that it is preferable to seek change within Putnam Management to address performance shortcomings. In the Trustees’ view, the alternative of engaging a new investment adviser for an underperforming fund would entail significant disruptions and would not provide any greater assurance of improved investment performance.
Brokerage and soft-dollar allocations; investor servicing
The Trustees considered various potential benefits that Putnam Management may receive in connection with the services it provides under the management contract with your fund. These include benefits related to brokerage allocation and the use of soft dollars, whereby a portion of the commissions paid by a fund for brokerage may be used to acquire research services that are expected to be useful to Putnam Management in managing the assets of the fund and of other clients. Subject to policies established by the Trustees, soft-dollar credits acquired through these means are used primarily to acquire research services that supplement Putnam Management’s internal research efforts. However, the Trustees noted that a portion of available soft-dollar credits continues to be allocated to the payment of fund expenses. The Trustees indicated their continued intent to monitor regulatory developments in this area with the assistance of their Brokerage Committee and also indicated their continued intent to monitor the potential benefits associated with fund brokerage and soft-dollar allocations and trends in industry practices to ensure that the principle of seeking best price and execution remains paramount in the portfolio trading process.
Putnam Management may also receive benefits from payments that the funds make to Putnam Management’s affiliates for investor or distribution services. In conjunction with the annual review of your fund’s management and sub-management contracts, the Trustees reviewed your fund’s investor servicing agreement with Putnam Investor Services, Inc. (“PSERV”) and its distributor’s contracts and distribution plans with Putnam Retail Management Limited Partnership (“PRM”), both of which are affiliates of Putnam Management. The Trustees concluded that the fees payable by the funds to PSERV and PRM, as applicable, for such services are reasonable in relation to the nature and quality of such services.
21
Financial statements
These sections of the report, as well as the accompanying Notes, preceded by the Report of Independent Registered Public Accounting Firm, constitute the fund’s financial statements.
The fund’s portfolio lists all the fund’s investments and their values as of the last day of the reporting period. Holdings are organized by asset type and industry sector, country, or state to show areas of concentration and diversification.
Statement of assets and liabilities shows how the fund’s net assets and share price are determined. All investment and non-investment assets are added together. Any unpaid expenses and other liabilities are subtracted from this total. The result is divided by the number of shares to determine the net asset value per share, which is calculated separately for each class of shares. (For funds with preferred shares, the amount subtracted from total assets includes the liquidation preference of preferred shares.)
Statement of operations shows the fund’s net investment gain or loss. This is done by first adding up all the fund’s earnings — from dividends and interest income — and subtracting its operating expenses to determine net investment income (or loss). Then, any net gain or loss the fund realized on the sales of its holdings — as well as any unrealized gains or losses over the period — is added to or subtracted from the net investment result to determine the fund’s net gain or loss for the fiscal year.
Statement of changes in net assets shows how the fund’s net assets were affected by the fund’s net investment gain or loss, by distributions to shareholders, and by changes in the number of the fund’s shares. It lists distributions and their sources (net investment income or realized capital gains) over the current reporting period and the most recent fiscal year-end. The distributions listed here may not match the sources listed in the Statement of operations because the distributions are determined on a tax basis and may be paid in a different period from the one in which they were earned.
Financial highlights provide an overview of the fund’s investment results, per-share distributions, expense ratios, net investment income ratios, and portfolio turnover in one summary table, reflecting the five most recent reporting periods. In a semiannual report, the highlights table also includes the current reporting period.
22
Report of Independent Registered Public Accounting Firm
The Board of Trustees and Shareholders
Putnam Investors Fund:
We have audited the accompanying statement of assets and liabilities of Putnam Investors Fund (the fund), including the fund’s portfolio, as of July 31, 2012, and the related statement of operations for the year then ended, the statements of changes in net assets for each of the years in the two-year period then ended and the financial highlights for each of the five years or periods in the period then ended. These financial statements and financial highlights are the responsibility of the fund’s management. Our responsibility is to express an opinion on these financial statements and financial highlights based on our audits.
We conducted our audits in accordance with the standards of the Public Company Accounting Oversight Board (United States). Those standards require that we plan and perform our audit to obtain reasonable assurance about whether the financial statements and financial highlights are free of material misstatement. An audit includes examining, on a test basis, evidence supporting the amounts and disclosures in the financial statements. Our procedures included confirmation of securities owned as of July 31, 2012 by correspondence with the custodian and brokers or by other appropriate auditing procedures. An audit also includes assessing the accounting principles used and significant estimates made by management, as well as evaluating the overall financial statement presentation. We believe that our audits provide a reasonable basis for our opinion.
In our opinion, the financial statements and financial highlights referred to above present fairly, in all material respects, the financial position of Putnam Investors Fund as of July 31, 2012, the results of its operations, the changes in its net assets and the financial highlights for the five years or periods in the period then ended, in conformity with U.S. generally accepted accounting principles.

Boston, Massachusetts
September 14, 2012
23
The fund’s portfolio 7/31/12
| COMMON STOCKS (98.6%)* | Shares | Value |
| Aerospace and defense (3.8%) | ||
| Embraer SA ADR (Brazil) | 125,600 | $3,187,728 |
| General Dynamics Corp. S | 71,500 | 4,535,960 |
| Honeywell International, Inc. | 230,200 | 13,363,110 |
| L-3 Communications Holdings, Inc. | 105,300 | 7,464,717 |
| Northrop Grumman Corp. | 92,600 | 6,130,120 |
| Precision Castparts Corp. | 21,600 | 3,360,096 |
| Raytheon Co. | 40,000 | 2,219,200 |
| Textron, Inc. | 77,500 | 2,018,875 |
| United Technologies Corp. | 116,000 | 8,635,040 |
| 50,914,846 | ||
| Air freight and logistics (0.6%) | ||
| United Parcel Service, Inc. Class B | 109,400 | 8,271,734 |
| 8,271,734 | ||
| Airlines (0.6%) | ||
| Southwest Airlines Co. S | 390,600 | 3,589,614 |
| Spirit Airlines, Inc. † | 226,348 | 4,868,745 |
| 8,458,359 | ||
| Auto components (0.5%) | ||
| Autoliv, Inc. (Sweden) | 41,400 | 2,341,998 |
| Lear Corp. | 57,000 | 2,026,350 |
| TRW Automotive Holdings Corp. † | 61,611 | 2,421,312 |
| 6,789,660 | ||
| Automobiles (0.4%) | ||
| Ford Motor Co. S | 577,400 | 5,335,176 |
| 5,335,176 | ||
| Beverages (2.4%) | ||
| Coca-Cola Co. (The) | 135,300 | 10,932,240 |
| Coca-Cola Enterprises, Inc. | 278,700 | 8,171,484 |
| Molson Coors Brewing Co. Class B | 74,000 | 3,131,680 |
| PepsiCo, Inc. | 129,100 | 9,389,443 |
| 31,624,847 | ||
| Biotechnology (0.7%) | ||
| Amgen, Inc. | 95,900 | 7,921,340 |
| Celgene Corp. † | 23,600 | 1,615,656 |
| 9,536,996 | ||
| Building products (0.2%) | ||
| Fortune Brands Home & Security, Inc. † | 150,264 | 3,323,840 |
| 3,323,840 | ||
| Capital markets (2.4%) | ||
| Ameriprise Financial, Inc. | 81,200 | 4,199,664 |
| Apollo Global Management, LLC. Class A | 184,700 | 2,506,379 |
| Bank of New York Mellon Corp. (The) S | 203,700 | 4,334,736 |
| Goldman Sachs Group, Inc. (The) | 92,100 | 9,292,890 |
| Manning & Napier, Inc. | 152,551 | 2,080,796 |
| Morgan Stanley | 258,800 | 3,535,208 |
| State Street Corp. | 158,100 | 6,384,078 |
| 32,333,751 | ||
| Chemicals (2.6%) | ||
| Celanese Corp. Ser. A | 74,300 | 2,833,059 |
| CF Industries Holdings, Inc. | 19,600 | 3,836,896 |
24
| COMMON STOCKS (98.6%)* cont. | Shares | Value |
| Chemicals cont. | ||
| Dow Chemical Co. (The) | 118,943 | $3,423,180 |
| E.I. du Pont de Nemours & Co. | 72,300 | 3,593,310 |
| Huntsman Corp. S | 201,821 | 2,553,036 |
| LyondellBasell Industries NV Class A (Netherlands) | 76,500 | 3,406,545 |
| Monsanto Co. | 34,700 | 2,971,014 |
| PPG Industries, Inc. | 63,500 | 6,950,710 |
| Tronox, Ltd. Class A † | 101,000 | 2,340,170 |
| W.R. Grace & Co. † | 51,000 | 2,858,040 |
| 34,765,960 | ||
| Commercial banks (2.7%) | ||
| First Southern Bancorp, Inc. Class B † F | 112,320 | 898,560 |
| PNC Financial Services Group, Inc. | 102,900 | 6,081,390 |
| Regions Financial Corp. | 361,400 | 2,515,344 |
| U.S. Bancorp | 216,200 | 7,242,700 |
| Wells Fargo & Co. | 566,998 | 19,170,202 |
| 35,908,196 | ||
| Communications equipment (2.0%) | ||
| Cisco Systems, Inc. | 922,400 | 14,712,280 |
| Qualcomm, Inc. | 198,900 | 11,870,352 |
| 26,582,632 | ||
| Computers and peripherals (5.9%) | ||
| Apple, Inc. † | 100,367 | 61,300,149 |
| EMC Corp. † | 323,800 | 8,486,798 |
| Hewlett-Packard Co. | 221,140 | 4,033,594 |
| NetApp, Inc. † | 73,200 | 2,391,444 |
| SanDisk Corp. † | 74,999 | 3,084,709 |
| 79,296,694 | ||
| Consumer finance (0.9%) | ||
| Capital One Financial Corp. | 100,515 | 5,678,092 |
| Discover Financial Services | 170,500 | 6,131,180 |
| 11,809,272 | ||
| Containers and packaging (0.3%) | ||
| Bemis Co., Inc. | 78,500 | 2,413,875 |
| Owens-Illinois, Inc. † | 120,300 | 2,219,535 |
| 4,633,410 | ||
| Diversified financial services (3.6%) | ||
| Bank of America Corp. | 868,642 | 6,375,832 |
| Citigroup, Inc. | 179,380 | 4,866,579 |
| CME Group, Inc. | 60,500 | 3,152,655 |
| JPMorgan Chase & Co. | 774,873 | 27,895,428 |
| Nasdaq OMX Group, Inc. (The) S | 116,800 | 2,651,360 |
| NBH Holdings Co. 144A Class A † | 159,300 | 2,827,575 |
| 47,769,429 | ||
| Diversified telecommunication services (2.7%) | ||
| AT&T, Inc. | 394,005 | 14,940,670 |
| Iridium Communications, Inc. † S | 506,197 | 4,586,145 |
| Verizon Communications, Inc. | 375,800 | 16,963,612 |
| 36,490,427 | ||
| Electric utilities (1.0%) | ||
| Edison International | 114,300 | 5,278,374 |
| Entergy Corp. | 117,900 | 8,567,793 |
| 13,846,167 | ||
25
| COMMON STOCKS (98.6%)* cont. | Shares | Value |
| Energy equipment and services (1.2%) | ||
| Cameron International Corp. † | 64,500 | $3,242,415 |
| Nabors Industries, Ltd. † | 218,800 | 3,028,192 |
| Schlumberger, Ltd. | 145,624 | 10,377,166 |
| 16,647,773 | ||
| Food and staples retail (2.7%) | ||
| Chefs’ Warehouse, Inc. (The) † | 97,699 | 1,577,839 |
| CVS Caremark Corp. | 216,810 | 9,810,653 |
| Kroger Co. (The) | 132,100 | 2,928,657 |
| Safeway, Inc. S | 194,100 | 3,018,255 |
| Walgreen Co. | 173,400 | 6,304,824 |
| Wal-Mart Stores, Inc. S | 172,900 | 12,868,947 |
| 36,509,175 | ||
| Food products (0.9%) | ||
| Bunge, Ltd. | 39,900 | 2,624,223 |
| H.J. Heinz Co. | 53,700 | 2,964,777 |
| Hillshire Brands Co. | 67,600 | 1,731,236 |
| Mead Johnson Nutrition Co. | 31,200 | 2,276,352 |
| Post Holdings, Inc. † | 77,856 | 2,304,538 |
| 11,901,126 | ||
| Health-care equipment and supplies (1.9%) | ||
| Baxter International, Inc. | 77,800 | 4,552,078 |
| Boston Scientific Corp. † | 488,700 | 2,526,579 |
| Covidien PLC (Ireland) | 103,500 | 5,783,580 |
| Medtronic, Inc. | 134,500 | 5,301,990 |
| St. Jude Medical, Inc. | 87,400 | 3,265,264 |
| Zimmer Holdings, Inc. S | 67,700 | 3,989,561 |
| 25,419,052 | ||
| Health-care providers and services (3.0%) | ||
| Aetna, Inc. | 197,631 | 7,126,574 |
| AmerisourceBergen Corp. | 104,900 | 4,164,530 |
| Express Scripts Holding Co. † | 114,400 | 6,628,336 |
| HCA Holdings, Inc. | 115,000 | 3,045,200 |
| McKesson Corp. | 110,000 | 9,980,300 |
| UnitedHealth Group, Inc. | 182,500 | 9,323,925 |
| 40,268,865 | ||
| Hotels, restaurants, and leisure (1.2%) | ||
| Ignite Restaurant Group, Inc. † | 79,600 | 1,088,132 |
| McDonald’s Corp. | 107,700 | 9,624,072 |
| Red Robin Gourmet Burgers, Inc. † S | 67,100 | 2,002,935 |
| Wyndham Worldwide Corp. | 75,600 | 3,934,980 |
| 16,650,119 | ||
| Household durables (0.2%) | ||
| Newell Rubbermaid, Inc. | 171,800 | 3,032,270 |
| 3,032,270 | ||
| Household products (1.9%) | ||
| Colgate-Palmolive Co. | 76,400 | 8,202,304 |
| Energizer Holdings, Inc. † | 35,700 | 2,776,389 |
| Procter & Gamble Co. (The) | 220,400 | 14,224,616 |
| 25,203,309 | ||
| Independent power producers and energy traders (0.5%) | ||
| AES Corp. (The) † | 512,400 | 6,179,544 |
| 6,179,544 | ||
26
| COMMON STOCKS (98.6%)* cont. | Shares | Value |
| Industrial conglomerates (2.1%) | ||
| General Electric Co. | 836,000 | $17,347,000 |
| Tyco International, Ltd. | 208,000 | 11,427,520 |
| 28,774,520 | ||
| Insurance (3.6%) | ||
| ACE, Ltd. | 134,000 | 9,849,000 |
| Allstate Corp. (The)�� | 84,700 | 2,905,210 |
| Berkshire Hathaway, Inc. Class B † | 44,280 | 3,756,715 |
| Hartford Financial Services Group, Inc. (The) S | 191,400 | 3,148,530 |
| MetLife, Inc. | 264,766 | 8,146,850 |
| Principal Financial Group | 113,500 | 2,904,465 |
| Prudential Financial, Inc. | 160,700 | 7,758,596 |
| RenaissanceRe Holdings, Ltd. | 35,800 | 2,648,842 |
| Travelers Cos., Inc. (The) | 111,000 | 6,954,150 |
| 48,072,358 | ||
| Internet and catalog retail (0.7%) | ||
| Amazon.com, Inc. † | 15,900 | 3,709,470 |
| Priceline.com, Inc. † | 8,200 | 5,426,268 |
| 9,135,738 | ||
| Internet software and services (1.6%) | ||
| eBay, Inc. † | 79,100 | 3,504,130 |
| Facebook, Inc. Class A † S | 104,600 | 2,270,866 |
| Google, Inc. Class A † | 24,098 | 15,253,311 |
| 21,028,307 | ||
| IT services (4.3%) | ||
| Accenture PLC Class A | 116,363 | 7,016,689 |
| Alliance Data Systems Corp. † | 24,900 | 3,237,000 |
| IBM Corp. S | 171,000 | 33,512,580 |
| Total Systems Services, Inc. | 112,100 | 2,651,165 |
| Unisys Corp. † | 74,880 | 1,454,918 |
| Visa, Inc. Class A S | 41,800 | 5,395,126 |
| Western Union Co. (The) | 240,600 | 4,193,658 |
| 57,461,136 | ||
| Life sciences tools and services (0.3%) | ||
| Agilent Technologies, Inc. | 111,700 | 4,276,993 |
| 4,276,993 | ||
| Machinery (1.4%) | ||
| AGCO Corp. † S | 55,300 | 2,424,352 |
| Caterpillar, Inc. | 52,400 | 4,412,604 |
| CNH Global NV (Netherlands) † S | 58,500 | 2,230,020 |
| Eaton Corp. S | 42,300 | 1,854,432 |
| Ingersoll-Rand PLC | 49,600 | 2,103,536 |
| Parker Hannifin Corp. S | 74,700 | 5,999,904 |
| 19,024,848 | ||
| Media (4.6%) | ||
| CBS Corp. Class B | 98,700 | 3,302,502 |
| Comcast Corp. Class A | 448,800 | 14,608,440 |
| DISH Network Corp. Class A | 133,000 | 4,091,080 |
| Gannett Co., Inc. S | 146,900 | 2,072,759 |
| Interpublic Group of Companies, Inc. (The) | 577,500 | 5,699,925 |
| News Corp. Class A | 266,100 | 6,125,622 |
27
| COMMON STOCKS (98.6%)* cont. | Shares | Value |
| Media cont. | ||
| Omnicom Group, Inc. S | 55,000 | $2,759,900 |
| Sirius XM Radio, Inc. † S | 1,002,800 | 2,166,048 |
| Time Warner Cable, Inc. | 61,200 | 5,197,716 |
| Time Warner, Inc. | 163,900 | 6,411,768 |
| Walt Disney Co. (The) S | 197,300 | 9,695,322 |
| 62,131,082 | ||
| Metals and mining (0.5%) | ||
| Freeport-McMoRan Copper & Gold, Inc. Class B (Indonesia) | 105,000 | 3,535,350 |
| Teck Resources, Ltd. Class B (Canada) | 87,700 | 2,458,231 |
| 5,993,581 | ||
| Multiline retail (1.0%) | ||
| Macy’s, Inc. | 192,100 | 6,884,864 |
| Target Corp. | 113,600 | 6,889,840 |
| 13,774,704 | ||
| Multi-utilities (1.1%) | ||
| Ameren Corp. | 229,028 | 7,835,048 |
| CenterPoint Energy, Inc. | 137,500 | 2,895,750 |
| DTE Energy Co. | 64,200 | 3,939,954 |
| 14,670,752 | ||
| Office electronics (0.2%) | ||
| Xerox Corp. | 398,100 | 2,758,833 |
| 2,758,833 | ||
| Oil, gas, and consumable fuels (10.1%) | ||
| Apache Corp. | 99,800 | 8,594,776 |
| Chevron Corp. | 342,800 | 37,564,024 |
| ConocoPhillips S | 137,400 | 7,480,056 |
| Devon Energy Corp. | 76,200 | 4,504,944 |
| Exxon Mobil Corp. | 300,362 | 26,086,440 |
| LRR Energy LP | 475,313 | 7,809,393 |
| Marathon Oil Corp. | 235,300 | 6,228,391 |
| Noble Energy, Inc. | 31,400 | 2,745,302 |
| Occidental Petroleum Corp. | 125,300 | 10,904,859 |
| Oiltanking Partners LP (Units) | 143,719 | 4,879,260 |
| Phillips 66 † | 64,900 | 2,440,240 |
| Royal Dutch Shell PLC ADR (United Kingdom) | 89,800 | 6,124,360 |
| SandRidge Mississippian Trust II | 138,600 | 2,877,336 |
| Scorpio Tankers, Inc. (Monaco) † | 157,555 | 946,906 |
| Suncor Energy, Inc. (Canada) | 89,600 | 2,736,384 |
| Valero Energy Corp. | 99,600 | 2,739,000 |
| 134,661,671 | ||
| Paper and forest products (0.2%) | ||
| International Paper Co. | 67,300 | 2,208,113 |
| 2,208,113 | ||
| Personal products (0.2%) | ||
| Avon Products, Inc. | 200,300 | 3,102,647 |
| 3,102,647 | ||
| Pharmaceuticals (7.1%) | ||
| Abbott Laboratories | 173,200 | 11,484,892 |
| Johnson & Johnson | 312,800 | 21,652,016 |
| Medicines Co. (The) † | 106,652 | 2,670,566 |
| Merck & Co., Inc. | 470,200 | 20,768,734 |
28
| COMMON STOCKS (98.6%)* cont. | Shares | Value |
| Pharmaceuticals cont. | ||
| Pfizer, Inc. | 1,477,326 | $35,514,917 |
| ViroPharma, Inc. † S | 113,100 | 2,455,401 |
| 94,546,526 | ||
| Professional services (0.5%) | ||
| Equifax, Inc. | 49,200 | 2,304,528 |
| Nielsen Holdings NV † | 144,500 | 4,118,250 |
| 6,422,778 | ||
| Real estate investment trusts (REITs) (0.6%) | ||
| American Capital Agency Corp. | 94,300 | 3,313,702 |
| Terreno Realty Corp. | 76,874 | 1,146,191 |
| Weyerhaeuser Co. | 155,600 | 3,633,260 |
| 8,093,153 | ||
| Road and rail (0.8%) | ||
| Hertz Global Holdings, Inc. † | 290,391 | 3,269,803 |
| Union Pacific Corp. S | 57,600 | 7,062,336 |
| 10,332,139 | ||
| Semiconductors and semiconductor equipment (1.3%) | ||
| Advanced Micro Devices, Inc. † S | 442,000 | 1,794,520 |
| Intel Corp. S | 360,500 | 9,264,850 |
| KLA-Tencor Corp. | 38,300 | 1,949,853 |
| Texas Instruments, Inc. | 139,900 | 3,810,876 |
| 16,820,099 | ||
| Software (4.4%) | ||
| CA, Inc. | 111,000 | 2,671,770 |
| Microsoft Corp. | 1,051,400 | 30,984,758 |
| Oracle Corp. | 768,100 | 23,196,620 |
| Symantec Corp. † | 157,100 | 2,474,325 |
| 59,327,473 | ||
| Specialty retail (2.0%) | ||
| Best Buy Co., Inc. S | 142,800 | 2,583,252 |
| Foot Locker, Inc. | 106,400 | 3,513,328 |
| Home Depot, Inc. (The) S | 201,400 | 10,509,052 |
| Lowe’s Cos., Inc. | 147,000 | 3,729,390 |
| Staples, Inc. S | 210,300 | 2,679,222 |
| TJX Cos., Inc. (The) | 81,300 | 3,599,964 |
| 26,614,208 | ||
| Textiles, apparel, and luxury goods (0.3%) | ||
| Coach, Inc. S | 76,700 | 3,783,611 |
| 3,783,611 | ||
| Tobacco (2.6%) | ||
| Lorillard, Inc. | 35,500 | 4,566,720 |
| Philip Morris International, Inc. | 332,800 | 30,431,232 |
| 34,997,952 | ||
| Trading companies and distributors (0.3%) | ||
| Air Lease Corp. † | 166,050 | 3,267,862 |
| WESCO International, Inc. † S | 12,011 | 669,133 |
| 3,936,995 | ||
| Total common stocks (cost $1,241,511,780) | $1,321,452,846 | |
29
| INVESTMENT COMPANIES (0.7%)* | Shares | Value |
| Market Vectors Semiconductor ETF † | 146,900 | $4,736,056 |
| SPDR S&P Homebuilders ETF S | 209,800 | 4,414,192 |
| Total investment companies (cost $8,201,784) | $9,150,248 | |
| CONVERTIBLE PREFERRED STOCKS (0.3%)* | Shares | Value |
| Citigroup, Inc. $7.50 cv. pfd. | 41,340 | $3,540,771 |
| Unisys Corp. Ser. A, 6.25% cv. pfd. | 16,345 | 966,398 |
| Total convertible preferred stocks (cost $5,967,180) | $4,507,169 | |
| PREFERRED STOCKS (—%)* | Shares | Value |
| First Southern Bancorp, Inc. 5.00% cum. pfd. (acquired 12/17/09, | ||
| cost $192,000) † ‡ F | 192 | $192,000 |
| Total preferred stocks (cost $192,000) | $192,000 | |
| SHORT-TERM INVESTMENTS (8.8%)* | Shares | Value |
| Putnam Cash Collateral Pool, LLC 0.21% d | 106,497,145 | $106,497,145 |
| Putnam Money Market Liquidity Fund 0.13% e | 10,906,016 | 10,906,016 |
| Total short-term investments (cost $117,403,161) | $117,403,161 | |
| TOTAL INVESTMENTS | ||
| Total investments (cost $1,373,275,905) | $1,452,705,424 | |
Key to holding’s abbreviations
| ADR | American Depository Receipts: represents ownership of foreign securities on deposit with a custodian bank |
| ETF | Exchange Traded Fund |
| SPDR | S&P Depository Receipts |
Notes to the fund’s portfolio
Unless noted otherwise, the notes to the fund’s portfolio are for the close of the fund’s reporting period, which ran from August 1, 2011 through July 31, 2012 (the reporting period). Within the following notes to the portfolio, references to “ASC 820” represent Accounting Standards Codification ASC 820 Fair Value Measurements and Disclosures.
* Percentages indicated are based on net assets of $1,339,660,174.
† Non-income-producing security.
‡ Security is restricted with regard to public resale. The total market value of this security and any other restricted securities (excluding 144A securities), if any, held at the close of the reporting period was $192,000, or less than 0.1% of net assets.
d See Note 1 to the financial statements regarding securities lending. The rate quoted in the security description is the annualized 7-day yield of the fund at the close of the reporting period.
e See Note 5 to the financial statements regarding investments in Putnam Money Market Liquidity Fund. The rate quoted in the security description is the annualized 7-day yield of the fund at the close of the reporting period.
F Is valued at fair value following procedures approved by the Trustees. Securities may be classified as Level 2 or Level 3 for ASC 820 based on the securities’ valuation inputs.
S Security on loan, in part or in entirety, at the close of the reporting period (Note 1).
144A after the name of an issuer represents securities exempt from registration under Rule 144A under the Securities Act of 1933, as amended. These securities may be resold in transactions exempt from registration, normally to qualified institutional buyers.
30
ASC 820 establishes a three-level hierarchy for disclosure of fair value measurements. The valuation hierarchy is based upon the transparency of inputs to the valuation of the fund’s investments. The three levels are defined as follows:
Level 1: Valuations based on quoted prices for identical securities in active markets.
Level 2: Valuations based on quoted prices in markets that are not active or for which all significant inputs are observable, either directly or indirectly.
Level 3: Valuations based on inputs that are unobservable and significant to the fair value measurement.
The following is a summary of the inputs used to value the fund’s net assets as of the close of the reporting period:
| Valuation inputs | |||
| Investments in securities: | Level 1 | Level 2 | Level 3 |
| Common stocks: | |||
| Consumer discretionary | $147,246,568 | $— | $— |
| Consumer staples | 143,339,056 | — | — |
| Energy | 151,309,444 | — | — |
| Financials | 180,260,024 | 2,827,575 | 898,560 |
| Health care | 174,048,432 | — | — |
| Industrials | 139,460,059 | — | — |
| Information technology | 263,275,174 | — | — |
| Materials | 47,601,064 | — | — |
| Telecommunication services | 36,490,427 | — | — |
| Utilities | 34,696,463 | — | — |
| Total common stocks | 1,317,726,711 | 2,827,575 | 898,560 |
| Convertible preferred stocks | — | 4,507,169 | — |
| Investment companies | 9,150,248 | — | — |
| Preferred stocks | — | — | 192,000 |
| Short-term investments | 10,906,016 | 106,497,145 | — |
| Totals by level | $1,337,782,975 | $113,831,889 | $1,090,560 |
At the start and close of the reporting period, Level 3 investments in securities were not considered a significant portion of the fund’s portfolio.
The accompanying notes are an integral part of these financial statements.
31
Statement of assets and liabilities 7/31/12
| ASSETS | |
| Investment in securities, at value, including $102,502,636 of securities on loan (Note 1): | |
| Unaffiliated issuers (identified cost $1,255,872,744) | $1,335,302,263 |
| Affiliated issuers (identified cost $117,403,161) (Notes 1 and 5) | 117,403,161 |
| Dividends, interest and other receivables | 1,818,058 |
| Receivable for shares of the fund sold | 186,970 |
| Receivable for investments sold | 9,058,820 |
| Total assets | 1,463,769,272 |
| LIABILITIES | |
| Payable for investments purchased | 13,311,483 |
| Payable for shares of the fund repurchased | 1,691,498 |
| Payable for compensation of Manager (Note 2) | 636,947 |
| Payable for investor servicing fees (Note 2) | 696,261 |
| Payable for custodian fees (Note 2) | 10,199 |
| Payable for Trustee compensation and expenses (Note 2) | 675,214 |
| Payable for administrative services (Note 2) | 2,821 |
| Payable for distribution fees (Note 2) | 332,143 |
| Collateral on securities loaned, at value (Note 1) | 106,497,145 |
| Other accrued expenses | 255,387 |
| Total liabilities | 124,109,098 |
| Net assets | $1,339,660,174 |
| REPRESENTED BY | |
| Paid-in capital (Unlimited shares authorized) (Notes 1 and 4) | $2,179,717,104 |
| Undistributed net investment income (Note 1) | 12,765,897 |
| Accumulated net realized loss on investments and foreign currency transactions (Note 1) | (932,252,346) |
| Net unrealized appreciation of investments | 79,429,519 |
| Total — Representing net assets applicable to capital shares outstanding | $1,339,660,174 |
(Continued on next page)
32
Statement of assets and liabilities (Continued)
| COMPUTATION OF NET ASSET VALUE AND OFFERING PRICE | |
| Net asset value and redemption price per class A share | |
| ($1,191,455,444 divided by 85,779,918 shares) | $13.89 |
| Offering price per class A share (100/94.25 of $13.89)* | $14.74 |
| Net asset value and offering price per class B share ($52,016,844 divided by 4,168,962 shares)** | $12.48 |
| Net asset value and offering price per class C share ($30,508,882 divided by 2,319,025 shares)** | $13.16 |
| Net asset value and redemption price per class M share ($18,740,300 divided by 1,430,580 shares) | $13.10 |
| Offering price per class M share (100/96.50 of $13.10)* | $13.58 |
| Net asset value, offering price and redemption price per class R share | |
| ($2,053,459 divided by 150,082 shares) | $13.68 |
| Net asset value, offering price and redemption price per class R5 share | |
| ($10,093 divided by 716 shares) | $14.10 |
| Net asset value, offering price and redemption price per class R6 share | |
| ($10,093 divided by 716 shares) | $14.10 |
| Net asset value, offering price and redemption price per class Y share | |
| ($44,865,059 divided by 3,181,966 shares) | $14.10 |
* On single retail sales of less than $50,000. On sales of $50,000 or more the offering price is reduced.
** Redemption price per share is equal to net asset value less any applicable contingent deferred sales charge.
The accompanying notes are an integral part of these financial statements.
33
Statement of operations Year ended 7/31/12
| INVESTMENT INCOME | |
| Dividends (net of foreign tax of $176,788) | $30,518,409 |
| Interest (including interest income of $5,227 from investments in affiliated issuers) (Note 5) | 5,227 |
| Securities lending (Note 1) | 253,370 |
| Total investment income | 30,777,006 |
| EXPENSES | |
| Compensation of Manager (Note 2) | 7,528,166 |
| Investor servicing fees (Note 2) | 4,432,995 |
| Custodian fees (Note 2) | 22,428 |
| Trustee compensation and expenses (Note 2) | 113,896 |
| Administrative services (Note 2) | 42,762 |
| Distribution fees — Class A (Note 2) | 2,956,929 |
| Distribution fees — Class B (Note 2) | 566,988 |
| Distribution fees — Class C (Note 2) | 305,694 |
| Distribution fees — Class M (Note 2) | 140,112 |
| Distribution fees — Class R (Note 2) | 9,456 |
| Other | 540,730 |
| Total expenses | 16,660,156 |
| Expense reduction (Note 2) | (50,486) |
| Net expenses | 16,609,670 |
| Net investment income | 14,167,336 |
| Net realized gain on investments (Notes 1 and 3) | 41,955,542 |
| Net realized gain on foreign currency transactions (Note 1) | 10,230 |
| Net unrealized appreciation of investments during the year | 28,519,617 |
| Net gain on investments | 70,485,389 |
| Net increase in net assets resulting from operations | $84,652,725 |
The accompanying notes are an integral part of these financial statements.
34
Statement of changes in net assets
| INCREASE (DECREASE) IN NET ASSETS | Year ended 7/31/12 | Year ended 7/31/11 |
| Operations: | ||
| Net investment income | $14,167,336 | $11,967,307 |
| Net realized gain on investments | ||
| and foreign currency transactions | 41,965,772 | 129,647,747 |
| Net unrealized appreciation of investments | 28,519,617 | 111,988,156 |
| Net increase in net assets resulting from operations | 84,652,725 | 253,603,210 |
| Distributions to shareholders (Note 1): | ||
| From ordinary income | ||
| Net investment income | ||
| Class A | (11,824,530) | (9,767,499) |
| Class B | (132,758) | — |
| Class C | (75,216) | (14,861) |
| Class M | (97,214) | (67,456) |
| Class R | (17,888) | (8,308) |
| Class Y | (485,910) | (355,636) |
| Increase in capital from settlement payments (Note 7) | 28,996 | 454,764 |
| Decrease from capital share transactions (Note 4) | (158,676,679) | (241,028,359) |
| Total increase (decrease) in net assets | (86,628,474) | 2,815,855 |
| NET ASSETS | ||
| Beginning of year | 1,426,288,648 | 1,423,472,793 |
| End of year (including undistributed net investment income | ||
| of $12,765,897 and $12,388,363, respectively) | $1,339,660,174 | $1,426,288,648 |
The accompanying notes are an integral part of these financial statements.
35
Financial highlights (For a common share outstanding throughout the period)
| INVESTMENT OPERATIONS: | LESS DISTRIBUTIONS: | RATIOS AND SUPPLEMENTAL DATA: | ||||||||||||
| Ratio | Ratio | |||||||||||||
| Net realized | of expenses | of net investment | ||||||||||||
| Net asset value, | and unrealized | Total from | From | Total return | Net assets, | to average | income (loss) | Portfolio | ||||||
| beginning | Net investment | gain (loss) | investment | net investment | Total | Redemption | Non-recurring | Net asset value, | at net asset | end of period | net assets | to average | turnover | |
| Period ended | of period | income (loss) a | on investments | operations | income | distributions | fees | reimbursements | end of period | value (%) b | (in thousands) | (%) c | net assets (%) | (%) |
| Class A | ||||||||||||||
| July 31, 2012 | $13.12 | .14 | .76 | .90 | (.13) | (.13) | — | — d,e | $13.89 | 6.95 | $1,191,455 | 1.20 | 1.11 | 49 |
| July 31, 2011 | 11.15 | .11 | 1.95 | 2.06 | (.09) | (.09) | — | — d,f | 13.12 | 18.54 | 1,264,410 | 1.18 | .86 | 65 |
| July 31, 2010 | 10.04 | .08 | 1.18 | 1.26 | (.15) | (.15) | — d | — | 11.15 | 12.59 | 1,252,067 | 1.27 | .72 | 97 |
| July 31, 2009 | 12.05 | .13 | (2.12) g | (1.99) | (.02) | (.02) | — d | — d,h | 10.04 | (16.44) g | 1,263,196 | 1.21 i | 1.36 i | 106 |
| July 31, 2008 | 15.35 | .03 | (3.33) | (3.30) | — | — | — d | — | 12.05 | (21.50) | 1,520,659 | 1.16 i | .22 i | 127 |
| Class B | ||||||||||||||
| July 31, 2012 | $11.79 | .04 | .68 | .72 | (.03) | (.03) | — | — d,e | $12.48 | 6.09 | $52,017 | 1.95 | .38 | 49 |
| July 31, 2011 | 10.01 | .01 | 1.77 | 1.78 | — | — | — | — d,f | 11.79 | 17.78 | 66,615 | 1.93 | .12 | 65 |
| July 31, 2010 | 9.02 | — d | 1.07 | 1.07 | (.08) | (.08) | — d | — | 10.01 | 11.81 | 82,483 | 2.02 | (.01) | 97 |
| July 31, 2009 | 10.89 | .05 | (1.92) g | (1.87) | — | — | — d | — d,h | 9.02 | (17.17) g | 114,357 | 1.96 i | .63 i | 106 |
| July 31, 2008 | 13.99 | (.07) | (3.03) | (3.10) | — | — | — d | — | 10.89 | (22.16) | 193,547 | 1.91 i | (.55) i | 127 |
| Class C | ||||||||||||||
| July 31, 2012 | $12.43 | .04 | .72 | .76 | (.03) | (.03) | — | — d,e | $13.16 | 6.14 | $30,509 | 1.95 | .37 | 49 |
| July 31, 2011 | 10.56 | .01 | 1.87 | 1.88 | (.01) | (.01) | — | — d,f | 12.43 | 17.76 | 33,041 | 1.93 | .11 | 65 |
| July 31, 2010 | 9.53 | — d | 1.11 | 1.11 | (.08) | (.08) | — d | — | 10.56 | 11.67 | 32,969 | 2.02 | (.03) | 97 |
| July 31, 2009 | 11.49 | .06 | (2.02) g | (1.96) | — | — | — d | — d,h | 9.53 | (17.06) g | 35,155 | 1.96 i | .62 i | 106 |
| July 31, 2008 | 14.75 | (.07) | (3.19) | (3.26) | — | — | — d | — | 11.49 | (22.10) | 36,892 | 1.91 i | (.54) i | 127 |
| Class M | ||||||||||||||
| July 31, 2012 | $12.38 | .08 | .70 | .78 | (.06) | (.06) | — | — d,e | $13.10 | 6.37 | $18,740 | 1.70 | .62 | 49 |
| July 31, 2011 | 10.52 | .04 | 1.86 | 1.90 | (.04) | (.04) | — | — d,f | 12.38 | 18.04 | 20,483 | 1.68 | .36 | 65 |
| July 31, 2010 | 9.49 | .02 | 1.12 | 1.14 | (.11) | (.11) | — d | — | 10.52 | 11.99 | 20,818 | 1.77 | .22 | 97 |
| July 31, 2009 | 11.42 | .08 | (2.01) g | (1.93) | — | — | — d | — d,h | 9.49 | (16.90) g | 20,862 | 1.71 i | .87 i | 106 |
| July 31, 2008 | 14.62 | (.04) | (3.16) | (3.20) | — | — | — d | — | 11.42 | (21.89) | 21,936 | 1.66 i | (.28) i | 127 |
| Class R | ||||||||||||||
| July 31, 2012 | $12.95 | .11 | .73 | .84 | (.11) | (.11) | — | — d,e | $13.68 | 6.59 | $2,053 | 1.45 | .86 | 49 |
| July 31, 2011 | 11.00 | .08 | 1.94 | 2.02 | (.07) | (.07) | — | — d,f | 12.95 | 18.35 | 1,423 | 1.43 | .60 | 65 |
| July 31, 2010 | 9.91 | .05 | 1.17 | 1.22 | (.13) | (.13) | — d | — | 11.00 | 12.34 | 1,410 | 1.52 | .46 | 97 |
| July 31, 2009 | 11.90 | .11 | (2.10) g | (1.99) | — d | — d | — d | — d,h | 9.91 | (16.70) g | 1,309 | 1.46 i | 1.11 i | 106 |
| July 31, 2008 | 15.20 | — d | (3.30) | (3.30) | — | — | — d | — | 11.90 | (21.71) | 1,446 | 1.41 i | — i,j | 127 |
| Class R5 | ||||||||||||||
| July 31, 2012 † | $13.97 | .01 | .12 | .13 | — | — | — | — | $14.10 | .93* | $10 | .06* | .08* | 49 |
| Class R6 | ||||||||||||||
| July 31, 2012 † | $13.97 | .01 | .12 | .13 | — | — | — | — | $14.10 | .93* | $10 | .05* | .08* | 49 |
| Class Y | ||||||||||||||
| July 31, 2012 | $13.32 | .18 | .76 | .94 | (.16) | (.16) | — | — d,e | $14.10 | 7.21 | $44,865 | .95 | 1.35 | 49 |
| July 31, 2011 | 11.32 | .14 | 1.98 | 2.12 | (.12) | (.12) | — | — d,f | 13.32 | 18.82 | 40,316 | .93 | 1.10 | 65 |
| July 31, 2010 | 10.18 | .11 | 1.21 | 1.32 | (.18) | (.18) | — d | — | 11.32 | 12.96 | 33,725 | 1.02 | 1.02 | 97 |
| July 31, 2009 | 12.25 | .13 | (2.14) g | (2.01) | (.06) | (.06) | — d | — d,h | 10.18 | (16.31) g | 91,321 | .95 i | 1.58 i | 106 |
| July 31, 2008 | 15.56 | .07 | (3.38) | (3.31) | — | — | — d | — | 12.25 | (21.27) | 707,086 | .91 i | .48 i | 127 |
See notes to financial highlights at the end of this section.
The accompanying notes are an integral part of these financial statements.
| 36 | 37 |
Financial highlights (Continued)
* Not annualized.
† For the period July 3, 2012 (commencement of operations) to July 31, 2012.
a Per share net investment income (loss) has been determined on the basis of the weighted average number of shares outstanding during the period.
b Total return assumes dividend reinvestment and does not reflect the effect of sales charges.
c Includes amounts paid through expense offset and brokerage/service arrangements (Note 2).
d Amount represents less than $0.01 per share.
e Reflects a non-recurring reimbursement pursuant to a settlement between the Securities and Exchange Commission (the SEC) and Southwest Securities, Inc. (SWS) which amounted to less than $0.01 per share outstanding on August 22, 2011.
f Reflects a non-recurring reimbursement related to restitution payments in connection with a distribution plan approved by the the SEC which amounted to less than $0.01 per share outstanding on July 21, 2011. Also reflects a non-recurring reimbursement related to short-term trading related lawsuits, which amounted to less than $0.01 per share outstanding on May 11, 2011 (Note 7).
g Reflects a non-recurring litigation payment received by the fund from Tyco International, Ltd., which amounted to the following amounts per share outstanding on March 13, 2009:
| Per share | |
| Class A | $0.03 |
| Class B | 0.03 |
| Class C | 0.03 |
| Class M | 0.03 |
| Class R | 0.03 |
| Class Y | 0.04 |
This payment resulted in an increase to total returns of 0.25% for the year ended July 31, 2009.
h Reflects a non-recurring reimbursement pursuant to a settlement between the SEC and Bear Stearns & Co., Inc. and Bear Stearns Securities Corp., which amounted to less than $0.01 per share outstanding on May 21, 2009.
i Reflects an involuntary contractual expense limitation and/or waivers of certain fund expenses in connection with investments in Putnam Prime Money Market Fund in effect during the period. As a result of such limitation and/or waivers, the expenses of each class, reflect a reduction of the following amounts:
| Percentage of | |
| average net assets | |
| July 31, 2009 | 0.09% |
| July 31, 2008 | <0.01 |
j Amount represents less than 0.01% of average net assets.
The accompanying notes are an integral part of these financial statements.
38
Notes to financial statements 7/31/12
Within the following Notes to financial statements, references to “State Street” represent State Street Bank and Trust Company, references to “the SEC” represent the Securities and Exchange Commission and references to “Putnam Management” represent Putnam Investment Management, LLC, the fund’s manager, an indirect wholly-owned subsidiary of Putnam Investments, LLC. Unless otherwise noted, the “reporting period” represents the period from August 1, 2011 through July 31, 2012.
Putnam Investors Fund (the fund) is a Massachusetts business trust, which is registered under the Investment Company Act of 1940, as amended, as a diversified open-end management investment company. The investment objective of the fund is to seek long-term growth of capital and any increased income that results from this growth. The fund invests mainly in common stocks (growth or value stocks or both) of large U.S. companies that Putnam Management believes have favorable investment potential. For example, the fund may purchase stocks of companies with stock prices that reflect a value lower than that which Putnam Management places on the company. Putnam Management may also consider other factors that it believes will cause the stock price to rise and may consider, among other factors, a company’s valuation, financial strength, growth potential, competitive position in its industry, projected future earnings, cash flows and dividends when deciding whether to buy or sell investments.
The fund offers class A, class B, class C, class M, class R, class R5, class R6 and class Y shares. The fund began offering class R5 and class R6 shares on July 2, 2012. Class A and class M shares are sold with a maximum front-end sales charge of 5.75% and 3.50%, respectively, and generally do not pay a contingent deferred sales charge. Class B shares, which convert to class A shares after approximately eight years, do not pay a front-end sales charge and are subject to a contingent deferred sales charge if those shares are redeemed within six years of purchase. Class C shares have a one-year 1.00% contingent deferred sales charge and do not convert to class A shares. Class R shares, which are not available to all investors, are sold at net asset value. The expenses for class A, class B, class C, class M and class R shares may differ based on the distribution fee of each class, which is identified in Note 2. Class R5, class R6 and class Y shares, which are sold at net asset value, are generally subject to the same expenses as class A, class B, class C, class M and class R shares, but do not bear a distribution fee and in the case of class R5 and class R6 shares, bear a lower investor servicing fee, which is identified in Note 2. Class R5, class R6 and class Y shares are not available to all investors.
In the normal course of business, the fund enters into contracts that may include agreements to indemnify another party under given circumstances. The fund’s maximum exposure under these arrangements is unknown as this would involve future claims that may be, but have not yet been, made against the fund. However, the fund’s management team expects the risk of material loss to be remote.
Note 1: Significant accounting policies
The following is a summary of significant accounting policies consistently followed by the fund in the preparation of its financial statements. The preparation of financial statements is in conformity with accounting principles generally accepted in the United States of America and requires management to make estimates and assumptions that affect the reported amounts of assets and liabilities in the financial statements and the reported amounts of increases and decreases in net assets from operations. Actual results could differ from those estimates. Subsequent events after the Statement of assets and liabilities date through the date that the financial statements were issued have been evaluated in the preparation of the financial statements.
Investment income, realized and unrealized gains and losses and expenses of the fund are borne pro-rata based on the relative net assets of each class to the total net assets of the fund, except that each class bears expenses unique to that class (including the distribution fees applicable to such classes). Each class votes as a class only with respect to its own distribution plan or other matters on which a class vote is required by law or determined by the Trustees. If the fund were liquidated, shares of each class would receive their pro-rata share of the net assets of the fund. In addition, the Trustees declare separate dividends on each class of shares.
Security valuation Investments for which market quotations are readily available are valued at the last reported sales price on their principal exchange, or official closing price for certain markets, and are classified as Level 1 securities. If no sales are reported, as in the case of some securities traded over-the-counter, a security is valued at its last reported bid price and is generally categorized as a Level 2 security.
39
Investments in other open-end investment companies (excluding exchange traded funds), which are classified as Level 1 securities, are based on their net asset value. The net asset value of an investment company equals the total value of its assets less its liabilities and divided by the number of its outstanding shares. Shares are only valued as of the close of regular trading on the New York Stock Exchange each day that the exchange is open.
Many securities markets and exchanges outside the U.S. close prior to the close of the New York Stock Exchange and therefore the closing prices for securities in such markets or on such exchanges may not fully reflect events that occur after such close but before the close of the New York Stock Exchange. Accordingly, on certain days, the fund will fair value foreign equity securities taking into account multiple factors including movements in the U.S. securities markets, currency valuations and comparisons to the valuation of American Depository Receipts, exchange-traded funds and futures contracts. These securities, which would generally be classified as Level 1 securities, will be transferred to Level 2 of the fair value hierarchy when they are valued at fair value. The number of days on which fair value prices will be used will depend on market activity and it is possible that fair value prices will be used by the fund to a significant extent. Securities quoted in foreign currencies, if any, are translated into U.S. dollars at the current exchange rate.
To the extent a pricing service or dealer is unable to value a security or provides a valuation that Putnam Management does not believe accurately reflects the security’s fair value, the security will be valued at fair value by Putnam Management. Certain investments, including certain restricted and illiquid securities and derivatives, are also valued at fair value following procedures approved by the Trustees. These valuations consider such factors as significant market or specific security events such as interest rate or credit quality changes, various relationships with other securities, discount rates, U.S. Treasury, U.S. swap and credit yields, index levels, convexity exposures and recovery rates. These securities are classified as Level 2 or as Level 3 depending on the priority of the significant inputs.
Such valuations and procedures are reviewed periodically by the Trustees. The fair value of securities is generally determined as the amount that the fund could reasonably expect to realize from an orderly disposition of such securities over a reasonable period of time. By its nature, a fair value price is a good faith estimate of the value of a security in a current sale and does not reflect an actual market price, which may be different by a material amount.
Security transactions and related investment income Security transactions are recorded on the trade date (the date the order to buy or sell is executed). Gains or losses on securities sold are determined on the identified cost basis.
Interest income is recorded on the accrual basis. Dividend income, net of applicable withholding taxes, is recognized on the ex-dividend date except that certain dividends from foreign securities, if any, are recognized as soon as the fund is informed of the ex-dividend date. Non-cash dividends, if any, are recorded at the fair market value of the securities received. Dividends representing a return of capital or capital gains, if any, are reflected as a reduction of cost and/or as a realized gain.
Foreign currency translation The accounting records of the fund are maintained in U.S. dollars. The market value of foreign securities, currency holdings, and other assets and liabilities is recorded in the books and records of the fund after translation to U.S. dollars based on the exchange rates on that day. The cost of each security is determined using historical exchange rates. Income and withholding taxes are translated at prevailing exchange rates when earned or incurred. The fund does not isolate that portion of realized or unrealized gains or losses resulting from changes in the foreign exchange rate on investments from fluctuations arising from changes in the market prices of the securities. Such gains and losses are included with the net realized and unrealized gain or loss on investments. Net realized gains and losses on foreign currency transactions represent net realized exchange gains or losses on closed forward currency contracts, disposition of foreign currencies, currency gains and losses realized between the trade and settlement dates on securities transactions and the difference between the amount of investment income and foreign withholding taxes recorded on the fund’s books and the U.S. dollar equivalent amounts actually received or paid. Net unrealized appreciation and depreciation of assets and liabilities in foreign currencies arise from changes in the value of open forward currency contracts and assets and liabilities other than investments at the period end, resulting from changes in the exchange rate.
Securities lending The fund may lend securities, through its agent, to qualified borrowers in order to earn additional income. The loans are collateralized by cash in an amount at least equal to the market value of the securities loaned. The market value of securities loaned is determined daily and any additional required collateral is allocated to the fund on the next business day. The risk of borrower default will be borne by the fund’s agent; the fund will bear the risk of loss with respect to the investment of the cash collateral. Income from securities lending is included in investment income on the Statement of operations. Cash collateral is invested in Putnam Cash Collateral Pool, LLC, a limited liability company managed by an affiliate of Putnam Management. Investments in Putnam Cash
40
Collateral Pool, LLC are valued at its closing net asset value each business day. There are no management fees charged to Putnam Cash Collateral Pool, LLC. At the close of the reporting period, the value of securities loaned amounted to $102,947,703. Certain of these securities were sold prior to the close of the reporting period and are included in Receivable for investments sold on the Statement of assets and liabilities. The fund received cash collateral of $106,497,145.
Interfund lending The fund, along with other Putnam funds, may participate in an interfund lending program pursuant to an exemptive order issued by the SEC. This program allows the fund to borrow from or lend to other Putnam funds that permit such transactions. Interfund lending transactions are subject to each fund’s investment policies and borrowing and lending limits. Interest earned or paid on the interfund lending transaction will be based on the average of certain current market rates. During the reporting period, the fund did not utilize the program.
Line of credit The fund participates, along with other Putnam funds, in a $315 million ($325 million prior to June 29, 2012) unsecured committed line of credit and a $185 million unsecured uncommitted line of credit, both provided by State Street. Borrowings may be made for temporary or emergency purposes, including the funding of shareholder redemption requests and trade settlements. Interest is charged to the fund based on the fund’s borrowing at a rate equal to the Federal Funds rate plus 1.25% for the committed line of credit and the Federal Funds rate plus 1.30% for the uncommitted line of credit. A closing fee equal to 0.02% of the committed line of credit and $50,000 for the uncommitted line of credit has been paid by the participating funds. In addition, a commitment fee of 0.11% (0.13% prior to June 29, 2012) per annum on any unutilized portion of the committed line of credit is allocated to the participating funds based on their relative net assets and paid quarterly. During the reporting period, the fund had no borrowings against these arrangements.
Federal taxes It is the policy of the fund to distribute all of its taxable income within the prescribed time period and otherwise comply with the provisions of the Internal Revenue Code of 1986, as amended (the Code), applicable to regulated investment companies. It is also the intention of the fund to distribute an amount sufficient to avoid imposition of any excise tax under Section 4982 of the Code.
The fund is subject to the provisions of Accounting Standards Codification ASC 740 Income Taxes (ASC 740). ASC 740 sets forth a minimum threshold for financial statement recognition of the benefit of a tax position taken or expected to be taken in a tax return. The fund did not have a liability to record for any unrecognized tax benefits in the accompanying financial statements. No provision has been made for federal taxes on income, capital gains or unrealized appreciation on securities held nor for excise tax on income and capital gains. Each of the fund’s federal tax returns for the prior three fiscal years remains subject to examination by the Internal Revenue Service.
The fund may also be subject to taxes imposed by governments of countries in which it invests. Such taxes are generally based on either income or gains earned or repatriated. The fund accrues and applies such taxes to net investment income, net realized gains and net unrealized gains as income and/or capital gains are earned. In some cases, the fund may be entitled to reclaim all or a portion of such taxes, and such reclaim amounts, if any, are reflected as an asset on the fund’s books. In many cases, however, the fund may not receive such amounts for an extended period of time, depending on the country of investment.
At July 31, 2012, the fund had a capital loss carryover of $928,376,739 available to the extent allowed by the Code to offset future net capital gain, if any. The amounts of the carryovers and the expiration dates are:
| Loss carryover | |||
| Short-term | Long-term | Total | Expiration |
| $12,575,679 | N/A | $12,575,679 | July 31, 2015 |
| 56,131,294 | N/A | 56,131,294 | July 31, 2016 |
| 600,896,767 | N/A | 600,896,767 | July 31, 2017 |
| 258,772,999 | N/A | 258,772,999 | July 31, 2018 |
Under the Regulated Investment Company Modernization Act of 2010, the fund will be permitted to carry forward capital losses incurred in taxable years beginning after December 22, 2010 for an unlimited period. However, any losses incurred during those future years will be required to be utilized prior to the losses incurred in pre-enactment tax years. As a result of this ordering rule, pre-enactment capital loss carryforwards may be more likely to expire unused. Additionally, post-enactment capital losses that are carried forward will retain their character as either short-term or long-term capital losses rather than being considered all short-term as under previous law.
41
Distributions to shareholders Distributions to shareholders from net investment income are recorded by the fund on the ex-dividend date. Distributions from capital gains, if any, are recorded on the ex-dividend date and paid at least annually. The amount and character of income and gains to be distributed are determined in accordance with income tax regulations, which may differ from generally accepted accounting principles. These differences include temporary and/or permanent differences of losses on wash sale transactions, realized built-in losses, partnership income and capital loss carryover limitation write-on. Reclassifications are made to the fund’s capital accounts to reflect income and gains available for distribution (or available capital loss carryovers) under income tax regulations. For the reporting period ended, the fund reclassified $1,156,286 to decrease undistributed net investment income, $2,056,502 to decrease paid-in-capital and $3,212,788 to decrease accumulated net realized losses.
The tax basis components of distributable earnings and the federal tax cost as of the close of the reporting period were as follows:
| Unrealized appreciation | $196,916,990 |
| Unrealized depreciation | (121,363,078) |
| Net unrealized appreciation | 75,553,912 |
| Undistributed ordinary income | 12,765,897 |
| Capital loss carryforward | (928,376,739) |
| Cost for federal income tax purposes | $1,377,151,512 |
Note 2: Management fee, administrative services and other transactions
The fund pays Putnam Management a management fee (based on the fund’s average net assets and computed and paid monthly) at annual rates that may vary based on the average of the aggregate net assets of most open-end funds, as defined in the fund’s management contract, sponsored by Putnam Management. Such annual rates may vary as follows:
| 0.710% | of the first $5 billion, |
| 0.660% | of the next $5 billion, |
| 0.610% | of the next $10 billion, |
| 0.560% | of the next $10 billion, |
| 0.510% | of the next $50 billion, |
| 0.490% | of the next $50 billion, |
| 0.480% | of the next $100 billion and |
| 0.475% | of any excess thereafter. |
Putnam Management has contractually agreed, through June 30, 2013, to waive fees or reimburse the fund’s expenses to the extent necessary to limit the cumulative expenses of the fund, exclusive of brokerage, interest, taxes, investment-related expenses, extraordinary expenses and payments under the fund’s investor servicing contract, investment management contract and distribution plans, on a fiscal year-to-date basis to an annual rate of 0.20% of the fund’s average net assets over such fiscal year-to-date period. During the reporting period, the fund’s expenses were not reduced as a result of this limit.
Putnam Investments Limited (PIL), an affiliate of Putnam Management, is authorized by the Trustees to manage a separate portion of the assets of the fund as determined by Putnam Management from time to time. Putnam Management pays a quarterly sub-management fee to PIL for its services at an annual rate of 0.35% of the average net assets of the portion of the fund managed by PIL.
The fund reimburses Putnam Management an allocated amount for the compensation and related expenses of certain officers of the fund and their staff who provide administrative services to the fund. The aggregate amount of all such reimbursements is determined annually by the Trustees.
Custodial functions for the fund’s assets are provided by State Street. Custody fees are based on the fund’s asset level, the number of its security holdings and transaction volumes.
Putnam Investor Services, Inc., an affiliate of Putnam Management, provides investor servicing agent functions to the fund. Putnam Investor Services, Inc. received fees for investor servicing (except for Class R5 and R6 shares) based on the fund’s retail asset level, the number of shareholder accounts in the fund and the level of defined contribution plan assets in the fund. Class R5 shares pay a monthly fee based on the average net assets of class R5 shares at an annual rate of 0.15%. Class R6 shares pay a monthly fee based on the average net assets of class R6 shares at an annual rate of 0.05%. Investor servicing fees will not exceed an annual rate of 0.32% of the fund’s average net assets. Prior to March 1, 2012, investor servicing fees could not exceed an annual rate of 0.375% of the
42
fund’s average net assets. The amounts incurred for investor servicing agent functions during the reporting period are included in Investor servicing fees in the Statement of operations.
The fund has entered into expense offset arrangements with Putnam Investor Services, Inc. and State Street whereby Putnam Investor Services, Inc.’s and State Street’s fees are reduced by credits allowed on cash balances. The fund also reduced expenses through brokerage/service arrangements. For the reporting period, the fund’s expenses were reduced by $4,011 under the expense offset arrangements and by $46,475 under the brokerage/ service arrangements.
Each independent Trustee of the fund receives an annual Trustee fee, of which $1,058, as a quarterly retainer, has been allocated to the fund, and an additional fee for each Trustees meeting attended. Trustees also are reimbursed for expenses they incur relating to their services as Trustees.
The fund has adopted a Trustee Fee Deferral Plan (the Deferral Plan) which allows the Trustees to defer the receipt of all or a portion of Trustees fees payable on or after July 1, 1995. The deferred fees remain invested in certain Putnam funds until distribution in accordance with the Deferral Plan.
The fund has adopted an unfunded noncontributory defined benefit pension plan (the Pension Plan) covering all Trustees of the fund who have served as a Trustee for at least five years and were first elected prior to 2004. Benefits under the Pension Plan are equal to 50% of the Trustee’s average annual attendance and retainer fees for the three years ended December 31, 2005. The retirement benefit is payable during a Trustee’s lifetime, beginning the year following retirement, for the number of years of service through December 31, 2006. Pension expense for the fund is included in Trustee compensation and expenses in the Statement of operations. Accrued pension liability is included in Payable for Trustee compensation and expenses in the Statement of assets and liabilities. The Trustees have terminated the Pension Plan with respect to any Trustee first elected after 2003.
The fund has adopted distribution plans (the Plans) with respect to its class A, class B, class C, class M and class R shares pursuant to Rule 12b–1 under the Investment Company Act of 1940. The purpose of the Plans is to compensate Putnam Retail Management Limited Partnership, an indirect wholly-owned subsidiary of Putnam Investments, LLC., for services provided and expenses incurred in distributing shares of the fund. The Plans provide for payments by the fund to Putnam Retail Management Limited Partnership at an annual rate of up to 0.35%, 1.00%, 1.00%, 1.00% and 1.00% of the average net assets attributable to class A, class B, class C, class M and class R shares, respectively. The Trustees have approved payment by the fund at an annual rate of 0.25%, 1.00%, 1.00%, 0.75% and 0.50% of the average net assets attributable to class A, class B, class C, class M and class R shares, respectively.
For the reporting period, Putnam Retail Management Limited Partnership, acting as underwriter, received net commissions of $60,905 and $1,042 from the sale of class A and class M shares, respectively, and received $51,622 and $623 in contingent deferred sales charges from redemptions of class B and class C shares, respectively.
A deferred sales charge of up to 1.00% and 0.65% is assessed on certain redemptions of class A and class M shares, respectively. For the reporting period, Putnam Retail Management Limited Partnership, acting as underwriter, received $67 and no monies on class A and class M redemptions, respectively.
Note 3: Purchases and sales of securities
During the reporting period, cost of purchases and proceeds from sales of investment securities other than short-term investments aggregated $652,657,084 and $809,213,766, respectively. There were no purchases or proceeds from sales of long-term U.S. government securities.
Note 4: Capital shares
At the close of the reporting period, there was an unlimited number of shares of beneficial interest authorized. Transactions in capital shares were as follows:
| Year ended 7/31/12 | Year ended 7/31/11 | |||
| Class A | Shares | Amount | Shares | Amount |
| Shares sold | 4,434,995 | $58,541,002 | 4,578,996 | $58,217,034 |
| Shares issued in connection with | ||||
| reinvestment of distributions | 849,481 | 10,762,926 | 712,487 | 8,801,280 |
| 5,284,476 | 69,303,928 | 5,291,483 | 67,018,314 | |
| Shares repurchased | (15,840,786) | (206,293,822) | (21,272,514) | (269,777,775) |
| Net decrease | (10,556,310) | $(136,989,894) | (15,981,031) | $(202,759,461) |
43
| Year ended 7/31/12 | Year ended 7/31/11 | |||
| Class B | Shares | Amount | Shares | Amount |
| Shares sold | 337,386 | $3,959,179 | 411,110 | $4,665,895 |
| Shares issued in connection with | ||||
| reinvestment of distributions | 11,092 | 126,895 | — | — |
| 348,478 | 4,086,074 | 411,110 | 4,665,895 | |
| Shares repurchased | (1,831,671) | (21,518,755) | (2,998,273) | (34,134,620) |
| Net decrease | (1,483,193) | $(17,432,681) | (2,587,163) | $(29,468,725) |
| Year ended 7/31/12 | Year ended 7/31/11 | |||
| Class C | Shares | Amount | Shares | Amount |
| Shares sold | 137,843 | $1,686,135 | 169,999 | $2,012,982 |
| Shares issued in connection with | ||||
| reinvestment of distributions | 5,616 | 67,729 | 1,084 | 12,735 |
| 143,459 | 1,753,864 | 171,083 | 2,025,717 | |
| Shares repurchased | (482,718) | (5,945,131) | (634,176) | (7,615,958) |
| Net decrease | (339,259) | $(4,191,267) | (463,093) | $(5,590,241) |
| Year ended 7/31/12 | Year ended 7/31/11 | |||
| Class M | Shares | Amount | Shares | Amount |
| Shares sold | 62,607 | $766,030 | 83,953 | $998,954 |
| Shares issued in connection with | ||||
| reinvestment of distributions | 7,917 | 94,923 | 5,637 | 65,893 |
| 70,524 | 860,953 | 89,590 | 1,064,847 | |
| Shares repurchased | (294,397) | (3,549,127) | (413,500) | (4,954,901) |
| Net decrease | (223,873) | $(2,688,174) | (323,910) | $(3,890,054) |
| Year ended 7/31/12 | Year ended 7/31/11 | |||
| Class R | Shares | Amount | Shares | Amount |
| Shares sold | 73,807 | $863,270 | 29,907 | $378,609 |
| Shares issued in connection with | ||||
| reinvestment of distributions | 1,431 | 17,888 | 681 | 8,308 |
| 75,238 | 881,158 | 30,588 | 386,917 | |
| Shares repurchased | (35,072) | (461,370) | (48,858) | (624,059) |
| Net increase (decrease) | 40,166 | $419,788 | (18,270) | $(237,142) |
| For the period 7/3/12 | ||
| (commencement of operations) to 7/31/12 | ||
| Class R5 | Shares | Amount |
| Shares sold | 716 | $10,000 |
| Shares issued in connection with | ||
| reinvestment of distributions | — | — |
| 716 | 10,000 | |
| Shares repurchased | — | — |
| Net increase | 716 | $10,000 |
44
| For the period 7/3/12 | ||
| (commencement of operations) to 7/31/12 | ||
| Class R6 | Shares | Amount |
| Shares sold | 716 | $10,000 |
| Shares issued in connection with | ||
| reinvestment of distributions | — | — |
| 716 | 10,000 | |
| Shares repurchased | — | — |
| Net increase | 716 | $10,000 |
| Year ended 7/31/12 | Year ended 7/31/11 | |||
| Class Y | Shares | Amount | Shares | Amount |
| Shares sold | 715,657 | $9,502,421 | 869,141 | $11,465,477 |
| Shares issued in connection with | ||||
| reinvestment of distributions | 36,672 | 470,874 | 26,586 | 332,855 |
| 752,329 | 9,973,295 | 895,727 | 11,798,332 | |
| Shares repurchased | (595,953) | (7,787,746) | (850,510) | (10,881,068) |
| Net increase | 156,376 | $2,185,549 | 45,217 | $917,264 |
At the close of the reporting period, Putnam Investments, LLC owned the following class shares of the fund:
| Shares owned | Percentage of ownership | Value | |
| Class R5 | 716 | 100% | $10,093 |
| Class R6 | 716 | 100 | 10,093 |
Note 5: Investment in Putnam Money Market Liquidity Fund
The fund invested in Putnam Money Market Liquidity Fund, an open-end management investment company managed by Putnam Management. Investments in Putnam Money Market Liquidity Fund are valued at its closing net asset value each business day. Income distributions earned by the fund are recorded as interest income in the Statement of operations and totaled $5,227 for the reporting period. During the reporting period, cost of purchases and proceeds of sales of investments in Putnam Money Market Liquidity Fund aggregated $185,578,320 and $176,578,823, respectively. Management fees charged to Putnam Money Market Liquidity Fund have been waived by Putnam Management.
Note 6: Market, credit and other risks
In the normal course of business, the fund trades financial instruments and enters into financial transactions where risk of potential loss exists due to changes in the market (market risk) or failure of the contracting party to the transaction to perform (credit risk). The fund may be exposed to additional credit risk that an institution or other entity with which the fund has unsettled or open transactions will default. Investments in foreign securities involve certain risks, including those related to economic instability, unfavorable political developments, and currency fluctuations.
Note 7: Regulatory matters and litigation
In late 2003 and 2004, Putnam Management settled charges brought by the SEC and the Massachusetts Securities Division in connection with excessive short-term trading in Putnam funds. In July 2011, the fund recorded a receivable of $445,788 related to restitution amounts in connection with a distribution plan approved by the SEC. This amount, which was received by the fund in December 2011, is reported as part of Increase in capital from settlement payments on the Statement of changes in net assets. These allegations and related matters have served as the general basis for certain lawsuits, including purported class action lawsuits against Putnam Management and, in a limited number of cases, some Putnam funds. In May 2011, the fund received a payment of $8,976 related to settlement of those lawsuits. This amount is reported as a part of Increase in capital from settlement payments on
45
the Statement of changes in net assets. Putnam Management has agreed to bear any costs incurred by the Putnam funds as a result of these matters.
Note 8: New accounting pronouncements
In May 2011, the Financial Accounting Standards Board (FASB) issued Accounting Standards Update (ASU) 2011–04 “Fair Value Measurements and Disclosures (Topic 820) — Amendments to Achieve Common Fair Value Measurement and Disclosure Requirements in U.S. GAAP and IFRS”. ASU 2011–04 amends FASB Topic 820 “Fair Value Measurement” and seeks to develop common requirements for measuring fair value and for disclosing information about fair value measurements in accordance with GAAP. ASU 2011–04 is effective for fiscal years and interim periods beginning after December 15, 2011. The application of ASU 2011–04 did not have a material impact on the fund’s financial statements.
In December 2011, the FASB issued ASU No. 2011–11 “Disclosures about Offsetting Assets and Liabilities”. The update creates new disclosure requirements requiring entities to disclose both gross and net information for derivatives and other financial instruments that are either offset in the Statement of assets and liabilities or subject to an enforceable master netting arrangement or similar agreement. The disclosure requirements are effective for annual reporting periods beginning on or after January 1, 2013 and interim periods within those annual periods. Putnam Management is currently evaluating the application of ASU 2011–11 and its impact, if any, on the fund’s financial statements.
46
Federal tax information (Unaudited)
The fund designated 100% of ordinary income distributions as qualifying for the dividends received deduction for corporations.
For the reporting period ended, the fund hereby designates 100%, or the maximum amount allowable, of its taxable ordinary income distributions as qualified dividends taxed at the individual net capital gain rates.
For the reporting period ended, pursuant to §871(k) of the Internal Revenue Code, the fund hereby designates $12,634 of distributions paid as qualifying to be taxed as interest-related dividends, and no monies to be taxed as short-term capital gain dividends for nonresident alien shareholders.
The Form 1099 that will be mailed to you in January 2013 will show the tax status of all distributions paid to your account in calendar 2012.
47
About the Trustees
Independent Trustees
48
* Mr. Reynolds is an “interested person” (as defined in the Investment Company Act of 1940) of the fund, Putnam Management, and Putnam Retail Management. He is President and Chief Executive Officer of Putnam Investments, as well as the President of your fund and each of the other Putnam funds.
The address of each Trustee is One Post Office Square, Boston, MA 02109.
As of July 31, 2012, there were 109 Putnam funds. All Trustees serve as Trustees of all Putnam funds.
Each Trustee serves for an indefinite term, until his or her resignation, retirement at age 75, removal, or death.
49
Officers
In addition to Robert L. Reynolds, the other officers of the fund are shown below:
| Jonathan S. Horwitz (Born 1955) | Janet C. Smith (Born 1965) |
| Executive Vice President, Principal Executive | Vice President, Principal Accounting Officer, |
| Officer, and Compliance Liaison | and Assistant Treasurer |
| Since 2004 | Since 2007 |
| Director of Fund Administration Services, | |
| Steven D. Krichmar (Born 1958) | Putnam Investments and Putnam Management |
| Vice President and Principal Financial Officer | |
| Since 2002 | Susan G. Malloy (Born 1957) |
| Chief of Operations, Putnam Investments and | Vice President and Assistant Treasurer |
| Putnam Management | Since 2007 |
| Director of Accounting & Control Services, | |
| Robert T. Burns (Born 1961) | Putnam Management |
| Vice President and Chief Legal Officer | |
| Since 2011 | James P. Pappas (Born 1953) |
| General Counsel, Putnam Investments and | Vice President |
| Putnam Management | Since 2004 |
| Director of Trustee Relations, | |
| Robert R. Leveille (Born 1969) | Putnam Investments and Putnam Management |
| Vice President and Chief Compliance Officer | |
| Since 2007 | Mark C. Trenchard (Born 1962) |
| Chief Compliance Officer, Putnam Investments, | Vice President and BSA Compliance Officer |
| Putnam Management, and Putnam Retail | Since 2002 |
| Management | Director of Operational Compliance, |
| Putnam Investments and Putnam | |
| Michael J. Higgins (Born 1976) | Retail Management |
| Vice President and Treasurer | |
| Since 2010 | Judith Cohen (Born 1945) |
| Manager of Finance, Dunkin’ Brands (2008– | Vice President, Clerk, and Associate Treasurer |
| 2010); Senior Financial Analyst, Old Mutual Asset | Since 1993 |
| Management (2007–2008); Senior Financial | |
| Analyst, Putnam Investments (1999–2007) | Nancy E. Florek (Born 1957) |
| Vice President, Proxy Manager, Assistant Clerk, | |
| and Associate Treasurer | |
| Since 2000 |
The principal occupations of the officers for the past five years have been with the employers as shown above although in some cases, they have held different positions with such employers. The address of each Officer is One Post Office Square, Boston, MA 02109.
50
The Putnam family of funds
The following is a list of Putnam’s open-end mutual funds offered to the public. Investors should carefully consider the investment objective, risks, charges, and expenses of a fund before investing. For a prospectus, or a summary prospectus if available, containing this and other information for any Putnam fund or product, call your financial advisor at 1-800-225-1581 and ask for a prospectus. Please read the prospectus carefully before investing.
| Growth | Income |
| Growth Opportunities Fund | American Government Income Fund |
| International Growth Fund | Diversified Income Trust |
| Multi-Cap Growth Fund | Floating Rate Income Fund |
| Small Cap Growth Fund | Global Income Trust |
| Voyager Fund | High Yield Advantage Fund |
| High Yield Trust | |
| Blend | Income Fund |
| Asia Pacific Equity Fund | Money Market Fund* |
| Capital Opportunities Fund | Short Duration Income Fund |
| Capital Spectrum Fund | U.S. Government Income Trust |
| Emerging Markets Equity Fund | |
| Equity Spectrum Fund | Tax-free income |
| Europe Equity Fund | AMT-Free Municipal Fund |
| Global Equity Fund | Tax Exempt Income Fund |
| International Capital Opportunities Fund | Tax Exempt Money Market Fund* |
| International Equity Fund | Tax-Free High Yield Fund |
| Investors Fund | |
| Multi-Cap Core Fund | State tax-free income funds: |
| Research Fund | Arizona, California, Massachusetts, Michigan, |
| Minnesota, New Jersey, New York, Ohio, | |
| Value | and Pennsylvania. |
| Convertible Securities Fund | |
| Equity Income Fund | Absolute Return |
| George Putnam Balanced Fund | Absolute Return 100 Fund |
| The Putnam Fund for Growth and Income | Absolute Return 300 Fund |
| International Value Fund | Absolute Return 500 Fund |
| Multi-Cap Value Fund | Absolute Return 700 Fund |
| Small Cap Value Fund | |
* An investment in a money market fund is not insured or guaranteed by the Federal Deposit Insurance Corporation or any other government agency. Although the fund seeks to preserve the value of your investment at $1.00 per share, it is possible to lose money by investing in the fund.
51
| Global Sector | Putnam RetirementReady Funds — portfolios |
| Global Consumer Fund | with automatically adjusting allocations to |
| Global Energy Fund | stocks, bonds, and money market instruments, |
| Global Financials Fund | becoming more conservative over time. |
| Global Health Care Fund | |
| Global Industrials Fund | RetirementReady 2055 Fund |
| Global Natural Resources Fund | RetirementReady 2050 Fund |
| Global Sector Fund | RetirementReady 2045 Fund |
| Global Technology Fund | RetirementReady 2040 Fund |
| Global Telecommunications Fund | RetirementReady 2035 Fund |
| Global Utilities Fund | RetirementReady 2030 Fund |
| RetirementReady 2025 Fund | |
| Asset Allocation | RetirementReady 2020 Fund |
| Putnam Global Asset Allocation Funds — | RetirementReady 2015 Fund |
| portfolios with allocations to stocks, bonds, | |
| and money market instruments that are | Putnam Retirement Income Lifestyle |
| adjusted dynamically within specified ranges | Funds — portfolios with managed |
| as market conditions change. | allocations to stocks, bonds, and money |
| market investments to generate | |
| Dynamic Asset Allocation Balanced Fund | retirement income. |
| Prior to November 30, 2011, this fund was known as | |
| Putnam Asset Allocation: Balanced Portfolio. | Retirement Income Fund Lifestyle 1 |
| Dynamic Asset Allocation | Retirement Income Fund Lifestyle 2 |
| Conservative Fund | Retirement Income Fund Lifestyle 3 |
| Prior to November 30, 2011, this fund was known as | |
| Putnam Asset Allocation: Conservative Portfolio. | |
| Dynamic Asset Allocation Growth Fund | |
| Prior to November 30, 2011, this fund was known as | |
| Putnam Asset Allocation: Growth Portfolio. | |
| Dynamic Risk Allocation Fund |
A short-term trading fee of 1% may apply to redemptions or exchanges from certain funds within the time period specified in the fund's prospectus.
Check your account balances and the most recent month-end performance in the Individual Investors section at putnam.com.
52
Fund information
Founded 75 years ago, Putnam Investments was built around the concept that a balance between risk and reward is the hallmark of a well-rounded financial program. We manage over 100 funds across income, value, blend, growth, asset allocation, absolute return, and global sector categories.
| Investment Manager | Trustees | Robert R. Leveille |
| Putnam Investment | Jameson A. Baxter, Chair | Vice President and |
| Management, LLC | Liaquat Ahamed | Chief Compliance Officer |
| One Post Office Square | Ravi Akhoury | |
| Boston, MA 02109 | Barbara M. Baumann | Michael J. Higgins |
| Charles B. Curtis | Vice President and Treasurer | |
| Investment Sub-Manager | Robert J. Darretta | |
| Putnam Investments Limited | Katinka Domotorffy | Janet C. Smith |
| 57–59 St James’s Street | John A. Hill | Vice President, |
| London, England SW1A 1LD | Paul L. Joskow | Principal Accounting Officer, |
| Elizabeth T. Kennan | and Assistant Treasurer | |
| Marketing Services | Kenneth R. Leibler | |
| Putnam Retail Management | Robert E. Patterson | Susan G. Malloy |
| One Post Office Square | George Putnam, III | Vice President and |
| Boston, MA 02109 | Robert L. Reynolds | Assistant Treasurer |
| W. Thomas Stephens | ||
| Custodian | James P. Pappas | |
| State Street Bank | Officers | Vice President |
| and Trust Company | Robert L. Reynolds | |
| President | Mark C. Trenchard | |
| Legal Counsel | Vice President and | |
| Ropes & Gray LLP | Jonathan S. Horwitz | BSA Compliance Officer |
| Executive Vice President, | ||
| Independent Registered | Principal Executive Officer, and | Judith Cohen |
| Public Accounting Firm | Compliance Liaison | Vice President, Clerk, and |
| KPMG LLP | Associate Treasurer | |
| Steven D. Krichmar | ||
| Vice President and | Nancy E. Florek | |
| Principal Financial Officer | Vice President, Proxy | |
| Manager, Assistant Clerk, and | ||
| Robert T. Burns | Associate Treasurer | |
| Vice President and | ||
| Chief Legal Officer | ||
This report is for the information of shareholders of Putnam Investors Fund. It may also be used as sales literature when preceded or accompanied by the current prospectus, the most recent copy of Putnam’s Quarterly Performance Summary, and Putnam’s Quarterly Ranking Summary. For more recent performance, please visit putnam.com. Investors should carefully consider the investment objectives, risks, charges, and expenses of a fund, which are described in its prospectus. For this and other information or to request a prospectus or summary prospectus, call 1-800-225-1581 toll free. Please read the prospectus carefully before investing. The fund’s Statement of Additional Information contains additional information about the fund’s Trustees and is available without charge upon request by calling 1-800-225-1581.
| Item 2. Code of Ethics: |
| (a) The fund’s principal executive, financial and accounting officers are employees of Putnam Investment Management, LLC, the Fund’s investment manager. As such they are subject to a comprehensive Code of Ethics adopted and administered by Putnam Investments which is designed to protect the interests of the firm and its clients. The Fund has adopted a Code of Ethics which incorporates the Code of Ethics of Putnam Investments with respect to all of its officers and Trustees who are employees of Putnam Investment Management, LLC. For this reason, the Fund has not adopted a separate code of ethics governing its principal executive, financial and accounting officers. |
| (c) In May 2008, the Code of Ethics of Putnam Investment Management, LLC was updated in its entirety to include the amendments adopted in August 2007 as well as a several additional technical, administrative and non-substantive changes. In May of 2009, the Code of Ethics of Putnam Investment Management, LLC was amended to reflect that all employees will now be subject to a 90-day blackout restriction on holding Putnam open-end funds, except for portfolio managers and their supervisors (and each of their immediate family members), who will be subject to a one-year blackout restriction on the funds that they manage or supervise. In June 2010, the Code of Ethics of Putnam Investments was updated in its entirety to include the amendments adopted in May of 2009 and to change certain rules and limits contained in the Code of Ethics. In addition, the updated Code of Ethics included numerous technical, administrative and non-substantive changes, which were intended primarily to make the document easier to navigate and understand. In July 2011, the Code of Ethics of Putnam Investments was updated to reflect several technical, administrative and non-substantive changes resulting from changes in employee titles. |
| Item 3. Audit Committee Financial Expert: |
| The Funds’ Audit and Compliance Committee is comprised solely of Trustees who are “independent” (as such term has been defined by the Securities and Exchange Commission (“SEC”) in regulations implementing Section 407 of the Sarbanes-Oxley Act (the “Regulations”)). The Trustees believe that each of the members of the Audit and Compliance Committee also possess a combination of knowledge and experience with respect to financial accounting matters, as well as other attributes, that qualify them for service on the Committee. In addition, the Trustees have determined that each of Mr. Leibler, Mr. Hill, Mr. Darretta and Ms. Baumann qualifies as an “audit committee financial expert” (as such term has been defined by the Regulations) based on their review of his or her pertinent experience and education. The SEC has stated that the designation or identification of a person as an audit committee financial expert pursuant to this Item 3 of Form N-CSR does not impose on such person any duties, obligations or liability that are greater than the duties, obligations and liability imposed on such person as a member of the Audit and Compliance Committee and the Board of Trustees in the absence of such designation or identification. |
| Item 4. Principal Accountant Fees and Services: |
| The following table presents fees billed in each of the last two fiscal years for services rendered to the fund by the fund’s independent auditor: |
| Fiscal year ended | Audit Fees | Audit-Related Fees | Tax Fees | All Other Fees | |
| July 31, 2012 | $41,716 | $-- | $4,100 | $ — | |
| July 31, 2011 | $45,000 | $-- | $4,000 | $ — | |
| For the fiscal years ended July 31, 2012 and July 31, 2011, the fund’s independent auditor billed aggregate non-audit fees in the amounts of $4,100 and $4,000 respectively, to the fund, Putnam Management and any entity controlling, controlled by or under common control with Putnam Management that provides ongoing services to the fund. |
| Audit Fees represent fees billed for the fund’s last two fiscal years relating to the audit and review of the financial statements included in annual reports and registration statements, and other services that are normally provided in connection with statutory and regulatory filings or engagements. |
| Audit-Related Fees represent fees billed in the fund’s last two fiscal years for services traditionally performed by the fund’s auditor, including accounting consultation for proposed transactions or concerning financial accounting and reporting standards and other audit or attest services not required by statute or regulation. |
| Tax Fees represent fees billed in the fund’s last two fiscal years for tax compliance, tax planning and tax advice services. Tax planning and tax advice services include assistance with tax audits, employee benefit plans and requests for rulings or technical advice from taxing authorities. |
| Pre-Approval Policies of the Audit and Compliance Committee. The Audit and Compliance Committee of the Putnam funds has determined that, as a matter of policy, all work performed for the funds by the funds’ independent auditors will be pre-approved by the Committee itself and thus will generally not be subject to pre-approval procedures. |
| The Audit and Compliance Committee also has adopted a policy to pre-approve the engagement by Putnam Management and certain of its affiliates of the funds’ independent auditors, even in circumstances where pre-approval is not required by applicable law. Any such requests by Putnam Management or certain of its affiliates are typically submitted in writing to the Committee and explain, among other things, the nature of the proposed engagement, the estimated fees, and why this work should be performed by that particular audit firm as opposed to another one. In reviewing such requests, the Committee considers, among other things, whether the provision of such services by the audit firm are compatible with the independence of the audit firm. |
| The following table presents fees billed by the fund’s independent auditor for services required to be approved pursuant to paragraph (c)(7)(ii) of Rule 2-01 of Regulation S-X. |
| Fiscal year ended | Audit-Related Fees | Tax Fees | All Other Fees | Total Non-Audit Fees | |
| July 31, 2012 | $ — | $ — | $ — | $ — | |
| July 31, 2011 | $ — | $ — | $ — | $ — | |
| Item 5. Audit Committee of Listed Registrants |
| Not applicable |
| Item 6. Schedule of Investments: |
| The registrant’s schedule of investments in unaffiliated issuers is included in the report to shareholders in Item 1 above. |
| Item 7. Disclosure of Proxy Voting Policies and Procedures For Closed-End Management Investment Companies: |
| Not applicable |
| Item 8. Portfolio Managers of Closed-End Investment Companies |
| Not Applicable |
| Item 9. Purchases of Equity Securities by Closed-End Management Investment Companies and Affiliated Purchasers: |
| Not applicable |
| Item 10. Submission of Matters to a Vote of Security Holders: |
| Not applicable |
| Item 11. Controls and Procedures: |
| (a) The registrant’s principal executive officer and principal financial officer have concluded, based on their evaluation of the effectiveness of the design and operation of the registrant’s disclosure controls and procedures as of a date within 90 days of the filing date of this report, that the design and operation of such procedures are generally effective to provide reasonable assurance that information required to be disclosed by the registrant in this report is recorded, processed, summarized and reported within the time periods specified in the Commission’s rules and forms. |
| (b) Changes in internal control over financial reporting: Not applicable |
| Item 12. Exhibits: |
| (a)(1) The Code of Ethics of The Putnam Funds, which incorporates the Code of Ethics of Putnam Investments, is filed herewith. |
| (a)(2) Separate certifications for the principal executive officer and principal financial officer of the registrant as required by Rule 30a-2(a) under the Investment Company Act of 1940, as amended, are filed herewith. |
| (b) The certifications required by Rule 30a-2(b) under the Investment Company Act of 1940, as amended, are filed herewith. |
| SIGNATURES |
| Pursuant to the requirements of the Securities Exchange Act of 1934 and the Investment Company Act of 1940, the registrant has duly caused this report to be signed on its behalf by the undersigned, thereunto duly authorized. |
| Putnam Investors Fund |
| By (Signature and Title): |
| /s/Janet C. Smith Janet C. Smith Principal Accounting Officer |
| Date: September 28, 2012 |
| Pursuant to the requirements of the Securities Exchange Act of 1934 and the Investment Company Act of 1940, this report has been signed below by the following persons on behalf of the registrant and in the capacities and on the dates indicated. |
| By (Signature and Title): |
| /s/Jonathan S. Horwitz Jonathan S. Horwitz Principal Executive Officer |
| Date: September 28, 2012 |
| By (Signature and Title): |
| /s/Steven D. Krichmar Steven D. Krichmar Principal Financial Officer |
| Date: September 28, 2012 |