| UNITED STATES SECURITIES AND EXCHANGE COMMISSION | ||
| Washington, D.C. 20549 | ||
FORM N-CSR | ||
| CERTIFIED SHAREHOLDER REPORT OF REGISTERED MANAGEMENT INVESTMENT COMPANIES | ||
| Investment Company Act file number: | (811- 00159) |
| Exact name of registrant as specified in charter: | Putnam Investors Fund |
| Address of principal executive offices: | One Post Office Square, Boston, Massachusetts 02109 |
| Name and address of agent for service: | Robert T. Burns, Vice President One Post Office Square Boston, Massachusetts 02109 |
| Copy to: | Bryan Chegwidden, Esq. Ropes & Gray LLP 1211 Avenue of the Americas New York, New York 10036 |
| Registrant’s telephone number, including area code: | (617) 292-1000 |
| Date of fiscal year end: | July 31, 2015 |
| Date of reporting period : | August 1, 2014 — July 31, 2015 |
Item 1. Report to Stockholders: |
| The following is a copy of the report transmitted to stockholders pursuant to Rule 30e-1 under the Investment Company Act of 1940: | |||
Putnam
Investors
Fund
Annual report
7 | 31 | 15
| Message from the Trustees | 1 | ||
| About the fund | 2 | ||
| Performance snapshot | 4 | ||
| Interview with your fund’s portfolio manager | 5 | ||
| Your fund’s performance | 10 | ||
| Your fund’s expenses | 13 | ||
| Terms and definitions | 15 | ||
| Other information for shareholders | 16 | ||
| Important notice regarding Putnam’s privacy policy | 17 | ||
| Trustee approval of management contract | 18 | ||
| Financial statements | 23 | ||
| Federal tax information | 49 | ||
| About the Trustees | 50 | ||
| Officers | 52 | ||
Consider these risks before investing: Growth stocks may be more susceptible to earnings disappointments, and value stocks may fail to rebound. Stock prices may fall or fail to rise over time for several reasons, including general financial market conditions and factors related to a specific issuer or industry. You can lose money by investing in the fund.
Message from the Trustees
Dear Fellow Shareholder:
A number of questions have emerged during the past year regarding the pace of growth in the global economy, resolution of Greece’s debt crisis, and changes in central bank policy, as the U.S. Federal Reserve has communicated its intentions to begin lifting interest rates. Although prompted by U.S. economic strength, tighter U.S. monetary policy can cause market volatility and constrain growth in other regions.
The Fed’s intentions contrast with the actions of central banks in Europe, Japan, and China, which are committed, for the foreseeable future, to low-interest-rate policies seeking to foster growth. Shortly after the end of your fund’s fiscal period, the People’s Bank of China even took the unexpected step of devaluing its currency in an attempt to reinvigorate the world’s second-largest economy.
China’s action triggered widespread selling in global stock markets, highlighting the lack of consensus among investors about economic strength in many regions and the possible effects of tighter U.S. monetary policy.
In the following pages, you will find a discussion of current economic and market conditions in addition to an update on your fund’s performance. Putnam’s experienced portfolio managers have research-driven viewpoints that guide their investment decisions in changing markets.
You can also consult with your financial advisor regarding the current market environment, and whether your mix of investments requires any adjustment to stay on track toward your long-term goals.
In closing, we would like to recognize Charles Curtis, who recently retired as a Putnam Trustee, for his 14 years of dedicated service. And, as always, we thank you for investing with Putnam.


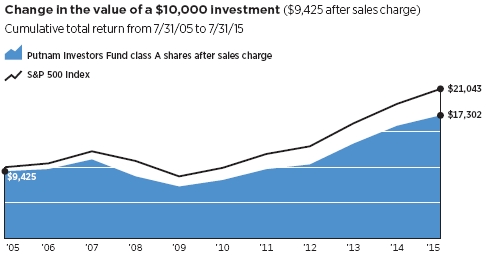
Current performance may be lower or higher than the quoted past performance, which cannot guarantee future results. Share price, principal value, and return will fluctuate, and you may have a gain or a loss when you sell your shares. Performance of class A shares assumes reinvestment of distributions and does not account for taxes. Fund returns in the bar chart do not reflect a sales charge of 5.75%; had they, returns would have been lower. See pages 3, 5, and 10–12 for additional performance information. For a portion of the periods, the fund had expense limitations, without which returns would have been lower. To obtain the most recent month-end performance, visit putnam.com.
* The fund’s benchmark and Lipper category, the S&P 500 Index and Lipper Large-Cap Core Funds category, were introduced on 3/4/57 and 12/31/59, respectively, which post-date the inception of the fund’s class A shares.
| 4 | Investors Fund |
Interview with your fund’s portfolio manager

Gerard P. Sullivan
Jerry, how were conditions for stock market investors during the 12-month reporting period ended July 31, 2015?
U.S. stocks delivered solid performance, volatility was low, and large market swings were rare through most of the period. Investors encountered a bumpy ride in October 2014, when stocks declined nearly 10% in response to global geopolitical tensions, slowing growth in Europe and China, and falling oil prices. Although it felt painful at the time, I believe that pullback was relatively mild, and the market’s subsequent snapback from its mid-October lows was about as sharp as I have ever seen. Stocks recovered dramatically, dipped again in early December, then surged to new record highs as 2014 came to a close.
The remainder of the period was also positive for stocks, although gains were much smaller. Investors remained concerned about oil prices, the impact of a strong U.S. dollar on corporate profits, and the debt crisis in Greece. Despite these worries, in March the bull market for U.S. stocks marked its sixth anniversary. The market overall was not very powerful in the first half of 2015 and, through the end of the period, there was very little drama. That is, growth was tepid, volatility was relatively low, and we did not see any of the meaningful market disruptions that can create compelling investment opportunities. In this environment, I focused on fundamental research; adding, selling, and trimming fund holdings when appropriate; and looking

This comparison shows your fund’s performance in the context of broad market indexes for the 12 months ended 7/31/15. See pages 3–4 and 10–12 for additional fund performance information. Index descriptions can be found on page 15.
| Investors Fund | 5 |
for areas where I believed stocks were still attractively valued.
How did the fund perform for the period?
The fund delivered a positive total return for the period, but underperformed its benchmark, the S&P 500 Index, and the average return for funds within its Lipper peer group, Large-Cap Core Funds.
Within the fund’s portfolio, what were some stocks that had a negative effect on performance for the period?
A major theme for the financial markets during this time was plunging energy prices. The price of oil dropped more than 50% in 2014, hitting a five-year low. The decline was largely in response to greater oil supplies combined with reduced energy demand. In the first half of 2015, oil prices remained volatile, recovering in the spring, then dropping sharply again. Just after the close of the period, the price of oil was down 60% from its 2014 peak. Although lower oil prices put more money into U.S. consumers’ pockets, they had a negative effect on most stocks in the energy sector and caused volatility across global financial markets. The surplus of oil and massive price weakness hurt the stocks of many energy companies, particularly those that specialize in exploration and production.
This trend is reflected in the fund’s results for the period. Among the top detractors from performance were stocks of businesses that are directly influenced by the price of oil, including QEP Resources, an oil and gas exploration and production company; Memorial Resource Development, an independent natural gas and oil firm; and Nabors Industries, an owner and operator of drilling rigs. At the close of the period, QEP Resources was no longer in the portfolio. Outside of energy, fund performance was dampened by the stock of Micron Technology,
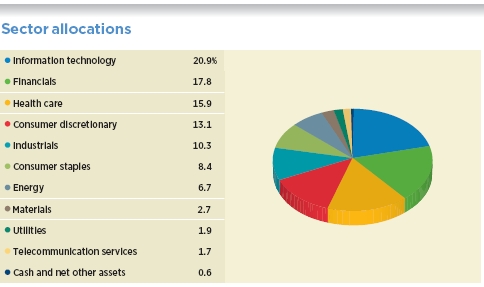
Allocations are shown as a percentage of the fund’s net assets as of 7/31/15. Cash and net other assets, if any, represent the market value weights of cash, derivatives, short-term securities, and other unclassified assets in the portfolio. Summary information may differ from the portfolio schedule included in the financial statements due to the inclusion of derivative securities, any interest accruals, the exclusion of as-of trades, if any, and the use of different classifications of securities for presentation purposes. Holdings and allocations may vary over time.
| 6 | Investors Fund |
a maker of semiconductor devices that are used in computers and mobile devices. Micron has struggled competitively and its earnings weakened considerably in recent months. Many of Micron’s products are used in personal computers, a market in which demand has declined dramatically.

Could you discuss some strategies or holdings that helped fund performance for the period?
The struggles of the energy sector are also evident among top contributors for the period. That is, the biggest positive impact for the period came from our decisions to maintain underweight positions versus the benchmark in oil companies Chevron and ConocoPhillips. By the close of the period, the fund’s position in ConocoPhillips had been sold.
Also among the performance highlights relative to the benchmark was the stock of CVS Health. The company had success with its two primary business segments: CVS, its nationwide network of retail stores and pharmacies, and Caremark, its pharmacy benefit manager, or PBM. PBMs administer drug benefit programs for employers and health insurance carriers. Another top performer was the stock of Kroger, an operator of retail food and drug stores throughout the United States. Finally, also worth noting is Alibaba Group Holding, a China-based e-commerce company whose $25 billion initial public offering [IPO] was the largest in history. We had been researching and following Alibaba for a while, and our analysts’ extensive knowledge of the company in advance of

This table shows the fund’s top 10 holdings by percentage of the fund’s net assets as of 7/31/15. Short-term holdings and derivatives, if any, are excluded. Holdings may vary over time.
| Investors Fund | 7 |
the IPO proved beneficial, as the stock was among the top contributors to returns for the fiscal year.
After more than six years of market gains, what is your outlook and approach for investing in stocks today?
At the close of the period, I believe the main question for stock market investors was, where are the excesses? I would say that stocks had become expensive — and in some cases valuations were stretched — in about 8 of the 10 sectors that I research. The two undervalued sectors, energy and financials, are not expensive at all, in my view. I find the energy sector very interesting, although we must proceed with caution because there is still potential for considerable volatility. I have been focusing on exploration and production companies with solid oil and gas assets, decent balance sheets, and cost structures that can help them weather the current challenges. We have already seen production begin to slow, which could lead to better pricing and improvement for these stocks, but investing in this sector requires diligent research and patience, as I believe any meaningful rebounds could be one or two years away.
What is your outlook for U.S. stock market investors today?
At the close of the period, I did not believe that stock valuations were too stretched in every sector, despite the multiyear rally in the market. After the period end, in late August, there was a market correction, which, in my view, prevented the emergence of widespread overvaluations. In addition, the market decline may create attractive value opportunities in the months ahead for research-focused investors.
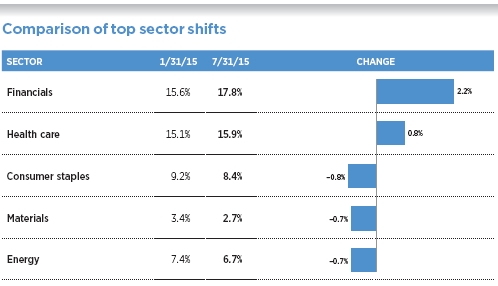
This chart shows the fund’s largest allocation shifts, by percentage, over the past six months. Allocations are shown as a percentage of the fund’s net assets. Current period summary information may differ from the portfolio schedule included in the financial statements due to the inclusion of derivative securities, any interest accruals, the exclusion of as-of trades, if any, and the use of different classifications of securities for presentation purposes. Holdings and allocations may vary over time.
| 8 | Investors Fund |
Thanks for your time and for bringing us up to date, Jerry.
The views expressed in this report are exclusively those of Putnam Management and are subject to change. They are not meant as investment advice.
Please note that the holdings discussed in this report may not have been held by the fund for the entire period. Portfolio composition is subject to review in accordance with the fund’s investment strategy and may vary in the future. Current and future portfolio holdings are subject to risk.
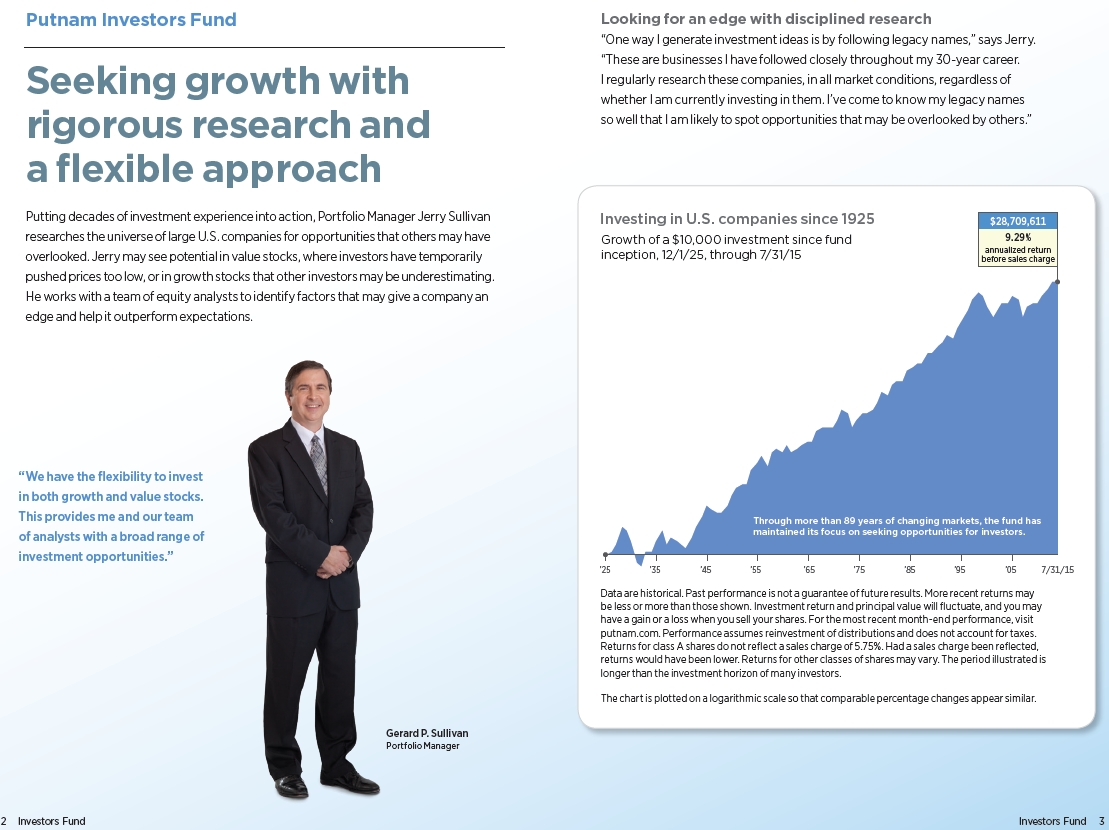
Portfolio Manager Gerard P. Sullivan has an M.B.A. from the Columbia University Graduate School of Business and a B.A. from Columbia University. Jerry joined Putnam in 2008 and has been in the investment industry since 1982.
IN THE NEWS
The People’s Bank of China devalued the Chinese yuan against the U.S. dollar on August 11, 2015, sending global markets down. For the next two days the currency declined further, totaling its biggest drop in decades — 4.4%. The unexpected move to reset the reference value of the currency followed recent reports that China’s exports fell in July and producer prices continued their nearly four-year deflationary trend. Analysts concluded that these measures were driven by an attempt to boost exports and stimulate the economy. China’s growth rate in early 2015 declined from levels of previous quarters. Central bank leadership said the currency was not in a free fall, but that the bank was allowing the market to have more influence over the currency’s direction. Policymakers said the exchange rate would be based more on the currency’s trading performance than by government mandate. At the same time, some observers contend that the move sends a signal that global growth is weak to the U.S. Federal Reserve, as it considers when to raise interest rates.
| Investors Fund | 9 |
Your fund’s performance
This section shows your fund’s performance, price, and distribution information for periods ended July 31, 2015, the end of its most recent fiscal year. In accordance with regulatory requirements for mutual funds, we also include performance information as of the most recent calendar quarter-end and expense information taken from the fund’s current prospectus. Performance should always be considered in light of a fund’s investment strategy. Data represent past performance. Past performance does not guarantee future results. More recent returns may be less or more than those shown. Investment return and principal value will fluctuate, and you may have a gain or a loss when you sell your shares. Performance information does not reflect any deduction for taxes a shareholder may owe on fund distributions or on the redemption of fund shares. For the most recent month-end performance, please visit the Individual Investors section at putnam.com or call Putnam at 1-800-225-1581. Class R, R5, R6, and Y shares are not available to all investors. See the Terms and Definitions section in this report for definitions of the share classes offered by your fund.
Fund performance Total return for periods ended 7/31/15
| Class A | Class B | Class C | Class M | Class R | Class R5 | Class R6 | Class Y | |||||
| (inception dates) | (12/1/25) | (3/1/93) | (7/26/99) | (12/2/94) | (1/21/03) | (7/2/12) | (7/2/12) | (1/7/97) | ||||
| Before | After | Before | After | Net | Net | Net | Net | |||||
| sales | sales | Before | After | Before | After | sales | sales | asset | asset | asset | asset | |
| charge | charge | CDSC | CDSC | CDSC | CDSC | charge | charge | value | value | value | value | |
| Annual average | ||||||||||||
| (life of fund) | 9.29% | 9.21% | 9.19% | 9.19% | 8.46% | 8.46% | 8.54% | 8.50% | 9.01% | 9.35% | 9.35% | 9.34% |
| 10 years | 83.57 | 73.02 | 72.71 | 72.71 | 70.24 | 70.24 | 74.55 | 68.45 | 78.96 | 88.79 | 89.23 | 88.16 |
| Annual average | 6.26 | 5.64 | 5.62 | 5.62 | 5.46 | 5.46 | 5.73 | 5.35 | 5.99 | 6.56 | 6.59 | 6.53 |
| 5 years | 111.29 | 99.14 | 103.55 | 101.55 | 103.61 | 103.61 | 106.14 | 98.92 | 108.73 | 114.64 | 115.14 | 113.92 |
| Annual average | 16.14 | 14.77 | 15.27 | 15.05 | 15.28 | 15.28 | 15.57 | 14.75 | 15.86 | 16.50 | 16.56 | 16.43 |
| 3 years | 66.66 | 57.08 | 62.89 | 59.89 | 62.91 | 62.91 | 64.17 | 58.42 | 65.45 | 68.49 | 68.88 | 67.93 |
| Annual average | 18.56 | 16.24 | 17.66 | 16.93 | 17.67 | 17.67 | 17.97 | 16.58 | 18.28 | 18.99 | 19.09 | 18.86 |
| 1 year | 9.32 | 3.03 | 8.46 | 3.46 | 8.51 | 7.51 | 8.73 | 4.93 | 9.03 | 9.69 | 9.74 | 9.57 |
Current performance may be lower or higher than the quoted past performance, which cannot guarantee future results. After-sales-charge returns for class A and M shares reflect the deduction of the maximum 5.75% and 3.50% sales charge, respectively, levied at the time of purchase. Class B share returns after contingent deferred sales charge (CDSC) reflect the applicable CDSC, which is 5% in the first year, declining over time to 1% in the sixth year, and is eliminated thereafter. Class C share returns after CDSC reflect a 1% CDSC for the first year that is eliminated thereafter. Class R, R5, R6, and Y shares have no initial sales charge or CDSC. Performance for class B, C, M, R, and Y shares before their inception is derived from the historical performance of class A shares, adjusted for the applicable sales charge (or CDSC) and the higher operating expenses for such shares, except for class Y shares, for which 12b-1 fees are not applicable. Performance for class R5 and R6 shares prior to their inception is derived from the historical performance of class Y shares and has not been adjusted for the lower investor servicing fees applicable to class R5 and R6 shares; had it, returns would have been higher.
Recent performance may have benefited from one or more legal settlements.
For a portion of the periods, the fund had expense limitations, without which returns would have been lower.
Class B share performance reflects conversion to class A shares after eight years.
| 10 | Investors Fund |
Comparative index returns For periods ended 7/31/15
| Lipper Large-Cap Core | ||
| S&P 500 Index | Funds category average* | |
| Annual average (life of fund) | —† | —† |
| 10 years | 110.43% | 99.30% |
| Annual average | 7.72 | 7.07 |
| 5 years | 112.26 | 100.03 |
| Annual average | 16.24 | 14.82 |
| 3 years | 62.55 | 59.12 |
| Annual average | 17.58 | 16.70 |
| 1 year | 11.21 | 9.54 |
Index and Lipper results should be compared with fund performance before sales charge, before CDSC, or at net asset value.
* Over the 1-year, 3-year, 5-year, and 10-year periods ended 7/31/15, there were 879, 797, 722, and 519 funds, respectively, in this Lipper category.
† The fund’s benchmark and Lipper category, the S&P 500 Index and Lipper Large-Cap Core Funds category, were introduced on 3/4/57 and 12/31/59, respectively, which post-date the inception of the fund’s class A shares.
Past performance does not indicate future results. At the end of the same time period, a $10,000 investment in the fund’s class B and class C shares would have been valued at $17,271 and $17,024, respectively, and no contingent deferred sales charges would apply. A $10,000 investment in the fund’s class M shares ($9,650 after sales charge) would have been valued at $16,845. A $10,000 investment in the fund’s class R, R5, R6, and Y shares would have been valued at $17,896, $18,879, $18,923, and $18,816, respectively.
| Investors Fund | 11 |
Fund price and distribution information For the 12-month period ended 7/31/15
| Distributions | Class A | Class B | Class C | Class M | Class R | Class R5 | Class R6 | Class Y | ||
| Number | 1 | 1 | 1 | 1 | 1 | 1 | 1 | 1 | ||
| Income | $0.198 | $0.052 | $0.077 | $0.103 | $0.158 | $0.262 | $0.282 | $0.261 | ||
| Capital gains | — | — | — | — | — | — | — | — | ||
| Total | $0.198 | $0.052 | $0.077 | $0.103 | $0.158 | $0.262 | $0.282 | $0.261 | ||
| Before | After | Net | Net | Before | After | Net | Net | Net | Net | |
| sales | sales | asset | asset | sales | sales | asset | asset | asset | asset | |
| Share value | charge | charge | value | value | charge | charge | value | value | value | value |
| 7/31/14 | $20.73 | $21.99 | $18.58 | $19.59 | $19.52 | $20.23 | $20.39 | $21.12 | $21.13 | $21.06 |
| 7/31/15 | 22.46 | 23.83 | 20.10 | 21.18 | 21.12 | 21.89 | 22.07 | 22.90 | 22.90 | 22.81 |
The classification of distributions, if any, is an estimate. Before-sales-charge share value and current dividend rate for class A and M shares, if applicable, do not take into account any sales charge levied at the time of purchase. After-sales-charge share value, current dividend rate, and current 30-day SEC yield, if applicable, are calculated assuming that the maximum sales charge (5.75% for class A shares and 3.50% for class M shares) was levied at the time of purchase. Final distribution information will appear on your year-end tax forms.
Fund performance as of most recent calendar quarter
Total return for periods ended 6/30/15
| Class A | Class B | Class C | Class M | Class R | Class R5 | Class R6 | Class Y | |||||
| (inception dates) | (12/1/25) | (3/1/93) | (7/26/99) | (12/2/94) | (1/21/03) | (7/2/12) | (7/2/12) | (1/7/97) | ||||
| Before | After | Before | After | Net | Net | Net | Net | |||||
| sales | sales | Before | After | Before | After | sales | sales | asset | asset | asset | asset | |
| charge | charge | CDSC | CDSC | CDSC | CDSC | charge | charge | value | value | value | value | |
| Annual average | ||||||||||||
| (life of fund) | 9.28% | 9.21% | 9.18% | 9.18% | 8.46% | 8.46% | 8.53% | 8.49% | 9.01% | 9.34% | 9.34% | 9.34% |
| 10 years | 88.05 | 77.24 | 76.98 | 76.98 | 74.32 | 74.32 | 78.81 | 72.55 | 83.40 | 93.42 | 93.87 | 92.76 |
| Annual average | 6.52 | 5.89 | 5.87 | 5.87 | 5.71 | 5.71 | 5.98 | 5.61 | 6.25 | 6.82 | 6.84 | 6.78 |
| 5 years | 123.81 | 110.94 | 115.76 | 113.76 | 115.60 | 115.60 | 118.32 | 110.68 | 121.15 | 127.49 | 128.02 | 126.72 |
| Annual average | 17.48 | 16.10 | 16.63 | 16.41 | 16.61 | 16.61 | 16.90 | 16.07 | 17.20 | 17.87 | 17.92 | 17.79 |
| 3 years | 66.70 | 57.11 | 63.07 | 60.07 | 63.05 | 63.05 | 64.18 | 58.44 | 65.44 | 68.47 | 68.86 | 67.89 |
| Annual average | 18.57 | 16.25 | 17.70 | 16.98 | 17.70 | 17.70 | 17.97 | 16.58 | 18.27 | 18.99 | 19.08 | 18.85 |
| 1 year | 6.67 | 0.53 | 5.91 | 0.91 | 5.93 | 4.93 | 6.19 | 2.47 | 6.44 | 7.08 | 7.13 | 6.96 |
See the discussion following the fund performance table on page 10 for information about the calculation of fund performance.
| 12 | Investors Fund |
Your fund’s expenses
As a mutual fund investor, you pay ongoing expenses, such as management fees, distribution fees (12b-1 fees), and other expenses. Using the following information, you can estimate how these expenses affect your investment and compare them with the expenses of other funds. You may also pay one-time transaction expenses, including sales charges (loads) and redemption fees, which are not shown in this section and would have resulted in higher total expenses. For more information, see your fund’s prospectus or talk to your financial representative.
Expense ratios
| Class A | Class B | Class C | Class M | Class R | Class R5 | Class R6 | Class Y | |
| Total annual operating expenses for | ||||||||
| the fiscal year ended 7/31/14 | 1.08% | 1.83% | 1.83% | 1.58% | 1.33% | 0.76% | 0.66% | 0.83% |
| Annualized expense ratio for the | ||||||||
| six-month period ended 7/31/15* | 1.03% | 1.78% | 1.78% | 1.53% | 1.28% | 0.74% | 0.64% | 0.78% |
Fiscal-year expense information in this table is taken from the most recent prospectus, is subject to change, and may differ from that shown for the annualized expense ratio and in the financial highlights of this report.
Expenses are shown as a percentage of average net assets.
* For the fund’s most recent fiscal half year; may differ from expense ratios based on one-year data in the financial highlights.
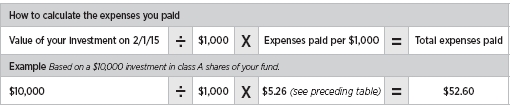
Expenses per $1,000
The following table shows the expenses you would have paid on a $1,000 investment in the fund from February 1, 2015, to July 31, 2015. It also shows how much a $1,000 investment would be worth at the close of the period, assuming actual returns and expenses.
| Class A | Class B | Class C | Class M | Class R | Class R5 | Class R6 | Class Y | |
| Expenses paid per $1,000*† | $5.26 | $9.07 | $9.08 | $7.81 | $6.53 | $3.78 | $3.27 | $3.99 |
| Ending value (after expenses) | $1,060.40 | $1,056.20 | $1,056.40 | $1,057.60 | $1,059.00 | $1,062.20 | $1,062.20 | $1,061.90 |
* Expenses for each share class are calculated using the fund’s annualized expense ratio for each class, which represents the ongoing expenses as a percentage of average net assets for the six months ended 7/31/15. The expense ratio may differ for each share class.
† Expenses are calculated by multiplying the expense ratio by the average account value for the period; then multiplying the result by the number of days in the period; and then dividing that result by the number of days in the year.
| Investors Fund | 13 |
Estimate the expenses you paid
To estimate the ongoing expenses you paid for the six months ended July 31, 2015, use the following calculation method. To find the value of your investment on February 1, 2015, call Putnam at 1-800-225-1581.
Compare expenses using the SEC’s method
The Securities and Exchange Commission (SEC) has established guidelines to help investors assess fund expenses. Per these guidelines, the following table shows your fund’s expenses based on a $1,000 investment, assuming a hypothetical 5% annualized return. You can use this information to compare the ongoing expenses (but not transaction expenses or total costs) of investing in the fund with those of other funds. All mutual fund shareholder reports will provide this information to help you make this comparison. Please note that you cannot use this information to estimate your actual ending account balance and expenses paid during the period.
| Class A | Class B | Class C | Class M | Class R | Class R5 | Class R6 | Class Y | |
| Expenses paid per $1,000*† | $5.16 | $8.90 | $8.90 | $7.65 | $6.41 | $3.71 | $3.21 | $3.91 |
| Ending value (after expenses) | $1,019.69 | $1,015.97 | $1,015.97 | $1,017.21 | $1,018.45 | $1,021.12 | $1,021.62 | $1,020.93 |
* Expenses for each share class are calculated using the fund’s annualized expense ratio for each class, which represents the ongoing expenses as a percentage of average net assets for the six months ended 7/31/15. The expense ratio may differ for each share class.
† Expenses are calculated by multiplying the expense ratio by the average account value for the six-month period; then multiplying the result by the number of days in the six-month period; and then dividing that result by the number of days in the year.
| 14 | Investors Fund |
Terms and definitions
Important terms
Total return shows how the value of the fund’s shares changed over time, assuming you held the shares through the entire period and reinvested all distributions in the fund.
Before sales charge, or net asset value, is the price, or value, of one share of a mutual fund, without a sales charge. Before-sales-charge figures fluctuate with market conditions, and are calculated by dividing the net assets of each class of shares by the number of outstanding shares in the class.
After sales charge is the price of a mutual fund share plus the maximum sales charge levied at the time of purchase. After-sales-charge performance figures shown here assume the 5.75% maximum sales charge for class A shares and 3.50% for class M shares.
Contingent deferred sales charge (CDSC) is generally a charge applied at the time of the redemption of class B or C shares and assumes redemption at the end of the period. Your fund’s class B CDSC declines over time from a 5% maximum during the first year to 1% during the sixth year. After the sixth year, the CDSC no longer applies. The CDSC for class C shares is 1% for one year after purchase.
Share classes
Class A shares are generally subject to an initial sales charge and no CDSC (except on certain redemptions of shares bought without an initial sales charge).
Class B shares are not subject to an initial sales charge and may be subject to a CDSC.
Class C shares are not subject to an initial sales charge and are subject to a CDSC only if the shares are redeemed during the first year.
Class M shares have a lower initial sales charge and a higher 12b-1 fee than class A shares and no CDSC (except on certain redemptions of shares bought without an initial sales charge).
Class R shares are not subject to an initial sales charge or CDSC and are available only to employer-sponsored retirement plans.
Class R5 and R6 shares are not subject to an initial sales charge or CDSC, and carry no 12b-1 fee. They are only available to employer-sponsored retirement plans.
Class Y shares are not subject to an initial sales charge or CDSC, and carry no 12b-1 fee. They are generally only available to corporate and institutional clients and clients in other approved programs.
Comparative indexes
Barclays U.S. Aggregate Bond Index is an unmanaged index of U.S. investment-grade fixed-income securities.
BofA Merrill Lynch U.S. 3-Month Treasury Bill Index is an unmanaged index that seeks to measure the performance of U.S. Treasury bills available in the marketplace.
S&P 500 Index is an unmanaged index of common stock performance.
Indexes assume reinvestment of all distributions and do not account for fees. Securities and performance of a fund and an index will differ. You cannot invest directly in an index.
Lipper is a third-party industry-ranking entity that ranks mutual funds. Its rankings do not reflect sales charges. Lipper rankings are based on total return at net asset value relative to other funds that have similar current investment styles or objectives as determined by Lipper. Lipper may change a fund’s category assignment at its discretion. Lipper category averages reflect performance trends for funds within a category.
| Investors Fund | 15 |
Other information for shareholders
Proxy voting
Putnam is committed to managing our mutual funds in the best interests of our shareholders. The Putnam funds’ proxy voting guidelines and procedures, as well as information regarding how your fund voted proxies relating to portfolio securities during the 12-month period ended June 30, 2015, are available in the Individual Investors section of putnam.com, and on the Securities and Exchange Commission (SEC) website, www.sec.gov. If you have questions about finding forms on the SEC’s website, you may call the SEC at 1-800-SEC-0330. You may also obtain the Putnam funds’ proxy voting guidelines and procedures at no charge by calling Putnam’s Shareholder Services at 1-800-225-1581.
Fund portfolio holdings
The fund will file a complete schedule of its portfolio holdings with the SEC for the first and third quarters of each fiscal year on Form N-Q. Shareholders may obtain the fund’s Form N-Q on the SEC’s website at www.sec.gov. In addition, the fund’s Form N-Q may be reviewed and copied at the SEC’s Public Reference Room in Washington, D.C. You may call the SEC at 1-800-SEC-0330 for information about the SEC’s website or the operation of the Public Reference Room.
Trustee and employee fund ownership
Putnam employees and members of the Board of Trustees place their faith, confidence, and, most importantly, investment dollars in Putnam mutual funds. As of July 31, 2015, Putnam employees had approximately $517,000,000 and the Trustees had approximately $141,000,000 invested in Putnam mutual funds. These amounts include investments by the Trustees’ and employees’ immediate family members as well as investments through retirement and deferred compensation plans.
| 16 | Investors Fund |
Important notice regarding Putnam’s privacy policy
In order to conduct business with our shareholders, we must obtain certain personal information such as account holders’ names, addresses, Social Security numbers, and dates of birth. Using this information, we are able to maintain accurate records of accounts and transactions.
It is our policy to protect the confidentiality of our shareholder information, whether or not a shareholder currently owns shares of our funds. In particular, it is our policy not to sell information about you or your accounts to outside marketing firms. We have safeguards in place designed to prevent unauthorized access to our computer systems and procedures to protect personal information from unauthorized use.
Under certain circumstances, we must share account information with outside vendors who provide services to us, such as mailings and proxy solicitations. In these cases, the service providers enter into confidentiality agreements with us, and we provide only the information necessary to process transactions and perform other services related to your account. Finally, it is our policy to share account information with your financial representative, if you’ve listed one on your Putnam account.
| Investors Fund | 17 |
Trustee approval of management contract
General conclusions
The Board of Trustees of The Putnam Funds oversees the management of each fund and, as required by law, determines annually whether to approve the continuance of your fund’s management contract with Putnam Investment Management, LLC (“Putnam Management”) and the sub-management contract with respect to your fund between Putnam Management and its affiliate, Putnam Investments Limited (“PIL”). The Board, with the assistance of its Contract Committee, requests and evaluates all information it deems reasonably necessary under the circumstances in connection with its annual contract review. The Contract Committee consists solely of Trustees who are not “interested persons” (as this term is defined in the Investment Company Act of 1940, as amended (the “1940 Act”)) of The Putnam Funds (“Independent Trustees”).
At the outset of the review process, members of the Board’s independent staff and independent legal counsel met with representatives of Putnam Management to review the annual contract review materials furnished to the Contract Committee during the course of the previous year’s review and to discuss possible changes in these materials that might be necessary or desirable for the coming year. Following these discussions and in consultation with the Contract Committee, the Independent Trustees’ independent legal counsel requested that Putnam Management and its affiliates furnish specified information, together with any additional information that Putnam Management considered relevant, to the Contract Committee. Over the course of several months ending in June 2015, the Contract Committee met on a number of occasions with representatives of Putnam Management, and separately in executive session, to consider the information that Putnam Management provided, as well as supplemental information provided in response to additional requests made by the Contract Committee. Throughout this process, the Contract Committee was assisted by the members of the Board’s independent staff and by independent legal counsel for The Putnam Funds and the Independent Trustees.
In May 2015, the Contract Committee met in executive session to discuss and consider its recommendations with respect to the continuance of the contracts. At the Trustees’ June 19, 2015 meeting, the Contract Committee met in executive session with the other Independent Trustees to review a summary of the key financial, performance and other data that the Contract Committee considered in the course of its review. The Contract Committee then presented its written report, which summarized the key factors that the Committee had considered and set forth its recommendations. The Contract Committee then recommended, and the Independent Trustees approved, the continuance of your fund’s management and sub-management contracts, effective July 1, 2015. (Because PIL is an affiliate of Putnam Management and Putnam Management remains fully responsible for all services provided by PIL, the Trustees have not attempted to evaluate PIL as a separate entity, and all subsequent references to Putnam Management below should be deemed to include reference to PIL as necessary or appropriate in the context.)
The Independent Trustees’ approval was based on the following conclusions:
• That the fee schedule in effect for your fund represented reasonable compensation in light of the nature and quality of the services being provided to the fund, the fees paid by competitive funds, the costs incurred by Putnam Management in providing services to the
| 18 | Investors Fund |
fund, and the continued application of certain reductions and waivers noted below; and
• That the fee schedule in effect for your fund represented an appropriate sharing between fund shareholders and Putnam Management of such economies of scale as may exist in the management of the fund at current asset levels.
These conclusions were based on a comprehensive consideration of all information provided to the Trustees and were not the result of any single factor. Some of the factors that figured particularly in the Trustees’ deliberations and how the Trustees considered these factors are described below, although individual Trustees may have evaluated the information presented differently, giving different weights to various factors. It is also important to recognize that the management arrangements for your fund and the other Putnam funds are the result of many years of review and discussion between the Independent Trustees and Putnam Management, that some aspects of the arrangements may receive greater scrutiny in some years than others, and that the Trustees’ conclusions may be based, in part, on their consideration of fee arrangements in previous years. For example, with some minor exceptions, the funds’ current fee arrangements were implemented at the beginning of 2010 following extensive review by the Contract Committee and discussions with representatives of Putnam Management, as well as approval by shareholders.
Management fee schedules and total expenses
The Trustees reviewed the management fee schedules in effect for all Putnam funds, including fee levels and breakpoints. The Trustees also reviewed the total expenses of each Putnam fund, recognizing that in most cases management fees represented the major, but not the sole, determinant of total costs to shareholders.
In reviewing fees and expenses, the Trustees generally focus their attention on material changes in circumstances — for example, changes in assets under management, changes in a fund’s investment style, changes in Putnam Management’s operating costs or profitability, or changes in competitive practices in the mutual fund industry — that suggest that consideration of fee changes might be warranted. The Trustees concluded that the circumstances did not warrant changes to the management fee structure of your fund.
Under its management contract, your fund has the benefit of breakpoints in its management fee schedule that provide shareholders with economies of scale in the form of reduced fee levels as assets under management in the Putnam family of funds increase. The Trustees concluded that the fee schedule in effect for your fund represented an appropriate sharing of economies of scale between fund shareholders and Putnam Management.
As in the past, the Trustees also focused on the competitiveness of each fund’s total expense ratio. In order to support the effort to have fund expenses meet competitive standards, the Trustees and Putnam Management have implemented certain expense limitations. These expense limitations were: (i) a contractual expense limitation applicable to all retail open-end funds of 32 basis points on investor servicing fees and expenses and (ii) a contractual expense limitation applicable to your fund and all but two of the other open-end funds of 20 basis points on so-called “other expenses” (i.e., all expenses exclusive of management fees, distribution fees, investor servicing fees, investment-related expenses, interest, taxes, brokerage commissions, acquired fund fees and expenses and extraordinary expenses). These expense limitations attempt to maintain competitive expense levels for funds with large numbers of small shareholder accounts and funds with relatively small net assets. Most
| Investors Fund | 19 |
funds, including your fund, had sufficiently low expenses that these expense limitations were not operative. Putnam Management’s support for these expense limitation arrangements was an important factor in the Trustees’ decision to approve the continuance of your fund’s management and sub-management contracts.
The Trustees reviewed comparative fee and expense information for a custom group of competitive funds selected by Lipper Inc. (“Lipper”). This comparative information included your fund’s percentile ranking for effective management fees and total expenses (excluding any applicable 12b-1 fee), which provides a general indication of your fund’s relative standing. In the custom peer group, your fund ranked in the second quintile in effective management fees (determined for your fund and the other funds in the custom peer group based on fund asset size and the applicable contractual management fee schedule) and in the fourth quintile in total expenses (excluding any applicable 12b-1 fees) as of December 31, 2014 (the first quintile representing the least expensive funds and the fifth quintile the most expensive funds). The fee and expense data reported by Lipper as of December 31, 2014 reflected the most recent fiscal year-end data available in Lipper’s database at that time.
In connection with their review of fund management fees and total expenses, the Trustees also reviewed the costs of the services provided and the profits realized by Putnam Management and its affiliates from their contractual relationships with the funds. This information included trends in revenues, expenses and profitability of Putnam Management and its affiliates relating to the investment management, investor servicing and distribution services provided to the funds. In this regard, the Trustees also reviewed an analysis of Putnam Management’s revenues, expenses and profitability, allocated on a fund-by-fund basis, with respect to the funds’ management, distribution, and investor servicing contracts. For each fund, the analysis presented information about revenues, expenses and profitability for each of the agreements separately and for the agreements taken together on a combined basis. The Trustees concluded that, at current asset levels, the fee schedules in place represented reasonable compensation for the services being provided and represented an appropriate sharing of such economies of scale as may exist in the management of the Putnam funds at that time.
The information examined by the Trustees as part of their annual contract review for the Putnam funds has included for many years information regarding fees charged by Putnam Management and its affiliates to institutional clients such as defined benefit pension plans, college endowments, and the like. This information included comparisons of those fees with fees charged to the Putnam funds, as well as an assessment of the differences in the services provided to these different types of clients. The Trustees observed that the differences in fee rates between institutional clients and mutual funds are by no means uniform when examined by individual asset sectors, suggesting that differences in the pricing of investment management services to these types of clients may reflect historical competitive forces operating in separate markets. The Trustees considered the fact that in many cases fee rates across different asset classes are higher on average for mutual funds than for institutional clients, as well as the differences between the services that Putnam Management provides to the Putnam funds and those that it provides to its institutional clients. The Trustees did not rely on these comparisons to any significant extent in concluding that the management fees paid by your fund are reasonable.
Investment performance
The quality of the investment process provided by Putnam Management represented a major factor in the Trustees’ evaluation of the quality
| 20 | Investors Fund |
of services provided by Putnam Management under your fund’s management contract. The Trustees were assisted in their review of the Putnam funds’ investment process and performance by the work of the investment oversight committees of the Trustees, which meet on a regular basis with the funds’ portfolio teams and with the Chief Investment Officer and other senior members of Putnam Management’s Investment Division throughout the year. The Trustees concluded that Putnam Management generally provides a high-quality investment process — based on the experience and skills of the individuals assigned to the management of fund portfolios, the resources made available to them, and in general Putnam Management’s ability to attract and retain high-quality personnel — but also recognized that this does not guarantee favorable investment results for every fund in every time period.
The Trustees considered that 2014 was a year of strong competitive performance for many of the Putnam funds, with generally strong results for the U.S. equity, money market and global asset allocation funds, but relatively mixed results for the international and global equity and fixed income funds. They noted that the longer-term performance of the Putnam funds continued to be strong, exemplified by the fact that the Putnam funds were recognized by Barron’s as the sixth-best performing mutual fund complex for the five-year period ended December 31, 2014. They also noted, however, the disappointing investment performance of some funds for periods ended December 31, 2014 and considered information provided by Putnam Management regarding the factors contributing to the underperformance and actions being taken to improve the performance of these particular funds. The Trustees indicated their intention to continue to monitor performance trends to assess the effectiveness of these efforts and to evaluate whether additional actions to address areas of underperformance are warranted.
For purposes of evaluating investment performance, the Trustees generally focus on competitive industry rankings for the one-year, three-year and five-year periods. For a number of Putnam funds with relatively unique investment mandates for which meaningful competitive performance rankings are not considered to be available, the Trustees evaluated performance based on comparisons of fund returns with the returns of selected investment benchmarks. In the case of your fund, the Trustees considered that its class A share cumulative total return performance at net asset value was in the following quartiles of its Lipper peer group (Lipper Large-Cap Core Funds) for the one-year, three-year and five-year periods ended December 31, 2014 (the first quartile representing the best-performing funds and the fourth quartile the worst-performing funds):
| One-year period | 1st | ||
| Three-year period | 1st | ||
| Five-year period | 1st | ||
Over the one-year, three-year and five-year periods ended December 31, 2014, there were 857, 759 and 695 funds, respectively, in your fund’s Lipper peer group. (When considering performance information, shareholders should be mindful that past performance is not a guarantee of future results.)
The Trustees also considered Putnam Management’s continued efforts to support fund performance through initiatives including structuring compensation for portfolio managers and research analysts to enhance accountability for fund performance, emphasizing accountability in the portfolio management process, and affirming its commitment to a fundamental-driven approach to investing. The Trustees noted further that Putnam Management continued to strengthen its fundamental research capabilities by adding new investment personnel.
| Investors Fund | 21 |
Brokerage and soft-dollar allocations; investor servicing
The Trustees considered various potential benefits that Putnam Management may receive in connection with the services it provides under the management contract with your fund. These include benefits related to brokerage allocation and the use of soft dollars, whereby a portion of the commissions paid by a fund for brokerage may be used to acquire research services that are expected to be useful to Putnam Management in managing the assets of the fund and of other clients. Subject to policies established by the Trustees, soft dollars generated by these means are used primarily to acquire brokerage and research services that enhance Putnam Management’s investment capabilities and supplement Putnam Management’s internal research efforts. However, the Trustees noted that a portion of available soft dollars continues to be used to pay fund expenses. The Trustees indicated their continued intent to monitor regulatory and industry developments in this area with the assistance of their Brokerage Committee and also indicated their continued intent to monitor the allocation of the Putnam funds’ brokerage in order to ensure that the principle of seeking best price and execution remains paramount in the portfolio trading process.
Putnam Management may also receive benefits from payments that the funds make to Putnam Management’s affiliates for investor or distribution services. In conjunction with the annual review of your fund’s management and sub-management contracts, the Trustees reviewed your fund’s investor servicing agreement with Putnam Investor Services, Inc. (“PSERV”) and its distributor’s contracts and distribution plans with Putnam Retail Management Limited Partnership (“PRM”), both of which are affiliates of Putnam Management. The Trustees concluded that the fees payable by the funds to PSERV and PRM, as applicable, for such services are reasonable in relation to the nature and quality of such services, the fees paid by competitive funds, and the costs incurred by PSERV and PRM, as applicable, in providing such services.
| 22 | Investors Fund |
Financial statements
These sections of the report, as well as the accompanying Notes, preceded by the Report of Independent Registered Public Accounting Firm, constitute the fund’s financial statements.
The fund’s portfolio lists all the fund’s investments and their values as of the last day of the reporting period. Holdings are organized by asset type and industry sector, country, or state to show areas of concentration and diversification.
Statement of assets and liabilities shows how the fund’s net assets and share price are determined. All investment and non-investment assets are added together. Any unpaid expenses and other liabilities are subtracted from this total. The result is divided by the number of shares to determine the net asset value per share, which is calculated separately for each class of shares. (For funds with preferred shares, the amount subtracted from total assets includes the liquidation preference of preferred shares.)
Statement of operations shows the fund’s net investment gain or loss. This is done by first adding up all the fund’s earnings — from dividends and interest income — and subtracting its operating expenses to determine net investment income (or loss). Then, any net gain or loss the fund realized on the sales of its holdings — as well as any unrealized gains or losses over the period — is added to or subtracted from the net investment result to determine the fund’s net gain or loss for the fiscal year.
Statement of changes in net assets shows how the fund’s net assets were affected by the fund’s net investment gain or loss, by distributions to shareholders, and by changes in the number of the fund’s shares. It lists distributions and their sources (net investment income or realized capital gains) over the current reporting period and the most recent fiscal year-end. The distributions listed here may not match the sources listed in the Statement of operations because the distributions are determined on a tax basis and may be paid in a different period from the one in which they were earned.
Financial highlights provide an overview of the fund’s investment results, per-share distributions, expense ratios, net investment income ratios, and portfolio turnover in one summary table, reflecting the five most recent reporting periods. In a semiannual report, the highlights table also includes the current reporting period.
| Investors Fund | 23 |
Report of Independent Registered Public Accounting Firm
The Board of Trustees and Shareholders
Putnam Investors Fund:
We have audited the accompanying statement of assets and liabilities of Putnam Investors Fund (the fund), including the fund’s portfolio, as of July 31, 2015, and the related statement of operations for the year then ended, the statements of changes in net assets for each of the years in the two-year period then ended, and the financial highlights for each of the years or periods in the five-year period then ended. These financial statements and financial highlights are the responsibility of the fund’s management. Our responsibility is to express an opinion on these financial statements and financial highlights based on our audits.
We conducted our audits in accordance with the standards of the Public Company Accounting Oversight Board (United States). Those standards require that we plan and perform the audit to obtain reasonable assurance about whether the financial statements and financial highlights are free of material misstatement. An audit includes examining, on a test basis, evidence supporting the amounts and disclosures in the financial statements. Our procedures included confirmation of securities owned as of July 31, 2015, by correspondence with the custodian and brokers or by other appropriate auditing procedures. An audit also includes assessing the accounting principles used and significant estimates made by management, as well as evaluating the overall financial statement presentation. We believe that our audits provide a reasonable basis for our opinion.
In our opinion, the financial statements and financial highlights referred to above present fairly, in all material respects, the financial position of Putnam Investors Fund as of July 31, 2015, the results of its operations for the year then ended, the changes in its net assets for each of the years in the two-year period then ended and the financial highlights for each of the years or periods in the five-year period then ended, in conformity with U.S. generally accepted accounting principles.

Boston, Massachusetts
September 9, 2015
| 24 | Investors Fund |
The fund’s portfolio 7/31/15
| COMMON STOCKS (98.8%)* | Shares | Value |
| Aerospace and defense (4.7%) | ||
| Airbus Group SE (France) | 27,234 | $1,932,385 |
| Boeing Co. (The) | 82,800 | 11,937,276 |
| Bombardier, Inc. Class B (Canada) | 1,576,900 | 1,965,322 |
| General Dynamics Corp. | 95,400 | 14,225,094 |
| Honeywell International, Inc. | 82,730 | 8,690,787 |
| L-3 Communications Holdings, Inc. | 88,445 | 10,211,860 |
| Northrop Grumman Systems Corp. | 127,500 | 22,058,775 |
| Raytheon Co. | 42,700 | 4,658,143 |
| Spirit AeroSystems Holdings, Inc. Class A † | 76,100 | 4,284,430 |
| TransDigm Group, Inc. † | 13,100 | 2,964,530 |
| United Technologies Corp. | 85,500 | 8,576,505 |
| 91,505,107 | ||
| Airlines (0.9%) | ||
| Alaska Air Group, Inc. | 42,600 | 3,226,950 |
| Southwest Airlines Co. | 285,600 | 10,338,720 |
| Spirit Airlines, Inc. † | 24,300 | 1,453,626 |
| United Continental Holdings, Inc. † | 32,400 | 1,827,036 |
| 16,846,332 | ||
| Auto components (1.0%) | ||
| Delphi Automotive PLC (United Kingdom) | 92,200 | 7,198,976 |
| Goodyear Tire & Rubber Co. (The) | 82,100 | 2,473,673 |
| Lear Corp. | 53,100 | 5,526,117 |
| Magna International, Inc. (Canada) | 79,800 | 4,337,928 |
| 19,536,694 | ||
| Automobiles (0.2%) | ||
| General Motors Co. | 153,800 | 4,846,238 |
| 4,846,238 | ||
| Banks (7.9%) | ||
| Bank of America Corp. | 1,230,842 | 22,007,455 |
| Citigroup, Inc. | 366,717 | 21,438,276 |
| JPMorgan Chase & Co. | 773,573 | 53,012,958 |
| KeyCorp | 207,800 | 3,083,752 |
| PNC Financial Services Group, Inc. | 75,400 | 7,402,772 |
| Regions Financial Corp. | 402,400 | 4,180,936 |
| SunTrust Banks, Inc. | 117,200 | 5,196,648 |
| Wells Fargo & Co. | 684,798 | 39,629,260 |
| 155,952,057 | ||
| Beverages (1.9%) | ||
| Coca-Cola Co. (The) | 119,500 | 4,909,060 |
| Coca-Cola Enterprises, Inc. | 55,100 | 2,814,508 |
| Dr. Pepper Snapple Group, Inc. | 124,800 | 10,011,456 |
| PepsiCo, Inc. | 205,400 | 19,790,290 |
| 37,525,314 | ||
| Biotechnology (4.2%) | ||
| AMAG Pharmaceuticals, Inc. † S | 128,605 | 8,217,860 |
| Amgen, Inc. | 114,300 | 20,184,237 |
| Biogen, Inc. † | 31,700 | 10,105,326 |
| Celgene Corp. † | 148,200 | 19,451,250 |
| Investors Fund | 25 |
| COMMON STOCKS (98.8%)* cont. | Shares | Value |
| Biotechnology cont. | ||
| Gilead Sciences, Inc. | 180,400 | $21,261,944 |
| United Therapeutics Corp. † | 16,200 | 2,743,632 |
| 81,964,249 | ||
| Building products (0.3%) | ||
| CaesarStone Sdot-Yam, Ltd. (Israel) | 54,619 | 3,918,367 |
| Masco Corp. | 88,900 | 2,346,071 |
| 6,264,438 | ||
| Capital markets (3.6%) | ||
| Bank of New York Mellon Corp. (The) | 137,400 | 5,963,160 |
| Blackstone Group LP (The) | 93,500 | 3,669,875 |
| Carlyle Group LP (The) | 263,379 | 7,008,515 |
| Charles Schwab Corp. (The) | 141,900 | 4,949,472 |
| Goldman Sachs Group, Inc. (The) | 94,500 | 19,379,115 |
| KKR & Co. LP | 155,700 | 3,721,230 |
| Legg Mason, Inc. | 78,300 | 3,863,322 |
| Morgan Stanley | 298,900 | 11,609,276 |
| State Street Corp. | 133,100 | 10,190,136 |
| 70,354,101 | ||
| Chemicals (1.7%) | ||
| Dow Chemical Co. (The) | 123,343 | 5,804,522 |
| E.I. du Pont de Nemours & Co. | 83,900 | 4,678,264 |
| Huntsman Corp. | 44,500 | 845,500 |
| LyondellBasell Industries NV Class A | 81,000 | 7,600,230 |
| Monsanto Co. | 57,200 | 5,828,108 |
| Sherwin-Williams Co. (The) | 17,100 | 4,749,696 |
| Symrise AG (Germany) | 51,768 | 3,445,678 |
| 32,951,998 | ||
| Commercial services and supplies (0.8%) | ||
| KAR Auction Services, Inc. | 82,962 | 3,229,711 |
| MiX Telematics, Ltd. ADR (South Africa) † S | 152,333 | 1,108,984 |
| Tyco International PLC | 83,100 | 3,156,969 |
| Waste Management, Inc. | 110,300 | 5,639,639 |
| West Corp. | 91,700 | 2,645,545 |
| 15,780,848 | ||
| Communications equipment (1.7%) | ||
| Cisco Systems, Inc. | 733,500 | 20,846,070 |
| QUALCOMM, Inc. | 203,100 | 13,077,609 |
| 33,923,679 | ||
| Consumer finance (1.0%) | ||
| Capital One Financial Corp. | 110,700 | 8,999,910 |
| Discover Financial Services | 185,000 | 10,324,850 |
| 19,324,760 | ||
| Containers and packaging (0.4%) | ||
| Berry Plastics Group, Inc. † | 90,235 | 2,938,052 |
| Sealed Air Corp. | 89,400 | 4,753,398 |
| 7,691,450 | ||
| Diversified financial services (0.9%) | ||
| Berkshire Hathaway, Inc. Class B † | 38,880 | 5,549,731 |
| Easterly Acquisition Corp. (Units) † | 736,300 | 7,363,000 |
| Voya Financial, Inc. | 105,600 | 4,957,920 |
| 17,870,651 | ||
| 26 | Investors Fund |
| COMMON STOCKS (98.8%)* cont. | Shares | Value |
| Diversified telecommunication services (1.6%) | ||
| AT&T, Inc. | 313,352 | $10,885,855 |
| CenturyLink, Inc. | 58,600 | 1,675,960 |
| Iridium Communications, Inc. † S | 321,548 | 2,385,886 |
| Verizon Communications, Inc. | 347,821 | 16,274,545 |
| 31,222,246 | ||
| Electric utilities (1.1%) | ||
| Duke Energy Corp. | 50,200 | 3,725,844 |
| Edison International | 91,100 | 5,466,911 |
| Entergy Corp. | 100,600 | 7,144,612 |
| Exelon Corp. | 173,400 | 5,564,406 |
| 21,901,773 | ||
| Electronic equipment, instruments, and components (0.4%) | ||
| CDW Corp. of Delaware | 52,968 | 1,903,140 |
| Corning, Inc. | 325,200 | 6,074,736 |
| 7,977,876 | ||
| Energy equipment and services (1.3%) | ||
| Cameron International Corp. † | 102,300 | 5,162,058 |
| Halliburton Co. | 78,400 | 3,276,336 |
| Nabors Industries, Ltd. | 257,700 | 2,991,897 |
| Schlumberger, Ltd. | 159,924 | 13,244,906 |
| 24,675,197 | ||
| Food and staples retail (3.3%) | ||
| Costco Wholesale Corp. | 62,000 | 9,008,600 |
| CVS Health Corp. | 231,110 | 25,992,942 |
| Kroger Co. (The) | 418,000 | 16,402,320 |
| Wal-Mart Stores, Inc. | 119,200 | 8,580,016 |
| Walgreens Boots Alliance, Inc. | 38,500 | 3,720,255 |
| 63,704,133 | ||
| Food products (0.8%) | ||
| Archer-Daniels-Midland Co. | 98,200 | 4,656,644 |
| Blue Buffalo Pet Products, Inc. † | 48,118 | 1,344,417 |
| JM Smucker Co. (The) | 17,800 | 1,988,082 |
| Keurig Green Mountain, Inc. | 29,300 | 2,198,672 |
| Pinnacle Foods, Inc. | 105,400 | 4,737,730 |
| 14,925,545 | ||
| Gas utilities (0.2%) | ||
| UGI Corp. | 91,500 | 3,343,410 |
| 3,343,410 | ||
| Health-care equipment and supplies (1.6%) | ||
| Becton Dickinson and Co. | 29,100 | 4,427,565 |
| Edwards Lifesciences Corp. † | 31,800 | 4,838,688 |
| Medtronic PLC | 118,923 | 9,322,374 |
| St. Jude Medical, Inc. | 64,700 | 4,776,154 |
| Stryker Corp. | 75,400 | 7,711,158 |
| 31,075,939 | ||
| Health-care providers and services (3.5%) | ||
| Aetna, Inc. | 68,700 | 7,761,039 |
| AmerisourceBergen Corp. | 66,000 | 6,979,500 |
| Anthem, Inc. | 69,400 | 10,706,338 |
| Cardinal Health, Inc. | 101,200 | 8,599,976 |
| Cigna Corp. | 47,600 | 6,857,256 |
| Express Scripts Holding Co. † | 38,700 | 3,485,709 |
| Investors Fund | 27 |
| COMMON STOCKS (98.8%)* cont. | Shares | Value |
| Health-care providers and services cont. | ||
| HCA Holdings, Inc. † | 121,600 | $11,310,016 |
| UnitedHealth Group, Inc. | 98,500 | 11,957,900 |
| 67,657,734 | ||
| Health-care technology (0.1%) | ||
| Press Ganey Holdings, Inc. † | 33,475 | 1,048,102 |
| 1,048,102 | ||
| Hotels, restaurants, and leisure (1.3%) | ||
| Intrawest Resorts Holdings, Inc. † | 43,162 | 430,325 |
| Las Vegas Sands Corp. S | 117,200 | 6,567,888 |
| McDonald’s Corp. | 48,400 | 4,833,224 |
| Penn National Gaming, Inc. † | 311,100 | 5,935,788 |
| Wyndham Worldwide Corp. | 47,100 | 3,886,692 |
| Yum! Brands, Inc. | 36,600 | 3,212,016 |
| 24,865,933 | ||
| Household durables (0.5%) | ||
| New Home Co., Inc. (The) † | 200,147 | 3,396,495 |
| TopBuild Corp. † | 9,878 | 284,085 |
| Tupperware Brands Corp. S | 59,200 | 3,461,424 |
| WCI Communities, Inc. † | 102,100 | 2,577,004 |
| 9,719,008 | ||
| Household products (0.8%) | ||
| Kimberly-Clark Corp. | 43,500 | 5,001,195 |
| Procter & Gamble Co. (The) | 143,400 | 10,998,780 |
| 15,999,975 | ||
| Independent power and renewable electricity producers (0.3%) | ||
| NRG Energy, Inc. | 273,300 | 6,135,585 |
| 6,135,585 | ||
| Industrial conglomerates (1.7%) | ||
| 3M Co. | 93,700 | 14,180,558 |
| Danaher Corp. | 64,100 | 5,868,996 |
| General Electric Co. | 412,400 | 10,763,640 |
| Siemens AG (Germany) | 24,355 | 2,607,282 |
| 33,420,476 | ||
| Insurance (2.8%) | ||
| American International Group, Inc. | 284,450 | 18,238,934 |
| Assured Guaranty, Ltd. | 122,700 | 3,001,242 |
| Genworth Financial, Inc. Class A † | 162,100 | 1,136,321 |
| Hartford Financial Services Group, Inc. (The) | 165,600 | 7,874,280 |
| Lincoln National Corp. | 110,600 | 6,228,992 |
| MetLife, Inc. | 138,066 | 7,695,799 |
| Prudential PLC (United Kingdom) | 113,920 | 2,680,189 |
| Travelers Cos., Inc. (The) | 79,000 | 8,383,480 |
| 55,239,237 | ||
| Internet and catalog retail (1.2%) | ||
| Amazon.com, Inc. † | 19,200 | 10,294,080 |
| Expedia, Inc. | 45,400 | 5,513,376 |
| FabFurnish GmbH (acquired 8/2/13, cost $31) (Private) (Brazil) †∆∆ F | 23 | 19 |
| Global Fashion Holding SA (acquired 8/2/13, cost $1,535,904) | ||
| (Private) (Brazil) †∆∆ F | 36,256 | 928,093 |
| New Bigfoot Other Assets GmbH (acquired 8/2/13, cost $31) | ||
| (Private) (Brazil) †∆∆ F | 23 | 19 |
| 28 | Investors Fund |
| COMMON STOCKS (98.8%)* cont. | Shares | Value |
| Internet and catalog retail cont. | ||
| New Middle East Other Assets GmbH (acquired 8/2/13, cost $12) | ||
| (Private) (Brazil) †∆∆ F | 9 | $7 |
| Priceline Group, Inc. (The) † | 5,900 | 7,337,063 |
| 24,072,657 | ||
| Internet software and services (2.6%) | ||
| Alibaba Group Holding, Ltd. ADR (China) † S | 59,000 | 4,622,060 |
| eBay, Inc. † | 119,600 | 3,363,152 |
| Facebook, Inc. Class A † | 109,300 | 10,275,293 |
| Google, Inc. Class C † | 46,494 | 29,087,111 |
| Yahoo!, Inc. † | 89,800 | 3,292,966 |
| 50,640,582 | ||
| IT Services (3.2%) | ||
| Amdocs, Ltd. | 53,700 | 3,149,505 |
| Computer Sciences Corp. | 138,900 | 9,088,227 |
| DST Systems, Inc. | 40,731 | 4,445,789 |
| IBM Corp. | 86,300 | 13,979,737 |
| MasterCard, Inc. Class A | 127,800 | 12,447,720 |
| PayPal Holdings, Inc. † | 119,600 | 4,628,520 |
| Visa, Inc. Class A | 134,800 | 10,155,832 |
| Xerox Corp. | 353,000 | 3,890,060 |
| 61,785,390 | ||
| Leisure products (0.2%) | ||
| Hasbro, Inc. | 30,900 | 2,433,066 |
| MCBC Holdings, Inc. † | 39,865 | 609,935 |
| 3,043,001 | ||
| Life sciences tools and services (0.2%) | ||
| Agilent Technologies, Inc. | 61,800 | 2,530,710 |
| Waters Corp. † | 14,700 | 1,962,303 |
| 4,493,013 | ||
| Machinery (1.1%) | ||
| Caterpillar, Inc. | 47,400 | 3,727,062 |
| Deere & Co. S | 73,300 | 6,931,981 |
| Parker Hannifin Corp. | 50,200 | 5,660,050 |
| Trinity Industries, Inc. | 207,496 | 6,071,333 |
| 22,390,426 | ||
| Media (3.5%) | ||
| Comcast Corp. Class A | 284,700 | 17,768,127 |
| DISH Network Corp. Class A † | 75,100 | 4,852,211 |
| Omnicom Group, Inc. | 63,800 | 4,662,504 |
| Time Warner Cable, Inc. | 37,500 | 7,125,375 |
| Time Warner, Inc. | 115,400 | 10,159,816 |
| Time, Inc. | 18,425 | 411,246 |
| Twenty-First Century Fox, Inc. | 182,800 | 6,304,772 |
| Walt Disney Co. (The) | 146,200 | 17,544,000 |
| 68,828,051 | ||
| Metals and mining (0.3%) | ||
| Freeport-McMoRan, Inc. (Indonesia) | 116,600 | 1,370,050 |
| Nucor Corp. | 82,500 | 3,641,550 |
| United States Steel Corp. S | 80,000 | 1,557,600 |
| 6,569,200 | ||
| Investors Fund | 29 |
| COMMON STOCKS (98.8%)* cont. | Shares | Value |
| Multi-utilities (0.3%) | ||
| Public Service Enterprise Group, Inc. | 123,700 | $5,154,579 |
| 5,154,579 | ||
| Multiline retail (1.5%) | ||
| Dollar General Corp. | 41,000 | 3,295,170 |
| Kohl’s Corp. | 83,100 | 5,095,692 |
| Macy’s, Inc. | 151,500 | 10,462,590 |
| Target Corp. | 127,300 | 10,419,505 |
| 29,272,957 | ||
| Oil, gas, and consumable fuels (5.5%) | ||
| Anadarko Petroleum Corp. | 110,600 | 8,223,110 |
| Apache Corp. | 75,200 | 3,448,672 |
| Chevron Corp. | 27,300 | 2,415,504 |
| Devon Energy Corp. | 64,300 | 3,177,706 |
| Energy Transfer Partners LP | 105,200 | 5,386,240 |
| EOG Resources, Inc. | 65,200 | 5,032,788 |
| Exxon Mobil Corp. | 363,025 | 28,755,210 |
| Green Plains Partners LP † | 297,487 | 4,744,918 |
| Gulfport Energy Corp. † | 72,300 | 2,368,548 |
| Hess Corp. | 51,700 | 3,050,817 |
| JP Energy Partners LP | 133,500 | 1,615,350 |
| Memorial Resource Development Corp. † S | 465,175 | 7,117,178 |
| Royal Dutch Shell PLC ADR Class A (United Kingdom) | 110,336 | 6,342,113 |
| Suncor Energy, Inc. (Canada) | 150,600 | 4,240,896 |
| Total SA ADR (France) | 215,020 | 10,598,336 |
| Valero Energy Corp. | 138,700 | 9,098,720 |
| Whiting Petroleum Corp. † | 67,895 | 1,391,169 |
| 107,007,275 | ||
| Paper and forest products (0.2%) | ||
| International Paper Co. | 98,400 | 4,710,408 |
| 4,710,408 | ||
| Personal products (1.0%) | ||
| Avon Products, Inc. S | 870,545 | 4,935,990 |
| Coty, Inc. Class A † | 295,120 | 7,888,558 |
| Edgewell Personal Care Co. | 64,100 | 6,135,011 |
| 18,959,559 | ||
| Pharmaceuticals (6.1%) | ||
| AbbVie, Inc. | 53,800 | 3,766,538 |
| Allergan PLC † | 21,219 | 7,026,672 |
| Bristol-Myers Squibb Co. | 92,400 | 6,065,136 |
| Eli Lilly & Co. | 68,000 | 5,746,680 |
| Jazz Pharmaceuticals PLC † | 22,132 | 4,254,656 |
| Johnson & Johnson | 251,600 | 25,212,836 |
| Merck & Co., Inc. | 276,200 | 16,284,752 |
| Mylan NV † | 68,300 | 3,824,117 |
| Perrigo Co. PLC | 43,400 | 8,341,480 |
| Pfizer, Inc. | 799,826 | 28,841,726 |
| Shire PLC ADR (United Kingdom) S | 28,900 | 7,710,809 |
| Zoetis, Inc. | 83,700 | 4,099,626 |
| 121,175,028 | ||
| 30 | Investors Fund |
| COMMON STOCKS (98.8%)* cont. | Shares | Value |
| Real estate investment trusts (REITs) (1.2%) | ||
| Armada Hoffler Properties, Inc. R | 531,044 | $5,443,201 |
| Easterly Government Properties, Inc. R | 536,744 | 8,480,555 |
| Hannon Armstrong Sustainable Infrastructure Capital, Inc. R | 142,436 | 2,858,691 |
| Kimco Realty Corp. R | 118,500 | 2,928,135 |
| Rayonier, Inc. R | 116,000 | 2,853,600 |
| 22,564,182 | ||
| Real estate management and development (0.2%) | ||
| Marcus & Millichap, Inc. † | 81,705 | 4,186,564 |
| 4,186,564 | ||
| Road and rail (0.8%) | ||
| Union Pacific Corp. | 157,900 | 15,409,461 |
| 15,409,461 | ||
| Semiconductors and semiconductor equipment (2.4%) | ||
| Avago Technologies, Ltd. | 30,300 | 3,791,742 |
| Broadcom Corp. Class A | 80,800 | 4,089,288 |
| Canadian Solar, Inc. (Canada) † | 61,500 | 1,651,583 |
| Intel Corp. | 481,600 | 13,942,320 |
| Lam Research Corp. | 48,200 | 3,705,134 |
| Marvell Technology Group, Ltd. | 237,100 | 2,949,524 |
| Maxim Integrated Products, Inc. | 82,200 | 2,798,088 |
| Micron Technology, Inc. † | 222,100 | 4,111,071 |
| NVIDIA Corp. | 204,100 | 4,071,795 |
| Texas Instruments, Inc. | 131,000 | 6,547,380 |
| 47,657,925 | ||
| Software (4.8%) | ||
| Activision Blizzard, Inc. | 158,000 | 4,074,820 |
| Autodesk, Inc. † | 47,700 | 2,412,666 |
| Cadence Design Systems, Inc. † S | 124,900 | 2,619,153 |
| Electronic Arts, Inc. † | 120,600 | 8,628,930 |
| Microsoft Corp. | 882,600 | 41,217,420 |
| Oracle Corp. | 527,000 | 21,048,380 |
| Red Hat, Inc. † | 43,100 | 3,408,348 |
| Symantec Corp. | 236,400 | 5,375,736 |
| TiVo, Inc. † | 232,700 | 2,317,692 |
| TubeMogul, Inc. † | 212,140 | 2,997,538 |
| 94,100,683 | ||
| Specialty retail (3.0%) | ||
| Bed Bath & Beyond, Inc. † | 62,700 | 4,089,921 |
| Best Buy Co., Inc. | 138,900 | 4,485,081 |
| Gap, Inc. (The) S | 137,400 | 5,012,352 |
| Home Depot, Inc. (The) | 151,300 | 17,706,639 |
| Lowe’s Cos., Inc. | 178,900 | 12,408,504 |
| Michaels Cos., Inc. (The) † | 189,178 | 4,793,771 |
| Sally Beauty Holdings, Inc. † | 78,100 | 2,326,599 |
| Select Comfort Corp. † | 58,376 | 1,520,111 |
| TJX Cos., Inc. (The) | 85,100 | 5,941,682 |
| 58,284,660 | ||
| Technology hardware, storage, and peripherals (5.6%) | ||
| Apple, Inc. | 645,269 | 78,271,124 |
| EMC Corp. | 455,900 | 12,259,151 |
| Hewlett-Packard Co. | 282,092 | 8,609,448 |
| Investors Fund | 31 |
| COMMON STOCKS (98.8%)* cont. | Shares | Value |
| Technology hardware, storage, and peripherals cont. | ||
| NetApp, Inc. | 56,300 | $1,753,745 |
| SanDisk Corp. | 25,400 | 1,531,366 |
| Western Digital Corp. | 96,700 | 8,322,002 |
| 110,746,836 | ||
| Textiles, apparel, and luxury goods (0.7%) | ||
| Coach, Inc. | 76,900 | 2,399,280 |
| NIKE, Inc. Class B | 101,800 | 11,729,396 |
| 14,128,676 | ||
| Tobacco (0.7%) | ||
| Altria Group, Inc. | 88,700 | 4,823,506 |
| Philip Morris International, Inc. | 102,100 | 8,732,613 |
| 13,556,119 | ||
| Total common stocks (cost $1,592,115,811) | $1,933,987,317 | |
| CONVERTIBLE PREFERRED STOCKS (0.6%)* | Shares | Value |
| Allergan PLC Ser. A, 5.50% cv. pfd. | 4,047 | $4,500,790 |
| American Tower Corp. $5.50 cv. pfd. R | 37,928 | 3,823,617 |
| Iridium Communications, Inc. 7.00% cv. pfd. | 27,936 | 2,666,142 |
| Total convertible preferred stocks (cost $10,633,400) | $10,990,549 | |
| SHORT-TERM INVESTMENTS (3.3%)* | Shares | Value |
| Putnam Cash Collateral Pool, LLC 0.25% d | 48,264,600 | $48,264,600 |
| Putnam Short Term Investment Fund 0.11% L | 15,773,109 | 15,773,109 |
| Total short-term investments (cost $64,037,709) | $64,037,709 | |
| TOTAL INVESTMENTS | ||
| Total investments (cost $1,666,786,920) | $2,009,015,575 | |
Key to holding’s abbreviations
| ADR | American Depository Receipts: represents ownership of foreign securities on deposit with a custodian bank |
Notes to the fund’s portfolio
Unless noted otherwise, the notes to the fund’s portfolio are for the close of the fund’s reporting period, which ran from August 1, 2014 through July 31, 2015 (the reporting period). Within the following notes to the portfolio, references to “ASC 820” represent Accounting Standards Codification 820 Fair Value Measurements and Disclosures and references to “OTC”, if any, represent over-the-counter.
* Percentages indicated are based on net assets of $1,957,826,757.
† This security is non-income-producing.
∆∆ This security is restricted with regard to public resale. The total fair value of this security and any other restricted securities (excluding 144A securities), if any, held at the close of the reporting period was $928,138, or less than 0.1% of net assets.
d Affiliated company. See Note 1 to the financial statements regarding securities lending. The rate quoted in the security description is the annualized 7-day yield of the fund at the close of the reporting period.
F This security is valued at fair value following procedures approved by the Trustees. Securities may be classified as Level 2 or Level 3 for ASC 820 based on the securities’ valuation inputs. At the close of the reporting period, fair value pricing was also used for certain foreign securities in the portfolio (Note 1).
| 32 | Investors Fund |
L Affiliated company (Note 5). The rate quoted in the security description is the annualized 7-day yield of the fund at the close of the reporting period.
R Real Estate Investment Trust.
S Security on loan, in part or in entirety, at the close of the reporting period (Note 1).
At the close of the reporting period, the fund maintained liquid assets totaling $67 to cover the settlement of certain securities.
ASC 820 establishes a three-level hierarchy for disclosure of fair value measurements. The valuation hierarchy is based upon the transparency of inputs to the valuation of the fund’s investments. The three levels are defined as follows:
Level 1: Valuations based on quoted prices for identical securities in active markets.
Level 2: Valuations based on quoted prices in markets that are not active or for which all significant inputs are observable, either directly or indirectly.
Level 3: Valuations based on inputs that are unobservable and significant to the fair value measurement.
The following is a summary of the inputs used to value the fund’s net assets as of the close of the reporting period:
| Valuation inputs | ||||||
| Investments in securities: | Level 1 | Level 2 | Level 3 | |||
| Common stocks*: | ||||||
| Consumer discretionary | $255,669,737 | $— | $928,138 | |||
| Consumer staples | 164,670,645 | — | — | |||
| Energy | 131,682,472 | — | — | |||
| Financials | 342,811,363 | 2,680,189 | — | |||
| Health care | 307,414,065 | — | — | |||
| Industrials | 197,077,421 | 4,539,667 | — | |||
| Information technology | 406,832,971 | — | — | |||
| Materials | 48,477,378 | 3,445,678 | — | |||
| Telecommunication services | 31,222,246 | — | — | |||
| Utilities | 36,535,347 | — | — | |||
| Total common stocks | 1,922,393,645 | 10,665,534 | 928,138 | |||
| Convertible preferred stocks | — | 10,990,549 | — | |||
| Short-term investments | 15,773,109 | 48,264,600 | — | |||
| Totals by level | $1,938,166,754 | $69,920,683 | $928,138 | |||
* Common stock classifications are presented at the sector level, which may differ from the fund’s portfolio presentation.
During the reporting period, transfers within the fair value hierarchy, if any, (other than certain transfers involving non-U.S. equity securities as described in Note 1) did not represent, in the aggregate, more than 1% of the fund’s net assets measured as of the end of the period.
At the start and close of the reporting period, Level 3 investments in securities represented less than 1% of the fund’s net assets and were not considered a significant portion of the fund’s portfolio.
The accompanying notes are an integral part of these financial statements.
| Investors Fund | 33 |
Statement of assets and liabilities 7/31/15
| ASSETS | |
| Investment in securities, at value, including $46,917,056 of securities on loan (Note 1): | |
| Unaffiliated issuers (identified cost $1,602,749,211) | $1,944,977,866 |
| Affiliated issuers (identified cost $64,037,709) (Notes 1 and 5) | 64,037,709 |
| Dividends, interest and other receivables | 1,933,322 |
| Receivable for shares of the fund sold | 1,270,451 |
| Receivable for investments sold | 5,636,767 |
| Prepaid assets | 52,386 |
| Total assets | 2,017,908,501 |
| LIABILITIES | |
| Payable for investments purchased | 7,363,000 |
| Payable for shares of the fund repurchased | 1,411,394 |
| Payable for compensation of Manager (Note 2) | 910,319 |
| Payable for custodian fees (Note 2) | 11,347 |
| Payable for investor servicing fees (Note 2) | 599,677 |
| Payable for Trustee compensation and expenses (Note 2) | 822,320 |
| Payable for administrative services (Note 2) | 7,719 |
| Payable for distribution fees (Note 2) | 436,984 |
| Collateral on securities loaned, at value (Note 1) | 48,264,600 |
| Other accrued expenses | 254,384 |
| Total liabilities | 60,081,744 |
| Net assets | $1,957,826,757 |
| REPRESENTED BY | |
| Paid-in capital (Unlimited shares authorized) (Notes 1 and 4) | $2,052,128,294 |
| Undistributed net investment income (Note 1) | 15,005,544 |
| Accumulated net realized loss on investments and foreign currency transactions (Note 1) | (451,533,745) |
| Net unrealized appreciation of investments and assets and liabilities in foreign currencies | 342,226,664 |
| Total — Representing net assets applicable to capital shares outstanding | $1,957,826,757 |
(Continued on next page)
| 34 | Investors Fund |
Statement of assets and liabilities (Continued)
| COMPUTATION OF NET ASSET VALUE AND OFFERING PRICE | |
| Net asset value and redemption price per class A share | |
| ($1,590,907,329 divided by 70,829,168 shares) | $22.46 |
| Offering price per class A share (100/94.25 of $22.46)* | $23.83 |
| Net asset value and offering price per class B share ($42,997,868 divided by 2,138,842 shares)** | $20.10 |
| Net asset value and offering price per class C share ($52,356,851 divided by 2,472,185 shares)** | $21.18 |
| Net asset value and redemption price per class M share ($23,661,489 divided by 1,120,207 shares) | $21.12 |
| Offering price per class M share (100/96.50 of $21.12)* | $21.89 |
| Net asset value, offering price and redemption price per class R share | |
| ($4,559,133 divided by 206,577 shares) | $22.07 |
| Net asset value, offering price and redemption price per class R5 share | |
| ($17,007 divided by 743 shares)† | $22.90 |
| Net asset value, offering price and redemption price per class R6 share | |
| ($19,178,337 divided by 837,351 shares) | $22.90 |
| Net asset value, offering price and redemption price per class Y share | |
| ($224,148,743 divided by 9,827,192 shares) | $22.81 |
* On single retail sales of less than $50,000. On sales of $50,000 or more the offering price is reduced.
** Redemption price per share is equal to net asset value less any applicable contingent deferred sales charge.
† Net asset value may not recalculate due to rounding of fractional shares.
The accompanying notes are an integral part of these financial statements.
| Investors Fund | 35 |
Statement of operations Year ended 7/31/15
| INVESTMENT INCOME | |
| Dividends (net of foreign tax of $128,846) | $35,284,067 |
| Interest (including interest income of $13,042 from investments in affiliated issuers) (Note 5) | 13,042 |
| Securities lending (Note 1) | 639,450 |
| Total investment income | 35,936,559 |
| EXPENSES | |
| Compensation of Manager (Note 2) | 10,137,791 |
| Investor servicing fees (Note 2) | 3,524,094 |
| Custodian fees (Note 2) | 32,151 |
| Trustee compensation and expenses (Note 2) | 70,926 |
| Distribution fees (Note 2) | 5,097,964 |
| Administrative services (Note 2) | 48,662 |
| Other | 586,256 |
| Total expenses | 19,497,844 |
| Expense reduction (Note 2) | (54,505) |
| Net expenses | 19,443,339 |
| Net investment income | 16,493,220 |
| Net realized gain on investments (Notes 1 and 3) | 132,187,412 |
| Net realized loss on foreign currency transactions (Note 1) | (4,281) |
| Net unrealized depreciation of assets and liabilities in foreign currencies during the year | (1,716) |
| Net unrealized appreciation of investments during the year | 9,995,292 |
| Net gain on investments | 142,176,707 |
| Net increase in net assets resulting from operations | $158,669,927 |
The accompanying notes are an integral part of these financial statements.
| 36 | Investors Fund |
Statement of changes in net assets
| INCREASE IN NET ASSETS | Year ended 7/31/15 | Year ended 7/31/14 |
| Operations: | ||
| Net investment income | $16,493,220 | $17,159,906 |
| Net realized gain on investments | ||
| and foreign currency transactions | 132,183,131 | 186,142,441 |
| Net unrealized appreciation of investments and assets | ||
| and liabilities in foreign currencies | 9,993,576 | 76,151,329 |
| Net increase in net assets resulting from operations | 158,669,927 | 279,453,676 |
| Distributions to shareholders (Note 1): | ||
| From ordinary income | ||
| Net investment income | ||
| Class A | (14,318,680) | (15,977,939) |
| Class B | (127,600) | (277,220) |
| Class C | (173,070) | (191,363) |
| Class M | (116,965) | (163,349) |
| Class R | (30,106) | (31,904) |
| Class R5 | (193) | (199) |
| Class R6 | (211,123) | (217,723) |
| Class Y | (1,130,271) | (726,120) |
| Increase (decrease) from capital share transactions (Note 4) | 111,357,043 | (95,692,631) |
| Total increase in net assets | 253,918,962 | 166,175,228 |
| NET ASSETS | ||
| Beginning of year | 1,703,907,795 | 1,537,732,567 |
| End of year (including undistributed net investment income | ||
| of $15,005,544 and $15,430,221, respectively) | $1,957,826,757 | $1,703,907,795 |
The accompanying notes are an integral part of these financial statements.
| Investors Fund | 37 |
Financial highlights (For a common share outstanding throughout the period)
| INVESTMENT OPERATIONS: | LESS DISTRIBUTIONS: | RATIOS AND SUPPLEMENTAL DATA: | |||||||||||
| Ratio of net | |||||||||||||
| Ratio | investment | ||||||||||||
| Net asset | Net realized | Non- | of expenses | income (loss) | |||||||||
| value, | and unrealized | Total from | From | recurring | Net asset | Total return | Net assets, | to average | to average | Portfolio | |||
| beginning | Net investment | gain (loss) | investment | net investment | Total | reimburse- | value, end | at net asset | end of period | net assets | net assets | turnover | |
| Period ended | of period | income (loss) a | on investments | operations | income | distributions | ments | of period | value (%) b | (in thousands) | (%) c | (%) | (%) |
| Class A | |||||||||||||
| July 31, 2015 | $20.73 | .20 | 1.73 | 1.93 | (.20) | (.20) | — | $22.46 | 9.32 | $1,590,907 | 1.03 | .92 | 44 |
| July 31, 2014 | 17.64 | .21 | 3.09 | 3.30 | (.21) | (.21) | — | 20.73 | 18.84 | 1,508,086 | 1.08 | 1.09 | 63 |
| July 31, 2013 | 13.89 | .20 | 3.70 | 3.90 | (.15) | (.15) | — | 17.64 | 28.29 | 1,364,640 | 1.14 | 1.28 | 77 |
| July 31, 2012 | 13.12 | .14 | .76 | .90 | (.13) | (.13) | — d,e | 13.89 | 6.95 | 1,191,455 | 1.20 | 1.11 | 49 |
| July 31, 2011 | 11.15 | .11 | 1.95 | 2.06 | (.09) | (.09) | — d,f | 13.12 | 18.54 | 1,264,410 | 1.18 | .86 | 65 |
| Class B | |||||||||||||
| July 31, 2015 | $18.58 | .03 | 1.54 | 1.57 | (.05) | (.05) | — | $20.10 | 8.46 | $42,998 | 1.78 | .18 | 44 |
| July 31, 2014 | 15.84 | .06 | 2.77 | 2.83 | (.09) | (.09) | — | 18.58 | 17.93 | 47,935 | 1.83 | .35 | 63 |
| July 31, 2013 | 12.48 | .08 | 3.32 | 3.40 | (.04) | (.04) | — | 15.84 | 27.35 | 51,200 | 1.89 | .55 | 77 |
| July 31, 2012 | 11.79 | .04 | .68 | .72 | (.03) | (.03) | — d,e | 12.48 | 6.09 | 52,017 | 1.95 | .38 | 49 |
| July 31, 2011 | 10.01 | .01 | 1.77 | 1.78 | — | — | — d,f | 11.79 | 17.78 | 66,615 | 1.93 | .12 | 65 |
| Class C | |||||||||||||
| July 31, 2015 | $19.59 | .03 | 1.64 | 1.67 | (.08) | (.08) | — | $21.18 | 8.51 | $52,357 | 1.78 | .16 | 44 |
| July 31, 2014 | 16.70 | .06 | 2.93 | 2.99 | (.10) | (.10) | — | 19.59 | 17.93 | 40,199 | 1.83 | .33 | 63 |
| July 31, 2013 | 13.16 | .08 | 3.50 | 3.58 | (.04) | (.04) | — | 16.70 | 27.31 | 34,080 | 1.89 | .53 | 77 |
| July 31, 2012 | 12.43 | .04 | .72 | .76 | (.03) | (.03) | — d,e | 13.16 | 6.14 | 30,509 | 1.95 | .37 | 49 |
| July 31, 2011 | 10.56 | .01 | 1.87 | 1.88 | (.01) | (.01) | — d,f | 12.43 | 17.76 | 33,041 | 1.93 | .11 | 65 |
| Class M | |||||||||||||
| July 31, 2015 | $19.52 | .09 | 1.61 | 1.70 | (.10) | (.10) | — | $21.12 | 8.73 | $23,661 | 1.53 | .42 | 44 |
| July 31, 2014 | 16.63 | .11 | 2.91 | 3.02 | (.13) | (.13) | — | 19.52 | 18.26 | 22,649 | 1.58 | .59 | 63 |
| July 31, 2013 | 13.10 | .11 | 3.50 | 3.61 | (.08) | (.08) | — | 16.63 | 27.67 | 20,852 | 1.64 | .78 | 77 |
| July 31, 2012 | 12.38 | .08 | .70 | .78 | (.06) | (.06) | — d,e | 13.10 | 6.37 | 18,740 | 1.70 | .62 | 49 |
| July 31, 2011 | 10.52 | .04 | 1.86 | 1.90 | (.04) | (.04) | — d,f | 12.38 | 18.04 | 20,483 | 1.68 | .36 | 65 |
| Class R | |||||||||||||
| July 31, 2015 | $20.39 | .14 | 1.70 | 1.84 | (.16) | (.16) | — | $22.07 | 9.03 | $4,559 | 1.28 | .66 | 44 |
| July 31, 2014 | 17.37 | .16 | 3.04 | 3.20 | (.18) | (.18) | — | 20.39 | 18.53 | 3,641 | 1.33 | .83 | 63 |
| July 31, 2013 | 13.68 | .15 | 3.66 | 3.81 | (.12) | (.12) | — | 17.37 | 28.03 | 2,871 | 1.39 | 1.00 | 77 |
| July 31, 2012 | 12.95 | .11 | .73 | .84 | (.11) | (.11) | — d,e | 13.68 | 6.59 | 2,053 | 1.45 | .86 | 49 |
| July 31, 2011 | 11.00 | .08 | 1.94 | 2.02 | (.07) | (.07) | — d,f | 12.95 | 18.35 | 1,423 | 1.43 | .60 | 65 |
| Class R5 | |||||||||||||
| July 31, 2015 | $21.12 | .27 | 1.77 | 2.04 | (.26) | (.26) | — | $22.90 | 9.69 | $17 | .74 | 1.21 | 44 |
| July 31, 2014 | 17.97 | .28 | 3.15 | 3.43 | (.28) | (.28) | — | 21.12 | 19.21 | 16 | .76 | 1.40 | 63 |
| July 31, 2013 | 14.10 | .26 | 3.77 | 4.03 | (.16) | (.16) | — | 17.97 | 28.85 | 13 | .76 | 1.64 | 77 |
| July 31, 2012 † | 13.97 | .01 | .12 | .13 | — | — | — | 14.10 | .93* | 10 | .06* | .08 * | 49 |
| Class R6 | |||||||||||||
| July 31, 2015 | $21.13 | .29 | 1.76 | 2.05 | (.28) | (.28) | — | $22.90 | 9.74 | $19,178 | .64 | 1.31 | 44 |
| July 31, 2014 | 17.98 | .30 | 3.15 | 3.45 | (.30) | (.30) | — | 21.13 | 19.32 | 15,633 | .66 | 1.51 | 63 |
| July 31, 2013 | 14.10 | .23 g | 3.82 | 4.05 | (.17) | (.17) | — | 17.98 | 28.98 | 13,890 | .66 | 1.32 g | 77 |
| July 31, 2012 † | 13.97 | .01 | .12 | .13 | — | — | — | 14.10 | .93* | 10 | .05* | .08 * | 49 |
| Class Y | |||||||||||||
| July 31, 2015 | $21.06 | .25 | 1.76 | 2.01 | (.26) | (.26) | — | $22.81 | 9.57 | $224,149 | .78 | 1.10 | 44 |
| July 31, 2014 | 17.91 | .26 | 3.14 | 3.40 | (.25) | (.25) | — | 21.06 | 19.15 | 65,749 | .83 | 1.33 | 63 |
| July 31, 2013 | 14.10 | .24 | 3.76 | 4.00 | (.19) | (.19) | — | 17.91 | 28.63 | 50,187 | .89 | 1.54 | 77 |
| July 31, 2012 | 13.32 | .18 | .76 | .94 | (.16) | (.16) | — d,e | 14.10 | 7.21 | 44,865 | .95 | 1.35 | 49 |
| July 31, 2011 | 11.32 | .14 | 1.98 | 2.12 | (.12) | (.12) | — d,f | 13.32 | 18.82 | 40,316 | .93 | 1.10 | 65 |
See notes to financial highlights at the end of this section.
The accompanying notes are an integral part of these financial statements.
| 38 | Investors Fund | Investors Fund | 39 |
Financial highlights (Continued)
* Not annualized.
† For the period July 3, 2012 (commencement of operations) to July 31, 2012.
a Per share net investment income (loss) has been determined on the basis of the weighted average number of shares outstanding during the period.
b Total return assumes dividend reinvestment and does not reflect the effect of sales charges.
c Includes amounts paid through expense offset and/or brokerage/service arrangements, if any (Note 2). Also excludes acquired fund fees and expenses, if any.
d Amount represents less than $0.01 per share.
e Reflects a non-recurring reimbursement pursuant to a settlement between the Securities and Exchange Commission (the SEC) and Southwest Securities, Inc. (SWS) which amounted to less than $0.01 per share outstanding on August 22, 2011.
f Reflects a non-recurring reimbursement related to restitution payments in connection with a distribution plan approved by the SEC which amounted to less than $0.01 per share outstanding on July 21, 2011. Also reflects a non-recurring reimbursement related to short-term trading related lawsuits, which amounted to less than $0.01 per share outstanding on May 11, 2011.
g The net investment income ratio and per share amount shown for the period ending may not correspond with the expected class specific differences for the period due to the timing of subscriptions into the class.
The accompanying notes are an integral part of these financial statements.
| 40 | Investors Fund |
Notes to financial statements 7/31/15
Within the following Notes to financial statements, references to “State Street” represent State Street Bank and Trust Company, references to “the SEC” represent the Securities and Exchange Commission, references to “Putnam Management” represent Putnam Investment Management, LLC, the fund’s manager, an indirect wholly-owned subsidiary of Putnam Investments, LLC and references to “OTC”, if any, represent over-the-counter. Unless otherwise noted, the “reporting period” represents the period from August 1, 2014 through July 31, 2015.
Putnam Investors Fund (the fund) is a Massachusetts business trust, which is registered under the Investment Company Act of 1940, as amended, as a diversified open-end management investment company. The goal of the fund is to seek long-term growth of capital and any increased income that results from this growth. The fund invests mainly in common stocks (growth or value stocks or both) of large U.S. companies that Putnam Management believes have favorable investment potential. For example, the fund may purchase stocks of companies with stock prices that reflect a value lower than that which Putnam Management places on the company. Putnam Management may also consider other factors that Putnam Management believes will cause the stock price to rise and may consider, among other factors, a company’s valuation, financial strength, growth potential, competitive position in its industry, projected future earnings, cash flows and dividends when deciding whether to buy or sell investments.
The fund offers class A, class B, class C, class M, class R, class R5, class R6 and class Y shares. Class A and class M shares are sold with a maximum front-end sales charge of 5.75% and 3.50%, respectively, and generally do not pay a contingent deferred sales charge. Class B shares, which convert to class A shares after approximately eight years, do not pay a front-end sales charge and are subject to a contingent deferred sales charge if those shares are redeemed within six years of purchase. Class C shares have a one-year 1.00% contingent deferred sales charge and do not convert to class A shares. Class R shares, which are not available to all investors, are sold at net asset value. The expenses for class A, class B, class C, class M and class R shares may differ based on the distribution fee of each class, which is identified in Note 2. Class R5, class R6 and class Y shares, which are sold at net asset value, are generally subject to the same expenses as class A, class B, class C, class M and class R shares, but do not bear a distribution fee and in the case of class R5 and class R6 shares, bear a lower investor servicing fee, which is identified in Note 2. Class R5, class R6 and class Y shares are not available to all investors.
In the normal course of business, the fund enters into contracts that may include agreements to indemnify another party under given circumstances. The fund’s maximum exposure under these arrangements is unknown as this would involve future claims that may be, but have not yet been, made against the fund. However, the fund’s management team expects the risk of material loss to be remote.
Note 1: Significant accounting policies
The following is a summary of significant accounting policies consistently followed by the fund in the preparation of its financial statements. The preparation of financial statements is in conformity with accounting principles generally accepted in the United States of America and requires management to make estimates and assumptions that affect the reported amounts of assets and liabilities in the financial statements and the reported amounts of increases and decreases in net assets from operations. Actual results could differ from those estimates. Subsequent events after the Statement of assets and liabilities date through the date that the financial statements were issued have been evaluated in the preparation of the financial statements.
Investment income, realized and unrealized gains and losses and expenses of the fund are borne pro-rata based on the relative net assets of each class to the total net assets of the fund, except that each class bears expenses unique to that class (including the distribution fees applicable to such classes). Each class votes as a class only with respect to its own distribution plan or other matters on which a class vote is required by law or determined by the Trustees. If the fund were liquidated, shares of each class would receive their pro-rata share of the net assets of the fund. In addition, the Trustees declare separate dividends on each class of shares.
Security valuation Portfolio securities and other investments are valued using policies and procedures adopted by the Board of Trustees. The Trustees have formed a Pricing Committee to oversee the implementation of these procedures and have delegated responsibility for valuing the fund’s assets in accordance with these procedures to Putnam Management. Putnam Management has established an internal Valuation Committee that is responsible for making fair value determinations, evaluating the effectiveness of the pricing policies of the fund and reporting to the Pricing Committee.
Investments for which market quotations are readily available are valued at the last reported sales price on their principal exchange, or official closing price for certain markets, and are classified as Level 1 securities under
| Investors Fund | 41 |
Accounting Standards Codification 820 Fair Value Measurements and Disclosures (ASC 820). If no sales are reported, as in the case of some securities that are traded OTC, a security is valued at its last reported bid price and is generally categorized as a Level 2 security.
Investments in open-end investment companies (excluding exchange-traded funds), if any, which can be classified as Level 1 or Level 2 securities, are valued based on their net asset value. The net asset value of such investment companies equals the total value of their assets less their liabilities and divided by the number of their outstanding shares.
Many securities markets and exchanges outside the U.S. close prior to the close of the New York Stock Exchange and therefore the closing prices for securities in such markets or on such exchanges may not fully reflect events that occur after such close but before the close of the New York Stock Exchange. Accordingly, on certain days, the fund will fair value foreign equity securities taking into account multiple factors including movements in the U.S. securities markets, currency valuations and comparisons to the valuation of American Depository Receipts, exchange-traded funds and futures contracts. These securities, which would generally be classified as Level 1 securities, will be transferred to Level 2 of the fair value hierarchy when they are valued at fair value. The number of days on which fair value prices will be used will depend on market activity and it is possible that fair value prices will be used by the fund to a significant extent. At the close of the reporting period, fair value pricing was used for certain foreign securities in the portfolio. Securities quoted in foreign currencies, if any, are translated into U.S. dollars at the current exchange rate. Short-term securities with remaining maturities of 60 days or less may be valued at amortized cost, which approximates fair value, and are classified as Level 2 securities.
To the extent a pricing service or dealer is unable to value a security or provides a valuation that Putnam Management does not believe accurately reflects the security’s fair value, the security will be valued at fair value by Putnam Management in accordance with policies and procedures approved by the Trustees. Certain investments, including certain restricted and illiquid securities and derivatives, are also valued at fair value following procedures approved by the Trustees. These valuations consider such factors as significant market or specific security events such as interest rate or credit quality changes, various relationships with other securities, discount rates, U.S. Treasury, U.S. swap and credit yields, index levels, convexity exposures, recovery rates, sales and other multiples and resale restrictions. These securities are classified as Level 2 or as Level 3 depending on the priority of the significant inputs.
To assess the continuing appropriateness of fair valuations, the Valuation Committee reviews and affirms the reasonableness of such valuations on a regular basis after considering all relevant information that is reasonably available. Such valuations and procedures are reviewed periodically by the Trustees. The fair value of securities is generally determined as the amount that the fund could reasonably expect to realize from an orderly disposition of such securities over a reasonable period of time. By its nature, a fair value price is a good faith estimate of the value of a security in a current sale and does not reflect an actual market price, which may be different by a material amount.
Security transactions and related investment income Security transactions are recorded on the trade date (the date the order to buy or sell is executed). Gains or losses on securities sold are determined on the identified cost basis.
Interest income, net of any applicable withholding taxes, is recorded on the accrual basis. Dividend income, net of any applicable withholding taxes, is recognized on the ex-dividend date except that certain dividends from foreign securities, if any, are recognized as soon as the fund is informed of the ex-dividend date. Non-cash dividends, if any, are recorded at the fair value of the securities received. Dividends representing a return of capital or capital gains, if any, are reflected as a reduction of cost and/or as a realized gain.
Foreign currency translation The accounting records of the fund are maintained in U.S. dollars. The fair value of foreign securities, currency holdings, and other assets and liabilities is recorded in the books and records of the fund after translation to U.S. dollars based on the exchange rates on that day. The cost of each security is determined using historical exchange rates. Income and withholding taxes are translated at prevailing exchange rates when earned or incurred. The fund does not isolate that portion of realized or unrealized gains or losses resulting from changes in the foreign exchange rate on investments from fluctuations arising from changes in the market prices of the securities. Such gains and losses are included with the net realized and unrealized gain or loss on investments. Net realized gains and losses on foreign currency transactions represent net realized exchange gains or losses on closed forward currency contracts, disposition of foreign currencies, currency gains and losses realized between the trade and settlement dates on securities transactions and the difference between the amount of investment income and foreign withholding taxes recorded on the fund’s books and the U.S. dollar equivalent amounts actually received or paid. Net unrealized appreciation and depreciation of assets and liabilities in foreign
| 42 | Investors Fund |
currencies arise from changes in the value of open forward currency contracts and assets and liabilities other than investments at the period end, resulting from changes in the exchange rate.
Securities lending The fund may lend securities, through its agent, to qualified borrowers in order to earn additional income. The loans are collateralized by cash in an amount at least equal to the fair value of the securities loaned. The fair value of securities loaned is determined daily and any additional required collateral is allocated to the fund on the next business day. The risk of borrower default will be borne by the fund’s agent; the fund will bear the risk of loss with respect to the investment of the cash collateral. Income from securities lending is included in investment income on the Statement of operations. Cash collateral is invested in Putnam Cash Collateral Pool, LLC, a limited liability company managed by an affiliate of Putnam Management. Investments in Putnam Cash Collateral Pool, LLC are valued at its closing net asset value each business day. There are no management fees charged to Putnam Cash Collateral Pool, LLC. At the close of the reporting period, the fund received cash collateral of $48,264,600 and the value of securities loaned amounted to $46,917,056.
Interfund lending The fund, along with other Putnam funds, may participate in an interfund lending program pursuant to an exemptive order issued by the SEC. This program allows the fund to borrow from or lend to other Putnam funds that permit such transactions. Interfund lending transactions are subject to each fund’s investment policies and borrowing and lending limits. Interest earned or paid on the interfund lending transaction will be based on the average of certain current market rates. During the reporting period, the fund did not utilize the program.
Lines of credit The fund participates, along with other Putnam funds, in a $392.5 million unsecured committed line of credit and a $235.5 million unsecured uncommitted line of credit, both provided by State Street. Borrowings may be made for temporary or emergency purposes, including the funding of shareholder redemption requests and trade settlements. Interest is charged to the fund based on the fund’s borrowing at a rate equal to the Federal Funds rate plus 1.25% for the committed line of credit and the Federal Funds rate plus 1.30% for the uncommitted line of credit. A closing fee equal to 0.04% of the committed line of credit and 0.04% of the uncommitted line of credit has been paid by the participating funds. In addition, a commitment fee of 0.11% per annum on any unutilized portion of the committed line of credit is allocated to the participating funds based on their relative net assets and paid quarterly. During the reporting period, the fund had no borrowings against these arrangements.
Federal taxes It is the policy of the fund to distribute all of its taxable income within the prescribed time period and otherwise comply with the provisions of the Internal Revenue Code of 1986, as amended (the Code), applicable to regulated investment companies. It is also the intention of the fund to distribute an amount sufficient to avoid imposition of any excise tax under Section 4982 of the Code.
The fund is subject to the provisions of Accounting Standards Codification 740 Income Taxes (ASC 740). ASC 740 sets forth a minimum threshold for financial statement recognition of the benefit of a tax position taken or expected to be taken in a tax return. The fund did not have a liability to record for any unrecognized tax benefits in the accompanying financial statements. No provision has been made for federal taxes on income, capital gains or unrealized appreciation on securities held nor for excise tax on income and capital gains. Each of the fund’s federal tax returns for the prior three fiscal years remains subject to examination by the Internal Revenue Service.
The fund may also be subject to taxes imposed by governments of countries in which it invests. Such taxes are generally based on either income or gains earned or repatriated. The fund accrues and applies such taxes to net investment income, net realized gains and net unrealized gains as income and/or capital gains are earned. In some cases, the fund may be entitled to reclaim all or a portion of such taxes, and such reclaim amounts, if any, are reflected as an asset on the fund’s books. In many cases, however, the fund may not receive such amounts for an extended period of time, depending on the country of investment.
At July 31, 2015, the fund had a capital loss carryover of $450,535,183 available to the extent allowed by the Code to offset future net capital gain, if any. The amounts of the carryovers and the expiration dates are:
| Loss carryover | |||
| Short-term | Long-term | Total | Expiration |
| $12,333,142 | N/A | $12,333,142 | July 31, 2016 |
| 179,561,301 | N/A | 179,561,301 | July 31, 2017 |
| 258,640,740 | N/A | 258,640,740 | July 31, 2018 |
Under the Regulated Investment Company Modernization Act of 2010, the fund will be permitted to carry forward capital losses incurred in taxable years beginning after December 22, 2010 for an unlimited period. However, any
| Investors Fund | 43 |
losses incurred will be required to be utilized prior to the losses incurred in pre-enactment tax years. As a result of this ordering rule, pre-enactment capital loss carryforwards may be more likely to expire unused. Additionally, post-enactment capital losses that are carried forward will retain their character as either short-term or long-term capital losses rather than being considered all short-term as under previous law.
Distributions to shareholders Distributions to shareholders from net investment income are recorded by the fund on the ex-dividend date. Distributions from capital gains, if any, are recorded on the ex-dividend date and paid at least annually. The amount and character of income and gains to be distributed are determined in accordance with income tax regulations, which may differ from generally accepted accounting principles. These differences include temporary and/or permanent differences from losses on wash sale transactions and from partnership income. Reclassifications are made to the fund’s capital accounts to reflect income and gains available for distribution (or available capital loss carryovers) under income tax regulations. At the close of the reporting period, the fund reclassified $809,889 to decrease undistributed net investment income, $4,482 to decrease paid-in-capital and $814,371 to decrease accumulated net realized loss.
The tax basis components of distributable earnings and the federal tax cost as of the close of the reporting period were as follows:
| Unrealized appreciation | $438,306,900 |
| Unrealized depreciation | (97,076,807) |
| Net unrealized appreciation | 341,230,093 |
| Undistributed ordinary income | 15,005,544 |
| Capital loss carryforward | (450,535,183) |
| Cost for federal income tax purposes | $1,667,785,482 |
Note 2: Management fee, administrative services and other transactions
The fund pays Putnam Management a management fee (based on the fund’s average net assets and computed and paid monthly) at annual rates that may vary based on the average of the aggregate net assets of most open-end funds, as defined in the fund’s management contract, sponsored by Putnam Management. Such annual rates may vary as follows:
| 0.710% | of the first $5 billion, | 0.510% | of the next $50 billion, | |
| 0.660% | of the next $5 billion, | 0.490% | of the next $50 billion, | |
| 0.610% | of the next $10 billion, | 0.480% | of the next $100 billion and | |
| 0.560% | of the next $10 billion, | 0.475% | of any excess thereafter. | |
Putnam Management has contractually agreed, through November 30, 2016, to waive fees or reimburse the fund’s expenses to the extent necessary to limit the cumulative expenses of the fund, exclusive of brokerage, interest, taxes, investment-related expenses, extraordinary expenses, acquired fund fees and expenses and payments under the fund’s investor servicing contract, investment management contract and distribution plans, on a fiscal year-to-date basis to an annual rate of 0.20% of the fund’s average net assets over such fiscal year-to-date period. During the reporting period, the fund’s expenses were not reduced as a result of this limit.
Putnam Investments Limited (PIL), an affiliate of Putnam Management, is authorized by the Trustees to manage a separate portion of the assets of the fund as determined by Putnam Management from time to time. Putnam Management pays a quarterly sub-management fee to PIL for its services at an annual rate of 0.35% of the average net assets of the portion of the fund managed by PIL.
The fund reimburses Putnam Management an allocated amount for the compensation and related expenses of certain officers of the fund and their staff who provide administrative services to the fund. The aggregate amount of all such reimbursements is determined annually by the Trustees.
Custodial functions for the fund’s assets are provided by State Street. Custody fees are based on the fund’s asset level, the number of its security holdings and transaction volumes.
Putnam Investor Services, Inc., an affiliate of Putnam Management, provides investor servicing agent functions to the fund. Putnam Investor Services, Inc. received fees for investor servicing (except for class R5 and R6 shares) that included (1) a per account fee for each direct and underlying non-defined contribution account (“retail account”) of the fund and each of the other funds in its specified category, which was totaled and then allocated to each fund in the category based on its average daily net assets; (2) a specified rate of the fund’s assets attributable to
| 44 | Investors Fund |
defined contribution plan accounts; and (3) for the portion of the fund’s fiscal year beginning after January 1, 2015, a specified rate based on the average net assets in retail accounts. Putnam Investor Services has agreed that the aggregate investor servicing fees for each fund’s retail and defined contribution accounts will not exceed an annual rate of 0.320% of the fund’s average assets attributable to such accounts. Class R5 shares paid a monthly fee based on the average net assets of class R5 shares at an annual rate of 0.15%. Class R6 shares paid a monthly fee based on the average net assets of class R6 shares at an annual rate of 0.05%. During the reporting period, the expenses for each class of shares related to investor servicing fees were as follows:
| Class A | $3,039,902 | Class R5 | 25 | |
| Class B | 89,020 | Class R6 | 8,648 | |
| Class C | 91,525 | Class Y | 241,702 | |
| Class M | 44,949 | Total | $3,524,094 | |
| Class R | 8,323 | |||
The fund has entered into expense offset arrangements with Putnam Investor Services, Inc. and State Street whereby Putnam Investor Services, Inc.’s and State Street’s fees are reduced by credits allowed on cash balances. The fund also reduced expenses through brokerage/service arrangements. For the reporting period, the fund’s expenses were reduced by $3,907 under the expense offset arrangements and by $50,598 under the brokerage/service arrangements.
Each Independent Trustee of the fund receives an annual Trustee fee, of which $1,126, as a quarterly retainer, has been allocated to the fund, and an additional fee for each Trustees meeting attended. Trustees also are reimbursed for expenses they incur relating to their services as Trustees.
The fund has adopted a Trustee Fee Deferral Plan (the Deferral Plan) which allows the Trustees to defer the receipt of all or a portion of Trustees fees payable on or after July 1, 1995. The deferred fees remain invested in certain Putnam funds until distribution in accordance with the Deferral Plan.
The fund has adopted an unfunded noncontributory defined benefit pension plan (the Pension Plan) covering all Trustees of the fund who have served as a Trustee for at least five years and were first elected prior to 2004. Benefits under the Pension Plan are equal to 50% of the Trustee’s average annual attendance and retainer fees for the three years ended December 31, 2005. The retirement benefit is payable during a Trustee’s lifetime, beginning the year following retirement, for the number of years of service through December 31, 2006. Pension expense for the fund is included in Trustee compensation and expenses in the Statement of operations. Accrued pension liability is included in Payable for Trustee compensation and expenses in the Statement of assets and liabilities. The Trustees have terminated the Pension Plan with respect to any Trustee first elected after 2003.
The fund has adopted distribution plans (the Plans) with respect to its class A, class B, class C, class M and class R shares pursuant to Rule 12b–1 under the Investment Company Act of 1940. The purpose of the Plans is to compensate Putnam Retail Management Limited Partnership, an indirect wholly-owned subsidiary of Putnam Investments, LLC, for services provided and expenses incurred in distributing shares of the fund. The Plans provide for payments by the fund to Putnam Retail Management Limited Partnership at an annual rate of up to 0.35%, 1.00%, 1.00%, 1.00% and 1.00% of the average net assets attributable to class A, class B, class C, class M and class R shares, respectively. The Trustees have approved payment by the fund at an annual rate of 0.25%, 1.00%, 1.00%, 0.75% and 0.50% of the average net assets attributable to class A, class B, class C, class M and class R shares, respectively. During the reporting period, the class specific expenses related to distribution fees were as follows:
| Class A | $3,959,518 | Class M | 175,630 | |
| Class B | 463,135 | Class R | 21,713 | |
| Class C | 477,968 | Total | $5,097,964 | |
For the reporting period, Putnam Retail Management Limited Partnership, acting as underwriter, received net commissions of $123,415 and $2,858 from the sale of class A and class M shares, respectively, and received $21,327 and $1,779 in contingent deferred sales charges from redemptions of class B and class C shares, respectively.
A deferred sales charge of up to 1.00% and 0.65% is assessed on certain redemptions of class A and class M shares, respectively. For the reporting period, Putnam Retail Management Limited Partnership, acting as underwriter, received $2 and no monies on class A and class M redemptions, respectively.
| Investors Fund | 45 |
Note 3: Purchases and sales of securities
During the reporting period, the cost of purchases and the proceeds from sales, excluding short-term investments, were as follows:
| Cost of purchases | Proceeds from sales | |
| Investments in securities (Long-term) | $945,208,178 | $813,516,301 |
| U.S. government securities (Long-term) | — | — |
| Total | $945,208,178 | $813,516,301 |
Note 4: Capital shares
At the close of the reporting period, there were an unlimited number of shares of beneficial interest authorized. Transactions in capital shares were as follows:
| Year ended 7/31/15 | Year ended 7/31/14 | |||
| Class A | Shares | Amount | Shares | Amount |
| Shares sold | 5,519,710 | $120,530,707 | 2,713,783 | $52,508,388 |
| Shares issued in connection with | ||||
| reinvestment of distributions | 595,846 | 13,156,274 | 775,256 | 14,652,339 |
| 6,115,556 | 133,686,981 | 3,489,039 | 67,160,727 | |
| Shares repurchased | (8,023,770) | (176,257,249) | (8,096,374) | (156,278,695) |
| Net decrease | (1,908,214) | $(42,570,268) | (4,607,335) | $(89,117,968) |
| Year ended 7/31/15 | Year ended 7/31/14 | |||
| Class B | Shares | Amount | Shares | Amount |
| Shares sold | 245,127 | $4,810,367 | 206,569 | $3,543,783 |
| Shares issued in connection with | ||||
| reinvestment of distributions | 6,208 | 123,296 | 15,642 | 266,227 |
| 251,335 | 4,933,663 | 222,211 | 3,810,010 | |
| Shares repurchased | (692,570) | (13,586,307) | (874,894) | (15,061,763) |
| Net decrease | (441,235) | $(8,652,644) | (652,683) | $(11,251,753) |
| Year ended 7/31/15 | Year ended 7/31/14 | |||
| Class C | Shares | Amount | Shares | Amount |
| Shares sold | 645,034 | $13,298,751 | 236,564 | $4,356,831 |
| Shares issued in connection with | ||||
| reinvestment of distributions | 7,367 | 154,200 | 9,943 | 178,478 |
| 652,401 | 13,452,951 | 246,507 | 4,535,309 | |
| Shares repurchased | (231,865) | (4,802,015) | (235,306) | (4,312,507) |
| Net increase | 420,536 | $8,650,936 | 11,201 | $222,802 |
| Year ended 7/31/15 | Year ended 7/31/14 | |||
| Class M | Shares | Amount | Shares | Amount |
| Shares sold | 65,505 | $1,359,216 | 36,892 | $665,650 |
| Shares issued in connection with | ||||
| reinvestment of distributions | 5,419 | 112,922 | 8,848 | 157,943 |
| 70,924 | 1,472,138 | 45,740 | 823,593 | |
| Shares repurchased | (111,183) | (2,291,904) | (139,014) | (2,508,628) |
| Net decrease | (40,259) | $(819,766) | (93,274) | $(1,685,035) |
| 46 | Investors Fund |
| Year ended 7/31/15 | Year ended 7/31/14 | |||
| Class R | Shares | Amount | Shares | Amount |
| Shares sold | 82,858 | $1,764,128 | 44,837 | $841,475 |
| Shares issued in connection with | ||||
| reinvestment of distributions | 1,247 | 27,108 | 1,621 | 30,160 |
| 84,105 | 1,791,236 | 46,458 | 871,635 | |
| Shares repurchased | (56,115) | (1,222,514) | (33,161) | (631,564) |
| Net increase | 27,990 | $568,722 | 13,297 | $240,071 |
| Year ended 7/31/15 | Year ended 7/31/14 | |||
| Class R5 | Shares | Amount | Shares | Amount |
| Shares sold | — | $— | — | $— |
| Shares issued in connection with | ||||
| reinvestment of distributions | 9 | 193 | 10 | 199 |
| 9 | 193 | 10 | 199 | |
| Shares repurchased | — | — | — | — |
| Net increase | 9 | $193 | 10 | $199 |
| Year ended 7/31/15 | Year ended 7/31/14 | |||
| Class R6 | Shares | Amount | Shares | Amount |
| Shares sold | 149,723 | $3,358,233 | 38,648 | $768,128 |
| Shares issued in connection with | ||||
| reinvestment of distributions | 9,400 | 211,123 | 11,334 | 217,723 |
| 159,123 | 3,569,356 | 49,982 | 985,851 | |
| Shares repurchased | (61,499) | (1,377,168) | (82,748) | (1,591,785) |
| Net increase (decrease) | 97,624 | $2,192,188 | (32,766) | $(605,934) |
| Year ended 7/31/15 | Year ended 7/31/14 | |||
| Class Y | Shares | Amount | Shares | Amount |
| Shares sold | 8,279,940 | $186,913,268 | 652,398 | $12,996,720 |
| Shares issued in connection with | ||||
| reinvestment of distributions | 47,319 | 1,059,464 | 36,575 | 700,770 |
| 8,327,259 | 187,972,732 | 688,973 | 13,697,490 | |
| Shares repurchased | (1,622,273) | (35,985,050) | (368,796) | (7,192,503) |
| Net increase | 6,704,986 | $151,987,682 | 320,177 | $6,504,987 |
At the close of the reporting period, Putnam Investments, LLC owned the following shares of the fund:
| Shares owned | Percentage of ownership | Value | |
| Class R5 | 743 | 100.00% | $17,007 |
| Class R6 | 744 | 0.09 | 17,038 |
| Investors Fund | 47 |
Note 5: Affiliated transactions
Transactions during the reporting period with Putnam Short Term Investment Fund, which is under common ownership and control, were as follows:
| Fair value at the | Fair value at | ||||
| beginning of | the end of | ||||
| the reporting | Investment | the reporting | |||
| Name of affiliate | period | Purchase cost | Sale proceeds | income | period |
| Putnam Short Term | |||||
| Investment Fund* | $6,519,342 | $301,434,134 | $292,180,367 | $13,042 | $15,773,109 |
* Management fees charged to Putnam Short Term Investment Fund have been waived by Putnam Management.
Note 6: Market, credit and other risks
In the normal course of business, the fund trades financial instruments and enters into financial transactions where risk of potential loss exists due to changes in the market (market risk) or failure of the contracting party to the transaction to perform (credit risk). The fund may be exposed to additional credit risk that an institution or other entity with which the fund has unsettled or open transactions will default. Investments in foreign securities involve certain risks, including those related to economic instability, unfavorable political developments, and currency fluctuations.
| 48 | Investors Fund |
Federal tax information (Unaudited)
The fund designated 100% of ordinary income distributions as qualifying for the dividends received deduction for corporations.
For the reporting period, the fund hereby designates 100%, or the maximum amount allowable, of its taxable ordinary income distributions as qualified dividends taxed at the individual net capital gain rates.
For the reporting period, pursuant to §871(k) of the Internal Revenue Code, the fund hereby designates $3,222 of distributions paid as qualifying to be taxed as interest-related dividends, and no monies to be taxed as short-term capital gain dividends for nonresident alien shareholders.
The Form 1099 that will be mailed to you in January 2016 will show the tax status of all distributions paid to your account in calendar 2015.
| Investors Fund | 49 |
About the Trustees
Independent Trustees

| 50 | Investors Fund |
* Mr. Reynolds is an “interested person” (as defined in the Investment Company Act of 1940) of the fund and Putnam Investments. He is President and Chief Executive Officer of Putnam Investments, as well as the President of your fund and each of the other Putnam funds.
The address of each Trustee is One Post Office Square, Boston, MA 02109.
As of July 31, 2015, there were 117 Putnam funds. All Trustees serve as Trustees of all Putnam funds.
Each Trustee serves for an indefinite term, until his or her resignation, retirement at age 75, removal, or death.
| Investors Fund | 51 |
Officers
In addition to Robert L. Reynolds, the other officers of the fund are shown below:
| Jonathan S. Horwitz (Born 1955) | Janet C. Smith (Born 1965) |
| Executive Vice President, Principal Executive | Vice President, Principal Accounting Officer, |
| Officer, and Compliance Liaison | and Assistant Treasurer |
| Since 2004 | Since 2007 |
| Director of Fund Administration Services, | |
| Steven D. Krichmar (Born 1958) | Putnam Investments and Putnam Management |
| Vice President and Principal Financial Officer | |
| Since 2002 | Susan G. Malloy (Born 1957) |
| Chief of Operations, Putnam Investments and | Vice President and Assistant Treasurer |
| Putnam Management | Since 2007 |
| Director of Accounting & Control Services, | |
| Robert T. Burns (Born 1961) | Putnam Investments and Putnam Management |
| Vice President and Chief Legal Officer | |
| Since 2011 | James P. Pappas (Born 1953) |
| General Counsel, Putnam Investments, Putnam | Vice President |
| Management, and Putnam Retail Management | Since 2004 |
| Director of Trustee Relations, | |
| Robert R. Leveille (Born 1969) | Putnam Investments and Putnam Management |
| Vice President and Chief Compliance Officer | |
| Since 2007 | Mark C. Trenchard (Born 1962) |
| Chief Compliance Officer, Putnam Investments, | Vice President and BSA Compliance Officer |
| Putnam Management, and Putnam Retail | Since 2002 |
| Management | Director of Operational Compliance, |
| Putnam Investments and Putnam | |
| Michael J. Higgins (Born 1976) | Retail Management |
| Vice President, Treasurer, and Clerk | |
| Since 2010 | Nancy E. Florek (Born 1957) |
| Manager of Finance, Dunkin’ Brands (2008– | Vice President, Director of Proxy Voting |
| 2010); Senior Financial Analyst, Old Mutual Asset | and Corporate Governance, Assistant Clerk, |
| Management (2007–2008); Senior Financial | and Associate Treasurer |
| Analyst, Putnam Investments (1999–2007) | Since 2000 |
The principal occupations of the officers for the past five years have been with the employers as shown above, although in some cases they have held different positions with such employers. The address of each officer is One Post Office Square, Boston, MA 02109.
| 52 | Investors Fund |
Fund information
Founded over 75 years ago, Putnam Investments was built around the concept that a balance between risk and reward is the hallmark of a well-rounded financial program. We manage over 100 funds across income, value, blend, growth, asset allocation, absolute return, and global sector categories.
| Investment Manager | Trustees | Robert R. Leveille |
| Putnam Investment | Jameson A. Baxter, Chair | Vice President and |
| Management, LLC | Liaquat Ahamed | Chief Compliance Officer |
| One Post Office Square | Ravi Akhoury | |
| Boston, MA 02109 | Barbara M. Baumann | Michael J. Higgins |
| Robert J. Darretta | Vice President, Treasurer, | |
| Investment Sub-Manager | Katinka Domotorffy | and Clerk |
| Putnam Investments Limited | John A. Hill | |
| 57–59 St James’s Street | Paul L. Joskow | Janet C. Smith |
| London, England SW1A 1LD | Kenneth R. Leibler | Vice President, |
| Robert E. Patterson | Principal Accounting Officer, | |
| Marketing Services | George Putnam, III | and Assistant Treasurer |
| Putnam Retail Management | Robert L. Reynolds | |
| One Post Office Square | W. Thomas Stephens | Susan G. Malloy |
| Boston, MA 02109 | Vice President and | |
| Officers | Assistant Treasurer | |
| Custodian | Robert L. Reynolds | |
| State Street Bank | President | James P. Pappas |
| and Trust Company | Vice President | |
| Jonathan S. Horwitz | ||
| Legal Counsel | Executive Vice President, | Mark C. Trenchard |
| Ropes & Gray LLP | Principal Executive Officer, and | Vice President and |
| Compliance Liaison | BSA Compliance Officer | |
| Independent Registered | ||
| Public Accounting Firm | Steven D. Krichmar | Nancy E. Florek |
| KPMG LLP | Vice President and | Vice President, Director of |
| Principal Financial Officer | Proxy Voting and Corporate | |
| Governance, Assistant Clerk, | ||
| Robert T. Burns | and Associate Treasurer | |
| Vice President and | ||
| Chief Legal Officer |
This report is for the information of shareholders of Putnam Investors Fund. It may also be used as sales literature when preceded or accompanied by the current prospectus, the most recent copy of Putnam’s Quarterly Performance Summary, and Putnam’s Quarterly Ranking Summary. For more recent performance, please visit putnam.com. Investors should carefully consider the investment objectives, risks, charges, and expenses of a fund, which are described in its prospectus. For this and other information or to request a prospectus or summary prospectus, call 1-800-225-1581 toll free. Please read the prospectus carefully before investing. The fund’s Statement of Additional Information contains additional information about the fund’s Trustees and is available without charge upon request by calling 1-800-225-1581.

| Item 2. Code of Ethics: |
| (a) The fund’s principal executive, financial and accounting officers are employees of Putnam Investment Management, LLC, the Fund’s investment manager. As such they are subject to a comprehensive Code of Ethics adopted and administered by Putnam Investments which is designed to protect the interests of the firm and its clients. The Fund has adopted a Code of Ethics which incorporates the Code of Ethics of Putnam Investments with respect to all of its officers and Trustees who are employees of Putnam Investment Management, LLC. For this reason, the Fund has not adopted a separate code of ethics governing its principal executive, financial and accounting officers. |
| Item 3. Audit Committee Financial Expert: |
| The Funds’ Audit, Compliance and Distributions Committee is comprised solely of Trustees who are “independent” (as such term has been defined by the Securities and Exchange Commission (“SEC”) in regulations implementing Section 407 of the Sarbanes-Oxley Act (the “Regulations”)). The Trustees believe that each of the members of the Audit, Compliance and Distributions Committee also possess a combination of knowledge and experience with respect to financial accounting matters, as well as other attributes, that qualify them for service on the Committee. In addition, the Trustees have determined that each of Mr. Darretta, Mr. Patterson, Mr. Hill, and Ms. Baumann qualifies as an “audit committee financial expert” (as such term has been defined by the Regulations) based on their review of his or her pertinent experience and education. The SEC has stated, and the funds’ amended and restated agreement and Declaration of Trust provides, that the designation or identification of a person as an audit committee financial expert pursuant to this Item 3 of Form N-CSR does not impose on such person any duties, obligations or liability that are greater than the duties, obligations and liability imposed on such person as a member of the Audit, Compliance and Distribution Committee and the Board of Trustees in the absence of such designation or identification. |
| Item 4. Principal Accountant Fees and Services: |
| The following table presents fees billed in each of the last two fiscal years for services rendered to the fund by the fund’s independent auditor: |
| Fiscal year ended | Audit Fees | Audit-Related Fees | Tax Fees | All Other Fees | |
| July 31, 2015 | $41,210 | $ — | $4,400 | $ — | |
| July 31, 2014 | $39,822 | $ — | $4,285 | $ — | |
| For the fiscal years ended July 31, 2015 and July 31, 2014, the fund’s independent auditor billed aggregate non-audit fees in the amounts of $4,400 and $4,285 respectively, to the fund, Putnam Management and any entity controlling, controlled by or under common control with Putnam Management that provides ongoing services to the fund. |
| Audit Fees represent fees billed for the fund’s last two fiscal years relating to the audit and review of the financial statements included in annual reports and registration statements, and other services that are normally provided in connection with statutory and regulatory filings or engagements. |
| Audit-Related Fees represent fees billed in the fund’s last two fiscal years for services traditionally performed by the fund’s auditor, including accounting consultation for proposed transactions or concerning financial accounting and reporting standards and other audit or attest services not required by statute or regulation. |
| Tax Fees represent fees billed in the fund’s last two fiscal years for tax compliance, tax planning and tax advice services. Tax planning and tax advice services include assistance with tax audits, employee benefit plans and requests for rulings or technical advice from taxing authorities. |
| All Other Fees represent fees billed for services relating to an analysis of fund profitability |
| Pre-Approval Policies of the Audit, Compliance and Distributions Committee. The Audit, Compliance and Distributions Committee of the Putnam funds has determined that, as a matter of policy, all work performed for the funds by the funds’ independent auditors will be pre-approved by the Committee itself and thus will generally not be subject to pre-approval procedures. |
| The Audit, Compliance and Distributions Committee also has adopted a policy to pre-approve the engagement by Putnam Management and certain of its affiliates of the funds’ independent auditors, even in circumstances where pre-approval is not required by applicable law. Any such requests by Putnam Management or certain of its affiliates are typically submitted in writing to the Committee and explain, among other things, the nature of the proposed engagement, the estimated fees, and why this work should be performed by that particular audit firm as opposed to another one. In reviewing such requests, the Committee considers, among other things, whether the provision of such services by the audit firm are compatible with the independence of the audit firm. |
| The following table presents fees billed by the fund’s independent auditor for services required to be approved pursuant to paragraph (c)(7)(ii) of Rule 2-01 of Regulation S-X. |
| Fiscal year ended | Audit-Related Fees | Tax Fees | All Other Fees | Total Non-Audit Fees | |
| July 31, 2015 | $ — | $ — | $ — | $ — | |
| July 31, 2014 | $ — | $ — | $ — | $ — | |
| Item 5. Audit Committee of Listed Registrants |
| Not applicable |
| Item 6. Schedule of Investments: |
| The registrant’s schedule of investments in unaffiliated issuers is included in the report to shareholders in Item 1 above. |
| Item 7. Disclosure of Proxy Voting Policies and Procedures For Closed-End Management Investment Companies: |
| Not applicable |
| Item 8. Portfolio Managers of Closed-End Investment Companies |
| Not Applicable |
| Item 9. Purchases of Equity Securities by Closed-End Management Investment Companies and Affiliated Purchasers: |
| Not applicable |
| Item 10. Submission of Matters to a Vote of Security Holders: |
| Not applicable |
| Item 11. Controls and Procedures: |
| (a) The registrant’s principal executive officer and principal financial officer have concluded, based on their evaluation of the effectiveness of the design and operation of the registrant’s disclosure controls and procedures as of a date within 90 days of the filing date of this report, that the design and operation of such procedures are generally effective to provide reasonable assurance that information required to be disclosed by the registrant in this report is recorded, processed, summarized and reported within the time periods specified in the Commission’s rules and forms. |
| (b) Changes in internal control over financial reporting: Not applicable |
| Item 12. Exhibits: |
| (a)(1) The Code of Ethics of The Putnam Funds, which incorporates the Code of Ethics of Putnam Investments, is filed herewith. |
| (a)(2) Separate certifications for the principal executive officer and principal financial officer of the registrant as required by Rule 30a-2(a) under the Investment Company Act of 1940, as amended, are filed herewith. |
| (b) The certifications required by Rule 30a-2(b) under the Investment Company Act of 1940, as amended, are filed herewith. |
| SIGNATURES |
| Pursuant to the requirements of the Securities Exchange Act of 1934 and the Investment Company Act of 1940, the registrant has duly caused this report to be signed on its behalf by the undersigned, thereunto duly authorized. |
| Putnam Investors Fund |
| By (Signature and Title): |
| /s/ Janet C. Smith Janet C. Smith Principal Accounting Officer |
| Date: September 28, 2015 |
| Pursuant to the requirements of the Securities Exchange Act of 1934 and the Investment Company Act of 1940, this report has been signed below by the following persons on behalf of the registrant and in the capacities and on the dates indicated. |
| By (Signature and Title): |
| /s/ Jonathan S. Horwitz Jonathan S. Horwitz Principal Executive Officer |
| Date: September 28, 2015 |
| By (Signature and Title): |
| /s/ Steven D. Krichmar Steven D. Krichmar Principal Financial Officer |
| Date: September 28, 2015 |