| | | |
| | |
| UNITED STATES |
| SECURITIES AND EXCHANGE COMMISSION |
| Washington, D.C. 20549 |
| |
| FORM N-CSR |
| |
| CERTIFIED SHAREHOLDER REPORT OF REGISTERED |
| MANAGEMENT INVESTMENT COMPANIES |
| | |
| Investment Company Act file number: (811- 01561) | |
| | |
| Exact name of registrant as specified in charter: | Putnam Vista Fund |
| |
| Address of principal executive offices: One Post Office Square, Boston, Massachusetts 02109 |
| | |
| Name and address of agent for service: | | Beth S. Mazor, Vice President |
| | One Post Office Square |
| | Boston, Massachusetts 02109 |
| | |
| Copy to: | | John W. Gerstmayr, Esq. |
| | Ropes & Gray LLP |
| | One International Place |
| | Boston, Massachusetts 02110 |
| | |
| Registrant’s telephone number, including area code: | (617) 292-1000 |
| | | |
| Date of fiscal year end: July 31, 2009 | | |
| |
| Date of reporting period: August 1, 2008 — January 31, 2009 |
Item 1. Report to Stockholders:
The following is a copy of the report transmitted to stockholders pursuant to Rule 30e-1 under the Investment Company Act of 1940:
Since 1937, when George Putnam created a prudent mix of stocks and bonds in a single, professionally managed portfolio, we have championed the wisdom of the balanced approach. Today, we offer investors a world of equity, fixed-income, multi-asset, and absolute-return portfolios so investors can pursue a range of financial goals. Our seasoned portfolio managers seek superior results over time, backed by original, fundamental research on a global scale. We believe in service excellence, in the value of experienced financial advice, and in putting clients first in everything we do.
In 1830, Massachusetts Supreme Judicial Court Justice Samuel Putnam established The Prudent Man Rule, a legal foundation for responsible money management.

THE PRUDENT MAN RULE
All that can be required of a trustee to invest is that he shall conduct himself faithfully and exercise a sound discretion. He is to observe how men of prudence, discretion, and intelligence manage their own affairs, not in regard to speculation, but in regard to the permanent disposition of their funds, considering the probable income, as well as the probable safety of the capital to be invested.

Putnam
Vista
Fund
1 | 31 | 09
Semiannual Report
| | |
| Message from the Trustees | 2 | |
| About the fund | 4 | |
| Performance snapshot | 6 | |
| Interview with your fund’s Portfolio Manager | 7 | |
| Performance in depth. | 12 | |
| Expenses | 14 | |
| Portfolio turnover | 16 | |
| Your fund’s management. | 17 | |
| Terms and definitions | 18 | |
| Trustee approval of management contract | 19 | |
| Other information for shareholders. | 24 | |
| Financial statements | 25 | |
| Brokerage commissions | 46 | |
Cover photograph: Vineyard, Napa County, California © Charles O’Rear
Message from the Trustees
Dear Fellow Shareholder:
Financial markets have experienced significant upheaval for well over a year now. Responses by governmental and financial authorities have been rapid and often unprecedented in scale, including the recent passage of a nearly $800 billion economic stimulus plan by Congress. Although history reminds us that stability and optimism have always returned to the markets, investors should expect continued volatility in the near term, for we are in the midst of a deep and painful bear market.
Under President and Chief Executive Officer Robert L. Reynolds, Putnam Investments is making the most of these challenging times by instituting several important changes designed to prepare Putnam for the eventual recovery. Key among them has been replacing a team management structure within Putnam equity funds with a more nimble decision-making process that vests responsibility with individual fund managers. The portfolio manager of Putnam Vista Fund is Raymond Haddad, who joined the company in 2000 and has 12 years of investment industry experience.
In other moves aimed at achieving performance excellence, Putnam has affirmed a fundamental approach to investing, simplified its equity fund lineup, and hired nearly 20 seasoned equity analysts.
2
We would like to take this opportunity to welcome new shareholders to the fund and to thank all of our investors for your continued confidence in Putnam. Although the markets have presented investors with extraordinary challenges, it is Putnam’s belief that the seeds of opportunity are often sown during difficult times like these.

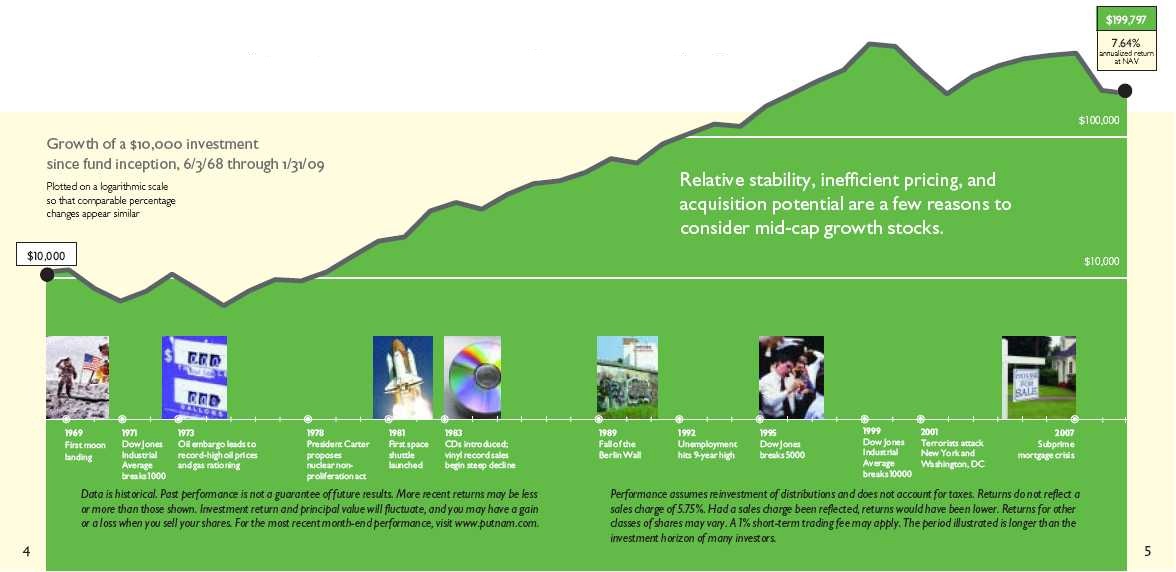
About the fund
Midsize growth companies have offered investors
compelling opportunities
Through more than 40 years of up and down markets, Putnam Vista Fund has sought compelling investment opportunities, and today it targets stocks of midsize companies that have the potential to reward investors over time.
There are several key reasons why midsize growth stocks can be attractive investments.
First, stocks of midsize companies — also called mid-capitalization or mid-cap stocks —are generally more stable than small-cap stocks. By the time a company’s capitalization qualifies it as mid cap, it is generally large enough to have developed a solid infrastructure, including professional management, a comprehensive business plan, and a mature sales and marketing structure. It has also typically weathered a full economic cycle. These characteristics generally enable midsize companies to offer investors a greater degree of stability than that offered by smaller, less mature companies.
Second, mid-cap stocks generally have greater price inefficiencies than large-cap stocks. While midsize companies may have many of the same business characteristics as large companies, fewer analysts generally follow their stocks. This makes mid-cap stocks less efficiently priced and means that extensive research capabilities, such as those employed by your fund’s manager and analysts, can help identify promising midsize companies before the market recognizes their potential.
Third, midsize companies are frequently candidates for acquisition, which could have a positive impact on their stock prices. Buyers find the established business models and well-defined market niches of some midsize companies appealing.
The fund invests some or all of its assets in small and/or midsize companies. Such investments increase the risk of greater price fluctuations. Stocks with above-average earnings growth may be more volatile, especially if earnings do not continue to grow.
Performance snapshot
Average annual total return (%) comparison as of 1/31/09
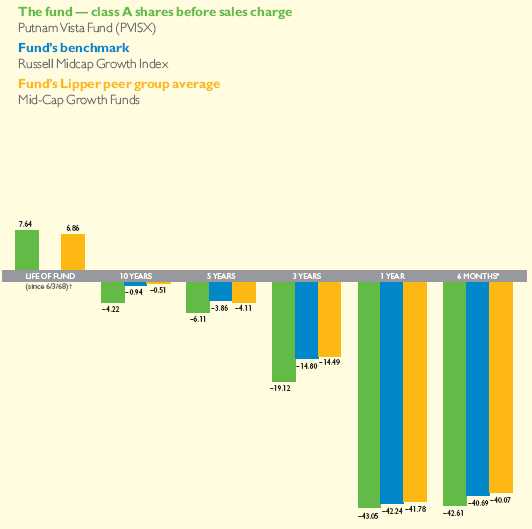
Current performance may be lower or higher than the quoted past performance, which cannot guarantee future results. Share price, principal value, and return will fluctuate, and you may have a gain or a loss when you sell your shares. Performance of class A shares assumes reinvestment of distributions and does not account for taxes. Fund returns in the bar chart do not reflect a sales charge of 5.75%; had they, returns would have been lower. See pages 7 and 12–14 for additional performance information. For a portion of the periods, this fund may have limited expenses, without which returns would have been lower. A 1% short-term trading fee may apply. To obtain the most recent month-end performance, visit www.putnam.com.
* Returns for the six-month period are not annualized, but cumulative.
† The Russell Midcap Growth Index launched on 12/31/85.
6
Interview with your
fund’s Portfolio Manager
Raymond Haddad
Ray, we have recently seen some of the greatest market volatility and price dislocation ever recorded in the financial markets. How did this affect fund performance?
It was a very difficult period. The severity of the financial markets’ downturn reached crisis proportions during the fall when many long-standing pillars of the financial community collapsed, the credit markets seized up, and the economy tipped into recession. The crisis prompted the U.S. government and its peers abroad to take coordinated and unprecedented steps to steady financial markets, unfreeze the credit markets, and begin to reverse 10 years of systemic leveraging by businesses and households. While the far-reaching measures helped to restore a degree of calm, the U.S. economy continued to struggle, with the national unemployment rate rising to 7.6% in January, the highest in 16 years, and consumer spending slowing markedly.
With investors less inclined to take risks on equities, stock prices fell sharply
Broad market index and fund performance
This comparison shows your fund’s performance in the context of broad market indexes for the six months ended 1/31/09. See page 6 and pages 12–14 for additional fund performance information. Index descriptions can be found on page 18.
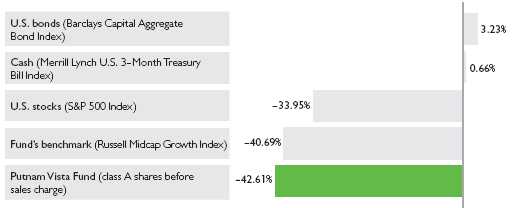
7
during the semiannual period. For the six months ended January 31, 2009, the fund’s class A shares fell 42.61%, trailing the benchmark Russell Midcap Growth Index and the average return for its Lipper peer group average. This result was due to an overweight exposure to energy stocks early in the period and to the fund’s defensive positioning during a brief rally in late 2008.
Which holdings hurt results the most relative to the index?
After reaching peak levels in July 2008, commodity prices fell sharply in the third quarter when it became evident that the U.S. contagion was spreading around the globe. Consequently, commodity-related stocks ranked among the worst-performing sectors for the period. The fund’s investments in the coal producer Peabody Energy and the coal-mining equipment company Joy Global were most disappointing. AGCO, one of the world’s largest manufacturers of farm equipment, experienced a decline in sales when grain prices fell. Consumer-related companies that depend on economic growth to prosper, including NII Holdings, a wireless service provider serving Latin American m arkets, also suffered in the sell-off. Given the deteriorating outlook for both AGCO and NII Holdings, I sold both positions before the close of the reporting period.
Top 10 holdings
This table shows the fund’s top 10 holdings and the percentage of the fund’s net assets that each represented as of 1/31/09. Also shown is each holding’s market sector and the specific industry within that sector. Holdings will vary over time.
| | |
| HOLDING (percentage of fund’s net assets) | SECTOR | INDUSTRY |
|
| H&R Block, Inc. (2.2%) | Consumer cyclicals | Commercial and |
| | | consumer services |
| SAIC, Inc. (2.1%) | Technology | Technology services |
| Goldcorp, Inc. (Canada) (2.0%) | Basic materials | Metals |
| Agnico-Eagle Mines, Ltd. (Canada) (2.0%) | Basic materials | Metals |
| AutoZone, Inc. (1.9%) | Consumer cyclicals | Retail |
| C.R. Bard, Inc. (1.8%) | Health care | Medical technology |
| Cephalon, Inc. (1.7%) | Health care | Pharmaceuticals |
| American Tower Corp. (1.6%) | Communication services | Telecommunications |
| Apollo Group, Inc. (1.6%) | Consumer staples | Schools |
| ITT Educational Services, Inc. (1.6%) | Consumer staples | Schools |
8
With investors becoming more risk-averse, how did mid-cap growth stocks hold up during the market’s decline?
The paralysis in the banking sector and lack of liquidity in the financial system had repercussions for all companies, no matter what their size. However, midsize companies by their very nature are not as fully established as their large-cap brethren and require additional cash infusions from time to time to expand their businesses. With the trauma in the financial system making it difficult for banks to lend, midsize companies were forced to put off expansion plans that contribute to their growth. Second, with economic and market conditions continuing to deteriorate, investors became less confident and sought the safety of the lower-risk investments. This flight to safety tended to draw investors away from mid-cap stocks, especially those with a growth-oriented focus.
How have you adapted the fund’s strategy to reflect the changing market conditions?
In these more challenging markets, I have instituted a more defensive undercurrent in the portfolio. I am placing increasing emphasis on companies with good balance sheets, strong cash flows, and stable business prospects that can perform relatively well in a slower-growth environment and can weather the illiquid financial markets during this difficult time.
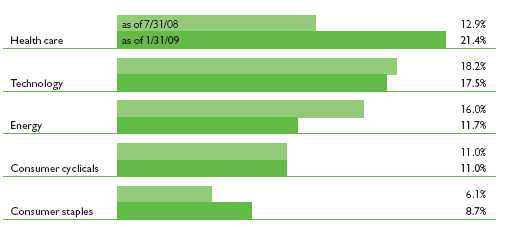
Comparison of top sector weightings
This chart shows how the fund’s top weightings have changed over the past six months. Weightings are shown as a percentage of net assets. Holdings will vary over time.
9
As you may recall, market conditions were quite different as the new fiscal year was getting under way in August 2008. The commodity markets were just coming off their highs in July, inflation was still a concern, and prospects for global economic growth, while slowing, still held promise. At that time, however, I became concerned that the economic slowdown would be greater than first anticipated, and I moved to reduce overall risk in the portfolio by reducing the portfolio’s exposure to energy stocks, since their prospects tend to be tied to economic prosperity. I sold all of the oil and gas equipment companies and trimmed investments in exploration and production companies. One of the companies that I retained was Range Resources, a natural gas producer that is utilizing new technologies that allow horizontal drilling to access previously untapped supplies of natural gas in an economically viable way.
The proceeds from the sales of energy stocks were reinvested in the defensive health-care sector, increasing the exposure to an overweight position. However, as with any sector, some companies are in a better position to survive the economic downturn than others. Therefore, I avoided the hospital and service care subsectors and focused on medical equipment companies that produce low-cost items. I increased the fund’s positions in the heart valve manufacturer Edwards Lifesciences and Cephalon, Inc., an international biopharmaceutical company. Both of these holdings performed relatively well for the six-month period.
I N T H E N E W S
Congress passed a $787 billion stimulus plan on February 13, 2009, with the goals of creating jobs, helping the unemployed, and cultivating economic growth. Tens of billions of dollars will be spent over the next two years to support Medicaid, help local school districts, and extend jobless benefits. Billions of dollars also will fund job-creating investments in“green” technologies, computerizing the nation’s medical-records system, biomedical research, and public works construction projects. The balance of the package is devoted to tax cuts for businesses and individuals, including a $400 payroll tax holiday for workers (married couples filing jointly for less than $150,000 get up to $800). The plan is one of the largest of its kind since Franklin D. Roosevelt launched the New Deal in 1933.
What other holdings helped performance?
The sharp decline in confidence and spending has had an impact on many
10
industries, but we also think the recession is creating opportunities. Even within consumer-related sectors, several portfolio holdings performed well by comparison. In the retail sector, AutoZone and Advance Auto Parts are benefiting from budget-minded consumers maintaining existing cars rather than buying new ones. H&R Block, which provides online and in-person tax preparation, is benefiting from new, financially disciplined management that is streamlining operations and selling off non-core assets to bolster profits. The company also is seeing increased demand from individuals looking to save money on their taxes in these hard economic times. Finally, in the education sector, I believe companies such as ITT Educational Services and Career Education, which I added during the period, will do well as unemployed workers take classes to adapt to a changing marketplace.
What is your outlook for the fund, Ray?
Given the underlying contributors and magnitude of the market’s decline, we may be entering a period with little historical precedent. Coordinated fiscal and monetary policy action will not quickly reverse the economic damage caused by the absence of credit and the loss of confidence across the financial markets. Until the housing market stabilizes, credit begins flowing again, and consumers, who contribute up to 70% of the gross national product, begin spending, the capital markets will remain in turmoil. Deleveraging, or the paying off of excess debt, is under way and, we believe, must continue in order to restore more solid underpinnings to the financials sector in particular and the economy in general. Consequently, I expect further volatility in the months ahead. Given this transitional period, I believe the equity markets may be entering a trading-range environment for the foreseeable future.
With this as a backdrop, I will continue to follow a disciplined approach to finding midsize companies with relatively little debt on their balance sheets and earnings that remain stable during economic weakness.
Thank you, Ray, for your time and insights today.
The views expressed in this report are exclusively those of Putnam Management. They are not meant as investment advice.
Please note that the holdings discussed in this report may not have been held by the fund for the entire period. Portfolio composition is subject to review in accordance with the fund’s investment strategy and may vary in the future.
11
Your fund’s performance
This section shows your fund’s performance, price, and distribution information for periods ended January 31, 2009, the end of the first half of its current fiscal year. In accordance with regulatory requirements for mutual funds, we also include performance as of the most recent calendar quarter-end and expense information taken from the fund’s current prospectus. Performance should always be considered in light of a fund’s investment strategy. Data represents past performance. Past performance does not guarantee future results. More recent returns may be less or more than those shown. Investment return and principal value will fluctuate, and you may have a gain or a loss when you sell your shares. Performance information does not reflect any deduction for taxes a shareholder may owe on fund distributions or on the redemption of fund shares. For the most recent month-end performance, please visit the Individual Investors section of www.putnam.com or call Putnam at 1-800-225-1581. Class Y shares are generally only available to corporate and institutional clients and clients in other approved programs. See the Terms and Definitions section in this report for definitions of the share classes offered by your fund.
| | | | | | | | | | |
| Fund performance Total return for periods ended 1/31/09 | | | | |
| |
| | Class A | Class B | Class C | Class M | Class R | Class Y |
| (inception dates) | (6/3/68) | (3/1/93) | (7/26/99) | (12/8/94) | (1/21/03) | (3/28/95) |
|
| | NAV | POP | NAV | CDSC | NAV | CDSC | NAV | POP | NAV | NAV |
|
| Annual average | | | | | | | | | | |
| (life of fund) | 7.64% | 7.49% | 6.69% | 6.69% | 6.83% | 6.83% | 6.96% | 6.86% | 7.38% | 7.74% |
|
| 10 years | –35.03 | –38.74 | –39.68 | –39.68 | –39.68 | –39.68 | –38.21 | –40.35 | –36.55 | –33.32 |
| Annual average | –4.22 | –4.78 | –4.93 | –4.93 | –4.93 | –4.93 | –4.70 | –5.04 | –4.45 | –3.97 |
|
| 5 years | –27.03 | –31.20 | –29.63 | –31.04 | –29.69 | –29.69 | –28.85 | –31.34 | –27.91 | –26.11 |
| Annual average | –6.11 | –7.21 | –6.79 | –7.16 | –6.80 | –6.80 | –6.58 | –7.24 | –6.34 | –5.87 |
|
| 3 years | –47.10 | –50.12 | –48.23 | –49.79 | –48.29 | –48.29 | –47.92 | –49.73 | –47.53 | –46.71 |
| Annual average | –19.12 | –20.69 | –19.70 | –20.52 | –19.74 | –19.74 | –19.54 | –20.49 | –19.34 | –18.93 |
|
| 1 year | –43.05 | –46.30 | –43.38 | –46.21 | –43.42 | –43.99 | –43.30 | –45.27 | –43.16 | –42.90 |
|
| 6 months | –42.61 | –45.91 | –42.75 | –45.61 | –42.78 | –43.36 | –42.77 | –44.78 | –42.66 | –42.53 |
|
Current performance may be lower or higher than the quoted past performance, which cannot guarantee future results. After-sales-charge returns (public offering price, or POP) for class A and M shares reflect a maximum 5.75% and 3.50% load, respectively. Class B share returns reflect the applicable contingent deferred sales charge (CDSC), which is 5% in the first year, declining to 1% in the sixth year, and is eliminated thereafter. Class C shares reflect a 1% CDSC for the first year that is eliminated thereafter. Class R and Y shares have no initial sales charge or CDSC. Performance for class B, C, M, R, and Y shares before their inception is derived from the historical performance of class A shares, adjusted for the applicable sales charge (or CDSC) and, except for class Y shares, the higher operating expenses for such shares.
For a portion of the periods, this fund may have limited expenses, without which returns would have been lower.
A 1% short-term trading fee may be applied to shares exchanged or sold within 7 days of purchase.
12
| | |
| Comparative index returns For periods ended 1/31/09 | |
|
| | | Lipper Mid-Cap Growth Funds |
| | Russell Midcap Growth Index | category average* |
|
| Annual average (life of fund) | —† | 6.86% |
|
| 10 years | –8.99% | –1.16 |
| Annual average | –0.94 | –0.51 |
|
| 5 years | –17.85 | –18.31 |
| Annual average | –3.86 | –4.11 |
|
| 3 years | –38.15 | –37.19 |
| Annual average | –14.80 | –14.49 |
|
| 1 year | –42.24 | –41.78 |
|
| 6 months | –40.69 | –40.07 |
|
Index and Lipper results should be compared to fund performance at net asset value.
* Over the 6-month, 1-year, 3-year, 5-year, 10-year, and life-of-fund periods ended 1/31/09, there were 618, 597, 518, 414, 194, and 10 funds, respectively, in this Lipper category.
† The Russell Midcap Growth Index launched on 12/31/85.
Fund price and distribution information For the six-month period ended 1/31/09
| | | | | | | | |
| | Class A | Class B | Class C | Class M | Class R | Class Y |
|
| Share value | NAV | POP | NAV | NAV | NAV | POP | NAV | NAV |
|
| 7/31/08 | $10.49 | $11.13 | $8.96 | $9.77 | $9.61 | $9.96 | $10.36 | $10.98 |
|
| 1/31/09 | 6.02 | 6.39 | 5.13 | 5.59 | 5.50 | 5.70 | 5.94 | 6.31 |
|
The classification of distributions, if any, is an estimate. Final distribution information will appear on your year-end tax forms.
The fund made no distributions during the period.
Fund performance as of the most recent calendar quarter
Total return for periods ended 12/31/08
| | | | | | | | | | |
| | Class A | Class B | Class C | Class M | Class R | Class Y |
| (inception dates) | (6/3/68) | (3/1/93) | (7/26/99) | (12/8/94) | (1/21/03) | (3/28/95) |
|
| | NAV | POP | NAV | CDSC | NAV | CDSC | NAV | POP | NAV | NAV |
|
| Annual average | | | | | | | | | | |
| (life of fund) | 7.80% | 7.64% | 6.84% | 6.84% | 6.99% | 6.99% | 7.11% | 7.02% | 7.54% | 7.90% |
|
| 10 years | –28.27 | –32.41 | –33.41 | –33.41 | –33.43 | –33.43 | –31.77 | –34.15 | –29.90 | –26.44 |
| Annual average | –3.27 | –3.84 | –3.98 | –3.98 | –3.99 | –3.99 | –3.75 | –4.09 | –3.49 | –3.02 |
|
| 5 years | –20.53 | –25.12 | –23.48 | –25.01 | –23.48 | –23.48 | –22.56 | –25.26 | –21.43 | –19.59 |
| Annual average | –4.49 | –5.62 | –5.21 | –5.59 | –5.21 | –5.21 | –4.98 | –5.66 | –4.71 | –4.27 |
|
| 3 years | –40.43 | –43.86 | –41.77 | –43.51 | –41.76 | –41.76 | –41.36 | –43.42 | –40.85 | –40.04 |
| Annual average | –15.86 | –17.51 | –16.49 | –17.33 | –16.49 | –16.49 | –16.30 | –17.29 | –16.06 | –15.68 |
|
| 1 year | –45.59 | –48.71 | –46.01 | –48.71 | –46.02 | –46.56 | –45.90 | –47.80 | –45.71 | –45.49 |
|
| 6 months | –42.22 | –45.54 | –42.39 | –45.27 | –42.38 | –42.96 | –42.40 | –44.45 | –42.27 | –42.17 |
|
13
Fund’s annual operating expenses For the fiscal year ended 7/31/08
| | | | | | |
| | Class A | Class B | Class C | Class M | Class R | Class Y |
|
| Total annual fund operating expenses | 1.18% | 1.93% | 1.93% | 1.68% | 1.43% | 0.93% |
|
Expense information in this table is taken from the most recent prospectus, is subject to change, and may differ from that shown in the next section and in the financial highlights of this report. Expenses are shown as a percentage of average net assets.
Your fund’s expenses
As a mutual fund investor, you pay ongoing expenses, such as management fees, distribution fees (12b-1 fees), and other expenses. In the most recent six-month period, your fund limited these expenses; had it not done so, expenses would have been higher. Using the following information, you can estimate how these expenses affect your investment and compare them with the expenses of other funds. You may also pay one-time transaction expenses, including sales charges (loads) and redemption fees, which are not shown in this section and would have resulted in higher total expenses. For more information, see your fund’s prospectus or talk to your financial representative.
Review your fund’s expenses
The following table shows the expenses you would have paid on a $1,000 investment in Putnam Vista Fund from August 1, 2008, to January 31, 2009. It also shows how much a $1,000 investment would be worth at the close of the period, assuming actual returns and expenses.
| | | | | | |
| | Class A | Class B | Class C | Class M | Class R | Class Y |
|
| Expenses paid per $1,000* | $5.28 | $8.24 | $8.24 | $7.25 | $6.27 | $4.29 |
|
| Ending value (after expenses) | $573.90 | $572.50 | $572.20 | $572.30 | $573.40 | $574.70 |
|
* Expenses for each share class are calculated using the fund’s annualized expense ratio for each class, which represents the ongoing expenses as a percentage of average net assets for the six months ended 1/31/09. The expense ratio may differ for each share class (see the last table in this section). Expenses are calculated by multiplying the expense ratio by the average account value for the period; then multiplying the result by the number of days in the period; and then dividing that result by the number of days in the year.
Estimate the expenses you paid
To estimate the ongoing expenses you paid for the six months ended January 31, 2009, use the following calculation method. To find the value of your investment on August 1, 2008, call Putnam at 1-800-225-1581.

14
Compare expenses using the SEC’s method
The Securities and Exchange Commission (SEC) has established guidelines to help investors assess fund expenses. Per these guidelines, the following table shows your fund’s expenses based on a $1,000 investment, assuming a hypothetical 5% annualized return. You can use this information to compare the ongoing expenses (but not transaction expenses or total costs) of investing in the fund with those of other funds. All mutual fund shareholder reports will provide this information to help you make this comparison. Please note that you cannot use this information to estimate your actual ending account balance and expenses paid during the period.
| | | | | | |
| | Class A | Class B | Class C | Class M | Class R | Class Y |
|
| Expenses paid per $1,000* | $6.77 | $10.56 | $10.56 | $9.30 | $8.03 | $5.50 |
|
| Ending value (after expenses) | $1,018.50 | $1,014.72 | $1,014.72 | $1,015.98 | $1,017.24 | $1,019.76 |
|
* Expenses for each share class are calculated using the fund’s annualized expense ratio for each class, which represents the ongoing expenses as a percentage of average net assets for the six months ended 1/31/09. The expense ratio may differ for each share class (see the last table in this section). Expenses are calculated by multiplying the expense ratio by the average account value for the period; then multiplying the result by the number of days in the period; and then dividing that result by the number of days in the year.
Compare expenses using industry averages
You can also compare your fund’s expenses with the average of its peer group, as defined by Lipper, an independent fund-rating agency that ranks funds relative to others that Lipper considers to have similar investment styles or objectives. The expense ratio for each share class shown indicates how much of your fund’s average net assets have been used to pay ongoing expenses during the period.
| | | | | | |
| | Class A | Class B | Class C | Class M | Class R | Class Y |
|
| Your fund’s annualized | | | | | | |
| expense ratio | 1.33% | 2.08% | 2.08% | 1.83% | 1.58% | 1.08% |
|
| Average annualized expense | | | | | | |
| ratio for Lipper peer group* | 1.40% | 2.15% | 2.15% | 1.90% | 1.65% | 1.15% |
|
* Putnam keeps fund expenses below the Lipper peer group average expense ratio by limiting our fund expenses if they exceed the Lipper average. The Lipper average is a simple average of front-end load funds in the peer group that excludes 12b-1 fees as well as any expense offset and brokerage/service arrangements that may reduce fund expenses. To facilitate the comparison in this presentation, Putnam has adjusted the Lipper average to reflect 12b-1 fees. Investors should note that the other funds in the peer group may be significantly smaller or larger than the fund, and that an asset-weighted average would likely be lower than the simple average. Also, the fund and Lipper report expense data at different times; the fund’s expense ratio shown here is annualized data for the most recent six-month period, while the quarterly updated Lipper average is based on the most recent fiscal year-end data available for the peer group funds as of 12/31/08.
15
Your fund’s portfolio turnover
Putnam funds are actively managed by experts who buy and sell securities based on intensive analysis of companies, industries, economies, and markets. Portfolio turnover is a measure of how often a fund’s managers buy and sell securities for your fund. A portfolio turnover of 100%, for example, means that the managers sold and replaced securities valued at 100% of a fund’s average portfolio value within a given period. Funds with high turnover may be more likely to generate capital gains that must be distributed to shareholders as taxable income. High turnover may also cause a fund to pay more brokerage commissions and other transaction costs, which may detract from performance.
You can use the following table to compare your fund’s turnover with the average turnover for funds in its Lipper category.
Turnover comparisons Percentage of holdings that change every year
| | | | | |
| | 2008 | 2007 | 2006 | 2005 | 2004 |
|
| Putnam Vista Fund | 141% | 111% | 111% | 74% | 78% |
|
| Lipper Mid-Cap Growth Funds | | | | | |
| category average | 120% | 108% | 110% | 115% | 130% |
|
Turnover data for the fund is calculated based on the fund’s fiscal-year period, which ends on July 31. Turnover data for the fund’s Lipper category is calculated based on the average of the turnover of each fund in the category for its fiscal year ended during the indicated year. Fiscal years vary across funds in the Lipper category, which may limit the comparability of the fund’s portfolio turnover rate to the Lipper average. Comparative data for 2008 is based on information available as of 12/31/08.
16
Your fund’s management
Your fund’s Portfolio Manager is Raymond Haddad.
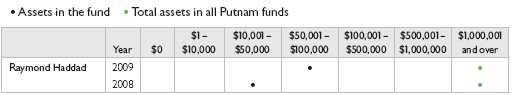
Portfolio management fund ownership
The following table shows how much the fund’s current Portfolio Manager has invested in the fund and in all Putnam mutual funds (in dollar ranges). Information shown is as of January 31, 2009, and January 31, 2008.
Trustee and Putnam employee fund ownership
As of January 31, 2009, all of the Trustees of the Putnam funds owned fund shares. The following table shows the approximate value of investments in the fund and all Putnam funds as of that date by the Trustees and Putnam employees. These amounts include investments by the Trustees’ and employees’ immediate family members and investments through retirement and deferred compensation plans.
| | |
| | Assets in the fund | Total assets in all Putnam funds |
|
| Trustees | $571,000 | $31,000,000 |
|
| Putnam employees | $7,878,000 | $342,000,000 |
|
Other Putnam funds managed by the Portfolio Manager
Raymond Haddad may also manage other accounts and variable trust funds advised by Putnam Management or an affiliate.
17
Terms and definitions
Important terms
Total return shows how the value of the fund’s shares changed over time, assuming you held the shares through the entire period and reinvested all distributions in the fund.
Net asset value (NAV) is the price, or value, of one share of a mutual fund, without a sales charge. NAVs fluctuate with market conditions. NAV is calculated by dividing the net assets of each class of shares by the number of outstanding shares in the class.
Public offering price (POP) is the price of a mutual fund share plus the maximum sales charge levied at the time of purchase. POP performance figures shown here assume the 5.75% maximum sales charge for class A shares and 3.50% for class M shares.
Contingent deferred sales charge (CDSC) is generally a charge applied at the time of the redemption of class B or C shares and assumes redemption at the end of the period. Your fund’s class B CDSC declines from a 5% maximum during the first year to 1% during the sixth year. After the sixth year, the CDSC no longer applies. The CDSC for class C shares is 1% for one year after purchase.
Share classes
Class A shares are generally subject to an initial sales charge and no CDSC (except on certain redemptions of shares bought without an initial sales charge).
Class B shares are not subject to an initial sales charge. They may be subject to a CDSC.
Class C shares are not subject to an initial sales charge and are subject to a CDSC only if the shares are redeemed during the first year.
Class M shares have a lower initial sales charge and a higher 12b-1 fee than class A shares and no CDSC (except on certain redemptions of shares bought without an initial sales charge).
Class R shares are not subject to an initial sales charge or CDSC and are available only to certain defined contribution plans.
Class Y shares are not subject to an initial sales charge or CDSC, and carry no 12b-1 fee. They are generally only available to corporate and institutional clients and clients in other approved programs.
Comparative indexes
Barclays Capital Aggregate Bond Index is an unmanaged index of U.S. investment-grade fixed-income securities.
Merrill Lynch U.S. 3-Month Treasury Bill Index is an unmanaged index that seeks to measure the performance of U.S. Treasury bills available in the marketplace.
Russell Midcap Growth Index is an unmanaged index of those companies in the Russell Midcap Index chosen for their growth orientation.
S&P 500 Index is an unmanaged index of common stock performance.
Indexes assume reinvestment of all distributions and do not account for fees. Securities and performance of a fund and an index will differ. You cannot invest directly in an index.
Lipper is a third-party industry-ranking entity that ranks mutual funds. Its rankings do not reflect sales charges. Lipper rankings are based on total return at net asset value relative to other funds that have similar current investment styles or objectives as determined by Lipper. Lipper may change a fund’s category assignment at its discretion. Lipper category averages reflect performance trends for funds within a category.
18
Trustee approval of management contract
General conclusions
The Board of Trustees of the Putnam funds oversees the management of each fund and, as required by law, determines annually whether to approve the continuance of your fund’s management contract with Putnam Investment Management (“Putnam Management”). In this regard, the Board of Trustees, with the assistance of its Contract Committee consisting solely of Trustees who are not “interested persons” (as such term is defined in the Investment Company Act of 1940, as amended) of the Putnam funds (the “Independent Trustees”), requests and evaluates all information it deems reasonably necessary under the circumstances. Over the course of several months ending in June 2008, the Contract Committee met several times to consider the information provided by Putnam Management and other information developed with the assistance of the Board’s independent counsel and independent staff. The Contract Committee reviewed and discussed key aspects of this information with all of the Independent Trustees. The Contract Committee recommended, and the Independent Trustees approved, the continuance of your fund’s management contract, effective July 1, 2008.
The Independent Trustees’ approval was based on the following conclusions:
• That the fee schedule in effect for your fund represented reasonable compensation in light of the nature and quality of the services being provided to the fund, the fees paid by competitive funds and the costs incurred by Putnam Management in providing such services, and
• That this fee schedule represented an appropriate sharing between fund shareholders and Putnam Management of such economies of scale as may exist in the management of the fund at current asset levels.
These conclusions were based on a comprehensive consideration of all information provided to the Trustees, were subject to the continued application of certain expense reductions and waivers and other considerations noted below, and were not the result of any single factor. Some of the factors that figured particularly in the Trustees’ deliberations and how the Trustees considered these factors are described below, although individual Trustees may have evaluated the information presented differently, giving different weights to various factors. It is also important to recognize that the fee arrangements for your fund and the other Putnam funds are the result of many years of review and discussion between the Independent Trustees and Putnam Management, that certain aspects of such arrangements may receive greater scrutiny in some years than others, and that the Trustees’ conclusions may be based, in part, on their consideration of these same arrangements in prior years.
Management fee schedules and categories; total expenses
The Trustees reviewed the management fee schedules in effect for all Putnam funds, including fee levels and breakpoints, and the assignment of funds to particular fee categories. In reviewing fees and expenses, the Trustees generally focused their attention on material changes in circumstances — for example, changes in a fund’s size or investment style, changes in Putnam Management’s operating costs or responsibilities, or changes in competitive practices in the mutual fund industry — that suggest that consideration of fee changes might be warranted. The Trustees concluded that the circumstances did not warrant changes to the management fee structure of your fund, which had
19
been carefully developed over the years, re-examined on many occasions and adjusted where appropriate. In this regard, the Trustees also noted that shareholders of your fund voted in 2007 to approve new management contracts containing an identical fee structure. The Trustees focused on two areas of particular interest, as discussed further below:
• Competitiveness. The Trustees reviewed comparative fee and expense information for competitive funds, which indicated that, in a custom peer group of competitive funds selected by Lipper Inc., your fund ranked in the 7th percentile in management fees and in the 14th percentile in total expenses (less any applicable 12b-1 fees) as of December 31, 2007 (the first percentile being the least expensive funds and the 100th percentile being the most expensive funds). (Because the fund’s custom peer group is smaller than the fund’s broad Lipper Inc. peer group, this expense information may differ from the Lipper peer expense information found elsewhere in this report.) The Trustees noted that expense ratios for a number of Putnam funds, which show the percentage of fund assets used to pay for management and administrative services, distribution (12b-1) fees and ot her expenses, had been increasing recently as a result of declining net assets and the natural operation of fee breakpoints.
The Trustees noted that the expense ratio increases described above were currently being controlled by expense limitations initially implemented in January 2004. The Trustees have received a commitment from Putnam Management and its parent company to continue this program through at least June 30, 2009. These expense limitations give effect to a commitment by Putnam Management that the expense ratio of each open-end fund would be no higher than the average expense ratio of the competitive funds included in the fund’s relevant Lipper universe (exclusive of any applicable 12b-1 charges in each case). The Trustees observed that this commitment to limit fund expenses has served shareholders well since its inception.
In order to ensure that the expenses of the Putnam funds continue to meet evolving competitive standards, the Trustees requested, and Putnam Management agreed, to extend for the twelve months beginning July 1, 2008, an additional expense limitation for certain funds at an amount equal to the average expense ratio (exclusive of 12b-1 charges) of a custom peer group of competitive funds selected by Lipper to correspond to the size of the fund. This additional expense limitation will be applied to those open-end funds that had above-average expense ratios (exclusive of 12b-1 charges) based on the custom peer group data for the period ended December 31, 2007. This additional expense limitation will not be applied to your fund because it had a below-average expense ratio relative to its custom peer group.
In addition, the Trustees devoted particular attention to analyzing the Putnam funds’ fees and expenses relative to those of competitors in fund complexes of comparable size and with a comparable mix of asset categories. The Trustees concluded that this analysis did not reveal any matters requiring further attention at the current time.
• Economies of scale. Your fund currently has the benefit of breakpoints in its management fee that provide shareholders with significant economies of scale, which means that the effective management fee rate of the fund (as a percentage of fund assets) declines as the fund grows in size and crosses specified asset thresholds. Conversely, if the fund shrinks in size — as has been the case for many Putnam funds in recent years — these breakpoints result in increasing fee levels. In recent years,
20
the Trustees have examined the operation of the existing breakpoint structure during periods of both growth and decline in asset levels. The Trustees concluded that the fee schedule in effect for your fund represented an appropriate sharing of economies of scale at current asset levels.
In connection with their review of the management fees and total expenses of the Putnam funds, the Trustees also reviewed the costs of the services to be provided and profits to be realized by Putnam Management and its affiliates from the relationship with the funds. This information included trends in revenues, expenses and profitability of Putnam Management and its affiliates relating to the investment management and distribution services provided to the funds. In this regard, the Trustees also reviewed an analysis of Putnam Management’s revenues, expenses and profitability with respect to the funds’ management contracts, allocated on a fund-by-fund basis.
Investment performance
The quality of the investment process provided by Putnam Management represented a major factor in the Trustees’ evaluation of the quality of services provided by Putnam Management under your fund’s management contract. The Trustees were assisted in their review of the Putnam funds’ investment process and performance by the work of the Investment Oversight Coordinating Committee of the Trustees and the Investment Oversight Committees of the Trustees, which had met on a regular monthly basis with the funds’ portfolio teams throughout the year. The Trustees concluded that Putnam Management generally provides a high-quality investment process — as measured by the experience and skills of the individuals assigned to the management of fund portfolios, the resources made available to such personnel, and in general the ability of Putnam Management to attract and retain high-quality personnel —but also recognized that t his does not guarantee favorable investment results for every fund in every time period. The Trustees considered the investment performance of each fund over multiple time periods and considered information comparing each fund’s performance with various benchmarks and with the performance of competitive funds.
While the Trustees noted the satisfactory investment performance of certain Putnam funds, they considered the disappointing investment performance of many funds in recent periods, particularly over periods in 2007 and 2008. They discussed with senior management of Putnam Management the factors contributing to such underperformance and actions being taken to improve performance. The Trustees recognized that, in recent years, Putnam Management has taken steps to strengthen its investment personnel and processes to address areas of underperformance, including recent efforts to further centralize Putnam Management’s equity research function. In this regard, the Trustees took into consideration efforts by Putnam Management to improve its ability to assess and mitigate investment risk in individual funds, across asset classes, and across the complex as a whole. The Trustees indicated their intention to continue to monitor performance trends to assess the effectiveness of these efforts and to evaluate whether additional changes to address areas of underperformance are warranted.
In the case of your fund, the Trustees considered that your fund’s class A share cumulative total return performance at net asset value was in the following percentiles of its Lipper Inc. peer group (Lipper Mid-Cap Growth Funds) for the one-year, three-year and five-year periods ended December 31, 2007 (the first percentile
21
being the best-performing funds and the 100th percentile being the worst-performing funds):
| | | |
| One-year period | 94th | | |
| | |
| Three-year period | 90th | | |
| | |
| Five-year period | 76th | | |
| | |
(Because of the passage of time, these performance results may differ from the performance results for more recent periods shown elsewhere in this report.) Over the one-year, three-year and five-year periods ended December 31, 2007, there were 601, 487, and 404 funds, respectively, in your fund’s Lipper peer group.* Past performance is no guarantee of future returns.
The Trustees noted the disappointing performance for your fund for the one-year, three-year, and five-year periods ended December 31, 2007. In this regard, the Trustees considered Putnam Management’s belief that the research centralization efforts underway in the equity space at Putnam Management will strengthen the fund’s investment process, which focuses on a blend of quantitative techniques and fundamental analysis, and enhance its performance potential.
As a general matter, the Trustees believe that cooperative efforts between the Trustees and Putnam Management represent the most effective way to address investment performance problems. The Trustees noted that investors in the Putnam funds have, in effect, placed their trust in the Putnam organization, under the oversight of the funds’ Trustees, to make appropriate decisions regarding the management of the funds. Based on the responsiveness of Putnam Management in the recent past to Trustee concerns about investment performance, the Trustees concluded that it is preferable to seek change within Putnam Management to address performance shortcomings. In the Trustees’ view, the alternative of engaging a new investment adviser for an underperforming fund would entail significant disruptions and would not provide any greater assurance of improved investment performance.
Brokerage and soft-dollar allocations; other benefits
The Trustees considered various potential benefits that Putnam Management may receive in connection with the services it provides under the management contract with your fund. These include benefits related to brokerage and soft-dollar allocations, whereby a portion of the commissions paid by a fund for brokerage may be used to acquire research services that may be useful to Putnam Management in managing the assets of the fund and of other clients. The Trustees considered changes made in 2008, at Putnam Management’s request, to the Putnam funds’ brokerage allocation policy, which expanded the permitted categories of brokerage and research services payable with soft dollars and increased the permitted soft dollar allocation to third-party services over what had been authorized in previous years. The Trustees indicated their continued intent to monitor the potential benefits associated with the allocation of fund brokerage and trends in industry practice to ensur e that the principle of seeking “best price and execution” remains paramount in the portfolio trading process.
* The percentile rankings for your fund’s class A share annualized total return performance in the Lipper Mid-Cap Growth Funds category for the one-, five-, and ten-year periods ended December 31, 2008, were 53%, 74%, and 85%, respectively. Over the one-, five-, and ten-year periods ended December 31, 2008, your fund ranked 316th out of 602, 310th out of 419, and 166th out of 195 funds, respectively. Note that this more recent information was not available when theTrustees approved the continuance of your fund’s management contract.
22
The Trustees’ annual review of your fund’s management contract arrangements also included the review of its distributor’s contract and distribution plan with Putnam Retail Management Limited Partnership and the investor servicing agreement with Putnam Fiduciary Trust Company (“PFTC”), each of which provides benefits to affiliates of Putnam Management. In the case of the investor servicing agreement, the Trustees considered that certain shareholder servicing functions were shifted to a third-party service provider by PFTC in 2007.
Comparison of retail and institutional fee schedules
The information examined by the Trustees as part of their annual contract review has included for many years information regarding fees charged by Putnam Management and its affiliates to institutional clients such as defined benefit pension plans, college endowments, etc. This information included comparisons of such fees with fees charged to the funds, as well as a detailed assessment of the differences in the services provided to these two types of clients. The Trustees observed, in this regard, that the differences in fee rates between institutional clients and mutual funds are by no means uniform when examined by individual asset sectors, suggesting that differences in the pricing of investment management services to these types of clients reflect to a substantial degree historical competitive forces operating in separate market places. The Trustees considered the fact that fee rates across different asset classes are typically higher o n average for mutual funds than for institutional clients, as well as the differences between the services that Putnam Management provides to the Putnam funds and those that it provides to institutional clients of the firm, but did not rely on such comparisons to any significant extent in concluding that the management fees paid by your fund are reasonable.
23
Other information for shareholders
Important notice regarding delivery of shareholder documents
In accordance with SEC regulations, Putnam sends a single copy of annual and semiannual shareholder reports, prospectuses, and proxy statements to Putnam shareholders who share the same address, unless a shareholder requests otherwise. If you prefer to receive your own copy of these documents, please call Putnam at 1-800-225-1581, and Putnam will begin sending individual copies within 30 days.
Proxy voting
Putnam is committed to managing our mutual funds in the best interests of our shareholders. The Putnam funds’ proxy voting guidelines and procedures, as well as information regarding how your fund voted proxies relating to portfolio securities during the 12-month period ended June 30, 2008, are available in the Individual Investors section of www.putnam.com, and on the SEC’s Web site, www.sec.gov. If you have questions about finding forms on the SEC’s Web site, you may call the SEC at 1-800-SEC-0330. You may also obtain the Putnam funds’ proxy voting guidelines and procedures at no charge by calling Putnam’s Shareholder Services at 1-800-225-1581.
Fund portfolio holdings
The fund will file a complete schedule of its portfolio holdings with the SEC for the first and third quarters of each fiscal year on Form N-Q. Shareholders may obtain the fund’s Forms N-Q on the SEC’s Web site at www.sec.gov. In addition, the fund’s Forms N-Q may be reviewed and copied at the SEC’s Public Reference Room in Washington, D.C. You may call the SEC at 1-800-SEC-0330 for information about the SEC’s Web site or the operation of the Public Reference Room.
24
Financial statements
A guide to financial statements
These sections of the report, as well as the accompanying Notes, constitute the fund’s financial statements.
The fund’s portfolio lists all the fund’s investments and their values as of the last day of the reporting period. Holdings are organized by asset type and industry sector, country, or state to show areas of concentration and diversification.
Statement of assets and liabilities shows how the fund’s net assets and share price are determined. All investment and noninvestment assets are added together. Any unpaid expenses and other liabilities are subtracted from this total. The result is divided by the number of shares to determine the net asset value per share, which is calculated separately for each class of shares. (For funds with preferred shares, the amount subtracted from total assets includes the liquidation preference of preferred shares.)
Statement of operations shows the fund’s net investment gain or loss. This is done by first adding up all the fund’s earnings —from dividends and interest income — and subtracting its operating expenses to determine net investment income (or loss). Then, any net gain or loss the fund realized on the sales of its holdings — as well as any unrealized gains or losses over the period — is added to or subtracted from the net investment result to determine the fund’s net gain or loss for the fiscal period.
Statement of changes in net assets shows how the fund’s net assets were affected by the fund’s net investment gain or loss, by distributions to shareholders, and by changes in the number of the fund’s shares. It lists distributions and their sources (net investment income or realized capital gains) over the current reporting period and the most recent fiscal year-end. The distributions listed here may not match the sources listed in the Statement of operations because the distributions are determined on a tax basis and may be paid in a different period from the one in which they were earned. Dividend sources are estimated at the time of declaration. Actual results may vary. Any non-taxable return of capital cannot be determined until final tax calculations are completed after the end of the fund’s fiscal year.
Financial highlights provide an overview of the fund’s investment results, per-share distributions, expense ratios, net investment income ratios, and portfolio turnover in one summary table, reflecting the five most recent reporting periods. In a semiannual report, the highlight table also includes the current reporting period.
25
| | |
| The fund’s portfolio 1/31/09 (Unaudited) | | |
| |
| |
| COMMON STOCKS (98.4%)* | Shares | Value |
|
| Banking (2.3%) | | |
| Northern Trust Corp. | 220,700 | $12,694,664 |
|
| People’s United Financial, Inc. | 512,300 | 8,381,228 |
|
| | | 21,075,892 |
| Biotechnology (3.6%) | | |
| Alexion Pharmaceuticals, Inc. † | 241,600 | 8,907,792 |
|
| Genzyme Corp. † | 136,900 | 9,435,148 |
|
| Martek Biosciences Corp. † | 376,337 | 9,954,114 |
|
| Viropharma, Inc. † | 323,223 | 3,878,676 |
|
| | | 32,175,730 |
| Building materials (0.9%) | | |
| Lennox International, Inc. | 279,700 | 7,862,367 |
|
| | | 7,862,367 |
| Chemicals (0.2%) | | |
| FMC Corp. | 38,689 | 1,726,303 |
|
| | | 1,726,303 |
| Coal (1.8%) | | |
| Massey Energy Co. | 659,445 | 10,010,375 |
|
| Peabody Energy Corp. | 260,800 | 6,520,000 |
|
| | | 16,530,375 |
| Commercial and consumer services (3.7%) | | |
| H&R Block, Inc. | 962,500 | 19,952,625 |
|
| Priceline.com, Inc. † | 97,600 | 6,547,984 |
|
| Watson Wyatt Worldwide, Inc. Class A | 145,700 | 6,775,050 |
|
| | | 33,275,659 |
| Communications equipment (3.2%) | | |
| Comtech Telecommunications Corp. † | 210,100 | 8,151,880 |
|
| F5 Networks, Inc. † | 502,400 | 11,138,208 |
|
| Harris Corp. | 228,800 | 9,904,752 |
|
| | | 29,194,840 |
| Computers (1.2%) | | |
| Brocade Communications Systems, Inc. † | 1,347,973 | 5,135,777 |
|
| National Instruments Corp. | 284,620 | 6,110,791 |
|
| | | 11,246,568 |
| Conglomerates (1.0%) | | |
| SPX Corp. | 205,600 | 8,657,816 |
|
| | | 8,657,816 |
| Consumer goods (1.5%) | | |
| Church & Dwight Co., Inc. | 262,211 | 13,957,492 |
|
| | | 13,957,492 |
| Electric utilities (3.7%) | | |
| Constellation Energy Group, Inc. | 387,700 | 10,196,510 |
|
| Edison International | 239,100 | 7,787,487 |
|
| NV Energy, Inc. | 671,800 | 7,208,414 |
|
| Pinnacle West Capital Corp. | 239,800 | 8,026,106 |
|
| | | 33,218,517 |
| Electronics (2.4%) | | |
| Altera Corp. | 377,000 | 5,798,260 |
|
| International Rectifier Corp. † | 559,268 | 7,617,230 |
|
| Synopsys, Inc. † | 440,400 | 8,147,400 |
|
| | | 21,562,890 |
26
| | |
| COMMON STOCKS (98.4%)* cont. | Shares | Value |
|
| Energy (other) (0.1%) | | |
| Covanta Holding Corp. † | 28,236 | $488,200 |
|
| Optisolar, Inc. (acquired 7/30/08, | | |
| cost $768,199) (Private) F ‡ † | 123,903 | 768,199 |
|
| | | 1,256,399 |
| Engineering and construction (1.4%) | | |
| Fluor Corp. | 187,500 | 7,293,750 |
|
| Quanta Services, Inc. † | 252,300 | 5,394,174 |
|
| | | 12,687,924 |
| Environmental (0.5%) | | |
| Foster Wheeler, Ltd. † | 224,000 | 4,473,280 |
|
| | | 4,473,280 |
| Food (2.3%) | | |
| Dean Foods Co. † | 716,500 | 13,857,110 |
|
| H.J. Heinz Co. | 178,800 | 6,526,200 |
|
| | | 20,383,310 |
| Health-care services (5.8%) | | |
| BioMarin Pharmaceuticals, Inc. † | 178,000 | 3,428,280 |
|
| Express Scripts, Inc. † | 254,600 | 13,687,296 |
|
| Genoptix, Inc. † | 74,479 | 2,524,838 |
|
| Humana, Inc. † | 165,100 | 6,262,243 |
|
| Omnicare, Inc. | 447,300 | 12,506,508 |
|
| Quest Diagnostics, Inc. | 290,400 | 14,331,240 |
|
| | | 52,740,405 |
| Insurance (1.9%) | | |
| AON Corp. | 181,400 | 6,720,870 |
|
| W.R. Berkley Corp. | 381,500 | 10,102,120 |
|
| | | 16,822,990 |
| Investment banking/Brokerage (0.6%) | | |
| Greenhill & Co., Inc. | 78,470 | 5,102,119 |
|
| | | 5,102,119 |
| Machinery (1.4%) | | |
| Bucyrus International, Inc. Class A | 215,200 | 3,335,600 |
|
| Joy Global, Inc. | 445,300 | 9,275,599 |
|
| | | 12,611,199 |
| Manufacturing (3.1%) | | |
| Dover Corp. | 305,500 | 8,639,540 |
|
| ITT Corp. | 193,900 | 8,779,792 |
|
| Shaw Group, Inc. † | 385,600 | 10,719,680 |
|
| | | 28,139,012 |
| Medical technology (5.8%) | | |
| C.R. Bard, Inc. | 193,500 | 16,557,795 |
|
| Edwards Lifesciences Corp. † | 212,366 | 12,208,921 |
|
| Haemonetics Corp. † | 118,900 | 7,032,935 |
|
| Luminex Corp. † | 150,200 | 3,059,574 |
|
| St. Jude Medical, Inc. † | 375,100 | 13,642,387 |
|
| | | 52,501,612 |
| Metals (5.5%) | | |
| Agnico-Eagle Mines, Ltd. (Canada) | 336,800 | 17,863,872 |
|
| AK Steel Holding Corp. | 444,063 | 3,583,588 |
|
| Goldcorp, Inc. (Toronto Exchange) (Canada) | 613,700 | 18,147,109 |
|
| Steel Dynamics, Inc. | 790,000 | 8,389,800 |
|
| United States Steel Corp. | 59,361 | 1,782,611 |
|
| | | 49,766,980 |
27
| | |
| COMMON STOCKS (98.4%)* cont. | Shares | Value |
|
| Natural gas utilities (2.1%) | | |
| Equitable Resources, Inc. | 216,100 | $7,397,103 |
|
| Southwestern Energy Co. † | 367,500 | 11,631,375 |
|
| | | 19,028,478 |
| Oil and gas (9.8%) | | |
| Cabot Oil & Gas Corp. Class A | 408,100 | 11,218,669 |
|
| Chesapeake Energy Corp. | 551,200 | 8,714,472 |
|
| Comstock Resources, Inc. † | 156,476 | 5,966,430 |
|
| Continental Resources, Inc. † | 292,600 | 6,048,042 |
|
| EXCO Resources, Inc. † | 647,000 | 6,560,580 |
|
| Frontier Oil Corp. | 456,200 | 6,514,536 |
|
| Noble Energy, Inc. | 182,900 | 8,949,297 |
|
| PetroHawk Energy Corp. † | 713,600 | 14,065,056 |
|
| Range Resources Corp. | 255,300 | 9,149,952 |
|
| Whiting Petroleum Corp. † | 385,811 | 11,188,519 |
|
| | | 88,375,553 |
| Pharmaceuticals (6.2%) | | |
| Cephalon, Inc. † | 197,000 | 15,204,460 |
|
| Emergent Biosolutions, Inc. † | 142,445 | 3,123,819 |
|
| King Pharmaceuticals, Inc. † | 607,151 | 5,306,500 |
|
| OSI Pharmaceuticals, Inc. † | 213,700 | 7,607,720 |
|
| Shire PLC ADR (United Kingdom) | 129,200 | 5,642,164 |
|
| Valeant Pharmaceuticals International † | 486,100 | 10,548,370 |
|
| Watson Pharmaceuticals, Inc. † | 314,600 | 8,582,288 |
|
| | | 56,015,321 |
| Publishing (1.2%) | | |
| Marvel Entertainment, Inc. † | 98,100 | 2,698,731 |
|
| Wiley (John) & Sons, Inc. Class A | 232,700 | 8,244,561 |
|
| | | 10,943,292 |
| Regional Bells (0.5%) | | |
| Frontier Communications Corp. | 539,400 | 4,374,534 |
|
| | | 4,374,534 |
| Retail (4.0%) | | |
| Advance Auto Parts, Inc. | 357,100 | 11,687,883 |
|
| AutoZone, Inc. † | 128,800 | 17,116,232 |
|
| GameStop Corp. † | 295,300 | 7,317,534 |
|
| | | 36,121,649 |
| Schools (4.1%) | | |
| Apollo Group, Inc. Class A † | 179,000 | 14,581,340 |
|
| Career Education Corp. † | 372,600 | 8,122,680 |
|
| ITT Educational Services, Inc. † | 118,700 | 14,541,937 |
|
| UNEXT.com, LLC (acquired 4/14/00, | | |
| cost $10,451,238) (Private) F ‡ † | 125,000 | 1,250 |
|
| | | 37,247,207 |
| Semiconductor (1.9%) | | |
| Hittite Microwave Corp. † | 105,600 | 2,705,472 |
|
| Linear Technology Corp. | 252,200 | 5,906,524 |
|
| Maxim Integrated Products, Inc. | 647,415 | 8,565,300 |
|
| | | 17,177,296 |
| Software (5.6%) | | |
| BMC Software, Inc. † | 245,962 | 6,230,217 |
|
| Mantech International Corp. Class A † | 163,409 | 8,763,625 |
|
| McAfee, Inc. † | 416,000 | 12,683,840 |
|
28
| | | |
| COMMON STOCKS (98.4%)*. cont. . | | Shares | Value |
|
| Software cont. | | | |
| Red Hat, Inc. † | | 981,300 | $14,376,045 |
|
| TIBCO Software, Inc. † | | 1,591,200 | 8,512,920 |
|
| | | | 50,566,647 |
| Staffing (0.8%) | | | |
| Hewitt Associates, Inc. Class A † | | 261,500 | 7,421,370 |
|
| | | | 7,421,370 |
| Technology (1.1%) | | | |
| Affiliated Computer Services, Inc. Class A † | | 217,600 | 9,979,136 |
|
| | | | 9,979,136 |
| Technology services (2.1%) | | | |
| SAIC, Inc. † | | 952,600 | 18,804,324 |
|
| | | | 18,804,324 |
| Telecommunications (2.8%) | | | |
| American Tower Corp. Class A † | | 482,600 | 14,642,084 |
|
| Sprint Nextel Corp. † | | 2,201,600 | 5,349,888 |
|
| ZTE Corp. (China) | | 1,713,900 | 4,892,888 |
|
| | | | 24,884,860 |
| Textiles (1.3%) | | | |
| VF Corp. | | 98,200 | 5,501,164 |
|
| Warnaco Group, Inc. (The) † | | 261,900 | 5,929,416 |
|
| | | | 11,430,580 |
| Water Utilities (1.0%) | | | |
| Aqua America, Inc. | | 453,800 | 9,411,815 |
|
| | | | 9,411,815 |
| Total common stocks (cost $1,019,541,615) | | | $888,751,741 |
| |
| |
| PURCHASED OPTIONS | Expiration date/ | Contract | |
| OUTSTANDING (—%)* | strike price | amount | Value |
|
| BJ’s Restaurants, Inc. (Put) | Mar-09/$8.96 | $32,847 | $17,402 |
|
| California Pizza Kitchen, Inc. (Put) | Mar-09/8.96 | 33,393 | 15,431 |
|
| Chipotle Mexican Grill, Inc. (Put) | Mar-09/54.86 | 5,396 | 42,968 |
|
| Cracker Barrel Old Country Store, Inc. (Put) | Mar-09/17.66 | 16,820 | 32,254 |
|
| Darden Restaurants, Inc. (Put) | Mar-09/25.35 | 12,033 | 20,841 |
|
| Jack in the Box, Inc. (Put) | Mar-09/18.82 | 16,190 | 10,311 |
|
| P.F. Chang’s China Bistro, Inc. (Put) | Mar-09/18.50 | 15,815 | 31,076 |
|
| Sonic Corp. (Put) | Mar-09/10.78 | 27,750 | 35,542 |
|
| Texas Roadhouse, Inc. (Put) | Mar-09/6.41 | 45,608 | 13,897 |
|
| The Steak n Shake Company (Put) | Mar-09/5.48 | 56,278 | 24,228 |
|
| Tim Hortons, Inc. (Put) | Mar-09/24.46 | 12,643 | 17,169 |
|
| Total purchased options outstanding (cost $422,267) | | | $261,119 |
|
| |
| CONVERTIBLE PREFERRED STOCKS (—%)* | | Shares | Value |
|
| Totality Corp. Ser. D, $0.346 cum. cv. pfd. | | | |
| (acquired 6/26/00, cost $2,240,735) (Private) F ‡ † | | 878,186 | $88 |
|
| Total convertible preferred stocks (cost $2,240,735) | | | $88 |
29
| | |
| SHORT-TERMSTOCKSINVESTMENTS. (1.8%)*. | Principal amount/shares | Value |
|
| Federated Prime Obligations Fund | 9,195,767 | $9,195,767 |
|
| U.S. Treasury Bills, for effective yields ranging | | |
| from 0.31% to 0.62%, November 19, 2009 | $6,300,000 | 6,268,172 |
|
| U.S. Treasury Cash Management Bills 0.70%, | | |
| May 15, 2009 | 405,000 | 403,981 |
|
| Total short-term investments (cost $15,878,744) | | $15,867,920 |
|
| |
| TOTAL INVESTMENTS | | |
|
| Total investments (cost $1,038,083,361) | | $904,880,868 |
* Percentages indicated are based on net assets of $903,553,515.
† Non-income-producing security.
‡ Restricted, excluding 144A securities, as to public resale. The total market value of restricted securities held at January 31, 2009 was $769,537 or less than 0.1% of net assets.
F Is valued at fair value following procedures approved by the Trustees. Securities may be classified as a Level 2 or Level 3 for FASB 157 disclosures based on the securities valuation inputs. On January 31, 2009, fair value pricing was also used for certain foreign securities in the portfolio (Note 1).
At January 31, 2009, liquid assets totaling $261,120 have been designated as collateral for open options.
ADR after the name of a foreign holding stands for American Depository Receipts representing ownership of foreign securities on deposit with a custodian bank.
In September 2006, the FASB issued Statement of Financial Accounting Standards No. 157, Fair Value Measurements (SFAS 157). SFAS 157 is effective for financial statements issued for fiscal years beginning after November 15, 2007 and interim periods within those fiscal years. While the adoption of SFAS 157 does not have a material effect on the fund’s net asset value, it does require additional disclosures about fair value measurements. The Standard establishes a three-level hierarchy for disclosure of fair value measurements. The valuation hierarchy is based upon the transparency of inputs to the valuation of the fund’s investments. The three levels are defined as follows:
Level 1 — Valuations based on quoted prices for identical securities in active markets.
Level 2 — Valuations based on quoted prices in markets that are not active or for which all significant inputs are observable, either directly or indirectly.
Level 3 — Valuations based on inputs that are unobservable and significant to the fair value measurement.
The following is a summary of the inputs used to value the fund’s net assets as of January 31, 2009:
| | |
| Valuation inputs | Investments in securities | Other financial instruments |
|
| Level 1 | $892,285,171 | $— |
|
| Level 2 | 11,826,160 | — |
|
| Level 3 | 769,537 | — |
|
| Total | $904,880,868 | $— |
Other financial instruments include futures, written options, TBA sale commitments, swaps and forward contracts which are valued at the unrealized appreciation/(depreciation) on the instrument.
30
| | |
| The following is a reconciliation of Level 3 assets as of January 31, 2009: | |
| | Investment in securities | Other financial instruments |
|
| Balance as of July 31, 2008 | $— | $— |
|
| Accrued discounts/premiums | — | — |
|
| Realized gain/loss | — | — |
|
| Change in net unrealized appreciation/(depreciation) | — | — |
|
| Net purchases/sales | — | — |
|
| Net transfers in and/or out of Level 31 | 769,537 | — |
|
| Balance as of January 31, 2009 | $769,537 | $— |
Other financial instruments include futures, written options, TBA sale commitments, swaps and forward contracts which are valued at the unrealized appreciation/ (depreciation) on the instrument.
1 Represents Level 3 securities acquired in merger with Putnam OTC & Emerging Growth Fund.
The accompanying notes are an integral part of these financial statements.
31
| |
| Statement of assets and liabilities 1/31/09 (Unaudited) | |
|
| |
| ASSETS | |
|
| Investment in securities, at value (Note 1): | |
| Unaffiliated issuers (identified cost $1,038,083,361) | $904,880,868 |
|
| Dividends, interest and other receivables | 534,257 |
|
| Receivable for shares of the fund sold | 1,075,160 |
|
| Receivable for securities sold | 42,681,568 |
|
| Total assets | 949,171,853 |
| |
| |
| LIABILITIES | |
|
| Payable to custodian (Note 2) | 61,220 |
|
| Payable for securities purchased | 41,010,193 |
|
| Payable for shares of the fund repurchased | 1,654,692 |
|
| Payable for compensation of Manager (Note 2) | 1,360,265 |
|
| Payable for investor servicing fees (Note 2) | 209,042 |
|
| Payable for custodian fees (Note 2) | 31,928 |
|
| Payable for Trustee compensation and expenses (Note 2) | 556,881 |
|
| Payable for administrative services (Note 2) | 3,353 |
|
| Payable for distribution fees (Note 2) | 257,621 |
|
| Other accrued expenses | 473,143 |
|
| Total liabilities | 45,618,338 |
| |
| Net assets | $903,553,515 |
|
| |
| REPRESENTED BY | |
|
| Paid-in capital (Unlimited shares authorized) (Notes 1 and 4) | $10,117,480,369 |
|
| Accumulated net investment loss (Note 1) | (1,883,518) |
|
| Accumulated net realized loss on investments (Note 1) | (9,078,840,843) |
|
| Net unrealized depreciation of investments | (133,202,493) |
|
| Total — Representing net assets applicable to capital shares outstanding | $903,553,515 |
| |
| |
| COMPUTATION OF NET ASSET VALUE AND OFFERING PRICE | |
|
| Net asset value and redemption price per class A share ($747,133,297 divided by 124,047,830 shares) | $6.02 |
|
| Offering price per class A share (100/94.25 of $6.02)* | $6.39 |
|
| Net asset value and offering price per class B share ($79,086,765 divided by 15,429,918 shares)** | $5.13 |
|
| Net asset value and offering price per class C share ($16,387,349 divided by 2,931,022 shares)** | $5.59 |
|
| Net asset value and redemption price per class M share ($12,618,410 divided by 2,293,039 shares) | $5.50 |
|
| Offering price per class M share (100/96.50 of $5.50)* | $5.70 |
|
| Net asset value, offering price and redemption price per class R share | |
| ($2,066,293 divided by 347,679 shares) | $5.94 |
|
| Net asset value, offering price and redemption price per class Y share | |
| ($46,261,401 divided by 7,329,158 shares) | $6.31 |
|
* On single retail sales of less than $50,000. On sales of $50,000 or more the offering price is reduced.
** Redemption price per share is equal to net asset value less any applicable contingent deferred sales charge.
The accompanying notes are an integral part of these financial statements.
32
| |
| Statement of operations Six months ended 1/31/09 (Unaudited) | |
| |
| |
| INVESTMENT INCOME | |
|
| Dividends (net of foreign tax of $1,212) | $4,445,212 |
|
| Interest (including interest income of $121,822 from | |
| investments in affiliated issuers) (Note 5) | 372,485 |
|
| Securities lending | 192,408 |
|
| Total investment income | 5,010,105 |
|
| |
| EXPENSES | |
|
| Compensation of Manager (Note 2) | 2,843,987 |
|
| Investor servicing fees (Note 2) | 1,868,376 |
|
| Custodian fees (Note 2) | 18,263 |
|
| Trustee compensation and expenses (Note 2) | 31,789 |
|
| Administrative services (Note 2) | 15,831 |
|
| Distribution fees — Class A (Note 2) | 975,169 |
|
| Distribution fees — Class B (Note 2) | 438,436 |
|
| Distribution fees — Class C (Note 2) | 81,011 |
|
| Distribution fees — Class M (Note 2) | 42,994 |
|
| Distribution fees — Class R (Note 2) | 4,633 |
|
| Other | 337,996 |
|
| Fees waived and reimbursed by Manager (Note 5) | (4,632) |
|
| Total expenses | 6,653,853 |
| | |
| Expense reduction (Note 2) | (192,509) |
|
| Net expenses | 6,461,344 |
| |
| Net investment loss | (1,451,239) |
|
| |
| Net realized loss on investments (Notes 1 and 3) | (386,004,969) |
|
| Net realized loss on futures contracts (Note 1) | (14,883,958) |
|
| Net realized gain on written options (Notes 1 and 3) | 259,075 |
|
| Net unrealized depreciation of investments, futures contracts and | |
| written options during the period | (140,872,650) |
|
| Net loss on investments | (541,502,502) |
| |
| Net decrease in net assets resulting from operations | $(542,953,741) |
|
The accompanying notes are an integral part of these financial statements.
33
| | |
| Statement of changes in net assets | | |
| |
| |
| DECREASE IN NET ASSETS | Six months ended 1/31/09* | Year ended 7/31/08 |
|
| Operations: | | |
| Net investment loss | $(1,451,239) | $(8,113,799) |
|
| Net realized loss on investments | (400,629,852) | (234,168,489) |
|
| Net unrealized appreciation (depreciation) of investments | (140,872,650) | 73,889,541 |
|
| Net decrease in net assets resulting from operations | (542,953,741) | (168,392,747) |
|
| Redemption fees (Note 1) | 10,201 | 9,228 |
|
| Increase (decrease) from capital share transactions (Note 4) | 125,303,766 | (568,020,292) |
|
| Total decrease in net assets | (417,639,774) | (736,403,811) |
|
| |
| NET ASSETS | | |
|
| Beginning of period | 1,321,193,289 | 2,057,597,100 |
|
| End of period (including undistributed net investment loss | | |
| of $1,883,518 and $—, respectively) | $903,553,515 | $1,321,193,289 |
|
| |
| * Unaudited | | |
The accompanying notes are an integral part of these financial statements.
34
| |
| |
| |
| This page left blank intentionally. |
| |
| |
| |
35
Financial highlights (For a common share outstanding throughout the period)
| | | | | | | | | | | |
| INVESTMENT OPERATIONS: | RATIOS AND SUPPLEMENTAL DATA: | | |
|
| |
| | | | Net realized | | | | | | | Ratio of net | |
| | Net asset value, | | and unrealized | Total from | | | | Net assets, end | Ratio of expenses | investment income | |
| | beginning | Net investment | gain (loss) on | investment | | Net asset value, | Total return at net | of period | to average net | (loss) to average | Portfolio |
| Period ended | of period | income (loss) a ,d | investments | operations | Redemption fees e | end of period | asset value (%) b | (in thousands) | assets (%) c,d | net assets (%) d | turnover (%) |
|
| Class A | | | | | | | | | | | |
| January 31, 2009 ** | $10.49 | (.01) | (4.46) | (4.47) | — | $6.02 | (42.61) * | $747,133 | .67 * | (.12) * | 118.29 * |
| July 31, 2008 | 11.58 | (.04) | (1.05) | (1.09) | — | 10.49 | (9.41) | 1,069,829 | 1.18 | (.39) | 141.16 |
| July 31, 2007 | 10.25 | (.03) | 1.36 | 1.33 | — | 11.58 | 12.98 | 1,565,310 | 1.11 | (.30) | 110.80 |
| July 31, 2006 | 10.11 | (.01) f | .15 | .14 | — | 10.25 | 1.39 f | 1,773,483 | .99 f | (.13) f | 110.50 |
| July 31, 2005 | 8.04 | (.05) g | 2.12 | 2.07 | — | 10.11 | 25.75 | 1,996,475 | 1.10 | (.51) g | 73.81 |
| July 31, 2004 | 7.12 | (.05) | .97 | .92 | — | 8.04 | 12.92 | 1,798,906 | 1.08 | (.60) | 77.95 |
|
| Class B | | | | | | | | | | | |
| January 31, 2009 ** | $8.96 | (.03) | (3.80) | (3.83) | — | $5.13 | (42.75) * | $79,087 | 1.05 * | (.50) * | 118.29 * |
| July 31, 2008 | 9.97 | (.11) | (.90) | (1.01) | — | 8.96 | (10.13) | 134,694 | 1.93 | (1.13) | 141.16 |
| July 31, 2007 | 8.89 | (.10) | 1.18 | 1.08 | — | 9.97 | 12.15 | 254,967 | 1.86 | (1.04) | 110.80 |
| July 31, 2006 | 8.83 | (.08) f | .14 | .06 | — | 8.89 | .68 f | 369,959 | 1.74 f | (.88) f | 110.50 |
| July 31, 2005 | 7.08 | (.10) g | 1.85 | 1.75 | — | 8.83 | 24.72 | 539,589 | 1.85 | (1.27) g | 73.81 |
| July 31, 2004 | 6.32 | (.10) | .86 | .76 | — | 7.08 | 12.03 | 674,172 | 1.83 | (1.35) | 77.95 |
|
| Class C | | | | | | | | | | | |
| January 31, 2009 ** | $9.77 | (.03) | (4.15) | (4.18) | — | $5.59 | (42.78) * | $16,387 | 1.05 * | (.50) * | 118.29 * |
| July 31, 2008 | 10.87 | (.12) | (.98) | (1.10) | — | 9.77 | (10.12) | 22,226 | 1.93 | (1.14) | 141.16 |
| July 31, 2007 | 9.70 | (.11) | 1.28 | 1.17 | — | 10.87 | 12.06 | 33,893 | 1.86 | (1.05) | 110.80 |
| July 31, 2006 | 9.63 | (.09) f | .16 | .07 | — | 9.70 | .73 f | 37,906 | 1.74 f | (.88) f | 110.50 |
| July 31, 2005 | 7.72 | (.11) g | 2.02 | 1.91 | — | 9.63 | 24.74 | 38,881 | 1.85 | (1.26) g | 73.81 |
| July 31, 2004 | 6.89 | (.10) | .93 | .83 | — | 7.72 | 12.05 | 36,770 | 1.83 | (1.35) | 77.95 |
|
| Class M | | | | | | | | | | | |
| January 31, 2009 ** | $9.61 | (.02) | (4.09) | (4.11) | — | $5.50 | (42.77) * | $12,618 | .92 * | (.38) * | 118.29 * |
| July 31, 2008 | 10.66 | (.09) | (.96) | (1.05) | — | 9.61 | (9.85) | 15,559 | 1.68 | (.89) | 141.16 |
| July 31, 2007 | 9.48 | (.08) | 1.26 | 1.18 | — | 10.66 | 12.45 | 23,971 | 1.61 | (.80) | 110.80 |
| July 31, 2006 | 9.40 | (.06) f | .14 | .08 | — | 9.48 | .85 f | 28,989 | 1.49 f | (.63) f | 110.50 |
| July 31, 2005 | 7.51 | (.08) g | 1.97 | 1.89 | — | 9.40 | 25.17 | 41,068 | 1.60 | (1.01) g | 73.81 |
| July 31, 2004 | 6.69 | (.08) | .90 | .82 | — | 7.51 | 12.26 | 44,375 | 1.58 | (1.10) | 77.95 |
|
| Class R | | | | | | | | | | | |
| January 31, 2009 ** | $10.36 | (.02) | (4.40) | (4.42) | — | $5.94 | (42.66) * | $2,066 | .79 * | (.24) * | 118.29 * |
| July 31, 2008 | 11.47 | (.07) | (1.04) | (1.11) | — | 10.36 | (9.68) | 2,263 | 1.43 | (.64) | 141.16 |
| July 31, 2007 | 10.18 | (.06) | 1.35 | 1.29 | — | 11.47 | 12.67 | 1,802 | 1.36 | (.54) | 110.80 |
| July 31, 2006 | 10.06 | (.04) f | .16 | .12 | — | 10.18 | 1.19 f | 826 | 1.24 f | (.35) f | 110.50 |
| July 31, 2005 | 8.02 | (.07) g | 2.11 | 2.04 | — | 10.06 | 25.44 | 248 | 1.35 | (.73) g | 73.81 |
| July 31, 2004 | 7.12 | (.06) | .96 | .90 | — | 8.02 | 12.64 | 37 | 1.33 | (.88) | 77.95 |
|
| Class Y | | | | | | | | | | | |
| January 31, 2009 ** | $10.98 | — e | (4.67) | (4.67) | — | $6.31 | (42.53) * | $46,261 | .54 * | .01 * | 118.29 * |
| July 31, 2008 | 12.09 | (.02) | (1.09) | (1.11) | — | 10.98 | (9.18) | 76,623 | .93 | (.13) | 141.16 |
| July 31, 2007 | 10.68 | (.01) | 1.42 | 1.41 | — | 12.09 | 13.20 | 177,654 | .86 | (.04) | 110.80 |
| July 31, 2006 | 10.50 | .01 f | .17 | .18 | — | 10.68 | 1.71 f | 213,639 | .74 f | .12 f | 110.50 |
| July 31, 2005 | 8.33 | (.02) g | 2.19 | 2.17 | — | 10.50 | 26.05 | 257,564 | .85 | (.26) g | 73.81 |
| July 31, 2004 | 7.36 | (.03) | 1.00 | .97 | — | 8.33 | 13.18 | 257,709 | .83 | (.35) | 77.95 |
|
See notes to financial highlights at the end of this section.
The accompanying notes are an integral part of these financial statements.
Financial highlights (Continued)
* Not annualized.
** Unaudited.
a Per share net investment income (loss) has been determined on the basis of the weighted average number of shares outstanding during the period.
b Total return assumes dividend reinvestment and does not reflect the effect of sales charges.
c Includes amounts paid through expense offset and brokerage service arrangements (Note 2).
d Reflects an involuntary contractual expense limitation and/or waivers of certain fund expenses in connection with investments in Putnam Prime Money Market Fund in effect during the period. As a result of such limitation and/or waivers, the expenses of each class reflect a reduction of the following amounts (Notes 2 and 5):
| |
| | Percentage of |
| | average net assets |
|
| January 31, 2009 | <0.01% |
|
| July 31, 2008 | <0.01 |
|
| July 31, 2007 | <0.01 |
|
| July 31, 2006 | <0.01 |
|
| July 31, 2005 | <0.01 |
|
| July 31, 2004 | <0.01 |
|
e Amount represents less than $0.01 per share.
f Reflects a non-recurring reimbursement from Putnam Investments relating to the calculation of certain amounts paid by the fund to Putnam in previous years for transfer agent services, which amounted to $0.01 per share and 0.08% of average net assets for the period ended July 31, 2006.
g Reflects a non-recurring accrual related to Putnam Management’s settlement with the SEC regarding brokerage allocation practices, which amounted to the following amounts:
| | |
| | | Percentage of |
| | Per share | average net assets |
|
| Class A | <$0.01 | 0.04% |
|
| Class B | <0.01 | 0.03 |
|
| Class C | <0.01 | 0.04 |
|
| Class M | <0.01 | 0.03 |
|
| Class R | <0.01 | 0.05 |
|
| Class Y | <0.01 | 0.04 |
|
The accompanying notes are an integral part of these financial statements.
38
Notes to financial statements 1/31/09 (Unaudited)
Note 1: Significant accounting policies
Putnam Vista Fund (the “fund”), a Massachusetts business trust, is registered under the Investment Company Act of 1940, as amended, as a diversified, open-end management investment company. The fund seeks capital appreciation by investing primarily in common stocks selected for above-average growth potential. The fund may also trade securities for short-term profits.
The fund offers class A, class B, class C, class M, class R and class Y shares. Class A and class M shares are sold with a maximum front-end sales charge of 5.75% and 3.50%, respectively, and generally do not pay a contingent deferred sales charge. Class B shares, which convert to class A shares after approximately eight years, do not pay a front-end sales charge and are subject to a contingent deferred sales charge, if those shares are redeemed within six years of purchase. Class C shares have a one-year 1.00% contingent deferred sales charge and do not convert to class A shares. Class R shares, which are offered to qualified employee-benefit plans, are sold at net asset value. The expenses for class A, class B, class C, class M and class R shares may differ based on the distribution fee of each class, which is identified in Note 2. Class Y shares, which are sold at net asset value, are generally subject to the same expenses as class A, class B, class C, class M an d class R shares, but do not bear a distribution fee. Class Y shares are generally only available to corporate and institutional clients and clients in other approved programs.
A 1.00% redemption fee may apply on any shares that are redeemed (either by selling or exchanging into another fund) within 7 days of purchase. The redemption fee is accounted for as an addition to paid-in-capital.
Investment income, realized and unrealized gains and losses and expenses of the fund are borne pro-rata based on the relative net assets of each class to the total net assets of the fund, except that each class bears expenses unique to that class (including the distribution fees applicable to such classes). Each class votes as a class only with respect to its own distribution plan or other matters on which a class vote is required by law or determined by the Trustees. If the fund were liquidated, shares of each class would receive their pro-rata share of the net assets of the fund. In addition, the Trustees declare separate dividends on each class of shares.
In the normal course of business, the fund enters into contracts that may include agreements to indemnify another party under given circumstances. The fund’s maximum exposure under these arrangements is unknown as this would involve future claims that may be, but have not yet been, made against the fund. However, the fund’s management team expects the risk of material loss to be remote.
The following is a summary of significant accounting policies consistently followed by the fund in the preparation of its financial statements. The preparation of financial statements is in conformity with accounting principles generally accepted in the United States of America and requires management to make estimates and assumptions that affect the reported amounts of assets and liabilities in the financial statements and the reported amounts of increases and decreases in net assets from operations during the reporting period. Actual results could differ from those estimates.
A) Security valuation Investments for which market quotations are readily available are valued at the last reported sales price on their principal exchange, or official closing price for certain markets. If no sales are reported — as in the case of some securities traded over-the-counter — a security is valued at its last reported bid price. Many securities markets and exchanges outside the U.S. close prior to the close of the New York Stock Exchange and therefore the closing prices for securities in such markets or on such exchanges may not fully reflect events that occur after such close but before the close of the New York Stock Exchange. Accordingly, on certain days, the fund will fair value foreign equity securities taking into account multiple factors, including movements in the U.S. securities markets. The number of days on which fair value prices will be used will depend on market activity and it is possib le that fair value prices will be used by the fund to a significant extent. At January 31, 2009, fair value pricing was used for certain foreign securities in the portfolio. Securities quoted in foreign currencies, if any, are translated into U.S. dollars at the current exchange rate. To the extent a pricing service or dealer is unable to value a security or provides a valuation which Putnam Investment Management, LLC (“Putnam Management”), the fund’s manager, a wholly-owned subsidiary of Putnam Investments, LLC, does not believe accurately reflects the security’s fair value, the security will be valued at fair value by Putnam Management. Certain investments, including certain restricted and illiquid securities and derivatives, are also valued at fair value following procedures approved
39
by the Trustees. Such valuations and procedures are reviewed periodically by the Trustees. The fair value of securities is generally determined as the amount that the fund could reasonably expect to realize from an orderly disposition of such securities over a reasonable period of time. By its nature, a fair value price is a good faith estimate of the value of a security at a given point in time and does not reflect an actual market price, which may be different by a material amount.
B) Joint trading account Pursuant to an exemptive order from the Securities and Exchange Commission (the “SEC”), the fund may transfer uninvested cash balances, including cash collateral received under security lending arrangements, into a joint trading account along with the cash of other registered investment companies and certain other accounts managed by Putnam Management. These balances may be invested in issues of short-term investments having maturities of up to 397 days for collateral received under security lending arrangements and up to 90 days for other cash investments.
C) Repurchase agreements The fund, or any joint trading account, through its custodian, receives delivery of the underlying securities, the market value of which at the time of purchase is required to be in an amount at least equal to the resale price, including accrued interest. Collateral for certain tri-party repurchase agreements is held at the counterparty’s custodian in a segregated account for the benefit of the fund and the counterparty. Putnam Management is responsible for determining that the value of these underlying securities is at all times at least equal to the resale price, including accrued interest.
D) Security transactions and related investment income Security transactions are recorded on the trade date (the date the order to buy or sell is executed). Gains or losses on securities sold are determined on the identified cost basis.
Interest income is recorded on the accrual basis. Dividend income, net of applicable withholding taxes, is recognized on the ex-dividend date except that certain dividends from foreign securities, if any, are recognized as soon as the fund is informed of the ex-dividend date. Non-cash dividends, if any, are recorded at the fair market value of the securities received. Dividends representing a return of capital or capital gains, if any, are reflected as a reduction of cost and/or as a realized gain.
All premiums/discounts are amortized/accreted on a yield-to-maturity basis.
E) Foreign currency translation The accounting records of the fund are maintained in U.S. dollars. The market value of foreign securities, currency holdings, and other assets and liabilities is recorded in the books and records of the fund after translation to U.S. dollars based on the exchange rates on that day. The cost of each security is determined using historical exchange rates. Income and withholding taxes are translated at prevailing exchange rates when earned or incurred. The fund does not isolate that portion of realized or unrealized gains or losses resulting from changes in the foreign exchange rate on investments from fluctuations arising from changes in the market prices of the securities. Such gains and losses are included with the net realized and unrealized gain or loss on investments. Net realized gains and losses on foreign currency transactions represent net realized e xchange gains or losses on closed forward currency contracts, disposition of foreign currencies, currency gains and losses realized between the trade and settlement dates on securities transactions and the difference between the amount of investment income and foreign withholding taxes recorded on the fund’s books and the U.S. dollar equivalent amounts actually received or paid. Net unrealized appreciation and depreciation of assets and liabilities in foreign currencies arise from changes in the value of open forward currency contracts and assets and liabilities other than investments at the period end, resulting from changes in the exchange rate. Investments in foreign securities involve certain risks, including those related to economic instability, unfavorable political developments, and currency fluctuations, not present with domestic investments.
F) Futures and options contracts The fund may use futures and options contracts to hedge against changes in the values of securities the fund owns, owned or expects to purchase, or for other investment purposes. The fund may also write options on swaps or securities it owns or in which it may invest to increase its current returns.
The potential risk to the fund is that the change in value of futures and options contracts may not correspond to the change in value of the hedged instruments. In addition, losses may arise from changes in the value of the underlying instruments, if there is an illiquid secondary market for the contracts, or if the counterparty to the contract is unable to perform. Risks may exceed amounts recognized on the Statement of assets and liabilities.When the contract is closed, the fund records a realized gain or loss equal to the difference between the value of the contract at the time it was opened and the value at the time it was closed. Realized gains and losses on purchased options are included in realized gains and losses on investment securities. If a written call option is exercised, the premium originally received
40
is recorded as an addition to sales proceeds. If a written put option is exercised, the premium originally received is recorded as a reduction to the cost of investments.
Futures contracts are valued at the quoted daily settlement prices established by the exchange on which they trade. The fund and the broker agree to exchange an amount of cash equal to the daily fluctuation in the value of the futures contract. Such receipts or payments are known as “variation margin.” Exchange traded options are valued at the last sale price or, if no sales are reported, the last bid price for purchased options and the last ask price for written options. Options traded over-the-counter are valued using prices supplied by dealers. Futures and written option contracts outstanding at period end, if any, are listed after the fund’s portfolio.
G) Securities lending The fund may lend securities, through its agents, to qualified borrowers in order to earn additional income. The loans are collateralized by cash and/or securities in an amount at least equal to the market value of the securities loaned. The market value of securities loaned is determined daily and any additional required collateral is allocated to the fund on the next business day. The risk of borrower default will be borne by the fund’s agents; the fund will bear the risk of loss with respect to the investment of the cash collateral. Income from securities lending is included in investment income on the Statement of operations. At January 31, 2009, the fund had no securities out on loan.
H) Federal taxes It is the policy of the fund to distribute all of its taxable income within the prescribed time and otherwise comply with the provisions of the Internal Revenue Code of 1986, as amended (the“Code”), applicable to regulated investment companies. It is also the intention of the fund to distribute an amount sufficient to avoid imposition of any excise tax under Section 4982 of the Code. The fund is subject to the provisions of FASB Interpretation No. 48, Accounting for Uncertainties in Income Taxes (“FIN 48”). FIN 48 sets forth a minimum threshold for financial statement recognition of the benefit of a tax position taken or expected to be taken in a tax return. The fund did not have any unrecognized tax benefits in the accompanying financial statements. Therefore, no provision has been made for federal taxes on income, capital gains or unrealized appreciation on securities held nor for exci se tax on income and capital gains. Each of the fund’s federal tax returns for the prior three fiscal years remains subject to examination by the Internal Revenue Service.
At July 31, 2008, the fund had a capital loss carryover of $3,071,403,562 available to the extent allowed by the Code to offset future net capital gain, if any. The amount of the carryover and the expiration dates are:
| | | |
| Loss Carryover | Expiration | | |
| | |
| $1,609,033,992 | July 31, 2010 | | |
| | |
| 1,449,973,763 | July 31, 2011 | | |
| | |
| 12,395,807 | July 31, 2016 | | |
| | |
Pursuant to federal income tax regulations applicable to regulated investment companies, the fund has elected to defer to its fiscal year ending July 31, 2009 $219,188,447 of losses recognized during the period November 1, 2007 to July 31, 2008.
The aggregate identified cost on a tax basis is $1,039,054,626, resulting in gross unrealized appreciation and depreciation of $32,102,887 and $166,276,645, respectively, or net unrealized depreciation of $134,173,758.
I) Distributions to shareholders Distributions to shareholders from net investment income are recorded by the fund on the ex-dividend date. Distributions from capital gains, if any, are recorded on the ex-dividend date and paid at least annually. The amount and character of income and gains to be distributed are determined in accordance with income tax regulations, which may differ from generally accepted accounting principles. Dividend sources are estimated at the time of declaration. Actual results may vary. Any non-taxable return of capital cannot be determined until final tax calculations are completed after the end of the fund’s fiscal year. Reclassifications are made to the fund’s capital accounts to reflect income and gains available for distribution (or available capital loss carryovers) under income tax regulations.
Note 2: Management fee, administrative services and other transactions
The fund pays Putnam Management for management and investment advisory services quarterly based on the average net assets of the fund. Such fee is based on the following annual rates: 0.65% of the first $500 million of average net assets, 0.55% of the next $500 million, 0.50% of the next $500 million, 0.45% of the next $5 billion, 0.425% of the next $5 billion, 0.405% of the next $5 billion, 0.39% of the next $5 billion and 0.38% thereafter.
Putnam Management has agreed to waive fees and reimburse expenses of the fund through June 30, 2009 to the extent necessary to ensure that the fund’s expenses do not exceed the simple average of the
41
expenses of all front-end load funds viewed by Lipper Inc. as having the same investment classification or objective as the fund. The expense reimbursement is based on a comparison of the fund’s expenses with the average annualized operating expenses of the funds in its Lipper peer group for each calendar quarter during the fund’s last fiscal year, excluding 12b-1 fees and without giving effect to any expense offset and brokerage/service arrangements that may reduce fund expenses. For the period ended January 31, 2009, Putnam Management did not waive any of its management fee from the fund.
The fund reimburses Putnam Management an allocated amount for the compensation and related expenses of certain officers of the fund and their staff who provide administrative services to the fund. The aggregate amount of all such reimbursements is determined annually by the Trustees.
Custodial functions for the fund’s assets were provided by State Street Bank and Trust Company (“State Street”). Custody fees are based on the fund’s asset level, the number of its security holdings and transaction volumes.
Putnam Investor Services, Inc., an affiliate of Putnam Management, provided investor servicing agent functions to the fund. Prior to December 31, 2008, these services were provided by Putnam Investor Services, a division of Putnam Fiduciary Trust Company (“PFTC”), which is an affiliate of Putnam Management. Putnam Investor Services, Inc. and Putnam Investor Services received fees for investor servicing, subject to certain limitations, based on the number of shareholder accounts in the fund and the level of defined contribution plan assets in the fund. The amounts incurred for investor servicing agent functions provided by affiliates of Putnam Management during the six months ended January 31, 2009 are included in Investor servicing fees in the Statement of operations.
The fund has entered into expense offset arrangements with PFTC and State Street whereby PFTC’s and State Street’s fees are reduced by credits allowed on cash balances. The fund also reduced expenses through brokerage/service arrangements. For the six months ended January 31, 2009, the fund’s expenses were reduced by $11,771 under the expense offset arrangements and by $180,738 under the brokerage/ service arrangements.
Each independent Trustee of the fund receives an annual Trustee fee, of which $694, as a quarterly retainer, has been allocated to the fund, and an additional fee for each Trustees meeting attended. Trustees receive additional fees for attendance at certain committee meetings and industry seminars and for certain compliance-related matters. Trustees also are reimbursed for expenses they incur relating to their services as Trustees.
The fund has adopted a Trustee Fee Deferral Plan (the “Deferral Plan”) which allows the Trustees to defer the receipt of all or a portion of Trustees fees payable on or after July 1, 1995. The deferred fees remain invested in certain Putnam funds until distribution in accordance with the Deferral Plan.
The fund has adopted an unfunded noncontributory defined benefit pension plan (the “Pension Plan”) covering all Trustees of the fund who have served as a Trustee for at least five years and were first elected prior to 2004. Benefits under the Pension Plan are equal to 50% of the Trustee’s average annual attendance and retainer fees for the three years ended December 31, 2005. The retirement benefit is payable during a Trustee’s lifetime, beginning the year following retirement, for the number of years of service through December 31, 2006. Pension expense for the fund is included in Trustee compensation and expenses in the Statement of operations. Accrued pension liability is included in Payable for Trustee compensation and expenses in the Statement of assets and liabilities. The Trustees have terminated the Pension Plan with respect to any Trustee first elected after 2003.
The fund has adopted distribution plans (the “Plans”) with respect to its class A, class B, class C, class M and class R shares pursuant to Rule 12b-1 under the Investment Company Act of 1940. The purpose of the Plans is to compensate Putnam Retail Management Limited Partnership, a wholly-owned subsidiary of Putnam Investments, LLC and Putnam Retail Management GP, Inc., for services provided and expenses incurred in distributing shares of the fund. The Plans provide for payments by the fund to Putnam Retail Management Limited Partnership at an annual rate of up to 0.35%, 1.00%, 1.00%, 1.00% and 1.00% of the average net assets attributable to class A, class B, class C, class M and class R shares, respectively. The Trustees have approved payment by the fund at an annual rate of 0.25%, 1.00%, 1.00%, 0.75% and 0.50% of the average net assets attributable to class A, class B, class C, class M and class R shares, respectively.
For the six months ended January 31, 2009, Putnam Retail Management Limited Partnership, acting as underwriter, received net commissions of $23,856 and $1,385 from the sale of class A and class M shares, respectively, and received $42,763 and $290 in
42
contingent deferred sales charges from redemptions of class B and class C shares, respectively.
A deferred sales charge of up to 1.00% and 0.65% is assessed on certain redemptions of class A and class M shares, respectively. For the six months ended January 31, 2009, Putnam Retail Management Limited Partnership, acting as underwriter, received $47 and no monies on class A and class M redemptions, respectively.
Note 3: Purchases and sales of securities
During the six months ended January 31, 2009, cost of purchases and proceeds from sales of investment securities other than short-term investments aggregated $1,149,311,404 and $1,188,207,061, respectively. There were no purchases or sales of U.S. government securities.
Written option transactions during the period ended January 31, 2009 are summarized as follows:
| | |
| | Contract | Premiums |
| | Amounts | Received |
|
| Written options | | |
| outstanding at | | |
| beginning of period | $— | $— |
|
| Options opened* | 321,171 | 317,523 |
| Options exercised | — | — |
| Options expired | (321,171) | (317,523) |
| Options closed | — | — |
|
| Written options | | |
| outstanding at | | |
| end of period | $— | $— |
|
* Options opened include contract amounts and premiums received of $110,200 and $101,935, respectively, from the December 29, 2008 merger with Putnam OTC & Emerging Growth Fund.
Note 4: Capital shares
At January 31, 2009, there was an unlimited number of shares of beneficial interest authorized. Transactions in capital shares were as follows:
| | | | |
| | Six months ended 1/31/09 | Year ended 7/31/08 |
|
| Class A | Shares | Amount | Shares | Amount |
|
| Shares sold | 5,763,873 | $42,342,044 | 10,262,887 | $114,263,072 |
|
| Shares issued in connection with | — | — | — | — |
| reinvestment of distributions | | | | |
|
| Shares issued in connection with the | 34,850,897 | 213,130,663 | — | — |
| merger of Putnam OTC & Emerging | | | | |
| Growth Fund | | | | |
|
| | 40,614,770 | 255,472,707 | 10,262,887 | 114,263,072 |
|
| Shares repurchased | (18,579,150) | (132,405,499) | (43,387,017) | (484,545,611) |
|
| Net increase (decrease) | 22,035,620 | $123,067,208 | (33,124,130) | $(370,282,539) |
| |
| |
| | Six months ended 1/31/09 | Year ended 7/31/08 |
|
| Class B | Shares | Amount | Shares | Amount |
|
| Shares sold | 435,343 | $2,621,497 | 628,787 | $6,037,977 |
|
| Shares issued in connection with | — | — | — | — |
| reinvestment of distributions | | | | |
|
| Shares issued in connection with the | 5,470,636 | 28,492,712 | — | — |
| merger of Putnam OTC & Emerging | | | | |
| Growth Fund | | | | |
|
| | 5,905,979 | 31,114,209 | 628,787 | 6,037,977 |
|
| Shares repurchased | (5,508,438) | (35,404,921) | (11,166,072) | (106,406,307) |
|
| Net increase (decrease) | 397,541 | $(4,290,712) | (10,537,285) | $(100,368,330) |
|
43
| | | | |
| | Six months ended 1/31/09 | Year ended 7/31/08 |
|
| Class C | Shares | Amount | Shares | Amount |
|
| Shares sold | 183,947 | $1,133,542 | 275,885 | $2,942,216 |
|
| Shares issued in connection with | — | — | — | — |
| reinvestment of distributions | | | | |
|
| Shares issued in connection with the | 949,061 | 5,390,479 | — | — |
| merger of Putnam OTC & Emerging | | | | |
| Growth Fund | | | | |
|
| | 1,133,008 | 6,524,021 | 275,885 | 2,942,216 |
|
| Shares repurchased | (476,423) | (3,202,270) | (1,118,167) | (11,609,551) |
|
| Net increase (decrease) | 656,585 | $3,321,751 | (842,282) | $(8,667,335) |
| |
| |
| | Six months ended 1/31/09 | Year ended 7/31/08 |
|
| Class M | Shares | Amount | Shares | Amount |
|
| Shares sold | 50,735 | $339,019 | 94,018 | $961,422 |
|
| Shares issued in connection with | — | — | — | — |
| reinvestment of distributions | | | | |
|
| Shares issued in connection with the | 881,209 | 4,925,961 | — | — |
| merger of Putnam OTC & Emerging | | | | |
| Growth Fund | | | | |
|
| | 931,944 | 5,264,980 | 94,018 | 961,422 |
|
| Shares repurchased | (258,696) | (1,812,412) | (722,379) | (7,257,354) |
|
| Net increase (decrease) | 673,248 | $3,452,568 | (628,361) | $(6,295,932) |
| |
| |
| | Six months ended 1/31/09 | Year ended 7/31/08 |
|
| Class R | Shares | Amount | Shares | Amount |
|
| Shares sold | 105,951 | $685,999 | 150,436 | $1,664,157 |
|
| Shares issued in connection with | — | — | — | — |
| reinvestment of distributions | | | | |
|
| Shares issued in connection with the | 55,382 | 334,267 | — | — |
| merger of Putnam OTC & Emerging | | | | |
| Growth Fund | | | | |
|
| | 161,333 | 1,020,266 | 150,436 | 1,664,157 |
|
| Shares repurchased | (32,042) | (221,841) | (89,142) | (952,149) |
|
| Net increase | 129,291 | $798,425 | 61,294 | $712,008 |
| |
| |
| | Six months ended 1/31/09 | Year ended 7/31/08 |
|
| Class Y | Shares | Amount | Shares | Amount |
|
| Shares sold | 2,401,122 | $16,469,214 | 3,409,424 | $41,557,783 |
|
| Shares issued in connection with | — | — | — | — |
| reinvestment of distributions | | | | |
|
| Shares issued in connection with the | 1,458,518 | 9,343,847 | — | — |
| merger of Putnam OTC & Emerging | | | | |
| Growth Fund | | | | |
|
| | 3,859,640 | 25,813,061 | 3,409,424 | 41,557,783 |
|
| Shares repurchased | (3,510,582) | (26,858,535) | (11,118,173) | (124,675,947) |
|
| Net increase (decrease) | 349,058 | $(1,045,474) | (7,708,749) | $(83,118,164) |
|
44
Note 5: Investment in Putnam Prime Money Market Fund
The fund invested in Putnam Prime Money Market Fund, an open-end management investment company managed by Putnam Management. Investments in Putnam Prime Money Market Fund were valued at its closing net asset value each business day. Management fees paid by the fund were reduced by an amount equal to the management fees paid by Putnam Prime Money Market Fund with respect to assets invested by the fund in Putnam Prime Money Market Fund. For the period ended January 31, 2009, management fees paid were reduced by $4,632 relating to the fund’s investment in Putnam Prime Money Market Fund. Income distributions earned by the fund were recorded as interest income in the Statement of operations and totaled $121,822 for the period ended January 31, 2009. During the period ended January 31, 2009, cost of purchases and proceeds of sales of investments in Putnam Prime Money Market Fund aggregated $77,594,404 and $160,422,947, respectively.
On September 17, 2008, the Trustees of the Putnam Prime Money Market Fund voted to close that fund effective September 17, 2008. On September 24, 2008, the fund received shares of Federated Prime Obligations Fund, an unaffiliated management investment company registered under the Investment Company Act of 1940, in liquidation of its shares of Putnam Prime Money Market Fund.
Note 6: Acquisition of Putnam OTC & Emerging Growth Fund
On December 29, 2008, the fund issued 34,850,897, 5,470,636, 949,061, 881,209, 55,382 and 1,458,518 class A, class B, class C, class M, class R and class Y shares, respectively for 40,268,975, 6,243,032, 1,095,467, 1,014,742, 63,963 and 1,697,719 class A, class B, class C, class M, class R and class Y, respectively, of Putnam OTC & Emerging Growth Fund to acquire that fund’s net assets in a tax-free exchange approved by the Trustees. The net assets of the fund and Putnam OTC & Emerging Growth Fund on December 26, 2008, were $686,896,227 and $261,617,927, respectively. On December 26, 2008, Putnam OTC & Emerging Growth Fund had accumulated net investment loss of $432,279, accumulated net realized loss of $5,385,247,671 and unrealized depreciation of $52,262,220. The aggregate net assets of the fund immediately following the acquisition were $948,514,154.
Information presented in the Statement of operations and changes in net assets reflect only the operations of Putnam Vista Fund.
Note 7: Regulatory matters and litigation
In late 2003 and 2004, Putnam Management settled charges brought by the SEC and the Massachusetts Securities Division in connection with excessive short-term trading in Putnam funds. Distribution of payments from Putnam Management to certain open-end Putnam funds and their shareholders is expected to be completed in the next several months. These allegations and related matters have served as the general basis for certain lawsuits, including purported class action lawsuits against Putnam Management and, in a limited number of cases, some Putnam funds. Putnam Management believes that these lawsuits will have no material adverse effect on the funds or on Putnam Management’s ability to provide investment management services. In addition, Putnam Management has agreed to bear any costs incurred by the Putnam funds as a result of these matters.
Note 8: New accounting pronouncement
In March 2008, Statement of Financial Accounting Standards No. 161, Disclosures about Derivative Instruments and Hedging Activities (“SFAS 161”) — an amendment of FASB Statement No. 133, was issued and is effective for fiscal years and interim periods beginning after November 15, 2008. SFAS 161 requires enhanced disclosures about how and why an entity uses derivative instruments and how derivative instruments affect an entity’s financial position. Putnam Management is currently evaluating the impact the adoption of SFAS 161 will have on the fund’s financial statement disclosures.
Note 9: Market and credit risk
In the normal course of business, the fund trades financial instruments and enters into financial transactions where risk of potential loss exists due to changes in the market (market risk) or failure of the contracting party to the transaction to perform (credit risk). The fund may be exposed to additional credit risk that an institution or other entity with which the funds have unsettled or open transactions will default.
45
Brokerage commissions (unaudited)
Brokerage commissions are paid to firms that execute trades on behalf of your fund. When choosing these firms, Putnam is required by law to seek the best execution of the trades, taking all relevant factors into consideration, including expected quality of execution and commission rate. Listed below are the largest relationships based upon brokerage commissions for your fund and the other funds in Putnam’s U.S. Small- and Mid-Cap group for the year ended January 31, 2009. The Putnam mutual funds in this group are Putnam Capital Opportunities Fund, Putnam Mid Cap Value Fund, Putnam New Opportunities Fund, Putnam Small Cap Growth Fund, Putnam Small Cap Value Fund, Putnam Vista Fund, Putnam VT Capital Opportunities Fund, Putnam VT Mid Cap Value Fund, Putnam VT New Opportunities Fund, Putnam VT Small Cap Value Fund, and Putnam VT Vista Fund.
The top five firms that received brokerage commissions for trades executed for the U.S. Small- and Mid-Cap group are (in descending order) Citigroup Global Markets, UBS Securities, Credit Suisse First Boston, Morgan Stanley & Co., and J.P. Morgan Securities. Commissions paid to these firms together represented approximately 43% of the total brokerage commissions paid for the year ended January 31, 2009.
Commissions paid to the next 10 firms together represented approximately 32% of the total brokerage commissions paid during the period. These firms are Barclays Capital, Cowen & Company, Goldman, Sachs & Co., Lehman Brothers, Merrill Lynch, Pierce, Fenner and Smith, Oppenheimer & Co., Piper Jaffray & Co., RBC Capital Markets, Wachovia Securities, and Weeden & Co.
Commission amounts do not include “mark-ups” paid on bond or derivative trades made directly with a dealer. Additional information about brokerage commissions is available on the Securities and Exchange Commission (SEC) Web site at www.sec.gov. Putnam funds disclose commissions by firm to the SEC in semiannual filings on Form N-SAR.
46
The Putnam family of funds
The following is a list of Putnam’s open-end mutual funds offered to the public. Investors should carefully consider the investment objective, risks, charges, and expenses of a fund before investing. For a prospectus containing this and other information for any Putnam fund or product, call your financial advisor at 1-800-225-1581 and ask for a prospectus. Please read the prospectus carefully before investing.
| |
| Growth | Value |
| Growth Opportunities Fund | Convertible Income-Growth Trust |
| International New Opportunities Fund* | Equity Income Fund |
| New Opportunities Fund | The George Putnam Fund of Boston |
| Small Cap Growth Fund* | The Putnam Fund for Growth and Income |
| Vista Fund | International Growth and Income Fund* |
| Voyager Fund | Mid Cap Value Fund |
| | Small Cap Value Fund* |
| Blend | |
| Capital Opportunities Fund* | Income |
| Europe Equity Fund* | American Government Income Fund |
| Global Equity Fund* | Diversified Income Trust |
| Global Natural Resources Fund* | Floating Rate Income Fund |
| International Capital Opportunities Fund* | Global Income Trust* |
| International Equity Fund* | High Yield Advantage Fund* |
| Investors Fund | High Yield Trust* |
| Research Fund | Income Fund |
| | Money Market Fund† |
| | U.S. Government Income Trust |
* A 1% redemption fee on total assets redeemed or exchanged within 90 days of purchase may be imposed for all share classes of these funds.
† An investment in a money market fund is not insured or guaranteed by the Federal Deposit Insurance Corporation or any other government agency. Although the fund seeks to preserve the value of your investment at $1.00 per share, it is possible to lose money by investing in the fund.
47
Tax-free income
AMT-Free Municipal Fund‡
Tax Exempt Income Fund
Tax Exempt Money Market Fund†
Tax-Free High Yield Fund
State tax-free income funds:
Arizona, California, Massachusetts, Michigan,
Minnesota, New Jersey, New York, Ohio,
and Pennsylvania
Absolute Return
Absolute Return 100 Fund
Absolute Return 300 Fund
Absolute Return 500 Fund
Absolute Return 700 Fund
Global Sector
Global Consumer Fund
Global Energy Fund
Global Financials Fund
Global Health Care Fund**
Global Industrials Fund
Global Natural Resources Fund
Global Technology Fund
Global Telecommunications Fund
Global Utilities Fund††
Asset allocation
Income Strategies Fund
Putnam Asset Allocation Funds — three investment
portfolios that spread your money across a variety
of stocks, bonds, and money market investments.
The three portfolios:
Asset Allocation: Balanced Portfolio
Asset Allocation: Conservative Portfolio
Asset Allocation: Growth Portfolio
Putnam RetirementReady®
Putnam RetirementReady Funds — 10 investment
portfolios that offer diversification among stocks,
bonds, and money market instruments and adjust
to become more conservative over time based
on a target date for withdrawing assets.
The 10 funds:
Putnam RetirementReady 2050 Fund
Putnam RetirementReady 2045 Fund
Putnam RetirementReady 2040 Fund
Putnam RetirementReady 2035 Fund
Putnam RetirementReady 2030 Fund
Putnam RetirementReady 2025 Fund
Putnam RetirementReady 2020 Fund
Putnam RetirementReady 2015 Fund
Putnam RetirementReady 2010 Fund
Putnam RetirementReady Maturity Fund
‡ Prior to November 30, 2008, the fund was known as Putnam AMT-Free Insured Municipal Fund.
** Prior to January 2, 2009, the fund was known as Putnam Health Sciences Trust.
†† Prior to January 2, 2009, the fund was known as Putnam Utilities Growth and Income Fund.
With the exception of money market funds, a 1% redemption fee may be applied to shares exchanged or sold within 7 days of purchase (90 days, for certain funds).
Check your account balances and the most recent month-end performance in the Individual Investors section at www.putnam.com.
48
Fund information
Founded over 70 years ago, Putnam Investments was built around the concept that a balance between risk and reward is the hallmark of a well-rounded financial program. We manage over 100 mutual funds across income, value, blend, growth, asset allocation, absolute return, and global sector categories.
| | |
| Investment Manager | George Putnam, III | Beth S. Mazor |
| Putnam Investment | Robert L. Reynolds | Vice President |
| Management, LLC | Richard B. Worley | |
| One Post Office Square | | James P. Pappas |
| Boston, MA 02109 | Officers | Vice President |
| | Charles E. Haldeman, Jr. | |
| Marketing Services | President | Francis J. McNamara, III |
| Putnam Retail Management | | Vice President and Chief |
| One Post Office Square | Charles E. Porter | Legal Officer |
| Boston, MA 02109 | Executive Vice President, | |
| | Principal Executive Officer, | Robert R. Leveille |
| Custodian | Associate Treasurer and | Vice President and |
| State Street Bank and | Compliance Liaison | Chief Compliance Officer |
| Trust Company | | |
| | Jonathan S. Horwitz | Mark C. Trenchard |
| Legal Counsel | Senior Vice President | Vice President and |
| Ropes & Gray LLP | and Treasurer | BSA Compliance Officer |
| | | |
| Trustees | Steven D. Krichmar | Judith Cohen |
| John A. Hill, Chairman | Vice President and | Vice President, Clerk and |
| Jameson A. Baxter, | Principal Financial Officer | Assistant Treasurer |
| Vice Chairman | | |
| Charles B. Curtis | Janet C. Smith | Wanda M. McManus |
| Robert J. Darretta | Vice President, Principal | Vice President, Senior Associate |
| Myra R. Drucker | Accounting Officer and | Treasurer and Assistant Clerk |
| Charles E. Haldeman, Jr. | Assistant Treasurer | |
| Paul L. Joskow | | Nancy E. Florek |
| Elizabeth T. Kennan | Susan G. Malloy | Vice President, Assistant Clerk, |
| Kenneth R. Leibler | Vice President and | Assistant Treasurer and |
| Robert E. Patterson | Assistant Treasurer | Proxy Manager |
| | |
| | | |
This report is for the information of shareholders of Putnam Vista Fund. It may also be used as sales literature when preceded or accompanied by the current prospectus, the most recent copy of Putnam’s Quarterly Performance Summary, and Putnam’s Quarterly Ranking Summary. For more recent performance, please visit www.putnam.com. Investors should carefully consider the investment objective, risks, charges, and expenses of a fund, which are described in its prospectus. For this and other information or to request a prospectus, call 1-800-225-1581 toll free. Please read the prospectus carefully before investing. The fund’s Statement of Additional Information contains additional information about the fund’s Trustees and is available without charge upon request by calling 1-800-225-1581.

Item 2. Code of Ethics:
Not applicable
Item 3. Audit Committee Financial Expert:
Not applicable
Item 4. Principal Accountant Fees and Services:
Not applicable
Item 5. Audit Committee of Listed Registrants
Not applicable
Item 6. Schedule of Investments:
The registrant’s schedule of investments in unaffiliated issuers is included in the report to shareholders in Item 1 above.
Item 7. Disclosure of Proxy Voting Policies and Procedures For Closed-End Management Investment Companies:
Not applicable
Item 8. Portfolio Managers of Closed-End Investment Companies
Not Applicable
Item 9. Purchases of Equity Securities by Closed-End Management Investment Companies and Affiliated Purchasers:
Not applicable
Item 10. Submission of Matters to a Vote of Security Holders:
Not applicable
Item 11. Controls and Procedures:
(a) The registrant's principal executive officer and principal financial officer have concluded, based on their evaluation of the effectiveness of the design and operation of the registrant's disclosure controls and procedures as of a date within 90 days of the filing date of this report, that the design and operation of such procedures are generally effective to provide reasonable assurance that information required to be disclosed by the registrant in this report is recorded, processed, summarized and reported within the time periods specified in the Commission's rules and forms.
(b) Changes in internal control over financial reporting: Not applicable
Item 12. Exhibits:
(a)(1) Not applicable
(a)(2) Separate certifications for the principal executive officer and principal financial officer of the registrant as required by Rule 30a-2(a) under the Investment Company Act of 1940, as amended, are filed herewith.
(b) The certifications required by Rule 30a-2(b) under the Investment Company Act of 1940, as amended, are filed herewith.
SIGNATURES
Pursuant to the requirements of the Securities Exchange Act of 1934 and the Investment Company Act of 1940, the registrant has duly caused this report to be signed on its behalf by the undersigned, thereunto duly authorized.
Putnam Vista Fund
By (Signature and Title):
/s/Janet C. Smith
Janet C. Smith
Principal Accounting Officer
Date: March 31, 2009
Pursuant to the requirements of the Securities Exchange Act of 1934 and the Investment Company Act of 1940, this report has been signed below by the following persons on behalf of the registrant and in the capacities and on the dates indicated.
By (Signature and Title):
/s/Charles E. Porter
Charles E. Porter
Principal Executive Officer
Date: March 31, 2009
By (Signature and Title):
/s/Steven D. Krichmar
Steven D. Krichmar
Principal Financial Officer
Date: March 31, 2009