Exhibit 99.1
Presentation to the Annual General MeetingStefan Frischknecht, Fund Manager Portfolio and Performance ReviewThe Swiss Helvetia Fund, Inc. September 11, 2020
Agenda 1 01 Performance 02 Portfolio positioning 03 Outlook 04 Case for Swiss equities
Performance
Performance NAV and price performance in USD 3 Source: Schroders, fund performance as published on website (www.swzfund.com); July 31, 2020; year-to-date performance as at July 31, 2020. Performance shown represents past performance. Past performance is no guarantee of future results and current performance may be higher or lower than the performance shown. Performance in USD %Based on Net Asset Value YTD 2020 1 year 3 yearsp.a. 5 yearsp.a. SWZ 2.06% 9.32% 6.12% 5.55% Swiss Performance Index, SPI 2.46% 11.48% 8.39% 7.74% Difference NAV -0.40 % -2.16% -2.27% -2.19% Performance in USD %Based on Market Price YTD 2020 1 year 3 years p.a. 5 yearsp.a. SWZ -1.53% 5.85% 3.45% 5.05% Swiss Performance Index, SPI 2.46% 11.48% 8.39% 7.74% Difference -3.99% -5.63% -4.94% -2.69% Net asset value Share price
Since July 1, 2014:Since Schroders took over as Fund adviser, relative performance is behind benchmark:From start, there was a negative impact from private equity / venture investments of the predecessorOur style bias towards ‘value’ rather than growth met headwinds, mainly over the past couple of years(value variant of MSCI Switzerland underperformed the ‘growth’ counterpart by approx. 3.5%)2019 has been a strong year for equity markets, and the cash held at the end of 2018 (after the tender offer in a volatile December month) represented a drag on relative performanceFurthermore, 2019 was a ‘large cap year’; being underweight the index heavyweights was not helpfulLast 12 monthsStock picking was positive, +3.0 %However, headwinds from style bias (overweight value as well as small & mid caps) could not be compensatedAfter costs, performance was -4.8% behind benchmarkYear to dateStock picking was an additional positive of +1.6%YTD relative performance after fees: -0.4%Small & mid cap overweight was a headwind (they the SPI by -2.8%) Performance comment Driving factors for relative performance of NAV 4 ySource: Schroders, fund performance as published on website (www.swzfund.com), Bloomberg for index performance, July 31, 2020; year-to-date performance as at July 31, 2020.Performance shown represents past performance. Past performance is no guarantee of future results and current performance may be higher or lower than the performance shown.
Performance attribution – stock level Top & Bottom 10 contributions to relative performance YTD 2020 5 Source: Schroders, FactSet, July 31, 2020; “over” means overweight; “under” means underweight compared to Swiss Performance Index; “zero” means no position. Top ten stock contributions (USD) Bottom ten stock contributions (USD) Total effect % Logitech (over) 1.3 Tecan (over) 0.7 VZ Holding (over) 0.5 Swiss Re (under) 0.5 BKW (over) 0.4 LafargeHolcim (zero) 0.3 Dufry (zero) 0.2 Adecco (zero) 0.2 SIG Combibloc (over) 0.2 Galenica (over) 0.2 Total effect % Lonza (zero) -1.3 Spineart (over) -1.1 Swiss Life (over) -0.7 Aryzta (over) -0.6 Givaudan (zero) -0.5 Swatch (Reg.) (over) -0.5 Nestlé (under) -0.4 Helvetia (over) -0.3 Richemont (over) -0.3 Sulzer (over) -0.2
Performance attribution – stock level Top & Bottom 10 contributions to relative performance 1 year 6 Source: Schroders, FactSet, July 31, 2020; “over” means overweight; “under” means underweight compared to Swiss Performance Index; “zero” means no position. Top ten stock contributions (USD) Bottom ten stock contributions (USD) Total effect % Logitech (over) 1.5 Tecan (over) 0.7 VZ Holding (over) 0.6 SIG Combibloc (over) 0.4 BKW (over) 0.4 Swiss Re (under) 0.3 Implenia (over) 0.3 ams (under) 0.2 Novartis (under) 0.2 Swatch (Bearer) (zero) 0.2 Total effect % Lonza (zero) -1.2 Spineart (over) -1.1 Swatch (Reg.) (over) -0.8 Swiss Life (over) -0.8 Givaudan (zero) -0.6 Aryzta (over) -0.4 Roche (under) -0.4 Sika (under) -0.3 Richemont (over) -0.3 Helvetia (over) -0.3
Portfolio positioning
Top ten holdings absolute Top relative weights Portfolio positioning As per July 31, 2020 8 Source: Schroders, JP Morgan, Bloomberg, July 31, 2020 Name Absolute weight Nestlé 18.1% Roche 13.8% Novartis 12.2% Zurich Insurance 4.1% Logitech 3.8% Richemont 3.1% Swiss Life 2.6% ABB 2.3% Tecan 2.1% Partners Group 2.0% Total 64.1% Name Relative weight % Logitech +3.0% Swiss Life +1.9% Tecan +1.8% VZ Holding +1.6% Swatch (Reg.) +1.6% Nestlé -4.2% Lonza -3.0% Givaudan -2.1% Alcon -1.9% Roche -1.8%
Portfolio positioning ICB classification 9 Source: Schroders, JP Morgan, Bloomberg, July 31, 2020 SWZ SPI Rel. % 25.9% 29.3% -3.4% 18.1% 24.1% -6.0% 9.2% 8.9% 0.3% 10.3% 6.4% 3.9% 6.1% 6.2% -0.1% 2.9% 5.3% -2.4% 0.0% 3.2% -3.2% 0.0% 2.8% -2.8% 5.7% 2.8% 2.9% 0.0% 2.7% -2.7% 5.4% 2.1% 3.3% 2.5% 1.9% 0.6% 0.0% 1.4% -1.4% 3.1% 1.1% 2.0% 0.0% 1.0% -1.0% 0.7% 0.5% 0.2% 1.5% 0.2% 1.3% 0.0% 0.1% -0.1% 0.0% 0.0% 0.0% 0.0% 0.0% 0.0% 0.0% 0.0% 0.0% 0.0% 0.0% 0.0% 0.0% 0.0% 0.0% 5.9% 0.0% 5.9% 2.7% 0.0% 2.7%
Portfolio positioning Changes in positioning in YTD 2020 10 Source: Schroders, July 31, 2020. New Positions ams Geberit SGS SoftwareOne Swiss Re Increased Positions ABB Helvetia Nestlé Partners Group Swiss Life Zurich Insurance Sold Positions Aryzta Bucher Feintool Implenia Kuros Sunrise HY 2020 Decreased Positions Cembra Money Bank Credit Suisse Julius Baer Sulzer UBS New Positions Stadler Rail Increased Positions Geberit July 2020 Decreased Positions Sold Positions
Risk measures (ex private equity) Portfolio turnover Portfolio positioning Key statistical measures 11 Source: Schroders, Aladdin View, July 31, 2020. Swiss Helvetia Fund July 31, 2020 July 31, 2019 Tracking error 2.4% 2.4% Beta 0.97 0.89 Relative VaR (95%) 1.1% 1.1% Volatility 20.2% 11.1% Active share 32.3% 37.6% Swiss Helvetia Fund Turnover in % of AuM Q2 2020 3% / 6% Turnover in % of AuM HY 2020 13% / 16% Turnover calculation method:(lesser of buys or sells) / (average AuM)(sells) / (average AuM)
Outlook
Outlook Earnings expectations 13 Source: Bloomberg, July 31, 2020 Consensus EPS development – MSCI World
Investment outlook Swiss franc development 14 Source: Swiss National Bank, December 2000 = 100, July 31, 2020 Trade weighted exchange rate index – real, CPI-based
Investment outlook Global comparison of dividend yield versus government bond yield 15 Source: Schroders, Bloomberg, July 31, 2020.
Investment outlook Global comparison of earnings expectations Source: Schroders, Bloomberg, July 31, 2020; all earnings converted into USD. 16
Unprecedented central bank interventionsGovernments attempt to save economyCompared to low / negative interest rates, stocks offer an attractive dividendMacroeconomic data improving (global, US & European economic surprise indices) Global GDP ex China will only start to grow earliest Q2Some sectors might take much longer to recoverTrade war, US elections, Brexit, ItalExit, etc. are risks that might come into focus again Outlook & market situation Coronavirus driving major uncertainty 17 Source: Schroders, 30 June 2020 Positives Negatives Global Swiss Many market leaders with superior growth potentialTrade (Baltic Dry Index) recovered sharplyMore resilient balance sheets Comeback of “Big Government”
Case for Switzerland
The Swiss stock market has a large proportion of global market leaders (not only among large corporations), with competitive advantageHigh innovation rateGlobal diversification helps in the current environment of synchronized growthGenerally strong ESG performance and absence of “sin stocks”Swiss companies remained competitive despite the historic appreciation of the Swiss francThe difference between dividend yield and 10 year government bond yield stands out Why are Swiss equities attractive? Source: Schroders. Views expressed are the portfolio management team’s view and not necessarily a «house view». These views are subject to change. 19
The World Economic Forum has been looking into drivers of competitiveness and prosperity in 137 economies. Amongst others, the following help explain the strong position of Switzerland:InnovationInfrastructureeducationlabor market efficiencymacroeconomic environmentbusiness sophisticationSwitzerland has been ranked within the top 5 over the last 15 years. Switzerland offers an attractive business environment 20 Source: World Economic Forum, Global Competitiveness Report 2019, rank out of 141 economies. See also: http://www.prosperity.com/rankings: The Legatum Institute, a London based think tank published its annual global prosperity index, where Switzerland ranked number 3 based on 104 variables split into 9 sub indices (economic quality, business environment, governance, education, health, safety & security, personal freedom, social capital and natural environment).
Switzerland is an innovation leader 21 Source: European Innovation Scoreboard 2020 Modest Innovators Moderate Innovators Strong Innovators Innovation Leaders
Global leadership results in high profitability Swiss company leadership transforms into margins 22 Source: Schroders, Bloomberg, December 31, 2019.
Swiss companies are very international Source: Morgan Stanley, June 13, 2017. 23 Europeex domestic APAC MEA LATAM N. America Domestic Europeex domestic APAC MEA LATAM N. America Domestic Europe MEA APAC Domestic
Long term outperformance of Swiss equities 24 Source: Schroders, July 31, 2020. All data in USD. Views expressed are the portfolio management team’s view and not necessarily a «house view». These views are subject to change.Performance shown represents past performance. Past performance is no guarantee of future results and current performance may be higher or lower than the performance shown. Long-term reasons to investLong-term historic outperformance due to:Many global leadersBalanced geographical diversificationHigh innovation rateHighly skilled and productive labour forceHigh profit marginsPolitical system (stability, taxes, labour law)Quality infrastructureLow debt (at companies and government)Strong CHF seen as asset, not disadvantage 2.9% p.a. in USD 10.3% p.a. in USD 7.4% p.a. in USD
Swiss companies are used to an appreciating Swiss Franc. High efficiency and strong focus on productivity gainsHigh innovation rateMarket leaders in their respective nichesGlobal production footprint provides a substantial natural hedgeSolid balance sheetsSharp moves in exchanges rate such as happened in 2011 and 2015 had short term impacts but were successfully absorbed after 1-2 years in terms of margin recovery CHF appreciation is nothing new Source: Schroders, Bloomberg, July 31, 2020. Views expressed are the portfolio management team’s view and not necessarily a «house view». These views are subject to change. 25
Swiss Equity Market Attractive risk / return profile compared to Europe 26 Source: Bloomberg, July 31, 2020, all data in USD.Performance shown represents past performance. Past performance is no guarantee of future results and current performance may be higher or lower than the performance shown. Switzerland10.2% p.a. / Volatility 17.8% Europe6.2% p.a. / Volatility 21.0% USA10.5% p.a. / Volatility 16.8%
Swiss Equity Market World’s Top 10 Countries by Market Cap 27 Source: Bloomberg, World Bank, July 31, 2020.*Most recent year: 2008. Rank Market Mkt Cap (US$ trillion) 1 USA 30.4 2 China 8.5 3 Japan 6.2 4 Hong Kong 4.9 5 Saudi Arabia 2.4 6 France 2.4 7 India 2.2 8 Germany 2.1 9 Canada 1.9 10 United Kingdom* 1.9 11 Switzerland 1.8 Top 10 62.9 World 68.7
Swiss Equity Market High concentration in Swiss Performance Index 28 Source: Bloomberg, Schroders, July 31, 2020. Swiss Performance Index (SPI) SPI compared to SWZ The Swiss Performance Index’s composition is inefficient and highly concentratedThe Swiss Helvetia Fund takes advantage of diversification benefits
Performance of The Swiss Helvetia Fund Compared to ETF and European Index since introduction of the EURO 29 Source: Schroders, Bloomberg July 31, 2020.Performance shown represents past performance. Past performance is no guarantee of future results and current performance may be higher or lower than the performance shown. Swiss ETF The Swiss Helvetia Fund MSCI Europe (ex Switzerland)
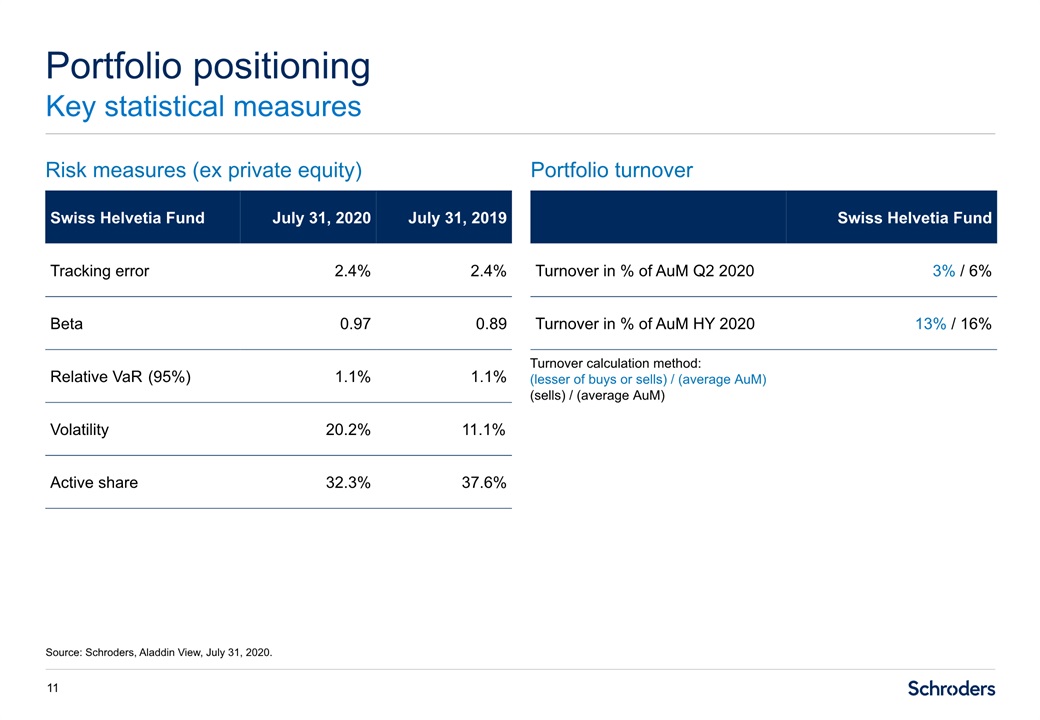
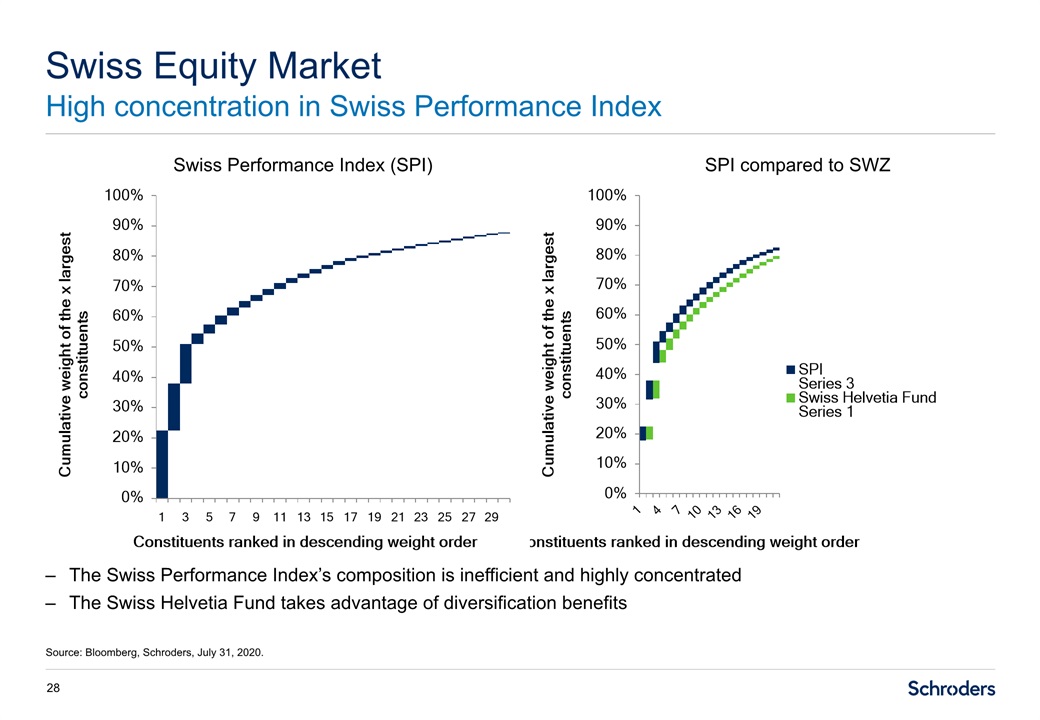
Important information 30 The Fund is a closed-end investment product. Common stock of the Fund is only available for purchase/sale on the NYSE at the then current market price. An investment in the Fund is not a deposit of a bank and is not insured or guaranteed by the Federal Deposit Insurance Corporation or any other government agency.This presentation is intended to be for information purposes only and it is not intended as promotional material in any respect. The material is not intended as an offer or solicitation for the purchase or sale of the Fund’s shares or any other financial instrument. The material is not intended to provide, and should not be relied on for, accounting, legal or tax advice, or investment recommendations. Information herein is believed to be reliable but Schroder Investment Management North America Inc. does not warrant its completeness or accuracy.The returns presented represent past performance and are not necessarily representative of future returns, which may vary. The value of investments can fall as well as rise as a result of market or currency movements.All investments, domestic and foreign, involve risks, including the risk of possible loss of principal. The market value of a fund’s portfolio may decline as a result of a number of factors, including adverse economic and market conditions, prospects of stocks in the portfolio, changing interest rates, and real or perceived adverse competitive industry conditions. Investing overseas involves special risks including among others risks related to political or economic instability, foreign currency (such as exchange, valuation, and fluctuation) risk, market entry or exit restrictions, illiquidity, and taxation. The Swiss securities markets have substantially less trading volume than the U.S. securities markets. Additionally, the capitalization of the Swiss securities markets is highly concentrated. Securities of some companies located in Switzerland will be less liquid and more volatile than securities of comparable U.S. companies. This combination of lower volume and greater concentration in the Swiss securities markets may create a risk of greater price volatility than in the U.S. securities markets. The views and forecasts contained herein are those of the Schroders Swiss Equities team and are subject to change. The information and opinions contained in this document have been obtained from sources we consider to be reliable. No responsibility can be accepted for errors of facts obtained from third parties. Reliance should not be placed on the views and information in the document when taking individual investment and/or strategic decisions.Definitions: Active share represents the proportion of stock holdings in the Fund that is different from the properties found in the benchmark. Beta measures the sensitivity of the Fund to the movements of its benchmark. Volatility is measured by Standard deviation, which is the risk or volatility of an investment’s return over a particular time period; the greater the number, the greater the risk or volatility. Tracking error is the difference between the price behavior of a position or a portfolio and the price behavior of a benchmark. VaR is Value at Risk, a widely used risk measure of the risk of loss on a specific portfolio of financial exposures.For more information, visit www.swzfund.com