
The Swiss Helvetia Fund, Inc.
Invest in Switzerland
Stefan Frischknecht, CFA
Fund Manager
October 27, 2015

THE SWISS HELVETIA FUND, INC.
Agenda
n Case for Swiss equities
n Description of “The Swiss Helvetia Fund, Inc.” (SWZ US)
n The Adviser: Schroders
n Investment Philosophy and Process
n Performance
n Portfolio positioning and changes
n Outlook
n Conclusion
n Appendix
1
Source: Schroders

THE SWISS HELVETIA FUND, INC.
Why invest in The Swiss Helvetia Fund, Inc.
Isn’t this a single country equity fund which invests only in a small nation?
Switzerland = approx. 1/300 of global GDP
= approx. 1/1000 of world population
= approx. 1/1000 of world population
= approx. 1/3000 of land area of our planet
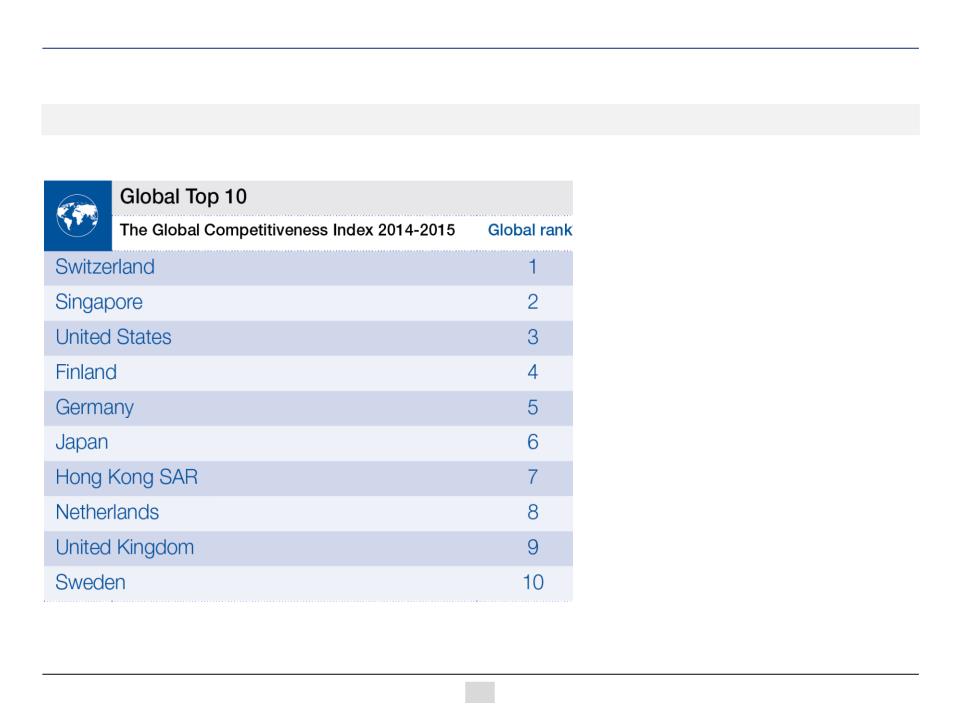
However, Switzerland is one of the top 10 global stock markets as measured by capitalization.
The size of the Swiss stock market is the result of its successful companies.
The size of the Swiss stock market is the result of its successful companies.
2
Source: Schroders, CIA World Fact Book (www.cia.gov).

The case for Swiss equities
THE SWISS HELVETIA FUND, INC.
Swiss stocks also leading in global competitiveness
Very high percentage of Swiss index members are global leaders
4
1 Source: Schroder research and company own websites, Forbes 2014, EvaluateMedTech October 2014, BloombergNews July 17, 2014, Chemweek Aug 23, 2013, GlobalCement Dec
9, 2013, Leffingwell May 15, 2015, Staffingindustry Oct 16, 2013, Reuters May 19, 2015, Rigzone July 20, 2011. The views and forecasts contained herein are those of the Schroders
Swiss Equities team based on information that they believe to be reliable.
9, 2013, Leffingwell May 15, 2015, Staffingindustry Oct 16, 2013, Reuters May 19, 2015, Rigzone July 20, 2011. The views and forecasts contained herein are those of the Schroders
Swiss Equities team based on information that they believe to be reliable.
Name | Global rank within market | Market |
Nestle | 1 | Food |
Novartis | 2 | Drugs |
Roche | 1 | Diagnostics |
UBS | 1 | Wealth management |
ABB | 2 | Power transmission / distribution |
Richemont | 1 | Jewelry |
Syngenta | 1 | Crop protection |
Swiss Re | 2 | Reinsurance |
LafargeHolcim | 1 | Cement |
Givaudan | 1 | Flavours / fragrance |
Adecco | 1 | Staffing |
Swatch | 1 | Watches |
SGS | 1 | Inspection / testing |
Transocean | 1 | Ocean drilling rigs |
At points over the past several years, 70%
of large caps in the Swiss Market Index
(“SMI”) have been ranked first or second
within their markets on a global basis.1
of large caps in the Swiss Market Index
(“SMI”) have been ranked first or second
within their markets on a global basis.1
Approximately 40% of Swiss mid caps, too.
THE SWISS HELVETIA FUND, INC.
How is global leadership of Swiss stocks possible?
Switzerland offers an attractive business environment
5
Source: World Economic Forum, Global Competitiveness Report 2014-15, rank out of 144 economies.
The World Economic Forum
has been looking into drivers of
competitiveness and prosperity
in 144 economies. Amongst
others, the following help
explain the strong position of
Switzerland:
has been looking into drivers of
competitiveness and prosperity
in 144 economies. Amongst
others, the following help
explain the strong position of
Switzerland:
- innovation
- infrastructure
- education
- labor market efficiency
- macroeconomic environment
- business sophistication
- infrastructure
- education
- labor market efficiency
- macroeconomic environment
- business sophistication
THE SWISS HELVETIA FUND, INC.
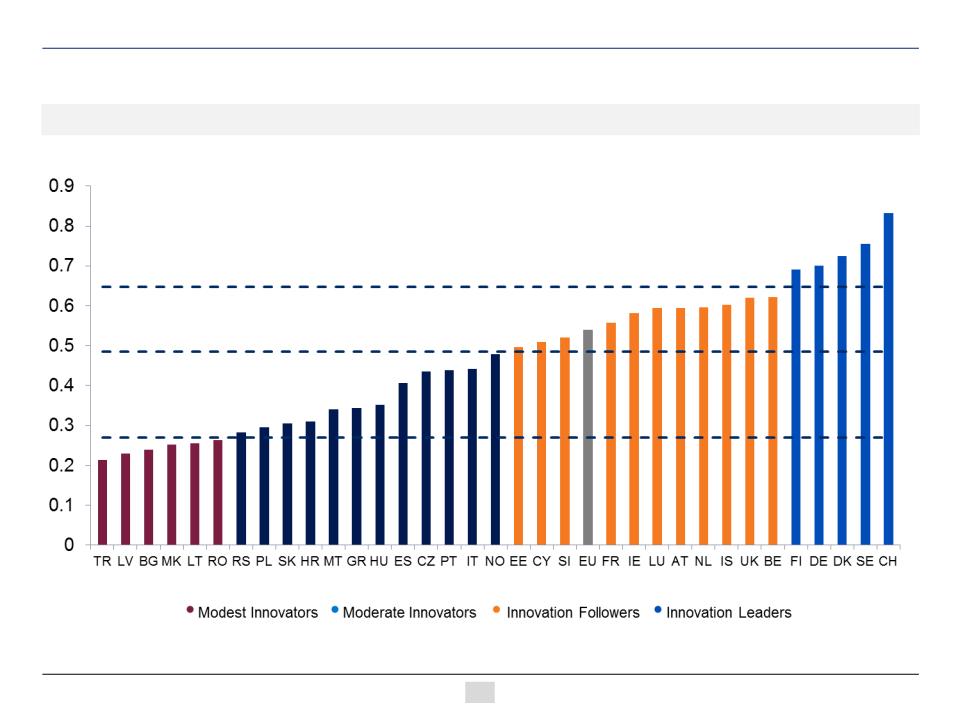
Swiss companies are innovation leaders
Per capita patent filings highest of in Europe
6
Source: Innovation Union Scoreboard 2011 (EU).
THE SWISS HELVETIA FUND, INC.
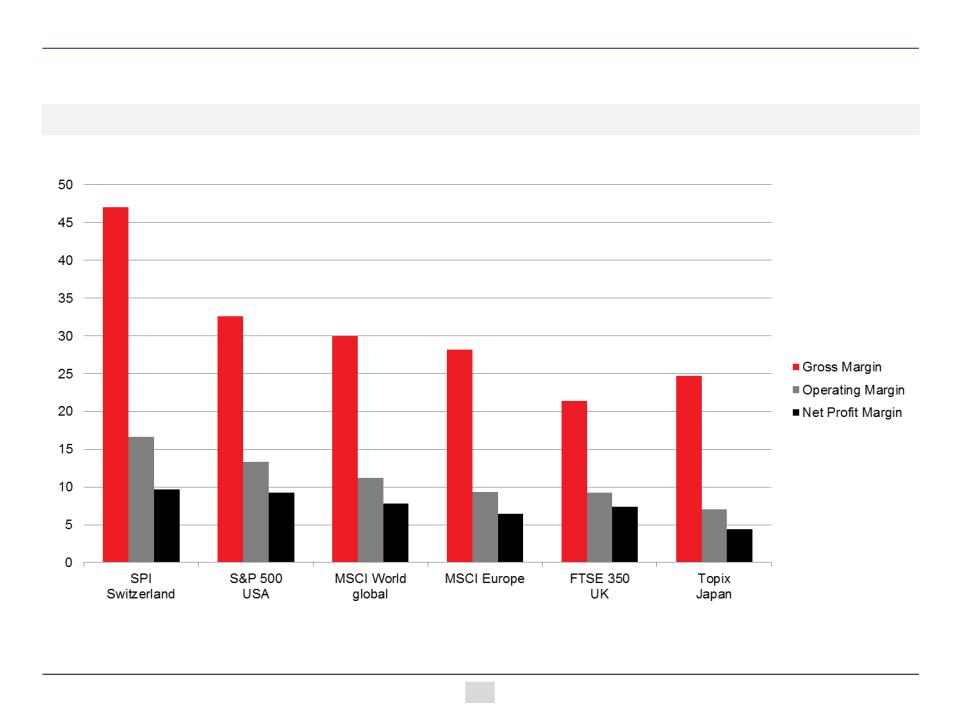
Global leadership results in high profitability
In a textbook manner, Swiss company leadership transforms into margins
7
Source: Schroders, Bloomberg as of December 31, 2014.
THE SWISS HELVETIA FUND, INC.
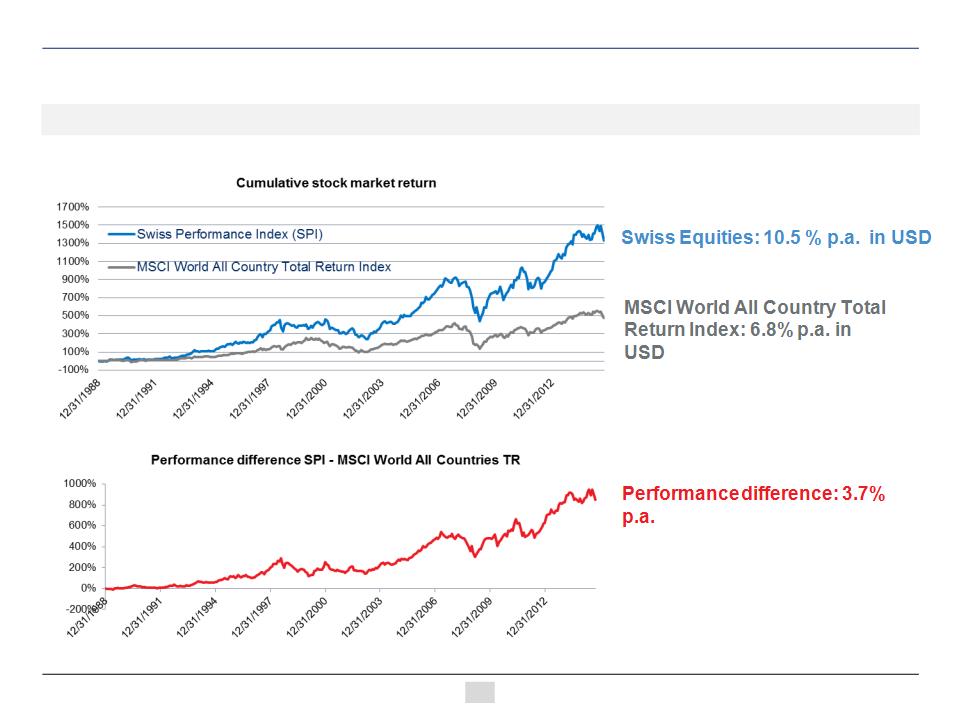
High profitability results in long-term outperformance
Swiss equities significantly outperformed global stocks for over 25 years
8
Source: Bloomberg, performance in USD as of September 30, 2015. Past performance is no guarantee of future results.

THE SWISS HELVETIA FUND, INC.
Swiss companies are geographically diversified
Swiss companies regional sales exposure
9
Source: HSBC, July 3, 2014; *UBS February 10, 2015, Data based on averages.
Europe
ex domestic
ex domestic
MEA
Unclassified
APAC
Americas
Domestic
Europe
ex domestic
ex domestic
MEA
Unclassified
APAC
Americas
Domestic
Europe
ex domestic
ex domestic
MEA
Unclassified
APAC
Americas
Domestic
Europe
Unclassified
APAC
Americas
ex US
ex US
Domestic

The Swiss Helvetia Fund, Inc.
THE SWISS HELVETIA FUND, INC.
The Swiss Helvetia Fund, Inc.
Why invest in the Fund?
n Allows US investors to participate in the performance of the entire Swiss equity universe
n The Fund is actively managed by an experienced team out of Zurich, Switzerland
n Track record of team Swiss equities started on January 1, 1999
n Fundamental stock picking (bottom-up)
n Robust portfolio construction and risk management (top-down)
n Style focus on value, quality and size
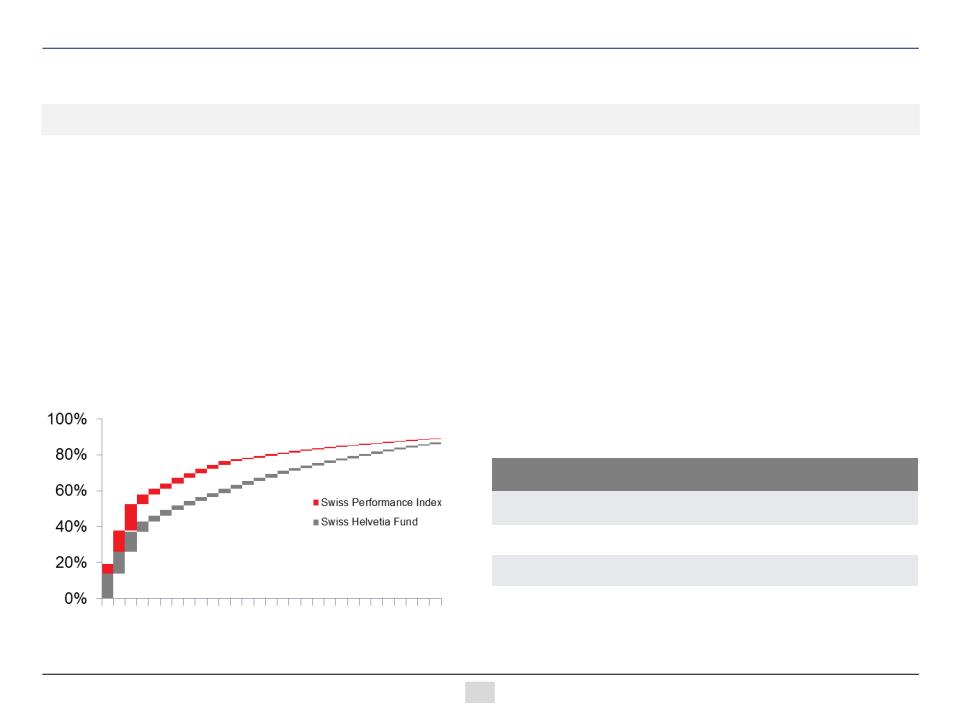
n The Fund has a better diversification compared to the Swiss Performance Index (SPI)
11
Source: Schroders, Bloomberg.
Portfolio weight | SWZ | SPI |
Top 3 positions | 37% | 53% |
Top 5 positions | 46% | 61% |
Top 10 positions | 59% | 74% |

The investment adviser:
Schroders
Schroders
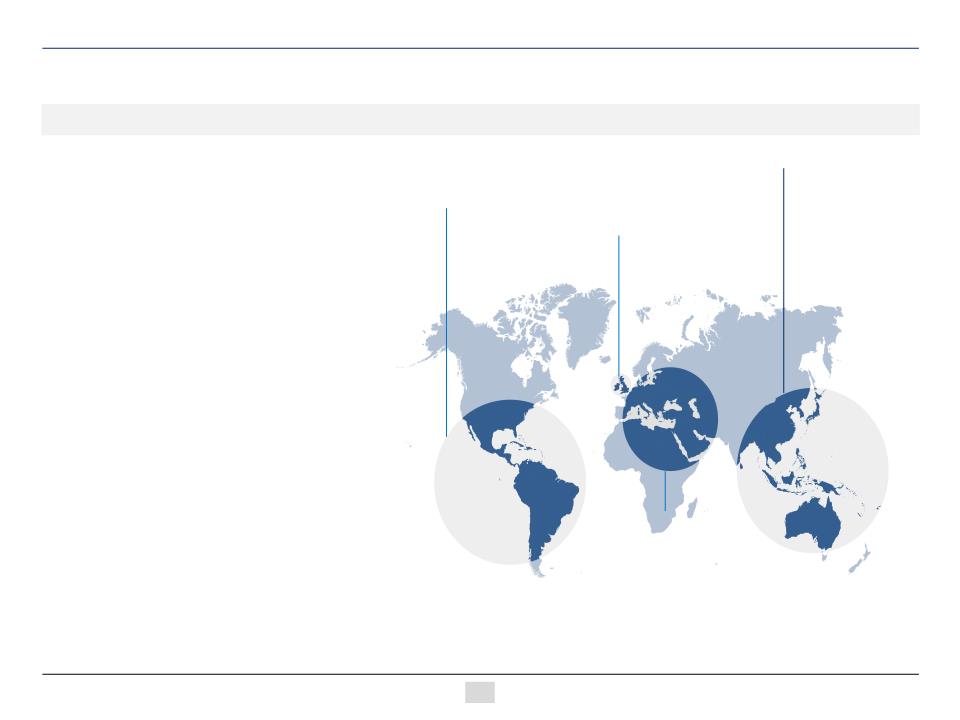
THE SWISS HELVETIA FUND, INC.
Schroders
Focus
n Asset management is our main business
Experience and independence
n Over 200 years of financial services
experience
experience
n Founding Schroder family controls 48%1 of
voting equity
voting equity
Resources
n Well established teams in all key investment
regions
regions
n Over 420 portfolio managers and
analysts worldwide
analysts worldwide
n Over 3,600 personnel in 27 countries
Financial strength
n US $487.4 billion in AUM globally
n Over US $1.5 billion surplus capital
available for building the business
available for building the business
1As of December 31, 2014.
Source: Schroders. Statistics are as of June 30, 2015.
Source: Schroders. Statistics are as of June 30, 2015.
Schroders offices
Key
A Alternatives (Property/EMD/Commodities) E Equities FI Fixed Income
MA Multi-Asset *Wealth management
Investment centers where Schroders has investment capabilities
Numbers represent personnel count
Argentina 2 (E)
Bermuda
Brazil 3 (E/FI/MA)
Cayman Islands*
Americas
UK and
Channel Islands
Channel Islands
UK 216 (A/E/FI/MA)*
Channel Islands 4 (A/MA)*
Denmark
France 3 (A)
Germany 5 (A)*
Gibraltar*
Italy 1 (MA)*
Europe and Middle East
Luxembourg
Netherlands
Spain*
Sweden
Switzerland 27 (A/E/FI/MA)*
UAE 3 (E)
Asia
Australia 26 (E/FI/MA)
China 4 (E) BoComm JV
Hong Kong 23 (E/FI/MA)*
India Axis JV
Indonesia 7 (E/FI/MA)
Japan 16 (E/FI/MA)
Singapore 19 (E/FI/MA)*
South Korea 8 (E/MA)
Taiwan 7 (E/MA)
Chile
Mexico
USA 52
(A/E/FI/MA)
A worldwide team dedicated to asset management
13

THE SWISS HELVETIA FUND, INC.
Schroders has had an established investment management presence since 1923 in
the US
the US
About Schroders
Schroder Investment Management North America
n A registered Investment Adviser with the SEC
n SIMNA Inc. manages $88.5 billion for clients across a range of asset classes
n AUM of $3.4 billion across 17 open-end mutual funds and $21.1 billion across 18 sub-
advisory portfolios
advisory portfolios
n Resources and infrastructure dedicated to managing, servicing and marketing 40-Act
registered portfolios
registered portfolios
n Dedicated U.S.-based compliance and legal teams to oversee regulatory requirements
n Existing structure in place for compliance & client service specialists to coordinate with
regional investment offices
regional investment offices
14
Source: Schroders, Schroder Investment Management North America assets include both SIMNA Inc. and SIMNA, Ltd SEC registered entities as of June 30, 2015,
mutual fund/sub-advisory AUM as of August 31, 2015.
mutual fund/sub-advisory AUM as of August 31, 2015.

THE SWISS HELVETIA FUND, INC.
n Track record of Swiss equity team started on January 1, 1999
n Proven and easy to understand process
n Fundamental stock picking (bottom-up)
n Robust portfolio construction and risk management (top-down)
n Style focus on value, quality and size
Schroders was selected by the independent directors of the Fund in 2014
for its track record, investment philosophy & process, its team and experience1
for its track record, investment philosophy & process, its team and experience1
About the portfolio management team
The Fund is managed by a Zurich based, experienced Swiss equity team
15
Source: Schroders; 1 The Swiss Helvetia Fund, Inc. press release, April 18, 2014 (www.swzfund.com).

Investment philosophy
and process
and process

THE SWISS HELVETIA FUND, INC.
Investment philosophy
3 main alpha sources
1. Value
n Definition: Classical Value Multiple Analysis (P/E, P/B, P/CF etc.) and Proprietary DCF Model
n Evidence: Kenneth R. French Database for Switzerland
2. Quality
n Definition: Quality of Balance Sheet, Management, Product/Service and shareholder value creation
n Evidence: Own empirical analysis re: debt/equity
3. Size (Small and Mid Cap)
n Definition: Stocks outside the large cap “Swiss Market Index” (SMI)
n Evidence: Performance of sub-indices within the all cap “Swiss Performance Index” (SPI)
17
Source: Schroders

THE SWISS HELVETIA FUND, INC.
Investment philosophy
Avoid high debt
18
Source: Bloomberg, Schroders, April 30, 2015. All returns in CHF.
THE SWISS HELVETIA FUND, INC.
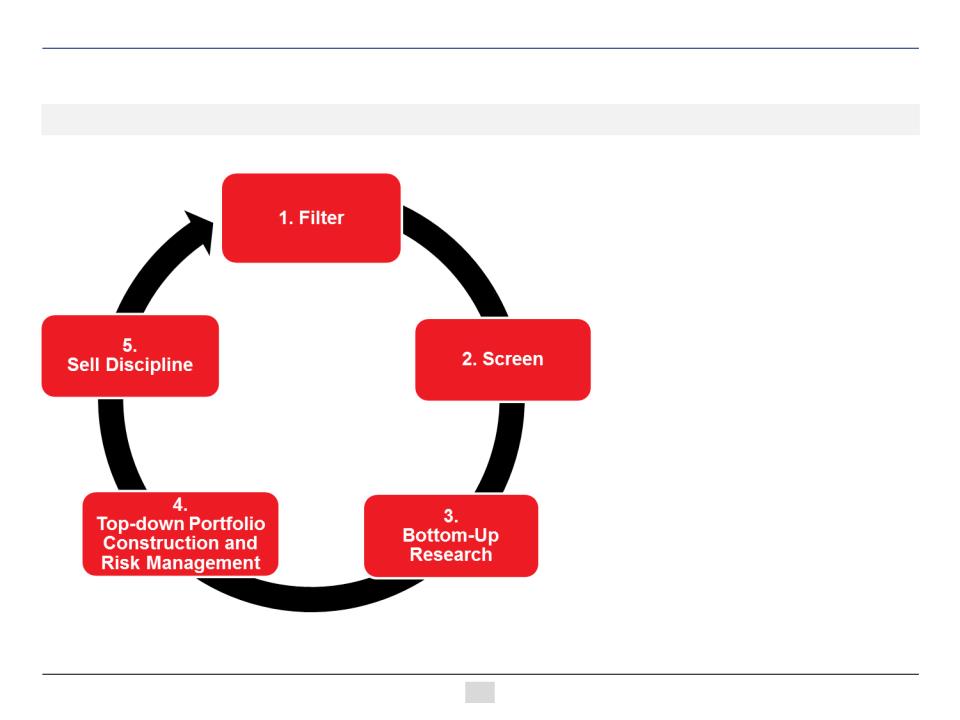
Investment process
5 recurring steps
19
Source: Schroders
1. Filter universe (209 stocks)
into investable stocks
(~125)
into investable stocks
(~125)
2. Screen for best ideas:
focus list of 60-80 names;
rest goes on watch list
focus list of 60-80 names;
rest goes on watch list
3. Detailed fundamental
research to come-up with
stock recommendations
research to come-up with
stock recommendations
4. Construct portfolio with 30-
40 names and monitor risks
40 names and monitor risks
5. Sell discipline a inherent part
of investment process
of investment process
209 stocks
60-80
30-40
125

THE SWISS HELVETIA FUND, INC.
Investment process II
Stock example: Implenia
Valuation
n Fair value: CHF 66 (upside 35%)
n Multiples: Est. P/E (2016) 10.9, Div yield 3.7%
20
Source: Schroders, Bloomberg, June 30, 2014. Data in CHF. For illustration only. Not a recommendation to buy or sell stocks mentioned.
Book value per share plus cumulative
dividends
dividends
1.
2.
3. bottom-up
Research
Research
4.
5.
Quality (Summary)
n Competitive Analysis +/- Leading construction services company in CH
n Shareholder Value Creation + 9% p.a. book value per share increase over 8y
n Management Quality + Seasoned and strongly committed management
n Balance Sheet Quality + Solid balance sheet, net cash; 27% goodwill/equity
THE SWISS HELVETIA FUND, INC.
Investment process
Sell discipline
Having a clear selling discipline is important for seeking to achieve consistent performance.
A stock is sold when:
A stock is sold when:
n Price target is reached
n Negative change of investment case (environment, positioning of firm, management)
n We find a better investment opportunity
21
Source: Schroders
1.
4.
5. Sell
discipline
discipline
2.
3.

Performance

THE SWISS HELVETIA FUND, INC.
Performance in USD % | H1 2015 | Q3 2015 | YTD (Sept 2015) |
NAV | 6.24 | -6.17 | -0.32 |
Swiss Performance Index, SPI | 6.50 | -6.64 | -0.57 |
Difference NAV | -0.26 | +0.47 | +0.25 |
Performance 2015
NAV and price performance in USD, as of September 30, 2015
23
Source: Schroders, Citi for fund performance and Bloomberg for Index performance; year-to-date performance as at September 30, 2015, reflecting end-of-day NAV
information available as of the date of publication; subject to subsequent change. Please consult quarterly, semi-annual and annual reports for NAV updates post
date of filing. Past performance is no guarantee of future results. Other periods would have achieved different results. Current performance may be higher or lower
than shown. Visit www.swzfund.com for the Fund’s most current performance.
Net Asset Value
Performance in USD % | H1 2015 | Q3 2015 | YTD (Sept 2015) |
Share price SWZ | 5.03 | -5.03 | -0.26 |
Swiss Performance Index, SPI | 6.50 | -6.64 | -0.57 |
Difference | -1.47 | +1.61 | +0.31 |
Share price
This is after a negative performance
impact of approx. -1% from write-
downs on legacy private equity
positions. Significant positive
contribution to relative performance
from listed stocks.
impact of approx. -1% from write-
downs on legacy private equity
positions. Significant positive
contribution to relative performance
from listed stocks.

Portfolio positioning
THE SWISS HELVETIA FUND, INC.
Top Ten holdings
Top/bottom relative weights
Portfolio positioning
As of September 30, 2015
25
Source: Schroders. Portfolio composition is subject to change over time.
Name | Absolute weight |
Novartis | 13.9% |
Nestlé | 12.0% |
Roche | 11.4% |
Lindt & Sprüngli (Reg.) | 5.5% |
Syngenta | 3.4% |
Richemont | 3.1% |
Swatch (Registered) | 2.5% |
Tecan | 2.4% |
Burckhardt Compression | 2.3% |
Swiss Life | 2.3% |
58.8% |
Name | Relative weight |
Lindt & Sprüngli (Reg.) | +4.9% |
Tecan | +2.3% |
Burckhardt Compression | +2.2% |
Swatch (Registered) | +2.1% |
Logitech | +2.1% |
ABB | -3.1% |
Roche | -3.4% |
UBS | -4.0% |
Novartis | -4.7% |
Nestlé | -7.1% |

THE SWISS HELVETIA FUND, INC.
Portfolio positioning
ICB classification
26
Source: Schroders Citi, Bloomberg, September 30, 2015.
SWZ | SPI | Rel. % |
25.3% | 33.5% | -8.2% |
18.1% | 20.8% | -2.7% |
3.7% | 10.0% | -6.3% |
8.8% | 8.2% | 0.6% |
3.5% | 6.6% | -3.1% |
5.6% | 4.5% | 1.1% |
3.7% | 4.0% | -0.3% |
3.7% | 3.7% | 0.0% |
4.7% | 1.8% | 2.9% |
1.3% | 1.2% | 0.1% |
2.1% | 1.1% | 1.0% |
0.0% | 1.0% | -1.0% |
3.6% | 0.9% | 2.7% |
1.1% | 0.8% | 0.3% |
4.5% | 0.7% | 3.8% |
0.0% | 0.4% | -0.4% |
0.0% | 0.3% | -0.3% |
1.2% | 0.2% | 1.0% |
0.0% | 0.1% | -0.1% |
0.0% | 0.1% | -0.1% |
0.0% | 0.1% | -0.1% |
0.0% | 0.0% | 0.0% |
0.0% | 0.0% | 0.0% |
4.8% | 0.0% | 4.8% |
4.3% | 0.0% | 4.3% |

THE SWISS HELVETIA FUND, INC.
Portfolio positioning
Changes in positioning YTD 2015
27
Source: Schroders, Year-to-date through September 30, 2015.
New Positions |
Aryzta |
Airopack |
SFS |
Adecco |
gategroup |
ams |
Sunrise Communication |
Increased Positions |
Syngenta |
Richemont |
Swatch (Reg.) |
Dufry |
Nestlé |
Swiss Life |
Credit Suisse |
GAM |
Feintool |
Implenia |
OC Oerlikon |
DKSH |
Logitech |
Decreased Positions |
Clariant |
BCV |
UBS |
VZ |
Actelion |
Basilea |
Evolva |
Tecan |
Burckhardt Compression |
Bucher Industries |
Sold Positions |
Sika |
EFG International |
Leonteq |
THE SWISS HELVETIA FUND, INC.
Risk measures September 30, 2015
Portfolio positioning
Key statistical measures
28
Source: Schroders, Charles River, Prism, September 30, 2015. Please refer to the back of this presentation for definitions.
Swiss Helvetia Fund | Q3 2015 | Q4 2014 |
Tracking error | 2.9% | 2.8% |
Beta | 0.89* | 0.92 |
Relative VaR (95%) | 1.4% | 1.3% |
Volatility | 10.5% | 9.2% |
Active share | 43.8% | 42.8% |
Portfolio turnover
Swiss Helvetia Fund | |
Turnover in % of AuM Q3 2015 | 11% |
Turnover in % of AuM YTD 2015 | 27% |
Turnover calculation method: (Buys + Sells) / (average AuM)
*low beta due to cash position and underweight in financials

Outlook

THE SWISS HELVETIA FUND, INC.
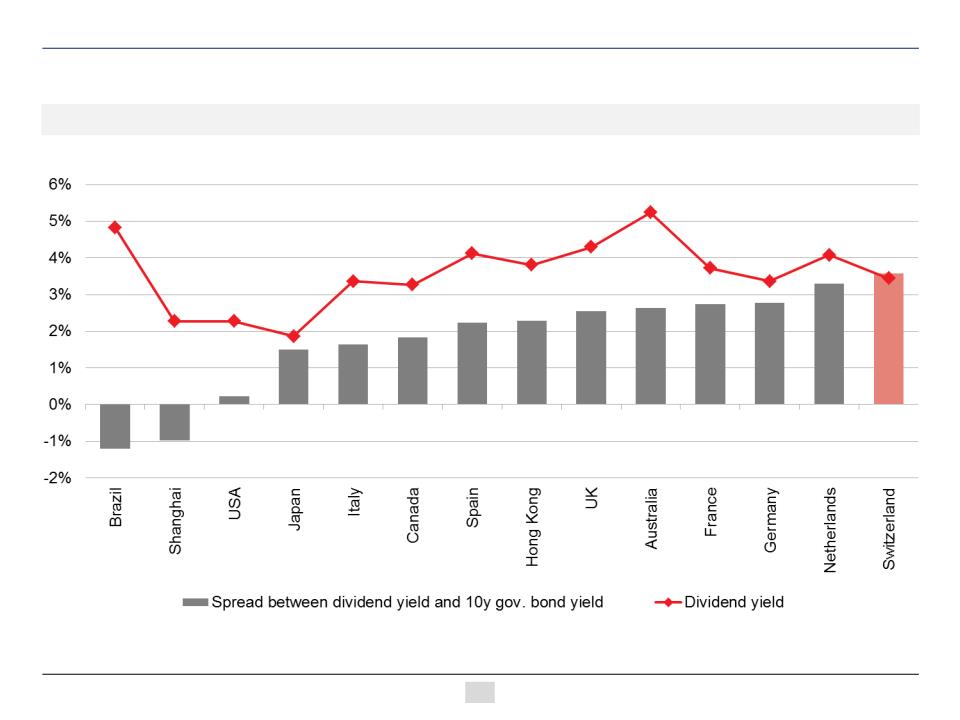
Investment outlook
n Global stock market valuations have become more expensive almost year after year since 2010
n But equity markets likely to benefit further from attractive / increasing dividends
n Swiss spread of dividend yield vs. 10 year government bond yield highest among major stock markets
n We believe that Swiss equities will be among the best performing equity markets long-term
- thanks to its global leaders of industry
- which has over past 10 years led to superior earnings growth (which is likely to persist)
- in spite of strong Swiss franc (despite making news headlines in 2015, it is rather “business as
usual”)
- thanks to its global leaders of industry
- which has over past 10 years led to superior earnings growth (which is likely to persist)
- in spite of strong Swiss franc (despite making news headlines in 2015, it is rather “business as
usual”)
n Simultaneously, investors need to be aware of shorter-term risks/volatility
(due to geopolitics, central banks, economic data, contagion from other asset classes, etc.)
(due to geopolitics, central banks, economic data, contagion from other asset classes, etc.)
30
Views expressed reflect those of the portfolio management team and do not necessarily reflect the views of Schroders. These views are subject to change.
THE SWISS HELVETIA FUND, INC.
Investment outlook
Global comparison of dividend yield versus government bond yield
31
Source: Bloomberg, as of September 30, 2015. Yields fluctuate.
THE SWISS HELVETIA FUND, INC.
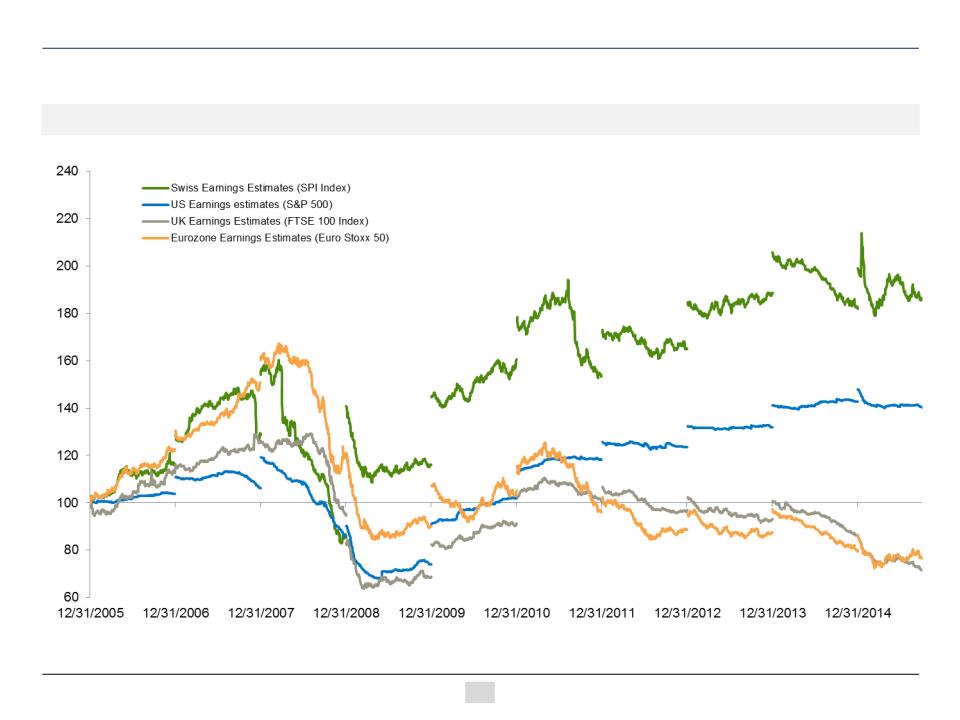
Investment outlook
Global comparison of earnings expectations
32
Source: Bloomberg: as of September 30, 2015, all earnings converted into US dollars.

Conclusion

THE SWISS HELVETIA FUND, INC.
Conclusion
n Swiss equities have a history of outperformance and are highly attractive from a long-term
total return perspective
total return perspective
n The Swiss Helvetia Fund is currently a way to invest in Swiss stocks at a discount
n Schroders has a proven philosophy, process and track record for Swiss equities
34
Views expressed reflect those of the portfolio management team and do not necessarily reflect the views of Schroders. These views are subject to change.
THE SWISS HELVETIA FUND, INC.
The Fund is a closed-end investment product. Common shares of the Fund are only available for purchase/sale on the NYSE at the current market price.
An investment in the Fund is not a deposit of a bank and is not insured or guaranteed by the Federal Deposit Insurance Corporation or any other
government agency.
An investment in the Fund is not a deposit of a bank and is not insured or guaranteed by the Federal Deposit Insurance Corporation or any other
government agency.
This presentation is intended to be for information purposes only and it is not intended as promotional material in any respect. The material is not intended as an offer
or solicitation for the purchase or sale of any financial instrument. The material is not intended to provide, and should not be relied on for, accounting, legal or tax
advice, or investment recommendations. Information herein is believed to be reliable but Schroder Investment Management North America Inc. does not warrant its
completeness or accuracy.
The returns presented represent past performance and are not necessarily representative of future returns, which may vary. The value of investments can fall as well
as rise as a result of market or currency movements.
as rise as a result of market or currency movements.
All investments, domestic and foreign, involve risks, including the risk of possible loss of principal. The market value of a fund’s portfolio may decline as a result of a
number of factors, including adverse economic and market conditions, prospects of stocks in the portfolio, changing interest rates, and real or perceived adverse
competitive industry conditions. Investing overseas involves special risks including among others risks related to political or economic instability, foreign currency
(such as exchange, valuation, and fluctuation) risk, market entry or exit restrictions, illiquidity, and taxation. The Swiss securities markets have substantially less
trading volume than the U.S. securities markets. Additionally, the capitalization of the Swiss securities markets is highly concentrated. Securities of some companies
located in Switzerland will be less liquid and more volatile than securities of comparable U.S. companies. This combination of lower volume and greater
concentration in the Swiss securities markets may create a risk of greater price volatility than in the U.S. securities markets.
The views and forecasts contained herein are those of the Schroders Swiss Equities team and are subject to change. The information and opinions contained in this
document have been obtained from sources we consider to be reliable. No responsibility can be accepted for errors of facts obtained from third parties. Reliance
should not be placed on the views and information in the document when taking individual investment and/or strategic decisions.
document have been obtained from sources we consider to be reliable. No responsibility can be accepted for errors of facts obtained from third parties. Reliance
should not be placed on the views and information in the document when taking individual investment and/or strategic decisions.
Definitions: Active share represents the proportion of stock holdings in the fund that is different from the composition found in the benchmark. Beta measures the
sensitivity of the fund to the movements of its benchmark. Volatility is measured by Standard deviation, which is the risk or volatility of an investment’s return over a
particular time period; the greater the number, the greater the risk. Tracking error is the difference between the price behavior of a position or a portfolio and the price
behavior of a benchmark. VaR is Value at Risk, a widely used risk measure of the risk of loss on a specific portfolio of financial exposures.
Each of the indices shown are for illustrative purposes and are intended only to reflect a comparative investment proxy for their respective asset class. Each is an
unmanaged basket of securities, and investors cannot invest directly in any index.
unmanaged basket of securities, and investors cannot invest directly in any index.
www.schroders.com/us
Important information
35