 Stefan Frischknecht, Fund Manager Portfolio and Performance Review The Swiss Helvetia Fund, Inc. June 27, 2017 |
 Agenda 1 01 Performance 02 Portfolio positioning 03 Outlook 04 05 Conclusion Is a Swiss only focus still opportune? |
 Performance |
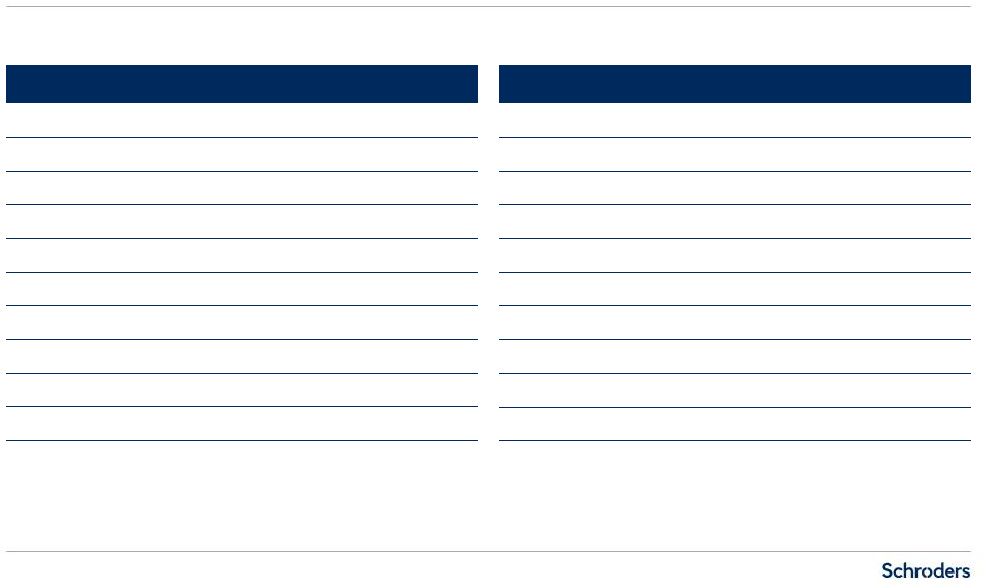
 Performance overview NAV and price performance in USD 3 Source: Schroders, Citi and JPM for Fund performance, Bloomberg for index performance, 31 May 2017; year-to-date performance as at 31 May 2017. The returns presented represent past performance and are not necessarily representative of future returns, which may vary. Performance in USD % H2 2014 2015 2016 YTD 2017 06/30/14 – 05/31/17 - 12/31/14 – 05/31/17 - 05/31/16 – 05/31/17 - NAV (US GAAP) as per quarterly filings -7.78 2.96% -2.19% 19.90% 11.35% 20.75% 19.31% Swiss Performance Index, SPI -6.06 2.58% -4.05% 20.11% 11.07% 18.22% 18.30% Difference NAV as per quarterly filings -1.72 +0.38% +1.86% -0.21% 0.28% 2.53% 1.01% Performance in USD % H2 2014 2015 2016 YTD 2017 06/30/14 – 05/31/17 - 12/31/14 – 05/31/17 - 05/31/16 – 05/31/17 - Share price SWZ -8.91 1.41% -0.24% 22.62% 13.08% 24.06% 24.82% Swiss Performance Index, SPI -6.06 2.58% -4.05% 20.11% 11.07% 18.22% 18.30% Difference -2.85 -1.17% +3.81% +2.51% 2.01% +5.84% 6.52% Net asset value Share price |
 Since July 1, 2014: – Since Schroders took over as Fund adviser, relative performance has been moderately positive after fees – After an initial transition period, i.e. since 31Dec 2014, relative performance has been positive by 2.53% – Private equity positions, taken over from predecessors, impacted absolute and relative performance – Legacy contribution to relative performance since July 1 2014: approx. 3.7% – Despite lack of liquid market to trade on, private equity positions have been actively reduced by 54% Last 12 months: – Stock selection has been positive – The Fund’s overweight in the well performing small & mid cap segment has also been positive – Of the biggest 5 overweights (as per 31 May 2017), 4 contributed positively (in absolute and relative terms) Year-to-date: – Stock selection has been positive – Relative performance has been slightly behind the SPI due to private equity, cash and fees – All our biggest 5 overweights (as per 31.5.17), contributed positively (in absolute and relative terms) Performance Comments Driving factors for relative performance of NAV 4 Source: Schroders, Periods ending 31 May 2017. The returns presented represent past performance and are not necessarily representative of future returns, which may vary. |
 Performance attribution – stock level Top & Bottom 10 contributions to relative performance YTD 2017 5 Source: Schroders, FactSet, 31 May 2017; “over” means overweight and “under” means underweight compared to Swiss Performance Index; “zero” means no position. Top ten stock contributions (USD) Bottom ten stock contributions (USD) Total effect % Logitech (over) 0.6 Belimo (over) 0.3 Swiss Re (under) 0.3 Cembra (over) 0.2 Sonova (over) 0.2 Zurich Insurance (zero) 0.2 Sunrise (over) 0.2 VAT Group (over) 0.2 SFS (over) 0.1 Syngenta (over) 0.1 Total effect % VZ Holding (over) -0.3 Implenia (over) -0.2 Kuros (over) -0.2 AMS (zero) -0.1 Sika (zero) -0.1 Airopack (over) -0.1 Partners Group (zero) -0.1 ABB (zero) -0.1 Roche (under) -0.1 Straumann (zero) -0.1 |
 Performance attribution – stock level Top & Bottom 10 contributions to relative performance last 12 months 6 Source: Schroders, FactSet, 31 May 2017; “over” means overweight and “under” means underweight compared to Swiss Performance Index; “zero” means no position. Top ten stock contributions (USD) Bottom ten stock contributions (USD) Total effect % Logitech (over) 2.3 VAT Group (over) 0.5 Belimo (over) 0.5 Sunrise (over) 0.4 Novartis (under) 0.4 Cembra Money Bank (over) 0.4 Credit Suisse (over) 0.4 Swiss Life (over) 0.3 Roche (under) 0.3 Swatch (over) 0.3 Total effect % Burckhardt Compression (over) -0.8 Lindt & Sprüngli (over) -0.7 Kuros (over) -0.5 LafargeHolcim (zero) -0.4 ABB (zero) -0.4 Zurich Insurance Group (zero) -0.4 VZ Holding (over) -0.3 Sika (zero) -0.3 Partners Group (zero) -0.2 AMS (zero) -0.2 |
 Portfolio positioning |
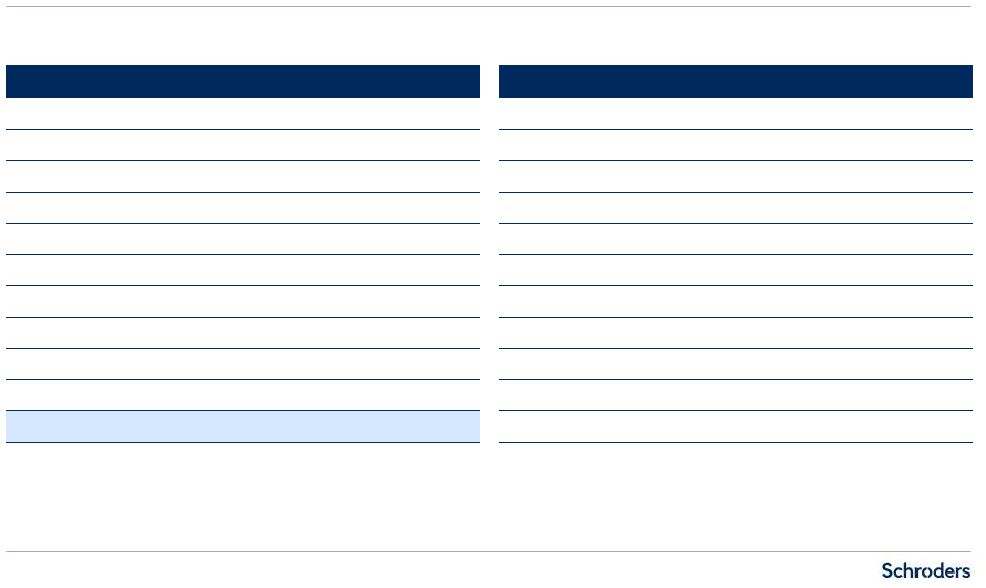 Top ten holdings absolute Top five relative over/underweights Portfolio positioning As at 31 May 2017 8 Source: Schroders, JP Morgan, Bloomberg, 31 May 2017. Name Absolute weight Nestlé 14.3% Novartis 13.6% Roche 12.4% UBS 4.8% Richemont 3.7% Lindt & Sprüngli (Reg.) 3.7% Logitech 3.1% Belimo 3.1% Swatch (Reg.) 2.6% Sunrise 2.4% Total 63.7% Name Relative weight % Lindt & Sprüngli (Reg.) +3.1% Belimo +2.9% Logitech +2.7% Sunrise +2.2% Swatch (Reg.) +2.2% Nestlé -5.6% ABB -3.5% Zurich Insurance -3.3% Novartis -2.5% LafargeHolcim -2.2% |
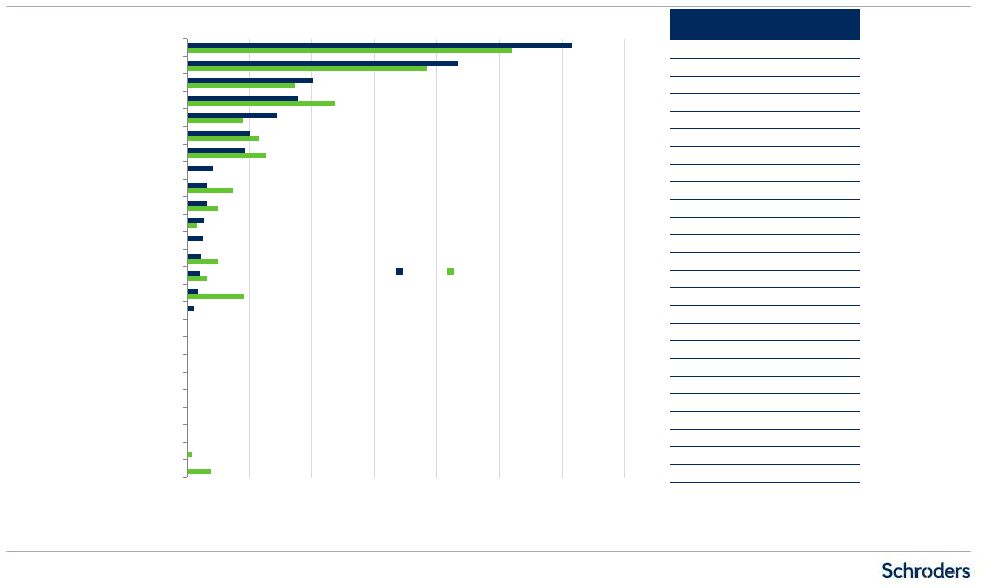 Portfolio positioning ICB classification 9 Source: Schroders, JP Morgan, Bloomberg, 31 May 2017. 0% 5% 10% 15% 20% 25% 30% 35% Private Equity Cash Oil & Gas Health Care Providers Basic Resources Travel & Leisure Automobiles & Parts Media Utilities Medical Supplies Medical Equipment Retail Telecommunications Real Estate Biotechnology Financial Services Technology Chemicals Personal & Household Goods Construction & Materials Insurance Banks Industrial Goods & Services Food & Beverage Pharmaceuticals SPI Swiss Helvetia Fund SWZ SPI Rel. % 26.0% 30.7% -4.7% 19.1% 21.6% -2.5% 8.6% 10.1% -1.5% 11.8% 8.9% 2.9% 4.5% 7.2% -2.7% 5.8% 5.1% 0.7% 6.3% 4.6% 1.7% 0.0% 2.1% -2.1% 3.7% 1.6% 2.1% 2.5% 1.6% 0.9% 0.8% 1.3% -0.5% 0.0% 1.3% -1.3% 2.4% 1.1% 1.3% 1.6% 1.0% 0.6% 4.6% 0.8% 3.8% 0.0% 0.5% -0.5% 0.0% 0.1% -0.1% 0.0% 0.1% -0.1% 0.0% 0.1% -0.1% 0.0% 0.1% -0.1% 0.0% 0.1% -0.1% 0.0% 0.0% 0.0% 0.0% 0.0% 0.0% 0.4% 0.0% 0.4% 1.9% 0.0% 1.9% |
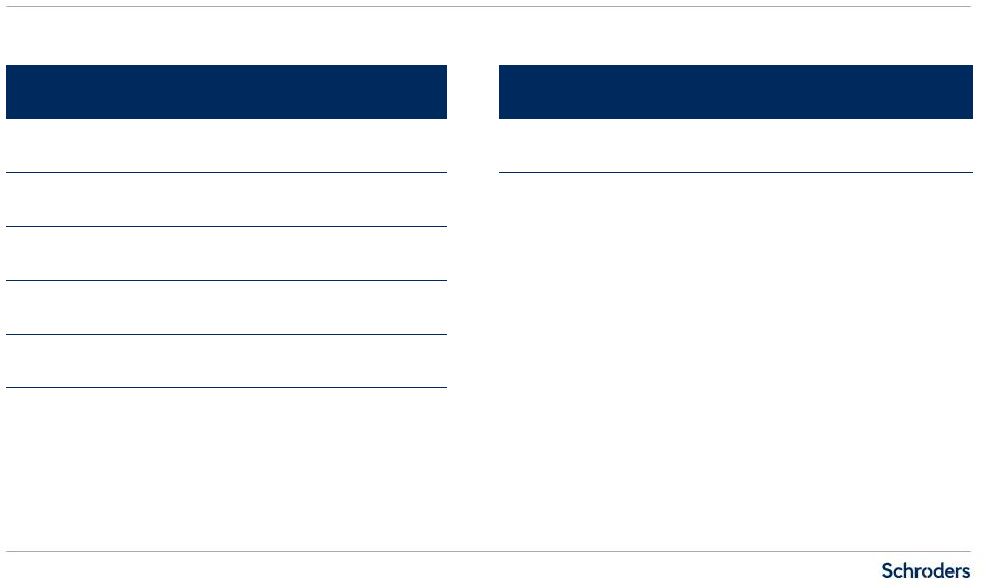
 Portfolio positioning Changes in positioning 10 Source: Schroders. New Positions Aryzta Increased Positions UBS Decreased Positions Bucher GAM Holding Logitech Oerlikon Swiss Re Sold Positions none New Positions Baloise Galenica Santé Increased Positions Credit Suisse Richemont Swatch (Reg.) Decreased Positions Belimo Burckhardt Compression Lindt & Sprüngli (Reg.) Logitech Lonza Nestlé Oerlikon Sonova Sold Positions Actelion Basilea Syngenta Q1 2017 31 March 2017 – 31 May 2017 |
 Risk measures (ex private equity) Portfolio turnover Portfolio positioning Key statistical measures 11 Source: Schroders, Charles River, Prism, 31 May 2017. Swiss Helvetia Fund 31 May 2017 Tracking error 2.1% Beta 0.95 Relative VaR (95%) 1.0% Volatility 10.7% Active share 39.5% Swiss Helvetia Fund Turnover in % of AuM YTD 2017 3.5% Turnover calculation method: (lesser of buys or sells) / (average AuM) |
 Outlook |
 Investment outlook Global comparison of dividend yield versus government bond yield 13 Source: Schroders, Bloomberg, 15 May 2017. -2% -1% 0% 1% 2% 3% 4% 5% Dividend yield - 10 yr government bond yield Dividend yield |
 Investment outlook Global comparison of earnings expectations Source: Schroders, Bloomberg, 15 May 2017; all earnings converted into USD. 50 100 150 200 250 Dec-05 Dec-06 Dec-07 Dec-08 Dec-09 Dec-10 Dec-11 Dec-12 Dec-13 Dec-14 Dec-15 Dec-16 US Earnings estimates (S&P 500) Swiss Earnings Estimates (SPI Index) Eurozone Earnings Estimates (Euro Stoxx 50) UK Earnings Estimates (FTSE 100 Index) Swiss small & mid cap earnings estimates (SPISMC Index) 14 |
 Equity market sentiment has switched from political risk to focus on macro-economic factors: – Eurozone growth continues to strengthen, but US, China and Japan leading indicators weakened – US consumer sentiment continues to recover (as indicated by the University of Michican Index) – But US business investment spending remains subdued Global monetary policy should remain accommodative: – inflation appears to have peaked as energy prices have started to retreat again – In view of fragile recoveries, central banks and governments are still promoting loose monetary policy – Bond yields seem to have peaked for now Risks: – The lack of investment alternatives rather than fundamentals has driven stock prices higher – Valuations are expensive on an absolute basis – Volatility has receded We expect stock markets to benefit from the economic recovery, low inflation, and monetary / fiscal stimulus. Swiss stocks, which are typically internationally diversified and have strong market shares, should benefit. Investment outlook Still positive environment, but not without risks 15 Source: Schroders, 31 May 2017. Views expressed are the portfolio management team’s view and not necessarily a «house view». |
 Is a Swiss only focus still opportune? |
 – Equity markets are driven by earnings in the long-term – Measured in US dollars, Swiss stocks have historically enjoyed strong earnings growth (cf. page 14) – Over multiple time periods, the Swiss stock market has outperformed its European peers – In the past, the Swiss focus has been beneficial – In assessing whether their investment focus should be broadened, we believe investors should consider aspects beyond short-term earnings catch up potential; long-term structural aspects are key to a successful portfolio – While the French election outcome might become a turning point in addressing Europe’s structural issues, we advise waiting for evidence before concluding that short term risks/volatility have materially declined Is a Swiss only fund still opportune? Of the many broadening solutions, we explore Swiss vs. European focus 17 Source: Schroders, 31 May 2017. Views expressed are the portfolio management team’s view and not necessarily a «house view». |
 Total return: The Swiss Helvetia Fund, Inc. 199.2% 6.1% p.a. (since year end 1998) ETF on Swiss stocks 170.1% 5.5% “ MSCI Europe ex Switzerland 116.1% 4.3% “ Performance of The Swiss Helvetia Fund Compared to ETF and European Index since introduction of the EURO 18 Source: Schroders, Bloomberg 31 May 2017. The returns presented represent past performance and are not necessarily representative of future returns, which may vary. -50% 0% 50% 100% 150% 200% 250% The Swiss Helvetia Fund, Inc. (SWZ US) Swiss ETF (iShares MSCI Switzerland Capped ETF; EWL US) MSCI Europe (ex Switzerland) Index |
 Important Information 19 The Fund is a closed-end investment product. Common shares of the Fund are only available for purchase/sale on the NYSE at the current market price. An investment in the Fund is not a deposit of a bank and is not insured or guaranteed by the Federal Deposit Insurance Corporation or any other government agency. This presentation is intended to be for information purposes only and it is not intended as promotional material in any respect. The material is not intended as an offer or solicitation for the purchase or sale of any financial instrument. The material is not intended to provide, and should not be relied on for, accounting, legal or tax advice, or investment recommendations. Information herein is believed to be reliable but Schroder Investment Management North America Inc. does not warrant its completeness or accuracy. The returns presented represent past performance and are not necessarily representative of future returns, which may vary. The value of investments can fall as well as rise as a result of market or currency movements. All investments, domestic and foreign, involve risks, including the risk of possible loss of principal. The market value of a fund’s portfolio may decline as a result of a number of factors, including adverse economic and market conditions, prospects of stocks in the portfolio, changing interest rates, and real or perceived adverse competitive industry conditions. Investing overseas involves special risks including among others risks related to political or economic instability, foreign currency (such as exchange, valuation, and fluctuation) risk, market entry or exit restrictions, illiquidity, and taxation. The Swiss securities markets have substantially less trading volume than the U.S. securities markets. Additionally, the capitalization of the Swiss securities markets is highly concentrated. Securities of some companies located in Switzerland will be less liquid and more volatile than securities of comparable U.S. companies. This combination of lower volume and greater concentration in the Swiss securities markets may create a risk of greater price volatility than in the U.S. securities markets. The views and forecasts contained herein are those of the Schroders Swiss Equities team and are subject to change. The information and opinions contained in this document have been obtained from sources we consider to be reliable. No responsibility can be accepted for errors of facts obtained from third parties. Reliance should not be placed on the views and information in the document when taking individual investment and/or strategic decisions. Definitions: Active share represents the proportion of stock holdings in the fund that is different from the composition found in the benchmark. Beta measures the sensitivity of the fund to the movements of its benchmark. Volatility is measured by Standard deviation, which is the risk or volatility of an investment’s return over a particular time period; the greater the number, the greater the risk. Tracking error is the difference between the price behavior of a position or a portfolio and the price behavior of a benchmark. VaR is Value at Risk, a widely used risk measure of the risk of loss on a specific portfolio of financial exposures. For more information, visit www.swzfund.com Schroder Investment Management North America Inc. 7 Bryant Park, New York, NY 10018-3706 (212) 641-3800 www.schroders.com/us |