UNITED STATES
SECURITIES AND EXCHANGE COMMISSION
Washington, D.C. 20549
FORM N-CSR
CERTIFIED SHAREHOLDER REPORT OF REGISTERED
MANAGEMENT INVESTMENT COMPANIES
Investment Company Act file number: 811-05151
J.P. Morgan Mutual Fund Group
(Exact name of registrant as specified in charter)
245 Park Avenue
New York, NY 10167
(Address of principal executive offices) (Zip code)
Frank J. Nasta
245 Park Avenue
New York, NY 10167
(Name and Address of Agent for Service)
Registrant’s telephone number, including area code: (800) 480-4111
Date of fiscal year end: Last day of February
Date of reporting period: March 1, 2008 through February 28, 2009
Form N-CSR is to be used by management investment companies to file reports with the Commission not later than 10 days after the transmission to stockholders of any report that is required to be transmitted to stockholders under Rule 30e-1 under the Investment Company Act of 1940 (17 CFR 270.30e-1). The Commission may use the information provided on Form N-CSR in its regulatory, disclosure review, inspection, and policymaking roles.
A registrant is required to disclose the information specified by Form N-CSR, and the Commission will make this information public. A registrant is not required to respond to the collection of information contained in Form N-CSR unless the Form displays a currently valid Office of Management and Budget (“OMB”) control number. Please direct comments concerning the accuracy of the information collection burden estimate and any suggestions for reducing the burden to Secretary, Securities and Exchange Commission, 450 Fifth Street, NW, Washington, DC 20549-0609. The OMB has reviewed this collection of information under the clearance requirements of 44 U.S.C. Section 3507.
ITEM 1. REPORTS TO STOCKHOLDERS.
The following is a copy of the report transmitted to shareholders pursuant to Rule 30e-1 under the Investment Company Act of 1940 (17 CFR 270.30e-1).
JPMorgan Emerging Markets Debt Fund
JPMorgan Enhanced Income Fund
JPMorgan Real Return Fund
JPMorgan Short Term Bond Fund
JPMorgan Short Term Bond Fund II

| President’s Letter | 1 | |||||
| Fund Commentaries: | ||||||
| JPMorgan Bond Fund | 2 | |||||
| JPMorgan Emerging Markets Debt Fund | 4 | |||||
| JPMorgan Enhanced Income Fund | 7 | |||||
| JPMorgan Real Return Fund | 9 | |||||
| JPMorgan Short Term Bond Fund | 11 | |||||
| JPMorgan Short Term Bond Fund II | 13 | |||||
| Schedules of Portfolio Investments | 16 | |||||
| Financial Statements | 40 | |||||
| Financial Highlights | 56 | |||||
| Notes to Financial Statements | 64 | |||||
| Report of Independent Registered Public Accounting Firm | 79 | |||||
| Trustees | 80 | |||||
| Officers | 82 | |||||
| Schedule of Shareholder Expenses | 83 | |||||
| Tax Letter | 85 |
MARCH 20, 2009 (Unaudited)
 | “While it’s difficult to provide much evidence that the financial markets and the economy are stabilizing, some financial stresses that originally triggered this economic slide have abated somewhat.” | |||||

President and CEO
J.P. Morgan Funds
AS OF FEBRUARY 28, 2009 (Unaudited)
| Fund Inception | July 26, 1993 | |||||
| Fiscal Year End | Last Day of February | |||||
| Net Assets as of 2/28/2009 (In Thousands) | $126,899 | |||||
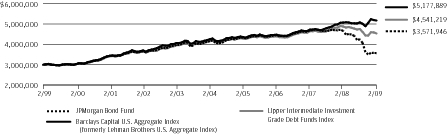
| Primary Benchmark | Barclays Capital U.S. Aggregate Index (formerly Lehman Brothers U.S. Aggregate Index) | |||||
| Average Credit Quality | AA– | |||||
| Duration | 4.9 | |||||
Q: | HOW DID THE FUND PERFORM? |
A: | The JPMorgan Bond Fund, which seeks to provide high total return consistent with moderate risk of capital and maintenance of liquidity*, returned –23.49%** (Institutional Class Shares) for the 12 months ended February 28, 2009, compared to the 2.06% return for the Barclays Capital U.S. Aggregate Index (formerly Lehman Brothers U.S. Aggregate Index) for the same period. |
Q: | WHY DID THE FUND PERFORM THIS WAY? |
A: | The Fund underperformed its benchmark for the period. Fixed income markets experienced much volatility and credit spread widening due primarily to the deleveraging of large market participants and wide-ranging rating agency actions. Generally, when credit spreads of a particular group of securities widen, prices fall, yields increase and total returns decline, relative to comparable-duration U.S. Treasuries. Weak conditions within many financial firms aggravated investor concerns about financial firms’ capitalization. Throughout this turmoil, credit markets became more volatile and more illiquid, as investors lost confidence. Central banks globally responded by pouring enormous amounts of liquidity into the financial system. The liquidity that was provided to the system by central banks prevented a complete financial meltdown, but did not fully alleviate the selling pressures in the market. These pressures accelerated after the Lehman bankruptcy, which led to the Fund’s significant underperformance from September 2008 through December 2008. The Fund did not anticipate the size and longevity of the deleveraging that occurred in 2008. |
Q: | HOW WAS THE FUND MANAGED? |
A: | The portfolio management team balanced top-down macroeconomic themes with bottom-up security selection and interest-rate management. The Fund also allocated its investments to extended sectors, such as emerging market and high-yield debt. The Fund was generally overweight spread duration vs. its benchmark during this time period. The overweighted sectors were generally mortgages, high yield and investment-grade credit. In addition, the Fund experienced significant redemptions during the reporting period, which presented additional challenges in managing the Fund and resulted in the need to sell securities during periods of extreme market volatility. |
| Mortgage Pass-Through Securities | 25.6 | % | ||||
| Corporate Bonds | 23.6 | |||||
| U.S. Treasury Obligations | 10.4 | |||||
| Collateralized Mortgage Obligations | 9.5 | |||||
| Private Placements | 8.1 | |||||
| U.S. Government Agency Securities | 8.0 | |||||
| Asset-Backed Securities | 5.0 | |||||
| Others (each less than 1.0%) | 2.2 | |||||
| Short-Term Investment | 7.6 |
| * | The advisor seeks to achieve the Fund’s objective. There can be no guarantee it will be achieved. |
| ** | The return shown is based on net asset value calculated for shareholder transactions and may differ from the return shown in the financial highlights which reflect adjustments made to the net asset value in accordance with accounting principles generally accepted in the United States of America. |
| *** | Percentages indicated are based upon total investments as of February 28, 2009. The Fund’s composition is subject to change. |
| INCEPTION DATE OF CLASS | 1 YEAR | 5 YEAR | 10 YEAR | |||||||||||||||
|---|---|---|---|---|---|---|---|---|---|---|---|---|---|---|---|---|---|---|
CLASS A SHARES | 9/10/01 | |||||||||||||||||
| Without Sales Charge | (23.77 | )% | (3.28 | )% | 1.58 | % | ||||||||||||
| With Sales Charge* | (26.66 | ) | (4.01 | ) | 1.19 | |||||||||||||
CLASS B SHARES | 9/10/01 | |||||||||||||||||
| Without CDSC | (24.23 | ) | (3.90 | ) | 0.98 | |||||||||||||
| With CDSC** | (29.23 | ) | (4.37 | ) | 0.98 | |||||||||||||
CLASS C SHARES | 3/31/03 | |||||||||||||||||
| Without CDSC | (24.20 | ) | (3.91 | ) | 1.03 | |||||||||||||
| With CDSC*** | (25.20 | ) | (3.91 | ) | 1.03 | |||||||||||||
SELECT CLASS SHARES | 9/10/01 | (23.63 | ) | (3.16 | ) | 1.59 | ||||||||||||
INSTITUTIONAL CLASS SHARES | 7/26/93 | (23.49 | ) | (3.00 | ) | 1.76 | ||||||||||||
ULTRA SHARES | 9/10/01 | (23.43 | ) | (2.92 | ) | 1.87 | ||||||||||||
| * | Sales Charge for Class A Shares is 3.75%. |
| ** | Assumes 5% CDSC (contingent deferred sales charge) for the one year period, 2% CDSC for the five year period and 0% CDSC thereafter. |
| *** | Assumes a 1% CDSC for the one year period and 0% CDSC thereafter. |
AS OF FEBRUARY 28, 2009 (Unaudited)
| Fund Inception | April 17, 1997 | |||||
| Fiscal Year End | Last Day of February | |||||
| Net Assets as of 2/28/2009 (In Thousands) | $199,533 | |||||
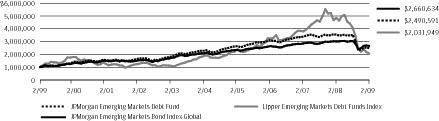
| Primary Benchmark | JPMorgan Emerging Markets Bond Index Global | |||||
| Average Credit Quality | BB– | |||||
| Duration | 6.0 Years | |||||
Q: | HOW DID THE FUND PERFORM? |
A: | The JPMorgan Emerging Markets Debt Fund, which seeks to provide high total return from a portfolio of fixed income securities of emerging markets issuers,* returned –29.67%** (Select Class Shares) for the 12 months ended February 28, 2009, compared to the –11.82% return for the JP Morgan Emerging Markets Bond Index Global for the same period. |
Q: | WHY DID THE FUND PERFORM THIS WAY? |
A: | The Fund underperformed its benchmark for the period. Emerging market credit spreads widened to record levels, along with significant volatility not witnessed in some time. Generally, when credit spreads of a particular group of securities widen, prices fall, yields increase and total returns decline relative to comparable-duration U.S. Treasuries. Financials continued to weaken, with liquidity in debt markets worsening dramatically. Many countries were also impacted by the rapid drop in commodity prices, although agricultural products and metals dropped less than energy. The rating agencies also reacted to concerns over funding and global economic weakening. |
Q: | HOW WAS THE FUND MANAGED? |
A: | The Fund was managed with a focus on weighted spread-duration contribution versus the underlying index. Spread duration is a measure of expected price sensitivity to changes in the market spreads. The Fund entered September with an underweight in overall spread duration, but with an overweight to the higher-beta countries. While remaining optimistic toward the long-term outlook of emerging markets countries, we pursued our fundamental investment process focusing on those countries that we believed were appropriately priced and able to withstand potential market volatility. The top-five overweights in weighted spread duration versus the index as of August 2008 were Brazil, Russia, the Ukraine, Venezuela and Kazakhstan. The overweights were through a combination of bonds and credit default swaps to manage the overall spread-duration exposure in the Fund. We favored commodity-exporting countries and those with trade balance surpluses. The top underweights in weighted spread duration in the Fund were Turkey, Mexico, the Philippines, Panama and Indonesia. As the period progressed, we reduced the exposure to the top-five countries as the volatility in the market increased, and to create a more defensive position during the crisis. Additionally, the Fund added defensive trades, such as in Austria, purchasing protection, using CDS, to hedge the Portfolio with fixed costs. Austria, specifically the banking sector, is highly exposed to the Eastern European emerging countries and vulnerable to a shock as a result of the crisis. The Fund moved to a further underweight in spread duration later in the reporting period and also reduced exposure to certain countries by cash bond sales and/or purchases of protection via CDS. |
Country | Weighted Spread Duration | |||||
Overweights: | ||||||
| Brazil | .44 | |||||
| Venezuela | .30 | |||||
| Russia | .16 | |||||
| Kazakhstan | .13 | |||||
| Guatemala | .11 | |||||
Underweights: | ||||||
| Turkey | –.66 | |||||
| Mexico | –.38 | |||||
| Bulgaria | –.26 | |||||
| Austria | –.24 | |||||
| Panama | –.20 |
| Foreign Government Securities | 71.5 | % | ||||
| Corporate Bonds | 19.5 | |||||
| U.S. Treasury Notes | 5.4 | |||||
| Others (each less than 1.0%) | 0.4 | |||||
| Short-Term Investment | 3.2 |
| Brazil | 21.3 | % | ||||
| Russia | 16.8 | |||||
| Venezuela | 11.5 | |||||
| United States | 8.6 | |||||
| Mexico | 6.9 | |||||
| Philippines | 5.2 | |||||
| Peru | 2.9 | |||||
| Indonesia | 2.9 | |||||
| Ukraine | 2.6 | |||||
| Dominican Republic | 2.4 | |||||
| Netherlands | 2.3 | |||||
| Guatemala | 2.1 | |||||
| Uruguay | 2.0 | |||||
| Turkey | 1.7 | |||||
| Colombia | 1.7 | |||||
| Costa Rica | 1.5 | |||||
| Trinidad & Tobago | 1.3 | |||||
| Gabon | 1.2 | |||||
| Argentina | 1.0 | |||||
| Others (each less than 1.0%) | 4.1 |
| * | The advisor seeks to achieve the Fund’s objective. There can be no guarantee it will be achieved. |
| ** | The return shown is based on net asset value calculated for shareholder transactions and may differ from the return shown in the financial highlights which reflect adjustments made to the net asset value in accordance with accounting principles generally accepted in the United States of America. |
| *** | Percentages indicated are based upon total investments as of February 28, 2009. The Fund’s composition is subject to change. |
AS OF FEBRUARY 28, 2009 (Unaudited) (continued)
| INCEPTION DATE OF CLASS | 1 YEAR | 5 YEAR | 10 YEAR | |||||||||||||||
|---|---|---|---|---|---|---|---|---|---|---|---|---|---|---|---|---|---|---|
CLASS A SHARES | 6/30/06 | |||||||||||||||||
| Without Sales Charge | (29.80 | )% | 1.61 | % | 9.48 | % | ||||||||||||
| With Sales Charge* | (32.45 | ) | 0.84 | 9.06 | ||||||||||||||
CLASS C SHARES | 6/30/06 | |||||||||||||||||
| Without CDSC | (30.18 | ) | 1.33 | 9.33 | ||||||||||||||
| With CDSC** | (31.18 | ) | 1.33 | 9.33 | ||||||||||||||
CLASS R5 SHARES | 5/15/06 | (29.54 | ) | 1.85 | 9.61 | |||||||||||||
SELECT CLASS SHARES | 4/17/97 | (29.67 | ) | 1.74 | 9.55 | |||||||||||||
| * | Sales Charge for Class A Shares is 3.75%. |
| ** | Assumes a 1% CDSC (contingent deferred sales charge) for the one year period and 0% CDSC thereafter. |
AS OF FEBRUARY 28, 2009 (Unaudited)
| Fund Inception | November 30, 2001 | |||||
| Fiscal Year End | Last Day of February | |||||
| Net Assets as of 2/28/2009 (In Thousands) | $7,491 | |||||
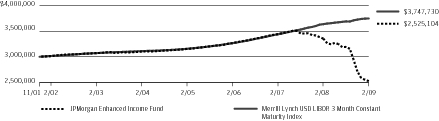
| Primary Benchmark | Merrill Lynch USD LIBOR 3 Month Constant Maturity Index | |||||
| Average Credit Quality | AA | |||||
| Duration | –0.1 Years | |||||
Q: | HOW DID THE FUND PERFORM? |
A: | The JPMorgan Enhanced Income Fund, which seeks to provide high current income consistent with principal preservation,* returned –24.74%** (Institutional Class Shares) for the 12 months ended February 28, 2009, compared to the 3.05% return for the Merrill Lynch USD LIBOR 3 Month Constant Maturity Index for the same period. |
Q: | WHY DID THE FUND PERFORM THIS WAY? |
A: | The Fund underperformed its benchmark for the period. Fixed income markets experienced much volatility and credit spread-widening due primarily to the deleveraging of large market participants and wide-ranging rating agency actions. Generally, when credit spreads of a particular group of securities widen, prices fall, yields increase and total returns decline, relative to comparable-duration U.S. Treasuries. Weak conditions within many financial firms aggravated investor concerns about financial firms’ capitalization. Throughout this turmoil, credit markets became more volatile and more illiquid, as investors lost confidence. Central banks globally responded by pouring enormous amounts of liquidity into the financial system. The liquidity that was provided to the system by central banks prevented a complete financial meltdown, but did not fully alleviate the selling pressures in the market. |
Q: | HOW WAS THE FUND MANAGED? |
A: | The focus was to manage the risk and liquidity in the Fund as the illiquidity in the market spread. Specifically the focus was on reducing risk by selling credit securities that we believed would fare the worst in a continued downturn while maintaining securities that we believed to have longer term value. The proceeds from the sale of these securities were kept in cash. In addition, the Fund experienced significant redemptions during the reporting period, which presented additional challenges in managing the Fund and resulted in the need to sell securities during periods of extreme market volatility. |
| Asset-Backed Securities | 47.3 | % | ||||
| Collateralized Mortgage Obligations | 15.9 | |||||
| Mortgage Pass-Through Securities | 15.9 | |||||
| Corporate Bond | 5.7 | |||||
| Others (each less than 1.0%) | 0.1 | |||||
| Short-Term Investment | 15.1 |
| * | The advisor seeks to achieve the Fund’s objective. There can be no guarantee it will be achieved. |
| ** | The return shown is based on net asset value calculated for shareholder transactions and may differ from the return shown in the financial highlights which reflect adjustments made to the net asset value in accordance with accounting principles generally accepted in the United States of America. |
| *** | Percentages indicated are based upon total investments as of February 28, 2009. The Fund’s composition is subject to change. |
AS OF FEBRUARY 28, 2009 (Unaudited) (continued)
| INCEPTION DATE | 1 YEAR | 5 YEAR | SINCE INCEPTION | |||||||||||||||
|---|---|---|---|---|---|---|---|---|---|---|---|---|---|---|---|---|---|---|
INSTITUTIONAL CLASS SHARES | 11/30/01 | (24.74 | )% | (4.03 | )% | (2.35 | )% | |||||||||||
AS OF FEBRUARY 28, 2009 (Unaudited)
| Fund Inception | September 1, 2005 | |||||
| Fiscal Year End | Last Day of February | |||||
| Net Assets as of 2/28/2009 (In Thousands) | $80,266 | |||||
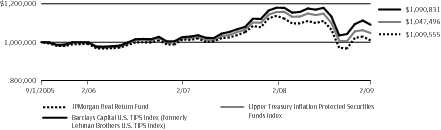
| Primary Benchmark | Barclays Capital U.S. TIPS Index (formerly Lehman Brothers U.S. TIPS Index) | |||||
| Average Credit Quality | AAA | |||||
| Duration | 7.5 Years | |||||
Q: | HOW DID THE FUND PERFORM? |
A: | The JPMorgan Real Return Fund, which seeks to maximize inflation protected return,* returned –11.20%** (Select Class Shares) for the 12 months ended February 28, 2009, compared to the –7.50% return for the Barclays U.S. Capital TIPS Index (formerly Lehman Brothers U.S. TIPS Index) for the same period. |
Q: | WHY DID THE FUND PERFORM THIS WAY? |
A: | The Fund underperformed its benchmark for the period. Fixed income markets experienced much volatility and credit spread-widening due primarily to the deleveraging of large market participants and wide-ranging rating agency actions. Generally, when credit spreads of a particular group of securities widen, prices fall, yields increase and total returns decline relative to comparable-duration U.S. Treasuries. Weak conditions within many financial firms aggravated investor concerns about financial firms’ capitalization. Throughout this turmoil, credit markets became more volatile and more illiquid, as investors lost confidence. Central banks globally responded by pouring enormous amounts of liquidity into the financial system. |
Q: | HOW WAS THE FUND MANAGED? |
A: | We repositioned the Fund late in the fourth quarter of 2008 to focus primarily on TIPS strategies and got long TIPS breakevens (by purchasing TIPS and selling nominal Treasuries) in late fall of 2008 as prices continued to fall. As the level of the TIPS breakeven got close to the nominal Treasury yield, we further increased the long positions in TIPS, which helped performance. We continued to seek those opportunistic, relative-value investments. We balanced top-down macroeconomic themes with bottom-up security selection. In addition, we employed interest rate management as part of our investment and risk management strategy. |
| U.S. Treasury Obligations | 97.1 | % | ||||
| Others (each less than 1.0%) | 1.0 | |||||
| Short-Term Investment | 1.9 |
| * | The advisor seeks to achieve the Fund’s objective. There can be no guarantee it will be achieved. |
| ** | The return shown is based on net asset value calculated for shareholder transactions and may differ from the return shown in the financial highlights which reflect adjustments made to the net asset value in accordance with accounting principles generally accepted in the United States of America. |
| *** | Percentages indicated are based upon total investments as of February 28, 2009. The Fund’s composition is subject to change. |
AS OF FEBRUARY 28, 2009 (Unaudited) (continued)
| INCEPTION DATE OF CLASS | 1 YEAR | 3 YEAR | SINCE INCEPTION | |||||||||||||||
|---|---|---|---|---|---|---|---|---|---|---|---|---|---|---|---|---|---|---|
CLASS A SHARES | 9/1/05 | |||||||||||||||||
| Without Sales Charge | (11.38 | )% | 0.41 | % | 0.02 | % | ||||||||||||
| With Sales Charge* | (14.74 | ) | (0.87 | ) | (1.07 | ) | ||||||||||||
CLASS C SHARES | 9/1/05 | |||||||||||||||||
| Without CDSC | (11.72 | ) | (0.09 | ) | (0.46 | ) | ||||||||||||
| With CDSC** | (12.72 | ) | (0.09 | ) | (0.46 | ) | ||||||||||||
SELECT CLASS SHARES | 9/1/05 | (11.20 | ) | 0.62 | 0.27 | |||||||||||||
INSTITUTIONAL CLASS SHARES | 9/1/05 | (10.99 | ) | 0.81 | 0.45 | |||||||||||||
| * | Sales Charge for Class A Shares is 3.75%. |
| ** | Assumes a 1% CDSC (contingent deferred sales charge) for the one year period and 0% CDSC thereafter. |
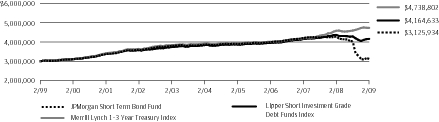
AS OF FEBRUARY 28, 2009 (Unaudited)
| Fund Inception | September 13, 1993 | |||||
| Fiscal Year End | Last Day of February | |||||
| Net Assets as of 2/28/2009 (In Thousands) | $18,837 | |||||
| Primary Benchmark | Merrill Lynch 1–3 Year Treasury Index | |||||
| Average Credit Quality | AAA | |||||
| Duration | 1.8 Years | |||||
Q: | HOW DID THE FUND PERFORM? |
A: | The JPMorgan Short Term Bond Fund, which seeks to provide high total return, consistent with low volatility of principal,* returned –27.07%** (Institutional Class Shares) for the 12 months ended February 28, 2009, compared to the 3.30% return for the Merrill Lynch 1–3 Year Treasury Index for the same period. |
Q: | WHY DID THE FUND PERFORM THIS WAY? |
A: | The Fund underperformed its benchmark for the period. Fixed income markets experienced much volatility and credit spread-widening due primarily to the deleveraging of large market participants and wide-ranging rating agency actions. Generally, when credit spreads of a particular group of securities widen, prices fall, yields increase and total returns decline, relative to comparable-duration U.S. Treasuries. Weak conditions within many financial firms aggravated investor concerns about financial firms’ capitalization. Throughout this turmoil, credit markets became more volatile and more illiquid, as investors lost confidence. Central banks globally responded by pouring enormous amounts of liquidity into the financial system. The liquidity that was provided to the system by central banks prevented a complete financial meltdown, but did not fully alleviate selling pressures in the market. These pressures accelerated after the Lehman bankruptcy, which led to the Fund’s significant underperformance in September 2008. The Fund did not anticipate the size and longevity of the deleveraging that occurred in 2008. |
Q: | HOW WAS THE FUND MANAGED? |
A: | The focus was to manage the risk in the Fund as the illiquidity in the market spread. Specifically, the focus was on reducing risk by selling credit securities that we believed would fare the worst in a continued downturn while maintaining securities that we believed to have longer-term value. The proceeds from the sale of these securities were used to purchase U.S. Treasury securities as the flight to quality continued. In addition, the Fund experienced significant redemptions during the reporting period, which presented additional challenges in managing the Fund and resulted in the need to sell securities during periods of extreme market volatility. |
| U.S. Treasury Obligations | 31.1 | % | ||||
| Collateralized Mortgage Obligations | 7.7 | |||||
| Asset-Backed Securities | 7.4 | |||||
| Foreign Government Securities | 2.0 | |||||
| Corporate Bonds | 2.0 | |||||
| Short-Term Investments | 49.8 |
| * | The advisor seeks to achieve the Fund’s objective. There can be no guarantee it will be achieved. |
| ** | The return shown is based on net asset value calculated for shareholder transactions and may differ from the return shown in the financial highlights which reflect adjustments made to the net asset value in accordance with accounting principles generally accepted in the United States of America. |
| *** | Percentages indicated are based upon total investments as of February 28, 2009. The Fund’s composition is subject to change. |
AS OF FEBRUARY 28, 2009 (Unaudited) (continued)
| INCEPTION DATE OF CLASS | 1 YEAR | 5 YEAR | 10 YEAR | |||||||||||||||
|---|---|---|---|---|---|---|---|---|---|---|---|---|---|---|---|---|---|---|
CLASS A SHARES | 9/10/01 | |||||||||||||||||
| Without Sales Charge | (27.54 | )% | (4.64 | )% | (0.02 | )% | ||||||||||||
| With Sales Charge* | (29.16 | ) | (5.07 | ) | (0.25 | ) | ||||||||||||
SELECT CLASS SHARES | 9/10/01 | (27.36 | ) | (4.42 | ) | 0.14 | ||||||||||||
INSTITUTIONAL CLASS SHARES | 9/13/93 | (27.07 | ) | (4.18 | ) | 0.41 | ||||||||||||
| * | Sales Charge for Class A Shares is 2.25% |
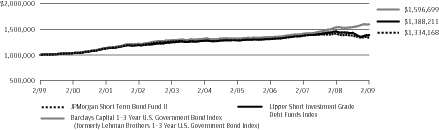
AS OF FEBRUARY 28, 2009 (Unaudited)
| Fund Inception | November 30, 1990 | |||||
| Fiscal Year End | Last Day of February | |||||
| Net Assets as of 2/28/2009 (In Thousands) | $125,895 | |||||
| Primary Benchmark | Barclays Capital 1–3 Year U.S. Government Bond Index (formerly Lehman Brothers 1–3 Year U.S. Government Bond Index) | |||||
| Average Credit Quality | AA+ | |||||
| Duration | 1.7 Years | |||||
Q: | HOW DID THE FUND PERFORM? |
A: | The JPMorgan Short Term Bond Fund II, which seeks a high level of income, consistent with preservation of capital,* returned –5.96%** (Select Class Shares) for the 12 months ended February 28, 2009, compared to the 3.68% return for the Barclays Capital 1–3 Year U.S. Government Bond Index (formerly Lehman Brothers 1–3 Year U.S. Government Bond Index) for the same period. |
Q: | WHY DID THE FUND PERFORM THIS WAY? |
A: | The Fund underperformed its benchmark for the period. Fixed income markets experienced much volatility and credit spread-widening due primarily to the deleveraging of large market participants and wide-ranging rating agency actions. Generally, when credit spreads of a particular group of securities widen, prices fall, yields increase and total returns decline, relative to comparable-duration U.S. Treasuries. Weak conditions within many financial firms aggravated investor concerns about financial firms’ capitalization. Throughout this turmoil, credit markets became more volatile and more illiquid, as investors lost confidence. Central banks globally responded by pouring enormous amounts of liquidity into the financial system. The liquidity that was provided to the system by central banks prevented a complete financial meltdown, but did not fully alleviate the selling pressures in the market. These pressures accelerated after the Lehman bankruptcy, which led to the Fund’s significant underperformance in September 2008. The Fund did not anticipate the size and longevity of the deleveraging that occurred in 2008. |
Q: | HOW WAS THE FUND MANAGED? |
A: | The focus was to manage the risk in the Fund as the illiquidity in the market spread. Specifically, the focus was on reducing risk by selling credit securities that we believed would fare the worst in a continued downturn while maintaining securities that we believed to have longer-term value. The proceeds from the sale of these securities were used to purchase U.S. Treasury securities as the flight to quality continued. In addition, the Fund experienced significant redemptions during the reporting period, which presented additional challenges in managing the Fund and resulted in the need to sell securities during periods of extreme market volatility. |
| U.S. Government Agency Securities | 29.7 | % | ||||
| Corporate Bonds | 16.5 | |||||
| U.S. Treasury Obligations | 12.2 | |||||
| Collateralized Mortgage Obligations | 9.1 | |||||
| Commercial Mortgage-Backed Securities | 3.3 | |||||
| Asset-Backed Securities | 2.4 | |||||
| Short-Term Investments | 26.8 |
| * | The advisor seeks to achieve the Fund’s objective. There can be no guarantee it will be achieved. |
| ** | The return shown is based on net asset value calculated for shareholder transactions and may differ from the return shown in the financial highlights which reflect adjustments made to the net asset value in accordance with accounting principles generally accepted in the United States of America. |
| *** | Percentages indicated are based upon total investments as of February 28, 2009. The Fund’s composition is subject to change. |
AS OF FEBRUARY 28, 2009 (Unaudited) (continued)
| INCEPTION DATE OF CLASS | 1 YEAR | 5 YEAR | 10 YEAR | |||||||||||||||
|---|---|---|---|---|---|---|---|---|---|---|---|---|---|---|---|---|---|---|
CLASS A SHARES | 5/6/96 | |||||||||||||||||
| Without Sales Charge | (6.02 | )% | 0.58 | % | 2.66 | % | ||||||||||||
| With Sales Charge* | (8.11 | ) | 0.12 | 2.43 | ||||||||||||||
CLASS M SHARES | 7/1/99 | |||||||||||||||||
| Without Sales Charge | (6.25 | ) | 0.35 | 2.42 | ||||||||||||||
| With Sales Charge** | (7.68 | ) | 0.04 | 2.26 | ||||||||||||||
SELECT CLASS SHARES | 11/30/90 | (5.96 | ) | 0.84 | 2.93 | |||||||||||||
| * | Sales Charge for Class A Shares is 2.25%. |
| ** | Sales Charge for Class M Shares is 1.50%. |
AS OF FEBRUARY 28, 2009
| PRINCIPAL AMOUNT($) | | SECURITY DESCRIPTION | | VALUE($) | |||||||||||
|---|---|---|---|---|---|---|---|---|---|---|---|---|---|---|---|
Long-Term Investments — 125.7% | |||||||||||||||
Asset-Backed Securities — 6.8% | |||||||||||||||
| 84 | American Express Credit Account Master Trust, Series 2004-C, Class C, VAR, 0.961%, 02/15/12 (e) (i) | 77 | |||||||||||||
| Countrywide Asset-Backed Certificates, | |||||||||||||||
| 1,073 | Series 2003-5, Class MF1, VAR, 5.413%, 01/25/34 (m) | 566 | |||||||||||||
| 8 | Series 2004-1, Class 3A, VAR, 0.754%, 04/25/34 (m) | 2 | |||||||||||||
| 590 | Series 2004-1, Class M1, VAR, 0.974%, 03/25/34 (m) | 242 | |||||||||||||
| 480 | Series 2004-1, Class M2, VAR, 1.024%, 03/25/34 (m) | 300 | |||||||||||||
| 116 | Series 2005-3, Class AF3, VAR, 4.823%, 08/25/35 (i) | 109 | |||||||||||||
| 420 | Series 2005-11, Class AF3, VAR, 4.778%, 02/25/36 (f) (i) | 252 | |||||||||||||
| Countrywide Home Equity Loan Trust, | |||||||||||||||
| 105 | Series 2004-1, Class A, VAR, 0.745%, 02/15/34 (f)(m) | 21 | |||||||||||||
| 126 | Series 2004-K, Class 2A, VAR, 0.755%, 02/15/34 (m) | 47 | |||||||||||||
| 374 | Granite Master Issuer plc, (United Kingdom), Series 2006-2, Class A4, VAR, 0.510%, 12/20/54 (m) | 232 | |||||||||||||
| 227 | GSAMP Trust, Series 2005-WMC2, Class A2B, VAR, 0.734%, 11/25/35 (m) | 211 | |||||||||||||
| 5,112 | Helios Finance LP, (Cayman Islands), Series 2007-S1, Class B1, VAR, 1.170%, 10/20/14 (e) (f) (i) | 2,403 | |||||||||||||
| K2 (USA) LLC, | |||||||||||||||
| 2,500 | VAR, 0.00%, 02/15/10 (d) (f) (i) (s) | — | |||||||||||||
| 8,000 | Series 2, VAR, 0.000%, 02/15/10 (d) (f) (i) (s) | — | |||||||||||||
| 9,000 | Series 2007-2D, VAR, 0.000%, 02/15/10 (d) (f) (i) (s) | — | |||||||||||||
| 8,500 | Series 2007-2I, VAR, 0.000%, 02/15/10 (d) (f) (i) (s) | — | |||||||||||||
| 9,000 | Series 2007-2J, VAR, 0.000%, 02/15/11 (d) (f) (i) (s) | — | |||||||||||||
| 3,100 | Links Finance LLC, VAR, 0.000%, 12/31/09 (d) (e) (f) (i) (s) | — | |||||||||||||
| Long Beach Mortgage Loan Trust, | |||||||||||||||
| 910 | Series 2004-1, Class M1, VAR, 0.974%, 02/25/34 (m) | 472 | |||||||||||||
| 610 | Series 2004-1, Class M2, VAR, 1.024%, 02/25/34 (m) | 343 | |||||||||||||
| 670 | Series 2004-3, Class M1, VAR, 1.044%, 07/25/34 (m) | 248 | |||||||||||||
| 114 | MASTR Asset Backed Securities Trust, Series 2006-AB1, Class A1, VAR, 0.614%, 02/25/36 (m) | 113 | |||||||||||||
| 610 | New Century Home Equity Loan Trust, Series 2005-1, Class M1, VAR, 0.924%, 03/25/35 (m) | 135 | |||||||||||||
| 345 | Newcastle Mortgage Securities Trust, Series 2006-1, Class A2, VAR, 0.594%, 03/25/36 (m) | 340 | |||||||||||||
| 201 | Option One Mortgage Loan Trust, Series 2003-1, Class A2, VAR, 1.314%, 02/25/33 (m) | 95 | |||||||||||||
| RESI Finance LP, (Cayman Islands), | |||||||||||||||
| 2,672 | Series 2003-C, Class B3, VAR, 1.849%, 09/10/35 (e) (m) | 1,069 | |||||||||||||
| 566 | Series 2003-D, Class B3, VAR, 1.749%, 12/10/35 (e) (m) | 212 | |||||||||||||
| 820 | Series 2003-D, Class B4, VAR, 1.949%, 12/10/35 (e) (m) | 303 | |||||||||||||
| 1,009 | Series 2005-A, Class B3, VAR, 1.029%, 03/10/37 (e) (m) | 247 | |||||||||||||
| 579 | Residential Asset Mortgage Products, Inc., Series 2006-RS1, Class AI2, VAR, 0.704%, 01/25/36 (m) | 451 | |||||||||||||
| Wachovia Asset Securitization, Inc., | |||||||||||||||
| 219 | Series 2002-HE2, Class A, VAR, 0.904%, 12/25/32 (f) | 83 | |||||||||||||
| 135 | Series 2003-HE3, Class A, VAR, 0.724%, 11/25/33 | 67 | |||||||||||||
| Total Asset-Backed Securities (Cost $58,280) | 8,640 | ||||||||||||||
Collateralized Mortgage Obligations — 13.0% | |||||||||||||||
Agency CMO — 3.4% | |||||||||||||||
| Federal Home Loan Mortgage Corp. REMICS, | |||||||||||||||
| 68 | Series 2508, Class PE, 5.500%, 05/15/28 (m) | 68 | |||||||||||||
| 3,833 | Series 2701, Class ST, IF, IO, 6.545%, 08/15/21 (m) | 239 | |||||||||||||
| 323 | Series 2772, Class GI, IO, 5.000%, 11/15/22 (m) | 2 | |||||||||||||
| 2,295 | Series 2779, Class SM, IF, IO, 6.695%, 10/15/18 (m) | 168 | |||||||||||||
| 199 | Series 2781, Class PI, IO, 5.000%, 10/15/23 (m) | 1 | |||||||||||||
| 4,586 | Series 2861, Class GS, IF, IO, 6.745%, 01/15/21 (m) | 145 | |||||||||||||
| 1,262 | Series 2891, Class LI, IO, 5.000%, 06/15/24 (m) | 19 | |||||||||||||
| 1,591 | Series 2931, Class GA, 5.000%, 11/15/28 (m) | 1,632 | |||||||||||||
| 1,144 | Series 2971, Class PI, IO, 5.500%, 03/15/26 (m) | 36 | |||||||||||||
| 224 | Series 2980, Class QB, 6.500%, 05/15/35 (m) | 237 | |||||||||||||
| 2,267 | Series 3149, Class IU, IO, 6.000%, 09/15/25 (m) | 78 | |||||||||||||
| 1,387 | Federal National Mortgage Association REMICS, Series 2004-87, Class JI, IO, 5.000%, 11/25/30 (m) | 99 | |||||||||||||
| PRINCIPAL AMOUNT($) | | SECURITY DESCRIPTION | | VALUE($) | ||||||||||
|---|---|---|---|---|---|---|---|---|---|---|---|---|---|---|
Long-Term Investments — Continued | ||||||||||||||
Agency CMO — Continued | ||||||||||||||
| 6,591 | Federal National Mortgage Association STRIPS, Series 378, Class 5, IO, 5.000%, 07/01/36 (m) | 770 | ||||||||||||
| Federal National Mortgage Association Whole Loan, | ||||||||||||||
| 59 | Series 2003-W3, Class 2A5, 5.356%, 06/25/42 (m) | 59 | ||||||||||||
| 822 | Series 2003-W6, Class 1A41, 5.398%, 10/25/42 (m) | 840 | ||||||||||||
| 288 | Government National Mortgage Association, Series 2004-44, Class PK, IO, 5.500%, 10/20/27 (m) | 2 | ||||||||||||
| 4,395 | ||||||||||||||
Non-Agency CMO — 9.6% | ||||||||||||||
| Adjustable Rate Mortgage Trust, | ||||||||||||||
| 95 | Series 2005-4, Class 7A2, VAR, 0.704%, 08/25/35 (m) | 40 | ||||||||||||
| 464 | Series 2005-5, Class 6A21, VAR, 0.704%, 09/25/35 (m) | 224 | ||||||||||||
| 90 | Series 2005-6A, Class 2A1, VAR, 0.784%, 11/25/35 (m) | 40 | ||||||||||||
| 867 | Citigroup Mortgage Loan Trust, Inc., Series 2007-12, Class 2A1, 6.500%, 10/25/36 (e) (i) | 388 | ||||||||||||
| 1,990 | CitiMortgage Alternative Loan Trust, Series 2006-A6, Class 1A4, 6.000%, 11/25/36 (m) | 1,175 | ||||||||||||
| 1,643 | Countrywide Alternative Loan Trust, Series 2004-28CB, Class 3A1, 6.000%, 01/25/35 (i) | 1,318 | ||||||||||||
| Countrywide Home Loan Mortgage Pass-Through Trust, | ||||||||||||||
| 783 | Series 2002-22, Class A20, 6.250%, 10/25/32 (m) | 684 | ||||||||||||
| 376 | Series 2006-10, Class 1A10, 5.850%, 05/25/36 (i) | 308 | ||||||||||||
| CS First Boston Mortgage Securities Corp., | ||||||||||||||
| 164 | Series 2003-29, Class 7A1, 6.500%, 12/25/33 (m) | 139 | ||||||||||||
| 489 | Series 2004-5, Class 1A8, 6.000%, 09/25/34 (m) | 489 | ||||||||||||
| 1,690 | Deutsche ALT-A Securities, Inc., Alternate Loan Trust, Series 2006-AR1, Class 1A2, VAR, 0.684%, 02/25/36 (m) | 1,307 | ||||||||||||
| 2,464 | Residential Accredit Loans, Inc., Series 2006-QS11, Class 1A1, 6.500%, 08/25/36 (m) | 1,066 | ||||||||||||
| 157 | SACO I, Inc. (Bear Stearns), Series 1997-2, Class 1A5, 7.000%, 08/25/36 (e) (i) | 146 | ||||||||||||
| 404 | Structured Asset Mortgage Investments, Inc., Series 2005-AR2, Class 2A1, VAR, 0.704%, 05/25/45 | 181 | ||||||||||||
| 271 | WaMu Mortgage Pass-Through Certificates, Series 2005-AR2, Class 2A21, VAR, 0.804%, 01/25/45 | 117 | ||||||||||||
| Wells Fargo Mortgage Backed Securities Trust, | ||||||||||||||
| 504 | Series 2003-2, Class A6, 5.250%, 02/25/18 | 494 | ||||||||||||
| 2,109 | Series 2003-M, Class A1, VAR, 4.709%, 12/25/33 (i) | 1,717 | ||||||||||||
| 1,160 | Series 2006-AR3, Class A1, VAR, 5.704%, 03/25/36 | 657 | ||||||||||||
| 3,085 | Series 2007-AR4, Class A1, VAR, 5.997%, 08/25/37 (i) | 1,621 | ||||||||||||
| 12,111 | ||||||||||||||
| Total Collateralized Mortgage Obligations (Cost $23,797) | 16,506 | |||||||||||||
Commercial Mortgage-Backed Securities — 0.6% | ||||||||||||||
| 785 | Morgan Stanley Dean Witter Capital I, Series 2003-HQ2, Class A2, 4.920%, 03/12/35 (m) | 681 | ||||||||||||
| 170 | Wachovia Bank Commercial Mortgage Trust, Series 2005-C17, Class A4, VAR, 5.083%, 03/15/42 | 129 | ||||||||||||
| Total Commercial Mortgage-Backed Securities (Cost $955) | 810 | |||||||||||||
Corporate Bonds — 32.2% | ||||||||||||||
Aerospace & Defense — 0.2% | ||||||||||||||
| 210 | Hawker Beechcraft Acquisition Co. LLC/Hawker Beechcraft Notes Co., PIK, 8.875%, 04/01/15 (m) | 18 | ||||||||||||
| 265 | L-3 Communications Corp., 5.875%, 01/15/15 (m) | 245 | ||||||||||||
| 263 | ||||||||||||||
Auto Components — 0.2% | ||||||||||||||
| 210 | Goodyear Tire & Rubber Co. (The), 9.000%, 07/01/15 (m) | 159 | ||||||||||||
| 285 | Tenneco, Inc., 8.125%, 11/15/15 | 48 | ||||||||||||
| 365 | TRW Automotive, Inc., 7.250%, 03/15/17 (e) | 102 | ||||||||||||
| 309 | ||||||||||||||
Beverages — 0.6% | ||||||||||||||
| 280 | Anheuser-Busch InBev Worldwide, Inc., 7.200%, 01/15/14 (e) (m) | 291 | ||||||||||||
| 330 | Constellation Brands, Inc., 7.250%, 09/01/16 (m) | 311 | ||||||||||||
| 250 | Dr. Pepper Snapple Group, Inc., 6.820%, 05/01/18 (m) | 233 | ||||||||||||
| 835 | ||||||||||||||
Capital Markets — 1.1% | ||||||||||||||
| 415 | Goldman Sachs Group, Inc. (The), 6.750%, 10/01/37 (m) | 295 | ||||||||||||
| 1,645 | Lehman Brothers Holdings Capital Trust VII, 5.857%, 05/31/12 (d) (i) (x) | — | (h) | |||||||||||
AS OF FEBRUARY 28, 2009 (continued)
| PRINCIPAL AMOUNT($) | | SECURITY DESCRIPTION | | VALUE($) | ||||||||||
|---|---|---|---|---|---|---|---|---|---|---|---|---|---|---|
Long-Term Investments — Continued | ||||||||||||||
Capital Markets — Continued | ||||||||||||||
| Lehman Brothers Holdings, Inc., | ||||||||||||||
| 650 | VAR, 0.000%, 08/21/09 (d) | 80 | ||||||||||||
| 690 | VAR, 0.000%, 05/25/10 (d) | 84 | ||||||||||||
| Morgan Stanley, | ||||||||||||||
| 125 | 5.450%, 01/09/17 (m) | 108 | ||||||||||||
| 810 | 5.625%, 01/09/12 (m) | 781 | ||||||||||||
| 1,348 | ||||||||||||||
Chemicals — 1.1% | ||||||||||||||
| 480 | Huntsman LLC, 11.500%, 07/15/12 (m) | 378 | ||||||||||||
| 580 | Ineos Group Holdings plc, (United Kingdom), 8.500%, 02/15/16 (e) (m) | 35 | ||||||||||||
| 450 | Nalco Co., 8.875%, 11/15/13 (m) | 435 | ||||||||||||
| 255 | PolyOne Corp., 8.875%, 05/01/12 (m) | 105 | ||||||||||||
| 490 | Terra Capital, Inc., 7.000%, 02/01/17 | 446 | ||||||||||||
| 1,399 | ||||||||||||||
Commercial Banks — 0.4% | ||||||||||||||
| 670 | Glitnir Banki HF, (Iceland), 0.000%, 10/15/08 (d) (e) (i) | 7 | ||||||||||||
| 2,535 | Shinsei Finance II, (Cayman Islands), VAR, 7.160%, 07/25/16 (e) (i) (x) | 261 | ||||||||||||
| 320 | Woori Bank, (South Korea), VAR, 5.750%, 03/13/14 (e) (i) | 260 | ||||||||||||
| 528 | ||||||||||||||
Commercial Services & Supplies — 0.5% | ||||||||||||||
| 190 | ACCO Brands Corp., 7.625%, 08/15/15 (m) | 77 | ||||||||||||
| 475 | Allied Waste North America, Inc., 7.250%, 03/15/15 (m) | 463 | ||||||||||||
| 72 | Corrections Corp. of America, 6.250%, 03/15/13 (m) | 69 | ||||||||||||
| 609 | ||||||||||||||
Consumer Finance — 0.8% | ||||||||||||||
| 545 | Ford Motor Credit Co. LLC, 7.800%, 06/01/12 (m) | 296 | ||||||||||||
| 202 | GMAC LLC, 6.875%, 08/28/12 (e) (m) | 116 | ||||||||||||
| 650 | John Deere Capital Corp., 5.350%, 04/03/18 (m) | 600 | ||||||||||||
| 1,012 | ||||||||||||||
Diversified Consumer Services — 0.4% | ||||||||||||||
| 150 | Service Corp. International, 7.375%, 10/01/14 | 143 | ||||||||||||
| 445 | Stewart Enterprises, Inc., 6.250%, 02/15/13 | 390 | ||||||||||||
| 533 | ||||||||||||||
Diversified Financial Services — 2.5% | ||||||||||||||
| 370 | General Electric Capital Corp., 5.875%, 01/14/38 (m) | 263 | ||||||||||||
| 3,220 | Xstrata Finance Dubai Ltd., (United Arab Emirates), VAR, 1.581%, 11/13/09 (e) (m) | 2,894 | ||||||||||||
| 3,157 | ||||||||||||||
Diversified Telecommunication Services — 3.6% | ||||||||||||||
| 850 | AT&T, Inc., 5.800%, 02/15/19 (m) | 826 | ||||||||||||
| 195 | Digicel Group Ltd., (Bermuda), 8.875%, 01/15/15 (e) (m) | 145 | ||||||||||||
| 665 | Nordic Telephone Co. Holdings ApS, (Denmark), 8.875%, 05/01/16 (e) (m) | 605 | ||||||||||||
| 385 | Qwest Communications International, Inc., 7.250%, 02/15/11 (m) | 366 | ||||||||||||
| 1,000 | Telefonica Emisiones S.A.U., (Spain), 5.855%, 02/04/13 | 1,025 | ||||||||||||
| Verizon Wireless Capital LLC, | ||||||||||||||
| 825 | 5.550%, 02/01/14 (e) | 820 | ||||||||||||
| 240 | 8.500%, 11/15/18 (e) | 270 | ||||||||||||
| 490 | Wind Acquisition Finance S.A., (Luxembourg), 10.750%, 12/01/15 (e) | 491 | ||||||||||||
| 4,548 | ||||||||||||||
Electric Utilities — 1.5% | ||||||||||||||
| 195 | EDF S.A., (France), 6.950%, 01/26/39 (e) (m) | 196 | ||||||||||||
| 560 | Indiana Michigan Power Co., 7.000%, 03/15/19 (m) | 546 | ||||||||||||
| 270 | Mirant Americas Generation LLC, 8.300%, 05/01/11 (m) | 260 | ||||||||||||
| 200 | Nevada Power Co., 7.125%, 03/15/19 (m) | 200 | ||||||||||||
| 450 | Spectra Energy Capital LLC, 7.500%, 09/15/38 | 394 | ||||||||||||
| 235 | Texas Competitive Electric Holdings Co. LLC, 10.250%, 11/01/15 | 119 | ||||||||||||
| 235 | Virginia Electric & Power Co., 6.350%, 11/30/37 | 237 | ||||||||||||
| 1,952 | ||||||||||||||
Electrical Equipment — 0.1% | ||||||||||||||
| 100 | Baldor Electric Co., 8.625%, 02/15/17 (m) | 79 | ||||||||||||
Electronic Equipment, Instruments & Components — 0.0% (g) | ||||||||||||||
| 260 | NXP BV / NXP Funding LLC, (Netherlands), 9.500%, 10/15/15 (m) | 22 | ||||||||||||
FDIC Guaranteed Securities (˜) — 1.8% | ||||||||||||||
| 735 | Bank of America Corp., 3.125%, 06/15/12 (m) | 754 | ||||||||||||
| 735 | Citigroup, Inc., 2.875%, 12/09/11 (m) | 751 | ||||||||||||
| 750 | Goldman Sachs Group, Inc. (The), 3.250%, 06/15/12 (m) | 776 | ||||||||||||
| 2,281 | ||||||||||||||
Food & Staples Retailing — 0.1% | ||||||||||||||
| 160 | Wal-Mart Stores, Inc., 5.250%, 09/01/35 | 149 | ||||||||||||
Food Products — 0.1% | ||||||||||||||
| 185 | Del Monte Corp., 6.750%, 02/15/15 (m) | 177 | ||||||||||||
Gas Utilities — 0.8% | ||||||||||||||
| 830 | NGPL PipeCo LLC, 7.119%, 12/15/17 (e) (m) | 770 | ||||||||||||
| 270 | Sonat, Inc., 7.625%, 07/15/11 | 258 | ||||||||||||
| 1,028 | ||||||||||||||
| PRINCIPAL AMOUNT($) | | SECURITY DESCRIPTION | | VALUE($) | ||||||||||
|---|---|---|---|---|---|---|---|---|---|---|---|---|---|---|
Long-Term Investments — Continued | ||||||||||||||
Health Care Equipment & Supplies — 0.8% | ||||||||||||||
| 360 | Biomet, Inc., PIK, 10.375%, 10/15/17 (m) | 314 | ||||||||||||
| 735 | Cooper Cos., Inc. (The), 7.125%, 02/15/15 (m) | 657 | ||||||||||||
| 971 | ||||||||||||||
Health Care Providers & Services — 1.0% | ||||||||||||||
| 400 | CHS/Community Health Systems, Inc., 8.875%, 07/15/15 (m) | 378 | ||||||||||||
| 570 | HCA, Inc., PIK, 9.625%, 11/15/16 (m) | 476 | ||||||||||||
| 400 | Roche Holdings, Inc., 6.000%, 03/01/19 (e) | 404 | ||||||||||||
| 1,258 | ||||||||||||||
Hotels, Restaurants & Leisure — 0.8% | ||||||||||||||
| 530 | Host Hotels & Resorts LP, 7.125%, 11/01/13 (m) | 420 | ||||||||||||
| 545 | MGM Mirage, 5.875%, 02/27/14 (m) | 226 | ||||||||||||
| 455 | Vail Resorts, Inc., 6.750%, 02/15/14 | 382 | ||||||||||||
| 1,028 | ||||||||||||||
Household Durables — 0.4% | ||||||||||||||
| Beazer Homes USA, Inc., | �� | |||||||||||||
| 205 | 6.500%, 11/15/13 (m) | 56 | ||||||||||||
| 70 | 6.875%, 07/15/15 (m) | 19 | ||||||||||||
| 320 | Jarden Corp., 7.500%, 05/01/17 (m) | 249 | ||||||||||||
| 355 | Sealy Mattress Co., 8.250%, 06/15/14 | 144 | ||||||||||||
| 330 | Simmons Co., SUB, 10.000%, 12/15/14 | 3 | ||||||||||||
| 471 | ||||||||||||||
Household Products — 0.6% | ||||||||||||||
| Visant Holding Corp., | ||||||||||||||
| 510 | 8.750%, 12/01/13 | 469 | ||||||||||||
| 340 | SUB, 10.250%, 12/01/13 (m) | 310 | ||||||||||||
| 779 | ||||||||||||||
Independent Power Producers & Energy Traders — 0.2% | ||||||||||||||
| 335 | NRG Energy, Inc., 7.375%, 02/01/16 (m) | 309 | ||||||||||||
Insurance — 3.1% | ||||||||||||||
| 190 | Metropolitan Life Global Funding I, 5.125%, 04/10/13 (e) (m) | 181 | ||||||||||||
| 1,790 | Nationwide Life Global Funding I, VAR, 1.448%, 10/09/09 (e) (m) | 1,770 | ||||||||||||
| 395 | Principal Life Income Funding Trusts, 5.300%, 04/24/13 (m) | 376 | ||||||||||||
| 518 | QBE Insurance Group Ltd., (Australia), 9.750%, 03/14/14 (e) (i) | 510 | ||||||||||||
| 1,790 | StanCorp Financial Group, Inc., VAR, 6.900%, 05/29/67 (i) | 858 | ||||||||||||
| 1,705 | Stingray Pass-Through Trust, (Cayman Islands), 5.902%, 01/12/15 (e) (i) | 205 | ||||||||||||
| 3,900 | ||||||||||||||
IT Services — 0.1% | ||||||||||||||
| 200 | SunGard Data Systems, Inc., 10.250%, 08/15/15 | 137 | ||||||||||||
Leisure Equipment & Products — 0.2% | ||||||||||||||
| 450 | Steinway Musical Instruments, Inc., 7.000%, 03/01/14 (e) | 297 | ||||||||||||
Machinery — 0.3% | ||||||||||||||
| 445 | Terex Corp., 8.000%, 11/15/17 | 358 | ||||||||||||
Media — 1.6% | ||||||||||||||
| 575 | CCO Holdings LLC/CCO Holdings Capital Corp., 8.750%, 11/15/13 (d) (m) | 448 | ||||||||||||
| 640 | Dex Media West LLC/Dex Media West Finance Co., 9.875%, 08/15/13 (m) | 98 | ||||||||||||
| 870 | Dex Media, Inc., SUB, 9.000%, 11/15/13 (m) | 56 | ||||||||||||
| 285 | DirecTV Holdings LLC/DirecTV Financing Co., 6.375%, 06/15/15 (m) | 259 | ||||||||||||
| 530 | DISH DBS Corp., 7.125%, 02/01/16 (m) | 478 | ||||||||||||
| 320 | Quebecor Media, Inc., (Canada), 7.750%, 03/15/16 (m) | 261 | ||||||||||||
| 335 | Time Warner Cable, Inc., 7.300%, 07/01/38 | 306 | ||||||||||||
| 125 | Videotron Ltee, (Canada), 6.875%, 01/15/14 | 117 | ||||||||||||
| 2,023 | ||||||||||||||
Metals & Mining — 0.7% | ||||||||||||||
| 225 | Arch Western Finance LLC, 6.750%, 07/01/13 (m) | 210 | ||||||||||||
| 255 | Freeport-McMoRan Copper & Gold, Inc., 8.250%, 04/01/15 (m) | 227 | ||||||||||||
| 490 | Rio Tinto Finance USA Ltd., (Australia), 5.875%, 07/15/13 (m) | 446 | ||||||||||||
| 883 | ||||||||||||||
Multiline Retail — 0.4% | ||||||||||||||
| 185 | Neiman-Marcus Group, Inc. (The), PIK, 9.000%, 10/15/15 (m) | 73 | ||||||||||||
| 415 | Target Corp., 6.500%, 10/15/37 | 374 | ||||||||||||
| 447 | ||||||||||||||
Multi-Utilities — 0.4% | ||||||||||||||
| 505 | Mirant North America LLC, 7.375%, 12/31/13 (m) | 462 | ||||||||||||
Oil, Gas & Consumable Fuels — 2.3% | ||||||||||||||
| 890 | Canadian Natural Resources Ltd., (Canada), 6.250%, 03/15/38 (m) | 664 | ||||||||||||
| 430 | Chesapeake Energy Corp., 6.500%, 08/15/17 (m) | 339 | ||||||||||||
| 740 | EnCana Corp., (Canada), 6.625%, 08/15/37 (m) | 617 | ||||||||||||
| 700 | Enterprise Products Operating LLC, 6.300%, 09/15/17 (m) | 642 | ||||||||||||
| 225 | Hess Corp., 8.125%, 02/15/19 (m) | 229 | ||||||||||||
| 460 | XTO Energy, Inc., 6.375%, 06/15/38 | 389 | ||||||||||||
| 2,880 | ||||||||||||||
Paper & Forest Products — 0.3% | ||||||||||||||
| 345 | Georgia-Pacific LLC, 7.000%, 01/15/15 (e) (m) | 321 | ||||||||||||
AS OF FEBRUARY 28, 2009 (continued)
| PRINCIPAL AMOUNT($) | | SECURITY DESCRIPTION | | VALUE($) | ||||||||||
|---|---|---|---|---|---|---|---|---|---|---|---|---|---|---|
Long-Term Investments — Continued | ||||||||||||||
Pharmaceuticals — 0.6% | ||||||||||||||
| 300 | GlaxoSmithKline Capital, Inc., 6.375%, 05/15/38 (m) | 315 | ||||||||||||
| 435 | Novartis Capital Corp., 4.125%, 02/10/14 (m) | 439 | ||||||||||||
| 754 | ||||||||||||||
Road & Rail — 0.1% | ||||||||||||||
| 105 | Hertz Corp. (The), 8.875%, 01/01/14 (m) | 52 | ||||||||||||
| 195 | RSC Equipment Rental, Inc., 9.500%, 12/01/14 (m) | 104 | ||||||||||||
| 156 | ||||||||||||||
Semiconductors & Semiconductor Equipment — 0.2% | ||||||||||||||
| 265 | Freescale Semiconductor, Inc., PIK, 9.125%, 12/15/14 (m) | 17 | ||||||||||||
| 780 | Sensata Technologies BV, (Netherlands), 8.000%, 05/01/14 | 203 | ||||||||||||
| 220 | ||||||||||||||
Software — 0.0% (g) | ||||||||||||||
| 310 | Open Solutions, Inc., 9.750%, 02/01/15 (e) (m) | 49 | ||||||||||||
Specialty Retail — 0.1% | ||||||||||||||
| 160 | Sally Holdings LLC/Sally Capital, Inc., 9.250%, 11/15/14 | 152 | ||||||||||||
Textiles, Apparel & Luxury Goods — 0.1% | ||||||||||||||
| 250 | Hanesbrands, Inc., VAR, 5.698%, 12/15/14 (m) | 165 | ||||||||||||
Thrifts & Mortgage Finance — 0.2% | ||||||||||||||
| 185 | Countrywide Financial Corp., VAR, 1.686%, 03/24/09 (m) | 185 | ||||||||||||
Tobacco — 0.8% | ||||||||||||||
| 595 | Altria Group, Inc., 9.700%, 11/10/18 (m) | 623 | ||||||||||||
| 405 | Philip Morris International, Inc., 6.375%, 05/16/38 (m) | 398 | ||||||||||||
| 1,021 | ||||||||||||||
Wireless Telecommunication Services — 1.1% | ||||||||||||||
| 215 | Cricket Communications, Inc., 9.375%, 11/01/14 (m) | 196 | ||||||||||||
| 260 | MetroPCS Wireless, Inc., 9.250%, 11/01/14 (m) | 246 | ||||||||||||
| 985 | Rogers Communications, Inc., (Canada), 6.800%, 08/15/18 | 986 | ||||||||||||
| 1,428 | ||||||||||||||
| Total Corporate Bonds (Cost $58,023) | 40,883 | |||||||||||||
Foreign Government Security — 0.5% | ||||||||||||||
| 646 | National Agricultural Cooperative Federation, (South Korea), VAR, 5.750%, 06/18/14 (f) (Cost $656) | 580 | ||||||||||||
Loan Participations & Assignments — 0.7% | ||||||||||||||
Independent Power Producers & Energy Traders — 0.5% | ||||||||||||||
| TXU (Texas Competitive Electric), Initial Tranche B-2 Term Loan, | ||||||||||||||
| 5 | 3.909%, 10/10/14 | 3 | ||||||||||||
| 975 | 3.948%, 10/10/14 | 601 | ||||||||||||
| 8 | 4.451%, 10/10/14 | 5 | ||||||||||||
| 609 | ||||||||||||||
IT Services — 0.2% | ||||||||||||||
| First Data Corp., Initial Tranche B1 Term Loan, | ||||||||||||||
| 437 | 3.223%, 09/24/14 | 288 | ||||||||||||
| 28 | 3.229%, 09/24/14 | 18 | ||||||||||||
| 306 | ||||||||||||||
| Total Loan Participations & Assignments (Cost $1,438) | 915 | |||||||||||||
Mortgage Pass-Through Securities — 35.0% | ||||||||||||||
| Federal Home Loan Mortgage Corp., Gold Pool, 15 Year, Single Family, | ||||||||||||||
| 57 | 6.000%, 02/01/11 – 04/01/11 (m) | 59 | ||||||||||||
| Federal Home Loan Mortgage Corp., Gold Pool, 30 Year, Single Family, | ||||||||||||||
| 82 | 6.000%, 01/01/35 (m) | 85 | ||||||||||||
| 25 | 7.000%, 12/01/25 – 02/01/26 (m) | 27 | ||||||||||||
| 57 | 7.500%, 10/01/26 – 02/01/27 (m) | 61 | ||||||||||||
| 42 | 8.000%, 04/01/26 – 07/01/26 (m) | 44 | ||||||||||||
| 3,650 | TBA, 6.500%, 03/15/39 | 3,817 | ||||||||||||
| Federal National Mortgage Association, 15 Year, Single Family, | ||||||||||||||
| 3,350 | TBA, 4.500%, 03/25/24 | 3,409 | ||||||||||||
| 1,140 | TBA, 5.500%, 03/25/24 | 1,182 | ||||||||||||
| 650 | TBA, 6.000%, 03/25/24 | 678 | ||||||||||||
| Federal National Mortgage Association, 30 Year, Single Family, | ||||||||||||||
| 663 | 6.000%, 10/01/23 – 01/01/29 (m) | 691 | ||||||||||||
| 60 | 6.500%, 04/01/29 – 11/01/29 (m) | 64 | ||||||||||||
| 77 | 7.000%, 02/01/35 (m) | 82 | ||||||||||||
| 26 | 7.500%, 03/01/35 (m) | 27 | ||||||||||||
| — (h) | 8.000%, 08/01/22 (m) | — | (h) | |||||||||||
| — (h) | 8.500%, 10/01/25 (m) | — | (h) | |||||||||||
| 5,600 | TBA, 4.500%, 03/25/39 | 5,610 | ||||||||||||
| 6,800 | TBA, 5.000%, 03/25/39 | 6,917 | ||||||||||||
| 17,035 | TBA, 5.500%, 03/25/39 | 17,450 | ||||||||||||
| Government National Mortgage Association, 30 Year, Single Family, | ||||||||||||||
| — (h) | 9.000%, 04/15/11 (m) | — | (h) | |||||||||||
| 1,100 | TBA, 5.000%, 03/15/39 | 1,122 | ||||||||||||
| 2,100 | TBA, 6.000%, 03/15/39 | 2,170 | ||||||||||||
| 900 | TBA, 6.500%, 03/15/39 | 938 | ||||||||||||
| Total Mortgage Pass-Through Securities (Cost $44,258) | 44,433 | |||||||||||||
| PRINCIPAL AMOUNT($) | | SECURITY DESCRIPTION | | VALUE($) | ||||||||||
|---|---|---|---|---|---|---|---|---|---|---|---|---|---|---|
Long-Term Investments — Continued | ||||||||||||||
Private Placements — 11.1% | ||||||||||||||
| 2,823 | 81 Irving Place, Irving Tenants Corp., Secured by First Mortgage and Agreement on Co-op Apartment Building in New York City, 6.950%, 01/01/29 (f) (i) | 2,851 | ||||||||||||
| 10,235 | 200 East 57th St., 200 East Tenants Corp., Secured by First Mortgage and Agreement on Co-op Apartment Building in New York City, 6.500%, 01/01/14 (f) (i) | 10,498 | ||||||||||||
| 708 | 200 East 57th St., 200 East Tenants Corp., Secured by Second Mortgage and Agreement on Co-op Apartment Building in New York City, 6.720%, 01/01/13 (f) (i) | 733 | ||||||||||||
| 14,082 | ||||||||||||||
| Total Private Placements (Cost $13,766) | 14,082 | |||||||||||||
U.S. Government Agency Securities — 10.8% | ||||||||||||||
| 7,565 | Federal Home Loan Mortgage Corp., 4.500%, 01/15/14 (m) | 8,194 | ||||||||||||
| 5,545 | Federal National Mortgage Association, 1.750%, 03/23/11 (m) | 5,551 | ||||||||||||
| Total U.S. Government Agency Securities (Cost $13,232) | 13,745 | |||||||||||||
U.S. Treasury Obligations — 14.3% | ||||||||||||||
| U.S. Treasury Bonds, | ||||||||||||||
| 555 | 4.375%, 02/15/38 (m) | 612 | ||||||||||||
| 2,375 | 4.500%, 05/15/38 (m) | 2,696 | ||||||||||||
| 100 | 7.250%, 05/15/16 (k) | 127 | ||||||||||||
| U.S. Treasury Notes, | ||||||||||||||
| 6,000 | 0.875%, 01/31/11 (m) | 5,987 | ||||||||||||
| 1,260 | 1.500%, 10/31/10 (k) (m) | 1,271 | ||||||||||||
| 330 | 1.750%, 03/31/10 (k) (m) | 333 | ||||||||||||
| 1,330 | 1.750%, 01/31/14 (m) | 1,316 | ||||||||||||
| 225 | 2.000%, 02/28/10 (k) (m) | 228 | ||||||||||||
| 610 | 2.000%, 11/30/13 (m) | 611 | ||||||||||||
| 335 | 2.125%, 04/30/10 (k) (m) | 340 | ||||||||||||
| 1,040 | 2.750%, 07/31/10 (k) (m) | 1,068 | ||||||||||||
| 1,385 | 2.750%, 10/31/13 (m) | 1,437 | ||||||||||||
| 5 | 2.750%, 02/15/19 (m) | 5 | ||||||||||||
| 105 | 2.875%, 06/30/10 (m) | 108 | ||||||||||||
| 175 | 3.375%, 10/15/09 (m) | 178 | ||||||||||||
| 485 | 3.500%, 02/15/10 (k) (m) | 498 | ||||||||||||
| 450 | 3.875%, 05/15/09 (k) (m) | 453 | ||||||||||||
| 320 | 4.000%, 02/15/15 (k) | 351 | ||||||||||||
| 85 | 4.500%, 09/30/11 (k) (m) | 92 | ||||||||||||
| 85 | 4.625%, 07/31/09 (k) (m) | 87 | ||||||||||||
| 265 | 4.875%, 08/15/09 (k) (m) | 270 | ||||||||||||
| Total U.S. Treasury Obligations (Cost $18,056) | 18,068 | |||||||||||||
| SHARES | | SECURITY DESCRIPTION | | VALUE($) | ||||||||||
|---|---|---|---|---|---|---|---|---|---|---|---|---|---|---|
Preferred Stocks — 0.7% | ||||||||||||||
Insurance — 0.7% | ||||||||||||||
| 2,000 | Axis Capital Holdings Ltd., (Bermuda), Series B, VAR, 7.500%, 12/01/15 (Cost $2,029) (f) (i) (x) | 900 | ||||||||||||
| Total Long-Term Investments (Cost $234,490) | 159,562 | |||||||||||||
| NOTIONAL AMOUNT($) | | SECURITY DESCRIPTION | | VALUE | |||||||
|---|---|---|---|---|---|---|---|---|---|---|---|
Options Purchased — 0.4% | |||||||||||
Call Option Purchased — 0.3% | |||||||||||
Receiver Option Purchased on Interest Rate Swap: | |||||||||||
| 35,630 | Expiring 03/16/09. If exercised the Fund receives semi-annually 2.510% and pays quarterly floating 3 month LIBOR expiring 03/18/10, European Style. Counterparty: Barclays Bank plc (r) | 385 | |||||||||
Put Option Purchased — 0.1% | |||||||||||
Payer Option Purchased on Interest Rate Swap: | |||||||||||
| 4,250 | Expiring 07/08/09. If exercised the Fund pays semi-annually 3.713% and receives quarterly floating 3 month LIBOR expiring 07/10/19, European Style. Counterparty: Credit Suisse International (r) | 107 | |||||||||
| Total Options Purchased (Cost $147) | 492 | ||||||||||
| SHARES | | | |||||||||||||
|---|---|---|---|---|---|---|---|---|---|---|---|---|---|---|---|
Short-Term Investment — 10.4% | |||||||||||||||
Investment Company — 10.4% | |||||||||||||||
| 13,208 | JPMorgan Prime Money Market Fund, Institutional Class Shares, 0.830% (b) (l) (m) (Cost $13,208) | 13,208 | |||||||||||||
Total Investments — 136.5% (Cost $247,845) | 173,262 | ||||||||||||||
Liabilities in Excess of Other Assets — (36.5)% | (46,363 | ) | |||||||||||||
NET ASSETS — 100.0% | $ | 126,899 | |||||||||||||
AS OF FEBRUARY 28, 2009 (continued)
| NUMBER OF CONTRACTS | | DESCRIPTION | | EXPIRATION DATE | | NOTIONAL VALUE AT 02/28/09 | | UNREALIZED APPRECIATION (DEPRECIATION) | ||||||||||
|---|---|---|---|---|---|---|---|---|---|---|---|---|---|---|---|---|---|---|
Long Futures Outstanding | ||||||||||||||||||
| 2 | Eurodollar | 03/16/09 | $ | 494 | $ | 8 | ||||||||||||
| 15 | 30 Day Federal Funds | 03/30/09 | 6,235 | 61 | ||||||||||||||
| 2 | Eurodollar | 06/15/09 | 493 | 5 | ||||||||||||||
| 64 | 10 Year U.S. Treasury Note | 06/19/09 | 7,682 | (94 | ) | |||||||||||||
| 10 | 30 Year U.S. Treasury Bond | 06/19/09 | 1,233 | (29 | ) | |||||||||||||
| 14 | 30 Day Federal Funds | 06/30/09 | 5,817 | 48 | ||||||||||||||
| 28 | 2 Year U.S. Treasury Note | 06/30/09 | 6,065 | (8 | ) | |||||||||||||
| 10 | 30 Day Federal Funds | 07/31/09 | 4,153 | 34 | ||||||||||||||
| 2 | Eurodollar | 09/14/09 | 493 | 6 | ||||||||||||||
| 5 | 30 Day Federal Funds | 11/30/09 | 2,073 | 11 | ||||||||||||||
| 2 | Eurodollar | 12/14/09 | 492 | 6 | ||||||||||||||
| 2 | Eurodollar | 03/15/10 | 492 | 6 | ||||||||||||||
| 2 | Eurodollar | 06/14/10 | 491 | 6 | ||||||||||||||
| 97 | Eurodollar | 09/13/10 | 23,740 | 74 | ||||||||||||||
| 2 | Eurodollar | 12/13/10 | 488 | — | (h) | |||||||||||||
Short Futures Outstanding | ||||||||||||||||||
| (14) | 10 Year U.S. Treasury Note | 06/19/09 | (1,680 | ) | 19 | |||||||||||||
| (23) | 2 Year U.S. Treasury Note | 06/30/09 | (4,982 | ) | (6 | ) | ||||||||||||
| (167) | 5 Year U.S. Treasury Note | 06/30/09 | (19,470 | ) | 73 | |||||||||||||
| $ | 220 | |||||||||||||||||
Receiver Option Written on Interest Rate Swap*
| COUNTERPARTY | | EXERCISE RATE** (r) | | OPTION EXPIRATION DATE | | SWAP TERMINATION DATE | | NOTIONAL AMOUNT | | VALUE | ||||||||||||
|---|---|---|---|---|---|---|---|---|---|---|---|---|---|---|---|---|---|---|---|---|---|---|
| Barclays Bank plc | 2.010% semi-annually | 03/16/09 | 03/18/10 | $ | 35,630 | $ | (209 | ) | ||||||||||||||
| (Premiums received of $50.) | ||||||||||||||||||||||
| *European Style. | ||||||||||||||||||||||
| ** The Fund would pay quarterly a floating rate based on 3 month LIBOR, if exercised. | ||||||||||||||||||||||
Corporate and Sovereign Issuers:
| SWAP COUNTERPARTY/ REFERENCE OBLIGATION | | FUND PAYS FIXED RATE (r) | | TERMINATION DATE | | IMPLIED CREDIT SPREAD AS OF 02/28/09 [3] | | NOTIONAL AMOUNT [4] | | VALUE | | UPFRONT PREMIUMS (PAID)/ RECEIVED [5] | ||||||||||||||
|---|---|---|---|---|---|---|---|---|---|---|---|---|---|---|---|---|---|---|---|---|---|---|---|---|---|---|
Credit Suisse International: | ||||||||||||||||||||||||||
| Kingdom of Sweden, 3.875%, 12/29/09 | 1.420% quarterly | 03/20/14 | 1.411% | $ | 625 | $ | (1 | ) | $ | — | ||||||||||||||||
| Kingdom of Sweden, 3.875%, 12/29/09 | 1.540% quarterly | 03/20/14 | 1.411 | 375 | (2 | ) | — | |||||||||||||||||||
Deutsche Bank AG, New York: | ||||||||||||||||||||||||||
| Aetna, Inc., 6.625%, 06/15/36 | 1.280% quarterly | 03/20/14 | 0.992 | 1,000 | (15 | ) | — | |||||||||||||||||||
Royal Bank of Scotland: | ||||||||||||||||||||||||||
| Republic of Korea, 4.250%, 06/01/13 | 3.400% quarterly | 03/20/14 | 4.339 | 1,000 | 37 | — | ||||||||||||||||||||
| Republic of Slovenia, 5.375%, 04/11/11 | 2.050% semi-annually | 02/20/14 | 2.051 | 150 | — | (h) | — | |||||||||||||||||||
| Republic of Slovenia, 5.375%, 04/11/11 | 2.080% semi-annually | 02/20/14 | 2.051 | 60 | — | (h) | — | |||||||||||||||||||
| Republic of Slovenia, 5.375%, 04/11/11 | 2.197% semi-annually | 02/20/14 | 2.051 | 60 | (1 | ) | — | |||||||||||||||||||
| Republic of Slovenia, 5.375%, 04/11/11 | 2.250% semi-annually | 02/20/14 | 2.051 | 30 | — | (h) | — | |||||||||||||||||||
| $ | 18 | $ | — | |||||||||||||||||||||||
| SWAP COUNTERPARTY/ REFERENCE OBLIGATION | | FUND PAYS FIXED RATE (r) | | TERMINATION DATE | | IMPLIED CREDIT SPREAD AS OF 02/28/09 [3] | | NOTIONAL AMOUNT [4] | | VALUE | | UPFRONT PREMIUMS (PAID)/ RECEIVED [5] | ||||||||||||||
|---|---|---|---|---|---|---|---|---|---|---|---|---|---|---|---|---|---|---|---|---|---|---|---|---|---|---|
Deutsche Bank AG, New York: | ||||||||||||||||||||||||||
| CDX.EM.10 | 3.350% semi-annually | 12/20/13 | 8.602% | $ | 250 | $ | 42 | $ | (41 | ) | ||||||||||||||||
Royal Bank of Scotland: | ||||||||||||||||||||||||||
| ABX.HE.PENAAA.06.2 | 0.110% monthly | 05/25/46 | 40.740 | 2,500 | 844 | (461 | ) | |||||||||||||||||||
| CDX.EM.10 | 3.350% semi-annually | 12/20/13 | 8.602 | 500 | 85 | (82 | ) | |||||||||||||||||||
| $ | 971 | $ | (584 | ) | ||||||||||||||||||||||
Corporate and Sovereign Issuers:
| SWAP COUNTERPARTY/ REFERENCE OBLIGATION | | FUND RECEIVES FIXED RATE (r) | | TERMINATION DATE | | IMPLIED CREDIT SPREAD AS OF 02/28/09 [3] | | NOTIONAL AMOUNT [4] | | VALUE | | UPFRONT PREMIUMS (PAID)/ RECEIVED [5] | ||||||||||||||
|---|---|---|---|---|---|---|---|---|---|---|---|---|---|---|---|---|---|---|---|---|---|---|---|---|---|---|
Deutsche Bank AG, New York: | ||||||||||||||||||||||||||
| Canadian Natural Resources, Ltd., 5.450%, 10/01/12 | 5.600% quarterly | 03/20/14 | 5.804% | $ | 300 | $ | (2 | ) | $ | — | ||||||||||||||||
| Petroleos de Venezuela S.A., 5.375%, 04/12/27 | 2.585% semi-annually | 05/20/12 | 26.476 | 1,410 | (627 | ) | — | |||||||||||||||||||
| $ | (629 | ) | $ | — | ||||||||||||||||||||||
| SWAP COUNTERPARTY/ REFERENCE OBLIGATION | | FUND RECEIVES FIXED RATE (r) | | TERMINATION DATE | | IMPLIED CREDIT SPREAD AS OF 02/28/09 [3] | | NOTIONAL AMOUNT [4] | | VALUE | | UPFRONT PREMIUMS (PAID)/ RECEIVED [5] | ||||||||||||||
|---|---|---|---|---|---|---|---|---|---|---|---|---|---|---|---|---|---|---|---|---|---|---|---|---|---|---|
Citibank, N.A.: | ||||||||||||||||||||||||||
| CDX.EM.10* | 3.350% semi-annually | 12/20/13 | 8.602% | $ | 1,450 | $ | (246 | ) | $ | 223 | ||||||||||||||||
Deutsche Bank AG, New York: | ||||||||||||||||||||||||||
| CDX.NA.HY.11.2 | 5.000% quarterly | 12/20/13 | 15.677 | 1,350 | (358 | ) | 350 | |||||||||||||||||||
| CDX.NA.HY.11.2 | 5.000% quarterly | 12/20/13 | 15.677 | 1,800 | (478 | ) | 429 | |||||||||||||||||||
Royal Bank of Scotland: | ||||||||||||||||||||||||||
| ABX.HE.PENAAA.07.2 | 0.760% monthly | 01/25/38 | 43.048 | 2,500 | (1,725 | ) | 1,346 | |||||||||||||||||||
| $ | (2,807 | ) | $ | 2,348 | ||||||||||||||||||||||
| [1] | The Fund, as a buyer of credit protection, is generally obligated to make periodic payments and may also pay an upfront premium to the protection seller, in exchange for the right to receive a contingent payment, upon occurrence of a credit event with respect to an underlying reference obligation, as defined under the terms of individual swap contracts. |
| [2] | The Fund, as a seller of credit protection, receives periodic payments and any upfront premium from the protection buyer, and is obligated to make a contingent payment, upon occurrence of a credit event with respect to an underlying reference obligation, as defined under the terms of individual swap contracts. |
| [3] | Implied credit spreads are an indication of the seller’s performance risk, related to the likelihood of a credit event occurring that would require a seller to make payment to a buyer. Implied credit spreads are used to determine the value of swap contracts and reflect the cost of buying/selling protection, which may include upfront payments made to enter into the contract. Therefore, higher spreads would indicate a greater likelihood that a seller will be obligated to perform (i.e., make payment) under the swap contract. Increasing values, in absolute terms and relative to notional amounts, are also indicative of greater performance risk. Implied credit spreads for credit default swaps on credit indexes are linked to the weighted average spread across the underlying reference obligations included in a particular index. |
| [4] | The notional amount is the maximum amount that a seller of a credit default swap would be obligated to make and a buyer of credit protection would receive, upon occurrence of a credit event. |
| [5] | Upfront premiums generally relate to payments made or received at the initiation of the agreement in lieu of all or a portion of future periodic payments. |
| * | The Fund has purchased credit default swaps with identical underlying reference obligations; net amounts received by the Fund from settlement of purchased protection would offset potential amounts paid at a credit event for protection sold. |
AS OF FEBRUARY 28, 2009 (continued)
| RATE TYPE (r) | ||||||||||||||||||||||||||
|---|---|---|---|---|---|---|---|---|---|---|---|---|---|---|---|---|---|---|---|---|---|---|---|---|---|---|
| SWAP COUNTERPARTY | | PAYMENTS MADE BY THE FUND | | PAYMENTS RECEIVED BY THE FUND | | TERMINATION DATE | | NOTIONAL AMOUNT | | VALUE | | UPFRONT PREMIUMS (PAID)/ RECEIVED [1] | ||||||||||||||
| Credit Suisse International | 2.670% semi-annually | 3 month LIBOR quarterly | 01/16/39 | $ | 100 | $ | 15 | $ | — | |||||||||||||||||
| Deutsche Bank AG, New York | 3 month LIBOR quarterly | 2.565% semi-annually | 02/17/10 | 37,560 | 440 | — | ||||||||||||||||||||
| Deutsche Bank AG, New York | 4.238% semi-annually | 3 month LIBOR quarterly | 10/23/38 | 980 | (155 | ) | — | |||||||||||||||||||
| $ | 300 | $ | — | |||||||||||||||||||||||
| [1] | Upfront premiums generally relate to payments made or received at the initiation of the agreement in lieu of all or a portion of future periodic payments. |
| SWAP COUNTERPARTY | | REFERENCED OBLIGATION | | PRICE LOCK | | TERMINATION DATE | | NOTIONAL AMOUNT | | VALUE | | UPFRONT PREMIUMS (PAID)/ RECEIVED [1] | ||||||||||||||
|---|---|---|---|---|---|---|---|---|---|---|---|---|---|---|---|---|---|---|---|---|---|---|---|---|---|---|
| Citibank, N.A. (†) | FNMA, 30 Year, Single Family, TBA, 6.000% | $ | 102.66 | 03/05/09 | $ | 4,065 | $ | 26 | $ | — | ||||||||||||||||
| Credit Suisse International (†) | FHLB, 5.375%, 05/18/16 | 112.29 | 03/11/09 | 1,685 | (14 | ) | — | |||||||||||||||||||
| Credit Suisse International (†) | U.S. Treasury Bond, 4.500%, 05/15/38 | 118.46 | 03/12/09 | 965 | (49 | ) | — | |||||||||||||||||||
| Deutsche Bank AG, New York (†) | FHLMC Gold, 30 Year, Single Family, TBA, 5.000% | 101.25 | 03/05/09 | 5,800 | 17 | — | ||||||||||||||||||||
| Deutsche Bank AG, New York (†) | FHLMC Gold, 30 Year, Single Family, TBA, 5.500% | 101.94 | 03/05/09 | 6,350 | 27 | — | ||||||||||||||||||||
| Deutsche Bank AG, New York (†) | FHLMC Gold, 30 Year, Single Family, TBA, 6.000% | 103.09 | 03/05/09 | 4,000 | 17 | — | ||||||||||||||||||||
| Deutsche Bank AG, New York (†) | FNMA, 15 Year, Single Family, TBA, 5.000% | 102.01 | 03/10/09 | 2,435 | 20 | — | ||||||||||||||||||||
| Deutsche Bank AG, New York (†) | GNMA, 30 Year, Single Family, TBA, 5.500% | 102.31 | 03/11/09 | 2,500 | 9 | — | ||||||||||||||||||||
| $ | 53 | $ | — | |||||||||||||||||||||||
| [1] | Upfront premiums generally relate to payments made or received at the initiation of the agreement in lieu of all or a portion of future periodic payments. |
| † | Fund pays the excess of the price lock over the market price or receives the excess of the market price over the price lock at termination. |
AS OF FEBRUARY 28, 2009
(Amounts in thousands)
| PRINCIPAL AMOUNT | | SECURITY DESCRIPTION | | VALUE | ||||||||||
|---|---|---|---|---|---|---|---|---|---|---|---|---|---|---|
Long-Term Investments — 102.7% | ||||||||||||||
Corporate Bonds — 20.7% | ||||||||||||||
Brazil — 1.1% | ||||||||||||||
| BRL 10,055 | Lehman Brothers Holdings, Inc., CLN, 10.000%, 01/03/12 (linked to Brazilian Real Notes, 10.000%, 01/03/12; credit rating BBB+) (d) (e) (f) (i) (o) | 450 | ||||||||||||
| 3,950 | Morgan Stanley & Co., Inc., CLN, linked to Brazilian Real 12.150%, 01/05/22 (linked to Brazil Government Bonds; credit rating BBB+) (e) (m) | 1,654 | ||||||||||||
| 2,104 | ||||||||||||||
Kazakhstan — 2.4% | ||||||||||||||
| KazMunaiGaz Finance Sub BV, | ||||||||||||||
| 5,540 | 9.125%, 07/02/18 (e) (m) | 3,573 | ||||||||||||
| 2,000 | 9.125%, 07/02/18 (m) | 1,290 | ||||||||||||
| 4,863 | ||||||||||||||
Mexico — 0.4% | ||||||||||||||
| MXN 40,000 | Depfa Bank plc, Zero Coupon, 06/15/15 | 814 | ||||||||||||
Russia — 9.4% | ||||||||||||||
| 1,590 | Gaz Capital S.A., 6.212%, 11/22/16 (e) (m) | 1,065 | ||||||||||||
| 6,985 | Gazprom International S.A., 7.201%, 02/01/20 | 5,675 | ||||||||||||
| Gazstream S.A. for Gazprom OAO, | ||||||||||||||
| 2,122 | 5.625%, 07/22/13 (e) (m) | 1,867 | ||||||||||||
| 1,635 | 5.625%, 07/22/13 | 1,439 | ||||||||||||
| RSHB Capital S.A. for OJSC Russian Agricultural Bank, | ||||||||||||||
| 3,230 | 7.125%, 01/14/14 (e) (m) | 2,180 | ||||||||||||
| 720 | 7.175%, 05/16/13 | 533 | ||||||||||||
| 4,610 | 7.750%, 05/29/18 (e) (m) | 2,743 | ||||||||||||
| 2,980 | TransCapitalInvest Ltd. for OJSC AK Transneft, 5.670%, 03/05/14 (e) | 2,190 | ||||||||||||
| 1,600 | VTB Capital S.A. for Vneshtorgbank, 6.250%, 06/30/35 | 944 | ||||||||||||
| 18,636 | ||||||||||||||
Trinidad & Tobago — 1.1% | ||||||||||||||
| 3,452 | National Gas Co. of Trinidad & Tobago Ltd., 6.050%, 01/15/36 | 2,195 | ||||||||||||
Ukraine — 1.6% | ||||||||||||||
| Credit Suisse First Boston International for CJSC The EXIM of Ukraine, | ||||||||||||||
| 320 | 6.800%, 10/04/12 | 128 | ||||||||||||
| 7,855 | 7.650%, 09/07/11 | 2,082 | ||||||||||||
| 1,695 | Dresdner Kleinwort Wasserstein for CJSC The EXIM of Ukraine, 7.750%, 09/23/09 | 1,017 | ||||||||||||
| 3,227 | ||||||||||||||
Venezuela — 4.7% | ||||||||||||||
| Petroleos de Venezuela S.A., | ||||||||||||||
| 23,309 | 5.250%, 04/12/17 | 8,741 | ||||||||||||
| 2,100 | 5.375%, 04/12/27 | 672 | ||||||||||||
| 9,413 | ||||||||||||||
| Total Corporate Bonds (Cost $74,547) | 41,252 | |||||||||||||
Foreign Government Securities — 75.8% | ||||||||||||||
Argentina — 1.1% | ||||||||||||||
| Republic of Argentina, | ||||||||||||||
| ARS 8,480 | VAR, 0.630%, 12/31/38 (m) | 263 | ||||||||||||
| 7,104 | VAR, 1.683%, 08/03/12 (m) | 1,887 | ||||||||||||
| 2,150 | ||||||||||||||
Barbados — 0.2% | ||||||||||||||
| Government of Barbados, | ||||||||||||||
| 390 | 6.625%, 12/05/35 (e) (m) | 282 | ||||||||||||
| 239 | 6.625%, 12/05/35 (m) | 173 | ||||||||||||
| 455 | ||||||||||||||
Brazil — 21.6% | ||||||||||||||
| 5,500 | Banco Nacional de Desenvolvimento Economico e Social, 6.369%, 06/16/18 (e) (m) | 5,094 | ||||||||||||
| Federal Republic of Brazil, | ||||||||||||||
| 1,879 | 7.125%, 01/20/37 (m) | 1,846 | ||||||||||||
| 15,467 | 8.000%, 01/15/18 (m) | 16,674 | ||||||||||||
| 3,459 | 8.250%, 01/20/34 (m) | 3,753 | ||||||||||||
| 2,230 | 8.750%, 02/04/25 (m) | 2,520 | ||||||||||||
| 800 | 8.875%, 10/14/19 (m) | 914 | ||||||||||||
| 7,188 | 12.250%, 03/06/30 (m) | 10,818 | ||||||||||||
| BRL 3,540 | 12.500%, 01/05/22 (m) | 1,469 | ||||||||||||
| 43,088 | ||||||||||||||
Colombia — 1.8% | ||||||||||||||
| Republic of Colombia, | ||||||||||||||
| 1,030 | 7.375%, 01/27/17 (m) | 1,036 | ||||||||||||
| 1,640 | 7.375%, 09/18/37 (m) | 1,501 | ||||||||||||
| 575 | 11.750%, 02/25/20 (m) | 717 | ||||||||||||
| COP 616,000 | 12.000%, 10/22/15 | 270 | ||||||||||||
| 3,524 | ||||||||||||||
Costa Rica — 1.6% | ||||||||||||||
| 2,798 | Republic of Costa Rica, 9.995%, 08/01/20 | 3,232 | ||||||||||||
Dominican Republic — 2.5% | ||||||||||||||
| Citigroup Funding, Inc., CLN, | ||||||||||||||
| 2,065 | 13.000%, 01/11/13 (linked to Dominican Republic Government Bond, 13.000%, 01/11/13; credit rating B) (e) (i) | 1,563 | ||||||||||||
| 3,565 | 15.000%, 03/12/12 (linked to Dominican Republic Government Bond, 15.000%, 03/12/12; credit rating B) (e) (i) | 2,580 | ||||||||||||
| 1,205 | 22.000%, 10/03/11 (linked to Dominican Republic Government Bond, 22.000%, 10/03/11; credit rating B) (e) (i) | 860 | ||||||||||||
AS OF FEBRUARY 28, 2009 (continued)
(Amounts in thousands, except number of contracts)
| PRINCIPAL AMOUNT | | SECURITY DESCRIPTION | | VALUE | |||||||
|---|---|---|---|---|---|---|---|---|---|---|---|
Long-Term Investments — Continued | |||||||||||
Dominican Republic — Continued | |||||||||||
| 30 | Government of Dominican Republic, 9.500%, 09/27/11 | 28 | |||||||||
| 5,031 | |||||||||||
Egypt — 0.6% | |||||||||||
| EGP 7,800 | Arab Republic of Egypt, 8.750%, 07/18/12 (e) (m) | 1,212 | |||||||||
El Salvador — 0.9% | |||||||||||
| 2,360 | Republic of El Salvador, 8.250%, 04/10/32 (e) (m) | 1,770 | |||||||||
Gabon — 1.3% | |||||||||||
| 3,945 | Republic of Gabon, 8.200%, 12/12/17 (e) (m) | 2,564 | |||||||||
Ghana — 0.8% | |||||||||||
| 1,550 | Barclays Bank plc, CLN, 13.500%, 04/07/10 (linked to Government of Ghana 3-Year Bond, 13.500%, 03/30/10; credit rating B+) (e) (i) | 830 | |||||||||
| 2,000 | Citigroup Funding, Inc., CLN, 15.000%, 06/20/12 (linked to Government of Ghana Treasury Bond, 15.000%, 06/20/12; credit rating B+) (e) (i) | 713 | |||||||||
| 1,543 | |||||||||||
Guatemala — 2.3% | |||||||||||
| Republic of Guatemala, | |||||||||||
| 1,521 | 8.125%, 10/06/34 | 1,460 | |||||||||
| 2,930 | 9.250%, 08/01/13 | 3,077 | |||||||||
| 4,537 | |||||||||||
Indonesia — 3.0% | |||||||||||
| 2,070 | Deutsche Bank AG, London Branch, CLN, 15.000%, 07/20/18 (linked to Indonesia Government Bond, 15.000%, 07/15/18; credit rating BB+) (e) (i) | 1,921 | |||||||||
| Republic of Indonesia, | |||||||||||
| 3,320 | 6.875%, 01/17/18 (e) (m) | 2,556 | |||||||||
| 1,575 | 11.625%, 03/04/19 (e) | 1,564 | |||||||||
| 6,041 | |||||||||||
Iraq — 0.7% | |||||||||||
| Republic of Iraq, | |||||||||||
| 1,250 | 5.800%, 01/15/28 (e) | 550 | |||||||||
| 2,109 | 5.800%, 01/15/28 | 928 | |||||||||
| 1,478 | |||||||||||
Mexico — 6.9% | |||||||||||
| United Mexican States, | |||||||||||
| 2,060 | 5.875%, 02/17/14 | 2,091 | |||||||||
| 5,000 | 5.950%, 03/19/19 | 4,800 | |||||||||
| 1,800 | 6.050%, 01/11/40 | 1,485 | |||||||||
| MXN 22,000 | 7.500%, 06/03/27 (m) | 1,273 | |||||||||
| MXN 39,500 | 9.000%, 12/20/12 (m) | 2,701 | |||||||||
| 1,085 | 11.375%, 09/15/16 (m) | 1,419 | |||||||||
| 13,769 | |||||||||||
Nigeria — 0.5% | |||||||||||
| 1,490 | Citigroup Funding, Inc., CLN, 9.000%, 12/17/10 (linked to Republic of Nigeria Treasury Bond, 9.000%, 12/14/10; credit rating BB) (e) (i) | 1,098 | |||||||||
Peru — 3.1% | |||||||||||
| 5,744 | IIRSA Norte Finance Ltd., 8.750%, 05/30/24 (i) | 4,039 | |||||||||
| Republic of Peru, | |||||||||||
| 482 | 6.550%, 03/14/37 | 440 | |||||||||
| 600 | 8.375%, 05/03/16 (m) | 669 | |||||||||
| 844 | 9.875%, 02/06/15 (m) | 1,000 | |||||||||
| 6,148 | |||||||||||
Philippines — 5.6% | |||||||||||
| Republic of Philippines, | |||||||||||
| 4,590 | 7.750%, 01/14/31 | 4,452 | |||||||||
| 5,449 | 8.250%, 01/15/14 | 5,872 | |||||||||
| 750 | 8.375%, 06/17/19 | 794 | |||||||||
| 11,118 | |||||||||||
Russia — 8.5% | |||||||||||
| Russian Federation, | |||||||||||
| 15,656 | SUB, 7.500%, 03/31/30 | 13,757 | |||||||||
| 2,568 | 12.750%, 06/24/28 | 3,197 | |||||||||
| 16,954 | |||||||||||
Trinidad & Tobago — 0.2% | |||||||||||
| 446 | Republic of Trinidad & Tobago, 9.750%, 07/01/20 | 493 | |||||||||
Turkey — 1.8% | |||||||||||
| Republic of Turkey, | |||||||||||
| 2,150 | 6.875%, 03/17/36 | 1,607 | |||||||||
| 2,000 | 12.375%, 06/15/09 | 2,050 | |||||||||
| 3,657 | |||||||||||
Uganda — 0.5% | |||||||||||
| 1,280 | Citigroup Funding, Inc., CLN, 10.250%, 03/07/11 (linked to Republic of Uganda Treasury Bond, 10.250%, 03/03/11; credit rating B+) (e) (i) | 905 | |||||||||
Ukraine — 1.1% | |||||||||||
| 1,840 | CS International for City of Kiev Ukraine, 8.250%, 11/26/12 (e) (i) | 708 | |||||||||
| Government of Ukraine, | |||||||||||
| 20 | 6.580%, 11/21/16 | 7 | |||||||||
| 4,230 | 6.750%, 11/14/17 | 1,502 | |||||||||
| 2,217 | |||||||||||
Uruguay — 1.7% | |||||||||||
| Republic of Uruguay, | |||||||||||
| UYU 40,949 | 3.700%, 06/26/37 | 577 | |||||||||
| UYU 48,033 | 5.000%, 09/14/18 (m) | 1,701 | |||||||||
| 465 | 7.500%, 03/15/15 | 470 | |||||||||
| 270 | 7.625%, 03/21/36 | 223 | |||||||||
| 379 | 8.000%, 11/18/22 | 350 | |||||||||
| 3,321 | |||||||||||
| PRINCIPAL AMOUNT | | SECURITY DESCRIPTION | | VALUE | |||||||
|---|---|---|---|---|---|---|---|---|---|---|---|
Long-Term Investments — Continued | |||||||||||
Venezuela — 7.5% | |||||||||||
| Republic of Venezuela, | |||||||||||
| 3,380 | 7.650%, 04/21/25 | 1,487 | |||||||||
| 3,505 | 8.500%, 10/08/14 | 1,998 | |||||||||
| 5,210 | 9.250%, 05/07/28 | 2,566 | |||||||||
| 1,160 | 9.375%, 01/13/34 | 574 | |||||||||
| 9,127 | 10.750%, 09/19/13 | 6,253 | |||||||||
| 3,149 | 13.625%, 08/15/18 | 2,078 | |||||||||
| 14,956 | |||||||||||
| Total Foreign Government Securities (Cost $184,849) | 151,261 | ||||||||||
Supranational — 0.4% | |||||||||||
| UYU 29,370 | International Bank for Reconstruction & Development, 3.400%, 04/15/17 (m) (Cost $1,491) | 908 | |||||||||
U.S. Treasury Obligations — 5.8% | |||||||||||
| U.S. Treasury Notes, | |||||||||||
| 11,000 | 0.875%, 01/31/11 (m) | 10,976 | |||||||||
| 530 | 3.250%, 12/31/09 (k) | 541 | |||||||||
| Total U.S. Treasury Obligations (Cost $11,513) | 11,517 | ||||||||||
| Total Long-Term Investments (Cost 272,400) | $ | 204,938 | |||||||||
| SHARES | | SECURITY DESCRIPTION | | VALUE | Short-Term Investment — 3.4%|||||||||||||
|---|---|---|---|---|---|---|---|---|---|---|---|---|---|---|---|---|---|
Investment Company — 3.4% | |||||||||||||||||
| 6,767 | JPMorgan Prime Money Market Fund, Institutional Class Shares, 0.830% (b) (l) (m) (Cost $6,767) | 6,767 | |||||||||||||||
Total Investments — 106.1% (Cost $279,167) | 211,705 | ||||||||||||||||
Liabilities in Excess of Other Assets — (6.1)% | (12,172 | ) | |||||||||||||||
NET ASSETS — 100.0% | $ | 199,533 | |||||||||||||||
| NUMBER OF CONTRACTS | | DESCRIPTION | | EXPIRATION DATE | | NOTIONAL VALUE AT 02/28/09 | | UNREALIZED APPRECIATION (DEPRECIATION) | ||||||||||
|---|---|---|---|---|---|---|---|---|---|---|---|---|---|---|---|---|---|---|
Long Futures Outstanding | ||||||||||||||||||
| 72 | 10 Year U.S. Treasury Note | 06/19/09 | 8,642 | (110 | ) | |||||||||||||
| 100 | 30 Year U.S. Treasury Bond | 06/19/09 | 12,334 | (363 | ) | |||||||||||||
Short Futures Outstanding | ||||||||||||||||||
| (65) | 2 Year U.S. Treasury Note | 06/30/09 | (14,080 | ) | 3 | |||||||||||||
| (102) | 5 Year U.S. Treasury Note | 06/30/09 | (11,892 | ) | 45 | |||||||||||||
| (425 | ) | |||||||||||||||||
AS OF FEBRUARY 28, 2009 (continued)
(Amounts in thousands, except number of contracts)
Corporate and Sovereign Issuers:
| SWAP COUNTERPARTY/REFERENCE OBLIGATION | | FUND PAYS FIXED RATE (r) | | TERMINATION DATE | | IMPLIED CREDIT SPREAD AS OF 02/28/09 [3] | | NOTIONAL AMOUNT [4] | | VALUE | | UPFRONT PREMIUMS (PAID)/RECEIVED [5] | ||||||||||||||
|---|---|---|---|---|---|---|---|---|---|---|---|---|---|---|---|---|---|---|---|---|---|---|---|---|---|---|
Barclays Bank plc: | ||||||||||||||||||||||||||
| Kingdom of Sweden, 3.875%, 12/29/09 | 1.100% quarterly | 03/20/14 | 1.411% | 4,790 | 66 | — | ||||||||||||||||||||
| Republic of Austria, 5.250%, 01/04/11 | 0.493% quarterly | 12/20/13 | 2.358 | 3,070 | 240 | — | ||||||||||||||||||||
| Republic of Kazakhstan, 11.125%, 05/11/07 | 10.920% semi-annually | 11/20/13 | 14.457 | 1,750 | 115 | — | ||||||||||||||||||||
| Russian Federation, 7.500%, 03/31/30 | 0.475% semi-annually | 04/20/12 | 8.631 | 530 | 110 | — | ||||||||||||||||||||
Citibank, N.A.: | ||||||||||||||||||||||||||
| Petroleos Mexicanos, 9.500%, 09/15/27 | 1.250% semi-annually | 06/20/10 | 4.158 | 1,000 | 35 | — | ||||||||||||||||||||
| Republic of Brazil, 12.250%, 03/06/30 | 0.695% semi-annually | 06/20/12 | 3.624 | 720 | 63 | — | ||||||||||||||||||||
| Republic of Poland, 5.250%, 01/15/14 | 1.750% semi-annually | 10/20/13 | 3.643 | 2,880 | 200 | — | ||||||||||||||||||||
| Republic of Romania, 8.500%, 05/08/12 | 5.900% semi-annually | 10/20/13 | 7.196 | 2,880 | 71 | — | ||||||||||||||||||||
Credit Suisse International: | ||||||||||||||||||||||||||
| Republic of Austria, 5.250%, 01/04/11 | 0.520% quarterly | 12/20/13 | 2.358 | 1,020 | 78 | — | ||||||||||||||||||||
| Russian Federation, 7.500%, 03/31/30 | 0.300% semi-annually | 03/20/09 | 9.203 | 120 | — | (h) | — | |||||||||||||||||||
Deutsche Bank AG, New York: | ||||||||||||||||||||||||||
| Republic of Austria, 5.250%, 01/04/11 | 0.52% quarterly | 12/20/13 | 2.358% | 5,910 | 455 | — | ||||||||||||||||||||
| Republic of Brazil, 12.250%, 03/06/30 | 0.810% semi-annually | 04/20/12 | 3.593 | 230 | 18 | — | ||||||||||||||||||||
| Republic of Brazil, 12.250%, 03/06/30 | 0.732% semi-annually | 06/20/12 | 3.642 | 1,140 | 99 | — | ||||||||||||||||||||
| Republic of Brazil, 12.250%, 03/06/30 | 0.660% semi-annually | 07/20/12 | 3.664 | 830 | 76 | — | ||||||||||||||||||||
| Republic of Brazil, 12.250%, 03/06/30 | 0.713% semi-annually | 07/20/12 | 3.664 | 1,450 | 131 | — | ||||||||||||||||||||
| Republic of Bulgaria, 8.250%, 01/15/15 | 5.000% semi-annually | 10/20/13 | 6.018 | 12,880 | 238 | — | ||||||||||||||||||||
| Republic of Colombia, 10.375%, 01/28/33 | 0.914% semi-annually | 04/20/12 | 4.325 | 410 | 38 | — | ||||||||||||||||||||
| Republic of Korea, 4.250%, 06/01/13 | 3.450% quarterly | 03/20/14 | 4.339 | 2,480 | 84 | — | ||||||||||||||||||||
| Republic of Turkey, 11.875%, 01/15/30 | 5.800% semi-annually | 11/20/13 | 4.880 | 3,490 | (182 | ) | — | |||||||||||||||||||
| Russian Federation, 7.500%, 03/31/30 | 0.495% semi-annually | 04/20/12 | 8.631 | 350 | 72 | — | ||||||||||||||||||||
| United Mexican States, 7.500%, 04/08/33 | 0.810% semi-annually | 08/20/10 | 4.011 | 70 | 3 | — | ||||||||||||||||||||
Morgan Stanley Capital Services: | �� | |||||||||||||||||||||||||
| Republic of Argentina, 8.280%, 12/31/33 | 2.620% semi-annually | 07/20/12 | 38.378 | 870 | 490 | — | ||||||||||||||||||||
| Republic of Brazil, 12.250%, 03/06/30 | 2.900% semi-annually | 10/20/10 | 2.992 | 400 | (4 | ) | — | |||||||||||||||||||
| Republic of Brazil, 12.250%, 03/06/30 | 0.690% semi-annually | 06/20/12 | 3.664 | 1,430 | 126 | — | ||||||||||||||||||||
| Republic of Colombia, 10.375%, 01/28/33 | 1.000% semi-annually | 04/20/12 | 4.325 | 750 | 68 | — | ||||||||||||||||||||
| Republic of Venezuela, 9.250%, 09/15/27 | 2.570% semi-annually | 07/20/12 | 24.711 | 960 | 423 | — | ||||||||||||||||||||
| Russian Federation, 7.500%, 03/31/30 | 0.900% semi-annually | 07/20/10 | 9.562 | 500 | 55 | — | ||||||||||||||||||||
| Russian Federation, 7.500%, 03/31/30 | 0.750% semi-annually | 08/20/10 | 9.528 | 750 | 88 | — | ||||||||||||||||||||
| Russian Federation, 7.500%, 03/31/30 | 0.530% semi-annually | 08/20/11 | 9.030 | 660 | 118 | — | ||||||||||||||||||||
| Russian Federation, 7.500%, 03/31/30 | 0.500% semi-annually | 11/20/11 | 8.873 | 740 | 141 | — | ||||||||||||||||||||
| Russian Federation, 12.750%, 06/24/28 | 0.640% semi-annually | 09/20/10 | 9.499 | 400 | 49 | — | ||||||||||||||||||||
| United Mexican States, 7.500%, 04/08/33 | 0.960% semi-annually | 07/20/10 | 3.987 | 2,000 | 79 | — | ||||||||||||||||||||
Royal Bank of Scotland: | ||||||||||||||||||||||||||
| Republic of Slovenia, 5.375%, 04/11/11 | 2.250% semi-annually | 02/20/14 | 2.051 | 190 | (2 | ) | — | |||||||||||||||||||
| Republic of Slovenia, 5.375%, 04/11/11 | 2.197% semi-annually | 02/20/14 | 2.051 | 310 | (2 | ) | — | |||||||||||||||||||
| Republic of Slovenia, 5.375%, 04/11/11 | 2.080% semi-annually | 02/20/14 | 2.051 | 510 | (1 | ) | — | |||||||||||||||||||
| Republic of Slovenia, 5.375%, 04/11/11 | 2.050% semi-annually | 02/20/14 | 2.051 | 1,410 | (2 | ) | — | |||||||||||||||||||
| Republic of Slovenia, 5.375%, 04/11/11 | 1.900% semi-annually | 02/20/14 | 2.051 | 2,340 | 12 | — | ||||||||||||||||||||
| SWAP COUNTERPARTY/REFERENCE OBLIGATION | | FUND PAYS FIXED RATE (r) | | TERMINATION DATE | | IMPLIED CREDIT SPREAD AS OF 02/28/09 [3] | | NOTIONAL AMOUNT [4] | | VALUE | | UPFRONT PREMIUMS (PAID)/RECEIVED [5] | ||||||||||||||
|---|---|---|---|---|---|---|---|---|---|---|---|---|---|---|---|---|---|---|---|---|---|---|---|---|---|---|
Union Bank of Switzerland AG: | ||||||||||||||||||||||||||
| Republic of Argentina, 8.280%, 12/31/33 | 2.620% semi-annually | 07/20/12 | 38.378 | 520 | 293 | — | ||||||||||||||||||||
| Republic of Venezuela, 9.250%, 09/15/27 | 2.030% semi-annually | 06/20/12 | 24.721 | 510 | 227 | — | ||||||||||||||||||||
| Republic of Venezuela, 9.250%, 09/15/27 | 2.550% semi-annually | 07/20/12 | 24.711 | 770 | 340 | — | ||||||||||||||||||||
| Russian Federation, 7.500%, 03/31/30 | 0.900% semi-annually | 08/20/10 | 9.528 | 300 | 35 | — | ||||||||||||||||||||
| 4,543 | — | |||||||||||||||||||||||||
Corporate and Sovereign Issuers:
| REFERENCE OBLIGATION | | FUND RECEIVES FIXED RATE (r) | | TERMINATION DATE | | IMPLIED CREDIT SPREAD AS OF 02/28/09 [3] | | NOTIONAL AMOUNT [4] | | VALUE | | UPFRONT PREMIUMS (PAID)/RECEIVED [5] | ||||||||||||||
|---|---|---|---|---|---|---|---|---|---|---|---|---|---|---|---|---|---|---|---|---|---|---|---|---|---|---|
Barclays Bank plc: | ||||||||||||||||||||||||||
| Government of Ukraine, 7.650%, 06/11/13 | 1.560% semi-annually | 04/20/12 | 38.207% | 530 | (292 | ) | — | |||||||||||||||||||
| Republic of Kazakhstan, 11.125%, 05/11/07* | 0.680% semi-annually | 08/20/12 | 15.161 | 1,510 | (533 | ) | — | |||||||||||||||||||
| Republic of Venezuela, 9.250%, 09/15/27* | 1.721% semi-annually | 03/20/12 | 24.746 | 1,520 | (658 | ) | — | |||||||||||||||||||
Citibank, N.A.: | — | |||||||||||||||||||||||||
| Government of Ukraine, 7.650%, 06/11/13 | 1.890% semi-annually | 10/20/11 | 38.740% | 1,670 | (855 | ) | — | |||||||||||||||||||
| Government of Ukraine, 7.650%, 06/11/13 | 1.750% semi-annually | 10/20/11 | 38.740 | 3,030 | (1,559 | ) | — | |||||||||||||||||||
| Government of Ukraine, 7.650%, 06/11/13 | 1.378% semi-annually | 06/20/12 | 38.010 | 2,860 | (1,620 | ) | — | |||||||||||||||||||
| Republic of Argentina, 8.280%, 12/31/33* | 2.160% semi-annually | 06/20/12 | 38.655 | 720 | (409 | ) | — | |||||||||||||||||||
| Republic of Kazakhstan, 11.125%, 05/11/07* | 0.630% semi-annually | 05/20/11 | 15.559 | 1,600 | (421 | ) | — | |||||||||||||||||||
| Republic of Kazakhstan, 11.125%, 05/11/07* | 0.600% semi-annually | 03/20/12 | 15.366 | 870 | (285 | ) | — | |||||||||||||||||||
| United Mexican States, 7.500%, 04/08/33* | 1.050% semi-annually | 06/20/10 | 3.960 | 1,000 | (35 | ) | — | |||||||||||||||||||
Credit Suisse International: | — | |||||||||||||||||||||||||
| RSHB Capital S.A. for OJSC Russian Agricultural Bank, 7.175%, 05/16/13 | 0.720% semi-annually | 03/20/09 | 12.227 | 120 | — | (h) | — | |||||||||||||||||||
Deutsche Bank AG, New York: | — | |||||||||||||||||||||||||
| Government of Ukraine, 7.650%, 06/11/13 | 1.580% semi-annually | 04/20/12 | 38.207 | 350 | (193 | ) | — | |||||||||||||||||||
| Republic of Argentina, 8.280%, 12/31/33* | 1.960% semi-annually | 04/20/12 | 39.279 | 230 | (129 | ) | — | |||||||||||||||||||
| Republic of Argentina, 8.280%, 12/31/33* | 2.140% semi-annually | 06/20/12 | 38.655 | 1,140 | (647 | ) | — | |||||||||||||||||||
| Republic of Argentina, 8.280%, 12/31/33* | 2.080% semi-annually | 07/20/12 | 38.378 | 830 | (475 | ) | — | |||||||||||||||||||
| Republic of Argentina, 8.280%, 12/31/33* | 2.327% semi-annually | 07/20/12 | 38.378 | 1,450 | (825 | ) | — | |||||||||||||||||||
| Republic of Kazakhstan, 11.125%, 05/11/07* | 0.535% semi-annually | 03/20/12 | 15.366 | 1,510 | (497 | ) | — | |||||||||||||||||||
| Republic of Kazakhstan, 11.125%, 05/11/07* | 0.610% semi-annually | 03/20/12 | 15.366 | 620 | (203 | ) | — | |||||||||||||||||||
| Republic of Kazakhstan, 11.125%, 05/11/07* | 0.655% semi-annually | 08/20/12 | 15.161 | 2,210 | (781 | ) | — | |||||||||||||||||||
| Republic of Kazakhstan, 11.125%, 05/11/07* | 0.710% semi-annually | 08/20/12 | 15.161 | 1,090 | (383 | ) | — | |||||||||||||||||||
| Republic of Venezuela, 9.250%, 09/15/27* | 1.620% semi-annually | 04/20/12 | 24.736 | 410 | (180 | ) | — | |||||||||||||||||||
| Republic of Venezuela, 9.250%, 09/15/27* | 1.604% semi-annually | 04/20/12 | 24.736 | 870 | (382 | ) | — | |||||||||||||||||||
| Russian Federation, 7.500%, 03/31/30* | 0.770% semi-annually | 08/20/10 | 9.528 | 70 | (8 | ) | — | |||||||||||||||||||
| Russian Federation, 7.500%, 03/31/30* | 0.525% semi-annually | 12/20/11 | 8.827 | 1,360 | (263 | ) | — | |||||||||||||||||||
| Russian Federation, 7.500%, 03/31/30* | 0.510% semi-annually | 12/20/11 | 8.827 | 1,580 | (306 | ) | — | |||||||||||||||||||
AS OF FEBRUARY 28, 2009 (continued)
| REFERENCE OBLIGATION | | FUND RECEIVES FIXED RATE (r) | | TERMINATION DATE | | IMPLIED CREDIT SPREAD AS OF 02/28/09 [3] | | NOTIONAL AMOUNT [4] | | VALUE | | UPFRONT PREMIUMS (PAID)/RECEIVED [5] | ||||||||||||||
|---|---|---|---|---|---|---|---|---|---|---|---|---|---|---|---|---|---|---|---|---|---|---|---|---|---|---|
Morgan Stanley Capital Services: | — | |||||||||||||||||||||||||
| Government of Ukraine, 7.650%, 06/11/13 | 1.900% semi-annually | 07/20/10 | 40.580 | 500 | (188 | ) | — | |||||||||||||||||||
| Government of Ukraine, 7.650%, 06/11/13 | 1.700% semi-annually | 08/20/10 | 40.390 | 750 | (295 | ) | — | |||||||||||||||||||
| Government of Ukraine, 7.650%, 06/11/13 | 1.760% semi-annually | 09/20/10 | 40.263 | 400 | (159 | ) | — | |||||||||||||||||||
| Government of Ukraine, 7.650%, 06/11/13 | 2.030% semi-annually | 08/20/11 | 38.934 | 660 | (332 | ) | — | |||||||||||||||||||
| Government of Ukraine, 7.650%, 06/11/13 | 1.620% semi-annually | 11/20/11 | 38.643 | 740 | (388 | ) | — | |||||||||||||||||||
| Petroleos de Venezuela S.A., 5.375%, 04/12/27 | 3.400% semi-annually | 07/20/12 | 26.245 | 870 | (386 | ) | — | |||||||||||||||||||
| Petroleos de Venezuela S.A., 5.375%, 04/12/27 | 3.550% semi-annually | 07/20/12 | 26.422 | 960 | (411 | ) | — | |||||||||||||||||||
| Republic of Argentina, 8.280%, 12/31/33* | 3.380% semi-annually | 10/20/10 | 44.397 | 400 | (172 | ) | — | |||||||||||||||||||
| Republic of Argentina, 8.280%, 12/31/33* | 2.160% semi-annually | 06/20/12 | 38.655 | 1,430 | (812 | ) | — | |||||||||||||||||||
| Republic of Venezuela, 9.250%, 09/15/27* | 1.690% semi-annually | 04/20/12 | 24.736 | 750 | (328 | ) | — | |||||||||||||||||||
| Republic of Venezuela, 9.250%, 09/15/27* | 3.400% semi-annually | 08/20/12 | 24.698 | 90 | (39 | ) | — | |||||||||||||||||||
| Russian Federation, 7.500%, 03/31/30* | 1.010% semi-annually | 07/20/10 | 9.562 | 2,000 | (216 | ) | — | |||||||||||||||||||
Union Bank of Switzerland AG: | — | |||||||||||||||||||||||||
| Government of Ukraine, 7.650%, 06/11/13 | 1.840% semi-annually | 08/20/10 | 40.390 | 300 | (117 | ) | — | |||||||||||||||||||
| Petroleos de Venezuela S.A., 5.250%, 04/12/17 | 2.780% semi-annually | 06/20/12 | 26.451 | 510 | (229 | ) | — | |||||||||||||||||||
| Petroleos de Venezuela S.A., 5.250%, 04/12/17 | 3.440% semi-annually | 07/20/12 | 26.425 | 520 | (230 | ) | — | |||||||||||||||||||
| Petroleos de Venezuela S.A., 5.250%, 04/12/17 | 3.550% semi-annually | 07/20/12 | 26.425 | 770 | (339 | ) | — | |||||||||||||||||||
| Republic of Venezuela, 9.250%, 09/15/27* | 2.510% semi-annually | 07/20/12 | 24.711 | 1,550 | (685 | ) | — | |||||||||||||||||||
| (17,265 | ) | — | ||||||||||||||||||||||||
| [1] | The Fund, as a buyer of a credit default swap, is generally obligated to make periodic payments and may also pay an upfront premium to the protection seller, in exchange for the right to receive a contingent payment, upon occurrence of a credit event with respect to an underlying reference obligation, as defined under the terms of individual swap contracts. |
| [2] | The Fund, as a seller of credit protection, receives periodic payments and any upfront premium from the protection buyer, and is obligated to make a contingent payment, upon occurrence of a credit event with respect to an underlying reference obligation, as defined under the terms of individual swaps contracts. |
| [3] | Implied credit spreads are an indication of the seller’s performance risk, related to the likelihood of a credit event occurring that would require a seller to make payment to a buyer. Implied credit spreads are used to determine the value of swap contracts and reflect the cost of buying/selling protection, which may include upfront payments made to enter into the contract. Therefore, higher spreads would indicate a greater likelihood that a seller will be obligated to perform (i.e., make payment) under the swap contract. Increasing values, in absolute terms and relative to notional amounts, are also indicative of greater performance risk. Implied credit spreads for credit default swaps on credit indexes are linked to the weighted average spread across the underlying reference obligations included in a particular index. |
| [4] | The notional amount is the maximum amount that a seller of a credit default swap would be obligated to make and a buyer of credit protection would receive, upon occurrence of a credit event. |
| [5] | Upfront premiums generally relate to payments made or received at the initiation of the agreement in lieu of all or a portion of future periodic payments. |
| * | The Fund has purchased credit default swaps with identical underlying reference obligations; net amounts received by the Fund from settlement of purchased protection would offset potential amounts paid at a credit event for protection sold. |
AS OF FEBRUARY 28, 2009
| PRINCIPAL AMOUNT($) | | SECURITY DESCRIPTION | | VALUE($) | ||||||||||
|---|---|---|---|---|---|---|---|---|---|---|---|---|---|---|
Long-Term Investments —��93.1% | ||||||||||||||
Asset-Backed Securities — 51.9% | ||||||||||||||
| 88 | American Express Credit Account Master Trust, Series 2004-C, Class C, VAR, 0.961%, 02/15/12 (e) | 81 | ||||||||||||
| 400 | Asset Backed Funding Certificates, Series 2005-HE1, Class M2, VAR, 0.914%, 03/25/35 | 177 | ||||||||||||
| 126 | Bear Stearns Asset Backed Securities Trust, Series 2005-HE3, Class M1, VAR, 0.904%, 03/25/35 | 119 | ||||||||||||
| 750 | Capital One Auto Finance Trust, Series 2007-B, Class A4, VAR, 0.491%, 04/15/14 | 525 | ||||||||||||
| 256 | Carrington Mortgage Loan Trust, Series 2006-OPT1, Class A3, VAR, 0.654%, 02/25/36 | 189 | ||||||||||||
| Countrywide Asset-Backed Certificates, | ||||||||||||||
| 113 | Series 2004-6, Class 2A4, VAR, 0.924%, 11/25/34 | 81 | ||||||||||||
| 29 | Series 2005-BC1, Class M2, VAR, 0.914%, 05/25/35 | 28 | ||||||||||||
| 468 | Countrywide Home Equity Loan Trust, Series 2003-C, Class A, VAR, 0.731%, 05/15/29 | 258 | ||||||||||||
| 369 | Fleet Home Equity Loan Trust, Series 2003-1, Class A, VAR, 0.720%, 01/20/33 | 229 | ||||||||||||
| 800 | HSI Asset Securitization Corp. Trust, Series 2006-OPT3, Class 3A3, VAR, 0.654%, 02/25/36 (f) | 471 | ||||||||||||
| 1,500 | K2 (USA) LLC, Series 2007-2D, VAR, 0.000%, 02/15/10 (d) (f) (i) (s) | — | ||||||||||||
| 2,100 | Links Finance LLC, VAR, 0.000%, 12/31/09 (d) (e) (f) (i) (s) | — | ||||||||||||
| 150 | Morgan Stanley ABS Capital I, Series 2005-HE2, Class M3, VAR, 0.954%, 01/25/35 | 94 | ||||||||||||
| 413 | New Century Home Equity Loan Trust, Series 2004-3, Class M1, VAR, 1.094%, 11/25/34 | 164 | ||||||||||||
| Option One Mortgage Loan Trust, | ||||||||||||||
| 70 | Series 2002-1, Class A, VAR, 1.054%, 02/25/32 | 47 | ||||||||||||
| 300 | Series 2005-2, Class M1, VAR, 0.914%, 05/25/35 | 84 | ||||||||||||
| 123 | Residential Funding Mortgage Securities II, Inc., Series 2003-HS4, Class AIB, VAR, 0.734%, 01/25/29 | 60 | ||||||||||||
| Securitized Asset Backed Receivables LLC Trust, | ||||||||||||||
| 500 | Series 2005-OP1, Class M2, VAR, 0.924%, 01/25/35 | 197 | ||||||||||||
| 62 | Series 2006-OP1, Class A2B, VAR, 0.674%, 10/25/35 | 62 | ||||||||||||
| 335 | Wachovia Asset Securitization, Inc., Series 2004-HE1, Class A, VAR, 0.694%, 06/25/34 | 140 | ||||||||||||
| 1,000 | William Street Funding Corp., Series 2005-1, Class A, VAR, 1.395%, 01/23/11 (e) (i) | 883 | ||||||||||||
| Total Asset-Backed Securities (Cost $9,955) | 3,889 | |||||||||||||
Collateralized Mortgage Obligations — 17.5% | ||||||||||||||
Agency CMO — 1.5% | ||||||||||||||
| Federal Home Loan Mortgage Corp. REMICS, | ||||||||||||||
| 981 | Series 2638, Class KI, IO, 5.000%, 11/15/27 | 56 | ||||||||||||
| 703 | Series 2975, Class IO, IO, 5.500%, 06/15/26 | 23 | ||||||||||||
| Federal National Mortgage Association REMICS, | ||||||||||||||
| 843 | Series 2005-51, Class KI, IO, 5.500%, 01/25/25 | 25 | ||||||||||||
| 463 | Series 2005-63, Class PK, IO, 5.500%, 10/25/24 | 8 | ||||||||||||
| 112 | ||||||||||||||
Non-Agency CMO — 16.0% | ||||||||||||||
| 774 | Countrywide Alternative Loan Trust, Series 2006-OA21, Class A1, VAR, 0.660%, 03/20/47 | 313 | ||||||||||||
| 881 | Countrywide Home Loan Mortgage Pass Through Trust, Series 2005-2, Class 2A3, VAR, 0.814%, 03/25/35 | 301 | ||||||||||||
| 276 | Thornburg Mortgage Securities Trust, Series 2003-2, Class A1, VAR, 1.154%, 04/25/43 | 241 | ||||||||||||
| 706 | WaMu Mortgage Pass Through Certificates, Series 2005-AR13, Class A1A1, VAR, 0.764%, 10/25/45 | 342 | ||||||||||||
| 1,197 | ||||||||||||||
| Total Collateralized Mortgage Obligations (Cost $2,788) | 1,309 | |||||||||||||
Commercial Mortgage-Backed Security — 0.1% | ||||||||||||||
| 6 | LB-UBS Commercial Mortgage Trust, Series 2003-C5, Class A2, 3.478%, 07/15/27 (Cost $6) | 6 | ||||||||||||
Corporate Bond — 6.2% | ||||||||||||||
Electric Utilities — 6.2% | ||||||||||||||
| 500 | Pepco Holdings, Inc., VAR, 2.828%, 06/01/10 (Cost $500) | 464 | ||||||||||||
Mortgage Pass-Through Securities — 17.4% | ||||||||||||||
| Federal National Mortgage Association, 30 Year, Single Family, | ||||||||||||||
| 572 | 5.500%, 10/01/38 | 587 | ||||||||||||
| 700 | TBA, 5.500%, 03/25/39 | 717 | ||||||||||||
| Total Mortgage Pass-Through Securities (Cost $1,287) | 1,304 | |||||||||||||
| Total Long-Term Investments (Cost $14,536) | 6,972 | |||||||||||||
AS OF FEBRUARY 28, 2009 (continued)
| SHARES | | SECURITY DESCRIPTION | | VALUE($) | |||||||
|---|---|---|---|---|---|---|---|---|---|---|---|
Short-Term Investment — 16.5% | |||||||||||
Investment Company — 16.5% | |||||||||||
| 1,241 | JPMorgan Prime Money Market Fund, Institutional Class Shares, 0.830% (b) (l) (m) (Cost $1,241) | 1,241 | |||||||||
Total Investments — 109.6% (Cost $15,777) | 8,213 | ||||||||||
Liabilities in Excess of Other Assets — (9.6)% | (722 | ) | |||||||||
NET ASSETS — 100.0% | $ | 7,491 | |||||||||
AS OF FEBRUARY 28, 2009
| PRINCIPAL AMOUNT($) | | SECURITY DESCRIPTION | | VALUE($) | |||||||
|---|---|---|---|---|---|---|---|---|---|---|---|
Long-Term Investments — 97.0% | |||||||||||
Asset-Backed Securities — 0.6% | |||||||||||
| 253 | GSAMP Trust, Series 2005-WMC2, Class A2B, VAR, 0.734%, 11/25/35 (m) | 235 | |||||||||
| 325 | Residential Asset Securities Corp., Series 2005-KS10, Class 1A2, VAR, 0.724%, 11/25/35 (m) | 280 | |||||||||
| Total Asset-Backed Securities (Cost $578) | 515 | ||||||||||
Collateralized Mortgage Obligations — 0.3% | |||||||||||
Non-Agency CMO — 0.3% | |||||||||||
| 168 | Adjustable Rate Mortgage Trust, Series 2005-12, Class 5A1, VAR, 0.724%, 03/25/36 (m) | 78 | |||||||||
| 333 | Harborview Mortgage Loan Trust, Series 2005-11, Class 2A1A, VAR, 0.776%, 08/19/45 (m) | 148 | |||||||||
| Total Collateralized Mortgage Obligations (Cost $500) | 226 | ||||||||||
U.S. Treasury Obligations — 96.1% | |||||||||||
| U.S. Treasury Inflation Indexed Bonds, | |||||||||||
| 1,760 | 1.750%, 01/15/28 | 1,541 | |||||||||
| 925 | 2.000%, 01/15/26 | 889 | |||||||||
| 3,585 | 2.375%, 01/15/25 | 3,833 | |||||||||
| 1,820 | 2.375%, 01/15/27 | 1,823 | |||||||||
| 2,095 | 2.500%, 01/15/29 | 2,038 | |||||||||
| 1,320 | 3.375%, 04/15/32 (m) | 1,849 | |||||||||
| 1,095 | 3.625%, 04/15/28 (m) | 1,618 | |||||||||
| 975 | 3.875%, 04/15/29 (m) | 1,470 | |||||||||
| U.S. Treasury Inflation Indexed Notes, | |||||||||||
| 1,965 | 0.625%, 04/15/13 | 1,896 | |||||||||
| 6,275 | 0.875%, 04/15/10 | 6,865 | |||||||||
| 4,305 | 1.375%, 07/15/18 | 3,904 | |||||||||
| 3,195 | 1.625%, 01/15/15 | 3,378 | |||||||||
| 3,620 | 1.625%, 01/15/18 | 3,450 | |||||||||
| 6,365 | 1.875%, 07/15/13 | 7,242 | |||||||||
| 2,150 | 1.875%, 07/15/15 | 2,261 | |||||||||
| 2,085 | 2.000%, 04/15/12 | 2,169 | |||||||||
| 3,365 | 2.000%, 01/15/14 | 3,809 | |||||||||
| 3,883 | 2.000%, 07/15/14 | 4,305 | |||||||||
| 3,605 | 2.000%, 01/15/16 | 3,710 | |||||||||
| 1,600 | 2.125%, 01/15/19 | 1,574 | |||||||||
| 3,050 | 2.375%, 04/15/11 | 3,260 | |||||||||
| 2,005 | 2.375%, 01/15/17 | 2,075 | |||||||||
| 1,215 | 2.500%, 07/15/16 | 1,268 | |||||||||
| 2,920 | 2.625%, 07/15/17 | 3,017 | |||||||||
| 4,500 | 3.000%, 07/15/12 (k) | 5,449 | |||||||||
| 855 | 3.375%, 01/15/12 | 1,055 | |||||||||
| 1,075 | 3.500%, 01/15/11 | 1,341 | |||||||||
| Total U.S. Treasury Obligations (Cost $78,146) | 77,089 | ||||||||||
| Total Long-Term Investments (Cost $79,224) | $ | 77,830 | |||||||||
| SHARES | | SECURITY DESCRIPTION | | VALUE ($) | |||||||
|---|---|---|---|---|---|---|---|---|---|---|---|
Short-Term Investment — 1.9% | |||||||||||
Investment Company — 1.9% | |||||||||||
| 1,536 | JPMorgan Prime Money Market Fund, Institutional Class Shares, 0.830% (b) (l) (m) (Cost $1,536) | 1,536 | |||||||||
Total Investments — 98.9% (Cost $80,760) | 79,366 | ||||||||||
Other Assets in Excess of Liabilities — 1.1% | 900 | ||||||||||
NET ASSETS — 100.0% | $ | 80,266 | |||||||||
AS OF FEBRUARY 28, 2009 (continued)
| NUMBER OF CONTRACTS | | DESCRIPTION | | EXPIRATION DATE | | NOTIONAL VALUE AT 02/28/09 | | UNREALIZED APPRECIATION (DEPRECIATION) | ||||||||||
|---|---|---|---|---|---|---|---|---|---|---|---|---|---|---|---|---|---|---|
Long Futures Outstanding | ||||||||||||||||||
| 4 | 2 Year U.S. Treasury Note | 06/30/09 | $ | 866 | $ | 1 | ||||||||||||
| 9 | Eurodollar | 09/13/10 | 2,203 | (1 | ) | |||||||||||||
Short Futures Outstanding | ||||||||||||||||||
| (23) | 10 Year U.S. Treasury Note | 06/19/09 | (2,761 | ) | 32 | |||||||||||||
| (2) | U.S. Treasury Bond | 06/19/09 | (247 | ) | 8 | |||||||||||||
| (3) | 2 Year U.S. Treasury Note | 06/30/09 | (650 | ) | 1 | |||||||||||||
| (26) | 5 Year U.S. Treasury Note | 06/30/09 | (3,031 | ) | 11 | |||||||||||||
| $ | 52 | |||||||||||||||||
| SWAP COUNTERPARTY | | REFERENCED OBLIGATION | | PRICE LOCK | | TERMINATION DATE | | NOTIONAL AMOUNT | | VALUE | UPFRONT PREMIUMS (PAID)/ RECEIVED | | ||||||||||||||
|---|---|---|---|---|---|---|---|---|---|---|---|---|---|---|---|---|---|---|---|---|---|---|---|---|---|---|
| Credit Suisse International † | U.S. Treasury Inflation Indexed Bond, 3.875%, 04/15/29 | $ | 119.69 | 03/24/09 | $ | 5,000 | $ | (104 | ) | $— | ||||||||||||||||
| † | Fund pays the excess of the price lock over the market price or receives the excess of the market price over the price lock at termination. |
AS OF FEBRUARY 28, 2009
| PRINCIPAL AMOUNT($) | | SECURITY DESCRIPTION | | VALUE($) | |||||||
|---|---|---|---|---|---|---|---|---|---|---|---|
Long-Term Investments — 50.5% | |||||||||||
Asset-Backed Securities — 7.4% | |||||||||||
| Countrywide Asset-Backed Certificates, | |||||||||||
| 449 | Series 2006-3, Class 2A2, VAR, 0.654%, 06/25/36 | 362 | |||||||||
| 1,380 | Series 2006-11, Class 1AF2, VAR, 6.017%, 09/25/46 | 808 | |||||||||
| K2 (USA) LLC, | |||||||||||
| 1,000 | VAR, 0.000%, 02/15/10 (d) (f) (i) (s) | — | |||||||||
| 7,500 | Series 2, VAR, 0.000%, 02/15/10 (d) (f) (i) (s) | — | |||||||||
| 9,500 | Series 2007-2D, VAR, 0.000%, 02/15/10 (d) (f) (i) (s) | — | |||||||||
| 16,200 | Links Finance LLC, VAR, 0.000%, 12/31/09 (d) (e) (f) (i) (s) | — | |||||||||
| 610 | Long Beach Mortgage Loan Trust, Series 2004-3, Class M1, VAR, 1.044%, 07/25/34 | 226 | |||||||||
| 11,900 | Sigma Finance Corp., (Cayman Islands), VAR, 0.000%, 08/15/11 (d) (f) (i) (s) | — | |||||||||
| Total Asset-Backed Securities (Cost $48,546) | 1,396 | ||||||||||
Collateralized Mortgage Obligations — 7.7% | |||||||||||
Agency CMO — 0.0% (g) | |||||||||||
| Federal Home Loan Mortgage Corp. REMICS, | |||||||||||
| 10 | Series 2750, Class IQ, IO, 5.000%, 10/15/21 | — | (h) | ||||||||
| 28 | Series 2781, Class PI, IO, 5.000%, 10/15/23 | — | (h) | ||||||||
| 239 | Government National Mortgage Association, Series 2004-44, Class PK, IO, 5.500%, 10/20/27 | 2 | |||||||||
| 2 | |||||||||||
Non-Agency CMO — 7.7% | |||||||||||
| 595 | Banc of America Funding Corp., Series 2005-6, Class 2A8, 5.500%, 10/25/35 | 493 | |||||||||
| 221 | Citicorp Mortgage Securities, Inc., Series 2005-6, Class 1A6, 5.500%, 09/25/35 | 191 | |||||||||
| 550 | First Horizon Asset Securities, Inc., Series 2005-6, Class 1A1, 5.500%, 11/25/35 | 487 | |||||||||
| Wells Fargo Mortgage Backed Securities Trust, | |||||||||||
| 145 | Series 2003-N, Class 1A4, VAR, 4.595%, 12/25/33 | 141 | |||||||||
| 149 | Series 2004-F, Class A8, VAR, 4.740%, 06/25/34 | 135 | |||||||||
| 1,447 | |||||||||||
| Total Collateralized Mortgage Obligations (Cost $1,657) | 1,449 | ||||||||||
Corporate Bonds — 2.0% | |||||||||||
Diversified Telecommunication Services — 2.0% | |||||||||||
| 360 | Telefonica Emisiones S.A.U., (Spain), 5.984%, 06/20/11 | 373 | |||||||||
Insurance — 0.0% (g) | |||||||||||
| 1,600 | Two-Rock Pass Through Trust, (Bermuda), VAR, 2.168%, 12/31/49 (e) (i) (x) | — | (h) | ||||||||
| Total Corporate Bonds (Cost $1,961) | 373 | ||||||||||
Foreign Government Security — 2.1% | |||||||||||
| 428 | National Agricultural Cooperative Federation, (South Korea), VAR, 5.750%, 06/18/14 (f) (Cost $443) | 384 | |||||||||
U.S. Treasury Obligations — 31.3% | |||||||||||
| U.S. Treasury Notes, | |||||||||||
| 3,000 | 2.375%, 08/31/10 (m) | 3,068 | |||||||||
| 2,000 | 4.875%, 07/31/11 (m) | 2,177 | |||||||||
| 600 | 5.125%, 06/30/11 (m) | 654 | |||||||||
| Total U.S. Treasury Obligations (Cost $5,772) | 5,899 | ||||||||||
| Total Long-Term Investments (Cost $58,379) | 9,501 | ||||||||||
| SHARES | | | ||||||||||||
|---|---|---|---|---|---|---|---|---|---|---|---|---|---|---|
Short-Term Investments — 50.1% | ||||||||||||||
Investment Company — 49.5% | ||||||||||||||
| 9,321 | JPMorgan Prime Money Market Fund, Institutional Class Shares, 0.830% (b) (l) (m) (Cost $9,321) | 9,321 | ||||||||||||
| PRINCIPAL AMOUNT($) | | | ||||||||
|---|---|---|---|---|---|---|---|---|---|---|
U.S. Treasury Obligation — 0.6% | ||||||||||
| 120 | U.S. Treasury Bill, 0.261%, 04/09/09 (k) (n) (Cost $120) | 120 | ||||||||
| Total Short-Term Investments (Cost $9,441) | 9,441 | |||||||||
Total Investments — 100.6% (Cost $67,820) | 18,942 | |||||||||
Liabilities in Excess of Other Assets — (0.6)% | (105 | ) | ||||||||
NET ASSETS — 100.0% | $ | 18,837 | ||||||||
AS OF FEBRUARY 28, 2009 (continued)
| NUMBER OF CONTRACTS | | DESCRIPTION | | EXPIRATION DATE | | NOTIONAL VALUE AT 02/28/09 | | UNREALIZED APPRECIATION (DEPRECIATION) | ||||||||||
|---|---|---|---|---|---|---|---|---|---|---|---|---|---|---|---|---|---|---|
Long Futures Outstanding | ||||||||||||||||||
| 40 | 2 Year U.S. Treasury Note | 06/30/09 | $ | 8,664 | $ | (9 | ) | |||||||||||
AS OF FEBRUARY 28, 2009
| PRINCIPAL AMOUNT($) | | SECURITY DESCRIPTION | | VALUE($) | |||||||
|---|---|---|---|---|---|---|---|---|---|---|---|
Long-Term Investments — 71.8% | |||||||||||
Asset-Backed Securities — 2.3% | |||||||||||
| 426 | Countrywide Asset-Backed Certificates, Series 2005-4, Class AF3, VAR, 4.456%, 10/25/35 | 357 | |||||||||
| 631 | GSAMP Trust, Series 2006-NC1, Class A2, VAR, 0.654%, 02/25/36 | 432 | |||||||||
| 800 | Home Equity Asset Trust, Series 2006-3, Class 2A3, VAR, 0.654%, 07/25/36 | 627 | |||||||||
| 4,000 | K2 (USA) LLC, Series 2007-2D, VAR, 0.000%, 02/15/10 (d) (f) (i) (s) | — | |||||||||
| 3,800 | Links Finance LLC, VAR, 0.000%, 12/31/09 (d) (e) (f) (i) (s) | — | |||||||||
| 604 | Residential Asset Mortgage Products, Inc., Series 2006-EFC1, Class A2, VAR, 0.674%, 02/25/36 | 508 | |||||||||
| 652 | Residential Asset Securities Corp., Series 2006-KS2, Class A3, VAR, 0.664%, 03/25/36 | 523 | |||||||||
| 537 | Securitized Asset Backed Receivables LLC Trust, Series 2006-WM1, Class A2B, VAR, 0.654%, 12/25/35 | 494 | |||||||||
| 2,900 | Sigma Finance Corp., (Cayman Islands), 0.000%, 08/15/11 (d) (f) (i) (s) | �� | — | ||||||||
| Total Asset-Backed Securities (Cost $14,350) | 2,941 | ||||||||||
Collateralized Mortgage Obligations — 8.9% | |||||||||||
Agency CMO — 6.0% | |||||||||||
| 272 | Federal Home Loan Mortgage Corp. REMICS, Series 2781, Class PI, IO, 5.000%, 10/15/23 | 1 | |||||||||
| Federal National Mortgage Association REMICS, | |||||||||||
| 2,107 | Series 2006-43, Class G, 6.500%, 09/25/33 | 2,163 | |||||||||
| 3,199 | Series 2006-63, Class AB, 6.500%, 10/25/33 | 3,279 | |||||||||
| 2,061 | Series 2006-63, Class AE, 6.500%, 10/25/33 | 2,113 | |||||||||
| Government National Mortgage Association, | |||||||||||
| 8 | Series 2002-24, Class FA, VAR, 0.955%, 04/16/32 | 8 | |||||||||
| 392 | Series 2004-44, Class PK, IO, 5.500%, 10/20/27 | 2 | |||||||||
| 7,566 | |||||||||||
Non-Agency CMO — 2.9% | |||||||||||
| 3,126 | Countrywide Home Loan Mortgage Pass Through Trust, Series 2005-J4, Class A4, 5.500%, 11/25/35 | 2,448 | |||||||||
| 1,242 | Residential Asset Securitization Trust, Series 2006-A8, Class 1A1, 6.000%, 08/25/36 | 634 | |||||||||
| 583 | Wells Fargo Mortgage Backed Securities Trust, Series 2003-N, Class 1A4, VAR, 4.595%, 12/25/33 | 564 | |||||||||
| 3,646 | |||||||||||
| Total Collateralized Mortgage Obligations (Cost $12,404) | 11,212 | ||||||||||
Commercial Mortgage-Backed Securities — 3.2% | |||||||||||
| 1,033 | Banc of America Commercial Mortgage, Inc., Series 2004-5, Class A2, 4.176%, 11/10/41 | 1,009 | |||||||||
| CS First Boston Mortgage Securities Corp., | |||||||||||
| 575 | Series 2001-CP4, Class A4, 6.180%, 12/15/35 | 560 | |||||||||
| 659 | Series 2004-C3, Class A3, 4.302%, 07/15/36 | 648 | |||||||||
| 666 | Greenwich Capital Commercial Funding Corp., Series 2003-C1, Class A2, 3.285%, 07/05/35 | 632 | |||||||||
| LB-UBS Commercial Mortgage Trust, | |||||||||||
| 25 | Series 2003-C5, Class A2, 3.478%, 07/15/27 | 24 | |||||||||
| 1,202 | Series 2004-C2, Class A2, 3.246%, 03/15/29 | 1,199 | |||||||||
| Total Commercial Mortgage-Backed Securities (Cost $4,157) | 4,072 | ||||||||||
Corporate Bonds — 16.2% | |||||||||||
Automobiles — 1.0% | |||||||||||
| 1,300 | Daimler Finance North America LLC, 5.750%, 05/18/09 (m) | 1,297 | |||||||||
Beverages — 0.8% | |||||||||||
| 1,050 | Coca-Cola Enterprises, Inc., 4.250%, 09/15/10 | 1,063 | |||||||||
Capital Markets — 1.4% | |||||||||||
| 600 | Goldman Sachs Group, Inc. (The), 5.300%, 02/14/12 | 580 | |||||||||
| 1,175 | Morgan Stanley, 4.250%, 05/15/10 | 1,147 | |||||||||
| 1,727 | |||||||||||
Commercial Banks — 0.8% | |||||||||||
| 1,000 | Hana Bank, (South Korea), 4.125%, 03/11/09 | 1,000 | |||||||||
Diversified Telecommunication Services — 0.8% | |||||||||||
| 950 | Telefonica Emisiones S.A.U., (Spain), 5.984%, 06/20/11 | 983 | |||||||||
Electric Utilities — 1.5% | |||||||||||
| Appalachian Power Co., | |||||||||||
| 650 | 5.550%, 04/01/11 | 648 | |||||||||
| 200 | 5.650%, 08/15/12 | 196 | |||||||||
| 1,000 | PSEG Power LLC, 3.750%, 04/01/09 | 1,001 | |||||||||
| 1,845 | |||||||||||
FDIC Guaranteed Securities (˜) — 5.2% | |||||||||||
| 600 | Bank of America Corp., 3.125%, 06/15/12 | 615 | |||||||||
| 600 | Citigroup, Inc., 2.875%, 12/09/11 | 613 | |||||||||
| General Electric Capital Corp., | |||||||||||
| 700 | 1.625%, 01/07/11 | 701 | |||||||||
| 800 | 3.000%, 12/09/11 | 818 | |||||||||
| 300 | Goldman Sachs Group, Inc. (The), 3.250%, 06/15/12 | 310 | |||||||||
| 600 | HSBC USA, Inc., 3.125%, 12/16/11 | 616 | |||||||||
| 400 | John Deere Capital Corp., 2.875%, 06/19/12 | 407 | |||||||||
AS OF FEBRUARY 28, 2009 (continued)
| PRINCIPAL AMOUNT($) | | SECURITY DESCRIPTION | | VALUE($) | |||||||
|---|---|---|---|---|---|---|---|---|---|---|---|
Long-Term Investments — Continued | |||||||||||
FDIC Guaranteed Securities (˜) — Continued | |||||||||||
| 1,300 | Morgan Stanley, 2.900%, 12/01/10 | 1,331 | |||||||||
| 400 | SunTrust Bank, 3.000%, 11/16/11 | 409 | |||||||||
| 700 | Wells Fargo & Co., 3.000%, 12/09/11 | 719 | |||||||||
| 6,539 | |||||||||||
Food & Staples Retailing — 0.6% | |||||||||||
| 700 | CVS/Caremark Corp., 4.000%, 09/15/09 (m) | 699 | |||||||||
Food Products — 0.5% | |||||||||||
| 600 | Kraft Foods, Inc., 6.000%, 02/11/13 | 625 | |||||||||
Insurance — 0.7% | |||||||||||
| 900 | Allstate Corp. (The), 7.200%, 12/01/09 (m) | 920 | |||||||||
Media — 1.4% | |||||||||||
| 1,000 | Comcast Cable Communications LLC, 6.750%, 01/30/11 | 1,036 | |||||||||
| 725 | Time Warner, Inc., 5.500%, 11/15/11 | 718 | |||||||||
| 1,754 | |||||||||||
Multi-Utilities — 0.9% | |||||||||||
| 1,150 | Midamerican Energy Co., 5.650%, 07/15/12 | 1,186 | |||||||||
Oil, Gas & Consumable Fuels — 0.6% | |||||||||||
| 778 | Qatar Petroleum, (Qatar), 5.579%, 05/30/11 (e) | 742 | |||||||||
| Total Corporate Bonds (Cost $20,201) | 20,380 | ||||||||||
U.S. Government Agency Securities — 29.2% | |||||||||||
| Federal Home Loan Mortgage Corp., | |||||||||||
| 3,250 | 3.125%, 10/25/10 | 3,334 | |||||||||
| 7,000 | 3.250%, 07/16/10 | 7,171 | |||||||||
| 18,050 | 5.250%, 07/18/11 | 19,562 | |||||||||
| 6,100 | Federal National Mortgage Association, 6.625%, 11/15/10 | 6,620 | |||||||||
| Total U.S. Government Agency Securities (Cost $35,425) | 36,687 | ||||||||||
U.S. Treasury Obligations — 12.0% | |||||||||||
| U.S. Treasury Notes, | |||||||||||
| 10,500 | 1.125%, 01/15/12 (m) | 10,425 | |||||||||
| 4,650 | 1.750%, 11/15/11 (m) | 4,705 | |||||||||
| Total U.S. Treasury Obligations (Cost $15,128) | 15,130 | ||||||||||
| Total Long-Term Investments (Cost $101,665) | $ | 90,422 | |||||||||
| SHARES | | | |||||||||
|---|---|---|---|---|---|---|---|---|---|---|---|
Short-Term Investments — 26.3% | |||||||||||
Investment Company — 26.0% | |||||||||||
| 32,758 | JPMorgan Prime Money Market Fund, Institutional Class Shares, 0.830% (b) (l) (m) (Cost $32,758) | $ | 32,758 | ||||||||
| PRINCIPAL AMOUNT($) | | | ||||||||
|---|---|---|---|---|---|---|---|---|---|---|
U.S. Treasury Obligations — 0.3% | ||||||||||
| U.S. Treasury Bills, | ||||||||||
| 40 | 0.054%, 03/05/09 (k) (n) | 40 | ||||||||
| 35 | 0.113%, 04/09/09 (k) (n) | 35 | ||||||||
| 265 | 0.232%, 04/09/09 (k) (n) | 264 | ||||||||
| (Cost $ 339) | 339 | |||||||||
| Total Short-Term Investments (Cost $33,097) | 33,097 | |||||||||
Total Investments — 98.1% (Cost $134,762) | 123,519 | |||||||||
Other Assets in Excess of Liabilities — 1.9% | 2,376 | |||||||||
NET ASSETS — 100.0% | $ | 125,895 | ||||||||
| NUMBER OF CONTRACTS | | DESCRIPTION | | EXPIRATION DATE | | NOTIONAL VALUE AT 02/28/09 | | UNREALIZED APPRECIATION (DEPRECIATION) | ||||||||||
|---|---|---|---|---|---|---|---|---|---|---|---|---|---|---|---|---|---|---|
Long Futures Outstanding | ||||||||||||||||||
| 106 | 2 Year U.S. Treasury Note | 06/30/09 | $ | 22,961 | $ | (28 | ) | |||||||||||
AS OF FEBRUARY 28, 2009
| ARS— | Argentine Peso |
| BRL— | Brazilian Real |
| CLN— | Credit Linked Notes. The credit ratings disclosed for the underlying referenced obligations, provide an indication of the likelihood or risk that the underlying sovereign issuer will default on payment of principal and interest. The credit ratings on these securities represent the rating from a national statistical rating organization and are as of February 28, 2009. Credit ratings are generally considered to be lagging indicators, and as such, credit risk could be greater than the current ratings would indicate. |
| CMO— | Collateralized Mortgage Obligation |
| COP— | Colombian Peso |
| EGP— | Egyptian Pound |
| FHLB— | Federal Home Loan Bank |
| FHLMC— | Federal Home Loan Mortgage Corp. |
| FNMA— | Federal National Mortgage Association |
| GNMA— | Government National Mortgage Association |
| IF— | Inverse Floaters represent securities that pay interest at a rate that increases (decreases) with a decline (incline) in a specified index. The interest rate shown is the rate in effect as of February 28, 2009. The rate may be subject to a cap and floor. |
| IO— | Interest Only represents the right to receive the monthly interest payments on an underlying pool of mortgage loans. The principal amount shown represents the par value on the underlying pool. The yields on these securities are subject to accelerated principal paydowns as a result of prepayment or refinancing of the underlying pool of mortgage instruments. As a result, interest income may be reduced considerably. |
| LIBOR— | London Interbank Offered Rate |
| MXN— | Mexican Peso |
| PIK— | Payment-in-kind |
| REMICS— | Real Estate Mortgage Investment Conduits |
| STRIPS— | Separate Trading of Registered Interest and Principal Securities. The STRIPS Program lets investors hold and trade individual interest and principal components of eligible notes and bonds as separate securities. |
| SUB— | Step-Up Bond. The interest rate shown is the rate in effect as of February 28, 2009. |
| TBA— | To Be Announced |
| UYU— | Uruguayan Peso |
| VAR— | Variable Rate Security. The interest rate shown is the rate in effect as of February 28, 2009. |
| ˜— | Securities are guaranteed by the Federal Deposit Insurance Corporation (FDIC) under its Temporary Liquidity Guarantee Program (TLGP). Under this program, the FDIC guarantees, with the full faith and credit of the U.S. government, the payment of principal and interest. The expiration of the FDIC’s guarantee is the earlier of the maturity date of the debt or June 30, 2012. |
| (b)— | Investment in affiliate. Money market fund registered under the Investment Company Act of 1940, as amended, and advised by J.P. Morgan Investment Management Inc. |
| (d)— | Defaulted Security. |
| (e)— | Security is exempt from registration under Rule 144A of the Securities Act of 1933. Unless otherwise indicated, this security has been determined to be liquid under procedures established by the Board of Trustees and may be resold in transactions exempt from registration, normally to qualified institutional buyers. |
| (f)— | Security is fair valued in accordance with procedures established by and under the supervision and responsibility of the Board of Trustees. The following approximates the value and percentage of these investments based on total investments (amounts in thousands): |
| Value | Percentage | |||||||||
|---|---|---|---|---|---|---|---|---|---|---|
| Bond Fund | $ | 18,321 | 10.6 | % | ||||||
| Emerging Markets Debt Fund | 450 | 0.2 | ||||||||
| Enhanced Income Fund | 471 | 5.7 | ||||||||
| Short Term Bond Fund | 384 | 2.0 | ||||||||
| Short Term Bond Fund II | — | — | ||||||||
| (g)— | Amount rounds to less than 0.1%. |
| (h)— | Amount rounds to less than one thousand (shares or dollars). |
| (i)— | Security has been deemed illiquid pursuant to procedures approved by the Board of Trustees and may be difficult to sell. |
| (k)— | Security is fully or partially segregated with the broker as collateral for futures or with brokers as initial margin for futures contracts. |
| (l)— | The rate shown is the current yield as of February 28, 2009. |
| (m)— | All or a portion of this security is reserved for current or potential holdings of futures, swaps, options, TBAs, when-issued securities, delayed delivery securities, reverse repurchase agreements and forward foreign currency contracts. |
| (n)— | The rate shown is the effective yield at the date of purchase. |
| (o)— | CLN issuer is in bankruptcy. |
| (r)— | Rates shown are per annum and payments are as described. |
| (s)— | These holdings represent investments in structured investment vehicles (SIVs). The value of SIVs may be affected by, among other things, changes in: interest rates, the quality of the underlying assets or the market’s assessment thereof, factors concerning interests in and structure of the issuer or the originator of the receivables, or the creditworthiness of the entities that provide credit enhancements. SIVs have experienced decreased liquidity primarily resulting from declines in the market value of certain categories of collateral underlying the SIVs. These holdings were previously determined to be liquid at the time of acquisition of such investments and have since been deemed to be illiquid due to the changes in market conditions. |
| (x)— | Security is perpetual and, thus, does not have a predetermined maturity date. The coupon rate for this security is fixed for a period of time and may be structured to adjust thereafter. The date shown reflects the next call date. The coupon rate shown is the rate in effect as of February 28, 2009. |
AS OF FEBRUARY 28, 2009
| | Bond Fund | | Emerging Markets Debt Fund | | Enhanced Income Fund | |||||||||
|---|---|---|---|---|---|---|---|---|---|---|---|---|---|---|
ASSETS: | ||||||||||||||
| Investments in non-affiliates, at value | $ | 160,054 | $ | 204,938 | $ | 6,972 | ||||||||
| Investments in affiliates, at value | 13,208 | 6,767 | 1,241 | |||||||||||
| Total investment securities, at value | 173,262 | 211,705 | 8,213 | |||||||||||
| Cash | 8 | — | — | |||||||||||
| Foreign currency, at value | 7 | 56 | — | |||||||||||
| Deposits at broker for foreign futures contracts | 342 | — | — | |||||||||||
| Receivables: | ||||||||||||||
| Investment securities sold | 18,532 | 3,284 | — | |||||||||||
| Fund shares sold | 104 | 69 | 3 | |||||||||||
| Interest and dividends | 1,253 | 6,751 | 23 | |||||||||||
| Variation margin on futures contracts | 29 | 24 | — | |||||||||||
| Outstanding swap contracts, at value | 1,579 | 4,736 | — | |||||||||||
| Due from Advisor | 24 | — | 20 | |||||||||||
| Total Assets | 195,140 | 226,625 | 8,259 | |||||||||||
LIABILITIES: | ||||||||||||||
| Payables: | ||||||||||||||
| Due to custodian | — | — | (b) | — | ||||||||||
| Dividends | 69 | 908 | 3 | |||||||||||
| Investment securities purchased | 63,732 | 7,135 | 715 | |||||||||||
| Fund shares redeemed | 202 | 1,172 | — | |||||||||||
| Variation margin on futures contracts | 56 | 183 | — | |||||||||||
| Outstanding options written, at value | 209 | — | — | |||||||||||
| Outstanding swap contracts, at value | 3,673 | 17,458 | — | |||||||||||
| Accrued liabilities: | ||||||||||||||
| Investment advisory fees | 5 | 112 | — | |||||||||||
| Administration fees | 9 | 6 | — | |||||||||||
| Shareholder servicing fees | 12 | 29 | — | |||||||||||
| Distribution fees | 6 | 2 | — | |||||||||||
| Custodian and accounting fees | 16 | 31 | 6 | |||||||||||
| Trustees’ and Chief Compliance Officer’s fees | 3 | 3 | 2 | |||||||||||
| Other | 249 | 53 | 42 | |||||||||||
| Total Liabilities | 68,241 | 27,092 | 768 | |||||||||||
| Net Assets | $ | 126,899 | $ | 199,533 | $ | 7,491 | ||||||||
| | Bond Fund | | Emerging Markets Debt Fund | | Enhanced Income Fund | |||||||||
|---|---|---|---|---|---|---|---|---|---|---|---|---|---|---|
NET ASSETS: | ||||||||||||||
| Paid in capital | $ | 416,456 | $ | 317,471 | $ | 39,413 | ||||||||
| Accumulated undistributed (distributions in excess of) net investment income | (3,176 | ) | 37 | (127 | ) | |||||||||
| Accumulated net realized gains (losses) | (211,480 | ) | (37,360 | ) | (24,231 | ) | ||||||||
| Net unrealized appreciation (depreciation) | (74,901 | ) | (80,615 | ) | (7,564 | ) | ||||||||
| Total Net Assets | $ | 126,899 | $ | 199,533 | $ | 7,491 | ||||||||
| Net Assets: | ||||||||||||||
| Class A | $ | 11,780 | $ | 4,025 | $ | — | ||||||||
| Class B | 2,279 | — | — | |||||||||||
| Class C | 4,285 | 2,253 | — | |||||||||||
| Class R5 | — | 15,046 | — | |||||||||||
| Select Class | 45,314 | 178,209 | — | |||||||||||
| Institutional Class | 17,873 | — | 7,491 | |||||||||||
| Ultra | 45,368 | — | — | |||||||||||
| Total | $ | 126,899 | $ | 199,533 | $ | 7,491 | ||||||||
| Outstanding units of beneficial interest (shares) | ||||||||||||||
| ($0.0001 par value; unlimited number of shares authorized): | ||||||||||||||
| Class A | 1,870 | 725 | — | |||||||||||
| Class B | 365 | — | — | |||||||||||
| Class C | 682 | 406 | — | |||||||||||
| Class R5 | — | 2,706 | — | |||||||||||
| Select Class | 7,275 | 32,062 | — | |||||||||||
| Institutional Class | 2,871 | — | 1,150 | |||||||||||
| Ultra | 7,286 | — | — | |||||||||||
| Net Asset Value: | ||||||||||||||
| Class A — Redemption price per share | $ | 6.30 | $ | 5.56 | $ | — | ||||||||
| Class B — Offering price per share (a) | 6.25 | — | — | |||||||||||
| Class C — Offering price per share (a) | 6.29 | 5.55 | — | |||||||||||
| Class R5 — Offering and redemption price per share | — | 5.56 | — | |||||||||||
| Select Class — Offering and redemption price per share | 6.23 | 5.56 | — | |||||||||||
| Institutional Class — Offering and redemption price per share | 6.23 | — | 6.52 | |||||||||||
| Ultra — Offering and redemption price per share | 6.23 | — | — | |||||||||||
| Class A maximum sales charge | 3.75 | % | 3.75 | % | — | |||||||||
| Class A maximum public offering price per share [net asset value per share/(100% – maximum sales charge)] | $ | 6.55 | $ | 5.78 | $ | — | ||||||||
| Cost of investments in non-affiliates | $ | 234,637 | $ | 272,400 | $ | 14,536 | ||||||||
| Cost of investments in affiliates | 13,208 | 6,767 | 1,241 | |||||||||||
| Cost of foreign currency | 10 | 57 | — | |||||||||||
| Premiums received from options written | 50 | — | — | |||||||||||
| Premiums paid on swaps | 584 | — | — | |||||||||||
| Premiums received from swaps | 2,348 | — | — | |||||||||||
| (a) | Redemption price for Class B and Class C Shares varies based upon length of time the shares are held. |
| (b) | Amount rounds to less than $1,000. |
AS OF FEBRUARY 28, 2009 (continued)
| | Real Return Fund | | Short Term Bond Fund | | Short Term Bond Fund II | |||||||||
|---|---|---|---|---|---|---|---|---|---|---|---|---|---|---|
ASSETS: | ||||||||||||||
| Investments in non-affiliates, at value | $ | 77,830 | $ | 9,621 | $ | 90,761 | ||||||||
| Investments in affiliates, at value | 1,536 | 9,321 | 32,758 | |||||||||||
| Total investment securities, at value | 79,366 | 18,942 | 123,519 | |||||||||||
| Cash | — | — | (b) | — | ||||||||||
| Foreign currency, at value | 2 | — | (b) | — | ||||||||||
| Deposits at broker for foreign futures contracts | — | — | — | (b) | ||||||||||
| Receivables: | ||||||||||||||
| Investment securities sold | — | — | 2,419 | |||||||||||
| Fund shares sold | 1,389 | 103 | 17 | |||||||||||
| Interest and dividends | 289 | 82 | 656 | |||||||||||
| Variation margin on futures contracts | 7 | 11 | 35 | |||||||||||
| Due from Advisor | 6 | 18 | — | |||||||||||
| Total Assets | 81,059 | 19,156 | 126,646 | |||||||||||
LIABILITIES: | ||||||||||||||
| Payables: | ||||||||||||||
| Due to custodian | 68 | — | 5 | |||||||||||
| Due to custodian for foreign currency | — | — | — | (b) | ||||||||||
| Dividends | — | 94 | 329 | |||||||||||
| Fund shares redeemed | 471 | 67 | 76 | |||||||||||
| Variation margin on futures contracts | 7 | — | — | |||||||||||
| Outstanding swap contracts, at value | 104 | — | — | |||||||||||
| Accrued liabilities: | ||||||||||||||
| Investment advisory fees | — | — | 21 | |||||||||||
| Administration fees | — | 7 | 7 | |||||||||||
| Shareholder servicing fees | 6 | 2 | 13 | |||||||||||
| Distribution fees | 6 | 1 | 33 | |||||||||||
| Custodian and accounting fees | 52 | 8 | 9 | |||||||||||
| Trustees’ and Chief Compliance Officer’s fees | — | 7 | 7 | |||||||||||
| Other | 79 | 133 | 251 | |||||||||||
| Total Liabilities | 793 | 319 | 751 | |||||||||||
| Net Assets | $ | 80,266 | $ | 18,837 | $ | 125,895 | ||||||||
| | Real Return Fund | | Short Term Bond Fund | | Short Term Bond Fund II | |||||||||
|---|---|---|---|---|---|---|---|---|---|---|---|---|---|---|
NET ASSETS: | ||||||||||||||
| Paid in capital | $ | 88,857 | $ | 143,193 | $ | 186,233 | ||||||||
| Accumulated undistributed (distributions in excess of) net investment income | 1 | (812 | ) | (374 | ) | |||||||||
| Accumulated net realized gains (losses) | (7,148 | ) | (74,657 | ) | (48,693 | ) | ||||||||
| Net unrealized appreciation (depreciation) | (1,444 | ) | (48,887 | ) | (11,271 | ) | ||||||||
| Total Net Assets | $ | 80,266 | $ | 18,837 | $ | 125,895 | ||||||||
| Net Assets: | ||||||||||||||
| Class A | $ | 9,090 | $ | 2,657 | $ | 6,456 | ||||||||
| Class C | 7,848 | — | — | |||||||||||
| Class M | — | — | 113,828 | |||||||||||
| Select Class | 38,458 | 6,232 | 5,611 | |||||||||||
| Institutional Class | 24,870 | 9,948 | — | |||||||||||
| Total | $ | 80,266 | $ | 18,837 | $ | 125,895 | ||||||||
| Outstanding units of beneficial interest (shares) | ||||||||||||||
| ($0.0001 par value; unlimited number of shares authorized): | ||||||||||||||
| Class A | 1,054 | 428 | 737 | |||||||||||
| Class C | 915 | — | — | |||||||||||
| Class M | — | — | 13,000 | |||||||||||
| Select Class | 4,439 | 1,004 | 640 | |||||||||||
| Institutional Class | 2,866 | 1,602 | — | |||||||||||
| Net Asset Value: | ||||||||||||||
| Class A — Redemption price per share | $ | 8.63 | $ | 6.21 | $ | 8.76 | ||||||||
| Class C — Offering price per share (a) | 8.58 | — | — | |||||||||||
| Class M — Offering price per share | — | — | 8.76 | |||||||||||
| Select Class — Offering and redemption price per share | 8.66 | 6.21 | 8.77 | |||||||||||
| Institutional Class — Offering and redemption price per share | 8.68 | 6.21 | — | |||||||||||
| Class A maximum sales charge | 3.75 | % | 2.25 | % | 2.25 | % | ||||||||
| Class A maximum public offering price per share [net asset value per share/(100% – maximum sales charge)] | $ | 8.97 | $ | 6.35 | $ | 8.96 | ||||||||
| Class M maximum sales charge | — | — | 1.50 | % | ||||||||||
| Class M maximum public offering price per share [net asset value per share/(100% – maximum sales charge)] | $ | — | $ | — | $ | 8.90 | ||||||||
| Cost of investments in non-affiliates | $ | 79,224 | $ | 58,499 | $ | 102,004 | ||||||||
| Cost of investments in affiliates | 1,536 | 9,321 | 32,758 | |||||||||||
| Cost of foreign currency | — | (b) | — | (b) | — | (b) | ||||||||
| (a) | Redemption price for Class C Shares varies based upon length of time the shares are held. |
| (b) | Amount rounds to less than $1,000. |
FOR THE YEAR ENDED FEBRUARY 28, 2009
| | Bond Fund | | Emerging Markets Debt Fund | | Enhanced Income Fund | |||||||||
|---|---|---|---|---|---|---|---|---|---|---|---|---|---|---|
INVESTMENT INCOME: | ||||||||||||||
| Interest income from non-affiliates | $ | 40,205 | $ | 23,236 | $ | 1,609 | ||||||||
| Dividend income from non-affiliates | 93 | — | — | |||||||||||
| Interest income from affiliates | 16 | — | — | |||||||||||
| Dividend income from affiliates (a) | 484 | 423 | 293 | |||||||||||
| Foreign taxes withheld | — | 38 | — | |||||||||||
| Total investment income | 40,798 | 23,697 | 1,902 | |||||||||||
EXPENSES: | ||||||||||||||
| Investment advisory fees | 1,929 | 1,893 | 134 | |||||||||||
| Administration fees | 660 | 283 | 55 | |||||||||||
| Distribution fees: | ||||||||||||||
| Class A | 43 | 22 | — | |||||||||||
| Class B | 23 | — | — | |||||||||||
| Class C | 41 | 30 | — | |||||||||||
| Shareholder servicing fees: | ||||||||||||||
| Class A | 43 | 22 | — | |||||||||||
| Class B | 8 | — | — | |||||||||||
| Class C | 14 | 10 | — | |||||||||||
| Class R5 | — | 10 | — | |||||||||||
| Select Class | 895 | 595 | — | |||||||||||
| Institutional Class | 151 | — | 53 | |||||||||||
| Custodian and accounting fees | 157 | 137 | 31 | |||||||||||
| Interest expense to affiliates | 10 | — | — | |||||||||||
| Professional fees | 148 | 99 | 76 | |||||||||||
| Trustees’ and Chief Compliance Officer’s fees | 10 | 4 | 1 | |||||||||||
| Printing and mailing costs | 75 | 20 | 3 | |||||||||||
| Registration and filing fees | 92 | 61 | 11 | |||||||||||
| Transfer agent fees | 230 | 114 | 3 | |||||||||||
| Other | 85 | 30 | 10 | |||||||||||
| Total expenses | 4,614 | 3,330 | 377 | |||||||||||
| Less amounts waived | (796 | ) | (49 | ) | (234 | ) | ||||||||
| Less earnings credits | (4 | ) | (1 | ) | — | (b) | ||||||||
| Less expense reimbursements | (55 | ) | — | (36 | ) | |||||||||
| Net expenses | 3,759 | 3,280 | 107 | |||||||||||
| Net investment income (loss) | 37,039 | 20,417 | 1,795 | |||||||||||
| | Bond Fund | | Emerging Markets Debt Fund | | Enhanced Income Fund | |||||||||
|---|---|---|---|---|---|---|---|---|---|---|---|---|---|---|
REALIZED/UNREALIZED GAINS (LOSSES): | ||||||||||||||
| Net realized gain (loss) on transactions from: | ||||||||||||||
| Investments in non-affiliates | $ | (191,705 | ) | $ | (26,011 | ) | $ | (12,962 | ) | |||||
| Investments in affiliates | (778 | ) | — | — | ||||||||||
| Securities sold short | (2,405 | ) | — | (56 | ) | |||||||||
| Futures | (8,330 | ) | 3,197 | 115 | ||||||||||
| Foreign currency transactions | (75 | ) | (3,267 | ) | — | |||||||||
| Written options | 207 | — | — | |||||||||||
| Swaps | (10,718 | ) | (11,755 | ) | (82 | ) | ||||||||
| Payments by affiliates (See Note 3) | 249 | — | — | |||||||||||
| Net realized gain (loss) | (213,555 | ) | (37,836 | ) | (12,985 | ) | ||||||||
| Change in net unrealized appreciation (depreciation) of: | ||||||||||||||
| Investments in non-affiliates | 11,348 | (69,104 | ) | 8 | ||||||||||
| Investments in affiliates | 585 | — | — | |||||||||||
| Futures | (2,718 | ) | (1,070 | ) | (69 | ) | ||||||||
| Foreign currency translations | 462 | 375 | — | |||||||||||
| Written options | 4,594 | — | — | |||||||||||
| Securities sold short | 224 | — | (7 | ) | ||||||||||
| Swaps | (406 | ) | (7,819 | ) | (121 | ) | ||||||||
| Change in net unrealized appreciation (depreciation) | 14,089 | (77,618 | ) | (189 | ) | |||||||||
| Net realized/unrealized gains (losses) | (199,466 | ) | (115,454 | ) | (13,174 | ) | ||||||||
| Change in net assets resulting from operations | $ | (162,427 | ) | $ | (95,037 | ) | $ | (11,379 | ) | |||||
| (a) | Includes reimbursements of investment advisory, administration and shareholder servicing fees. Please see Fees and Other Transactions with Affiliates in the Notes to Financial Statements. |
| (b) | Amount rounds to less than $1,000. |
FOR THE YEAR ENDED FEBRUARY 28, 2009 (continued)
| | Real Return Fund | | Short Term Bond Fund | | Short Term Bond Fund II | |||||||||
|---|---|---|---|---|---|---|---|---|---|---|---|---|---|---|
INVESTMENT INCOME: | ||||||||||||||
| Interest income from non-affiliates | $ | 1,748 | $ | 18,299 | $ | 7,570 | ||||||||
| Interest income from affiliates | — | 51 | 9 | |||||||||||
| Dividend income from affiliates (a) | 89 | 384 | 422 | |||||||||||
| Total investment income | 1,837 | 18,734 | 8,001 | |||||||||||
EXPENSES: | ||||||||||||||
| Investment advisory fees | 281 | 917 | 469 | |||||||||||
| Administration fees | 85 | 374 | 196 | |||||||||||
| Distribution fees: | ||||||||||||||
| Class A | 20 | 17 | 38 | |||||||||||
| Class C | 69 | — | — | |||||||||||
| Class M | — | — | 451 | |||||||||||
| Shareholder servicing fees: | ||||||||||||||
| Class A | 20 | 17 | 38 | |||||||||||
| Class C | 23 | — | — | |||||||||||
| Class M | — | — | 322 | |||||||||||
| Select Class | 133 | 707 | 108 | |||||||||||
| Institutional Class | 10 | 77 | — | |||||||||||
| Custodian and accounting fees | 132 | 51 | 56 | |||||||||||
| Interest expense to affiliates | 2 | 1 | — | |||||||||||
| Professional fees | 112 | 110 | 119 | |||||||||||
| Trustees’ and Chief Compliance Officer’s fees | 1 | 4 | 3 | |||||||||||
| Printing and mailing costs | 5 | 37 | 88 | |||||||||||
| Registration and filing fees | 56 | 22 | 39 | |||||||||||
| Transfer agent fees | 58 | 48 | 62 | |||||||||||
| Other | 61 | 47 | 80 | |||||||||||
| Total expenses | 1,068 | 2,429 | 2,069 | |||||||||||
| Less amounts waived | (436 | ) | (529 | ) | (448 | ) | ||||||||
| Less earnings credits | (1 | ) | (3 | ) | (1 | ) | ||||||||
| Less expense reimbursements | (27 | ) | (59 | ) | — | |||||||||
| Net expenses | 604 | 1,838 | 1,620 | |||||||||||
| Net investment income (loss) | 1,233 | 16,896 | 6,381 | |||||||||||
| | Real Return Fund | | Short Term Bond Fund | | Short Term Bond Fund II | |||||||||
|---|---|---|---|---|---|---|---|---|---|---|---|---|---|---|
REALIZED/UNREALIZED GAINS (LOSSES): | ||||||||||||||
| Net realized gain (loss) on transactions from: | ||||||||||||||
| Investments in non-affiliates | $ | (1,497 | ) | $ | (53,052 | ) | $ | (18,969 | ) | |||||
| Investments in affiliates | — | (802 | ) | (144 | ) | |||||||||
| Securities sold short | 311 | 1,845 | — | |||||||||||
| Futures | (737 | ) | (4,015 | ) | 1,040 | |||||||||
| Foreign currency transactions | 28 | (14 | ) | — | ||||||||||
| Written options | (1,575 | ) | 1,796 | 145 | ||||||||||
| Swaps | (1,878 | ) | 3,326 | (255 | ) | |||||||||
| Net realized gain (loss) | (5,348 | ) | (50,916 | ) | (18,183 | ) | ||||||||
| Change in net unrealized appreciation (depreciation) of: | ||||||||||||||
| Investments in non-affiliates | (6,075 | ) | (10,557 | ) | 867 | |||||||||
| Investments in affiliates | — | (63 | ) | (5 | ) | |||||||||
| Futures | 4 | (411 | ) | (329 | ) | |||||||||
| Foreign currency translations | (9 | ) | (6 | ) | — | |||||||||
| Written options | 278 | 2,156 | 374 | |||||||||||
| Securities sold short | (59 | ) | (1,942 | ) | — | |||||||||
| Swaps | 123 | (9,720 | ) | (1,382 | ) | |||||||||
| Change in net unrealized appreciation (depreciation) | (5,738 | ) | (20,543 | ) | (475 | ) | ||||||||
| Net realized/unrealized gains (losses) | (11,086 | ) | (71,459 | ) | (18,658 | ) | ||||||||
| Change in net assets resulting from operations | $ | (9,853 | ) | $ | (54,563 | ) | $ | (12,277 | ) | |||||
| (a) | Includes reimbursements of investment advisory, administration and shareholder servicing fees. Please see Fees and Other Transactions with Affiliates in the Notes to Financial Statements. |
FOR THE PERIODS INDICATED
| Bond Fund | Emerging Markets Debt Fund | Enhanced Income Fund | |||||||||||||||||||||||||
|---|---|---|---|---|---|---|---|---|---|---|---|---|---|---|---|---|---|---|---|---|---|---|---|---|---|---|---|
| | Year Ended 2/28/2009 | | Year Ended 2/29/2008 | | Year Ended 2/28/2009 | | Year Ended 2/29/2008 | | Year Ended 2/28/2009 | | Year Ended 2/29/2008 | ||||||||||||||||
CHANGE IN NET ASSETS RESULTING FROM OPERATIONS: | |||||||||||||||||||||||||||
| Net investment income (loss) | $ | 37,039 | $ | 117,741 | $ | 20,417 | $ | 17,161 | $ | 1,795 | $ | 8,234 | |||||||||||||||
| Net realized gain (loss) | (213,555 | ) | (12,726 | ) | (37,836 | ) | 513 | (12,985 | ) | (3,805 | ) | ||||||||||||||||
| Change in net unrealized appreciation (depreciation) | 14,089 | (116,371 | ) | (77,618 | ) | (8,893 | ) | (189 | ) | (7,554 | ) | ||||||||||||||||
| Change in net assets resulting from operations | (162,427 | ) | (11,356 | ) | (95,037 | ) | 8,781 | (11,379 | ) | (3,125 | ) | ||||||||||||||||
DISTRIBUTIONS TO SHAREHOLDERS: | |||||||||||||||||||||||||||
Class A | |||||||||||||||||||||||||||
| From net investment income | (1,164 | ) | (1,302 | ) | (547 | ) | (543 | ) | — | — | |||||||||||||||||
| From net realized gains | — | — | — | (205 | ) | — | — | ||||||||||||||||||||
Class B | |||||||||||||||||||||||||||
| From net investment income | (191 | ) | (173 | ) | — | — | — | — | |||||||||||||||||||
Class C | |||||||||||||||||||||||||||
| From net investment income | (338 | ) | (306 | ) | (224 | ) | (217 | ) | — | — | |||||||||||||||||
| From net realized gains | — | — | — | (79 | ) | — | — | ||||||||||||||||||||
Class R5 | |||||||||||||||||||||||||||
| From net investment income | — | — | (1,261 | ) | (1,294 | ) | — | — | |||||||||||||||||||
| From net realized gains | — | — | — | (363 | ) | — | — | ||||||||||||||||||||
Select Class | |||||||||||||||||||||||||||
| From net investment income | (20,800 | ) | (82,232 | ) | (15,199 | ) | (14,385 | ) | — | — | |||||||||||||||||
| From net realized gains | — | — | — | (4,326 | ) | — | — | ||||||||||||||||||||
Institutional Class | |||||||||||||||||||||||||||
| From net investment income | (9,762 | ) | (21,498 | ) | — | — | (1,743 | ) | (8,070 | ) | |||||||||||||||||
| From net realized gains | — | — | — | — | — | (189 | ) | ||||||||||||||||||||
Ultra | |||||||||||||||||||||||||||
| From net investment income | (7,508 | ) | (9,393 | ) | — | — | — | — | |||||||||||||||||||
| Total distributions to shareholders | (39,763 | ) | (114,904 | ) | (17,231 | ) | (21,412 | ) | (1,743 | ) | (8,259 | ) | |||||||||||||||
CAPITAL TRANSACTIONS: | |||||||||||||||||||||||||||
| Change in net assets from capital transactions | (1,350,461 | ) | (244,149 | ) | 11,079 | 175,875 | (82,565 | ) | (68,540 | ) | |||||||||||||||||
NET ASSETS: | |||||||||||||||||||||||||||
| Change in net assets | (1,552,651 | ) | (370,409 | ) | (101,189 | ) | 163,244 | (95,687 | ) | (79,924 | ) | ||||||||||||||||
| Beginning of period | 1,679,550 | 2,049,959 | 300,722 | 137,478 | 103,178 | 183,102 | |||||||||||||||||||||
| End of period | $ | 126,899 | $ | 1,679,550 | $ | 199,533 | $ | 300,722 | $ | 7,491 | $ | 103,178 | |||||||||||||||
| Accumulated undistributed (distributions in excess of) net investment income | $ | (3,176 | ) | $ | 8,104 | $ | 37 | $ | 970 | $ | (127 | ) | $ | (173 | ) | ||||||||||||
| Real Return Fund | Short Term Bond Fund | Short Term Bond Fund II | |||||||||||||||||||||||||
|---|---|---|---|---|---|---|---|---|---|---|---|---|---|---|---|---|---|---|---|---|---|---|---|---|---|---|---|
| | Year Ended 2/28/2009 | | Year Ended 2/29/2008 | | Year Ended 2/28/2009 | | Year Ended 2/29/2008 | | Year Ended 2/28/2009 | | Year Ended 2/29/2008 | ||||||||||||||||
CHANGE IN NET ASSETS RESULTING FROM OPERATIONS: | |||||||||||||||||||||||||||
| Net investment income (loss) | $ | 1,233 | $ | 3,897 | $ | 16,896 | $ | 85,886 | $ | 6,381 | $ | 14,171 | |||||||||||||||
| Net realized gain (loss) | (5,348 | ) | 585 | (50,916 | ) | (28,575 | ) | (18,183 | ) | 3,124 | |||||||||||||||||
| Change in net unrealized appreciation (depreciation) | (5,738 | ) | 4,183 | (20,543 | ) | (32,299 | ) | (475 | ) | (8,617 | ) | ||||||||||||||||
| Change in net assets resulting from operations | (9,853 | ) | 8,665 | (54,563 | ) | 25,012 | (12,277 | ) | 8,678 | ||||||||||||||||||
| Net equalization credits (debits) | — | — | — | — | (147 | ) | (204 | ) | |||||||||||||||||||
DISTRIBUTIONS TO SHAREHOLDERS: | |||||||||||||||||||||||||||
Class A | |||||||||||||||||||||||||||
| From net investment income | (345 | ) | (63 | ) | (419 | ) | (548 | ) | (558 | ) | (1,177 | ) | |||||||||||||||
Class C | |||||||||||||||||||||||||||
| From net investment income | (383 | ) | (23 | ) | — | — | — | — | |||||||||||||||||||
Class M | |||||||||||||||||||||||||||
| From net investment income | — | — | — | — | (4,395 | ) | (6,753 | ) | |||||||||||||||||||
Select Class | |||||||||||||||||||||||||||
| From net investment income | (2,440 | ) | (3,530 | ) | (11,005 | ) | (63,417 | ) | (1,629 | ) | (6,250 | ) | |||||||||||||||
Institutional Class | |||||||||||||||||||||||||||
| From net investment income | (320 | ) | (359 | ) | (3,630 | ) | (21,722 | ) | — | — | |||||||||||||||||
| Total distributions to shareholders | (3,488 | ) | (3,975 | ) | (15,054 | ) | (85,687 | ) | (6,582 | ) | (14,180 | ) | |||||||||||||||
CAPITAL TRANSACTIONS: | |||||||||||||||||||||||||||
| Change in net assets from capital transactions | 15,912 | 4,482 | (983,540 | ) | (520,629 | ) | (104,896 | ) | (96,618 | ) | |||||||||||||||||
NET ASSETS: | |||||||||||||||||||||||||||
| Change in net assets | 2,571 | 9,172 | (1,053,157 | ) | (581,304 | ) | (123,902 | ) | (102,324 | ) | |||||||||||||||||
| Beginning of period | 77,695 | 68,523 | 1,071,994 | 1,653,298 | 249,797 | 352,121 | |||||||||||||||||||||
| End of period | $ | 80,266 | $ | 77,695 | $ | 18,837 | $ | 1,071,994 | $ | 125,895 | $ | 249,797 | |||||||||||||||
| Accumulated undistributed (distributions in excess of) net investment income | $ | 1 | $ | 338 | $ | (812 | ) | $ | 2,585 | $ | (374 | ) | $ | (144 | ) | ||||||||||||
FOR THE PERIODS INDICATED (continued)
| Bond Fund | Emerging Markets Debt Fund | Enhanced Income Fund | |||||||||||||||||||||||||
|---|---|---|---|---|---|---|---|---|---|---|---|---|---|---|---|---|---|---|---|---|---|---|---|---|---|---|---|
| | Year Ended 2/28/2009 | | Year Ended 2/29/2008 | | Year Ended 2/28/2009 | | Year Ended 2/29/2008 | | Year Ended 2/28/2009 | | Year Ended 2/29/2008 | ||||||||||||||||
CAPITAL TRANSACTIONS: | |||||||||||||||||||||||||||
Class A | |||||||||||||||||||||||||||
| Proceeds from shares issued | $ | 6,387 | $ | 20,591 | $ | 8,860 | $ | 15,321 | $ | — | $ | — | |||||||||||||||
| Dividends and distributions reinvested | 964 | 1,043 | 444 | 579 | — | — | |||||||||||||||||||||
| Cost of shares redeemed | (15,363 | ) | (14,713 | ) | (9,554 | ) | (9,276 | ) | — | — | |||||||||||||||||
| Redemption fees | — | — | 1 | 1 | — | — | |||||||||||||||||||||
| Change in net assets from Class A capital transactions | $ | (8,012 | ) | $ | 6,921 | $ | (249 | ) | $ | 6,625 | $ | — | $ | — | |||||||||||||
Class B | |||||||||||||||||||||||||||
| Proceeds from shares issued | $ | 513 | $ | 2,256 | $ | — | $ | — | $ | — | $ | — | |||||||||||||||
| Dividends and distributions reinvested | 132 | 124 | — | — | — | — | |||||||||||||||||||||
| Cost of shares redeemed | (1,435 | ) | (1,593 | ) | — | — | — | — | |||||||||||||||||||
| Change in net assets from Class B capital transactions | $ | (790 | ) | $ | 787 | $ | — | $ | — | $ | — | $ | — | ||||||||||||||
Class C | |||||||||||||||||||||||||||
| Proceeds from shares issued | $ | 2,667 | $ | 6,191 | $ | 1,025 | $ | 4,511 | $ | — | $ | — | |||||||||||||||
| Dividends and distributions reinvested | 231 | 186 | 171 | 237 | — | — | |||||||||||||||||||||
| Cost of shares redeemed | (4,406 | ) | (3,436 | ) | (2,502 | ) | (710 | ) | — | — | |||||||||||||||||
| Redemption fees | — | — | — (a) | 1 | — | — | |||||||||||||||||||||
| Change in net assets from Class C capital transactions | $ | (1,508 | ) | $ | 2,941 | $ | (1,306 | ) | $ | 4,039 | $ | — | $ | — | |||||||||||||
Class R5 | |||||||||||||||||||||||||||
| Proceeds from shares issued | $ | — | $ | — | $ | 4,330 | $ | 14,037 | $ | — | $ | — | |||||||||||||||
| Dividends and distributions reinvested | — | — | 1,261 | 1,657 | — | — | |||||||||||||||||||||
| Cost of shares redeemed | — | — | (4,485 | ) | (935 | ) | — | — | |||||||||||||||||||
| Redemption fees | — | — | 2 | 4 | — | — | |||||||||||||||||||||
| Change in net assets from Class R5 capital transactions | $ | — | $ | — | $ | 1,108 | $ | 14,763 | $ | — | $ | — | |||||||||||||||
Select Class | |||||||||||||||||||||||||||
| Proceeds from shares issued | $ | 65,691 | $ | 716,798 | $ | 114,105 | $ | 198,351 | $ | — | $ | — | |||||||||||||||
| Dividends and distributions reinvested | 9,713 | 26,966 | 2,475 | 6,144 | — | — | |||||||||||||||||||||
| Cost of shares redeemed | (676,824 | ) | (995,991 | ) | (105,074 | ) | (54,085 | ) | �� | — | |||||||||||||||||
| Redemptions in-kind (Note 8) | (359,837 | ) | — | — | — | — | — | ||||||||||||||||||||
| Redemption fees | — | — | 20 | 38 | — | — | |||||||||||||||||||||
| Change in net assets from Select Class capital transactions | $ | (961,257 | ) | $ | (252,227 | ) | $ | 11,526 | $ | 150,448 | $ | — | $ | — | |||||||||||||
Institutional Class | |||||||||||||||||||||||||||
| Proceeds from shares issued | $ | 25,244 | $ | 166,454 | $ | — | $ | — | $ | 313 | $ | 94,077 | |||||||||||||||
| Dividends and distributions reinvested | 7,819 | 13,089 | — | — | 1,140 | 5,748 | |||||||||||||||||||||
| Cost of shares redeemed | (265,784 | ) | (205,895 | ) | — | — | (84,018 | ) | (168,365 | ) | |||||||||||||||||
| Redemptions in-kind (Note 8) | (51,776 | ) | — | — | — | — | — | ||||||||||||||||||||
| Change in net assets from Institutional Class capital transactions | $ | (284,497 | ) | $ | (26,352 | ) | $ | — | $ | — | $ | (82,565 | ) | $ | (68,540 | ) | |||||||||||
Ultra | |||||||||||||||||||||||||||
| Proceeds from shares issued | $ | 25,798 | $ | 46,145 | $ | — | $ | — | $ | — | $ | — | |||||||||||||||
| Dividends and distributions reinvested | 5,553 | 5,205 | — | — | — | — | |||||||||||||||||||||
| Cost of shares redeemed | (78,541 | ) | (27,569 | ) | — | — | — | — | |||||||||||||||||||
| Redemptions in-kind (Note 8) | (47,207 | ) | — | — | — | — | — | ||||||||||||||||||||
| Change in net assets from Ultra capital transactions | $ | (94,397 | ) | $ | 23,781 | $ | — | $ | — | $ | — | $ | — | ||||||||||||||
Total change in net assets from capital transactions | $ | (1,350,461 | ) | $ | (244,149 | ) | $ | 11,079 | $ | 175,875 | $ | (82,565 | ) | $ | (68,540 | ) | |||||||||||
| (a) | Amount rounds to less than $1,000. |
| Bond Fund | Emerging Markets Debt Fund | Enhanced Income Fund | |||||||||||||||||||||||||
|---|---|---|---|---|---|---|---|---|---|---|---|---|---|---|---|---|---|---|---|---|---|---|---|---|---|---|---|
| | Year Ended 2/28/2009 | �� | Year Ended 2/29/2008 | | Year Ended 2/28/2009 | | Year Ended 2/29/2008 | | Year Ended 2/28/2009 | | Year Ended 2/29/2008 | ||||||||||||||||
SHARE TRANSACTIONS: | |||||||||||||||||||||||||||
Class A | |||||||||||||||||||||||||||
| Issued | 859 | 2,226 | 1,093 | 1,738 | — | — | |||||||||||||||||||||
| Reinvested | 130 | 114 | 61 | 68 | — | — | |||||||||||||||||||||
| Redeemed | (2,004 | ) | (1,611 | ) | (1,397 | ) | (1,085 | ) | — | — | |||||||||||||||||
| Change in Class A Shares | (1,015 | ) | 729 | (243 | ) | 721 | — | — | |||||||||||||||||||
Class B | |||||||||||||||||||||||||||
| Issued | 73 | 247 | — | — | — | — | |||||||||||||||||||||
| Reinvested | 18 | 14 | — | — | — | — | |||||||||||||||||||||
| Redeemed | (193 | ) | (176 | ) | — | — | — | — | |||||||||||||||||||
| Change in Class B Shares | (102 | ) | 85 | — | — | — | — | ||||||||||||||||||||
Class C | |||||||||||||||||||||||||||
| Issued | 355 | 675 | 131 | 515 | — | — | |||||||||||||||||||||
| Reinvested | 31 | 21 | 23 | 28 | — | — | |||||||||||||||||||||
| Redeemed | (570 | ) | (378 | ) | (361 | ) | (83 | ) | — | — | |||||||||||||||||
| Change in Class C Shares | (184 | ) | 318 | (207 | ) | 460 | — | — | |||||||||||||||||||
Class R5 | |||||||||||||||||||||||||||
| Issued | — | — | 623 | 1,586 | — | — | |||||||||||||||||||||
| Reinvested | — | — | 177 | 193 | — | — | |||||||||||||||||||||
| Redeemed | — | — | (748 | ) | (106 | ) | — | — | |||||||||||||||||||
| Change in Class R5 Shares | — | — | 52 | 1,673 | — | — | |||||||||||||||||||||
Select Class | |||||||||||||||||||||||||||
| Issued | 7,936 | 78,063 | 16,293 | 22,695 | — | — | |||||||||||||||||||||
| Reinvested | 1,240 | 2,987 | 337 | 717 | — | — | |||||||||||||||||||||
| Redeemed | (82,575 | ) | (110,580 | ) | (16,058 | ) | (6,279 | ) | — | — | |||||||||||||||||
| Redemptions in-kind (Note 8) | (46,611 | ) | — | — | — | — | — | ||||||||||||||||||||
| Change in Select Class Shares | (120,010 | ) | (29,530 | ) | 572 | 17,133 | — | — | |||||||||||||||||||
Institutional Class | |||||||||||||||||||||||||||
| Issued | 3,033 | 18,319 | — | — | 37 | 9,634 | |||||||||||||||||||||
| Reinvested | 989 | 1,449 | — | — | 141 | 602 | |||||||||||||||||||||
| Redeemed | (34,265 | ) | (22,790 | ) | — | — | (10,507 | ) | (17,529 | ) | |||||||||||||||||
| Redemptions in-kind (Note 8) | (6,707 | ) | — | — | — | — | — | ||||||||||||||||||||
| Change in Institutional Class Shares | (36,950 | ) | (3,022 | ) | — | — | (10,329 | ) | (7,293 | ) | |||||||||||||||||
Ultra | |||||||||||||||||||||||||||
| Issued | 3,216 | 5,126 | — | — | — | — | |||||||||||||||||||||
| Reinvested | 754 | 576 | — | — | — | — | |||||||||||||||||||||
| Redeemed | (10,620 | ) | (3,082 | ) | — | — | — | — | |||||||||||||||||||
| Redemptions in-kind (Note 8) | (6,115 | ) | — | — | — | — | — | ||||||||||||||||||||
| Change in Ultra Shares | (12,765 | ) | 2,620 | — | — | — | — | ||||||||||||||||||||
FOR THE PERIODS INDICATED (continued)
| Real Return Fund | Short Term Bond Fund | Short Term Bond Fund II | |||||||||||||||||||||||||
|---|---|---|---|---|---|---|---|---|---|---|---|---|---|---|---|---|---|---|---|---|---|---|---|---|---|---|---|
| | Year Ended 2/28/2009 | | Year Ended 2/29/2008 | | Year Ended 2/28/2009 | | Year Ended 2/29/2008 | | Year Ended 2/28/2009 | | Year Ended 2/29/2008 | ||||||||||||||||
CAPITAL TRANSACTIONS: | |||||||||||||||||||||||||||
Class A | |||||||||||||||||||||||||||
| Proceeds from shares issued | $ | 11,505 | $ | 4,834 | $ | 2,048 | $ | 10,776 | $ | 1,537 | $ | 6,310 | |||||||||||||||
| Dividends and distributions reinvested | 316 | 49 | 375 | 514 | 533 | 1,118 | |||||||||||||||||||||
| Cost of shares redeemed | (6,496 | ) | (481 | ) | (7,941 | ) | (8,426 | ) | (16,779 | ) | (8,955 | ) | |||||||||||||||
| Change in net assets from Class A capital transactions | $ | 5,325 | $ | 4,402 | $ | (5,518 | ) | $ | 2,864 | $ | (14,709 | ) | $ | (1,527 | ) | ||||||||||||
Class C | |||||||||||||||||||||||||||
| Proceeds from shares issued | $ | 13,575 | $ | 3,908 | $ | — | $ | — | $ | — | $ | — | |||||||||||||||
| Dividends and distributions reinvested | 283 | 20 | — | — | — | — | |||||||||||||||||||||
| Cost of shares redeemed | (8,381 | ) | (26 | ) | — | — | — | — | |||||||||||||||||||
| Change in net assets from Class C capital transactions | $ | 5,477 | $ | 3,902 | $ | — | $ | — | $ | — | $ | — | |||||||||||||||
Class M | |||||||||||||||||||||||||||
| Proceeds from shares issued | $ | — | $ | — | $ | — | $ | — | $ | 9 | $ | 1 | |||||||||||||||
| Dividends and distributions reinvested | — | — | — | — | — | (a) | — | (a) | |||||||||||||||||||
| Cost of shares redeemed | — | — | — | — | (17,482 | ) | (28,875 | ) | |||||||||||||||||||
| Change in net assets from Class M capital transactions | $ | — | $ | — | $ | — | $ | — | $ | (17,473 | ) | $ | (28,874 | ) | |||||||||||||
Select Class | |||||||||||||||||||||||||||
| Proceeds from shares issued | $ | 4,476 | $ | 4,331 | $ | 61,453 | $ | 500,278 | $ | 211 | $ | 8,986 | |||||||||||||||
| Dividends and distributions reinvested | 2,438 | 3,530 | 884 | 3,886 | 73 | 272 | |||||||||||||||||||||
| Cost of shares redeemed | (21,227 | ) | (12,106 | ) | (563,135 | ) | (816,136 | ) | (72,998 | ) | (75,475 | ) | |||||||||||||||
| Redemptions in-kind (Note 8) | — | — | (275,799 | ) | — | — | — | ||||||||||||||||||||
| Change in net assets from Select Class capital transactions | $ | (14,313 | ) | $ | (4,245 | ) | $ | (776,597 | ) | $ | (311,972 | ) | $ | (72,714 | ) | $ | (66,217 | ) | |||||||||
Institutional Class | |||||||||||||||||||||||||||
| Proceeds from shares issued | $ | 20,317 | $ | 363 | $ | 30,453 | $ | 128,940 | $ | — | $ | — | |||||||||||||||
| Dividends and distributions reinvested | 83 | 60 | 2,213 | 11,725 | — | — | |||||||||||||||||||||
| Cost of shares redeemed | (977 | ) | — | (175,293 | ) | (352,186 | ) | — | — | ||||||||||||||||||
| Redemptions in-kind (Note 8) | — | — | (58,798 | ) | — | — | — | ||||||||||||||||||||
| Change in net assets from Institutional Class capital transactions | $ | 19,423 | $ | 423 | $ | (201,425 | ) | $ | (211,521 | ) | $ | — | $ | — | |||||||||||||
Total change in net assets from capital transactions | $ | 15,912 | $ | 4,482 | $ | (983,540 | ) | $ | (520,629 | ) | $ | (104,896 | ) | $ | (96,618 | ) | |||||||||||
| (a) | Amount rounds to less than $1,000. |
| Real Return Fund | Short Term Bond Fund | Short Term Bond Fund II | |||||||||||||||||||||||||
|---|---|---|---|---|---|---|---|---|---|---|---|---|---|---|---|---|---|---|---|---|---|---|---|---|---|---|---|
| | Year Ended 2/28/2009 | | Year Ended 2/29/2008 | | Year Ended 2/28/2009 | | Year Ended 2/29/2008 | | Year Ended 2/28/2009 | | Year Ended 2/29/2008 | ||||||||||||||||
SHARE TRANSACTIONS: | |||||||||||||||||||||||||||
Class A | �� | ||||||||||||||||||||||||||
| Issued | 1,209 | 490 | 265 | 1,148 | 164 | 642 | |||||||||||||||||||||
| Reinvested | 33 | 5 | 48 | 55 | 58 | 115 | |||||||||||||||||||||
| Redeemed | (699 | ) | (50 | ) | (1,076 | ) | (906 | ) | (1,830 | ) | (916 | ) | |||||||||||||||
| Change in Class A Shares | 543 | 445 | (763 | ) | 297 | (1,608 | ) | (159 | ) | ||||||||||||||||||
Class C | |||||||||||||||||||||||||||
| Issued | 1,394 | 397 | — | — | — | — | |||||||||||||||||||||
| Reinvested | 30 | 2 | — | — | — | — | |||||||||||||||||||||
| Redeemed | (908 | ) | (3 | ) | — | — | — | — | |||||||||||||||||||
| Change in Class C Shares | 516 | 396 | — | — | — | — | |||||||||||||||||||||
Class M | |||||||||||||||||||||||||||
| Issued | — | — | — | — | — | (a) | — | (a) | |||||||||||||||||||
| Reinvested | — | — | — | — | — | (a) | — | (a) | |||||||||||||||||||
| Redeemed | — | — | — | — | (1,910 | ) | (2,950 | ) | |||||||||||||||||||
| Change in Class M Shares | — | — | — | — | (1,910 | ) | (2,950 | ) | |||||||||||||||||||
Select Class | |||||||||||||||||||||||||||
| Issued | 458 | 460 | 7,091 | 52,766 | 23 | 914 | |||||||||||||||||||||
| Reinvested | 255 | 372 | 106 | 415 | 8 | 28 | |||||||||||||||||||||
| Redeemed | (2,334 | ) | (1,244 | ) | (64,673 | ) | (87,596 | ) | (7,969 | ) | (7,736 | ) | |||||||||||||||
| Redemptions in-kind (Note 8) | — | — | (32,032 | ) | — | — | — | ||||||||||||||||||||
| Change in Select Class Shares | (1,621 | ) | (412 | ) | (89,508 | ) | (34,415 | ) | (7,938 | ) | (6,794 | ) | |||||||||||||||
Institutional Class | |||||||||||||||||||||||||||
| Issued | 2,283 | 38 | 3,536 | 13,637 | — | — | |||||||||||||||||||||
| Reinvested | 9 | 7 | 271 | 1,250 | — | — | |||||||||||||||||||||
| Redeemed | (110 | ) | — | (20,249 | ) | (37,736 | ) | — | — | ||||||||||||||||||
| Redemptions in-kind (Note 8) | — | — | (6,837 | ) | — | — | — | ||||||||||||||||||||
| Change in Institutional Class Shares | 2,182 | 45 | (23,279 | ) | (22,849 | ) | — | — | |||||||||||||||||||
| (a) | Amount rounds to less than 1,000. |
FOR THE YEAR ENDED FEBRUARY 28, 2009
| | Bond Fund | ||||||
|---|---|---|---|---|---|---|---|
INCREASE (DECREASE) IN CASH | |||||||
Cash flows provided (used) by operating activities: | |||||||
| Net decrease in net assets from operations | $ | (162,427 | ) | ||||
Adjustments to reconcile net increase/decrease in net assets from operations to net cash provided (used) by operating activities: | |||||||
| Purchase of investment securities | (10,301,817 | ) | |||||
| Proceeds from disposition of investment securities | 13,175,112 | ||||||
| Covers of investment securities sold short | (10,866,308 | ) | |||||
| Proceeds from disposition of investment securities sold short | 9,123,532 | ||||||
| Sales of short-term investments, net | 20,182 | ||||||
| Decrease in premiums received on written options | (25,090 | ) | |||||
| Decrease in premiums paid/received on swaps | (2,468 | ) | |||||
| Unrealized appreciation/depreciation on swap contracts | 406 | ||||||
| Unrealized appreciation/depreciation on investments | (11,933 | ) | |||||
| Unrealized appreciation/depreciation on securities sold short | (224 | ) | |||||
| Unrealized appreciation/depreciation on foreign currency translations | (462 | ) | |||||
| Unrealized appreciation/depreciation on written options | (4,594 | ) | |||||
| Realized gain/loss on investments | 192,483 | ||||||
| Realized gain/loss on investment securities sold short | 2,405 | ||||||
| Realized gain/loss on swap contracts | 10,718 | ||||||
| Realized gain/loss on written options | (207 | ) | |||||
| Decrease in deposits with broker for futures contracts | (160 | ) | |||||
| Increase in due from Advisor and Affiliates | (24 | ) | |||||
| Decrease in receivable for investments sold | 3,154,774 | ||||||
| Decrease in interest and dividends receivable | 13,291 | ||||||
| Decrease in variation margin receivable | 10,439 | ||||||
| Decrease in payable for investments purchased | (3,299,066 | ) | |||||
| Decrease in dividends and distributions payable | (2,665 | ) | |||||
| Decrease in variation margin payable | (7,653 | ) | |||||
| Decrease in accrued expenses and other liabilities | (801 | ) | |||||
| Net (amortization)/accretion of income | (11 | ) | |||||
| Net cash provided (used) by operating activities | 1,017,432 | ||||||
Cash flows provided (used) by financing activities: | |||||||
| Net proceeds from shares issued | 130,346 | ||||||
| Net cost of shares redeemed | (1,135,229 | ) | |||||
| Cash distributions paid to shareholders (net of reinvestments of $24,412) | (15,351 | ) | |||||
| Net cash provided (used) by financing activities | (1,020,234 | ) | |||||
| Net decrease in cash | (2,802 | ) | |||||
Cash: | |||||||
| Beginning of period (including foreign currency of $891) | 2,817 | ||||||
| End of period (including foreign currency of $7) | $ | 15 | |||||
FOR THE PERIODS INDICATED
| | | | | Per share operating performance | | ||||||||||||||||||||||||||||||
|---|---|---|---|---|---|---|---|---|---|---|---|---|---|---|---|---|---|---|---|---|---|---|---|---|---|---|---|---|---|---|---|---|---|---|---|
| Investment operations | Distributions | ||||||||||||||||||||||||||||||||||
| | Net asset value, beginning of period | | Net investment income (loss) | | Net realized and unrealized gains (losses) on investments | | Total from investment operations | | Net investment income | | Net realized gains | | Tax return of capital | | Total distributions | ||||||||||||||||||||
Bond Fund | |||||||||||||||||||||||||||||||||||
Class A | |||||||||||||||||||||||||||||||||||
| Year Ended February 28, 2009 | $ | 8.87 | $ | 0.43 | (f) | $ | (2.47 | ) | $ | (2.04 | ) | $ | (0.53 | ) | $ | — | $ | — | $ | (0.53 | ) | ||||||||||||||
| Year Ended February 29, 2008 | 9.40 | 0.47 | (0.54 | ) | (0.07 | ) | (0.46 | ) | — | — | (0.46 | ) | |||||||||||||||||||||||
| September 1, 2006 through February 28, 2007 (e) | 9.29 | 0.22 | 0.12 | 0.34 | (0.23 | ) | — | — | (0.23 | ) | |||||||||||||||||||||||||
| Year Ended August 31, 2006 | 9.85 | 0.41 | (0.28 | ) | 0.13 | (0.42 | ) | (0.27 | ) | — | (0.69 | ) | |||||||||||||||||||||||
| Year Ended August 31, 2005 | 10.05 | 0.36 | 0.13 | 0.49 | (0.39 | ) | (0.30 | ) | — | (0.69 | ) | ||||||||||||||||||||||||
| Year Ended August 31, 2004 | 10.03 | 0.32 | 0.32 | 0.64 | (0.32 | ) | (0.30 | ) | — | (0.62 | ) | ||||||||||||||||||||||||
Class B | |||||||||||||||||||||||||||||||||||
| Year Ended February 28, 2009 | 8.80 | 0.37 | (f) | (2.44 | ) | (2.07 | ) | (0.48 | ) | — | — | (0.48 | ) | ||||||||||||||||||||||
| Year Ended February 29, 2008 | 9.34 | 0.41 | (0.55 | ) | (0.14 | ) | (0.40 | ) | — | — | (0.40 | ) | |||||||||||||||||||||||
| September 1, 2006 through February 28, 2007 (e) | 9.23 | 0.19 | 0.12 | 0.31 | (0.20 | ) | — | — | (0.20 | ) | |||||||||||||||||||||||||
| Year Ended August 31, 2006 | 9.78 | 0.36 | (0.28 | ) | 0.08 | (0.36 | ) | (0.27 | ) | — | (0.63 | ) | |||||||||||||||||||||||
| Year Ended August 31, 2005 | 9.97 | 0.29 | 0.12 | 0.41 | (0.30 | ) | (0.30 | ) | — | (0.60 | ) | ||||||||||||||||||||||||
| Year Ended August 31, 2004 | 9.95 | 0.25 | 0.32 | 0.57 | (0.25 | ) | (0.30 | ) | — | (g) | (0.55 | ) | |||||||||||||||||||||||
Class C | |||||||||||||||||||||||||||||||||||
| Year Ended February 28, 2009 | 8.85 | 0.37 | (f) | (2.45 | ) | (2.08 | ) | (0.48 | ) | — | — | (0.48 | ) | ||||||||||||||||||||||
| Year Ended February 29, 2008 | 9.39 | 0.42 | (0.56 | ) | (0.14 | ) | (0.40 | ) | — | — | (0.40 | ) | |||||||||||||||||||||||
| September 1, 2006 through February 28, 2007 (e) | 9.27 | 0.19 | 0.13 | 0.32 | (0.20 | ) | — | — | (0.20 | ) | |||||||||||||||||||||||||
| Year Ended August 31, 2006 | 9.83 | 0.32 | (0.25 | ) | 0.07 | (0.36 | ) | (0.27 | ) | — | (0.63 | ) | |||||||||||||||||||||||
| Year Ended August 31, 2005 | 10.03 | 0.28 | 0.12 | 0.40 | (0.30 | ) | (0.30 | ) | — | (0.60 | ) | ||||||||||||||||||||||||
| Year Ended August 31, 2004 | 10.01 | 0.24 | 0.33 | 0.57 | (0.25 | ) | (0.30 | ) | — | (0.55 | ) | ||||||||||||||||||||||||
Select Class | |||||||||||||||||||||||||||||||||||
| Year Ended February 28, 2009 | 8.78 | 0.47 | (f) | (2.49 | ) | (2.02 | ) | (0.53 | ) | — | — | (0.53 | ) | ||||||||||||||||||||||
| Year Ended February 29, 2008 | 9.31 | 0.48 | (0.54 | ) | (0.06 | ) | (0.47 | ) | — | — | (0.47 | ) | |||||||||||||||||||||||
| September 1, 2006 through February 28, 2007 (e) | 9.20 | 0.23 | 0.12 | 0.35 | (0.24 | ) | — | — | (0.24 | ) | |||||||||||||||||||||||||
| Year Ended August 31, 2006 | 9.76 | 0.42 | (0.28 | ) | 0.14 | (0.43 | ) | (0.27 | ) | — | (0.70 | ) | |||||||||||||||||||||||
| Year Ended August 31, 2005 | 9.97 | 0.36 | 0.13 | 0.49 | (0.40 | ) | (0.30 | ) | — | (0.70 | ) | ||||||||||||||||||||||||
| Year Ended August 31, 2004 | 9.94 | 0.33 | 0.33 | 0.66 | (0.33 | ) | (0.30 | ) | — | (0.63 | ) | ||||||||||||||||||||||||
Institutional Class | |||||||||||||||||||||||||||||||||||
| Year Ended February 28, 2009 | 8.77 | 0.46 | (f) | (2.45 | ) | (1.99 | ) | (0.55 | ) | — | — | (0.55 | ) | ||||||||||||||||||||||
| Year Ended February 29, 2008 | 9.31 | 0.50 | (0.56 | ) | (0.06 | ) | (0.48 | ) | — | — | (0.48 | ) | |||||||||||||||||||||||
| September 1, 2006 through February 28, 2007 (e) | 9.19 | 0.22 | 0.14 | 0.36 | (0.24 | ) | — | — | (0.24 | ) | |||||||||||||||||||||||||
| Year Ended August 31, 2006 | 9.75 | 0.46 | (0.31 | ) | 0.15 | (0.44 | ) | (0.27 | ) | — | (0.71 | ) | |||||||||||||||||||||||
| Year Ended August 31, 2005 | 9.96 | 0.38 | 0.13 | 0.51 | (0.42 | ) | (0.30 | ) | — | (0.72 | ) | ||||||||||||||||||||||||
| Year Ended August 31, 2004 | 9.94 | 0.35 | 0.32 | 0.67 | (0.35 | ) | (0.30 | ) | — | (0.65 | ) | ||||||||||||||||||||||||
Ultra | |||||||||||||||||||||||||||||||||||
| Year Ended February 28, 2009 | 8.77 | 0.46 | (f) | (2.45 | ) | (1.99 | ) | (0.55 | ) | — | — | (0.55 | ) | ||||||||||||||||||||||
| Year Ended February 29, 2008 | 9.31 | 0.51 | (0.56 | ) | (0.05 | ) | (0.49 | ) | — | — | (0.49 | ) | |||||||||||||||||||||||
| September 1, 2006 through February 28, 2007 (e) | 9.20 | 0.24 | 0.12 | 0.36 | (0.25 | ) | — | — | (0.25 | ) | |||||||||||||||||||||||||
| Year Ended August 31, 2006 | 9.76 | 0.48 | (0.32 | ) | 0.16 | (0.45 | ) | (0.27 | ) | — | (0.72 | ) | |||||||||||||||||||||||
| Year Ended August 31, 2005 | 9.97 | 0.32 | 0.20 | 0.52 | (0.43 | ) | (0.30 | ) | — | (0.73 | ) | ||||||||||||||||||||||||
| Year Ended August 31, 2004 | 9.95 | 0.36 | 0.32 | 0.68 | (0.36 | ) | (0.30 | ) | — | (0.66 | ) | ||||||||||||||||||||||||
| (a) | Annualized for periods less than one year. |
| (b) | Not annualized for periods less than one year. |
| (c) | Includes adjustments in accordance with accounting principles generally accepted in the United States of America and as such, the net asset value for financial reporting purposes and the returns based upon those net asset values may differ from the net asset value and returns for shareholder transactions. |
| (d) | Includes earnings credits and interest expense, each of which is less than 0.01%, if applicable or unless otherwise noted. |
| (e) | The Fund changed its fiscal year end from August 31 to the last day in February. |
| (f) | Calculated based on average shares outstanding. |
| (g) | Amount rounds to less than $0.01. |
| (h) | An affiliate of JPMorgan Chase & Co. reimbursed the Fund for losses incurred from an operational error. Without this payment, the total return for Class A, Class B, Class C, Select Class, Institutional Class and Ultra would have been (23.81)%, (24.27)%, (24.24)%, (23.75)%, (23.65)% and (23.59)%, respectively, and the net realized and unrealized gains (losses) on investments per share for Class B, Class C, Institutional Class and Ultra would have been $(2.45), $(2.46), $(2.47) and $(2.46), respectively. There was no impact to the net realized and unrealized gains (losses) on investments per share for Class A and Select Class. |
| | Ratios/Supplemental data | | |||||||||||||||||||||||||
|---|---|---|---|---|---|---|---|---|---|---|---|---|---|---|---|---|---|---|---|---|---|---|---|---|---|---|---|
| Ratios to average net assets (a) | |||||||||||||||||||||||||||
| Net asset value, end of period | | Total return (excludes sales charge) (b)(c) | | Net assets end of period (000’s) | | Net expenses (d) | | Net investment income (loss) | | Expenses without waivers, reimbursements and earnings credits | | Portfolio turnover rate (b) | |||||||||||||||
| $6.30 | (23.69 | )%(h) | $ | 11,780 | 0.75 | % | 5.57 | % | 1.12 | % | 744 | % | |||||||||||||||
| 8.87 | (0.82 | ) | 25,579 | 0.75 | 5.22 | 0.97 | 821 | ||||||||||||||||||||
| 9.40 | 3.72 | 20,271 | 0.75 | 4.89 | 0.95 | 357 | |||||||||||||||||||||
| 9.29 | 1.42 | 13,632 | 0.75 | 4.55 | 0.97 | 711 | |||||||||||||||||||||
| 9.85 | 5.06 | 5,963 | 0.75 | 3.63 | 1.31 | 559 | |||||||||||||||||||||
| 10.05 | 6.61 | 3,004 | 0.75 | 3.19 | 1.88 | 571 | |||||||||||||||||||||
| 6.25 | (24.14 | )(h) | 2,279 | 1.40 | 4.92 | 1.62 | 744 | ||||||||||||||||||||
| 8.80 | (1.58 | ) | 4,113 | 1.40 | 4.56 | 1.47 | 821 | ||||||||||||||||||||
| 9.34 | 3.42 | 3,564 | 1.40 | 4.23 | 1.45 | 357 | |||||||||||||||||||||
| 9.23 | 0.90 | 2,814 | 1.40 | 3.99 | 1.47 | 711 | |||||||||||||||||||||
| 9.78 | 4.23 | 2,283 | 1.44 | 2.93 | 1.90 | 559 | |||||||||||||||||||||
| 9.97 | 5.89 | 1,972 | 1.50 | 2.48 | 2.36 | 571 | |||||||||||||||||||||
| 6.29 | (24.12 | )(h) | 4,285 | 1.40 | 4.91 | 1.62 | 744 | ||||||||||||||||||||
| 8.85 | (1.54 | ) | 7,659 | 1.40 | 4.57 | 1.47 | 821 | ||||||||||||||||||||
| 9.39 | 3.53 | 5,146 | 1.40 | 4.26 | 1.45 | 357 | |||||||||||||||||||||
| 9.27 | 0.87 | 2,574 | 1.39 | 3.90 | 1.46 | 711 | |||||||||||||||||||||
| 9.83 | 4.13 | 425 | 1.42 | 2.96 | 1.82 | 559 | |||||||||||||||||||||
| 10.03 | 5.84 | 211 | 1.50 | 2.45 | 2.36 | 571 | |||||||||||||||||||||
| 6.23 | (23.63 | )(h) | 45,314 | 0.65 | 5.74 | 0.76 | 744 | ||||||||||||||||||||
| 8.78 | (0.71 | ) | 1,116,991 | 0.65 | 5.31 | 0.71 | 821 | ||||||||||||||||||||
| 9.31 | 3.81 | 1,459,959 | 0.65 | 4.97 | 0.70 | 357 | |||||||||||||||||||||
| 9.20 | 1.55 | 1,310,157 | 0.65 | 4.69 | 0.71 | 711 | |||||||||||||||||||||
| 9.76 | 5.12 | 202,659 | 0.66 | 3.72 | 0.74 | 559 | |||||||||||||||||||||
| 9.97 | 6.88 | 188,775 | 0.66 | 3.33 | 0.78 | 571 | |||||||||||||||||||||
| 6.23 | (23.40 | )(h) | 17,873 | 0.49 | 5.75 | 0.62 | 744 | ||||||||||||||||||||
| 8.77 | (0.68 | ) | 349,342 | 0.49 | 5.47 | 0.56 | 821 | ||||||||||||||||||||
| 9.31 | 3.99 | 398,771 | 0.49 | 5.15 | 0.55 | 357 | |||||||||||||||||||||
| 9.19 | 1.70 | 265,279 | 0.49 | 4.91 | 0.58 | 711 | |||||||||||||||||||||
| 9.75 | 5.33 | 259,697 | 0.49 | 3.85 | 0.59 | 559 | |||||||||||||||||||||
| 9.96 | 6.96 | 318,100 | 0.49 | 3.51 | 0.62 | 571 | |||||||||||||||||||||
| 6.23 | (23.34 | )(h) | 45,368 | 0.40 | 5.88 | 0.58 | 744 | ||||||||||||||||||||
| 8.77 | (0.56 | ) | 175,866 | 0.40 | 5.56 | 0.47 | 821 | ||||||||||||||||||||
| 9.31 | 3.95 | 162,248 | 0.40 | 5.23 | 0.45 | 357 | |||||||||||||||||||||
| 9.20 | 1.80 | 145,624 | 0.40 | 5.00 | 0.48 | 711 | |||||||||||||||||||||
| 9.76 | 5.45 | 126,272 | 0.40 | 3.90 | 0.51 | 559 | |||||||||||||||||||||
| 9.97 | 7.05 | 380,794 | 0.40 | 3.59 | 0.56 | 571 | |||||||||||||||||||||
FOR THE PERIODS INDICATED (continued)
| | | | | Per share operating performance | | ||||||||||||||||||||||||||||||
|---|---|---|---|---|---|---|---|---|---|---|---|---|---|---|---|---|---|---|---|---|---|---|---|---|---|---|---|---|---|---|---|---|---|---|---|
| Investment operations | Distributions | ||||||||||||||||||||||||||||||||||
| | Net asset value, beginning of period | | Net investment income (loss) | | Net realized and unrealized gains (losses) on investments | | Total from investment operations | | Net investment income | | Net realized gains | | Tax return of capital | | Total distributions | ||||||||||||||||||||
Emerging Markets Debt Fund | |||||||||||||||||||||||||||||||||||
Class A | |||||||||||||||||||||||||||||||||||
| Year Ended February 28, 2009 | $ | 8.41 | $ | 0.55 | $ | (2.97 | ) | $ | (2.42 | ) | $ | (0.43 | ) | $ | — | $ | — | $ | (0.43 | ) | |||||||||||||||
| Year Ended February 29, 2008 | 8.73 | 0.54 | (0.18 | ) | 0.36 | (0.53 | ) | (0.15 | ) | — | (0.68 | ) | |||||||||||||||||||||||
| September 1, 2006 through February 28, 2007 (e) | 8.39 | 0.21 | 0.37 | 0.58 | (0.21 | ) | (0.03 | ) | — | (0.24 | ) | ||||||||||||||||||||||||
| June 30, 2006 (f) through August 31, 2006 | 7.93 | 0.08 | 0.46 | 0.54 | (0.08 | ) | — | — | (0.08 | ) | |||||||||||||||||||||||||
Class C | |||||||||||||||||||||||||||||||||||
| Year Ended February 28, 2009 | 8.40 | 0.50 | (2.95 | ) | (2.45 | ) | (0.40 | ) | — | — | (0.40 | ) | |||||||||||||||||||||||
| Year Ended February 29, 2008 | 8.73 | 0.50 | (0.19 | ) | 0.31 | (0.49 | ) | (0.15 | ) | — | (0.64 | ) | |||||||||||||||||||||||
| September 1, 2006 through February 28, 2007 (e) | 8.39 | 0.20 | 0.36 | 0.56 | (0.19 | ) | (0.03 | ) | — | (0.22 | ) | ||||||||||||||||||||||||
| June 30, 2006 (f) through August 31, 2006 | 7.93 | 0.07 | 0.47 | 0.54 | (0.08 | ) | — | — | (0.08 | ) | |||||||||||||||||||||||||
Class R5 | |||||||||||||||||||||||||||||||||||
| Year Ended February 28, 2009 | 8.42 | 0.56 | (2.96 | ) | (2.40 | ) | (0.46 | ) | — | — | (0.46 | ) | |||||||||||||||||||||||
| Year Ended February 29, 2008 | 8.73 | 0.60 | (0.19 | ) | 0.41 | (0.57 | ) | (0.15 | ) | — | (0.72 | ) | |||||||||||||||||||||||
| September 1, 2006 through February 28, 2007 (e) | 8.39 | 0.24 | 0.36 | 0.60 | (0.23 | ) | (0.03 | ) | — | (0.26 | ) | ||||||||||||||||||||||||
| May 15, 2006 (f) through August 31, 2006 | 8.07 | 0.14 | 0.33 | 0.47 | (0.15 | ) | — | — | (0.15 | ) | |||||||||||||||||||||||||
Select Class | |||||||||||||||||||||||||||||||||||
| Year Ended February 28, 2009 | 8.42 | 0.54 | (2.95 | ) | (2.41 | ) | (0.45 | ) | — | — | (0.45 | ) | |||||||||||||||||||||||
| Year Ended February 29, 2008 | 8.74 | 0.56 | (0.18 | ) | 0.38 | (0.55 | ) | (0.15 | ) | — | (0.70 | ) | |||||||||||||||||||||||
| September 1, 2006 through February 28, 2007 (e) | 8.39 | 0.21 | 0.39 | 0.60 | (0.22 | ) | (0.03 | ) | — | (0.25 | ) | ||||||||||||||||||||||||
| Year Ended August 31, 2006 | 9.29 | 0.45 | 0.42 | 0.87 | (0.46 | ) | (1.35 | ) | — | (1.81 | ) | ||||||||||||||||||||||||
| Year Ended August 31, 2005 | 9.58 | 0.61 | 1.08 | 1.69 | (0.67 | ) | (1.31 | ) | — | (1.98 | ) | ||||||||||||||||||||||||
| Year Ended August 31, 2004 | 9.02 | 0.67 | 0.60 | 1.27 | (0.71 | ) | — | — | (0.71 | ) | |||||||||||||||||||||||||
Enhanced Income Fund | |||||||||||||||||||||||||||||||||||
Institutional Class | |||||||||||||||||||||||||||||||||||
| Year Ended February 28, 2009 | 8.99 | 0.22 | (2.38 | ) | (2.16 | ) | (0.31 | ) | — | — | (0.31 | ) | |||||||||||||||||||||||
| Year Ended February 29, 2008 | 9.75 | 0.53 | (0.76 | ) | (0.23 | ) | (0.51 | ) | — | (0.02 | ) | (0.53 | ) | ||||||||||||||||||||||
| September 1, 2006 through February 28, 2007 (e) | 9.76 | 0.27 | (0.01 | ) | 0.26 | (0.27 | ) | — | — | (0.27 | ) | ||||||||||||||||||||||||
| Year Ended August 31, 2006 | 9.82 | 0.50 | (0.06 | ) | 0.44 | (0.50 | ) | — | — | (0.50 | ) | ||||||||||||||||||||||||
| Year Ended August 31, 2005 | 9.84 | 0.28 | (0.02 | ) | 0.26 | (0.28 | ) | — | — | (0.28 | ) | ||||||||||||||||||||||||
| Year Ended August 31, 2004 | 9.86 | 0.14 | (0.02 | ) | 0.12 | (0.14 | ) | — | — | (0.14 | ) | ||||||||||||||||||||||||
| (a) | Annualized for periods less than one year. |
| (b) | Not annualized for periods less than one year. |
| (c) | Includes adjustments in accordance with accounting principles generally accepted in the United States of America and as such, the net asset value for financial reporting purposes and the returns based upon those net asset values may differ from the net asset value and returns for shareholder transactions. |
| (d) | Includes earnings credits and interest expense, each of which is less than 0.01%, if applicable or unless otherwise noted. |
| (e) | The Fund changed its fiscal year end from August 31 to the last day in February. |
| (f) | Commencement of offering of class of shares. |
| (g) | Amount rounds to less than $0.01. |
| (h) | Voluntary contribution from Advisor. The total return without the voluntary contribution would have been 10.46%. |
| (i) | Includes interest expense of 0.01%. |
| Ratios/Supplemental data | | |||||||||||||||||||||||||||||||||||
|---|---|---|---|---|---|---|---|---|---|---|---|---|---|---|---|---|---|---|---|---|---|---|---|---|---|---|---|---|---|---|---|---|---|---|---|---|
| Ratios to average net assets (a) | ||||||||||||||||||||||||||||||||||||
| Contribution from affiliate | | Redemption fees | | Net asset value, end of period | | Total return (excludes sales charge) (b)(c) | | Net assets end of period (000’s) | | Net expenses (d) | | Net investment income (loss) | | Expenses without waivers, reimbursements and earnings credits | | Portfolio turnover rate (b) | ||||||||||||||||||||
| $— | $ | — | (g) | $ | 5.56 | (29.80 | )% | $ | 4,025 | 1.45 | % | 7.18 | % | 1.46 | % | 63 | % | |||||||||||||||||||
| — | — | (g) | 8.41 | 4.22 | 8,140 | 1.47 | 7.22 | 1.47 | 80 | |||||||||||||||||||||||||||
| — | — | (g) | 8.73 | 6.96 | 2,154 | 1.50 | 5.20 | 1.59 | 68 | |||||||||||||||||||||||||||
| — | — | (g) | 8.39 | 6.82 | 41 | 1.50 | 6.17 | 1.71 | 270 | |||||||||||||||||||||||||||
| — | — | (g) | 5.55 | (30.18 | ) | 2,253 | 1.95 | 6.60 | 1.96 | 63 | ||||||||||||||||||||||||||
| — | — | (g) | 8.40 | 3.63 | 5,154 | 1.97 | 6.50 | 1.98 | 80 | |||||||||||||||||||||||||||
| — | — | (g) | 8.73 | 6.73 | 1,332 | 2.00 | 4.66 | 2.09 | 68 | |||||||||||||||||||||||||||
| — | — | (g) | 8.39 | 6.77 | 27 | 2.00 | 5.87 | 2.20 | 270 | |||||||||||||||||||||||||||
| — | — | (g) | 5.56 | (29.54 | ) | 15,046 | 1.01 | 7.77 | 1.03 | 63 | ||||||||||||||||||||||||||
| — | — | (g) | 8.42 | 4.79 | 22,347 | 1.02 | 7.25 | 1.03 | 80 | |||||||||||||||||||||||||||
| — | — | (g) | 8.73 | 7.15 | 8,571 | 1.05 | 5.42 | 1.14 | 68 | |||||||||||||||||||||||||||
| — | — | (g) | 8.39 | 5.88 | 2,426 | 1.05 | 7.23 | 1.23 | 270 | |||||||||||||||||||||||||||
| — | — | (g) | 5.56 | (29.67 | ) | 178,209 | 1.21 | 7.55 | 1.23 | 63 | ||||||||||||||||||||||||||
| — | — | (g) | 8.42 | 4.48 | 265,081 | 1.22 | 7.10 | 1.23 | 80 | |||||||||||||||||||||||||||
| — | — | (g) | 8.74 | 7.17 | 125,421 | 1.25 | 4.98 | 1.35 | 68 | |||||||||||||||||||||||||||
| 0.04 | (h) | — | (g) | 8.39 | 10.99 | (h) | 117,423 | 1.26 | (i) | 5.77 | 1.42 | 270 | ||||||||||||||||||||||||
| — | — | (g) | 9.29 | 19.87 | 34,448 | 1.25 | 6.56 | 1.72 | 337 | |||||||||||||||||||||||||||
| — | — | 9.58 | 14.56 | 36,145 | 1.26 | (i) | 7.01 | 1.65 | 166 | |||||||||||||||||||||||||||
| — | — | 6.52 | (24.51 | ) | 7,491 | 0.20 | 3.36 | 0.70 | 151 | |||||||||||||||||||||||||||
| — | — | 8.99 | (2.53 | ) | 103,178 | 0.20 | 5.37 | 0.56 | 269 | |||||||||||||||||||||||||||
| — | — | 9.75 | 2.66 | 183,102 | 0.20 | 5.53 | 0.55 | 44 | ||||||||||||||||||||||||||||
| — | — | 9.76 | 4.61 | 131,238 | 0.20 | 5.04 | 0.57 | 264 | ||||||||||||||||||||||||||||
| — | — | 9.82 | 2.69 | 163,344 | 0.20 | 2.66 | 0.56 | 128 | ||||||||||||||||||||||||||||
| — | — | 9.84 | 1.28 | 293,752 | 0.20 | 1.47 | 0.56 | 156 | ||||||||||||||||||||||||||||
FOR THE PERIODS INDICATED (continued)
| | | Per share operating performance | | ||||||||||||||||||||
|---|---|---|---|---|---|---|---|---|---|---|---|---|---|---|---|---|---|---|---|---|---|---|---|
| Investment operations | Distributions | ||||||||||||||||||||||
| | Net asset value, beginning of period | | Net investment income (loss) | | Net realized and unrealized gains (losses) on investments | | Total from investment operations | | Net investment income | ||||||||||||||
Real Return Fund | |||||||||||||||||||||||
Class A | |||||||||||||||||||||||
| Year Ended February 28, 2009 | $ | 10.13 | $ | 0.22 | $ | (1.33 | ) | $ | (1.11 | ) | $ | (0.39 | ) | ||||||||||
| Year Ended February 29, 2008 | 9.52 | 0.54 | 0.58 | 1.12 | (0.51 | ) | |||||||||||||||||
| September 1, 2006 through February 28, 2007 (e) | 9.51 | 0.04 | 0.03 | 0.07 | (0.06 | ) | |||||||||||||||||
| Year Ended August 31, 2006 (f) | 10.00 | 0.42 | (0.46 | ) | (0.04 | ) | (0.45 | ) | |||||||||||||||
Class C | |||||||||||||||||||||||
| Year Ended February 28, 2009 | 10.08 | 0.16 | (1.30 | ) | (1.14 | ) | (0.36 | ) | |||||||||||||||
| Year Ended February 29, 2008 | 9.49 | 0.50 | 0.57 | 1.07 | (0.48 | ) | |||||||||||||||||
| September 1, 2006 through February 28, 2007 (e) | 9.50 | 0.02 | 0.02 | 0.04 | (0.05 | ) | |||||||||||||||||
| Year Ended August 31, 2006 (f) | 10.00 | 0.41 | (0.50 | ) | (0.09 | ) | (0.41 | ) | |||||||||||||||
Select Class | |||||||||||||||||||||||
| Year Ended February 28, 2009 | 10.16 | 0.19 | (1.29 | ) | (1.10 | ) | (0.40 | ) | |||||||||||||||
| Year Ended February 29, 2008 | 9.54 | 0.52 | 0.63 | 1.15 | (0.53 | ) | |||||||||||||||||
| September 1, 2006 through February 28, 2007 (e) | 9.53 | 0.06 | 0.02 | 0.08 | (0.07 | ) | |||||||||||||||||
| Year Ended August 31, 2006 (f) | 10.00 | 0.48 | (0.49 | ) | (0.01 | ) | (0.46 | ) | |||||||||||||||
Institutional Class | |||||||||||||||||||||||
| Year Ended February 28, 2009 | 10.17 | 0.07 | (1.15 | ) | (1.08 | ) | (0.41 | ) | |||||||||||||||
| Year Ended February 29, 2008 | 9.55 | 0.54 | 0.63 | 1.17 | (0.55 | ) | |||||||||||||||||
| September 1, 2006 through February 28, 2007 (e) | 9.53 | 0.06 | 0.03 | 0.09 | (0.07 | ) | |||||||||||||||||
| Year Ended August 31, 2006 (f) | 10.00 | 0.49 | (0.49 | ) | — | (0.47 | ) | ||||||||||||||||
Short Term Bond Fund | |||||||||||||||||||||||
Class A | |||||||||||||||||||||||
| Year Ended February 28, 2009 | 9.19 | 0.41 | (g) | (2.85 | ) | (2.44 | ) | (0.54 | ) | ||||||||||||||
| Year Ended February 29, 2008 | 9.52 | 0.44 | (0.32 | ) | 0.12 | (0.45 | ) | ||||||||||||||||
| September 1, 2006 through February 28, 2007 (e) | 9.50 | 0.22 | 0.03 | 0.25 | (0.23 | ) | |||||||||||||||||
| Year Ended August 31, 2006 | 9.64 | 0.42 | (0.15 | ) | 0.27 | (0.41 | ) | ||||||||||||||||
| Year Ended August 31, 2005 | 9.84 | 0.31 | (0.19 | ) | 0.12 | (0.32 | ) | ||||||||||||||||
| Year Ended August 31, 2004 | 9.85 | 0.20 | (0.01 | ) | 0.19 | (0.20 | ) | ||||||||||||||||
Select Class | |||||||||||||||||||||||
| Year Ended February 28, 2009 | 9.20 | 0.40 | (g) | (2.84 | ) | (2.44 | ) | (0.55 | ) | ||||||||||||||
| Year Ended February 29, 2008 | 9.53 | 0.46 | (0.32 | ) | 0.14 | (0.47 | ) | ||||||||||||||||
| September 1, 2006 through February 28, 2007 (e) | 9.51 | 0.23 | 0.03 | 0.26 | (0.24 | ) | |||||||||||||||||
| Year Ended August 31, 2006 | 9.64 | 0.44 | (0.14 | ) | 0.30 | (0.43 | ) | ||||||||||||||||
| Year Ended August 31, 2005 | 9.84 | 0.32 | (0.17 | ) | 0.15 | (0.35 | ) | ||||||||||||||||
| Year Ended August 31, 2004 | 9.86 | 0.22 | (0.02 | ) | 0.20 | (0.22 | ) | ||||||||||||||||
Institutional Class | |||||||||||||||||||||||
| Year Ended February 28, 2009 | 9.19 | 0.42 | (g) | (2.83 | ) | (2.41 | ) | (0.57 | ) | ||||||||||||||
| Year Ended February 29, 2008 | 9.53 | 0.52 | (0.37 | ) | 0.15 | (0.49 | ) | ||||||||||||||||
| September 1, 2006 through February 28, 2007 (e) | 9.51 | 0.24 | 0.03 | 0.27 | (0.25 | ) | |||||||||||||||||
| Year Ended August 31, 2006 | 9.64 | 0.48 | (0.15 | ) | 0.33 | (0.46 | ) | ||||||||||||||||
| Year Ended August 31, 2005 | 9.85 | 0.36 | (0.19 | ) | 0.17 | (0.38 | ) | ||||||||||||||||
| Year Ended August 31, 2004 | 9.86 | 0.25 | (0.02 | ) | 0.23 | (0.24 | ) | ||||||||||||||||
| (a) | Annualized for periods less than one year. |
| (b) | Not annualized for periods less than one year. |
| (c) | Includes adjustments in accordance with accounting principles generally accepted in the United States of America and as such, the net asset value for financial reporting purposes and the returns based upon those net asset values may differ from the net asset value and returns for shareholder transactions. |
| (d) | Includes earnings credits and interest expense, each of which is less than 0.01%, if applicable or unless otherwise noted. |
| (e) | The Fund changed its fiscal year end from August 31 to the last day in February. |
| (f) | Commencement of operations was September 1, 2005. |
| (g) | Calculated based on average shares outstanding. |
| (h) | Includes interest expense of 0.01%. |
| | Ratios/Supplemental data | | |||||||||||||||||||||||||
|---|---|---|---|---|---|---|---|---|---|---|---|---|---|---|---|---|---|---|---|---|---|---|---|---|---|---|---|
| Ratios to average net assets (a) | |||||||||||||||||||||||||||
| Net asset value, end of period | | Total return (excludes sales charge) (b)(c) | | Net assets end of period (000’s) | | Net expenses (d) | | Net investment income (loss) | | Expenses without waivers, reimbursements and earnings credits | | Portfolio turnover rate (b) | |||||||||||||||
| $8.63 | (11.29 | )% | $ | 9,090 | 0.91 | %(h) | 2.26 | % | 1.48 | % | 335 | % | |||||||||||||||
| 10.13 | 12.30 | 5,171 | 0.90 | 4.60 | 1.92 | 494 | |||||||||||||||||||||
| 9.52 | 0.78 | 630 | 0.90 | 0.85 | 1.34 | 154 | |||||||||||||||||||||
| 9.51 | (0.33 | ) | 584 | 0.90 | 3.96 | 1.45 | 223 | ||||||||||||||||||||
| 8.58 | (11.64 | ) | 7,848 | 1.41 | (h) | 2.39 | 1.97 | 335 | |||||||||||||||||||
| 10.08 | 11.71 | 4,023 | 1.40 | 3.36 | 2.75 | 494 | |||||||||||||||||||||
| 9.49 | 0.48 | 27 | 1.40 | 0.41 | 1.85 | 154 | |||||||||||||||||||||
| 9.50 | (0.80 | ) | 24 | 1.40 | 4.58 | 1.95 | 223 | ||||||||||||||||||||
| 8.66 | (11.11 | ) | 38,458 | 0.66 | (h) | 2.66 | 1.23 | 335 | |||||||||||||||||||
| 10.16 | 12.63 | 61,551 | 0.65 | 5.50 | 1.31 | 494 | |||||||||||||||||||||
| 9.54 | 0.83 | 61,757 | 0.65 | 1.18 | 1.09 | 154 | |||||||||||||||||||||
| 9.53 | 0.01 | 58,882 | 0.65 | 5.20 | 1.21 | 223 | |||||||||||||||||||||
| 8.68 | (10.90 | ) | 24,870 | 0.51 | (h) | (5.77 | ) | 1.11 | 335 | ||||||||||||||||||
| 10.17 | 12.79 | 6,950 | 0.50 | 5.60 | 1.18 | 494 | |||||||||||||||||||||
| 9.55 | 0.96 | 6,109 | 0.50 | 1.22 | 0.94 | 154 | |||||||||||||||||||||
| 9.53 | 0.12 | 944 | 0.50 | 7.35 | 0.98 | 223 | |||||||||||||||||||||
| 6.21 | (27.35 | ) | 2,657 | 0.75 | 5.00 | 1.12 | 420 | ||||||||||||||||||||
| 9.19 | 1.26 | 10,944 | 0.75 | 4.69 | 0.90 | 506 | |||||||||||||||||||||
| 9.52 | 2.64 | 8,510 | 0.75 | 4.77 | 0.89 | 143 | |||||||||||||||||||||
| 9.50 | 2.93 | 5,819 | 0.75 | 4.49 | 0.91 | 540 | |||||||||||||||||||||
| 9.64 | 1.29 | 3,393 | 0.75 | 3.20 | 1.21 | 194 | |||||||||||||||||||||
| 9.84 | 1.92 | 3,000 | 0.75 | 2.00 | 1.17 | 261 | |||||||||||||||||||||
| 6.21 | (27.28 | ) | 6,232 | 0.55 | 4.52 | 0.67 | 420 | ||||||||||||||||||||
| 9.20 | 1.47 | 832,289 | 0.55 | 4.94 | 0.65 | 506 | |||||||||||||||||||||
| 9.53 | 2.72 | 1,190,100 | 0.55 | 4.96 | 0.64 | 143 | |||||||||||||||||||||
| 9.51 | 3.22 | 640,217 | 0.55 | 4.73 | 0.65 | 540 | |||||||||||||||||||||
| 9.64 | 1.52 | 159,035 | 0.56 | 3.48 | 0.68 | 194 | |||||||||||||||||||||
| 9.84 | 1.99 | 94,681 | 0.58 | 2.22 | 0.73 | 261 | |||||||||||||||||||||
| 6.21 | (26.99 | ) | 9,948 | 0.30 | 4.86 | 0.57 | 420 | ||||||||||||||||||||
| 9.19 | 1.62 | 228,761 | 0.30 | 5.20 | 0.50 | 506 | |||||||||||||||||||||
| 9.53 | 2.84 | �� | 454,688 | 0.30 | 5.19 | 0.49 | 143 | ||||||||||||||||||||
| 9.51 | 3.47 | 380,233 | 0.30 | 4.87 | 0.51 | 540 | |||||||||||||||||||||
| 9.64 | 1.75 | 471,460 | 0.30 | 3.60 | 0.53 | 194 | |||||||||||||||||||||
| 9.85 | 2.38 | 641,869 | 0.30 | 2.49 | 0.55 | 261 | |||||||||||||||||||||
FOR THE PERIODS INDICATED (continued)
| | | | Per share operating performance | | |||||||||||||||||||||||||||
|---|---|---|---|---|---|---|---|---|---|---|---|---|---|---|---|---|---|---|---|---|---|---|---|---|---|---|---|---|---|---|---|
| Investment operations | Distributions | ||||||||||||||||||||||||||||||
| | Net asset value, beginning of period | | Net investment income (loss) | | Net realized and unrealized gains (losses) on investments | | Total from investment operations | | Net investment income | | Tax return of capital | | Total distributions | ||||||||||||||||||
Short Term Bond Fund II | |||||||||||||||||||||||||||||||
Class A | |||||||||||||||||||||||||||||||
| Year Ended February 28, 2009 | $ | 9.66 | $ | 0.34 | (f) | $ | (0.90 | ) | $ | (0.56 | ) | $ | (0.34 | ) | $ | — | $ | (0.34 | ) | ||||||||||||
| Year Ended February 29, 2008 | 9.84 | 0.45 | (0.18 | ) | 0.27 | (0.45 | ) | — | (0.45 | ) | |||||||||||||||||||||
| September 1, 2006 through February 28, 2007 (e) | 9.84 | 0.22 | (f) | 0.02 | 0.24 | (0.24 | ) | — | (0.24 | ) | |||||||||||||||||||||
| Year Ended August 31, 2006 | 10.02 | 0.45 | (0.20 | ) | 0.25 | (0.43 | ) | — | (0.43 | ) | |||||||||||||||||||||
| Year Ended August 31, 2005 | 10.21 | 0.31 | (0.20 | ) | 0.11 | (0.30 | ) | — | (0.30 | ) | |||||||||||||||||||||
| Year Ended August 31, 2004 | 10.23 | 0.21 | (f) | (0.02 | ) | 0.19 | (0.21 | ) | — | (g) | (0.21 | ) | |||||||||||||||||||
Class M | |||||||||||||||||||||||||||||||
| Year Ended February 28, 2009 | �� | 9.66 | 0.29 | (f) | (0.88 | ) | (0.59 | ) | (0.31 | ) | — | (0.31 | ) | ||||||||||||||||||
| Year Ended February 29, 2008 | 9.85 | 0.41 | (0.18 | ) | 0.23 | (0.42 | ) | — | (0.42 | ) | |||||||||||||||||||||
| September 1, 2006 through February 28, 2007 (e) | 9.84 | 0.21 | (f) | 0.02 | 0.23 | (0.22 | ) | — | (0.22 | ) | |||||||||||||||||||||
| Year Ended August 31, 2006 | 10.02 | 0.41 | (0.19 | ) | 0.22 | (0.40 | ) | — | (0.40 | ) | |||||||||||||||||||||
| Year Ended August 31, 2005 | 10.21 | 0.28 | (0.20 | ) | 0.08 | (0.27 | ) | — | (0.27 | ) | |||||||||||||||||||||
| Year Ended August 31, 2004 | 10.23 | 0.18 | (f) | (0.02 | ) | 0.16 | (0.18 | ) | — | (g) | (0.18 | ) | |||||||||||||||||||
Select Class | |||||||||||||||||||||||||||||||
| Year Ended February 28, 2009 | 9.68 | 0.37 | (f) | (0.92 | ) | (0.55 | ) | (0.36 | ) | — | (0.36 | ) | |||||||||||||||||||
| Year Ended February 29, 2008 | 9.86 | 0.51 | (0.22 | ) | 0.29 | (0.47 | ) | — | (0.47 | ) | |||||||||||||||||||||
| September 1, 2006 through February 28, 2007 (e) | 9.86 | 0.23 | (f) | 0.02 | 0.25 | (0.25 | ) | — | (0.25 | ) | |||||||||||||||||||||
| Year Ended August 31, 2006 | 10.03 | 0.47 | (0.19 | ) | 0.28 | (0.45 | ) | — | (0.45 | ) | |||||||||||||||||||||
| Year Ended August 31, 2005 | 10.22 | 0.32 | (0.18 | ) | 0.14 | (0.33 | ) | — | (0.33 | ) | |||||||||||||||||||||
| Year Ended August 31, 2004 | 10.25 | 0.23 | (f) | (0.03 | ) | 0.20 | (0.23 | ) | — | (g) | (0.23 | ) | |||||||||||||||||||
| (a) | Annualized for periods less than one year. |
| (b) | Not annualized for periods less than one year. |
| (c) | Includes adjustments in accordance with accounting principles generally accepted in the United States of America and as such, the net asset value for financial reporting purposes and the returns based upon those net asset values may differ from the net asset value and returns for shareholder transactions. |
| (d) | Includes earnings credits and interest expense, each of which is less than 0.01%, if applicable or unless otherwise noted. |
| (e) | The Fund changed its fiscal year end from August 31 to the last day in February. |
| (f) | Calculated based on average shares outstanding. |
| (g) | Amount rounds to less than $0.01. |
| | Ratios/Supplemental data | �� | |||||||||||||||||||||||||
|---|---|---|---|---|---|---|---|---|---|---|---|---|---|---|---|---|---|---|---|---|---|---|---|---|---|---|---|
| Ratios to average net assets (a) | |||||||||||||||||||||||||||
| Net asset value, end of period | | Total return (excludes sales charge) (b)(c) | | Net assets end of period (000’s) | | Net expenses (d) | | Net investment income (loss) | | Expenses without waivers, reimbursements and earnings credits | | Portfolio turnover rate (b) | |||||||||||||||
| $8.76 | (5.93 | )% | $ | 6,456 | 0.75 | % | 3.61 | % | 1.09 | % | 91 | % | |||||||||||||||
| 9.66 | 2.78 | 22,655 | 0.75 | 4.51 | 1.01 | 338 | |||||||||||||||||||||
| 9.84 | 2.42 | 24,652 | 0.75 | 4.53 | 0.98 | 246 | |||||||||||||||||||||
| 9.84 | 2.56 | 32,557 | 0.75 | 4.46 | 0.95 | 479 | |||||||||||||||||||||
| 10.02 | 1.09 | 41,311 | 0.75 | 2.94 | 1.00 | 201 | |||||||||||||||||||||
| 10.21 | 1.85 | 55,000 | 0.75 | 2.03 | 1.10 | 253 | |||||||||||||||||||||
| 8.76 | (6.15 | ) | 113,828 | 1.00 | 3.19 | 1.19 | 91 | ||||||||||||||||||||
| 9.66 | 2.42 | 144,078 | 1.00 | 4.26 | 1.11 | 338 | |||||||||||||||||||||
| 9.85 | 2.39 | 175,836 | 1.00 | 4.29 | 1.08 | 246 | |||||||||||||||||||||
| 9.84 | 2.30 | 209,284 | 1.00 | 4.19 | 1.05 | 479 | |||||||||||||||||||||
| 10.02 | 0.83 | 371,756 | 1.00 | 2.67 | 1.03 | 201 | |||||||||||||||||||||
| 10.21 | 1.58 | 643,278 | 1.00 | 1.75 | 1.04 | 253 | |||||||||||||||||||||
| 8.77 | (5.76 | ) | 5,611 | 0.50 | 3.92 | 0.83 | 91 | ||||||||||||||||||||
| 9.68 | 3.02 | 83,064 | 0.50 | 4.76 | 0.75 | 338 | |||||||||||||||||||||
| 9.86 | 2.54 | 151,633 | 0.50 | 4.75 | 0.72 | 246 | |||||||||||||||||||||
| 9.86 | 2.91 | 375,097 | 0.50 | 4.71 | 0.70 | 479 | |||||||||||||||||||||
| 10.03 | 1.35 | 432,056 | 0.50 | 3.21 | 0.68 | 201 | |||||||||||||||||||||
| 10.22 | 2.01 | 492,178 | 0.50 | 2.26 | 0.70 | 253 | |||||||||||||||||||||
AS OF FEBRUARY 28, 2009
| | Classes Offered | | Trust | |||||||
|---|---|---|---|---|---|---|---|---|---|---|
| Bond Fund | Class A, Class B, Class C, Select Class, Institutional Class and Ultra | JPM I | ||||||||
| Emerging Markets Debt Fund | Class A, Class C, Class R5 and Select Class | JPM I | ||||||||
| Enhanced Income Fund | Institutional Class | JPM I | ||||||||
| Real Return Fund | Class A, Class C, Select Class and Institutional Class | JPM I | ||||||||
| Short Term Bond Fund | Class A, Select Class and Institutional Class | JPM I | ||||||||
| Short Term Bond Fund II | Class A, Class M and Select Class | MFG | ||||||||
| • | Level 1 — quoted prices in active markets for identical securities |
| • | Level 2 — other significant observable inputs (including quoted prices for similar securities, interest rates, prepayment speeds, credit risk, etc.) |
| • | Level 3 — significant unobservable inputs (including the Funds’ own assumptions in determining the fair value of investments) |
| Valuation Inputs | | Investments in Securities | | Liabilities in Securities Sold Short† | | Appreciation in Other Financial Instruments* | | Depreciation in Other Financial Instruments | ||||||||||
|---|---|---|---|---|---|---|---|---|---|---|---|---|---|---|---|---|---|---|
Bond Fund | �� | |||||||||||||||||
| Level 1 — Quoted Prices | $ | 13,208 | $ | — | $ | 357 | $ | (137 | ) | |||||||||
| Level 2 — Other significant observable inputs | 141,733 | (209 | ) | 995 | (1,325 | ) | ||||||||||||
| Level 3 — Significant unobservable inputs | 18,321 | — | — | — | ||||||||||||||
Total | $ | 173,262 | $ | (209 | ) | $ | 1,352 | $ | (1,462 | ) | ||||||||
Emerging Markets Debt Fund | ||||||||||||||||||
| Level 1 — Quoted Prices | $ | 6,767 | $ | — | $ | 48 | $ | (473 | ) | |||||||||
| Level 2 — Other significant observable inputs | 204,488 | — | 4,736 | (17,458 | ) | |||||||||||||
| Level 3 — Significant unobservable inputs | 450 | — | — | — | ||||||||||||||
Total | $ | 211,705 | $ | — | $ | 4,784 | $ | (17,931 | ) | |||||||||
Enhanced Income Fund | ||||||||||||||||||
| Level 1 — Quoted Prices | $ | 1,241 | $ | — | $ | — | $ | — | ||||||||||
| Level 2 — Other significant observable inputs | 6,501 | — | — | — | ||||||||||||||
| Level 3 — Significant unobservable inputs | 471 | — | — | — | ||||||||||||||
Total | $ | 8,213 | $ | — | $ | — | $ | — | ||||||||||
Real Return Fund | ||||||||||||||||||
| Level 1 — Quoted Prices | $ | 1,536 | $ | — | $ | 53 | $ | (1 | ) | |||||||||
| Level 2 — Other significant observable inputs | 77,830 | — | — | (104 | ) | |||||||||||||
| Level 3 — Significant unobservable inputs | — | — | — | — | ||||||||||||||
Total | $ | 79,366 | $ | — | $ | 53 | $ | (105 | ) | |||||||||
Short Term Bond Fund | ||||||||||||||||||
| Level 1 — Quoted Prices | $ | 9,321 | $ | — | $ | — | $ | (9 | ) | |||||||||
| Level 2 — Other significant observable inputs | 9,237 | — | — | — | ||||||||||||||
| Level 3 — Significant unobservable inputs | 384 | — | — | — | ||||||||||||||
Total | $ | 18,942 | $ | — | $ | — | $ | (9 | ) | |||||||||
Short Term Bond Fund II | ||||||||||||||||||
| Level 1 — Quoted Prices | $ | 32,758 | $ | — | $ | — | $ | (28 | ) | |||||||||
| Level 2 — Other significant observable inputs | 90,761 | — | — | — | ||||||||||||||
| Level 3 — Significant unobservable inputs | — | (a) | — | — | — | |||||||||||||
Total | $ | 123,519 | $ | — | $ | — | $ | (28 | ) | |||||||||
| † | Liabilities in securities sold short may include written options. |
| * | Other financial instruments may include futures, forwards and swap contracts. |
| (a) | Security has a zero value. |
| | Investments in Securities | | Other Financial Instruments* | |||||||
|---|---|---|---|---|---|---|---|---|---|---|
Bond Fund | ||||||||||
| Balance as of 02/29/08 | $ | 24,117 | $ | — | ||||||
| Realized Gain (loss) | — | (a) | — | |||||||
| Change in unrealized appreciation (depreciation) | (6,765 | ) | — | |||||||
| Net amortization/accretion | — | (a) | — | |||||||
| Net purchases (sales) | (3,270 | ) | — | |||||||
| Net transfers in (out) of Level 3 | 4,239 | — | ||||||||
| Balance as of 02/28/09 | $ | 18,321 | $ | — | ||||||
AS OF FEBRUARY 28, 2009 (continued)
| | Investments in Securities | | Other Financial Instruments* | |||||||
|---|---|---|---|---|---|---|---|---|---|---|
Emerging Markets Debt Fund | ||||||||||
| Balance as of 02/29/08 | $ | — | $ | — | ||||||
| Realized Gain (loss) | — | — | ||||||||
| Change in unrealized appreciation (depreciation) | — | — | ||||||||
| Net amortization/accretion | — | — | ||||||||
| Net purchases (sales) | 450 | — | ||||||||
| Net transfers in (out) of Level 3 | — | — | ||||||||
| Balance as of 02/28/09 | $ | 450 | $ | — | ||||||
Enhanced Income Fund | ||||||||||
| Balance as of 02/29/08 | $ | 1,199 | $ | — | ||||||
| Realized Gain (loss) | — | — | ||||||||
| Change in unrealized appreciation (depreciation) | 1,201 | — | ||||||||
| Net amortization/accretion | — | — | ||||||||
| Net purchases (sales) | (2,400 | ) | — | |||||||
| Net transfers in (out) of Level 3 | 471 | — | ||||||||
| Balance as of 02/28/09 | $ | 471 | $ | — | ||||||
Short Term Bond Fund | ||||||||||
| Balance as of 02/29/08 | $ | 19,202 | $ | — | ||||||
| Realized gain (loss) | — | — | ||||||||
| Change in unrealized appreciation (depreciation) | (1,400 | ) | — | |||||||
| Net amortization/accretion | 5 | — | ||||||||
| Net purchases (sales) | (17,807 | ) | — | |||||||
| Net transfers in (out) of Level 3 | 384 | — | ||||||||
| Balance as of 02/28/09 | $ | 384 | $ | — | ||||||
Short Term Bond Fund II | ||||||||||
| Balance as of 02/29/08 | $ | 2,033 | $ | — | ||||||
| Realized gain (loss) | — | — | ||||||||
| Change in unrealized appreciation (depreciation) | (1,133 | ) | — | |||||||
| Net amortization/accretion | — | — | ||||||||
| Net purchases (sales) | (900 | ) | — | |||||||
| Net transfers in (out) of Level 3 | — | — | ||||||||
| Balance as of 02/28/09 | $ | — | (b) | $ | — | |||||
| * | Other financial instruments may include futures, forwards and swap contracts. |
| (a) | Amount rounds to less than $1,000. |
| (b) | Security has a zero value. |
| | ||||||
|---|---|---|---|---|---|---|
| Bond Fund | $ | (12,945 | ) | |||
| Emerging Markets Debt Fund | (5,035 | ) | ||||
| Enhanced Income Fund | (1,168 | ) | ||||
| Short Term Bond Fund | (18,009 | ) | ||||
| Short Term Bond Fund II | (4,247 | ) | ||||
of promptly (within seven days) and in the usual course of business at approximately its fair value and includes, but is not limited to, repurchase agreements maturing in excess of seven days, time deposits with a withdrawal penalty, non-negotiable instruments and instruments for which no market exists. Disposal of these securities may involve time-consuming negotiations and expense, and prompt sale at the current valuation may be difficult.
| | Value | | Percentage | |||||||
|---|---|---|---|---|---|---|---|---|---|---|
| Bond Fund | $ | 25,422 | 20.0 | % | ||||||
| Emerging Markets Debt Fund | 15,667 | 7.9 | ||||||||
| Enhanced Income Fund | 883 | 11.8 | ||||||||
| Short Term Bond Fund | — | (a) | — | (a) | ||||||
| Short Term Bond Fund II | — | (b) | — | |||||||
| (a) | Amount rounds to less than $1,000 and 0.1%. |
| (b) | Security has a zero value. |
| Affiliate | | Value at February 29, 2008 | | Purchase Cost | | Sales Proceeds | | Realized Gain/ (Loss) | | Dividend*/ Interest Income | | Shares/ Principal Amount ($) at February 28, 2009 | | Value at February 28, 2009 | ||||||||||||||||
|---|---|---|---|---|---|---|---|---|---|---|---|---|---|---|---|---|---|---|---|---|---|---|---|---|---|---|---|---|---|---|
Bond Fund | ||||||||||||||||||||||||||||||
| Bear Stearns Cos., Inc. (The), VAR, 3.19%, 05/18/10** | $ | 6,485 | $ | — | $ | 6,292 | $ | (778 | ) | $ | 16 | — | $ | — | ||||||||||||||||
| JPMorgan Prime Money Market Fund, Institutional Class Shares, 0.830% | 18,180 | 642,898 | 647,870 | — | 448 | 13,208 | 13,208 | |||||||||||||||||||||||
| Total | $ | 24,665 | $ | (778 | ) | $ | 464 | $ | 13,208 | |||||||||||||||||||||
Emerging Markets Debt Fund | ||||||||||||||||||||||||||||||
| JPMorgan Prime Money Market Fund, Institutional Class Shares, 0.830% | $ | 9,742 | $ | 205,995 | $ | 208,970 | $ | — | $ | 390 | 6,767 | $ | 6,767 | |||||||||||||||||
Enhanced Income Fund | ||||||||||||||||||||||||||||||
| JPMorgan Prime Money Market Fund, Institutional Class Shares, 0.830% | $ | 21,994 | $ | 75,131 | $ | 95,884 | $ | — | $ | 273 | 1,241 | $ | 1,241 | |||||||||||||||||
AS OF FEBRUARY 28, 2009 (continued)
| Affiliate | | Value at February 29, 2008 | | Purchase Cost | | Sales Proceeds | | Realized Gain/ (Loss) | | Dividend*/ Interest Income | | Shares/ Principal Amount ($) at February 28, 2009 | | Value at February 28, 2009 | ||||||||||||||||
|---|---|---|---|---|---|---|---|---|---|---|---|---|---|---|---|---|---|---|---|---|---|---|---|---|---|---|---|---|---|---|
Real Return Fund | ||||||||||||||||||||||||||||||
| JPMorgan Prime Money Market Fund, Institutional Class Shares, 0.830% | $ | 3,362 | $ | 65,848 | $ | 67,674 | $ | — | $ | 82 | 1,536 | $ | 1,536 | |||||||||||||||||
Short Term Bond Fund | ||||||||||||||||||||||||||||||
| Bear Stearns Cos., Inc. (The), 4.55%, 06/23/10** | $ | 5,614 | $ | — | $ | 5,273 | $ | (358 | ) | $ | 19 | — | $ | — | ||||||||||||||||
| Bear Stearns Cos., Inc. (The), 5.85%, 07/19/10** | 7,572 | — | 7,050 | (444 | ) | 32 | — | — | ||||||||||||||||||||||
| JPMorgan Prime Money Market Fund, Institutional Class Shares, 0.830% | 26,684 | 563,644 | 581,007 | — | 357 | 9,321 | 9,321 | |||||||||||||||||||||||
| Total | $ | 39,870 | $ | (802 | ) | $ | 408 | $ | 9,321 | |||||||||||||||||||||
Short Term Bond Fund II | ||||||||||||||||||||||||||||||
| Bear Stearns Cos., Inc. (The), 4.55%, 06/23/10** | $ | 1,478 | $ | — | $ | 1,388 | $ | (94 | ) | $ | 5 | — | $ | — | ||||||||||||||||
| Bear Stearns Cos., Inc. (The), 5.85%, 07/19/10** | 858 | — | 799 | (50 | ) | 4 | — | — | ||||||||||||||||||||||
| JPMorgan Prime Money Market Fund, Institutional Class Shares, 0.830% | 23,371 | 170,659 | 161,272 | — | 392 | 32,758 | 32,758 | |||||||||||||||||||||||
| Total | $ | 25,707 | $ | (144 | ) | $ | 401 | $ | 32,758 | |||||||||||||||||||||
| * | Does not include the reimbursement of advisory, administration and shareholder servicing fees resulting from investments in money market funds as disclosed in note 3.A. |
| ** | Security was purchased prior to its affiliation with JPMorgan Chase & Co. |
closing transaction is entered into, the related liability is extinguished and the Fund realizes a gain or loss contingent on whether the cost of the closing transaction exceeds the premium received when the option was written. If a call option is exercised, the premium is added to the proceeds from the sale of the underlying security in determining whether there has been a realized gain or loss. If a put option is exercised, the premium reduces the cost basis of the security.
| Bond Fund | |||||||||||||||||||
|---|---|---|---|---|---|---|---|---|---|---|---|---|---|---|---|---|---|---|---|
| | Number of Contracts | | Premiums Received | | Notional Value | | Premiums Received | ||||||||||||
| Options outstanding at February 29, 2008 | 12,066 | $ | 10,207 | $ | 1,272,426 | $ | 14,933 | ||||||||||||
| Options written | 7,075 | 3,277 | 4,964,727 | 24,112 | |||||||||||||||
| Options expired | (24 | ) | (4 | ) | (451,952 | ) | (3,234 | ) | |||||||||||
| Options terminated in closing purchase transactions | (19,117 | ) | (13,480 | ) | (5,749,571 | ) | (35,761 | ) | |||||||||||
| Options outstanding at February 28, 2009 | — | $ | — | $ | 35,630 | $ | 50 | ||||||||||||
| Real Return Fund | |||||||||||||||||||||||
|---|---|---|---|---|---|---|---|---|---|---|---|---|---|---|---|---|---|---|---|---|---|---|---|
| | Number of Contracts | | Premiums Received | | Notional Value | | Notional Value | | Premiums Received | ||||||||||||||
| Options outstanding at February 29, 2008 | 488 | $ | 470 | $ | 19,479 | AUD 19,460 | $ | 419 | |||||||||||||||
| Options written | 771 | 337 | 405,479 | — | 2,040 | ||||||||||||||||||
| Options expired | — | — | — | AUD (19,460) | (18 | ) | |||||||||||||||||
| Options terminated in closing purchase transactions | (1,259 | ) | (807 | ) | (424,958 | ) | — | (2,441 | ) | ||||||||||||||
| Options outstanding at February 28, 2009 | — | $ | — | $ | — | $ | — | $ | — | ||||||||||||||
| Short Term Bond Fund | |||||||||||||||||||
|---|---|---|---|---|---|---|---|---|---|---|---|---|---|---|---|---|---|---|---|
| | Number of Contracts | | Premiums Received | | Notional Value | | Premiums Received | ||||||||||||
| Options outstanding at February 29, 2008 | 3,112 | $ | 2,997 | $ | 405,925 | $ | 4,488 | ||||||||||||
| Options written | 2,855 | 1,574 | 76,408 | 4,162 | |||||||||||||||
| Options expired | — | — | — | — | |||||||||||||||
| Options terminated in closing purchase transactions | (5,967 | ) | (4,571 | ) | (482,333 | ) | (8,650 | ) | |||||||||||
| Options outstanding at February 28, 2009 | — | $ | — | $ | — | $ | — | ||||||||||||
| Short Term Bond Fund II | |||||||||||||||||||
|---|---|---|---|---|---|---|---|---|---|---|---|---|---|---|---|---|---|---|---|
| | Number of Contracts | | Premiums Received | | Notional Value | | Premiums Received | ||||||||||||
| Options outstanding at February 29, 2008 | 711 | $ | 687 | $ | 34,095 | $ | 630 | ||||||||||||
| Options written | 874 | 420 | 18,156 | 974 | |||||||||||||||
| Options expired | — | — | — | — | |||||||||||||||
| Options terminated in closing purchase transactions | (1,585 | ) | (1,107 | ) | (52,251 | ) | (1,604 | ) | |||||||||||
| Options outstanding at February 28, 2009 | — | $ | — | $ | — | $ | — | ||||||||||||
AS OF FEBRUARY 28, 2009 (continued)
Upfront payments made or received are recorded as a realized gain or loss upon termination of the agreement. The value of swap agreements is recognized in the Statements of Assets and Liabilities; the risk of loss may exceed such amounts. The Funds may be exposed to market risk related to unfavorable changes in interest rates or in the price or return of underlying instruments; counterparty credit risk related to the swap counterparty’s failure to perform under contract terms; liquidity risk related to the lack of a liquid market for these contracts allowing the fund to close out its position; and, documentation risk related to disagreement on the meaning of contract terms. Notional amounts of swap agreements, presented in the Schedules of Portfolio Investments, are used to express the extent of involvement in these transactions
AS OF FEBRUARY 28, 2009 (continued)
accepted in the United States of America. To the extent these “book/tax” differences are permanent in nature (i.e., that they result from other than timing of recognition — “temporary differences”), such amounts are reclassified within the capital accounts based on their Federal tax-basis treatment.
| | Paid-in-capital | | Accumulated Undistributed/ (Overdistributed) Net Investment Income | | Accumulated Net Realized Gain (Loss) on Investments | |||||||||
|---|---|---|---|---|---|---|---|---|---|---|---|---|---|---|
| Bond Fund | $ | (49,809 | ) | $ | (8,556 | ) | $ | 58,365 | ||||||
| Emerging Markets Debt Fund | 890 | (4,119 | ) | 3,229 | ||||||||||
| Enhanced Income Fund | — | (6 | ) | 6 | ||||||||||
| Real Return Fund | (2,236 | ) | 1,918 | 318 | ||||||||||
| Short Term Bond Fund | (27,963 | ) | (5,239 | ) | 33,202 | |||||||||
| Short Term Bond Fund II | — | (a) | (29 | ) | 29 | |||||||||
| (a) | Amount rounds to less than $1,000. |
| | ||||||
|---|---|---|---|---|---|---|
| Bond Fund | 0.30 | % | ||||
| Emerging Markets Debt Fund | 0.70 | |||||
| Enhanced Income Fund | 0.25 | |||||
| Real Return Fund | 0.35 | |||||
| Short Term Bond Fund | 0.25 | |||||
| Short Term Bond Fund II | 0.25 | |||||
| | ||||||
|---|---|---|---|---|---|---|
| Bond Fund | $ | 36 | ||||
| Emerging Markets Debt Fund | 33 | |||||
| Enhanced Income Fund | 20 | |||||
| Real Return Fund | 7 | |||||
| Short Term Bond Fund | 27 | |||||
| Short Term Bond Fund II | 30 | |||||
| | Class A | | Class B | | Class C | | Class M | |||||||||||
|---|---|---|---|---|---|---|---|---|---|---|---|---|---|---|---|---|---|---|
| Bond Fund | 0.25 | % | 0.75 | % | 0.75 | % | n/a | |||||||||||
| Emerging Markets Debt Fund | 0.25 | n/a | 0.75 | n/a | ||||||||||||||
| Real Return Fund | 0.25 | n/a | 0.75 | n/a | ||||||||||||||
| Short Term Bond Fund | 0.25 | n/a | n/a | n/a | ||||||||||||||
| Short Term Bond Fund II | 0.25 | n/a | n/a | 0.35 | % | |||||||||||||
| | Front-End Sales Charge | | CDSC | |||||||
|---|---|---|---|---|---|---|---|---|---|---|
| Bond Fund | $ | 4 | $ | 20 | ||||||
| Emerging Markets Debt Fund | 3 | 2 | ||||||||
| Real Return Fund | 14 | 16 | ||||||||
| Short Term Bond Fund | 1 | 1 | ||||||||
| Short Term Bond Fund II | 1 | — | ||||||||
| | Class A | | Class B | | Class C | | Class M | | Class R5 | | Select Class | | Institutional Class | |||||||||||||||||
|---|---|---|---|---|---|---|---|---|---|---|---|---|---|---|---|---|---|---|---|---|---|---|---|---|---|---|---|---|---|---|
| Bond Fund | 0.25 | % | 0.25 | % | 0.25 | % | n/a | n/a | 0.25 | % | 0.10 | % | ||||||||||||||||||
| Emerging Markets Debt Fund | 0.25 | n/a | 0.25 | n/a | 0.05 | % | 0.25 | n/a | ||||||||||||||||||||||
| Enhanced Income Fund | n/a | n/a | n/a | n/a | n/a | n/a | 0.10 | |||||||||||||||||||||||
| Real Return Fund | 0.25 | n/a | 0.25 | n/a | n/a | 0.25 | 0.10 | |||||||||||||||||||||||
| Short Term Bond Fund | 0.25 | n/a | n/a | n/a | n/a | 0.25 | 0.10 | |||||||||||||||||||||||
| Short Term Bond Fund II | 0.25 | n/a | n/a | 0.25 | % | n/a | 0.25 | n/a | ||||||||||||||||||||||
AS OF FEBRUARY 28, 2009 (continued)
| | Class A | | Class B | | Class C | | Class M | | Class R5 | | Select Class | | Institutional Class | | Ultra | |||||||||||||||||||
|---|---|---|---|---|---|---|---|---|---|---|---|---|---|---|---|---|---|---|---|---|---|---|---|---|---|---|---|---|---|---|---|---|---|---|
| Bond Fund | 0.75 | % | 1.50 | % | 1.50 | % | n/a | n/a | 0.69 | % | 0.49 | % | 0.40 | % | ||||||||||||||||||||
| Emerging Markets Debt Fund | 1.50 | n/a | 2.00 | n/a | 1.05 | % | 1.25 | n/a | n/a | |||||||||||||||||||||||||
| Enhanced Income Fund | n/a | n/a | n/a | n/a | n/a | n/a | 0.25 | n/a | ||||||||||||||||||||||||||
| Real Return Fund | 0.90 | n/a | 1.40 | n/a | n/a | 0.65 | 0.50 | n/a | ||||||||||||||||||||||||||
| Short Term Bond Fund | 0.75 | n/a | n/a | n/a | n/a | 0.60 | 0.30 | n/a | ||||||||||||||||||||||||||
| Short Term Bond Fund II | 0.75 | n/a | n/a | 1.00 | % | n/a | 0.50 | n/a | n/a | |||||||||||||||||||||||||
| Contractual Waivers | ||||||||||||||||||||||
|---|---|---|---|---|---|---|---|---|---|---|---|---|---|---|---|---|---|---|---|---|---|---|
| | Investment Advisory | | Administration | | Shareholder Servicing | | Total | | Contractual Reimbursements | |||||||||||||
| Bond Fund | $ | 412 | $ | 192 | $ | 41 | $ | 645 | $ | 55 | ||||||||||||
| Emerging Markets Debt Fund | — | 23 | 26 | 49 | — | |||||||||||||||||
| Enhanced Income Fund | 129 | 29 | 53 | 211 | 36 | |||||||||||||||||
| Real Return Fund | 270 | 85 | 81 | 436 | 27 | |||||||||||||||||
| Short Term Bond Fund | 264 | 43 | 81 | 388 | 59 | |||||||||||||||||
| Short Term Bond Fund II | 71 | 121 | 256 | 448 | — | |||||||||||||||||
| Voluntary Waivers | |||||||||||||||
|---|---|---|---|---|---|---|---|---|---|---|---|---|---|---|---|
| | Investment Advisory | | Administration | | Total | ||||||||||
| Bond Fund | $ | 5 | $ | 146 | $ | 151 | |||||||||
| Enhanced Income Fund | — | 23 | 23 | ||||||||||||
| Short Term Bond Fund | 22 | 119 | 141 | ||||||||||||
| | Purchases (excluding U.S. Government) | | Sales (excluding U.S. Government) | | Purchases of U.S. Government | | Sales of U.S. Government | |||||||||||
|---|---|---|---|---|---|---|---|---|---|---|---|---|---|---|---|---|---|---|
| Bond Fund | $ | 10,142,041 | $ | 13,009,119 | $ | 158,635 | $ | 166,468 | ||||||||||
| Emerging Markets Debt Fund | 173,641 | 157,910 | 11,829 | 6,628 | ||||||||||||||
| Enhanced Income Fund | 61,557 | 120,832 | 594 | 1,291 | ||||||||||||||
| Real Return Fund | 182,571 | 223,458 | 120,223 | 96,355 | ||||||||||||||
| Short Term Bond Fund | 1,501,447 | 2,610,707 | 475,891 | 629,606 | ||||||||||||||
| Short Term Bond Fund II | 92,242 | 224,883 | 60,682 | 47,573 | ||||||||||||||
| | Aggregate Cost | | Gross Unrealized Appreciation | | Gross Unrealized Depreciation | | Net Unrealized Appreciation (Depreciation) | |||||||||||
|---|---|---|---|---|---|---|---|---|---|---|---|---|---|---|---|---|---|---|
| Bond Fund | $ | 248,321 | $ | 1,918 | $ | 76,977 | $ | (75,059 | ) | |||||||||
| Emerging Markets Debt Fund | 283,178 | 555 | 72,028 | (71,473 | ) | |||||||||||||
| Enhanced Income Fund | 15,777 | 17 | 7,581 | (7,564 | ) | |||||||||||||
| Real Return Fund | 80,817 | 639 | 2,090 | (1,451 | ) | |||||||||||||
| Short Term Bond Fund | 67,821 | 136 | 49,015 | (48,879 | ) | |||||||||||||
| Short Term Bond Fund II | 135,111 | 1,639 | 13,231 | (11,592 | ) | |||||||||||||
| Total Distributions Paid From: | ||||||||||
|---|---|---|---|---|---|---|---|---|---|---|
| | Ordinary Income | | Total Distributions Paid | |||||||
| Bond Fund | $ | 39,763 | $ | 39,763 | ||||||
| Emerging Markets Debt Fund | 17,231 | 17,231 | ||||||||
| Enhanced Income Fund | 1,743 | 1,743 | ||||||||
| Real Return Fund | 3,488 | 3,488 | ||||||||
| Short Term Bond Fund | 15,054 | 15,054 | ||||||||
| Short Term Bond Fund II | 6,582 | 6,582 | ||||||||
| Total Distributions Paid From: | |||||||||||||||||||
|---|---|---|---|---|---|---|---|---|---|---|---|---|---|---|---|---|---|---|---|
| | Ordinary Income | | Net Long Term Capital Gains | | Return of Capital | | Total Distributions Paid | ||||||||||||
| Bond Fund | $ | 114,904 | $ | — | $ | — | $ | 114,904 | |||||||||||
| Emerging Markets Debt Fund | 19,112 | 2,300 | — | 21,412 | |||||||||||||||
| Enhanced Income Fund | 8,070 | — | 189 | 8,259 | |||||||||||||||
| Real Return Fund | 3,975 | — | — | 3,975 | |||||||||||||||
| Short Term Bond Fund | 85,687 | — | — | 85,687 | |||||||||||||||
| Short Term Bond Fund II | 14,180 | — | — | 14,180 | |||||||||||||||
AS OF FEBRUARY 28, 2009 (continued)
| | Current Distributable Ordinary Income | | Current Distributable Long Term Capital Gain or (Tax Basis Capital Loss Carryover) | | Unrealized Appreciation (Depreciation) | |||||||||
|---|---|---|---|---|---|---|---|---|---|---|---|---|---|---|
| Bond Fund | $ | 284 | $ | (198,201 | ) | $ | (75,579 | ) | ||||||
| Emerging Markets Debt Fund | 1,127 | (25,857 | ) | (84,202 | ) | |||||||||
| Enhanced Income Fund | 25 | (17,020 | ) | (7,564 | ) | |||||||||
| Real Return Fund | — | (5,901 | ) | (1,553 | ) | |||||||||
| Short Term Bond Fund | 811 | (68,581 | ) | (48,879 | ) | |||||||||
| Short Term Bond Fund II | 662 | (36,594 | ) | (11,592 | ) | |||||||||
| | 2010 | | 2011 | | 2012 | | 2013 | | 2014 | | 2015 | | 2016 | | 2017 | | Total | |||||||||||||||||||||
|---|---|---|---|---|---|---|---|---|---|---|---|---|---|---|---|---|---|---|---|---|---|---|---|---|---|---|---|---|---|---|---|---|---|---|---|---|---|---|
| Bond Fund | $ | — | $ | — | $ | — | $ | — | $ | 6,292 | $ | 14,908 | $ | 26,467 | $ | 150,534 | $ | 198,201 | ||||||||||||||||||||
| Emerging Markets Debt Fund | — | — | — | — | — | — | — | 25,857 | 25,857 | |||||||||||||||||||||||||||||
| Enhanced Income Fund | 1,180 | 792 | 3,941 | 526 | 680 | 420 | 3,401 | 6,080 | 17,020 | |||||||||||||||||||||||||||||
| Real Return Fund | — | — | — | — | 160 | 1,305 | — | 4,436 | 5,901 | |||||||||||||||||||||||||||||
| Short Term Bond Fund | — | — | 1,803 | 1,217 | 8,476 | 6,394 | 27,215 | 23,476 | 68,581 | |||||||||||||||||||||||||||||
| Short Term Bond Fund II | — | — | 1,675 | 657 | 14,799 | 10,312 | 2,292 | 6,859 | 36,594 | |||||||||||||||||||||||||||||
| | Capital Losses | | Currency Losses | |||||||
|---|---|---|---|---|---|---|---|---|---|---|
| Bond Fund | $ | 12,892 | $ | — | ||||||
| Emerging Markets Debt Fund | 7,915 | 176 | ||||||||
| Enhanced Income Fund | 7,210 | — | ||||||||
| Real Return Fund | 1,135 | — | ||||||||
| Short Term Bond Fund | 6,058 | 1 | ||||||||
| Short Term Bond Fund II | 12,125 | — | ||||||||
| | Average Borrowings | | Number of Days Used | | Interest Paid | |||||||||
|---|---|---|---|---|---|---|---|---|---|---|---|---|---|---|
| Bond Fund | $ | 14,381 | 3 | $ | 3 | |||||||||
| Bond Fund | | Value (000’s) | | Realized Losses (000’s) | | Type | ||||||||
|---|---|---|---|---|---|---|---|---|---|---|---|---|---|---|
| Select Class | $ | 359,837 | $ | (39,311 | ) | Redemption in-kind | ||||||||
| Institutional Class | 51,776 | (5,659 | ) | Redemption in-kind | ||||||||||
| Ultra | 47,207 | (5,158 | ) | Redemption in-kind | ||||||||||
AS OF FEBRUARY 28, 2009 (continued)
| Short Term Bond Fund | | Value (000’s) | | Realized Losses (000’s) | | Type | ||||||||
|---|---|---|---|---|---|---|---|---|---|---|---|---|---|---|
| Select Class | $ | 275,799 | $ | (23,050 | ) | Redemption in-kind | ||||||||
| Institutional Class | 58,798 | (4,913 | ) | Redemption in-kind | ||||||||||
JPMorgan Enhanced Income Fund, JPMorgan Emerging Markets Debt Fund, JPMorgan Real Return Fund,
JPMorgan Short Term Bond Fund and JPMorgan Short Term Bond Fund II :
New York, New York
April 28, 2009
(Unaudited)
| Name (Year of Birth); Positions With the Funds (1) | | Principal Occupations During Past 5 Years | | Number of Portfolios in Fund Complex Overseen by Trustee (2) | | Other Directorships Held Outside Fund Complex | |||||||||
|---|---|---|---|---|---|---|---|---|---|---|---|---|---|---|---|
Independent Trustees | |||||||||||||||
| William J. Armstrong (1941); Trustee of Trust since 2005; Trustee of heritage JPMorgan Funds since 1987. | Retired; CFO and Consultant, EduNeering, Inc. (internet business education supplier) (2000–2001); Vice President and Treasurer, Ingersoll–Rand Company (manufacturer of industrial equipment) (1972–2000). | 138 | None. | ||||||||||||
| John F. Finn (1947); Trustee of Trust since 2005; Trustee of heritage One Group Mutual Funds since 1998. | President and Chief Executive Officer, Gardner, Inc. (wholesale distributor to outdoor power equipment industry) (1979–present). | 138 | Director, Cardinal Health, Inc. (CAH) (1994–present); Chairman, Greif, Inc. (GEF) (packaging manufacturer) (2007–present). | ||||||||||||
| Dr. Matthew Goldstein (1941); Trustee of Trust since 2005; Trustee of heritage JPMorgan Funds since 2003. | Chancellor, City University of New York (1999–present); President, Adelphi University (New York) (1998–1999). | 138 | Director, Bronx-Lebanon Hospital Center; Director, United Way of New York City (2002–present). | ||||||||||||
| Robert J. Higgins (1945); Trustee of Trust since 2005; Trustee of heritage JPMorgan Funds since 2002. | Retired; Director of Administration of the State of Rhode Island (2003–2004); President — Consumer Banking and Investment Services, Fleet Boston Financial (1971–2001). | 138 | None. | ||||||||||||
| Peter C. Marshall (1942); Trustee of Trust since 2005; Trustee of heritage One Group Mutual Funds since 1985. | Self-employed business consultant (2000–present); Senior Vice President, W.D. Hoard, Inc. (corporate parent of DCI Marketing, Inc.) (2000–2002); President, DCI Marketing, Inc. (1992–2000). | 138 | Director, Center for Deaf and Hard of Hearing (1990–present). | ||||||||||||
| Marilyn McCoy* (1948); Trustee of Trust since 2005; Trustee of heritage One Group Mutual Funds since 1999. | Vice President of Administration and Planning, Northwestern University (1985–present). | 138 | Trustee, Carleton College (2003–present). | ||||||||||||
| William G. Morton, Jr. (1937); Trustee of Trust since 2005; Trustee of heritage JPMorgan Funds since 2003. | Retired; Chairman Emeritus (2001–2002), and Chairman and Chief Executive Officer, Boston Stock Exchange (1985–2001). | 138 | Trustee, Stratton Mountain School (2001–present) | ||||||||||||
| Name (Year of Birth); Positions With the Funds (1) | | Principal Occupations During Past 5 Years | | Number of Portfolios in Fund Complex Overseen by Trustee (2) | | Other Directorships Held Outside Fund Complex | |||||||||
|---|---|---|---|---|---|---|---|---|---|---|---|---|---|---|---|
Independent Trustees (continued) | |||||||||||||||
| Robert A. Oden, Jr. (1946); Trustee of Trust since 2005; Trustee of heritage One Group Mutual Funds since 1997. | President, Carleton College (2002–present); President, Kenyon College (1995–2002). | 138 | Trustee, American University in Cairo (1999–present); Trustee, Carleton College (2002–present). | ||||||||||||
| Fergus Reid, III (1932); Trustee of Trust (Chairman) since 2005; Trustee (Chairman) of heritage JPMorgan Funds since 1987. | Chairman, Joe Pietryka, Inc. (formerly Lumelite Corporation) (plastics manufacturing) (2003–present); Chairman and Chief Executive Officer, Lumelite Corporation (1985–2002). | 138 | Trustee, Morgan Stanley Funds (164 portfolios) (1992–present). | ||||||||||||
| Frederick W. Ruebeck (1939); Trustee of Trust since 2005; Trustee of heritage One Group Mutual Funds since 1994. | Advisor, Jerome P. Green & Associates, LLC (broker-dealer) (2000–present); Chief Investment Officer, Wabash College (2004–present); self-employed consultant (2000–present); Director of Investments, Eli Lilly and Company (pharmaceuticals) (1988–1999). | 138 | Trustee, Wabash College (1988–present); Chairman, Indianapolis Symphony Orchestra Foundation (1994–present). | ||||||||||||
| James J. Schonbachler (1943); Trustee of Trust since 2005; Trustee of heritage JPMorgan Funds since 2001. | Retired; Managing Director of Bankers Trust Company (financial services) (1968–1998). | 138 | None. | ||||||||||||
Interested Trustees | |||||||||||||||
| Frankie D. Hughes** (1952), Trustee of Trust since 2008. | Principal and Chief Investment Officer, Hughes Capital Management, Inc. (fixed income asset management) (1993–present). | 138 | None. | ||||||||||||
| Leonard M. Spalding, Jr.*** (1935); Trustee of Trust since 2005; Trustee of heritage JPMorgan Funds since 1998. | Retired; Chief Executive Officer, Chase Mutual Funds (investment company) (1989–1998); President and Chief Executive Officer, Vista Capital Management (investment management) (1990–1998); Chief Investment Executive, Chase Manhattan Private Bank (investment management) (1990–1998). | 138 | Director, Glenview Trust Company, LLC (2001–present); Trustee, St. Catherine College (1998–present); Trustee, Bellarmine University (2000–present); Director, Springfield-Washington County Economic Development Authority (1997–present); Trustee, Catholic Education Foundation (2005–present). | ||||||||||||
| (1) | Each Trustee serves for an indefinite term, subject to the Trust’s current retirement policy, which is age 75 for all Trustees, except Mr. Reid for whom it is age 78. |
| (2) | A Fund Complex means two or more registered investment companies that hold themselves out to investors as related companies for purposes of investment and investor services or have a common investment adviser or have an investment adviser that is an affiliated person of the investment adviser of any of the other registered investment companies. The JPMorgan Funds Complex for which the Board of Trustees serves currently includes eight registered investment companies (138 funds). |
| * | Ms. McCoy has served as Vice President of Administration and Planning for Northwestern University since 1985. William M. Daley, Head of Corporate Responsibility for JPMorgan Chase & Co., has served as a member of the Board of Trustees of Northwestern University since 2005. The Funds’ investment adviser is a wholly-owned subsidiary of JPMorgan Chase & Co. |
| ** | Ms. Hughes is treated as an “interested person” based on the portfolio holdings of clients of Hughes Capital Management, Inc. |
| *** | Mr. Spalding is treated as an “interested person” due to his ownership of JPMorgan Chase stock. |
(Unaudited)
| Name (Year of Birth), Positions Held with the Trust (Since) | | Principal Occupations During Past 5 Years | ||||
|---|---|---|---|---|---|---|
| George C.W. Gatch (1962), President (2005) | Managing Director, J.P. Morgan Investment Management Inc.; Director and President, JPMorgan Distribution Services, Inc. and JPMorgan Funds Management, Inc. since 2005. Mr. Gatch is CEO and President of the JPMorgan Funds. Mr. Gatch has been an employee of JPMorgan since 1986 and has held positions such as President and CEO of DKB Morgan, a Japanese mutual fund company, which was a joint venture between J.P. Morgan and Dai-Ichi Kangyo Bank, as well as positions in business management, marketing, and sales. | |||||
| Robert L. Young (1963), Senior Vice President (2005)* | Director and Vice President, JPMorgan Distribution Services, Inc. and JPMorgan Funds Management, Inc.; Chief Operating Officer, JPMorgan Funds since 2005, and One Group Mutual Funds from 2001 until 2005. Mr. Young was Vice President and Treasurer, JPMorgan Funds Management, Inc. (formerly One Group Administrative Services), and Vice President and Treasurer, JPMorgan Distribution Services, Inc. (formerly One Group Dealer Services, Inc.) from 1999 to 2005. | |||||
| Patricia A. Maleski (1960), Vice President and Chief Administrative Officer (2005), Treasurer and Principal Financial Officer (2008) | Managing Director, JPMorgan Funds Management, Inc.; Head of Funds Administration and Board Liaison, JPMorgan Funds. Ms. Maleski has been with JPMorgan Chase & Co. since 2001. | |||||
| Frank J. Nasta (1964), Secretary (2008) | Managing Director and Associate General Counsel, JPMorgan Chase since 2008; Previously, Director, Managing Director, General Counsel and Corporate Secretary, J & W Seligman & Co. Incorporated; Secretary of each of the investment companies of the Seligman Group of Funds and Seligman Data Corp.; Director and Corporate Secretary, Seligman Advisors, Inc. and Seligman Services, Inc. | |||||
| Stephen M. Ungerman (1953), Chief Compliance Officer (2005) | Managing Director, JPMorgan Chase & Co.; Mr. Ungerman was head of Fund Administration — Pooled Vehicles from 2000 to 2004. Mr. Ungerman has been with JPMorgan Chase & Co. since 2000. | |||||
| Paul L. Gulinello (1950), AML Compliance Officer (2005) | Vice President and Anti Money Laundering Compliance Officer for JPMorgan Asset Management Americas, additionally responsible for personal trading and compliance testing since 2004; Treasury Services Operating Risk Management and Compliance Executive supporting all JPMorgan Treasury Services business units from July 2000 to 2004. | |||||
| Michael J. Tansley (1964), Controller (2008) | Vice President, JPMorgan Funds Management, Inc. since July 2008; prior to joining JPMorgan Chase, Mr. Tansley worked for General Electric, as Global eFinance Leader in GE Money from 2004 through 2008 and Vice President and Controller of GE Asset Management from 1998. | |||||
| Elizabeth A. Davin (1964), Assistant Secretary (2008)* | Vice President and Assistant General Counsel, JPMorgan Chase since 2005; Senior Counsel, JPMorgan Chase (formerly Bank One Corporation) from 2004 to 2005; Assistant General Counsel and Associate General Counsel and Vice President, Gartmore Global Investments, Inc. from 1999 to 2004. | |||||
| Jessica K. Ditullio (1962), Assistant Secretary (2005)* | Vice President and Assistant General Counsel, JPMorgan Chase since 2005; Ms. Ditullio has served as an attorney with various titles for JPMorgan Chase (formerly Bank One Corporation) since 1990. | |||||
| John T. Fitzgerald (1975), Assistant Secretary (2008) | Vice President and Assistant General Counsel, JPMorgan Chase since 2005; Associate, Willkie Farr & Gallagher LLP (law firm) from 2002 to 2005. | |||||
| Brian L. Duncan (1965), Assistant Treasurer (2008)* | Vice President, JPMorgan Funds Management, Inc. since June 2007; prior to joining JPMorgan Chase, Mr. Duncan worked for Penn Treaty American Corporation as Vice President and Controller from 2004 through 2007 and Assistant Vice President of Financial Reporting from 2003–2004. | |||||
| Jeffrey D. House (1972), Assistant Treasurer (2006)* | Vice President, JPMorgan Funds Management, Inc. since July 2006; formerly, Senior Manager of Financial Services of BISYS Fund Services, Inc. from December 1995 until July 2006. | |||||
| Laura S. Melman (1966), Assistant Treasurer (2006) | Vice President, JPMorgan Funds Management, Inc. since August, 2006, responsible for Taxation; Vice President of Structured Products at The Bank of New York Co., Inc. from 2001 until 2006. | |||||
| Francesco Tango (1971), Assistant Treasurer (2007) | Vice President, JPMorgan Funds Management, Inc. since January 2003: Associate, JPMorgan Funds Management, Inc. since 1999. | |||||
| * | The contact address for the officer is 1111 Polaris Parkway, Columbus, OH 43240. |
(Unaudited)
| | Beginning Account Value, September 1, 2008 | | Ending Account Value, February 28, 2009 | | Expenses Paid During September 1, 2008 to February 28, 2009* | | Annualized Expense Ratio | |||||||||||
|---|---|---|---|---|---|---|---|---|---|---|---|---|---|---|---|---|---|---|
Bond Fund | ||||||||||||||||||
Class A | ||||||||||||||||||
| Actual | $ | 1,000.00 | $ | 837.80 | $ | 3.42 | 0.75 | % | ||||||||||
| Hypothetical | 1,000.00 | 1,021.08 | 3.76 | 0.75 | ||||||||||||||
Class B | ||||||||||||||||||
| Actual | 1,000.00 | 835.10 | 6.37 | 1.40 | ||||||||||||||
| Hypothetical | 1,000.00 | 1,017.85 | 7.00 | 1.40 | ||||||||||||||
Class C | ||||||||||||||||||
| Actual | 1,000.00 | 836.00 | 6.37 | 1.40 | ||||||||||||||
| Hypothetical | 1,000.00 | 1,017.85 | 7.00 | 1.40 | ||||||||||||||
Select Class | ||||||||||||||||||
| Actual | 1,000.00 | 838.00 | 2.96 | 0.65 | ||||||||||||||
| Hypothetical | 1,000.00 | 1,021.57 | 3.26 | 0.65 | ||||||||||||||
Institutional Class | ||||||||||||||||||
| Actual | 1,000.00 | 839.60 | 2.23 | 0.49 | ||||||||||||||
| Hypothetical | 1,000.00 | 1,022.36 | 2.46 | 0.49 | ||||||||||||||
Ultra | ||||||||||||||||||
| Actual | 1,000.00 | 840.00 | 1.82 | 0.40 | ||||||||||||||
| Hypothetical | 1,000.00 | 1,022.81 | 2.01 | 0.40 | ||||||||||||||
Emerging Markets Debt Fund | ||||||||||||||||||
Class A | ||||||||||||||||||
| Actual | 1,000.00 | 710.10 | 6.28 | 1.48 | ||||||||||||||
| Hypothetical | 1,000.00 | 1,017.46 | 7.40 | 1.48 | ||||||||||||||
(Unaudited) (continued)
| | Beginning Account Value, September 1, 2008 | | Ending Account Value, February 28, 2009 | | Expenses Paid During September 1, 2008 to February 28, 2009* | | Annualized Expense Ratio | |||||||||||
|---|---|---|---|---|---|---|---|---|---|---|---|---|---|---|---|---|---|---|
Emerging Markets Debt Fund (continued) | ||||||||||||||||||
Class C | ||||||||||||||||||
| Actual | $ | 1,000.00 | $ | 1,291.80 | $ | 11.25 | 1.98 | % | ||||||||||
| Hypothetical | 1,000.00 | 1,014.98 | 9.89 | 1.98 | ||||||||||||||
Class R5 | ||||||||||||||||||
| Actual | 1,000.00 | 711.10 | 4.41 | 1.04 | ||||||||||||||
| Hypothetical | 1,000.00 | 1,019.64 | 5.21 | 1.04 | ||||||||||||||
Select Class | ||||||||||||||||||
| Actual | 1,000.00 | 710.60 | 5.26 | 1.24 | ||||||||||||||
| Hypothetical | 1,000.00 | 1,018.65 | 6.21 | 1.24 | ||||||||||||||
Enhanced Income Fund | ||||||||||||||||||
Institutional Class | ||||||||||||||||||
| Actual | 1,000.00 | 793.30 | 0.89 | 0.20 | ||||||||||||||
| Hypothetical | 1,000.00 | 1,023.80 | 1.00 | 0.20 | ||||||||||||||
Real Return Fund | ||||||||||||||||||
Class A | ||||||||||||||||||
| Actual | 1,000.00 | 908.50 | 4.35 | 0.92 | ||||||||||||||
| Hypothetical | 1,000.00 | 1,020.23 | 4.61 | 0.92 | ||||||||||||||
Class C | ||||||||||||||||||
| Actual | 1,000.00 | 906.20 | 6.71 | 1.42 | ||||||||||||||
| Hypothetical | 1,000.00 | 1,017.75 | 7.10 | 1.42 | ||||||||||||||
Select Class | ||||||||||||||||||
| Actual | 1,000.00 | 909.20 | 3.17 | 0.67 | ||||||||||||||
| Hypothetical | 1,000.00 | 1,021.47 | 3.36 | 0.67 | ||||||||||||||
Institutional Class | ||||||||||||||||||
| Actual | 1,000.00 | 910.50 | 2.42 | 0.51 | ||||||||||||||
| Hypothetical | 1,000.00 | 1,022.27 | 2.56 | 0.51 | ||||||||||||||
Short Term Bond Fund | ||||||||||||||||||
Class A | ||||||||||||||||||
| Actual | 1,000.00 | 771.40 | 3.29 | 0.75 | ||||||||||||||
| Hypothetical | 1,000.00 | 1,021.08 | 3.76 | 0.75 | ||||||||||||||
Select Class | ||||||||||||||||||
| Actual | 1,000.00 | 771.90 | 2.46 | 0.56 | ||||||||||||||
| Hypothetical | 1,000.00 | 1,022.02 | 2.81 | 0.56 | ||||||||||||||
Institutional Class | ||||||||||||||||||
| Actual | 1,000.00 | 773.30 | 1.32 | 0.30 | ||||||||||||||
| Hypothetical | 1,000.00 | 1,023.31 | 1.51 | 0.30 | ||||||||||||||
Short Term Bond Fund II | ||||||||||||||||||
Class A | ||||||||||||||||||
| Actual | 1,000.00 | 967.10 | 3.66 | 0.75 | ||||||||||||||
| Hypothetical | 1,000.00 | 1,021.08 | 3.76 | 0.75 | ||||||||||||||
Class M | ||||||||||||||||||
| Actual | 1,000.00 | 966.00 | 4.87 | 1.00 | ||||||||||||||
| Hypothetical | 1,000.00 | 1,019.84 | 5.01 | 1.00 | ||||||||||||||
Select Class | ||||||||||||||||||
| Actual | 1,000.00 | 967.50 | 2.44 | 0.50 | ||||||||||||||
| Hypothetical | 1,000.00 | 1,022.32 | 2.51 | 0.50 | ||||||||||||||
| * | Expenses are equal to the Funds’ annualized expense ratio, multiplied by the average account value over the period, multiplied by 181/365 to reflect the one-half year period). |
(Unaudited)
| | Qualified Interest Income | |||||
|---|---|---|---|---|---|---|
| Bond Fund | $ | 28,674 | ||||
| Short Term Bond Fund | 15,135 | |||||
| Short Term Bond Fund II | 5,727 | |||||
| | Income from U.S. Treasury Obligations | |||||
|---|---|---|---|---|---|---|
| Bond Fund | 3.09 | % | ||||
| Emerging Markets Debt Fund | 16.49 | |||||
| Enhanced Income Fund | 4.01 | |||||
| Real Return Fund | 97.19 | |||||
| Short Term Bond Fund | 23.64 | |||||
| Short Term Bond Fund II | 7.00 | |||||


| © JPMorgan Chase & Co., 2009 All rights reserved. February 2009. | AN-INC-209 | |||||
|---|---|---|---|---|---|---|
ITEM 2. CODE OF ETHICS.
Disclose whether, as of the end of the period covered by the report, the registrant has adopted a code of ethics that applies to the registrant’s principal executive officer, principal financial officer, principal accounting officer or controller, or persons performing similar functions, regardless of whether these individuals are employed by the registrant or a third party. If the registrant has not adopted such a code of ethics, explain why it has not done so.
The registrant must briefly describe the nature of any amendment, during the period covered by the report, to a provision of its code of ethics that applies to the registrant’s principal executive officer, principal financial officer, principal accounting officer or controller, or persons performing similar functions, regardless of whether these individuals are employed by the registrant or a third party, and that relates to any element of the code of ethics definition enumerated in paragraph (b) of this Item. The registrant must file a copy of any such amendment as an exhibit pursuant to Item 12(a)(1), unless the registrant has elected to satisfy paragraph (f) of this Item by positing its code of ethics on its website pursuant to paragraph (f)(2) of this Item, or by undertaking to provide its code of ethics to any person without charge, upon request, pursuant to paragraph (f)(3) of this Item.
If the registrant has, during the period covered by the report, granted a waiver, including an implicit waiver, from a provision of the code of ethics that applies to the registrant’s principal executive officer, principal financial officer, principal accounting officer or controller, or persons performing similar functions, regardless of whether these individuals are employed by the registrant or third party, that relates to one or more items set forth in paragraph (b) of this Item, the registrant must briefly describe the nature of the waiver, the name of the person to whom the waiver was granted, and the date of the waiver.
The Registrant has adopted a code of ethics that applies to the Registrant’s principal executive officer and principal financial officer. There were no amendments to the code of ethics or waivers granted with respect to the code of ethics in the period covered by the report.
ITEM 3. AUDIT COMMITTEE FINANCIAL EXPERT.
(a) (1) Disclose that the registrant’s board of directors has determined that the registrant either:
(i) Has at least one audit committee financial expert serving on its audit committee; or
(ii) Does not have an audit committee financial expert serving on its audit committee.
The Registrant’s Board of Trustees has determined that the Registrant has at least one audit committee financial expert serving on its audit committee. The Securities and Exchange Commission has stated that the designation or identification of a person as an audit committee financial expert pursuant to this Item 3 of Form N-CSR does not impose on such person any duties, obligations or liabilities that are greater than the duties, obligations and liabilities imposed on such person as a member of the Audit Committee and the Board of Trustees in the absence of such designation or identification.
(2) If the registrant provides the disclosure required by paragraph (a)(1)(i) of this Item, it must disclose the name of the audit committee financial expert and whether that person is “independent.” In order to be considered “independent” for purposes of this Item, a member of an audit committee may not, other than in his or her capacity as a member of the audit committee, the board of directors, or any other board committee:
(i) Accept directly or indirectly any consulting, advisory, or other compensatory fee from the issuer; or
(ii) Be an “interested person” of the investment company as defined in Section 2(a)(19) of the Act (15 U.S.C. 80a-2(a)(19)).
The audit committee financial expert is William Armstrong. He is not an “interested person” of the Registrant and is also “independent” as defined by the U.S. Securities and Exchange Commission for purposes of audit committee financial expert determinations.
(3) If the registrant provides the disclosure required by paragraph (a)(1)(ii) of this Item, it must explain why it does not have an audit committee financial expert.
Not applicable.
ITEM 4. PRINCIPAL ACCOUNTANT FEES AND SERVICES.
(a) Disclose, under the caption Audit Fees, the aggregate fees billed for each of the last two fiscal years for professional
services rendered by the principal accountant for the audit of the registrant’s annual financial statements or services that are normally provided by the accountant in connection with statutory and regulatory filings or engagements for those fiscal years.
AUDIT FEES
2009 – $92,500
2008 – $91,800
(b) Disclose, under the caption Audit-Related Fees, the aggregate fees billed in each of the last two fiscal years for assurance and related services by the principal accountant that are reasonably related to the performance of the audit of the registrant’s financial statements and are not reported under paragraph (a) of this Item. Registrants shall describe the nature of the services comprising the fees disclosed under this category.
AUDIT-RELATED FEES (On a calendar year basis)
2008 – $18,890,000
2007 – $15,213,000
The audit-related fees consist of aggregate fees billed for assurance and related services by the independent registered public accounting firm to the Registrant’s investment adviser (not including any sub-adviser whose role is primarily portfolio management and is subcontracted with or overseen by another investment adviser), and any entity controlling, controlled by or under common control with the investment adviser that provides ongoing services to the Registrant (“Service Affiliates”), that were reasonably related to the performance of the annual audit of the Registrant's financial statements.
(c) Disclose, under the caption Tax Fees, the aggregate fees billed in each of the last two fiscal years for professional services rendered by the principal accountant for tax compliance, tax advice, and tax planning. Registrants shall describe the nature of the services comprising the fees disclosed under this category.
TAX FEES
2009 – $9,670
2008 – $9,660
The tax fees consist of fees billed in connection with preparing the federal regulated investment company income tax returns for the Registrant for the tax years ended February 28, 2009 and February 29, 2008, respectively.
For the last fiscal year, no tax fees were required to be approved pursuant to paragraph (c)(7)(ii) of Rule 2-01 of Regulation S-X.
(d) Disclose, under the caption All Other Fees, the aggregate fees billed in each of the last two fiscal years for products and services provided by the principal accountant, other than the services reported in paragraphs (a) through (c) of this Item. Registrants shall describe the nature of the services comprising the fees disclosed under this category.
ALL OTHER FEES
2009 – Not applicable
2008 – $20,000*
* Services for language translation of financial reports.
(e) (1) Disclose the audit committee’s pre-approval policies and procedures described in paragraph (c)(7) of Rule 2-01 of Regulation S-X.
Pursuant to the Registrant’s Audit Committee Charter and written policies and procedures for the pre-approval of audit and non-audit services (the “Pre-approval Policy”), the Audit Committee pre-approves all audit and non-audit services performed by the Registrant’s independent public registered accounting firm for the Registrant. In addition, the Audit Committee pre-approves the auditor’s engagement for non-audit services with the Registrant’s investment adviser (not including a sub-adviser whose role is primarily portfolio management and is sub-contracted or overseen by another investment adviser) and any Service Affiliate in accordance with paragraph (c)(7)(ii) of Rule 2-01 of Regulation S-X, if the
engagement relates directly to the operations and financial reporting of the Registrant. Proposed services may be pre-approved either 1) without consideration of specific case-by-case services or 2) require the specific pre-approval of the Audit Committee. Therefore, initially the Pre-approval Policy listed a number of audit and non-audit services that have been approved by the Audit Committee, or which were not subject to pre-approval under the transition provisions of Sarbanes-Oxley Act of 2002 (the “Pre-approval List”). The Audit Committee annually reviews and pre-approves the services included on the Pre-approval List that may be provided by the independent public registered accounting firm without obtaining additional specific pre-approval of individual services from the Audit Committee. The Audit Committee adds to, or subtracts from, the list of general pre-approved services from time to time, based on subsequent de terminations. All other audit and non-audit services not on the Pre-approval List must be specifically pre-approved by the Audit Committee.
One or more members of the Audit Committee may be appointed as the Committee’s delegate for the purposes of considering whether to approve such services. Any pre-approvals granted by the delegate will be reported, for informational purposes only, to the Audit Committee at its next scheduled meeting. The Audit Committee’s responsibilities to pre-approve services performed by the independent public registered accounting firm are not delegated to management.
(2) Disclose the percentage of services described in each of paragraphs (b) through (d) of this Item that were approved by the audit committee pursuant to paragraph (c)(7)(i)(C) of Rule 2-01 of Regulation S-X.
2009 – 0.0%
2008 – 0.0%
(f) If greater than 50 percent, disclose the percentage of hours expended on the principal accountant’s engagement to audit the registrant’s financial statements for the most recent fiscal year that were attributed to work performed by persons other than the principal accountant’s full-time, permanent employees.
None.
(g) Disclose the aggregate non-audit fees billed by the registrant’s accountant for services rendered to the registrant, and rendered to the registrant’s investment adviser (not including any sub-adviser whose role is primarily portfolio management and is subcontracted with or overseen by another investment adviser), and any entity controlling, controlled by, or under common control with the adviser that provides ongoing services to the registrant for each of the last two fiscal years of the registrant.
The aggregate non-audit fees billed by the independent registered public accounting firm for services rendered to the Registrant, and rendered to Service Affiliates, for the last two calendar year ends were $24.8 million in 2008 and $19.9 million in 2007.
(h) Disclose whether the registrant’s audit committee of the board of directors has considered whether the provision of non-audit services that were rendered to the registrant’s investment adviser (not including any subadviser whose role is primarily portfolio management and is subcontracted with or overseen by another investment adviser), and any entity controlling, controlled by, or under common control with the investment adviser that provides ongoing services to the registrant that were not pre-approved pursuant to paragraph (c)(7)(ii) of Rule 2-01 of Regulation S-X is compatible with maintaining the principal accountant’s independence.
The Registrant’s Audit Committee has considered whether the provision of the non-audit services that were rendered to Service Affiliates that were not pre-approved (not requiring pre-approval) is compatible with maintaining the independent public registered accounting firm’s independence. All services provided by the independent public registered accounting firm to the Registrant or to Service Affiliates that were required to be pre-approved were pre-approved as required.
ITEM 5. AUDIT COMMITTEE OF LISTED REGISTRANTS.
(a) If the registrant is a listed issuer as defined in Rule 10A-3 under the Exchange Act (17CFR 240.10A-3), state whether or not the registrant has a separately-designated standing audit committee established in accordance with Section 3(a)(58)(A) of the Exchange Act (15 U.S.C. 78c(a)(58)(A)). If the registrant has such a committee, however designated, identify each committee member. If the entire board of directors is acting as the registrant’s audit committee as specified in Section 3(a)(58)(B) of the Exchange Act (15 U.S.C. 78c(a)(58)(B)), so state.
(b) If applicable, provide the disclosure required by Rule 10A-3(d) under the Exchange Act (17CFR 240.10A-3(d)) regarding an exemption from the listing standards for all audit committees.
Not applicable.
ITEM 6. SCHEDULE OF INVESTMENTS.
File Schedule I – Investments in securities of unaffiliated issuers as of the close of the reporting period as set forth in Section 210.12-12 of Regulation S-X, unless the schedule is included as part of the report to shareholders filed under Item 1 of this Form.
Included in Item 1.
ITEM 7. DISCLOSURE OF PROXY VOTING POLICIES AND PROCEDURES FOR CLOSED-END MANAGEMENT INVESTMENT COMPANIES.
A closed-end management investment company that is filing an annual report on this Form N-CSR must, unless it invests exclusively in non-voting securities, describe the policies and procedures that it uses to determine how to vote proxies relating to portfolio securities, including the procedures that the company uses when a vote presents a conflict between the interests of its shareholders, on the one hand, and those of the company’s investment adviser; principal underwriter; or any affiliated person (as defined in Section 2(a)(3) of the Investment Company Act of 1940 (15 U.S.C. 80a-2(a)(3)) and the rules thereunder) of the company, its investment adviser, or its principal underwriter, on the other. Include any policies and procedures of the company’s investment adviser, or any other third party, that the company uses, or that are used on the company’s behalf, to determine how to vote proxies relating to portfolio securities.
Not applicable.
ITEM 8. PORTFOLIO MANAGERS OF CLOSED-END MANAGEMENT INVESTMENT COMPANIES.
Not applicable.
ITEM 9. PURCHASE OF EQUITY SECURITIES BY CLOSED-END MANAGEMENT INVESTMENT COMPANY AND AFFILIATED PURCHASERS.
(a) If the registrant is a closed-end management investment company, provide the information specified in paragraph (b) of this Item with respect to any purchase made by or on behalf of the registrant or any "affiliated purchaser," as defined in Rule 10b-18(a)(3) under the Exchange Act (17 CFR 240.10b-18(a)(3)), of shares or other units of any class of the registrant's equity securities that is registered by the registrant pursuant to Section 12 of the Exchange Act (15 U.S.C. 781).
Not applicable.
ITEM 10. SUBMISSION OF MATTERS TO A VOTE OF SECURITY HOLDERS.
Describe any material changes to the procedures by which shareholders may recommend nominees to the registrant's board of directors, where those changes were implemented after the registrant last provided disclosure in response to the requirements of Item 7(d)(2)(ii)(G) of Schedule 14A (17 CFR 240.14a-101), or this Item.
No material changes to report.
ITEM 11. CONTROLS AND PROCEDURES.
(a) Disclose the conclusions of the registrant’s principal executive and principal financial officers, or persons performing similar functions, regarding the effectiveness of the registrant’s disclosure controls and procedures (as defined in Rule 30a-3(c) under the Act (17 CFR 270.30a-3(c))) as of a date within 90 days of the filing date of the report that includes the disclosure required by this
paragraph, based on the evaluation of these controls and procedures required by Rule 30a-3(b) under the Act (17 CFR 270.30a-3(b)) and Rules 13a-15(b) or 15d-15(b) under the Exchange Act (17 CFR 240.13a-15(b) or 240.15d-15(b)).
The Registrant's principal executive and principal financial officers have concluded, based on their evaluation of the Registrant's disclosure controls and procedures as of a date within 90 days of the filing date of this report, that the Registrant's disclosure controls and procedures are reasonably designed to ensure that information required to be disclosed by the Registrant on Form N-CSR is recorded, processed, summarized and reported within the required time periods and that information required to be disclosed by the Registrant in the reports that it files or submits on Form N-CSR is accumulated and communicated to the Registrant's management, including its principal executive and principal financial officers, as appropriate to allow timely decisions regarding required disclosure.
(b) Disclose any change in the registrant’s internal control over financial reporting (as defined in Rule 30a-3(d) under the Act (17 CFR 270.30a-3(d)) that occurred during the registrant's second fiscal quarter of the period covered by this report that has materially affected, or is reasonably likely to materially affect, the registrant's internal control over financial reporting.
There were no changes in the Registrant's internal control over financial reporting that occurred during the last fiscal quarter covered by this report that have materially affected, or are reasonably likely to materially affect, the Registrant's internal control over financial reporting.
ITEM 12. EXHIBITS.
(a) File the exhibits listed below as part of this Form. Letter or number the exhibits in the sequence indicated.
(a)(1) Any code of ethics, or amendment thereto, that is the subject of the disclosure required by Item 2, to the extent that the registrant intends to satisfy the Item 2 requirements through filing of an exhibit.
Code of Ethics applicable to its Principal Executive and Principal Financial Officers pursuant to Section 406 of the Sarbanes-Oxley Act of 2002 attached hereto.
(a)(2) A separate certification for each principal executive officer and principal financial officer of the registrant as required by Rule 30a-2(a) under the Act (17 CFR 270.30a-2).
Certifications pursuant to Rule 30a-2(a) under the Investment Company Act of 1940 are attached hereto.
(a)(3) Any written solicitation to purchase securities under Rule 23c-1 under the Act (17 CFR 270.23c-1) sent or given during the period covered by the report by or on behalf of the registrant to 10 or more persons.
Not applicable.
(b) A separate or combined certification for each principal executive officer and principal officer of the registrant as required by Rule 30a-2(b) under the Act of 1940.
Certifications pursuant to Rule 30a-2(b) under the Investment Company Act of 1940 are attached hereto.
SIGNATURES
Pursuant to the requirements of the Securities Exchange Act of 1934 and the Investment Company Act of 1940, the registrant has duly caused this report to be signed on its behalf by the undersigned, thereunto duly authorized.
J.P. Morgan Mutual Fund Group
By:
/s/_____________________________
George C.W. Gatch
President and Principal Executive Officer
May 8, 2009
Pursuant to the requirements of the Securities Exchange Act of 1934 and the Investment Company Act of 1940, this report has been signed below by the following persons on behalf of the registrant and in the capacities and on the dates indicated.
By:
/s/___________________________
George C.W. Gatch
President and Principal Executive Officer
May 8, 2009
By:
/s/____________________________
Patricia A. Maleski
Treasurer and Principal Financial Officer
May 8, 2009