UNITED STATES
SECURITIES AND EXCHANGE COMMISSION
Washington, D.C. 20549
FORM N-CSR
CERTIFIED SHAREHOLDER REPORT OF REGISTERED
MANAGEMENT INVESTMENT COMPANIES
Investment Company Act file number | 811-5162 |
|
Delaware VIP Trust |
(Exact name of registrant as specified in charter) |
|
2005 Market Street Philadelphia, PA | | 19103 |
(Address of principal executive offices) | | (Zip code) |
|
David F. Connor, Esq. 2005 Market Street Philadelphia, PA 19103 |
(Name and address of agent for service) |
|
Registrant’s telephone number, including area code: | (800) 523-1918 | |
|
Date of fiscal year end: | December 31 | |
|
Date of reporting period: | December 31, 2006 | |
| | | | | | | | |
Item 1. Reports to Stockholders
Delaware VIP Trust — Delaware VIP Balanced Series
For the 12-month period ended December 31, 2006, the Delaware VIP Balanced Series showed a positive return of 16.20% for Standard Class shares with distributions reinvested, as Service Class shares gained 15.88% with distributions reinvested. The benchmarks for the Series are the Standard & Poor's 500 Index, which gained 15.78%, and the Lehman Brothers Aggregate Bond Index, which returned +4.33% (source: Lipper).
Expecting a slowdown in the economy and a reduced rate of corporate earnings growth during the fiscal year, we believed it was prudent to position the equity portion of the Series more defensively than usual. As a result, we had more holdings in less economically sensitive sectors, such as healthcare and consumer staples, than those reflected in the benchmark indices. The Series' equity allocation was underweight relative to the S&P 500 Index in the more economically sensitive areas, such as consumer discretionary.
We regularly looked to invest in undervalued companies with good business models and prices that we believed were well below their intrinsic value. During this recent period, we focused on companies that we believed to have particularly sound balance sheets, strong dividend yields, and the potential to continue generating relatively stable earnings, even in a weaker economy. This approach led us to hold smaller positions in the energy and industrial sectors relative to the benchmark indices, both of which tend to be relatively sensitive to economic changes.
Despite being faced with rising interest rates during the first half of the year, the fixed income markets had positive total returns for the year as measured by the 4.33% advance of the broad Lehman Brothers Aggregate Bond Index for 2006. While bond market returns trailed those of equities, the Series' fixed income allocation continued to provide an important counterweight to stock holdings. Throughout the year, we continued to hold a broad array of fixed income assets, with the largest holdings at year-end falling into the categories of government agency bonds and U.S. Treasury holdings.
The views expressed are current as of the date of this report and are subject to change.
The performance data quoted below and on the next page represent past performance; past performance does not guarantee future results. Investment return and principal value of an investment will fluctuate so that your shares, when redeemed, may be worth more or less than their original cost. Current performance may be lower or higher than the performance data quoted. Please obtain the performance data for the most recent month end by calling the number noted on the page related to this Series in the introductory section of this report.
You should consider the investment objectives, risks, charges, and expenses of the investment carefully before investing. The Delaware VIP Balanced Series prospectus contains this and other important information about the Series. To obtain a prospectus, contact the company noted on the page related to this Series in the introductory section of this report, either by phone or through the company Web site. We advise you to read the prospectus carefully before you invest.
Delaware VIP Balanced Series
Average Annual Total Returns
For the periods ending Dec. 31, 2006 | | 1 Year | | 5 Years | | 10 Years | | Lifetime | |
| Standard Class Shares* | | | +16.20 | % | | | +4.94 | % | | | +4.64 | % | | | +8.17 | % | |
| Service Class Shares** | | | +15.88 | % | | | +4.71 | % | | | NA | | | | +2.55 | % | |
* Commenced operations on July 28, 1988
** Commenced operations on May 1, 2000
Balanced Series- 1
Delaware VIP Trust — Delaware VIP Balanced Series (continued)
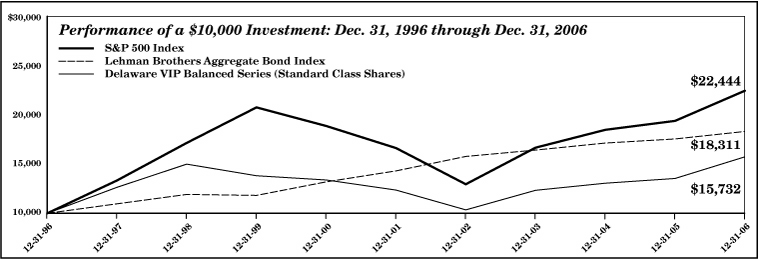
The chart shows a $10,000 investment in the Delaware VIP Balanced Series Standard Class shares for the period from Dec. 31, 1996 through Dec. 31, 2006. All distributions were reinvested. The chart also shows $10,000 invested in the Lehman Brothers Aggregate Bond Index and S&P 500 Index for the period from Dec. 31, 1996 through Dec. 31, 2006.
Lehman Brothers Aggregate Bond Index measures the performance of a large group of high quality, fixed income securities across the government, corporate, mortgage-backed, asset-backed, and commercial mortgage-backed markets. The S&P 500 Index measures the performance of mostly large-capitalization U.S. companies. An index is unmanaged and does not reflect the costs of operating a mutual fund, such as the costs of buying, selling, and holding securities. You cannot invest directly in an index.
Earnings from a variable annuity or variable life investment compound tax free until withdrawal, so no adjustments were made for income taxes.
An expense limitation was in effect for the Delaware VIP Balanced Series during the periods shown.
Performance of Service Class shares will vary due to different charges and expenses.
Performance does not reflect insurance fees related to a variable annuity or variable life investment or the deferred sales charge that would apply to certain withdrawals of investments held for fewer than eight years. Performance shown here would have been reduced if such fees were included and the expense limitation was removed. For more information about fees, consult your variable annuity or variable life prospectus.
Investments in variable products involve risk. A rise or fall in interest rates can have a significant impact on bond prices and the net asset value (NAV) of the Series. Series that invest in bonds may lose their value as interest rates rise, and an investor may lose principal. High yielding, noninvestment grade bonds involve higher risk than investment grade bonds. Adverse conditions may affect the issuer's ability to pay interest and principal on these securities. The Series may be invested in emerging markets and foreign high yield corporate bonds, which have special risks that include currency fluctuations, economic and political change, and different accounting standards. Some portfolios offer more risk than others. Please read both the contract and underlying prospectus for specific details regarding the product's risk profile.
Balanced Series- 2
Delaware VIP Trust — Delaware VIP Balanced Series
Disclosure of Series Expenses
For the Period July 1, 2006 to December 31, 2006
As a shareholder of the Series, you incur ongoing costs, including management fees; distribution and/or service (12b-1) fees; and other Series expenses. This Example is intended to help you understand your ongoing costs (in dollars) of investing in the Series and to compare these costs with the ongoing costs of investing in other mutual funds.
The Example is based on an investment of $1,000 invested at the beginning of the period and held for the entire period from July 1, 2006 to December 31, 2006.
Actual Expenses
The first section of the table shown, "Actual Series Return," provides information about actual account values and actual expenses. You may use the information in this section of the table, together with the amount you invested, to estimate the expenses that you paid over the period. Simply divide your account value by $1,000 (for example, an $8,600 account value divided by $1,000 = 8.6), then multiply the result by the number in the first section under the heading entitled "Expenses Paid During Period" to estimate the expenses you paid on your account during the period.
Hypothetical Example for Comparison Purposes
The second section of the table shown, "Hypothetical 5% Return," provides information about hypothetical account values and hypothetical expenses based on the Series' actual expense ratio and an assumed rate of return of 5% per year before expenses, which is not the Series' actual return. The hypothetical account values and expenses may not be used to estimate the actual ending account balance or expenses you paid for the period. You may use this information to compare the ongoing costs of investing in the Series and other funds. To do so, compare the 5% hypothetical example with the 5% hypothetical examples that appear in the shareholder reports of other funds.
Please note that the expenses shown in the table are meant to highlight your ongoing costs only. As a shareholder of the Series, you do not incur any transaction costs, such as sales charges (loads), redemption fees or exchange fees, but shareholders of other funds may incur such costs. Also, the fees related to the variable annuity investment or the deferred sales charge that could apply have not been included. Therefore, the second section of the table is useful in comparing ongoing costs only, and will not help you determine the relative total costs of owning different funds. The Series' actual expenses shown in the table reflect fee waivers in effect. The expenses shown in the table assume reinvestment of all dividends and distributions.
Expense Analysis of an Investment of $1,000
| | | Beginning
Account
Value
7/1/06 | | Ending
Account
Value
12/31/06 | | Annualized
Expense
Ratios | | Expenses
Paid During
Period
7/1/06 to
12/31/06* | |
| Actual Series Return | |
| Standard Class | | $ | 1,000.00 | | | $ | 1,119.60 | | | | 0.82 | % | | $ | 4.38 | | |
| Service Class | | | 1,000.00 | | | | 1,118.10 | | | | 1.07 | % | | | 5.71 | | |
| Hypothetical 5% Return (5% return before expenses) | |
| Standard Class | | $ | 1,000.00 | | | $ | 1,021.07 | | | | 0.82 | % | | $ | 4.18 | | |
| Service Class | | | 1,000.00 | | | | 1,019.81 | | | | 1.07 | % | | | 5.45 | | |
*"Expenses Paid During Period" are equal to the Series' annualized expense ratio, multiplied by the average account value over the period, multiplied by 184/365 (to reflect the one-half year period).
Balanced Series- 3
Delaware VIP Trust — Delaware VIP Balanced Series
Sector Allocation and Credit Rating Breakdown
As of December 31, 2006
Sector designations may be different than the sector designations presented in other Series materials.
| Sector | | Percentage
of Net Assets | |
| Common Stock | | | 61.09 | % | |
| Consumer Discretionary | | | 5.26 | % | |
| Consumer Staples | | | 7.43 | % | |
| Energy | | | 3.78 | % | |
| Financials | | | 14.86 | % | |
| Health Care | | | 11.05 | % | |
| Industrials | | | 3.76 | % | |
| Information Technology | | | 7.39 | % | |
| Materials | | | 1.89 | % | |
| Telecommunications | | | 3.82 | % | |
| Utilities | | | 1.85 | % | |
| Preferred Stock | | | 0.06 | % | |
| Agency Asset-Backed Securities | | | 0.01 | % | |
| Agency Collateralized Mortgage Obligations | | | 1.75 | % | |
| Agency Mortgage-Backed Securities | | | 5.56 | % | |
| Agency Obligations | | | 0.62 | % | |
| Commercial Mortgage-Backed Securities | | | 2.26 | % | |
| Corporate Bonds | | | 11.49 | % | |
| Banking | | | 1.60 | % | |
| Basic Industry | | | 0.27 | % | |
| Brokerage | | | 0.78 | % | |
| Capital Goods | | | 0.27 | % | |
| Communications | | | 1.76 | % | |
| Consumer Cyclical | | | 0.68 | % | |
| Consumer Non-Cyclical | | | 0.53 | % | |
| Electric | | | 1.25 | % | |
| Energy | | | 0.53 | % | |
| Finance Companies | | | 0.70 | % | |
| Industrial | | | 0.01 | % | |
| Insurance | | | 1.51 | % | |
| Natural Gas | | | 0.94 | % | |
| Real Estate | | | 0.21 | % | |
| Technology & Electronics | | | 0.02 | % | |
| Transportation | | | 0.43 | % | |
| Foreign Agencies | | | 0.16 | % | |
| Municipal Bonds | | | 0.95 | % | |
| Non-Agency Asset-Backed Securities | | | 2.46 | % | |
| Non-Agency Collateralized Mortgage Obligations | | | 8.47 | % | |
| U.S. Treasury Obligations | | | 3.18 | % | |
| Repurchase Agreements | | | 5.49 | % | |
| Securities Lending Collateral | | | 6.57 | % | |
| Fixed Rate Note | | | 1.24 | % | |
| Variable Rate Notes | | | 5.33 | % | |
| Total Market Value of Securities | | | 110.12 | % | |
| Obligation to Return Securities Lending Collateral | | | (6.57 | %) | |
| Liabilities Net of Receivables and Other Assets | | | (3.55 | %) | |
| Total Net Assets | | | 100.00 | % | |
Credit Rating Breakdown
(as a % of fixed income investments) | |
| AAA | | | 66.85 | % | |
| AA | | | 4.24 | % | |
| A | | | 8.53 | % | |
| BBB | | | 18.40 | % | |
| BB | | | 0.56 | % | |
| B | | | 1.13 | % | |
| CCC | | | 0.21 | % | |
| Not Rated | | | 0.08 | % | |
| Total | | | 100.00 | % | |
Balanced Series-4
Delaware VIP Trust — Delaware VIP Balanced Series
Statement of Net Assets
December 31, 2006
| | | Number of
Shares | | Market
Value
(U.S. $) | |
| COMMON STOCK–61.09% | |
| Consumer Discretionary–5.26% | |
| Gap | | | 33,800 | | | $ | 659,100 | | |
| † Idearc | | | 860 | | | | 24,639 | | |
| Limited Brands | | | 19,900 | | | | 575,906 | | |
| Mattel | | | 27,200 | | | | 616,352 | | |
| | | | | | | | 1,875,997 | | |
| Consumer Staples–7.43% | |
| ConAgra Foods | | | 24,900 | | | | 672,300 | | |
| Heinz (H.J.) | | | 14,400 | | | | 648,144 | | |
| Kimberly-Clark | | | 9,800 | | | | 665,910 | | |
| Safeway | | | 19,100 | | | | 660,096 | | |
| | | | | | | | 2,646,450 | | |
| Energy–3.78% | |
| Chevron | | | 9,400 | | | | 691,182 | | |
| ConocoPhillips | | | 9,100 | | | | 654,745 | | |
| | | | | | | | 1,345,927 | | |
| Financials–14.86% | |
| Allstate | | | 10,100 | | | | 657,611 | | |
| * Aon | | | 18,900 | | | | 667,926 | | |
| Chubb | | | 12,000 | | | | 634,920 | | |
| Hartford Financial Services | | | 7,300 | | | | 681,163 | | |
| Huntington Bancshares | | | 26,700 | | | | 634,125 | | |
| Morgan Stanley | | | 8,100 | | | | 659,583 | | |
| Wachovia | | | 12,000 | | | | 683,399 | | |
| Washington Mutual | | | 14,900 | | | | 677,801 | | |
| | | | | | | | 5,296,528 | | |
| Health Care–11.05% | |
| Abbott Laboratories | | | 13,900 | | | | 677,069 | | |
| Baxter International | | | 14,100 | | | | 654,099 | | |
| Bristol-Myers Squibb | | | 27,100 | | | | 713,272 | | |
| Merck & Co | | | 14,200 | | | | 619,120 | | |
| Pfizer | | | 23,800 | | | | 616,420 | | |
| Wyeth | | | 12,900 | | | | 656,868 | | |
| | | | | | | | 3,936,848 | | |
| Industrials–3.76% | |
| Donnelley (R.R.) & Sons | | | 19,500 | | | | 693,030 | | |
| Waste Management | | | 17,600 | | | | 647,152 | | |
| | | | | | | | 1,340,182 | | |
| Information Technology–7.39% | |
| Hewlett-Packard | | | 16,100 | | | | 663,159 | | |
| * Intel | | | 31,000 | | | | 627,750 | | |
| International Business Machines | | | 7,000 | | | | 680,050 | | |
| † Xerox | | | 39,100 | | | | 662,745 | | |
| | | | | | | | 2,633,704 | | |
| Materials–1.89% | |
| duPont (E.I.) deNemours | | | 13,800 | | | | 672,198 | | |
| | | | | | | | 672,198 | | |
| Telecommunications–3.82% | |
| AT&T | | | 18,600 | | | | 664,950 | | |
| Verizon Communications | | | 18,700 | | | | 696,388 | | |
| | | | | | | | 1,361,338 | | |
| Utilities–1.85% | |
| * Progress Energy | | | 13,400 | | | | 657,672 | | |
| | | | | | | | 657,672 | | |
Total Common Stock
(cost $17,866,449) | | | | | | | 21,766,844 | | |
| | | Number of
Shares | | Market
Value
(U.S. $) | |
| PREFERRED STOCK–0.06% | |
| Nexen 7.35% | | | 790 | | | $ | 20,382 | | |
Total Preferred Stock
(cost $19,750) | | | | | | | 20,382 | | |
| | | Principal
Amount
(U.S. $) | | | |
AGENCY ASSET-BACKED
SECURITIES–0.01% | |
• Fannie Mae Whole Loan
Series 2002-W11 AV1 5.69% 11/25/32 | | $ | 3,677 | | | | 3,676 | | |
Total Agency Asset-Backed Securities
(cost $3,678) | | | | | | | 3,676 | | |
AGENCY COLLATERALIZED
MORTGAGE OBLIGATIONS–1.75% | |
Fannie Mae
Series 1996-46 ZA 7.50% 11/25/26 | | | 20,341 | | | | 21,010 | | |
| Series 2003-122 AJ 4.50% 2/25/28 | | | 19,709 | | | | 19,220 | | |
| Series 2005-110 MB 5.50% 9/25/35 | | | 60,000 | | | | 60,150 | | |
| Series 2006-M2 A2F 5.259% 5/25/20 | | | 80,000 | | | | 79,152 | | |
Fannie Mae Grantor Trust
Series 2001-T8 A2 9.50% 7/25/41 | | | 17,166 | | | | 18,486 | | |
Fannie Mae Whole Loan
Series 2004-W9 2A1 6.50% 2/25/44 | | | 29,511 | | | | 30,196 | | |
| Series 2004-W11 1A2 6.50% 5/25/44 | | | 31,457 | | | | 32,197 | | |
Freddie Mac
Series 1730 Z 7.00% 5/15/24 | | | 16,934 | | | | 17,651 | | |
| Series 2326 ZQ 6.50% 6/15/31 | | | 79,706 | | | | 82,521 | | |
| Series 2480 EH 6.00% 11/15/31 | | | 1,468 | | | | 1,467 | | |
| Series 2662 MA 4.50% 10/15/31 | | | 37,418 | | | | 36,648 | | |
| Series 2872 GC 5.00% 11/15/29 | | | 40,000 | | | | 39,136 | | |
| Series 2890 PC 5.00% 7/15/30 | | | 65,000 | | | | 63,550 | | |
| Series 3022 MB 5.00% 12/15/28 | | | 30,000 | | | | 29,561 | | |
| Series 3063 PC 5.00% 2/15/29 | | | 60,000 | | | | 59,071 | | |
t Freddie Mac Structured Pass Through
Securities
Series T-58 2A 6.50% 9/25/43 | | | 32,181 | | | | 32,857 | | |
Total Agency Collateralized
Mortgage Obligations (cost $633,928) | | | | | | | 622,873 | | |
AGENCY MORTGAGE-BACKED
SECURITIES–5.56% | |
| Fannie Mae 6.50% 8/1/17 | | | 22,942 | | | | 23,352 | | |
Fannie Mae Relocation 30 yr
5.00% 11/1/33 | | | 56,586 | | | | 55,136 | | |
| 5.00% 11/1/34 | | | 36,530 | | | | 35,570 | | |
Fannie Mae S.F. 15 yr TBA
6.00% 1/1/22 | | | 80,000 | | | | 81,125 | | |
Fannie Mae S.F. 30 yr
5.50% 3/1/29 | | | 71,657 | | | | 71,196 | | |
| 5.50% 4/1/29 | | | 78,647 | | | | 78,141 | | |
| 7.50% 6/1/31 | | | 27,107 | | | | 28,226 | | |
| 9.50% 6/1/19 | | | 7,363 | | | | 7,774 | | |
Balanced Series- 5
Delaware VIP Balanced Series
Statement of Net Assets (continued)
| | | Principal
Amount
(U.S. $) | | Market
Value
(U.S. $) | |
AGENCY MORTGAGE-BACKED
SECURITIES (continued) | |
Fannie Mae S.F. 30 yr TBA
5.00% 1/1/37 | | $ | 330,000 | | | $ | 318,656 | | |
| 5.50% 1/1/37 | | | 970,000 | | | | 958,785 | | |
| 6.00% 1/25/37 | | | 40,000 | | | | 40,275 | | |
| 6.50% 1/1/37 | | | 25,000 | | | | 25,477 | | |
| • Freddie Mac ARM 4.673% 4/1/34 | | | 21,293 | | | | 21,588 | | |
Freddie Mac Relocation 30 yr
5.00% 9/1/33 | | | 96,530 | | | | 94,225 | | |
| Freddie Mac S.F. 15 yr 4.00% 2/1/14 | | | 58,171 | | | | 56,243 | | |
| Freddie Mac S.F. 30 yr 7.00% 11/1/33 | | | 14,648 | | | | 15,067 | | |
| Freddie Mac S.F. 30 yr TBA 6.00% 1/1/37 | | | 65,000 | | | | 65,488 | | |
| GNMA S.F. 30 yr 7.50% 1/15/32 | | | 6,303 | | | | 6,578 | | |
Total Agency Mortgage-Backed
Securities (cost $1,994,572) | | | | | | | 1,982,902 | | |
| AGENCY OBLIGATIONS–0.62% | |
| ^ Fannie Mae 5.377% 10/9/19 | | | 230,000 | | | | 113,867 | | |
^ Resolution Funding Interest Strip
5.24% 10/15/25 | | | 275,000 | | | | 106,671 | | |
Total Agency Obligations
(cost $220,938) | | | | | | | 220,538 | | |
COMMERCIAL MORTGAGE-BACKED
SECURITIES–2.26% | |
Bank of America Commercial Mortgage
Securities | |
| • Series 2006-3 A4 5.889% 7/10/44 | | | 50,000 | | | | 51,976 | | |
| Series 2006-4 A4 5.634% 7/10/46 | | | 25,000 | | | | 25,520 | | |
# Bear Stearns Commercial Mortgage
Securities Series 2004-ESA E 144A
5.064% 5/14/16 | | | 40,000 | | | | 39,845 | | |
t Commercial Mortgage Pass Through
Certificates | | | | | | | | | |
# Series 2001-J1A A2 144A
6.457% 2/14/34 | | | 28,520 | | | | 29,518 | | |
| Series 2006-C7 A2 5.69% 6/10/46 | | | 25,000 | | | | 25,429 | | |
• Credit Suisse Mortgage Capital
Certificates Series 2006-C1 AAB
5.556% 2/15/39 | | | 15,000 | | | | 15,192 | | |
# Crown Castle Towers
Series 2005-1A C 144A
5.074% 6/15/35 | | | 25,000 | | | | 24,676 | | |
Deutsche Mortgage and Asset Receiving
Series 1998-C1 A2 6.538% 6/15/31 | | | 30,785 | | | | 30,988 | | |
First Union-Lehman Brothers-Bank of
America Series 1998-C2 A2
6.56% 11/18/35 | | | 26,637 | | | | 26,914 | | |
General Electric Capital Commercial
Mortgage Series 2002-1A A3
6.269% 12/10/35 | | | 75,000 | | | | 78,359 | | |
GS Mortgage Securities II
Series 2006-GG8 A4 5.56% 11/10/39 | | | 80,000 | | | | 81,254 | | |
| | | Principal
Amount
(U.S. $) | | Market
Value
(U.S. $) | |
COMMERCIAL MORTGAGE-BACKED
SECURITIES (continued) | |
JPMorgan Chase Commercial Mortgage
Securities
Series 2002-C1 A3 5.376% 7/12/37 | | $ | 35,000 | | | $ | 35,213 | | |
| Series 2003-C1 A2 4.985% 1/12/37 | | | 68,000 | | | | 66,980 | | |
•# Series 2006-RR1A A1 144A
5.456% 10/18/52 | | | 25,000 | | | | 25,180 | | |
Lehman Brothers-UBS Commercial
Mortgage Trust Series 2002-C1 A4
6.462% 3/15/31 | | | 55,000 | | | | 57,929 | | |
• Merrill Lynch Mortgage Trust
Series 2006-C1 ASB 5.66% 5/12/39 | | | 35,000 | | | | 35,819 | | |
# SBA Commercial Mortgage Securities
Trust Series 2006-1A B 144A
5.451% 11/15/36 | | | 60,000 | | | | 60,153 | | |
# Tower 144A
Series 2004-2A A 4.232% 12/15/14 | | | 45,000 | | | | 43,801 | | |
| Series 2006-1 B 5.588% 2/15/36 | | | 25,000 | | | | 25,140 | | |
| Series 2006-1 C 5.707% 2/15/36 | | | 25,000 | | | | 25,158 | | |
Total Commercial Mortgage-Backed
Securities (cost $815,102) | | | | | | | 805,044 | | |
| CORPORATE BONDS–11.49% | |
| Banking–1.60% | |
| •# Barclays Bank 144A 7.375% 6/29/49 | | | 20,000 | | | | 21,622 | | |
| Citigroup 5.875% 2/22/33 | | | 20,000 | | | | 20,132 | | |
JP Morgan Chase Capital XX
6.55% 9/29/36 | | | 25,000 | | | | 25,901 | | |
| • MUFG Capital Finance 1 6.346% 7/29/49 | | | 100,000 | | | | 101,669 | | |
Popular North America
4.25% 4/1/08 | | | 55,000 | | | | 54,205 | | |
| • 5.77% 4/6/09 | | | 25,000 | | | | 25,084 | | |
Popular North America Capital Trust I
6.564% 9/15/34 | | | 15,000 | | | | 15,006 | | |
•# Rabobank Capital Funding II 144A
5.26% 12/29/49 | | | 35,000 | | | | 34,277 | | |
| • RBS Capital Trust I 4.709% 12/29/49 | | | 60,000 | | | | 57,115 | | |
•# Resona Preferred Global Securities
Cayman 144A 7.191% 12/29/49 | | | 70,000 | | | | 73,156 | | |
* Sovereign Capital Trust VI
7.908% 6/13/36 | | | 30,000 | | | | 33,801 | | |
| SunTrust Capital II 7.90% 6/15/27 | | | 35,000 | | | | 36,503 | | |
# Wachovia Capital Trust I 144A
7.64% 1/15/27 | | | 40,000 | | | | 41,558 | | |
• Wachovia Capital Trust III
5.80% 3/15/42 | | | 30,000 | | | | 30,276 | | |
| | | | | | | | 570,305 | | |
| Basic Industry–0.27% | |
| * Abitibi-Consolidated 7.875% 8/1/09 | | | 5,000 | | | | 4,900 | | |
| Bowater 9.50% 10/15/12 | | | 5,000 | | | | 5,200 | | |
| Lubrizol 4.625% 10/1/09 | | | 30,000 | | | | 29,447 | | |
| * Norske Skog Canada 8.625% 6/15/11 | | | 2,000 | | | | 2,035 | | |
| Potlatch 13.00% 12/1/09 | | | 5,000 | | | | 5,790 | | |
| * Vale Overseas 6.25% 1/23/17 | | | 25,000 | | | | 25,239 | | |
| Weyerhaeuser 7.125% 7/15/23 | | | 25,000 | | | | 25,053 | | |
| | | | | | | | 97,664 | | |
Balanced Series- 6
Delaware VIP Balanced Series
Statement of Net Assets (continued)
| | | Principal
Amount
(U.S. $) | | Market
Value
(U.S. $) | |
| CORPORATE BONDS (continued) | |
| Brokerage–0.78% | |
| • Ameriprise Financial 7.518% 6/1/66 | | $ | 80,000 | | | $ | 88,004 | | |
| Amvescap 4.50% 12/15/09 | | | 55,000 | | | | 53,656 | | |
| Goldman Sachs Group 6.345% 2/15/34 | | | 25,000 | | | | 25,388 | | |
| LaBranche & Co. 11.00% 5/15/12 | | | 5,000 | | | | 5,413 | | |
| Merrill Lynch 6.05% 5/16/16 | | | 100,000 | | | | 103,688 | | |
| | | | | | | | 276,149 | | |
| Capital Goods–0.27% | |
| Casella Waste Systems 9.75% 2/1/13 | | | 5,000 | | | | 5,263 | | |
| Caterpillar 6.05% 8/15/36 | | | 15,000 | | | | 15,494 | | |
| General Electric 5.00% 2/1/13 | | | 40,000 | | | | 39,607 | | |
| * Geo Sub 11.00% 5/15/12 | | | 5,000 | | | | 4,850 | | |
| * Graham Packaging 9.875% 10/15/14 | | | 5,000 | | | | 5,075 | | |
| Interface 10.375% 2/1/10 | | | 5,000 | | | | 5,550 | | |
| Intertape Polymer 8.50% 8/1/14 | | | 5,000 | | | | 4,538 | | |
| United Technologies 6.05% 6/1/36 | | | 15,000 | | | | 15,856 | | |
| | | | | | | | 96,233 | | |
| Communications–1.76% | |
| n Adelphia Communications 8.125% 4/1/07 | | | 5,000 | | | | 4,613 | | |
| * American Tower 7.125% 10/15/12 | | | 5,000 | | | | 5,163 | | |
AT&T
7.30% 11/15/11 | | | 40,000 | | | | 43,351 | | |
| 8.00% 11/15/31 | | | 15,000 | | | | 18,666 | | |
| BellSouth 4.20% 9/15/09 | | | 25,000 | | | | 24,319 | | |
British Telecommunications
9.125% 12/15/30 | | | 15,000 | | | | 20,577 | | |
| n Century Communications 9.50% 4/1/07 | | | 5,000 | | | | 6,075 | | |
| Charter Communications 13.50% 1/15/11 | | | 5,000 | | | | 4,975 | | |
| Comcast | |
| • 5.674% 7/14/09 | | | 15,000 | | | | 15,044 | | |
| 6.45% 3/15/37 | | | 15,000 | | | | 15,058 | | |
| 6.50% 11/15/35 | | | 15,000 | | | | 15,155 | | |
| Cox Communications 4.625% 1/15/10 | | | 25,000 | | | | 24,488 | | |
| Embarq 6.738% 6/1/13 | | | 20,000 | | | | 20,497 | | |
| o Inmarsat Finance 10.375% 11/15/12 | | | 5,000 | | | | 4,631 | | |
| Insight Communications 12.25% 2/15/11 | | | 5,000 | | | | 5,250 | | |
| Insight Midwest 9.75% 10/1/09 | | | 4,000 | | | | 4,075 | | |
| * Mediacom Capital 9.50% 1/15/13 | | | 7,000 | | | | 7,245 | | |
| News America Holdings 7.75% 12/1/45 | | | 20,000 | | | | 22,928 | | |
| * Rural Cellular 9.875% 2/1/10 | | | 5,000 | | | | 5,344 | | |
Sprint Capital
6.875% 11/15/28 | | | 10,000 | | | | 10,038 | | |
| 7.625% 1/30/11 | | | 35,000 | | | | 37,507 | | |
| 8.75% 3/15/32 | | | 15,000 | | | | 18,105 | | |
| Telecom Italia Capital | |
| *• 5.984% 7/18/11 | | | 40,000 | | | | 39,988 | | |
| 7.20% 7/18/36 | | | 45,000 | | | | 47,160 | | |
| Telefonica Emisones 5.984% 6/20/11 | | | 75,000 | | | | 76,418 | | |
| * Telefonos de Mexico 4.50% 11/19/08 | | | 65,000 | | | | 64,152 | | |
| Thomson 5.75% 2/1/08 | | | 30,000 | | | | 30,098 | | |
| Time Warner 5.50% 11/15/11 | | | 20,000 | | | | 19,970 | | |
Time Warner Entertainment
8.375% 3/15/23 | | | 10,000 | | | | 11,759 | | |
| • US LEC 13.87% 10/1/09 | | | 5,000 | | | | 5,325 | | |
| | | | | | | | 627,974 | | |
| | | Principal
Amount
(U.S. $) | | Market
Value
(U.S. $) | |
| CORPORATE BONDS (continued) | |
| Consumer Cyclical–0.68% | |
| Caesars Entertainment 9.375% 2/15/07 | | $ | 5,000 | | | $ | 5,019 | | |
| • DaimlerChrysler Holdings 5.82% 8/3/09 | | | 50,000 | | | | 50,116 | | |
General Motors Acceptance Corporation
6.875% 9/15/11 | | | 35,000 | | | | 35,935 | | |
| Harrah's Operating 6.50% 6/1/16 | | | 5,000 | | | | 4,484 | | |
Home Depot
5.40% 3/1/16 | | | 10,000 | | | | 9,798 | | |
| 5.875% 12/16/36 | | | 50,000 | | | | 49,237 | | |
| * Mandalay Resort Group 9.375% 2/15/10 | | | 5,000 | | | | 5,375 | | |
Penney (JC)
7.625% 3/1/97 | | | 25,000 | | | | 25,600 | | |
| 8.00% 3/1/10 | | | 15,000 | | | | 15,982 | | |
| * Playtex Products 9.375% 6/1/11 | | | 5,000 | | | | 5,238 | | |
| Viacom 5.75% 4/30/11 | | | 25,000 | | | | 25,036 | | |
| * WMG Acquisition 7.375% 4/15/14 | | | 5,000 | | | | 4,975 | | |
Wheeling Island Gaming
10.125% 12/15/09 | | | 5,000 | | | | 5,119 | | |
| | | | | | | | 241,914 | | |
| Consumer Non-Cyclical–0.53% | |
| Boston Scientific 6.40% 6/15/16 | | | 25,000 | | | | 25,343 | | |
| Cott Beverages 8.00% 12/15/11 | | | 5,000 | | | | 5,125 | | |
| CRC Health 10.75% 2/1/16 | | | 5,000 | | | | 5,400 | | |
| Gold Kist 10.25% 3/15/14 | | | 3,000 | | | | 3,457 | | |
| Kraft Foods 4.125% 11/12/09 | | | 15,000 | | | | 14,559 | | |
| Kroger 6.375% 3/1/08 | | | 30,000 | | | | 30,227 | | |
| Medco Health Solutions 7.25% 8/15/13 | | | 10,000 | | | | 10,748 | | |
| Medtronic 4.375% 9/15/10 | | | 5,000 | | | | 4,855 | | |
| Merck & Co. 5.75% 11/15/36 | | | 35,000 | | | | 34,747 | | |
| UST 6.625% 7/15/12 | | | 10,000 | | | | 10,552 | | |
| o Vanguard Health 11.25% 10/1/15 | | | 5,000 | | | | 3,875 | | |
| Warner Chilcott 8.75% 2/1/15 | | | 5,000 | | | | 5,150 | | |
| Wyeth 5.50% 2/1/14 | | | 35,000 | | | | 35,232 | | |
| | | | | | | | 189,270 | | |
| Electric–1.25% | |
• Alabama Power Capital Trust IV
4.75% 10/1/42 | | | 55,000 | | | | 54,720 | | |
| # Calpine 144A 8.496% 7/15/07 | | | 196 | | | | 216 | | |
| Commonweallth Edison 5.95% 8/15/16 | | | 45,000 | | | | 45,578 | | |
| Dominion Resources 5.687% 5/15/08 | | | 20,000 | | | | 20,035 | | |
| Duke Capital 5.668% 8/15/14 | | | 35,000 | | | | 34,959 | | |
FPL Group Capital
5.625% 9/1/11 | | | 25,000 | | | | 25,300 | | |
| • 6.35% 10/1/66 | | | 35,000 | | | | 35,547 | | |
| Midamerican Energy 6.125% 4/1/36 | | | 20,000 | | | | 20,230 | | |
| * Midwest Generation 8.75% 5/1/34 | | | 5,000 | | | | 5,450 | | |
| • Nisource Finance 5.94% 11/23/09 | | | 20,000 | | | | 20,022 | | |
| Oncor Electric Delivery 7.00% 9/1/22 | | | 35,000 | | | | 37,739 | | |
| Orion Power 12.00% 5/1/10 | | | 5,000 | | | | 5,700 | | |
Pepco
5.50% 8/15/07 | | | 40,000 | | | | 39,974 | | |
| • 5.994% 6/1/10 | | | 30,000 | | | | 30,068 | | |
# Power Contract Financing 144A
6.256% 2/1/10 | | | 16,628 | | | | 16,724 | | |
Balanced Series- 7
Delaware VIP Balanced Series
Statement of Net Assets (continued)
| | | Principal
Amount
(U.S. $) | | Market
Value
(U.S. $) | |
| CORPORATE BONDS (continued) | |
| Electric (continued) | |
| Puget Sound Energy 5.483% 6/1/35 | | $ | 15,000 | | | $ | 13,719 | | |
Southwestern Public Service
6.00% 10/1/36 | | | 30,000 | | | | 29,791 | | |
| Xcel Energy 6.50% 7/1/36 | | | 10,000 | | | | 10,601 | | |
| | | | | | | | 446,373 | | |
| Energy–0.53% | |
| Anadarko Petroleum 5.95% 9/15/16 | | | 15,000 | | | | 15,059 | | |
| * Bluewater Finance 10.25% 2/15/12 | | | 5,000 | | | | 5,263 | | |
| # Canadian Oil Sands 144A 4.80% 8/10/09 | | | 35,000 | | | | 34,357 | | |
| Kerr-McGee 7.125% 10/15/27 | | | 15,000 | | | | 16,121 | | |
| Nexen 5.875% 3/10/35 | | | 5,000 | | | | 4,696 | | |
# Ras Laffan Liquiefied Natural Gas III
144A 5.832% 9/30/16 | | | 25,000 | | | | 25,120 | | |
| • Secunda International 13.374% 9/1/12 | | | 5,000 | | | | 5,181 | | |
| Valero Energy 6.125% 4/15/07 | | | 45,000 | | | | 45,059 | | |
Weatherford International
4.95% 10/15/13 | | | 35,000 | | | | 33,574 | | |
| Whiting Petroleum 7.25% 5/1/13 | | | 5,000 | | | | 5,038 | | |
| | | | | | | | 189,468 | | |
| Finance Companies–0.70% | |
| *• American Express 6.80% 9/1/66 | | | 20,000 | | | | 21,365 | | |
American General Finance
4.875% 7/15/12 | | | 30,000 | | | | 29,304 | | |
| FTI Consulting 7.625% 6/15/13 | | | 5,000 | | | | 5,188 | | |
| Residential Capital | |
| • 5.85% 6/9/08 | | | 25,000 | | | | 24,958 | | |
| 6.00% 2/22/11 | | | 20,000 | | | | 19,980 | | |
| 6.125% 11/21/08 | | | 30,000 | | | | 30,162 | | |
| 6.375% 6/30/10 | | | 25,000 | | | | 25,311 | | |
| 6.50% 4/17/13 | | | 50,000 | | | | 50,736 | | |
| 6.875% 6/30/15 | | | 40,000 | | | | 41,533 | | |
| | | | | | | | 248,537 | | |
| Industrial–0.01% | |
| # Mobile Services Group 144A 9.75% 8/1/14 | | | 5,000 | | | | 5,250 | | |
| | | | | | | | 5,250 | | |
| Insurance–1.51% | |
# Farmers Insurance Exchange 144A
6.00% 8/1/14 | | | 10,000 | | | | 9,901 | | |
| 8.625% 5/1/24 | | | 70,000 | | | | 84,165 | | |
•# Great West Life & Annuity Insurance
144A 7.153% 5/16/46 | | | 20,000 | | | | 21,230 | | |
| # Liberty Mutual 144A 6.70% 8/15/16 | | | 15,000 | | | | 15,853 | | |
Marsh & McLennan
5.15% 9/15/10 | | | 35,000 | | | | 34,415 | | |
| * 5.375% 3/15/07 | | | 40,000 | | | | 39,989 | | |
MetLife
5.00% 6/15/15 | | | 10,000 | | | | 9,715 | | |
| • 6.40% 12/15/36 | | | 30,000 | | | | 30,239 | | |
| Montpelier Re Holdings 6.125% 8/15/13 | | | 45,000 | | | | 43,899 | | |
# Nationwide Mutual Insurance 144A
7.875% 4/1/33 | | | 45,000 | | | | 53,541 | | |
*# Nippon Life Insurance 144A
4.875% 8/9/10 | | | 35,000 | | | | 34,261 | | |
| | | Principal
Amount
(U.S. $) | | Market
Value
(U.S. $) | |
| CORPORATE BONDS (continued) | |
| Insurance (continued) | |
| PMI Group 5.568% 11/15/08 | | $ | 30,000 | | | $ | 29,984 | | |
| SAFECO Capital Trust I 8.072% 7/15/37 | | | 45,000 | | | | 47,104 | | |
WellPoint
4.25% 12/15/09 | | | 25,000 | | | | 24,318 | | |
| 5.85% 1/15/36 | | | 35,000 | | | | 34,117 | | |
Willis Group
5.125% 7/15/10 | | | 15,000 | | | | 14,636 | | |
| 5.625% 7/15/15 | | | 10,000 | | | | 9,588 | | |
| | | | | | | | 536,955 | | |
| Natural Gas–0.94% | |
| Boardwalk Pipelines 5.875% 11/15/16 | | | 25,000 | | | | 24,796 | | |
| El Paso Natural Gas 7.625% 8/1/10 | | | 5,000 | | | | 5,250 | | |
| El Paso Production 7.75% 6/1/13 | | | 5,000 | | | | 5,256 | | |
Enterprise Products Operating
4.00% 10/15/07 | | | 50,000 | | | | 49,398 | | |
| 4.625% 10/15/09 | | | 40,000 | | | | 39,189 | | |
| Inergy Finance 6.875% 12/15/14 | | | 5,000 | | | | 4,938 | | |
| ONEOK 5.51% 2/16/08 | | | 25,000 | | | | 24,989 | | |
| • Sempra Energy 5.845% 5/21/08 | | | 50,000 | | | | 50,022 | | |
| Southern Union 6.15% 8/16/08 | | | 50,000 | | | | 50,224 | | |
| Valero Logistics Operations 6.05% 3/15/13 | | | 80,000 | | | | 80,692 | | |
| | | | | | | | 334,754 | | |
| Real Estate–0.21% | |
| BF Saul REIT 7.50% 3/1/14 | | | 5,000 | | | | 5,106 | | |
* Developers Diversified Realty
4.625% 8/1/10 | | | 50,000 | | | | 48,718 | | |
| HRPT Properties Trust 5.75% 2/15/14 | | | 20,000 | | | | 20,042 | | |
| | | | | | | | 73,866 | | |
| Technology & Electronics–0.02% | |
* MagnaChip Semiconductor
8.00% 12/15/14 | | | 5,000 | | | | 3,375 | | |
| # UGS Capital II PIK 144A 10.348% 6/1/11 | | | 5,000 | | | | 5,038 | | |
| | | | | | | | 8,413 | | |
| Transportation–0.43% | |
| American Airlines 3.857% 7/9/10 | | | 40,429 | | | | 39,236 | | |
| Continental Airlines 6.503% 6/15/11 | | | 50,000 | | | | 51,500 | | |
| # Erac USA Finance 144A 7.35% 6/15/08 | | | 40,000 | | | | 41,015 | | |
| # Hertz 144A 8.875% 1/1/14 | | | 10,000 | | | | 10,525 | | |
| o H-Lines Finance Holdings 11.00% 4/1/13 | | | 5,000 | | | | 4,675 | | |
Kansas City Southern de Mexico
12.50% 6/15/12 | | | 5,000 | | | | 5,425 | | |
Kansas City Southern Railway
9.50% 10/1/08 | | | 1,000 | | | | 1,050 | | |
| | | | | | | | 153,426 | | |
Total Corporate Bonds
(cost $4,020,442) | | | | | | | 4,096,551 | | |
| FOREIGN AGENCIES–0.16% | |
Pemex Project Funding Master Trust
6.125% 8/15/08 | | | 35,000 | | | | 35,368 | | |
| 6.625% 6/15/35 | | | 20,000 | | | | 20,485 | | |
Total Foreign Agencies
(cost $52,817) | | | | | | | 55,853 | | |
Balanced Series- 8
Delaware VIP Balanced Series
Statement of Net Assets (continued)
| | | Principal
Amount
(U.S. $) | | Market
Value
(U.S. $) | |
| MUNICIPAL BONDS–0.95% | |
Augusta, Georgia Water & Sewer Revenue
5.25% 10/1/39 (FSA) | | $ | 55,000 | | | $ | 59,371 | | |
| California State 5.00% 2/1/33 | | | 20,000 | | | | 20,836 | | |
California State University Systemwide
Revenue 5.00% 11/1/30 (AMBAC) | | | 20,000 | | | | 21,252 | | |
Colorado Department of Transportation
Revenue 5.00% 12/15/12 (FGIC) | | | 70,000 | | | | 75,000 | | |
Illinois State Taxable Pension
5.10% 6/1/33 | | | 30,000 | | | | 28,776 | | |
New Jersey Economic Development
Authority Revenue Cigarette Tax
5.75% 6/15/29 | | | 40,000 | | | | 43,318 | | |
New York State Urban Development
Series A-1 5.25% 3/15/34 (FGIC) | | | 35,000 | | | | 37,629 | | |
Oregon State Taxable Pension
5.892% 6/1/27 | | | 35,000 | | | | 36,713 | | |
West Virginia Economic Development
Authority 5.37% 7/1/20 (MBIA) | | | 15,000 | | | | 14,959 | | |
Total Municipal Bonds
(cost $329,637) | | | | | | | 337,854 | | |
NON-AGENCY ASSET-BACKED
SECURITIES–2.46% | |
Countrywide Asset-Backed Certificates
Series 2004-S1 A2 3.872% 3/25/20 | | | 15,841 | | | | 15,608 | | |
| • Series 2006-3 2A2 5.53% 6/25/36 | | | 105,000 | | | | 105,172 | | |
| Series 2006-S3 A2 6.085% 6/25/21 | | | 40,000 | | | | 40,359 | | |
| • Series 2006-S6 A2 5.519% 3/25/34 | | | 40,000 | | | | 39,881 | | |
| • Series 2006-S7 A3 5.712% 11/25/35 | | | 75,000 | | | | 74,821 | | |
| • Series 2006-S9 A3 5.728% 8/25/36 | | | 35,000 | | | | 34,786 | | |
• GMAC Mortgage Corporation Loan
Trust Series 2006-HE3 A2
5.75% 10/25/36 | | | 25,000 | | | | 24,993 | | |
GSAMP Series 2006-S3 A1
6.085% 5/25/36 | | | 15,162 | | | | 15,129 | | |
•# MASTR Specialized Loan Trust
Series 2005-2 A2 144A 5.006% 7/25/35 | | | 26,141 | | | | 25,651 | | |
• Merrill Lynch Mortgage Investors
Series 2005-NCB A1A 5.451% 7/25/36 | | | 6,343 | | | | 6,317 | | |
| Series 2006-AR1 A2C 5.51% 3/25/37 | | | 75,000 | | | | 75,026 | | |
Mid-State Trust
Series 11 A1 4.864% 7/15/38 | | | 18,944 | | | | 18,222 | | |
| Series 2004-1 A 6.005% 8/15/37 | | | 10,241 | | | | 10,400 | | |
| # Series 2006-1 A 144A 5.787% 10/15/40 | | | 24,247 | | | | 24,254 | | |
• Option One Mortgage Loan Trust
Series 2005-4 A3 5.61% 11/25/35 | | | 100,000 | | | | 100,252 | | |
Renaissance Home Equity Loan Trust
Series 2004-4 AF2 3.856% 2/25/35 | | | 37 | | | | 37 | | |
| Series 2005-4 A2 5.399% 2/25/36 | | | 35,000 | | | | 34,833 | | |
• Residential Asset Securities
Series 2006-KS3 AI3 5.52% 4/25/36 | | | 105,000 | | | | 105,168 | | |
Structured Asset Securities
Series 2001-SB1 A2 3.375% 8/25/31 | | | 32,618 | | | | 29,305 | | |
| Series 2004-16XS A2 4.91% 8/25/34 | | | 26,053 | | | | 25,930 | | |
| | | Principal
Amount
(U.S. $) | | Market
Value
(U.S. $) | |
NON-AGENCY ASSET-BACKED
SECURITIES (continued) | |
Triad Auto Receivables Owner Trust
Series 2006-C A4 5.31% 5/13/13 | | $ | 40,000 | | | $ | 40,144 | | |
UPFC Auto Receivables Trust
Series 2006-B A3 5.01% 8/15/12 | | | 30,000 | | | | 29,933 | | |
Total Non-Agency Asset-Backed Securities
(cost $878,565) | | | | | | | 876,221 | | |
NON-AGENCY COLLATERALIZED
MORTGAGE OBLIGATIONS–8.47% | |
American Home Mortgage Investment Trust
Series 2005-2 5A1 5.064% 9/25/35 | | | 35,000 | | | | 34,009 | | |
Bank of America Alternative Loan Trust
Series 2003-10 2A1 6.00% 12/25/33 | | | 66,478 | | | | 66,624 | | |
| Series 2004-2 1A1 6.00% 3/25/34 | | | 36,810 | | | | 36,891 | | |
| Series 2005-3 2A1 5.50% 4/25/20 | | | 38,414 | | | | 38,246 | | |
| Series 2005-5 2CB1 6.00% 6/25/35 | | | 41,111 | | | | 41,188 | �� | |
| Series 2005-9 5A1 5.50% 10/25/20 | | | 25,449 | | | | 25,306 | | |
• Bank of America Funding Securities
Series 2006-F 1A2 5.172% 7/20/36 | | | 46,822 | | | | 46,477 | | |
| Bank of America Mortgage Securities | |
| • Series 2003-D 1A2 6.114% 5/25/33 | | | 1,041 | | | | 1,049 | | |
| Series 2005-9 2A1 4.75% 10/25/20 | | | 44,530 | | | | 43,574 | | |
• Bear Stearns Alternative A Trust
Series 2006-3 33A1 6.189% 5/25/36 | | | 50,092 | | | | 50,669 | | |
| Series 2006-3 34A1 6.186% 5/25/36 | | | 51,109 | | | | 51,697 | | |
| Series 2006-4 23A5 6.242% 8/25/36 | | | 40,335 | | | | 40,889 | | |
Chase Mortgage Finance
Series 2003-S8 A2 5.00% 9/25/18 | | | 79,516 | | | | 78,274 | | |
Countrywide Alternative Loan Trust
Series 2004-28CB 6A1 6.00% 1/25/35 | | | 18,047 | | | | 18,075 | | |
| • Series 2004-J7 1A2 4.673% 8/25/34 | | | 19,493 | | | | 19,337 | | |
| • Series 2005-63 3A1 5.895% 11/25/35 | | | 50,151 | | | | 50,164 | | |
| Series 2006-2CB A3 5.50% 3/25/36 | | | 38,811 | | | | 38,878 | | |
| Series 2006-33CB M 6.00% 11/25/36 | | | 24,965 | | | | 24,682 | | |
t Countrywide Home Loan
Mortgage Pass Through Trust | | | | | | | | | |
| • Series 2004-12 1M 4.564% 8/25/34 | | | 34,484 | | | | 34,188 | | |
| Series 2005-23 A1 5.50% 11/25/35 | | | 70,752 | | | | 69,271 | | |
| Series 2006-1 A2 6.00% 3/25/36 | | | 39,933 | | | | 39,937 | | |
| • Series 2006-HYB3 3A1A 6.113% 5/20/36 | | | 50,067 | | | | 50,564 | | |
| • Series 2006-HYB4 1A2 5.711% 6/20/36 | | | 38,131 | | | | 38,298 | | |
Credit Suisse First Boston Mortgage Securities
Series 2003-29 5A1 7.00% 12/25/33 | | | 15,131 | | | | 15,415 | | |
| Series 2004-1 3A1 7.00% 2/25/34 | | | 10,269 | | | | 10,461 | | |
First Horizon Asset Securities
Series 2003-5 1A17 8.00% 7/25/33 | | | 17,451 | | | | 18,453 | | |
| • Series 2004-AR5 4A1 5.682% 10/25/34 | | | 33,194 | | | | 33,017 | | |
• GMAC Mortgage Loan Trust
Series 2005-AR2 4A 5.188% 5/25/35 | | | 40,812 | | | | 40,037 | | |
# GSMPS Mortgage Loan Trust 144A
Series 1998-3 A 7.75% 9/19/27 | | | 31,719 | | | | 33,254 | | |
| Series 2005-RP1 1A3 8.00% 1/25/35 | | | 24,516 | | | | 25,946 | | |
| Series 2005-RP1 1A4 8.50% 1/25/35 | | | 14,230 | | | | 15,195 | | |
Balanced Series- 9
Delaware VIP Balanced Series
Statement of Net Assets (continued)
| | | Principal
Amount
(U.S. $) | | Market
Value
(U.S. $) | |
NON-AGENCY COLLATERALIZED
MORTGAGE OBLIGATIONS (continued) | |
• Indymac Index Mortgage Loan Trust
Series 2005-AR25 1A21 5.877% 12/25/35 | | $ | 42,268 | | | $ | 42,300 | | |
| Series 2006-AR2 1A1A 5.57% 4/25/46 | | | 61,093 | | | | 61,141 | | |
• JPMorgan Mortgage Trust
Series 2005-A4 1A1 5.406% 7/25/35 | | | 49,282 | | | | 48,651 | | |
| Series 2005-A6 1A2 5.152% 9/25/35 | | | 60,000 | | | | 60,106 | | |
Lehman Mortgage Trust
Series 2005-2 2A3 5.50% 12/25/35 | | | 40,758 | | | | 40,729 | | |
| Series 2006-1 3A3 5.50% 2/25/36 | | | 40,000 | | | | 40,065 | | |
• MASTR Adjustable Rate Mortgages Trust
Series 2003-6 1A2 5.883% 12/25/33 | | | 26,502 | | | | 26,830 | | |
| Series 2005-1 B1 5.346% 3/25/35 | | | 39,682 | | | | 39,292 | | |
| Series 2005-6 7A1 5.375% 6/25/35 | | | 29,730 | | | | 29,313 | | |
MASTR Alternative Loans Trust
Series 2003-6 3A1 8.00% 9/25/33 | | | 7,345 | | | | 7,523 | | |
| Series 2005-3 7A1 6.00% 4/25/35 | | | 45,228 | | | | 45,245 | | |
# MASTR Reperforming Loan Trust 144A
Series 2005-1 1A5 8.00% 8/25/34 | | | 38,128 | | | | 40,253 | | |
| Series 2005-2 1A4 8.00% 5/25/35 | | | 17,153 | | | | 18,081 | | |
Morgan Stanley Mortgage Loan Trust
Series 2006-2 6A 6.50% 2/25/36 | | | 23,039 | | | | 23,370 | | |
Nomura Asset Acceptance
Series 2005-WF1 2A2 4.786% 3/25/35 | | | 65,000 | | | | 63,994 | | |
| • Series 2006-AF1 1A2 6.159% 5/25/36 | | | 60,000 | | | | 60,579 | | |
Prime Mortgage Trust
Series 2004-CL1 1A1 6.00% 2/25/34 | | | 18,820 | | | | 18,943 | | |
Residential Accredit Loans
Series 2005-QS9 A6 5.50% 6/25/35 | | | 25,000 | | | | 24,219 | | |
Residential Asset Mortgage Products
Series 2004-SL1 A3 7.00% 11/25/31 | | | 16,729 | | | | 16,986 | | |
| Series 2004-SL4 A3 6.50% 7/25/32 | | | 28,572 | | | | 29,043 | | |
| Series 2005-SL1 A2 6.00% 5/25/32 | | | 31,928 | | | | 32,629 | | |
• Residential Funding Mortgage Security I
Series 2006-SA3 3A1 6.067% 9/25/36 | | | 46,483 | | | | 46,816 | | |
• Structured Adjustable Rate
Mortgage Loan Trust
Series 2004-18 5A 5.50% 12/25/34 | | | 37,607 | | | | 37,208 | | |
| Series 2005-3XS A2 5.60% 1/25/35 | | | 33,926 | | | | 33,954 | | |
| Series 2006-5 5A4 5.582% 6/25/36 | | | 28,749 | | | | 28,390 | | |
| Structured Asset Securities | |
| • Series 2002-22H 1A 6.96% 11/25/32 | | | 11,350 | | | | 11,544 | | |
| Series 2004-12H 1A 6.00% 5/25/34 | | | 39,720 | | | | 39,795 | | |
Washington Mutual
Series 2004-CB3 4A 6.00% 10/25/19 | | | 64,073 | | | | 64,695 | | |
| • Series 2006-AR7 1A 5.807% 7/25/46 | | | 26,607 | | | | 26,612 | | |
| • Series 2006-AR8 2A3 6.16% 8/25/36 | | | 22,243 | | | | 22,468 | | |
| • Series 2006-AR10 1A1 5.97% 9/25/36 | | | 45,732 | | | | 46,126 | | |
| • Series 2006-AR14 1A4 5.666% 11/25/36 | | | 33,459 | | | | 33,515 | | |
| | | Principal
Amount
(U.S. $) | | Market
Value
(U.S. $) | |
NON-AGENCY COLLATERALIZED
MORTGAGE OBLIGATIONS (continued) | |
Washington Mutual Alternative
Mortgage Pass Through Certificates
Series 2005-6 3CB 5.50% 8/25/35 | | $ | 45,336 | | | $ | 44,415 | | |
| Series 2005-9 3CB 5.50% 10/25/20 | | | 52,890 | | | | 52,665 | | |
| Series 2006-2 2CB 6.50% 3/25/36 | | | 34,272 | | | | 34,711 | | |
| Series 2006-5 2CB3 6.00% 7/25/36 | | | 47,105 | | | | 47,599 | | |
| Series 2006-5 LB1 6.00% 7/25/36 | | | 24,882 | | | | 24,688 | | |
| • Series 2006-AR5 3A 5.767% 7/25/46 | | | 29,013 | | | | 29,086 | | |
Wells Fargo Mortgage Backed
Securities Trust | |
| • Series 2004-T A1 4.382% 9/25/34 | | | 29,262 | | | | 29,284 | | |
| Series 2005-14 2A1 5.50% 12/25/35 | | | 66,087 | | | | 64,703 | | |
| Series 2005-17 1A1 5.50% 1/25/36 | | | 52,406 | | | | 51,309 | | |
| Series 2006-2 3A1 5.75% 3/25/36 | | | 52,965 | | | | 52,436 | | |
| Series 2006-7 2A1 6.00% 6/25/36 | | | 84,740 | | | | 84,371 | | |
| • Series 2006-AR4 1A1 5.865% 4/25/36 | | | 70,254 | | | | 70,187 | | |
| • Series 2006-AR4 2A1 5.787% 4/25/36 | | | 102,969 | | | | 102,457 | | |
| • Series 2006-AR10 5A1 5.605% 7/25/36 | | | 41,845 | | | | 41,885 | | |
Total Non-Agency Collateralized
Mortgage Obligations
(cost $3,027,856) | | | | | | | 3,020,276 | | |
| U.S. TREASURY OBLIGATIONS–3.18% | |
| * U.S. Treasury Bonds 4.50% 2/15/36 | | | 205,000 | | | | 195,006 | | |
U.S. Treasury Inflation Index Notes
2.00% 1/15/26 | | | 45,761 | | | | 43,052 | | |
| 2.375% 4/15/11 | | | 86,434 | | | | 86,117 | | |
| 2.50% 7/15/16 | | | 304,823 | | | | 307,229 | | |
| m* 3.00% 7/15/12 | | | 101,030 | | | | 104,002 | | |
* U.S. Treasury Notes
4.50% 11/30/11 | | | 30,000 | | | | 29,742 | | |
| 4.625% 11/15/09 | | | 35,000 | | | | 34,902 | | |
| 4.625% 10/31/11 | | | 220,000 | | | | 219,270 | | |
| 4.875% 10/31/08 | | | 30,000 | | | | 30,023 | | |
| *^ U.S. Treasury Strip 4.293% 11/15/13 | | | 115,000 | | | | 83,681 | | |
Total U.S. Treasury Obligations
(cost $1,136,937) | | | | | | | 1,133,024 | | |
| REPURCHASE AGREEMENTS–5.49% | |
With BNP Paribas 4.80% 1/2/07
(dated 12/29/06, to be repurchased
at $743,396, collateralized by
$777,000 U.S. Treasury Bills
due 6/28/07, market value $758,787) | | | 743,000 | | | | 743,000 | | |
With Cantor Fitzgerald 4.82% 1/2/07
(dated 12/29/06, to be repurchased
at $893,478, collateralized by
$77,000 U.S. Treasury Notes 4.00%
due 6/15/09, market value $75,915,
$478,000 U.S. Treasury Notes 6.125%
due 8/15/07, market value $492,636
and $319,000 U.S. Treasury Notes 6.50%
due 2/15/10, market value $343,030) | | | 893,000 | | | | 893,000 | | |
Balanced Series- 10
Delaware VIP Balanced Series
Statement of Net Assets (continued)
| | | Principal
Amount
(U.S. $) | | Market
Value
(U.S. $) | |
| REPURCHASE AGREEMENTS (continued) | |
With UBS Warburg 4.75% 1/2/07
(dated 12/29/06, to be repurchased
at $319,168, collateralized by
$329,000 U.S. Treasury Bills
due 3/29/07, market value $325,559) | | $ | 319,000 | | | $ | 319,000 | | |
Total Repurchase Agreements
(cost $1,955,000) | | | | | | | 1,955,000 | | |
Total Market Value of Securities
Before Securities Lending
Collateral–103.55%
(cost $32,955,671) | | | | | | | 36,897,038 | | |
| SECURITY LENDING COLLATERAL**–6.57% | |
| Short-Term Investments–6.57% | |
| Fixed Rate Note–1.24% | |
Citigroup Global Markets
5.32% 1/2/07 | | | 443,300 | | | | 443,300 | | |
| | | | | | | | 443,300 | | |
| • Variable Rate Notes–5.33% | | | | | | | | | |
American Honda Finance
5.32% 2/21/07 | | | 57,326 | | | | 57,326 | | |
| ANZ National 5.35% 1/29/08 | | | 12,739 | | | | 12,739 | | |
| Australia New Zealand 5.35% 1/29/08 | | | 63,696 | | | | 63,696 | | |
| Bank of America 5.32% 2/23/07 | | | 82,805 | | | | 82,805 | | |
| Bank of New York 5.34% 1/29/08 | | | 50,957 | | | | 50,957 | | |
| Barclays New York 5.31% 5/18/07 | | | 82,805 | | | | 82,805 | | |
| | | Principal
Amount
(U.S. $) | | Market
Value
(U.S. $) | |
| SECURITY LENDING COLLATERAL (continued) | |
| Short-Term Investments (continued) | |
| • Variable Rate Notes (continued) | | | | | | | | | |
| Bayerische Landesbank 5.40% 1/29/08 | | $ | 63,696 | | | $ | 63,696 | | |
| Bear Stearns 5.41% 6/29/07 | | | 76,435 | | | | 76,435 | | |
| BNP Paribas 5.35% 1/29/08 | | | 63,696 | | | | 63,696 | | |
| Canadian Imperial Bank 5.33% 1/29/09 | | | 44,587 | | | | 44,587 | | |
| CDC Financial 5.36% 1/29/07 | | | 82,805 | | | | 82,805 | | |
| Citigroup Global Markets 5.38% 1/5/07 | | | 82,805 | | | | 82,805 | | |
| Commonwealth Bank 5.35% 1/29/08 | | | 63,696 | | | | 63,696 | | |
| Deutsche Bank 5.34% 2/23/07 | | | 76,435 | | | | 76,435 | | |
| Dexia Bank 5.33% 9/28/07 | | | 89,174 | | | | 89,161 | | |
| Goldman Sachs 5.45% 12/28/07 | | | 82,805 | | | | 82,805 | | |
| Marshall & Ilsley Bank 5.33% 1/29/08 | | | 70,065 | | | | 70,065 | | |
Merrill Lynch Mortgage Capital
5.41% 1/8/07 | | | 82,805 | | | | 82,805 | | |
| Morgan Stanley 5.49% 1/29/08 | | | 82,805 | | | | 82,805 | | |
| National Australia Bank 5.32% 3/7/07 | | | 78,983 | | | | 78,983 | | |
| National City Bank 5.32% 3/2/07 | | | 76,437 | | | | 76,439 | | |
| National Rural Utilities 5.34% 1/29/08 | | | 100,639 | | | | 100,639 | | |
| Nordea Bank New York 5.31% 5/16/07 | | | 31,848 | | | | 31,847 | | |
| Nordea Bank Norge 5.36% 1/29/08 | | | 63,696 | | | | 63,696 | | |
| Royal Bank of Scotland 5.34% 1/29/08 | | | 63,696 | | | | 63,696 | | |
| Societe Generale 5.32% 1/29/08 | | | 31,848 | | | | 31,848 | | |
| Toronto Dominion 5.32% 5/29/07 | | | 76,435 | | | | 76,435 | | |
| Wells Fargo 5.36% 1/29/08 | | | 63,696 | | | | 63,696 | | |
| | | | | | | | 1,899,403 | | |
Total Securities Lending Collateral
(cost $2,342,703) | | | | | | | 2,342,703 | | |
Balanced Series- 11
Delaware VIP Balanced Series
Statement of Net Assets (continued)
| TOTAL MARKET VALUE OF SECURITIES–110.12% (cost $35,298,374) | | $ | 39,239,741 | v | |
| OBLIGATION TO RETURN SECURITIES LENDING COLLATERAL**–(6.57%) | | | (2,342,703 | ) | |
| LIABILITIES NET OF RECEIVABLES AND OTHER ASSETS–(3.55%) | | | (1,264,585 | ) | |
| NET ASSETS APPLICABLE TO 2,335,350 SHARES OUTSTANDING–100.00% | | $ | 35,632,453 | | |
| NET ASSET VALUE-DELAWARE VIP BALANCED SERIES STANDARD CLASS ($35,626,540 / 2,334,962 Shares) | | $ | 15.26 | | |
| NET ASSET VALUE-DELAWARE VIP BALANCED SERIES SERVICE CLASS ($5,913 / 388 Shares) | | $ | 15.24 | | |
| COMPONENTS OF NET ASSETS AT DECEMBER 31, 2006: | |
| Shares of beneficial interest (unlimited authorization–no par) | | $ | 50,468,348 | | |
| Undistributed net investment income | | | 1,093,355 | | |
| Accumulated net realized loss on investments | | | (19,871,505 | ) | |
| Net unrealized appreciation of investments | | | 3,942,255 | | |
| Total net assets | | $ | 35,632,453 | | |
* Fully or partially on loan.
** See Note 10 in "Notes to Financial Statements."
v Includes $2,389,755 of securities loaned.
† Non-income producing security for the year ended December 31, 2006.
• Variable rate security. The interest rate shown is the rate as of December 31, 2006.
t Pass Through Agreement. Security represents the contractual right to receive a proportionate amount of underlying payments due to the counterparty pursuant to various agreements related to the rescheduling of obligations and the exchange of certain notes.
^ Zero coupon security. The interest rate shown is the yield at the time of purchase.
‡ Non-income producing security. Security is currently in default.
n Security is currently in default. The issue has missed the maturity date. Bankruptcy proceedings are in process to determine distribution of assets. The date listed is the estimate of when proceedings will be finalized.
o Step coupon bond. Indicates security that has a zero coupon that remains in effect until a predetermined date at which time the stated interest rate becomes effective.
m Fully or partially pledged as collateral for financial futures contracts.
# Security exempt from registration under Rule 144A of the Securities Act of 1933, as amended. At December 31, 2006, the aggregate amount of Rule 144A securities equaled $983,914, which represented 2.76% of the Series' net assets. See Note 11 in "Notes to Financial Statements."
Summary of Abbreviations:
AMBAC – Insured by the AMBAC Assurance Corporation
ARM – Adjustable Rate Mortgage
FGIC – Insured by the Financial Guaranty Insurance Company
FSA – Insured by Financial Security Assurance
GNMA – Government National Mortgage Association
GSMPS – Goldman Sachs Reperforming Mortgage Securities
MBIA – Insured by the Municipal Bond Insurance Association
PIK – Pay-in-kind
REIT – Real Estate Investment Trust
S.F. – Single Family
TBA – To be announced
yr – Year
The following financial futures contracts and swap contracts were outstanding at December 31, 2006:
Futures Contracts1
Contracts
to Buy | | Notional
Cost | | Notional
Value | | Expiration Date | | Unrealized
Depreciation | |
| | 3 | | | U.S. Treasury 5 year Notes | | $ | 317,923 | | | $ | 315,188 | | | 3/31/07 | | $ | (2,735 | ) | |
| | 1 | | | U.S. Treasury Long Bond | | | 113,607 | | | | 111,438 | | | 3/31/07 | | | (2,169 | ) | |
| | | $ | (4,904 | ) | |
Swap Contracts2
| Notional Amount | | Expiration Date | | Description | | Unrealized
Appreciation | |
| $ | 405,000 | | | | 2/1/07 | | | Agreement with Goldman Sachs to receive the notional amount multiplied by the return on the Lehman Brothers Commercial MBS Index AAA and to pay the notional amount multiplied by the 1 month BBA LIBOR adjusted by a spread of plus 0.05%. | | $ | 5,792 | | |
|
The use of financial futures contracts and swap contracts involves elements of market risk and risks in excess of the amount recognized in the financial statements. The notional amounts presented above represent the Series' total exposure in such contracts, whereas only the net unrealized appreciation (depreciation) is reflected in the Series' net assets.
1See Note 8 in "Notes to Financial Statements."
2See Note 9 in "Notes to Financial Statements."
See accompanying notes
Balanced Series- 12
Delaware VIP Trust — Delaware VIP Balanced Series
Statement of Operations
Year Ended December 31, 2006
Delaware VIP Trust — Delaware VIP Balanced Series
Statements of Changes in Net Assets
| INVESTMENT INCOME: | |
| Interest | | $ | 725,314 | | |
| Dividends | | | 609,208 | | |
| Securities lending income | | | 4,538 | | |
| | | | 1,339,060 | | |
| EXPENSES: | |
| Management fees | | | 235,990 | | |
| Accounting and administration expenses | | | 14,523 | | |
| Audit and tax | | | 12,124 | | |
| Pricing fees | | | 10,828 | | |
| Reports and statements to shareholders | | | 8,893 | | |
| Custodian fees | | | 8,343 | | |
| Trustees' fees and benefits | | | 6,404 | | |
| Dividend disbursing and transfer agent fees and expenses | | | 3,631 | | |
| Legal fees | | | 3,230 | | |
| Dues and services | | | 1,164 | | |
| Insurance fees | | | 1,082 | | |
| Consulting fees | | | 480 | | |
| Taxes (other than taxes on income) | | | 239 | | |
| Trustees' expenses | | | 185 | | |
| Registration fees | | | 52 | | |
| Distribution expenses – Service Class | | | 16 | | |
| Other | | | 22 | | |
| | | | 307,206 | | |
| Less expenses absorbed or waived | | | (11,104 | ) | |
| Less waiver of distribution expenses – Service Class | | | (3 | ) | |
| Less expense paid indirectly | | | (2,113 | ) | |
| Total operating expenses | | | 293,986 | | |
| NET INVESTMENT INCOME | | | 1,045,074 | | |
NET REALIZED AND UNREALIZED GAIN (LOSS)
ON INVESTMENTS: | |
| Net realized gain (loss) on: | |
| Investments | | | 1,181,617 | | |
| Futures contracts | | | 13,452 | | |
| Swap contracts | | | (8,985 | ) | |
| Net realized gain | | | 1,186,084 | | |
Net change in unrealized appreciation/depreciation
of investments | | | 3,149,987 | | |
NET REALIZED AND UNREALIZED GAIN ON
INVESTMENTS | | | 4,336,071 | | |
NET INCREASE IN NET ASSETS RESULTING
FROM OPERATIONS | | $ | 5,381,145 | | |
See accompanying notes
| | | Year Ended | |
| | | 12/31/06 | | 12/31/05 | |
INCREASE (DECREASE) IN NET
ASSETS FROM OPERATIONS: | |
| Net investment income | | $ | 1,045,074 | | | $ | 1,063,172 | | |
| Net realized gain on investments | | | 1,186,084 | | | | 3,661,335 | | |
Net change in unrealized appreciation/
depreciation of investments | | | 3,149,987 | | | | (3,243,861 | ) | |
Net increase in net assets
resulting from operations | | | 5,381,145 | | | | 1,480,646 | | |
DIVIDENDS AND DISTRIBUTIONS
TO SHAREHOLDERS FROM: | |
| Net investment income: | |
| Standard Class | | | (1,122,023 | ) | | | (993,690 | ) | |
| Service Class | | | (144 | ) | | | (102 | ) | |
| | | | (1,122,167 | ) | | | (993,792 | ) | |
| CAPITAL SHARE TRANSACTIONS: | |
| Proceeds from shares sold: | |
| Standard Class | | | 35,103,629 | | | | 672,726 | | |
Net asset value of shares issued upon
reinvestment of dividends and distributions: | |
| Standard Class | | | 1,122,023 | | | | 993,690 | | |
| Service Class | | | 144 | | | | 102 | | |
| | | | 36,225,796 | | | | 1,666,518 | | |
| Cost of shares repurchased: | |
| Standard Class | | | (43,084,571 | ) | | | (9,333,352 | ) | |
Decrease in net assets derived from
capital share transactions | | | (6,858,775 | ) | | | (7,666,834 | ) | |
| NET DECREASE IN NET ASSETS | | | (2,599,797 | ) | | | (7,179,980 | ) | |
| NET ASSETS: | |
| Beginning of year | | | 38,232,250 | | | | 45,412,230 | | |
End of year (including undistributed
net investment income of $1,093,355 and
$1,113,970, respectively) | | $ | 35,632,453 | | | $ | 38,232,250 | | |
See accompanying notes
Balanced Series-13
Delaware VIP Trust — Delaware VIP Balanced Series
Financial Highlights
Selected data for each share of the Series outstanding throughout each period were as follows:
| | | Delaware VIP Balanced Series Standard Class | |
| | | Year Ended | |
| | | 12/31/06 | | 12/31/05 | | 12/31/04 | | 12/31/03 | | 12/31/02 | |
| Net asset value, beginning of period | | $ | 13.530 | | | $ | 13.360 | | | $ | 12.890 | | | $ | 11.170 | | | $ | 13.730 | | |
| Income (loss) from investment operations: | |
| Net investment income1 | | | 0.405 | | | | 0.341 | | | | 0.245 | | | | 0.211 | | | | 0.258 | | |
Net realized and unrealized gain (loss) on investments
and foreign currencies | | | 1.739 | | | | 0.135 | | | | 0.493 | | | | 1.872 | | | | (2.430 | ) | |
| Total from investment operations | | | 2.144 | | | | 0.476 | | | | 0.738 | | | | 2.083 | | | | (2.172 | ) | |
| Less dividends and distributions from: | |
| Net investment income | | | (0.414 | ) | | | (0.306 | ) | | | (0.268 | ) | | | (0.363 | ) | | | (0.388 | ) | |
| Total dividends and distributions | | | (0.414 | ) | | | (0.306 | ) | | | (0.268 | ) | | | (0.363 | ) | | | (0.388 | ) | |
| Net asset value, end of period | | $ | 15.260 | | | $ | 13.530 | | | $ | 13.360 | | | $ | 12.890 | | | $ | 11.170 | | |
| Total return2 | | | 16.20 | % | | | 3.68 | % | | | 5.84 | % | | | 19.21 | % | | | (16.27 | %) | |
| Ratios and supplemental data: | |
| Net assets, end of period (000 omitted) | | $ | 35,626 | | | $ | 38,227 | | | $ | 45,407 | | | $ | 53,233 | | | $ | 54,789 | | |
| Ratio of expenses to average net assets | | | 0.81 | % | | | 0.80 | % | | | 0.77 | % | | | 0.77 | % | | | 0.75 | % | |
Ratio of expenses to average net assets prior to expense
limitation and expenses paid indirectly | | | 0.84 | % | | | 0.85 | % | | | 0.77 | % | | | 0.77 | % | | | 0.76 | % | |
| Ratio of net investment income to average net assets | | | 2.88 | % | | | 2.57 | % | | | 1.91 | % | | | 1.80 | % | | | 2.10 | % | |
Ratio of net investment income to average net assets prior
to expense limitation and expenses paid indirectly | | | 2.85 | % | | | 2.52 | % | | | 1.91 | % | | | 1.80 | % | | | 2.09 | % | |
| Portfolio turnover | | | 131 | % | | | 200 | % | | | 247 | % | | | 231 | % | | | 303 | % | |
1The average shares outstanding method has been applied for per share information.
2Total investment return is based on the change in net asset value of a share during the period and assumes reinvestment of dividends and distributions at net asset value. Total investment return reflects waivers and payment of fees by the manager, as applicable. Performance would have been lower had the expense limitation not been in effect.
See accompanying notes
Balanced Series- 14
Delaware VIP Balanced Series
Financial Highlights (continued)
Selected data for each share of the Series outstanding throughout each period were as follows:
| | | Delaware VIP Balanced Series Service Class | |
| | | Year Ended | |
| | | 12/31/06 | | 12/31/05 | | 12/31/04 | | 12/31/03 | | 12/31/02 | |
| Net asset value, beginning of period | | $ | 13.520 | | | $ | 13.340 | | | $ | 12.880 | | | $ | 11.170 | | | $ | 13.720 | | |
| Income (loss) from investment operations: | |
| Net investment income1 | | | 0.371 | | | | 0.310 | | | | 0.214 | | | | 0.186 | | | | 0.238 | | |
Net realized and unrealized gain (loss) on investments
and foreign currencies | | | 1.732 | | | | 0.145 | | | | 0.488 | | | | 1.867 | | | | (2.421 | ) | |
| Total from investment operations | | | 2.103 | | | | 0.455 | | | | 0.702 | | | | 2.053 | | | | (2.183 | ) | |
| Less dividends and distributions from: | |
| Net investment income | | | (0.383 | ) | | | (0.275 | ) | | | (0.242 | ) | | | (0.343 | ) | | | (0.367 | ) | |
| Total dividends and distributions | | | (0.383 | ) | | | (0.275 | ) | | | (0.242 | ) | | | (0.343 | ) | | | (0.367 | ) | |
| Net asset value, end of period | | $ | 15.240 | | | $ | 13.520 | | | $ | 13.340 | | | $ | 12.880 | | | $ | 11.170 | | |
| Total return2 | | | 15.88 | % | | | 3.51 | % | | | 5.55 | % | | | 18.90 | % | | | (16.40 | %) | |
| Ratios and supplemental data: | |
| Net assets, end of period (000 omitted) | | $ | 6 | | | $ | 5 | | | $ | 5 | | | $ | 5 | | | $ | 4 | | |
| Ratio of expenses to average net assets | | | 1.06 | % | | | 1.05 | % | | | 1.02 | % | | | 0.99 | % | | | 0.90 | % | |
Ratio of expenses to average net assets prior to expense
limitation and expenses paid indirectly | | | 1.14 | % | | | 1.15 | % | | | 1.07 | % | | | 1.02 | % | | | 0.91 | % | |
| Ratio of net investment income to average net assets | | | 2.63 | % | | | 2.32 | % | | | 1.66 | % | | | 1.58 | % | | | 1.95 | % | |
Ratio of net investment income to average net assets prior
to expense limitation and expenses paid indirectly | | | 2.55 | % | | | 2.22 | % | | | 1.61 | % | | | 1.55 | % | | | 1.94 | % | |
| Portfolio turnover | | | 131 | % | | | 200 | % | | | 247 | % | | | 231 | % | | | 303 | % | |
1The average shares outstanding method has been applied for per share information.
2Total investment return is based on the change in net asset value of a share during the period and assumes reinvestment of dividends and distributions at net asset value. Total investment return reflects waivers and payment of fees by the manager and distributor, as applicable. Performance would have been lower had the expense limitation not been in effect.
See accompanying notes
Balanced Series- 15
Delaware VIP Trust — Delaware VIP Balanced Series
Notes to Financial Statements
December 31, 2006
Delaware VIP Trust (the "Trust") is organized as a Delaware statutory trust and offers 15 series: Delaware VIP Balanced Series, Delaware VIP Capital Reserves Series, Delaware VIP Cash Reserve Series, Delaware VIP Diversified Income Series, Delaware VIP Emerging Markets Series, Delaware VIP Global Bond Series, Delaware VIP Growth Opportunities Series, Delaware VIP High Yield Series, Delaware VIP International Value Equity Series, Delaware VIP REIT Series, Delaware VIP Select Growth Series, Delaware VIP Small Cap Value Series, Delaware VIP Trend Series, Delaware VIP U.S. Growth Series and Delaware VIP Value Series. These financial statements and the related notes pertain to Delaware VIP Balanced Series (the "Series"). The Trust is an open-end investment company. The Series is considered diversified under the Investment Company Act of 1940, as amended, and offers Standard Class and Service Class shares. The Standard Class shares do not carry a 12b-1 fee and the Service Class shares carry a 12b-1 fee. The shares of the Series are sold only to separate accounts of life insurance companies.
The investment objective of the Series is to seek a balance of capital appreciation, income and preservation of capital.
1. Significant Accounting Policies
The following accounting policies are in accordance with U.S. generally accepted accounting principles and are consistently followed by the Series.
Security Valuation—Equity securities, except those traded on the Nasdaq Stock Market, Inc. (Nasdaq), are valued at the last quoted sales price as of the time of the regular close of the New York Stock Exchange (NYSE) on the valuation date. Securities traded on the Nasdaq are valued in accordance with the Nasdaq Official Closing Price, which may not be the last sales price. If on a particular day an equity security does not trade, then the mean between the bid and asked prices will be used. U.S. government and agency securities are valued at the mean between the bid and asked prices. Other long-term debt securities are valued by an independent pricing service and such prices are believed to reflect the fair value of such securities. Short-term debt securities having less than 60 days to maturity are valued at amortized cost, which approximates market value. Se curities lending collateral is valued at amortized cost, which approximates market value. Futures contracts and options on futures contracts are valued at the daily quoted settlement prices. Exchange-traded options are valued at the last reported sale price or, if no sales are reported, at the mean between the last reported bid and asked prices. Swap contracts and other securities and assets for which market quotations are not readily available are valued at fair value as determined in good faith under the direction of the Series' Board of Trustees. In determining whether market quotations are readily available or fair valuation will be used, various factors will be taken into consideration, such as market closures, or with respect to foreign securities, aftermarket trading, or significant events after local market trading (e.g., government actions or pronouncements, trading volume or volatility on markets, exchanges among dealers, or news events).
In September 2006, the Financial Accounting Standards Board (FASB) issued FASB Statement No. 157 "Fair Value Measurements" (Statement 157). Statement 157 establishes a framework for measuring fair value in generally accepted accounting principles, clarifies the definition of fair value within that framework, and expands disclosures about the use of fair value measurements. Statement 157 is intended to increase consistency and comparability among fair value estimates used in financial reporting. Statement 157 is effective for fiscal years beginning after November 15, 2007. Management does not expect the adoption of Statement 157 to have an impact on the amounts reported in the financial statements.
Federal Income Taxes—The Series intends to continue to qualify for federal income tax purposes as a regulated investment company and make the requisite distributions to shareholders. Accordingly, no provision for federal income taxes has been made in the financial statements.
On July 13, 2006, FASB released FASB Interpretation No. 48 "Accounting for Uncertainty in Income Taxes" (FIN 48). FIN 48 provides guidance for how uncertain tax positions should be recognized, measured, presented and disclosed in the financial statements. FIN 48 requires the evaluation of tax positions taken or expected to be taken in the course of preparing the Series' tax returns to determine whether the tax positions are "more-likely-than-not" of being sustained by the applicable tax authority. Tax positions not deemed to meet the more-likely-than-not threshold would be recorded as a tax benefit or expense in the current year. Adoption of FIN 48 is required for fiscal years beginning after December 15, 2006 and is to be applied to all open tax years as of the effective date. Recent SEC guidance allows implementing FIN 48 in Series net asset value calculations as late as the Series' last net asset value calculation in the first required fi nancial statement reporting period. As a result, the Series will incorporate FIN 48 in its semiannual report on June 30, 2007. Although the Series' tax positions are currently being evaluated, management does not expect the adoption of FIN 48 to have a material impact on the Series' financial statements.
Class Accounting—Investment income, common expenses and realized and unrealized gain (loss) on investments are allocated to the classes of the Series on the basis of daily net assets of each class. Distribution expenses relating to a specific class are charged directly to that class.
Repurchase Agreements—The Series may invest in a pooled cash account along with other members of the Delaware Investments® Family of Funds pursuant to an exemptive order issued by the Securities and Exchange Commission. The aggregate daily balance of the pooled cash account is invested in repurchase agreements secured by obligations of the U.S. government. The respective collateral is held by the Series' custodian bank until the maturity of the respective repurchase agreements. Each repurchase agreement is at least 102% collateralized. However, in the event of default or bankruptcy by the counterparty to the agreement, realization of the collateral may be subject to legal proceedings.
Use of Estimates—The preparation of financial statements in conformity with U.S. generally accepted accounting principles requires management to make estimates and assumptions that affect the reported amounts of assets and liabilities at the date of the financial statements and the reported amounts of revenues and expenses during the reporting period. Actual results could differ from those estimates.
Other—Expenses directly attributable to the Series are charged directly to the Series. Other expenses common to various funds within the Delaware Investments® Family of Funds are generally allocated amongst such funds on the basis of average net assets. Management fees and some other expenses are paid monthly. Security transactions are recorded on the date the securities are purchased or sold (trade date) for financial reporting purposes. Costs used in calculating realized gains and losses on the sale of investment securities are those of the specific securities sold. Dividend income is recorded on the ex-dividend date and interest income is recorded on the accrual basis. Discounts and premiums are amortized to interest income over the lives of the respective securities. Realized gains (losses) on paydowns of mortgage- and asset-backed securiti es are classified as interest income.
Balanced Series- 16
Delaware VIP Balanced Series
Notes to Financial Statements (continued)
1. Significant Accounting Policies (continued)
The Series declares and pays dividends from net investment income and distributions from net realized gain on investments, if any, following the close of the fiscal year.
Subject to seeking best execution, the Series may direct certain security trades to brokers who have agreed to rebate a portion of the related brokerage commission to the Series in cash. There were no commission rebates during the year ended December 31, 2006. In general, best execution refers to many factors, including the price paid or received for a security, the commission charged, the promptness and reliability of execution, the confidentiality and placement accorded the order, and other factors affecting the overall benefit obtained by the Series on the transaction.
The Series receives earnings credits from its custodian when positive cash balances are maintained, which are used to offset custody fees. The expense paid under this arrangement is included in custodian fees on the Statement of Operations with the corresponding expense offset shown as "expense paid indirectly."
2. Investment Management, Administration Agreements and Other Transactions with Affiliates
In accordance with the terms of its investment management agreement, the Series pays Delaware Management Company (DMC), a series of Delaware Management Business Trust and the investment manager, an annual fee which is calculated daily at the rate of 0.65% on the first $500 million of average daily net assets of the Series, 0.60% on the next $500 million, 0.55% on the next $1.5 billion, and 0.50% on average daily net assets in excess of $2.5 billion.
DMC has contractually agreed to waive that portion, if any, of its management fee and reimburse the Series to the extent necessary to ensure that annual operating expenses, exclusive of taxes, interest, brokerage commissions, distribution fees, certain insurance costs and extraordinary expenses, do not exceed 0.80% of average daily net assets of the Series through April 30, 2007.
Delaware Service Company, Inc. (DSC), an affiliate of DMC, provides accounting, administration, dividend disbursing and transfer agent services. The Series pays DSC a monthly fee computed at the annual rate of 0.04% of the Series' average daily net assets for accounting and administrative services. The Series pays DSC a monthly fee based on average net assets for dividend disbursing and transfer agent services.
Pursuant to a distribution agreement and distribution plan, the Series pays Delaware Distributors, L.P. (DDLP), the distributor and an affiliate of DMC, an annual distribution and service fee not to exceed 0.30% of the average daily net assets of the Service Class shares. DDLP has contracted to waive distribution and service fees through April 30, 2007 in order to prevent distribution and service fees of the Service Class shares from exceeding 0.25% of average daily net assets. Standard Class shares pay no distribution and service expenses.
At December 31, 2006, the Series had liabilities payable to affiliates as follows:
Investment
Management
Fee Payable to
DMC | | Dividend Disbursing,
Transfer Agent, Accounting
and Administration Fees
and Other Expenses
Payable to DSC | | Distribution
Fee Payable
To DDLP | | Other
Expenses
Payable
to DMC
and Affiliates* | |
| $ | 18,654 | | | $ | 1,702 | | | $ | 1 | | | $ | 2,236 | | |
*DMC, as part of its administrative services, pays operating expenses on behalf of the Series and is reimbursed on a periodic basis. Such expenses include items such as printing of shareholder reports, fees for audit, legal and tax services, custodian fees and trustees' fees.
As provided in the investment management agreement, the Series bears the cost of certain legal and tax services, including internal legal and tax services provided to the Series by DMC and/or its affiliates' employees. For the year ended December 31, 2006, the Series was charged $1,710 for internal legal and tax services provided by DMC and/or its affiliates' employees.
Trustees' fees and benefits include expenses accrued by the Series for each Trustee's retainer, per meeting fees and retirement benefits. Independent Trustees with over five years of uninterrupted service are eligible to participate in a retirement plan that provides for the payment of benefits upon retirement. The amount of the retirement benefit is based on factors set forth in the plan, including the number of years of service. On November 16, 2006, the Board of Trustees unanimously voted to terminate the retirement plan. Payments equal to the net present value of the earned benefits will be made in 2007 to those independent trustees so entitled. The retirement benefit payout for the Series is $4,392. Certain officers of DMC, DSC and DDLP are officers and/or trustees of the Trust. These officers and trustees are paid no compensation by the Series.
Balanced Series- 17
Delaware VIP Balanced Series
Notes to Financial Statements (continued)
3. Investments
For the year ended December 31, 2006, the Series made purchases and sales of investment securities other than short-term investments as follows:
| Purchases other than U.S. government securities | | $ | 36,420,339 | | |
| Purchases of U.S. government securities | | | 11,064,032 | | |
| Sales other than U.S. government securities | | | 43,632,479 | | |
| Sales of U.S. government securities | | | 11,348,001 | | |
At December 31, 2006, the cost of investments for federal income tax purposes and unrealized appreciation (depreciation) for the Series were as follows:
Cost of
Investments | | Aggregate
Unrealized
Appreciation | | Aggregate
Unrealized
Depreciation | | Net Unrealized
Appreciation | |
| $ | 35,347,853 | | | $ | 4,027,820 | | | $ | (135,932 | ) | | $ | 3,891,888 | | |
4. Dividend and Distribution Information
Income and long-term capital gain distributions are determined in accordance with federal income tax regulations, which may differ from U.S. generally accepted accounting principles. Additionally, net short-term gains on sales of investment securities are treated as ordinary income for federal income tax purposes. The tax character of dividends and distributions paid during the years ended December 31, 2006 and 2005 was as follows:
| | | Year
Ended
12/31/06 | | Year
Ended
12/31/05 | |
| Ordinary income | | $ | 1,122,167 | | | $ | 993,792 | | |
5. Components of Net Assets on a Tax Basis
As of December 31, 2006, the components of net assets on a tax basis were as follows:
| Shares of beneficial interest | | $ | 50,468,348 | | |
| Undistributed ordinary income | | | 1,093,483 | | |
| Capital loss carryforwards | | | (19,827,058 | ) | |
Unrealized appreciation of investments and
swap contracts | | | 3,897,680 | | |
| Net assets | | $ | 35,632,453 | | |
The differences between book basis and tax basis components of net assets are primarily attributable to tax deferral of losses on wash sales, mark-to-market of futures contracts, tax treatment of market discount and premium on debt instruments, interest accrual on defaulted bonds, and contingent payment debt instruments.
For financial reporting purposes, capital accounts are adjusted to reflect the tax character of permanent book/tax differences. Reclassifications are primarily due to tax treatment of gain (loss) on paydowns of mortgage- and asset-backed securities, contingent payment debt instruments, and market discount and premium on certain debt instruments. Results of operations and net assets were not affected by these reclassifications. For the year ended December 31, 2006, the Series recorded the following reclassifications:
Undistributed
Net
Investment Income | | Accumulated
Net Realized
Gain (Loss) | |
| $ | 56,478 | | | $ | (56,478 | ) | |
For federal income tax purposes, capital loss carryforwards may be carried forward and applied against future capital gains. $1,082,898 was utilized in 2006. Capital loss carryforwards remaining at December 31, 2006 will expire as follows: $1,748,728 expires in 2008, $8,028,969 expires in 2009, $9,576,012 expires in 2010 and $473,349 expires in 2011.
Balanced Series- 18
Delaware VIP Balanced Series
Notes to Financial Statements (continued)
6. Capital Shares
Transactions in capital shares were as follows:
| | | Year
Ended
12/31/06 | | Year
Ended
12/31/05 | |
| Shares sold: | |
| Standard Class | | | 2,599,584 | | | | 51,036 | | |
Shares issued upon reinvestment of dividends
and distributions: | |
| Standard Class | | | 82,019 | | | | 77,210 | | |
| Service Class | | | 10 | | | | 8 | | |
| | | | 2,681,613 | | | | 128,254 | | |
| Shares repurchased: | |
| Standard Class | | | (3,171,452 | ) | | | (703,125 | ) | |
| Net decrease | | | (489,839 | ) | | | (574,871 | ) | |
7. Line of Credit
The Series, along with certain other funds in the Delaware Investments® Family of Funds (the "Participants"), participates in a $225,000,000 revolving line of credit facility to be used for temporary or emergency purposes as an additional source of liquidity to fund redemptions of investor shares. The Participants are charged an annual commitment fee, which is allocated across the Participants on the basis of each Participant's allocation of the entire facility. The Participants may borrow up to a maximum of one third of their net assets under the agreement. The Series had no amounts outstanding as of December 31, 2006, or at any time during the year then ended.
8. Futures Contracts
The Series may invest in financial futures contracts to hedge its existing portfolio securities against fluctuations in value caused by changes in prevailing market interest rates. Upon entering into a futures contract, the Series deposits cash or pledges U.S. government securities to a broker, equal to the minimum "initial margin" requirements of the exchange on which the contract is traded. Subsequent payments are received from the broker or paid to the broker each day, based on the daily fluctuation in the market value of the contract. These receipts or payments are known as "variation margin" and are recorded daily by the Series as unrealized gains or losses until the contracts are closed. When the contracts are closed, the Series records a realized gain or loss equal to the difference between the value of the contract at the time it was opened and the value at the time it was closed. Risks of entering into futures contracts include pote ntial imperfect correlation between the futures contracts and the underlying securities and the possibility of an illiquid secondary market for these instruments. The unrealized gain (loss) is included in liabilities net of receivables and other assets on the Statement of Net Assets.
9. Swap Contracts
The Series may enter into total return swap contracts in accordance with its investment objectives. A swap is a contract to exchange the return generated by one instrument for the return generated by another instrument. Total return swaps involve commitments to pay interest in exchange for a market linked return based on a notional amount. To the extent the total return of the security, instrument or basket of instruments underlying the transaction exceeds the offsetting interest obligation, the Series will receive a payment from the counterparty. To the extent the total return of the security, instrument or basket of instruments underlying the transaction falls short of the offsetting interest obligation, the Series will make a payment to the counterparty. The change in value of swap contracts outstanding, if any, is recorded as unrealized appreciation or depreciation daily. A realized gain or loss is recorded on maturity or termination of the swap contract.
Because there is no organized market for these swap contracts, the value of open swaps may differ from that which would be realized in the event the Series terminated its position in the contract. Risks of entering into these contracts include the potential inability of the counterparty to meet the terms of the contracts. This type of risk is generally limited to the amount of favorable movements in the value of the underlying security, instrument, or basket of instruments, if any, at the day of default. Risks also arise from potential losses from adverse market movements and such losses could exceed the related unrealized amounts shown on the Statement of Net Assets.
Balanced Series- 19
Delaware VIP Balanced Series
Notes to Financial Statements (continued)
10. Securities Lending
The Series, along with other funds in the Delaware Investments® Family of Funds, may lend its securities pursuant to a security lending agreement (Lending Agreement) with JPMorgan Chase. Initial security loans made pursuant to the Lending Agreement are required to be secured by U.S. government obligations and/or cash collateral not less than 102% of the market value of the securities issued in the United States. With respect to each loan, if the aggregate market value of the collateral held on any business day is less than the aggregate market value of the securities which are the subject of such loan, the borrower will be notified to provide additional collateral not less than the applicable collateral requirements. Cash collateral received is invested in fixed income securities, with a weighted average maturity not to exceed 90 days, rated in one of the top two tiers by Standard & Poor's Ratings Group or Moody's Investor s Service, Inc. or repurchase agreements collateralized by such securities. However, in the event of default or bankruptcy by the lending agent, realization and/or retention of the collateral may be subject to legal proceedings. In the event the borrower fails to return loaned securities and the collateral received is insufficient to cover the value of the loaned securities and provided such collateral shortfall is not the result of investment losses, the lending agent has agreed to pay the amount of the shortfall to the Series, or at the discretion of the lending agent, replace the loaned securities. The Series continues to record dividends and interest on the securities loaned and is subject to change in value of the securities loaned that may occur during the term of the loan. The Series has the right under the Lending Agreement to recover the securities from the borrower on demand. With respect to security loans collateralized by U.S. Treasury obligations the Series receives a fee from the securities len ding agent. With respect to security loans collateralized by cash collateral, the earnings from the collateral investments are shared among the Series, the security lending agent and the borrower. The Series records securities lending income net of allocations to the security lending agent and the borrower.
At December 31, 2006, the market value of the securities on loan was $2,389,755, for which the Series received collateral, comprised of U.S. government obligations valued at $162,924, and cash collateral of $2,342,703. Investments purchased with cash collateral are presented on the Statement of Net Assets under the caption "Securities Lending Collateral."
11. Credit and Market Risk
The Series invests in fixed-income securities whose value is derived from an underlying pool of mortgages or consumer loans. Investors receive principal and interest payments as the underlying mortgages and consumer loans are paid back. Some of these securities are collateralized mortgage obligations (CMOs). CMOs are debt securities issued by U.S. government agencies or by financial institutions and other mortgage lenders, which are collateralized by a pool of mortgages held under an indenture. Prepayment of mortgages may shorten the stated maturity of the obligations and can result in a loss of premium, if any has been paid. Certain of these securities may be stripped (securities which provide only the principal or interest feature of the underlying security). The yield to maturity on an interest-only CMO is extremely sensitive not only to changes in prevailing interest rates, but also to the rate of principal payments (including prepayment s) on the related underlying mortgage assets. A rapid rate of principal payments may have a material adverse affect on the Series' yield to maturity. If the underlying mortgage assets experience greater than anticipated prepayments of principal, the Series may fail to fully recoup its initial investment in these securities even if the securities are rated in the highest rating categories.
The Series may invest up to 10% of its total assets in illiquid securities, which may include securities with contractual restrictions on resale, securities exempt from registration under Rule 144A of the Securities Act of 1933, as amended, and other securities which may not be readily marketable. The relative illiquidity of these securities may impair the Series from disposing of them in a timely manner and at a fair price when it is necessary or desirable to do so. While maintaining oversight, the Series' Board of Trustees has delegated to DMC the day-to-day functions of determining whether individual securities are liquid for purposes of the Series' limitation on investments in illiquid assets. At December 31, 2006, no securities have been determined to be illiquid under the Series' Liquidity Procedures. Rule 144A securities have been identified on the Statement of Net Assets.
12. Contractual Obligations
The Series enters into contracts in the normal course of business that contain a variety of indemnifications. The Series' maximum exposure under these arrangements is unknown. However, the Series has not had prior claims or losses pursuant to these contracts. Management has reviewed the Series' existing contracts and expects the risk of loss to be remote.
Balanced Series- 20
Delaware VIP Balanced Series
Notes to Financial Statements (continued)
13. Tax Information (Unaudited)
For the fiscal year ended December 31, 2006, the Series designates dividends and distributions paid during the year as follows:
(A)
Long-Term
Capital Gain
Distributions
(Tax Basis) | | (B)
Ordinary
Income
Distributions
(Tax Basis) | | Total
Distributions
(Tax Basis) | | (C)
Qualifying
Dividends1 | |
| | – | | | | 100 | % | | | 100 | % | | | 50 | % | |
(A) and (B) are based on a percentage of the Series' total distributions.
(C) is based on a percentage of the Series' ordinary income distributions.
1 Qualifying dividends represent dividends which qualify for the corporate dividends received deduction.
Balanced Series- 21
Delaware VIP Trust — Delaware VIP Balanced Series
Report of Independent Registered Public Accounting Firm
To the Shareholders and Board of Trustees
Delaware VIP Trust–Delaware VIP Balanced Series
We have audited the accompanying statement of net assets of the Delaware VIP Balanced Series (one of the series constituting Delaware VIP Trust) (the "Series") as of December 31, 2006, and the related statement of operations for the year then ended, the statements of changes in net assets for each of the two years in the period then ended, and the financial highlights for each of the five years in the period then ended. These financial statements and financial highlights are the responsibility of the Series' management. Our responsibility is to express an opinion on these financial statements and financial highlights based on our audits.
We conducted our audits in accordance with the standards of the Public Company Accounting Oversight Board (United States). Those standards require that we plan and perform the audit to obtain reasonable assurance about whether the financial statements and financial highlights are free of material misstatement. We were not engaged to perform an audit of the Series' internal control over financial reporting. Our audits included consideration of internal control over financial reporting as a basis for designing audit procedures that are appropriate in the circumstances, but not for the purpose of expressing an opinion on the effectiveness of the Series' internal control over financial reporting. Accordingly, we express no such opinion. An audit also includes examining, on a test basis, evidence supporting the amounts and disclosures in the financial statements and financial highlights, assessing the accounting principles used and significant es timates made by management, and evaluating the overall financial statement presentation. Our procedures included confirmation of securities owned as of December 31, 2006, by correspondence with the custodian and brokers or by other appropriate auditing procedures where replies from brokers were not received. We believe that our audits provide a reasonable basis for our opinion.
In our opinion, the financial statements and financial highlights referred to above present fairly, in all material respects, the financial position of the Delaware VIP Balanced Series of Delaware VIP Trust at December 31, 2006, the results of its operations for the year then ended, the changes in its net assets for each of the two years in the period then ended, and its financial highlights for each of the five years in the period then ended, in conformity with U.S. generally accepted accounting principles.
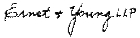
Philadelphia, Pennsylvania
February 14, 2007
The Series files its complete schedule of portfolio holdings with the Securities and Exchange Commission for the first and third quarters of each fiscal year on Form N-Q. The Series' Forms N-Q, as well as a description of the policies and procedures that the Series uses to determine how to vote proxies (if any) relating to portfolio securities is available without charge (i) upon request, by calling 800-523-1918; (ii) on the Series' website at http://www.delawareinvestments.com; and (iii) on the Commission's website at http://www.sec.gov. The Series' Forms N-Q may be reviewed and copied at the Commission's Public Reference Room in Washington, DC; information on the operation of the Public Reference Room may be obtained by calling 1-800-SEC-0330.
Information (if any) regarding how the Series voted proxies relating to portfolio securities during the most recently disclosed 12-month period ended June 30 is available without charge (i) through the Series' website at http://www.delawareinvestments.com; and (ii) on the Commission's website at http://www.sec.gov.
Balanced Series-22
Delaware Investments® Family of Funds
BOARD OF TRUSTEES/DIRECTORS AND OFFICERS ADDENDUM
A mutual fund is governed by a Board of Trustees/Directors ("Trustees"), which has oversight responsibility for the management of a fund's business affairs. Trustees establish procedures and oversee and review the performance of the investment manager, the distributor, and others who perform services for the fund. The independent fund trustees, in particular, are advocates for shareholder interests. Each trustee has served in that capacity since he or she was elected to or appointed to the Board of Trustees, and will continue to serve until his or her retirement or the election of a new trustee in his or her place. The following is a list of the Trustees and Officers with certain background and related information.
Name,
Address,
and Birth Date | | Position(s)
Held with
Fund(s) | | Length of Time
Served | | Principal
Occupation(s)
During
Past 5 Years | | Number of
Portfolios in Fund
Complex Overseen
by Trustee
or Officer | | Other
Directorships
Held by
Trustee
or Officer | |
| INTERESTED TRUSTEES | | | | | | | | | | | | | |
|
Patrick P. Coyne1
2005 Market Street
Philadelphia, PA
19103
April 14, 1963 | | Chairman,
President,
Chief Executive
Officer, and
Trustee | | Chairman and Trustee
since August 16, 2006
President and
Chief Executive Officer
since August 1, 2006 | | Patrick P. Coyne has served in
various executive capacities
at different times at
Delaware Investments.2 | | | 84 | | | None | |
|
| INDEPENDENT TRUSTEES | | | | | | | | | | | | | |
|
Thomas L. Bennett
2005 Market Street
Philadelphia, PA
19103
October 4, 1947 | | Trustee | | Since
March 2005 | | Private Investor –
(March 2004 – Present)
Investment Manager –
Morgan Stanley & Co.
(January 1984 – March 2004) | | | 84 | | | None | |
|
John A. Fry
2005 Market Street
Philadelphia, PA
19103
May 28, 1960 | | Trustee | | Since
January 2001 | | President –
Franklin & Marshall College
(June 2002 – Present)
Executive Vice President –
University of Pennsylvania
(April 1995 – June 2002) | | | 84 | | | Director –
Community Health
Systems
Director –
Allied Barton
Security Holdings | |
|
Anthony D. Knerr
2005 Market Street
Philadelphia, PA
19103
December 7, 1938 | | Trustee | | Since
April 1990 | | Founder and Managing Director –
Anthony Knerr & Associates
(Strategic Consulting)
(1990 – Present) | | | 84 | | | None | |
|
Lucinda S. Landreth
2005 Market Street
Philadelphia, PA
19103
June 24, 1947 | | Trustee | | Since
March 2005 | | Chief Investment Officer –
Assurant, Inc.
(Insurance)
(2002 – 2004) | | | 84 | | | None | |
|
Ann R. Leven
2005 Market Street
Philadelphia, PA
19103
November 1, 1940 | | Trustee | | Since
September 1989 | | Consultant –
ARL Associates
(Financial Planning)
(1983 – Present) | | | 84 | | | Director and
Audit Committee
Chairperson – Andy
Warhol Foundation
Director and Audit
Committee Member –
Systemax, Inc. | |
|
Balanced Series- 23
Name,
Address,
and Birth Date | | Position(s)
Held with
Fund(s) | | Length of Time
Served | | Principal
Occupation(s)
During
Past 5 Years | | Number of
Portfolios in Fund
Complex Overseen
by Trustee
or Officer | | Other
Directorships
Held by
Trustee
or Officer | |
| INDEPENDENT TRUSTEES (CONTINUED) | | | | | | | | | | | | | |
|
Thomas F. Madison
2005 Market Street
Philadelphia, PA
19103
February 25, 1936 | | Trustee | | Since
May 1997 | | President and Chief
Executive Officer –
MLM Partners, Inc.
(Small Business Investing
and Consulting)
(January 1993 – Present) | | | 84 | | | Director –
Banner Health
Director –
CenterPoint Energy
Director and Audit
Committee Member –
Digital River, Inc.
Director and Audit
Committee Member –
Rimage
Corporation
Director – Valmont
Industries, Inc. | |
|
Janet L. Yeomans
2005 Market Street
Philadelphia, PA
19103
July 31, 1948 | | Trustee | | Since
April 1999 | | Vice President
(January 2003 – Present)
and Treasurer
(January 2006 – Present)
3M Corporation
Ms. Yeomans has held
various management positions
at 3M Corporation since 1983. | | | 84 | | | None | |
|
J. Richard Zecher
2005 Market Street
Philadelphia, PA
19103
July 3, 1940 | | Trustee | | Since
March 2005 | | Founder –
Investor Analytics
(Risk Management)
(May 1999 – Present)
Founder –
Sutton Asset Management
(Hedge Fund)
(September 1998 – Present) | | | 84 | | | Director and Audit
Committee Member –
Investor Analytics
Director and Audit
Committee Member –
Oxigene, Inc. | |
|
| OFFICERS | | | | | | | | | | | | | |
|
David F. Connor
2005 Market Street
Philadelphia, PA
19103
December 2, 1963 | | Vice President,
Deputy General
Counsel, and Secretary | | Vice President since
September 21, 2000
and Secretary
since
October 2005 | | David F. Connor has served as
Vice President and Deputy
General Counsel of
Delaware Investments
since 2000. | | | 84 | | | None3 | |
|
David P. O'Connor
2005 Market Street
Philadelphia, PA
19103
February 21, 1966 | | Senior Vice
President,
General Counsel,
and Chief
Legal Officer | | Senior Vice President,
General Counsel, and
Chief Legal Officer
since
October 2005 | | David P. O'Connor has served in
various executive and legal
capacities at different times at
Delaware Investments. | | | 84 | | | None3 | |
|
John J. O'Connor
2005 Market Street
Philadelphia, PA
19103
June 16, 1957 | | Senior Vice President
and Treasurer | | Treasurer
since
February 2005 | | John J. O'Connor has served in
various executive capacities
at different times at
Delaware Investments. | | | 84 | | | None3 | |
|
Richard Salus
2005 Market Street
Philadelphia, PA
19103
October 4, 1963 | | Senior
Vice President
and
Chief Financial
Officer | | Chief Financial
Officer since
November 1, 2006 | | Richard Salus has served in
various executive capacities
at different times at
Delaware Investments. | | | 84 | | | None3 | |
|
1 Patrick P. Coyne is considered to be an "Interested Trustee" because he is an executive officer of the Fund's(s') investment advisor.
2 Delaware Investments is the marketing name for Delaware Management Holdings, Inc. and its subsidiaries, including the Fund's(s') investment advisor, principal underwriter, and its transfer agent.
3 David F. Connor, David P. O'Connor, John J. O'Connor, and Richard Salus serve in similar capacities for the six portfolios of the Optimum Fund Trust, which have the same investment advisor, principal underwriter, and transfer agent as the registrant. John J. O'Connor also serves in a similar capacity for Lincoln Variable Insurance Products Trust, which has the same investment advisor as the registrant.
The Statement of Additional Information for the Fund(s) includes additional information about the Trustees and Officers and is available, without charge, upon request by calling 800 523-1918.
Balanced Series-24
Delaware VIP Trust — Delaware VIP Capital Reserves Series
For the 12-month period ended December 31, 2006, the Delaware VIP Capital Reserves Series showed a positive return of 4.57% for Standard Class shares with distributions reinvested, as Service Class shares returned +4.34% with distributions reinvested. The Series' benchmark, the Merrill Lynch 1-3 Year Treasury Index, gained 3.96%. The Series' former benchmark, the Lehman Brothers Intermediate Government/Credit Index, gained 3.78% (source: Lipper).
Our focus on credit research allowed the VIP Capital Reserves Series to invest in lower-rated credits during 2006, with results that exceeded those of our benchmark. Investments rated B returned +11.00% while those rated BB returned +9.63% (source: Bear Stearns). We believe that our ability to select the best securities in each of those ratings categories explains the Series' outperformance of the benchmark index.
Mortgage-backed securities and asset-backed securities were responsible for the majority of the Series' outperformance during the year. Non-agency hybrid securities outperformed and continued to provide attractive roll-down potential, as the steepness of the hybrid curve provided considerable opportunity for spread tightening as these securities season.
Other areas that were beneficial included corporate bonds and short-seasoned, discount balloon mortgages. The latter group continues to add yield to the front end of the investment portfolio. Among corporate bonds, our down-in-quality bias and security selection enabled the Series to outperform the index in this area of the market.
Additionally, we continued to add short, fixed-rate, home equity asset-backed securities to the Series, as the yields on short-structured spread product remained very attractive in our view verses other like-duration assets.
Treasury Inflation-Protected Securities added performance during the first half of the year as they outperformed nominal Treasuries, but were poor performers and detracted from performance during the second half as energy prices and inflation expectations fell.
The views expressed are current as of the date of this report and are subject to change.
The performance data quoted below and on the next page represent past performance; past performance does not guarantee future results. Investment return and principal value of an investment will fluctuate so that your shares, when redeemed, may be worth more or less than their original cost. Current performance may be lower or higher than the performance data quoted. Please obtain the performance data for the most recent month end by calling the number noted on the page related to this Series in the introductory section of this report.
You should consider the investment objectives, risks, charges, and expenses of the investment carefully before investing. The Delaware VIP Capital Reserves Series prospectus contains this and other important information about the Series. To obtain a prospectus, contact the company noted on the page related to this Series in the introductory section of this report, either by phone or through the company Web site. We advise you to read the prospectus carefully before you invest.
Delaware VIP Capital Reserves Series
Average Annual Total Returns
For the periods ending Dec. 31, 2006 | | 1 Year | | 5 Years | | 10 Years | | Lifetime | |
| Standard Class Shares* | | | +4.57 | % | | | +4.34 | % | | | +5.28 | % | | | +6.05 | % | |
| Service Class Shares** | | | +4.34 | % | | | +3.98 | % | | | NA | | | | +5.38 | % | |
* Commenced operations on July 28, 1988
** Commenced operations on May 1, 2000
Capital Reserves Series- 1
Delaware VIP Trust — Delaware VIP Capital Reserves Series (continued)
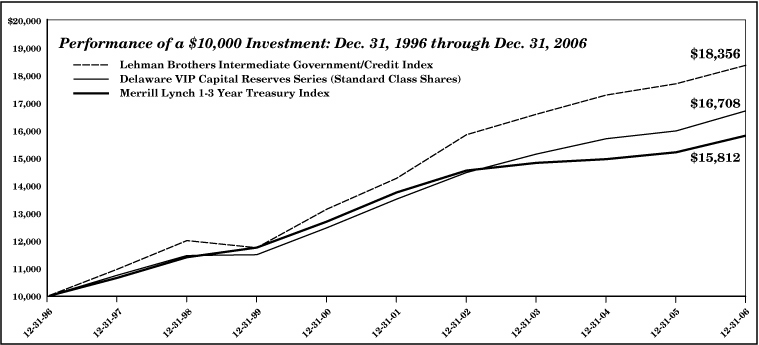
The chart shows a $10,000 investment in the Delaware VIP Capital Reserves Series Standard Class shares for the period from Dec. 31, 1996 through Dec. 31, 2006. All distributions were reinvested. The chart also shows $10,000 invested in the former benchmark Lehman Brothers Intermediate Government/Credit Index and in the current benchmark Merrill Lynch 1-3 Year Treasury Index for the period from Dec. 31, 1996 through Dec. 31, 2006. The investment manager believes the effective duration of the Merrill Lynch 1-3 Year Treasury Index better reflects the Series' investments.
The Merrill Lynch 1-3 Year Treasury Index is an unmanaged index of short-term U.S. Treasury obligations having maturities from 1 to 2.99 years. The Lehman Brothers Intermediate Government/Credit Index measures the performance of U.S. government and corporate bonds with an average daily maturity of four to five years. An index is unmanaged and does not reflect the costs of operating a mutual fund, such as the costs of buying, selling, and holding securities. You cannot invest directly in an index.
Earnings from a variable annuity or variable life investment compound tax free until withdrawal, so no adjustments were made for income taxes.
Performance of Service Class shares will vary due to charges and expenses.
Performance does not reflect insurance fees related to a variable annuity or variable life investment or the deferred sales charge that would apply to certain withdrawals of investments held for fewer than eight years. Performance shown here would have been reduced if such fees were included and the expense limitation was removed. For more information about fees, consult your variable annuity or variable life prospectus.
Investments in variable products involve risk. High yielding, non investment grade bonds involve higher risk than investment grade bonds. Adverse conditions may affect the issuer's ability to pay interest and principal on these securities. International and emerging market investments are subject to risks not ordinarily associated with domestic investments, such as currency, economic and political risks, and different accounting standards. Some portfolios offer more risk than others. Please read both the contract and underlying prospectus for specific details regarding the product's risk profile.
Capital Reserves Series- 2
Delaware VIP Trust — Delaware VIP Capital Reserves Series
Disclosure of Series Expenses
For the Period July 1, 2006 to December 31, 2006
As a shareholder of the Series, you incur ongoing costs, including management fees; distribution and/or service (12b-1) fees; and other Series expenses. This Example is intended to help you understand your ongoing costs (in dollars) of investing in the Series and to compare these costs with the ongoing costs of investing in other mutual funds.
The Example is based on an investment of $1,000 invested at the beginning of the period and held for the entire period from July 1, 2006 to December 31, 2006.
Actual Expenses
The first section of the table shown, "Actual Series Return," provides information about actual account values and actual expenses. You may use the information in this section of the table, together with the amount you invested, to estimate the expenses that you paid over the period. Simply divide your account value by $1,000 (for example, an $8,600 account value divided by $1,000 = 8.6), then multiply the result by the number in the first section under the heading entitled "Expenses Paid During Period" to estimate the expenses you paid on your account during the period.
Hypothetical Example for Comparison Purposes
The second section of the table shown, "Hypothetical 5% Return," provides information about hypothetical account values and hypothetical expenses based on the Series' actual expense ratio and an assumed rate of return of 5% per year before expenses, which is not the Series' actual return. The hypothetical account values and expenses may not be used to estimate the actual ending account balance or expenses you paid for the period. You may use this information to compare the ongoing costs of investing in the Series and other funds. To do so, compare the 5% hypothetical example with the 5% hypothetical examples that appear in the shareholder reports of other funds.
Please note that the expenses shown in the table are meant to highlight your ongoing costs only. As a shareholder of the Series, you do not incur any transaction costs, such as sales charges (loads), redemption fees or exchange fees, but shareholders of other funds may incur such costs. Also, the fees related to the variable annuity investment or the deferred sales charge that could apply have not been included. Therefore, the second section of the table is useful in comparing ongoing costs only, and will not help you determine the relative total costs of owning different funds. The Series' actual expenses shown in the table reflect fee waivers in effect for Service Class shares. The expenses shown in the table assume reinvestment of all dividends and distributions.
Expense Analysis of an Investment of $1,000
| | | Beginning
Account
Value
7/1/06 | | Ending
Account
Value
12/31/06 | | Annualized
Expense
Ratios | | Expenses
Paid During
Period
7/1/06 to
12/31/06* | |
| Actual Series Return | |
| Standard Class | | $ | 1,000.00 | | | $ | 1,031.90 | | | | 0.71 | % | | $ | 3.64 | | |
| Service Class | | | 1,000.00 | | | | 1,029.70 | | | | 0.96 | % | | | 4.91 | | |
| Hypothetical 5% Return (5% return before expenses) | |
| Standard Class | | $ | 1,000.00 | | | $ | 1,021.63 | | | | 0.71 | % | | $ | 3.62 | | |
| Service Class | | | 1,000.00 | | | | 1,020.37 | | | | 0.96 | % | | | 4.89 | | |
*"Expenses Paid During Period" are equal to the Series' annualized expense ratio, multiplied by the average account value over the period, multiplied by 184/365 (to reflect the one-half year period).
Capital Reserves Series- 3
Delaware VIP Trust — Delaware VIP Capital Reserves Series
Sector Allocation and Credit Rating Breakdown
As of December 31, 2006
Sector designations may be different than the sector designations presented in other Series materials.
| Sector | | Percentage
of Net Assets | |
| Agency Asset-Backed Securities | | | 0.25 | % | |
| Agency Collateralized Mortgage Obligations | | | 1.79 | % | |
| Agency Mortgage-Backed Securities | | | 13.18 | % | |
| Agency Obligations | | | 1.04 | % | |
| Commercial Mortgage-Backed Securities | | | 2.22 | % | |
| Corporate Bonds | | | 24.16 | % | |
| Banking | | | 1.94 | % | |
| Basic Industry | | | 1.69 | % | |
| Brokerage | | | 0.80 | % | |
| Communications | | | 4.04 | % | |
| Consumer Cyclical | | | 3.20 | % | |
| Consumer Non-Cyclical | | | 1.01 | % | |
| Electric | | | 2.23 | % | |
| Energy | | | 0.91 | % | |
| Finance Companies | | | 2.91 | % | |
| Insurance | | | 1.93 | % | |
| Natural Gas | | | 0.54 | % | |
| Real Estate | | | 1.58 | % | |
| Transportation | | | 1.38 | % | |
| Foreign Agencies | | | 0.37 | % | |
| Non-Agency Asset-Backed Securities | | | 27.28 | % | |
| Non-Agency Collateralized Mortgage Obligations | | | 16.24 | % | |
| Senior Secured Loans | | | 0.29 | % | |
| U.S. Treasury Obligations | | | 10.96 | % | |
| Repurchase Agreements | | | 3.60 | % | |
| Total Market Value of Securities | | | 101.38 | % | |
| Liabilities Net of Receivables and Other Assets | | | (1.38 | %) | |
| Total Net Assets | | | 100.00 | % | |
Credit Rating Breakdown
(as a % of fixed income investments) | |
| AAA | | | 74.54 | % | |
| AA | | | 2.30 | % | |
| A | | | 6.03 | % | |
| BBB | | | 14.12 | % | |
| BB | | | 0.95 | % | |
| B | | | 2.06 | % | |
| Total | | | 100.00 | % | |
Capital Reserves Series-4
Delaware VIP Trust — Delaware VIP Capital Reserves Series
Statement of Net Assets
December 31, 2006
| | | Principal
Amountm | | Market
Value
(U.S. $) | |
AGENCY ASSET-BACKED
SECURITIES–0.25% | |
Fannie Mae Grantor Trust
Series 2003-T4 2A5 4.907% 9/26/33 | | USD | 53,643 | | | $ | 53,516 | | |
| • Series 2004-T4 A3 4.43% 8/25/24 | | | 2,093 | | | | 2,086 | | |
t Freddie Mac Structured Pass Through
Securities Series T-30 A5
8.61% 12/25/30 | | | 30,836 | | | | 30,764 | | |
Total Agency Asset-Backed Securities
(cost $86,061) | | | | | | | 86,366 | | |
AGENCY COLLATERALIZED
MORTGAGE OBLIGATIONS–1.79% | |
Fannie Mae Grantor Trust
Series 2001-T8 A2 9.50% 7/25/41 | | | 26,529 | | | | 28,569 | | |
Fannie Mae Series 2003-122 AJ
4.50% 2/25/28 | | | 29,564 | | | | 28,831 | | |
Fannie Mae Whole Loan
Series 2004-W9 2A1 6.50% 2/25/44 | | | 61,292 | | | | 62,715 | | |
Freddie Mac
Series 2326 ZQ 6.50% 6/15/31 | | | 128,756 | | | | 133,301 | | |
| Series 2662 MA 4.50% 10/15/31 | | | 57,566 | | | | 56,381 | | |
Freddie Mac Stated Final Series 5 GC
2.95% 12/15/09 | | | 156,255 | | | | 152,671 | | |
• Freddie Mac Strip Series 19 F
5.736% 6/1/28 | | | 26,170 | | | | 26,061 | | |
t Freddie Mac Structured Pass Through
Securities Series T-58 2A
6.50% 9/25/43 | | | 64,362 | | | | 65,715 | | |
Government National Mortgage
Association Series 2002-61 BA
4.648% 3/16/26 | | | 59,292 | | | | 58,601 | | |
Total Agency Collateralized
Mortgage Obligations
(cost $621,180) | | | | | | | 612,845 | | |
AGENCY MORTGAGE-BACKED
SECURITIES–13.18% | |
Fannie Mae
6.50% 8/1/17 | | | 31,545 | | | | 32,109 | | |
| 6.52% 1/1/08 | | | 7,721 | | | | 7,733 | | |
| 7.00% 11/15/16 | | | 88,734 | | | | 91,326 | | |
| 8.50% 9/20/10 | | | 6,080 | | | | 6,299 | | |
| 9.00% 4/1/09 | | | 6,620 | | | | 6,728 | | |
• Fannie Mae ARM
3.021% 6/1/34 | | | 97,979 | | | | 98,304 | | |
| 3.772% 8/1/34 | | | 69,013 | | | | 69,417 | | |
| 5.068% 8/1/35 | | | 68,207 | | | | 66,893 | | |
| 5.256% 10/1/33 | | | 157,739 | | | | 160,577 | | |
| 5.91% 12/1/33 | | | 64,127 | | | | 65,444 | | |
| 6.186% 6/1/36 | | | 239,314 | | | | 241,249 | | |
| 6.251% 7/1/36 | | | 214,922 | | | | 216,904 | | |
| 6.329% 7/1/36 | | | 220,302 | | | | 222,683 | | |
| 6.357% 8/1/36 | | | 216,242 | | | | 218,568 | | |
| 6.367% 4/1/36 | | | 121,320 | | | | 123,073 | | |
| Fannie Mae FHAVA 9.00% 6/1/09 | | | 43,051 | | | | 44,111 | | |
| | | Principal
Amountm | | Market
Value
(U.S. $) | |
AGENCY MORTGAGE-BACKED
SECURITIES (continued) | |
Fannie Mae Relocation 30 yr
Pool #763656 5.00% 1/1/34 | | USD | 105,929 | | | $ | 103,214 | | |
| Pool #763742 5.00% 1/1/34 | | | 138,582 | | | | 134,939 | | |
Fannie Mae S.F. 15 yr
7.50% 3/1/15 | | | 12,512 | | | | 12,962 | | |
| 8.00% 10/1/14 | | | 14,690 | | | | 14,909 | | |
| 8.00% 10/1/16 | | | 53,294 | | | | 55,439 | | |
Fannie Mae S.F. 15 yr TBA
6.00% 1/1/22 | | | 410,000 | | | | 415,765 | | |
Fannie Mae S.F. 30 yr
7.50% 12/1/10 | | | 6,208 | | | | 6,268 | | |
| 7.50% 6/1/31 | | | 28,165 | | | | 29,328 | | |
| 8.50% 5/1/11 | | | 3,817 | | | | 3,903 | | |
| 8.50% 8/1/12 | | | 8,223 | | | | 8,420 | | |
| 9.00% 7/1/20 | | | 49,089 | | | | 52,450 | | |
| 10.00% 8/1/19 | | | 52,552 | | | | 57,284 | | |
Fannie Mae S.F. 30 yr TBA
6.50% 1/1/37 | | | 380,000 | | | | 387,244 | | |
• Freddie Mac ARM
4.673% 4/1/34 | | | 30,165 | | | | 30,583 | | |
| 5.813% 4/1/33 | | | 52,842 | | | | 54,184 | | |
Freddie Mac Balloon 5 yr
4.00% 6/1/08 | | | 18,058 | | | | 17,821 | | |
| 4.00% 1/1/09 | | | 107,302 | | | | 105,583 | | |
| 4.50% 1/1/10 | | | 200,295 | | | | 198,252 | | |
Freddie Mac Balloon 7 yr
4.50% 10/1/09 | | | 119,079 | | | | 117,425 | | |
| 5.00% 6/1/11 | | | 197,750 | | | | 196,683 | | |
| 5.00% 11/1/11 | | | 214,301 | | | | 213,189 | | |
Freddie Mac Relocation 15 yr
3.50% 9/1/18 | | | 85,385 | | | | 79,002 | | |
| 3.50% 10/1/18 | | | 11,951 | | | | 11,057 | | |
Freddie Mac S.F. 15 yr
4.00% 11/1/13 | | | 127,588 | | | | 123,515 | | |
| 4.00% 3/1/14 | | | 154,331 | | | | 149,175 | | |
| 8.00% 5/1/15 | | | 45,905 | | | | 48,382 | | |
| 8.50% 10/1/15 | | | 6,052 | | | | 6,377 | | |
Freddie Mac S.F. 30 yr
7.00% 11/1/33 | | | 29,296 | | | | 30,134 | | |
| 9.25% 9/1/08 | | | 2,710 | | | | 2,770 | | |
GNMA I S.F. 15 yr
6.00% 1/15/09 | | | 4,469 | | | | 4,503 | | |
| 8.50% 8/15/10 | | | 2,892 | | | | 2,921 | | |
GNMA I S.F. 30 yr
8.00% 5/15/08 | | | 12,398 | | | | 12,428 | | |
| 11.00% 11/15/10 | | | 148,615 | | | | 157,324 | | |
GNMA II S.F. 30 yr
12.00% 6/20/14 | | | 6,788 | | | | 7,632 | | |
| 12.00% 3/20/15 | | | 693 | | | | 767 | | |
| 12.00% 2/20/16 | | | 2,244 | | | | 2,477 | | |
Total Agency Mortgage-Backed
Securities (cost $4,565,392) | | | | | | | 4,525,727 | | |
Capital Reserves Series- 5
Delaware VIP Capital Reserves Series
Statement of Net Assets (continued)
| | | Principal
Amountm | | Market
Value
(U.S. $) | |
| AGENCY OBLIGATIONS–1.04% | |
| Fannie Mae 5.25% 12/3/07 | | USD | 35,000 | | | $ | 35,010 | | |
Federal Home Loan Bank
4.25% 9/14/07 | | | 180,000 | | | | 178,797 | | |
Freddie Mac
5.00% 9/16/08 | | | 65,000 | | | | 64,965 | | |
| 7.00% 3/15/10 | | | 75,000 | | | | 79,580 | | |
Total Agency Obligations
(cost $357,787) | | | | | | | 358,352 | | |
COMMERCIAL MORTGAGE-BACKED
SECURITIES–2.22% | |
# Bear Stearns Commercial Mortgage
Securities Series 2004-ESA E 144A
5.064% 5/14/16 | | | 65,000 | | | | 64,748 | | |
t# Commercial Mortgage Pass Through
Certificates Series 2001-J1A A2 144A
6.457% 2/14/34 | | | 47,533 | | | | 49,196 | | |
# Crown Castle Towers Series 2006-1A B
144A 5.362% 11/15/36 | | | 40,000 | | | | 39,950 | | |
Deutsche Mortgage and Asset Receiving
Series 1998-C1 A2 6.538% 6/15/31 | | | 149,188 | | | | 150,174 | | |
DLJ Commercial Mortgage
Series 1998-CF1 A3 6.70% 2/18/31 | | | 150,000 | | | | 151,780 | | |
First Union-Lehman Brothers-Bank of
America Series 1998-C2 A2
6.56% 11/18/35 | | | 79,912 | | | | 80,741 | | |
# SBA Commercial Mortgage Securities
Trust Series 2006-1A B 144A
5.451% 11/15/36 | | | 150,000 | | | | 150,383 | | |
# Tower 144A
Series 2006-1 B 5.588% 2/15/36 | | | 30,000 | | | | 30,168 | | |
| Series 2006-1 C 5.707% 2/15/36 | | | 45,000 | | | | 45,285 | | |
Total Commercial Mortgage-Backed
Securities (cost $770,144) | | | | | | | 762,425 | | |
| CORPORATE BONDS–24.16% | |
| Banking–1.94% | |
| Marshall & Ilsley 3.95% 8/14/09 | | | 145,000 | | | | 140,373 | | |
| Popular North America 4.25% 4/1/08 | | | 295,000 | | | | 290,733 | | |
| •# Vneshtorgbank 144A 5.97% 8/1/08 | | | 100,000 | | | | 100,175 | | |
• Wachovia Capital Trust III
5.80% 3/15/42 | | | 135,000 | | | | 136,240 | | |
| | | | | | | | 667,521 | | |
| Basic Industry–1.69% | |
| Abitibi-Consolidated 7.875% 8/1/09 | | | 80,000 | | | | 78,400 | | |
| Bowater 9.00% 8/1/09 | | | 135,000 | | | | 142,087 | | |
| Norske Skog Canada 8.625% 6/15/11 | | | 65,000 | | | | 66,138 | | |
| Grupo Minero Mexico 8.25% 4/1/08 | | | 100,000 | | | | 103,500 | | |
| Lubrizol 4.625% 10/1/09 | | | 120,000 | | | | 117,788 | | |
| Weyerhaeuser 5.95% 11/1/08 | | | 70,000 | | | | 70,590 | | |
| | | | | | | | 578,503 | | |
| Brokerage–0.80% | |
| Amvescap 4.50% 12/15/09 | | | 120,000 | | | | 117,067 | | |
| LaBranche 9.50% 5/15/09 | | | 75,000 | | | | 79,125 | | |
| Nuveen Investments 5.00% 9/15/10 | | | 80,000 | | | | 78,767 | | |
| | | | | | | | 274,959 | | |
| | | Principal
Amountm | | Market
Value
(U.S. $) | |
| CORPORATE BONDS (continued) | |
| Communications–4.04% | |
| AT&T 7.30% 11/15/11 | | USD | 180,000 | | | $ | 195,082 | | |
| BellSouth 4.20% 9/15/09 | | | 90,000 | | | | 87,547 | | |
Comcast Cable Communications
6.20% 11/15/08 | | | 235,000 | | | | 238,824 | | |
| Cox Communications 4.625% 1/15/10 | | | 60,000 | | | | 58,771 | | |
| GTE California 7.65% 3/15/07 | | | 105,000 | | | | 105,377 | | |
| News America 7.375% 10/17/08 | | | 70,000 | | | | 72,267 | | |
Telecom Italia Capital
4.00% 1/15/10 | | | 130,000 | | | | 124,223 | | |
| • 5.984% 7/18/11 | | | 100,000 | | | | 99,969 | | |
| Telefonos de Mexico 4.50% 11/19/08 | | | 155,000 | | | | 152,979 | | |
| Time Warner 5.50% 11/15/11 | | | 80,000 | | | | 79,879 | | |
| Viacom | |
| • 5.711% 6/16/09 | | | 120,000 | | | | 120,284 | | |
| 5.75% 4/30/11 | | | 50,000 | | | | 50,073 | | |
| | | | | | | | 1,385,275 | | |
| Consumer Cyclical–3.20% | |
| CVS 3.875% 11/1/07 | | | 155,000 | | | | 153,053 | | |
| • DaimlerChrysler 5.82% 8/3/09 | | | 135,000 | | | | 135,315 | | |
Ford Motor Credit
5.80% 1/12/09 | | | 95,000 | | | | 93,319 | | |
| 9.875% 8/10/11 | | | 150,000 | | | | 160,578 | | |
| Fortune Brands 5.125% 1/15/11 | | | 70,000 | | | | 68,752 | | |
• General Motors Acceptance
6.324% 7/16/07 | | | 105,000 | | | | 105,099 | | |
| May Department Stores 3.95% 7/15/07 | | | 115,000 | | | | 113,896 | | |
| MGM MIRAGE 9.75% 6/1/07 | | | 50,000 | | | | 50,875 | | |
| Penney (J.C.) 7.375% 8/15/08 | | | 145,000 | | | | 148,543 | | |
| Wal-Mart Stores 6.875% 8/10/09 | | | 65,000 | | | | 67,759 | | |
| | | | | | | | 1,097,189 | | |
| Consumer Non-Cyclical–1.01% | |
| Fred Meyer 7.45% 3/1/08 | | | 70,000 | | | | 71,535 | | |
| # HCA 144A 9.125% 11/15/14 | | | 40,000 | | | | 42,850 | | |
| Kraft Foods 4.125% 11/12/09 | | | 120,000 | | | | 116,470 | | |
| US Oncology 9.00% 8/15/12 | | | 110,000 | | | | 116,600 | | |
| | | | | | | | 347,455 | | |
| Electric–2.23% | |
| Ameren 4.263% 5/15/07 | | | 80,000 | | | | 79,591 | | |
| America Electric Power 4.709% 8/16/07 | | | 95,000 | | | | 94,548 | | |
| CC Fund Trust I 6.90% 2/16/07 | | | 45,000 | | | | 45,056 | | |
| Dominion Resources 5.687% 5/15/08 | | | 75,000 | | | | 75,133 | | |
| FPL Group Capital 5.625% 9/1/11 | | | 70,000 | | | | 70,839 | | |
| Pacific Gas & Electric 4.20% 3/1/11 | | | 120,000 | | | | 115,002 | | |
| Potomac Electric Power 6.25% 10/15/07 | | | 75,000 | | | | 75,387 | | |
# Power Contract Financing 144A
6.256% 2/1/10 | | | 49,884 | | | | 50,172 | | |
# Power Receivables Finance 144A
6.29% 1/1/12 | | | 75,161 | | | | 75,652 | | |
| PSEG Funding Trust I 5.381% 11/16/07 | | | 60,000 | | | | 59,887 | | |
| Southern Capital Funding 5.30% 2/1/07 | | | 25,000 | | | | 24,990 | | |
| | | | | | | | 766,257 | | |
Capital Reserves Series- 6
Delaware VIP Capital Reserves Series
Statement of Net Assets (continued)
| | | Principal
Amountm | | Market
Value
(U.S. $) | |
| CORPORATE BONDS (continued) | |
| Energy–0.91% | |
| Talisman Energy 7.125% 6/1/07 | | USD | 210,000 | | | $ | 211,367 | | |
| Valero Energy 6.125% 4/15/07 | | | 100,000 | | | | 100,133 | | |
| | | | | | | | 311,500 | | |
| Finance Companies–2.91% | |
| General Electric Capital 6.50% 1/27/09 | | NZD | 500,000 | | | | 345,700 | | |
International Lease Finance
4.625% 6/2/08 | | USD | 60,000 | | | | 59,318 | | |
•# Mizuho JGB Investment Preferred
144A 9.87% 12/29/49 | | | 135,000 | | | | 143,111 | | |
| Residential Capital | |
| • 5.85% 6/9/08 | | | 70,000 | | | | 69,881 | | |
| 6.125% 11/21/08 | | | 215,000 | | | | 216,160 | | |
| 6.375% 6/30/10 | | | 43,000 | | | | 43,534 | | |
| • 6.675% 11/21/08 | | | 45,000 | | | | 45,586 | | |
| •# Xtrata Finance 144A 5.724% 11/13/09 | | | 75,000 | | | | 75,068 | | |
| | | | | | | | 998,358 | | |
| Insurance–1.93% | |
Marsh & McLennan
5.15% 9/15/10 | | | 50,000 | | | | 49,164 | | |
| 5.375% 3/15/07 | | | 95,000 | | | | 94,973 | | |
| • 5.513% 7/13/07 | | | 75,000 | | | | 75,014 | | |
# Nippon Life Insurance 144A
4.875% 8/9/10 | | | 90,000 | | | | 88,100 | | |
| PMI Group 5.568% 11/15/08 | | | 85,000 | | | | 84,955 | | |
| SAFECO Capital Trust I 8.072% 7/15/37 | | | 100,000 | | | | 104,675 | | |
| St. Paul Travelers 5.01% 8/16/07 | | | 70,000 | | | | 69,743 | | |
| WellPoint 4.25% 12/15/09 | | | 35,000 | | | | 34,045 | | |
| Willis 5.125% 7/15/10 | | | 65,000 | | | | 63,421 | | |
| | | | | | | | 664,090 | | |
| Natural Gas–0.54% | |
| • Sempra Energy 5.845% 5/21/08 | | | 50,000 | | | | 50,022 | | |
| Southern Union 6.15% 8/16/08 | | | 135,000 | | | | 135,606 | | |
| | | | | | | | 185,628 | | |
| Real Estate–1.58% | |
Developers Diversified Realty
4.625% 8/1/10 | | | 100,000 | | | | 97,436 | | |
| EOP Operating 7.00% 7/15/11 | | | 125,000 | | | | 135,404 | | |
Simon Property Group
5.375% 8/28/08 | | | 130,000 | | | | 129,483 | | |
| 7.125% 2/9/09 | | | 35,000 | | | | 36,191 | | |
| Tanger Properties 9.125% 2/15/08 | | | 140,000 | | | | 145,035 | | |
| | | | | | | | 543,549 | | |
| Transportation–1.38% | |
| Continental Airlines 6.503% 6/15/11 | | | 245,000 | | | | 252,350 | | |
# Erac USA Finance 144A
7.35% 6/15/08 | | | 215,000 | | | | 220,457 | | |
| | | | | | | | 472,807 | | |
Total Corporate Bonds
(cost $8,256,594) | | | | | | | 8,293,091 | | |
| FOREIGN AGENCIES–0.37% | |
Pemex Project Funding Master Trust
6.125% 8/15/08 | | | 125,000 | | | | 126,313 | | |
Total Foreign Agencies
(cost $125,338) | | | | | | | 126,313 | | |
| | | Principal
Amountm | | Market
Value
(U.S. $) | |
NON-AGENCY ASSET-BACKED
SECURITIES–27.28% | |
| Ameriquest Mortgage Securities | |
| Series 2003-5 A4 4.272% 4/25/33 | | USD | 19,356 | | | $ | 19,221 | | |
| Series 2003-11 AF6 5.14% 1/25/34 | | | 65,000 | | | | 64,290 | | |
| Series 2004-FR1 A4 3.243% 5/25/34 | | | 36,149 | | | | 35,887 | | |
| • Series 2006-R1 A2C 5.54% 3/25/36 | | | 100,000 | | | | 100,119 | | |
Argent Securities Series 2003-W5 AF4
4.66% 10/25/33 | | | 19,174 | | | | 19,038 | | |
BMW Vehicle Owner Trust
Series 2004-A A3 2.67% 3/25/08 | | | 4,803 | | | | 4,794 | | |
Centex Home Equity Series 2005-D AF4
5.27% 10/25/35 | | | 155,000 | | | | 154,154 | | |
Chase Funding Mortgage Loan
Asset-Backed Certificates
Series 2002-3 1A6 4.707% 9/25/13 | | | 188,583 | | | | 186,328 | | |
| Series 2003-2 1A4 3.986% 8/25/29 | | | 21,951 | | | | 21,788 | | |
| Series 2003-3 1A4 3.303% 11/25/29 | | | 160,521 | | | | 158,250 | | |
CIT Equipment Collateral
Series 2005-VT1 A3 4.12% 8/20/08 | | | 195,816 | | | | 194,737 | | |
| Series 2006-VT2 A3 5.07% 2/20/10 | | | 100,000 | | | | 99,809 | | |
CitiFinancial Mortgage Securities
Series 2003-2 AF4 4.098% 5/25/33 | | | 220,000 | | | | 215,408 | | |
| Series 2004-1 AF2 2.645% 4/25/34 | | | 212,078 | | | | 207,254 | | |
| Countrywide Asset-Backed Certificates | |
| • Series 2004-13 AV2 5.61% 5/25/34 | | | 37,174 | | | | 37,193 | | |
| # Series 2004-BC1N 144A 5.50% 4/25/35 | | | 3,593 | | | | 3,595 | | |
| Series 2004-S1 A2 3.872% 3/25/20 | | | 174,250 | | | | 171,684 | | |
| • Series 2006-1 AF2 5.281% 7/25/36 | | | 410,000 | | | | 408,217 | | |
| • Series 2006-1 AF3 5.348% 7/25/36 | | | 280,000 | | | | 278,967 | | |
| • Series 2006-3 2A2 5.53% 6/25/36 | | | 135,000 | | | | 135,223 | | |
| Series 2006-9 1AF3 5.859% 10/25/46 | | | 160,000 | | | | 160,750 | | |
| • Series 2006-11 1AF3 6.05% 9/25/46 | | | 215,000 | | | | 217,150 | | |
| Series 2006-13 1AF3 5.944% 1/25/37 | | | 160,000 | | | | 160,997 | | |
| • Series 2006-15 A3 5.689% 10/25/46 | | | 115,000 | | | | 115,278 | | |
| Series 2006-S2 A2 5.627% 7/25/27 | | | 80,000 | | | | 79,941 | | |
| Series 2006-S3 A2 6.085% 6/25/21 | | | 250,000 | | | | 252,242 | | |
| Series 2006-S5 A3 5.762% 6/25/35 | | | 115,000 | | | | 115,190 | | |
| • Series 2006-S6 A2 5.519% 3/25/34 | | | 105,000 | | | | 104,687 | | |
| • Series 2006-S7 A3 5.712% 11/25/35 | | | 210,000 | | | | 209,499 | | |
| • Series 2006-S9 A3 5.728% 8/25/36 | | | 95,000 | | | | 94,418 | | |
# Credit-Based Asset Servicing and
Securitization Series 2006-SL1 A2
144A 5.556% 9/25/36 | | | 245,000 | | | | 244,761 | | |
Credit Suisse First Boston Mortgage
Securities Series 2005-AGE1 A2
4.64% 2/25/32 | | | 250,000 | | | | 246,152 | | |
# Dunkin Securitization Series 2006-1 A2
144A 5.779% 6/20/31 | | | 100,000 | | | | 101,343 | | |
• Equifirst Mortgage Loan Trust
Series 2004-3 A2 5.68% 12/25/34 | | | 27,278 | | | | 27,300 | | |
General Motors Acceptance Corporation
Mortgage Loan Trust
Series 2003-HE2 A3 4.12% 10/25/26 | | | 111,189 | | | | 110,532 | | |
| Series 2004-HLT1 A2 3.87% 5/25/25 | | | 6,119 | | | | 6,096 | | |
| • Series 2006-HE3 A2 5.75% 10/25/36 | | | 95,000 | | | | 94,973 | | |
Capital Reserves Series- 7
Delaware VIP Capital Reserves Series
Statement of Net Assets (continued)
| | | Principal
Amountm | | Market
Value
(U.S. $) | |
NON-AGENCY ASSET-BACKED
SECURITIES (continued) | |
GSAMP Trust Series 2006-S3 A1
6.085% 5/25/36 | | USD | 115,231 | | | $ | 114,982 | | |
Indymac Seconds Asset Backed Trust
Series 2006-1 A2 5.767% 5/25/36 | | | 235,000 | | | | 235,449 | | |
Long Beach Auto Receivables Trust
Series 2006-B A3 5.17% 8/15/11 | | | 300,000 | | | | 299,989 | | |
Long Beach Mortgage Loan Trust
Series 2006-A A2 5.548% 5/25/36 | | | 205,000 | | | | 205,330 | | |
•# MASTR Specialized Loan Trust
Series 2005-2 A2 144A
5.006% 7/25/35 | | | 33,983 | | | | 33,346 | | |
| Merrill Lynch Mortgage Investors | |
| • Series 2005-NCB A1A 5.451% 7/25/36 | | | 24,315 | | | | 24,213 | | |
| • Series 2006-AR1 A2C 5.51% 3/25/37 | | | 80,000 | | | | 80,028 | | |
• Morgan Stanley Mortgage Loan Trust
Series 2006-12XS A1 5.47% 10/25/36 | | | 158,109 | | | | 158,125 | | |
New Century Home Equity Loan Trust
Series 2003-5 AI4 4.76% 11/25/33 | | | 100,000 | | | | 99,063 | | |
• Option One Mortgage Loan Trust
Series 2005-4 A3 5.61% 11/25/35 | | | 125,000 | | | | 125,315 | | |
Renaissance Home Equity Loan Trust
Series 2004-2 AF3 4.464% 7/25/34 | | | 70,997 | | | | 70,627 | | |
| Series 2004-4 AF2 3.856% 2/25/35 | | | 211 | | | | 210 | | |
| Series 2005-1 AF2 4.263% 5/25/35 | | | 55,922 | | | | 55,666 | | |
| Series 2005-4 A2 5.399% 2/25/36 | | | 40,000 | | | | 39,809 | | |
| Series 2005-4 A3 5.565% 2/25/36 | | | 25,000 | | | | 24,945 | | |
| Series 2006-1 AF3 5.608% 5/25/36 | | | 210,000 | | | | 209,860 | | |
| Series 2006-2 AF3 5.797% 8/25/36 | | | 125,000 | | | | 125,625 | | |
| Series 2006-3 AF2 5.58% 11/25/36 | | | 90,000 | | | | 89,935 | | |
| Series 2006-3 AF3 5.586% 11/25/36 | | | 235,000 | | | | 234,817 | | |
| Series 2006-4 AF2 5.285% 1/25/37 | | | 225,000 | | | | 224,719 | | |
Residential Asset Mortgage Products
Series 2004-RS12 AI2 3.767% 2/25/27 | | | 35,579 | | | | 35,450 | | |
Residential Asset Securities
Series 2002-KS2 AI5 6.779% 4/25/32 | | | 48,013 | | | | 48,366 | | |
| • Series 2004-KS9 AI3 3.79% 8/25/29 | | | 122,379 | | | | 120,823 | | |
| • Series 2006-KS3 AI3 5.52% 4/25/36 | | | 270,000 | | | | 270,431 | | |
Residential Funding Mortgage Securities II
Series 2001-HS2 A5 6.92% 4/25/31 | | | 32,815 | | | | 32,704 | | |
| Series 2005-HI3 A2 5.09% 9/25/35 | | | 160,000 | | | | 158,802 | | |
| Series 2006-HI2 A3 5.79% 2/25/36 | | | 150,000 | | | | 150,606 | | |
| • Series 2006-HSA1 A2 5.19% 2/25/36 | | | 345,000 | | | | 342,482 | | |
| • Series 2006-HSA2 AI2 5.50% 3/25/36 | | | 190,000 | | | | 189,467 | | |
# Silverleaf Finance Series 2005-A A
144A 4.857% 11/15/16 | | | 77,006 | | | | 76,298 | | |
Structured Asset Securities
Series 2001-SB1 A2 3.375% 8/25/31 | | | 44,267 | | | | 39,771 | | |
| Series 2005-4XS 1A2B 4.67% 3/25/35 | | | 110,000 | | | | 108,780 | | |
| Series 2005-9XS 1A2A 4.84% 6/25/35 | | | 95,000 | | | | 93,824 | | |
| Series 2005-NC1 A2 3.92% 2/25/35 | | | 26,312 | | | | 26,189 | | |
| • Series 2005-NC1 A7 5.58% 2/25/35 | | | 117,529 | | | | 117,630 | | |
Triad Auto Receivables Owner Trust
Series 2006-C A4 5.31% 5/13/13 | | | 160,000 | | | | 160,578 | | |
| | | Principal
Amountm | | Market
Value
(U.S. $) | |
NON-AGENCY ASSET-BACKED
SECURITIES (continued) | |
UPFC Auto Receivables Trust
Series 2006-B A3 5.01% 8/15/12 | | USD | 85,000 | | | $ | 84,809 | | |
Total Non-Agency Asset-Backed
Securities (cost $9,364,168) | | | | | | | 9,366,328 | | |
NON-AGENCY COLLATERALIZED
MORTGAGE OBLIGATIONS–16.24% | |
Bank of America Alternative Loan Trust
Series 2003-10 2A1 6.00% 12/25/33 | | | 90,411 | | | | 90,608 | | |
| Series 2004-2 1A1 6.00% 3/25/34 | | | 73,621 | | | | 73,782 | | |
| Series 2004-11 1CB1 6.00% 12/25/34 | | | 39,738 | | | | 39,909 | | |
| Series 2005-9 5A1 5.50% 10/25/20 | | | 114,522 | | | | 113,878 | | |
• Bank of America Funding
Series 2006-H 1A2 5.691% 9/20/46 | | | 145,248 | | | | 145,271 | | |
• Bank of America Mortgage Securities
Series 2003-D 1A2 6.114% 5/25/33 | | | 2,343 | | | | 2,361 | | |
• Bear Stearns Alternative A Trust
Series 2006-3 33A1 6.189% 5/25/36 | | | 113,845 | | | | 115,158 | | |
| Series 2006-3 34A1 6.186% 5/25/36 | | | 119,254 | | | | 120,626 | | |
| Series 2006-4 23A5 6.241% 8/25/36 | | | 103,079 | | | | 104,493 | | |
Bear Stearns Asset-Backed Securities
Series 2005-AC8 A5 5.50% 11/25/35 | | | 88,184 | | | | 87,974 | | |
Countrywide Alternative Loan Trust
Series 2003-20CB 1A2 5.50% 10/25/33 | | | 161,528 | | | | 160,338 | | |
| Series 2004-28CB 6A1 6.00% 1/25/35 | | | 93,240 | | | | 93,386 | | |
| •Series 2004-J7 1A2 4.673% 8/25/34 | | | 25,990 | | | | 25,783 | | |
| Series 2005-1CB 2A2 5.50% 3/25/35 | | | 182,301 | | | | 180,746 | | |
| Series 2006-2CB A3 5.50% 3/25/36 | | | 77,622 | | | | 77,757 | | |
•t Countrywide Home Loan Mortgage Pass
Through Trust
Series 2003-21 A1 4.077% 5/25/33 | | | 39,612 | | | | 39,089 | | |
| Series 2004-12 1M 4.564% 8/25/34 | | | 98,527 | | | | 97,680 | | |
| Series 2006-HYB4 1A2 5.711% 6/20/36 | | | 93,208 | | | | 93,617 | | |
Credit Suisse First Boston Mortgage
Securities
Series 2002-5 1A4 6.50% 2/25/32 | | | 145,264 | | | | 144,842 | | |
| Series 2003-29 5A1 7.00% 12/25/33 | | | 30,263 | | | | 30,830 | | |
| Series 2004-1 3A1 7.00% 2/25/34 | | | 8,402 | | | | 8,559 | | |
Deutsche Alternative A Securities Loan
Trust Series 2003-4XS A6A
4.82% 10/25/33 | | | 65,000 | | | | 63,529 | | |
• First Horizon Asset Securities
Series 2004-AR5 4A1 5.682% 10/25/34 | | | 47,716 | | | | 47,461 | | |
• General Motors Acceptance Corporation
Mortgage Loan Trust Series 2005-AR2
4A 5.188% 5/25/35 | | | 89,786 | | | | 88,082 | | |
# GSMPS Mortgage Loan Trust 144A
Series 1998-3 A 7.75% 9/19/27 | | | 31,719 | | | | 33,254 | | |
| Series 2005-RP1 1A3 8.00% 1/25/35 | | | 36,773 | | | | 38,919 | | |
| Series 2005-RP1 1A4 8.50% 1/25/35 | | | 17,076 | | | | 18,234 | | |
GSR Mortgage Home Loan Trust
Series 2004-2F 9A1 6.00% 9/25/19 | | | 33,179 | | | | 33,234 | | |
• Indymac Index Mortgage Loan Trust
Series 2006-AR2 1A1A 5.57% 4/25/46 | | | 39,274 | | | | 39,305 | | |
Capital Reserves Series-8
Delaware VIP Capital Reserves Series
Statement of Net Assets (continued)
| | | Principal
Amountm | | Market
Value
(U.S. $) | |
NON-AGENCY COLLATERALIZED
MORTGAGE OBLIGATIONS (continued) | |
| • JPMorgan Mortgage Trust | | | | | | | | | |
| Series 2005-A4 1A1 5.406% 7/25/35 | | USD | 134,406 | | | $ | 132,685 | | |
| Series 2005-A6 1A2 5.152% 9/25/35 | | | 105,000 | | | | 105,186 | | |
Lehman Mortgage Trust
Series 2005-2 2A3 5.50% 12/25/35 | | | 77,440 | | | | 77,384 | | |
| Series 2006-1 3A3 5.50% 2/25/36 | | | 100,000 | | | | 100,162 | | |
• MASTR Adjustable Rate Mortgages Trust
Series 2003-6 1A2 5.883% 12/25/33 | | | 48,927 | | | | 49,532 | | |
| Series 2005-1 B1 5.436% 3/25/35 | | | 114,087 | | | | 112,966 | | |
| Series 2005-6 7A1 5.375% 6/25/35 | | | 84,944 | | | | 83,753 | | |
# MASTR Reperforming Loan Trust
Series 2005-1 1A5 144A 8.00% 8/25/34 | | | 73,079 | | | | 77,152 | | |
Nomura Asset Acceptance
Series 2005-WF1 2A2 4.786% 3/25/35 | | | 100,000 | | | | 98,452 | | |
| • Series 2006-AF1 1A2 6.159% 5/25/36 | | | 125,000 | | | | 126,205 | | |
Residential Asset Mortgage Products
Series 2004-SL1 A3 7.00% 11/25/31 | | | 28,997 | | | | 29,443 | | |
| Series 2004-SL4 A3 6.50% 7/25/32 | | | 38,962 | | | | 39,604 | | |
• Residential Funding Mortgage Security I
Series 2006-SA3 3A1 6.079% 9/25/36 | | | 116,209 | | | | 117,039 | | |
| Series 2006-SA4 2A1 6.152% 11/25/36 | | | 261,293 | | | | 264,642 | | |
• Structured Adjustable Rate Mortgage
Loan Trust
Series 2004-18 5A 5.50% 12/25/34 | | | 45,129 | | | | 44,649 | | |
| Series 2005-22 4A2 5.379% 12/25/35 | | | 23,281 | | | | 22,982 | | |
| Series 2005-3XS A2 5.60% 1/25/35 | | | 51,887 | | | | 51,930 | | |
| Series 2006-5 5A4 5.582% 6/25/36 | | | 47,916 | | | | 47,317 | | |
Structured Asset Securities
Series 2004-5H A2 4.43% 12/25/33 | | | 51,245 | | | | 50,580 | | |
| Series 2004-12H 1A 6.00% 5/25/34 | | | 35,047 | | | | 35,113 | | |
Washington Mutual
Series 2003-S10 A2 5.00% 10/25/18 | | | 183,765 | | | | 180,822 | | |
| • Series 2004-AR4 A2 2.98% 6/25/34 | | | 70,033 | | | | 69,637 | | |
| • Series 2006-AR7 1A 5.807% 7/25/46 | | | 57,015 | | | | 57,026 | | |
| • Series 2006-AR10 1A1 5.97% 9/25/36 | | | 128,051 | | | | 129,153 | | |
| • Series 2006-AR14 1A4 5.666% 11/25/36 | | | 119,495 | | | | 119,697 | | |
t Washington Mutual Alternative
Mortgage Pass Through Certificates | | | | | | | | | |
| Series 2006-5 2CB3 6.00% 7/25/36 | | | 113,053 | | | | 114,238 | | |
| • Series 2006-AR5 3A 5.77% 7/25/46 | | | 82,202 | | | | 82,411 | | |
• Wells Fargo Mortgage Backed Securities Trust
Series 2004-EE 2A1 3.989% 12/25/34 | | | 191,512 | | | | 187,583 | | |
| Series 2004-T A1 4.382% 9/25/34 | | | 37,623 | | | | 37,651 | | |
| Series 2005-AR12 2A10 4.32% 7/25/35 | | | 191,407 | | | | 188,822 | | |
| Series 2006-AR4 2A1 5.787% 4/25/36 | | | 205,937 | | | | 204,911 | | |
| Series 2006-AR10 5A1 5.605% 7/25/36 | | | 111,586 | | | | 111,695 | | |
| Series 2006-AR11 A7 5.537% 8/25/36 | | | 126,615 | | | | 126,042 | | |
| Series 2006-AR12 1A2 6.045% 9/25/36 | | | 89,884 | | | | 90,422 | | |
Total Non-Agency Collateralized
Mortgage Obligations
(cost $5,579,794) | | | | | | | 5,575,591 | | |
| | | Principal
Amountm | | Market
Value
(U.S. $) | |
| @«SENIOR SECURED LOANS–0.29% | |
| Visteon 8.61% 6/13/13 | | USD | 100,000 | | | $ | 100,563 | | |
Total Senior Secured Loans
(cost $100,000) | | | | | | | 100,563 | | |
| U.S. TREASURY OBLIGATIONS–10.96% | |
U.S. Treasury Inflation Index Notes
2.375% 4/15/11 | | | 132,193 | | | | 131,708 | | |
| 2.50% 7/15/16 | | | 144,916 | | | | 146,059 | | |
| m 3.00% 7/15/12 | | | 763,341 | | | | 785,794 | | |
| 3.375% 1/15/07 | | | 382,179 | | | | 381,642 | | |
| 3.875% 1/15/09 | | | 307,675 | | | | 316,232 | | |
U.S. Treasury Notes
4.50% 11/30/11 | | | 5,000 | | | | 4,957 | | |
| 4.625% 11/15/09 | | | 735,000 | | | | 732,933 | | |
| 4.625% 11/15/16 | | | 145,000 | | | | 144,094 | | |
| 4.875% 8/15/09 | | | 1,115,000 | | | | 1,118,704 | | |
Total U.S. Treasury Obligations
(cost $3,776,640) | | | | | | | 3,762,123 | | |
| REPURCHASE AGREEMENTS–3.60% | |
With BNP Paribas 4.80% 1/2/07
(dated 12/29/06, to be repurchased
at $469,250, collateralized by
$491,000 U.S. Treasury Bills
due 6/28/07, market value $478,948) | | | 469,000 | | | | 469,000 | | |
With Cantor Fitzgerald 4.82% 1/2/07
(dated 12/29/06, to be repurchased
at $564,302, collateralized by
$49,000 U.S. Treasury Notes 4.00%
due 6/15/09, market value $47,918,
$302,000 U.S. Treasury Notes 6.125%
due 8/15/07, market value $310,953
and $201,000 U.S. Treasury Notes 6.50%
due 2/15/10, market value $216,521) | | | 564,000 | | | | 564,000 | | |
With UBS Warburg 4.75% 1/2/07
(dated 12/29/06, to be repurchased at
$201,106, collateralized by $208,000
U.S. Treasury Bills due 3/29/07,
market value $205,493) | | | 201,000 | | | | 201,000 | | |
Total Repurchase Agreements
(cost $1,234,000) | | | | | | | 1,234,000 | | |
Capital Reserves Series-9
Delaware VIP Capital Reserves Series
Statement of Net Assets (continued)
| TOTAL MARKET VALUE OF SECURITIES–101.38% (cost $34,837,098) | | $ | 34,803,724 | | |
| LIABILITIES NET OF RECEIVABLES AND OTHER ASSETS–(1.38%) | | | (472,125 | ) | |
| NET ASSETS APPLICABLE TO 3,543,373 SHARES OUTSTANDING–100.00% | | $ | 34,331,599 | | |
| NET ASSET VALUE–DELAWARE VIP CAPITAL RESERVES SERIES STANDARD CLASS ($22,625,369 / 2,330,258 Shares) | | $ | 9.71 | | |
| NET ASSET VALUE–DELAWARE VIP CAPITAL RESERVES SERIES SERVICES CLASS ($11,706,230 / 1,213,115 Shares) | | $ | 9.65 | | |
| COMPONENTS OF NET ASSETS AT DECEMBER 31, 2006: | |
| Shares of beneficial interest (unlimited authorization-no par) | | $ | 36,139,207 | | |
| Undistributed net investment income | | | 4,212 | | |
| Accumulated net realized loss on investments | | | (1,800,452 | ) | |
| Unrealized depreciation of investments and foreign currencies | | | (11,368 | ) | |
| Total net assets | | $ | 34,331,599 | | |
m Principal amount shown is stated in the currency in which each security is denominated.
NZD – New Zealand Dollar
USD – United States Dollar
• Variable rate security. The rate shown is the rate as of December 31, 2006.
t Pass Through Agreement. Security represents the contractual right to receive a proportionate amount of underlying payments due to the counterparty pursuant to various agreements related to the rescheduling of obligations and the exchange of certain notes.
m Fully or partially pledged as collateral for financial futures contracts.
« Senior Secured Loans generally pay interest at rates which are periodically redetermined by reference to a base lending rate plus a premium. These base lending rates are generally (i) the prime rate offered by one or more United States banks, (ii) the lending rate offered by one or more European banks such as the London Inter-Bank Offered Rate ('LIBOR') and (iii) the certificate of deposit rate. Senior Secured Loans may be subject to restrictions on resale.
@ Illiquid security. At December 31, 2006, the aggregate amount of illiquid securities equaled $100,563, which represented 0.29% of the Series' net assets. See Note 11 in "Notes to Financial Statements."
# Security exempt from registration under Rule 144A of the Securities Act of 1933, as amended. At December 31, 2006, the aggregate amount of Rule 144A securities equaled $1,802,217, which represented 5.25% of the Series' net assets. See Note 11 in "Notes to Financial Statements."
Summary of Abbreviations:
ARM – Adjustable Rate Mortgage
FHAVA – Federal Housing Administration & Veterans Administration
GNMA – Government National Mortgage Association
S.F. – Single Family
TBA – To be announced
yr – Year
The following foreign currency exchange contracts, futures contracts and swap contracts were outstanding at December 31, 2006:
Foreign Currency Exchange Contracts1
Contracts to
Deliver | | In Exchange For | | Settlement Date | | Unrealized
Depreciation | |
| NZD | (520,000 | ) | | USD | 360,854 | | | | 2/2/07 | | | $ | (4,680 | ) | |
Futures Contracts2
Contracts
to Buy (Sell) | | Notional
Cost (Proceeds) | | Notional
Value | | Expiration Date | | Unrealized
Appreciation
(Depreciation) | |
| 9 | | U.S. Treasury 2 year Notes | | $ | 1,840,749 | | | $ | 1,836,281 | | | 3/31/07 | | $ | (4,468 | ) | |
| | (28 | ) | | U.S. Treasury 5 year Notes | | | (2,961,346 | ) | | | (2,941,750 | ) | | 3/31/07 | | | 19,596 | | |
| 3 | | U.S. Treasury 10 year Notes | | | 326,542 | | | | 322,406 | | | 3/31/07 | | | (4,136 | ) | |
| | | $ | 10,992 | | |
Swap Contracts3
| Notional Amount | | Expiration Date | | Description | | Unrealized
Appreciation | |
| $ | 1,080,000 | | | | 2/1/07 | | | Agreement with Goldman Sachs to receive the notional amount multiplied by the return on the Lehman Brothers Commercial MBS Index Aaa and to pay the notional amount multiplied by the 1 month BBA LIBOR adjusted by a spread of plus 0.05%. | | $ | 15,446 | | |
|
The use of foreign currency exchange contracts, futures contracts and swap contracts involves elements of market risk and risks in excess of the amount recognized in the financial statements. The notional amounts presented above represent the Series' total exposure in such contracts, whereas only the net unrealized appreciation (depreciation) is reflected in the Series' net assets.
1See Note 8 in "Notes to Financial Statements."
2See Note 9 in "Notes to Financial Statements."
3See Note 10 in "Notes to Financial Statements."
See accompanying notes
Capital Reserves Series-10
Delaware VIP Trust — Delaware VIP Capital Reserves Series
Statement of Operations
Year Ended December 31, 2006
Delaware VIP Trust — Delaware VIP Capital Reserves Series
Statements of Changes in Net Assets
| INVESTMENT INCOME: | |
| Interest | | $ | 1,588,988 | | |
| EXPENSES: | |
| Management fees | | | 165,894 | | |
| Distribution expenses – Service Class | | | 26,331 | | |
| Accounting and administration expenses | | | 13,271 | | |
| Reports and statements to shareholders | | | 12,146 | | |
| Audit and tax | | | 11,835 | | |
| Custodian fees | | | 7,851 | | |
| Pricing fees | | | 7,582 | | |
| Trustees' fees and benefits | | | 6,438 | | |
| Legal fees | | | 3,688 | | |
| Dividend disbursing and transfer agent fees and expenses | | | 3,318 | | |
| Insurance fees | | | 1,234 | | |
| Consulting fees | | | 814 | | |
| Registration fees | | | 593 | | |
| Trustees' expenses | | | 195 | | |
| Dues and services | | | 125 | | |
| Taxes (other than taxes on income) | | | 3 | | |
| Other | | | 92 | | |
| | | | 261,410 | | |
| Less waiver of distribution expenses – Service Class | | | (4,388 | ) | |
| Less expense paid indirectly | | | (5,153 | ) | |
| Total operating expenses | | | 251,869 | | |
| NET INVESTMENT INCOME | | | 1,337,119 | | |
NET REALIZED AND UNREALIZED GAIN (LOSS)
ON INVESTMENTS AND FOREIGN CURRENCIES: | |
| Net realized gain (loss) on: | |
| Investments | | | (79,933 | ) | |
| Foreign currencies | | | 364 | | |
| Futures contracts | | | (15,928 | ) | |
| Swap contracts | | | (18,310 | ) | |
| Net realized loss | | | (113,807 | ) | |
Net change in unrealized appreciation/depreciation
of investments and foreign currencies | | | 275,106 | | |
NET REALIZED AND UNREALIZED GAIN ON
INVESTMENTS AND FOREIGN CURRENCIES | | | 161,299 | | |
NET INCREASE IN NET ASSETS RESULTING
FROM OPERATIONS | | $ | 1,498,418 | | |
See accompanying notes
| | | Year Ended | |
| | | 12/31/06 | | 12/31/05 | |
INCREASE (DECREASE) IN NET
ASSETS FROM OPERATIONS: | |
| Net investment income | | $ | 1,337,119 | | | $ | 917,619 | | |
Net realized loss on investments
and foreign currencies | | | (113,807 | ) | | | (21,346 | ) | |
Net change in unrealized appreciation/
depreciation of investments
and foreign currencies | | | 275,106 | | | | (437,959 | ) | |
Net increase in net assets
resulting from operations | | | 1,498,418 | | | | 458,314 | | |
DIVIDENDS AND DISTRIBUTIONS
TO SHAREHOLDERS FROM: | |
| Net investment income: | |
| Standard Class | | | (1,090,179 | ) | | | (998,134 | ) | |
| Service Class | | | (379,335 | ) | | | (50,338 | ) | |
| | | | (1,469,514 | ) | | | (1,048,472 | ) | |
| CAPITAL SHARE TRANSACTIONS: | |
| Proceeds from shares sold: | |
| Standard Class | | | 30,958,997 | | | | 3,108,074 | | |
| Service Class | | | 21,727,142 | | | | 7,736,817 | | |
Net asset value of shares issued upon
reinvestment of dividends and distributions: | |
| Standard Class | | | 1,087,085 | | | | 1,000,606 | | |
| Service Class | | | 370,622 | | | | 46,785 | | |
| | | | 54,143,846 | | | | 11,892,282 | | |
| Cost of shares repurchased: | |
| Standard Class | | | (33,314,414 | ) | | | (5,608,419 | ) | |
| Service Class | | | (14,914,594 | ) | | | (3,268,155 | ) | |
| | | | (48,229,008 | ) | | | (8,876,574 | ) | |
Increase in net assets derived from
capital share transactions | | | 5,914,838 | | | | 3,015,708 | | |
| NET INCREASE IN NET ASSETS | | | 5,943,742 | | | | 2,425,550 | | |
| NET ASSETS: | |
| Beginning of year | | | 28,387,857 | | | | 25,962,307 | | |
End of year (including undistributed
net investment income of $4,212 and
$4,035, respectively) | | $ | 34,331,599 | | | $ | 28,387,857 | | |
See accompanying notes
Capital Reserves Series-11
Delaware VIP Trust — Delaware VIP Capital Reserves Series
Financial Highlights
Selected data for each share of the Series outstanding throughout each period were as follows:
| | | Delaware VIP Capital Reserves Series Standard Class | |
| | | Year Ended | |
| | | 12/31/06 | | 12/31/05 | | 12/31/04 | | 12/31/03 | | 12/31/02 | |
| Net asset value, beginning of period | | $ | 9.710 | | | $ | 9.940 | | | $ | 10.020 | | | $ | 9.970 | | | $ | 9.750 | | |
| Income (loss) from investment operations: | |
| Net investment income1 | | | 0.396 | | | | 0.355 | | | | 0.356 | | | | 0.329 | | | | 0.419 | | |
Net realized and unrealized gain (loss) on investments
and foreign currencies | | | 0.038 | | | | (0.180 | ) | | | 0.004 | | | | 0.125 | | | | 0.253 | | |
| Total from investment operations | | | 0.434 | | | | 0.175 | | | | 0.360 | | | | 0.454 | | | | 0.672 | | |
| Less dividends and distributions from: | |
| Net investment income | | | (0.434 | ) | | | (0.405 | ) | | | (0.440 | ) | | | (0.404 | ) | | | (0.452 | ) | |
| Total dividends and distributions | | | (0.434 | ) | | | (0.405 | ) | | | (0.440 | ) | | | (0.404 | ) | | | (0.452 | ) | |
| Net asset value, end of period | | $ | 9.710 | | | $ | 9.710 | | | $ | 9.940 | | | $ | 10.020 | | | $ | 9.970 | | |
| Total return2 | | | 4.57 | % | | | 1.79 | % | | | 3.66 | % | | | 4.63 | % | | | 7.09 | % | |
| Ratios and supplemental data: | |
| Net assets, end of period (000 omitted) | | $ | 22,626 | | | $ | 23,895 | | | $ | 25,955 | | | $ | 34,077 | | | $ | 42,698 | | |
| Ratio of expenses to average net assets | | | 0.71 | % | | | 0.71 | % | | | 0.62 | % | | | 0.63 | % | | | 0.62 | % | |
| Ratio of net investment income to average net assets | | | 4.10 | % | | | 3.61 | % | | | 3.57 | % | | | 3.36 | % | | | 4.21 | % | |
| Portfolio turnover | | | 318 | % | | | 259 | % | | | 252 | % | | | 438 | % | | | 427 | % | |
1The average shares outstanding method has been applied for per share information.
2Total investment return is based on the change in net asset value of a share during the period and assumes reinvestment of dividends and distributions at net asset value.
See accompanying notes
Capital Reserves Series- 12
Delaware VIP Capital Reserves Series
Financial Highlights (continued)
Selected data for each share of the Series outstanding throughout each period were as follows:
| | | Delaware VIP Capital Reserves Series Service Class | |
| | | Year Ended | |
| | | 12/31/06 | | 12/31/05 | | 12/31/04 | | 12/31/03 | | 12/31/02 | |
| Net asset value, beginning of period | | $ | 9.650 | | | $ | 9.900 | | | $ | 10.000 | | | $ | 9.970 | | | $ | 9.760 | | |
| Income (loss) from investment operations: | |
| Net investment income1 | | | 0.372 | | | | 0.331 | | | | 0.333 | | | | 0.308 | | | | 0.406 | | |
Net realized and unrealized gain (loss) on investments
and foreign currencies | | | 0.037 | | | | (0.200 | ) | | | (0.017 | ) | | | 0.105 | | | | 0.243 | | |
| Total from investment operations | | | 0.409 | | | | 0.131 | | | | 0.316 | | | | 0.413 | | | | 0.649 | | |
| Less dividends and distributions from: | |
| Net investment income | | | (0.409 | ) | | | (0.381 | ) | | | (0.416 | ) | | | (0.383 | ) | | | (0.439 | ) | |
| Total dividends and distributions | | | (0.409 | ) | | | (0.381 | ) | | | (0.416 | ) | | | (0.383 | ) | | | (0.439 | ) | |
| Net asset value, end of period | | $ | 9.650 | | | $ | 9.650 | | | $ | 9.900 | | | $ | 10.000 | | | $ | 9.970 | | |
| Total return2 | | | 4.34 | % | | | 1.35 | % | | | 3.23 | % | | | 4.21 | % | | | 6.84 | % | |
| Ratios and supplemental data: | |
| Net assets, end of period (000 omitted) | | $ | 11,706 | | | $ | 4,493 | | | $ | 7 | | | $ | 6 | | | $ | 6 | | |
| Ratio of expenses to average net assets | | | 0.96 | % | | | 0.96 | % | | | 0.87 | % | | | 0.85 | % | | | 0.77 | % | |
Ratio of expenses to average net assets prior to expense
limitation and expenses paid indirectly | | | 1.01 | % | | | 1.01 | % | | | 0.92 | % | | | 0.88 | % | | | 0.77 | % | |
| Ratio of net investment income to average net assets | | | 3.85 | % | | | 3.36 | % | | | 3.32 | % | | | 3.14 | % | | | 4.06 | % | |
Ratio of net investment income to average net assets prior
to expense limitation and expenses paid indirectly | | | 3.78 | % | | | 3.31 | % | | | 3.27 | % | | | 3.11 | % | | | 4.06 | % | |
| Portfolio turnover | | | 318 | % | | | 259 | % | | | 252 | % | | | 438 | % | | | 427 | % | |
1The average shares outstanding method has been applied for per share information.
2Total investment return is based on the change in net asset value of a share during the period and assumes reinvestment of dividends and distributions at net asset value. Total investment return reflects a waiver and payment of fees by the distributor, as applicable. Performance would have been lower had the waiver not been in effect.
See accompanying notes
Capital Reserves Series-13
Delaware VIP Trust — Delaware VIP Capital Reserves Series
Notes to Financial Statements
December 31, 2006
Delaware VIP Trust (the "Trust") is organized as a Delaware statutory trust and offers 15 series: Delaware VIP Balanced Series, Delaware VIP Capital Reserves Series, Delaware VIP Cash Reserve Series, Delaware VIP Diversified Income Series, Delaware VIP Emerging Markets Series, Delaware VIP Global Bond Series, Delaware VIP Growth Opportunities Series, Delaware VIP High Yield Series, Delaware VIP International Value Equity Series, Delaware VIP REIT Series, Delaware VIP Select Growth Series, Delaware VIP Small Cap Value Series, Delaware VIP Trend Series, Delaware VIP U.S. Growth Series and Delaware VIP Value Series. These financial statements and the related notes pertain to Delaware VIP Capital Reserves Series (the "Series"). The Trust is an open-end investment company. The Series is considered diversified under the Investment Company Act of 1940, as amended, and offers Standard Class and Service Class shares. The Standard Class shares do not carry a 12b-1 fee and the Service Class shares carry a 12b-1 fee. The shares of the Series are sold only to separate accounts of life insurance companies.
The investment objective of the Series is to seek a high, stable level of current income while attempting to minimize fluctuations in principal and provide maximum liquidity.
1. Significant Accounting Policies
The following accounting policies are in accordance with U.S. generally accepted accounting principles and are consistently followed by the Series.
Security Valuation—U.S. government and agency securities are valued at the mean between the bid and asked prices. Other long-term debt securities are valued by an independent pricing service and such prices are believed to reflect the fair value of such securities. Short-term debt securities having less than 60 days to maturity are valued at amortized cost, which approximates market value. Foreign currency exchange contracts are valued at the mean between the bid and asked prices of the contracts and are marked-to-market daily. Interpolated values are derived when the settlement date of the contract is an interim date for which quotations are not available. Futures contracts and options on futures contracts are valued at the daily quoted settlement prices. Swap contracts and other securities and assets for which market quotations are not readily available are valued at fair value as determined in good faith under the direction of the Series' Board of Trustees. In determining whether market quotations are readily available or fair valuation will be used, various factors will be taken into consideration, such as market closures, aftermarket trading, or significant events after local market trading (e.g., government actions or pronouncements, trading volume or volatility on markets, exchanges among dealers, or news events).
In September 2006, the Financial Accounting Standards Board (FASB) issued FASB Statement No. 157 "Fair Value Measurements" (Statement 157). Statement 157 establishes a framework for measuring fair value in generally accepted accounting principles, clarifies the definition of fair value within that framework, and expands disclosures about the use of fair value measurements. Statement 157 is intended to increase consistency and comparability among fair value estimates used in financial reporting. Statement 157 is effective for fiscal years beginning after November 15, 2007. Management does not expect the adoption of Statement 157 to have an impact on the amounts reported in the financial statements.
Federal Income Taxes—The Series intends to continue to qualify for federal income tax purposes as a regulated investment company and make the requisite distributions to shareholders. Accordingly, no provision for federal income taxes has been made in the financial statements.
On July 13, 2006, FASB released FASB Interpretation No. 48 "Accounting for Uncertainty in Income Taxes" (FIN 48). FIN 48 provides guidance for how uncertain tax positions should be recognized, measured, presented and disclosed in the financial statements. FIN 48 requires the evaluation of tax positions taken or expected to be taken in the course of preparing the Series' tax returns to determine whether the tax positions are "more-likely-than-not" of being sustained by the applicable tax authority. Tax positions not deemed to meet the more-likely-than-not threshold would be recorded as a tax benefit or expense in the current year. Adoption of FIN 48 is required for fiscal years beginning after December 15, 2006 and is to be applied to all open tax years as of the effective date. Recent SEC guidance allows implementing FIN 48 in Series net asset value calculations as late as the Series' last net asset value calculation in the first required fi nancial statement reporting period. As a result, the Series will incorporate FIN 48 in its semiannual report on June 30, 2007. Although the Series' tax positions are currently being evaluated, management does not expect the adoption of FIN 48 to have a material impact on the Series' financial statements.
Class Accounting—Investment income and common expenses are allocated to the classes of the Series on the basis of "settled shares" of each class in relation to the net assets of the Series. Realized and unrealized gain (loss) on investments is allocated to the classes of the Series on the basis of daily net assets of each class. Distribution expenses relating to a specific class are charged directly to that class.
Repurchase Agreements—The Series may invest in a pooled cash account along with other members of the Delaware Investments® Family of Funds pursuant to an exemptive order issued by the Securities and Exchange Commission. The aggregate daily balance of the pooled cash account is invested in repurchase agreements secured by obligations of the U.S. government. The respective collateral is held by the Series' custodian bank until the maturity of the respective repurchase agreements. Each repurchase agreement is at least 102% collateralized. However, in the event of default or bankruptcy by the counterparty to the agreement, realization of the collateral may be subject to legal proceedings.
Use of Estimates—The preparation of financial statements in conformity with U.S. generally accepted accounting principles requires management to make estimates and assumptions that affect the reported amounts of assets and liabilities at the date of the financial statements and the reported amounts of revenues and expenses during the reporting period. Actual results could differ from those estimates.
Other—Expenses directly attributable to the Series are charged directly to the Series. Other expenses common to various funds within the Delaware Investments® Family of Funds are generally allocated amongst such funds on the basis of average net assets. Management fees and some other expenses are paid monthly. Security transactions are recorded on the date the securities are purchased or sold (trade date) for financial reporting purposes. Costs used in calculating realized gains and losses on the sale of investment securities are those of the specific securities sold. Interest income is recorded on the accrual basis. Discounts and premiums are amortized to interest income over the lives of the respective securities. Realized gains (losses) on paydowns of mortgage- and asset-backed securities are classified as interest income.
The Series declares dividends daily from net investment income and pays such dividends monthly and declares and pays distributions from net realized gain on investments, if any, following the close of the fiscal year.
Capital Reserves Series- 14
Delaware VIP Capital Reserves Series
Notes to Financial Statements (continued)
1. Significant Accounting Policies (continued)
The Series may receive earnings credits from its custodian when positive cash balances are maintained, which are used to offset custody fees. The expense paid under this arrangement is included in custodian fees on the Statement of Operations with the corresponding expense offset shown as "expense paid indirectly."
2. Investment Management, Administration Agreements and Other Transactions with Affiliates
In accordance with the terms of its investment management agreement, the Series pays Delaware Management Company (DMC), a series of Delaware Management Business Trust and the investment manager, an annual fee which is calculated daily at the rate of 0.50% on the first $500 million of average daily net assets of the Series, 0.475% on the next $500 million, 0.45% on the next $1.5 billion, and 0.425% on average daily net assets in excess of $2.5 billion.
DMC has contractually agreed to waive that portion, if any, of its management fee and reimburse the Series to the extent necessary to ensure that annual operating expenses, exclusive of taxes, interest, brokerage commissions, distribution fees, certain insurance costs and extraordinary expenses, do not exceed 0.70% of average daily net assets of the Series through April 30, 2007. Prior to May 1, 2006, the expense limitation was 0.80% of average daily net assets. No reimbursement was due for the year ended December 31, 2006.
Delaware Service Company, Inc. (DSC), an affiliate of DMC, provides accounting, administration, dividend disbursing and transfer agent services. The Series pays DSC a monthly fee computed at the annual rate of 0.04% of the Series' average daily net assets for accounting and administrative services. The Series pays DSC a monthly fee based on average net assets for dividend disbursing and transfer agent services.
Pursuant to a distribution agreement and distribution plan, the Series pays Delaware Distributors, L.P. (DDLP), the distributor and an affiliate of DMC, an annual distribution and service fee not to exceed 0.30% of the average daily net assets of the Service Class shares. DDLP has contracted to waive distribution and service fees through April 30, 2007 in order to prevent distribution and service fees of the Service Class shares from exceeding 0.25% of average daily net assets. Standard Class shares pay no distribution and service expenses.
At December 31, 2006, the Series had liabilities payable to affiliates as follows:
Investment
Management
Fee Payable to
DMC | | Dividend Disbursing,
Transfer Agent,
Accounting and Administrative
Fees and Other Expenses
Payable to DSC | | Distribution
Fee Payable
To DDLP | | Other
Expenses
Payable
to DMC
and Affiliates* | |
| $ | 15,387 | | | $ | 1,720 | | | $ | 2,855 | | | $ | 2,109 | | |
*DMC, as part of its administrative services, pays operating expenses on behalf of the Series and is reimbursed on a periodic basis. Such expenses include items such as printing of shareholder reports, fees for audit, legal and tax services, custodian fees and trustees' fees.
As provided in the investment management agreement, the Series bears the cost of certain legal and tax services, including internal legal and tax services provided to the Series by DMC and/or its affiliates' employees. For the year ended December 31, 2006, the Series was charged $1,597 for internal legal and tax services provided by DMC and/or its affiliates' employees.
Trustees' fees and benefits include expenses accrued by the Series for each Trustee's retainer, per meeting fees and retirement benefits. Independent Trustees with over five years of uninterrupted service are eligible to participate in a retirement plan that provides for the payment of benefits upon retirement. The amount of the retirement benefit is based on factors set forth in the plan, including the number of years of service. On November 16, 2006, the Board of Trustees unanimously voted to terminate the retirement plan. Payments equal to the net present value of the earned benefits will be made in 2007 to those independent trustees so entitled. The retirement benefit payout for the Series is $4,608. Certain officers of DMC, DSC and DDLP are officers and/or trustees of the Trust. These officers and trustees are paid no compensation by the Series.
Capital Reserves Series- 15
Delaware VIP Capital Reserves Series
Notes to Financial Statements (continued)
3. Investments
For the year ended December 31, 2006, the Series made purchases and sales of investment securities other than short-term investments as follows:
| Purchases other than U.S. government securities | | $ | 36,668,258 | | |
| Purchases of U.S. government securities | | | 69,797,993 | | |
| Sales other than U.S. government securities | | | 25,463,761 | | |
| Sales of U.S. government securities | | | 73,527,877 | | |
At December 31, 2006, the cost of investments for federal income tax purposes and unrealized appreciation (depreciation) for the Series were as follows:
Cost of
Investments | | Aggregate
Unrealized
Appreciation | | Aggregate
Unrealized
Depreciation | | Net Unrealized
Depreciation | |
| $ | 34,947,573 | | | $ | 84,248 | | | $ | (228,097 | ) | | $ | (143,849 | ) | |
4. Dividend and Distribution Information
Income and long-term capital gain distributions are determined in accordance with federal income tax regulations, which may differ from U.S. generally accepted accounting principles. Additionally, gains (losses) on foreign currency transactions and net short-term gains on sales of investment securities are treated as ordinary income for federal income tax purposes. The tax character of dividends and distributions paid during the years ended December 31, 2006 and 2005 was as follows:
| | | Year
Ended
12/31/06 | | Year
Ended
12/31/05 | |
| Ordinary income | | $ | 1,469,514 | | | $ | 1,048,472 | | |
5. Components of Net Assets on a Tax Basis
As of December 31, 2006, the components of net assets on a tax basis were as follows:
| Shares of beneficial interest | | $ | 36,139,207 | | |
| Undistributed ordinary income | | | 15,830 | | |
| Post-October losses | | | (11,406 | ) | |
| Post-October currency losses | | | (4,316 | ) | |
| Capital loss carryforwards | | | (1,679,561 | ) | |
Unrealized depreciation of investments, swap
contracts, and foreign currencies | | | (128,155 | ) | |
| Net assets | | $ | 34,331,599 | | |
The differences between book basis and tax basis components of net assets are primarily attributable to tax deferral of losses on wash sales, mark-to-market of foreign currency contracts, mark-to-market of futures contracts, tax treatment of market discount and premium on debt instruments and contingent payment debt instruments.
Post-October losses and Post-October currency losses represent losses realized on investment and foreign currency transactions from November 1, 2006 through December 31, 2006 that, in accordance with federal income tax regulations, the Series has elected to defer and treat as having arisen in the following fiscal year.
For financial reporting purposes, capital accounts are adjusted to reflect the tax character of permanent book/tax differences. Reclassifications are primarily due to tax treatment of gain (loss) on foreign currency transactions, paydown gains (losses) on mortgage- and asset-backed securities and market discount and premium on certain debt instruments. Results of operations and net assets were not affected by these reclassifications. For the year ended December 31, 2006, the Series recorded the following reclassifications:
Undistributed
Net
Investment Income | | Accumulated
Net Realized
Gain (Loss) | |
| $ | 132,572 | | | $ | (132,572 | ) | |
For federal income tax purposes, capital loss carryforwards may be carried forward and applied against future capital gains. Capital loss carryforwards remaining at December 31, 2006 will expire as follows: $1,132,035 expires in 2008, $82,894 expires in 2010, $226,584 expires in 2013 and $238,048 expires in 2014.
Capital Reserves Series- 16
Delaware VIP Capital Reserves Series
Notes to Financial Statements (continued)
6. Capital Shares
Transactions in capital shares were as follows:
| | | Year
Ended
12/31/06 | | Year
Ended
12/31/05 | |
| Shares sold: | |
| Standard Class | | | 3,206,194 | | | | 317,536 | | |
| Service Class | | | 2,258,522 | | | | 797,328 | | |
Shares issued upon reinvestment of dividends
and distributions: | |
| Standard Class | | | 112,240 | | | | 101,984 | | |
| Service Class | | | 38,492 | | | | 4,829 | | |
| | | | 5,615,448 | | | | 1,221,677 | | |
| Shares repurchased: | |
| Standard Class | | | (3,448,638 | ) | | | (570,499 | ) | |
| Service Class | | | (1,549,400 | ) | | | (337,333 | ) | |
| | | | (4,998,038 | ) | | | (907,832 | ) | |
| Net increase | | | 617,410 | | | | 313,845 | | |
7. Line of Credit
The Series, along with certain other funds in the Delaware Investments® Family of Funds (the "Participants"), participates in a $225,000,000 revolving line of credit facility to be used for temporary or emergency purposes as an additional source of liquidity to fund redemptions of investor shares. The Participants are charged an annual commitment fee, which is allocated across the Participants on the basis of each Participant's allocation of the entire facility. The Participants may borrow up to a maximum of one third of their net assets under the agreement. The Series had no amounts outstanding as of December 31, 2006, or at any time during the year then ended.
8. Foreign Currency Exchange Contracts
The Series may enter into foreign currency exchange contracts as a way of managing foreign exchange rate risk. The Series may enter into these contracts to fix the U.S. dollar value of a security that it has agreed to buy or sell for the period between the date the trade was entered into and the date the security is delivered and paid for. The Series may also use these contracts to hedge the U.S. dollar value of securities it already owns that are denominated in foreign currencies. The change in market value is recorded as an unrealized gain or loss. When the contract is closed, a realized gain or loss is recorded equal to the difference between the value of the contract at the time it was opened and the value at the time it was closed.
The use of foreign currency exchange contracts does not eliminate fluctuations in the underlying prices of the securities, but does establish a rate of exchange that can be achieved in the future. Although foreign currency exchange contracts limit the risk of loss due to a decline in the value of the hedged currency, they also limit any potential gain that might result should the value of the currency increase. In addition, the Series could be exposed to risks if the counterparties to the contracts are unable to meet the terms of their contracts. The unrealized gain (loss) is included in liabilities net of receivables and other assets on the Statement of Net Assets.
9. Futures Contracts
The Series may invest in financial futures contracts to hedge its existing portfolio securities against fluctuations in fair value caused by changes in prevailing market interest rates. Upon entering into a futures contract, the Series deposits cash or pledges U.S. government securities to a broker, equal to the minimum "initial margin" requirements of the exchange on which the contract is traded. Subsequent payments are received from the broker or paid to the broker each day, based on the daily fluctuation in the market value of the contract. These receipts or payments are known as "variation margin" and are recorded daily by the Series as unrealized gains or losses until the contracts are closed. When the contracts are closed, the Series records a realized gain or loss equal to the difference between the value of the contract at the time it was opened and the value at the time it was closed. Risks of entering into futures contracts include s potential imperfect correlation between the futures contracts and the underlying securities and the possibility of an illiquid secondary market for these instruments. The unrealized gain (loss) is included in liabilities net of receivables and other assets on the Statement of Net Assets.
10. Swap Contracts
The Series may enter into total return swap contracts in accordance with its investment objectives. A swap is a contract to exchange the return generated by one instrument for the return generated by another instrument. Total return swaps involve commitments to pay interest in exchange for a market linked return based on a notional amount. To the extent the total return of the security, instrument or basket of instruments underlying the transaction exceeds the offsetting interest obligation, the Series will receive a payment from the counterparty. To the extent the total return of the security, instrument or basket of instruments underlying the transaction falls short of the offsetting interest obligation, the Series will make a payment to the counterparty. The change in value of swap contracts outstanding, if any, is recorded as unrealized appreciation or depreciation daily. A realized gain or loss is recorded on maturity or termination of the swap contract.
Capital Reserves Series- 17
Delaware VIP Capital Reserves Series
Notes to Financial Statements (continued)
10. Swap Contracts (continued)
Because there is no organized market for these swap contracts, the value of open swaps may differ from that which would be realized in the event the Series terminated its position in the contract. Risks of entering into these contracts include the potential inability of the counterparty to meet the terms of the contracts. This type of risk is generally limited to the amount of favorable movements in the value of the underlying security, instrument, or basket of instruments, if any, at the day of default. Risks also arise from potential losses from adverse market movements and such losses could exceed the related unrealized amounts shown on the Statement of Net Assets.
11. Credit and Market Risk
The Series invests in fixed income securities whose value is derived from an underlying pool of mortgages or consumer loans. Investors receive principal and interest payments as the underlying mortgages and consumer loans are paid back. Some of these securities are collateralized mortgage obligations (CMOs). CMOs are debt securities issued by U.S. government agencies or by financial institutions and other mortgage lenders, which are collateralized by a pool of mortgages held under an indenture. Prepayment of mortgages may shorten the stated maturity of the obligations and can result in a loss of premium, if any has been paid. Certain of these securities may be stripped (securities which provide only the principal or interest feature of the underlying security). The yield to maturity on an interest-only CMO is extremely sensitive not only to changes in prevailing interest rates, but also to the rate of principal payments (including prepayment s) on the related underlying mortgage assets. A rapid rate of principal payments may have a material adverse affect on the Series' yield to maturity. If the underlying mortgage assets experience greater than anticipated prepayments of principal, the Series may fail to recoup its initial investment in these securities even if the securities are rated in the highest rating categories.
The Series may invest up to 10% of its total assets in illiquid securities, which may include securities with contractual restrictions on resale, securities exempt from registration under Rule 144A of the Securities Act of 1933, as amended, and other securities which may not be readily marketable. The relative illiquidity of these securities may impair the Series from disposing of them in a timely manner and at a fair price when it is necessary or desirable to do so. While maintaining oversight, the Series' Board of Trustees has delegated to DMC the day-to-day functions of determining whether individual securities are liquid for purposes of the Series' limitation on investments in illiquid assets. Rule 144A and illiquid securities have been identified on the Statement of Net Assets.
12. Contractual Obligations
The Series enters into contracts in the normal course of business that contain a variety of indemnifications. The Series' maximum exposure under these arrangements is unknown. However, the Series has not had prior claims or losses pursuant to these contracts. Management has reviewed the Series' existing contracts and expects the risk of loss to be remote.
13. Tax Information (Unaudited)
For the fiscal year ended December 31, 2006, the Series designates dividends and distributions paid during the year as follows:
(A)
Long-Term
Capital Gain
Distributions
(Tax Basis) | | (B)
Ordinary
Income
Distributions
(Tax Basis) | | Total
Distributions
(Tax Basis) | |
| | – | | | | 100 | % | | | 100 | % | |
(A) and (B) are based on a percentage of the Series' total distributions.
Capital Reserves Series- 18
Delaware VIP Trust — Delaware VIP Capital Reserves Series
Report of Independent Registered Public Accounting Firm
To the Shareholders and Board of Trustees
Delaware VIP Trust — Delaware VIP Capital Reserves Series
We have audited the accompanying statement of net assets of the Delaware VIP Capital Reserves Series (one of the series constituting Delaware VIP Trust) (the "Series") as of December 31, 2006, and the related statement of operations for the year then ended, the statements of changes in net assets for each of the two years in the period then ended, and the financial highlights for each of the five years in the period then ended. These financial statements and financial highlights are the responsibility of the Series' management. Our responsibility is to express an opinion on these financial statements and financial highlights based on our audits.
We conducted our audits in accordance with the standards of the Public Company Accounting Oversight Board (United States). Those standards require that we plan and perform the audit to obtain reasonable assurance about whether the financial statements and financial highlights are free of material misstatement. We were not engaged to perform an audit of the Series' internal control over financial reporting. Our audits included consideration of internal control over financial reporting as a basis for designing audit procedures that are appropriate in the circumstances, but not for the purpose of expressing an opinion on the effectiveness of the Series' internal control over financial reporting. Accordingly, we express no such opinion. An audit also includes examining, on a test basis, evidence supporting the amounts and disclosures in the financial statements and financial highlights, assessing the accounting principles used and significant es timates made by management, and evaluating the overall financial statement presentation. Our procedures included confirmation of securities owned as of December 31, 2006, by correspondence with the custodian and brokers or by other appropriate auditing procedures where replies from brokers were not received. We believe that our audits provide a reasonable basis for our opinion.
In our opinion, the financial statements and financial highlights referred to above present fairly, in all material respects, the financial position of the Delaware VIP Capital Reserves Series of Delaware VIP Trust at December 31, 2006, the results of its operations for the year then ended, the changes in its net assets for each of the two years in the period then ended, and its financial highlights for each of the five years in the period then ended, in conformity with U.S. generally accepted accounting principles.

Philadelphia, Pennsylvania
February 14, 2007
The Series files its complete schedule of portfolio holdings with the Securities and Exchange Commission for the first and third quarters of each fiscal year on Form N-Q. The Series' Forms N-Q, as well as a description of the policies and procedures that the Series uses to determine how to vote proxies (if any) relating to portfolio securities is available without charge (i) upon request, by calling 800-523-1918; (ii) on the Series' website at http://www.delawareinvestments.com; and (iii) on the Commission's website at http://www.sec.gov. The Series' Forms N-Q may be reviewed and copied at the Commission's Public Reference Room in Washington, DC; information on the operation of the Public Reference Room may be obtained by calling 1-800-SEC-0330.
Information (if any) regarding how the Series voted proxies relating to portfolio securities during the most recently disclosed 12-month period ended June 30 is available without charge (i) through the Series' website at http://www.delawareinvestments.com; and (ii) on the Commission's website at http://www.sec.gov.
Capital Reserves Series- 19
Delaware Investments® Family of Funds
board of trustees/directors and officers addendum
A mutual fund is governed by a Board of Trustees/Directors ("Trustees"), which has oversight responsibility for the management of a fund's business affairs. Trustees establish procedures and oversee and review the performance of the investment manager, the distributor, and others who perform services for the fund. The independent fund trustees, in particular, are advocates for shareholder interests. Each trustee has served in that capacity since he or she was elected to or appointed to the Board of Trustees, and will continue to serve until his or her retirement or the election of a new trustee in his or her place. The following is a list of the Trustees and Officers with certain background and related information.
Name,
Address,
and Birth Date | | Position(s)
Held with
Fund(s) | | Length of Time
Served | | Principal
Occupation(s)
During
Past 5 Years | | Number of
Portfolios in Fund
Complex Overseen
by Trustee
or Officer | | Other
Directorships
Held by
Trustee
or Officer | |
| interested trustees | | | | | | | | | | | | | |
|
Patrick P. Coyne1
2005 Market Street
Philadelphia, PA
19103
April 14, 1963 | | Chairman,
President,
Chief Executive
Officer, and
Trustee | | Chairman and Trustee
since August 16, 2006
President and
Chief Executive Officer
since August 1, 2006 | | Patrick P. Coyne has served in
various executive capacities
at different times at
Delaware Investments.2 | | | 84 | | | None | |
|
| independent trustees | | | | | | | | | | | | | |
|
Thomas L. Bennett
2005 Market Street
Philadelphia, PA
19103
October 4, 1947 | | Trustee | | Since
March 2005 | | Private Investor –
(March 2004 – Present)
Investment Manager –
Morgan Stanley & Co.
(January 1984 – March 2004) | | | 84 | | | None | |
|
John A. Fry
2005 Market Street
Philadelphia, PA
19103
May 28, 1960 | | Trustee | | Since
January 2001 | | President –
Franklin & Marshall College
(June 2002 – Present)
Executive Vice President –
University of Pennsylvania
(April 1995 – June 2002) | | | 84 | | | Director –
Community Health
Systems
Director –
Allied Barton
Security Holdings | |
|
Anthony D. Knerr
2005 Market Street
Philadelphia, PA
19103
December 7, 1938 | | Trustee | | Since
April 1990 | | Founder and Managing Director –
Anthony Knerr & Associates
(Strategic Consulting)
(1990 – Present) | | | 84 | | | None | |
|
Lucinda S. Landreth
2005 Market Street
Philadelphia, PA
19103
June 24, 1947 | | Trustee | | Since
March 2005 | | Chief Investment Officer –
Assurant, Inc.
(Insurance)
(2002 – 2004) | | | 84 | | | None | |
|
Ann R. Leven
2005 Market Street
Philadelphia, PA
19103
November 1, 1940 | | Trustee | | Since
September 1989 | | Consultant –
ARL Associates
(Financial Planning)
(1983 – Present) | | | 84 | | | Director and
Audit Committee
Chairperson – Andy
Warhol Foundation
Director and Audit
Committee Member –
Systemax, Inc. | |
|
Capital Reserves Series- 20
Name,
Address,
and Birth Date | | Position(s)
Held with
Fund(s) | | Length of Time
Served | | Principal
Occupation(s)
During
Past 5 Years | | Number of
Portfolios in Fund
Complex Overseen
by Trustee
or Officer | | Other
Directorships
Held by
Trustee
or Officer | |
| independent trustees (continued) | | | | | | | | | | | | | |
|
Thomas F. Madison
2005 Market Street
Philadelphia, PA
19103
February 25, 1936 | | Trustee | | Since
May 1997 | | President and Chief
Executive Officer –
MLM Partners, Inc.
(Small Business Investing
and Consulting)
(January 1993 – Present) | | | 84 | | | Director –
Banner Health
Director –
CenterPoint Energy
Director and Audit
Committee Member –
Digital River, Inc.
Director and Audit
Committee Member –
Rimage
Corporation
Director – Valmont
Industries, Inc. | |
|
Janet L. Yeomans
2005 Market Street
Philadelphia, PA
19103
July 31, 1948 | | Trustee | | Since
April 1999 | | Vice President
(January 2003 – Present)
and Treasurer
(January 2006 – Present)
3M Corporation
Ms. Yeomans has held
various management positions
at 3M Corporation since 1983. | | | 84 | | | None | |
|
J. Richard Zecher
2005 Market Street
Philadelphia, PA
19103
July 3, 1940 | | Trustee | | Since
March 2005 | | Founder –
Investor Analytics
(Risk Management)
(May 1999 – Present)
Founder –
Sutton Asset Management
(Hedge Fund)
(September 1998 – Present) | | | 84 | | | Director and Audit
Committee Member –
Investor Analytics
Director and Audit
Committee Member –
Oxigene, Inc. | |
|
| officers | | | | | | | | | | | | | |
|
David F. Connor
2005 Market Street
Philadelphia, PA
19103
December 2, 1963 | | Vice President,
Deputy General
Counsel, and Secretary | | Vice President since
September 21, 2000
and Secretary
since
October 2005 | | David F. Connor has served as
Vice President and Deputy
General Counsel of
Delaware Investments
since 2000. | | | 84 | | | None3 | |
|
David P. O'Connor
2005 Market Street
Philadelphia, PA
19103
February 21, 1966 | | Senior Vice
President,
General Counsel,
and Chief
Legal Officer | | Senior Vice President,
General Counsel, and
Chief Legal Officer
since
October 2005 | | David P. O'Connor has served in
various executive and legal
capacities at different times at
Delaware Investments. | | | 84 | | | None3 | |
|
John J. O'Connor
2005 Market Street
Philadelphia, PA
19103
June 16, 1957 | | Senior Vice President
and Treasurer | | Treasurer
since
February 2005 | | John J. O'Connor has served in
various executive capacities
at different times at
Delaware Investments. | | | 84 | | | None3 | |
|
Richard Salus
2005 Market Street
Philadelphia, PA
19103
October 4, 1963 | | Senior
Vice President
and
Chief Financial
Officer | | Chief Financial
Officer since
November 1, 2006 | | Richard Salus has served in
various executive capacities
at different times at
Delaware Investments. | | | 84 | | | None3 | |
|
1 Patrick P. Coyne is considered to be an "Interested Trustee" because he is an executive officer of the Fund's(s') investment advisor.
2 Delaware Investments is the marketing name for Delaware Management Holdings, Inc. and its subsidiaries, including the Fund's(s') investment advisor, principal underwriter, and its transfer agent.
3 David F. Connor, David P. O'Connor, John J. O'Connor, and Richard Salus serve in similar capacities for the six portfolios of the Optimum Fund Trust, which have the same investment advisor, principal underwriter, and transfer agent as the registrant. John J. O'Connor also serves in a similar capacity for Lincoln Variable Insurance Products Trust, which has the same investment advisor as the registrant.
The Statement of Additional Information for the Fund(s) includes additional information about the Trustees and Officers and is available, without charge, upon request by calling 800 523-1918.
Capital Reserves Series- 21
Delaware VIP Trust — Delaware VIP Cash Reserve Series
For the 12-month period ended Dec. 31, 2006, the Delaware VIP Cash Reserve Series showed a positive return of 4.49% for Standard Class shares, and Service Class shares gained 4.23% (both with distributions reinvested). By comparison, the U.S. Consumer Price Index, gained 2.54% (source: Lipper).
At its two fourth-quarter meetings, the Federal Open-Market Committee left rates unchanged, so that the June rate hike of 25 basis points to a target rate of 5.25% was the last rate hike of the series of 17 such actions that had begun exactly two years earlier. With the yields of money market funds being highly sensitive to movements in the federal funds rate, the Series' yield was stable from mid-summer 2006 through the end of the year.
The direction of any future movements continues to be dependent on the economy's performance, with attention focused on the balance between economic growth and inflation. In this vein, we believe recent economic releases have been filled with contradictions. Despite weakness in some sectors of the economy, notably the housing market, other indications have been relatively robust. Payroll employment rose unexpectedly in December, and there were upward revisions in the employment numbers for October and November. Gross domestic product (GDP) estimates have been raised as well. On balance, viewed from the final quarter of 2006, the economy appeared relatively healthy.
As the likelihood of further Federal Reserve Bank (Fed) rate hikes subsided over the course of the fourth quarter, and money market rates stabilized, the Series' average maturity was extended to 38 days, reflecting investment in higher yielding paper further out on the yield curve.
The views expressed are current as of the date of this report and are subject to change.
The performance data quoted below and on the next page represent past performance; past performance does not guarantee future results. Investment return and principal value of an investment will fluctuate so that your shares, when redeemed, may be worth more or less than their original cost. Current performance may be lower or higher than the performance data quoted. Please obtain the performance data for the most recent month end by calling the number noted on the page related to this Series in the introductory section of this report.
You should consider the investment objectives, risks, charges, and expenses of the investment carefully before investing. The Delaware VIP Cash Reserve Series prospectus contains this and other important information about the Series. To obtain a prospectus, contact the company noted on the page related to this Series in the introductory section of this report, either by phone or through the company Web site. We advise you to read the prospectus carefully before you invest.
Delaware VIP Cash Reserve Series
Average Annual Total Returns
For the periods ending Dec. 31, 2006 | | 1 Year | | 5 Years | | 10 Years | | Lifetime | |
| Standard Class Shares* | | | +4.49 | % | | | +1.97 | % | | | +3.47 | % | | | +4.30 | % | |
| Service Class Shares** | | | +4.23 | % | | | +1.74 | % | | | NA | | | | +2.47 | % | |
* Commenced operations on July 28, 1988
** Commenced operations on May 1, 2000
Cash Reserve Series- 1
Delaware VIP Trust — Delaware VIP Cash Reserve Series (continued)
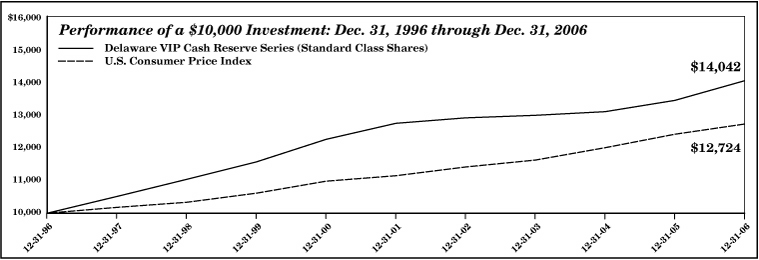
The chart shows a $10,000 investment in the Delaware VIP Cash Reserve Series Standard Class shares for the period Dec. 31, 1996 through Dec. 31, 2006. All distributions were reinvested. The chart also shows $10,000 invested in the U.S. Consumer Price Index for the period from Dec. 31, 1996 through Dec. 31, 2006.
The U.S. Consumer Price Index is calculated by the U.S. Department of Labor and measures the rate of consumer price inflation in the U.S. The index represents the change in the price of goods and services for all urban consumers. An index is unmanaged and does not reflect the costs of operating a mutual fund, such as the costs of buying, selling, and holding securities. You cannot invest directly in an index.
Earnings from a variable annuity or variable life investment compound tax free until withdrawal, so no adjustments were made for income taxes.
An expense limitation was in effect for the Delaware VIP Cash Reserve Series during the periods shown.
Performance of Service Class shares will vary due to different charges and expenses.
Performance does not reflect insurance fees related to a variable annuity or variable life investment or the deferred sales charge that would apply to certain withdrawals of investments held for fewer than eight years. Performance shown here would have been reduced if such fees were included and the expense limitation was removed. For more information about fees, consult your variable annuity or variable life prospectus.
An investment in the Series is not insured or guaranteed by the Federal Deposit Insurance Corporation or any other government agency. Although the Series seeks to preserve the value of an investment at $1.00 per share, it is possible to lose money by investing in the Series.
Investments in variable products involve risk. Some portfolios offer more risk than others. Please read both the contract and underlying prospectus for specific details regarding the product's risk profile.
Cash Reserve Series- 2
Delaware VIP Trust — Delaware VIP Cash Reserve Series
Disclosure of Series Expenses
For the Period July 1, 2006 to December 31, 2006
As a shareholder of the Series, you incur ongoing costs, including management fees; distribution and/or service (12b-1) fees; and other Series expenses. This Example is intended to help you understand your ongoing costs (in dollars) of investing in the Series and to compare these costs with the ongoing costs of investing in other mutual funds.
The Example is based on an investment of $1,000 invested at the beginning of the period and held for the entire period from July 1, 2006 to December 31, 2006.
Actual Expenses
The first section of the table shown, "Actual Series Return," provides information about actual account values and actual expenses. You may use the information in this section of the table, together with the amount you invested, to estimate the expenses that you paid over the period. Simply divide your account value by $1,000 (for example, an $8,600 account value divided by $1,000 = 8.6), then multiply the result by the number in the first section under the heading entitled "Expenses Paid During Period" to estimate the expenses you paid on your account during the period.
Hypothetical Example for Comparison Purposes
The second section of the table shown, "Hypothetical 5% Return," provides information about hypothetical account values and hypothetical expenses based on the Series' actual expense ratio and an assumed rate of return of 5% per year before expenses, which is not the Series' actual return. The hypothetical account values and expenses may not be used to estimate the actual ending account balance or expenses you paid for the period. You may use this information to compare the ongoing costs of investing in the Series and other funds. To do so, compare the 5% hypothetical example with the 5% hypothetical examples that appear in the shareholder reports of other funds.
Please note that the expenses shown in the table are meant to highlight your ongoing costs only. As a shareholder of the Series, you do not incur any transaction costs, such as sales charges (loads), redemption fees or exchange fees, but shareholders of other funds may incur such costs. Also, the fees related to the variable annuity investment or the deferred sales charge that could apply have not been included. Therefore, the second section of the table is useful in comparing ongoing costs only, and will not help you determine the relative total costs of owning different funds. The Series' actual expenses shown in the table reflect fee waivers in effect for Service Class shares. The expenses shown in the table assume reinvestment of all dividends and distributions.
Expense Analysis of an Investment of $1,000
| | | Beginning
Account
Value
7/1/06 | | Ending
Account
Value
12/31/06 | | Annualized
Expense
Ratios | | Expenses
Paid During
Period
7/1/06 to
12/31/06* | |
| Actual Series Return | |
| Standard Class | | $ | 1,000.00 | | | $ | 1,023.90 | | | | 0.66 | % | | $ | 3.37 | | |
| Service Class | | | 1,000.00 | | | | 1,022.70 | | | | 0.91 | % | | | 4.64 | | |
| Hypothetical 5% Return (5% return before expenses) | |
| Standard Class | | $ | 1,000.00 | | | $ | 1,021.88 | | | | 0.66 | % | | $ | 3.36 | | |
| Service Class | | | 1,000.00 | | | | 1,020.62 | | | | 0.91 | % | | | 4.63 | | |
*"Expenses Paid During Period" are equal to the Series' annualized expense ratio, multiplied by the average account value over the period, multiplied by 184/365 (to reflect the one-half year period).
Cash Reserve Series- 3
Delaware VIP Trust — Delaware VIP Cash Reserve Series
Sector Allocation
As of December 31, 2006
Sector designations may be different than the sector designations presented in other Series materials.
| Sector | | Percentage
of Net Assets | |
| Certificate of Deposit | | | 2.38 | % | |
| Commercial Paper | | | 82.01 | % | |
| Colleges & Universities | | | 2.38 | % | |
| Financial Services | | | 48.68 | % | |
| Industrial | | | 3.33 | % | |
| Mortgage Bankers & Brokers | | | 18.35 | % | |
| Pharmaceutical | | | 2.85 | % | |
| Sovereign Agency | | | 4.04 | % | |
| State Agency | | | 2.38 | % | |
| Floating Rate Notes | | | 9.54 | % | |
| Medium Term Note | | | 2.38 | % | |
| Variable Rate Demand Note | | | 3.81 | % | |
| Total Market Value of Securities | | | 100.12 | % | |
| Liabilities Net of Receivables and Other Assets | | | (0.12 | %) | |
| Total Net Assets | | | 100.00 | % | |
Cash Reserve Series-4
Delaware VIP Trust — Delaware VIP Cash Reserve Series
Statement of Net Assets
December 31, 2006
| | | Principal
Amount | | Market
Value | |
| CERTIFICATE OF DEPOSIT–2.38% | |
| Wilmington Trust 5.32% 4/5/07 | | $ | 500,000 | | | $ | 500,013 | | |
Total Certificate of Deposit
(cost $500,013) | | | | | | | 500,013 | | |
| d COMMERCIAL PAPER–82.01% | | | | | | | | | |
| Colleges & Universities–2.38% | |
Leland Stanford Junior University
5.316% 1/16/07 | | | 250,000 | | | | 249,449 | | |
| University of California 5.349% 1/11/07 | | | 250,000 | | | | 249,635 | | |
| | | | | | | | 499,084 | | |
| Financial Services–48.68% | |
n Amstel Funding
5.345% 1/16/07 | | | 457,000 | | | | 455,985 | | |
| 5.347% 4/13/07 | | | 350,000 | | | | 344,833 | | |
n Aquinas Funding
5.314% 1/11/07 | | | 300,000 | | | | 299,562 | | |
| 5.533% 1/29/07 | | | 250,000 | | | | 248,954 | | |
Bank of America
5.295% 3/1/07 | | | 300,000 | | | | 297,429 | | |
| 5.329% 1/24/07 | | | 219,000 | | | | 218,258 | | |
| n Barton Capital 5.37% 1/12/07 | | | 500,000 | | | | 499,183 | | |
| Beta Finance 5.331% 2/20/07 | | | 280,000 | | | | 277,956 | | |
n Corporate Asset Funding
5.312% 1/30/07 | | | 500,000 | | | | 497,877 | | |
CBA Delaware Finance
5.291% 1/16/07 | | | 500,000 | | | | 498,903 | | |
| 5.573% 1/5/07 | | | 250,000 | | | | 249,849 | | |
| CDC Commercial Paper 5.356% 1/4/07 | | | 350,000 | | | | 349,844 | | |
| n Corporate Receivables 5.31% 1/23/07 | | | 250,000 | | | | 249,199 | | |
| Danske 5.287% 1/16/07 | | | 500,000 | | | | 498,908 | | |
n Fountain Square Commercial Funding
5.313% 2/16/07 | | | 300,000 | | | | 297,987 | | |
| 5.363% 1/3/07 | | | 300,000 | | | | 299,912 | | |
| HBOS Treasury Services 5.32% 1/22/07 | | | 500,000 | | | | 498,469 | | |
JPMorgan Chase
5.302% 2/6/07 | | | 168,000 | | | | 167,116 | | |
| 5.308% 3/28/07 | | | 188,000 | | | | 185,674 | | |
| 5.546% 1/5/07 | | | 500,000 | | | | 499,701 | | |
| Metlife Funding 5.303% 1/2/07 | | | 635,000 | | | | 634,908 | | |
| Sanpaolo IMI 5.321% 1/30/07 | | | 500,000 | | | | 497,885 | | |
| n Sheffield Receivables 5.30% 1/22/07 | | | 250,000 | | | | 249,232 | | |
| # Sigma Finance 5.325% 2/13/07 | | | 250,000 | | | | 248,438 | | |
| n Starbird Funding 5.323% 1/17/07 | | | 650,000 | | | | 648,473 | | |
| Surrey Funding 5.324% 1/30/07 | | | 500,000 | | | | 497,889 | | |
| n Three Pillars 5.305% 1/8/07 | | | 500,000 | | | | 499,488 | | |
| | | | | | | | 10,211,912 | | |
| Industrial–3.33% | |
BASF AG
5.293% 2/14/07 | | | 300,000 | | | | 298,079 | | |
| 5.31% 1/2/07 | | | 400,000 | | | | 399,941 | | |
| | | | | | | | 698,020 | | |
| | | Principal
Amount | | Market
Value | |
| COMMERCIAL PAPER (continued) | |
| Mortgage Bankers & Brokers–18.35% | |
| Bear Stearns 5.511% 3/1/07 | | $ | 500,000 | | | $ | 495,624 | | |
| Goldman Sachs 5.324% 2/1/07 | | | 500,000 | | | | 497,722 | | |
| HSBC 5.299% 2/6/07 | | | 500,000 | | | | 497,398 | | |
| ING Funding 5.308% 1/16/07 | | | 750,000 | | | | 748,364 | | |
| Morgan Stanley 5.304% 3/7/07 | | | 600,000 | | | | 594,323 | | |
| Svenska Handelsbanken 5.306% 2/28/07 | | | 500,000 | | | | 495,783 | | |
| Westpac Banking 5.342% 3/7/07 | | | 525,000 | | | | 519,995 | | |
| | | | | | | | 3,849,209 | | |
| Pharmaceutical–2.85% | |
| Abbott Laboratories 5.275% 1/16/07 | | | 600,000 | | | | 598,688 | | |
| | | | | | | | 598,688 | | |
| Sovereign Agency–4.04% | |
Swedish Housing Finance
5.306% 1/29/07 | | | 300,000 | | | | 298,770 | | |
| 5.314% 1/22/07 | | | 250,000 | | | | 249,239 | | |
| 5.364% 2/5/07 | | | 300,000 | | | | 298,454 | | |
| | | | | | | | 846,463 | | |
| State Agency–2.38% | |
| City of Austin, Texas 5.37% 1/9/07 | | | 500,000 | | | | 499,404 | | |
| | | | | | | | 499,404 | | |
Total Discounted Commercial Paper
(cost $17,202,780) | | | | | | | 17,202,780 | | |
| • FLOATING RATE NOTES–9.54% | | | | | | | | | |
| Credit Suisse New York 5.325% 7/26/07 | | | 500,000 | | | | 500,000 | | |
| # DNB NOR Bank 144A 5.34% 1/25/08 | | | 750,000 | | | | 750,000 | | |
| Washington Mutual Bank 5.35% 6/26/07 | | | 750,000 | | | | 750,000 | | |
Total Floating Rate Notes
(cost $2,000,000) | | | | | | | 2,000,000 | | |
| MEDIUM TERM NOTE–2.38% | |
| Sigma Finance 4.83% 1/30/07 | | | 500,000 | | | | 500,000 | | |
Total Medium Term Note
(cost $500,000) | | | | | | | 500,000 | | |
| VARIABLE RATE DEMAND NOTE–3.81% | |
• North Texas Higher Education
Authority Series B 5.35% 12/1/44
(AMBAC) (SPA–Depfa Bank) | | | 800,000 | | | | 800,000 | | |
Total Variable Rate Demand Note
(cost $800,000) | | | | | | | 800,000 | | |
Cash Reserve Series-5
Delaware VIP Cash Reserve Series
Statement of Net Assets (continued)
| TOTAL MARKET VALUE OF SECURITIES–100.12% (cost $21,002,793)v | | $ | 21,002,793 | | |
| LIABILITIES NET OF RECEIVABLES AND OTHER ASSETS–(0.12%) | | | (25,648 | ) | |
| NET ASSETS APPLICABLE TO 20,977,043 SHARES OUTSTANDING–100.00% | | $ | 20,977,145 | | |
| NET ASSET VALUE-DELAWARE VIP CASH RESERVE SERIES STANDARD CLASS ($20,971,272 / 20,971,170 Shares) | | $ | 1.00 | | |
| NET ASSET VALUE-DELAWARE VIP CASH RESERVE SERIES SERVICE CLASS ($5,873 / 5,873 Shares) | | $ | 1.00 | | |
| COMPONENTS OF NET ASSETS AT DECEMBER 31, 2006: | |
| Shares of beneficial interest (unlimited authorization-no par) | | $ | 21,030,441 | | |
| Accumulated net realized loss on investments | | | (53,296 | ) | |
| Total net assets | | $ | 20,977,145 | | |
d The interest rate shown is the effective yield as of the time of purchase.
n Asset-backed Commercial Paper.
v Also the cost for federal income tax purposes.
• Variable rate security. The interest rate shown is the rate as of December 31, 2006.
# Security exempt from registration under Rule 144A of the Securities Act of 1933, as amended. At December 31, 2006, the aggregate amount of Rule 144A securities equaled $998,438, which represented 4.76% of the Series' net assets. See Note 5 in "Notes to Financial Statements."
Summary of Abbreviations:
AMBAC – Insured by the AMBAC Assurance Corporation
SPA – Stand-by Purchase Agreement
See accompanying notes
Cash Reserve Series- 6
Delaware VIP Trust — Delaware VIP Cash Reserve Series
Statement of Operations
Year Ended December 31, 2006
Delaware VIP Trust — Delaware VIP Cash Reserve Series
Statements of Changes in Net Assets
| INVESTMENT INCOME: | |
| Interest | | $ | 1,105,882 | | |
| EXPENSES: | |
| Management fees | | | 98,279 | | |
| Reports and statements to shareholders | | | 13,142 | | |
| Audit and tax | | | 11,471 | | |
| Accounting and administration expenses | | | 8,736 | | |
| Custodian fees | | | 5,203 | | |
| Trustees' fees and benefits | | | 3,860 | | |
| Dividend disbursing and transfer agent fees and expenses | | | 2,184 | | |
| Legal fees | | | 2,025 | | |
| Pricing fees | | | 1,161 | | |
| Consulting fees | | | 601 | | |
| Insurance fees | | | 274 | | |
| Taxes (other than taxes on income) | | | 176 | | |
| Dues and services | | | 95 | | |
| Trustees' expenses | | | 72 | | |
| Registration fees | | | 52 | | |
| Distribution expenses – Service Class | | | 18 | | |
| | | | 147,349 | | |
| Less waiver of distribution expenses – Service Class | | | (3 | ) | |
| Less expense paid indirectly | | | (397 | ) | |
| Total operating expenses | | | 146,949 | | |
| NET INVESTMENT INCOME | | | 958,933 | | |
| NET REALIZED GAIN ON INVESTMENTS | | | 20 | | |
NET INCREASE IN NET ASSETS RESULTING
FROM OPERATIONS | | $ | 958,953 | | |
See accompanying notes
| | | Year Ended | |
| | | 12/31/06 | | 12/31/05 | |
INCREASE IN NET ASSETS FROM
OPERATIONS: | |
| Net investment income | | $ | 958,933 | | | $ | 699,559 | | |
| Net realized gain on investments | | | 20 | | | | 82 | | |
Net increase in net assets resulting
from operations | | | 958,953 | | | | 699,641 | | |
DIVIDENDS AND DISTRIBUTIONS
TO SHAREHOLDERS FROM: | |
| Net investment income: | |
| Standard Class | | | (958,694 | ) | | | (699,425 | ) | |
| Service Class | | | (239 | ) | | | (134 | ) | |
| | | | (958,933 | ) | | | (699,559 | ) | |
CAPITAL SHARE TRANSACTIONS
(at $1.00 per share): | |
| Proceeds from shares sold: | |
| Standard Class | | | 29,007,341 | | | | 7,755,610 | | |
Net asset value of shares issued upon
reinvestment of dividends and distributions: | |
| Standard Class | | | 954,586 | | | | 690,782 | | |
| Service Class | | | 237 | | | | 130 | | |
| | | | 29,962,164 | | | | 8,446,522 | | |
| Cost of shares repurchased: | |
| Standard Class | | | (32,421,044 | ) | | | (14,846,540 | ) | |
Decrease in net assets derived from
capital share transactions | | | (2,458,880 | ) | | | (6,400,018 | ) | |
| NET DECREASE IN NET ASSETS | | | (2,458,860 | ) | | | (6,399,936 | ) | |
| NET ASSETS: | |
| Beginning of year | | | 23,436,005 | | | | 29,835,941 | | |
End of year (there was no undistributed
net investment income at either year end) | | $ | 20,977,145 | | | $ | 23,436,005 | | |
See accompanying notes
Cash Reserve Series-7
Delaware VIP Trust — Delaware VIP Cash Reserve Series
Financial Highlights
Selected data for each share of the Series outstanding throughout each period were as follows:
| | | Delaware VIP Cash Reserve Series Standard Class | |
| | | Year Ended | |
| | | 12/31/06 | | 12/31/05 | | 12/31/041 | | 12/31/03 | | 12/31/022 | |
| Net asset value, beginning of period | | $ | 1.000 | | | $ | 1.000 | | | $ | 1.000 | | | $ | 1.000 | | | $ | 1.000 | | |
| Income from investment operations: | |
| Net investment income | | | 0.044 | | | | 0.027 | | | | 0.009 | | | | 0.006 | | | | 0.013 | | |
| Total from investment operations | | | 0.044 | | | | 0.027 | | | | 0.009 | | | | 0.006 | | | | 0.013 | | |
| Less dividends and distributions from: | |
| Net investment income | | | (0.044 | ) | | | (0.027 | ) | | | (0.009 | ) | | | (0.006 | ) | | | (0.013 | ) | |
| Total dividends and distributions | | | (0.044 | ) | | | (0.027 | ) | | | (0.009 | ) | | | (0.006 | ) | | | (0.013 | ) | |
| Net asset value, end of period | | $ | 1.000 | | | $ | 1.000 | | | $ | 1.000 | | | $ | 1.000 | | | $ | 1.000 | | |
| Total return3 | | | 4.49 | % | | | 2.69 | % | | | 0.87 | % | | | 0.61 | % | | | 1.26 | % | |
| Ratios and supplemental data: | |
| Net assets, end of period (000 omitted) | | $ | 20,971 | | | $ | 23,430 | | | $ | 29,831 | | | $ | 42,748 | | | $ | 49,809 | | |
| Ratio of expenses to average net assets | | | 0.67 | % | | | 0.61 | % | | | 0.55 | % | | | 0.58 | % | | | 0.59 | % | |
| Ratio of net investment income to average net assets | | | 4.39 | % | | | 2.62 | % | | | 0.82 | % | | | 0.60 | % | | | 1.26 | % | |
1On June 10, 2004, DMC voluntarily made a capital contribution of $0.001 per share to the Series in order to eliminate the potential deviation in the Series' net asset value of $1.00 per share caused by accumulated net realized losses. This contribution had no impact on the Series' total return.
| 2Effective December 20, 2002, the Series declared a 10 for 1 share split. Per share data for periods prior to this date have been restated to reflect this share split. | |
| 3Total investment return is based on the change in net asset value of a share during the period and assumes reinvestment of dividends and distributions at net asset value. | |
See accompanying notes
Cash Reserve Series- 8
Delaware VIP Cash Reserve Series
Financial Highlights (continued)
Selected data for each share of the Series outstanding throughout each period were as follows:
| | | Delaware VIP Cash Reserve Series Service Class | |
| | | Year Ended | |
| | | 12/31/06 | | 12/31/05 | | 12/31/041 | | 12/31/03 | | 12/31/022 | |
| Net asset value, beginning of period | | $ | 1.000 | | | $ | 1.000 | | | $ | 1.000 | | | $ | 1.000 | | | $ | 1.000 | | |
| Income from investment operations: | |
| Net investment income | | | 0.041 | | | | 0.024 | | | | 0.006 | | | | 0.004 | | | | 0.011 | | |
| Total from investment operations | | | 0.041 | | | | 0.024 | | | | 0.006 | | | | 0.004 | | | | 0.011 | | |
| Less dividends and distributions from: | |
| Net investment income | | | (0.041 | ) | | | (0.024 | ) | | | (0.006 | ) | | | (0.004 | ) | | | (0.011 | ) | |
| Total dividends and distributions | | | (0.041 | ) | | | (0.024 | ) | | | (0.006 | ) | | | (0.004 | ) | | | (0.011 | ) | |
| Net asset value, end of period | | $ | 1.000 | | | $ | 1.000 | | | $ | 1.000 | | | $ | 1.000 | | | $ | 1.000 | | |
| Total return3 | | | 4.23 | % | | | 2.43 | % | | | 0.60 | % | | | 0.40 | % | | | 1.13 | % | |
| Ratios and supplemental data: | |
| Net assets, end of period (000 omitted) | | $ | 6 | | | $ | 6 | | | $ | 5 | | | $ | 5 | | | $ | 5 | | |
| Ratio of expenses to average net assets | | | 0.92 | % | | | 0.86 | % | | | 0.80 | % | | | 0.80 | % | | | 0.74 | % | |
Ratio of expenses to average net assets prior to expense
limitation and expenses paid indirectly | | | 0.97 | % | | | 0.91 | % | | | 0.85 | % | | | 0.83 | % | | | 0.74 | % | |
| Ratio of net investment income to average net assets | | | 4.14 | % | | | 2.37 | % | | | 0.57 | % | | | 0.38 | % | | | 1.11 | % | |
Ratio of net investment income to average net assets
prior to expense limitation and expenses paid indirectly | | | 4.09 | % | | | 2.32 | % | | | 0.52 | % | | | 0.35 | % | | | 1.11 | % | |
1On June 10, 2004, DMC voluntarily made a capital contribution of $0.001 per share to the Series in order to eliminate the potential deviation in the Series' net asset value of $1.00 per share caused by accumulated net realized losses. This contribution had no impact on the Series' total return.
2Effective December 20, 2002, the Series declared a 10 for 1 share split. Per share data for periods prior to this date have been restated to reflect this share split.
3Total investment return is based on the change in net asset value of a share during the period and assumes reinvestment of dividends and distributions at net asset value. Total investment return reflects a waiver and payment of fees by the distributor, as applicable. Performance would have been lower had the waiver not been in effect.
See accompanying notes
Cash Reserve Series- 9
Delaware VIP Trust — Delaware VIP Cash Reserve Series
Notes to Financial Statements
December 31, 2006
Delaware VIP Trust (the "Trust") is organized as a Delaware statutory trust and offers 15 series: Delaware VIP Balanced Series, Delaware VIP Capital Reserves Series, Delaware VIP Cash Reserve Series, Delaware VIP Diversified Income Series, Delaware VIP Emerging Markets Series, Delaware VIP Global Bond Series, Delaware VIP Growth Opportunities Series, Delaware VIP High Yield Series, Delaware VIP International Value Equity Series, Delaware VIP REIT Series, Delaware VIP Select Growth Series, Delaware VIP Small Cap Value Series, Delaware VIP Trend Series, Delaware VIP U.S. Growth Series and Delaware VIP Value Series. These financial statements and the related notes pertain to Delaware VIP Cash Reserve Series (the "Series"). The Trust is an open-end investment company. The Series is considered diversified under the Investment Company Act of 1940, as amended, and offers Standard Class and Service Class shares. The Standard Class shares do not carr y a 12b-1 fee and the Service Class shares carry a 12b-1 fee. The shares of the Series are sold only to separate accounts of life insurance companies.
The investment objective of the Series is to seek to provide maximum current income, while preserving principal and maintaining liquidity, by investing its assets in a diversified portfolio of money market securities and managing the portfolio to maintain a constant net asset value of $1 per share.
1. Significant Accounting Policies
The following accounting policies are in accordance with U.S. generally accepted accounting principles and are consistently followed by the Series.
Security Valuation—Securities are valued at amortized cost, which approximates market value.
In September 2006, the Financial Accounting Standards Board (FASB) issued FASB Statement No. 157 "Fair Value Measurements" (Statement 157). Statement 157 establishes a framework for measuring fair value in generally accepted accounting principles, clarifies the definition of fair value within that framework, and expands disclosures about the use of fair value measurements. Statement 157 is intended to increase consistency and comparability among fair value estimates used in financial reporting. Statement 157 is effective for fiscal years beginning after November 15, 2007. Management does not expect the adoption of Statement 157 to have an impact on the amounts reported in the financial statements.
Federal Income Taxes—The Series intends to continue to qualify for federal income tax purposes as a regulated investment company and make the requisite distributions to shareholders. Accordingly, no provision for federal income taxes has been made in the financial statements.
On July 13, 2006, FASB released FASB Interpretation No. 48 "Accounting for Uncertainty in Income Taxes" (FIN 48). FIN 48 provides guidance for how uncertain tax positions should be recognized, measured, presented and disclosed in the financial statements. FIN 48 requires the evaluation of tax positions taken or expected to be taken in the course of preparing the Series' tax returns to determine whether the tax positions are "more-likely-than-not" of being sustained by the applicable tax authority. Tax positions not deemed to meet the more-likely-than-not threshold would be recorded as a tax benefit or expense in the current year. Adoption of FIN 48 is required for fiscal years beginning after December 15, 2006 and is to be applied to all open tax years as of the effective date. Recent SEC guidance allows implementing FIN 48 in Series net asset value calculations as late as the Series' last net asset value calculation in the first required fi nancial statement reporting period. As a result, the Series will incorporate FIN 48 in its semiannual report on June 30, 2007. Although the Series' tax positions are currently being evaluated, management does not expect the adoption of FIN 48 to have a material impact on the Series' financial statements.
Class Accounting—Investment income and common expenses are allocated to the classes of the Series on the basis of "settled shares" of each class in relation to the net assets of the Series. Realized and unrealized gain (loss) on investments is allocated to the classes of the Series on the basis of daily net assets of each class. Distribution expenses relating to a specific class are charged directly to that class.
Repurchase Agreements—The Series may invest in a pooled cash account along with other members of the Delaware Investments® Family of Funds pursuant to an exemptive order issued by the Securities and Exchange Commission. The aggregate daily balance of the pooled cash account is invested in repurchase agreements secured by obligations of the U.S. government. The respective collateral is held by the Series' custodian bank until the maturity of the respective repurchase agreements. Each repurchase agreement is at least 102% collateralized. However, in the event of default or bankruptcy by the counterparty to the agreement, realization of the collateral may be subject to legal proceedings.
Use of Estimates—The preparation of financial statements in conformity with U.S. generally accepted accounting principles requires management to make estimates and assumptions that affect the reported amounts of assets and liabilities at the date of the financial statements and the reported amounts of revenues and expenses during the reporting period. Actual results could differ from those estimates.
Other—Expenses directly attributable to the Series are charged directly to the Series. Other expenses common to various funds within the Delaware Investments® Family of Funds are generally allocated amongst such funds on the basis of average net assets. Management fees and some other expenses are paid monthly. Security transactions are recorded on the date the securities are purchased or sold (trade date) for financial reporting purposes. Costs used in calculating realized gains and losses on the sale of investment securities are those of the specific securities sold. Interest income is recorded on the accrual basis. Discounts and premiums are amortized to interest income over the lives of the respective securities.
The Series declares dividends daily from net investment income and pays such dividends monthly and declares and pays distributions from net realized gain on investments, if any, following the close of the fiscal year.
The Series may receive earnings credits from its custodian when positive cash balances are maintained, which are used to offset custody fees. The expense paid under this arrangement is included in custodian fees on the Statement of Operations with the corresponding expense offset shown as "expense paid indirectly."
Cash Reserve Series- 10
Delaware VIP Cash Reserve Series
Notes to Financial Statements (continued)
2. Investment Management, Administration Agreements and Other Transactions with Affiliates
In accordance with the terms of its investment management agreement, the Series pays Delaware Management Company (DMC), a series of Delaware Management Business Trust and the investment manager, an annual fee which is calculated daily at the rate of 0.45% on the first $500 million of average daily net assets of the Series, 0.40% on the next $500 million, 0.35% on the next $1.5 billion, and 0.30% on average daily net assets in excess of $2.5 billion.
DMC has contractually agreed to waive that portion, if any, of its management fee and reimburse the Series to the extent necessary to ensure that annual operating expenses, exclusive of taxes, interest, brokerage commissions, distribution fees, certain insurance costs and extraordinary expenses, do not exceed 0.67% of average daily net assets of the Series through April 30, 2007. Prior to May 1, 2006, the expense limitation was 0.80% of average daily net assets. No reimbursement was due for the year ended December 31, 2006.
Delaware Service Company, Inc. (DSC), an affiliate of DMC, provides accounting, administration, dividend disbursing and transfer agent services. The Series pays DSC a monthly fee computed at the annual rate of 0.04% of the Series' average daily net assets for accounting and administrative services. The Series pays DSC a monthly fee based on average net assets for dividend disbursing and transfer agent services.
Pursuant to a distribution agreement and distribution plan, the Series pays Delaware Distributors, L.P. (DDLP), the distributor and an affiliate of DMC, an annual distribution and service fee not to exceed 0.30% of the average daily net assets of the Service Class shares. DDLP has contracted to waive distribution and service fees through April 30, 2007 in order to prevent distribution and service fees of the Service Class shares from exceeding 0.25% of average daily net assets. Standard Class shares pay no distribution and service expenses.
At December 31, 2006, the Series had liabilities payable to affiliates as follows:
Investment
Management
Fee Payable to
DMC | | Dividend Disbursing,
Transfer Agent, Accounting
and Administration Fees
and Other Expenses
Payable to DSC | | Distribution
Fees Payable
To DDLP | | Other
Expenses
Payable
to DMC
and Affiliates* | |
| $ | 8,136 | | | $ | 1,004 | | | $ | 1 | | | $ | 835 | | |
*DMC, as part of its administrative services, pays operating expenses on behalf of the Series and is reimbursed on a periodic basis. Such expenses include items such as printing of shareholder reports, fees for audit, legal and tax services, custodian fees and trustees' fees.
As provided in the investment management agreement, the Series bears the cost of certain legal and tax services, including internal legal and tax services provided to the Series by DMC and/or its affiliates' employees. For the year ended December 31, 2006, the Series was charged $1,022 for internal legal and tax services provided by DMC and/or its affiliates' employees.
Trustees' fees and benefits include expenses accrued by the Series for each Trustee's retainer, per meeting fees and retirement benefits. Independent Trustees with over five years of uninterrupted service are eligible to participate in a retirement plan that provides for the payment of benefits upon retirement. The amount of the retirement benefit is based on factors set forth in the plan, including the number of years of service. On November 16, 2006, the Board of Trustees unanimously voted to terminate the retirement plan. Payments equal to the net present value of the earned benefits will be made in 2007 to those independent trustees so entitled. The retirement benefit payout for the Series is $2,653. Certain officers of DMC, DSC and DDLP are officers and/or trustees of the Trust. These officers and trustees are paid no compensation by the Series.
3. Dividend and Distribution Information
Income and long-term capital gain distributions are determined in accordance with federal income tax regulations, which may differ from U.S. generally accepted accounting principles. Additionally, net short-term gains on sales of investment securities are treated as ordinary income for federal income tax purposes. The tax character of dividends and distributions paid during the years ended December 31, 2006 and 2005 was as follows:
| | | Year
Ended
12/31/06 | | Year
Ended
12/31/05 | |
| Ordinary income | | $ | 958,933 | | | $ | 699,559 | | |
Cash Reserve Series- 11
Delaware VIP Cash Reserve Series
Notes to Financial Statements (continued)
4. Components of Net Assets on a Tax Basis
As of December 31, 2006, the components of net assets on a tax basis were as follows:
| Shares of beneficial interest | | $ | 21,030,441 | | |
| Capital loss carryforwards | | | (53,296 | ) | |
| Net assets | | $ | 20,977,145 | | |
For federal income tax purposes, capital loss carryforwards may be carried forward and applied against future capital gains. $17 was utilized in 2006. Capital loss carryforwards of $53,296 remaining at December 31, 2006 will expire in 2010.
5. Credit and Market Risk
An investment in the Series is not insured or guaranteed by the Federal Deposit Insurance Corporation or any other government agency. Although the Series seeks to preserve the value of your investment at $1.00 per share, it is possible to lose money by investing in the Series.
The Series may invest up to 10% of its total assets in illiquid securities, which may include securities with contractual restrictions on resale, securities exempt from registration under Rule 144A of the Securities Act of 1933, as amended, and other securities which may not be readily marketable. The relative illiquidity of these securities may impair the Series from disposing of them in a timely manner and at a fair price when it is necessary or desirable to do so. While maintaining oversight, the Series' Board of Trustees has delegated to DMC the day-to-day functions of determining whether individual securities are liquid for purposes of the Series' limitation on investments in illiquid assets. At December 31, 2006, no securities have been determined to be illiquid under the Series' Liquidity Procedures. Rule 144A securities have been identified on the Statement of Net Assets.
6. Contractual Obligations
The Series enters into contracts in the normal course of business that contain a variety of indemnifications. The Series' maximum exposure under these arrangements is unknown. However, the Series has not had prior claims or losses pursuant to these contracts. Management has reviewed the Series' existing contracts and expects the risk of loss to be remote.
7. Tax Information (Unaudited)
For the fiscal year ended December 31, 2006, the Series designates dividends and distributions paid during the year as follows:
(A)
Long-Term
Capital Gain
Distributions
(Tax Basis) | | (B)
Ordinary
Income
Distributions
(Tax Basis) | | Total
Distributions
(Tax Basis) | |
| | – | | | | 100 | % | | | 100 | % | |
(A) and (B) are based on a percentage of the Series' total distributions.
Cash Reserve Series- 12
Delaware VIP Trust — Delaware VIP Cash Reserve Series
Report of Independent Registered Public Accounting Firm
To the Shareholders and Board of Trustees
Delaware VIP Trust — Delaware VIP Cash Reserve Series
We have audited the accompanying statement of net assets of the Delaware VIP Cash Reserve Series (one of the series constituting Delaware VIP Trust) (the "Series") as of December 31, 2006, and the related statement of operations for the year then ended, the statements of changes in net assets for each of the two years in the period then ended, and the financial highlights for each of the five years in the period then ended. These financial statements and financial highlights are the responsibility of the Series' management. Our responsibility is to express an opinion on these financial statements and financial highlights based on our audits.
We conducted our audits in accordance with the standards of the Public Company Accounting Oversight Board (United States). Those standards require that we plan and perform the audit to obtain reasonable assurance about whether the financial statements and financial highlights are free of material misstatement. We were not engaged to perform an audit of the Series' internal control over financial reporting. Our audits included consideration of internal control over financial reporting as a basis for designing audit procedures that are appropriate in the circumstances, but not for the purpose of expressing an opinion on the effectiveness of the Series' internal control over financial reporting. Accordingly, we express no such opinion. An audit also includes examining, on a test basis, evidence supporting the amounts and disclosures in the financial statements and financial highlights, assessing the accounting principles used and significant es timates made by management, and evaluating the overall financial statement presentation. Our procedures included confirmation of securities owned as of December 31, 2006, by correspondence with the custodian. We believe that our audits provide a reasonable basis for our opinion.
In our opinion, the financial statements and financial highlights referred to above present fairly, in all material respects, the financial position of the Delaware VIP Cash Reserve Series of Delaware VIP Trust at December 31, 2006, the results of its operations for the year then ended, the changes in its net assets for each of the two years in the period then ended, and its financial highlights for each of the five years in the period then ended, in conformity with U.S. generally accepted accounting principles.

Philadelphia, Pennsylvania
February 14, 2007
The Series files its complete schedule of portfolio holdings with the Securities and Exchange Commission for the first and third quarters of each fiscal year on Form N-Q. The Series' Forms N-Q, as well as a description of the policies and procedures that the Series uses to determine how to vote proxies (if any) relating to portfolio securities is available without charge (i) upon request, by calling 800-523-1918; (ii) on the Series' website at http://www.delawareinvestments.com; and (iii) on the Commission's website at http://www.sec.gov. The Series' Forms N-Q may be reviewed and copied at the Commission's Public Reference Room in Washington, DC; information on the operation of the Public Reference Room may be obtained by calling 1-800-SEC-0330.
Information (if any) regarding how the Series voted proxies relating to portfolio securities during the most recently disclosed 12-month period ended June 30 is available without charge (i) through the Series' website at http://www.delawareinvestments.com; and (ii) on the Commission's website at http://www.sec.gov.
Cash Reserve Series-13
Delaware Investments® Family of Funds
board of trustees/directors and officers addendum
A mutual fund is governed by a Board of Trustees/Directors ("Trustees"), which has oversight responsibility for the management of a fund's business affairs. Trustees establish procedures and oversee and review the performance of the investment manager, the distributor, and others who perform services for the fund. The independent fund trustees, in particular, are advocates for shareholder interests. Each trustee has served in that capacity since he or she was elected to or appointed to the Board of Trustees, and will continue to serve until his or her retirement or the election of a new trustee in his or her place. The following is a list of the Trustees and Officers with certain background and related information.
Name,
Address,
and Birth Date | | Position(s)
Held with
Fund(s) | | Length of Time
Served | | Principal
Occupation(s)
During
Past 5 Years | | Number of
Portfolios in Fund
Complex Overseen
by Trustee
or Officer | | Other
Directorships
Held by
Trustee
or Officer | |
| interested trustees | | | | | | | | | | | | | |
|
Patrick P. Coyne1
2005 Market Street
Philadelphia, PA
19103
April 14, 1963 | | Chairman,
President,
Chief Executive
Officer, and
Trustee | | Chairman and Trustee
since August 16, 2006
President and
Chief Executive Officer
since August 1, 2006 | | Patrick P. Coyne has served in
various executive capacities
at different times at
Delaware Investments.2 | | | 84 | | | None | |
|
| independent trustees | | | | | | | | | | | | | |
|
Thomas L. Bennett
2005 Market Street
Philadelphia, PA
19103
October 4, 1947 | | Trustee | | Since
March 2005 | | Private Investor –
(March 2004 – Present)
Investment Manager –
Morgan Stanley & Co.
(January 1984 – March 2004) | | | 84 | | | None | |
|
John A. Fry
2005 Market Street
Philadelphia, PA
19103
May 28, 1960 | | Trustee | | Since
January 2001 | | President –
Franklin & Marshall College
(June 2002 – Present)
Executive Vice President –
University of Pennsylvania
(April 1995 – June 2002) | | | 84 | | | Director –
Community Health
Systems
Director –
Allied Barton
Security Holdings | |
|
Anthony D. Knerr
2005 Market Street
Philadelphia, PA
19103
December 7, 1938 | | Trustee | | Since
April 1990 | | Founder and Managing Director –
Anthony Knerr & Associates
(Strategic Consulting)
(1990 – Present) | | | 84 | | | None | |
|
Lucinda S. Landreth
2005 Market Street
Philadelphia, PA
19103
June 24, 1947 | | Trustee | | Since
March 2005 | | Chief Investment Officer –
Assurant, Inc.
(Insurance)
(2002 – 2004) | | | 84 | | | None | |
|
Ann R. Leven
2005 Market Street
Philadelphia, PA
19103
November 1, 1940 | | Trustee | | Since
September 1989 | | Consultant –
ARL Associates
(Financial Planning)
(1983 – Present) | | | 84 | | | Director and
Audit Committee
Chairperson – Andy
Warhol Foundation
Director and Audit
Committee Member –
Systemax, Inc. | |
|
Cash Reserve Series- 14
Name,
Address,
and Birth Date | | Position(s)
Held with
Fund(s) | | Length of Time
Served | | Principal
Occupation(s)
During
Past 5 Years | | Number of
Portfolios in Fund
Complex Overseen
by Trustee
or Officer | | Other
Directorships
Held by
Trustee
or Officer | |
| independent trustees (continued) | | | | | | | | | | | | | |
|
Thomas F. Madison
2005 Market Street
Philadelphia, PA
19103
February 25, 1936 | | Trustee | | Since
May 1997 | | President and Chief
Executive Officer –
MLM Partners, Inc.
(Small Business Investing
and Consulting)
(January 1993 – Present) | | | 84 | | | Director –
Banner Health
Director –
CenterPoint Energy
Director and Audit
Committee Member –
Digital River, Inc.
Director and Audit
Committee Member –
Rimage
Corporation
Director – Valmont
Industries, Inc. | |
|
Janet L. Yeomans
2005 Market Street
Philadelphia, PA
19103
July 31, 1948 | | Trustee | | Since
April 1999 | | Vice President
(January 2003 – Present)
and Treasurer
(January 2006 – Present)
3M Corporation
Ms. Yeomans has held
various management positions
at 3M Corporation since 1983. | | | 84 | | | None | |
|
J. Richard Zecher
2005 Market Street
Philadelphia, PA
19103
July 3, 1940 | | Trustee | | Since
March 2005 | | Founder –
Investor Analytics
(Risk Management)
(May 1999 – Present)
Founder –
Sutton Asset Management
(Hedge Fund)
(September 1998 – Present) | | | 84 | | | Director and Audit
Committee Member –
Investor Analytics
Director and Audit
Committee Member –
Oxigene, Inc. | |
|
| officers | | | | | | | | | | | | | |
|
David F. Connor
2005 Market Street
Philadelphia, PA
19103
December 2, 1963 | | Vice President,
Deputy General
Counsel, and Secretary | | Vice President since
September 21, 2000
and Secretary
since
October 2005 | | David F. Connor has served as
Vice President and Deputy
General Counsel of
Delaware Investments
since 2000. | | | 84 | | | None3 | |
|
David P. O'Connor
2005 Market Street
Philadelphia, PA
19103
February 21, 1966 | | Senior Vice
President,
General Counsel,
and Chief
Legal Officer | | Senior Vice President,
General Counsel, and
Chief Legal Officer
since
October 2005 | | David P. O'Connor has served in
various executive and legal
capacities at different times at
Delaware Investments. | | | 84 | | | None3 | |
|
John J. O'Connor
2005 Market Street
Philadelphia, PA
19103
June 16, 1957 | | Senior Vice President
and Treasurer | | Treasurer
since
February 2005 | | John J. O'Connor has served in
various executive capacities
at different times at
Delaware Investments. | | | 84 | | | None3 | |
|
Richard Salus
2005 Market Street
Philadelphia, PA
19103
October 4, 1963 | | Senior
Vice President
and
Chief Financial
Officer | | Chief Financial
Officer since
November 1, 2006 | | Richard Salus has served in
various executive capacities
at different times at
Delaware Investments. | | | 84 | | | None3 | |
|
1 Patrick P. Coyne is considered to be an "Interested Trustee" because he is an executive officer of the Fund's(s') investment advisor.
2 Delaware Investments is the marketing name for Delaware Management Holdings, Inc. and its subsidiaries, including the Fund's(s') investment advisor, principal underwriter, and its transfer agent.
3 David F. Connor, David P. O'Connor, John J. O'Connor, and Richard Salus serve in similar capacities for the six portfolios of the Optimum Fund Trust, which have the same investment advisor, principal underwriter, and transfer agent as the registrant. John J. O'Connor also serves in a similar capacity for Lincoln Variable Insurance Products Trust, which has the same investment advisor as the registrant.
The Statement of Additional Information for the Fund(s) includes additional information about the Trustees and Officers and is available, without charge, upon request by calling 800 523-1918.
Cash Reserve Series- 15
Delaware VIP Trust — Delaware VIP Diversified Income Series
For the 12-month period ended Dec. 31, 2006, Delaware VIP Diversified Income Series returned +7.92% for Standard Class shares and +7.57% for Service Class shares (both figures reflect all distributions reinvested). During the same period, the Series' benchmark, the Lehman Brothers Aggregate Bond Index, underperformed compared to the Series with a return of 4.33% (source: Lipper).
The Series allocates its investments between the U.S. investment grade sector, the U.S. high yield sector, established market foreign bonds, and emerging markets.
In both the Series and the market in general, performance among investment grade bonds was generally not as strong as that of fixed income assets rated lower in credit quality. Our benchmark for the high yield portion of the market, the Bear Stearns High Yield Index, gained 11.64% for the year ended December 31, 2006, which was higher than the Series' performance benchmark.
When considering investment grade corporate bonds, we favored companies that we regard as having strong financial health, often selecting their higher yielding but subordinated debt securities. We generally avoided investments affected by leveraged buyouts, management buyouts, leveraged recapitalizations, and mergers, all of which generally tend to be unfriendly to bondholders.
Because the high yield and emerging market areas posted strong performance in recent quarters, we shifted focus somewhat to higher-quality domestic bonds and the established international markets late in the year.
The views expressed are current as of the date of this report and are subject to change.
The performance data quoted below and on the next page represent past performance; past performance does not guarantee future results. Investment return and principal value of an investment will fluctuate so that your shares, when redeemed, may be worth more or less than their original cost. Current performance may be lower or higher than the performance data quoted. Please obtain the performance data for the most recent month end by calling the number noted on the page related to this Series in the introductory section of this report.
You should consider the investment objectives, risks, charges, and expenses of the investment carefully before investing. The Delaware VIP Diversified Income Series prospectus contains this and other important information about the Series. To obtain a prospectus, contact the company noted on the page related to this Series in the introductory section of this report, either by phone or through the company Web site. We advise you to read the prospectus carefully before you invest.
Delaware VIP Diversified Income Series
Average Annual Total Returns
For the periods ending Dec. 31, 2006 | | 1 Year | | Lifetime | |
| Standard Class Shares* | | | +7.92 | % | | | +5.77 | % | |
| Service Class Shares* | | | +7.57 | % | | | +5.46 | % | |
* Commenced operations on May 16, 2003.
Diversified Income Series- 1
Delaware VIP Trust — Delaware VIP Diversified Income Series (continued)
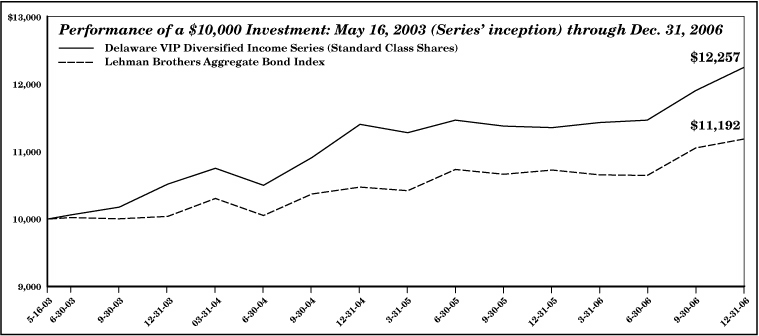
The chart shows a $10,000 investment in the Delaware VIP Diversified Income Series Standard Class shares for the period from the Series inception May 16, 2003 through Dec. 31, 2006. All distributions were reinvested. The chart also shows $10,000 invested in the Lehman Brothers Aggregate Bond Index for the period from May 31, 2003 through Dec. 31, 2006.
Lehman Brothers Aggregate Bond Index measures the performance of a large group of high quality, fixed income securities across the government, corporate, mortgage-backed, asset-backed, and commercial mortgage-backed markets. An index is unmanaged and does not reflect the costs of operating a mutual fund, such as the costs of buying, selling, and holding securities. You cannot invest directly in an index.
Earnings from a variable annuity or variable life investment compound tax free until withdrawal, so no adjustments were made for income taxes.
An expense limitation was in effect for the Delaware VIP Diversified Income Series during the periods shown.
Performance of Service Class shares will vary due to different charges and expenses.
Performance does not reflect insurance fees related to a variable annuity or variable life investment or the deferred sales charge that would apply to certain withdrawals of investments held for fewer than eight years. Performance shown here would have been reduced if such fees were included and the expense limitation was removed. For more information about fees, consult your variable annuity or variable life prospectus.
Investments in variable products involve risk. High yielding, noninvestment grade bonds involve higher risk than investment grade bonds. Adverse conditions may affect the issuer's ability to pay interest and principal on these securities. International and emerging market investments are subject to risks not ordinarily associated with domestic investments, such as currency, economic and political risks, and different accounting standards. Some portfolios offer more risk than others. Please read both the contract and underlying prospectus for specific details regarding the product's risk profile.
Diversified Income Series- 2
Delaware VIP Trust — Delaware VIP Diversified Income Series
Disclosure of Series Expenses
For the Period July 1, 2006 to December 31, 2006
As a shareholder of the Series, you incur ongoing costs, including management fees; distribution and/or service (12b-1) fees; and other Series expenses. This Example is intended to help you understand your ongoing costs (in dollars) of investing in the Series and to compare these costs with the ongoing costs of investing in other mutual funds.
The Example is based on an investment of $1,000 invested at the beginning of the period and held for the entire period from July 1, 2006 to December 31, 2006.
Actual Expenses
The first section of the table shown, "Actual Series Return," provides information about actual account values and actual expenses. You may use the information in this section of the table, together with the amount you invested, to estimate the expenses that you paid over the period. Simply divide your account value by $1,000 (for example, an $8,600 account value divided by $1,000 = 8.6), then multiply the result by the number in the first section under the heading entitled "Expenses Paid During Period" to estimate the expenses you paid on your account during the period.
Hypothetical Example for Comparison Purposes
The second section of the table shown, "Hypothetical 5% Return," provides information about hypothetical account values and hypothetical expenses based on the Series' actual expense ratio and an assumed rate of return of 5% per year before expenses, which is not the Series' actual return. The hypothetical account values and expenses may not be used to estimate the actual ending account balance or expenses you paid for the period. You may use this information to compare the ongoing costs of investing in the Series and other funds. To do so, compare the 5% hypothetical example with the 5% hypothetical examples that appear in the shareholder reports of other funds.
Please note that the expenses shown in the table are meant to highlight your ongoing costs only. As a shareholder of the Series, you do not incur any transaction costs, such as sales charges (loads), redemption fees or exchange fees, but shareholders of other funds may incur such costs. Also, the fees related to the variable annuity investment or the deferred sales charge that could apply have not been included. Therefore, the second section of the table is useful in comparing ongoing costs only, and will not help you determine the relative total costs of owning different funds. The Series' actual expenses shown in the table reflect fee waivers in effect for Service Class shares. The expenses shown in the table assume reinvestment of all dividends and distributions.
Expense Analysis of an Investment of $1,000
| | | Beginning
Account
Value
7/1/06 | | Ending
Account
Value
12/31/06 | | Annualized
Expense
Ratios | | Expenses
Paid During
Period
7/1/06 to
12/31/06* | |
| Actual Series Return | |
| Standard Class | | $ | 1,000.00 | | | $ | 1,068.50 | | | | 0.81 | % | | $ | 4.22 | | |
| Service Class | | | 1,000.00 | | | | 1,066.40 | | | | 1.06 | % | | | 5.52 | | |
| Hypothetical 5% Return (5% return before expenses) | |
| Standard Class | | $ | 1,000.00 | | | $ | 1,021.12 | | | | 0.81 | % | | $ | 4.13 | | |
| Service Class | | | 1,000.00 | | | | 1,019.86 | | | | 1.06 | % | | | 5.40 | | |
*"Expenses Paid During Period" are equal to the Series' annualized expense ratio, multiplied by the average account value over the period, multiplied by 184/365 (to reflect the one-half year period).
Diversified Income Series- 3
Delaware VIP Trust — Delaware VIP Diversified Income Series
Sector Allocation and Credit Rating Breakdown
As of December 31, 2006
Sector designations may be different than the sector designations presented in other Series materials.
| Sector | | Percentage
of Net Assets | |
| Agency Asset-Backed Securities | | | 0.04 | % | |
| Agency Collateralized Mortgage Obligations | | | 0.68 | % | |
| Agency Mortgage-Backed Securities | | | 8.28 | % | |
| Agency Obligations | | | 2.71 | % | |
| Commercial Mortgage-Backed Securities | | | 1.63 | % | |
| Convertible Bonds | | | 0.22 | % | |
| Corporate Bonds | | | 42.44 | % | |
| Banking | | | 4.26 | % | |
| Basic Industry | | | 4.08 | % | |
| Brokerage | | | 0.82 | % | |
| Capital Goods | | | 2.04 | % | |
| Communications | | | 6.30 | % | |
| Consumer Cyclical | | | 7.20 | % | |
| Consumer Non-Cyclical | | | 3.07 | % | |
| Electric | | | 2.00 | % | |
| Energy | | | 2.21 | % | |
| Finance Companies | | | 3.52 | % | |
| Industrial | | | 0.52 | % | |
| Insurance | | | 2.00 | % | |
| Natural Gas | | | 0.99 | % | |
| Real Estate | | | 0.72 | % | |
| Technology | | | 1.22 | % | |
| Transportation | | | 1.49 | % | |
| Foreign Agencies | | | 1.69 | % | |
| Austria | | | 0.34 | % | |
| Germany | | | 1.06 | % | |
| Mexico | | | 0.15 | % | |
| Ukraine | | | 0.14 | % | |
| Municipal Bonds | | | 0.11 | % | |
| Non-Agency Asset-Backed Securities | | | 1.52 | % | |
| Non-Agency Collateralized Mortgage Obligations | | | 5.08 | % | |
| Regional Agencies | | | 3.23 | % | |
| Australia | | | 3.23 | % | |
| Regional Authority | | | 0.24 | % | |
| Canada | | | 0.24 | % | |
| Senior Secured Loans | | | 2.24 | % | |
| Sovereign Agencies | | | 0.75 | % | |
| France | | | 0.06 | % | |
| Japan | | | 0.52 | % | |
| Norway | | | 0.17 | % | |
| Sovereign Debt | | | 14.04 | % | |
| Argentina | | | 0.21 | % | |
| Austria | | | 0.67 | % | |
| Brazil | | | 1.56 | % | |
| Colombia | | | 0.81 | % | |
| Dominican Republic | | | 0.13 | % | |
| El Salvador | | | 0.09 | % | |
| France | | | 0.75 | % | |
| Germany | | | 1.22 | % | |
| Indonesia | | | 0.15 | % | |
| Japan | | | 2.62 | % | |
| Malaysia | | | 0.27 | % | |
| Mexico | | | 0.62 | % | |
| Norway | | | 1.18 | % | |
| Panama | | | 0.10 | % | |
| Sector | | Percentage
of Net Assets | |
| Philippines | | | 0.39 | % | |
| Poland | | | 0.50 | % | |
| Republic of Korea | | | 0.23 | % | |
| Sweden | | | 0.40 | % | |
| Turkey | | | 0.24 | % | |
| United Kingdom | | | 1.07 | % | |
| Uruguay | | | 0.21 | % | |
| Venezuela | | | 0.62 | % | |
| Supranational Banks | | | 1.36 | % | |
| U.S. Treasury Obligations | | | 5.90 | % | |
| Common Stock | | | 0.05 | % | |
| Preferred Stock | | | 0.00 | % | |
| Warrants | | | 0.12 | % | |
| Repurchase Agreements | | | 12.29 | % | |
| Total Market Value of Securities | | | 104.62 | % | |
| Liabilities Net of Receivables and Other Assets | | | (4.62 | %) | |
| Total Net Assets | | | 100.00 | % | |
Credit Rating Breakdown
(as a % of fixed income investments) | |
| AAA | | | 45.77 | % | |
| AA | | | 5.43 | % | |
| A | | | 5.55 | % | |
| BBB | | | 9.27 | % | |
| BB | | | 12.52 | % | |
| B | | | 16.37 | % | |
| CCC | | | 4.11 | % | |
| D | | | 0.04 | % | |
| Not Rated | | | 0.94 | % | |
| Total | | | 100.00 | % | |
Diversified Income Series-4
Delaware VIP Trust — Delaware VIP Diversified Income Series
Statement of Net Assets
December 31, 2006
| | | Principal
Amountm | | Market
Value
(U.S. $) | |
AGENCY ASSET-BACKED
SECURITIES–0.04% | |
• Fannie Mae Whole Loan
Series 2002-W11 AV1
5.69% 11/25/32 | | USD | 21,807 | | | $ | 21,803 | | |
t FHLMC Structured Pass Through
Securities
Series T-30 A5 8.61% 12/25/30 | | | 182,297 | | | | 181,869 | | |
Total Agency Asset-Backed
Securities (cost $203,648) | | | | | | | 203,672 | | |
AGENCY COLLATERALIZED
MORTGAGE OBLIGATIONS–0.68% | |
Fannie Mae
Series 1996-46 ZA 7.50% 11/25/26 | | | 6,780 | | | | 7,003 | | |
| Series 2002-90 A1 6.50% 6/25/42 | | | 20,945 | | | | 21,383 | | |
| Series 2002-90 A2 6.50% 11/25/42 | | | 85,879 | | | | 87,471 | | |
| Series 2003-122 AJ 4.50% 2/25/28 | | | 101,010 | | | | 98,505 | | |
| Series 2005-110 MB 5.50% 9/25/35 | | | 730,000 | | | | 731,825 | | |
Fannie Mae Grantor Trust
Series 1999-T2 A1 7.50% 1/19/39 | | | 1,900 | | | | 1,985 | | |
| Series 2001-T8 A2 9.50% 7/25/41 | | | 17,166 | | | | 18,486 | | |
| Series 2002-T4 A3 7.50% 12/25/41 | | | 38,826 | | | | 40,343 | | |
| Series 2004-T1 1A2 6.50% 1/25/44 | | | 39,651 | | | | 40,544 | | |
Fannie Mae Whole Loan
Series 2002-W6 2A1 7.00% 6/25/42 | | | 67,845 | | | | 69,897 | | |
| Series 2004-W9 2A1 6.50% 2/25/44 | | | 11,350 | | | | 11,614 | | |
| Series 2004-W11 1A2 6.50% 5/25/44 | | | 125,827 | | | | 128,788 | | |
t FHLMC Structured Pass Through
Securities
Series T-54 2A 6.50% 2/25/43 | | | 36,894 | | | | 37,603 | | |
| Series T-58 2A 6.50% 9/25/43 | | | 15,144 | | | | 15,462 | | |
Freddie Mac
Series 1730 Z 7.00% 5/15/24 | | | 165,956 | | | | 172,981 | | |
| Series 2326 ZQ 6.50% 6/15/31 | | | 257,512 | | | | 266,602 | | |
| Series 2480 EH 6.00% 11/15/31 | | | 163 | | | | 163 | | |
| Series 2552 KB 4.25% 6/15/27 | | | 120,593 | | | | 119,499 | | |
| Series 2662 MA 4.50% 10/15/31 | | | 264,804 | | | | 259,353 | | |
| Series 2872 GC 5.00% 11/15/29 | | | 220,000 | | | | 215,250 | | |
| Series 2890 PC 5.00% 7/15/30 | | | 105,000 | | | | 102,657 | | |
| Series 2915 KP 5.00% 11/15/29 | | | 265,000 | | | | 259,321 | | |
| Series 3022 MB 5.00% 12/15/28 | | | 165,000 | | | | 162,583 | | |
| Series 3063 PC 5.00% 2/15/29 | | | 540,000 | | | | 531,642 | | |
Total Agency Collateralized Mortgage
Obligations (cost $3,426,381) | | | | | | | 3,400,960 | | |
AGENCY MORTGAGE-BACKED
SECURITIES–8.28% | |
Fannie Mae
5.50% 1/1/13 | | | 226,180 | | | | 226,160 | | |
| 6.171% 5/1/09 | | | 25,402 | | | | 25,573 | | |
| 6.50% 8/1/17 | | | 68,826 | | | | 70,056 | | |
| | | Principal
Amountm | | Market
Value
(U.S. $) | |
AGENCY MORTGAGE-BACKED
SECURITIES (continued) | |
• Fannie Mae ARM
5.068% 8/1/35 | | USD | 568,388 | | | $ | 557,438 | | |
| 5.256% 10/1/33 | | | 328,746 | | | | 334,661 | | |
Fannie Mae Relocation 15 yr
4.00% 9/1/20 | | | 546,942 | | | | 513,686 | | |
Fannie Mae Relocation 30 yr
5.00% 11/1/33 | | | 10,610 | | | | 10,338 | | |
| 5.00% 8/1/34 | | | 65,504 | | | | 63,782 | | |
| 5.00% 11/1/34 | | | 95,866 | | | | 93,346 | | |
| 5.00% 4/1/35 | | | 267,679 | | | | 260,389 | | |
| 5.00% 10/1/35 | | | 448,064 | | | | 435,862 | | |
| 5.00% 1/1/36 | | | 602,765 | | | | 586,350 | | |
Fannie Mae S.F. 15 yr TBA
5.00% 1/1/22 | | | 350,000 | | | | 344,094 | | |
| 5.50% 1/1/22 | | | 3,915,000 | | | | 3,915,000 | | |
| 6.00% 1/1/22 | | | 4,420,000 | | | | 4,482,154 | | |
Fannie Mae S.F. 30 yr
5.50% 3/1/29 | | | 3,583 | | | | 3,560 | | |
| 5.50% 4/1/29 | | | 3,575 | | | | 3,552 | | |
| 7.50% 3/1/32 | | | 1,520 | | | | 1,580 | | |
| 7.50% 4/1/32 | | | 5,326 | | | | 5,536 | | |
Fannie Mae S.F. 30 yr TBA
5.00% 1/1/37 | | | 7,020,000 | | | | 6,778,687 | | |
| 5.50% 1/1/37 | | | 12,535,000 | | | | 12,390,069 | | |
| 6.00% 1/25/37 | | | 6,000,000 | | | | 6,041,250 | | |
| 6.50% 1/1/37 | | | 3,020,000 | | | | 3,077,567 | | |
| Freddie Mac 7.00% 1/1/08 | | | 35,074 | | | | 35,140 | | |
• Freddie Mac ARM
3.019% 12/1/33 | | | 528,790 | | | | 535,449 | | |
| 4.673% 4/1/34 | | | 10,647 | | | | 10,794 | | |
Freddie Mac Relocation 30 yr
5.00% 9/1/33 | | | 19,306 | | | | 18,845 | | |
Freddie Mac S.F. 30 yr TBA
6.00% 1/1/37 | | | 800,000 | | | | 806,000 | | |
Total Agency Mortgage-Backed
Securities (cost $41,862,379) | | | | | | | 41,626,918 | | |
| AGENCY OBLIGATIONS–2.71% | |
Fannie Mae
3.00% 8/15/07 | | | 40,000 | | | | 39,462 | | |
| 5.00% 9/15/08 | | | 1,100,000 | | | | 1,099,220 | | |
| 6.375% 8/15/07 | | AUD | 965,000 | | | | 760,831 | | |
Federal Farm Credit Bank
5.125% 8/25/16 | | USD | 615,000 | | | | 623,387 | | |
Federal Home Loan Bank
5.375% 8/19/11 | | | 1,920,000 | | | | 1,954,827 | | |
Diversified Income Series- 5
Delaware VIP Diversified Income Series
Statement of Net Assets (continued)
| | | Principal
Amountm | | Market
Value
(U.S. $) | |
| AGENCY OBLIGATIONS (continued) | |
^ Financing Corporation Interest Strip
CPN 4.79% 4/6/12 | | USD | 645,000 | | | $ | 501,068 | | |
| CPN 4.797% 5/2/12 | | | 125,000 | | | | 96,989 | | |
| CPN 4.901% 10/6/12 | | | 545,000 | | | | 411,316 | | |
| CPN 4.938% 10/6/13 | | | 109,000 | | | | 78,269 | | |
| CPN 4.948% 10/6/14 | | | 650,000 | | | | 442,948 | | |
| CPN 5.093% 4/6/14 | | | 135,000 | | | | 94,402 | | |
| CPN 5.101% 10/6/11 | | | 120,000 | | | | 96,197 | | |
| CPN 5.175% 3/26/12 | | | 200,000 | | | | 155,431 | | |
| CPN 5.213% 10/6/15 | | | 200,000 | | | | 129,328 | | |
| CPN 1 5.162% 5/11/12 | | | 330,000 | | | | 255,948 | | |
| CPN 1 5.283% 5/11/15 | | | 400,000 | | | | 264,266 | | |
| CPN 1 5.407% 11/11/17 | | | 700,000 | | | | 403,006 | | |
| CPN 4 5.213% 10/6/15 | | | 200,000 | | | | 129,328 | | |
| CPN 12 5.10% 12/6/11 | | | 638,000 | | | | 509,263 | | |
| CPN 13 5.161% 12/27/12 | | | 100,000 | | | | 74,610 | | |
| CPN 13 5.208% 6/27/13 | | | 400,000 | | | | 291,138 | | |
| CPN 13 5.366% 12/27/16 | | | 366,000 | | | | 221,629 | | |
| CPN 15 4.903% 9/7/13 | | | 860,000 | | | | 620,358 | | |
| CPN 15 5.252% 3/7/16 | | | 674,000 | | | | 425,955 | | |
| CPN A 5.098% 8/8/15 | | | 150,000 | | | | 97,916 | | |
| CPN A 5.099% 2/8/15 | | | 150,000 | | | | 100,453 | | |
| CPN D 5.112% 9/26/11 | | | 550,000 | | | | 440,630 | | |
| CPN D 5.119% 9/26/10 | | | 600,000 | | | | 500,182 | | |
Freddie Mac
4.625% 12/19/08 | | | 525,000 | | | | 521,369 | | |
| 5.50% 7/18/16 | | | 2,200,000 | | | | 2,286,500 | | |
Total Agency Obligations
(cost $13,375,896) | | | | | | | 13,626,226 | | |
COMMERCIAL MORTGAGE-BACKED
SECURITIES–1.63% | |
Bank of America Commercial Mortgage
Securities | |
| • Series 2006-3 A4 5.889% 7/10/44 | | | 1,410,000 | | | | 1,465,723 | | |
| Series 2006-4 A4 5.634% 7/10/46 | | | 315,000 | | | | 321,552 | | |
# Bear Stearns Commercial Mortgage
Securities
Series 2004-ESA E 144A 5.064% 5/14/16 | | | 300,000 | | | | 298,836 | | |
t Commercial Mortgage Pass Through
Certificates | | | | | | | | | |
# Series 2001-J1A A2 144A
6.457% 2/14/34 | | | 185,380 | | | | 191,865 | | |
| Series 2006-C7 A2 5.69% 6/10/46 | | | 210,000 | | | | 213,607 | | |
• Credit Suisse Mortgage Capital
Certificates
Series 2006-C1 AAB 5.556% 2/15/39 | | | 115,000 | | | | 116,469 | | |
# Crown Castle Towers 144A
Series 2005-1A C 5.074% 6/15/35 | | | 90,000 | | | | 88,833 | | |
| Series 2006-1A B 5.362% 11/15/36 | | | 830,000 | | | | 828,954 | | |
# First Union National Bank Commercial
Mortgage Trust
Series 2001-C2 L 144A 6.46% 1/12/43 | | | 200,000 | | | | 202,196 | | |
| | | Principal
Amountm | | Market
Value
(U.S. $) | |
COMMERCIAL MORTGAGE-BACKED
SECURITIES (continued) | |
GE Capital Commercial Mortgage Trust
Series 2002-1A A3 6.269% 12/10/35 | | USD | 365,000 | | | $ | 381,345 | | |
# Tower 144A
Series 2004-2A A 4.232% 12/15/14 | | | 65,000 | | | | 63,268 | | |
| Series 2006-1 B 5.588% 2/15/36 | | | 120,000 | | | | 120,673 | | |
| Series 2006-1 C 5.707% 2/15/36 | | | 185,000 | | | | 186,171 | | |
GS Mortgage Securities II
Series 2006-GG8 A4 5.56% 11/10/39 | | | 440,000 | | | | 446,903 | | |
•# Series 2006-RR2 A1 144A
5.689% 6/23/46 | | | 345,000 | | | | 348,573 | | |
•# Series 2006-RR3 A1S 144A
5.659% 7/18/56 | | | 635,000 | | | | 644,944 | | |
JPMorgan Chase Commercial Mortgage
Securities | |
| Series 2002-C1 A3 5.376% 7/12/37 | | | 290,000 | | | | 291,761 | | |
| Series 2002-C2 A2 5.05% 12/12/34 | | | 280,000 | | | | 276,752 | | |
| Series 2003-C1 A2 4.985% 1/12/37 | | | 20,000 | | | | 19,700 | | |
| • Series 2006-LDP7 AJ 5.876% 4/15/45 | | | 1,000,000 | | | | 1,040,316 | | |
•# Series 2006-RR1A A1 144A
5.456% 10/18/52 | | | 305,000 | | | | 307,193 | | |
LB-UBS Commercial Mortgage Trust
Series 2002-C1 A4 6.462% 3/15/31 | | | 110,000 | | | | 115,859 | | |
# Morgan Stanley Capital
I Series 1999-FNV1 G 144A
6.12% 3/15/31 | | | 110,000 | | | | 111,098 | | |
•# Morgan Stanley Dean Witter Capital
I Series 2001-TOP1 E 144A
7.313% 2/15/33 | | | 100,000 | | | | 105,991 | | |
Total Commercial Mortgage-Backed
Securities (cost $8,099,080) | | | | | | | 8,188,582 | | |
| CONVERTIBLE BONDS–0.22% | |
Ford Motor 4.25% 12/15/36 exercise
price $9.20, expiration date 12/15/36 | | | 1,035,000 | | | | 1,111,331 | | |
Total Convertible Bonds
(cost $1,060,182) | | | | | | | 1,111,331 | | |
| CORPORATE BONDS–42.44% | |
| Banking–4.26% | |
| BAC Capital Trust XI 6.625% 5/23/36 | | | 105,000 | | | | 113,696 | | |
| Banco BMG 8.75% 7/1/10 | | | 690,000 | | | | 703,800 | | |
| •# Banco Macro 144A 9.75% 12/18/36 | | | 560,000 | | | | 574,000 | | |
| •# Banco Mercantil 144A 6.862% 10/13/21 | | | 415,000 | | | | 421,545 | | |
| # Bank of Moscow 144A 7.335% 5/13/13 | | | 365,000 | | | | 383,684 | | |
Barclays Bank
10.00% 1/6/10 | | BRL | 5,980,000 | | | | 2,633,830 | | |
| •# 144A 7.375% 6/29/49 | | USD | 330,000 | | | | 356,766 | | |
Citigroup
0.80% 10/30/08 | | JPY | 99,900,000 | | | | 838,510 | | |
| 6.125% 8/25/36 | | USD | 100,000 | | | | 104,493 | | |
Credit Suisse First Boston USA
6.125% 11/15/11 | | | 115,000 | | | | 119,202 | | |
Diversified Income Series-6
Delaware VIP Diversified Income Series
Statement of Net Assets (continued)
| | | Principal
Amountm | | Market
Value
(U.S. $) | |
| CORPORATE BONDS (continued) | |
| Banking (continued) | |
| Depfa Bank 20.00% 11/19/07 | | TRY | 3,554,000 | | | $ | 2,503,994 | | |
First Union Institutional Capital II
7.85% 1/1/27 | | USD | 950,000 | | | | 988,459 | | |
| Fortis Capital 6.25% 6/29/49 | | EUR | 500,000 | | | | 686,828 | | |
| •# Glitnir Banki 144A 6.693% 6/15/16 | | USD | 570,000 | | | | 589,013 | | |
| •# HBOS 144A 5.92% 9/29/49 | | | 300,000 | | | | 294,781 | | |
Kazkommerts International
8.00% 11/3/15 | | | 288,000 | | | | 298,541 | | |
# Majapahit Holding 144A
7.75% 10/17/16 | | | 210,000 | | | | 223,388 | | |
• MUFG Capital Finance 1 6.346%
7/29/49 | | | 360,000 | | | | 366,010 | | |
•# PNC Preferred Funding Trust I
144A 6.517% 12/31/49 | | | 400,000 | | | | 407,398 | | |
Popular North America
4.25% 4/1/08 | | | 335,000 | | | | 330,155 | | |
| • 5.77% 4/6/09 | | | 290,000 | | | | 290,979 | | |
Popular North America Capital Trust I
6.564% 9/15/34 | | | 260,000 | | | | 260,099 | | |
•# Rabobank Capital Funding II 144A
5.26% 12/29/49 | | | 235,000 | | | | 230,148 | | |
| • RBS Capital Trust I 4.709% 12/29/49 | | | 180,000 | | | | 171,344 | | |
• Resona Bank
4.125% 9/29/49 | | EUR | 450,000 | | | | 574,321 | | |
| # 144A 5.85% 9/29/49 | | USD | 605,000 | | | | 591,798 | | |
•# Resona Preferred Global Securities
144A 7.191% 12/29/49 | | | 1,020,000 | | | | 1,065,984 | | |
# Russian Standard Bank 144A
8.625% 5/5/11 | | | 265,000 | | | | 266,246 | | |
| •# Shinsei Finance 144A 6.418% 1/29/49 | | | 475,000 | | | | 475,280 | | |
Sovereign Capital Trust VI 7.908%
6/13/36 | | | 510,000 | | | | 574,620 | | |
# TuranAlem Finance 144A
7.75% 4/25/13 | | | 600,000 | | | | 612,750 | | |
Vneshtorgbank
4.25% 2/15/16 | | EUR | 570,000 | | | | 739,008 | | |
| •# 144A 5.97% 8/1/08 | | USD | 260,000 | | | | 260,455 | | |
• Wachovia Capital Trust III
5.80% 3/15/42 | | | 555,000 | | | | 560,097 | | |
WM Covered Bond Program
3.875% 9/27/11 | | EUR | 1,400,000 | | | | 1,825,811 | | |
| | | | | | | | 21,437,033 | | |
| Basic Industry–4.08% | |
Abitibi-Consolidated Finance
7.875% 8/1/09 | | USD | 240,000 | | | | 235,200 | | |
| AK Steel 7.875% 2/15/09 | | | 450,000 | | | | 452,250 | | |
Alrosa Finance
8.875% 11/17/14 | | | 222,000 | | | | 257,299 | | |
| @# 144A 8.875% 11/17/14 | | | 594,000 | | | | 689,783 | | |
| Barrick Gold Finance 7.50% 5/1/07 | | | 60,000 | | | | 60,413 | | |
Bowater
9.00% 8/1/09 | | | 705,000 | | | | 742,013 | | |
| 9.50% 10/15/12 | | | 650,000 | | | | 676,000 | | |
| | | Principal
Amountm | | Market
Value
(U.S. $) | |
| CORPORATE BONDS (continued) | |
| Basic Industry (continued) | |
Donohue Forest Products
7.625% 5/15/07 | | USD | 275,000 | | | $ | 275,688 | | |
| EvrazSecurities 10.875% 8/3/09 | | | 500,000 | | | | 549,975 | | |
Georgia-Pacific
8.875% 5/15/31 | | | 355,000 | | | | 377,188 | | |
| 9.50% 12/1/11 | | | 750,000 | | | | 825,000 | | |
| # 144A 7.00% 1/15/15 | | | 575,000 | | | | 576,438 | | |
| Ispat Inland 9.75% 4/1/14 | | | 65,000 | | | | 72,734 | | |
| Lubrizol 4.625% 10/1/09 | | | 725,000 | | | | 711,635 | | |
Lyondell Chemical
8.00% 9/15/14 | | | 500,000 | | | | 521,250 | | |
| 8.25% 9/15/16 | | | 500,000 | | | | 527,500 | | |
| 10.50% 6/1/13 | | | 50,000 | | | | 55,250 | | |
# Momentive Performance Materials
144A 9.75% 12/1/14 | | | 775,000 | | | | 778,875 | | |
| # Nell AF Sarl 144A 8.375% 8/15/15 | | | 525,000 | | | | 542,063 | | |
| NewPage 10.00% 5/1/12 | | | 600,000 | | | | 636,000 | | |
| Norske Skog Canada 8.625% 6/15/11 | | | 1,050,000 | | | | 1,068,374 | | |
# Norske Skogindustrier 144A 7.125%
10/15/33 | | | 600,000 | | | | 568,144 | | |
# Port Townsend Paper 144A
11.00% 4/15/11 | | | 685,000 | | | | 606,225 | | |
| Potlatch 13.00% 12/1/09 | | | 675,000 | | | | 781,697 | | |
# Sappi Papier 144A
6.75% 6/15/12 | | | 415,000 | | | | 414,362 | | |
| 7.50% 6/15/32 | | | 1,175,000 | | | | 1,100,612 | | |
| ‡ Solutia 6.72% 10/15/37 | | | 615,000 | | | | 601,931 | | |
| Southern Copper 7.50% 7/27/35 | | | 125,000 | | | | 136,161 | | |
| # Stora Enso Oyj 144A 7.25% 4/15/36 | | | 345,000 | | | | 362,741 | | |
| Tembec Industries 8.625% 6/30/09 | | | 2,975,000 | | | | 2,052,749 | | |
Vale Overseas
6.25% 1/23/17 | | | 990,000 | | | | 999,451 | | |
| 6.875% 11/21/36 | | | 1,295,000 | | | | 1,334,686 | | |
| Weyerhaeuser 7.125% 7/15/23 | | | 525,000 | | | | 526,121 | | |
| Witco 6.875% 2/1/26 | | | 425,000 | | | | 374,000 | | |
| | | | | | | | 20,489,808 | | |
| Brokerage–0.82% | |
| • Ameriprise Financial 7.518% 6/1/66 | | | 440,000 | | | | 484,021 | | |
| Amvescap 4.50% 12/15/09 | | | 150,000 | | | | 146,334 | | |
| E Trade Financial 8.00% 6/15/11 | | | 700,000 | | | | 735,000 | | |
| Goldman Sachs Group 6.345% 2/15/34 | | | 320,000 | | | | 324,971 | | |
LaBranche
9.50% 5/15/09 | | | 560,000 | | | | 590,800 | | |
| 11.00% 5/15/12 | | | 950,000 | | | | 1,028,374 | | |
| Merrill Lynch | |
| • 2.86% 3/12/07 | | | 95,000 | | | | 94,676 | | |
| 6.05% 5/16/16 | | | 325,000 | | | | 336,989 | | |
| 6.22% 9/15/26 | | | 180,000 | | | | 186,014 | | |
| Morgan Stanley 6.25% 8/9/26 | | | 185,000 | | | | 194,005 | | |
| | | | | | | | 4,121,184 | | |
| Capital Goods–2.04% | |
# Aleris Intlernational 144A 10.00%
12/15/16 | | | 750,000 | | | | 755,625 | | |
Diversified Income Series- 7
Delaware VIP Diversified Income Series
Statement of Net Assets (continued)
| | | Principal
Amountm | | Market
Value
(U.S. $) | |
| CORPORATE BONDS (continued) | |
| Capital Goods (continued) | |
| Armor Holdings 8.25% 8/15/13 | | USD | 525,000 | | | $ | 548,625 | | |
| # Berry Plastics 144A 8.875% 9/15/14 | | | 550,000 | | | | 561,000 | | |
| Building Materials 8.00% 10/15/07 | | | 475,000 | | | | 483,930 | | |
| Casella Waste Systems 9.75% 2/1/13 | | | 1,125,000 | | | | 1,184,062 | | |
| Caterpillar 6.05% 8/15/36 | | | 245,000 | | | | 253,067 | | |
| CPG International 10.50% 7/1/13 | | | 325,000 | | | | 332,719 | | |
| # Esco 144A 8.625% 12/15/13 | | | 350,000 | | | | 361,375 | | |
| General Electric 5.00% 2/1/13 | | | 365,000 | | | | 361,416 | | |
| Geo Sub 11.00% 5/15/12 | | | 625,000 | | | | 606,250 | | |
| Graham Packaging 9.875% 10/15/14 | | | 975,000 | | | | 989,625 | | |
| Interface 10.375% 2/1/10 | | | 725,000 | | | | 804,750 | | |
| Intertape Polymer 8.50% 8/1/14 | | | 485,000 | | | | 440,138 | | |
| o NTK Holdings 10.75% 3/1/14 | | | 575,000 | | | | 405,375 | | |
# Penhall International 144A
12.00% 8/1/14 | | | 350,000 | | | | 379,750 | | |
| # Rental Service 144A 9.50% 12/1/14 | | | 800,000 | | | | 830,000 | | |
| # Siemens Finance 144A 6.125% 8/17/26 | | | 310,000 | | | | 317,655 | | |
| WCA Waste 9.25% 6/15/14 | | | 600,000 | | | | 630,000 | | |
| | | | | | | | 10,245,362 | | |
| Communications–6.30% | |
n Adelphia Communications
8.125% 4/1/07 | | | 280,000 | | | | 258,300 | | |
| America Movil 6.375% 3/1/35 | | | 370,000 | | | | 362,838 | | |
| American Tower 7.125% 10/15/12 | | | 660,000 | | | | 681,450 | | |
| American Towers 7.25% 12/1/11 | | | 175,000 | | | | 182,000 | | |
AT&T
7.30% 11/15/11 | | | 325,000 | | | | 352,231 | | |
| 8.00% 11/15/31 | | | 380,000 | | | | 472,884 | | |
| Bellsouth 4.20% 9/15/09 | | | 250,000 | | | | 243,187 | | |
British Telecommunications
9.125% 12/15/30 | | | 295,000 | | | | 404,690 | | |
# Broadview Networks 144A
11.375% 9/1/12 | | | 450,000 | | | | 471,375 | | |
| CCH I Holdings 13.50% 1/15/14 | | | 725,000 | | | | 715,938 | | |
n Century Communications
9.50% 4/1/07 | | | 2,500,000 | | | | 3,037,499 | | |
Charter Communication Holdings
13.50% 1/15/11 | | | 1,275,000 | | | | 1,268,624 | | |
| Cincinnati Bell 8.375% 1/15/14 | | | 325,000 | | | | 335,563 | | |
# CMP Susquehanna 144A
9.875% 5/15/14 | | | 375,000 | | | | 375,000 | | |
| Comcast | |
| • 5.674% 7/14/09 | | | 375,000 | | | | 376,099 | | |
| 6.45% 3/15/37 | | | 240,000 | | | | 240,926 | | |
| 6.50% 11/15/35 | | | 365,000 | | | | 368,777 | | |
| Cox Communications 4.625% 1/15/10 | | | 150,000 | | | | 146,927 | | |
# Cricket Communications 144A
9.375% 11/1/14 | | | 550,000 | | | | 583,000 | | |
| Dex Media East 12.125% 11/15/12 | | | 350,000 | | | | 386,313 | | |
| # Digicel Limited 144A 9.25% 9/1/12 | | | 1,195,000 | | | | 1,281,637 | | |
| GTE California 7.65% 3/15/07 | | | 470,000 | | | | 471,690 | | |
Hughes Network Systems/Finance
9.50% 4/15/14 | | | 2,025,000 | | | | 2,123,718 | | |
| | | Principal
Amountm | | Market
Value
(U.S. $) | |
| CORPORATE BONDS (continued) | |
| Communications (continued) | |
| o Inmarsat Finance 10.375% 11/15/12 | | USD | 1,150,000 | | | $ | 1,065,187 | | |
| Insight Communications 12.25% 2/15/11 | | | 315,000 | | | | 330,750 | | |
| Insight Midwest 9.75% 10/1/09 | | | 160,000 | | | | 163,001 | | |
| • IWO Holdings 9.124% 1/15/12 | | | 40,000 | | | | 41,000 | | |
| Level 3 Communications 11.50% 3/1/10 | | | 600,000 | | | | 639,000 | | |
| # Level 3 Financing 144A 9.25% 11/1/14 | | | 300,000 | | | | 307,500 | | |
| Mediacom Broadband 8.50% 10/15/15 | | | 25,000 | | | | 25,438 | | |
| Mediacom Capital 9.50% 1/15/13 | | | 1,650,000 | | | | 1,707,749 | | |
| # MetroPCS Wireless 144A 9.25% 11/1/14 | | | 275,000 | | | | 288,750 | | |
| # Net Servicos 144A 9.25% 11/27/49 | | | 370,000 | | | | 378,325 | | |
# Pakistan Mobile Communications
144A 8.625% 11/13/13 | | | 730,000 | | | | 767,413 | | |
| # Quebecor World 144A 9.75% 1/15/15 | | | 400,000 | | | | 404,500 | | |
Qwest
7.50% 10/1/14 | | | 750,000 | | | | 798,750 | | |
| • 8.61% 6/15/13 | | | 125,000 | | | | 135,938 | | |
Rural Cellular
9.875% 2/1/10 | | | 820,000 | | | | 876,375 | | |
| • 11.121% 11/1/12 | | | 230,000 | | | | 240,925 | | |
Sprint Capital
6.875% 11/15/28 | | | 175,000 | | | | 175,669 | | |
| 7.625% 1/30/11 | | | 370,000 | | | | 396,506 | | |
| 8.75% 3/15/32 | | | 195,000 | | | | 235,368 | | |
Telecom Italia Capital
4.00% 1/15/10 | | | 670,000 | | | | 640,225 | | |
| • 5.984% 7/18/11 | | | 445,000 | | | | 444,863 | | |
| 7.20% 7/18/36 | | | 575,000 | | | | 602,595 | | |
| Telefonica Emisones | |
| • 5.665% 6/19/09 | | | 265,000 | | | | 265,504 | | |
| 5.984% 6/20/11 | | | 365,000 | | | | 371,905 | | |
| 6.421% 6/20/16 | | | 310,000 | | | | 320,367 | | |
| 7.045% 6/20/36 | | | 110,000 | | | | 117,213 | | |
| Telefonos de Mexico 4.50% 11/19/08 | | | 395,000 | | | | 389,850 | | |
| THOMSON 5.75% 2/1/08 | | | 100,000 | | | | 100,325 | | |
Time Warner Entertainment
8.375% 3/15/23 | | | 210,000 | | | | 246,943 | | |
Triton PCS
8.50% 6/1/13 | | | 710,000 | | | | 683,375 | | |
| 9.375% 2/1/11 | | | 1,075,000 | | | | 1,015,875 | | |
| # True Move 144A 10.75% 12/16/13 | | | 740,000 | | | | 725,200 | | |
| • US LEC 13.87% 10/1/09 | | | 150,000 | | | | 159,750 | | |
| Vertis 10.875% 6/15/09 | | | 810,000 | | | | 818,100 | | |
| Vimpel Communication 8.25% 5/23/16 | | | 622,000 | | | | 653,878 | | |
| | | | | | | | 31,674,778 | | |
| Consumer Cyclical–7.20% | |
| Accuride 8.50% 2/1/15 | | | 250,000 | | | | 241,875 | | |
| Boyd Gaming 8.75% 4/15/12 | | | 675,000 | | | | 708,750 | | |
| Brickman Group 11.75% 12/15/09 | | | 305,000 | | | | 325,588 | | |
| Carrols 9.00% 1/15/13 | | | 425,000 | | | | 436,688 | | |
| Centex 6.50% 5/1/16 | | | 650,000 | | | | 666,123 | | |
Corrections Corporation of America
7.50% 5/1/11 | | | 525,000 | | | | 543,375 | | |
| • DaimlerChrysler 5.82% 8/3/09 | | | 940,000 | | | | 942,195 | | |
Diversified Income Series- 8
Delaware VIP Diversified Income Series
Statement of Net Assets (continued)
| | | Principal
Amountm | | Market
Value
(U.S. $) | |
| CORPORATE BONDS (continued) | |
| Consumer Cyclical (continued) | |
| Denny's 10.00% 10/1/12 | | USD | 525,000 | | | $ | 556,500 | | |
Ford Motor
7.45% 7/16/31 | | | 725,000 | | | | 572,750 | | |
| 7.70% 5/15/97 | | | 230,000 | | | | 168,475 | | |
| Ford Motor Credit | |
| 5.75% 1/12/09 | | EUR | 971,000 | | | | 1,284,656 | | |
| 7.375% 10/28/09 | | USD | 485,000 | | | | 486,338 | | |
| 8.00% 12/15/16 | | | 565,000 | | | | 559,248 | | |
| • 8.11% 1/13/12 | | | 665,000 | | | | 659,770 | | |
| 9.875% 8/10/11 | | | 1,730,000 | | | | 1,851,986 | | |
| # 144A 9.75% 9/15/10 | | | 380,000 | | | | 404,561 | | |
# Galaxy Entertainment Finance 144A
9.875% 12/15/12 | | | 1,816,000 | | | | 1,954,469 | | |
| Gaylord Entertainment 8.00% 11/15/13 | | | 525,000 | | | | 547,313 | | |
| General Motors 8.375% 7/15/33 | | | 1,700,000 | | | | 1,580,999 | | |
General Motors Acceptance Corporation
5.375% 6/6/11 | | EUR | 610,000 | | | | 814,002 | | |
| 6.125% 3/15/07 | | EUR | 460,000 | | | | 608,892 | | |
| 6.875% 9/15/11 | | USD | 2,060,000 | | | | 2,115,040 | | |
| 8.00% 11/1/31 | | | 735,000 | | | | 846,280 | | |
General Motors Acceptance International
Finance 4.125% 2/6/07 | | EUR | 825,000 | | | | 1,088,677 | | |
Harrah's Operating
5.625% 6/1/15 | | USD | 215,000 | | | | 184,690 | | |
| 6.50% 6/1/16 | | | 1,505,000 | | | | 1,349,783 | | |
| Home Depot 5.875% 12/16/36 | | | 625,000 | | | | 615,461 | | |
| Landry's Restaurant 7.50% 12/15/14 | | | 425,000 | | | | 417,563 | | |
| Lodgenet Entertainment 9.50% 6/15/13 | | | 905,000 | | | | 979,663 | | |
| Majestic Star Casino 9.50% 10/15/10 | | | 550,000 | | | | 580,250 | | |
Mandalay Resorts
9.375% 2/15/10 | | | 750,000 | | | | 806,250 | | |
| 9.50% 8/1/08 | | | 700,000 | | | | 738,500 | | |
| MGM Mirage 7.625% 1/15/17 | | | 475,000 | | | | 478,563 | | |
# Micheals Stores 144A
11.375% 11/1/16 | | | 475,000 | | | | 497,563 | | |
Neiman Marcus
9.00% 10/15/15 | | | 445,000 | | | | 487,831 | | |
| 10.375% 10/15/15 | | | 970,000 | | | | 1,083,975 | | |
| NPC International 9.50% 5/1/14 | | | 525,000 | | | | 540,750 | | |
| O'Charleys 9.00% 11/1/13 | | | 425,000 | | | | 448,375 | | |
Penney (J.C.)
7.375% 8/15/08 | | | 215,000 | | | | 220,253 | | |
| 7.625% 3/1/97 | | | 65,000 | | | | 66,560 | | |
| 8.125% 4/1/27 | | | 270,000 | | | | 277,770 | | |
| Playtex Products 9.375% 6/1/11 | | | 630,000 | | | | 659,925 | | |
# Pokagon Gaming Authority 144A
10.375% 6/15/14 | | | 775,000 | | | | 852,500 | | |
| Procter & Gamble 2.00% 6/21/10 | | JPY | 94,000,000 | | | | 812,362 | | |
Time Warner
5.50% 11/15/11 | | USD | 325,000 | | | | 324,510 | | |
| 5.875% 11/15/16 | | | 215,000 | | | | 214,854 | | |
| 6.50% 11/15/36 | | | 220,000 | | | | 219,689 | | |
| | | Principal
Amountm | | Market
Value
(U.S. $) | |
| CORPORATE BONDS (continued) | |
| Consumer Cyclical (continued) | |
o Town Sports International
11.00% 2/1/14 | | USD | 400,000 | | | $ | 350,500 | | |
| True Temper Sports 8.375% 9/15/11 | | | 250,000 | | | | 218,750 | | |
| Viacom | |
| • 5.711% 6/16/09 | | | 275,000 | | | | 275,652 | | |
| 5.75% 4/30/11 | | | 300,000 | | | | 300,437 | | |
| Visteon 8.25% 8/1/10 | | | 665,000 | | | | 651,700 | | |
Wheeling Island Gaming
10.125% 12/15/09 | | | 950,000 | | | | 972,563 | | |
| WMG Acquisition 7.375% 4/15/14 | | | 625,000 | | | | 621,875 | | |
| | | | | | | | 36,213,667 | | |
| Consumer Non-Cyclical–3.07% | |
| AmerisourceBergen 5.875% 9/15/15 | | | 470,000 | | | | 461,905 | | |
| Boston Scientific 6.40% 6/15/16 | | | 530,000 | | | | 537,281 | | |
| Constellation Brands 8.125% 1/15/12 | | | 675,000 | | | | 705,375 | | |
| Cott Beverages 8.00% 12/15/11 | | | 625,000 | | | | 640,625 | | |
| CRC Health 10.75% 2/1/16 | | | 715,000 | | | | 772,200 | | |
| # Elan Finance 144A 8.875% 12/1/13 | | | 650,000 | | | | 653,250 | | |
| Gold Kist 10.25% 3/15/14 | | | 450,000 | | | | 518,585 | | |
HCA
6.50% 2/15/16 | | | 1,415,000 | | | | 1,199,212 | | |
| # 144A 9.125% 11/15/14 | | | 170,000 | | | | 182,113 | | |
| # 144A 9.25% 11/15/16 | | | 250,000 | | | | 268,438 | | |
| # Healthsouth 144A 10.75% 6/15/16 | | | 1,440,000 | | | | 1,556,999 | | |
| Ingles Markets 8.875% 12/1/11 | | | 750,000 | | | | 785,625 | | |
| Kraft Foods 6.50% 11/1/31 | | | 105,000 | | | | 113,506 | | |
| Medco Health Solutions 7.25% 8/15/13 | | | 480,000 | | | | 515,900 | | |
| # Miller Brewing 144A 4.25% 8/15/08 | | | 175,000 | | | | 171,968 | | |
| National Beef Packing 10.50% 8/1/11 | | | 850,000 | | | | 901,000 | | |
| Pilgrim's Pride 9.625% 9/15/11 | | | 320,000 | | | | 336,000 | | |
| Pinnacle Foods 8.25% 12/1/13 | | | 575,000 | | | | 591,531 | | |
| Reynolds American 6.50% 6/1/07 | | | 625,000 | | | | 628,964 | | |
| Swift 12.50% 1/1/10 | | | 425,000 | | | | 436,688 | | |
US Oncology
9.00% 8/15/12 | | | 125,000 | | | | 132,500 | | |
| 10.75% 8/15/14 | | | 750,000 | | | | 832,500 | | |
| UST 6.625% 7/15/12 | | | 85,000 | | | | 89,695 | | |
| o Vanguard Health 11.25% 10/1/15 | | | 1,375,000 | | | | 1,065,625 | | |
| Warner Chilcott 8.75% 2/1/15 | | | 550,000 | | | | 566,500 | | |
| # Wimar Opco 144A 9.625% 12/15/14 | | | 350,000 | | | | 348,250 | | |
| Wyeth 5.50% 2/1/14 | | | 410,000 | | | | 412,702 | | |
| | | | | | | | 15,424,937 | | |
| Electric–2.00% | |
# Abu Dhabi National Energy 144A
5.875% 10/27/16 | | | 330,000 | | | | 332,954 | | |
| 6.50% 10/27/36 | | | 1,555,000 | | | | 1,609,235 | | |
| Avista 9.75% 6/1/08 | | | 415,000 | | | | 437,157 | | |
| # Calpine 144A 8.496% 7/15/07 | | | 180,838 | | | | 199,825 | | |
Dominion Resources
5.687% 5/15/08 | | | 445,000 | | | | 445,789 | | |
| • 6.30% 9/30/66 | | | 380,000 | | | | 382,127 | | |
| Duke Capital 5.668% 8/15/14 | | | 360,000 | | | | 359,575 | | |
| Elwood Energy 8.159% 7/5/26 | | | 854,100 | | | | 896,609 | | |
| FPL Group Capital 5.625% 9/1/11 | | | 295,000 | | | | 298,535 | | |
Diversified Income Series- 9
Delaware VIP Diversified Income Series
Statement of Net Assets (continued)
| | | Principal
Amountm | | Market
Value
(U.S. $) | |
| CORPORATE BONDS (continued) | |
| Electric (continued) | |
| Hydro Quebec 10.50% 10/15/21 | | CAD | 293,000 | | | $ | 408,366 | | |
Midwest Generation
8.30% 7/2/09 | | USD | 490,918 | | | | 505,032 | | |
| 8.75% 5/1/34 | | | 850,000 | | | | 926,500 | | |
Mirant Americas Generation
8.30% 5/1/11 | | | 725,000 | | | | 746,750 | | |
| Mirant North America 7.375% 12/31/13 | | | 375,000 | | | | 382,500 | | |
| Oncor Electric Delivery 7.00% 9/1/22 | | | 450,000 | | | | 485,219 | | |
| Orion Power 12.00% 5/1/10 | | | 575,000 | | | | 655,500 | | |
Pepco Holdings
5.50% 8/15/07 | | | 470,000 | | | | 469,693 | | |
| • 5.994% 6/1/10 | | | 265,000 | | | | 265,598 | | |
# Power Contract Financing 144A
6.256% 2/1/10 | | | 166,281 | | | | 167,239 | | |
# Tenaska Alabama Partners 144A
7.00% 6/30/21 | | | 96,921 | | | | 96,742 | | |
| Xcel Energy 6.50% 7/1/36 | | | 10,000 | | | | 10,601 | | |
| | | | | | | | 10,081,546 | | |
| Energy–2.21% | |
| Anadarko Petroleum 5.95% 9/15/16 | | | 190,000 | | | | 190,745 | | |
| Bluewater Finance 10.25% 2/15/12 | | | 480,000 | | | | 505,200 | | |
# Canadian Oil Sands 144A
4.80% 8/10/09 | | | 115,000 | | | | 112,891 | | |
| Chesapeake Energy 6.625% 1/15/16 | | | 160,000 | | | | 159,800 | | |
# Complete Production Services 144A
8.00% 12/15/16 | | | 450,000 | | | | 463,500 | | |
Compton Petroleum Finance
7.625% 12/1/13 | | | 775,000 | | | | 751,750 | | |
Gazprom
4.56% 12/9/12 | | EUR | 1,050,000 | | | | 1,369,056 | | |
| # 144A 6.212% 11/22/16 | | USD | 370,000 | | | | 373,515 | | |
# Hilcorp Energy I 144A
7.75% 11/1/15 | | | 150,000 | | | | 148,125 | | |
| 9.00% 6/1/16 | | | 750,000 | | | | 796,875 | | |
| 10.50% 9/1/10 | | | 525,000 | | | | 564,375 | | |
| Mariner Energy 7.50% 4/15/13 | | | 400,000 | | | | 390,000 | | |
| Nexen 5.875% 3/10/35 | | | 95,000 | | | | 89,222 | | |
| # OPTI Canada 144A 8.25% 12/15/14 | | | 400,000 | | | | 413,000 | | |
# Pan American Energy 144A
7.75% 2/9/12 | | | 445,000 | | | | 460,575 | | |
| Petrohawk Energy 9.125% 7/15/13 | | | 925,000 | | | | 975,875 | | |
# Ras Laffan Liquefied Natural
Gas III 144A | | | | | | | | | |
| 5.832% 9/30/16 | | | 425,000 | | | | 427,034 | | |
| 5.838% 9/30/27 | | | 500,000 | | | | 481,723 | | |
# Regency Energy Partners 144A
8.375% 12/15/13 | | | 950,000 | | | | 957,125 | | |
| • Secunda International 13.374% 9/1/12 | | | 390,000 | | | | 404,138 | | |
| # TNK-BP Finance 144A 7.50% 7/18/16 | | | 700,000 | | | | 746,375 | | |
Weatherford International
4.95% 10/15/13 | | | 72,000 | | | | 69,066 | | |
| Whiting Petroleum 7.25% 5/1/13 | | | 275,000 | | | | 277,063 | | |
| | | | | | | | 11,127,028 | | |
| | | Principal
Amountm | | Market
Value
(U.S. $) | |
| CORPORATE BONDS (continued) | |
| Finance Companies–3.52% | |
| • American Express 6.80% 9/1/66 | | USD | 210,000 | | | $ | 224,330 | | |
American General Finance
4.875% 7/15/12 | | | 830,000 | | | | 810,742 | | |
# Buffalo Thunder Development Authority
44A 9.375% 12/15/14 | | | 875,000 | | | | 892,500 | | |
| •# C10 Capital 144A 6.722% 12/31/49 | | | 310,000 | | | | 309,058 | | |
| # CFG Investment 144A 9.25% 12/19/13 | | | 465,000 | | | | 466,163 | | |
| FTI Consulting 7.625% 6/15/13 | | | 800,000 | | | | 830,000 | | |
| GE Capital UK Funding 4.625% 1/18/16 | | GBP | 320,000 | | | | 592,297 | | |
| General Electric Capital 5.125% 1/28/14 | | SEK | 6,500,000 | | | | 1,001,185 | | |
•# Hellas Telecommunication II 144A
11.115% 1/15/15 | | USD | 650,000 | | | | 655,688 | | |
| # Hexion Finance 144A 9.75% 11/15/14 | | | 600,000 | | | | 611,250 | | |
| HSBC Finance 4.625% 9/15/10 | | | 615,000 | | | | 602,145 | | |
| # Idearc 144A 8.00% 11/15/16 | | | 520,000 | | | | 530,400 | | |
International Lease Finance
4.625% 6/2/08 | | | 130,000 | | | | 128,523 | | |
JP Morgan Chase Capital
XVIII 6.95% 8/17/36 | | | 330,000 | | | | 358,123 | | |
| XX 6.55% 9/29/36 | | | 85,000 | | | | 88,063 | | |
• Lehman Brothers UK Capital
Funding II 3.875% 2/28/49 | | EUR | 450,000 | | | | 576,265 | | |
| • Nelnet 7.40% 9/29/36 | | USD | 215,000 | | | | 221,617 | | |
^t# Peru Enhanced Pass Through
Finance 144A
3.936% 5/31/18 | | | 930,000 | | | | 620,775 | | |
| 5.831% 5/31/25 | | | 1,115,000 | | | | 415,338 | | |
Red Arrow International Leasing
8.375% 3/31/12 | | RUB | 62,961,878 | | | | 2,467,005 | | |
| Residential Capital | |
| • 5.85% 6/9/08 | | USD | 390,000 | | | | 389,339 | | |
| 6.00% 2/22/11 | | | 330,000 | | | | 329,673 | | |
| 6.125% 11/21/08 | | | 615,000 | | | | 618,318 | | |
| 6.375% 6/30/10 | | | 285,000 | | | | 288,540 | | |
| 6.375% 5/17/13 | | GBP | 312,000 | | | | 612,086 | | |
| 6.50% 4/17/13 | | USD | 1,205,000 | | | | 1,222,750 | | |
| 6.875% 6/30/15 | | | 835,000 | | | | 867,021 | | |
| •# 144A 7.204% 4/17/09 | | | 345,000 | | | | 346,906 | | |
•# SMFG Preferred Capital 1 144A
6.078% 12/29/49 | | | 345,000 | | | | 341,022 | | |
•# Xstrata Finance 144A
5.724% 11/13/09 | | | 310,000 | | | | 310,282 | | |
| | | | | | | | 17,727,404 | | |
| Industrial–0.52% | |
| Adesa 7.625% 6/15/12 | | | 700,000 | | | | 726,250 | | |
| # Knowledge Learning 144A 7.75% 2/1/15 | | | 200,000 | | | | 192,500 | | |
| # Mobile Services 144A 9.75% 8/1/14 | | | 375,000 | | | | 393,750 | | |
| Mueller 10.00% 5/1/12 | | | 324,000 | | | | 353,970 | | |
# RBS Global & Rexnord 144A
11.75% 8/1/16 | | | 425,000 | | | | 446,250 | | |
| Trimas 9.875% 6/15/12 | | | 500,000 | | | | 486,250 | | |
| | | | | | | | 2,598,970 | | |
Diversified Income Series-10
Delaware VIP Diversified Income Series
Statement of Net Assets (continued)
| | | Principal
Amountm | | Market
Value
(U.S. $) | |
| CORPORATE BONDS (continued) | |
| Insurance–2.00% | |
| ASIF III 0.95% 7/15/09 | | JPY | 100,000,000 | | | $ | 837,766 | | |
# Farmers Exchange Capital 144A
7.05% 7/15/28 | | USD | 650,000 | | | | 680,204 | | |
# Farmers Insurance Exchange 144A
6.00% 8/1/14 | | | 70,000 | | | | 69,310 | | |
| 8.625% 5/1/24 | | | 255,000 | | | | 306,602 | | |
•# Financial Security Assurance
144A 6.40% 12/15/66 | | | 210,000 | | | | 211,671 | | |
•# Great West Life & Annuity Insurance
144A 7.153% 5/16/46 | | | 205,000 | | | | 217,608 | | |
| # Liberty Mutual 144A 6.70% 8/15/16 | | | 265,000 | | | | 280,066 | | |
Marsh & McLennan
5.15% 9/15/10 | | | 370,000 | | | | 363,812 | | |
| 5.375% 3/15/07 | | | 370,000 | | | | 369,896 | | |
| • 5.513% 7/13/07 | | | 430,000 | | | | 430,080 | | |
MetLife
5.00% 6/15/15 | | | 180,000 | | | | 174,875 | | |
| • 6.40% 12/15/36 | | | 440,000 | | | | 443,500 | | |
# Metropolitan Life Global Funding I
144A 4.25% 7/30/09 | | | 450,000 | | | | 439,488 | | |
| Montpelier Re 6.125% 8/15/13 | | | 215,000 | | | | 209,741 | | |
# Nationwide Mutual Insurance 144A
7.875% 4/1/33 | | | 375,000 | | | | 446,178 | | |
# Nippon Life Insurance 144A 4.875%
8/9/10 | | | 535,000 | | | | 523,707 | | |
•t# North Front Pass Through Trust 144A
5.81% 12/15/24 | | | 750,000 | | | | 739,534 | | |
SAFECO Capital Trust I
8.072% 7/15/37 | | | 245,000 | | | | 256,454 | | |
| St. Paul Travelers 5.01% 8/16/07 | | | 290,000 | | | | 288,934 | | |
•t# Twin Reefs Pass Through Trust 144A
6.35% 12/31/49 | | | 600,000 | | | | 601,141 | | |
| WellPoint | |
| 4.25% 12/15/09 | | | 130,000 | | | | 126,451 | | |
| 5.85% 1/15/36 | | | 585,000 | | | | 570,244 | | |
| Willis North America | |
| 5.125% 7/15/10 | | | 270,000 | | | | 263,440 | | |
| 5.625% 7/15/15 | | | 185,000 | | | | 177,380 | | |
•# ZFS Finance USA Trust I 144A
6.45% 12/15/65 | | | 1,000,000 | | | | 1,021,705 | | |
| | | | | | | | 10,049,787 | | |
| Natural Gas–0.99% | |
| El Paso Natural Gas 7.625% 8/1/10 | | | 715,000 | | | | 750,749 | | |
# El Paso Performance-Linked Trust
144A 7.75% 7/15/11 | | | 325,000 | | | | 345,313 | | |
| El Paso Production 7.75% 6/1/13 | | | 300,000 | | | | 315,375 | | |
Enterprise Products Operating
4.00% 10/15/07 | | | 110,000 | | | | 108,675 | | |
| 4.625% 10/15/09 | | | 330,000 | | | | 323,306 | | |
| • 8.375% 8/1/66 | | | 730,000 | | | | 792,056 | | |
Inergy Finance
6.875% 12/15/14 | | | 275,000 | | | | 271,563 | | |
| 8.25% 3/1/16 | | | 75,000 | | | | 79,125 | | |
| | | Principal
Amountm | | Market
Value
(U.S. $) | |
| CORPORATE BONDS (continued) | |
| Natural Gas (continued) | |
| Kinder Morgan Finance 5.35% 1/5/11 | | USD | 495,000 | | | $ | 483,211 | | |
# Nakilat 144A
6.067% 12/31/33 | | | 215,000 | | | | 214,078 | | |
| 6.267% 12/31/33 | | | 400,000 | | | | 397,591 | | |
| Oneok 5.51% 2/16/08 | | | 385,000 | | | | 384,830 | | |
| • Sempra Energy 5.845% 5/21/08 | | | 115,000 | | | | 115,050 | | |
Valero Logistics Operations
6.05% 3/15/13 | | | 415,000 | | | | 418,594 | | |
| | | | | | | | 4,999,516 | | |
| Real Estate–0.72% | |
American Real Estate Partners
8.125% 6/1/12 | | | 500,000 | | | | 518,750 | | |
| BF Saul REIT 7.50% 3/1/14 | | | 585,000 | | | | 597,431 | | |
Developers Diversified Realty
4.625% 8/1/10 | | | 90,000 | | | | 87,692 | | |
| 5.25% 4/15/11 | | | 95,000 | | | | 94,147 | | |
| 5.375% 10/15/12 | | | 415,000 | | | | 411,522 | | |
| # Greentown China 144A 9.00% 11/8/13 | | | 740,000 | | | | 764,050 | | |
| HRPT Properties Trust 5.75% 2/15/14 | | | 280,000 | | | | 280,589 | | |
| Rouse 7.20% 9/15/12 | | | 350,000 | | | | 359,807 | | |
| # Shimao Property 144A 8.00% 12/1/16 | | | 505,000 | | | | 515,100 | | |
| | | | | | | | 3,629,088 | | |
| Technology–1.22% | |
# Freescale Semiconductor 144A
9.125% 12/15/14 | | | 115,000 | | | | 114,856 | | |
| 10.125% 12/15/16 | | | 1,290,000 | | | | 1,298,063 | | |
International Business Machine
4.00% 11/11/11 | | EUR | 1,000,000 | | | | 1,308,028 | | |
| iPayment 9.75% 5/15/14 | | USD | 70,000 | | | | 72,275 | | |
MagnaChip Semiconductor
8.00% 12/15/14 | | | 1,375,000 | | | | 928,125 | | |
| # NXP Funding 144A 9.50% 10/15/15 | | | 375,000 | | | | 386,250 | | |
| Solectron Global Finance 8.00% 3/15/16 | | | 475,000 | | | | 483,313 | | |
| Sungard Data Systems 10.25% 8/15/15 | | | 806,000 | | | | 864,435 | | |
# Telcordia Technologies 144A
10.00% 3/15/13 | | | 330,000 | | | | 292,050 | | |
# UGS Capital II PIK 144A
10.348% 6/1/11 | | | 400,830 | | | | 403,836 | | |
| | | | | | | | 6,151,231 | | |
| Transportation–1.49% | |
American Airlines
6.817% 5/23/11 | | | 305,000 | | | | 309,862 | | |
| 6.977% 5/23/21 | | | 116,926 | | | | 115,757 | | |
| 7.377% 5/23/19 | | | 534,823 | | | | 522,789 | | |
| Continental Airlines 6.503% 6/15/11 | | | 205,000 | | | | 211,150 | | |
# Erac USA Finance 144A
5.30% 11/15/08 | | | 100,000 | | | | 99,482 | | |
| 7.35% 6/15/08 | | | 505,000 | | | | 517,817 | | |
| # Hertz 144A 8.875% 1/1/14 | | | 475,000 | | | | 499,938 | | |
| o H-Lines Finance 11.00% 4/1/13 | | | 646,000 | | | | 604,010 | | |
| Horizon Lines 9.00% 11/1/12 | | | 354,000 | | | | 373,470 | | |
Diversified Income Series- 11
Delaware VIP Diversified Income Series
Statement of Net Assets (continued)
| | | Principal
Amountm | | Market
Value
(U.S. $) | |
| CORPORATE BONDS (continued) | |
| Transportation (continued) | |
Kansas City Southern de Mexico
9.375% 5/1/12 | | USD | 510,000 | | | $ | 546,975 | | |
| 12.50% 6/15/12 | | | 200,000 | | | | 217,000 | | |
| # 144A 7.625% 12/1/13 | | | 1,130,000 | | | | 1,132,824 | | |
Kansas City Southern Railway
9.50% 10/1/08 | | | 350,000 | | | | 367,500 | | |
| ‡ Northwest Airlines 7.041% 4/1/22 | | | 101,919 | | | | 102,747 | | |
| OMI 7.625% 12/1/13 | | | 640,000 | | | | 657,600 | | |
| Seabulk International 9.50% 8/15/13 | | | 515,000 | | | | 560,063 | | |
| Stena 9.625% 12/1/12 | | | 600,000 | | | | 642,000 | | |
| | | | | | | | 7,480,984 | | |
Total Corporate Bonds
(cost $208,073,865) | | | | | | | 213,452,323 | | |
| FOREIGN AGENCIES–1.69% 5 | |
| Austria–0.34% | |
Oesterreichische Kontrollbank
1.80% 3/22/10 | | JPY | 196,000,000 | | | | 1,690,123 | | |
| | | | | | | | 1,690,123 | | |
| Germany–1.06% | |
KFW
1.75% 3/23/10 | | JPY | 95,000,000 | | | | 817,937 | | |
| 3.50% 7/4/21 | | EUR | 1,911,000 | | | | 2,337,192 | | |
| 4.95% 10/14/14 | | CAD | 424,000 | | | | 377,668 | | |
| 8.25% 9/20/07 | | ISK | 73,400,000 | | | | 997,269 | | |
| Rentenbank 1.375% 4/25/13 | | JPY | 99,000,000 | | | | 830,817 | | |
| | | | | | | | 5,360,883 | | |
| Mexico–0.15% | |
Pemex Project Funding Master Trust
6.625% 6/15/35 | | USD | 723,000 | | | | 740,533 | | |
| | | | | | | | 740,533 | | |
| Ukraine–0.14% | |
Exim of Ukraine
7.65% 9/7/11 | | USD | 270,000 | | | | 276,337 | | |
| 7.75% 9/23/09 | | USD | 405,000 | | | | 416,623 | | |
| | | | | | | | 692,960 | | |
Total Foreign Agencies
(cost $8,530,042) | | | | | | | 8,484,499 | | |
| MUNICIPAL BONDS–0.11% | |
Augusta, Georgia Water & Sewer Revenue
5.25% 10/1/39 (FSA) | | | 85,000 | | | | 91,755 | | |
| California State 5.00% 2/1/33 | | | 25,000 | | | | 26,113 | | |
California State University Systemwide
Revenue 5.00% 11/1/30 (AMBAC) | | | 95,000 | | | | 100,948 | | |
Colorado Department of Transportation
Revenue 5.00% 12/15/12 (FGIC) | | | 5,000 | | | | 5,357 | | |
Illinois State Taxable Pension
5.10% 6/1/33 | | | 10,000 | | | | 9,592 | | |
Massachusetts Health & Education
Facilities Authority Revenue
Series A 5.00% 7/15/36 | | | 220,000 | | | | 234,392 | | |
| | | Principal
Amountm | | Market
Value
(U.S. $) | |
| MUNICIPAL BONDS (continued) | |
New Jersey Economic Development
Authority Revenue Cigarette Tax
5.75% 6/15/29 | | USD | 25,000 | | | $ | 27,074 | | |
New York State Urban Development
Series A-1 5.25% 3/15/34 (FGIC) | | | 40,000 | | | | 43,004 | | |
Oregon State Taxable Pension
5.892% 6/1/27 | | | 5,000 | | | | 5,245 | | |
Total Municipal Bonds
(cost $525,272) | | | | | | | 543,480 | | |
NON-AGENCY ASSET-BACKED
SECURITIES–1.52% | |
Chase Funding Mortgage Loan
Asset-Backed Certificates
Series 2002-3 1A6 4.707% 9/25/13 | | | 719,246 | | | | 710,647 | | |
| Countrywide Asset-Backed Certificates | |
| • Series 2006-4 2A2 5.53% 7/25/36 | | | 1,050,000 | | | | 1,051,752 | | |
| • Series 2006-11 1AF3 6.05% 9/25/46 | | | 735,000 | | | | 742,350 | | |
| • Series 2006-15 A3 5.689% 10/25/46 | | | 165,000 | | | | 165,399 | | |
| Series 2006-S3 A2 6.085% 6/25/21 | | | 475,000 | | | | 479,261 | | |
| • Series 2006-S7 A3 5.712% 11/25/35 | | | 1,115,000 | | | | 1,112,337 | | |
| • Series 2006-S9 A3 5.728% 8/25/36 | | | 745,000 | | | | 740,437 | | |
# Credit-Based Asset Service and
Securitization Series 2006-SL1 A2 144A
5.556% 9/25/36 | | | 450,000 | | | | 449,561 | | |
# Dunkin Securitization
Series 2006-1 A2 144A 5.779% 6/20/31 | | | 640,000 | | | | 648,596 | | |
• GMAC Mortgage Loan Trust
Series 2006-HE3 A2 5.75% 10/25/36 | | | 180,000 | | | | 179,948 | | |
•# MASTR Specialized Loan Trust
Series 2005-2 A2 144A 5.006% 7/25/35 | | | 243,110 | | | | 238,552 | | |
MBNA Master Credit Card Trust
Series 2000-D C 8.40% 9/15/09 | | | 25,000 | | | | 25,205 | | |
| Mid-State Trust | |
| Series 11 A1 4.864% 7/15/38 | | | 18,944 | | | | 18,222 | | |
| Series 2004-1 A 6.005% 8/15/37 | | | 10,241 | | | | 10,400 | | |
| Series 2005-1 A 5.745% 1/15/40 | | | 225,120 | | | | 224,838 | | |
| # Series 2006-1 A 144A 5.787% 10/15/40 | | | 276,415 | | | | 276,501 | | |
• Option One Mortgage Loan Trust
Series 2005-4 A3 5.61% 11/25/35 | | | 230,000 | | | | 230,580 | | |
Renaissance Home Equity Loan Trust
Series 2005-4 A2 5.399% 2/25/36 | | | 170,000 | | | | 169,187 | | |
| Series 2005-4 A3 5.565% 2/25/36 | | | 110,000 | | | | 109,757 | | |
Structured Asset Securities
Series 2001-SB1 A2 3.375% 8/25/31 | | | 48,927 | | | | 43,958 | | |
| • Series 2005-NC1 A7 5.58% 2/25/35 | | | 39,840 | | | | 39,875 | | |
Total Non-Agency Asset-Backed
Securities (cost $7,667,092) | | | | | | | 7,667,363 | | |
Diversified Income Series- 12
Delaware VIP Diversified Income Series
Statement of Net Assets (continued)
| | | Principal
Amountm | | Market
Value
(U.S. $) | |
NON-AGENCY COLLATERALIZED
MORTGAGE OBLIGATIONS–5.08% | |
Bank of America Alternative Loan Trust
Series 2003-10 2A1 6.00% 12/25/33 | | USD | 10,637 | | | $ | 10,660 | | |
| Series 2004-2 1A1 6.00% 3/25/34 | | | 3,068 | | | | 3,074 | | |
| Series 2004-10 1CB1 6.00% 11/25/34 | | | 82,082 | | | | 82,433 | | |
| Series 2005-3 2A1 5.50% 4/25/20 | | | 103,719 | | | | 103,265 | | |
| Series 2005-5 2CB1 6.00% 6/25/35 | | | 194,342 | | | | 194,707 | | |
| Series 2005-6 7A1 5.50% 7/25/20 | | | 264,208 | | | | 262,887 | | |
| Series 2005-9 5A1 5.50% 10/25/20 | | | 521,711 | | | | 518,777 | | |
Bank of America Funding
Series 2005-8 1A1 5.50% 1/25/36 | | | 1,340,368 | | | | 1,312,305 | | |
| Bank of America Mortgage Securities | |
| • Series 2003-D 1A2 6.114% 5/25/33 | | | 260 | | | | 262 | | |
| • Series 2004-G 2A3 4.232% 8/25/34 | | | 43,774 | | | | 43,618 | | |
| Series 2005-9 2A1 4.75% 10/25/20 | | | 360,697 | | | | 352,950 | | |
| • Series 2005-A 1A1 4.041% 2/25/35 | | | 112,815 | | | | 111,546 | | |
• Bear Stearns Alternative-A Trust
Series 2006-3 33A1 6.189% 5/25/36 | | | 455,381 | | | | 460,631 | | |
| Series 2006-4 23A5 6.242% 8/25/36 | | | 470,580 | | | | 477,035 | | |
Bear Stearns Asset Backed Securities
Series 2005-AC8 A5 5.50% 11/25/35 | | | 363,759 | | | | 362,891 | | |
Chase Mortgage Finance
Series 2003-S8 A2 5.00% 9/25/18 | | | 590,687 | | | | 581,466 | | |
Countrywide Alternative Loan Trust
Series 2004-28CB 6A1 6.00% 1/25/35 | | | 424,093 | | | | 424,756 | | |
| • Series 2004-J7 1A2 4.673% 8/25/34 | | | 32,488 | | | | 32,228 | | |
| • Series 2005-63 3A1 5.895% 11/25/35 | | | 359,417 | | | | 359,507 | | |
| Series 2006-2CB A3 5.50% 3/25/36 | | | 301,865 | | | | 302,387 | | |
t Countrywide Home Loan Mortgage
Pass Through Trust | | | | | | | | | |
| • Series 2003-21 A1 4.077% 5/25/33 | | | 990 | | | | 977 | | |
| Series 2005-23 A1 5.50% 11/25/35 | | | 1,759,963 | | | | 1,723,114 | | |
| Series 2006-1 A2 6.00% 3/25/36 | | | 323,900 | | | | 323,936 | | |
| • Series 2006-HYB3 3A1A 6.113% 5/20/36 | | | 414,192 | | | | 418,304 | | |
Credit Suisse First Boston
Mortgage Securities
Series 2003-29 5A1 7.00% 12/25/33 | | | 13,756 | | | | 14,014 | | |
First Horizon Asset Securities
Series 2003-5 1A17 8.00% 7/25/33 | | | 2,181 | | | | 2,307 | | |
| • Series 2004-AR5 4A1 5.682% 10/25/34 | | | 29,044 | | | | 28,889 | | |
• General Motors Acceptance Corporation
Mortgage Loan Trust
Series 2005-AR2 4A 5.188% 5/25/35 | | | 350,981 | | | | 344,322 | | |
# GSMPS Mortgage Loan Trust 144A
Series 2005-RP1 1A3 8.00% 1/25/35 | | | 343,219 | | | | 363,244 | | |
| Series 2005-RP1 1A4 8.50% 1/25/35 | | | 281,761 | | | | 300,863 | | |
| Series 2006-RP1 1A2 7.50% 1/25/36 | | | 452,047 | | | | 471,218 | | |
• Indymac Index Mortgage Loan Trust
Series 2005-AR25 1A21 5.877% 12/25/35 | | | 376,185 | | | | 376,467 | | |
| Series 2006-AR2 1A1A 5.57% 4/25/46 | | | 480,019 | | | | 480,390 | | |
• JPMorgan Mortgage Trust
Series 2005-A4 1A1 5.406% 7/25/35 | | | 340,494 | | | | 336,134 | | |
| Series 2005-A6 1A2 5.152% 9/25/35 | | | 855,000 | | | | 856,515 | | |
| | | Principal
Amountm | | Market
Value
(U.S. $) | |
NON-AGENCY COLLATERALIZED
SECURITIES (continued) | |
Lehman Mortgage Trust
Series 2005-2 2A3 5.50% 12/25/35 | | USD | 305,684 | | | $ | 305,465 | | |
• MASTR Adjustable Rate Mortgages Trust
Series 2003-6 1A2 5.883% 12/25/33 | | | 6,116 | | | | 6,191 | | |
| Series 2005-6 7A1 5.375% 6/25/35 | | | 212,359 | | | | 209,382 | | |
MASTR Alternative Loans Trust
Series 2003-9 1A1 5.50% 12/25/18 | | | 60,552 | | | | 60,249 | | |
| Series 2005-3 7A1 6.00% 4/25/35 | | | 97,414 | | | | 97,451 | | |
# MASTR Reperforming Loan Trust 144A
Series 2005-1 1A5 8.00% 8/25/34 | | | 524,261 | | | | 553,482 | | |
| Series 2005-2 1A4 8.00% 5/25/35 | | | 315,619 | | | | 332,682 | | |
Morgan Stanley Mortgage Loan Trust
Series 2006-2 6A 6.50% 2/25/36 | | | 216,566 | | | | 219,680 | | |
Nomura Asset Acceptance
Series 2005-WF1 2A2 4.786% 3/25/35 | | | 275,000 | | | | 270,742 | | |
| • Series 2006-AF1 1A2 6.159% 5/25/36 | | | 400,000 | | | | 403,857 | | |
Prime Mortgage Trust Series
2004-CL1 1A1 6.00% 2/25/34 | | | 11,292 | | | | 11,366 | | |
Residential Accredit Loans Series
2005-QS9 A6 5.50% 6/25/35 | | | 150,000 | | | | 145,313 | | |
Residential Asset Mortgage Products
Series 2004-SL1 A3 7.00% 11/25/31 | | | 1,115 | | | | 1,132 | | |
| Series 2004-SL4 A3 6.50% 7/25/32 | | | 51,949 | | | | 52,806 | | |
| Series 2005-SL1 A2 6.00% 5/25/32 | | | 125,051 | | | | 127,799 | | |
• Residential Funding Mortgage Security
I Series 2006-SA3 3A1 6.06% 9/25/36 | | | 534,559 | | | | 538,379 | | |
• Structured Adjustable Rate
Mortgage Loan Trust
Series 2004-18 5A 5.50% 12/25/34 | | | 37,607 | | | | 37,208 | | |
| Series 2005-3XS A2 5.60% 1/25/35 | | | 273,407 | | | | 273,629 | | |
| Structured Asset Securities | |
| • Series 2002-22H 1A 6.958% 11/25/32 | | | 1,702 | | | | 1,732 | | |
| Series 2004-5H A2 4.43% 12/25/33 | | | 218,065 | | | | 215,233 | | |
| Series 2004-12H 1A 6.00% 5/25/34 | | | 39,720 | | | | 39,795 | | |
Washington Mutual
Series 2004-CB3 1A 6.00% 10/25/34 | | | 53,892 | | | | 53,976 | | |
| Series 2004-CB3 4A 6.00% 10/25/19 | | | 16,861 | | | | 17,025 | | |
| • Series 2006-AR7 1A 5.807% 7/25/46 | | | 247,064 | | | | 247,113 | | |
| • Series 2006-AR10 1A1 5.97% 9/25/36 | | | 557,935 | | | | 562,737 | | |
t Washington Mutual Alternative Mortgage
Pass Through Certificates
Series 2005-1 5A2 6.00% 3/25/35 | | | 55,871 | | | | 55,464 | | |
| Series 2005-1 6A2 6.50% 3/25/35 | | | 12,238 | | | | 12,309 | | |
| Series 2005-9 3CB 5.50% 10/25/20 | | | 282,080 | | | | 280,877 | | |
| Series 2006-2 2CB 6.50% 3/25/36 | | | 287,024 | | | | 290,702 | | |
| Series 2006-5 2CB3 6.00% 7/25/36 | | | 518,158 | | | | 523,590 | | |
| Series 2006-5 LB1 6.00% 7/25/36 | | | 233,893 | | | | 232,068 | | |
| • Series 2006-AR5 3A 5.77% 7/25/46 | | | 362,658 | | | | 363,578 | | |
Diversified Income Series-13
Delaware VIP Diversified Income Series
Statement of Net Assets (continued)
| | | Principal
Amountm | | Market
Value
(U.S. $) | |
NON-AGENCY COLLATERALIZED
SECURITIES (continued) | |
Wells Fargo Mortgage Backed
Securities Trust | |
| • Series 2004-T A1 4.382% 9/25/34 | | USD | 148,401 | | | $ | 148,514 | | |
| Series 2005-12 1A7 5.50% 11/25/35 | | | 488,900 | | | | 474,844 | | |
| Series 2005-14 2A1 5.50% 12/25/35 | | | 755,279 | | | | 739,465 | | |
| Series 2005-17 1A1 5.50% 1/25/36 | | | 424,016 | | | �� | 415,138 | | |
| Series 2005-17 1A2 5.50% 1/25/36 | | | 395,430 | | | | 388,451 | | |
| Series 2006-1 A3 5.00% 3/25/21 | | | 781,111 | | | | 762,804 | | |
| Series 2006-2 3A1 5.75% 3/25/36 | | | 452,612 | | | | 448,086 | | |
| • Series 2006-AR4 1A1 5.865% 4/25/36 | | | 604,181 | | | | 603,607 | | |
| • Series 2006-AR4 2A1 5.787% 4/25/36 | | | 421,235 | | | | 419,137 | | |
| • Series 2006-AR5 2A1 5.536% 4/25/36 | | | 526,489 | | | | 525,045 | | |
| • Series 2006-AR10 5A1 5.605% 7/25/36 | | | 497,490 | | | | 497,972 | | |
| • Series 2006-AR19 A1 5.69% 12/25/36 | | | 1,583,340 | | | | 1,575,171 | | |
Total Non-Agency Collateralized
Mortgage Obligations
(cost $25,510,554) | | | | | | | 25,579,325 | | |
| REGIONAL AGENCIES–3.23%5 | |
| Australia–3.23% | |
New South Wales Treasury
5.50% 8/1/14 | | AUD | 10,502,000 | | | | 7,942,168 | | |
| 5.50% 3/1/17 | | AUD | 2,600,000 | | | | 1,950,214 | | |
| 6.00% 5/1/12 | | AUD | 4,398,000 | | | | 3,423,855 | | |
| Queensland Treasury 6.00% 10/14/15 | | AUD | 3,775,000 | | | | 2,957,152 | | |
Total Regional Agencies
(cost $15,934,738) | | | | | | | 16,273,389 | | |
| REGIONAL AUTHORITY–0.24% | |
| Canada – 0.24% | |
Ontario Province
1.875% 1/25/10 | | JPY | 48,000,000 | | | | 414,258 | | |
| 4.50% 3/8/15 | | CAD | 460,000 | | | | 399,671 | | |
| 5.375% 12/2/12 | | CAD | 418,000 | | | | 380,858 | | |
Total Regional Authority
(cost $1,216,501) | | | | | | | 1,194,787 | | |
| v SENIOR SECURED LOANS–2.24% | | | | | | | | | |
| @ Avis Car Rental 6.35% 4/19/12 | | USD | 124,429 | | | | 123,962 | | |
| @ AWAS 2nd Lien 11.00% 3/21/13 | | | 483,587 | | | | 490,841 | | |
| Ford Motor 8.36% 11/29/13 | | | 2,000,000 | | | | 2,006,249 | | |
| General Motors 7.745% 11/17/13 | | | 1,325,000 | | | | 1,329,140 | | |
@ Georgia Pacific Term Tranche Loan B
6.661% 12/20/12 | | | 990,000 | | | | 990,000 | | |
| HCA 8.086% 11/17/13 | | | 1,000,000 | | | | 1,013,438 | | |
| @ Healthsouth 8.15% 3/10/13 | | | 1,194,000 | | | | 1,204,447 | | |
| Idearc 7.32% 11/17/14 | | | 300,000 | | | | 301,688 | | |
| LA Petite 2nd Lien 12.61% 2/17/13 | | | 200,000 | | | | 202,000 | | |
| Lyondell Chemical 7.11% 8/16/13 | | | 598,500 | | | | 602,241 | | |
Talecris Biotherapeutics 2nd Lien
13.50% 12/6/14 | | | 600,000 | | | | 605,250 | | |
@ United Airlines Bank Loan Tranche B
8.625% 2/1/12 | | | 781,075 | | | | 786,933 | | |
| 9.188% 2/1/12 | | | 49,750 | | | | 50,123 | | |
| | | Principal
Amountm | | Market
Value
(U.S. $) | |
| v SENIOR SECURED LOANS (continued) | | | | | | | | | |
| @ Visteon 8.18% 6/13/13 | | USD | 200,000 | | | $ | 201,125 | | |
| Wind Acquisition PIK 12.54% 12/7/11 | | | 780,000 | | | | 792,675 | | |
| @ Windstream Term Loan B 7.26% 7/17/13 | | | 585,000 | | | | 589,388 | | |
Total Senior Secured Loans
(cost $11,232,567) | | | | | | | 11,289,500 | | |
| SOVEREIGN AGENCIES–0.75% 5 | |
| France – 0.06% | |
Caisse d'Amortissement de la
Dette Sociale 3.625% 4/25/16 | | EUR | 226,000 | | | | 288,370 | | |
| | | | | | | | 288,370 | | |
| Japan – 0.52% | |
Development Bank of Japan
1.70% 9/20/22 | | JPY | 190,000,000 | | | | 1,506,070 | | |
Japan Finance Corporation for
Municipal Enterprises 2.00% 5/9/16 | | JPY | 130,000,000 | | | | 1,129,606 | | |
| | | | | | | | 2,635,676 | | |
| Norway – 0.17% | |
| Kommunalbanken 4.25% 10/24/11 | | NOK | 5,340,000 | | | | 845,595 | | |
| | | | | | | | 845,595 | | |
Total Sovereign Agencies
(cost $3,868,671) | | | | | | | 3,769,641 | | |
| SOVEREIGN DEBT–14.04% 5 | |
| Argentina – 0.21% | |
| Republic of Argentina | |
| • 5.59% 8/3/12 | | USD | 450,000 | | | | 318,854 | | |
| 8.28% 12/31/33 | | USD | 661,935 | | | | 720,847 | | |
| | | | | | | | 1,039,701 | | |
| Austria – 0.67% | |
Republic of Austria
5.25% 1/4/11 | | EUR | 1,500,000 | | | | 2,076,223 | | |
| # 144A 4.00% 9/15/16 | | EUR | 976,000 | | | | 1,289,082 | | |
| | | | | | | | 3,365,305 | | |
| Brazil – 1.56% | |
Federal Republic of Brazil
6.00% 1/17/17 | | USD | 355,000 | | | | 350,563 | | |
| 8.75% 2/4/25 | | USD | 299,000 | | | | 370,013 | | |
| 11.00% 8/17/40 | | USD | 560,000 | | | | 742,700 | | |
| 12.50% 1/5/16 | | BRL | 350,000 | | | | 186,344 | | |
| 12.50% 1/5/22 | | BRL | 11,581,000 | | | | 6,192,975 | | |
| | | | | | | | 7,842,595 | | |
| Colombia – 0.81% | |
Republic of Colombia
7.375% 1/27/17 | | USD | 785,000 | | | | 845,838 | | |
| 7.375% 9/18/37 | | USD | 870,000 | | | | 936,120 | | |
| 12.00% 10/22/15 | | COP | 4,290,000,000 | | | | 2,279,240 | | |
| | | | | | | | 4,061,198 | | |
| Dominican Republic–0.13% | |
# Dominican Republic
144A 8.625% 4/20/27 | | USD | 554,000 | | | | 639,593 | | |
| | | | | | | | 639,593 | | |
| El Salvador–0.09% | |
| Republic of El Salvador 7.65% 6/15/35 | | USD | 385,000 | | | | 438,900 | | |
| | | | | | | | 438,900 | | |
Diversified Income Series-14
Delaware VIP Diversified Income Series
Statement of Net Assets (continued)
| | | Principal
Amountm | | Market
Value
(U.S. $) | |
| SOVEREIGN DEBT (continued) | |
| France–0.75% | |
| French Treasury Note 2.75% 3/12/08 | | EUR | 643,000 | | | $ | 837,837 | | |
| Government of France 4.00% 4/25/55 | | EUR | 2,264,000 | | | | 2,949,674 | | |
| | | | | | | | 3,787,511 | | |
| Germany–1.22% | |
Deutschland Republic
4.00% 1/4/37 | | EUR | 640,000 | | | | 833,499 | | |
| 4.75% 7/4/08 | | EUR | 1,408,000 | | | | 1,881,325 | | |
| 5.00% 1/4/12 | | EUR | 299,000 | | | | 413,510 | | |
| 6.25% 1/4/24 | | EUR | 1,614,000 | | | | 2,695,278 | | |
Deutschland Republic Inflation Linked
1.50% 4/15/16 | | EUR | 241,777 | | | | 308,993 | | |
| | | | | | | | 6,132,605 | | |
| Indonesia–0.15% | |
# Republic of Indonesia
144A 6.875% 3/9/17 | | USD | 700,000 | | | | 745,500 | | |
| | | | | | | | 745,500 | | |
| Japan–2.62% | |
Japan Government
2 yr Bond 0.70% 9/15/08 | | JPY | 295,300,000 | | | | 2,479,091 | | |
| 5 yr Bond 1.50% 6/20/11 | | JPY | 311,650,000 | | | | 2,657,246 | | |
| 10 yr Bond 1.90% 6/20/16 | | JPY | 511,750,000 | | | | 4,393,608 | | |
| 20 yr Bond 2.30% 6/20/26 | | JPY | 298,300,000 | | | | 2,605,842 | | |
Japanese Government CPI Linked
Bond 0.80% 3/10/16 | | JPY | 129,745,400 | | | | 1,057,544 | | |
| | | | | | | | 13,193,331 | | |
| Malaysia–0.27% | |
Malaysian Government
3.756% 4/28/11 | | MYR | 2,763,000 | | | | 784,614 | | |
| 7.00% 3/15/09 | | MYR | 1,954,000 | | | | 593,092 | | |
| | | | | | | | 1,377,706 | | |
| Mexico–0.62% | |
Mexican Government
5.625% 1/15/17 | | USD | 550,000 | | | | 551,925 | | |
| 8.00% 12/17/15 | | MXN | 5,860,000 | | | | 561,997 | | |
| 9.00% 12/20/12 | | MXN | 14,483,000 | | | | 1,448,299 | | |
| 10.00% 12/5/24 | | MXN | 5,005,000 | | | | 575,184 | | |
| | | | | | | | 3,137,405 | | |
| Norway–1.18% | |
Norwegian Government
5.00% 5/15/15 | | NOK | 25,502,000 | | | | 4,262,673 | | |
| 6.50% 5/15/13 | | NOK | 9,481,000 | | | | 1,693,962 | | |
| | | | | | | | 5,956,635 | | |
| Panama–0.10% | |
| Republic of Panama 7.25% 3/15/15 | | USD | 480,000 | | | | 522,000 | | |
| | | | | | | | 522,000 | | |
| Philippines–0.39% | |
Republic of Philippines
7.75% 1/14/31 | | USD | 365,000 | | | | 416,100 | | |
| 8.25% 1/15/14 | | USD | 855,000 | | | | 969,356 | | |
| # 144A 8.75% 10/7/16 | | USD | 480,000 | | | | 568,800 | | |
| | | | | | | | 1,954,256 | | |
| | | Principal
Amountm | | Market
Value
(U.S. $) | |
| SOVEREIGN DEBT (continued) | |
| Poland–0.50% | |
Poland Government
6.00% 11/24/10 | | PLN | 4,721,000 | | | $ | 1,688,351 | | |
| 6.25% 10/24/15 | | PLN | 2,261,000 | | | | 836,855 | | |
| | | | | | | | 2,525,206 | | |
| Republic of Korea–0.23% | |
Government of South Korea
4.25% 12/7/21 | | EUR | 900,000 | | | | 1,153,172 | | |
| | | | | | | | 1,153,172 | | |
| Sweden – 0.40% | |
Sweden Government
5.50% 10/8/12 | | SEK | 12,770,000 | | | | 2,023,689 | | |
| | | | | | | | 2,023,689 | | |
| Turkey – 0.24% | |
Republic of Turkey
7.00% 9/26/16 | | USD | 240,000 | | | | 245,100 | | |
| 7.375% 2/5/25 | | USD | 925,000 | | | | 952,750 | | |
| | | | | | | | 1,197,850 | | |
| United Kingdom – 1.07% | |
U.K. Treasury
4.25% 3/7/11 | | GBP | 640,000 | | | | 1,215,989 | | |
| 4.75% 9/7/15 | | GBP | 322,000 | | | | 628,889 | | |
| 4.75% 3/7/20 | | GBP | 850,000 | | | | 1,682,635 | | |
| 5.00% 3/7/12 | | GBP | 153,000 | | | | 300,223 | | |
| 8.00% 6/7/21 | | GBP | 277,000 | | | | 731,585 | | |
| 9.00% 7/12/11 | | GBP | 364,000 | | | | 825,974 | | |
| | | | | | | | 5,385,295 | | |
| Uruguay – 0.21% | |
| Uruguay 7.625% 3/21/36 | | USD | 936,000 | | | | 1,034,280 | | |
| | | | | | | | 1,034,280 | | |
| Venezuela – 0.62% | |
Venezuela Government
5.75% 2/26/16 | | USD | 1,036,000 | | | | 984,200 | | |
| 6.00% 12/9/20 | | USD | 1,947,000 | | | | 1,824,339 | | |
| 9.375% 1/13/34 | | USD | 235,000 | | | | 310,788 | | |
| | | | | | | | 3,119,327 | | |
Total Sovereign Debt
(cost $68,242,934) | | | | | | | 70,633,060 | | |
| SUPRANATIONAL BANKS–1.36% | |
Asia Development Bank
0.50% 10/9/12 | | AUD | 759,000 | | | | 432,738 | | |
European Investment Bank
1.40% 6/20/17 | | JPY | 288,600,000 | | | | 2,375,054 | | |
| 4.25% 12/7/10 | | GBP | 616,000 | | | | 1,160,544 | | |
Inter-American Development Bank
1.90% 7/8/09 | | JPY | 287,000,000 | | | | 2,472,483 | | |
^ International Bank for Reconstruction &
Development 7.041% 8/20/07 | | NZD | 565,000 | | | | 379,676 | | |
Total Supranational Banks
(cost $6,788,397) | | | | | | | 6,820,495 | | |
Diversified Income Series- 15
Delaware VIP Diversified Income Series
Statement of Net Assets (continued)
| | | Principal
Amountm | | Market
Value
(U.S. $) | |
| U.S. TREASURY OBLIGATIONS–5.90% | |
| U.S. Treasury Bond 4.50% 2/15/36 | | USD | 770,000 | | | $ | 732,463 | | |
U.S. Treasury Inflation Index Notes
2.00% 1/15/26 | | | 513,545 | | | | 483,134 | | |
| 2.375% 4/15/11 | | | 101,687 | | | | 101,314 | | |
| 2.50% 7/15/16 | | | 1,239,281 | | | | 1,249,060 | | |
| * 3.00% 7/15/12 | | | 235,738 | | | | 242,672 | | |
U.S. Treasury Notes
4.625% 9/30/08 | | | 670,000 | | | | 667,723 | | |
| 4.625% 11/30/08 | | | 9,395,000 | | | | 9,363,809 | | |
| 4.625% 10/31/11 | | | 4,205,000 | | | | 4,191,039 | | |
| 4.625% 11/15/16 | | | 4,635,000 | | | | 4,606,036 | | |
| 4.875% 10/31/08 | | | 1,665,000 | | | | 1,666,302 | | |
| * 4.875% 8/15/16 | | | 6,313,000 | | | | 6,390,435 | | |
Total U.S. Treasury Obligations
(cost $29,788,304) | | | | | | | 29,693,987 | | |
| | | Number of
Shares | | | |
| COMMON STOCK–0.05% | |
| † Charter Communications Class A | | | 5,800 | | | | 17,748 | | |
| † Foster Wheeler | | | 1,044 | | | | 57,566 | | |
| † Mirant | | | 5,025 | | | | 158,639 | | |
Total Common Stock
(cost $131,043) | | | | | | | 233,953 | | |
| PREFERRED STOCK–0.00% | |
| Nexen 7.35% | | | 200 | | | | 5,160 | | |
Total Preferred Stock
(cost $5,290) | | | | | | | 5,160 | | |
| WARRANTS–0.12% | |
† Argentina GDP Linked,
expiration date 12/15/35 | | | 4,642,000 | | | | 619,707 | | |
Total Warrants
(cost $413,595) | | | | | | | 619,707 | | |
| | | Principal
Amountm | | Market
Value
(U.S. $) | |
| REPURCHASE AGREEMENTS–12.29% | |
With BNP Paribas 4.80% 1/2/07
(dated 12/29/06, to be repurchased
at $23,504,529, collateralized by
$24,576,000 U.S. Treasury Bills
due 6/28/07, market value
$23,985,035) | | USD | 23,492,000 | | | $ | 23,492,000 | | |
With Cantor Fitzgerald 4.82% 1/2/07
(dated 12/29/06, to be repurchased
at $28,240,116, collateralized by
$2,434,000 U.S. Treasury Notes 4.00%
due 6/15/09, market value $2,399,662,
$15,121,000 U.S. Treasury Notes
6.125% due 8/15/07, market value
$15,572,091 and $10,080,000
U.S. Treasury Notes 6.50% due 2/15/10,
market value $10,843,091) | | | 28,225,000 | | | | 28,225,000 | | |
With UBS Warburg 4.75% 1/2/07
(dated 12/29/06, to be repurchased
at $10,085,320, collateralized by
$10,412,000 U.S. Treasury Bills due
3/29/07, market value $10,290,815) | | | 10,080,000 | | | | 10,080,000 | | |
Total Repurchase Agreements
(cost $61,797,000) | | | | | | | 61,797,000 | | |
Diversified Income Series- 16
Delaware VIP Diversified Income Series
Statement of Net Assets (continued)
| TOTAL MARKET VALUE OF SECURITIES–104.62% (cost $517,753,431) | | $ | 526,215,358 | | |
| LIABILITIES NET OF RECEIVABLES AND OTHER ASSETS–(4.62%) | | | (23,243,376 | ) | |
| NET ASSETS APPLICABLE TO 51,273,248 SHARES OUTSTANDING–100.00% | | $ | 502,971,982 | | |
| NET ASSET VALUE-DELAWARE VIP DIVERSIFIED INCOME SERIES STANDARD CLASS ($294,248,422 / 29,944,048 Shares) | | $ | 9.83 | | |
| NET ASSET VALUE-DELAWARE VIP DIVERSIFIED INCOME SERIES SERVICE CLASS ($208,723,560 / 21,329,200 Shares) | | $ | 9.79 | | |
| COMPONENTS OF NET ASSET AT DECEMBER 31, 2006: | |
| Shares of beneficial interest (unlimited authorization–no par) | | $ | 476,807,780 | | |
| Undistributed net investment income | | | 17,313,698 | | |
| Accumulated net realized gain on investments | | | 1,089,048 | | |
| Net unrealized appreciation of investments and foreign currencies | | | 7,761,456 | | |
| Total net assets | | $ | 502,971,982 | | |
m Principal amount shown is stated in the currency in which each security is denominated.
AUD – Australian Dollar
BRL – Brazilian Real
CAD – Canadian Dollar
COP – Colombian Peso
EUR – European Monetary Unit
GBP – British Pound Sterling
ISK – Iceland Krona
JPY – Japanese Yen
MXN – Mexican Peso
MYR – Malaysia Ringgit
NOK – Norwegian Kroner
NZD – New Zealand Dollar
PLN – Polish Zlotych
RUB – Russian Ruble
SEK – Swedish Krona
TRY – Turkish Lira
USD – United States Dollar
ZAR – South African Rand
# Security exempt from registration under Rule 144A of the Securities Act of 1933, as amended. At December 31, 2006, the aggregate amount of Rule 144A securities equaled $65,848,416, which represented 13.09% of the Series' net assets. See Note 12 in "Notes to Financial Statements."
• Variable rate security. The rate shown is the rate as of December 31, 2006.
^ Zero coupon security. The interest rate shown is the yield at the time of purchase.
‡ Non-income producing security. Security is currently in default.
@ Illiquid security. At December 31, 2006, the aggregate amount of illiquid securities equaled $5,126,602, which represented 1.02% of the Series' net assets. See Note 12 in "Notes to Financial Statements."
o Step coupon bond. Indicates security that has a zero coupon that remains in effect until a predetermined date at which time the stated interest rate becomes effective.
* Fully or partially pledged as collateral for financial futures contracts.
n Security is currently in default. The issue has missed the maturity date. Bankruptcy proceedings are in process to determine distribution of assets. The date listed is the estimate of when proceedings will be finalized.
t Pass Through Agreement. Security represents the contractual right to receive a proportionate amount of underlying payments due to the counterparty pursuant to various agreements related to the rescheduling of obligations and the exchange of certain notes.
† Non-income producing security for the year ended December 31, 2006.
v Senior Secured Loans generally pay interest at rates which are periodically redetermined by reference to a base lending rate plus a premium. These base lending rates are generally (i) the prime rate offered by one or more United States banks, (ii) the lending rate offered by one or more European banks such as the London Inter-Bank Offered Rate ('LIBOR') and (iii) the certificate of deposit rate. Senior Secured Loans may be subject to restrictions on resale.
5 Securities have been classified by country of origin.
Summary of Abbreviations:
AMBAC – Insured by the AMBAC Assurance Corporation
ARM – Adjustable Rate Mortgage
CPI – Consumer Price Index
CPN – Coupon
FGIC – Insured by the Financial Guaranty Insurance Company
FHLMC – Federal Home Loan Mortgage Corporation
FSA – Insured by Financial Security Assurance
GDP – Gross Domestic Product
PIK – Pay-in-Kind
REIT – Real Estate Investment Trust
S.F. – Single Family
TBA – To be Announced
yr – Year
Diversified Income Series- 17
Delaware VIP Diversified Income Series
Statement of Net Assets (continued)
The following foreign currency and foreign cross currency exchange contracts, futures contracts, and swap contracts were outstanding at December 31, 2006:
Foreign Currency Exchange Contracts1
| Contracts to Receive (Deliver) | | In Exchange For | | Settlement Date | | Unrealized
Appreciation
(Depreciation) | |
| AUD | (17,680,000 | ) | | USD | 13,759,654 | | | 1/11/07 | | $ | (193,170 | ) | |
| CAD | 777,679 | | | AUD | (862,000 | ) | | 2/22/07 | | | (11,549 | ) | |
| CAD | 433,043 | | | NZD | (543,000 | ) | | 2/22/07 | | | (9,314 | ) | |
| CAD | 13,609 | | | USD | (11,700 | ) | | 1/3/07 | | | (29 | ) | |
| EUR | 1,871,588 | | | GBP | (1,266,000 | ) | | 1/11/07 | | | (7,301 | ) | |
| EUR | (298,022 | ) | | ISK | 27,549,166 | | | 1/11/07 | | | (7,183 | ) | |
| EUR | 1,277,430 | | | PLN | (4,891,162 | ) | | 1/11/07 | | | 1,887 | | |
| EUR | (628,454 | ) | | USD | 826,091 | | | 1/11/07 | | | (3,097 | ) | |
| EUR | 2,000,000 | | | USD | (2,641,360 | ) | | 2/22/07 | | | 5,684 | | |
| GBP | 415,598 | | | USD | (813,700 | ) | | 1/3/07 | | | 206 | | |
| ISK | 30,245,000 | | | EUR | (315,604 | ) | | 2/2/07 | | | 4,054 | | |
| JPY | 139,818,015 | | | EUR | (920,837 | ) | | 1/11/07 | | | (39,569 | ) | |
| NOK | 4,813,280 | | | AUD | (1,000,000 | ) | | 1/11/07 | | | (16,789 | ) | |
| NOK | 18,359,400 | | | USD | (3,000,000 | ) | | 1/11/07 | | | (53,833 | ) | |
| NOK | 791,998 | | | USD | (127,100 | ) | | 1/3/07 | | | (60 | ) | |
| ZAR | 6,111,315 | | | USD | (870,000 | ) | | 1/29/07 | | | 351 | | |
| | | $ | (329,712 | ) | |
Futures Contracts2
| | | Contracts
To Buy (Sell) | | Notional Cost
(Proceeds) | | Notional
Value | | Expiration Date | | Unrealized
Appreciation
(Depreciation) | |
| | 105 | | | U.S. Treasury 2 year Notes | | $ | 21,563,312 | | | $ | 21,423,281 | | | 3/30/07 | | $ | (140,031 | ) | |
| | 414 | | | U.S. Treasury 5 year Notes | | | 43,873,340 | | | | 43,495,875 | | | 3/30/07 | | | (377,465 | ) | |
| | 76 | | | U.S. Treasury 10 year Notes | | | 8,260,074 | | | | 8,167,625 | | | 3/30/07 | | | (92,449 | ) | |
| | (21 | ) | | U.S. Treasury Long Bond | | | (2,381,186 | ) | | | (2,340,188 | ) | | 3/30/07 | | | 40,998 | | |
| | | $ | (568,947 | ) | |
Swap Contracts3
| Notional Amount | | Expiration Date | | Description | | Unrealized
Appreciation | |
| $ | 2,380,000 | | | | 2/1/07 | | | Agreement with Goldman Sachs to receive the notional amount multiplied by the return on the Lehman Brothers Commercial MBS Index AAA and to pay the notional amount multiplied by the 1 month BBA LIBOR adjusted by a spread of plus 0.05%. | | $ | 34,039 | | |
|
Credit Default Swap Contracts3
Swap Counterparty &
Referenced Obligation | | Notional
Amount | | Annual Protection
Payments | | Termination Date | | Unrealized
Appreciation | |
Protection Purchased:
Goldman Sachs | |
CDS IndexCo ABX
Home Equity BBB Index 06-1 | | $ | 6,000,000 | | | | 1.54 | % | | 7/25/45 | | $ | 24,376 | | |
| Goldman Sachs | |
CDS IndexCo ABX
Home Equity BBB-Index 06-1 | | | 7,000,000 | | | | 2.67 | % | | 7/25/45 | | | 55,820 | | |
| Goldman Sachs | |
CDS IndexCo ABX
Home Equity BBB-Index 06-2 | | | 3,000,000 | | | | 2.42 | % | | 5/25/46 | | | 10,000 | | |
| Total | | | | | | | | | | | | $ | 90,196 | | |
The use of foreign currency and foreign cross currency exchange contracts, futures contracts and swap contracts involves elements of market risk and risks in excess of the amount recognized in the financial statements. The notional amounts presented above represent the Series' total exposure in such contracts, whereas only the net unrealized appreciation (depreciation) is reflected in the Series' net assets.
1See Note 8 in "Notes to Financial Statements."
2See Note 9 in "Notes to Financial Statements."
3See Note 11 in "Notes to Financial Statements."
See accompanying notes
Diversified Income Series-18
Delaware VIP Trust — Delaware VIP Diversified Income Series
Statement of Operations
Year Ended December 31, 2006
Delaware VIP Trust — Delaware VIP Diversified Income Series
Statements of Changes in Net Assets
| INVESTMENT INCOME: | |
| Interest | | $ | 21,329,449 | | |
| Dividends | | | 3,937 | | |
| Witholding tax expense | | | (2,089 | ) | |
| | | | 21,331,297 | | |
| EXPENSES: | |
| Management fees | | | 2,293,852 | | |
| Distribution expenses – Service Class | | | 495,586 | | |
| Accounting and administration expenses | | | 141,160 | | |
| Trustees' fees and benefits | | | 68,414 | | |
| Custodian fees | | | 61,248 | | |
| Reports and statements to shareholders | | | 53,340 | | |
| Legal fees | | | 38,063 | | |
| Dividend disbursing and transfer agent fees and expenses | | | 35,290 | | |
| Pricing fees | | | 22,415 | | |
| Insurance fees | | | 19,404 | | |
| Registration fees | | | 17,766 | | |
| Audit and tax | | | 16,634 | | |
| Consulting fees | | | 9,245 | | |
| Trustees' expenses | | | 1,400 | | |
| Dues and services | | | 1,278 | | |
| Taxes (other than taxes on income) | | | 779 | | |
| | | | 3,275,874 | | |
| Less waiver of distribution expenses – Service Class | | | (82,598 | ) | |
| Total operating expenses | | | 3,193,276 | | |
| NET INVESTMENT INCOME | | | 18,138,021 | | |
NET REALIZED AND UNREALIZED GAIN (LOSS)
ON INVESTMENTS AND FOREIGN CURRENCIES: | |
| Net realized gain (loss) on: | |
| Investments | | | 1,963,391 | | |
| Futures contracts | | | 719,059 | | |
| Swap contracts | | | (117,678 | ) | |
| Options written | | | 3,614 | | |
| Foreign currencies | | | (713,056 | ) | |
| Net realized gain | | | 1,855,330 | | |
Net change in unrealized appreciation/depreciation
of investments and foreign currencies | | | 9,416,957 | | |
NET REALIZED AND UNREALIZED GAIN ON
INVESTMENTS AND FOREIGN CURRENCIES | | | 11,272,287 | | |
NET INCREASE IN NET ASSETS RESULTING
FROM OPERATIONS | | $ | 29,410,308 | | |
See accompanying notes
| | | Year Ended | |
| | | 12/31/06 | | 12/31/05 | |
INCREASE (DECREASE) IN NET
ASSETS FROM OPERATIONS: | |
| Net investment income | | $ | 18,138,021 | | | $ | 5,255,909 | | |
Net realized gain (loss) on investments and
foreign currencies | | | 1,855,330 | | | | (2,817,864 | ) | |
Net change in unrealized appreciation/
depreciation of investments and
foreign currencies | | | 9,416,957 | | | | (3,080,673 | ) | |
Net increase (decrease) in net assets
resulting from operations | | | 29,410,308 | | | | (642,628 | ) | |
DIVIDENDS AND DISTRIBUTIONS TO
SHAREHOLDERS FROM: | |
| Net investment income: | |
| Standard Class | | | (1,927,505 | ) | | | (257,955 | ) | |
| Service Class | | | (2,054,268 | ) | | | (535,544 | ) | |
| Net realized gain on investments: | |
| Standard Class | | | – | | | | (125,069 | ) | |
| Service Class | | | – | | | | (338,239 | ) | |
| | | | (3,981,773 | ) | | | (1,256,807 | ) | |
| CAPITAL SHARE TRANSACTIONS: | |
| Proceeds from shares sold: | |
| Standard Class | | | 202,710,123 | | | | 85,247,705 | | |
| Service Class | | | 95,407,632 | | | | 99,383,381 | | |
Net asset value of shares issued upon
reinvestment of dividends and distributions: | |
| Standard Class | | | 1,927,505 | | | | 383,024 | | |
| Service Class | | | 2,054,268 | | | | 873,783 | | |
| | | | 302,099,528 | | | | 185,887,893 | | |
| Cost of shares repurchased: | |
| Standard Class | | | (15,934,779 | ) | | | (9,080,224 | ) | |
| Service Class | | | (30,302,103 | ) | | | (15,414,593 | ) | |
| | | | (46,236,882 | ) | | | (24,494,817 | ) | |
Increase in net assets derived from
capital share transactions | | | 255,862,646 | | | | 161,393,076 | | |
| NET INCREASE IN NET ASSETS | | | 281,291,181 | | | | 159,493,641 | | |
| NET ASSETS: | |
| Beginning of year | | | 221,680,801 | | | | 62,187,160 | | |
End of year (including undistributed
net investment income of $17,313,698 and
$3,793,628, respectively) | | $ | 502,971,982 | | | $ | 221,680,801 | | |
See accompanying notes
Diversified Income Series- 19
Delaware VIP Trust — Delaware VIP Diversified Income Series
Financial Highlights
Selected data for each share of the Series outstanding throughout each period were as follows:
| Delaware VIP Diversified Income Series Standard Class | |
| | | Year Ended | | 5/16/031
to | |
| | | 12/31/06 | | 12/31/05 | | 12/31/04 | | 12/31/03 | |
| Net asset value, beginning of period | | $ | 9.260 | | | $ | 9.450 | | | $ | 8.940 | | | $ | 8.500 | | |
| Income (loss) from investment operations: | |
| Net investment income2 | | | 0.496 | | | | 0.373 | | | | 0.348 | | | | 0.240 | | |
| Net realized and unrealized gain (loss) on investments and foreign currencies | | | 0.227 | | | | (0.416 | ) | | | 0.395 | | | | 0.200 | | |
| Total from investment operations | | | 0.723 | | | | (0.043 | ) | | | 0.743 | | | | 0.440 | | |
| Less dividends and distributions from: | |
| Net investment income | | | (0.153 | ) | | | (0.099 | ) | | | (0.233 | ) | | | – | | |
| Net realized gain on investments | | | – | | | | (0.048 | ) | | | – | | | | – | | |
| Total dividends and distributions | | | (0.153 | ) | | | (0.147 | ) | | | (0.233 | ) | | | – | | |
| Net asset value, end of period | | $ | 9.830 | | | $ | 9.260 | | | $ | 9.450 | | | $ | 8.940 | | |
| Total return3 | | | 7.92 | % | | | (0.45 | %) | | | 8.47 | % | | | 5.18 | % | |
| Ratios and supplemental data: | |
| Net assets, end of period (000 omitted) | | $ | 294,248 | | | $ | 90,811 | | | $ | 14,770 | | | $ | 2,104 | | |
| Ratio of expenses to average net assets | | | 0.79 | % | | | 0.79 | % | | | 0.80 | % | | | 0.80 | % | |
Ratio of expenses to average net assets prior to expense limitation
and expenses paid indirectly | | | 0.79 | % | | | 0.86 | % | | | 0.98 | % | | | 1.59 | % | |
| Ratio of net investment income to average net assets | | | 5.26 | % | | | 4.02 | % | | | 3.82 | % | | | 4.43 | % | |
Ratio of net investment income to average net assets prior to expense limitation
and expenses paid indirectly | | | 5.26 | % | | | 3.95 | % | | | 3.64 | % | | | 3.64 | % | |
| Portfolio turnover | | | 311 | % | | | 400 | % | | | 493 | % | | | 521 | % | |
1Commencement of operations; ratios and portfolio turnover have been annualized and total return has not been annualized.
2The average shares outstanding method has been applied for per share information.
3Total investment return is based on the change in net asset value of a share during the period and assumes reinvestment of dividends and distributions at net asset value. Total investment return reflects waivers and payment of fees by the manager, as applicable. Performance would have been lower had the expense limitation not been in effect.
See accompanying notes
Diversified Income Series- 20
Delaware VIP Diversified Income Series
Financial Highlights (continued)
Selected data for each share of the Series outstanding throughout each period were as follows:
| | | Delaware VIP Diversified Income Series Service Class | |
| | | Year Ended | | 5/16/031
to | |
| | | 12/31/06 | | 12/31/05 | | 12/31/04 | | 12/31/03 | |
| Net asset value, beginning of period | | $ | 9.230 | | | $ | 9.410 | | | $ | 8.930 | | | $ | 8.500 | | |
| Income (loss) from investment operations: | |
| Net investment income2 | | | 0.472 | | | | 0.350 | | | | 0.326 | | | | 0.216 | | |
| Net realized and unrealized gain (loss) on investments and foreign currencies | | | 0.218 | | | | (0.406 | ) | | | 0.373 | | | | 0.214 | | |
| Total from investment operations | | | 0.690 | | | | (0.056 | ) | | | 0.699 | | | | 0.430 | | |
| Less dividends and distributions from: | |
| Net investment income | | | (0.130 | ) | | | (0.076 | ) | | | (0.219 | ) | | | – | | |
| Net realized gain on investments | | | – | | | | (0.048 | ) | | | – | | | | – | | |
| Total dividends and distributions | | | (0.130 | ) | | | (0.124 | ) | | | (0.219 | ) | | | – | | |
| Net asset value, end of period | | $ | 9.790 | | | $ | 9.230 | | | $ | 9.410 | | | $ | 8.930 | | |
| Total return3 | | | 7.57 | % | | | (0.59 | %) | | | 7.85 | % | | | 5.06 | % | |
| Ratios and supplemental data: | |
| Net assets, end of period (000 omitted) | | $ | 208,724 | | | $ | 130,870 | | | $ | 47,417 | | | $ | - | | |
| Ratio of expenses to average net assets | | | 1.04 | % | | | 1.04 | % | | | 1.05 | % | | | 1.05 | % | |
Ratio of expenses to average net assets prior to expense limitation
and expenses paid indirectly | | | 1.09 | % | | | 1.16 | % | | | 1.28 | % | | | 1.89 | % | |
| Ratio of net investment income to average net assets | | | 5.01 | % | | | 3.77 | % | | | 3.57 | % | | | 4.18 | % | |
Ratio of net investment income to average net assets prior to expense limitation
and expenses paid indirectly | | | 4.96 | % | | | 3.65 | % | | | 3.34 | % | | | 3.34 | % | |
| Portfolio turnover | | | 311 | % | | | 400 | % | | | 493 | % | | | 521 | % | |
1Commencement of operations; ratios and portfolio turnover have been annualized and total return has not been annualized.
2The average shares outstanding method has been applied for per share information.
3Total investment return is based on the change in net asset value of a share during the period and assumes reinvestment of dividends and distributions at net asset value. Total investment return reflects waivers and payment of fees by the manager and distributor, as applicable. Performance would have been lower had the expense limitation and waiver not been in effect.
See accompanying notes
Diversified Income Series- 21
Delaware VIP Trust — Delaware VIP Diversified Income Series
Notes to Financial Statements
December 31, 2006
Delaware VIP Trust (the "Trust") is organized as a Delaware statutory trust and offers 15 series: Delaware VIP Balanced Series, Delaware VIP Capital Reserves Series, Delaware VIP Cash Reserve Series, Delaware VIP Diversified Income Series, Delaware VIP Emerging Markets Series, Delaware VIP Global Bond Series, Delaware VIP Growth Opportunities Series, Delaware VIP High Yield Series, Delaware VIP International Value Equity Series, Delaware VIP REIT Series, Delaware VIP Select Growth Series, Delaware VIP Small Cap Value Series, Delaware VIP Trend Series, Delaware VIP U.S. Growth Series and Delaware VIP Value Series. These financial statements and the related notes pertain to Delaware VIP Diversified Income Series (the "Series"). The Trust is an open-end investment company. The Series is considered diversified under the Investment Company Act of 1940, as amended, and offers Standard Class and Service Class shares. The Standard Class shares do no t carry a 12b-1 fee and the Service Class shares carry a 12b-1 fee. The shares of the Series are sold only to separate accounts of life insurance companies.
The investment objective of the Series is to seek maximum long-term total return consistent with reasonable risk.
1. Significant Accounting Policies
The following accounting policies are in accordance with U.S. generally accepted accounting principles and are consistently followed by the Series.
Security Valuation—Equity securities, except those traded on the Nasdaq Stock Market, Inc. (Nasdaq), are valued at the last quoted sales price as of the time of the regular close of the New York Stock Exchange (NYSE) on the valuation date. Securities traded on the Nasdaq are valued in accordance with the Nasdaq Official Closing Price, which may not be the last sales price. If on a particular day an equity security does not trade, then the mean between the bid and asked prices will be used. Securities listed on a foreign exchange are valued at the last quoted sales price before the Series is valued. U.S. government and agency securities are valued at the mean between the bid and asked prices. Other long-term debt securities are valued by an independent pricing service and such prices are believed to reflect the fair value of such securities. Short-term debt se curities having less than 60 days to maturity are valued at amortized cost, which approximates market value. Forward foreign currency exchange contracts are valued at the mean between the bid and asked prices of the contracts and are marked-to-market daily. Interpolated values are derived when the settlement date of the contract is an interim date for which quotations are not available. Futures contracts are valued at the daily quoted settlement prices. Exchange-traded options are valued at the last reported sale price or, if no sales are reported, at the mean between the last reported bid and asked prices. Swap contracts and other securities and assets for which market quotations are not readily available are valued at fair value as determined in good faith under the direction of the Series' Board of Trustees. In determining whether market quotations are readily available or fair valuation will be used, various factors will be taken into consideration, such as market closures, or with respect to foreign sec urities, aftermarket trading, or significant events after local market trading (e.g., government actions or pronouncements, trading volume or volatility on markets, exchanges among dealers, or news events).
In September 2006, the Financial Accounting Standards Board (FASB) issued FASB Statement No. 157 "Fair Value Measurements" (Statement 157). Statement 157 establishes a framework for measuring fair value in generally accepted accounting principles, clarifies the definition of fair value within that framework, and expands disclosures about the use of fair value measurements. Statement 157 is intended to increase consistency and comparability among fair value estimates used in financial reporting. Statement 157 is effective for fiscal years beginning after November 15, 2007. Management does not expect the adoption of Statement 157 to have an impact on the amounts reported in the financial statements.
Federal Income Taxes—The Series intends to continue to qualify for federal income tax purposes as a regulated investment company and make the requisite distributions to shareholders. Accordingly, no provision for federal income taxes has been made in the financial statements.
On July 13, 2006, FASB released FASB Interpretation No. 48 "Accounting for Uncertainty in Income Taxes" (FIN 48). FIN 48 provides guidance for how uncertain tax positions should be recognized, measured, presented and disclosed in the financial statements. FIN 48 requires the evaluation of tax positions taken or expected to be taken in the course of preparing the Series' tax returns to determine whether the tax positions are "more-likely-than-not" of being sustained by the applicable tax authority. Tax positions not deemed to meet the more-likely-than-not threshold would be recorded as a tax benefit or expense in the current year. Adoption of FIN 48 is required for fiscal years beginning after December 15, 2006 and is to be applied to all open tax years as of the effective date. Recent SEC guidance allows implementing FIN 48 in Series net asset value calculations as late as the Series' last net asset value calculation in the first required fi nancial statement reporting period. As a result, the Series will incorporate FIN 48 in its semiannual report on June 30, 2007. Although the Series' tax positions are currently being evaluated, management does not expect the adoption of FIN 48 to have a material impact on the Series' financial statements.
Class Accounting—Investment income, common expenses and realized and unrealized gain (loss) on investments are allocated to the classes of the Series on the basis of daily net assets of each class. Distribution expenses relating to a specific class are charged directly to that class.
Repurchase Agreements—The Series may invest in a pooled cash account along with other members of the Delaware Investments® Family of Funds pursuant to an exemptive order issued by the Securities and Exchange Commission. The aggregate daily balance of the pooled cash account is invested in repurchase agreements secured by obligations of the U.S. government. The respective collateral is held by the Series' custodian bank until the maturity of the respective repurchase agreements. Each repurchase agreement is at least 102% collateralized. However, in the event of default or bankruptcy by the counterparty to the agreement, realization of the collateral may be subject to legal proceedings.
Foreign Currency Transactions—Transactions denominated in foreign currencies are recorded at the prevailing exchange rates on the valuation date. The value of all assets and liabilities denominated in foreign currencies are translated into U.S. dollars at the exchange rate of such currencies against the U.S. dollar daily. Transaction gains or losses resulting from changes in exchange rates during the reporting period or upon settlement of the foreign currency transaction are reported in operations for the current period. The Series isolates that portion of realized gains and losses on investments in debt securities, which are due to changes in the foreign exchange rates from that which are due to changes in market prices of debt securities. The Series reports certain foreign currency related transactions as components of realized gains (losses) for financial reporting purposes, where such components are treated as ordinary income (loss) for federal income tax purposes.
Diversified Income Series- 22
Delaware VIP Diversified Income Series
Notes to Financial Statements (continued)
1. Significant Accounting Policies (continued)
Use of Estimates—The preparation of financial statements in conformity with U.S. generally accepted accounting principles requires management to make estimates and assumptions that affect the reported amounts of assets and liabilities at the date of the financial statements and the reported amounts of revenues and expenses during the reporting period. Actual results could differ from those estimates.
Other—Expenses directly attributable to the Series are charged directly to the Series. Other expenses common to various funds within the Delaware Investments® Family of Funds are generally allocated amongst such funds on the basis of average net assets. Management fees and some other expenses are paid monthly. Security transactions are recorded on the date the securities are purchased or sold (trade date) for financial reporting purposes. Costs used in calculating realized gains and losses on the sale of investment securities are those of the specific securities sold. Dividend income is recorded on the ex-dividend date and interest income is recorded on the accrual basis. Withholding taxes have been provided for in accordance with the Series' understanding of the applicable country's tax rules and rates. Discounts and premiums on non-convertibl e bonds are amortized to interest income over the lives of the respective securities. Realized gains (losses) on paydowns of mortgage- and asset-backed securities are classified as interest income.
The Series declares and pays dividends from net investment income and distributions from net realized gain on investments, if any, following the close of the fiscal year.
2. Investment Management, Administration Agreements and Other Transactions with Affiliates
In accordance with the terms of its investment management agreement, the Series pays Delaware Management Company (DMC), a series of Delaware Management Business Trust and the investment manager, an annual fee which is calculated daily at the rate of 0.65% on the first $500 million of average daily net assets of the Series, 0.60% on the next $500 million, 0.55% on the next $1.5 billion, and 0.50% on the average daily net assets in excess of $2.5 billion.
DMC has contractually agreed to waive that portion, if any, of its management fee and reimburse the Series to the extent necessary to ensure that annual operating expenses, exclusive of taxes, interest, brokerage commissions, distribution fees, certain insurance costs and extraordinary expenses, do not exceed 0.81% of average daily net assets of the Series through April 30, 2007. Prior to May 1, 2006, the expense limitation was 0.80% of average daily net assets. No reimbursement was due for the year ended December 31, 2006.
Delaware Service Company, Inc. (DSC), an affiliate of DMC, provides accounting, administration, dividend disbursing and transfer agent services. The Series pays DSC a monthly fee computed at the annual rate of 0.04% of the Series' average daily net assets for accounting and administrative services. The Series pays DSC a monthly fee based on average net assets for dividend disbursing and transfer agent services.
Pursuant to a distribution agreement and distribution plan, the Series pays Delaware Distributors, L.P. (DDLP), the distributor and an affiliate of DMC, an annual distribution and service fee not to exceed 0.30% of the average daily net assets of the Service Class shares. DDLP has contracted to waive distribution and service fees through April 30, 2007 in order to prevent distribution and service fees of the Service Class shares from exceeding 0.25% of average daily net assets. Standard Class shares pay no distribution and service expenses.
At December 31, 2006, the Series had liabilities payable to affiliates as follows:
Investment
Management
Fee Payable to
DMC | | Dividend Disbursing,
Transfer Agent,
Accounting and Administration
Fees and Other Expenses
Payable to DSC | | Distribution
Fees Payable
to DDLP | | Other
Expenses
Payable
to DMC
and Affiliates* | |
| $ | 272,774 | | | $ | 23,230 | | | $ | 43,567 | | | $ | 35,148 | | |
*DMC, as part of its administrative services, pays operating expenses on behalf of the Series and is reimbursed on a periodic basis. Such expenses include items such as printing of shareholder reports, fees for audit, legal and tax services, custodian fees and trustees' fees.
As provided in the investment management agreement, the Series bears the cost of certain legal and tax services, including internal legal and tax services provided to the Series by DMC and/or its affiliates' employees. For the year ended December 31, 2006, the Series was charged $17,674 for internal legal and tax services provided by DMC and/or its affiliates' employees.
Trustees' fees and benefits include expenses accrued by the Series for each Trustee's retainer, per meeting fees and retirement benefits. Independent Trustees with over five years of uninterrupted service are eligible to participate in a retirement plan that provides for the payment of benefits upon retirement. The amount of the retirement benefit is based on factors set forth in the plan, including the number of years of service. On November 16, 2006, the Board of Trustees unanimously voted to terminate the retirement plan. Payments equal to the net present value of the earned benefits will be made in 2007 to those independent trustees so entitled. The retirement benefit payout for the Series is $49,837. Certain officers of DMC, DSC and DDLP are officers and/or trustees of the Trust. These officers and trustees are paid no compensation by the Series.
Diversified Income Series- 23
Delaware VIP Diversified Income Series
Notes to Financial Statements (continued)
3. Investments
For the year ended December 31, 2006, the Series made purchases and sales of investment securities other than short-term investments as follows:
| Purchases other than U.S. government securities | | $ | 1,031,989,642 | | |
| Purchases of U.S. government securities | | | 215,187,130 | | |
| Sales other than U.S. government securities | | | 800,749,594 | | |
| Sales of U.S. government securities | | | 211,930,623 | | |
At December 31, 2006, the cost of investments for federal income tax purposes and unrealized appreciation (depreciation) for the Series were as follows:
Cost of
Investments | | Aggregate
Unrealized
Appreciation | | Aggregate
Unrealized
Depreciation | | Net Unrealized
Appreciation | |
| $ | 518,385,176 | | | $ | 9,912,834 | | | $ | (2,082,652 | ) | | $ | 7,830,182 | | |
4. Dividend and Distribution Information
Income and long-term capital gain distributions are determined in accordance with federal income tax regulations, which may differ from U.S. generally accepted accounting principles. Additionally, gains (losses) on foreign currency transactions and net short-term gains on sales of investment securities are treated as ordinary income for federal income tax purposes. The tax character of dividends and distributions paid during the years ended December 31, 2006 and 2005 was as follows:
| | | Year
Ended
12/31/06 | | Year
Ended
12/31/05 | |
| Ordinary income | | $ | 3,981,773 | | | $ | 1,201,382 | | |
| Long-term capital gain | | | – | | | | 55,425 | | |
| | | $ | 3,981,773 | | | $ | 1,256,807 | | |
5. Components of Net Assets on a Tax Basis
As of December 31, 2006, the components of net assets on a tax basis were as follows:
| Shares of beneficial interest | | $ | 476,807,780 | | |
| Undistributed ordinary income | | | 19,196,298 | | |
| Undistributed long-term capital gains | | | 61,136 | | |
| Post-October losses | | | (378,676 | ) | |
| Other temporary differences | | | (657,805 | ) | |
Unrealized appreciation of investments, swap
contracts and foreign currencies | | | 7,943,249 | | |
| Net assets | | $ | 502,971,982 | | |
The differences between book basis and tax basis components of net assets are primarily attributable to tax deferral of losses on wash sales, interest accrual on defaulted bonds, contingent payment debt instruments, mark-to-market of futures contracts, straddle deferrals, mark-to-market of foreign currency contracts and credit default swap contracts.
Post-October losses represent losses realized on investment transactions from November 1, 2006 through December 31, 2006 that, in accordance with federal income tax regulations, the Series has elected to defer and treat as having arisen in the following fiscal year.
For financial reporting purposes, capital accounts are adjusted to reflect the tax character of permanent book/tax differences. Reclassifications are primarily due to tax treatment of paydowns of mortgage- and asset-backed securities, contingent payment debt instruments, credit default swap contracts and gain (loss) on foreign currency transactions. Results of operations and net assets were not affected by these reclassifications. For the year ended December 31, 2006, the Series recorded the following reclassifications:
Undistributed
Net
Investment Income | | Accumulated
Net Realized
Gain (Loss) | |
| $ | (636,178 | ) | | $ | 636,178 | | |
Capital loss carryforwards of $682,113 were utilized in 2006.
Diversified Income Series-24
Delaware VIP Diversified Income Series
Notes to Financial Statements (continued)
6. Capital Shares
Transactions in capital shares were as follows:
| | | Year
Ended
12/31/06 | | Year
Ended
12/31/05 | |
| Shares sold: | |
| Standard Class | | | 21,608,848 | | | | 9,175,989 | | |
| Service Class | | | 10,150,801 | | | | 10,713,809 | | |
Shares issued upon reinvestment of dividends
and distributions: | |
| Standard Class | | | 209,284 | | | | 41,588 | | |
| Service Class | | | 223,533 | | | | 95,080 | | |
| | | | 32,192,466 | | | | 20,026,466 | | |
| Shares repurchased: | |
| Standard Class | | | (1,676,554 | ) | | | (978,146 | ) | |
| Service Class | | | (3,228,944 | ) | | | (1,663,091 | ) | |
| | | | (4,905,498 | ) | | | (2,641,237 | ) | |
| Net increase | | | 27,286,968 | | | | 17,385,229 | | |
7. Line of Credit
The Series, along with certain other funds in the Delaware Investments® Family of Funds (the "Participants"), participates in a $225,000,000 revolving line of credit facility to be used for temporary or emergency purposes as an additional source of liquidity to fund redemptions of investor shares. The Participants are charged an annual commitment fee, which is allocated across the Participants on the basis of each Participant's allocation of the entire facility. The Participants may borrow up to a maximum of one third of their net assets under the agreement. The Series had no amounts outstanding as of December 31, 2006, or at any time during the year then ended.
8. Foreign Currency Exchange Contracts
The Series may enter into foreign currency exchange contracts as a way of managing foreign exchange rate risk. The Series may enter into these contracts to fix the U.S. dollar value of a security that it has agreed to buy or sell for the period between the date the trade was entered into and the date the security is delivered and paid for. The Series may also use these contracts to hedge the U.S. dollar value of securities it already owns that are denominated in foreign currencies. The change in market value is recorded as an unrealized gain or loss. When the contract is closed, a realized gain or loss is recorded equal to the difference between the value of the contract at the time it was opened and the value at the time it was closed.
The use of foreign currency exchange contracts does not eliminate fluctuations in the underlying prices of the securities, but does establish a rate of exchange that can be achieved in the future. Although foreign currency exchange contracts limit the risk of loss due to a decline in the value of the hedged currency, they also limit any potential gain that might result should the value of the currency increase. In addition, the Series could be exposed to risks if the counterparties to the contracts are unable to meet the terms of their contracts. The unrealized gain (loss) is included in liabilities net of receivables and other assets on the Statement of Net Assets.
9. Futures Contracts
The Series may invest in financial futures contracts to hedge its existing portfolio securities against fluctuations in fair value caused by changes in prevailing market interest rates. Upon entering into a futures contract, the Series deposits cash or pledges U.S. government securities to a broker, equal to the minimum "initial margin" requirements of the exchange on which the contract is traded. Subsequent payments are received from the broker or paid to the broker each day, based on the daily fluctuation in the market value of the contract. These receipts or payments are known as "variation margin" and are recorded daily by the Series as unrealized gains or losses until the contracts are closed. When the contracts are closed, the Series records a realized gain or loss equal to the difference between the value of the contract at the time it was opened and the value at the time it was closed. Risks of entering into futures contracts include potential imperfect correlation between the futures contracts and the underlying securities and the possibility of an illiquid secondary market for these instruments. The unrealized gain (loss) is included in liabilities net of receivables and other assets on the Statement of Net Assets.
10. Options Written
During the year ended December 31, 2006, the Series entered into options contracts in accordance with its investment objectives. When the Series writes an option, a premium is received and a liability is recorded and adjusted on a daily basis to reflect the current market value of the options written. Premiums received from writing options that expire unexercised are treated by the Series on the expiration date as realized gains. The difference between the premium received and the amount paid on effecting a closing purchase transaction, including brokerage commissions, is treated as realized gain or loss. If a call option is exercised, the premium is added to the proceeds from the sale of the underlying security in determining whether the Series has a realized gain or loss. If a put option is exercised, the premium reduces the cost basis of the securities purchased by the Series. The Series, as writer of an option, bears the market risk of a n unfavorable change in the price of the security underlying the written option.
Diversified Income Series-25
Delaware VIP Diversified Income Series
Notes to Financial Statements (continued)
10. Options Written (continued)
Transactions in options written during the year ended December 31, 2006 for the Series were as follows:
| | | Number of contracts | | Premiums | |
| Options outstanding at December 31, 2005 | | | – | | | $ | – | | |
| Options written | | | 1,680,000 | | | | 3,614 | | |
| Options expired | | | (1,680,000 | ) | | | (3,614 | ) | |
| Options outstanding at December 31, 2006 | | | – | | | $ | – | | |
11. Swap Contracts
The Series may enter into total return swap contracts in accordance with its investment objectives. A swap is a contract to exchange the return generated by one instrument for the return generated by another instrument. Total return swaps involve commitments to pay interest in exchange for a market-linked return based on a notional amount. To the extent the total return of the security, instrument or basket of instruments underlying the transaction exceeds the offsetting interest obligation, the Series will receive a payment from the counterparty. To the extent the total return of the security, instrument or basket of instruments underlying the transaction falls short of the offsetting interest obligation, the Series will make a payment to the counterparty. The change in value of swap contracts outstanding, if any, is recorded as unrealized appreciation or depreciation daily. A realized gain or loss is recorded on maturity or termination of the swap contract.
Because there is no organized market for these swap contracts, the value of open swaps may differ from that which would be realized in the event the Series terminated its position in the contract. Risks of entering into these contracts include the potential inability of the counterparty to meet the terms of the contracts. This type of risk is generally limited to the amount of favorable movements in the value of the underlying security, instrument, or basket of instruments, if any, at the day of default. Risks also arise from potential losses from adverse market movements and such losses could exceed the related unrealized amounts shown on the Statement of Net Assets.
The Series may also enter into credit default swap ("CDS") contracts in accordance with its investment objectives. A CDS contract is a risk-transfer instrument through which one party (the "purchaser of protection") transfers to another party (the "seller of protection") the financial risk of a Credit Event (as defined in the CDS agreement), as it relates to a particular reference security or basket of securities (such as an index). In exchange for the protection offered by the seller of protection, the purchaser of protection agrees to pay the seller of protection a periodic amount at a stated rate that is applied to the notional amount of the CDS contract. In addition, an upfront payment may be made or received by the Series in connection with an unwinding or assignment of a CDS contract. Upon the occurrence of a Credit Event, the seller of protection would pay the par (or other agreed-upon) value of the referenced security (or basket of s ecurities) to the counterparty.
During the year ended December 31, 2006, the Series entered into CDS contracts as a purchaser of protection. Periodic payments on such contracts are accrued daily and recorded as unrealized losses on swap agreements. Upon payment, such amounts are recorded as realized losses on swap agreements. Upfront payments made or received in connection with CDS contracts are amortized over the expected life of the CDS contracts as realized losses (gains) on swap agreements. The change in value of CDS contracts is recorded as unrealized appreciation or depreciation daily. A realized gain or loss is recorded upon a Credit Event or the maturity or termination of the agreement. For the year ended December 31, 2006, the Series did not enter into any CDS contracts as a seller of protection.
Credit default swaps may involve greater risks than if the Series had invested in the referenced obligation directly. Credit default swaps are subject to general market risk, liquidity risk, counterparty risk and credit risk. If the Series enters into a CDS contract as a purchaser of protection and no credit event occurs, its exposure is limited to the periodic payments previously made to the counterparty.
12. Credit and Market Risk
Some countries in which the Series may invest require governmental approval for the repatriation of investment income, capital or the proceeds of sales of securities by foreign investors. In addition, if there is deterioration in a country's balance of payments or for other reasons, a country may impose temporary restrictions on foreign capital remittances abroad.
The securities exchanges of certain foreign markets are substantially smaller, less liquid and more volatile than the major securities markets in the United States. Consequently, acquisition and disposition of securities by the Series may be inhibited. In addition, a significant portion of the aggregate market value of securities listed on the major securities exchanges in emerging markets are held by a smaller number of investors. This may limit the number of shares available for acquisition or disposition by the Series.
The Series invests in fixed income securities whose value is derived from underlying mortgages or consumer loans. Investors receive principal and interest payments as the underlying mortgages or consumer loans are paid back. Some of these securities are collateralized mortgage obligations (CMOs). CMOs are debt securities issued by U.S. government agencies or by financial institutions and other mortgage lenders, which are collateralized by a pool of mortgages held under an indenture. Prepayment of mortgages may shorten the stated maturity of the obligations and can result in a loss of premium, if any has been paid. Certain of these securities may be stripped (securities which provide only the principal or interest feature of the underlying security). The yield to maturity on an interest-only CMO is extremely sensitive not only to changes in prevailing interest rates, but also to the rate of principal payments (including prepayments) on the re lated underlying mortgage assets. A rapid rate of principal payments may have a material adverse affect on the Series' yield to maturity. If the underlying mortgage assets experience greater than anticipated prepayments of principal, the Series may fail to fully recoup its initial investment in these securities even if the securities are rated in the highest rating categories.
Diversified Income Series- 26
Delaware VIP Diversified Income Series
Notes to Financial Statements (continued)
12. Credit and Market Risk (continued)
The Series invests a portion of its assets in high yield fixed income securities, which carry ratings of BB or lower by Standard & Poor's Ratings Group and/or Ba or lower by Moody's Investors Service, Inc. Investments in these higher yielding securities are generally accompanied by a greater degree of credit risk than higher rated securities. Additionally, lower rated securities may be more susceptible to adverse economic and competitive industry conditions than investment grade securities.
The Series may invest up to 15% of its total assets in illiquid securities, which may include securities with contractual restrictions on resale, securities exempt from registration under Rule 144A of the Securities Act of 1933, as amended, and other securities which may not be readily marketable. The relative illiquidity of these securities may impair the Series from disposing of them in a timely manner and at a fair price when it is necessary or desirable to do so. While maintaining oversight, the Series' Board of Trustees has delegated to DMC the day-to-day functions of determining whether individual securities are liquid for purposes of the Series' limitation on investments in illiquid assets. Rule 144A and illiquid securities have been identified on the Statement of Net Assets.
13. Contractual Obligations
The Series enters into contracts in the normal course of business that contain a variety of indemnifications. The Series' maximum exposure under these arrangements is unknown. However, the Series has not had prior claims or losses pursuant to these contracts. Management has reviewed the Series' existing contracts and expects the risk of loss to be remote.
14. Tax Information (Unaudited)
For the fiscal year ended December 31, 2006, the Series designates dividends and distributions paid during the year as follows:
(A)
Long-Term
Capital Gain
Distributions
(Tax Basis) | | (B)
Ordinary
Income
Distributions
(Tax Basis) | | Total
Distributions
(Tax Basis) | |
| | – | | | | 100 | % | | | 100 | % | |
(A) and (B) are based on a percentage of the Series' total distributions.
Diversified Income Series- 27
Delaware VIP Trust — Delaware VIP Diversified Income Series
Report of Independent Registered Public Accounting Firm
To the Shareholders and Board of Trustees
Delaware VIP Trust–Delaware VIP Diversified Income Series
We have audited the accompanying statement of net assets of the Delaware VIP Diversified Income Series (one of the series constituting Delaware VIP Trust) (the "Series") as of December 31, 2006, and the related statement of operations for the year then ended, the statements of changes in net assets for each of the two years in the period then ended, and the financial highlights for each of the three years in the period then ended and for the period May 16, 2003 (commencement of operations) through December 31, 2003. These financial statements and financial highlights are the responsibility of the Fund's management. Our responsibility is to express an opinion on these financial statements and financial highlights based on our audits.
We conducted our audits in accordance with the standards of the Public Company Accounting Oversight Board (United States). Those standards require that we plan and perform the audit to obtain reasonable assurance about whether the financial statements and financial highlights are free of material misstatement. We were not engaged to perform an audit of the Series' internal control over financial reporting. Our audits included consideration of internal control over financial reporting as a basis for designing audit procedures that are appropriate in the circumstances, but not for the purpose of expressing an opinion on the effectiveness of the Series' internal control over financial reporting. Accordingly, we express no such opinion. An audit also includes examining, on a test basis, evidence supporting the amounts and disclosures in the financial statements and financial highlights, assessing the accounting principles used and significant es timates made by management, and evaluating the overall financial statement presentation. Our procedures included confirmation of securities owned as of December 31, 2006, by correspondence with the custodian and brokers or by other appropriate auditing procedures where replies from brokers were not received. We believe that our audits provide a reasonable basis for our opinion.
In our opinion, the financial statements and financial highlights referred to above present fairly, in all material respects, the financial position of the Delaware VIP Diversified Income Series of Delaware VIP Trust at December 31, 2006, the results of its operations for the year then ended, the changes in its net assets for each of the two years in the period then ended, and its financial highlights for each of the three years in the period then ended and for the period May 16, 2003 (commencement of operations) through December 31, 2003, in conformity with U.S. generally accepted accounting principles.

Philadelphia, Pennsylvania
February 14, 2007
The Series files its complete schedule of portfolio holdings with the Securities and Exchange Commission for the first and third quarters of each fiscal year on Form N-Q. The Series' Forms N-Q, as well as a description of the policies and procedures that the Series uses to determine how to vote proxies (if any) relating to portfolio securities is available without charge (i) upon request, by calling 800-523-1918; (ii) on the Series' website at http://www.delawareinvestments.com; and (iii) on the Commission's website at http://www.sec.gov. The Series' Forms N-Q may be reviewed and copied at the Commission's Public Reference Room in Washington, DC; information on the operation of the Public Reference Room may be obtained by calling 1-800-SEC-0330.
Information (if any) regarding how the Series voted proxies relating to portfolio securities during the most recently disclosed 12-month period ended June 30 is available without charge (i) through the Series' website at http://www.delawareinvestments.com; and (ii) on the Commission's website at http://www.sec.gov.
Diversified Income Series-28
Delaware Investments® Family of Funds
board of trustees/directors and officers addendum
A mutual fund is governed by a Board of Trustees/Directors ("Trustees"), which has oversight responsibility for the management of a fund's business affairs. Trustees establish procedures and oversee and review the performance of the investment manager, the distributor, and others who perform services for the fund. The independent fund trustees, in particular, are advocates for shareholder interests. Each trustee has served in that capacity since he or she was elected to or appointed to the Board of Trustees, and will continue to serve until his or her retirement or the election of a new trustee in his or her place. The following is a list of the Trustees and Officers with certain background and related information.
Name,
Address,
and Birth Date | | Position(s)
Held with
Fund(s) | | Length of Time
Served | | Principal
Occupation(s)
During
Past 5 Years | | Number of
Portfolios in Fund
Complex Overseen
by Trustee
or Officer | | Other
Directorships
Held by
Trustee
or Officer | |
| interested trustees | | | | | | | | | | | | | |
|
Patrick P. Coyne1
2005 Market Street
Philadelphia, PA
19103
April 14, 1963 | | Chairman,
President,
Chief Executive
Officer, and
Trustee | | Chairman and Trustee
since August 16, 2006
President and
Chief Executive Officer
since August 1, 2006 | | Patrick P. Coyne has served in
various executive capacities
at different times at
Delaware Investments.2 | | | 84 | | | None | |
|
| independent trustees | | | | | | | | | | | | | |
|
Thomas L. Bennett
2005 Market Street
Philadelphia, PA
19103
October 4, 1947 | | Trustee | | Since
March 2005 | | Private Investor –
(March 2004 – Present)
Investment Manager –
Morgan Stanley & Co.
(January 1984 – March 2004) | | | 84 | | | None | |
|
John A. Fry
2005 Market Street
Philadelphia, PA
19103
May 28, 1960 | | Trustee | | Since
January 2001 | | President –
Franklin & Marshall College
(June 2002 – Present)
Executive Vice President –
University of Pennsylvania
(April 1995 – June 2002) | | | 84 | | | Director –
Community Health
Systems
Director –
Allied Barton
Security Holdings | |
|
Anthony D. Knerr
2005 Market Street
Philadelphia, PA
19103
December 7, 1938 | | Trustee | | Since
April 1990 | | Founder and Managing Director –
Anthony Knerr & Associates
(Strategic Consulting)
(1990 – Present) | | | 84 | | | None | |
|
Lucinda S. Landreth
2005 Market Street
Philadelphia, PA
19103
June 24, 1947 | | Trustee | | Since
March 2005 | | Chief Investment Officer –
Assurant, Inc.
(Insurance)
(2002 – 2004) | | | 84 | | | None | |
|
Ann R. Leven
2005 Market Street
Philadelphia, PA
19103
November 1, 1940 | | Trustee | | Since
September 1989 | | Consultant –
ARL Associates
(Financial Planning)
(1983 – Present) | | | 84 | | | Director and
Audit Committee
Chairperson – Andy
Warhol Foundation
Director and Audit
Committee Member –
Systemax, Inc. | |
|
Diversified Income Series- 29
Name,
Address,
and Birth Date | | Position(s)
Held with
Fund(s) | | Length of Time
Served | | Principal
Occupation(s)
During
Past 5 Years | | Number of
Portfolios in Fund
Complex Overseen
by Trustee
or Officer | | Other
Directorships
Held by
Trustee
or Officer | |
| independent trustees (continued) | | | | | | | | | | | | | |
|
Thomas F. Madison
2005 Market Street
Philadelphia, PA
19103
February 25, 1936 | | Trustee | | Since
May 1997 | | President and Chief
Executive Officer –
MLM Partners, Inc.
(Small Business Investing
and Consulting)
(January 1993 – Present) | | | 84 | | | Director –
Banner Health
Director –
CenterPoint Energy
Director and Audit
Committee Member –
Digital River, Inc.
Director and Audit
Committee Member –
Rimage
Corporation
Director – Valmont
Industries, Inc. | |
|
Janet L. Yeomans
2005 Market Street
Philadelphia, PA
19103
July 31, 1948 | | Trustee | | Since
April 1999 | | Vice President
(January 2003 – Present)
and Treasurer
(January 2006 – Present)
3M Corporation
Ms. Yeomans has held
various management positions
at 3M Corporation since 1983. | | | 84 | | | None | |
|
J. Richard Zecher
2005 Market Street
Philadelphia, PA
19103
July 3, 1940 | | Trustee | | Since
March 2005 | | Founder –
Investor Analytics
(Risk Management)
(May 1999 – Present)
Founder –
Sutton Asset Management
(Hedge Fund)
(September 1998 – Present) | | | 84 | | | Director and Audit
Committee Member –
Investor Analytics
Director and Audit
Committee Member –
Oxigene, Inc. | |
|
| officers | | | | | | | | | | | | | |
|
David F. Connor
2005 Market Street
Philadelphia, PA
19103
December 2, 1963 | | Vice President,
Deputy General
Counsel, and Secretary | | Vice President since
September 21, 2000
and Secretary
since
October 2005 | | David F. Connor has served as
Vice President and Deputy
General Counsel of
Delaware Investments
since 2000. | | | 84 | | | None3 | |
|
David P. O'Connor
2005 Market Street
Philadelphia, PA
19103
February 21, 1966 | | Senior Vice
President,
General Counsel,
and Chief
Legal Officer | | Senior Vice President,
General Counsel, and
Chief Legal Officer
since
October 2005 | | David P. O'Connor has served in
various executive and legal
capacities at different times at
Delaware Investments. | | | 84 | | | None3 | |
|
John J. O'Connor
2005 Market Street
Philadelphia, PA
19103
June 16, 1957 | | Senior Vice President
and Treasurer | | Treasurer
since
February 2005 | | John J. O'Connor has served in
various executive capacities
at different times at
Delaware Investments. | | | 84 | | | None3 | |
|
Richard Salus
2005 Market Street
Philadelphia, PA
19103
October 4, 1963 | | Senior
Vice President
and
Chief Financial
Officer | | Chief Financial
Officer since
November 1, 2006 | | Richard Salus has served in
various executive capacities
at different times at
Delaware Investments. | | | 84 | | | None3 | |
|
1 Patrick P. Coyne is considered to be an "Interested Trustee" because he is an executive officer of the Fund's(s') investment advisor.
2 Delaware Investments is the marketing name for Delaware Management Holdings, Inc. and its subsidiaries, including the Fund's(s') investment advisor, principal underwriter, and its transfer agent.
3 David F. Connor, David P. O'Connor, John J. O'Connor, and Richard Salus serve in similar capacities for the six portfolios of the Optimum Fund Trust, which have the same investment advisor, principal underwriter, and transfer agent as the registrant. John J. O'Connor also serves in a similar capacity for Lincoln Variable Insurance Products Trust, which has the same investment advisor as the registrant.
The Statement of Additional Information for the Fund(s) includes additional information about the Trustees and Officers and is available, without charge, upon request by calling 800 523-1918.
Diversified Income Series- 30
Delaware VIP Trust — Delaware VIP Emerging Markets Series
Delaware VIP Emerging Markets Series Standard Class shares returned +27.13%, and its Service Class shares returned +26.81% (both reflect all distributions reinvested) for the fiscal year ended Dec. 31, 2006. The Series performance lagged behind the 32.59% gain of its benchmark, the Morgan Stanley Capital International Emerging Markets Free Index (source: Lipper).
During the year, Liu-Er Chen of Delaware Investments assumed day-to-day management of the Series. The new investment strategy differs from that of the previous manager's and resulted in certain changes to the Series during the last quarter of the fiscal year. The Series' former manager followed a value-oriented stock selection process, focusing on stocks that offered attractive dividend yields. This was combined with defensive allocations within certain countries and economic sectors.
During the first three quarters of the year, the portfolio was characterized by several factors, including: a marked underweight in India, where stock valuations were viewed as unappealing; an overweight in the Brazilian market, based on attractive stock valuations; and an overweight in selected markets in southeast Asia, particularly in Thailand and Malaysia, where the managers believed that attractive stock prices would be supported by undervalued currencies.
As a result of the change in management of the Series, some positions have been reduced or eliminated while new positions have been added. The manager follows an approach based on — first and foremost — calculating a company's intrinsic value, seeking to determine its true worth in the marketplace.
The views expressed are current as of the date of this report and are subject to change.
The performance data quoted below and on the next page represent past performance; past performance does not guarantee future results. Investment return and principal value of an investment will fluctuate so that your shares, when redeemed, may be worth more or less than their original cost. Current performance may be lower or higher than the performance data quoted. Please obtain the performance data for the most recent month end by calling the number noted on the page related to this Series in the introductory section of this report.
You should consider the investment objectives, risks, charges, and expenses of the investment carefully before investing. The Delaware VIP Emerging Markets Series prospectus contains this and other important information about the Series. To obtain a prospectus, contact the company noted on the page related to this Series in the introductory section of this report, either by phone or through the company Web site. We advise you to read the prospectus carefully before you invest.
Instances of high double-digit returns are unusual, cannot be sustained, and were achieved primarily during favorable market conditions.
Delaware VIP Emerging Markets Series
Average annual total returns
For the periods ending Dec. 31, 2006 | | 1 Year | | 5 Years | | Lifetime | |
| Standard Class Shares* | | | +27.13 | % | | | +31.15 | % | | | +11.13 | % | |
| Service Class Shares** | | | +26.81 | % | | | +30.86 | % | | | +20.02 | % | |
* Commenced operations on May 1, 1997
** Commenced operations on May 1, 2000
Emerging Markets Series- 1
Delaware VIP Trust — Delaware VIP Emerging Markets Series (continued)
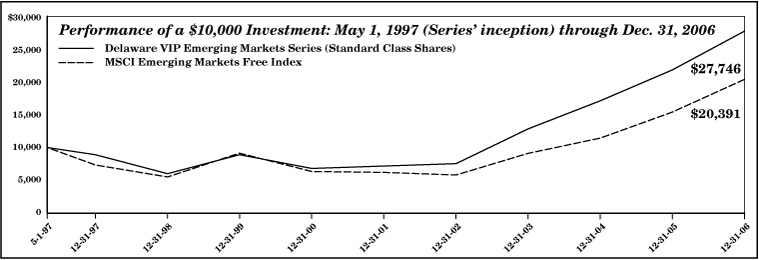
The chart shows a $10,000 investment in the Delaware VIP Emerging Markets Series Standard Class shares for the period from the Series inception May 1, 1997 through Dec. 31, 2006. All distributions were reinvested. The chart also shows $10,000 invested in the MSCI Emerging Markets Free Index for the period from May 31, 1997 through Dec. 31, 2006.
MSCI EM Index measures the equity market performance of 26 emerging market country indices located around the world. An index is unmanaged and does not reflect the costs of operating a mutual fund, such as the costs of buying, selling, and holding securities. You cannot invest directly in an index.
Earnings from a variable annuity or variable life investment compound tax free until withdrawal, so no adjustments were made for income taxes.
An expense limitation was in effect for the Delaware VIP Emerging Markets Series during the periods shown.
Performance of Service Class shares will vary due to different charges and expenses.
Performance does not reflect insurance fees related to a variable annuity or variable life investment or the deferred sales charge that would apply to certain withdrawals of investments held for fewer than eight years. Performance shown here would have been reduced if such fees were included and the expense limitation was removed. For more information about fees, consult your variable annuity or variable life prospectus.
Investments in variable products involve risk. Foreign investments are subject to risks not ordinarily associated with domestic investments, such as currency, economic and political risks, and different accounting standards. Investing in emerging markets can be riskier than investing in well-established foreign markets. Some portfolios offer more risk than others. Please read both the contract and underlying prospectus for specific details regarding the product's risk profile.
Emerging Markets Series- 2
Delaware VIP Trust — Delaware VIP Emerging Markets Series
Disclosure of Series Expenses
For the Period July 1, 2006 to December 31, 2006
As a shareholder of the Series, you incur ongoing costs, including management fees; distribution and/or service (12b-1) fees; and other Series expenses. This Example is intended to help you understand your ongoing costs (in dollars) of investing in the Series and to compare these costs with the ongoing costs of investing in other mutual funds.
The Example is based on an investment of $1,000 invested at the beginning of the period and held for the entire period from July 1, 2006 to December 31, 2006.
Actual Expenses
The first section of the table shown, "Actual Series Return," provides information about actual account values and actual expenses. You may use the information in this section of the table, together with the amount you invested, to estimate the expenses that you paid over the period. Simply divide your account value by $1,000 (for example, an $8,600 account value divided by $1,000 = 8.6), then multiply the result by the number in the first section under the heading entitled "Expenses Paid During Period" to estimate the expenses you paid on your account during the period.
Hypothetical Example for Comparison Purposes
The second section of the table shown, "Hypothetical 5% Return," provides information about hypothetical account values and hypothetical expenses based on the Series' actual expense ratio and an assumed rate of return of 5% per year before expenses, which is not the Series' actual return. The hypothetical account values and expenses may not be used to estimate the actual ending account balance or expenses you paid for the period. You may use this information to compare the ongoing costs of investing in the Series and other funds. To do so, compare the 5% hypothetical example with the 5% hypothetical examples that appear in the shareholder reports of other funds.
Please note that the expenses shown in the table are meant to highlight your ongoing costs only. As a shareholder of the Series, you do not incur any transaction costs, such as sales charges (loads), redemption fees or exchange fees, but shareholders of other funds may incur such costs. Also, the fees related to the variable annuity investment or the deferred sales charge that could apply have not been included. Therefore, the second section of the table is useful in comparing ongoing costs only, and will not help you determine the relative total costs of owning different funds. The Series' actual expenses shown in the table reflect fee waivers in effect. The expenses shown in the table assume reinvestment of all dividends and distributions.
Expense Analysis of an Investment of $1,000
| | | Beginning
Account
Value
7/1/06 | | Ending
Account
Value
12/31/06 | | Annualized
Expense
Ratios | | Expenses
Paid During
Period
7/1/06 to
12/31/06* | |
| Actual Series Return | |
| Standard Class | | $ | 1,000.00 | | | $ | 1,238.30 | | | | 1.52 | % | | $ | 8.58 | | |
| Service Class | | | 1,000.00 | | | | 1,236.30 | | | | 1.77 | % | | | 9.98 | | |
| Hypothetical 5% Return (5% return before expenses) | |
| Standard Class | | $ | 1,000.00 | | | $ | 1,017.54 | | | | 1.52 | % | | $ | 7.73 | | |
| Service Class | | | 1,000.00 | | | | 1,016.28 | | | | 1.77 | % | | | 9.00 | | |
*"Expenses Paid During Period" are equal to the Series' annualized expense ratio, multiplied by the average account value over the period, multiplied by 184/365 (to reflect the one-half year period).
Emerging Markets Series- 3
Delaware VIP Trust — Delaware VIP Emerging Markets Series
Country and Sector Allocations
As of December 31, 2006
Sector designations may be different than the sector designations presented in other Series materials.
| Country | | Percentage
of Net Assets | |
| Common Stock | | | 90.03 | % | |
| Argentina | | | 1.88 | % | |
| Brazil | | | 11.17 | % | |
| Chile | | | 1.26 | % | |
| China | | | 10.51 | % | |
| Egypt | | | 0.68 | % | |
| Hungary | | | 2.00 | % | |
| Indonesia | | | 1.95 | % | |
| Israel | | | 1.94 | % | |
| Kazakhstan | | | 1.00 | % | |
| Malaysia | | | 5.32 | % | |
| Mexico | | | 7.48 | % | |
| Pakistan | | | 0.26 | % | |
| Panama | | | 0.55 | % | |
| Peru | | | 1.15 | % | |
| Philippines | | | 0.39 | % | |
| Poland | | | 1.03 | % | |
| Republic of Korea | | | 11.99 | % | |
| Russia | | | 6.44 | % | |
| South Africa | | | 7.22 | % | |
| Taiwan | | | 9.13 | % | |
| Thailand | | | 2.70 | % | |
| Turkey | | | 1.74 | % | |
| United Kingdom | | | 0.41 | % | |
| United States | | | 1.83 | % | |
| Preferred Stock | | | 6.70 | % | |
| Brazil | | | 3.89 | % | |
| Republic of Korea | | | 2.81 | % | |
| Exchange Traded Funds | | | 0.45 | % | |
| Repurchase Agreements | | | 2.57 | % | |
| Total Market Value of Securities | | | 99.75 | % | |
| Receivables and Other Assets Net of Liabilities | | | 0.25 | % | |
| Total Net Assets | | | 100.00 | % | |
| Sector | | Percentage
of Net Assets | |
| Consumer Discretionary | | | 6.77 | % | |
| Consumer Staples | | | 7.88 | % | |
| Energy | | | 12.53 | % | |
| Financials | | | 20.33 | % | |
| Industrials | | | 8.43 | % | |
| Information Technology | | | 7.43 | % | |
| Materials | | | 9.39 | % | |
| Telecommunication Services | | | 15.45 | % | |
| Utilities | | | 8.52 | % | |
| Total | | | 96.73 | % | |
Emerging Markets Series- 4
Delaware VIP Trust — Delaware VIP Emerging Markets Series
Statement of Net Assets
December 31, 2006
| | | Number of
Shares | | Market
Value
(U.S. $) | |
| COMMON STOCK–90.03%Æ | |
| Argentina–1.88% | |
| Cresud ADR | | | 87,700 | | | $ | 1,534,750 | | |
| † Grupo Financiero Galicia ADR | | | 187,000 | | | | 1,787,720 | | |
IRSA Inversiones y
Representaciones GDR | | | 96,700 | | | | 1,635,197 | | |
† Petrobras Energia Participaciones
ADR | | | 128,500 | | | | 1,566,415 | | |
| | | | | | | | 6,524,082 | | |
| Brazil–11.17% | |
| AES Tiete | | | 42,200,000 | | | | 1,224,620 | | |
| Banco do Brasil | | | 55,700 | | | | 1,668,523 | | |
| Centrais Eletricas Brasileiras | | | 271,362,623 | | | | 6,489,078 | | |
| Companhia de Concessoes Rodoviarias | | | 279,375 | | | | 3,772,511 | | |
| Companhia Siderurgica Nacional | | | 53,148 | | | | 1,604,515 | | |
| Companhia Vale do Rio Doce ADR | | | 66,051 | | | | 1,733,839 | | |
| CPFL Energia | | | 101,100 | | | | 1,419,612 | | |
| † CPFL Energia ADR | | | 33,700 | | | | 1,381,026 | | |
| Petroleo Brasileiro ADR | | | 107,300 | | | | 10,030,403 | | |
| † Tim Participacoes ADR | | | 35,100 | | | | 1,215,162 | | |
Unibanco – Uniao de Bancos
Brasileiros ADR | | | 37,800 | | | | 3,513,888 | | |
| Votorantim Celulose e Papel ADR | | | 241,300 | | | | 4,731,892 | | |
| | | | | | | | 38,785,069 | | |
| Chile–1.26% | |
| Banco Santander ADR | | | 58,500 | | | | 2,817,360 | | |
| † Inversiones Aguas Metropolitanas | | | 237,618 | | | | 292,419 | | |
†# Inversiones Aguas Metropolitanas
144A ADR | | | 51,717 | | | | 1,272,885 | | |
| | | | | | | | 4,382,664 | | |
| China–10.51%o | |
China Merchants Holdings
International | | | 547,908 | | | | 2,241,320 | | |
| China Shipping Development | | | 3,804,000 | | | | 5,817,690 | | |
| China Telecom | | | 11,242,000 | | | | 6,138,183 | | |
| China Unicom | | | 3,327,021 | | | | 4,918,332 | | |
| China Unicom ADR | | | 16,000 | | | | 238,240 | | |
| CNOOC ADR | | | 16,700 | | | | 1,580,321 | | |
| COSCO | | | 4,344,333 | | | | 2,827,999 | | |
| Fountain Set | | | 3,199,200 | | | | 891,641 | | |
| Guangshen Railway | | | 3,020,000 | | | | 2,041,370 | | |
| Huaneng Power International | | | 7,724,000 | | | | 6,905,519 | | |
| Texwinca | | | 1,660,000 | | | | 1,149,280 | | |
| Zhejiang Expressway | | | 2,268,117 | | | | 1,734,063 | | |
| | | | | | | | 36,483,958 | | |
| Egypt–0.68% | |
| MobiNil-Egyptian Mobile Services | | | 75,034 | | | | 2,364,827 | | |
| | | | | | | | 2,364,827 | | |
| Hungary–2.00% | |
| Magyar Telekom Telecommunications | | | 570,900 | | | | 3,181,130 | | |
| OTP Bank | | | 82,031 | | | | 3,762,372 | | |
| | | | | | | | 6,943,502 | | |
| | | Number of
Shares | | Market
Value
(U.S. $) | |
| COMMON STOCK (continued) | |
| Indonesia–1.95% | |
| Bank Mandiri Persero | | | 7,915,220 | | | $ | 2,564,821 | | |
| Bumi Resources | | | 8,863,000 | | | | 895,109 | | |
| Gudang Garam | | | 1,410,264 | | | | 1,602,989 | | |
| Telekomunikasi Indonesia | | | 1,503,000 | | | | 1,693,993 | | |
| | | | | | | | 6,756,912 | | |
| Israel–1.94% | |
| Bezeq Israeli Telecommunication | | | 1,679,777 | | | | 2,712,344 | | |
| Israel Chemicals | | | 642,438 | | | | 4,008,588 | | |
| | | | | | | | 6,720,932 | | |
| Kazakhstan–1.00% | |
† KazMunaiGas Exploration Production
GDR | | | 142,186 | | | | 3,483,685 | | |
| | | | | | | | 3,483,685 | | |
| Malaysia–5.32% | |
| Eastern & Oriental | | | 3,076,100 | | | | 1,655,917 | | |
| † Genting International | | | 4,116,000 | | | | 2,262,883 | | |
| Hong Leong Bank | | | 2,123,918 | | | | 3,339,305 | | |
| KLCC Property | | | 71,000 | | | | 57,122 | | |
| Maxis Communications | | | 1,038,607 | | | | 3,000,815 | | |
| MISC - Foreign | | | 404,412 | | | | 1,019,516 | | |
| Oriental Holdings | | | 1,305,900 | | | | 1,649,947 | | |
| PLUS Expressways | | | 2,428,074 | | | | 1,931,356 | | |
| Public Bank | | | 453,700 | | | | 994,606 | | |
| Public Bank - Foreign | | | 425,251 | | | | 944,306 | | |
| Sime Darby | | | 38,800 | | | | 79,301 | | |
| Tanjong | | | 379,610 | | | | 1,547,472 | | |
| | | | | | | | 18,482,546 | | |
| Mexico–7.48% | |
| America Movil Series L ADR | | | 94,300 | | | | 4,264,246 | | |
| Controladora Comercial Mexicana | | | 201,600 | | | | 522,522 | | |
| † Desarrolladora Homex ADR | | | 14,600 | | | | 862,422 | | |
| Fomento Economico Mexicano ADR | | | 24,100 | | | | 2,789,816 | | |
| † Grupo Aeroportuario del Pacifico ADR | | | 20,900 | | | | 819,071 | | |
| Grupo Aeroportuario del Sureste ADR | | | 43,000 | | | | 1,826,640 | | |
| Grupo Mexico Class B | | | 454,389 | | | | 1,665,630 | | |
| Grupo Modelo Series C | | | 583,265 | | | | 3,228,663 | | |
| Grupo Televisa ADR | | | 277,200 | | | | 7,487,172 | | |
| Kimberly-Clark de Mexico Class A | | | 356,362 | | | | 1,646,067 | | |
| Organizacion Soriana Class B | | | 133,177 | | | | 877,738 | | |
| | | | | | | | 25,989,987 | | |
| Pakistan–0.26% | |
| † Oil & Gas Development GDR | | | 47,167 | | | | 900,890 | | |
| | | | | | | | 900,890 | | |
| Panama–0.55% | |
Banco Latinoamericano de Exportacions
Class E | | | 112,900 | | | | 1,914,784 | | |
| | | | | | | | 1,914,784 | | |
| Peru–1.15% | |
| Cia de Minas Buenaventura ADR | | | 142,400 | | | | 3,995,744 | | |
| | | | | | | | 3,995,744 | | |
Emerging Markets Series- 5
Delaware VIP Emerging Markets Series
Statement of Net Assets (continued)
| | | Number of
Shares | | Market
Value
(U.S. $) | |
| COMMON STOCK (continued) | |
| Philippines–0.39% | |
Philippine Long Distance
Telephone ADR | | | 26,400 | | | $ | 1,349,832 | | |
| | | | | | | | 1,349,832 | | |
| Poland–1.03% | |
| Telekomunikacja Polska | | | 423,692 | | | | 3,568,677 | | |
| | | | | | | | 3,568,677 | | |
| Republic of Korea–11.99% | |
| Cheil Industries | | | 28,260 | | | | 1,189,598 | | |
| CJ | | | 16,817 | | | | 2,016,209 | | |
| Daelim Industrial | | | 50,201 | | | | 4,070,388 | | |
| Hana Financial | | | 58,799 | | | | 3,088,302 | | |
| Kookmin Bank | | | 61,489 | | | | 4,943,845 | | |
| Korea Electric Power | | | 62,730 | | | | 2,859,952 | | |
| Korea Electric Power ADR | | | 84,600 | | | | 1,921,266 | | |
| KT | | | 112,200 | | | | 5,610,005 | | |
| KT ADR | | | 105,727 | | | | 2,680,179 | | |
| KT&G | | | 21,918 | | | | 1,331,579 | | |
| Lotte Confectionery | | | 1,158 | | | | 1,506,647 | | |
| POSCO ADR | | | 40,700 | | | | 3,364,669 | | |
| Samsung | | | 42,000 | | | | 1,375,214 | | |
| Samsung Electronics | | | 3,725 | | | | 2,443,635 | | |
| Shinsegae | | | 2,555 | | | | 1,591,447 | | |
| SK Telecom ADR | | | 62,700 | | | | 1,660,296 | | |
| | | | | | | | 41,653,231 | | |
| Russia–6.44% | |
| Gazprom ADR | | | 200,405 | | | | 9,218,630 | | |
LUKOIL ADR
(London International Exchange) | | | 44,297 | | | | 3,863,939 | | |
| LUKOIL ADR | | | 27,664 | | | | 2,433,049 | | |
| Mobile Telesystems ADR | | | 35,500 | | | | 1,781,745 | | |
| NovaTek GDR | | | 47,545 | | | | 3,017,600 | | |
| Unified Energy System GDR | | | 18,787 | | | | 2,050,601 | | |
| | | | | | | | 22,365,564 | | |
| South Africa–7.22% | |
| Alexander Forbes | | | 1,003,787 | | | | 2,241,363 | | |
| Barloworld | | | 117,710 | | | | 2,755,450 | | |
| Liberty Group | | | 177,596 | | | | 2,101,157 | | |
| Mittal Steel South Africa | | | 164,862 | | | | 2,306,897 | | |
| Remgro | | | 136,101 | | | | 3,453,063 | | |
| Sasol | | | 95,871 | | | | 3,539,272 | | |
| Standard Bank | | | 256,893 | | | | 3,460,200 | | |
| Steinhoff International | | | 418,714 | | | | 1,481,171 | | |
| Telkom | | | 124,972 | | | | 2,521,478 | | |
| Tiger Brands | | | 49,997 | | | | 1,220,813 | | |
| | | | | | | | 25,080,864 | | |
| Taiwan–9.13% | |
| † Ase Test | | | 144,100 | | | | 1,453,969 | | |
| Asustek Computer | | | 1,526,346 | | | | 4,169,347 | | |
| Cathay Financial | | | 1,034,188 | | | | 2,344,985 | | |
| † China Life Insurance | | | 2,936,000 | | | | 1,581,499 | | |
| Chunghwa Telecom | | | 1,615,394 | | | | 3,001,676 | | |
| Formosa Chemicals & Fibre | | | 1,755,330 | | | | 2,940,182 | | |
| Lite-On Technology | | | 1 | | | | 1 | | |
| | | Number of
Shares | | Market
Value
(U.S. $) | |
| COMMON STOCK (continued) | |
| Taiwan (continued) | |
| Mega Financial | | | 3,646,556 | | | $ | 2,677,187 | | |
| President Chain Store | | | 1,139,549 | | | | 2,750,105 | | |
| Synnex Technology International | | | 977,160 | | | | 1,231,966 | | |
| Taiwan Semiconductor Manufacturing | | | 3,516,028 | | | | 7,219,045 | | |
| † United Microelectronics | | | 3,777,367 | | | | 2,353,069 | | |
| | | | | | | | 31,723,031 | | |
| Thailand–2.70% | |
| Advanced Info Service Class F | | | 804,800 | | | | 1,770,787 | | |
| Kasikornbank–Foreign | | | 194,537 | | | | 350,585 | | |
| Kasikornbank NVDR | | | 1,200,363 | | | | 2,140,411 | | |
| Land & Houses NVDR | | | 6,629,101 | | | | 1,209,488 | | |
| Siam Cement NVDR | | | 566,170 | | | | 3,914,390 | | |
| | | | | | | | 9,385,661 | | |
| Turkey–1.74% | |
| Turk Sise ve Cam Fabrikalar | | | 418,123 | | | | 1,459,829 | | |
| Turkiye Is Bankasi Class C | | | 884,384 | | | | 4,005,500 | | |
| Yazicilar | | | 22,733 | | | | 572,660 | | |
| | | | | | | | 6,037,989 | | |
| United Kingdom–0.41% | |
| † Griffin Mining | | | 677,756 | | | | 1,426,830 | | |
| | | | | | | | 1,426,830 | | |
| United States–1.83% | |
| † Amkor Technology | | | 167,800 | | | | 1,567,252 | | |
| ConocoPhillips | | | 45,500 | | | | 3,273,725 | | |
Freeport-McMoRan Copper & Gold
Class B | | | 27,000 | | | | 1,504,710 | | |
| | | | | | | | 6,345,687 | | |
Total Common Stock
(cost $259,442,648) | | | | | | | 312,666,948 | | |
| PREFERRED STOCK–6.70% | |
| Brazil–3.89% | |
| AES Tiete | | | 54,200,000 | | | | 1,580,463 | | |
| Centrais Elecricas | | | 97,749,366 | | | | 2,191,526 | | |
| Companhia Vale do Rio Doce Class A | | | 163,840 | | | | 4,148,722 | | |
| Investimentos Itau | | | 843,628 | | | | 4,311,921 | | |
| Ultrapar Participacoes | | | 55,662 | | | | 1,276,331 | | |
| | | | | | | | 13,508,963 | | |
| Republic of Korea–2.81% | |
| Hyundai Motor | | | 108,292 | | | | 4,407,058 | | |
| Samsung Electronics | | | 10,395 | | | | 5,360,764 | | |
| | | | | | | | 9,767,822 | | |
Total Preferred Stock
(cost $17,668,697) | | | | | | | 23,276,785 | | |
| EXCHANGE TRADED FUNDS–0.45% | |
| iShares MSCI Taiwan Index Fund | | | 107,700 | | | | 1,562,727 | | |
Total Exchange Traded Funds
(cost $1,602,576) | | | | | | | 1,562,727 | | |
Emerging Markets Series- 6
Delaware VIP Emerging Markets Series
Statement of Net Assets (continued)
| | | Principal
Amount | | Market
Value
(U.S. $) | |
| REPURCHASE AGREEMENTS–2.57% | |
With BNP Paribas 4.80% 1/2/07
(dated 12/29/06, to be repurchased
at $3,400,813, collateralized by
$3,556,000 U.S. Treasury Bills due
6/28/07, market value $3,470,236) | | $ | 3,399,000 | | | $ | 3,399,000 | | |
With Cantor Fitzgerald 4.82% 1/2/07
(dated 12/29/06, to be repurchased
at $4,086,187, collateralized by
$352,000 U.S. Treasury Notes
4.00% due 6/15/09, market value
$347,191, $2,188,000 U.S. Treasury
Notes 6.125% due 8/15/07, market
value $2,253,023 and $1,458,000
U.S. Treasury Notes 6.50% due 2/15/10,
market value $1,568,815) | | | 4,084,000 | | | | 4,084,000 | | |
With UBS Warburg 4.75% 1/2/07
(dated 12/29/06, to be repurchased
at $1,458,770, collateralized by
$1,506,000 U.S. Treasury Bills due
3/29/07, market value $1,488,910) | | | 1,458,000 | | | | 1,458,000 | | |
Total Repurchase Agreements
(cost $8,941,000) | | | | | | | 8,941,000 | | |
| TOTAL MARKET VALUE OF SECURITIES–99.75% (cost $287,654,921) | | $ | 346,447,460 | | |
| RECEIVABLES AND OTHER ASSETS NET OF LIABILITIES–0.25% | | | 861,943 | | |
| NET ASSETS APPLICABLE TO 15,633,591 SHARES OUTSTANDING–100.00% | | $ | 347,309,403 | | |
| NET ASSET VALUE–DELAWARE VIP EMERGING MARKETS SERIES STANDARD CLASS ($189,572,589 / 8,523,032 Shares) | | $ | 22.24 | | |
| NET ASSET VALUE–DELAWARE VIP EMERGING MARKETS SERIES SERVICE CLASS ($157,736,814 / 7,110,559 Shares) | | $ | 22.18 | | |
| COMPONENTS OF NET ASSETS AT DECEMBER 31, 2006: | |
| Shares of beneficial interest (unlimited authorization-no par) | | $ | 253,246,168 | | |
| Undistributed net investment income | | | 5,402,981 | | |
| Accumulated net realized gain on investments | | | 29,867,080 | | |
| Net unrealized appreciation of investments and foreign currencies | | | 58,793,174 | | |
| Total net assets | | $ | 347,309,403 | | |
† Non-income producing security for the year ended December 31, 2006.
# Security exempt from registration under Rule 144A of the Securities Act of 1933, as amended. At December 31, 2006, the aggregate amount of Rule 144A securities equaled $1,272,885, which represented 0.37% of Series' net assets. See Note 9 in "Notes to Financial Statements."
Æ Securities have been classified by country of origin.
o Securities listed and traded on the Hong Kong Stock Exchange. These securities have significant business operations in China.
Summary of Abbreviations:
ADR – American Depositary Receipts
GDR – Global Depositary Receipts
NVDR – Non-Voting Depositary Receipts
See accompanying notes
Emerging Markets Series- 7
Delaware VIP Trust — Delaware VIP Emerging Markets Series
Statement of Operations
Year Ended December 31, 2006
| INVESTMENT INCOME: | |
| Dividends | | $ | 11,255,632 | | |
| Interest | | | 392,498 | | |
| Foreign tax withheld | | | (1,053,824 | ) | |
| | | | 10,594,306 | | |
| EXPENSES: | |
| Management fees | | | 3,413,665 | | |
| Custodian fees | | | 518,264 | | |
| Distribution expenses – Service Class | | | 363,170 | | |
| Accounting and administration expenses | | | 109,237 | | |
| Trustees' fees and benefits | | | 50,799 | | |
| Reports and statements to shareholders | | | 32,961 | | |
| Legal fees | | | 28,682 | | |
| Dividend disbursing and transfer agent fees and expenses | | | 27,309 | | |
| Audit and tax | | | 22,555 | | |
| Insurance fees | | | 15,859 | | |
| Consulting fees | | | 8,245 | | |
| Dues and services | | | 7,250 | | |
| Pricing fees | | | 7,181 | | |
| Taxes (other than taxes on income) | | | 2,800 | | |
| Trustees' expenses | | | 1,570 | | |
| Registration fees | | | 534 | | |
| | | | 4,610,081 | | |
| Less expenses absorbed or waived | | | (130,109 | ) | |
| Less waiver of distribution expenses – Service Class | | | (60,528 | ) | |
| Total operating expenses | | | 4,419,444 | | |
| NET INVESTMENT INCOME | | | 6,174,862 | | |
NET REALIZED AND UNREALIZED GAIN (LOSS)
ON INVESTMENTS AND FOREIGN CURRENCIES: | |
| Net realized gain (loss) on: | |
| Investments | | | 30,022,641 | | |
| Foreign currencies | | | (198,994 | ) | |
| Net realized gain | | | 29,823,647 | | |
Net change in unrealized appreciation/depreciation
of investments and foreign currencies | | | 30,008,281 | | |
NET REALIZED AND UNREALIZED GAIN ON
INVESTMENTS AND FOREIGN CURRENCIES | | | 59,831,928 | | |
NET INCREASE IN NET ASSETS RESULTING
FROM OPERATIONS | | $ | 66,006,790 | | |
See accompanying notes
Delaware VIP Trust — Delaware VIP Emerging Markets Series
Statements of Changes in Net Assets
| | | Year Ended | |
| | | 12/31/06 | | 12/31/05 | |
INCREASE IN NET
ASSETS FROM OPERATIONS: | |
| Net investment income | | $ | 6,174,862 | | | $ | 2,705,766 | | |
Net realized gain on investments and
foreign currencies | | | 29,823,647 | | | | 6,690,267 | | |
Net change in unrealized appreciation/
depreciation of investments and
foreign currencies | | | 30,008,281 | | | | 19,673,561 | | |
Net increase in net assets resulting
from operations | | | 66,006,790 | | | | 29,069,594 | | |
DIVIDENDS AND DISTRIBUTIONS
TO SHAREHOLDERS FROM: | |
| Net investment income: | |
| Standard Class | | | (1,865,697 | ) | | | (185,268 | ) | |
| Service Class | | | (1,148,824 | ) | | | (26,959 | ) | |
| Net realized gain on investments: | |
| Standard Class | | | (3,946,372 | ) | | | (653,887 | ) | |
| Service Class | | | (2,908,845 | ) | | | (255,396 | ) | |
| | | | (9,869,738 | ) | | | (1,121,510 | ) | |
| CAPITAL SHARE TRANSACTIONS: | |
| Proceeds from shares sold: | |
| Standard Class | | | 90,207,572 | | | | 79,478,798 | | |
| Service Class | | | 89,316,167 | | | | 66,615,479 | | |
Net asset value of shares issued upon
reinvestment of dividends
and distributions: | |
| Standard Class | | | 5,812,069 | | | | 839,155 | | |
| Service Class | | | 4,057,669 | | | | 282,355 | | |
| | | | 189,393,477 | | | | 147,215,787 | | |
| Cost of shares repurchased: | |
| Standard Class | | | (58,049,374 | ) | | | (14,800,249 | ) | |
| Service Class | | | (39,040,035 | ) | | | (10,506,016 | ) | |
| | | | (97,089,409 | ) | | | (25,306,265 | ) | |
Increase in net assets derived from
capital share transactions | | | 92,304,068 | | | | 121,909,522 | | |
| NET INCREASE IN NET ASSETS | | | 148,441,120 | | | | 149,857,606 | | |
| NET ASSETS: | |
| Beginning of year | | | 198,868,283 | | | | 49,010,677 | | |
End of year (including undistributed
net investment income of $5,402,981
and $2,425,952 , respectively) | | $ | 347,309,403 | | | $ | 198,868,283 | | |
See accompanying notes
Emerging Markets Series-8
Delaware VIP Trust — Delaware VIP Emerging Markets Series
Financial Highlights
Selected data for each share of the Series outstanding throughout each period were as follows:
| | | Delaware VIP Emerging Markets Series Standard Class | |
| | | Year Ended | |
| | | 12/31/06 | | 12/31/05 | | 12/31/04 | | 12/31/03 | | 12/31/02 | |
| Net asset value, beginning of period | | $ | 18.200 | | | $ | 14.500 | | | $ | 11.180 | | | $ | 6.770 | | | $ | 6.610 | | |
| Income from investment operations: | |
| Net investment income1 | | | 0.457 | | | | 0.412 | | | | 0.263 | | | | 0.210 | | | | 0.215 | | |
Net realized and unrealized gain on investments and
foreign currencies | | | 4.340 | | | | 3.519 | | | | 3.388 | | | | 4.410 | | | | 0.137 | | |
| Total from investment operations | | | 4.797 | | | | 3.931 | | | | 3.651 | | | | 4.620 | | | | 0.352 | | |
| Less dividends and distributions from: | |
| Net investment income | | | (0.243 | ) | | | (0.051 | ) | | | (0.331 | ) | | | (0.210 | ) | | | (0.192 | ) | |
| Net realized gain on investments | | | (0.514 | ) | | | (0.180 | ) | | | – | | | | – | | | | – | | |
| Total dividends and distributions | | | (0.757 | ) | | | (0.231 | ) | | | (0.331 | ) | | | (0.210 | ) | | | (0.192 | ) | |
| Net asset value, end of period | | $ | 22.240 | | | $ | 18.200 | | | $ | 14.500 | | | $ | 11.180 | | | $ | 6.770 | | |
| Total return2 | | | 27.13 | % | | | 27.49 | % | | | 33.47 | % | | | 70.54 | % | | | 5.17 | % | |
| Ratios and supplemental data: | |
| Net assets, end of period (000 omitted) | | $ | 189,572 | | | $ | 120,292 | | | $ | 36,966 | | | $ | 14,304 | | | $ | 12,651 | | |
| Ratio of expenses to average net assets | | | 1.51 | % | | | 1.47 | % | | | 1.50 | % | | | 1.49 | % | | | 1.43 | % | |
Ratio of expenses to average net assets prior to expense
limitation and expenses paid indirectly | | | 1.56 | % | | | 1.57 | % | | | 1.63 | % | | | 1.58 | % | | | 1.46 | % | |
| Ratio of net investment income to average net assets | | | 2.37 | % | | | 2.55 | % | | | 2.15 | % | | | 2.64 | % | | | 3.15 | % | |
Ratio of net investment income to average net assets prior
to expense limitation and expenses paid indirectly | | | 2.32 | % | | | 2.45 | % | | | 2.02 | % | | | 2.55 | % | | | 3.12 | % | |
| Portfolio turnover | | | 67 | % | | | 18 | % | | | 34 | % | | | 71 | % | | | 39 | % | |
1The average shares outstanding method has been applied for per share information.
2Total investment return is based on the change in net asset value of a share during the period and assumes reinvestment of dividends and distributions at net asset value. Total investment return reflects waivers and payment of fees by the manager. Performance would have been lower had the expense limitation not been in effect.
See accompanying notes
Emerging Markets Series- 9
Delaware VIP Emerging Markets Series
Financial Highlights (continued)
Selected data for each share of the Series outstanding throughout each period were as follows:
| | | Delaware VIP Emerging Markets Series Service Class | |
| | | Year Ended | |
| | | 12/31/06 | | 12/31/05 | | 12/31/04 | | 12/31/03 | | 12/31/02 | |
| Net asset value, beginning of period | | $ | 18.160 | | | $ | 14.480 | | | $ | 11.170 | | | $ | 6.770 | | | $ | 6.610 | | |
| Income from investment operations: | |
| Net investment income1 | | | 0.409 | | | | 0.372 | | | | 0.231 | | | | 0.197 | | | | 0.204 | | |
Net realized and unrealized gain on investments and
foreign currencies | | | 4.328 | | | | 3.507 | | | | 3.397 | | | | 4.402 | | | | 0.138 | | |
| Total from investment operations | | | 4.737 | | | | 3.879 | | | | 3.628 | | | | 4.599 | | | | 0.342 | | |
| Less dividends and distributions from: | |
| Net investment income | | | (0.203 | ) | | | (0.019 | ) | | | (0.318 | ) | | | (0.199 | ) | | | (0.182 | ) | |
| Net realized gain on investments | | | (0.514 | ) | | | (0.180 | ) | | | – | | | | – | | | | – | | |
| Total dividends and distributions | | | (0.717 | ) | | | (0.199 | ) | | | (0.318 | ) | | | (0.199 | ) | | | (0.182 | ) | |
| Net asset value, end of period | | $ | 22.180 | | | $ | 18.160 | | | $ | 14.480 | | | $ | 11.170 | | | $ | 6.770 | | |
| Total return2 | | | 26.81 | % | | | 27.11 | % | | | 33.26 | % | | | 70.10 | % | | | 5.03 | % | |
| Ratios and supplemental data: | |
| Net assets, end of period (000 omitted) | | $ | 157,737 | | | $ | 78,576 | | | $ | 12,045 | | | $ | 144 | | | $ | 652 | | |
| Ratio of expenses to average net assets | | | 1.76 | % | | | 1.72 | % | | | 1.75 | % | | | 1.71 | % | | | 1.58 | % | |
Ratio of expenses to average net assets prior to expense
limitation and expenses paid indirectly | | | 1.86 | % | | | 1.87 | % | | | 1.93 | % | | | 1.83 | % | | | 1.61 | % | |
| Ratio of net investment income to average net assets | | | 2.12 | % | | | 2.30 | % | | | 1.90 | % | | | 2.42 | % | | | 3.00 | % | |
Ratio of net investment income to average net assets prior
to expense limitation and expenses paid indirectly | | | 2.02 | % | | | 2.15 | % | | | 1.72 | % | | | 2.30 | % | | | 2.97 | % | |
| Portfolio turnover | | | 67 | % | | | 18 | % | | | 34 | % | | | 71 | % | | | 39 | % | |
1The average shares outstanding method has been applied for per share information.
2Total investment return is based on the change in net asset value of a share during the period and assumes reinvestment of dividends and distributions at net asset value. Total investment return reflects waivers and payment of fees by the manager and distributor, as applicable. Performance would have been lower had the expense limitation and waiver not been in effect.
See accompanying notes
Emerging Markets Series- 10
Delaware VIP Trust — Delaware VIP Emerging Markets Series
Notes to Financial Statements
December 31, 2006
Delaware VIP Trust (the "Trust") is organized as a Delaware statutory trust and offers 15 series: Delaware VIP Balanced Series, Delaware VIP Capital Reserves Series, Delaware VIP Cash Reserve Series, Delaware VIP Diversified Income Series, Delaware VIP Emerging Markets Series, Delaware VIP Global Bond Series, Delaware VIP Growth Opportunities Series, Delaware VIP High Yield Series, Delaware VIP International Value Equity Series, Delaware VIP REIT Series, Delaware VIP Select Growth Series, Delaware VIP Small Cap Value Series, Delaware VIP Trend Series, Delaware VIP U.S. Growth Series and Delaware VIP Value Series. These financial statements and the related notes pertain to Delaware VIP Emerging Markets Series (the "Series"). The Trust is an open-end investment company. The Series is considered non-diversified under the Investment Company Act of 1940, as amended, and offers Standard Class and Service Class shares. The Standard Class shares do not carry a 12b-1 fee and the Service Class shares carry a 12b-1 fee. The shares of the Series are sold only to separate accounts of life insurance companies.
The investment objective of the Series is to seek long-term capital appreciation.
1. Significant Accounting Policies
The following accounting policies are in accordance with U.S. generally accepted accounting principles and are consistently followed by the Series.
Security Valuation—Equity securities, except those traded on the Nasdaq Stock Market, Inc. (Nasdaq), are valued at the last quoted sales price as of the time of the regular close of the New York Stock Exchange (NYSE) on the valuation date. Securities traded on the Nasdaq are valued in accordance with the Nasdaq Official Closing Price, which may not be the last sales price. If on a particular day an equity security does not trade, then the mean between the bid and asked prices will be used. Securities listed on a foreign exchange are valued at the last quoted sales price before the Series is valued. Short-term debt securities having less than 60 days to maturity are valued at amortized cost, which approximates market value. Foreign currency exchange contracts are valued at the mean between the bid and asked prices of the contracts and are marked-to-market dail y. Interpolated values are derived when the settlement date of the contract is an interim date for which quotations are not available. Other securities and assets for which market quotations are not readily available are valued at fair value as determined in good faith under the direction of the Series' Board of Trustees. In determining whether market quotations are readily available or fair valuation will be used, various factors will be taken into consideration, such as market closures, aftermarket trading, or significant events after local market trading (e.g., government actions or pronouncements, trading volume or volatility on markets, exchanges among dealers, or news events).
In September 2006, the Financial Accounting Standards Board (FASB) issued FASB Statement No. 157 "Fair Value Measurements" (Statement 157). Statement 157 establishes a framework for measuring fair value in generally accepted accounting principles, clarifies the definition of fair value within that framework, and expands disclosures about the use of fair value measurements. Statement 157 is intended to increase consistency and comparability among fair value estimates used in financial reporting. Statement 157 is effective for fiscal years beginning after November 15, 2007. Management does not expect the adoption of Statement 157 to have an impact on the amounts reported in the financial statements.
Federal Income Taxes—The Series intends to continue to qualify for federal income tax purposes as a regulated investment company and make the requisite distributions to shareholders. Accordingly, no provision for federal income taxes has been made in the financial statements.
On July 13, 2006, FASB released FASB Interpretation No. 48 "Accounting for Uncertainty in Income Taxes" (FIN 48). FIN 48 provides guidance for how uncertain tax positions should be recognized, measured, presented and disclosed in the financial statements. FIN 48 requires the evaluation of tax positions taken or expected to be taken in the course of preparing the Series' tax returns to determine whether the tax positions are "more-likely-than-not" of being sustained by the applicable tax authority. Tax positions not deemed to meet the more-likely-than-not threshold would be recorded as a tax benefit or expense in the current year. Adoption of FIN 48 is required for fiscal years beginning after December 15, 2006 and is to be applied to all open tax years as of the effective date. Recent SEC guidance allows implementing FIN 48 in Series net asset value calculations as late as the Series' last net asset value calculation in the first required fi nancial statement reporting period. As a result, the Series will incorporate FIN 48 in its semiannual report on June 30, 2007. Although the Series' tax positions are currently being evaluated, management does not expect the adoption of FIN 48 to have a material impact on the Series' financial statements.
Class Accounting—Investment income, common expenses and realized and unrealized gain (loss) on investments are allocated to the classes of the Series on the basis of daily net assets of each class. Distribution expenses relating to a specific class are charged directly to that class.
Repurchase Agreements—The Series may invest in a pooled cash account along with other members of the Delaware Investments® Family of Funds pursuant to an exemptive order issued by the Securities and Exchange Commission. The aggregate daily balance of the pooled cash account is invested in repurchase agreements secured by obligations of the U.S. government. The respective collateral is held by the Series' custodian bank until the maturity of the respective repurchase agreements. Each repurchase agreement is at least 102% collateralized. However, in the event of default or bankruptcy by the counterparty to the agreement, realization of the collateral may be subject to legal proceedings.
Foreign Currency Transactions—Transactions denominated in foreign currencies are recorded at the prevailing exchange rates on the valuation date. The value of all assets and liabilities denominated in foreign currencies are translated into U.S. dollars at the exchange rate of such currencies against the U.S. dollar daily. Transaction gains or losses resulting from changes in exchange rates during the reporting period or upon settlement of the foreign currency transaction are reported in operations for the current period. The Series does not isolate that portion of realized gains and losses on investments which are due to changes in foreign exchange rates from that which are due to changes in market prices. The Series reports certain foreign currency related transactions as components of realized gains (losses) for financial reporting purposes, where such comp onents are treated as ordinary income (loss) for federal income tax purposes.
Use of Estimates—The preparation of financial statements in conformity with U.S. generally accepted accounting principles requires management to make estimates and assumptions that affect the reported amounts of assets and liabilities at the date of the financial statements and the reported amounts of revenues and expenses during the reporting period. Actual results could differ from those estimates.
Emerging Markets Series- 11
Delaware VIP Emerging Markets Series
Notes to Financial Statements (continued)
1. Significant Accounting Policies (continued)
Other—Expenses directly attributable to the Series are charged directly to the Series. Other expenses common to various funds within the Delaware Investments® Family of Funds are generally allocated amongst such funds on the basis of average net assets. Management fees and some other expenses are paid monthly. Security transactions are recorded on the date the securities are purchased or sold (trade date) for financial reporting purposes. Costs used in calculating realized gains and losses on the sale of investment securities are those of the specific securities sold. Dividend income is recorded on the ex-dividend date and interest income is recorded on the accrual basis. Foreign dividends are also recorded on the ex-dividend date or as soon after the ex-dividend date that the Series is aware of such dividends, net of all non-rebatable tax withholdings. W ithholding taxes on foreign dividends have been recorded in accordance with the Series' understanding of the applicable country's tax rules and rates.
The Series declares and pays dividends from net investment income and distributions from net realized gain on investments, if any, following the close of the fiscal year.
2. Investment Management, Administration Agreements and Other Transactions with Affiliates
In accordance with the terms of its investment management agreement, the Series pays Delaware Management Company (DMC), a series of Delaware Management Business Trust and the investment manager, an annual fee which is calculated daily at the rate of 1.25% on the first $500 million of average daily net assets of the Series, 1.20% on the next $500 million, 1.15% on the next $1.5 billion, and 1.10% on average daily net assets in excess of $2.5 billion.
Prior to September 25, 2006, Mondrian Investment Partners Ltd. ("Mondrian") (the "Sub-Advisor") was responsible for the day-to-day management of the Series' investment portfolio. For these services, DMC, not the Series, paid the Sub-Advisor 0.20% of the Series' average daily net assets. Mondrian resigned as sub-advisor to the Series effective September 25, 2006.
DMC has contractually agreed to waive that portion, if any, of its management fee and reimburse the Series to the extent necessary to ensure that annual operating expenses, exclusive of taxes, interest, brokerage commissions, distribution fees, certain insurance costs and extraordinary expenses, do not exceed 1.50% of average daily net assets of the Series through April 30, 2007.
Delaware Service Company, Inc. (DSC), an affiliate of DMC, provides accounting, administration, dividend disbursing and transfer agent services. The Series pays DSC a monthly fee computed at the annual rate of 0.04% of the Series' average daily net assets for accounting and administrative services. The Series pays DSC a monthly fee based on average net assets for dividend disbursing and transfer agent services.
Pursuant to a distribution agreement and distribution plan, the Series pays Delaware Distributors, L.P. (DDLP), the distributor and an affiliate of DMC, an annual distribution and service fee not to exceed 0.30% of the average daily net assets of the Service Class shares. DDLP has contracted to waive distribution and service fees through April 30, 2007 in order to prevent distribution and service fees of the Service Class shares from exceeding 0.25% of average daily net assets. Standard Class shares pay no distribution and service expenses.
At December 31, 2006, the Series had liabilities payable to affiliates as follows:
Investment
Management
Fee Payable to
DMC | | Dividend Disbursing,
Transfer Agent, Accounting
and Administration Fees
and Other Expenses
Payable to DSC | | Distribution
Fee Payable
To DDLP | | Other
Expenses
Payable
to DMC
and Affiliates* | |
| $ | 336,441 | | | $ | 15,664 | | | $ | 32,075 | | | $ | 21,756 | | |
*DMC as part of its administrative services, pays operating expenses on behalf of the Series and is reimbursed on a periodic basis. Such expenses include items such as printing of shareholder reports, fees for audit, legal and tax services, custodian fees and trustees' fees.
As provided in the investment management agreement, the Series bears the cost of certain legal and tax services, including internal legal and tax services provided to the Series by DMC and/or its affiliates' employees. For the year ended December 31, 2006, the Series was charged $13,230 for internal legal and tax services provided by DMC and/or its affiliates' employees.
Trustees' fees and benefits include expenses accrued by the Series for each Trustee's retainer, per meeting fees and retirement benefits. Independent Trustees with over five years of uninterrupted service are eligible to participate in a retirement plan that provides for the payment of benefits upon retirement. The amount of the retirement benefit is based on factors set forth in the plan, including the number of years of service. On November 16, 2006, the Board of Trustees unanimously voted to terminate the retirement plan. Payments equal to the net present value of the earned benefits will be made in 2007 to those independent trustees so entitled. The retirement benefit payout for the Series is $35,828. Certain officers of DMC, DSC and DDLP are officers and/or trustees of the Trust. These officers and trustees are paid no compensation by the Series.
Emerging Markets Series- 12
Delaware VIP Emerging Markets Series
Notes to Financial Statements (continued)
3. Investments
For the year ended December 31, 2006, the Series made purchases and sales of investment securities other than short-term investments as follows:
| Purchases | | $ | 265,914,820 | | |
| Sales | | | 175,365,177 | | |
At December 31, 2006, the cost of investments for federal income tax purposes and unrealized appreciation (depreciation) for the Series were as follows:
Cost of
Investments | | Aggregate
Unrealized
Appreciation | | Aggregate
Unrealized
Depreciation | | Net Unrealized
Appreciation | |
| $ | 288,969,245 | | | $ | 60,468,479 | | | $ | (2,990,264 | ) | | $ | 57,478,215 | | |
4. Dividend and Distribution Information
Income and long-term capital gain distributions are determined in accordance with federal income tax regulations, which may differ from U.S. generally accepted accounting principles. Additionally, gains (losses) on foreign currency transactions and net short-term gains on sales of investment securities are treated as ordinary income for federal income tax purposes. The tax character of dividends and distributions paid during the years ended December 31, 2006 and 2005 was as follows:
| | | Year
Ended
12/31/06 | | Year
Ended
12/31/05 | |
| Ordinary income | | $ | 5,745,436 | | | $ | 427,583 | | |
| Long-term capital gain | | | 4,124,302 | | | | 693,927 | | |
| | | $ | 9,869,738 | | | $ | 1,121,510 | | |
5. Components of Net Assets on a Tax Basis
As of December 31, 2006, the components of net assets on a tax basis were as follows:
| Shares of beneficial interest | | $ | 253,246,168 | | |
| Undistributed ordinary income | | | 13,343,257 | | |
| Undistributed long-term capital gains | | | 23,241,128 | | |
Unrealized appreciation of investments
and foreign currencies | | | 57,478,850 | | |
| Net assets | | $ | 347,309,403 | | |
The differences between book basis and tax basis components of net assets are primarily attributable to tax deferral of losses on wash sales and tax recognition of unrealized gain on investments in passive foreign investment companies.
For financial reporting purposes, capital accounts are adjusted to reflect the tax character of permanent book/tax differences. Reclassifications are primarily due to tax treatment of gain (loss) on foreign currency transactions and capital gain tax. Results of operations and net assets were not affected by these reclassifications. For the year ended December 31, 2006, the Series recorded the following reclassifications:
Undistributed
Net
Investment Income | | Accumulated
Net Realized
Gain (Loss) | |
| $ | (183,312 | ) | | $ | 183,312 | | |
Emerging Markets Series-13
Delaware VIP Emerging Markets Series
Notes to Financial Statements (continued)
6. Capital Shares
Transactions in capital shares were as follows:
| | | Year
Ended
12/31/06 | | Year
Ended
12/31/05 | |
| Shares sold: | |
| Standard Class | | | 4,700,048 | | | | 4,946,468 | | |
| Service Class | | | 4,637,136 | | | | 4,136,774 | | |
Shares issued upon reinvestment of dividends
and distributions: | |
| Standard Class | | | 310,143 | | | | 56,969 | | |
| Service Class | | | 216,640 | | | | 19,169 | | |
| | | | 9,863,967 | | | | 9,159,380 | | |
| Shares repurchased: | |
| Standard Class | | | (3,097,082 | ) | | | (942,342 | ) | |
| Service Class | | | (2,070,320 | ) | | | (660,948 | ) | |
| | | | (5,167,402 | ) | | | (1,603,290 | ) | |
| Net increase | | | 4,696,565 | | | | 7,556,090 | | |
7. Line of Credit
The Series, along with certain other funds in the Delaware Investments® Family of Funds (the "Participants"), participates in a $225,000,000 revolving line of credit facility to be used for temporary or emergency purposes as an additional source of liquidity to fund redemptions of investor shares. The Participants are charged an annual commitment fee, which is allocated across the Participants on the basis of each Participant's allocation of the entire facility. The Participants may borrow up to a maximum of one third of their net assets under the agreement. The Series had no amounts outstanding as of December 31, 2006, or at any time during the year then ended.
8. Foreign Currency Exchange Contracts
The Series may enter into foreign currency exchange contracts as a way of managing foreign exchange rate risk. The Series may enter into these contracts to fix the U.S. dollar value of a security that it has agreed to buy or sell for the period between the date the trade was entered into and the date the security is delivered and paid for. The Series may also use these contracts to hedge the U.S. dollar value of securities it already owns that are denominated in foreign currencies. The change in market value is recorded as an unrealized gain or loss. When the contract is closed, a realized gain or loss is recorded equal to the difference between the value of the contract at the time it was opened and the value at the time it was closed.
The use of foreign currency exchange contracts does not eliminate fluctuations in the underlying prices of the securities, but does establish a rate of exchange that can be achieved in the future. Although foreign currency exchange contracts limit the risk of loss due to a decline in the value of the hedged currency, they also limit any potential gain that might result should the value of the currency increase. In addition, the Series could be exposed to risks if the counterparties to the contracts are unable to meet the terms of their contracts. There were no foreign currency exchange contracts outstanding at December 31, 2006.
9. Credit and Market Risk
Some countries in which the Series may invest require governmental approval for the repatriation of investment income, capital or the proceeds of sales of securities by foreign investors. In addition, if there is deterioration in a country's balance of payments or for other reasons, a country may impose temporary restrictions on foreign capital remittances abroad.
The securities exchanges of certain foreign markets are substantially smaller, less liquid and more volatile than the major securities markets in the United States. Consequently, acquisition and disposition of securities by the Series may be inhibited. In addition, a significant portion of the aggregate market value of equity securities listed on the major securities exchanges in emerging markets are held by a smaller number of investors. This may limit the number of shares available for acquisition or disposition by the Series.
The Series may invest up to 10% of its total assets in illiquid securities, which may include securities with contractual restrictions on resale, securities exempt from registration under Rule 144A of the Securities Act of 1933, as amended, and other securities which may not be readily marketable. The relative illiquidity of these securities may impair the Series from disposing of them in a timely manner and at a fair price when it is necessary or desirable to do so. While maintaining oversight, the Series' Board of Trustees has delegated to DMC the day-to-day functions of determining whether individual Rule 144A securities are liquid for purposes of the Series' limitation on investments in illiquid assets. At December 31, 2006, no securities have been determined to be illiquid under the Series' Liquidity Procedures. Rule 144A securities have been identified on the Statement of Net Assets.
Emerging Markets Series-14
Delaware VIP Emerging Markets Series
Notes to Financial Statements (continued)
10. Contractual Obligations
The Series enters into contracts in the normal course of business that contain a variety of indemnifications. The Series' maximum exposure under these arrangements is unknown. However, the Series has not had prior claims or losses pursuant to these contracts. Management has reviewed the Series' existing contracts and expects the risk of loss to be remote.
11. Tax Information (Unaudited)
For the fiscal year ended December 31, 2006, the Series designates dividends and distributions paid during the year as follows:
(A)
Long-Term
Capital Gain
Distributions
(Tax Basis) | | (B)
Ordinary
Income
Distributions
(Tax Basis) | | Total
Distributions
(Tax Basis) | |
| | 42 | % | | | 58 | % | | | 100 | % | |
(A) and (B) are based on a percentage of the Series' total distributions.
The Delaware VIP Emerging Markets Series intends to pass through foreign tax credits in the maximum amount of $526,106. The gross foreign source income earned during the fiscal year 2006 by Delaware VIP Emerging Markets Series was $11,170,724.
Emerging Markets Series- 15
Delaware VIP Trust — Delaware VIP Emerging Markets Series
Report of Independent Registered Public Accounting Firm
To the Shareholders and Board of Trustees
Delaware VIP Trust–Delaware VIP Emerging Markets Series
We have audited the accompanying statement of net assets of the Delaware VIP Emerging Markets Series (one of the series constituting Delaware VIP Trust) (the "Series") as of December 31, 2006, and the related statement of operations for the year then ended, the statements of changes in net assets for each of the two years in the period then ended, and the financial highlights for each of the five years in the period then ended. These financial statements and financial highlights are the responsibility of the Series' management. Our responsibility is to express an opinion on these financial statements and financial highlights based on our audits.
We conducted our audits in accordance with the standards of the Public Company Accounting Oversight Board (United States). Those standards require that we plan and perform the audit to obtain reasonable assurance about whether the financial statements and financial highlights are free of material misstatement. We were not engaged to perform an audit of the Series' internal control over financial reporting. Our audits included consideration of internal control over financial reporting as a basis for designing audit procedures that are appropriate in the circumstances, but not for the purpose of expressing an opinion on the effectiveness of the Series' internal control over financial reporting. Accordingly, we express no such opinion. An audit also includes examining, on a test basis, evidence supporting the amounts and disclosures in the financial statements and financial highlights, assessing the accounting principles used and significant es timates made by management, and evaluating the overall financial statement presentation. Our procedures included confirmation of securities owned as of December 31, 2006, by correspondence with the custodian and brokers or by other appropriate auditing procedures where replies from brokers were not received. We believe that our audits provide a reasonable basis for our opinion.
In our opinion, the financial statements and financial highlights referred to above present fairly, in all material respects, the financial position of the Delaware VIP Emerging Markets Series of Delaware VIP Trust at December 31, 2006, the results of its operations for the year then ended, the changes in its net assets for each of the two years in the period then ended, and its financial highlights for each of the five years in the period then ended, in conformity with U.S. generally accepted accounting principles.

Philadelphia, Pennsylvania
February 14, 2007
The Series files its complete schedule of portfolio holdings with the Securities and Exchange Commission for the first and third quarters of each fiscal year on Form N-Q. The Series' Forms N-Q, as well as a description of the policies and procedures that the Series uses to determine how to vote proxies (if any) relating to portfolio securities is available without charge (i) upon request, by calling 800-523-1918; (ii) on the Series' website at http://www.delawareinvestments.com; and (iii) on the Commission's website at http://www.sec.gov. The Series' Forms N-Q may be reviewed and copied at the Commission's Public Reference Room in Washington, DC; information on the operation of the Public Reference Room may be obtained by calling 1-800-SEC-0330.
Information (if any) regarding how the Series voted proxies relating to portfolio securities during the most recently disclosed 12-month period ended June 30 is available without charge (i) through the Series' website at http://www.delawareinvestments.com; and (ii) on the Commission's website at http://www.sec.gov.
Emerging Markets Series- 16
Delaware Investments® Family of Funds
board of trustees/directors and officers addendum
A mutual fund is governed by a Board of Trustees/Directors ("Trustees"), which has oversight responsibility for the management of a fund's business affairs. Trustees establish procedures and oversee and review the performance of the investment manager, the distributor, and others who perform services for the fund. The independent fund trustees, in particular, are advocates for shareholder interests. Each trustee has served in that capacity since he or she was elected to or appointed to the Board of Trustees, and will continue to serve until his or her retirement or the election of a new trustee in his or her place. The following is a list of the Trustees and Officers with certain background and related information.
Name,
Address,
and Birth Date | | Position(s)
Held with
Fund(s) | | Length of Time
Served | | Principal
Occupation(s)
During
Past 5 Years | | Number of
Portfolios in Fund
Complex Overseen
by Trustee
or Officer | | Other
Directorships
Held by
Trustee
or Officer | |
| interested trustees | | | | | | | | | | | | | |
|
Patrick P. Coyne1
2005 Market Street
Philadelphia, PA
19103
April 14, 1963 | | Chairman,
President,
Chief Executive
Officer, and
Trustee | | Chairman and Trustee
since August 16, 2006
President and
Chief Executive Officer
since August 1, 2006 | | Patrick P. Coyne has served in
various executive capacities
at different times at
Delaware Investments.2 | | | 84 | | | None | |
|
| independent trustees | | | | | | | | | | | | | |
|
Thomas L. Bennett
2005 Market Street
Philadelphia, PA
19103
October 4, 1947 | | Trustee | | Since
March 2005 | | Private Investor –
(March 2004 – Present)
Investment Manager –
Morgan Stanley & Co.
(January 1984 – March 2004) | | | 84 | | | None | |
|
John A. Fry
2005 Market Street
Philadelphia, PA
19103
May 28, 1960 | | Trustee | | Since
January 2001 | | President –
Franklin & Marshall College
(June 2002 – Present)
Executive Vice President –
University of Pennsylvania
(April 1995 – June 2002) | | | 84 | | | Director –
Community Health
Systems
Director –
Allied Barton
Security Holdings | |
|
Anthony D. Knerr
2005 Market Street
Philadelphia, PA
19103
December 7, 1938 | | Trustee | | Since
April 1990 | | Founder and Managing Director –
Anthony Knerr & Associates
(Strategic Consulting)
(1990 – Present) | | | 84 | | | None | |
|
Lucinda S. Landreth
2005 Market Street
Philadelphia, PA
19103
June 24, 1947 | | Trustee | | Since
March 2005 | | Chief Investment Officer –
Assurant, Inc.
(Insurance)
(2002 – 2004) | | | 84 | | | None | |
|
Ann R. Leven
2005 Market Street
Philadelphia, PA
19103
November 1, 1940 | | Trustee | | Since
September 1989 | | Consultant –
ARL Associates
(Financial Planning)
(1983 – Present) | | | 84 | | | Director and
Audit Committee
Chairperson – Andy
Warhol Foundation
Director and Audit
Committee Member –
Systemax, Inc. | |
|
Emerging Markets Series- 17
Name,
Address,
and Birth Date | | Position(s)
Held with
Fund(s) | | Length of Time
Served | | Principal
Occupation(s)
During
Past 5 Years | | Number of
Portfolios in Fund
Complex Overseen
by Trustee
or Officer | | Other
Directorships
Held by
Trustee
or Officer | |
| independent trustees (continued) | | | | | | | | | | | | | |
|
Thomas F. Madison
2005 Market Street
Philadelphia, PA
19103
February 25, 1936 | | Trustee | | Since
May 1997 | | President and Chief
Executive Officer –
MLM Partners, Inc.
(Small Business Investing
and Consulting)
(January 1993 – Present) | | | 84 | | | Director –
Banner Health
Director –
CenterPoint Energy
Director and Audit
Committee Member –
Digital River, Inc.
Director and Audit
Committee Member –
Rimage
Corporation
Director – Valmont
Industries, Inc. | |
|
Janet L. Yeomans
2005 Market Street
Philadelphia, PA
19103
July 31, 1948 | | Trustee | | Since
April 1999 | | Vice President
(January 2003 – Present)
and Treasurer
(January 2006 – Present)
3M Corporation
Ms. Yeomans has held
various management positions
at 3M Corporation since 1983. | | | 84 | | | None | |
|
J. Richard Zecher
2005 Market Street
Philadelphia, PA
19103
July 3, 1940 | | Trustee | | Since
March 2005 | | Founder –
Investor Analytics
(Risk Management)
(May 1999 – Present)
Founder –
Sutton Asset Management
(Hedge Fund)
(September 1998 – Present) | | | 84 | | | Director and Audit
Committee Member –
Investor Analytics
Director and Audit
Committee Member –
Oxigene, Inc. | |
|
| officers | | | | | | | | | | | | | |
|
David F. Connor
2005 Market Street
Philadelphia, PA
19103
December 2, 1963 | | Vice President,
Deputy General
Counsel, and Secretary | | Vice President since
September 21, 2000
and Secretary
since
October 2005 | | David F. Connor has served as
Vice President and Deputy
General Counsel of
Delaware Investments
since 2000. | | | 84 | | | None3 | |
|
David P. O'Connor
2005 Market Street
Philadelphia, PA
19103
February 21, 1966 | | Senior Vice
President,
General Counsel,
and Chief
Legal Officer | | Senior Vice President,
General Counsel, and
Chief Legal Officer
since
October 2005 | | David P. O'Connor has served in
various executive and legal
capacities at different times at
Delaware Investments. | | | 84 | | | None3 | |
|
John J. O'Connor
2005 Market Street
Philadelphia, PA
19103
June 16, 1957 | | Senior Vice President
and Treasurer | | Treasurer
since
February 2005 | | John J. O'Connor has served in
various executive capacities
at different times at
Delaware Investments. | | | 84 | | | None3 | |
|
Richard Salus
2005 Market Street
Philadelphia, PA
19103
October 4, 1963 | | Senior
Vice President
and
Chief Financial
Officer | | Chief Financial
Officer since
November 1, 2006 | | Richard Salus has served in
various executive capacities
at different times at
Delaware Investments. | | | 84 | | | None3 | |
|
1 Patrick P. Coyne is considered to be an "Interested Trustee" because he is an executive officer of the Fund's(s') investment advisor.
2 Delaware Investments is the marketing name for Delaware Management Holdings, Inc. and its subsidiaries, including the Fund's(s') investment advisor, principal underwriter, and its transfer agent.
3 David F. Connor, David P. O'Connor, John J. O'Connor, and Richard Salus serve in similar capacities for the six portfolios of the Optimum Fund Trust, which have the same investment advisor, principal underwriter, and transfer agent as the registrant. John J. O'Connor also serves in a similar capacity for Lincoln Variable Insurance Products Trust, which has the same investment advisor as the registrant.
The Statement of Additional Information for the Fund(s) includes additional information about the Trustees and Officers and is available, without charge, upon request by calling 800 523-1918.
Emerging Markets Series- 18
Delaware VIP Trust — Delaware VIP Global Bond Series (closed to new investors)
On November 16, 2006, the Board of Trustees of the Delaware VIP Trust voted and approved a proposal to liquidate and dissolve the Delaware VIP Global Bond Series, subject to shareholder approval at a shareholder meeting scheduled for February 28, 2007.
For the fiscal year ended Dec. 31, 2006, Delaware VIP Global Bond Series Standard Class shares showed a return of +3.15% (at net asset value with all distributions reinvested). The Citigroup World Government Bond Index — the Series' benchmark — advanced 6.12% for the year (source: Lipper).
International fixed income assets continued to grow in popularity with investors, as the $9 trillion in global bond sales in 2006 surpassed the record set in 2003. By comparison, U.S. bond sales topped $500 million (source: Bloomberg).
Emerging market bonds especially remained in demand after several years of strong advances. In mid-year, emerging market bonds underwent a slump, but performed well again for the whole of 2006, as evidenced by the 11.14% advance made by the Lehman Brothers Global Emerging Market Bond Index.
Performance for the Series may have been limited by its positioning toward the low end of the Series' typical range for emerging markets, due to what we considered stretched valuations in U.S. dollar-denominated emerging market assets. In addition to its U.S. assets, the Series' largest country allocations at fiscal year end were in Germany, Norway, Canada, France, and Japan.
The Series maintains a general strategy that seeks current income consistent with preservation of principal. During the year, we continued our strategy of purchasing securities in countries where the currency appeared undervalued or fair-valued compared to other countries. The portfolio also continued to hold currency hedges, a strategy designed to limit the risks associated with exposure to certain currencies while preserving underlying bond exposure.
Our focus remains on currencies with improving economic fundamentals at a time when U.S. economic growth appears to be slowing a bit more than many other world economies. Near the end of the fiscal year, the euro, Norwegian krone, and Swedish krona were among our key selections. We believed these currencies were poised to benefit, where underlying economic fundamentals remain sound.
The views expressed are current as of the date of this report and are subject to change.
The performance data quoted below and on the next page represent past performance; past performance does not guarantee future results. Investment return and principal value of an investment will fluctuate so that your shares, when redeemed, may be worth more or less than their original cost. Current performance may be lower or higher than the performance data quoted. Please obtain the performance data for the most recent month end by calling the number noted on the page related to this Series in the introductory section of this report.
You should consider the investment objectives, risks, charges, and expenses of the investment carefully before investing. The Delaware VIP Global Bond Series prospectus contains this and other important information about the Series. To obtain a prospectus, contact the company noted on the page related to this Series in the introductory section of this report, either by phone or through the company Web site. We advise you to read the prospectus carefully before you invest.
Delaware VIP Global Bond Series
Average annual total returns
For the periods ending Dec. 31, 2006 | | 1 Year | | 5 Years | | 10 Years | | Lifetime | |
| Standard Class Shares* | | | +3.15 | % | | | +9.90 | % | | | +5.37 | % | | | +6.13 | % | |
* Commenced operations on May 2, 1996
Global Bond Series- 1
Delaware VIP Trust — Delaware VIP Global Bond Series (continued)
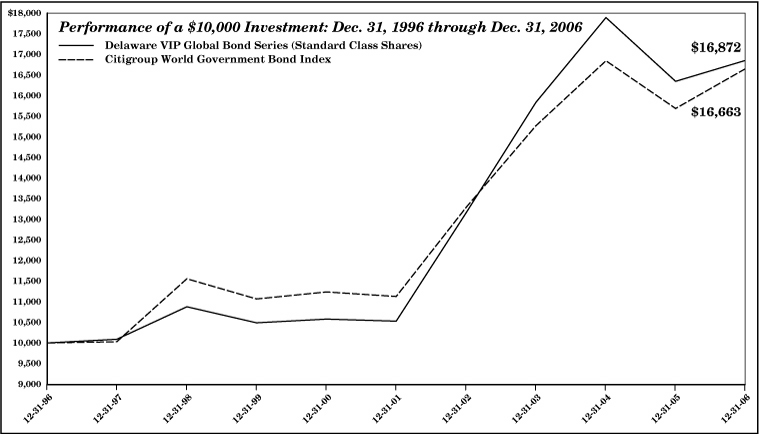
The chart shows a $10,000 investment in the Delaware VIP Global Bond Series Standard Class shares for the period from Dec. 31, 1996 through Dec. 31, 2006. All distributions were reinvested. The chart also shows $10,000 invested in the Citigroup World Government Bond Index for the period from Dec. 31, 1996 through Dec. 31, 2006.
The Citigroup World Government Bond Index is an unmanaged composite and a theoretical measure of global bond market performance rather than an actual available investment. An index is unmanaged and does not reflect the costs of operating a mutual fund, such as the costs of buying, selling, and holding securities. You cannot invest directly in an index.
Earnings from a variable annuity or variable life investment compound tax free until withdrawal, so no adjustments were made for income taxes.
An expense limitation was in effect for the Delaware VIP Global Bond Series during the periods shown.
Performance does not reflect insurance fees related to a variable annuity or variable life investment or the deferred sales charge that would apply to certain withdrawals of investments held for fewer than eight years. Performance shown here would have been reduced if such fees were included and the expense limitation was removed. For more information about fees, consult your variable annuity or variable life prospectus.
Investments in variable products involve risk. International and emerging market investments are subject to risks not ordinarily associated with domestic investments, such as currency, economic and political risks, and different accounting standards. Some portfolios offer more risk than others. Please read both the contract and underlying prospectus for specific details regarding the product's risk profile.
Global Bond Series- 2
Delaware VIP Trust — Delaware VIP Global Bond Series
Disclosure of Series Expenses
For the Period July 1, 2006 to December 31, 2006
As a shareholder of the Series, you incur ongoing costs, including management fees; distribution and/or service (12b-1) fees; and other Series expenses. This Example is intended to help you understand your ongoing costs (in dollars) of investing in the Series and to compare these costs with the ongoing costs of investing in other mutual funds.
The Example is based on an investment of $1,000 invested at the beginning of the period and held for the entire period from July 1, 2006 to December 31, 2006.
Actual Expenses
The first section of the table shown, "Actual Series Return," provides information about actual account values and actual expenses. You may use the information in this section of the table, together with the amount you invested, to estimate the expenses that you paid over the period. Simply divide your account value by $1,000 (for example, an $8,600 account value divided by $1,000 = 8.6), then multiply the result by the number in the first section under the heading entitled "Expenses Paid During Period" to estimate the expenses you paid on your account during the period.
Hypothetical Example for Comparison Purposes
The second section of the table shown, "Hypothetical 5% Return," provides information about hypothetical account values and hypothetical expenses based on the Series' actual expense ratio and an assumed rate of return of 5% per year before expenses, which is not the Series' actual return. The hypothetical account values and expenses may not be used to estimate the actual ending account balance or expenses you paid for the period. You may use this information to compare the ongoing costs of investing in the Series and other funds. To do so, compare the 5% hypothetical example with the 5% hypothetical examples that appear in the shareholder reports of other funds.
Please note that the expenses shown in the table are meant to highlight your ongoing costs only. As a shareholder of the Series, you do not incur any transaction costs, such as sales charges (loads), redemption fees or exchange fees, but shareholders of other funds may incur such costs. Also, the fees related to the variable annuity investment or the deferred sales charge that could apply have not been included. Therefore, the second section of the table is useful in comparing ongoing costs only, and will not help you determine the relative total costs of owning different funds. The Series' actual expenses shown in the table reflect fee waivers in effect. The expenses shown in the table assume reinvestment of all dividends and distributions.
Expense Analysis of an Investment of $1,000
| | | Beginning
Account
Value
7/1/06 | | Ending
Account
Value
12/31/06 | | Annualized
Expense
Ratios | | Expenses
Paid During
Period
7/1/06 to
12/31/06* | |
| Actual Series Return | |
| Standard Class | | $ | 1,000.00 | | | $ | 1,033.70 | | | | 0.97 | % | | $ | 4.97 | | |
| Hypothetical 5% Return (5% return before expenses) | |
| Standard Class | | $ | 1,000.00 | | | $ | 1,020.32 | | | | 0.97 | % | | $ | 4.94 | | |
*"Expenses Paid During Period" are equal to the Series' annualized expense ratio, multiplied by the average account value over the period, multiplied by 184/365 (to reflect the one-half year period).
Global Bond Series- 3
Delaware VIP Trust — Delaware VIP Global Bond Series
Sector/Country Allocation and Credit Rating Breakdown
As of December 31, 2006
Sector designations may be different than the sector designations presented in other Series materials.
| Sector/Country | | Percentage
of Net Assets | |
| Corporate Bonds | | | 10.96 | % | |
| Banking & Finance | | | 9.88 | % | |
| Consumer Non-Cyclical | | | 0.51 | % | |
| Utilities | | | 0.57 | % | |
| Foreign Agencies | | | 9.78 | % | |
| Austria | | | 0.51 | % | |
| Germany | | | 9.27 | % | |
| Regional Agency | | | 1.44 | % | |
| Australia | | | 1.44 | % | |
| Regional Authority | | | 0.92 | % | |
| Canada | | | 0.92 | % | |
| Sovereign Agencies | | | 4.46 | % | |
| France | | | 0.32 | % | |
| Japan | | | 2.78 | % | |
| Norway | | | 1.02 | % | |
| United States | | | 0.34 | % | |
| Sovereign Debt | | | 55.76 | % | |
| Austria | | | 1.92 | % | |
| France | | | 5.44 | % | |
| Germany | | | 6.72 | % | |
| Japan | | | 24.89 | % | |
| Norway | | | 7.29 | % | |
| Poland | | | 3.26 | % | |
| Republic of Korea | | | 1.25 | % | |
| Sweden | | | 2.33 | % | |
| United Kingdom | | | 2.66 | % | |
| Supranational Banks | | | 8.18 | % | |
| Total Market Value of Securities | | | 91.50 | % | |
| Receivables and Other Assets Net of Liabilities | | | 8.50 | % | |
| Total Net Assets | | | 100.00 | % | |
Credit Rating Breakdown
(as a % of fixed income investments) | | | |
| AAA | | | 61.74 | % | |
| AA | | | 28.09 | % | |
| A | | | 4.51 | % | |
| BBB | | | 1.91 | % | |
| BB | | | 2.33 | % | |
| B | | | 1.42 | % | |
| Total | | | 100.00 | % | |
Global Bond Series- 4
Delaware VIP Trust — Delaware VIP Global Bond Series
Statement of Net Assets
December 31, 2006
| | | Principal
Amountm | | Market
Value
(U.S $) | |
| CORPORATE BONDS–10.96% | |
| Banking & Finance–9.88% | |
| ASIF III 0.95% 7/15/09 | | JPY | 3,000,000 | | | $ | 25,133 | | |
| Citigroup 0.80% 10/30/08 | | JPY | 1,000,000 | | | | 8,393 | | |
| Depfa Bank 20.00% 11/19/07 | | TRY | 40,000 | | | | 28,182 | | |
| Ford Motor Credit 5.75% 1/12/09 | | EUR | 55,000 | | | | 72,766 | | |
GE Capital UK Funding
4.625% 1/18/16 | | GBP | 20,000 | | | | 37,019 | | |
General Motors Acceptance
Corporation 5.375% 6/6/11 | | EUR | 40,000 | | | | 53,377 | | |
General Motors Acceptance
International Finance
4.125% 2/6/07 | | EUR | 50,000 | | | | 65,980 | | |
| Residential Capital 6.375% 5/17/13 | | GBP | 50,000 | | | | 98,091 | | |
| WM Covered Bond 3.875% 9/27/11 | | EUR | 90,000 | | | | 117,375 | | |
| | | | | | | | 506,316 | | |
| Consumer Non-Cyclical–0.51% | |
| Procter & Gamble 2.00% 6/21/10 | | JPY | 3,000,000 | | | | 25,926 | | |
| | | | | | | | 25,926 | | |
| Utilities–0.57% | |
| Hydro Quebec 10.50% 10/15/21 | | CAD | 21,000 | | | | 29,269 | | |
| | | | | | | | 29,269 | | |
Total Corporate Bonds
(cost $549,272) | | | | | | | 561,511 | | |
| FOREIGN AGENCIES–9.78% | |
| Austria–0.51% | |
Oesterreichische Kontrollbank
1.80% 3/22/10 | | JPY | 3,000,000 | | | | 25,869 | | |
| | | | | | | | 25,869 | | |
| Germany–9.27% | |
KFW
1.75% 3/23/10 | | JPY | 5,000,000 | | | | 43,049 | | |
| 3.50% 7/4/21 | | EUR | 128,000 | | | | 156,547 | | |
| 4.75% 12/7/10 | | GBP | 22,000 | | | | 42,193 | | |
| 4.95% 10/14/14 | | CAD | 32,000 | | | | 28,503 | | |
| 8.25% 9/20/07 | | ISK | 12,000,000 | | | | 163,042 | | |
| Rentenbank 1.375% 4/25/13 | | JPY | 5,000,000 | | | | 41,960 | | |
| | | | | | | | 475,294 | | |
Total Foreign Agencies
(cost $512,206) | | | | | | | 501,163 | | |
| REGIONAL AGENCY–1.44% | |
| Australia–1.44% | |
New South Wales Treasury
6.00% 5/1/12 | | AUD | 95,000 | | | | 73,958 | | |
Total Regional Agency
(cost $73,200) | | | | | | | 73,958 | | |
| REGIONAL AUTHORITY–0.92% | |
| Canada–0.92% | |
Ontario Province
4.50% 3/8/15 | | CAD | 28,000 | | | | 24,327 | | |
| 5.375% 12/2/12 | | CAD | 25,000 | | | | 22,779 | | |
Total Regional Authority
(cost $47,599) | | | | | | | 47,106 | | |
| | | Principal
Amountm | | Market
Value
(U.S $) | |
| SOVEREIGN AGENCIES–4.46% | |
| France–0.32% | |
Caisse d'Amortissement de la Dette
Sociale 3.625% 4/25/16 | | EUR | 13,000 | | | $ | 16,588 | | |
| | | | | | | | 16,588 | | |
| Japan–2.78% | |
Development Bank of Japan
1.70% 9/20/22 | | JPY | 7,000,000 | | | | 55,487 | | |
Japan Finance Corporation for
Municipal Enterprises
2.00% 5/9/16 | | JPY | 10,000,000 | | | | 86,892 | | |
| | | | | | | | 142,379 | | |
| Norway–1.02% | |
| Kommunalbanken 4.25% 10/24/11 | | NOK | 330,000 | | | | 52,256 | | |
| | | | | | | | 52,256 | | |
| United States–0.34% | |
| Fannie Mae 6.375% 8/15/07 | | AUD | 22,000 | | | | 17,345 | | |
| | | | | | | | 17,345 | | |
Total Sovereign Agencies
(cost $236,843) | | | | | | | 228,568 | | |
| SOVEREIGN DEBT–55.76% | |
| Austria–1.92% | |
| Republic of Austria 5.25% 1/4/11 | | EUR | 71,000 | | | | 98,275 | | |
| | | | | | | | 98,275 | | |
| France–5.44% | |
France Government O.A.T
4.00% 4/25/55 | | EUR | 153,000 | | | | 199,337 | | |
| French Treasury Note 2.75% 3/12/08 | | EUR | 61,000 | | | | 79,484 | | |
| | | | | | | | 278,821 | | |
| Germany–6.72% | |
Deutschland Republic
4.00% 1/4/37 | | EUR | 35,000 | | | | 45,582 | | |
| 4.75% 7/4/08 | | EUR | 59,000 | | | | 78,834 | | |
| 6.25% 1/4/24 | | EUR | 117,000 | | | | 195,383 | | |
Deutschland Republic Inflation
Linked 1.50% 4/15/16 | | EUR | 19,302 | | | | 24,667 | | |
| | | | | | | | 344,466 | | |
| Japan–24.89% | |
Japan Government
2 yr. Bond 0.70% 9/15/08 | | JPY | 8,000,000 | | | | 67,161 | | |
| 5 yr. Bond 1.50% 6/20/11 | | JPY | 95,450,000 | | | | 813,843 | | |
| 10 yr. Bond 1.90% 6/20/16 | | JPY | 30,150,000 | | | | 258,852 | | |
| 20 yr. Bond 2.30% 6/20/26 | | JPY | 15,550,000 | | | | 135,839 | | |
| | | | | | | | 1,275,695 | | |
| Norway–7.29% | |
Norwegian Government
5.00% 5/15/15 | | NOK | 1,727,000 | | | | 288,668 | | |
| 6.50% 5/15/13 | | NOK | 476,000 | | | | 85,047 | | |
| | | | | | | | 373,715 | | |
| Poland–3.26% | |
Poland Government
6.00% 11/24/10 | | PLN | 304,000 | | | | 108,718 | | |
| 6.25% 10/24/15 | | PLN | 158,000 | | | | 58,480 | | |
| | | | | | | | 167,198 | | |
Global Bond Series- 5
Delaware VIP Global Bond Series
Statement of Net Assets (continued)
| | | Principal
Amountm | | Market
Value
(U.S $) | |
| SOVEREIGN DEBT (continued) | |
| Republic of Korea–1.25% | |
Government of South Korea
4.25% 12/7/21 | | EUR | 50,000 | | | $ | 64,065 | | |
| | | | | | | | 64,065 | | |
| Sweden–2.33% | |
| Sweden Government 5.50% 10/8/12 | | SEK | 755,000 | | | | 119,646 | | |
| | | | | | | | 119,646 | | |
| United Kingdom–2.66% | |
U.K. Treasury
4.75% 3/7/20 | | GBP | 15,000 | | | | 29,694 | | |
| 5.00% 3/7/12 | | GBP | 15,000 | | | | 29,434 | | |
| 8.00% 6/7/21 | | GBP | 18,000 | | | | 47,539 | | |
| 9.00% 7/12/11 | | GBP | 13,000 | | | | 29,499 | | |
| | | | | | | | 136,166 | | |
Total Sovereign Debt
(cost $2,810,550) | | | | | | | 2,858,047 | | |
| | | Principal
Amountm | | Market
Value
(U.S $) | |
| SUPRANATIONAL BANKS–8.18% | |
| Supranational–8.18% | �� |
Asia Development Bank
0.50% 10/9/12 | | AUD | 30,000 | | | $ | 17,104 | | |
European Investment Bank
1.40% 6/20/17 | | JPY | 19,100,000 | | | | 157,185 | | |
| 4.25% 12/7/10 | | GBP | 58,000 | | | | 109,272 | | |
Inter-American Development Bank
1.90% 7/8/09 | | JPY | 13,000,000 | | | | 111,994 | | |
^International Bank for
Reconstruction & Development
7.122% 8/20/07 | | NZD | 35,000 | | | | 23,520 | | |
Total Supranational Banks
(cost $417,012) | | | | | | | 419,075 | | |
Global Bond Series- 6
Delaware VIP Global Bond Series
Statement of Net Assets (continued)
| TOTAL MARKET VALUE OF SECURITIES–91.50% (cost $4,646,682) | | $ | 4,689,428 | | |
| RECEIVABLES AND OTHER ASSETS NET OF LIABILITIES–8.50% | | | 435,678 | | |
| NET ASSETS APPLICABLE TO 505,768 SHARES OUTSTANDING; EQUIVALENT TO $10.13 PER SHARE–100.00% | | $ | 5,125,106 | | |
| COMPONENTS OF NET ASSETS AT DECEMBER 31, 2006: | |
| Shares of beneficial interest (unlimited authorization–no par) | | $ | 6,296,037 | | |
| Undistributed net investment income | | | 381,679 | | |
| Accumulated net realized loss on investments | | | (1,605,450 | ) | |
| Net unrealized appreciation of investments and foreign currencies | | | 52,840 | | |
| Total net assets | | $ | 5,125,106 | | |
mPrincipal amount shown is stated in the currency in which each bond is denominated.
AUD – Australian Dollar
CAD – Canadian Dollar
EUR – European Monetary Unit
GBP – British Pound Sterling
ISK – Iceland Krona
JPY – Japanese Yen
NOK – Norwegian Kroner
NZD – New Zealand Dollar
PLN – Polish Zlotych
SEK – Swedish Krona
TRY – Turkish Lira
USD – United States Dollar
^Zero coupon security. The rate shown is the yield at the time of purchase.
Summary of Abbreviations:
O.A.T. – Obligation Assimilable au Tresor (Treasury Obligation)
yr. – year
The following foreign currency exchange contracts and foreign cross currency exchange contracts were outstanding at December 31, 2006:
Foreign Currency Exchange Contracts1
| Contracts to Receive (Deliver) | | In Exchange For | | Settlement Date | | Unrealized
Appreciation
(Depreciation) | |
| CAD | 35,185 | | | AUD | (39,000 | ) | | 2/22/07 | | $ | (523 | ) | |
| CAD | 26,317 | | | NZD | (33,000 | ) | | 2/22/07 | | | (566 | ) | |
| EUR | 102,006 | | | GBP | (69,000 | ) | | 1/11/07 | | | (398 | ) | |
| EUR | 50,400 | | | ISK | (4,659,000 | ) | | 1/11/07 | | | 1,215 | | |
| EUR | 112,407 | | | PLN | (430,395 | ) | | 1/11/07 | | | 166 | | |
| EUR | (39,400 | ) | | USD | 51,857 | | | 1/11/07 | | | (186 | ) | |
| JPY | 67,540,210 | | | EUR | (444,818 | ) | | 1/11/07 | | | (19,093 | ) | |
| JPY | (107,533,500 | ) | | USD | 931,905 | | | 1/11/07 | | | 26,802 | | |
| | | $ | 7,417 | | |
The use of foreign currency exchange contracts involves elements of market risk and risks in excess of the amount recognized in the financial statements. The notional amounts presented above represent the Series' total exposure in such contracts, whereas only the net unrealized appreciation (depreciation) is reflected in the Series' net assets.
1See Note 8 in "Notes to Financial Statements."
See accompanying notes
Global Bond Series- 7
Delaware VIP Trust — Delaware VIP Global Bond Series
Statement of Assets and Liabilities
December 31, 2006
| ASSETS: | |
| Investments at market (cost $4,646,682) | | $ | 4,689,428 | | |
| Foreign currencies (cost $174,224) | | | 174,939 | | |
| Cash | | | 192,491 | | |
| Interest receivable | | | 72,679 | | |
| Receivable for securities sold | | | 75,866 | | |
| Due from manager | | | 440 | | |
| Foreign currency contracts, at value | | | 7,417 | | |
| Total assets | | | 5,213,260 | | |
| LIABILITIES: | |
| Payable for securities purchased | | | 60,898 | | |
| Liquidations payable | | | 584 | | |
| Due to manager and affiliates | | | 3,738 | | |
| Other accrued expenses | | | 22,934 | | |
| Total liabilities | | | 88,154 | | |
| Total net assets | | $ | 5,125,106 | | |
See accompanying notes
Global Bond Series- 8
Delaware VIP Trust — Delaware VIP Global Bond Series
Statement of Operations
Year Ended December 31, 2006
| INVESTMENT INCOME: | |
| Interest | | $ | 1,038,195 | | |
| EXPENSES: | |
| Management fees | | | 215,143 | | |
| Custodian fees | | | 25,952 | | |
| Audit and tax | | | 12,615 | | |
| Accounting and administration expenses | | | 11,474 | | |
| Reports and statements to shareholders | | | 9,912 | | |
| Pricing fees | | | 4,343 | | |
| Legal fees | | | 3,888 | | |
| Dividend disbursing and transfer agent fees and expenses | | | 2,869 | | |
| Trustees' fees and benefits | | | 2,359 | | |
| Consulting fees | | | 339 | | |
| Dues and services | | | 233 | | |
| Insurance fees | | | 149 | | |
| Registration fees | | | 53 | | |
| Distribution expenses – Service Class | | | 25 | | |
| Trustees' expenses | | | 24 | | |
| | | | 289,378 | | |
| Less expenses absorbed or waived | | | (6,992 | ) | |
| Less waiver of distribution expenses – Service Class | | | (4 | ) | |
| Total operating expenses | | | 282,382 | | |
| NET INVESTMENT INCOME | | | 755,813 | | |
NET REALIZED AND UNREALIZED GAIN (LOSS)
ON INVESTMENTS AND FOREIGN CURRENCIES: | |
| Net realized gain (loss) on: | |
| Investments | | | (632,497 | ) | |
| Options written | | | 215 | | |
| Foreign currencies | | | (604,827 | ) | |
| Net realized loss | | | (1,237,109 | ) | |
Net change in unrealized appreciation/depreciation
of investments and foreign currencies | | | 1,570,227 | | |
NET REALIZED AND UNREALIZED GAIN ON
INVESTMENTS AND FOREIGN CURRENCIES | | | 333,118 | | |
NET INCREASE IN NET ASSETS RESULTING
FROM OPERATIONS | | $ | 1,088,931 | | |
See accompanying notes
Delaware VIP Trust — Delaware VIP Global Bond Series
Statements of Changes in Net Assets
| | | Year Ended | |
| | | 12/31/06 | | 12/31/05 | |
INCREASE (DECREASE) IN NET
ASSETS FROM OPERATIONS: | |
| Net investment income | | $ | 755,813 | | | $ | 1,451,016 | | |
Net realized gain (loss) on investments
and foreign currencies | | | (1,237,109 | ) | | | 938,859 | | |
Net change in unrealized appreciation/
depreciation on investments
and foreign currencies | | | 1,570,227 | | | | (9,350,986 | ) | |
Net increase (decrease) in net assets
resulting from operations | | | 1,088,931 | | | | (6,961,111 | ) | |
DIVIDENDS AND DISTRIBUTIONS
TO SHAREHOLDERS FROM: | |
| Net investment income: | |
| Standard Class | | | (1,095,558 | ) | | | (12,177,352 | ) | |
| Service Class | | | (135 | ) | | | (1,263 | ) | |
| Net realized gain on investments: | |
| Standard Class | | | (1,681,682 | ) | | | (1,441,808 | ) | |
| Service Class | | | (242 | ) | | | (152 | ) | |
| | | | (2,777,617 | ) | | | (13,620,575 | ) | |
| CAPITAL SHARE TRANSACTIONS: | |
| Proceeds from shares sold: | |
| Standard Class | | | 6,820,136 | | | | 3,701,855 | | |
Net asset value of shares issued upon
reinvestment of dividends and distributions: | |
| Standard Class | | | 2,777,240 | | | | 13,619,160 | | |
| Service Class | | | 377 | | | | 1,415 | | |
| | | | 9,597,753 | | | | 17,322,430 | | |
| Cost of shares repurchased: | |
| Standard Class | | | (64,786,686 | ) | | | (21,110,123 | ) | |
| Service Class | | | (8,396 | ) | | | — | | |
| | | | (64,795,082 | ) | | | (21,110,123 | ) | |
Decrease in net assets derived from
capital share transactions | | | (55,197,329 | ) | | | (3,787,693 | ) | |
| NET DECREASE IN NET ASSETS | | | (56,886,015 | ) | | | (24,369,379 | ) | |
| NET ASSETS: | |
| Beginning of year | | | 62,011,121 | | | | 86,380,500 | | |
End of year (including undistributed
net investment income of $381,679 and
$949,981, respectively) | | $ | 5,125,106 | | | $ | 62,011,121 | | |
See accompanying notes
Global Bond Series- 9
Delaware VIP Trust — Delaware VIP Global Bond Series
Financial Highlights
Selected data for each share of the Series outstanding throughout each period were as follows:
| | | Delaware VIP Global Bond Series Standard Class | |
| | | Year Ended | |
| | | 12/31/06 | | 12/31/05 | | 12/31/04 | | 12/31/03 | | 12/31/02 | |
| Net asset value, beginning of period | | $ | 10.330 | | | $ | 13.560 | | | $ | 13.940 | | | $ | 11.770 | | | $ | 9.470 | | |
| Income (loss) from investment operations: | |
| Net investment income1 | | | 0.267 | | | | 0.217 | | | | 0.316 | | | | 0.356 | | | | 0.404 | | |
Net realized and unrealized gain (loss) on investments
and foreign currencies | | | 0.040 | | | | (1.265 | ) | | | 1.262 | | | | 2.005 | | | | 1.957 | | |
| Total from investment operations | | | 0.307 | | | | (1.048 | ) | | | 1.578 | | | | 2.361 | | | | 2.361 | | |
| Less dividends and distributions from: | |
| Net investment income | | | (0.200 | ) | | | (1.951 | ) | | | (1.692 | ) | | | (0.191 | ) | | | (0.061 | ) | |
| Net realized gain on investments | | | (0.307 | ) | | | (0.231 | ) | | | (0.266 | ) | | | — | | | | — | | |
| Total dividends and distributions | | | (0.507 | ) | | | (2.182 | ) | | | (1.958 | ) | | | (0.191 | ) | | | (0.061 | ) | |
| Net asset value, end of period | | $ | 10.130 | | | $ | 10.330 | | | $ | 13.560 | | | $ | 13.940 | | | $ | 11.770 | | |
| Total return2 | | | 3.15 | % | | | (8.65 | %) | | | 13.00 | % | | | 20.36 | % | | | 25.09 | % | |
| Ratios and supplemental data: | |
| Net assets, end of period (000 omitted) | | $ | 5,125 | | | $ | 62,003 | | | $ | 86,372 | | | $ | 105,463 | | | $ | 91,945 | | |
| Ratio of expenses to average net assets | | | 0.98 | % | | | 0.97 | % | | | 0.93 | % | | | 0.87 | % | | | 0.81 | % | |
Ratio of expenses to average net assets prior to expense
limitation and expenses paid indirectly | | | 1.01 | % | | | 1.09 | % | | | 0.93 | % | | | 0.91 | % | | | 0.81 | % | |
| Ratio of net investment income to average net assets | | | 2.64 | % | | | 1.94 | % | | | 2.52 | % | | | 2.81 | % | | | 3.76 | % | |
Ratio of net investment income to average net assets prior
to expense limitation and expenses paid indirectly | | | 2.61 | % | | | 1.82 | % | | | 2.52 | % | | | 2.77 | % | | | 3.76 | % | |
| Portfolio turnover | | | 200 | % | | | 188 | % | | | 117 | % | | | 111 | % | | | 49 | % | |
1The average shares outstanding method has been applied for per share information.
2Total investment return is based on the change in net asset value of a share during the period and assumes reinvestment of dividends and distributions at net asset value. Total investment return reflects waivers and payment of fees by the manager, as applicable. Performance would have been lower had the expense limitation not been in effect.
See accompanying notes
Global Bond Series- 10
Delaware VIP Trust — Delaware VIP Global Bond Series
Notes to Financial Statements
December 31, 2006
Delaware VIP Trust (the "Trust") is organized as a Delaware statutory trust and offers 15 series: Delaware VIP Balanced Series, Delaware VIP Capital Reserves Series, Delaware VIP Cash Reserve Series, Delaware VIP Diversified Income Series, Delaware VIP Emerging Markets Series, Delaware VIP Global Bond Series, Delaware VIP Growth Opportunities Series, Delaware VIP High Yield Series, Delaware VIP International Value Equity Series, Delaware VIP REIT Series, Delaware VIP Select Growth Series, Delaware VIP Small Cap Value Series, Delaware VIP Trend Series, Delaware VIP U.S. Growth Series and Delaware VIP Value Series. These financial statements and the related notes pertain to Delaware VIP Global Bond Series (the "Series"). The Trust is an open-end investment company. The Series is considered non-diversified under the Investment Company Act of 1940, as amended, and offers Standard Class and Service Class shares. The sole shareholder of Service Cl ass shares liquidated its shares on December 21, 2006. The Service Class of the Series is no longer offered to new purchasers. The Standard Class shares do not carry a 12b-1 fee and the Service Class shares carry a 12b-1 fee. The shares of the Series are sold only to separate accounts of life insurance companies.
The investment objective of the Series is to seek current income consistent with the preservation of principal.
1. Significant Accounting Policies
The following accounting policies are in accordance with U.S. generally accepted accounting principles and are consistently followed by the Series.
Security Valuation—Securities listed on a foreign exchange are valued at the last quoted sales price before the Series is valued. U.S. government and agency securities are valued at the mean between the bid and asked prices. Other long-term debt securities are valued by an independent pricing service and such prices are believed to reflect the fair value of such securities. Short-term debt securities having less than 60 days to maturity are valued at amortized cost, which approximates market value. Foreign currency exchange contracts are valued at the mean between the bid and asked prices of the contracts and are marked-to-market daily. Interpolated values are derived when the settlement date of the contract is an interim date for which quotations are not available. Exchange-traded options are valued at the last reported sale price or, if no sales are reporte d, at the mean between the last reported bid and asked prices. Other securities and assets for which market quotations are not readily available are valued at fair value as determined in good faith under the direction of the Series' Board of Trustees. In determining whether market quotations are readily available or fair valuation will be used, various factors will be taken into consideration, such as market closures, aftermarket trading, or significant events after local market trading (e.g., government actions or pronouncements, trading volume or volatility on markets, exchanges among dealers, or news events).
In September 2006, the Financial Accounting Standards Board (FASB) issued FASB Statement No. 157 "Fair Value Measurements" (Statement 157). Statement 157 establishes a framework for measuring fair value in generally accepted accounting principles, clarifies the definition of fair value within that framework, and expands disclosures about the use of fair value measurements. Statement 157 is intended to increase consistency and comparability among fair value estimates used in financial reporting. Statement 157 is effective for fiscal years beginning after November 15, 2007. Management does not expect the adoption of Statement 157 to have an impact on the amounts reported in the financial statements.
Federal Income Taxes—The Series intends to continue to qualify for federal income tax purposes as a regulated investment company and make the requisite distributions to shareholders. Accordingly, no provision for federal income taxes has been made in the financial statements.
On July 13, 2006, FASB released FASB Interpretation No. 48 "Accounting for Uncertainty in Income Taxes" (FIN 48). FIN 48 provides guidance for how uncertain tax positions should be recognized, measured, presented and disclosed in the financial statements. FIN 48 requires the evaluation of tax positions taken or expected to be taken in the course of preparing the Series' tax returns to determine whether the tax positions are "more-likely-than-not" of being sustained by the applicable tax authority. Tax positions not deemed to meet the more-likely-than-not threshold would be recorded as a tax benefit or expense in the current year. Adoption of FIN 48 is required for fiscal years beginning after December 15, 2006 and is to be applied to all open tax years as of the effective date. Recent SEC guidance allows implementing FIN 48 in Series net asset value calculations as late as the Series' last net asset value calculation in the first required fi nancial statement reporting period. As a result, the Series will incorporate FIN 48 in its semiannual report on June 30, 2007. Although the Series' tax positions are currently being evaluated, management does not expect the adoption of FIN 48 to have a material impact on the Series' financial statements.
Class Accounting—Investment income, common expenses and realized and unrealized gain (loss) on investments are allocated to the classes of the Series on the basis of daily net assets of each class. Distribution expenses relating to a specific class are charged directly to that class.
Repurchase Agreements—The Series may invest in a pooled cash account along with other members of the Delaware Investments® Family of Funds pursuant to an exemptive order issued by the Securities and Exchange Commission. The aggregate daily balance of the pooled cash account is invested in repurchase agreements secured by obligations of the U.S. government. The respective collateral is held by the Series' custodian bank until the maturity of the respective repurchase agreements. Each repurchase agreement is at least 102% collateralized. However, in the event of default or bankruptcy by the counterparty to the agreement, realization of the collateral may be subject to legal proceedings.
Foreign Currency Transactions—Transactions denominated in foreign currencies are recorded at the prevailing exchange rates on the valuation date. The value of all assets and liabilities denominated in foreign currencies are translated into U.S. dollars at the exchange rate of such currencies against the U.S. dollar daily. Transaction gains or losses resulting from changes in exchange rates during the reporting period or upon settlement of the foreign currency transaction are reported in operations for the current period. The Series isolates that portion of realized gains and losses on investments in debt securities, which are due to changes in foreign exchange rates from that which are due to changes in market prices of debt securities. The Series reports certain foreign currency related transactions as components of realized gains (losses) for financial repo rting purposes, where such components are treated as ordinary income (loss) for federal income tax purposes.
Global Bond Series- 11
Delaware VIP Global Bond Series
Notes to Financial Statements (continued)
1. Significant Accounting Policies (continued)
Use of Estimates—The preparation of financial statements in conformity with U.S. generally accepted accounting principles requires management to make estimates and assumptions that affect the reported amounts of assets and liabilities at the date of the financial statements and the reported amounts of revenues and expenses during the reporting period. Actual results could differ from those estimates.
Other—Expenses directly attributable to the Series are charged directly to the Series. Other expenses common to various funds within the Delaware Investments® Family of Funds are generally allocated amongst such funds on the basis of average net assets. Management fees and some other expenses are paid monthly. Security transactions are recorded on the date the securities are purchased or sold (trade date) for financial reporting purposes. Costs used in calculating realized gains and losses on the sale of investment securities are those of the specific securities sold. Interest income is recorded on the accrual basis. Premiums and discounts on all debt securities are amortized to interest income over the lives of the respective securities.
The Series declares and pays dividends from net investment income and distributions from net realized gain on investments, if any, following the close of the fiscal year.
2. Investment Management, Administration Agreements and Other Transactions with Affiliates
In accordance with the terms of its investment management agreement, the Series pays Delaware Management Company (DMC), the investment manager, an annual fee which is calculated daily at the rate of 0.75% on the first $500 million of average daily net assets of the Series, 0.70% on the next $500 million, 0.65% on the next $1.5 billion, and 0.60% on average daily net assets in excess of $2.5 billion.
DMC has contractually agreed to waive that portion, if any, of its management fee and reimburse the Series to the extent necessary to ensure that annual operating expenses, exclusive of taxes, interest, brokerage commissions, distribution fees, certain insurance costs and extraordinary expenses, do not exceed 1.00% of average daily net assets of the Series through April 30, 2007.
Delaware Service Company, Inc. (DSC), an affiliate of DMC, provides accounting, administration, dividend disbursing and transfer agent services. The Series pays DSC a monthly fee computed at the annual rate of 0.04% of the Series' average daily net assets for accounting and administrative services. The Series pays DSC a monthly fee based on average net assets for dividend disbursing and transfer agent services.
Pursuant to a distribution agreement and distribution plan, the Series pays Delaware Distributors, L.P. (DDLP), the distributor and an affiliate of DMC, an annual distribution and service fee not to exceed 0.30% of the average daily net assets of the Service Class shares. DDLP has contracted to waive distribution and service fees through April 30, 2007 in order to prevent distribution and service fees of the Service Class shares from exceeding 0.25% of average daily net assets. Standard Class shares pay no distribution and service expenses.
At December 31, 2006, the Series had receivables due from or liabilities payable to affiliates as follows:
Dividend Disbursing,
Transfer Agent,
Accounting and Administration
Fees and Other Expenses
Payable to DSC | | Distribution
Fee Payable
to DDLP | | Other
Expenses
Payable
to DMC and
Affiliates* | | Receivable
from DMC
Under Expense
Limitation
Agreement | |
| $ | (252 | ) | | $ | (1 | ) | | $ | (3,485 | ) | | $ | 440 | | |
*DMC, as part of its administrative services, pays operating expenses on behalf of the Series and is reimbursed on a periodic basis. Such expenses include items such as printing of shareholder reports, fees for audit, legal and tax services, custodian fees and trustees' fees.
As provided in the investment management agreement, the Series bears the cost of certain legal and tax services, including internal legal and tax services provided to the Series by DMC and/or its affiliates' employees. For the year ended December 31, 2006, the Series was charged $1,158 for internal legal and tax services provided by DMC and/or its affiliates' employees.
Trustees' fees and benefits include expenses accrued by the Series for each Trustee's retainer, per meeting fees and retirement benefits. Independent Trustees with over five years of uninterrupted service are eligible to participate in a retirement plan that provides for the payment of benefits upon retirement. The amount of the retirement benefit is based on factors set forth in the plan, including the number of years of service. On November 16, 2006, the Board of Trustees unanimously voted to terminate the retirement plan. Payments equal to the net present value of the earned benefits will be made in 2007 to those independent trustees so entitled. The retirement benefit payout for the Series is $741. Certain officers of DMC, DSC and DDLP are officers and/or trustees of the Trust. These officers and trustees are paid no compensation by the Series.
Global Bond Series- 12
Delaware VIP Global Bond Series
Notes to Financial Statements (continued)
3. Investments
For the year ended December 31, 2006, the Series made purchases and sales of investment securities other than short-term investments as follows:
| Purchases other than U.S. government securities | | $ | 52,957,923 | | |
| Purchases of U.S. government securities | | | 2,641,531 | | |
| Sales other than U.S. government securities | | | 103,367,910 | | |
| Sales of U.S. government securities | | | 7,921,638 | | |
At December 31, 2006, the cost of investments for federal income tax purposes and unrealized appreciation (depreciation) for the Series were as follows:
Cost of
Investments | | Aggregate
Unrealized
Appreciation | | Aggregate
Unrealized
Depreciation | | Net Unrealized
Appreciation | |
| $ | 4,656,740 | | | $ | 83,086 | | | $ | (50,398 | ) | | $ | 32,688 | | |
4. Dividend and Distribution Information
Income and long-term capital gain distributions are determined in accordance with federal income tax regulations, which may differ from U.S. generally accepted accounting principles. Additionally, gains (losses) on foreign currency transactions and net short-term gains on sales of investment securities are treated as ordinary income for federal income tax purposes. The tax character of dividends and distributions paid during the years ended December 31, 2006 and 2005 was as follows:
| | | Year
Ended
12/31/06 | | Year
Ended
12/31/05 | |
| Ordinary income | | $ | 2,440,216 | | | $ | 12,733,806 | | |
| Long-term capital gains | | | 337,401 | | | | 886,769 | | |
| Total distribution | | $ | 2,777,617 | | | $ | 13,620,575 | | |
5. Components of Net Assets on a Tax Basis
As of December 31, 2006, the components of net assets on a tax basis were as follows:
| Shares of beneficial interest | | $ | 6,296,037 | | |
| Undistributed ordinary income | | | 807,129 | | |
| Post-October currency losses | | | (385,043 | ) | |
| Capital loss carryforwards | | | (1,595,392 | ) | |
| Other temporary differences | | | (34,205 | ) | |
Unrealized appreciation of investments
and foreign currencies | | | 36,580 | | |
| Net assets | | $ | 5,125,106 | | |
The differences between book basis and tax basis components of net assets are primarily attributable to tax deferral of losses on wash sales, mark-to-market of forward foreign currency contracts, currency straddles, and tax treatment of market discount and premium on debt instruments.
Post-October currency losses represent losses realized on foreign currency transactions from November 1, 2006 through December 31, 2006 that, in accordance with federal income tax regulations, the Series has elected to defer and treat as having arisen in the following fiscal year.
For financial reporting purposes, capital accounts are adjusted to reflect the tax character of permanent book/tax differences. Reclassifications are primarily due to tax treatment of gain (loss) on foreign currency transactions, dividends and distributions and market discount and premium on certain debt instruments. Results of operations and net assets were not affected by these reclassifications. For the year ended December 31, 2006, the Series recorded the following reclassifications:
Undistributed
Net
Investment Income | | Accumulated
Net Realized
Gain (Loss) | |
| $ | (228,422 | ) | | $ | 228,422 | | |
For federal income tax purposes, capital loss carryforwards may be carried forward and applied against future capital gains. Capital loss carryforwards of $1,595,392 remaining at December 31, 2006 will expire in 2014.
Global Bond Series-13
Delaware VIP Global Bond Series
Notes to Financial Statements (continued)
6. Capital Shares
Transactions in capital shares were as follows:
| | | Year
Ended
12/31/06 | | Year
Ended
12/31/05 | |
| Shares sold: | |
| Standard Class | | | 695,050 | | | | 317,642 | | |
Shares issued upon reinvestment of dividends
and distributions: | |
| Standard Class | | | 283,971 | | | | 1,242,624 | | |
| Service Class | | | 38 | | | | 129 | | |
| | | | 979,059 | | | | 1,560,395 | | |
| Shares repurchased: | |
| Standard Class | | | (6,476,295 | ) | | | (1,928,903 | ) | |
| Service Class | | | (825 | ) | | | — | | |
| | | | (6,477,120 | ) | | | (1,928,903 | ) | |
| Net decrease | | | (5,498,061 | ) | | | (368,508 | ) | |
7. Line of Credit
The Series, along with certain other funds in the Delaware Investments® Family of Funds (the "Participants"), participates in a $225,000,000 revolving line of credit facility to be used for temporary or emergency purposes as an additional source of liquidity to fund redemptions of investor shares. The Participants are charged an annual commitment fee, which is allocated across the Participants on the basis of each Participant's allocation of the entire facility. The Participants may borrow up to a maximum of one third of their net assets under the agreement. The Series had no amounts outstanding as of December 31, 2006, or at any time during the year then ended.
8. Foreign Currency Exchange Contracts
The Series may enter into foreign currency exchange contracts as a way of managing foreign exchange rate risk. The Series may enter into these contracts to fix the U.S. dollar value of a security that it has agreed to buy or sell for the period between the date the trade was entered into and the date the security is delivered and paid for. The Series may also use these contracts to hedge the U.S. dollar value of securities it already owns that are denominated in foreign currencies. The change in market value is recorded as an unrealized gain or loss. When the contract is closed, a realized gain or loss is recorded equal to the difference between the value of the contract at the time it was opened and the value at the time it was closed.
The use of foreign currency exchange contracts and foreign cross currency exchange contracts does not eliminate fluctuations in the underlying prices of the securities, but does establish a rate of exchange that can be achieved in the future. Although foreign currency exchange contracts limit the risk of loss due to a decline in the value of the hedged currency, they also limit any potential gain that might result should the value of the currency increase. In addition, the Series could be exposed to risks if the counterparties to the contracts are unable to meet the terms of their contracts. The unrealized gain (loss) is included in receivables and other assets net of liabilities on the Statement of Net Assets.
9. Options Written
During the year ended December 31, 2006, the Series entered into options contracts in accordance with its investment objectives. When the Series writes an option, a premium is received and a liability is recorded and adjusted on a daily basis to reflect the current market value of the options written. Premiums received from writing options that expire unexercised are treated by the Series on the expiration date as realized gains. The difference between the premium received and the amount paid on effecting a closing purchase transaction, including brokerage commissions, is treated as realized gain or loss. If a call option is exercised, the premium is added to the proceeds from the sale of the underlying security in determining whether the Series has a realized gain or loss. If a put option is exercised, the premium reduces the cost basis of the securities purchased by the Series. The Series, as writer of an option, bears the market risk of a n unfavorable change in the price of the security underlying the written option.
Global Bond Series- 14
Delaware VIP Global Bond Series
Notes to Financial Statements (continued)
9. Options Written (continued)
Transactions in options written during the year ended December 31, 2006 for the Series were as follows:
| | | Number of
contracts | | Premiums | |
Options outstanding at
December 31, 2005 | | | — | | | $ | — | | |
| Options written | | | 100,000 | | | | 215 | | |
| Options expired | | | (100,000 | ) | | | (215 | ) | |
Options outstanding at
December 31, 2006 | | | — | | | $ | — | | |
10. Credit and Market Risk
Some countries in which the Series may invest require governmental approval for the repatriation of investment income, capital or the proceeds of sales of securities by foreign investors. In addition, if there is a deterioration in a country's balance of payments or for other reasons, a country may impose temporary restrictions on foreign capital remittances abroad.
The securities exchanges of certain foreign markets are substantially smaller, less liquid and more volatile than the major securities markets in the United States. Consequently, acquisition and disposition of securities by the Series may be inhibited.
The Series may invest up to 10% of its total assets in illiquid securities, which may include securities with contractual restrictions on resale, securities exempt from registration under Rule 144A of the Securities Act of 1933, as amended, and other securities which may not be readily marketable. The relative illiquidity of these securities may impair the Series from disposing of them in a timely manner and at a fair price when it is necessary or desirable to do so. While maintaining oversight, the Series' Board of Trustees has delegated to DMC the day-to-day functions of determining whether individual securities are liquid for purposes of the Series' limitation on investments in illiquid assets. At December 31, 2006, there were no Rule 144A securities and no securities have been determined to be illiquid under the Series' Liquidity Procedures.
11. Contractual Obligations
The Series enters into contracts in the normal course of business that contain a variety of indemnifications. The Series' maximum exposure under these arrangements is unknown. However, the Series has not had prior claims or losses pursuant to these contracts. Management has reviewed the Series' existing contracts and expects the risk of loss to be remote.
12. Tax Information (Unaudited)
For the fiscal year ended December 31, 2006, the Series designates dividends and distributions paid during the year as follows:
(A)
Long-Term
Capital Gain
Distributions
(Tax Basis) | | (B)
Ordinary
Income
Distributions
(Tax Basis) | | Total
Distributions
(Tax Basis) | |
| | 12 | % | | | 88 | % | | | 100 | % | |
(A) and (B) are based on a percentage of the Series' total distributions.
13. Liquidation of Series
On November 16, 2006, the Board of Trustees of the Delaware VIP Trust unanimously voted and approved a proposal to liquidate and dissolve the Delaware VIP Global Bond Series, subject to shareholder approval. Series shareholders will receive a proxy statement providing them with information about the distribution and requesting their votes on the proposed liquidation and dissolution of their Series at a special meeting of shareholders expected to be held February 28, 2007. If approved, the liquidation and dissolution is expected to take place by the end of March 2007.
Global Bond Series-15
Delaware VIP Trust — Delaware VIP Global Bond Series
Report of Independent Registered Public Accounting Firm
To the Shareholders and Board of Trustees
Delaware VIP Trust – Delaware VIP Global Bond Series
We have audited the accompanying statement of net assets and statement of assets and liabilities of the Delaware VIP Global Bond Series (one of the series constituting Delaware VIP Trust) (the "Series") as of December 31, 2006, and the related statement of operations for the year then ended, the statements of changes in net assets for each of the two years in the period then ended, and the financial highlights for each of the five years in the period then ended. These financial statements and financial highlights are the responsibility of the Series' management. Our responsibility is to express an opinion on these financial statements and financial highlights based on our audits.
We conducted our audits in accordance with the standards of the Public Company Accounting Oversight Board (United States). Those standards require that we plan and perform the audit to obtain reasonable assurance about whether the financial statements and financial highlights are free of material misstatement. We were not engaged to perform an audit of the Series' internal control over financial reporting. Our audits included consideration of internal control over financial reporting as a basis for designing audit procedures that are appropriate in the circumstances, but not for the purpose of expressing an opinion on the effectiveness of the Series' internal control over financial reporting. Accordingly, we express no such opinion. An audit also includes examining, on a test basis, evidence supporting the amounts and disclosures in the financial statements and financial highlights, assessing the accounting principles used and significant es timates made by management, and evaluating the overall financial statement presentation. Our procedures included confirmation of securities owned as of December 31, 2006, by correspondence with the custodian and brokers or by other appropriate auditing procedures where replies from brokers were not received. We believe that our audits provide a reasonable basis for our opinion.
In our opinion, the financial statements and financial highlights referred to above present fairly, in all material respects, the financial position of the Delaware VIP Global Bond Series of Delaware VIP Trust at December 31, 2006, the results of its operations for the year then ended, the changes in its net assets for each of the two years in the period then ended, and its financial highlights for each of the five years in the period then ended, in conformity with U.S. generally accepted accounting principles.

Philadelphia, Pennsylvania
February 14, 2007
The Series files its complete schedule of portfolio holdings with the Securities and Exchange Commission for the first and third quarters of each fiscal year on Form N-Q. The Series' Forms N-Q, as well as a description of the policies and procedures that the Series uses to determine how to vote proxies (if any) relating to portfolio securities is available without charge (i) upon request, by calling 800-523-1918; (ii) on the Series' website at http://www.delawareinvestments.com; and (iii) on the Commission's website at http://www.sec.gov. The Series' Forms N-Q may be reviewed and copied at the Commission's Public Reference Room in Washington, DC; information on the operation of the Public Reference Room may be obtained by calling 1-800-SEC-0330.
Information (if any) regarding how the Series voted proxies relating to portfolio securities during the most recently disclosed 12-month period ended June 30 is available without charge (i) through the Series' website at http://www.delawareinvestments.com; and (ii) on the Commission's website at http://www.sec.gov.
Global Bond Series- 16
Delaware Investments® Family of Funds
board of trustees/directors and officers addendum
A mutual fund is governed by a Board of Trustees/Directors ("Trustees"), which has oversight responsibility for the management of a fund's business affairs. Trustees establish procedures and oversee and review the performance of the investment manager, the distributor, and others who perform services for the fund. The independent fund trustees, in particular, are advocates for shareholder interests. Each trustee has served in that capacity since he or she was elected to or appointed to the Board of Trustees, and will continue to serve until his or her retirement or the election of a new trustee in his or her place. The following is a list of the Trustees and Officers with certain background and related information.
Name,
Address,
and Birth Date | | Position(s)
Held with
Fund(s) | | Length of Time
Served | | Principal
Occupation(s)
During
Past 5 Years | | Number of
Portfolios in Fund
Complex Overseen
by Trustee
or Officer | | Other
Directorships
Held by
Trustee
or Officer | |
| interested trustees | | | | | | | | | | | | | |
|
Patrick P. Coyne1
2005 Market Street
Philadelphia, PA
19103
April 14, 1963 | | Chairman,
President,
Chief Executive
Officer, and
Trustee | | Chairman and Trustee
since August 16, 2006
President and
Chief Executive Officer
since August 1, 2006 | | Patrick P. Coyne has served in
various executive capacities
at different times at
Delaware Investments.2 | | | 84 | | | None | |
|
| independent trustees | | | | | | | | | | | | | |
|
Thomas L. Bennett
2005 Market Street
Philadelphia, PA
19103
October 4, 1947 | | Trustee | | Since
March 2005 | | Private Investor –
(March 2004 – Present)
Investment Manager –
Morgan Stanley & Co.
(January 1984 – March 2004) | | | 84 | | | None | |
|
John A. Fry
2005 Market Street
Philadelphia, PA
19103
May 28, 1960 | | Trustee | | Since
January 2001 | | President –
Franklin & Marshall College
(June 2002 – Present)
Executive Vice President –
University of Pennsylvania
(April 1995 – June 2002) | | | 84 | | | Director –
Community Health
Systems
Director –
Allied Barton
Security Holdings | |
|
Anthony D. Knerr
2005 Market Street
Philadelphia, PA
19103
December 7, 1938 | | Trustee | | Since
April 1990 | | Founder and Managing Director –
Anthony Knerr & Associates
(Strategic Consulting)
(1990 – Present) | | | 84 | | | None | |
|
Lucinda S. Landreth
2005 Market Street
Philadelphia, PA
19103
June 24, 1947 | | Trustee | | Since
March 2005 | | Chief Investment Officer –
Assurant, Inc.
(Insurance)
(2002 – 2004) | | | 84 | | | None | |
|
Ann R. Leven
2005 Market Street
Philadelphia, PA
19103
November 1, 1940 | | Trustee | | Since
September 1989 | | Consultant –
ARL Associates
(Financial Planning)
(1983 – Present) | | | 84 | | | Director and
Audit Committee
Chairperson – Andy
Warhol Foundation
Director and Audit
Committee Member –
Systemax, Inc. | |
|
Global Bond Series- 17
Name,
Address,
and Birth Date | | Position(s)
Held with
Fund(s) | | Length of Time
Served | | Principal
Occupation(s)
During
Past 5 Years | | Number of
Portfolios in Fund
Complex Overseen
by Trustee
or Officer | | Other
Directorships
Held by
Trustee
or Officer | |
| independent trustees (continued) | | | | | | | | | | | | | |
|
Thomas F. Madison
2005 Market Street
Philadelphia, PA
19103
February 25, 1936 | | Trustee | | Since
May 1997 | | President and Chief
Executive Officer –
MLM Partners, Inc.
(Small Business Investing
and Consulting)
(January 1993 – Present) | | | 84 | | | Director –
Banner Health
Director –
CenterPoint Energy
Director and Audit
Committee Member –
Digital River, Inc.
Director and Audit
Committee Member –
Rimage
Corporation
Director – Valmont
Industries, Inc. | |
|
Janet L. Yeomans
2005 Market Street
Philadelphia, PA
19103
July 31, 1948 | | Trustee | | Since
April 1999 | | Vice President
(January 2003 – Present)
and Treasurer
(January 2006 – Present)
3M Corporation
Ms. Yeomans has held
various management positions
at 3M Corporation since 1983. | | | 84 | | | None | |
|
J. Richard Zecher
2005 Market Street
Philadelphia, PA
19103
July 3, 1940 | | Trustee | | Since
March 2005 | | Founder –
Investor Analytics
(Risk Management)
(May 1999 – Present)
Founder –
Sutton Asset Management
(Hedge Fund)
(September 1998 – Present) | | | 84 | | | Director and Audit
Committee Member –
Investor Analytics
Director and Audit
Committee Member –
Oxigene, Inc. | |
|
| officers | | | | | | | | | | | | | |
|
David F. Connor
2005 Market Street
Philadelphia, PA
19103
December 2, 1963 | | Vice President,
Deputy General
Counsel, and Secretary | | Vice President since
September 21, 2000
and Secretary
since
October 2005 | | David F. Connor has served as
Vice President and Deputy
General Counsel of
Delaware Investments
since 2000. | | | 84 | | | None3 | |
|
David P. O'Connor
2005 Market Street
Philadelphia, PA
19103
February 21, 1966 | | Senior Vice
President,
General Counsel,
and Chief
Legal Officer | | Senior Vice President,
General Counsel, and
Chief Legal Officer
since
October 2005 | | David P. O'Connor has served in
various executive and legal
capacities at different times at
Delaware Investments. | | | 84 | | | None3 | |
|
John J. O'Connor
2005 Market Street
Philadelphia, PA
19103
June 16, 1957 | | Senior Vice President
and Treasurer | | Treasurer
since
February 2005 | | John J. O'Connor has served in
various executive capacities
at different times at
Delaware Investments. | | | 84 | | | None3 | |
|
Richard Salus
2005 Market Street
Philadelphia, PA
19103
October 4, 1963 | | Senior
Vice President
and
Chief Financial
Officer | | Chief Financial
Officer since
November 1, 2006 | | Richard Salus has served in
various executive capacities
at different times at
Delaware Investments. | | | 84 | | | None3 | |
|
1 Patrick P. Coyne is considered to be an "Interested Trustee" because he is an executive officer of the Fund's(s') investment advisor.
2 Delaware Investments is the marketing name for Delaware Management Holdings, Inc. and its subsidiaries, including the Fund's(s') investment advisor, principal underwriter, and its transfer agent.
3 David F. Connor, David P. O'Connor, John J. O'Connor, and Richard Salus serve in similar capacities for the six portfolios of the Optimum Fund Trust, which have the same investment advisor, principal underwriter, and transfer agent as the registrant. John J. O'Connor also serves in a similar capacity for Lincoln Variable Insurance Products Trust, which has the same investment advisor as the registrant.
The Statement of Additional Information for the Fund(s) includes additional information about the Trustees and Officers and is available, without charge, upon request by calling 800 523-1918.
Global Bond Series- 18
Delaware VIP Trust — Delaware VIP Growth Opportunities Series
For the 12-month period ended Dec. 31, 2006, the Delaware VIP Growth Opportunities Series Standard Class shares had a positive return of 6.36%, and Service Class shares gained 6.03% (both figures with distributions reinvested). The Series benchmark, the Russell Midcap Growth Index, gained 10.66% (source: Lipper).
In general, value stocks strongly outperformed growth stocks during the fiscal year. This disparity reflected, in part, almost indiscriminate risk aversion by investors from late April to early August due to fears about inflation and rising interest rates. The attendant disconnect between price action and fundamentals hit smaller-cap growth stocks hard, and sectors and industries where we had a significant portion of the portfolio positioned — technology; biotech and medical tech; and consumer-related industries — were further punished.
This severe investor pessimism eventually gave way in August, as commodity prices dropped and the Federal Reserve finally paused its two-plus year regimen of successive rate hikes. Large-cap stocks were the initial beneficiaries, followed in the fourth quarter by a rally in mid- and small-cap stocks.
For the year, the Series received a strongly positive contribution from its industrial holdings, including specialty metals manufacturer, Allegheny Technologies, and mining equipment manufacturer, Joy Global. Stock selection in the business services and consumer services sectors also added value.
Unfortunately, these positive contributions were offset by the adverse impact of some problematic holdings in the Series' technology and healthcare holdings. FDA rejection of the Neurocrine Bioscience insomnia drug caught investors completely by surprise, sending the stock down considerably and providing evidence of an increasingly cautious FDA with respect to new drug approval. The Series' holdings in Neurocrine Bioscience were sold before Dec. 31, 2006.
Some nervousness in the technology sector was exacerbated by the SEC investigation into past options-granting practices. Some technology holdings were adversely affected by these events, though many later rebounded. Overall, sector selection for the year also hindered performance, primarily due to overweights in consumer non-durables and technology, along with underweights in energy and basic industry.
The views expressed are current as of the date of this report and are subject to change.
The performance data quoted below and on the next page represent past performance; past performance does not guarantee future results. Investment return and principal value of an investment will fluctuate so that your shares, when redeemed, may be worth more or less than their original cost. Current performance may be lower or higher than the performance data quoted. Please obtain the performance data for the most recent month end by calling the number noted on the page related to this Series in the introductory section of this report.
You should consider the investment objectives, risks, charges, and expenses of the investment carefully before investing. The Delaware VIP Growth Opportunities Series prospectus contains this and other important information about the Series. To obtain a prospectus, contact the company noted on the page related to this Series in the introductory section of this report, either by phone or through the company Web site. We advise you to read the prospectus carefully before you invest.
Delaware VIP Growth Opportunities Series
Average Annual Total Returns
For the periods ending Dec. 31, 2006 | | 1 Year | | 5 Years | | 10 Years | | Lifetime | |
| Standard Class Shares* | | | +6.36 | % | | | +7.13 | % | | | +9.23 | % | | | +9.95 | % | |
| Service Class Shares** | | | +6.03 | % | | | +6.88 | % | | | NA | | | | +0.05 | % | |
* Commenced operations on July 12, 1991
** Commenced operations on May 1, 2000
Growth Opportunities Series- 1
Delaware VIP Trust — Delaware VIP Growth Opportunities Series (continued)

The chart shows a $10,000 investment in the Delaware VIP Growth Opportunities Series Standard Class shares for the period from Dec. 31, 1996 through Dec. 31, 2006. All distributions were reinvested. The chart also shows $10,000 invested in the Russell Midcap Growth Index for the period from Dec. 31, 1996 through Dec. 31, 2006.
Russell Midcap Growth Index measures the performance of those Russell Midcap companies with higher price-to-book ratios and higher forecasted growth values. The stocks are also members of the Russell 1000 Growth Index. An index is unmanaged and does not reflect the costs of operating a mutual fund, such as the costs of buying, selling, and holding securities. You cannot invest directly in an index.
Earnings from a variable annuity investment or variable life compound tax free until withdrawal, so no adjustments were made for income taxes.
An expense limitation was in effect for the Delaware VIP Growth Opportunities Series during the periods shown.
Performance of Service Class shares will vary due to different charges and expenses.
Performance does not reflect insurance fees related to a variable annuity or variable life investment or the deferred sales charge that would apply to certain withdrawals of investments held for fewer than eight years. Performance shown here would have been reduced if such fees were included and the expense limitation was removed. For more information about fees, consult your variable annuity or variable life prospectus.
Investments in variable products involve risk. Series that invest in small and/or medium-sized companies typically involve greater risk, particularly in the short term, than those investing in larger, more established companies. Some portfolios offer more risk than others. Please read both the contract and underlying prospectus for specific details regarding the product's risk profile.
Growth Opportunities Series- 2
Delaware VIP Trust — Delaware VIP Growth Opportunities Series
Disclosure of Series Expenses
For the Period July 1, 2006 to December 31, 2006
As a shareholder of the Series, you incur ongoing costs, including management fees; distribution and/or service (12b-1) fees; and other Series expenses. This Example is intended to help you understand your ongoing costs (in dollars) of investing in the Series and to compare these costs with the ongoing costs of investing in other mutual funds.
The Example is based on an investment of $1,000 invested at the beginning of the period and held for the entire period from July 1, 2006 to December 31, 2006.
Actual Expenses
The first section of the table shown, "Actual Series Return," provides information about actual account values and actual expenses. You may use the information in this section of the table, together with the amount you invested, to estimate the expenses that you paid over the period. Simply divide your account value by $1,000 (for example, an $8,600 account value divided by $1,000 = 8.6), then multiply the result by the number in the first section under the heading entitled "Expenses Paid During Period" to estimate the expenses you paid on your account during the period.
Hypothetical Example for Comparison Purposes
The second section of the table shown, "Hypothetical 5% Return," provides information about hypothetical account values and hypothetical expenses based on the Series' actual expense ratio and an assumed rate of return of 5% per year before expenses, which is not the Series' actual return. The hypothetical account values and expenses may not be used to estimate the actual ending account balance or expenses you paid for the period. You may use this information to compare the ongoing costs of investing in the Series and other funds. To do so, compare the 5% hypothetical example with the 5% hypothetical examples that appear in the shareholder reports of other funds.
Please note that the expenses shown in the table are meant to highlight your ongoing costs only. As a shareholder of the Series, you do not incur any transaction costs, such as sales charges (loads), redemption fees or exchange fees, but shareholders of other funds may incur such costs. Also, the fees related to the variable annuity investment or the deferred sales charge that could apply have not been included. Therefore, the second section of the table is useful in comparing ongoing costs only, and will not help you determine the relative total costs of owning different funds. The Series' actual expenses shown in the table reflect fee waivers in effect for Service Class shares. The expenses shown in the table assume reinvestment of all dividends and distributions.
Expense Analysis of an Investment of $1,000
| | | Beginning
Account
Value
7/1/06 | | Ending
Account
Value
12/31/06 | | Annualized
Expense
Ratios | | Expenses
Paid During
Period
7/1/06 to
12/31/06* | |
| Actual Series Return | |
| Standard Class | | $ | 1,000.00 | | | $ | 1,032.20 | | | | 0.93 | % | | $ | 4.76 | | |
| Service Class | | | 1,000.00 | | | | 1,030.40 | | | | 1.18 | % | | | 6.04 | | |
| Hypothetical 5% Return (5% return before expenses) | |
| Standard Class | | $ | 1,000.00 | | | $ | 1,020.52 | | | | 0.93 | % | | $ | 4.74 | | |
| Service Class | | | 1,000.00 | | | | 1,019.26 | | | | 1.18 | % | | | 6.01 | | |
*"Expenses Paid During Period" are equal to the Series' annualized expense ratio, multiplied by the average account value over the period, multiplied by 184/365 (to reflect the one-half year period).
Growth Opportunities Series- 3
Delaware VIP Trust — Delaware VIP Growth Opportunities Series
Sector Allocation and Top 10 Holdings
As of December 31, 2006
Sector designations may be different than the sector designations presented in other Series materials.
| Sector | | Percentage
of Net Assets | |
| Common Stock | | | 99.44 | % | |
| Basic Industry/Capital Goods | | | 9.96 | % | |
| Business Services | | | 10.59 | % | |
| Consumer Durables | | | 2.07 | % | |
| Consumer Non-Durables | | | 14.23 | % | |
| Consumer Services | | | 6.66 | % | |
| Energy | | | 6.65 | % | |
| Financials | | | 9.99 | % | |
| Health Care | | | 13.02 | % | |
| Technology | | | 24.19 | % | |
| Transportation | | | 2.08 | % | |
| Repurchase Agreements | | | 0.04 | % | |
| Securities Lending Collateral | | | 13.23 | % | |
| Fixed Rate Note | | | 2.50 | % | |
| Variable Rate Notes | | | 10.73 | % | |
| Total Market Value of Securities | | | 112.71 | % | |
| Obligation to Return Securities Lending Collateral | | | (13.23 | %) | |
| Receivables and Other Assets Net of Liabilities | | | 0.52 | % | |
| Total Net Assets | | | 100.00 | % | |
Holdings are for informational purposes only and are subject to change at any time. They are not a recommendation to buy, sell, or hold any security.
| Top 10 Holdings | | Percentage
of Net Assets | |
| Staples | | | 3.08 | % | |
| Marriott International Class A | | | 2.46 | % | |
| Coach | | | 2.43 | % | |
| National Oilwell Varco | | | 2.36 | % | |
| Hologic | | | 2.09 | % | |
| Allegheny Technologies | | | 2.08 | % | |
| Activision | | | 2.07 | % | |
| Network Appliance | | | 2.05 | % | |
| Starwood Hotels & Resorts Worldwide | | | 2.04 | % | |
| Nordstrom | | | 2.01 | % | |
Growth Opportunities Series- 4
Delaware VIP Trust — Delaware VIP Growth Opportunities Series
Statement of Net Assets
December 31, 2006
| | | Number of
Shares | | Market
Value | |
| COMMON STOCK–99.44% | |
| Basic Industry/Capital Goods–9.96% | |
| Allegheny Technologies | | | 11,700 | | | $ | 1,060,956 | | |
| * Graco | | | 23,700 | | | | 938,994 | | |
| Joy Global | | | 20,600 | | | | 995,804 | | |
| † Mettler-Toledo International | | | 10,300 | | | | 812,155 | | |
| Oshkosh Truck | | | 11,900 | | | | 576,198 | | |
| * Trinity Industries | | | 19,900 | | | | 700,480 | | |
| | | | | | | | 5,084,587 | | |
| Business Services–10.59% | |
| † Dun & Bradstreet | | | 8,700 | | | | 720,273 | | |
| Expeditors International Washington | | | 21,900 | | | | 886,950 | | |
| † Fiserv | | | 14,300 | | | | 749,606 | | |
| Global Payments | | | 15,200 | | | | 703,760 | | |
| Paychex | | | 23,300 | | | | 921,282 | | |
| Robert Half International | | | 16,400 | | | | 608,768 | | |
| † WESCO International | | | 13,900 | | | | 817,459 | | |
| | | | | | | | 5,408,098 | | |
| Consumer Durables–2.07% | |
| †��Activision | | | 61,300 | | | | 1,056,812 | | |
| | | | | | | | 1,056,812 | | |
| Consumer Non-Durables–14.23% | |
| American Eagle Outfitters | | | 30,000 | | | | 936,300 | | |
| * Bebe Stores | | | 26,300 | | | | 520,477 | | |
| † Coach | | | 28,900 | | | | 1,241,544 | | |
| Family Dollar Stores | | | 13,100 | | | | 384,223 | | |
| *† J. Crew | | | 5,700 | | | | 219,735 | | |
| Nordstrom | | | 20,800 | | | | 1,026,272 | | |
| Staples | | | 58,900 | | | | 1,572,630 | | |
| † Starbucks | | | 20,200 | | | | 715,484 | | |
| Whole Foods Market | | | 13,800 | | | | 647,634 | | |
| | | | | | | | 7,264,299 | | |
| Consumer Services–6.66% | |
| Host Hotels & Resorts | | | 23,038 | | | | 565,583 | | |
| Marriott International Class A | | | 26,300 | | | | 1,255,036 | | |
| Starwood Hotels & Resorts Worldwide | | | 16,700 | | | | 1,043,750 | | |
| † Wynn Resorts | | | 5,700 | | | | 534,945 | | |
| | | | | | | | 3,399,314 | | |
| Energy–6.65% | |
| Chesapeake Energy | | | 27,000 | | | | 784,350 | | |
| † Helix Energy Solutions | | | 17,600 | | | | 552,112 | | |
| † National Oilwell Varco | | | 19,700 | | | | 1,205,246 | | |
| Smith International | | | 20,800 | | | | 854,256 | | |
| | | | | | | | 3,395,964 | | |
| Financials–9.99% | |
| *† Affiliated Managers | | | 8,900 | | | | 935,657 | | |
| Compass Bancshares | | | 11,500 | | | | 685,975 | | |
| † E Trade Financial | | | 23,200 | | | | 520,144 | | |
| Legg Mason | | | 6,400 | | | | 608,320 | | |
| Lehman Brothers | | | 13,000 | | | | 1,015,560 | | |
| Nuveen Investments Class A | | | 15,600 | | | | 809,328 | | |
| Zions Bancorp | | | 6,400 | | | | 527,616 | | |
| | | | | | | | 5,102,600 | | |
| | | Number of
Shares | | Market
Value | |
| COMMON STOCK (continued) | |
| Health Care–13.02% | |
| Caremark Rx | | | 12,000 | | | $ | 685,320 | | |
| Dade Behring | | | 19,200 | | | | 764,352 | | |
| † Express Scripts | | | 7,900 | | | | 565,640 | | |
| *† Hologic | | | 22,700 | | | | 1,073,256 | | |
| *† Invitrogen | | | 15,300 | | | | 865,827 | | |
| † Medco Health Solutions | | | 16,700 | | | | 892,448 | | |
| *† MGI Pharma | | | 29,600 | | | | 544,936 | | |
| Omnicare | | | 12,000 | | | | 463,560 | | |
| *† PDL BioPharma | | | 39,400 | | | | 793,516 | | |
| | | | | | | | 6,648,855 | | |
| Technology–24.19% | |
| † Amdocs | | | 16,700 | | | | 647,125 | | |
| † Broadcom Class A | | | 26,850 | | | | 867,524 | | |
| † Ciena | | | 19,685 | | | | 545,471 | | |
| † Citrix Systems | | | 11,800 | | | | 319,190 | | |
| † F5 Networks | | | 7,900 | | | | 586,259 | | |
| † Focus Media ADR | | | 10,400 | | | | 690,456 | | |
| † Integrated Device Technology | | | 15,900 | | | | 246,132 | | |
| Intersil Class A | | | 22,800 | | | | 545,376 | | |
| L-3 Communications | | | 9,400 | | | | 768,732 | | |
| † Marvell Technology | | | 36,900 | | | | 708,111 | | |
| *† Microsemi | | | 37,500 | | | | 736,875 | | |
| † Network Appliance | | | 26,700 | | | | 1,048,776 | | |
| † NII Holdings | | | 14,800 | | | | 953,712 | | |
| *† NutriSystem | | | 9,700 | | | | 614,883 | | |
| *† Polycom | | | 26,000 | | | | 803,660 | | |
| *† salesforce.com | | | 15,700 | | | | 572,265 | | |
| † SanDisk | | | 8,700 | | | | 374,361 | | |
| Satyam Computer Services ADR | | | 28,000 | | | | 672,280 | | |
| † Tellabs | | | 63,300 | | | | 649,458 | | |
| | | | | | | | 12,350,646 | | |
| Transportation–2.08% | |
| * Hunt (J.B.) Transport Services | | | 24,100 | | | | 500,557 | | |
| UTi Worldwide | | | 18,700 | | | | 559,130 | | |
| | | | | | | | 1,059,687 | | |
Total Common Stock
(cost $39,818,926) | | | | | | | 50,770,862 | | |
| | | Principal | | Amount | |
| REPURCHASE AGREEMENTS–0.04% | |
With BNP Paribas 4.80% 1/2/07
(dated 12/29/06, to be repurchased at $7,224,
collateralized by $7,560 U.S. Treasury Bills
due 6/28/07, market value $7,374) | | $ | 7,220 | | | | 7,220 | | |
With Cantor Fitzgerald 4.82% 1/2/07
(dated 12/29/06, to be repurchased at $8,685,
collateralized by $750 U.S. Treasury Notes
4.00% due 6/15/09, market value $738, $4,650
U.S. Treasury Notes 6.125% due 8/15/07,
market value $4,788 and $3,100
U.S. Treasury Notes 6.50% due 2/15/10,
market value $3,334) | | | 8,680 | | | | 8,680 | | |
Growth Opportunities Series- 5
Delaware VIP Growth Opportunities Series
Statement of Net Assets (continued)
| | | Principal
Amount | | Market
Value | |
| REPURCHASE AGREEMENTS (continued) | |
With UBS Warburg 4.75% 1/2/07
(dated 12/29/06, to be repurchased at $3,102,
collateralized by $3,200 U.S. Treasury Bills
due 3/29/07, market value $3,164) | | $ | 3,100 | | | $ | 3,100 | | |
Total Repurchase Agreements
(cost $19,000) | | | | | | | 19,000 | | |
Total Market Value of Securities
Before Securities Lending
Collateral–99.48%
(cost $39,837,926) | | | | | | | 50,789,862 | | |
| SECURITIES LENDING COLLATERAL**–13.23% | |
| Short-Term Investments | |
| Fixed Rate Note – 2.50% | |
Citigroup Global Markets
5.32% 1/2/07 | | | 1,277,883 | | | | 1,277,883 | | |
| | | | | | | | 1,277,883 | | |
| • Variable Rate Notes–10.73% | | | | | | | | | |
American Honda Finance
5.32% 2/21/07 | | | 165,252 | | | | 165,252 | | |
| ANZ National 5.35% 1/29/08 | | | 36,723 | | | | 36,723 | | |
| Australia New Zealand 5.35% 1/29/08 | | | 183,614 | | | | 183,613 | | |
| Bank of America 5.32% 2/23/07 | | | 238,698 | | | | 238,698 | | |
| Bank of New York 5.34% 1/29/08 | | | 146,891 | | | | 146,891 | | |
| Barclays New York 5.31% 5/18/07 | | | 238,698 | | | | 238,698 | | |
| Bayerische Landesbank 5.40% 1/29/08 | | | 183,614 | | | | 183,614 | | |
| | | Principal
Amount | | Market
Value | |
| SECURITY LENDING COLLATERAL (continued) | |
| Short-Term Investments (continued) | |
| • Variable Rate Notes (continued) | | | | | | | | | |
| Bear Stearns 5.41% 6/29/07 | | $ | 220,336 | | | $ | 220,336 | | |
| BNP Paribas 5.35% 1/29/08 | | | 183,614 | | | | 183,613 | | |
| Canadian Imperial Bank 5.33% 1/29/09 | | | 128,529 | | | | 128,529 | | |
| CDC Financial 5.36% 1/29/07 | | | 238,698 | | | | 238,698 | | |
| Citigroup Global Markets 5.38% 1/5/07 | | | 238,698 | | | | 238,698 | | |
| Commonwealth Bank 5.35% 1/29/08 | | | 183,614 | | | | 183,613 | | |
| Deutsche Bank 5.34% 2/23/07 | | | 220,336 | | | | 220,336 | | |
| Dexia Bank 5.33% 9/28/07 | | | 257,058 | | | | 257,021 | | |
| Goldman Sachs 5.45% 12/28/07 | | | 238,698 | | | | 238,698 | | |
| Marshall & Ilsley Bank 5.33% 1/29/08 | | | 201,975 | | | | 201,975 | | |
Merrill Lynch Mortgage Capital
5.41% 1/8/07 | | | 238,698 | | | | 238,698 | | |
| Morgan Stanley 5.49% 1/29/08 | | | 238,698 | | | | 238,698 | | |
| National Australia Bank 5.32% 3/7/07 | | | 227,681 | | | | 227,681 | | |
| National City Bank 5.32% 3/2/07 | | | 220,343 | | | | 220,356 | | |
| National Rural Utilities 5.34% 1/29/08 | | | 290,109 | | | | 290,109 | | |
| Nordea Bank New York 5.31% 5/16/07 | | | 91,806 | | | | 91,804 | | |
| Nordea Bank Norge 5.36% 1/29/08 | | | 183,614 | | | | 183,614 | | |
| Royal Bank of Scotland 5.34% 1/29/08 | | | 183,614 | | | | 183,614 | | |
| Societe Generale 5.32% 1/29/08 | | | 91,807 | | | | 91,807 | | |
| Toronto Dominion 5.32% 5/29/07 | | | 220,336 | | | | 220,336 | | |
| Wells Fargo 5.36% 1/29/08 | | | 183,614 | | | | 183,614 | | |
| | | | | | | | 5,475,337 | | |
Total Securities Lending Collateral
(cost $6,753,220) | | | | | | | 6,753,220 | | |
| TOTAL MARKET VALUE OF SECURITIES – 112.71% (cost $46,591,146) | | | 57,543,082 | v | |
| OBLIGATION TO RETURN SECURITIES LENDING COLLATERAL** – (13.23%) | | | (6,753,220 | ) | |
| RECEIVABLES AND OTHER ASSETS NET OF LIABILITIES – 0.52% | | | 265,501 | | |
| NET ASSETS APPLICABLE TO 2,709,600 SHARES OUTSTANDING – 100.00% | | $ | 51,055,363 | | |
| NET ASSET VALUE – DELAWARE VIP GROWTH OPPORTUNITIES SERIES STANDARD CLASS ($38,858,902 / 2,055,403 Shares) | | $ | 18.91 | | |
| NET ASSET VALUE – DELAWARE VIP GROWTH OPPORTUNITIES SERIES SERVICE CLASS ($12,196,461 / 654,197 Shares) | | $ | 18.64 | | |
| COMPONENTS OF NET ASSETS AT DECEMBER 31, 2006: | |
| Shares of beneficial interest (unlimited authorization–no par) | | $ | 44,936,524 | | |
| Accumulated net realized loss on investments | | | (4,833,097 | ) | |
| Net unrealized appreciation of investments | | | 10,951,936 | | |
| Total net assets | | $ | 51,055,363 | | |
* Fully or partially on loan.
** See Note 8 in "Notes to Financial Statements."
v Includes $6,632,572 of securities loaned.
† Non-income producing security for the year ended December 31, 2006.
• Variable rate security. The rate shown is the rate as of December 31, 2006.
ADR – American Depositary Receipts
See accompanying notes
Growth Opportunities Series-6
Delaware VIP Trust — Delaware VIP
Growth Opportunities Series
Statement of Operations
Year Ended December 31, 2006
Delaware VIP Trust — Delaware VIP
Growth Opportunities Series
Statements of Changes in Net Assets
| INVESTMENT INCOME: | |
| Dividends | | $ | 321,123 | | |
| Interest | | | 107,756 | | |
| Securities lending income | | | 9,433 | | |
| | | | 438,312 | | |
| EXPENSES: | |
| Management fees | | | 414,292 | | |
| Distribution expenses - Service Class | | | 39,051 | | |
| Accounting and administration expenses | | | 22,096 | | |
| Reports and statements to shareholders | | | 19,308 | | |
| Audit and tax | | | 13,136 | | |
| Trustees' fees and benefits | | | 9,378 | | |
| Legal fees | | | 6,038 | | |
| Dividend disbursing and transfer agent fees and expenses | | | 5,523 | | |
| Custodian fees | | | 4,228 | | |
| Dues and services | | | 1,933 | | |
| Consulting fees | | | 1,787 | | |
| Insurance fees | | | 1,672 | | |
| Pricing fees | | | 439 | | |
| Trustees' expenses | | | 269 | | |
| Taxes (other than taxes on income) | | | 84 | | |
| Registration fees | | | 52 | | |
| Other | | | 44 | | |
| | | | 539,330 | | |
| Less waiver of distribution expenses - Service Class | | | (6,509 | ) | |
| Less expense paid indirectly | | | (41 | ) | |
| Total operating expenses | | | 532,780 | | |
| NET INVESTMENT LOSS | | | (94,468 | ) | |
NET REALIZED AND UNREALIZED GAIN (LOSS)
ON INVESTMENTS: | |
| Net realized gain on investments | | | 6,652,389 | | |
Net change in unrealized appreciation/depreciation
of investments | | | (3,075,782 | ) | |
NET REALIZED AND UNREALIZED GAIN
ON INVESTMENTS | | | 3,576,607 | | |
NET INCREASE IN NET ASSETS RESULTING
FROM OPERATIONS | | $ | 3,482,139 | | |
See accompanying notes
| | | Year Ended | |
| | | 12/31/06 | | 12/31/05 | |
INCREASE (DECREASE) IN NET
ASSETS FROM OPERATIONS: | |
| Net investment loss | | $ | (94,468 | ) | | $ | (256,753 | ) | |
| Net realized gain on investments | | | 6,652,389 | | | | 7,465,944 | | |
Net change in unrealized appreciation/
depreciation of investments | | | (3,075,782 | ) | | | (732,587 | ) | |
Net increase in net assets
resulting from operations | | | 3,482,139 | | | | 6,476,604 | | |
| CAPITAL SHARE TRANSACTIONS: | |
| Proceeds from shares sold: | |
| Standard Class | | | 38,229,325 | | | | 1,424,558 | | |
| Service Class | | | 12,382,384 | | | | 1,280,534 | | |
| | | | 50,611,709 | | | | 2,705,092 | | |
| Cost of shares repurchased: | |
| Standard Class | | | (48,030,272 | ) | | | (17,343,946 | ) | |
| Service Class | | | (15,056,667 | ) | | | (3,746,289 | ) | |
| | | | (63,086,939 | ) | | | (21,090,235 | ) | |
Decrease in net assets derived from
capital share transactions | | | (12,475,230 | ) | | | (18,385,143 | ) | |
| NET DECREASE IN NET ASSETS | | | (8,993,091 | ) | | | (11,908,539 | ) | |
| NET ASSETS: | |
| Beginning of year | | | 60,048,454 | | | | 71,956,993 | | |
End of year (there was no undistributed
net investment income at either year end) | | $ | 51,055,363 | | | $ | 60,048,454 | | |
See accompanying notes
Growth Opportunities Series-7
Delaware VIP Trust — Delaware VIP Growth Opportunities Series
Financial Highlights
Selected data for each share of the Series outstanding throughout each period were as follows:
| | | Delaware VIP Growth Opportunities Series Standard Class | |
| | | Year Ended | |
| | | 12/31/06 | | 12/31/05 | | 12/31/04 | | 12/31/03 | | 12/31/02 | |
| Net asset value, beginning of period | | $ | 17.780 | | | $ | 15.960 | | | $ | 14.190 | | | $ | 10.060 | | | $ | 15.010 | | |
| Income (loss) from investment operations: | |
| Net investment loss1 | | | (0.021 | ) | | | (0.056 | ) | | | (0.031 | ) | | | (0.032 | ) | | | (0.025 | ) | |
| Net realized and unrealized gain (loss) on investments | | | 1.151 | | | | 1.876 | | | | 1.801 | | | | 4.162 | | | | (3.351 | ) | |
| Total from investment operations | | | 1.130 | | | | 1.820 | | | | 1.770 | | | | 4.130 | | | | (3.376 | ) | |
| Less dividends and distributions from: | |
| Return of capital | | | – | | | | – | | | | – | | | | – | | | | (1.574 | ) | |
| Total dividends and distributions | | | – | | | | – | | | | – | | | | – | | | | (1.574 | ) | |
| Net asset value, end of period | | $ | 18.910 | | | $ | 17.780 | | | $ | 15.960 | | | $ | 14.190 | | | $ | 10.060 | | |
| Total return2 | | | 6.36 | % | | | 11.40 | % | | | 12.47 | % | | | 41.05 | % | | | (24.94 | %) | |
| Ratios and supplemental data: | |
| Net assets, end of period (000 omitted) | | $ | 38,859 | | | $ | 46,000 | | | $ | 56,875 | | | $ | 65,368 | | | $ | 60,964 | | |
| Ratio of expenses to average net assets | | | 0.91 | % | | | 0.90 | % | | | 0.84 | % | | | 0.85 | % | | | 0.87 | % | |
| Ratio of net investment loss to average net assets | | | (0.11 | %) | | | (0.35 | %) | | | (0.21 | %) | | | (0.27 | %) | | | (0.21 | %) | |
| Portfolio turnover | | | 67 | % | | | 75 | % | | | 94 | % | | | 94 | % | | | 88 | % | |
1The average shares outstanding method has been applied for per share information.
2Total investment return is based on the change in net asset value of a share during the period and assumes reinvestment of dividends and distributions at net asset value.
See accompanying notes
Growth Opportunities Series-8
Delaware VIP Growth Opportunities Series
Financial Highlights (continued)
Selected data for each share of the Series outstanding throughout each period were as follows:
| | | Delaware VIP Growth Opportunities Series Service Class | |
| | | Year Ended | |
| | | 12/31/06 | | 12/31/05 | | 12/31/04 | | 12/31/03 | | 12/31/02 | |
| Net asset value, beginning of period | | $ | 17.580 | | | $ | 15.810 | | | $ | 14.100 | | | $ | 10.010 | | | $ | 14.970 | | |
| Income (loss) from investment operations: | |
| Net investment loss1 | | | (0.066 | ) | | | (0.096 | ) | | | (0.066 | ) | | | (0.058 | ) | | | (0.043 | ) | |
| Net realized and unrealized gain (loss) on investments | | | 1.126 | | | | 1.866 | | | | 1.776 | | | | 4.148 | | | | (3.343 | ) | |
| Total from investment operations | | | 1.060 | | | | 1.770 | | | | 1.710 | | | | 4.090 | | | | (3.386 | ) | |
| Less dividends and distributions from: | |
| Return of capital | | | – | | | | – | | | | – | | | | – | | | | (1.574 | ) | |
| Total dividends and distributions | | | – | | | | – | | | | – | | | | – | | | | (1.574 | ) | |
| Net asset value, end of period | | $ | 18.640 | | | $ | 17.580 | | | $ | 15.810 | | | $ | 14.100 | | | $ | 10.010 | | |
| Total return2 | | | 6.03 | % | | | 11.20 | % | | | 12.13 | % | | | 40.86 | % | | | (25.09 | %) | |
| Ratios and supplemental data: | |
| Net assets, end of period (000 omitted) | | $ | 12,196 | | | $ | 14,048 | | | $ | 15,082 | | | $ | 16,906 | | | $ | 15,275 | | |
| Ratio of expenses to average net assets | | | 1.16 | % | | | 1.15 | % | | | 1.09 | % | | | 1.07 | % | | | 1.02 | % | |
Ratio of expenses to average net assets prior to expense
limitation and expenses paid indirectly | | | 1.21 | % | | | 1.20 | % | | | 1.14 | % | | | 1.10 | % | | | 1.02 | % | |
| Ratio of net investment loss to average net assets | | | (0.36 | %) | | | (0.60 | %) | | | (0.46 | %) | | | (0.49 | %) | | | (0.36 | %) | |
Ratio of net investment loss to average net assets prior
to expense limitation and expenses paid indirectly | | | (0.41 | %) | | | (0.65 | %) | | | (0.51 | %) | | | (0.52 | %) | | | (0.36 | %) | |
| Portfolio turnover | | | 67 | % | | | 75 | % | | | 94 | % | | | 94 | % | | | 88 | % | |
1The average shares outstanding method has been applied for per share information.
2Total investment return is based on the change in net asset value of a share during the period and assumes reinvestment of dividends and distributions at net asset value. Total investment return reflects waivers and payment of fees by the distributor, as applicable. Performance would have been lower had the expense limitation and waiver not been in effect.
See accompanying notes
Growth Opportunities Series- 9
Delaware VIP Trust — Delaware VIP Growth Opportunities Series
Notes to Financial Statements
December 31, 2006
Delaware VIP Trust (the "Trust") is organized as a Delaware statutory trust and offers 15 series: Delaware VIP Balanced Series, Delaware VIP Capital Reserves Series, Delaware VIP Cash Reserve Series, Delaware VIP Diversified Income Series, Delaware VIP Emerging Markets Series, Delaware VIP Global Bond Series, Delaware VIP Growth Opportunities Series, Delaware VIP High Yield Series, Delaware VIP International Value Equity Series, Delaware VIP REIT Series, Delaware VIP Select Growth Series, Delaware VIP Small Cap Value Series, Delaware VIP Trend Series, Delaware VIP U.S. Growth Series and Delaware VIP Value Series. These financial statements and the related notes pertain to Delaware VIP Growth Opportunities Series (the "Series"). The Trust is an open-end investment company. The Series is considered diversified under the Investment Company Act of 1940, as amended, and offers Standard Class and Service Class shares. The Standard Class shares do not carry a 12b-1 fee and the Service Class shares carry a 12b-1 fee. The shares of the Series are sold only to separate accounts of life insurance companies.
The investment objective of the Series is to seek long-term capital appreciation.
1. Significant Accounting Policies
The following accounting policies are in accordance with U.S. generally accepted accounting principles and are consistently followed by the Series.
Security Valuation—Equity securities, except those traded on the Nasdaq Stock Market, Inc. (Nasdaq), are valued at the last quoted sales price as of the time of the regular close of the New York Stock Exchange (NYSE) on the valuation date. Securities traded on the Nasdaq are valued in accordance with the Nasdaq Official Closing Price, which may not be the last sales price. If on a particular day an equity security does not trade, then the mean between the bid and asked prices will be used. Short-term debt securities having less than 60 days to maturity are valued at amortized cost, which approximates market value. Securities lending collateral is valued at amortized cost, which approximates market value. Other securities and assets for which market quotations are not readily available are valued at fair value as determined in good faith under the direction of the Series' Board of Trustees. In determining whether market quotations are readily available or fair valuation will be used, various factors will be taken into consideration, such as market closures, aftermarket trading, or significant events after local market trading (e.g., government actions or pronouncements, trading volume or volatility on markets, exchanges among dealers, or news events).
In September 2006, the Financial Accounting Standards Board (FASB) issued FASB Statement No. 157 "Fair Value Measurements" (Statement 157). Statement 157 establishes a framework for measuring fair value in generally accepted accounting principles, clarifies the definition of fair value within that framework, and expands disclosures about the use of fair value measurements. Statement 157 is intended to increase consistency and comparability among fair value estimates used in financial reporting. Statement 157 is effective for fiscal years beginning after November 15, 2007. Management does not expect the adoption of Statement 157 to have an impact on the amounts reported in the financial statements.
Federal Income Taxes—The Series intends to continue to qualify for federal income tax purposes as a regulated investment company and make the requisite distributions to shareholders. Accordingly, no provision for federal income taxes has been made in the financial statements.
On July 13, 2006, FASB released FASB Interpretation No. 48 "Accounting for Uncertainty in Income Taxes" (FIN 48). FIN 48 provides guidance for how uncertain tax positions should be recognized, measured, presented and disclosed in the financial statements. FIN 48 requires the evaluation of tax positions taken or expected to be taken in the course of preparing the Series' tax returns to determine whether the tax positions are "more-likely-than-not" of being sustained by the applicable tax authority. Tax positions not deemed to meet the more-likely-than-not threshold would be recorded as a tax benefit or expense in the current year. Adoption of FIN 48 is required for fiscal years beginning after December 15, 2006 and is to be applied to all open tax years as of the effective date. Recent SEC guidance allows implementing FIN 48 in Series net asset value calculations as late as the Series' last net asset value calculation in the first required fi nancial statement reporting period. As a result, the Series will incorporate FIN 48 in its semiannual report on June 30, 2007. Although the Series' tax positions are currently being evaluated, management does not expect the adoption of FIN 48 to have a material impact on the Series' financial statements.
Class Accounting—Investment income, common expenses and realized and unrealized gain (loss) on investments are allocated to the classes of the Series on the basis of daily net assets of each class. Distribution expenses relating to a specific class are charged directly to that class.
Repurchase Agreements—The Series may invest in a pooled cash account along with other members of the Delaware Investments® Family of Funds pursuant to an exemptive order issued by the Securities and Exchange Commission. The aggregate daily balance of the pooled cash account is invested in repurchase agreements secured by obligations of the U.S. government. The respective collateral is held by the Series' custodian bank until the maturity of the respective repurchase agreements. Each repurchase agreement is at least 102% collateralized. However, in the event of default or bankruptcy by the counterparty to the agreement, realization of the collateral may be subject to legal proceedings.
Use of Estimates—The preparation of financial statements in conformity with U.S. generally accepted accounting principles requires management to make estimates and assumptions that affect the reported amounts of assets and liabilities at the date of the financial statements and the reported amounts of revenues and expenses during the reporting period. Actual results could differ from those estimates.
Other—Expenses directly attributable to the Series are charged directly to the Series. Other expenses common to various funds within the Delaware Investments® Family of Funds are generally allocated amongst such funds on the basis of average net assets. Management fees and some other expenses are paid monthly. Security transactions are recorded on the date the securities are purchased or sold (trade date) for financial reporting purposes. Costs used in calculating realized gains and losses on the sale of investment securities are those of the specific securities sold. Dividend income is recorded on the ex-dividend date and interest income is recorded on the accrual basis.
The Series declares and pays dividends from net investment income and distributions from net realized gain on investments, if any, following the close of the fiscal year.
Growth Opportunities Series- 10
Delaware VIP Growth Opportunities Series
Notes to Financial Statements (continued)
1. Significant Accounting Policies (continued)
Subject to seeking best execution, the Series may direct certain security trades to brokers who have agreed to rebate a portion of the related brokerage commission to the Series in cash. Such commission rebates are included in realized gain on investments in the accompanying financial statements and totaled $12,381 for the year ended December 31, 2006. In general, best execution refers to many factors, including the price paid or received for a security, the commission charged, the promptness and reliability of execution, the confidentiality and placement accorded the order, and other factors affecting the overall benefit obtained by the Series on the transaction.
The Series may receive earnings credits from its custodian when positive cash balances are maintained, which are used to offset custody fees. The expense paid under this arrangement is included in custodian fees on the Statement of Operations with the corresponding expense offset shown as "expense paid indirectly."
2. Investment Management, Administration Agreements and Other Transactions with Affiliates
In accordance with the terms of its investment management agreement, the Series pays Delaware Management Company (DMC), a series of Delaware Management Business Trust and the investment manager, an annual fee which is calculated daily at the rate of 0.75% on the first $500 million of average daily net assets of the Series, 0.70% on the next $500 million, 0.65% on the next $1.5 billion, and 0.60% on average daily net assets in excess of $2.5 billion.
DMC has contractually agreed to waive that portion, if any, of its management fee and reimburse the Series to the extent necessary to ensure that annual operating expenses, exclusive of taxes, interest, brokerage commissions, distribution fees, certain insurance costs and extraordinary expenses, do not exceed 0.95% of average daily net assets of the Series through April 30, 2007. Prior to May 1, 2006, the expense limitation was 0.90% of average daily net assets. No reimbursement was due for the year ended December 31, 2006.
Delaware Service Company, Inc. (DSC), an affiliate of DMC, provides accounting, administration, dividend disbursing and transfer agent services. The Series pays DSC a monthly fee computed at the annual rate of 0.04% of the Series' average daily net assets for accounting and administrative services. The Series pays DSC a monthly fee based on average net assets for dividend disbursing and transfer agent services.
Pursuant to a distribution agreement and distribution plan, the Series pays Delaware Distributors, L.P. (DDLP), the distributor and an affiliate of DMC, an annual distribution and service fee not to exceed 0.30% of the average daily net assets of the Service Class shares. DDLP has contracted to waive distribution and service fees through April 30, 2007 in order to prevent distribution and service fees of the Service Class shares from exceeding 0.25% of average daily net assets. Standard Class shares pay no distribution and service expenses.
At December 31, 2006, the Series had liabilities payable to affiliates as follows:
Investment
Management
Fee Payable to
DMC | | Dividend Disbursing,
Transfer Agent, Accounting
and Administration Fees
and Other Expenses
Payable to DSC | | Distribution
Fees Payable
to DDLP | | Other
Expenses
Payable
to DMC
and Affiliates* | |
| $ | 33,083 | | | $ | 2,462 | | | $ | 2,640 | | | $ | 1,881 | | |
*DMC, as part of its administrative services, pays operating expenses on behalf of the Series and is reimbursed on a periodic basis. Such expenses include items such as printing of shareholder reports, fees for audit, legal and tax services, custodian fees and trustees' fees.
As provided in the investment management agreement, the Series bears the cost of certain legal and tax services, including internal legal and tax services provided to the Series by DMC and/or its affiliates' employees. For the year ended December 31, 2006, the Series was charged $2,580 for internal legal and tax services provided by DMC and/or its affiliates' employees.
Trustees' fees and benefits include expenses accrued by the Series for each Trustee's retainer, per meeting fees and retirement benefits. Independent Trustees with over five years of uninterrupted service are eligible to participate in a retirement plan that provides for the payment of benefits upon retirement. The amount of the retirement benefit is based on factors set forth in the plan, including the number of years of service. On November 16, 2006, the Board of Trustees unanimously voted to terminate the retirement plan. Payments equal to the net present value of the earned benefits will be made in 2007 to those independent trustees so entitled. The retirement benefit payout for the Series is $6,312. Certain officers of DMC, DSC and DDLP are officers and/or trustees of the Trust. These officers and trustees are paid no compensation by the Series.
Growth Opportunities Series- 11
Delaware VIP Growth Opportunities Series
Notes to Financial Statements (continued)
3. Investments
For the year ended December 31, 2006, the Series made purchases and sales of investment securities other than short-term investments as follows:
| Purchases | | $ | 36,012,814 | | |
| Sales | | | 48,012,211 | | |
At December 31, 2006, the cost of investments for federal income tax purposes and unrealized appreciation (depreciation) for the Series were as follows:
Cost of
Investments | | Aggregate
Unrealized
Appreciation | | Aggregate
Unrealized
Depreciation | | Net Unrealized
Appreciation | |
| $ | 46,656,656 | | | $ | 12,588,184 | | | $ | (1,701,758 | ) | | $ | 10,886,426 | | |
4. Dividend and Distribution Information
Income and long-term capital gain distributions are determined in accordance with federal income tax regulations, which may differ from U.S. generally accepted accounting principles. Additionally, net short-term gains on sales of investment securities are treated as ordinary income for federal income tax purposes. There were no dividends and distributions paid during the years ended December 31, 2006 and 2005.
5. Components of Net Assets on a Tax Basis
As of December 31, 2006, the components of net assets on a tax basis were as follows:
| Shares of beneficial interest | | $ | 44,936,524 | | |
| Capital loss carryforwards | | | (4,767,587 | ) | |
| Unrealized appreciation of investments | | | 10,886,426 | | |
| Net assets | | $ | 51,055,363 | | |
The differences between book basis and tax basis components of net assets are primarily attributable to tax deferral of losses on wash sales.
For financial reporting purposes, capital accounts are adjusted to reflect the tax character of permanent book/tax differences. Reclassifications are primarily due to tax treatment of net operating losses. Results of operations and net assets were not affected by these reclassifications. For the year ended December 31, 2006, the Series recorded the following reclassifications:
Accumulated
Net
Investment Loss | | Paid-in
Capital | |
| $ | 94,468 | | | $ | (94,468 | ) | |
For federal income tax purposes, capital loss carryforwards may be carried forward and applied against future capital gains. $6,244,728 was utilized in 2006. Capital loss carryforwards of $4,767,587 remaining at December 31, 2006 will expire in 2010.
Growth Opportunities Series- 12
Delaware VIP Growth Opportunities Series
Notes to Financial Statements (continued)
6. Capital Shares
Transactions in capital shares were as follows:
| | | Year
Ended
12/31/06 | | Year
Ended
12/31/05 | |
| Shares sold: | |
| Standard Class | | | 2,215,596 | | | | 86,824 | | |
| Service Class | | | 725,687 | | | | 78,177 | | |
| | | | 2,941,283 | | | | 165,001 | | |
| Shares repurchased: | |
| Standard Class | | | (2,747,292 | ) | | | (1,064,136 | ) | |
| Service Class | | | (870,649 | ) | | | (232,719 | ) | |
| | | | (3,617,941 | ) | | | (1,296,855 | ) | |
| Net decrease | | | (676,658 | ) | | | (1,131,854 | ) | |
7. Line of Credit
The Series, along with certain other funds in the Delaware Investments® Family of Funds (the "Participants"), participates in a $225,000,000 revolving line of credit facility to be used for temporary or emergency purposes as an additional source of liquidity to fund redemptions of investor shares. The Participants are charged an annual commitment fee, which is allocated across the Participants on the basis of each Participant's allocation of the entire facility. The Participants may borrow up to a maximum of one third of their net assets under the agreement. The Series had no amounts outstanding as of December 31, 2006, or at any time during the year then ended.
8. Securities Lending
The Series, along with other funds in the Delaware Investments® Family of Funds, may lend its securities pursuant to a security lending agreement (Lending Agreement) with JPMorgan Chase. Initial security loans made pursuant to the Lending Agreement are required to be secured by U.S. government obligations and/or cash collateral not less than 102% of the market value of the securities issued in the United States. With respect to each loan, if the aggregate market value of the collateral held on any business day is less than the aggregate market value of the securities which are the subject of such loan, the borrower will be notified to provide additional collateral not less than the applicable collateral requirements. Cash collateral received is invested in fixed income securities, with a weighted average maturity not to exceed 90 days, rated in one of the top two tiers by Standard & Poor's Ratings Group or Moody's Investor s Service, Inc. or repurchase agreements collateralized by such securities. However, in the event of default or bankruptcy by the lending agent, realization and/or retention of the collateral may be subject to legal proceedings. In the event the borrower fails to return loaned securities and the collateral received is insufficient to cover the value of the loaned securities and provided such collateral shortfall is not the result of investment losses, the lending agent has agreed to pay the amount of the shortfall to the Series, or at the discretion of the lending agent, replace the loaned securities. The Series continues to record dividends on the securities loaned and is subject to change in value of the securities loaned that may occur during the term of the loan. The Series has the right under the Lending Agreement to recover the securities from the borrower on demand. The security lending agent and the borrower retain a portion of the earnings from the collateral investments. The Series records security lending income net of such allocation.
At December 31, 2006, the market value of securities on loan was $6,632,572, for which cash collateral was received and invested in accordance with the Lending Agreement. Such investments are presented on the Statement of Net Assets under the caption "Securities Lending Collateral."
9. Credit and Market Risk
The Series invests a significant portion of its assets in small- and mid-sized companies and may be subject to certain risks associated with ownership of securities of such companies. Investments in small- or mid-sized companies may be more volatile than investments in larger companies for a number of reasons, which include more limited financial resources or a dependence on narrow product lines.
The Series may invest up to 10% of its total assets in illiquid securities, which may include securities with contractual restrictions on resale, securities exempt from registration under Rule 144A of the Securities Act of 1933, as amended, and other securities which may not be readily marketable. The relative illiquidity of these securities may impair the Series from disposing of them in a timely manner and at a fair price when it is necessary or desirable to do so. While maintaining oversight, the Series' Board of Trustees has delegated to DMC the day-to-day functions of determining whether individual securities are liquid for purposes of the Series' limitation on investments in illiquid assets. At December 31, 2006, there were no Rule 144A securities and no securities have been determined to be illiquid under the Series' Liquidity Procedures.
10. Contractual Obligations
The Series enters into contracts in the normal course of business that contain a variety of indemnifications. The Series' maximum exposure under these arrangements is unknown. However, the Series has not had prior claims or losses pursuant to these contracts. Management has reviewed the Series' existing contracts and expects the risk of loss to be remote.
Growth Opportunities Series- 13
Delaware VIP Trust — Delaware VIP Growth Opportunities Series
Report of Independent Registered Public Accounting Firm
To the Shareholders and Board of Trustees
Delaware VIP Trust–Delaware VIP Growth Opportunities Series
We have audited the accompanying statement of net assets of the Delaware VIP Growth Opportunities Series (one of the series constituting Delaware VIP Trust) (the "Series") as of December 31, 2006, and the related statement of operations for the year then ended, the statements of changes in net assets for each of the two years in the period then ended, and the financial highlights for each of the five years in the period then ended. These financial statements and financial highlights are the responsibility of the Series' management. Our responsibility is to express an opinion on these financial statements and financial highlights based on our audits.
We conducted our audits in accordance with the standards of the Public Company Accounting Oversight Board (United States). Those standards require that we plan and perform the audit to obtain reasonable assurance about whether the financial statements and financial highlights are free of material misstatement. We were not engaged to perform an audit of the Series' internal control over financial reporting. Our audits included consideration of internal control over financial reporting as a basis for designing audit procedures that are appropriate in the circumstances, but not for the purpose of expressing an opinion on the effectiveness of the Series' internal control over financial reporting. Accordingly, we express no such opinion. An audit also includes examining, on a test basis, evidence supporting the amounts and disclosures in the financial statements and financial highlights, assessing the accounting principles used and significant es timates made by management, and evaluating the overall financial statement presentation. Our procedures included confirmation of securities owned as of December 31, 2006, by correspondence with the custodian and brokers. We believe that our audits provide a reasonable basis for our opinion.
In our opinion, the financial statements and financial highlights referred to above present fairly, in all material respects, the financial position of the Delaware VIP Growth Opportunities Series of Delaware VIP Trust at December 31, 2006, the results of its operations for the year then ended, the changes in its net assets for each of the two years in the period then ended, and its financial highlights for each of the five years in the period then ended, in conformity with U.S. generally accepted accounting principles.

Philadelphia, Pennsylvania
February 14, 2007
The Series files its complete schedule of portfolio holdings with the Securities and Exchange Commission for the first and third quarters of each fiscal year on Form N-Q. The Series' Forms N-Q, as well as a description of the policies and procedures that the Series uses to determine how to vote proxies (if any) relating to portfolio securities is available without charge (i) upon request, by calling 800-523-1918; (ii) on the Series' website at http://www.delawareinvestments.com; and (iii) on the Commission's website at http://www.sec.gov. The Series' Forms N-Q may be reviewed and copied at the Commission's Public Reference Room in Washington, DC; information on the operation of the Public Reference Room may be obtained by calling 1-800-SEC-0330.
Information (if any) regarding how the Series voted proxies relating to portfolio securities during the most recently disclosed 12-month period ended June 30 is available without charge (i) through the Series' website at http://www.delawareinvestments.com; and (ii) on the Commission's website at http://www.sec.gov.
Growth Opportunities Series-14
Delaware Investments® Family of Funds
board of trustees/directors and officers addendum
A mutual fund is governed by a Board of Trustees/Directors ("Trustees"), which has oversight responsibility for the management of a fund's business affairs. Trustees establish procedures and oversee and review the performance of the investment manager, the distributor, and others who perform services for the fund. The independent fund trustees, in particular, are advocates for shareholder interests. Each trustee has served in that capacity since he or she was elected to or appointed to the Board of Trustees, and will continue to serve until his or her retirement or the election of a new trustee in his or her place. The following is a list of the Trustees and Officers with certain background and related information.
Name,
Address,
and Birth Date | | Position(s)
Held with
Fund(s) | | Length of Time
Served | | Principal
Occupation(s)
During
Past 5 Years | | Number of
Portfolios in Fund
Complex Overseen
by Trustee
or Officer | | Other
Directorships
Held by
Trustee
or Officer | |
| interested trustees | | | | | | | | | | | | | |
|
Patrick P. Coyne1
2005 Market Street
Philadelphia, PA
19103
April 14, 1963 | | Chairman,
President,
Chief Executive
Officer, and
Trustee | | Chairman and Trustee
since August 16, 2006
President and
Chief Executive Officer
since August 1, 2006 | | Patrick P. Coyne has served in
various executive capacities
at different times at
Delaware Investments.2 | | | 84 | | | None | |
|
| independent trustees | | | | | | | | | | | | | |
|
Thomas L. Bennett
2005 Market Street
Philadelphia, PA
19103
October 4, 1947 | | Trustee | | Since
March 2005 | | Private Investor –
(March 2004 – Present)
Investment Manager –
Morgan Stanley & Co.
(January 1984 – March 2004) | | | 84 | | | None | |
|
John A. Fry
2005 Market Street
Philadelphia, PA
19103
May 28, 1960 | | Trustee | | Since
January 2001 | | President –
Franklin & Marshall College
(June 2002 – Present)
Executive Vice President –
University of Pennsylvania
(April 1995 – June 2002) | | | 84 | | | Director –
Community Health
Systems
Director –
Allied Barton
Security Holdings | |
|
Anthony D. Knerr
2005 Market Street
Philadelphia, PA
19103
December 7, 1938 | | Trustee | | Since
April 1990 | | Founder and Managing Director –
Anthony Knerr & Associates
(Strategic Consulting)
(1990 – Present) | | | 84 | | | None | |
|
Lucinda S. Landreth
2005 Market Street
Philadelphia, PA
19103
June 24, 1947 | | Trustee | | Since
March 2005 | | Chief Investment Officer –
Assurant, Inc.
(Insurance)
(2002 – 2004) | | | 84 | | | None | |
|
Ann R. Leven
2005 Market Street
Philadelphia, PA
19103
November 1, 1940 | | Trustee | | Since
September 1989 | | Consultant –
ARL Associates
(Financial Planning)
(1983 – Present) | | | 84 | | | Director and
Audit Committee
Chairperson – Andy
Warhol Foundation
Director and Audit
Committee Member –
Systemax, Inc. | |
|
Growth Opportunities Series- 15
Name,
Address,
and Birth Date | | Position(s)
Held with
Fund(s) | | Length of Time
Served | | Principal
Occupation(s)
During
Past 5 Years | | Number of
Portfolios in Fund
Complex Overseen
by Trustee
or Officer | | Other
Directorships
Held by
Trustee
or Officer | |
| independent trustees (continued) | | | | | | | | | | | | | |
|
Thomas F. Madison
2005 Market Street
Philadelphia, PA
19103
February 25, 1936 | | Trustee | | Since
May 1997 | | President and Chief
Executive Officer –
MLM Partners, Inc.
(Small Business Investing
and Consulting)
(January 1993 – Present) | | | 84 | | | Director –
Banner Health
Director –
CenterPoint Energy
Director and Audit
Committee Member –
Digital River, Inc.
Director and Audit
Committee Member –
Rimage
Corporation
Director – Valmont
Industries, Inc. | |
|
Janet L. Yeomans
2005 Market Street
Philadelphia, PA
19103
July 31, 1948 | | Trustee | | Since
April 1999 | | Vice President
(January 2003 – Present)
and Treasurer
(January 2006 – Present)
3M Corporation
Ms. Yeomans has held
various management positions
at 3M Corporation since 1983. | | | 84 | | | None | |
|
J. Richard Zecher
2005 Market Street
Philadelphia, PA
19103
July 3, 1940 | | Trustee | | Since
March 2005 | | Founder –
Investor Analytics
(Risk Management)
(May 1999 – Present)
Founder –
Sutton Asset Management
(Hedge Fund)
(September 1998 – Present) | | | 84 | | | Director and Audit
Committee Member –
Investor Analytics
Director and Audit
Committee Member –
Oxigene, Inc. | |
|
| officers | | | | | | | | | | | | | |
|
David F. Connor
2005 Market Street
Philadelphia, PA
19103
December 2, 1963 | | Vice President,
Deputy General
Counsel, and Secretary | | Vice President since
September 21, 2000
and Secretary
since
October 2005 | | David F. Connor has served as
Vice President and Deputy
General Counsel of
Delaware Investments
since 2000. | | | 84 | | | None3 | |
|
David P. O'Connor
2005 Market Street
Philadelphia, PA
19103
February 21, 1966 | | Senior Vice
President,
General Counsel,
and Chief
Legal Officer | | Senior Vice President,
General Counsel, and
Chief Legal Officer
since
October 2005 | | David P. O'Connor has served in
various executive and legal
capacities at different times at
Delaware Investments. | | | 84 | | | None3 | |
|
John J. O'Connor
2005 Market Street
Philadelphia, PA
19103
June 16, 1957 | | Senior Vice President
and Treasurer | | Treasurer
since
February 2005 | | John J. O'Connor has served in
various executive capacities
at different times at
Delaware Investments. | | | 84 | | | None3 | |
|
Richard Salus
2005 Market Street
Philadelphia, PA
19103
October 4, 1963 | | Senior
Vice President
and
Chief Financial
Officer | | Chief Financial
Officer since
November 1, 2006 | | Richard Salus has served in
various executive capacities
at different times at
Delaware Investments. | | | 84 | | | None3 | |
|
1 Patrick P. Coyne is considered to be an "Interested Trustee" because he is an executive officer of the Fund's(s') investment advisor.
2 Delaware Investments is the marketing name for Delaware Management Holdings, Inc. and its subsidiaries, including the Fund's(s') investment advisor, principal underwriter, and its transfer agent.
3 David F. Connor, David P. O'Connor, John J. O'Connor, and Richard Salus serve in similar capacities for the six portfolios of the Optimum Fund Trust, which have the same investment advisor, principal underwriter, and transfer agent as the registrant. John J. O'Connor also serves in a similar capacity for Lincoln Variable Insurance Products Trust, which has the same investment advisor as the registrant.
The Statement of Additional Information for the Fund(s) includes additional information about the Trustees and Officers and is available, without charge, upon request by calling 800 523-1918.
Growth Opportunities Series- 16
Delaware VIP Trust — Delaware VIP High Yield Series
Still-strong corporate balance sheets, combined with a general search for yield by investors in a low interest rate environment, helped high yield bond market performance in 2006. For the year ended Dec. 31, 2006, Delaware VIP High Yield Series returned +12.45% for Standard Class shares and +12.19% for Service Class shares (both figures reflect all distributions reinvested). During the same period, the Series' benchmark — the Bear Stearns High Yield Index — gained 11.64% (source: Bloomberg).
We continued to focus on security selection as the primary driver of the Series' performance. Although the economic climate and other big-picture factors were influential in the high yield market, company-specific characteristics and influences generally played larger roles in overall performance. As such, we avoided making significant sector bets, preferring instead to rely on in-depth research to uncover attractively valued securities throughout the high yield market.
During the year, the automotive industry continued to influence high yield market returns. Despite concerns surrounding the high cost of gasoline, automotive-industry bonds performed very well at times, as several companies made efforts to reduce legacy costs and bring production in line with demand. Our security-by-security analysis has led us to be cautious in this sector, and we were underweight versus the index in major automotive issues such as General Motors and Ford bonds, which together represent a significant portion of the index. We believe this was a prudent approach, and it reflects a belief that a single industry comprised of only two available bond issues should not represent such a large component of the Series.
The views expressed are current as of the date of this report and are subject to change.
The performance data quoted below and on the next page represent past performance; past performance does not guarantee future results. Investment return and principal value of an investment will fluctuate so that your shares, when redeemed, may be worth more or less than their original cost. Current performance may be lower or higher than the performance data quoted. Please obtain the performance data for the most recent month end by calling the number noted on the page related to this Series in the introductory section of this report.
You should consider the investment objectives, risks, charges, and expenses or the investment carefully before investing. The Delaware VIP High Yield Series prospectus contains this and other important information about the Series. To obtain a prospectus, contact the company noted on the page related to this Series in the introductory section of this report, either by phone or through the company Web site. We advise you to read the prospectus carefully before you invest.
Delaware VIP High Yield Series
Average Annual Total Returns
For the periods ending Dec. 31, 2006 | | 1 Year | | 5 Years | | 10 Years | | Lifetime | |
| Standard Class Shares* | | | +12.45 | % | | | +11.78 | % | | | +4.29 | % | | | +7.05 | % | |
| Service Class Shares** | | | +12.19 | % | | | +11.56 | % | | | NA | | | | +6.08 | % | |
* Commenced operations on July 28, 1988
** Commenced operations on May 1, 2000
High Yield Series- 1
Delaware VIP Trust — Delaware VIP High Yield Series (continued)

The chart shows a $10,000 investment in the Delaware VIP High Yield Series Standard Class shares for the period from Dec. 31, 1996 through Dec. 31, 2006. All distributions were reinvested. The chart also shows $10,000 invested in the Bear Stearns High Yield Index for the period from Dec. 31, 1996 through Dec. 31, 2006.
The Bear Stearns High Yield Index measures the performance of a large group of high yield securities across a wide spectrum of industries with at least one year to maturity. An index is unmanaged and does not reflect the costs of operating a mutual fund, such as the costs of buying, selling, and holding securities. You cannot invest directly in an index.
Earnings from a variable annuity or variable life investment compound tax free until withdrawal, so no adjustments were made for income taxes.
Performance of Service Class shares will vary due to different charges and expenses.
Performance does not reflect insurance fees related to a variable annuity or variable life investment or the deferred sales charge that would apply to certain withdrawals of investments held for fewer than eight years. Performance shown here would have been reduced if such fees were included and the expense limitation was removed. For more information about fees, consult your variable annuity or variable life prospectus.
Investments in variable products involve risk. High yielding noninvestment grade bonds involve higher risk than investment grade bonds. Adverse conditions may affect the issuer's ability to pay interest and principal on these securities. The Series may be invested in emerging markets and foreign high yield corporate bonds, which have special risks that include currency fluctuations, economic and political change, and different accounting standards. Some portfolios offer more risk than others. Please read both the contract and underlying prospectus for specific details regarding the product's risk profile.
High Yield Series- 2
Delaware VIP Trust — Delaware VIP High Yield Series
Disclosure of Series Expenses
For the Period July 1, 2006 to December 31, 2006
As a shareholder of the Series, you incur ongoing costs, including management fees; distribution and/or service (12b-1) fees; and other Series expenses. This Example is intended to help you understand your ongoing costs (in dollars) of investing in the Series and to compare these costs with the ongoing costs of investing in other mutual funds.
The Example is based on an investment of $1,000 invested at the beginning of the period and held for the entire period from July 1, 2006 to December 31, 2006.
Actual Expenses
The first section of the table shown, "Actual Series Return," provides information about actual account values and actual expenses. You may use the information in this section of the table, together with the amount you invested, to estimate the expenses that you paid over the period. Simply divide your account value by $1,000 (for example, an $8,600 account value divided by $1,000 = 8.6), then multiply the result by the number in the first section under the heading entitled "Expenses Paid During Period" to estimate the expenses you paid on your account during the period.
Hypothetical Example for Comparison Purposes
The second section of the table shown, "Hypothetical 5% Return," provides information about hypothetical account values and hypothetical expenses based on the Series' actual expense ratio and an assumed rate of return of 5% per year before expenses, which is not the Series' actual return. The hypothetical account values and expenses may not be used to estimate the actual ending account balance or expenses you paid for the period. You may use this information to compare the ongoing costs of investing in the Series and other funds. To do so, compare the 5% hypothetical example with the 5% hypothetical examples that appear in the shareholder reports of other funds.
Please note that the expenses shown in the table are meant to highlight your ongoing costs only. As a shareholder of the Series, you do not incur any transaction costs, such as sales charges (loads), redemption fees or exchange fees, but shareholders of other funds may incur such costs. Also, the fees related to the variable annuity investment or the deferred sales charge that could apply have not been included. Therefore, the second section of the table is useful in comparing ongoing costs only, and will not help you determine the relative total costs of owning different funds. The Series' actual expenses shown in the table reflect fee waivers in effect for Service Class shares. The expenses shown in the table assume reinvestment of all dividends and distributions.
Expense Analysis of an Investment of $1,000
| | | Beginning
Account
Value
7/1/06 | | Ending
Account
Value
12/31/06 | | Annualized
Expense
Ratios | | Expenses
Paid During
Period
7/1/06 to
12/31/06* | |
| Actual Series Return | |
| Standard Class | | $ | 1,000.00 | | | $ | 1,080.10 | | | | 0.80 | % | | $ | 4.19 | | |
| Service Class | | | 1,000.00 | | | | 1,080.30 | | | | 1.05 | % | | | 5.51 | | |
| Hypothetical 5% Return (5% return before expenses) | |
| Standard Class | | $ | 1,000.00 | | | $ | 1,021.17 | | | | 0.80 | % | | $ | 4.08 | | |
| Service Class | | | 1,000.00 | | | | 1,019.91 | | | | 1.05 | % | | | 5.35 | | |
*"Expenses Paid During Period" are equal to the Series' annualized expense ratio, multiplied by the average account value over the period, multiplied by 184/365 (to reflect the one-half year period).
High Yield Series- 3
Delaware VIP Trust — Delaware VIP High Yield Series
Sector Allocation and Credit Rating Breakdown
As of December 31, 2006
Sector designations may be different than the sector designations presented in other Series materials.
| Sector | | Percentage
of Net Assets | |
| Collateralized Bond Obligations | | | 0.02 | % | |
| Commercial Mortgage-Backed Securities | | | 0.45 | % | |
| Corporate Bonds | | | 91.48 | % | |
| Basic Industry | | | 12.07 | % | |
| Brokerage | | | 2.07 | % | |
| Capital Goods | | | 5.27 | % | |
| Consumer Cyclical | �� | | 7.32 | % | |
| Consumer Non-Cyclical | | | 6.20 | % | |
| Energy | | | 7.24 | % | |
| Finance & Investments | | | 0.06 | % | |
| Media | | | 8.00 | % | |
| Real Estate | | | 1.37 | % | |
| Services Cyclical | | | 17.09 | % | |
| Services Non-Cyclical | | | 8.00 | % | |
| Technology & Electronics | | | 3.21 | % | |
| Telecommunications | | | 9.55 | % | |
| Utilities | | | 4.03 | % | |
| Convertible Bonds | | | 0.53 | % | |
| Emerging Market Bonds | | | 1.13 | % | |
| Senior Secured Loans | | | 2.19 | % | |
| Common Stock | | | 0.92 | % | |
| Warrants | | | 0.00 | % | |
| Repurchase Agreements | | | 0.08 | % | |
| Total Market Value of Securities | | | 96.80 | % | |
| Receivables and Other Assets Net of Liabilities | | | 3.20 | % | |
| Total Net Assets | | | 100.00 | % | |
Credit Rating Breakdown
(as a % of fixed income investments) | |
| AAA | | | 2.69 | % | |
| BBB | | | 1.02 | % | |
| BB | | | 19.80 | % | |
| B | | | 57.93 | % | |
| CCC | | | 15.33 | % | |
| D | | | 0.42 | % | |
| Not Rated | | | 2.81 | % | |
| Total | | | 100.00 | % | |
High Yield Series- 4
Delaware VIP Trust — Delaware VIP High Yield Series
Statement of Net Assets
December 31, 2006
| | | Principal
Amount
(U.S.$) | | Market
Value
(U.S.$) | |
| @= COLLATERALIZED BOND OBLIGATIONS–0.02% | |
• Merrill Lynch CBO VII Series
1997-C3A A 5.741% 3/23/08 | | $ | 281,157 | | | $ | 14,345 | | |
South Street CBO Series
1999-1A A1 7.16% 7/1/11 | | | 34,848 | | | | 34,848 | | |
Total Collateralized Bond Obligations
(cost $192,327) | | | | | | | 49,193 | | |
COMMERCIAL MORTGAGE-BACKED
SECURITIES–0.45% | |
# First Union National Bank Commercial
Mortgage Series
2001-C2 L 144A 6.46% 1/12/43 | | | 1,375,000 | | | | 1,390,099 | | |
Total Commercial Mortgage-Backed
Securities (cost $1,395,571) | | | | | | | 1,390,099 | | |
| CORPORATE BONDS–91.48% | |
| Basic Industry–12.07% | |
| Abitibi-Consolidated 7.875% 8/1/09 | | | 425,000 | | | | 416,500 | | |
| AK Steel 7.875% 2/15/09 | | | 1,625,000 | | | | 1,633,125 | | |
Bowater
9.00% 8/1/09 | | | 950,000 | | | | 999,875 | | |
| 9.50% 10/15/12 | | | 2,200,000 | | | | 2,288,000 | | |
Donohue Forest Products
7.625% 5/15/07 | | | 1,325,000 | | | | 1,328,313 | | |
| Georgia Pacific | | | | | | | | | |
| # 144A 7.00% 1/15/15 | | | 1,325,000 | | | | 1,328,313 | | |
| 9.50% 12/1/11 | | | 1,005,000 | | | | 1,105,500 | | |
| Gold Kist 10.25% 3/15/14 | | | 1,375,000 | | | | 1,584,564 | | |
# Hexion US Finance 144A
9.75% 11/15/14 | | | 1,715,000 | | | | 1,747,156 | | |
Lyondell Chemical
8.00% 9/15/14 | | | 1,425,000 | | | | 1,485,563 | | |
| 8.25% 9/15/16 | | | 1,550,000 | | | | 1,635,250 | | |
| 10.50% 6/1/13 | | | 190,000 | | | | 209,950 | | |
# Momentive Performance Materials
144A 9.75% 12/1/14 | | | 2,175,000 | | | | 2,185,875 | | |
| # Nell AF SARL 144A 8.375% 8/15/15 | | | 1,650,000 | | | | 1,703,625 | | |
| NewPage 10.00% 5/1/12 | | | 1,700,000 | | | | 1,802,000 | | |
| Norske Skog Canada 8.625% 6/15/11 | | | 2,975,000 | | | | 3,027,062 | | |
# Port Townsend Paper
144A 11.00% 4/15/11 | | | 1,905,000 | | | | 1,685,925 | | |
| Potlatch 13.00% 12/1/09 | | | 2,000,000 | | | | 2,316,140 | | |
| # Sappi Papier 144A 7.50% 6/15/32 | | | 2,575,000 | | | | 2,411,981 | | |
| ‡ Solutia 6.72% 10/15/37 | | | 2,150,000 | | | | 2,104,313 | | |
| Tembec Industries 8.625% 6/30/09 | | | 4,525,000 | | | | 3,122,249 | | |
| Witco 6.875% 2/1/26 | | | 965,000 | | | | 849,200 | | |
| | | | | | | | 36,970,479 | | |
| Brokerage–2.07% | |
| E Trade Financial 8.00% 6/15/11 | | | 2,000,000 | | | | 2,100,000 | | |
LaBranche
9.50% 5/15/09 | | | 1,290,000 | | | | 1,360,950 | | |
| 11.00% 5/15/12 | | | 2,650,000 | | | | 2,868,625 | | |
| | | | | | | | 6,329,575 | | |
| Capital Goods–5.27% | |
| Armor Holdings 8.25% 8/15/13 | | | 1,075,000 | | | | 1,123,375 | | |
| | | Principal
Amount
(U.S.$) | | Market
Value
(U.S.$) | |
| CORPORATE BONDS (continued) | |
| Capital Goods (continued) | |
| # Berry Plastics 144A 8.875% 9/15/14 | | $ | 1,400,000 | | | $ | 1,428,000 | | |
| Building Materials 8.00% 10/15/07 | | | 800,000 | | | | 815,040 | | |
| CPG International 10.50% 7/1/13 | | | 950,000 | | | | 972,563 | | |
| # Esco 144A 8.625% 12/15/13 | | | 950,000 | | | | 980,875 | | |
| Graham Packaging 9.875% 10/15/14 | | | 2,810,000 | | | | 2,852,149 | | |
| Interface 10.375% 2/1/10 | | | 2,125,000 | | | | 2,358,750 | | |
| Intertape Polymer 8.50% 8/1/14 | | | 1,510,000 | | | | 1,370,325 | | |
| Mueller Group 10.00% 5/1/12 | | | 405,000 | | | | 442,463 | | |
| o NTK Holdings 10.75% 3/1/14 | | | 1,625,000 | | | | 1,145,625 | | |
# RBS Global & Rexnord
144A 11.75% 8/1/16 | | | 1,150,000 | | | | 1,207,500 | | |
| Trimas 9.875% 6/15/12 | | | 1,500,000 | | | | 1,458,750 | | |
| | | | | | | | 16,155,415 | | |
| Consumer Cyclical–7.32% | |
| Accuride 8.50% 2/1/15 | | | 1,300,000 | | | | 1,257,750 | | |
| Carrols 9.00% 1/15/13 | | | 1,450,000 | | | | 1,489,875 | | |
| Denny's 10.00% 10/1/12 | | | 1,450,000 | | | | 1,537,000 | | |
Ford Motor Credit
7.375% 10/28/09 | | | 1,450,000 | | | | 1,453,999 | | |
| 8.00% 12/15/16 | | | 750,000 | | | | 742,364 | | |
| • 8.11% 1/13/12 | | | 750,000 | | | | 744,101 | | |
| 9.875% 8/10/11 | | | 750,000 | | | | 802,885 | | |
| General Motors 8.375% 7/15/33 | | | 2,350,000 | | | | 2,185,499 | | |
General Motors Acceptance Corporation
6.875% 9/15/11 | | | 1,855,000 | | | | 1,904,564 | | |
| 8.00% 11/1/31 | | | 530,000 | | | | 610,243 | | |
# Goodyear Tire & Rubber
144A 8.625% 12/1/11 | | | 1,975,000 | | | | 2,049,062 | | |
| Landry's Restaurant 7.50% 12/15/14 | | | 1,175,000 | | | | 1,154,438 | | |
| # Micheals Stores 144A 11.375% 11/1/16 | | | 1,475,000 | | | | 1,545,063 | | |
| Neiman Marcus 9.00% 10/15/15 | | | 1,165,000 | | | | 1,277,131 | | |
| NPC International 9.50% 5/1/14 | | | 1,500,000 | | | | 1,545,000 | | |
| O'Charleys 9.00% 11/1/13 | | | 1,225,000 | | | | 1,292,375 | | |
| Visteon 8.25% 8/1/10 | | | 850,000 | | | | 833,000 | | |
| | | | | | | | 22,424,349 | | |
| Consumer Non-Cyclical–6.20% | |
| Constellation Brands 8.125% 1/15/12 | | | 1,950,000 | | | | 2,037,750 | | |
| Cott Beverages 8.00% 12/15/11 | | | 1,750,000 | | | | 1,793,750 | | |
| # Elan Finance 144A 8.875% 12/1/13 | | | 1,350,000 | | | | 1,356,750 | | |
| Ingles Markets 8.875% 12/1/11 | | | 2,125,000 | | | | 2,225,938 | | |
| National Beef Packing 10.50% 8/1/11 | | | 2,175,000 | | | | 2,305,499 | | |
| Pilgrim's Pride 9.625% 9/15/11 | | | 1,665,000 | | | | 1,748,250 | | |
| Pinnacle Foods 8.25% 12/1/13 | | | 1,550,000 | | | | 1,594,563 | | |
| Playtex Products 9.375% 6/1/11 | | | 2,255,000 | | | | 2,362,112 | | |
| Swift & Company 12.50% 1/1/10 | | | 1,225,000 | | | | 1,258,688 | | |
| True Temper Sports 8.375% 9/15/11 | | | 775,000 | | | | 678,125 | | |
| Warner Chilcott 8.75% 2/1/15 | | | 1,575,000 | | | | 1,622,250 | | |
| | | | | | | | 18,983,675 | | |
| Energy–7.24% | |
| Bluewater Finance 10.25% 2/15/12 | | | 985,000 | | | | 1,036,713 | | |
| Chesapeake Energy 6.625% 1/15/16 | | | 445,000 | | | | 444,444 | | |
# Complete Production Services
144A 8.00% 12/15/16 | | | 475,000 | | | | 489,250 | | |
| Compton Petroleum 7.625% 12/1/13 | | | 2,145,000 | | | | 2,080,649 | | |
High Yield Series-5
Delaware VIP High Yield Series
Statement of Net Assets (continued)
| | | Principal
Amount
(U.S.$) | | Market
Value
(U.S.$) | |
| CORPORATE BONDS (continued) | |
| Energy (continued) | |
| El Paso Natural Gas 7.625% 8/1/10 | | $ | 1,240,000 | | | $ | 1,302,000 | | |
# El Paso Performance-Linked Trust
144A 7.75% 7/15/11 | | | 975,000 | | | | 1,035,938 | | |
| El Paso Production 7.75% 6/1/13 | | | 875,000 | | | | 919,844 | | |
# Hilcorp Energy 144A
7.75% 11/1/15 | | | 400,000 | | | | 395,000 | | |
| 9.00% 6/1/16 | | | 1,475,000 | | | | 1,567,188 | | |
| 10.50% 9/1/10 | | | 1,450,000 | | | | 1,558,750 | | |
Inergy Finance
6.875% 12/15/14 | | | 810,000 | | | | 799,875 | | |
| 8.25% 3/1/16 | | | 375,000 | | | | 395,625 | | |
| Mariner Energy 7.50% 4/15/13 | | | 1,200,000 | | | | 1,170,000 | | |
| # OPTI Canada 144A 8.25% 12/15/14 | | | 1,175,000 | | | | 1,213,188 | | |
| PetroHawk Energy 9.125% 7/15/13 | | | 2,845,000 | | | | 3,001,474 | | |
| # Regency Energy 144A 8.375% 12/15/13 | | | 2,650,000 | | | | 2,669,874 | | |
| • Secunda International 13.374% 9/1/12 | | | 1,125,000 | | | | 1,165,781 | | |
| Whiting Petroleum 7.25% 5/1/13 | | | 935,000 | | | | 942,013 | | |
| | | | | | | | 22,187,606 | | |
| Finance & Investments–0.06% | |
| iPayment 9.75% 5/15/14 | | | 175,000 | | | | 180,688 | | |
| | | | | | | | 180,688 | | |
| Media–8.00% | |
| CCH I Holdings 13.50% 1/15/14 | | | 1,635,000 | | | | 1,614,563 | | |
| ‡ Century Communications 9.50% 9/1/07 | | | 2,820,000 | | | | 3,426,300 | | |
Charter Communications
13.50% 1/15/11 | | | 4,275,000 | | | | 4,253,624 | | |
# CMP Susquehanna
144A 9.875% 5/15/14 | | | 1,020,000 | | | | 1,020,000 | | |
Dex Media East Finance
12.125% 11/15/12 | | | 1,780,000 | | | | 1,964,675 | | |
| # Idearc 144A 8.00% 11/15/16 | | | 800,000 | | | | 816,000 | | |
Insight Communications
12.25% 2/15/11 | | | 275,000 | | | | 288,750 | | |
| Insight Midwest 9.75% 10/1/09 | | | 420,000 | | | | 427,876 | | |
Lodgenet Entertainment
9.50% 6/15/13 | | | 2,555,000 | | | | 2,765,788 | | |
| Mediacom Capital 9.50% 1/15/13 | | | 4,325,000 | | | | 4,476,375 | | |
| # Quebecor World 144A 9.75% 1/15/15 | | | 1,100,000 | | | | 1,112,375 | | |
| Vertis 10.875% 6/15/09 | | | 550,000 | | | | 555,500 | | |
| WMG Acquisition 7.375% 4/15/14 | | | 1,800,000 | | | | 1,791,000 | | |
| | | | | | | | 24,512,826 | | |
| Real Estate–1.37% | |
American Real Estate Partners
8.125% 6/1/12 | | | 1,450,000 | | | | 1,504,375 | | |
| BF Saul REIT 7.50% 3/1/14 | | | 1,750,000 | | | | 1,787,187 | | |
| Rouse 7.20% 9/15/12 | | | 875,000 | | | | 899,518 | | |
| | | | | | | | 4,191,080 | | |
| Services Cyclical–17.09% | |
| Adesa 7.625% 6/15/12 | | | 1,975,000 | | | | 2,049,063 | | |
| American Airlines 7.377% 5/23/19 | | | 1,106,320 | | | | 1,081,427 | | |
| Boyd Gaming 8.75% 4/15/12 | | | 1,925,000 | | | | 2,021,250 | | |
| Brickman 11.75% 12/15/09 | | | 580,000 | | | | 619,150 | | |
# Buffalo Thunder Development Authority
144A 9.375% 12/15/14 | | | 1,650,000 | | | | 1,683,000 | | |
| | | Principal
Amount
(U.S.$) | | Market
Value
(U.S.$) | |
| CORPORATE BONDS (continued) | |
| Services Cyclical (continued) | |
Corrections Corporation of America
7.50% 5/1/11 | | $ | 1,625,000 | | | $ | 1,681,875 | | |
| FTI Consulting 7.625% 6/15/13 | | | 2,225,000 | | | | 2,308,438 | | |
# Galaxy Entertainment Finance
144A 9.875% 12/15/12 | | | 3,125,000 | | | | 3,363,280 | | |
| Gaylord Entertainment 8.00% 11/15/13 | | | 1,500,000 | | | | 1,563,750 | | |
| Harrah's Operating 6.50% 6/1/16 | | | 2,125,000 | | | | 1,905,840 | | |
| # Hertz 144A 8.875% 1/1/14 | | | 1,350,000 | | | | 1,420,875 | | |
o H-Lines Finance Holdings
11.00% 4/1/13 | | | 2,288,000 | | | | 2,139,280 | | |
| Horizon Lines 9.00% 11/1/12 | | | 935,000 | | | | 986,425 | | |
| Kansas City Southern de Mexico | |
| # 144A 7.625% 12/1/13 | | | 1,650,000 | | | | 1,654,125 | | |
| 9.375% 5/1/12 | | | 1,435,000 | | | | 1,539,038 | | |
| 12.50% 6/15/12 | | | 500,000 | | | | 542,500 | | |
Kansas City Southern Railway
9.50% 10/1/08 | | | 1,100,000 | | | | 1,155,000 | | |
| # Knowledge Learning 144A 7.75% 2/1/15 | | | 1,050,000 | | | | 1,010,625 | | |
| Majestic Star Casino 9.50% 10/15/10 | | | 1,575,000 | | | | 1,661,625 | | |
Mandalay Resort
9.375% 2/15/10 | | | 1,650,000 | | | | 1,773,750 | | |
| 9.50% 8/1/08 | | | 1,975,000 | | | | 2,083,625 | | |
| MGM Mirage 7.625% 1/15/17 | | | 900,000 | | | | 906,750 | | |
| # Mobile Services 144A 9.75% 8/1/14 | | | 1,150,000 | | | | 1,207,500 | | |
| OMI 7.625% 12/1/13 | | | 2,285,000 | | | | 2,347,838 | | |
# Penhall International
144A 12.00% 8/1/14 | | | 1,025,000 | | | | 1,112,125 | | |
# Pokagon Gaming Authority
144A 10.375% 6/15/14 | | | 2,350,000 | | | | 2,585,000 | | |
| # Rental Service 144A 9.50% 12/1/14 | | | 2,200,000 | | | | 2,282,500 | | |
| Seabulk International 9.50% 8/15/13 | | | 865,000 | | | | 940,688 | | |
| Stena 9.625% 12/1/12 | | | 1,800,000 | | | | 1,926,000 | | |
o Town Sports International
11.00% 2/1/14 | | | 1,125,000 | | | | 985,781 | | |
| # Wimar Opco 144A 9.625% 12/15/14 | | | 975,000 | | | | 970,125 | | |
Wheeling Island Gaming
10.125% 12/15/09 | | | 2,775,000 | | | | 2,840,905 | | |
| | | | | | | | 52,349,153 | | |
| Services Non-Cyclical–8.00% | |
# Aleris International
144A 10.00% 12/15/16 | | | 1,925,000 | | | | 1,939,438 | | |
| Casella Waste Systems 9.75% 2/1/13 | | | 3,450,000 | | | | 3,631,125 | | |
| CRC Health 10.75% 2/1/16 | | | 2,025,000 | | | | 2,187,000 | | |
| Geo Sub 11.00% 5/15/12 | | | 1,675,000 | | | | 1,624,750 | | |
| HCA 6.50% 2/15/16 | | | 3,675,000 | | | | 3,114,563 | | |
| # HCA 144A 9.25% 11/15/16 | | | 725,000 | | | | 778,469 | | |
| # HealthSouth 144A 10.75% 6/15/16 | | | 3,800,000 | | | | 4,108,749 | | |
| US Oncology 10.75% 8/15/14 | | | 2,100,000 | | | | 2,331,000 | | |
| o Vanguard Health 11.25% 10/1/15 | | | 3,825,000 | | | | 2,964,375 | | |
| WCA Waste 9.25% 6/15/14 | | | 1,750,000 | | | | 1,837,500 | | |
| | | | | | | | 24,516,969 | | |
| Technology & Electronics–3.21% | |
# Freescale Semiconductor
144A 10.125% 12/15/16 | | | 2,975,000 | | | | 2,993,593 | | |
High Yield Series-6
Delaware VIP High Yield Series
Statement of Net Assets (continued)
| | | Principal
Amount
(U.S.$) | | Market
Value
(U.S.$) | |
| CORPORATE BONDS (continued) | |
| Technology & Electronics (continued) | |
MagnaChip Semiconductor
8.00% 12/15/14 | | $ | 3,950,000 | | | $ | 2,666,250 | | |
| # NXP Funding 144A 9.50% 10/15/15 | | | 1,050,000 | | | | 1,081,500 | | |
Solectron Global Finance
8.00% 3/15/16 | | | 550,000 | | | | 559,625 | | |
Sungard Data Systems
10.25% 8/15/15 | | | 1,275,000 | | | | 1,367,438 | | |
•# UGS Capital II PIK 144A
10.348% 6/1/11 | | | 1,150,059 | | | | 1,158,685 | | |
| | | | | | | | 9,827,091 | | |
| Telecommunications–9.55% | |
| ‡ Allegiance Telecom 11.75% 2/15/08 | | | 565,000 | | | | 257,075 | | |
| American Tower 7.125% 10/15/12 | | | 1,700,000 | | | | 1,755,250 | | |
| American Towers 7.25% 12/1/11 | | | 580,000 | | | | 603,200 | | |
# Broadview Networks 144A
11.375% 9/1/12 | | | 1,275,000 | | | | 1,335,563 | | |
| Cincinnati Bell 8.375% 1/15/14 | | | 875,000 | | | | 903,438 | | |
# Cricket Communications
144A 9.375% 11/1/14 | | | 1,675,000 | | | | 1,775,500 | | |
| # Digicel Limited 144A 9.25% 9/1/12 | | | 1,595,000 | | | | 1,710,638 | | |
•# Hellas Telecommunications II
144A 11.115% 1/15/15 | | | 1,750,000 | | | | 1,765,313 | | |
Hughes Network Systems
9.50% 4/15/14 | | | 3,475,000 | | | | 3,644,405 | | |
| o Inmarsat Finance 10.375% 11/15/12 | | | 2,925,000 | | | | 2,709,280 | | |
| • IWO Holdings 9.124% 1/15/12 | | | 265,000 | | | | 271,625 | | |
Level 3 Communications
11.50% 3/1/10 | | | 1,550,000 | | | | 1,650,750 | | |
# Level 3 Financing 144A
9.25% 11/1/14 | | | 825,000 | | | | 845,625 | | |
# MetroPCS Wireless 144A
9.25% 11/1/14 | | | 800,000 | | | | 840,000 | | |
Qwest
7.50% 10/1/14 | | | 2,200,000 | | | | 2,343,000 | | |
| • 8.61% 6/15/13 | | | 1,100,000 | | | | 1,196,250 | | |
Rural Cellular
9.875% 2/1/10 | | | 1,685,000 | | | | 1,800,844 | | |
| • 11.121% 11/1/12 | | | 760,000 | | | | 796,100 | | |
Triton CPCS
8.50% 6/1/13 | | | 850,000 | | | | 818,125 | | |
| 8.75% 11/15/11 | | | 500,000 | | | | 467,500 | | |
| 9.375% 2/1/11 | | | 1,115,000 | | | | 1,053,675 | | |
| • US LEC 13.87% 10/1/09 | | | 675,000 | | | | 718,875 | | |
| | | | | | | | 29,262,031 | | |
| Utilities–4.03% | |
| Avista 9.75% 6/1/08 | | | 680,000 | | | | 716,305 | | |
| # Calpine 144A 8.496% 7/15/07 | | | 1,177,692 | | | | 1,301,350 | | |
| Elwood Energy 8.159% 7/5/26 | | | 2,028,488 | | | | 2,129,445 | | |
Midwest Generation
8.30% 7/2/09 | | | 1,338,868 | | | | 1,377,361 | | |
| 8.75% 5/1/34 | | | 2,200,000 | | | | 2,398,000 | | |
Mirant Americas Generation
8.30% 5/1/11 | | | 2,300,000 | | | | 2,369,000 | | |
| | | Principal
Amount
(U.S.$) | | Market
Value
(U.S.$) | |
| CORPORATE BONDS (continued) | |
| Utilities (continued) | |
Mirant North America
7.375% 12/31/13 | | $ | 225,000 | | | $ | 229,500 | | |
| Orion Power 12.00% 5/1/10 | | | 1,440,000 | | | | 1,641,600 | | |
# Tenaska Alabama Partners 144A
7.00% 6/30/21 | | | 174,458 | | | | 174,136 | | |
| | | | | | | | 12,336,697 | | |
Total Corporate Bonds
(cost $274,165,015) | | | | | | | 280,227,634 | | |
| CONVERTIBLE BONDS–0.53% | |
Ford Motor 4.25% 12/15/36 exercise price
$9.20 expiration date 12/15/36 | | | 1,500,000 | | | | 1,610,625 | | |
Total Convertible Bonds
(cost $1,543,313) | | | | | | | 1,610,625 | | |
| EMERGING MARKET BONDS–1.13% | |
| # C&M Finance 144A 8.10% 2/1/16 | | | 750,000 | | | | 772,105 | | |
| # True Move 144A 10.75% 12/16/13 | | | 1,700,000 | | | | 1,666,000 | | |
Venezuela Government
6.00% 12/9/20 | | | 1,110,000 | | | | 1,040,070 | | |
Total Emerging Market Bonds
(cost $3,444,123) | | | | | | | 3,478,175 | | |
| « SENIOR SECURED LOANS–2.19% | | | | | | | | | |
| Ford Motor Primary 1 8.36% 11/29/13 | | | 1,700,000 | | | | 1,705,313 | | |
| General Motors 7.745% 11/17/13 | | | 750,000 | | | | 752,344 | | |
| HCA Term Loan B 8.086% 11/18/13 | | | 900,000 | | | | 912,094 | | |
Talecris Biotherapeutics 2nd Lien
13.50% 12/6/14 | | | 850,000 | | | | 857,438 | | |
Wind Acquisition PIK
12.54% 12/7/11 | | | 2,445,000 | | | | 2,484,730 | | |
Total Senior Secured Loans
(cost $6,647,813) | | | | | | | 6,711,919 | | |
| | | Number of
Shares | |
| |
| COMMON STOCK–0.92% | |
| d@†=Avado Brands | | | 1,813 | | | | 0 | | |
| † Charter Communications Class A | | | 58,900 | | | | 180,234 | | |
| † Foster Wheeler | | | 24,215 | | | | 1,335,208 | | |
| † Mirant | | | 34,864 | | | | 1,100,656 | | |
| † Petrojarl ADR | | | 2,484 | | | | 28,126 | | |
| † Petroleum Geo-Services ADR | | | 7,452 | | | | 174,526 | | |
Total Common Stock
(cost $1,266,455) | | | | | | | 2,818,750 | | |
| WARRANTS–0.00% | |
†# Solutia 144A, exercise price $7.59,
expiration date 7/15/09 | | | 850 | | | | 0 | | |
| Total Warrants (cost $72,431) | | | | | | | 0 | | |
High Yield Series-7
Delaware VIP High Yield Series
Statement of Net Assets (continued)
| | | Principal
Amount
(U.S.$) | | Market
Value
(U.S.$) | |
| REPURCHASE AGREEMENTS–0.08% | |
With BNP Paribas 4.80% 1/2/07
(dated 12/29/06, to be repurchased
at $97,372, collateralized by
$101,810 U.S. Treasury Bills
due 6/28/07, market value $99,360) | | $ | 97,320 | | | $ | 97,320 | | |
With Cantor Fitzgerald 4.82% 1/2/07
(dated 12/29/06, to be repurchased
at $116,983, collateralized by $10,090
U.S. Treasury Notes 4.00% due
6/15/09, market value $9,941, $62,640
U.S. Treasury Notes 6.125% due 8/15/07,
market value $64,509 and $41,760
U.S. Treasury Notes 6.50% due 2/15/10,
market value $44,919) | | | 116,920 | | | | 116,920 | | |
With UBS Warburg 4.75% 1/2/07
(dated 12/29/06, to be repurchased at
$41,782, collateralized by $43,130
U.S. Treasury Bills due 3/29/07,
market value $42,631) | | | 41,760 | | | | 41,760 | | |
Total Repurchase Agreements
(cost $256,000) | | | | | | | 256,000 | | |
High Yield Series- 8
Delaware VIP High Yield Series
Statement of Net Assets (continued)
| TOTAL MARKET VALUE OF SECURITIES–96.80% (cost $288,983,048) | | $ | 296,542,395 | | |
| RECEIVABLES AND OTHER ASSETS NET OF LIABILITIES–3.20% | | | 9,801,674 | | |
| NET ASSETS APPLICABLE TO 49,477,216 SHARES OUTSTANDING–100.00% | | $ | 306,344,069 | | |
| NET ASSET VALUE–DELAWARE VIP HIGH YIELD SERIES STANDARD CLASS ($105,576,465 / 17,024,995 Shares) | | $ | 6.20 | | |
| NET ASSET VALUE–DELAWARE VIP HIGH YIELD SERIES SERVICE CLASS ($200,767,604 / 32,452,221 Shares) | | $ | 6.19 | | |
| COMPONENTS OF NET ASSETS AT DECEMBER 31, 2006: | |
| Shares of beneficial interest (unlimited authorization - no par) | | $ | 322,120,172 | | |
| Undistributed net investment income | | | 21,003,046 | | |
| Accumulated net realized loss on investments | | | (44,338,496 | ) | |
| Net unrealized appreciation of investments | | | 7,559,347 | | |
| Total net assets | | $ | 306,344,069 | | |
† Non-income producing security for the year ended December 31, 2006.
• Variable rate security. The interest rate shown is the rate as of December 31, 2006.
d Restricted Security. Investment in a security not registered under the Securities Act of 1933, as amended. This security has certain restrictions on resale which may limit its liquidity. At December 31, 2006, the aggregate amount of the restricted security equaled $0.00 or 0% of the Series' net assets. See Note 8 in "Notes to Financial Statements."
‡ Non-income producing security. Security is currently in default.
o Step coupon bond. Indicates security that has a zero coupon that remains in effect until a predetermined date at which time the stated interest rate becomes effective.
= Security is being fair valued in accordance with the Series' fair valuation policy. At December 31, 2006, the aggregate amount of fair valued securities equaled $49,193, which represented 0.02% of the Series' net assets. See Note 1 in "Notes to Financial Statements."
@ Illiquid security. At December 31, 2006, the aggregate amount of illiquid securities equaled $49,193, which represented 0.02% of the Series' net assets. See Note 8 in "Notes to Financial Statements."
« Senior Secured Loans generally pay interest at rates which are periodically redetermined by reference to a base lending rate plus a premium. These base lending rates are generally (i) the prime rate offered by one or more United States banks, (ii) the lending rate offered by one or more European banks such as the London Inter-Bank Offered Rate ('LIBOR') and (iii) the certificate of deposit rate. Senior Secured Loans may be subject to restrictions on resale.
# Security exempt from registration under Rule 144A of the Securities Act of 1933, as amended. At December 31, 2006, the aggregate amount of Rule 144A securities equaled $74,433,606, which represented 24.30% of the Series' net assets. See Note 8 in "Notes to Financial Statements."
Summary of Abbreviations:
ADR – American Depositary Receipt
CBO – Collateralized Bond Obligation
PIK – Pay-in-kind
REIT – Real Estate Investment Trust
See accompanying notes
High Yield Series-9
Delaware VIP Trust — Delaware VIP High Yield Series
Statement of Operations
Year Ended December 31, 2006
| INVESTMENT INCOME: | |
| Interest | | $ | 23,216,247 | | |
| Dividends | | | 16,601 | | |
| | | | 23,232,848 | | |
| EXPENSES: | |
| Management fees | | | 1,718,135 | | |
| Distribution expenses - Service Class | | | 529,832 | | |
| Accounting and administration expenses | | | 105,731 | | |
| Reports and statements to shareholders | | | 60,451 | | |
| Trustees' fees and benefits | | | 49,447 | | |
| Legal fees | | | 31,271 | | |
| Dividend disbursing and transfer agent fees and expenses | | | 26,432 | | |
| Audit and tax | | | 21,069 | | |
| Insurance fees | | | 11,338 | | |
| Custodian fees | | | 11,034 | | |
| Consulting fees | | | 6,395 | | |
| Pricing fees | | | 5,369 | | |
| Registration fees | | | 3,252 | | |
| Trustees' expenses | | | 1,515 | | |
| Dues and services | | | 1,381 | | |
| | | | 2,582,652 | | |
| Less waiver of distribution expenses - Service Class | | | (88,305 | ) | |
| Total operating expenses | | | 2,494,347 | | |
| NET INVESTMENT INCOME | | | 20,738,501 | | |
NET REALIZED AND UNREALIZED GAIN
ON INVESTMENTS: | |
| Net realized gain on investments | | | 342,427 | | |
Net change in unrealized appreciation/depreciation
of investments | | | 9,806,997 | | |
NET REALIZED AND UNREALIZED GAIN
ON INVESTMENTS | | | 10,149,424 | | |
NET INCREASE IN NET ASSETS RESULTING
FROM OPERATIONS | | $ | 30,887,925 | | |
See accompanying notes
Delaware VIP Trust — Delaware VIP High Yield Series
Statements of Changes in Net Assets
| | | Year Ended | |
| | | 12/31/06 | | 12/31/05 | |
INCREASE (DECREASE) IN NET
ASSETS FROM OPERATIONS: | |
| Net investment income | | $ | 20,738,501 | | | $ | 15,193,441 | | |
| Net realized gain on investments | | | 342,427 | | | | 1,807,494 | | |
Net change in unrealized appreciation/
depreciation of investments | | | 9,806,997 | | | | (9,505,870 | ) | |
Net increase in net assets
resulting from operations | | | 30,887,925 | | | | 7,495,065 | | |
DIVIDENDS AND DISTRIBUTIONS
TO SHAREHOLDERS FROM: | |
| Net investment income: | |
| Standard Class | | | (5,223,811 | ) | | | (4,250,072 | ) | |
| Service Class | | | (10,890,450 | ) | | | (8,789,319 | ) | |
| | | | (16,114,261 | ) | | | (13,039,391 | ) | |
| CAPITAL SHARE TRANSACTIONS: | |
| Proceeds from shares sold: | |
| Standard Class | | | 65,283,017 | | | | 33,815,940 | | |
| Service Class | | | 64,586,970 | | | | 60,267,388 | | |
Net asset value of shares issued upon
reinvestment of dividends and distributions: | |
| Standard Class | | | 5,223,811 | | | | 4,250,072 | | |
| Service Class | | | 10,890,450 | | | | 8,789,319 | | |
| | | | 145,984,248 | | | | 107,122,719 | | |
| Cost of shares repurchased: | |
| Standard Class | | | (40,279,258 | ) | | | (31,558,451 | ) | |
| Service Class | | | (46,658,029 | ) | | | (33,897,320 | ) | |
| | | | (86,937,287 | ) | | | (65,455,771 | ) | |
Increase in net assets derived from
capital share transactions | | | 59,046,961 | | | | 41,666,948 | | |
| NET INCREASE IN NET ASSETS | | | 73,820,625 | | | | 36,122,622 | | |
| NET ASSETS: | |
| Beginning of year | | | 232,523,444 | | | | 196,400,822 | | |
End of year (including undistributed
net investment income of $21,003,046 and
$16,105,414, respectively) | | $ | 306,344,069 | | | $ | 232,523,444 | | |
See accompanying notes
High Yield Series-10
Delaware VIP Trust — Delaware VIP High Yield Series
Financial Highlights
Selected data for each share of the Series outstanding throughout each period were as follows:
| | | Delaware VIP High Yield Series Standard Class | |
| | | Year Ended | |
| | | 12/31/06 | | 12/31/05 | | 12/31/04 | | 12/31/03 | | 12/31/02 | |
| Net asset value, beginning of period | | $ | 5.910 | | | $ | 6.110 | | | $ | 5.690 | | | $ | 4.790 | | | $ | 5.220 | | |
| Income (loss) from investment operations: | |
| Net investment income1 | | | 0.473 | | | | 0.434 | | | | 0.437 | | | | 0.489 | | | | 0.517 | | |
Net realized and unrealized gain (loss) on investments
and foreign currencies | | | 0.226 | | | | (0.227 | ) | | | 0.332 | | | | 0.804 | | | | (0.413 | ) | |
| Total from investment operations | | | 0.699 | | | | 0.207 | | | | 0.769 | | | | 1.293 | | | | 0.104 | | |
| Less dividends and distributions from: | |
| Net investment income | | | (0.409 | ) | | | (0.407 | ) | | | (0.349 | ) | | | (0.393 | ) | | | (0.534 | ) | |
| Total dividends and distributions | | | (0.409 | ) | | | (0.407 | ) | | | (0.349 | ) | | | (0.393 | ) | | | (0.534 | ) | |
| Net asset value, end of period | | $ | 6.200 | | | $ | 5.910 | | | $ | 6.110 | | | $ | 5.690 | | | $ | 4.790 | | |
| Total return2 | | | 12.45 | % | | | 3.59 | % | | | 14.25 | % | | | 28.74 | % | | | 1.84 | % | |
| Ratios and supplemental data: | |
| Net assets, end of period (000 omitted) | | $ | 105,576 | | | $ | 70,139 | | | $ | 65,418 | | | $ | 71,061 | | | $ | 48,089 | | |
| Ratio of expenses to average net assets | | | 0.78 | % | | | 0.78 | % | | | 0.75 | % | | | 0.77 | % | | | 0.78 | % | |
| Ratio of net investment income to average net assets | | | 8.01 | % | | | 7.39 | % | | | 7.66 | % | | | 9.33 | % | | | 10.96 | % | |
| Portfolio turnover | | | 132 | % | | | 162 | % | | | 429 | % | | | 716 | % | | | 587 | % | |
1 The average shares outstanding method has been applied for per share information.
2Total investment return is based on the change in net asset value of a share during the period and assumes reinvestment of dividends and distributions at net asset value.
See accompanying notes
High Yield Series- 11
Delaware VIP High Yield Series
Financial Highlights (continued)
Selected data for each share of the Series outstanding throughout each period were as follows:
| | | Delaware VIP High Yield Series Service Class | |
| | | Year Ended | |
| | | 12/31/06 | | 12/31/05 | | 12/31/04 | | 12/31/03 | | 12/31/02 | |
| Net asset value, beginning of period | | $ | 5.900 | | | $ | 6.100 | | | $ | 5.680 | | | $ | 4.780 | | | $ | 5.220 | | |
| Income (loss) from investment operations: | |
| Net investment income1 | | | 0.458 | | | | 0.419 | | | | 0.423 | | | | 0.477 | | | | 0.510 | | |
Net realized and unrealized gain (loss) on investments
and foreign currencies | | | 0.226 | | | | (0.226 | ) | | | 0.334 | | | | 0.809 | | | | (0.424 | ) | |
| Total from investment operations | | | 0.684 | | | | 0.193 | | | | 0.757 | | | | 1.286 | | | | 0.086 | | |
| Less dividends and distributions from: | |
| Net investment income | | | (0.394 | ) | | | (0.393 | ) | | | (0.337 | ) | | | (0.386 | ) | | | (0.526 | ) | |
| Total dividends and distributions | | | (0.394 | ) | | | (0.393 | ) | | | (0.337 | ) | | | (0.386 | ) | | | (0.526 | ) | |
| Net asset value, end of period | | $ | 6.190 | | | $ | 5.900 | | | $ | 6.100 | | | $ | 5.680 | | | $ | 4.780 | | |
| Total return2 | | | 12.19 | % | | | 3.34 | % | | | 14.02 | % | | | 28.61 | % | | | 1.65 | % | |
| Ratios and supplemental data: | |
| Net assets, end of period (000 omitted) | | $ | 200,768 | | | $ | 162,384 | | | $ | 130,983 | | | $ | 68,295 | | | $ | 13,529 | | |
| Ratio of expenses to average net assets | | | 1.03 | % | | | 1.03 | % | | | 1.00 | % | | | 0.99 | % | | | 0.93 | % | |
Ratio of expenses to average net assets prior
to expense limitation and expenses paid indirectly | | | 1.08 | % | | | 1.08 | % | | | 1.05 | % | | | 1.02 | % | | | 0.93 | % | |
| Ratio of net investment income to average net assets | | | 7.76 | % | | | 7.14 | % | | | 7.41 | % | | | 9.11 | % | | | 10.81 | % | |
Ratio of net investment income to average net assets prior
to expense limitation and expenses paid indirectly | | | 7.71 | % | | | 7.09 | % | | | 7.36 | % | | | 9.08 | % | | | 10.81 | % | |
| Portfolio turnover | | | 132 | % | | | 162 | % | | | 429 | % | | | 716 | % | | | 587 | % | |
1The average shares outstanding method has been applied for per share information.
2Total investment return is based on the change in net asset value of a share during the period and assumes reinvestment of dividends and distributions at net asset value. Total investment return reflects waivers and payment of fees by the distributor, as applicable. Performance would have been lower had the waiver not been in effect.
See accompanying notes
High Yield Series- 12
Delaware VIP Trust — Delaware VIP High Yield Series
Notes to Financial Statements
December 31, 2006
Delaware VIP Trust (the "Trust") is organized as a Delaware statutory trust and offers 15 series: Delaware VIP Balanced Series, Delaware VIP Capital Reserves Series, Delaware VIP Cash Reserve Series, Delaware VIP Diversified Income Series, Delaware VIP Emerging Markets Series, Delaware VIP Global Bond Series, Delaware VIP Growth Opportunities Series, Delaware VIP High Yield Series, Delaware VIP International Value Equity Series, Delaware VIP REIT Series, Delaware VIP Select Growth Series, Delaware VIP Small Cap Value Series, Delaware VIP Trend Series, Delaware VIP U.S. Growth Series and Delaware VIP Value Series. These financial statements and the related notes pertain to Delaware VIP High Yield Series (the "Series"). The Trust is an open-end investment company. The Series is considered diversified under the Investment Company Act of 1940, as amended, and offers Standard Class and Service Class shares. The Standard Class shares do not carry a 12b-1 fee and the Service Class shares carry a 12b-1 fee. The shares of the Series are sold only to separate accounts of life insurance companies.
The investment objective of the Series is to seek total return and, as a secondary objective, high current income.
1. Significant Accounting Policies
The following accounting policies are in accordance with U.S. generally accepted accounting principles and are consistently followed by the Series.
Security Valuation—Equity securities, except those traded on the Nasdaq Stock Market, Inc. (Nasdaq), are valued at the last quoted sales price as of the time of the regular close of the New York Stock Exchange (NYSE) on the valuation date. Securities traded on the Nasdaq are valued in accordance with the Nasdaq Official Closing Price, which may not be the last sales price. If on a particular day an equity security does not trade, then the mean between the bid and asked prices will be used. Long-term debt securities are valued by an independent pricing service and such prices are believed to reflect the fair value of such securities. Short-term debt securities having less than 60 days to maturity are valued at amortized cost, which approximates market value. Other securities and assets for which market quotations are not readily available are valued at fair va lue as determined in good faith under the direction of the Series' Board of Trustees. In determining whether market quotations are readily available or fair valuation will be used, various factors will be taken into consideration, such as market closures, or with respect to foreign securities, aftermarket trading or significant events after local market trading (e.g., government actions or pronouncements, trading volume or volatility on markets, exchanges among dealers, or news events).
In September 2006, the Financial Accounting Standards Board (FASB) issued FASB Statement No. 157 "Fair Value Measurements" (Statement 157). Statement 157 establishes a framework for measuring fair value in generally accepted accounting principles, clarifies the definition of fair value within that framework, and expands disclosures about the use of fair value measurements. Statement 157 is intended to increase consistency and comparability among fair value estimates used in financial reporting. Statement 157 is effective for fiscal years beginning after November 15, 2007. Management does not expect the adoption of Statement 157 to have an impact on the amounts reported in the financial statements.
Federal Income Taxes—The Series intends to continue to qualify for federal income tax purposes as a regulated investment company and make the requisite distributions to shareholders. Accordingly, no provision for federal income taxes has been made in the financial statements.
On July 13, 2006, FASB released FASB Interpretation No. 48 "Accounting for Uncertainty in Income Taxes" (FIN 48). FIN 48 provides guidance for how uncertain tax positions should be recognized, measured, presented and disclosed in the financial statements. FIN 48 requires the evaluation of tax positions taken or expected to be taken in the course of preparing the Series' tax returns to determine whether the tax positions are "more-likely-than-not" of being sustained by the applicable tax authority. Tax positions not deemed to meet the more-likely-than-not threshold would be recorded as a tax benefit or expense in the current year. Adoption of FIN 48 is required for fiscal years beginning after December 15, 2006 and is to be applied to all open tax years as of the effective date. Recent SEC guidance allows implementing FIN 48 in Series net asset value calculations as late as the Series' last net asset value calculation in the first required fi nancial statement reporting period. As a result, the Series will incorporate FIN 48 in its semiannual report on June 30, 2007. Although the Series' tax positions are currently being evaluated, management does not expect the adoption of FIN 48 to have a material impact on the Series' financial statements.
Class Accounting—Investment income, common expenses and realized and unrealized gain (loss) on investments are allocated to the classes of the Series on the basis of daily net assets of each class. Distribution expenses relating to a specific class are charged directly to that class.
Repurchase Agreements—The Series may invest in a pooled cash account along with other members of the Delaware Investments® Family of Funds pursuant to an exemptive order issued by the Securities and Exchange Commission. The aggregate daily balance of the pooled cash account is invested in repurchase agreements secured by obligations of the U.S. government. The respective collateral is held by the Series' custodian bank until the maturity of the respective repurchase agreements. Each repurchase agreement is at least 102% collateralized. However, in the event of default or bankruptcy by the counterparty to the agreement, realization of the collateral may be subject to legal proceedings.
Use of Estimates—The preparation of financial statements in conformity with U.S. generally accepted accounting principles requires management to make estimates and assumptions that affect the reported amounts of assets and liabilities at the date of the financial statements and the reported amounts of revenues and expenses during the reporting period. Actual results could differ from those estimates.
High Yield Series-13
Delaware VIP High Yield Series
Notes to Financial Statements (continued)
1. Significant Accounting Policies (continued)
Other—Expenses directly attributable to the Series are charged directly to the Series. Other expenses common to various funds within the Delaware Investments® Family of Funds are generally allocated amongst such funds on the basis of average net assets. Management fees and some other expenses are paid monthly. Security transactions are recorded on the date the securities are purchased or sold (trade date) for financial reporting purposes. Costs used in calculating realized gains and losses on the sale of investment securities are those of the specific securities sold. Dividend income is recorded on the ex-dividend date and interest income is recorded on the accrual basis. Discounts and premiums on non-convertible bonds are amortized to interest income over the lives of the respective securities. Realized gains (losses) on paydowns of mortgage- and asset-backed securities are classified as interest income.
The Series declares and pays dividends from net investment income and distributions from net realized gain on investments, if any, following the close of the fiscal year.
The Series receives earnings credits from its custodian when positive cash balances are maintained, which are used to offset custody fees. There were no earnings credits for the year ended December 31, 2006.
2. Investment Management, Administration Agreements and Other Transactions with Affiliates
In accordance with the terms of its investment management agreement, the Series pays Delaware Management Company (DMC), a series of Delaware Management Business Trust and the investment manager, an annual fee which is calculated daily at the rate of 0.65% on the first $500 million of average daily net assets of the Series, 0.60% on the next $500 million, 0.55% on the next $1.5 billion, and 0.50% on average daily net assets in excess of $2.5 billion.
DMC has contractually agreed to waive that portion, if any, of its management fee and reimburse the Series to the extent necessary to ensure that annual operating expenses, exclusive of taxes, interest, brokerage commissions, distribution fees, certain insurance costs and extraordinary expenses, do not exceed 0.78% of average daily net assets of the Series through April 30, 2007. Prior to May 1, 2006, the expense limitation was 0.80% of average daily net assets. No reimbursement was due for the year ended December 31, 2006.
Delaware Service Company, Inc. (DSC), an affiliate of DMC, provides accounting, administration, dividend disbursing and transfer agent services. The Series pays DSC a monthly fee computed at the annual rate of 0.04% of the Series' average daily net assets for accounting and administrative services. The Series pays DSC a monthly fee based on average net assets for dividend disbursing and transfer agent services.
Pursuant to a distribution agreement and distribution plan, the Series pays Delaware Distributors, L.P. (DDLP), the distributor and an affiliate of DMC, an annual distribution and service fee not to exceed 0.30% of the average daily net assets of the Service Class shares. DDLP has contracted to waive distribution and service fees through April 30, 2007 in order to prevent distribution and service fees of the Service Class shares from exceeding 0.25% of average daily net assets. Standard Class shares pay no distribution and service expenses.
At December 31, 2006, the Series had liabilities payable to affiliates as follows:
Investment
Management
Fee Payable to
DMC | | Dividend Disbursing,
Transfer Agent,
Accounting and Administration
Fees and Other Expenses
Payable to DSC | | Distribution
Fees Payable
to DDLP | | Other
Expenses
Payable
to DMC
and Affiliates* | |
| $ | 166,650 | | | $ | 14,240 | | | $ | 42,022 | | | $ | 21,887 | | |
*DMC, as part of its administrative services, pays operating expenses on behalf of the Series and is reimbursed on a periodic basis. Such expenses include items such as printing of shareholder reports, fees for audit, legal and tax services, custodian fees and trustees' fees.
As provided in the investment management agreement, the Series bears the cost of certain legal and tax services, including internal legal and tax services provided to the Series by DMC and/or its affiliates' employees. For the year ended December 31, 2006, the Series was charged $12,712 for internal legal and tax services provided by DMC and/or its affiliates' employees.
Trustees' fees and benefits include expenses accrued by the Series for each Trustee's retainer, per meeting fees and retirement benefits. Independent Trustees with over five years of uninterrupted service are eligible to participate in a retirement plan that provides for the payment of benefits upon retirement. The amount of the retirement benefit is based on factors set forth in the plan, including the number of years of service. On November 16, 2006, the Board of Trustees unanimously voted to terminate the retirement plan. Payments equal to the net present value of the earned benefits will be made in 2007 to those independent trustees so entitled. The retirement benefit payout for the Series is $34,982. Certain officers of DMC, DSC and DDLP are officers and/or trustees of the Trust. These officers and trustees are paid no compensation by the Series.
High Yield Series- 14
Delaware VIP High Yield Series
Notes to Financial Statements (continued)
3. Investments
For the year ended December 31, 2006, the Series made purchases and sales of investment securities other than short-term investments as follows:
| Purchases | | $ | 400,396,024 | | |
| Sales | | | 330,530,919 | | |
At December 31, 2006, the cost of investments for federal income tax purposes and unrealized appreciation (depreciation) for the Series were as follows:
Cost of
Investments | | Aggregate
Unrealized
Appreciation | | Aggregate
Unrealized
Depreciation | | Net Unrealized
Appreciation | |
| $ | 290,114,974 | | | $ | 9,443,994 | | | $ | (3,016,573 | ) | | $ | 6,427,421 | | |
4. Dividend and Distribution Information
Income and long-term capital gain distributions are determined in accordance with federal income tax regulations, which may differ from U.S. generally accepted accounting principles. Additionally, net short-term gains on sales of investment securities are treated as ordinary income for federal income tax purposes. The tax character of dividends and distributions paid during the years ended December 31, 2006 and 2005 was as follows:
| | | Year
Ended
12/31/06 | | Year
Ended
12/31/05 | |
| Ordinary income | | $ | 16,114,261 | | | $ | 13,039,391 | | |
5. Components of Net Assets on a Tax Basis
As of December 31, 2006, the components of net assets on a tax basis were as follows:
| Shares of beneficial interest | | $ | 322,120,172 | | |
| Undistributed ordinary income | | | 21,053,074 | | |
| Capital loss carryforwards | | | (42,615,340 | ) | |
| Post-October losses | | | (641,258 | ) | |
| Unrealized appreciation of investments | | | 6,427,421 | | |
| Net assets | | $ | 306,344,069 | | |
The differences between book basis and tax basis components of net assets are primarily attributable to tax deferral of losses on wash sales and tax treatment of interest accrual on defaulted bonds and market discount and premium on debt instruments.
Post-October losses represent losses realized on investment transactions from November 1, 2006 through December 31, 2006 that, in accordance with federal income tax regulations, the Series has elected to defer and treat as having arisen in the following fiscal year.
For financial reporting purposes, capital accounts are adjusted to reflect the tax character of permanent book/tax differences. Reclassifications are primarily due to tax treatment of paydown gain (loss) on mortgage- and asset-backed securities, contingent payment debt instruments and market discount and premium on certain debt instruments. Results of operations and net assets were not affected by these reclassifications. For the year ended December 31, 2006, the Series recorded the following reclassifications:
Undistributed
Net
Investment Income | | Accumulated
Net Realized
Gain (Loss) | |
| $ | 273,392 | | | $ | (273,392 | ) | |
For federal income tax purposes, capital loss carryforwards may be carried forward and applied against future capital gains. $832,780 was utilized in 2006. Capital loss carryforwards remaining at December 31, 2006 will expire as follows: $19,963,415 expires in 2008, $18,082,790 expires in 2009 and $4,569,135 expires in 2010.
High Yield Series-15
Delaware VIP High Yield Series
Notes to Financial Statements (continued)
6. Capital Shares
Transactions in capital shares were as follows:
| | | Year
Ended
12/31/06 | | Year
Ended
12/31/05 | |
| Shares sold: | |
| Standard Class | | | 11,147,480 | | | | 5,762,942 | | |
| Service Class | | | 10,971,704 | | | | 10,268,782 | | |
Shares issued upon reinvestment of dividends
and distributions: | |
| Standard Class | | | 918,069 | | | | 740,431 | | |
| Service Class | | | 1,917,333 | | | | 1,531,240 | | |
| | | | 24,954,586 | | | | 18,303,395 | | |
| Shares repurchased: | |
| Standard Class | | | (6,900,107 | ) | | | (5,350,215 | ) | |
| Service Class | | | (7,953,893 | ) | | | (5,761,025 | ) | |
| | | | (14,854,000 | ) | | | (11,111,240 | ) | |
| Net increase | | | 10,100,586 | | | | 7,192,155 | | |
7. Line of Credit
The Series, along with certain other funds in the Delaware Investments® Family of Funds (the "Participants"), participates in a $225,000,000 revolving line of credit facility to be used for temporary or emergency purposes as an additional source of liquidity to fund redemptions of investor shares. The Participants are charged an annual commitment fee, which is allocated across the Participants on the basis of each Participant's allocation of the entire facility. The Participants may borrow up to a maximum of one third of their net assets under the agreement. The Series had no amounts outstanding as of December 31, 2006, or at any time during the year then ended.
8. Credit and Market Risk
The Series invests a portion of its assets in high yield fixed income securities, which carry ratings of BB or lower by Standard & Poor's Ratings Group and/or Ba or lower by Moody's Investors Service, Inc. Investments in these higher yielding securities are generally accompanied by a greater degree of credit risk than higher rated securities. Additionally, lower rated securities may be more susceptible to adverse economic and competitive industry conditions than investment grade securities.
The Series may invest up to 15% of its total assets in illiquid securities, which may include securities with contractual restrictions on resale, securities exempt from registration under Rule 144A of the Securities Act of 1933, as amended, and other securities which may not be readily marketable. The relative illiquidity of these securities may impair the Series from disposing of them in a timely manner and at a fair price when it is necessary or desirable to do so. While maintaining oversight, the Series' Board of Trustees has delegated to DMC the day-to-day functions of determining whether individual securities are liquid for purposes of the Series' limitation on investments in illiquid assets. Rule 144A and illiquid securities have been identified on the Statement of Net Assets.
9. Contractual Obligations
The Series enters into contracts in the normal course of business that contain a variety of indemnifications. The Series' maximum exposure under these arrangements is unknown. However, the Series has not had prior claims or losses pursuant to these contracts. Management has reviewed the Series' existing contracts and expects the risk of loss to be remote.
10. Tax Information (Unaudited)
For the fiscal year ended December 31, 2006, the Series designates dividends and distributions paid during the year as follows:
(A)
Long-Term
Capital Gain
Distributions
(Tax Basis) | | (B)
Ordinary
Income
Distributions
(Tax Basis) | | Total
Distributions
(Tax Basis) | |
| | – | | | | 100 | % | | | 100 | % | |
(A) and (B) are based on a percentage of the Series' total distributions.
High Yield Series-16
Delaware VIP Trust — Delaware VIP High Yield Series
Report of Independent Registered Public Accounting Firm
To the Shareholders and Board of Trustees
Delaware VIP Trust–Delaware VIP High Yield Series
We have audited the accompanying statement of net assets of the Delaware VIP High Yield Series (one of the series constituting Delaware VIP Trust) (the "Series") as of December 31, 2006, and the related statement of operations for the year then ended, the statements of changes in net assets for each of the two years in the period then ended, and the financial highlights for each of the five years in the period then ended. These financial statements and financial highlights are the responsibility of the Series' management. Our responsibility is to express an opinion on these financial statements and financial highlights based on our audits.
We conducted our audits in accordance with the standards of the Public Company Accounting Oversight Board (United States). Those standards require that we plan and perform the audit to obtain reasonable assurance about whether the financial statements and financial highlights are free of material misstatement. We were not engaged to perform an audit of the Series' internal control over financial reporting. Our audits included consideration of internal control over financial reporting as a basis for designing audit procedures that are appropriate in the circumstances, but not for the purpose of expressing an opinion on the effectiveness of the Series' internal control over financial reporting. Accordingly, we express no such opinion. An audit also includes examining, on a test basis, evidence supporting the amounts and disclosures in the financial statements and financial highlights, assessing the accounting principles used and significant es timates made by management, and evaluating the overall financial statement presentation. Our procedures included confirmation of securities owned as of December 31, 2006, by correspondence with the custodian and brokers or by other appropriate auditing procedures where replies from brokers were not received. We believe that our audits provide a reasonable basis for our opinion.
In our opinion, the financial statements and financial highlights referred to above present fairly, in all material respects, the financial position of the Delaware VIP High Yield Series of Delaware VIP Trust at December 31, 2006, the results of its operations for the year then ended, the changes in its net assets for each of the two years in the period then ended, and its financial highlights for each of the five years in the period then ended, in conformity with U.S. generally accepted accounting principles.
Philadelphia, Pennsylvania
February 14, 2007
The Series files its complete schedule of portfolio holdings with the Securities and Exchange Commission for the first and third quarters of each fiscal year on Form N-Q. The Series' Forms N-Q, as well as a description of the policies and procedures that the Series uses to determine how to vote proxies (if any) relating to portfolio securities is available without charge (i) upon request, by calling 800-523-1918; (ii) on the Series' website at http://www.delawareinvestments.com; and (iii) on the Commission's website at http://www.sec.gov. The Series' Forms N-Q may be reviewed and copied at the Commission's Public Reference Room in Washington, DC; information on the operation of the Public Reference Room may be obtained by calling 1-800-SEC-0330.
Information (if any) regarding how the Series voted proxies relating to portfolio securities during the most recently disclosed 12-month period ended June 30 is available without charge (i) through the Series' website at http://www.delawareinvestments.com; and (ii) on the Commission's website at http://www.sec.gov.
High Yield Series-17
Delaware Investments® Family of Funds
board of trustees/directors and officers addendum
A mutual fund is governed by a Board of Trustees/Directors ("Trustees"), which has oversight responsibility for the management of a fund's business affairs. Trustees establish procedures and oversee and review the performance of the investment manager, the distributor, and others who perform services for the fund. The independent fund trustees, in particular, are advocates for shareholder interests. Each trustee has served in that capacity since he or she was elected to or appointed to the Board of Trustees, and will continue to serve until his or her retirement or the election of a new trustee in his or her place. The following is a list of the Trustees and Officers with certain background and related information.
Name,
Address,
and Birth Date | | Position(s)
Held with
Fund(s) | | Length of Time
Served | | Principal
Occupation(s)
During
Past 5 Years | | Number of
Portfolios in Fund
Complex Overseen
by Trustee
or Officer | | Other
Directorships
Held by
Trustee
or Officer | |
| interested trustees | | | | | | | | | | | | | |
|
Patrick P. Coyne1
2005 Market Street
Philadelphia, PA
19103
April 14, 1963 | | Chairman,
President,
Chief Executive
Officer, and
Trustee | | Chairman and Trustee
since August 16, 2006
President and
Chief Executive Officer
since August 1, 2006 | | Patrick P. Coyne has served in
various executive capacities
at different times at
Delaware Investments.2 | | | 84 | | | None | |
|
| independent trustees | | | | | | | | | | | | | |
|
Thomas L. Bennett
2005 Market Street
Philadelphia, PA
19103
October 4, 1947 | | Trustee | | Since
March 2005 | | Private Investor –
(March 2004 – Present)
Investment Manager –
Morgan Stanley & Co.
(January 1984 – March 2004) | | | 84 | | | None | |
|
John A. Fry
2005 Market Street
Philadelphia, PA
19103
May 28, 1960 | | Trustee | | Since
January 2001 | | President –
Franklin & Marshall College
(June 2002 – Present)
Executive Vice President –
University of Pennsylvania
(April 1995 – June 2002) | | | 84 | | | Director –
Community Health
Systems
Director –
Allied Barton
Security Holdings | |
|
Anthony D. Knerr
2005 Market Street
Philadelphia, PA
19103
December 7, 1938 | | Trustee | | Since
April 1990 | | Founder and Managing Director –
Anthony Knerr & Associates
(Strategic Consulting)
(1990 – Present) | | | 84 | | | None | |
|
Lucinda S. Landreth
2005 Market Street
Philadelphia, PA
19103
June 24, 1947 | | Trustee | | Since
March 2005 | | Chief Investment Officer –
Assurant, Inc.
(Insurance)
(2002 – 2004) | | | 84 | | | None | |
|
Ann R. Leven
2005 Market Street
Philadelphia, PA
19103
November 1, 1940 | | Trustee | | Since
September 1989 | | Consultant –
ARL Associates
(Financial Planning)
(1983 – Present) | | | 84 | | | Director and
Audit Committee
Chairperson – Andy
Warhol Foundation
Director and Audit
Committee Member –
Systemax, Inc. | |
|
High Yield Series- 18
Name,
Address,
and Birth Date | | Position(s)
Held with
Fund(s) | | Length of Time
Served | | Principal
Occupation(s)
During
Past 5 Years | | Number of
Portfolios in Fund
Complex Overseen
by Trustee
or Officer | | Other
Directorships
Held by
Trustee
or Officer | |
| independent trustees (continued) | | | | | | | | | | | | | |
|
Thomas F. Madison
2005 Market Street
Philadelphia, PA
19103
February 25, 1936 | | Trustee | | Since
May 1997 | | President and Chief
Executive Officer –
MLM Partners, Inc.
(Small Business Investing
and Consulting)
(January 1993 – Present) | | | 84 | | | Director –
Banner Health
Director –
CenterPoint Energy
Director and Audit
Committee Member –
Digital River, Inc.
Director and Audit
Committee Member –
Rimage
Corporation
Director – Valmont
Industries, Inc. | |
|
Janet L. Yeomans
2005 Market Street
Philadelphia, PA
19103
July 31, 1948 | | Trustee | | Since
April 1999 | | Vice President
(January 2003 – Present)
and Treasurer
(January 2006 – Present)
3M Corporation
Ms. Yeomans has held
various management positions
at 3M Corporation since 1983. | | | 84 | | | None | |
|
J. Richard Zecher
2005 Market Street
Philadelphia, PA
19103
July 3, 1940 | | Trustee | | Since
March 2005 | | Founder –
Investor Analytics
(Risk Management)
(May 1999 – Present)
Founder –
Sutton Asset Management
(Hedge Fund)
(September 1998 – Present) | | | 84 | | | Director and Audit
Committee Member –
Investor Analytics
Director and Audit
Committee Member –
Oxigene, Inc. | |
|
| officers | | | | | | | | | | | | | |
|
David F. Connor
2005 Market Street
Philadelphia, PA
19103
December 2, 1963 | | Vice President,
Deputy General
Counsel, and Secretary | | Vice President since
September 21, 2000
and Secretary
since
October 2005 | | David F. Connor has served as
Vice President and Deputy
General Counsel of
Delaware Investments
since 2000. | | | 84 | | | None3 | |
|
David P. O'Connor
2005 Market Street
Philadelphia, PA
19103
February 21, 1966 | | Senior Vice
President,
General Counsel,
and Chief
Legal Officer | | Senior Vice President,
General Counsel, and
Chief Legal Officer
since
October 2005 | | David P. O'Connor has served in
various executive and legal
capacities at different times at
Delaware Investments. | | | 84 | | | None3 | |
|
John J. O'Connor
2005 Market Street
Philadelphia, PA
19103
June 16, 1957 | | Senior Vice President
and Treasurer | | Treasurer
since
February 2005 | | John J. O'Connor has served in
various executive capacities
at different times at
Delaware Investments. | | | 84 | | | None3 | |
|
Richard Salus
2005 Market Street
Philadelphia, PA
19103
October 4, 1963 | | Senior
Vice President
and
Chief Financial
Officer | | Chief Financial
Officer since
November 1, 2006 | | Richard Salus has served in
various executive capacities
at different times at
Delaware Investments. | | | 84 | | | None3 | |
|
1 Patrick P. Coyne is considered to be an "Interested Trustee" because he is an executive officer of the Fund's(s') investment advisor.
2 Delaware Investments is the marketing name for Delaware Management Holdings, Inc. and its subsidiaries, including the Fund's(s') investment advisor, principal underwriter, and its transfer agent.
3 David F. Connor, David P. O'Connor, John J. O'Connor, and Richard Salus serve in similar capacities for the six portfolios of the Optimum Fund Trust, which have the same investment advisor, principal underwriter, and transfer agent as the registrant. John J. O'Connor also serves in a similar capacity for Lincoln Variable Insurance Products Trust, which has the same investment advisor as the registrant.
The Statement of Additional Information for the Fund(s) includes additional information about the Trustees and Officers and is available, without charge, upon request by calling 800 523-1918.
High Yield Series- 19
Delaware VIP Trust — Delaware VIP International Value Equity Series
Delaware VIP International Value Equity Series Standard Class shares returned +23.59%, and its Service Class shares returned +23.24% (both figures reflect all distributions reinvested) for the fiscal year ended Dec. 31, 2006. The Series benchmark, the MSCI EAFE Index, also rose sharply, gaining 32.59% for the same period (source: Lipper).
On May 1, 2006, day-to-day management of the Series was transitioned from subadvisor Mondrian Investment Partners Ltd. to the Delaware Investments International Equity team based in Boston.
The team's investment philosophy is that adversity creates opportunity. It believes that "efficient-opportunity-capture" by a collaborative, experienced team is critical to generating competitive long-term performance. The management team uses a bottom-up, contrarian investment style in seeking to identify mispriced securities, and prioritizes its research through a process aimed at creating efficient segmentation of this broad investment universe.
The Series' underperformance versus its benchmark for the year was primarily a result of sector allocation. Transition of management in May was coincident with the market's shift to a more defensive nature and negatively affected performance through adverse sector allocation as that market shift took place.
Prior to the management change, performance was characterized by a heavier weighting than the benchmark index in the weak telecommunications services sector. In the months following the change, the negative impact of sector allocation was felt in a lower exposure than the MSCI EAFE Index to the strong utilities sector. Management did, however, overweight consumer discretionary investments versus the index, which resulted in a measure of positive relative return.
We feel that success in a maturing market cycle such as this one requires particular attention to the specific drivers of company operating performance. Stocks whose performance has been leveraged by the benefits of accelerating economic growth may struggle to find new sources of outperformance. As always, we continue to seek stocks of companies whose prospects for success rely not on macroeconomic drivers but on their own inherent strengths.
The views expressed are current as of the date of this report and are subject to change.
The performance data quoted below and on the next page represent past performance; past performance does not guarantee future results. Investment return and principal value of an investment will fluctuate so that your shares, when redeemed, may be worth more or less than their original cost. Current performance may be lower or higher than the performance data quoted. Please obtain the performance data for the most recent month end by calling the number noted on the page related to this Series in the introductory section of this report.
You should consider the investment objectives, risks, charges, and expenses of the investment carefully before investing. The Delaware VIP International Value Equity Series prospectus contains this and other important information about the Series. To obtain a prospectus, contact the company noted on the page related to this Series in the introductory section of this report, either by phone or through the company Web site. We advise you to read the prospectus carefully before you invest.
Instances of high double-digit returns are unusual, cannot be sustained, and were achieved primarily during favorable market conditions.
Delaware VIP International Value Equity Series
Average Annual Total Returns
For the periods ending Dec. 31, 2006 | | 1 Year | | 5 Years | | 10 Years | | Lifetime | |
| Standard Class Shares* | | | +23.59 | % | | | +16.90 | % | | | +10.05 | % | | | +10.75 | % | |
| Service Class Shares** | | | +23.24 | % | | | +16.63 | % | | | NA | | | | +11.03 | % | |
* Commenced operations on Oct. 29, 1992
** Commenced operations on May 1, 2000
International Value Equity Series- 1
Delaware VIP Trust — Delaware VIP International Value Equity Series (continued)
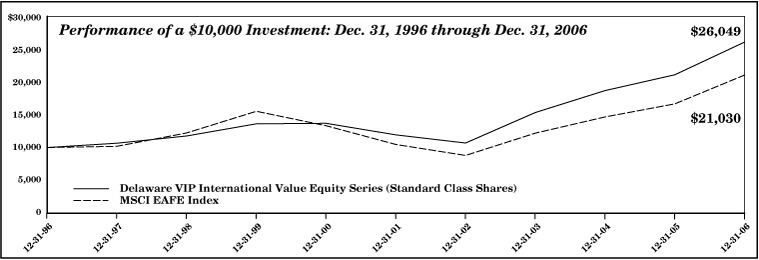
The chart shows a $10,000 investment in the Delaware VIP International Value Equity Series Standard Class shares for the period from Dec. 31, 1996 through Dec. 31, 2006. All distributions were reinvested. The chart also shows $10,000 invested in the MSCI EAFE Index for the period from Dec. 31, 1996 through Dec. 31, 2006.
MSCI EAFE Index measures the equity market performance of 21 developed market countries in Europe, Australasia, and the Far East. An index is unmanaged and does not reflect the costs of operating a mutual fund, such as the costs of buying, selling, and holding securities. You cannot invest directly in an index.
Earnings from a variable annuity or variable life investment compound tax free until withdrawal, so no adjustments were made for income taxes.
An expense limitation was in effect for the Delaware VIP International Value Equity Series during the periods shown.
Performance of Service Class shares will vary due to different charges and expenses.
Performance does not reflect insurance fees related to a variable annuity or variable life investment or the deferred sales charge that would apply to certain withdrawals of investments held for fewer than eight years. Performance shown here would have been reduced if such fees were included and the expense limitation was removed. For more information about fees, consult your variable annuity or variable life prospectus.
Investments in variable products involve risk. Foreign investments are subject to risks not ordinarily associated with domestic investments, such as currency, economic and political risks, and different accounting standards. Some portfolios offer more risk than others. Please read both the contract and underlying prospectus for specific details regarding the product's risk profile.
International Value Equity Series- 2
Delaware VIP Trust — Delaware VIP International Value Equity Series
Disclosure of Series Expenses
For the Period July 1, 2006 to December 31, 2006
As a shareholder of the Series, you incur ongoing costs, including management fees; distribution and/or service (12b-1) fees; and other Series expenses. This Example is intended to help you understand your ongoing costs (in dollars) of investing in the Series and to compare these costs with the ongoing costs of investing in other mutual funds.
The Example is based on an investment of $1,000 invested at the beginning of the period and held for the entire period from July 1, 2006 to December 31, 2006.
Actual Expenses
The first section of the table shown, "Actual Series Return," provides information about actual account values and actual expenses. You may use the information in this section of the table, together with the amount you invested, to estimate the expenses that you paid over the period. Simply divide your account value by $1,000 (for example, an $8,600 account value divided by $1,000 = 8.6), then multiply the result by the number in the first section under the heading entitled "Expenses Paid During Period" to estimate the expenses you paid on your account during the period.
Hypothetical Example for Comparison Purposes
The second section of the table shown, "Hypothetical 5% Return," provides information about hypothetical account values and hypothetical expenses based on the Series' actual expense ratio and an assumed rate of return of 5% per year before expenses, which is not the Series' actual return. The hypothetical account values and expenses may not be used to estimate the actual ending account balance or expenses you paid for the period. You may use this information to compare the ongoing costs of investing in the Series and other funds. To do so, compare the 5% hypothetical example with the 5% hypothetical examples that appear in the shareholder reports of other funds.
Please note that the expenses shown in the table are meant to highlight your ongoing costs only. As a shareholder of the Series, you do not incur any transaction costs, such as sales charges (loads), redemption fees or exchange fees, but shareholders of other funds may incur such costs. Also, the fees related to the variable annuity investment or the deferred sales charge that could apply have not been included. Therefore, the second section of the table is useful in comparing ongoing costs only, and will not help you determine the relative total costs of owning different funds. The Series' actual expenses shown in the table reflect fee waivers in effect for Service Class shares. The expenses shown in the table assume reinvestment of all dividends and distributions.
Expense Analysis of an Investment of $1,000
| | | Beginning
Account
Value
7/1/06 | | Ending
Account
Value
12/31/06 | | Annualized
Expense
Ratios | | Expenses
Paid During
Period
7/1/06 to
12/31/06* | |
| Actual Series Return | |
| Standard Class | | $ | 1,000.00 | | | $ | 1,154.40 | | | | 1.04 | % | | $ | 5.65 | | |
| Service Class | | | 1,000.00 | | | | 1,152.50 | | | | 1.29 | % | | | 7.00 | | |
| Hypothetical 5% Return (5% return before expenses) | |
| Standard Class | | $ | 1,000.00 | | | $ | 1,019.96 | | | | 1.04 | % | | $ | 5.30 | | |
| Service Class | | | 1,000.00 | | | | 1,018.70 | | | | 1.29 | % | | | 6.56 | | |
*"Expenses Paid During Period" are equal to the Series' annualized expense ratio, multiplied by the average account value over the period, multiplied by 184/365 (to reflect the one-half year period).
International Value Equity Series- 3
Delaware VIP Trust — Delaware VIP International Value Equity Series
Country and Sector Allocations
As of December 31, 2006
Sector designations may be different than the sector designations presented in other Series materials.
| Country | | Percentage
of Net Assets | |
| Common Stock | | | 98.05 | % | |
| Australia | | | 5.76 | % | |
| Belgium | | | 1.83 | % | |
| Canada | | | 2.13 | % | |
| Denmark | | | 2.00 | % | |
| Finland | | | 4.13 | % | |
| France | | | 15.49 | % | |
| Germany | | | 4.91 | % | |
| Hong Kong | | | 1.89 | % | |
| Japan | | | 19.81 | % | |
| Mexico | | | 3.82 | % | |
| Netherlands | | | 4.77 | % | |
| Norway | | | 0.76 | % | |
| Republic of Korea | | | 1.96 | % | |
| Sweden | | | 2.25 | % | |
| Switzerland | | | 2.16 | % | |
| United Kingdom | | | 24.38 | % | |
| Repurchase Agreements | | | 1.07 | % | |
| Securities Lending Collateral | | | 5.08 | % | |
| Fixed Rate Note | | | 0.96 | % | |
| Variable Rate Notes | | | 4.12 | % | |
| Total Market Value of Securities | | | 104.20 | % | |
| Obligation to Return Securities Lending Collateral | | | (5.08 | %) | |
| Receivables and Other Assets Net of Liabilities | | | 0.88 | % | |
| Total Net Assets | | | 100.00 | % | |
| Sector | | Percentage
of Net Assets | |
| Consumer Discretionary | | | 21.63 | % | |
| Consumer Staples | | | 5.41 | % | |
| Energy | | | 4.30 | % | |
| Financials | | | 21.00 | % | |
| Health Care | | | 10.03 | % | |
| Industrials | | | 10.57 | % | |
| Information Technology | | | 11.29 | % | |
| Materials | | | 5.70 | % | |
| Telecommunication Services | | | 8.12 | % | |
| Total | | | 98.05 | % | |
International Value Equity Series-4
Delaware VIP Trust — Delaware VIP International Value Equity Series
Statement of Net Assets
December 31, 2006
| | | Number of
Shares | | Market
Value
(U.S. $) | |
| COMMON STOCK–98.05%Æ | |
| Australia–5.76% | |
| Coca-Cola Amatil | | | 643,391 | | | $ | 3,933,445 | | |
| Telstra | | | 583,733 | | | | 1,907,793 | | |
| Telstra - Receipt | | | 605,514 | | | | 1,285,882 | | |
| Westpac Banking | | | 148,857 | | | | 2,840,579 | | |
| | | | | | | | 9,967,699 | | |
| Belgium–1.83% | |
| Dexia | | | 116,147 | | | | 3,174,109 | | |
| | | | | | | | 3,174,109 | | |
| Canada–2.13% | |
| † CGI Class A | | | 529,091 | | | | 3,688,642 | | |
| | | | | | | | 3,688,642 | | |
| Denmark–2.00% | |
| Novo Nordisk Class B | | | 41,556 | | | | 3,460,410 | | |
| | | | | | | | 3,460,410 | | |
| Finland–4.13% | |
| Nokia | | | 210,519 | | | | 4,275,192 | | |
| * TietoEnator | | | 89,324 | | | | 2,873,248 | | |
| | | | | | | | 7,148,440 | | |
| France–15.49% | |
| AXA | | | 85,197 | | | | 3,434,552 | | |
| Compagnie de Saint-Gobain | | | 45,736 | | | | 3,832,443 | | |
| Lafarge | | | 24,775 | | | | 3,682,838 | | |
| * Lagardere | | | 38,652 | | | | 3,104,252 | | |
| Publicis Groupe | | | 87,000 | | | | 3,664,891 | | |
| Sanofi-Aventis | | | 36,500 | | | | 3,365,465 | | |
| Total | | | 79,434 | | | | 5,716,103 | | |
| | | | | | | | 26,800,544 | | |
| Germany–4.91% | |
| Bayerische Motoren Werke | | | 71,561 | | | | 4,110,375 | | |
| Metro | | | 69,165 | | | | 4,388,303 | | |
| | | | | | | | 8,498,678 | | |
| Hong Kong–1.89% | |
| Esprit Holdings | | | 293,430 | | | | 3,268,359 | | |
| | | | | | | | 3,268,359 | | |
| Japan–19.81% | |
| * Asahi Glass | | | 297,000 | | | | 3,559,238 | | |
| Canon | | | 72,281 | | | | 4,069,432 | | |
| * Don Quijote | | | 214,000 | | | | 4,085,136 | | |
| * Fujitsu | | | 422,000 | | | | 3,306,571 | | |
| Honda Motor | | | 72,800 | | | | 2,873,357 | | |
| Mitsubishi UFJ Financial | | | 235 | | | | 2,915,363 | | |
| Nissan Motor | | | 268,800 | | | | 3,243,530 | | |
| NTT DoCoMo | | | 2,163 | | | | 3,422,581 | | |
| Ono Pharmaceutical | | | 67,100 | | | | 3,539,949 | | |
| Terumo | | | 83,200 | | | | 3,262,770 | | |
| | | | | | | | 34,277,927 | | |
| Mexico–3.82% | |
| Cemex S.A.B. ADR | | | 92,598 | | | | 3,132,590 | | |
| Telefonos de Mexico ADR | | | 123,116 | | | | 3,476,796 | | |
| | | | | | | | 6,609,386 | | |
| Netherlands–4.77% | |
| ING Groep CVA | | | 108,322 | | | | 4,786,753 | | |
| Koninklijke Philips Electronics | | | 92,424 | | | | 3,475,575 | | |
| | | | | | | | 8,262,328 | | |
| Norway–0.76% | |
| * Tandberg | | | 87,637 | | | | 1,314,760 | | |
| | | | | | | | 1,314,760 | | |
| | | Number of
Shares | | Market
Value
(U.S. $) | |
| COMMON STOCK (continued) | |
| Republic of Korea–1.96% | |
| Kookmin Bank | | | 42,225 | | | $ | 3,394,979 | | |
| | | | | | | | 3,394,979 | | |
| Sweden–2.25% | |
| * Nordea Bank | | | 253,611 | | | | 3,899,017 | | |
| | | | | | | | 3,899,017 | | |
| Switzerland–2.16% | |
| Novartis | | | 65,057 | | | | 3,735,901 | | |
| | | | | | | | 3,735,901 | | |
| United Kingdom–24.38% | |
| | | | 154,200 | | | | 1,719,821 | | |
| † British Airways | | | 388,859 | | | | 4,008,213 | | |
| DSG International | | | 445,322 | | | | 1,662,854 | | |
| Greggs | | | 12,319 | | | | 1,039,987 | | |
| HBOS | | | 144,429 | | | | 3,196,230 | | |
| Kesa Electricals | | | 520,523 | | | | 3,456,786 | | |
| Rio Tinto | | | 57,527 | | | | 3,048,163 | | |
| Royal & Sun Alliance Insurance Group | | | 159,222 | | | | 474,595 | | |
| Royal Bank of Scotland | | | 114,341 | | | | 4,453,015 | | |
| Standard Chartered | | | 129,712 | | | | 3,779,390 | | |
| Tomkins | | | 583,135 | | | | 2,799,842 | | |
| Travis Perkins | | | 105,676 | | | | 4,098,108 | | |
| Vodafone | | | 1,433,199 | | | | 3,958,764 | | |
| WPP Group | | | 332,682 | | | | 4,493,723 | | |
| | | | | | | | 42,189,491 | | |
Total Common Stock
(cost $151,357,633) | | | | | | | 169,690,670 | | |
| | | Principal
Amount | | | |
| REPURCHASE AGREEMENTS–1.07% | |
With BNP Paribas 4.80% 1/2/07
(dated 12/29/06, to be repurchased
at $706,377, collateralized by
$739,000 U.S. Treasury Bills
due 6/28/07, market value $720,750) | | $ | 706,000 | | | | 706,000 | | |
With Cantor Fitzgerald 4.82% 1/2/07
(dated 12/29/06, to be repurchased
at $848,454, collateralized by
$73,000 U.S. Treasury Notes 4.00%
due 6/15/09, market value $72,110,
$454,000 U.S. Treasury Notes 6.125%
due 8/15/07, market value $467,941
and $303,000 U.S. Treasury Notes 6.50%
due 2/15/10, market value $325,835) | | | 848,000 | | | | 848,000 | | |
With UBS Warburg 4.75% 1/2/07
(dated 12/29/06, to be repurchased
at $303,160, collateralized by
$313,000 U.S. Treasury Bills
due 3/29/07, market value $309,239) | | | 303,000 | | | | 303,000 | | |
Total Repurchase Agreements
(cost $1,857,000) | | | | | | | 1,857,000 | | |
Total Market Value of Securities
Before Securities Lending
Collateral–99.12%
(cost $153,214,633) | | | | | | | 171,547,670 | | |
International Value Equity Series- 5
Delaware VIP International Value Equity Series
Statement of Net Assets (continued)
| | | Principal
Amount | | Market
Value
(U.S. $) | |
| SECURITIES LENDING COLLATERAL**–5.08% | |
| Short-Term Investments–5.08% | |
| Fixed Rate Note–0.96% | |
Citigroup Global Markets
5.32% 1/2/07 | | $ | 1,664,955 | | | $ | 1,664,954 | | |
| | | | | | | | 1,664,954 | | |
| • Variable Rate Notes–4.12% | | | | | | | | | |
American Honda Finance
5.32% 2/21/07 | | | 215,307 | | | | 215,307 | | |
| ANZ National 5.35% 1/29/08 | | | 47,846 | | | | 47,846 | | |
| Australia New Zealand 5.35% 1/29/08 | | | 239,230 | | | | 239,230 | | |
| Bank of America 5.32% 2/23/07 | | | 311,000 | | | | 311,000 | | |
| Bank of New York 5.34% 1/29/08 | | | 191,384 | | | | 191,384 | | |
| Barclays New York 5.31% 5/18/07 | | | 311,000 | | | | 311,000 | | |
| Bayerische Landesbank 5.40% 1/29/08 | | | 239,230 | | | | 239,230 | | |
| Bear Stearns 5.41% 6/29/07 | | | 287,076 | | | | 287,076 | | |
| BNP Paribas 5.35% 1/29/08 | | | 239,230 | | | | 239,230 | | |
| Canadian Imperial Bank 5.33% 1/29/09 | | | 167,461 | | | | 167,461 | | |
| CDC Financial Products 5.36% 1/29/07 | | | 311,000 | | | | 311,000 | | |
| Citigroup Global Markets 5.38% 1/5/07 | | | 311,000 | | | | 311,000 | | |
| Commonwealth Bank 5.35% 1/29/08 | | | 239,230 | | | | 239,230 | | |
| Deutsche Bank London 5.34% 2/23/07 | | | 287,076 | | | | 287,076 | | |
| | | Principal
Amount | | Market
Value
(U.S. $) | |
| SECURITY LENDING COLLATERAL (continued) | |
| Short-Term Investments (continued) | |
| • Variable Rate Notes (continued) | | | | | | | | | |
| Dexia Bank 5.33% 9/28/07 | | $ | 334,921 | | | $ | 334,873 | | |
| Goldman Sachs 5.45% 12/28/07 | | | 311,000 | | | | 311,000 | | |
| Marshall & Ilsley Bank 5.33% 1/29/08 | | | 263,153 | | | | 263,153 | | |
Merrill Lynch Mortgage Capital
5.41% 1/8/07 | | | 311,000 | | | | 311,000 | | |
| Morgan Stanley 5.49% 1/29/08 | | | 311,000 | | | | 311,000 | | |
| National Australia Bank 5.32% 3/7/07 | | | 296,645 | | | | 296,645 | | |
| National City Bank 5.32% 3/2/07 | | | 287,085 | | | | 287,102 | | |
| National Rural Utilities 5.34% 1/29/08 | | | 377,984 | | | | 377,984 | | |
| Nordea Bank New York 5.31% 5/16/07 | | | 119,614 | | | | 119,612 | | |
| Nordea Bank Norge 5.36% 1/29/08 | | | 239,230 | | | | 239,230 | | |
| Royal Bank of Scotland 5.34% 1/29/08 | | | 239,230 | | | | 239,230 | | |
| Societe Generale 5.32% 1/29/08 | | | 119,615 | | | | 119,615 | | |
| Toronto Dominion 5.32% 5/29/07 | | | 287,076 | | | | 287,076 | | |
| Wells Fargo 5.36% 1/29/08 | | | 239,230 | | | | 239,230 | | |
| | | | | | | | 7,133,820 | | |
Total Securities Lending Collateral
(cost $8,798,774) | | | | | | | 8,798,774 | | |
International Value Equity Series- 6
Delaware VIP International Value Equity Series
Statement of Net Assets (continued)
| TOTAL MARKET VALUE OF SECURITIES–104.20% (cost $162,013,407) | | $ | 180,346,444 | v | |
| OBLIGATION TO RETURN SECURITIES LENDING COLLATERAL**–(5.08%) | | | (8,798,774 | ) | |
| RECEIVABLES AND OTHER ASSETS NET OF LIABILITIES–0.88% | | | 1,528,927 | | |
| NET ASSETS APPLICABLE TO 7,491,657 SHARES OUTSTANDING–100.00% | | $ | 173,076,597 | | |
NET ASSET VALUE–DELAWARE VIP INTERNATIONAL VALUE EQUITY
SERIES STANDARD CLASS ($173,017,238 / 7,489,082 SHARES) | | $ | 23.10 | | |
| NET ASSET VALUE–DELAWARE VIP INTERNATIONAL VALUE EQUITY SERIES SERVICE CLASS ($59,359 / 2,575 SHARES) | | $ | 23.05 | | |
| COMPONENTS OF NET ASSETS AT DECEMBER 31, 2006: | |
| Shares of beneficial interest (unlimited authorization–no par) | | $ | 85,803,298 | | |
| Undistributed net investment income | | | 3,678,748 | | |
| Accumulated net realized gain on investments | | | 65,252,121 | | |
| Net unrealized appreciation of investments and foreign currencies | | | 18,342,430 | | |
| Total net assets | | $ | 173,076,597 | | |
* Fully or partially on loan.
** See Note 9 in "Notes to Financial Statements."
† Non-income producing security for the year ended December 31, 2006.
• Variable rate security. The interest rate shown is the rate as of December 31, 2006.
v Includes $8,361,364 of securities loaned.
Æ Securities have been classified by country of origin. Classification by type of business has been presented on page 4 in "Country and Sector Allocations."
Summary of Abbreviations:
ADR – American Depositary Receipts
CVA – Dutch Certificate
GBP – British Pound Sterling
NOK – Norwegian Kroner
USD – United States Dollar
The following foreign currency exchange contracts were outstanding at December 31, 2006:
Foreign Currency Exchange Contracts1
Contracts to Receive
(Deliver) | | In Exchange For | | Settlement Date | | Unrealized
Appreciation
(Depreciation) | |
| GBP | (284,717 | ) | | USD | 558,074 | | | 1/02/07 | | $ | 490 | | |
| GBP | 445,099 | | | USD | (872,439 | ) | | 1/02/07 | | | (766 | ) | |
| GBP | (261,956 | ) | | USD | 513,461 | | | 1/03/07 | | | 447 | | |
| NOK | (994,993 | ) | | USD | 158,375 | | | 1/02/07 | | | (1,218 | ) | |
| NOK | (1,971,713 | ) | | USD | 313,882 | | | 1/03/07 | | | (2,390 | ) | |
| | | $ | (3,437 | ) | |
The use of foreign currency exchange contracts involves elements of market risk and risks in excess of the amount recognized in the financial statements. The notional amounts presented above represent the Series' total exposure in such contracts, whereas only the net unrealized appreciation (depreciation) is reflected in the Series' net assets.
1See Note 8 in "Notes to Financial Statements."
See accompanying notes
International Value Equity Series- 7
Delaware VIP Trust —
Delaware VIP International Value Equity Series
Statement of Operations
Year Ended December 31, 2006
| INVESTMENT INCOME: | |
| Dividends | | $ | 5,844,745 | | |
| Interest | | | 60,792 | | |
| Securities lending income | | | 120,169 | | |
| Foreign tax withheld | | | (361,809 | ) | |
| | | | 5,663,897 | | |
| EXPENSES: | |
| Management fees | | | 1,397,646 | | |
| Custodian fees | | | 80,843 | | |
| Accounting and administration expenses | | | 65,771 | | |
| Trustees' fees and benefits | | | 29,505 | | |
| Audit and tax | | | 17,707 | | |
| Legal fees | | | 17,246 | | |
| Dividend disbursing and transfer agent fees and expenses | | | 16,443 | | |
| Reports and statements to shareholders | | | 11,968 | | |
| Insurance fees | | | 6,178 | | |
| Pricing fees | | | 4,488 | | |
| Consulting fees | | | 4,135 | | |
| Dues and services | | | 2,216 | | |
| Trustees' expenses | | | 875 | | |
| Taxes (other than taxes on income) | | | 189 | | |
| Distribution expenses - Service Class | | | 177 | | |
| Registration fees | | | 49 | | |
| | | | 1,655,436 | | |
| Less waiver of distribution expenses - Service Class | | | (30 | ) | |
| Total operating expenses | | | 1,655,406 | | |
| NET INVESTMENT INCOME | | | 4,008,491 | | |
NET REALIZED AND UNREALIZED GAIN (LOSS)
ON INVESTMENTS AND FOREIGN CURRENCIES: | |
| Net realized gain on: | |
| Investments | | | 66,401,072 | | |
| Foreign currencies | | | 23,940 | | |
| Net realized gain | | | 66,425,012 | | |
Net change in unrealized appreciation/depreciation
of investments and foreign currencies | | | (35,420,048 | ) | |
NET REALIZED AND UNREALIZED GAIN ON
INVESTMENTS AND FOREIGN CURRENCIES | | | 31,004,964 | | |
NET INCREASE IN NET ASSETS RESULTING
FROM OPERATIONS | | $ | 35,013,455 | | |
See accompanying notes
Delaware VIP Trust —
Delaware VIP International Value Equity Series
Statements of Changes in Net Assets
| | | Year Ended | |
| | | 12/31/06 | | 12/31/05 | |
INCREASE (DECREASE) IN NET
ASSETS FROM OPERATIONS: | |
| Net investment income | | $ | 4,008,491 | | | $ | 4,195,257 | | |
Net realized gain on investments
and foreign currencies | | | 66,425,012 | | | | 9,604,540 | | |
Net change in unrealized appreciation/
depreciation of investments and
foreign currencies | | | (35,420,048 | ) | | | 5,525,580 | | |
Net increase in net assets resulting
from operations | | | 35,013,455 | | | | 19,325,377 | | |
DIVIDENDS AND DISTRIBUTIONS
TO SHAREHOLDERS FROM: | |
| Net investment income: | |
| Standard Class | | | (4,683,222 | ) | | | (2,493,989 | ) | |
| Service Class | | | (1,608 | ) | | | (928 | ) | |
| Net realized gain on investments: | |
| Standard Class | | | (9,267,611 | ) | | | (1,825,497 | ) | |
| Service Class | | | (3,444 | ) | | | (788 | ) | |
| | | | (13,955,885 | ) | | | (4,321,202 | ) | |
| CAPITAL SHARE TRANSACTIONS: | |
| Proceeds from shares sold: | |
| Standard Class | | | 90,482,396 | | | | 4,337,148 | | |
| Service Class | | | 336 | | | | 3,501 | | |
Net asset value of shares issued upon
reinvestment of dividends and distributions: | |
| Standard Class | | | 13,950,833 | | | | 4,319,486 | | |
| Service Class | | | 5,052 | | | | 1,716 | | |
| | | | 104,438,617 | | | | 8,661,851 | | |
| Cost of shares repurchased: | |
| Standard Class | | | (113,759,501 | ) | | | (26,906,001 | ) | |
| Service Class | | | (14,980 | ) | | | (44,213 | ) | |
| | | | (113,774,481 | ) | | | (26,950,214 | ) | |
Decrease in net assets derived from
capital share transactions | | | (9,335,864 | ) | | | (18,288,363 | ) | |
NET INCREASE (DECREASE)
IN NET ASSETS | | | 11,721,706 | | | | (3,284,188 | ) | |
| NET ASSETS: | |
| Beginning of year | | | 161,354,891 | | | | 164,639,079 | | |
End of year (including undistributed
net investment income of $3,678,748 and
$4,331,147, respectively) | | $ | 173,076,597 | | | $ | 161,354,891 | | |
See accompanying notes
International Value Equity Series- 8
Delaware VIP Trust — Delaware VIP International Value Equity Series
Financial Highlights
Selected data for each share of the Series outstanding throughout each period were as follows:
| | | Delaware VIP International Value Equity Series Standard Class | |
| | | Year Ended | |
| | | 12/31/06 | | 12/31/05 | | 12/31/04 | | 12/31/03 | | 12/31/02 | |
| Net asset value, beginning of period | | $ | 20.380 | | | $ | 18.550 | | | $ | 15.660 | | | $ | 11.550 | | | $ | 13.900 | | |
| Income (loss) from investment operations: | |
| Net investment income1 | | | 0.512 | | | | 0.496 | | | | 0.396 | | | | 0.373 | | | | 0.254 | | |
Net realized and unrealized gain (loss) on investments
and foreign currencies | | | 4.043 | | | | 1.838 | | | | 2.920 | | | | 4.355 | | | | (1.556 | ) | |
| Total from investment operations | | | 4.555 | | | | 2.334 | | | | 3.316 | | | | 4.728 | | | | (1.302 | ) | |
| Less dividends and distributions from: | |
| Net investment income | | | (0.616 | ) | | | (0.291 | ) | | | (0.426 | ) | | | (0.314 | ) | | | (0.284 | ) | |
| Net realized gain on investments | | | (1.219 | ) | | | (0.213 | ) | | | — | | | | (0.304 | ) | | | (0.764 | ) | |
| Total dividends and distributions | | | (1.835 | ) | | | (0.504 | ) | | | (0.426 | ) | | | (0.618 | ) | | | (1.048 | ) | |
| Net asset value, end of period | | $ | 23.100 | | | $ | 20.380 | | | $ | 18.550 | | | $ | 15.660 | | | $ | 11.550 | | |
| Total return2 | | | 23.59 | % | | | 12.87 | % | | | 21.79 | % | | | 43.44 | % | | | (10.40 | %) | |
| Ratios and supplemental data: | |
| Net assets, end of period (000 omitted) $173,017 | | $ | 161,293 | | | $ | 164,544 | | | $ | 167,813 | | | $ | 1 | | | | 42,065 | | |
| Ratio of expenses to average net assets | | | 1.01 | % | | | 1.00 | % | | | 0.99 | % | | | 0.98 | % | | | 0.98 | % | |
Ratio of expenses to average net assets prior to expense
limitation and expenses paid indirectly | | | 1.01 | % | | | 1.02 | % | | | 0.99 | % | | | 0.99 | % | | | 1.02 | % | |
| Ratio of net investment income to average net assets | | | 2.44 | % | | | 2.63 | % | | | 2.46 | % | | | 2.96 | % | | | 1.99 | % | |
Ratio of net investment income to average net assets prior
to expense limitation and expenses paid indirectly | | | 2.44 | % | | | 2.61 | % | | | 2.46 | % | | | 2.95 | % | | | 1.95 | % | |
| Portfolio turnover | | | 114 | % | | | 8 | % | | | 10 | % | | | 11 | % | | | 13 | % | |
1The average shares outstanding method has been applied for per share information.
2Total investment return is based on the change in net asset value of a share during the period and assumes reinvestment of dividends and distributions at net asset value. Total investment return reflects waivers and payment of fees by the manager, as applicable. Performance would have been lower had the expense limitation not been in effect.
See accompanying notes
International Value Equity Series- 9
Delaware VIP International Value Equity Series
Financial Highlights (continued)
| Selected data for each share of the Series outstanding throughout each period were as follows: | |
| | | Delaware VIP International Value Equity Series Service Class | |
| | | Year Ended | |
| | | 12/31/06 | | 12/31/05 | | 12/31/04 | | 12/31/03 | | 12/31/02 | |
| Net asset value, beginning of period | | $ | 20.350 | | | $ | 18.520 | | | $ | 15.650 | | | $ | 11.550 | | | $ | 13.900 | | |
| Income (loss) from investment operations: | |
| Net investment income1 | | | 0.459 | | | | 0.449 | | | | 0.356 | | | | 0.345 | | | | 0.236 | | |
Net realized and unrealized gain (loss) on investments
and foreign currencies | | | 4.029 | | | | 1.845 | | | | 2.911 | | | | 4.355 | | | | (1.559 | ) | |
| Total from investment operations | | | 4.488 | | | | 2.294 | | | | 3.267 | | | | 4.700 | | | | (1.323 | ) | |
| Less dividends and distributions from: | |
| Net investment income | | | (0.569 | ) | | | (0.251 | ) | | | (0.397 | ) | | | (0.296 | ) | | | (0.263 | ) | |
| Net realized gain on investments | | | (1.219 | ) | | | (0.213 | ) | | | — | | | | (0.304 | ) | | | (0.764 | ) | |
| Total dividends and distributions | | | (1.788 | ) | | | (0.464 | ) | | | (0.397 | ) | | | (0.600 | ) | | | (1.027 | ) | |
| Net asset value, end of period | | $ | 23.050 | | | $ | 20.350 | | | $ | 18.520 | | | $ | 15.650 | | | $ | 11.550 | | |
| Total return2 | | | 23.24 | % | | | 12.65 | % | | | 21.44 | % | | | 43.11 | % | | | (10.54 | %) | |
| Ratios and supplemental data: | |
| Net assets, end of period (000 omitted) | | $ | 60 | | | $ | 62 | | | $ | 95 | | | $ | 109 | | | $ | 54 | | |
| Ratio of expenses to average net assets | | | 1.26 | % | | | 1.25 | % | | | 1.24 | % | | | 1.20 | % | | | 1.13 | % | |
Ratio of expenses to average net assets prior to expense
limitation and expenses paid indirectly | | | 1.31 | % | | | 1.32 | % | | | 1.29 | % | | | 1.24 | % | | | 1.17 | % | |
| Ratio of net investment income to average net assets | | | 2.19 | % | | | 2.38 | % | | | 2.21 | % | | | 2.74 | % | | | 1.84 | % | |
Ratio of net investment income to average net assets prior
to expense limitation and expenses paid indirectly | | | 2.14 | % | | | 2.31 | % | | | 2.16 | % | | | 2.70 | % | | | 1.80 | % | |
| Portfolio turnover | | | 114 | % | | | 8 | % | | | 10 | % | | | 11 | % | | | 13 | % | |
1The average shares outstanding method has been applied for per share information.
2Total investment return is based on the change in net asset value of a share during the period and assumes reinvestment of dividends and distributions at net asset value. Total investment return reflects waivers and payment of fees by the manager and distributor, as applicable. Performance would have been lower had the expense limitation and waiver not been in effect.
See accompanying notes
International Value Equity Series- 10
Delaware VIP Trust — Delaware VIP International Value Equity Series
Notes to Financial Statements
December 31, 2006
Delaware VIP Trust (the "Trust") is organized as a Delaware statutory trust and offers 15 series: Delaware VIP Balanced Series, Delaware VIP Capital Reserves Series, Delaware VIP Cash Reserve Series, Delaware VIP Diversified Income Series, Delaware VIP Emerging Markets Series, Delaware VIP Global Bond Series, Delaware VIP Growth Opportunities Series, Delaware VIP High Yield Series, Delaware VIP International Value Equity Series, Delaware VIP REIT Series, Delaware VIP Select Growth Series, Delaware VIP Small Cap Value Series, Delaware VIP Trend Series, Delaware VIP U.S. Growth Series and Delaware VIP Value Series. These financial statements and the related notes pertain to Delaware VIP International Value Equity Series (the "Series"). The Trust is an open-end investment company. The Series is considered diversified under the Investment Company Act of 1940, as amended, and offers Standard Class and Service Class shares. The Standard Class shar es do not carry a 12b-1 fee and the Service Class shares carry a 12b-1 fee. The shares of the Series are sold only to separate accounts of life insurance companies.
The investment objective of the Series is to seek long-term growth without undue risk to principal.
1. Significant Accounting Policies
The following accounting policies are in accordance with U.S. generally accepted accounting principles and are consistently followed by the Series.
Security Valuation—Equity securities, except those traded on the Nasdaq Stock Market, Inc. (Nasdaq), are valued at the last quoted sales price as of the time of the regular close of the New York Stock Exchange (NYSE) on the valuation date. Securities traded on the Nasdaq are valued in accordance with the Nasdaq Official Closing Price, which may not be the last sales price. If on a particular day an equity security does not trade, then the mean between the bid and asked prices will be used. Securities listed on a foreign exchange are valued at the last quoted sales price before the Series is valued. Short-term debt securities having less than 60 days to maturity are valued at amortized cost, which approximates market value. Securities lending collateral is valued at amortized cost, which approximates market value. Foreign currency exchange contracts are valued at the mean between the bid and asked prices of the contracts and are marked-to-market daily. Interpolated values are derived when the settlement date of the contract is an interim date for which quotations are not available. Other securities and assets for which market quotations are not readily available are valued at fair value as determined in good faith under the direction of the Series' Board of Trustees. In determining whether market quotations are readily available or fair valuation will be used, various factors will be taken into consideration, such as market closures, or with respect to foreign securities, aftermarket trading, or significant events after local market trading (e.g., government actions or pronouncements, trading volume or volatility on markets, exchanges among dealers, or news events).
In September 2006, the Financial Accounting Standards Board (FASB) issued FASB Statement No. 157 "Fair Value Measurements" (Statement 157). Statement 157 establishes a framework for measuring fair value in generally accepted accounting principles, clarifies the definition of fair value within that framework, and expands disclosures about the use of fair value measurements. Statement 157 is intended to increase consistency and comparability among fair value estimates used in financial reporting. Statement 157 is effective for fiscal years beginning after November 15, 2007. Management does not expect the adoption of Statement 157 to have an impact on the amounts reported in the financial statements.
Federal Income Taxes—The Series intends to continue to qualify for federal income tax purposes as a regulated investment company and make the requisite distributions to shareholders. Accordingly, no provision for federal income taxes has been made in the financial statements.
On July 13, 2006, FASB released FASB Interpretation No. 48 "Accounting for Uncertainty in Income Taxes" (FIN 48). FIN 48 provides guidance for how uncertain tax positions should be recognized, measured, presented and disclosed in the financial statements. FIN 48 requires the evaluation of tax positions taken or expected to be taken in the course of preparing the Series' tax returns to determine whether the tax positions are "more-likely-than-not" of being sustained by the applicable tax authority. Tax positions not deemed to meet the more-likely-than-not threshold would be recorded as a tax benefit or expense in the current year. Adoption of FIN 48 is required for fiscal years beginning after December 15, 2006 and is to be applied to all open tax years as of the effective date. Recent SEC guidance allows implementing FIN 48 in Series net asset value calculations as late as the Series' last net asset value calculation in the first required fi nancial statement reporting period. As a result, the Series will incorporate FIN 48 in its semiannual report on June 30, 2007. Although the Series' tax positions are currently being evaluated, management does not expect the adoption of FIN 48 to have a material impact on the Series' financial statements.
Class Accounting—Investment income, common expenses and realized and unrealized gain (loss) on investments are allocated to the classes of the Series on the basis of daily net assets of each class. Distribution expenses relating to a specific class are charged directly to that class.
Repurchase Agreements—The Series may invest in a pooled cash account along with other members of the Delaware Investments® Family of Funds pursuant to an exemptive order issued by the Securities and Exchange Commission. The aggregate daily balance of the pooled cash account is invested in repurchase agreements secured by obligations of the U.S. government. The respective collateral is held by the Series' custodian bank until the maturity of the respective repurchase agreements. Each repurchase agreement is at least 102% collateralized. However, in the event of default or bankruptcy by the counterparty to the agreement, realization of the collateral may be subject to legal proceedings.
Foreign Currency Transactions—Transactions denominated in foreign currencies are recorded at the prevailing exchange rates on the valuation date. The value of all assets and liabilities denominated in foreign currencies are translated into U.S. dollars at the exchange rate of such currencies against the U.S. dollar daily. Transaction gains or losses resulting from changes in exchange rates during the reporting period or upon settlement of the foreign currency transaction are reported in operations for the current period. The Series does not isolate that portion of realized gains and losses on investments which are due to changes in foreign exchange rates from that which are due to changes in market prices. The Series reports certain foreign currency related transactions as components of realized gains (losses) for financial reporting purposes, where such comp onents are treated as ordinary income (loss) for federal income tax purposes.
Use of Estimates—The preparation of financial statements in conformity with U.S. generally accepted accounting principles requires management to make estimates and assumptions that affect the reported amounts of assets and liabilities at the date of the financial statements and the reported amounts of revenues and expenses during the reporting period. Actual results could differ from those estimates.
International Value Equity Series- 11
Delaware VIP International Value Equity Series
Notes to Financial Statements (continued)
1. Significant Accounting Policies (continued)
Other—Expenses directly attributable to the Series are charged directly to the Series. Other expenses common to various funds within the Delaware Investments® Family of Funds are generally allocated amongst such funds on the basis of average net assets. Management fees and some other expenses are paid monthly. Security transactions are recorded on the date the securities are purchased or sold (trade date) for financial reporting purposes. Costs used in calculating realized gains and losses on the sale of investment securities are those of the specific securities sold. Dividend income is recorded on the ex-dividend date and interest income is recorded on the accrual basis. Taxable non-cash dividends are recorded as dividend income. Foreign dividends are also recorded on the ex-dividend date or as soon after the ex-dividend date that the Series i s aware of such dividends, net of all non-rebatable tax withholdings. Withholding taxes on foreign dividends have been recorded in accordance with the Series' understanding of the applicable country's tax rules and rates.
The Series declares and pays dividends from net investment income and distributions from net realized gain on investments, if any, following the close of the fiscal year.
2. Investment Management, Administration Agreements and Other Transactions with Affiliates
In accordance with the terms of its investment management agreement, the Series pays Delaware Management Company (DMC), a series of Delaware Management Business Trust and the investment manager, an annual fee which is calculated daily at the rate of 0.85% on the first $500 million of average daily net assets of the Series, 0.80% on the next $500 million, 0.75% on the next $1.5 billion, and 0.70% on average daily net assets in excess of $2.5 billion.
Prior to May 1, 2006, Mondrian Investment Partners Ltd. served as the Series' sub-advisor. For these services, DMC, not the Series, paid the Sub-Advisor 0.20% of the Series' average daily net assets. Beginning May 1, 2006, DMC is responsible for the day to day management of the Series.
DMC has contractually agreed to waive that portion, if any, of its management fee and reimburse the Series to the extent necessary to ensure that annual operating expenses, exclusive of taxes, interest, brokerage commissions, distribution fees, certain insurance costs and extraordinary expenses, do not exceed 1.08% of average daily net assets of the Series through April 30, 2007. Prior to May 1, 2006, the expense limitation was 1.00% of average daily net assets. No reimbursement was due for the year ended December 31, 2006.
Delaware Service Company, Inc. (DSC), an affiliate of DMC, provides accounting, administration, dividend disbursing and transfer agent services. The Series pays DSC a monthly fee computed at the annual rate of 0.04% of the Series' average daily net assets for accounting and administrative services. The Series pays DSC a monthly fee based on average net assets for dividend disbursing and transfer agent services.
Pursuant to a distribution agreement and distribution plan, the Series pays Delaware Distributors, L.P. (DDLP), the distributor and an affiliate of DMC, an annual distribution and service fee not to exceed 0.30% of the average daily net assets of the Service Class shares. DDLP has contracted to waive distribution and service fees through April 30, 2007 in order to prevent distribution and service fees of the Service Class shares from exceeding 0.25% of average daily net assets. Standard Class shares pay no distribution and service expenses.
At December 31, 2006, the Series had liabilities payable to affiliates as follows:
Investment
Management
Fee Payable to
DMC | | Dividend Disbursing,
Transfer Agent,
Accounting and Administration
Fees and Other Expenses
Payable to DSC | | Distribution
Fees Payable
to DDLP | | Other
Expenses
Payable
to
Affiliates* | |
| $ | 123,778 | | | $ | 8,113 | | | $ | 13 | | | $ | 6,504 | | |
*DMC, as part of its administrative services, pays operating expenses on behalf of the Series and is reimbursed on a periodic basis. Such expenses include items such as printing of shareholder reports, fees for audit, legal and tax services, custodian fees and trustees' fees.
As provided in the investment management agreement, the Series bears the cost of certain legal and tax services, including internal legal and tax services provided to the Series by DMC and/or its affiliates' employees. For the year ended December 31, 2006, the Series was charged $7,810 for internal legal and tax services provided by DMC and/or its affiliates' employees.
Trustees' fees and benefits include expenses accrued by the Series for each Trustee's retainer, per meeting fees and retirement benefits. Independent Trustees with over five years of uninterrupted service are eligible to participate in a retirement plan that provides for the payment of benefits upon retirement. The amount of the retirement benefit is based on factors set forth in the plan, including the number of years of service. On November 16, 2006, the Board of Trustees unanimously voted to terminate the retirement plan. Payments equal to the net present value of the earned benefits will be made in 2007 to those independent trustees so entitled. The retirement benefit payout for the Series is $20,374. Certain officers of DMC, DSC and DDLP are officers and/or trustees of the Trust. These officers and trustees are paid no compensation by the Series.
International Value Equity Series- 12
Delaware VIP International Value Equity Series
Notes to Financial Statements (continued)
3. Investments
For the year ended December 31, 2006, the Series made purchases and sales of investment securities other than short-term investments as follows:
| Purchases | | $ | 185,501,299 | | |
| Sales | | | 206,300,060 | | |
At December 31, 2006, the cost of investments for federal income tax purposes and unrealized appreciation (depreciation) for the Series were as follows:
Cost of
Investments | | Aggregate
Unrealized
Appreciation | | Aggregate
Unrealized
Depreciation | | Net Unrealized
Appreciation | |
| $ | 162,453,973 | | | $ | 23,044,828 | | | $ | (5,152,357 | ) | | $ | 17,892,471 | | |
4. Dividend and Distribution Information
Income and long-term capital gain distributions are determined in accordance with federal income tax regulations, which may differ from U.S. generally accepted accounting principles. Additionally, gains (losses) on foreign currency transactions and net short-term gains on sales of investment securities are treated as ordinary income for federal income tax purposes. The tax character of dividends and distributions paid during the years ended December 31, 2006 and 2005 was as follows:
| | | Year
Ended
12/31/06 | | Year
Ended
12/31/05 | |
| Ordinary income | | $ | 4,773,624 | | | $ | 2,563,510 | | |
| Long-term capital gain | | | 9,182,261 | | | | 1,757,692 | | |
| Total | | $ | 13,955,885 | | | $ | 4,321,202 | | |
5. Components of Net Assets on a Tax Basis
As of December 31, 2006, the components of net assets on a tax basis were as follows:
| Shares of beneficial interest | | $ | 85,803,298 | | |
| Undistributed ordinary income | | | 4,884,050 | | |
| Undistributed long-term capital gain | | | 64,502,538 | | |
| Post-October currency losses | | | (18,590 | ) | |
| Unrealized appreciation of investments | |
| and foreign currencies | | | 17,905,301 | | |
| Net assets | | $ | 173,076,597 | | |
The differences between book basis and tax basis components of net assets are primarily attributable to tax deferral of losses on wash sales and mark to market of foreign currency contracts.
Post-October currency losses represent losses realized on foreign currency transactions from November 1, 2006 through December 31, 2006 that, in accordance with federal income tax regulations, the Series has elected to defer and treat as having arisen in the following fiscal year.
For financial reporting purposes, capital accounts are adjusted to reflect the tax character of permanent book/tax differences. Reclassifications are primarily due to tax treatment of gain (loss) on foreign currency transactions. Results of operations and net assets were not affected by these reclassifications. For the year ended December 31, 2006, the Series recorded the following reclassifications:
Undistributed
Net
Investment Income | | Accumulated
Net Realized
Gain (Loss) | |
| $ | 23,940 | | | $ | (23,940 | ) | |
International Value Equity Series- 13
Delaware VIP International Value Equity Series
Notes to Financial Statements (continued)
6. Capital Shares
Transactions in capital shares were as follows:
| | | Year
Ended
12/31/06 | | Year
Ended
12/31/05 | |
| Shares sold: | |
| Standard Class | | | 4,684,879 | | | | 233,387 | | |
| Service Class | | | 15 | | | | 191 | | |
Shares issued upon reinvestment of dividends
and distributions: | |
| Standard Class | | | 686,895 | | | | 234,882 | | |
| Service Class | | | 249 | | | | 93 | | |
| | | | 5,372,038 | | | | 468,553 | | |
| Shares repurchased: | |
| Standard Class | | | (5,796,253 | ) | | | (1,425,475 | ) | |
| Service Class | | | (712 | ) | | | (2,381 | ) | |
| | | | (5,796,965 | ) | | | (1,427,856 | ) | |
| Net decrease | | | (424,927 | ) | | | (959,303 | ) | |
7. Line of Credit
The Series, along with certain other funds in the Delaware Investments® Family of Funds (the "Participants"), participates in a $225,000,000 revolving line of credit facility to be used for temporary or emergency purposes as an additional source of liquidity to fund redemptions of investor shares. The Participants are charged an annual commitment fee, which is allocated across the Participants on the basis of each Participant's allocation of the entire facility. The Participants may borrow up to a maximum of one third of their net assets under the agreement. The Series had no amounts outstanding as of December 31, 2006, or at any time during the year then ended.
8. Foreign Currency Exchange Contracts
The Series may enter into foreign currency exchange contracts as a way of managing foreign exchange rate risk. The Series may enter into these contracts to fix the U.S. dollar value of a security that it has agreed to buy or sell for the period between the date the trade was entered into and the date the security is delivered and paid for. The Series may also use these contracts to hedge the U.S. dollar value of securities it already owns that are denominated in foreign currencies. The change in market value is recorded as an unrealized gain or loss. When the contract is closed, a realized gain or loss is recorded equal to the difference between the value of the contract at the time it was opened and the value at the time it was closed.
The use of foreign currency exchange contracts does not eliminate fluctuations in the underlying prices of the securities, but does establish a rate of exchange that can be achieved in the future. Although foreign currency exchange contracts limit the risk of loss due to a decline in the value of the hedged currency, they also limit any potential gain that might result should the value of the currency increase. In addition, the Series could be exposed to risks if the counterparties to the contracts are unable to meet the terms of their contracts. The unrealized gain (loss) is included in receivables and other assets net of liabilities on the Statement of Net Assets.
9. Securities Lending
The Series, along with other funds in the Delaware Investments® Family of Funds, may lend its securities pursuant to a security lending agreement (Lending Agreement) with JPMorgan Chase. Initial security loans made pursuant to the Lending Agreement are required to be secured by U.S. government obligations and/or cash collateral not less than 102% of the market value of securities issued in the United States and 105% of the market value of the securities issued outside the United States. With respect to each loan, if the aggregate market value of the collateral held on any business day is less than the aggregate market value of the securities which are the subject of such loan, the borrower will be notified to provide additional collateral not less than the applicable collateral requirements. Cash collateral received is invested in fixed income securities, with a weighted average maturity not to exceed 90 days, rated in one of the top two tiers by Standard & Poor's Ratings Group or Moody's Investors Service, Inc. or repurchase agreements collateralized by such securities. However, in the event of default or bankruptcy by the lending agent, realization and/or retention of the collateral may be subject to legal proceedings. In the event the borrower fails to return loaned securities and the collateral received is insufficient to cover the value of the loaned securities and provided such collateral shortfall is not the result of investment losses, the lending agent has agreed to pay the amount of the shortfall to the Series, or at the discretion of the lending agent, replace the loaned securities. The Series continues to record dividends on the securities loaned and is subject to change in value of the securities loaned that may occur during the term of the loan. The Series has the right under the Lending Agreement to recover the securities from the borrower on demand. The security lending agent and the borrower retain a portion of the earnings from the collateral investments. The Series records security lending income net of such allocation.
At December 31, 2006, the market value of securities on loan was $8,361,364, for which cash collateral was received and invested in accordance with the Lending Agreement. Such investments are presented on the Statement of Net Assets under the caption "Securities Lending Collateral."
International Value Equity Series-14
Delaware VIP International Value Equity Series
Notes to Financial Statements (continued)
10. Credit and Market Risk
Some countries in which the Series may invest require governmental approval for the repatriation of investment income, capital or the proceeds of sales of securities by foreign investors. In addition, if there is deterioration in a country's balance of payments or for other reasons, a country may impose temporary restrictions on foreign capital remittances abroad.
The securities exchanges of certain foreign markets are substantially smaller, less liquid, and more volatile than the major securities markets in the United States. Consequently, acquisition and disposition of securities by the Series may be inhibited. In addition, a significant portion of the aggregate market value of equity securities listed on the major securities exchanges in emerging markets are held by a smaller number of investors. This may limit the number of shares available for acquisition or disposition by the Series.
The Series may invest up to 10% of its total assets in illiquid securities, which may include securities with contractual restrictions on resale, securities exempt from registration under Rule 144A of the Securities Act of 1933, as amended, and other securities which may not be readily marketable. The relative illiquidity of these securities may impair the Series from disposing of them in a timely manner and at a fair price when it is necessary or desirable to do so. While maintaining oversight, the Series' Board of Trustees has delegated to DMC the day-to-day functions of determining whether individual securities are liquid for purposes of the Series' limitation on investments in illiquid assets. At December 31, 2006, there were no Rule 144A securities and no securities have been determined to be illiquid under the Series' Liquidity Procedures.
11. Contractual Obligations
The Series enters into contracts in the normal course of business that contain a variety of indemnifications. The Series' maximum exposure under these arrangements is unknown. However, the Series has not had prior claims or losses pursuant to these contracts. Management has reviewed the Series' existing contracts and expects the risk of loss to be remote.
12. Tax Information (Unaudited)
For the fiscal year ended December 31, 2006, the Series designates dividends and distributions paid during the year as follows:
(A)
Long-Term
Capital Gain
Distributions
(Tax Basis) | | (B)
Ordinary
Income
Distributions
(Tax Basis) | | Total
Distributions
(Tax Basis) | |
| | 66 | % | | | 34 | % | | | 100 | % | |
(A) and (B) are based on a percentage of the Series' total distributions.
The Delaware VIP International Value Equity Series intends to pass through foreign tax credits in the maximum amount of $246,256. The gross foreign source income earned during the fiscal year 2006 by the Delaware VIP International Value Equity Series was $5,844,855.
International Value Equity Series- 15
Delaware VIP Trust — Delaware VIP International Value Equity Series
Report of Independent Registered Public Accounting Firm
To the Shareholders and Board of Trustees
Delaware VIP Trust–Delaware VIP International Value Equity Series
We have audited the accompanying statement of net assets of the Delaware VIP International Value Equity Series (one of the series constituting Delaware VIP Trust) (the "Series") as of December 31, 2006, and the related statement of operations for the year then ended, the statements of changes in net assets for each of the two years in the period then ended, and the financial highlights for each of the five years in the period then ended. These financial statements and financial highlights are the responsibility of the Series' management. Our responsibility is to express an opinion on these financial statements and financial highlights based on our audits.
We conducted our audits in accordance with the standards of the Public Company Accounting Oversight Board (United States). Those standards require that we plan and perform the audit to obtain reasonable assurance about whether the financial statements and financial highlights are free of material misstatement. We were not engaged to perform an audit of the Series' internal control over financial reporting. Our audits included consideration of internal control over financial reporting as a basis for designing audit procedures that are appropriate in the circumstances, but not for the purpose of expressing an opinion on the effectiveness of the Series' internal control over financial reporting. Accordingly, we express no such opinion. An audit also includes examining, on a test basis, evidence supporting the amounts and disclosures in the financial statements and financial highlights, assessing the accounting principles used and significant es timates made by management, and evaluating the overall financial statement presentation. Our procedures included confirmation of securities owned as of December 31, 2006, by correspondence with the custodian and brokers or by other appropriate auditing procedures where replies from brokers were not received. We believe that our audits provide a reasonable basis for our opinion.
In our opinion, the financial statements and financial highlights referred to above present fairly, in all material respects, the financial position of the Delaware VIP International Value Equity Series of Delaware VIP Trust at December 31, 2006, the results of its operations for the year then ended, the changes in its net assets for each of the two years in the period then ended, and its financial highlights for each of the five years in the period then ended, in conformity with U.S. generally accepted accounting principles.

Philadelphia, Pennsylvania
February 14, 2007
The Series files its complete schedule of portfolio holdings with the Securities and Exchange Commission for the first and third quarters of each fiscal year on Form N-Q. The Series' Forms N-Q, as well as a description of the policies and procedures that the Series uses to determine how to vote proxies (if any) relating to portfolio securities is available without charge (i) upon request, by calling 800-523-1918; (ii) on the Series' website at http://www.delawareinvestments.com; and (iii) on the Commission's website at http://www.sec.gov. The Series' Forms N-Q may be reviewed and copied at the Commission's Public Reference Room in Washington, DC; information on the operation of the Public Reference Room may be obtained by calling 1-800-SEC-0330.
Information (if any) regarding how the Series voted proxies relating to portfolio securities during the most recently disclosed 12-month period ended June 30 is available without charge (i) through the Series' website at http://www.delawareinvestments.com; and (ii) on the Commission's website at http://www.sec.gov.
International Value Equity Series- 16
Delaware Investments® Family of Funds
board of trustees/directors and officers addendum
A mutual fund is governed by a Board of Trustees/Directors ("Trustees"), which has oversight responsibility for the management of a fund's business affairs. Trustees establish procedures and oversee and review the performance of the investment manager, the distributor, and others who perform services for the fund. The independent fund trustees, in particular, are advocates for shareholder interests. Each trustee has served in that capacity since he or she was elected to or appointed to the Board of Trustees, and will continue to serve until his or her retirement or the election of a new trustee in his or her place. The following is a list of the Trustees and Officers with certain background and related information.
Name,
Address,
and Birth Date | | Position(s)
Held with
Fund(s) | | Length of Time
Served | | Principal
Occupation(s)
During
Past 5 Years | | Number of
Portfolios in Fund
Complex Overseen
by Trustee
or Officer | | Other
Directorships
Held by
Trustee
or Officer | |
| interested trustees | | | | | | | | | | | | | |
|
Patrick P. Coyne1
2005 Market Street
Philadelphia, PA
19103
April 14, 1963 | | Chairman,
President,
Chief Executive
Officer, and
Trustee | | Chairman and Trustee
since August 16, 2006
President and
Chief Executive Officer
since August 1, 2006 | | Patrick P. Coyne has served in
various executive capacities
at different times at
Delaware Investments.2 | | | 84 | | | None | |
|
| independent trustees | | | | | | | | | | | | | |
|
Thomas L. Bennett
2005 Market Street
Philadelphia, PA
19103
October 4, 1947 | | Trustee | | Since
March 2005 | | Private Investor –
(March 2004 – Present)
Investment Manager –
Morgan Stanley & Co.
(January 1984 – March 2004) | | | 84 | | | None | |
|
John A. Fry
2005 Market Street
Philadelphia, PA
19103
May 28, 1960 | | Trustee | | Since
January 2001 | | President –
Franklin & Marshall College
(June 2002 – Present)
Executive Vice President –
University of Pennsylvania
(April 1995 – June 2002) | | | 84 | | | Director –
Community Health
Systems
Director –
Allied Barton
Security Holdings | |
|
Anthony D. Knerr
2005 Market Street
Philadelphia, PA
19103
December 7, 1938 | | Trustee | | Since
April 1990 | | Founder and Managing Director –
Anthony Knerr & Associates
(Strategic Consulting)
(1990 – Present) | | | 84 | | | None | |
|
Lucinda S. Landreth
2005 Market Street
Philadelphia, PA
19103
June 24, 1947 | | Trustee | | Since
March 2005 | | Chief Investment Officer –
Assurant, Inc.
(Insurance)
(2002 – 2004) | | | 84 | | | None | |
|
Ann R. Leven
2005 Market Street
Philadelphia, PA
19103
November 1, 1940 | | Trustee | | Since
September 1989 | | Consultant –
ARL Associates
(Financial Planning)
(1983 – Present) | | | 84 | | | Director and
Audit Committee
Chairperson – Andy
Warhol Foundation
Director and Audit
Committee Member –
Systemax, Inc. | |
|
International Value Equity Series- 17
Name,
Address,
and Birth Date | | Position(s)
Held with
Fund(s) | | Length of Time
Served | | Principal
Occupation(s)
During
Past 5 Years | | Number of
Portfolios in Fund
Complex Overseen
by Trustee
or Officer | | Other
Directorships
Held by
Trustee
or Officer | |
| independent trustees (continued) | | | | | | | | | | | | | |
|
Thomas F. Madison
2005 Market Street
Philadelphia, PA
19103
February 25, 1936 | | Trustee | | Since
May 1997 | | President and Chief
Executive Officer –
MLM Partners, Inc.
(Small Business Investing
and Consulting)
(January 1993 – Present) | | | 84 | | | Director –
Banner Health
Director –
CenterPoint Energy
Director and Audit
Committee Member –
Digital River, Inc.
Director and Audit
Committee Member –
Rimage
Corporation
Director – Valmont
Industries, Inc. | |
|
Janet L. Yeomans
2005 Market Street
Philadelphia, PA
19103
July 31, 1948 | | Trustee | | Since
April 1999 | | Vice President
(January 2003 – Present)
and Treasurer
(January 2006 – Present)
3M Corporation
Ms. Yeomans has held
various management positions
at 3M Corporation since 1983. | | | 84 | | | None | |
|
J. Richard Zecher
2005 Market Street
Philadelphia, PA
19103
July 3, 1940 | | Trustee | | Since
March 2005 | | Founder –
Investor Analytics
(Risk Management)
(May 1999 – Present)
Founder –
Sutton Asset Management
(Hedge Fund)
(September 1998 – Present) | | | 84 | | | Director and Audit
Committee Member –
Investor Analytics
Director and Audit
Committee Member –
Oxigene, Inc. | |
|
| officers | | | | | | | | | | | | | |
|
David F. Connor
2005 Market Street
Philadelphia, PA
19103
December 2, 1963 | | Vice President,
Deputy General
Counsel, and Secretary | | Vice President since
September 21, 2000
and Secretary
since
October 2005 | | David F. Connor has served as
Vice President and Deputy
General Counsel of
Delaware Investments
since 2000. | | | 84 | | | None3 | |
|
David P. O'Connor
2005 Market Street
Philadelphia, PA
19103
February 21, 1966 | | Senior Vice
President,
General Counsel,
and Chief
Legal Officer | | Senior Vice President,
General Counsel, and
Chief Legal Officer
since
October 2005 | | David P. O'Connor has served in
various executive and legal
capacities at different times at
Delaware Investments. | | | 84 | | | None3 | |
|
John J. O'Connor
2005 Market Street
Philadelphia, PA
19103
June 16, 1957 | | Senior Vice President
and Treasurer | | Treasurer
since
February 2005 | | John J. O'Connor has served in
various executive capacities
at different times at
Delaware Investments. | | | 84 | | | None3 | |
|
Richard Salus
2005 Market Street
Philadelphia, PA
19103
October 4, 1963 | | Senior
Vice President
and
Chief Financial
Officer | | Chief Financial
Officer since
November 1, 2006 | | Richard Salus has served in
various executive capacities
at different times at
Delaware Investments. | | | 84 | | | None3 | |
|
1 Patrick P. Coyne is considered to be an "Interested Trustee" because he is an executive officer of the Fund's(s') investment advisor.
2 Delaware Investments is the marketing name for Delaware Management Holdings, Inc. and its subsidiaries, including the Fund's(s') investment advisor, principal underwriter, and its transfer agent.
3 David F. Connor, David P. O'Connor, John J. O'Connor, and Richard Salus serve in similar capacities for the six portfolios of the Optimum Fund Trust, which have the same investment advisor, principal underwriter, and transfer agent as the registrant. John J. O'Connor also serves in a similar capacity for Lincoln Variable Insurance Products Trust, which has the same investment advisor as the registrant.
The Statement of Additional Information for the Fund(s) includes additional information about the Trustees and Officers and is available, without charge, upon request by calling 800 523-1918.
International Value Equity Series- 18
Delaware VIP Trust — Delaware VIP REIT Series
For the 12-month period ended Dec. 31, 2006, the Delaware VIP REIT Series showed a positive return of 32.63% for Standard Class shares with distributions reinvested, as Service Class shares gained 32.32% with distributions reinvested. The Series benchmark, the NAREIT Equity REIT Index, gained 35.06% (source: Lipper).
Although performance of real estate investment trusts (REITs) has been robust over several years, we continued to exercise caution during the period, emphasizing companies with strong or improving fundamentals and attractive valuations. We held overweight positions in several key areas, such as economically sensitive holdings like industrial REITs, which generally benefit from steady growth of gross domestic product (GDP). We were also more heavily weighted than the benchmark index in REITs with exposure to office property markets. In urban markets, certain office stocks benefited during the year as increased demand drove rental rates higher. Multi-family apartment REITs were also strong performers in the index during the period, also fueled by strong rent growth.
An example of significant growth from another category is Entertainment Properties Trust, which owns megaplex movie theatre properties, entertainment retail centers, and other specialty properties in urban areas.
The largest negative impact on performance was the Series exposure to mortgage REITs during the first half of the fiscal year. A poor performer was Education Realty Trust, a position that we sold in favor of other opportunities. Mills Corp. and American Financial Realty Trust were also among the negative contributors sold before fiscal year end to make room for more favorable opportunities.
The views expressed are current as of the date of this report and are subject to change.
The performance data quoted below and on the next page represent past performance; past performance does not guarantee future results. Investment return and principal value of an investment will fluctuate so that your shares, when redeemed, may be worth more or less than their original cost. Current performance may be lower or higher than the performance data quoted. Please obtain the performance data for the most recent month end by calling the number noted on the page related to this Series in the introductory section of this report.
You should consider the investment objectives, risks, charges, and expenses of the investment carefully before investing. The Delaware VIP REIT Series prospectus contains this and other important information about the Series. To obtain a prospectus, contact the company noted on the page related to this Series in the introductory section of this report, either by phone or through the company Web site. We advise you to read the prospectus carefully before you invest.
Instances of high double-digit returns are unusual, cannot be sustained, and were achieved primarily during favorable market conditions.
Delaware VIP REIT Series
Average Annual Total Returns
For the periods ending Dec. 31, 2006 | | 1 Year | | 5 Years | | Lifetime | |
| Standard Class Shares* | | | +32.63 | % | | | +21.21 | % | | | +14.81 | % | |
| Service Class Shares** | | | +32.32 | % | | | +20.94 | % | | | +20.01 | % | |
* Commenced operations on May 4, 1998
** Commenced operations on May 1, 2000
REIT Series- 1
Delaware VIP Trust — Delaware VIP REIT Series (continued)

The chart shows a $10,000 investment in the Delaware VIP REIT Series Standard Class shares for the period from the Series' inception May 4, 1998 through Dec. 31, 2006. All distributions were reinvested. The chart also shows a $10,000 investment in the NAREIT Equity REIT Index for the period from May 31, 1998 through Dec. 31, 2006.
The NAREIT Equity REIT Index is an unmanaged index of real estate investment trusts that invest in many types of U.S. property. An index does not reflect the costs of operating a mutual fund, such as the costs of buying, selling, and holding securities. You cannot invest directly in an index.
Earnings from a variable annuity or variable life investment compound tax free until withdrawal, so no adjustments were made for income taxes.
An expense limitation was in effect for the Delaware VIP REIT Series during the periods shown.
Performance of Service Class shares will vary due to different charges and expenses.
Performance does not reflect insurance fees related to a variable annuity or variable life investment or the deferred sales charge that would apply to certain withdrawals of investments held for fewer than eight years. Performance shown here would have been reduced if such fees were included and the expense limitation was removed. For more information about fees, consult your variable annuity or variable life prospectus.
Investments in variable products involve risk. Series that invest in REITs are subject to many of the risks associated with direct real estate ownership and, as such, may be adversely affected by declines in real estate values, and general and local economic conditions. Series that invest a significant portion of their assets in one industry or in related industries may involve greater risks than more diversified series, including greater potential for volatility. Some portfolios offer more risk than others. Please read both the contract and underlying prospectus for specific details regarding the product's risk profile.
REIT Series- 2
Delaware VIP Trust — Delaware VIP REIT Series
Disclosure of Series Expenses
For the Period July 1, 2006 to December 31, 2006
As a shareholder of the Series, you incur ongoing costs, including management fees; distribution and/or service (12b-1) fees; and other Series expenses. This Example is intended to help you understand your ongoing costs (in dollars) of investing in the Series and to compare these costs with the ongoing costs of investing in other mutual funds.
The Example is based on an investment of $1,000 invested at the beginning of the period and held for the entire period from July 1, 2006 to December 31, 2006.
Actual Expenses
The first section of the table shown, "Actual Series Return," provides information about actual account values and actual expenses. You may use the information in this section of the table, together with the amount you invested, to estimate the expenses that you paid over the period. Simply divide your account value by $1,000 (for example, an $8,600 account value divided by $1,000 = 8.6), then multiply the result by the number in the first section under the heading entitled "Expenses Paid During Period" to estimate the expenses you paid on your account during the period.
Hypothetical Example for Comparison Purposes
The second section of the table shown, "Hypothetical 5% Return," provides information about hypothetical account values and hypothetical expenses based on the Series' actual expense ratio and an assumed rate of return of 5% per year before expenses, which is not the Series' actual return. The hypothetical account values and expenses may not be used to estimate the actual ending account balance or expenses you paid for the period. You may use this information to compare the ongoing costs of investing in the Series and other funds. To do so, compare the 5% hypothetical example with the 5% hypothetical examples that appear in the shareholder reports of other funds.
Please note that the expenses shown in the table are meant to highlight your ongoing costs only. As a shareholder of the Series, you do not incur any transaction costs, such as sales charges (loads), redemption fees or exchange fees, but shareholders of other funds may incur such costs. Also, the fees related to the variable annuity investment or the deferred sales charge that could apply have not been included. Therefore, the second section of the table is useful in comparing ongoing costs only, and will not help you determine the relative total costs of owning different funds. The Series' actual expenses shown in the table reflect fee waivers in effect for Service Class shares. The expenses shown in the table assume reinvestment of all dividends and distributions.
Expense Analysis of an Investment of $1,000
| | | Beginning
Account
Value
7/1/06 | | Ending
Account
Value
12/31/06 | | Annualized
Expense
Ratios | | Expenses
Paid During
Period
7/1/06 to
12/31/06* | |
| Actual Series Return | |
| Standard Class | | $ | 1,000.00 | | | $ | 1,196.20 | | | | 0.85 | % | | $ | 4.71 | | |
| Service Class | | | 1,000.00 | | | | 1,194.80 | | | | 1.10 | % | | | 6.09 | | |
| Hypothetical 5% Return (5% return before expenses) | |
| Standard Class | | $ | 1,000.00 | | | $ | 1,020.92 | | | | 0.85 | % | | $ | 4.33 | | |
| Service Class | | | 1,000.00 | | | | 1,019.66 | | | | 1.10 | % | | | 5.60 | | |
*"Expenses Paid During Period" are equal to the Series' annualized expense ratio, multiplied by the average account value over the period, multiplied by 184/365 (to reflect the one-half year period).
REIT Series- 3
Delaware VIP Trust — Delaware VIP REIT Series
Sector Allocation and Top 10 Holdings
As of December 31, 2006
Sector designations may be different than the sector designations presented in other Series materials.
| Sector | | Percentage
of Net Assets | |
| Common Stock | | | 97.84 | % | |
| Diversified REITs | | | 7.21 | % | |
| Health Care REITs | | | 5.65 | % | |
| Hotel REITs | | | 6.07 | % | |
| Industrial REITs | | | 7.02 | % | |
| Mall REITs | | | 14.41 | % | |
| Manufactured Housing REITs | | | 0.89 | % | |
| Multifamily REITs | | | 16.71 | % | |
| Office REITs | | | 18.01 | % | |
| Office/Industrial REITs | | | 1.20 | % | |
| Real Estate Operating Companies | | | 4.04 | % | |
| Self-Storage REITs | | | 4.17 | % | |
| Shopping Center REITs | | | 11.81 | % | |
| Specialty REITs | | | 0.65 | % | |
| Repurchase Agreements | | | 2.05 | % | |
| Total Market Value of Securities | | | 99.89 | % | |
| Receivables and Other Assets Net of Liabilities | | | 0.11 | % | |
| Total Net Assets | | | 100.00 | % | |
Holdings are for informational purposes only and are subject to change at any time. They are not a recommendation to buy, sell, or hold any security.
| Top 10 Holdings | | Percentage
of Net Assets | |
| Simon Property Group | | | 7.35 | % | |
| Vornado Realty Trust | | | 5.60 | % | |
| Boston Properties | | | 4.73 | % | |
| ProLogis | | | 4.40 | % | |
| Host Hotels & Resorts | | | 4.32 | % | |
| Equity Office Properties Trust | | | 4.21 | % | |
| Public Storage | | | 4.17 | % | |
| Archstone-Smith Trust | | | 3.99 | % | |
| AvalonBay Communities | | | 3.75 | % | |
| General Growth Properties | | | 3.66 | % | |
REIT Series-4
Delaware VIP Trust — Delaware VIP REIT Series
Statement of Net Assets
December 31, 2006
| | | Number of
Shares | | Market
Value | |
| COMMON STOCK–97.84% | |
| Diversified REITs–7.21% | |
| Spirit Finance | | | 404,500 | | | $ | 5,044,115 | | |
| Vornado Realty Trust | | | 455,101 | | | | 55,294,772 | | |
Washington Real Estate
Investment Trust | | | 271,300 | | | | 10,852,000 | | |
| | | | | | | | 71,190,887 | | |
| Health Care REITs–5.65% | |
| Health Care Property Investors | | | 549,100 | | | | 20,217,862 | | |
| Senior Housing Properties Trust | | | 241,900 | | | | 5,921,712 | | |
| Ventas | | | 700,500 | | | | 29,645,160 | | |
| | | | | | | | 55,784,734 | | |
| Hotel REITs–6.07% | |
| Hersha Hospitality Trust | | | 848,190 | | | | 9,618,475 | | |
| Host Hotels & Resorts | | | 1,738,796 | | | | 42,687,441 | | |
| Marriott International Class A | | | 159,400 | | | | 7,606,568 | | |
| | | | | | | | 59,912,484 | | |
| Industrial REITs–7.02% | |
| AMB Property | | | 276,455 | | | | 16,203,028 | | |
| First Potomac Realty Trust | | | 331,247 | | | | 9,642,600 | | |
| ProLogis | | | 715,293 | | | | 43,468,355 | | |
| | | | | | | | 69,313,983 | | |
| Mall REITs–14.41% | |
| General Growth Properties | | | 690,946 | | | | 36,088,110 | | |
| Macerich | | | 388,200 | | | | 33,606,474 | | |
| Simon Property Group | | | 716,899 | | | | 72,614,699 | | |
| | | | | | | | 142,309,283 | | |
| Manufactured Housing REITs–0.89% | |
| Equity Lifestyle Properties | | | 162,200 | | | | 8,828,546 | | |
| | | | | | | | 8,828,546 | | |
| Multifamily REITs–16.71% | |
| American Campus Communities | | | 188,700 | | | | 5,372,289 | | |
| Apartment Investment & Management | | | 121,100 | | | | 6,784,022 | | |
| Archstone-Smith Trust | | | 676,500 | | | | 39,379,065 | | |
| AvalonBay Communities | | | 284,474 | | | | 36,995,844 | | |
| BRE Properties | | | 315,600 | | | | 20,520,312 | | |
| Camden Property Trust | | | 215,174 | | | | 15,890,600 | | |
| Equity Residential | | | 654,000 | | | | 33,190,500 | | |
| Essex Property Trust | | | 52,808 | | | | 6,825,434 | | |
| | | | | | | | 164,958,066 | | |
| Office REITs–18.01% | |
| Alexandria Real Estate Equities | | | 145,496 | | | | 14,607,798 | | |
| Boston Properties | | | 417,400 | | | | 46,698,713 | | |
| Brandywine Realty Trust | | | 375,700 | | | | 12,492,025 | | |
| Douglas Emmett | | | 276,800 | | | | 7,360,112 | | |
| Equity Office Properties Trust | | | 863,600 | | | | 41,599,612 | | |
| Highwoods Properties | | | 301,600 | | | | 12,293,216 | | |
| Mack-Cali Realty | | | 155,300 | | | | 7,920,300 | | |
| Maguire Properties | | | 77,500 | | | | 3,100,000 | | |
| SL Green Realty | | | 238,637 | | | | 31,686,221 | | |
| | | | | | | | 177,757,997 | | |
| Office/Industrial REITs–1.20% | |
| Liberty Property Trust | | | 134,900 | | | | 6,628,986 | | |
| PS Business Parks | | | 73,700 | | | | 5,211,327 | | |
| | | | | | | | 11,840,313 | | |
| | | Number of
Shares | | Market
Value | |
| COMMON STOCK (continued) | |
| Real Estate Operating Companies–4.04% | |
| Brookfield Properties | | | 397,100 | | | $ | 15,617,943 | | |
| Starwood Hotels & Resorts Worldwide | | | 388,550 | | | | 24,284,375 | | |
| | | | | | | | 39,902,318 | | |
| Self-Storage REITs–4.17% | |
| Public Storage | | | 422,500 | | | | 41,193,750 | | |
| | | | | | | | 41,193,750 | | |
| Shopping Center REITs–11.81% | |
| Developers Diversified Realty | | | 155,778 | | | | 9,806,225 | | |
| Federal Realty Investment Trust | | | 249,189 | | | | 21,181,065 | | |
| Kimco Realty | | | 692,100 | | | | 31,109,894 | | |
| Kite Realty Group Trust | | | 686,096 | | | | 12,775,108 | | |
| New Plan Excel Realty Trust | | | 567,000 | | | | 15,581,160 | | |
| Regency Centers | | | 334,439 | | | | 26,143,097 | | |
| | | | | | | | 116,596,549 | | |
| Specialty REITs–0.65% | |
| Entertainment Properties Trust | | | 108,900 | | | | 6,364,116 | | |
| | | | | | | | 6,364,116 | | |
Total Common Stock
(cost $789,468,479) | | | | | | | 965,953,026 | | |
| | | Principal
Amount | | | |
| REPURCHASE AGREEMENTS–2.05% | |
With BNP Paribas 4.80% 1/2/07
(dated 12/29/06, to be repurchased
at $7,688,098, collateralized by
$8,039,000 U.S. Treasury Bills
due 6/28/07, market value $7,845,583) | | $ | 7,684,000 | | | | 7,684,000 | | |
With Cantor Fitzgerald 4.82% 1/2/07
(dated 12/29/06, to be repurchased
at $9,237,945, collateralized by
$796,000 U.S. Treasury Notes 4.00%
due 6/15/09, market value $784,937,
$4,946,000 U.S. Treasury Notes 6.125%
due 8/15/07, market value $5,093,682
and $3,297,000 U.S. Treasury Notes 6.50%
due 2/15/10, market value $3,546,810) | | | 9,233,000 | | | | 9,233,000 | | |
With UBS Warburg 4.75% 1/2/07
(dated 12/29/06, to be repurchased
at $3,298,740, collateralized by
$3,406,000 U.S. Treasury Bills
due 3/29/07, market value $3,366,159) | | | 3,297,000 | | | | 3,297,000 | | |
Total Repurchase Agreements
(cost $20,214,000) | | | | | | | 20,214,000 | | |
REIT Series-5
Delaware VIP REIT Series
Statement of Net Assets (continued)
| TOTAL MARKET VALUE OF SECURITIES–99.89% (cost $809,682,479) | | $ | 986,167,026 | | |
| RECEIVABLES AND OTHER ASSETS NET OF LIABILITIES–0.11% | | | 1,121,931 | | |
| NET ASSETS APPLICABLE TO 43,216,318 SHARES OUTSTANDING – 100.00% | | $ | 987,288,957 | | |
| NET ASSET VALUE–DELAWARE VIP REIT SERIES STANDARD CLASS ($672,738,260 / 29,429,468 Shares) | | $ | 22.86 | | |
| NET ASSET VALUE–DELAWARE VIP REIT SERIES SERVICE CLASS ($314,550,697 / 13,786,850 Shares) | | $ | 22.82 | | |
COMPONENTS OF NET ASSETS AT DECEMBER 31, 2006:
| Shares of beneficial interest (unlimited authorization–no par) | | $ | 599,527,229 | | |
| Undistributed net investment income | | | 15,460,663 | | |
| Accumulated net realized gain on investments | | | 195,816,518 | | |
| Net unrealized appreciation of investments | | | 176,484,547 | | |
| Total net assets | | $ | 987,288,957 | | |
REIT – Real Estate Investment Trust
See accompanying notes
REIT Series-6
Delaware VIP Trust — Delaware VIP REIT Series
Statement of Operations
Year Ended December 31, 2006
| INVESTMENT INCOME: | |
| Dividends | | $ | 21,430,536 | | |
| Interest | | | 1,913,814 | | |
| Foreign Tax Withheld | | | (7,162 | ) | |
| | | | 23,337,188 | | |
| EXPENSES: | |
| Management fees | | | 6,259,545 | | |
| Distribution expenses – Service Class | | | 747,412 | | |
| Accounting and administration expenses | | | 343,403 | | |
| Reports and statements to shareholders | | | 183,542 | | |
| Trustees' fees and benefits | | | 153,518 | | |
| Legal fees | | | 91,760 | | |
| Dividend disbursing and transfer agent fees and expenses | | | 85,851 | | |
| Audit and tax | | | 47,921 | | |
| Insurance fees | | | 30,052 | | |
| Custodian fees | | | 26,123 | | |
| Consulting fees | | | 25,785 | | |
| Dues and services | | | 5,689 | | |
| Taxes (other than taxes on income) | | | 4,120 | | |
| Trustees' expenses | | | 2,504 | | |
| Pricing fees | | | 419 | | |
| | | | 8,007,644 | | |
| Less waiver of distribution expenses – Service Class | | | (124,569 | ) | |
| Less expense paid indirectly | | | (6,550 | ) | |
| Total operating expenses | | | 7,876,525 | | |
| NET INVESTMENT INCOME | | | 15,460,663 | | |
NET REALIZED AND UNREALIZED GAIN
ON INVESTMENTS: | |
| Net realized gain on investments | | | 195,940,779 | | |
Net change in unrealized appreciation/depreciation
of investments | | | 30,768,216 | | |
NET REALIZED AND UNREALIZED GAIN ON
INVESTMENTS | | | 226,708,995 | | |
NET INCREASE IN NET ASSETS RESULTING
FROM OPERATIONS | | $ | 242,169,658 | | |
See accompanying notes
Delaware VIP Trust — Delaware VIP REIT Series
Statements of Changes in Net Assets
| | | Year Ended | |
| | | 12/31/06 | | 12/31/05 | |
INCREASE (DECREASE) IN NET
ASSETS FROM OPERATIONS: | |
| Net investment income | | $ | 15,460,663 | | | $ | 22,994,249 | | |
| Net realized gain on investments | | | 195,940,779 | | | | 52,767,407 | | |
Net change in unrealized appreciation/
depreciation of investments | | | 30,768,216 | | | | (21,990,619 | ) | |
Net increase in net assets
resulting from operations | | | 242,169,658 | | | | 53,771,037 | | |
DIVIDENDS AND DISTRIBUTIONS
TO SHAREHOLDERS FROM: | |
| Net investment income: | |
| Standard Class | | | (13,253,838 | ) | | | (11,911,298 | ) | |
| Service Class | | | (3,839,355 | ) | | | (2,802,570 | ) | |
| Net realized gain on investments: | |
| Standard Class | | | (44,190,646 | ) | | | (36,097,851 | ) | |
| Service Class | | | (14,446,942 | ) | | | (9,584,965 | ) | |
| | | | (75,730,781 | ) | | | (60,396,684 | ) | |
| CAPITAL SHARE TRANSACTIONS: | |
| Proceeds from shares sold: | |
| Standard Class | | | 141,651,178 | | | | 111,459,280 | | |
| Service Class | | | 86,531,629 | | | | 63,929,983 | | |
Net asset value of shares issued upon
reinvestment of dividends and distributions: | |
| Standard Class | | | 57,444,484 | | | | 48,009,149 | | |
| Service Class | | | 18,286,297 | | | | 12,387,535 | | |
| | | | 303,913,588 | | | | 235,785,947 | | |
| Cost of shares repurchased: | |
| Standard Class | | | (278,178,009 | ) | | | (139,035,302 | ) | |
| Service Class | | | (44,657,293 | ) | | | (35,552,569 | ) | |
| | | | (322,835,302 | ) | | | (174,587,871 | ) | |
Increase (decrease) in net assets derived from
capital share transactions | | | (18,921,714 | ) | | | 61,198,076 | | |
| NET INCREASE IN NET ASSETS | | | 147,517,163 | | | | 54,572,429 | | |
| NET ASSETS: | |
| Beginning of year | | | 839,771,794 | | | | 785,199,365 | | |
End of year (including undistributed
net investment income of $15,460,663 and
$31,025,294, respectively) | | $ | 987,288,957 | | | $ | 839,771,794 | | |
See accompanying notes
REIT Series- 7
Delaware VIP Trust — Delaware VIP REIT Series
Financial Highlights
Selected data for each share of the Series outstanding throughout each period were as follows:
| | | Delaware VIP REIT Series Standard Class | |
| | | Year Ended | |
| | | 12/31/06 | | 12/31/05 | | 12/31/04 | | 12/31/03 | | 12/31/02 | |
| Net asset value, beginning of period | | $ | 18.770 | | | $ | 19.080 | | | $ | 15.140 | | | $ | 11.730 | | | $ | 11.700 | | |
| Income from investment operations: | |
| Net investment income1 | | | 0.378 | | | | 0.523 | | | | 0.504 | | | | 0.586 | | | | 0.534 | | |
| Net realized and unrealized gain on investments | | | 5.424 | | | | 0.618 | | | | 4.112 | | | | 3.271 | | | | 0.010 | | |
| Total from investment operations | | | 5.802 | | | | 1.141 | | | | 4.616 | | | | 3.857 | | | | 0.544 | | |
| Less dividends and distributions from: | |
| Net investment income | | | (0.395 | ) | | | (0.360 | ) | | | (0.332 | ) | | | (0.342 | ) | | | (0.317 | ) | |
| Net realized gain on investments | | | (1.317 | ) | | | (1.091 | ) | | | (0.344 | ) | | | (0.105 | ) | | | (0.197 | ) | |
| Total dividends and distributions | | | (1.712 | ) | | | (1.451 | ) | | | (0.676 | ) | | | (0.447 | ) | | | (0.514 | ) | |
| Net asset value, end of period | | $ | 22.860 | | | $ | 18.770 | | | $ | 19.080 | | | $ | 15.140 | | | $ | 11.730 | | |
| Total return2 | | | 32.63 | % | | | 7.17 | % | | | 31.38 | % | | | 34.02 | % | | | 4.52 | % | |
| Ratios and supplemental data: | |
| Net assets, end of period (000 omitted) | | $ | 672,738 | | | $ | 637,889 | | | $ | 624,223 | | | $ | 359,958 | | | $ | 225,826 | | |
| Ratio of expenses to average net assets | | | 0.84 | % | | | 0.85 | % | | | 0.84 | % | | | 0.86 | % | | | 0.84 | % | |
| Ratio of net investment income to average net assets | | | 1.87 | % | | | 2.89 | % | | | 3.11 | % | | | 4.51 | % | | | 4.52 | % | |
| Portfolio turnover | | | 100 | % | | | 42 | % | | | 38 | % | | | 37 | % | | | 53 | % | |
1The average shares outstanding method has been applied for per share information.
2Total investment return is based on the change in net asset value of a share during the period and assumes reinvestment of dividends and distributions at net asset value.
See accompanying notes
REIT Series-8
Delaware VIP REIT Series
Financial Highlights (continued)
Selected data for each share of the Series outstanding throughout each period were as follows:
| | | Delaware VIP REIT Series Service Class | |
| | | Year Ended | |
| | | 12/31/06 | | 12/31/05 | | 12/31/04 | | 12/31/03 | | 12/31/02 | |
| Net asset value, beginning of period | | $ | 18.740 | | | $ | 19.050 | | | $ | 15.130 | | | $ | 11.720 | | | $ | 11.700 | | |
| Income from investment operations: | |
| Net investment income1 | | | 0.327 | | | | 0.478 | | | | 0.464 | | | | 0.556 | | | | 0.517 | | |
| Net realized and unrealized gain on investments | | | 5.420 | | | | 0.622 | | | | 4.102 | | | | 3.283 | | | | – | | |
| Total from investment operations | | | 5.747 | | | | 1.100 | | | | 4.566 | | | | 3.839 | | | | 0.517 | | |
| Less dividends and distributions from: | |
| Net investment income | | | (0.350 | ) | | | (0.319 | ) | | | (0.302 | ) | | | (0.324 | ) | | | (0.300 | ) | |
| Net realized gain on investments | | | (1.317 | ) | | | (1.091 | ) | | | (0.344 | ) | | | (0.105 | ) | | | (0.197 | ) | |
| Total dividends and distributions | | | (1.667 | ) | | | (1.410 | ) | | | (0.646 | ) | | | (0.429 | ) | | | (0.497 | ) | |
| Net asset value, end of period | | $ | 22.820 | | | $ | 18.740 | | | $ | 19.050 | | | $ | 15.130 | | | $ | 11.720 | | |
| Total return2 | | | 32.32 | % | | | 6.86 | % | | | 31.09 | % | | | 33.73 | % | | | 4.38 | % | |
| Ratios and supplemental data: | |
| Net assets, end of period (000 omitted) | | $ | 314,551 | | | $ | 201,883 | | | $ | 160,976 | | | $ | 68,276 | | | $ | 28,152 | | |
| Ratio of expenses to average net assets | | | 1.09 | % | | | 1.10 | % | | | 1.09 | % | | | 1.08 | % | | | 0.99 | % | |
Ratio of expenses to average net assets prior to expense
limitation and expenses paid indirectly | | | 1.14 | % | | | 1.15 | % | | | 1.14 | % | | | 1.11 | % | | | 0.99 | % | |
| Ratio of net investment income to average net assets | | | 1.62 | % | | | 2.64 | % | | | 2.86 | % | | | 4.29 | % | | | 4.37 | % | |
Ratio of net investment income to average net assets prior
to expense limitation and expenses paid indirectly | | | 1.57 | % | | | 2.59 | % | | | 2.81 | % | | | 4.26 | % | | | 4.37 | % | |
| Portfolio turnover | | | 100 | % | | | 42 | % | | | 38 | % | | | 37 | % | | | 53 | % | |
1The average shares outstanding method has been applied for per share information.
2Total investment return is based on the change in net asset value of a share during the period and assumes reinvestment of dividends and distributions at net asset value. Total investment return reflects waivers and payment of fees by the distributor, as applicable. Performance would have been lower had the expense limitation and waiver not been in effect.
See accompanying notes
REIT Series-9
Delaware VIP Trust — Delaware VIP REIT Series
Notes to Financial Statements
December 31, 2006
Delaware VIP Trust (the "Trust") is organized as a Delaware statutory trust and offers 15 series: Delaware VIP Balanced Series, Delaware VIP Capital Reserves Series, Delaware VIP Cash Reserve Series, Delaware VIP Diversified Income Series, Delaware VIP Emerging Markets Series, Delaware VIP Global Bond Series, Delaware VIP Growth Opportunities Series, Delaware VIP High Yield Series, Delaware VIP International Value Equity Series, Delaware VIP REIT Series, Delaware VIP Select Growth Series, Delaware VIP Small Cap Value Series, Delaware VIP Trend Series, Delaware VIP U.S. Growth Series and Delaware VIP Value Series. These financial statements and the related notes pertain to Delaware VIP REIT Series (the "Series"). The Trust is an open-end investment company. The Series is considered non-diversified under the Investment Company Act of 1940, as amended, and offers Standard Class and Service Class shares. The Standard Class shares do not carry a 12b-1 fee and the Service Class shares carry a 12b-1 fee. The shares of the Series are sold only to separate accounts of life insurance companies.
The investment objective of the Series is to seek maximum long-term total return, with capital appreciation as a secondary objective.
1. Significant Accounting Policies
The following accounting policies are in accordance with U.S. generally accepted accounting principles and are consistently followed by the Series.
Security Valuation—Equity securities, except those traded on the Nasdaq Stock Market, Inc. (Nasdaq), are valued at the last quoted sales price as of the time of the regular close of the New York Stock Exchange (NYSE) on the valuation date. Securities traded on the Nasdaq are valued in accordance with the Nasdaq Official Closing Price, which may not be the last sales price. If on a particular day an equity security does not trade, then the mean between the bid and asked prices will be used. Short-term debt securities having less than 60 days to maturity are valued at amortized cost, which approximates market value. Other securities and assets for which market quotations are not readily available are valued at fair value as determined in good faith under the direction of the Series' Board of Trustees. In determining whether market quotations are readily availab le or fair valuation will be used, various factors will be taken into consideration, such as market closures, or with respect to foreign securities, aftermarket trading, or significant events after local market trading (e.g., government actions or pronouncements, trading volume or volatility on markets, exchanges among dealers, or news events).
In September 2006, the Financial Accounting Standards Board (FASB) issued FASB Statement No. 157 "Fair Value Measurements" (Statement 157). Statement 157 establishes a framework for measuring fair value in generally accepted accounting principles, clarifies the definition of fair value within that framework, and expands disclosures about the use of fair value measurements. Statement 157 is intended to increase consistency and comparability among fair value estimates used in financial reporting. Statement 157 is effective for fiscal years beginning after November 15, 2007. Management does not expect the adoption of Statement 157 to have an impact on the amounts reported in the financial statements.
Federal Income Taxes—The Series intends to continue to qualify for federal income tax purposes as a regulated investment company and make the requisite distributions to shareholders. Accordingly, no provision for federal income taxes has been made in the financial statements.
On July 13, 2006, FASB released FASB Interpretation No. 48 "Accounting for Uncertainty in Income Taxes" (FIN 48). FIN 48 provides guidance for how uncertain tax positions should be recognized, measured, presented and disclosed in the financial statements. FIN 48 requires the evaluation of tax positions taken or expected to be taken in the course of preparing the Series' tax returns to determine whether the tax positions are "more-likely-than-not" of being sustained by the applicable tax authority. Tax positions not deemed to meet the more-likely-than-not threshold would be recorded as a tax benefit or expense in the current year. Adoption of FIN 48 is required for fiscal years beginning after December 15, 2006 and is to be applied to all open tax years as of the effective date. Recent SEC guidance allows implementing FIN 48 in Series net asset value calculations as late as the Series' last net asset value calculation in the first required fi nancial statement reporting period. As a result, the Series will incorporate FIN 48 in its semiannual report on June 30, 2007. Although the Series' tax positions are currently being evaluated, management does not expect the adoption of FIN 48 to have a material impact on the Series' financial statements.
Class Accounting—Investment income, common expenses and realized and unrealized gain (loss) on investments are allocated to the classes of the Series on the basis of daily net assets of each class. Distribution expenses relating to a specific class are charged directly to that class.
Repurchase Agreements—The Series may invest in a pooled cash account along with other members of the Delaware Investments® Family of Funds pursuant to an exemptive order issued by the Securities and Exchange Commission. The aggregate daily balance of the pooled cash account is invested in repurchase agreements secured by obligations of the U.S. government. The respective collateral is held by the Series' custodian bank until the maturity of the respective repurchase agreements. Each repurchase agreement is at least 102% collateralized. However, in the event of default or bankruptcy by the counterparty to the agreement, realization of the collateral may be subject to legal proceedings.
Use of Estimates—The preparation of financial statements in conformity with U.S. generally accepted accounting principles requires management to make estimates and assumptions that affect the reported amounts of assets and liabilities at the date of the financial statements and the reported amounts of revenues and expenses during the reporting period. Actual results could differ from those estimates.
Other—Expenses directly attributable to the Series are charged directly to the Series. Other expenses common to various funds within the Delaware Investments® Family of Funds are generally allocated amongst such funds on the basis of average net assets. Management fees and some other expenses are paid monthly. Security transactions are recorded on the date the securities are purchased or sold (trade date) for financial reporting purposes. Costs used in calculating realized gains and losses on the sale of investment securities are those of the specific securities sold. Dividend income is recorded on the ex-dividend date and interest income is recorded on the accrual basis. Distributions received from investments in Real Estate Investment Trusts are recorded as dividend income on ex-dividend date, subject to reclassification upon notice of the ch aracter of such distributions by the issuer. The financial statements reflect an estimate of the reclassification of the distribution character.
REIT Series- 10
Delaware VIP REIT Series
Notes to Financial Statements (continued)
1. Significant Accounting Policies (continued)
The Series declares and pays dividends from net investment income and distributions from net realized gain on investments, if any, following the close of the fiscal year.
Subject to seeking best execution, the Series may direct certain security trades to brokers who have agreed to rebate a portion of the related brokerage commission to the Series in cash. Such commission rebates are included in realized gain on investments in the accompanying financial statements and totaled $9,502 for the year ended December 31, 2006. In general, best execution refers to many factors, including the price paid or received for a security, the commission charged, the promptness and reliability of execution, the confidentiality and placement accorded the order, and other factors affecting the overall benefit obtained by the Series on the transaction.
The Series receives earnings credits from its custodian when positive cash balances are maintained, which are used to offset custody fees. The expense paid under this arrangement is included in custodian fees on the Statement of Operations with the corresponding expense offset shown as "expense paid indirectly."
2. Investment Management, Administration Agreements and Other Transactions with Affiliates
In accordance with the terms of its investment management agreement, the Series pays Delaware Management Company (DMC), a series of Delaware Management Business Trust and the investment manager, an annual fee which is calculated daily at the rate of 0.75% on the first $500 million of average daily net assets of the Series, 0.70% on the next $500 million, 0.65% on the next $1.5 billion, and 0.60% on average daily net assets in excess of $2.5 billion.
DMC has contractually agreed to waive that portion, if any, of its management fee and reimburse the Series to the extent necessary to ensure that annual operating expenses, exclusive of taxes, interest, brokerage commissions, distribution fees, certain insurance costs and extraordinary expenses, do not exceed 1.00% of average daily net assets of the Series through April 30, 2007. Prior to May 1, 2006 the expense limitation was 0.95% of average daily net assets. No reimbursement was due for the year ended December 31, 2006.
Delaware Service Company, Inc. (DSC), an affiliate of DMC, provides accounting, administration, dividend disbursing and transfer agent services. The Series pays DSC a monthly fee computed at the annual rate of 0.04% of the Series' average daily net assets for accounting and administrative services. The Series pays DSC a monthly fee based on average net assets for dividend disbursing and transfer agent services.
Pursuant to a distribution agreement and distribution plan, the Series pays Delaware Distributors, L.P. (DDLP), the distributor and an affiliate of DMC, an annual distribution and service fee not to exceed 0.30% of the average daily net assets of the Service Class shares. DDLP has contracted to waive distribution and service fees through April 30, 2007 in order to prevent distribution and service fees of the Service Class shares from exceeding 0.25% of average daily net assets. Standard Class shares pay no distribution and service expenses.
At December 31, 2006, the Series had liabilities payable to affiliates as follows:
Investment
Management
Fee Payable to
DMC | | Dividend Disbursing,
Transfer Agent, Accounting
and Administrative Fees
and Other Expenses
Payable to DSC | | Distribution
Fees Payable
to DDLP | | Other
Expenses
Payable
to DMC
and Affiliates* | |
| $ | 606,857 | | | $ | 46,319 | | | $ | 66,115 | | | $ | 77,214 | | |
*DMC, as part of its administrative services, pays operating expenses on behalf of the Series and is reimbursed on a periodic basis. Such expenses include items such as printing of shareholder reports, fees for audit, legal and tax services, custodian fees and trustees' fees.
As provided in the investment management agreement, the Series bears the cost of certain legal and tax services, including internal legal and tax services provided to the Series by DMC and/or its affiliates' employees. For the year ended December 31, 2006, the Series was charged $41,577 for internal legal and tax services provided by DMC and/or its affiliates' employees.
Trustees' fees and benefits include expenses accrued by the Series for each Trustee's retainer, per meeting fees and retirement benefits. Independent Trustees with over five years of uninterrupted service are eligible to participate in a retirement plan that provides for the payment of benefits upon retirement. The amount of the retirement benefit is based on factors set forth in the plan, including the number of years of service. On November 16, 2006, the Board of Trustees unanimously voted to terminate the retirement plan. Payments equal to the net present value of the earned benefits will be made in 2007 to those independent trustees so entitled. The retirement benefit payout for the Series is $106,750. Certain officers of DMC, DSC and DDLP are officers and/or trustees of the Trust. These officers and trustees are paid no compensation by the Series.
REIT Series- 11
Delaware VIP REIT Series
Notes to Financial Statements (continued)
3. Investments
For the year ended December 31, 2006, the Series made purchases and sales of investment securities other than short-term investments as follows:
| Purchases | | $ | 826,126,222 | | |
| Sales | | | 903,456,341 | | |
At December 31, 2006, the cost of investments for federal income tax purposes and unrealized appreciation (depreciation) for the Series were as follows:
Cost of
Investments | | Aggregate
Unrealized
Appreciation | | Aggregate
Unrealized
Depreciation | | Net Unrealized
Appreciation | |
| $ | 809,827,901 | | | $ | 176,558,141 | | | $ | (219,016 | ) | | $ | 176,339,125 | | |
4. Dividend and Distribution Information
Income and long-term capital gain distributions are determined in accordance with federal income tax regulations, which may differ from U.S. generally accepted accounting principles. Additionally, net short-term gains on sales of investment securities are treated as ordinary income for federal income tax purposes. The tax character of dividends and distributions paid during the years ended December 31, 2006 and 2005 was as follows:
| | | Year
Ended
12/31/06 | | Year
Ended
12/31/05 | |
| Ordinary income | | $ | 17,111,655 | | | $ | 21,957,797 | | |
| Long-term capital gain | | | 58,619,126 | | | | 38,438,887 | | |
| Total | | $ | 75,730,781 | | | $ | 60,396,684 | | |
5. Components of Net Assets on a Tax Basis
As of December 31, 2006, the components of net assets on a tax basis were as follows:
| Shares of beneficial interest | | $ | 599,527,229 | | |
| Undistributed ordinary income | | | 47,103,961 | | |
| Undistributed long-term capital gain | | | 164,318,642 | | |
| Unrealized appreciation of investments | | | 176,339,125 | | |
| Net assets | | $ | 987,288,957 | | |
The differences between book basis and tax basis components of net assets are primarily attributable to tax deferral of losses on wash sales.
The undistributed earnings for the Series may be subject to reclassification upon notice of the tax character of distributions received from investments in Real Estate Investment Trusts.
For financial reporting purposes, capital accounts are adjusted to reflect the tax character of permanent book/tax differences. Reclassifications are primarily due to tax treatment of Real Estate Investment Trust dividends. Results of operations and net assets were not affected by these reclassifications. For the year ended December 31, 2006, the Series recorded the following reclassifications:
Undistributed
Net
Investment Income | | Accumulated
Net Realilzed
Gain (Loss) | | Unrealized
Appreciation
on Investments* | |
| $ | (13,932,101 | ) | | $ | 9,999,320 | | | $ | 3,932,781 | | |
*Adjustment to cost basis of securities.
REIT Series-12
Delaware VIP REIT Series
Notes to Financial Statements (continued)
6. Capital Shares
Transactions in capital shares were as follows:
| | | Year
Ended
12/31/06 | | Year
Ended
12/31/05 | |
| Shares sold: | |
| Standard Class | | | 6,992,847 | | | | 6,092,744 | | |
| Service Class | | | 4,285,149 | | | | 3,532,245 | | |
Shares issued upon reinvestment of dividends
and distributions: | |
| Standard Class | | | 2,985,680 | | | | 2,958,050 | | |
| Service Class | | | 950,431 | | | | 762,779 | | |
| | | | 15,214,107 | | | | 13,345,818 | | |
| Shares repurchased: | |
| Standard Class | | | (14,534,587 | ) | | | (7,785,003 | ) | |
| Service Class | | | (2,221,709 | ) | | | (1,972,201 | ) | |
| | | | (16,756,296 | ) | | | (9,757,204 | ) | |
| Net increase (decrease) | | | (1,542,189 | ) | | | 3,588,614 | | |
7. Line of Credit
The Series, along with certain other funds in the Delaware Investments® Family of Funds (the "Participants"), participates in a $225,000,000 revolving line of credit facility to be used for temporary or emergency purposes as an additional source of liquidity to fund redemptions of investor shares. The Participants are charged an annual commitment fee, which is allocated across the Participants on the basis of each Participant's allocation of the entire facility. The Participants may borrow up to a maximum of one third of their net assets under the agreement. The Series had no amounts outstanding as of December 31, 2006, or at any time during the year then ended.
8. Credit and Market Risk
The Series concentrates its investments in the real estate industry and is subject to some of the risks associated with that industry. If the Series holds real estate directly as a result of defaults or receives rental income directly from real estate holdings, its tax status as a regulated investment company may be jeopardized. The Series is also affected by interest rate changes, particularly if the real estate investment trusts it holds use floating rate debt to finance their ongoing operations. Its investments may also tend to fluctuate more in value than a portfolio that invests in a broader range of industries.
The Series may invest up to 15% of its total assets in illiquid securities, which may include securities with contractual restrictions on resale, securities exempt from registration under Rule 144A of the Securities Act of 1933, as amended, and other securities which may not be readily marketable. The relative illiquidity of these securities may impair the Series from disposing of them in a timely manner and at a fair price when it is necessary or desirable to do so. While maintaining oversight, the Series' Board of Trustees has delegated to DMC the day-to-day functions of determining whether individual securities are liquid for purposes of the Series' limitation on investments in illiquid assets. At December 31, 2006, there were no Rule 144A securities and no securities have been determined to be illiquid under the Series' Liquidity Procedures.
9. Contractual Obligations
The Series enters into contracts in the normal course of business that contain a variety of indemnifications. The Series' maximum exposure under these arrangements is unknown. However, the Series has not had prior claims or losses pursuant to these contracts. Management has reviewed the Series' existing contracts and expects the risk of loss to be remote.
10. Tax Information (Unaudited)
For the fiscal year ended December 31, 2006, the Series designates dividends and distributions paid during the year as follows:
(A)
Long-Term
Capital Gain
Distributions
(Tax Basis) | | (B)
Ordinary
Income
Distributions
(Tax Basis) | | (C)
Total
Distributions
(Tax Basis) | |
| | 77 | % | | | 23 | % | | | 100 | % | |
(A) and (B) are based on a percentage of the Series' total distributions.
REIT Series- 13
Delaware VIP Trust — Delaware VIP REIT Series
Report of Independent Registered Public Accounting Firm
To the Shareholders and Board of Trustees
Delaware VIP Trust–Delaware VIP REIT Series
We have audited the accompanying statement of net assets of the Delaware VIP REIT Series (one of the series constituting Delaware VIP Trust) (the "Series") as of December 31, 2006, and the related statement of operations for the year then ended, the statements of changes in net assets for each of the two years in the period then ended, and the financial highlights for each of the five years in the period then ended. These financial statements and financial highlights are the responsibility of the Series' management. Our responsibility is to express an opinion on these financial statements and financial highlights based on our audits.
We conducted our audits in accordance with the standards of the Public Company Accounting Oversight Board (United States). Those standards require that we plan and perform the audit to obtain reasonable assurance about whether the financial statements and financial highlights are free of material misstatement. We were not engaged to perform an audit of the Series' internal control over financial reporting. Our audits included consideration of internal control over financial reporting as a basis for designing audit procedures that are appropriate in the circumstances, but not for the purpose of expressing an opinion on the effectiveness of the Series' internal control over financial reporting. Accordingly, we express no such opinion. An audit also includes examining, on a test basis, evidence supporting the amounts and disclosures in the financial statements and financial highlights, assessing the accounting principles used and significant es timates made by management, and evaluating the overall financial statement presentation. Our procedures included confirmation of securities owned as of December 31, 2006, by correspondence with the custodian and brokers or by other appropriate auditing procedures where replies from brokers were not received. We believe that our audits provide a reasonable basis for our opinion.
In our opinion, the financial statements and financial highlights referred to above present fairly, in all material respects, the financial position of the Delaware VIP REIT Series of Delaware VIP Trust at December 31, 2006, the results of its operations for the year then ended, the changes in its net assets for each of the two years in the period then ended, and its financial highlights for each of the five years in the period then ended, in conformity with U.S. generally accepted accounting principles.

Philadelphia, Pennsylvania
February 14, 2007
The Series files its complete schedule of portfolio holdings with the Securities and Exchange Commission for the first and third quarters of each fiscal year on Form N-Q. The Series' Forms N-Q, as well as a description of the policies and procedures that the Series uses to determine how to vote proxies (if any) relating to portfolio securities is available without charge (i) upon request, by calling 800-523-1918; (ii) on the Series' website at http://www.delawareinvestments.com; and (iii) on the Commission's website at http://www.sec.gov. The Series' Forms N-Q may be reviewed and copied at the Commission's Public Reference Room in Washington, DC; information on the operation of the Public Reference Room may be obtained by calling 1-800-SEC-0330.
Information (if any) regarding how the Series voted proxies relating to portfolio securities during the most recently disclosed 12-month period ended June 30 is available without charge (i) through the Series' website at http://www.delawareinvestments.com; and (ii) on the Commission's website at http://www.sec.gov.
REIT Series- 14
Delaware Investments® Family of Funds
board of trustees/directors and officers addendum
A mutual fund is governed by a Board of Trustees/Directors ("Trustees"), which has oversight responsibility for the management of a fund's business affairs. Trustees establish procedures and oversee and review the performance of the investment manager, the distributor, and others who perform services for the fund. The independent fund trustees, in particular, are advocates for shareholder interests. Each trustee has served in that capacity since he or she was elected to or appointed to the Board of Trustees, and will continue to serve until his or her retirement or the election of a new trustee in his or her place. The following is a list of the Trustees and Officers with certain background and related information.
Name,
Address,
and Birth Date | | Position(s)
Held with
Fund(s) | | Length of Time
Served | | Principal
Occupation(s)
During
Past 5 Years | | Number of
Portfolios in Fund
Complex Overseen
by Trustee
or Officer | | Other
Directorships
Held by
Trustee
or Officer | |
| interested trustees | | | | | | | | | | | | | |
|
Patrick P. Coyne1
2005 Market Street
Philadelphia, PA
19103
April 14, 1963 | | Chairman,
President,
Chief Executive
Officer, and
Trustee | | Chairman and Trustee
since August 16, 2006
President and
Chief Executive Officer
since August 1, 2006 | | Patrick P. Coyne has served in
various executive capacities
at different times at
Delaware Investments.2 | | | 84 | | | None | |
|
| independent trustees | | | | | | | | | | | | | |
|
Thomas L. Bennett
2005 Market Street
Philadelphia, PA
19103
October 4, 1947 | | Trustee | | Since
March 2005 | | Private Investor –
(March 2004 – Present)
Investment Manager –
Morgan Stanley & Co.
(January 1984 – March 2004) | | | 84 | | | None | |
|
John A. Fry
2005 Market Street
Philadelphia, PA
19103
May 28, 1960 | | Trustee | | Since
January 2001 | | President –
Franklin & Marshall College
(June 2002 – Present)
Executive Vice President –
University of Pennsylvania
(April 1995 – June 2002) | | | 84 | | | Director –
Community Health
Systems
Director –
Allied Barton
Security Holdings | |
|
Anthony D. Knerr
2005 Market Street
Philadelphia, PA
19103
December 7, 1938 | | Trustee | | Since
April 1990 | | Founder and Managing Director –
Anthony Knerr & Associates
(Strategic Consulting)
(1990 – Present) | | | 84 | | | None | |
|
Lucinda S. Landreth
2005 Market Street
Philadelphia, PA
19103
June 24, 1947 | | Trustee | | Since
March 2005 | | Chief Investment Officer –
Assurant, Inc.
(Insurance)
(2002 – 2004) | | | 84 | | | None | |
|
Ann R. Leven
2005 Market Street
Philadelphia, PA
19103
November 1, 1940 | | Trustee | | Since
September 1989 | | Consultant –
ARL Associates
(Financial Planning)
(1983 – Present) | | | 84 | | | Director and
Audit Committee
Chairperson – Andy
Warhol Foundation
Director and Audit
Committee Member –
Systemax, Inc. | |
|
REIT Series- 15
Name,
Address,
and Birth Date | | Position(s)
Held with
Fund(s) | | Length of Time
Served | | Principal
Occupation(s)
During
Past 5 Years | | Number of
Portfolios in Fund
Complex Overseen
by Trustee
or Officer | | Other
Directorships
Held by
Trustee
or Officer | |
| independent trustees (continued) | | | | | | | | | | | | | |
|
Thomas F. Madison
2005 Market Street
Philadelphia, PA
19103
February 25, 1936 | | Trustee | | Since
May 1997 | | President and Chief
Executive Officer –
MLM Partners, Inc.
(Small Business Investing
and Consulting)
(January 1993 – Present) | | | 84 | | | Director –
Banner Health
Director –
CenterPoint Energy
Director and Audit
Committee Member –
Digital River, Inc.
Director and Audit
Committee Member –
Rimage
Corporation
Director – Valmont
Industries, Inc. | |
|
Janet L. Yeomans
2005 Market Street
Philadelphia, PA
19103
July 31, 1948 | | Trustee | | Since
April 1999 | | Vice President
(January 2003 – Present)
and Treasurer
(January 2006 – Present)
3M Corporation
Ms. Yeomans has held
various management positions
at 3M Corporation since 1983. | | | 84 | | | None | |
|
J. Richard Zecher
2005 Market Street
Philadelphia, PA
19103
July 3, 1940 | | Trustee | | Since
March 2005 | | Founder –
Investor Analytics
(Risk Management)
(May 1999 – Present)
Founder –
Sutton Asset Management
(Hedge Fund)
(September 1998 – Present) | | | 84 | | | Director and Audit
Committee Member –
Investor Analytics
Director and Audit
Committee Member –
Oxigene, Inc. | |
|
| officers | | | | | | | | | | | | | |
|
David F. Connor
2005 Market Street
Philadelphia, PA
19103
December 2, 1963 | | Vice President,
Deputy General
Counsel, and Secretary | | Vice President since
September 21, 2000
and Secretary
since
October 2005 | | David F. Connor has served as
Vice President and Deputy
General Counsel of
Delaware Investments
since 2000. | | | 84 | | | None3 | |
|
David P. O'Connor
2005 Market Street
Philadelphia, PA
19103
February 21, 1966 | | Senior Vice
President,
General Counsel,
and Chief
Legal Officer | | Senior Vice President,
General Counsel, and
Chief Legal Officer
since
October 2005 | | David P. O'Connor has served in
various executive and legal
capacities at different times at
Delaware Investments. | | | 84 | | | None3 | |
|
John J. O'Connor
2005 Market Street
Philadelphia, PA
19103
June 16, 1957 | | Senior Vice President
and Treasurer | | Treasurer
since
February 2005 | | John J. O'Connor has served in
various executive capacities
at different times at
Delaware Investments. | | | 84 | | | None3 | |
|
Richard Salus
2005 Market Street
Philadelphia, PA
19103
October 4, 1963 | | Senior
Vice President
and
Chief Financial
Officer | | Chief Financial
Officer since
November 1, 2006 | | Richard Salus has served in
various executive capacities
at different times at
Delaware Investments. | | | 84 | | | None3 | |
|
1 Patrick P. Coyne is considered to be an "Interested Trustee" because he is an executive officer of the Fund's(s') investment advisor.
2 Delaware Investments is the marketing name for Delaware Management Holdings, Inc. and its subsidiaries, including the Fund's(s') investment advisor, principal underwriter, and its transfer agent.
3 David F. Connor, David P. O'Connor, John J. O'Connor, and Richard Salus serve in similar capacities for the six portfolios of the Optimum Fund Trust, which have the same investment advisor, principal underwriter, and transfer agent as the registrant. John J. O'Connor also serves in a similar capacity for Lincoln Variable Insurance Products Trust, which has the same investment advisor as the registrant.
The Statement of Additional Information for the Fund(s) includes additional information about the Trustees and Officers and is available, without charge, upon request by calling 800 523-1918.
REIT Series- 16
Delaware VIP Trust — Delaware VIP Select Growth Series
For the 12-month period ended Dec. 31, 2006, the Delaware VIP Select Growth Series Standard Class shares showed a positive return of 1.82%, and Service Class shares gained 1.53%, both with distributions reinvested. The Series performance lagged behind the 9.46% gain of its benchmark, the Russell 3000 Growth Index (source: Lipper).
Our broad investment approach focuses on individual companies that we believe have particularly good long-term growth prospects over the next five years or longer. The heaviest positions held in the Series were companies categorized as consumer discretionary and technology. The largest consumer discretionary holdings as of Dec. 31, 2006 were NetFlix, Weight Watchers International, and eBay. From the technology industry, we added to existing positions in Qualcomm and Seagate Technology.
As long-term investors, we typically seek to avoid large-scale changes as long as we remain confident in the names we own. Specific to the fiscal year 2006, we believe that a number of our more aggressive holdings were unreasonably penalized.
Positive contributors to the performance included IntercontinentalExchange and MGM Mirage. IntercontinentalExchange was a new position in the Series and is a play on the growth of electronic exchanges in the derivatives and futures markets, specifically in the energy industry. MGM Mirage performed well due to the increase of interest in the gaming companies from private equity investors, the market's growing appreciation for international expansion, and MGM's tender offer that gave the stock technical support and signaled that company fundamentals were strong.
Most of our underperformers during the period were among the Series' more aggressive holdings. For example, we were negatively affected by our positions in XM Satellite Radio and NetTeller PLC. By fiscal year end we had sold both of these positions. Another detractor was SanDisk, a leading maker of flash memory storage. However, we continued to have confidence in SanDisk's long-term growth potential and took advantage of recent price dips to add to our existing holdings in the stock. Also hindering our performance was Navteq, though we remain confident that the continued proliferation of navigation devices on mobile devices will continue to Navteq's benefit.
The views expressed are current as of the date of this report and are subject to change.
The performance data quoted below and on the next page represent past performance; past performance does not guarantee future results. Investment return and principal value of an investment will fluctuate so that your shares, when redeemed, may be worth more or less than their original cost. Current performance may be lower or higher than the performance data quoted. Please obtain the performance data for the most recent month end by calling the number noted on the page related to this Series in the introductory section of this report.
You should consider the investment objectives, risks, charges, and expenses of the investment carefully before investing. The Delaware VIP Select Growth Series prospectus contains this and other important information about the Series. To obtain a prospectus, contact the company noted on the page related to this Series in the introductory section of this report, either by phone or through the company Web site. We advise you to read the prospectus carefully before you invest.
Delaware VIP Select Growth Series
Average Annual Total Returns
For the periods ending Dec. 31, 2006 | | 1 Year | | 5 Years | | Lifetime | |
| Standard Class Shares* | | | +1.82 | % | | | +3.92 | % | | | +0.30 | % | |
| Service Class Shares** | | | +1.53 | % | | | +3.70 | % | | | -4.13 | % | |
* Commenced operations on May 3, 1999
** Commenced operations on May 1, 2000
Select Growth Series- 1
Delaware VIP Trust — Delaware VIP Select Growth Series (continued)
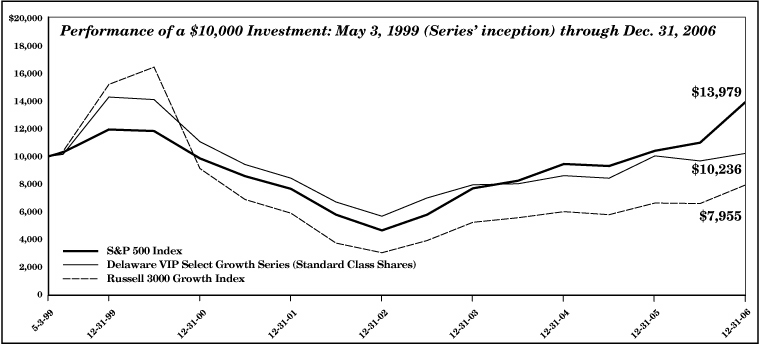
The chart shows a $10,000 investment in the Delaware VIP Select Growth Series Standard Class shares for the period from the Series' inception May 3, 1999 through Dec. 31, 2006. All distributions were reinvested. The chart also shows $10,000 invested in the Russell 3000 Growth Index and the S&P 500 Index for the period from May 3, 1999 through Dec. 31, 2006.
Russell 3000 Growth Index measures the performance of those Russell 3000 Index companies with higher price-to-book ratios and higher forecasted growth values. The S&P 500 Index measures mostly large-capitalization U.S. companies. An index is unmanaged and does not reflect the costs of operating a mutual fund, such as the costs of buying, selling, and holding securities. You cannot invest directly in an index.
Series that invest in small- and medium-sized companies typically involve greater risk, particularly in the short term, than those investing in larger, more established companies.
Earnings from a variable annuity or variable life investment compound tax free until withdrawal, so no adjustments were made for income taxes.
An expense limitation was in effect for the Delaware VIP Select Growth Series during the periods shown.
Performance of Service Class shares will vary due to different charges and expenses.
Performance does not reflect insurance fees related to a variable annuity or variable life investment or the deferred sales charge that would apply to certain withdrawals of investments held for fewer than eight years. Performance shown here would have been reduced if such fees were included and the expense limitation was removed. For more information about fees, consult your variable annuity or variable life prospectus.
Investments in variable products involve risk. Some portfolios offer more risk than others. Please read both the contract and underlying prospectus for specific details regarding the product's risk profile.
Select Growth Series- 2
Delaware VIP Trust — Delaware VIP Select Growth Series
Disclosure of Series Expenses
For the Period July 1, 2006 to December 31, 2006
As a shareholder of the Series, you incur ongoing costs, including management fees; distribution and/or service (12b-1) fees; and other Series expenses. This Example is intended to help you understand your ongoing costs (in dollars) of investing in the Series and to compare these costs with the ongoing costs of investing in other mutual funds.
The Example is based on an investment of $1,000 invested at the beginning of the period and held for the entire period from July 1, 2006 to December 31, 2006.
Actual Expenses
The first section of the table shown, "Actual Series Return," provides information about actual account values and actual expenses. You may use the information in this section of the table, together with the amount you invested, to estimate the expenses that you paid over the period. Simply divide your account value by $1,000 (for example, an $8,600 account value divided by $1,000 = 8.6), then multiply the result by the number in the first section under the heading entitled "Expenses Paid During Period" to estimate the expenses you paid on your account during the period.
Hypothetical Example for Comparison Purposes
The second section of the table shown, "Hypothetical 5% Return," provides information about hypothetical account values and hypothetical expenses based on the Series' actual expense ratio and an assumed rate of return of 5% per year before expenses, which is not the Series' actual return. The hypothetical account values and expenses may not be used to estimate the actual ending account balance or expenses you paid for the period. You may use this information to compare the ongoing costs of investing in the Series and other funds. To do so, compare the 5% hypothetical example with the 5% hypothetical examples that appear in the shareholder reports of other funds.
Please note that the expenses shown in the table are meant to highlight your ongoing costs only. As a shareholder of the Series, you do not incur any transaction costs, such as sales charges (loads), redemption fees or exchange fees, but shareholders of other funds may incur such costs. Also, the fees related to the variable annuity investment or the deferred sales charge that could apply have not been included. Therefore, the second section of the table is useful in comparing ongoing costs only, and will not help you determine the relative total costs of owning different funds. The Series' actual expenses shown in the table reflect fee waivers in effect. The expenses shown in the table assume reinvestment of all dividends and distributions.
Expense Analysis of an Investment of $1,000
| | | Beginning
Account
Value
7/1/06 | | Ending
Account
Value
12/31/06 | | Annualized
Expense
Ratios | | Expenses
Paid During
Period
7/1/06 to
12/31/06* | |
| Actual Series Return | |
| Standard Class | | $ | 1,000.00 | | | $ | 1,058.90 | | | | 0.92 | % | | $ | 4.77 | | |
| Service Class | | | 1,000.00 | | | | 1,058.60 | | | | 1.17 | % | | | 6.07 | | |
| Hypothetical 5% Return (5% return before expenses) | |
| Standard Class | | $ | 1,000.00 | | | $ | 1,020.57 | | | | 0.92 | % | | $ | 4.69 | | |
| Service Class | | | 1,000.00 | | | | 1,019.31 | | | | 1.17 | % | | | 5.96 | | |
*"Expenses Paid During Period" are equal to the Series' annualized expense ratio, multiplied by the average account value over the period, multiplied by 184/365 (to reflect the one-half year period).
Select Growth Series- 3
Delaware VIP Trust — Delaware VIP Select Growth Series
Sector Allocation and Top 10 Holdings
As of December 31, 2006
Sector designations may be different than the sector designations presented in other Series materials.
| Sector | | Percentage
of Net Assets | |
| Common Stock | | | 100.07 | % | |
| Basic Industry/Capital Goods | | | 1.29 | % | |
| Business Services | | | 9.62 | % | |
| Consumer Durables | | | 1.96 | % | |
| Consumer Non-Durables | | | 13.05 | % | |
| Consumer Services | | | 22.47 | % | |
| Energy | | | 0.45 | % | |
| Financials | | | 11.64 | % | |
| Health Care | | | 16.47 | % | |
| Technology | | | 23.12 | % | |
| Total Market Value of Securities | | | 100.07 | % | |
| Liabilities Net of Receivables and Other Assets | | | (0.07 | %) | |
| Total Net Assets | | | 100.00 | % | |
Holdings are for informational purposes only and are subject to change at any time.
They are not a recommendation to buy, sell, or hold any security.
Top 10 Holdings
| | | Percentage
of Net Assets | |
| NetFlix | | | 7.96 | % | |
| UnitedHealth Group | | | 6.71 | % | |
| IntercontinentalExchange | | | 5.87 | % | |
| Weight Watchers International | | | 5.42 | % | |
| QUALCOMM | | | 5.07 | % | |
| eBay | | | 4.88 | % | |
| SanDisk | | | 4.62 | % | |
| Allergan | | | 4.43 | % | |
| Jackson Hewitt Tax Service | | | 4.40 | % | |
| Seagate Technology | | | 4.22 | % | |
Select Growth Series- 4
Delaware VIP Trust — Delaware VIP Select Growth Series
Statement of Net Assets
December 31, 2006
| | | Number of
Shares | | Market
Value | |
| COMMON STOCK–100.07% | |
| Basic Industry/Capital Goods–1.29% | |
| Graco | | | 1,100 | | | $ | 43,582 | | |
| Praxair | | | 3,500 | | | | 207,655 | | |
| | | | | | | | 251,237 | | |
| Business Services–9.62% | |
| Equifax | | | 3,900 | | | | 158,340 | | |
| Expeditors International Washington | | | 10,400 | | | | 421,200 | | |
| † Global Cash Access | | | 38,300 | | | | 621,609 | | |
| Paychex | | | 6,000 | | | | 237,240 | | |
| † Research in Motion | | | 3,400 | | | | 434,452 | | |
| | | | | | | | 1,872,841 | | |
| Consumer Durables–1.96% | |
| † Select Comfort | | | 22,000 | | | | 382,580 | | |
| | | | | | | | 382,580 | | |
| Consumer Non-Durables–13.05% | |
| † Blue Nile | | | 10,600 | | | | 391,034 | | |
| † NetFlix | | | 59,900 | | | | 1,549,014 | | |
| Staples | | | 8,600 | | | | 229,620 | | |
| Walgreen | | | 4,700 | | | | 215,683 | | |
| Whole Foods Market | | | 3,300 | | | | 154,869 | | |
| | | | | | | | 2,540,220 | | |
| Consumer Services–22.47% | |
| † eBay | | | 31,600 | | | | 950,212 | | |
| IHOP | | | 10,600 | | | | 558,620 | | |
| Jackson Hewitt Tax Service | | | 25,200 | | | | 856,044 | | |
| † MGM MIRAGE | | | 6,500 | | | | 372,775 | | |
| Strayer Education | | | 4,100 | | | | 434,805 | | |
| Weight Watchers International | | | 20,100 | | | | 1,055,853 | | |
| Western Union | | | 6,600 | | | | 147,972 | | |
| | | | | | | | 4,376,281 | | |
| | | Number of
Shares | | Market
Value | |
| COMMON STOCK (continued) | |
| Energy–0.45% | |
| EOG Resources | | | 1,400 | | | $ | 87,430 | | |
| | | | | | | | 87,430 | | |
| Financials–11.64% | |
| Chicago Mercantile Exchange Class A | | | 900 | | | | 458,775 | | |
| † IntercontinentalExchange | | | 10,600 | | | | 1,143,740 | | |
| † NYMEX | | | 2,900 | | | | 359,629 | | |
| optionsXpress | | | 13,400 | | | | 304,046 | | |
| | | | | | | | 2,266,190 | | |
| Health Care–16.47% | |
| Allergan | | | 7,200 | | | | 862,128 | | |
| † Genentech | | | 7,300 | | | | 592,249 | | |
| UnitedHealth Group | | | 24,300 | | | | 1,305,639 | | |
| † Zimmer | | | 5,700 | | | | 446,766 | | |
| | | | | | | | 3,206,782 | | |
| Technology–23.12% | |
| Blackbaud | | | 7,000 | | | | 182,000 | | |
| † Google Class A | | | 875 | | | | 402,920 | | |
| † Intuit | | | 16,000 | | | | 488,160 | | |
| † j2 Global Communications | | | 18,900 | | | | 515,025 | | |
| † NAVTEQ | | | 5,900 | | | | 206,323 | | |
| QUALCOMM | | | 26,100 | | | | 986,319 | | |
| † SanDisk | | | 20,900 | | | | 899,327 | | |
| Seagate Technology | | | 31,000 | | | | 821,500 | | |
| | | | | | | | 4,501,574 | | |
Total Common Stock
(cost $15,490,608) | | | | | | | 19,485,135 | | |
| TOTAL MARKET VALUE OF SECURITIES–100.07% (cost $15,490,608) | | | 19,485,135 | | |
| LIABILITIES NET OF RECEIVABLES AND OTHER ASSETS–(0.07%) | | | (13,389 | ) | |
| NET ASSETS APPLICABLE TO 1,940,899 SHARES OUTSTANDING–100.00% | | $ | 19,471,746 | | |
| NET ASSET VALUE-DELAWARE VIP SELECT GROWTH SERIES STANDARD CLASS ($14,901,337 / 1,480,596 Shares) | | $ | 10.06 | | |
| NET ASSET VALUE-DELAWARE VIP SELECT GROWTH SERIES SERVICE CLASS ($4,570,409 / 460,303 Shares) | | $ | 9.93 | | |
| COMPONENTS OF NET ASSETS AT DECEMBER 31, 2006: | |
| Shares of beneficial interest (unlimited authorization–no par) | | $ | 64,703,220 | | |
| Accumulated net investment loss | | | (133 | ) | |
| Accumulated net realized loss on investments | | | (49,225,868 | ) | |
| Net unrealized appreciation of investments | | | 3,994,527 | | |
| Total net assets | | $ | 19,471,746 | | |
† Non-income producing security for the year ended December 31, 2006.
See accompanying notes
Select Growth Series- 5
Delaware VIP Trust — Delaware VIP Select Growth Series
Statement of Operations
Year Ended December 31, 2006
| INVESTMENT INCOME: | |
| Dividends | | $ | 104,500 | | |
| Interest | | | 11,954 | | |
| | | | 116,454 | | |
| EXPENSES: | |
| Management fees | | | 158,216 | | |
| Distribution expenses – Service Class | | | 14,183 | | |
| Audit and tax | | | 11,071 | | |
| Accounting and administration expenses | | | 8,438 | | |
| Reports and statements to shareholders | | | 6,208 | | |
| Trustees' fees and benefits | | | 3,601 | | |
| Custodian fees | | | 3,175 | | |
| Legal fees | | | 2,499 | | |
| Dividend disbursing and transfer agent fees and expenses | | | 2,110 | | |
| Dues and services | | | 1,503 | | |
| Insurance fees | | | 477 | | |
| Consulting fees | | | 474 | | |
| Pricing fees | | | 360 | | |
| Taxes (other than taxes on income) | | | 222 | | |
| Trustees' expenses | | | 96 | | |
| Registration fees | | | 52 | | |
| | | | 212,685 | | |
| Less expenses absorbed or waived | | | (6,430 | ) | |
| Less waiver of distribution expenses – Service Class | | | (2,364 | ) | |
| Less expense paid indirectly | | | (20 | ) | |
| Total operating expenses | | | 203,871 | | |
| NET INVESTMENT LOSS | | | (87,417 | ) | |
NET REALIZED AND UNREALIZED GAIN (LOSS)
ON INVESTMENTS: | |
| Net realized gain (loss) on: | |
| Investments | | | 1,056,103 | | |
| Foreign currencies | | | (903 | ) | |
| Net realized gain | | | 1,055,200 | | |
Net change in unrealized appreciation/depreciation
of investments | | | (666,516 | ) | |
NET REALIZED AND UNREALIZED GAIN ON
INVESTMENTS | | | 388,684 | | |
NET INCREASE IN NET ASSETS RESULTING
FROM OPERATIONS | | $ | 301,267 | | |
See accompanying notes
Delaware VIP Trust — Delaware VIP Select Growth Series
Statements of Changes in Net Assets
| | | Year Ended | |
| | | 12/31/06 | | 12/31/05 | |
INCREASE (DECREASE) IN NET
ASSETS FROM OPERATIONS: | |
| Net investment loss | | $ | (87,417 | ) | | $ | (70,668 | ) | |
Net realized gain on investments and
foreign currencies | | | 1,055,200 | | | | 3,605,727 | | |
Net change in unrealized appreciation/
depreciation of investments and
foreign currencies | | | (666,516 | ) | | | (97,657 | ) | |
Net increase in net assets
resulting from operations | | | 301,267 | | | | 3,437,402 | | |
| CAPITAL SHARE TRANSACTIONS: | |
| Proceeds from shares sold: | |
| Standard Class | | | 15,031,576 | | | | 271,657 | | |
| Service Class | | | 4,970,607 | | | | 245,554 | | |
| | | | 20,002,183 | | | | 517,211 | | |
| Cost of shares repurchased: | |
| Standard Class | | | (18,980,519 | ) | | | (4,882,598 | ) | |
| Service Class | | | (5,539,539 | ) | | | (1,024,469 | ) | |
| | | | (24,520,058 | ) | | | (5,907,067 | ) | |
Decrease in net assets derived from
capital share transactions | | | (4,517,875 | ) | | | (5,389,856 | ) | |
| NET DECREASE IN NET ASSETS | | | (4,216,608 | ) | | | (1,952,454 | ) | |
| NET ASSETS: | |
| Beginning of year | | | 23,688,354 | | | | 25,640,808 | | |
End of year (including accumulated
net investment loss of $(133) and
$-, respectively) | | $ | 19,471,746 | | | $ | 23,688,354 | | |
See accompanying notes
Select Growth Series- 6
Delaware VIP Trust — Delaware VIP Select Growth Series
Financial Highlights
Selected data for each share of the Series outstanding throughout each period were as follows:
| | | Delaware VIP Select Growth Series Standard Class | |
| | | Year Ended | |
| | | 12/31/06 | | 12/31/05 | | 12/31/04 | | 12/31/03 | | 12/31/02 | |
| Net asset value, beginning of period | | $ | 9.880 | | | $ | 8.460 | | | $ | 7.810 | | | $ | 5.600 | | | $ | 8.300 | | |
| Income (loss) from investment operations: | |
| Net investment loss1 | | | (0.035 | ) | | | (0.022 | ) | | | (0.011 | ) | | | (0.016 | ) | | | (0.024 | ) | |
Net realized and unrealized gain (loss) on investments
and foreign currencies | | | 0.215 | | | | 1.442 | | | | 0.661 | | | | 2.226 | | | | (2.676 | ) | |
| Total from investment operations | | | 0.180 | | | | 1.420 | | | | 0.650 | | | | 2.210 | | | | (2.700 | ) | |
| Net asset value, end of period | | $ | 10.060 | | | $ | 9.880 | | | $ | 8.460 | | | $ | 7.810 | | | $ | 5.600 | | |
| Total return2 | | | 1.82 | % | | | 16.78 | % | | | 8.32 | % | | | 39.46 | % | | | (32.53 | %) | |
| Ratios and supplemental data: | |
| Net assets, end of period (000 omitted) | | $ | 14,901 | | | $ | 18,612 | | | $ | 20,493 | | | $ | 23,089 | | | $ | 27,056 | | |
| Ratio of expenses to average net assets | | | 0.91 | % | | | 0.90 | % | | | 0.83 | % | | | 0.83 | % | | | 0.86 | % | |
Ratio of expenses to average net assets prior to expense
limitation and expenses paid indirectly | | | 0.94 | % | | | 0.97 | % | | | 0.83 | % | | | 0.83 | % | | | 0.86 | % | |
| Ratio of net investment loss to average net assets | | | (0.36 | %) | | | (0.26 | %) | | | (0.14 | %) | | | (0.24 | %) | | | (0.35 | %) | |
Ratio of net investment loss to average net assets prior
to expense limitation and expenses paid indirectly | | | (0.39 | %) | | | (0.33 | %) | | | (0.14 | %) | | | (0.24 | %) | | | (0.35 | %) | |
| Portfolio turnover | | | 50 | % | | | 133 | % | | | 86 | % | | | 72 | % | | | 106 | % | |
1The average shares outstanding method has been applied for per share information.
2Total investment return is based on the change in net asset value of a share during the period and assumes reinvestment of dividends and distributions at net asset value. Total investment return reflects waivers and payment of fees by the manager, as applicable. Performance would have been lower had the expense limitation not been in effect.
See accompanying notes
Select Growth Series- 7
Delaware VIP Select Growth Series
Financial Highlights (continued)
Selected data for each share of the Series outstanding throughout each period were as follows:
| | | Delaware VIP Select Growth Series Service Class | |
| | | Year Ended | |
| | | 12/31/06 | | 12/31/05 | | 12/31/04 | | 12/31/03 | | 12/31/02 | |
| Net asset value, beginning of period | | $ | 9.780 | | | $ | 8.390 | | | $ | 7.760 | | | $ | 5.580 | | | $ | 8.280 | | |
| Income (loss) from investment operations: | |
| Net investment loss1 | | | (0.059 | ) | | | (0.043 | ) | | | (0.030 | ) | | | (0.030 | ) | | | (0.034 | ) | |
Net realized and unrealized gain (loss) on investments
and foreign currencies | | | 0.209 | | | | 1.433 | | | | 0.660 | | | | 2.210 | | | | (2.666 | ) | |
| Total from investment operations | | | 0.150 | | | | 1.390 | | | | 0.630 | | | | 2.180 | | | | (2.700 | ) | |
| Net asset value, end of period | | $ | 9.930 | | | $ | 9.780 | | | $ | 8.390 | | | $ | 7.760 | | | $ | 5.580 | | |
| Total return2 | | | 1.53 | % | | | 16.57 | % | | | 8.12 | % | | | 39.07 | % | | | (32.61 | %) | |
| Ratios and supplemental data: | |
| Net assets, end of period (000 omitted) | | $ | 4,571 | | | $ | 5,076 | | | $ | 5,148 | | | $ | 5,670 | | | $ | 7,018 | | |
| Ratio of expenses to average net assets | | | 1.16 | % | | | 1.15 | % | | | 1.08 | % | | | 1.05 | % | | | 1.01 | % | |
Ratio of expenses to average net assets prior to expense
limitation and expenses paid indirectly | | | 1.24 | % | | | 1.27 | % | | | 1.13 | % | | | 1.08 | % | | | 1.01 | % | |
| Ratio of net investment loss to average net assets | | | (0.61 | %) | | | (0.51 | %) | | | (0.39 | %) | | | (0.46 | %) | | | (0.50 | %) | |
Ratio of net investment loss to average net assets prior
to expense limitation and expenses paid indirectly | | | (0.69 | %) | | | (0.63 | %) | | | (0.44 | %) | | | (0.49 | %) | | | (0.50 | %) | |
| Portfolio turnover | | | 50 | % | | | 133 | % | | | 86 | % | | | 72 | % | | | 106 | % | |
1The average shares outstanding method has been applied for per share information.
2Total investment return is based on the change in net asset value of a share during the period and assumes reinvestment of dividends and distributions at net asset value. Total investment return reflects waivers and payment of fees by the manager and distributor, as applicable. Performance would have been lower had the expense limitation not been in effect.
See accompanying notes
Select Growth Series- 8
Delaware VIP Trust — Delaware VIP Select Growth Series
Notes to Financial Statements
December 31, 2006
Delaware VIP Trust (the "Trust") is organized as a Delaware statutory trust and offers 15 series: Delaware VIP Balanced Series, Delaware VIP Capital Reserves Series, Delaware VIP Cash Reserve Series, Delaware VIP Diversified Income Series, Delaware VIP Emerging Markets Series, Delaware VIP Global Bond Series, Delaware VIP Growth Opportunities Series, Delaware VIP High Yield Series, Delaware VIP International Value Equity Series, Delaware VIP REIT Series, Delaware VIP Select Growth Series, Delaware VIP Small Cap Value Series, Delaware VIP Trend Series, Delaware VIP U.S. Growth Series and Delaware VIP Value Series. These financial statements and the related notes pertain to Delaware VIP Select Growth Series (the "Series"). The Trust is an open-end investment company. The Series is considered diversified under the Investment Company Act of 1940, as amended, and offers Standard Class and Service Class shares. The Standard Class shares do not car ry a 12b-1 fee and the Service Class shares carry a 12b-1 fee. The shares of the Series are sold only to separate accounts of life insurance companies.
The investment objective of the Series is to seek long-term capital appreciation.
1. Significant Accounting Policies
The following accounting policies are in accordance with U.S. generally accepted accounting principles and are consistently followed by the Series.
Security Valuation—Equity securities, except those traded on the Nasdaq Stock Market, Inc. (Nasdaq), are valued at the last quoted sales price as of the time of the regular close of the New York Stock Exchange (NYSE) on the valuation date. Securities traded on the Nasdaq are valued in accordance with the Nasdaq Official Closing Price, which may not be the last sales price. If on a particular day an equity security does not trade, then the mean between the bid and asked prices will be used. Short-term debt securities having less than 60 days to maturity are valued at amortized cost, which approximates market value. Other securities and assets for which market quotations are not readily available are valued at fair value as determined in good faith under the direction of the Series' Board of Trustees. In determining whether market quotations are readily availab le or fair valuation will be used, various factors will be taken into consideration, such as market closures, or with respect to foreign securities, aftermarket trading, or significant events after local market trading (e.g., government actions or pronouncements, trading volume or volatility on markets, exchanges among dealers, or news events).
In September 2006, the Financial Accounting Standards Board (FASB) issued FASB Statement No. 157 "Fair Value Measurements" (Statement 157). Statement 157 establishes a framework for measuring fair value in generally accepted accounting principles, clarifies the definition of fair value within that framework, and expands disclosures about the use of fair value measurements. Statement 157 is intended to increase consistency and comparability among fair value estimates used in financial reporting. Statement 157 is effective for fiscal years beginning after November 15, 2007. Management does not expect the adoption of Statement 157 to have an impact on the amounts reported in the financial statements.
Federal Income Taxes—The Series intends to continue to qualify for federal income tax purposes as a regulated investment company and make the requisite distributions to shareholders. Accordingly, no provision for federal income taxes has been made in the financial statements.
On July 13, 2006, FASB released FASB Interpretation No. 48 "Accounting for Uncertainty in Income Taxes" (FIN 48). FIN 48 provides guidance for how uncertain tax positions should be recognized, measured, presented, and disclosed in the financial statements. FIN 48 requires the evaluation of tax positions taken or expected to be taken in the course of preparing the Series' tax returns to determine whether the tax positions are "more-likely-than-not" of being sustained by the applicable tax authority. Tax positions not deemed to meet the more-likely-than-not threshold would be recorded as a tax benefit or expense in the current year. Adoption of FIN 48 is required for fiscal years beginning after December 15, 2006 and is to be applied to all open tax years as of the effective date. Recent SEC guidance allows implementing FIN 48 in Series net asset value calculations as late as the Series' last net asset value calculation in the first required f inancial statement reporting period. As a result, the Series will incorporate FIN 48 in its semiannual report on June 30, 2007. Although the Serires' tax positions are currently being evaluated, management does not expect the adoption of FIN 48 to have a material impact on the Series' financial statements.
Class Accounting—Investment income, common expenses and realized and unrealized gain (loss) on investments are allocated to the classes of the Series on the basis of daily net assets of each class. Distribution expenses relating to a specific class are charged directly to that class.
Repurchase Agreements—The Series may invest in a pooled cash account along with other members of the Delaware Investments® Family of Funds pursuant to an exemptive order issued by the Securities and Exchange Commission. The aggregate daily balance of the pooled cash account is invested in repurchase agreements secured by obligations of the U.S. government. The respective collateral is held by the Series' custodian bank until the maturity of the respective repurchase agreements. Each repurchase agreement is at least 102% collateralized. However, in the event of default or bankruptcy by the counterparty to the agreement, realization of the collateral may be subject to legal proceedings.
Use of Estimates—The preparation of financial statements in conformity with U.S. generally accepted accounting principles requires management to make estimates and assumptions that affect the reported amounts of assets and liabilities at the date of the financial statements and the reported amounts of revenues and expenses during the reporting period. Actual results could differ from those estimates.
Other—Expenses directly attributable to the Series are charged directly to the Series. Other expenses common to various funds within the Delaware Investments® Family of Funds are generally allocated amongst such funds on the basis of average net assets. Management fees and some other expenses are paid monthly. Security transactions are recorded on the date the securities are purchased or sold (trade date) for financial reporting purposes. Costs used in calculating realized gains and losses on the sale of investment securities are those of the specific securities sold. Dividend income is recorded on the ex-dividend date and interest income is recorded on the accrual basis.
The Series declares and pays dividends from net investment income and distributions from net realized gain on investments, if any, following the close of the fiscal year.
Select Growth Series- 9
Delaware VIP Select Growth Series
Notes to Financial Statements (continued)
1. Significant Accounting Policies (continued)
Subject to seeking best execution, the Series may direct certain security trades to brokers who have agreed to rebate a portion of the related brokerage commission to the Series in cash. Such commission rebates are included in realized gain on investments in the accompanying financial statements and totaled $2,897 for the year ended December 31, 2006. In general, best execution refers to many factors, including the price paid or received for a security, the commission charged, the promptness and reliability of execution, the confidentiality and placement accorded the order, and other factors affecting the overall benefit obtained by the Series on the transaction.
The Series may receive earnings credits from its custodian when positive cash balances are maintained, which are used to offset custody fees. The expense paid under this arrangement is included in custodian fees on the Statement of Operations with the corresponding expense offset shown as "expense paid indirectly."
2. Investment Management, Administration Agreements and Other Transactions with Affiliates
In accordance with the terms of its investment management agreement, the Series pays Delaware Management Company (DMC), a series of Delaware Management Business Trust and the investment manager, an annual fee which is calculated daily at the rate of 0.75% on the first $500 million of average daily net assets of the Series, 0.70% on the next $500 million, 0.65% on the next $1.5 billion, and 0.60% on average daily net assets in excess of $2.5 billion.
DMC has contractually agreed to waive that portion, if any, of its management fee and reimburse the Series to the extent necessary to ensure that annual operating expenses, exclusive of taxes, interest, brokerage commissions, distribution fees, certain insurance costs and extraordinary expenses, do not exceed 0.90% of average daily net assets of the Series through April 30, 2007.
Delaware Service Company, Inc. (DSC), an affiliate of DMC, provides accounting, administration, dividend disbursing and transfer agent services. The Series pays DSC a monthly fee computed at the annual rate of 0.04% of the Series' average daily net assets for accounting and administrative services. The Series pays DSC a monthly fee based on average net assets for dividend disbursing and transfer agent services.
Pursuant to a distribution agreement and distribution plan, the Series pays Delaware Distributors, L.P. (DDLP), the distributor and an affiliate of DMC, an annual distribution and service fee not to exceed 0.30% of the average daily net assets of the Service Class shares. DDLP has contracted to waive distribution and service fees through April 30, 2007 in order to prevent distribution and service fees of the Service Class shares from exceeding 0.25% of average daily net assets. Standard Class shares pay no distribution and service expenses.
At December 31, 2006, the Series had liabilities payable to affiliates as follows:
Investment
Management
Fee Payable to
DMC | | Dividend Disbursing,
Transfer Agent, Accounting
and Administration Fees
and Other Expenses
Payable to DSC | | Distribution
Fees Payable
to DDLP | | Other
Expenses
Payable
to DMC
and Affiliates* | |
| $ | 10,744 | | | $ | 944 | | | $ | 996 | | | $ | 733 | | |
*DMC, as part of its administrative services, pays operating expenses on behalf of the Series and is reimbursed on a periodic basis. Such expenses include items such as printing of shareholder reports, fees for audit, legal and tax services, custodian fees and trustees' fees.
As provided in the investment management agreement, the Series bears the cost of certain legal and tax services, including internal legal and tax services provided to the Series by DMC and/or its affiliates' employees. For the year ended December 31, 2006, the Series was charged $984 for internal legal and tax services provided by DMC and/or its affiliates' employees.
Trustees' fees and benefits include expenses accrued by the Series for each Trustee's retainer, per meeting fees and retirement benefits. Independent Trustees with over five years of uninterrupted service are eligible to participate in a retirement plan that provides for the payment of benefits upon retirement. The amount of the retirement benefit is based on factors set forth in the plan, including the number of years of service. On November 16, 2006, the Board of Trustees unanimously voted to terminate the retirement plan. Payments equal to the net present value of the earned benefits will be made in 2007 to those independent trustees so entitled. The retirement benefit payout for the Series is $2,430. Certain officers of DMC, DSC and DDLP are officers and/or trustees of the Trust. These officers and trustees are paid no compensation by the Series.
3. Investments
For year ended December 31, 2006, the Series made purchases and sales of investment securities other than short-term investments as follows:
| Purchases | | $ | 10,407,364 | | |
| Sales | | | 14,893,136 | | |
Select Growth Series- 10
Delaware VIP Select Growth Series
Notes to Financial Statements (continued)
3. Investments (continued)
At December 31, 2006, the cost of investments for federal income tax purposes and unrealized appreciation (depreciation) for the Series were as follows:
Cost of
Investments | | Aggregate
Unrealized
Appreciation | | Aggregate
Unrealized
Depreciation | | Net Unrealized
Appreciation | |
| $ | 15,524,870 | | | $ | 4,188,631 | | | $ | (228,366 | ) | | $ | 3,960,265 | | |
4. Dividend and Distribution Information
Income and long-term capital gain distributions are determined in accordance with federal income tax regulations, which may differ from U.S. generally accepted accounting principles. Additionally, gains (losses) on foreign currency transactions and net short-term gains on sales of investment securities are treated as ordinary income for federal income tax purposes. There were no dividends and distributions paid during the years ended December 31, 2006 and 2005.
5. Components of Net Assets on a Tax Basis
As of December 31, 2006, the components of net assets on a tax basis were as follows:
| Shares of beneficial interest | | $ | 64,703,220 | | |
| Post-October losses | | | (82,285 | ) | |
| Post-October currency losses | | | (133 | ) | |
| Capital loss carryforwards | | | (49,109,321 | ) | |
| Unrealized appreciation of investments | | | 3,960,265 | | |
| Net assets | | $ | 19,471,746 | | |
The differences between book basis and tax basis components of net assets are primarily attributable to tax deferral of losses on wash sales.
Post-October losses represent losses realized on investment and foreign currency transactions from November 1, 2006 through December 31, 2006 that, in accordance with federal income tax regulations, the Series has elected to defer and treat as having arisen in the following fiscal year.
For financial reporting purposes, capital accounts are adjusted to reflect the tax character of permanent book/tax differences. Reclassifications are primarily due to tax treatment of net operating losses and gain (loss) on foreign currency transactions. Results of operations and net assets were not affected by these reclassifications. For the year ended December 31, 2006, the Series recorded the following reclassifications:
Accumulated
Net
Investment Loss | | Accumulated
Net Realized
Gain (Loss) | | Paid-in
Capital | |
| $ | 87,284 | | | $ | 903 | | | $ | (88,187 | ) | |
For federal income tax purposes, capital loss carryforwards may be carried forward and applied against future capital gains. $1,148,188 was utilized in 2006. Capital loss carryforwards remaining at December 31, 2006 will expire as follows: $4,054,443 expires in 2008, $30,958,389 expires in 2009, $10,812,739 expires in 2010 and $3,283,750 expires in 2011.
6. Capital Shares
Transactions in capital shares were as follows:
| | | Year
Ended
12/31/06 | | Year
Ended
12/31/05 | |
| Shares sold: | |
| Standard Class | | | 1,691,049 | | | | 30,108 | | |
| Service Class | | | 560,656 | | | | 25,633 | | |
| | | | 2,251,705 | | | | 55,741 | | |
| Shares repurchased: | |
| Standard Class | | | (2,093,415 | ) | | | (569,367 | ) | |
| Service Class | | | (619,563 | ) | | | (120,148 | ) | |
| | | | (2,712,978 | ) | | | (689,515 | ) | |
| Net decrease | | | (461,273 | ) | | | (633,774 | ) | |
Select Growth Series- 11
Delaware VIP Select Growth Series
Notes to Financial Statements (continued)
7. Line of Credit
The Series, along with certain other funds in the Delaware Investments® Family of Funds (the "Participants"), participates in a $225,000,000 revolving line of credit facility to be used for temporary or emergency purposes as an additional source of liquidity to fund redemptions of investor shares. The Participants are charged an annual commitment fee, which is allocated across the Participants on the basis of each Participant's allocation of the entire facility. The Participants may borrow up to a maximum of one third of their net assets under the agreement. The Series had no amounts outstanding as of December 31, 2006, or at any time during the year then ended.
8. Credit and Market Risk
The Series invests a significant portion of its assets in small- and mid-sized companies and may be subject to certain risks associated with ownership of securities of such companies. Investments in small- or mid-sized companies may be more volatile than investments in larger companies for a number of reasons, which include more limited financial resources or a dependence on narrow product lines.
The Series may invest up to 15% of its total assets in illiquid securities, which may include securities with contractual restrictions on resale, securities exempt from registration under Rule 144A of the Securities Act of 1933, as amended, and other securities which may not be readily marketable. The relative illiquidity of these securities may impair the Series from disposing of them in a timely manner and at a fair price when it is necessary or desirable to do so. While maintaining oversight, the Series' Board of Trustees has delegated to DMC the day-to-day functions of determining whether individual securities are liquid for purposes of the Series' limitation on investments in illiquid assets. At December 31, 2006, there were no Rule 144A securities and no securities have been determined to be illiquid under the Series' Liquidity Procedures.
9. Contractual Obligations
The Series enters into contracts in the normal course of business that contain a variety of indemnifications. The Series' maximum exposure under these arrangements is unknown. However, the Series has not had prior claims or losses pursuant to these contracts. Management has reviewed the Series' existing contracts and expects the risk of loss to be remote.
Select Growth Series- 12
Delaware VIP Trust — Delaware VIP Select Growth Series
Report of Independent Registered Public Accounting Firm
To the Shareholders and Board of Trustees
Delaware VIP Trust–Delaware VIP Select Growth Series
We have audited the accompanying statement of net assets of the Delaware VIP Select Growth Series (one of the series constituting Delaware VIP Trust) (the "Series") as of December 31, 2006, and the related statement of operations for the year then ended, the statements of changes in net assets for each of the two years in the period then ended, and the financial highlights for each of the five years in the period then ended. These financial statements and financial highlights are the responsibility of the Series' management. Our responsibility is to express an opinion on these financial statements and financial highlights based on our audits.
We conducted our audits in accordance with the standards of the Public Company Accounting Oversight Board (United States). Those standards require that we plan and perform the audit to obtain reasonable assurance about whether the financial statements and financial highlights are free of material misstatement. We were not engaged to perform an audit of the Series' internal control over financial reporting. Our audits included consideration of internal control over financial reporting as a basis for designing audit procedures that are appropriate in the circumstances, but not for the purpose of expressing an opinion on the effectiveness of the Series' internal control over financial reporting. Accordingly, we express no such opinion. An audit also includes examining, on a test basis, evidence supporting the amounts and disclosures in the financial statements and financial highlights, assessing the accounting principles used and significant es timates made by management, and evaluating the overall financial statement presentation. Our procedures included confirmation of securities owned as of December 31, 2006, by correspondence with the custodian. We believe that our audits provide a reasonable basis for our opinion.
In our opinion, the financial statements and financial highlights referred to above present fairly, in all material respects, the financial position of the Delaware VIP Select Growth Series of Delaware VIP Trust at December 31, 2006, the results of its operations for the year then ended, the changes in its net assets for each of the two years in the period then ended, and its financial highlights for each of the five years in the period then ended, in conformity with U.S. generally accepted accounting principles.

Philadelphia, Pennsylvania
February 14, 2007
The Series files its complete schedule of portfolio holdings with the Securities and Exchange Commission for the first and third quarters of each fiscal year on Form N-Q. The Series' Forms N-Q, as well as a description of the policies and procedures that the Series uses to determine how to vote proxies (if any) relating to portfolio securities is available without charge (i) upon request, by calling 800-523-1918; (ii) on the Series' website at http://www.delawareinvestments.com; and (iii) on the Commission's website at http://www.sec.gov. The Series' Forms N-Q may be reviewed and copied at the Commission's Public Reference Room in Washington, DC; information on the operation of the Public Reference Room may be obtained by calling 1-800-SEC-0330.
Information (if any) regarding how the Series voted proxies relating to portfolio securities during the most recently disclosed 12-month period ended December 31 is available without charge (i) through the Series' website at http://www.delawareinvestments.com; and (ii) on the Commission's website at http://www.sec.gov.
Select Growth Series- 13
Delaware Investments® Family of Funds
board of trustees/directors and officers addendum
A mutual fund is governed by a Board of Trustees/Directors ("Trustees"), which has oversight responsibility for the management of a fund's business affairs. Trustees establish procedures and oversee and review the performance of the investment manager, the distributor, and others who perform services for the fund. The independent fund trustees, in particular, are advocates for shareholder interests. Each trustee has served in that capacity since he or she was elected to or appointed to the Board of Trustees, and will continue to serve until his or her retirement or the election of a new trustee in his or her place. The following is a list of the Trustees and Officers with certain background and related information.
Name,
Address,
and Birth Date | | Position(s)
Held with
Fund(s) | | Length of Time
Served | | Principal
Occupation(s)
During
Past 5 Years | | Number of
Portfolios in Fund
Complex Overseen
by Trustee
or Officer | | Other
Directorships
Held by
Trustee
or Officer | |
| interested trustees | | | | | | | | | | | | | |
|
Patrick P. Coyne1
2005 Market Street
Philadelphia, PA
19103
April 14, 1963 | | Chairman,
President,
Chief Executive
Officer, and
Trustee | | Chairman and Trustee
since August 16, 2006
President and
Chief Executive Officer
since August 1, 2006 | | Patrick P. Coyne has served in
various executive capacities
at different times at
Delaware Investments.2 | | | 84 | | | None | |
|
| independent trustees | | | | | | | | | | | | | |
|
Thomas L. Bennett
2005 Market Street
Philadelphia, PA
19103
October 4, 1947 | | Trustee | | Since
March 2005 | | Private Investor –
(March 2004 – Present)
Investment Manager –
Morgan Stanley & Co.
(January 1984 – March 2004) | | | 84 | | | None | |
|
John A. Fry
2005 Market Street
Philadelphia, PA
19103
May 28, 1960 | | Trustee | | Since
January 2001 | | President –
Franklin & Marshall College
(June 2002 – Present)
Executive Vice President –
University of Pennsylvania
(April 1995 – June 2002) | | | 84 | | | Director –
Community Health
Systems
Director –
Allied Barton
Security Holdings | |
|
Anthony D. Knerr
2005 Market Street
Philadelphia, PA
19103
December 7, 1938 | | Trustee | | Since
April 1990 | | Founder and Managing Director –
Anthony Knerr & Associates
(Strategic Consulting)
(1990 – Present) | | | 84 | | | None | |
|
Lucinda S. Landreth
2005 Market Street
Philadelphia, PA
19103
June 24, 1947 | | Trustee | | Since
March 2005 | | Chief Investment Officer –
Assurant, Inc.
(Insurance)
(2002 – 2004) | | | 84 | | | None | |
|
Ann R. Leven
2005 Market Street
Philadelphia, PA
19103
November 1, 1940 | | Trustee | | Since
September 1989 | | Consultant –
ARL Associates
(Financial Planning)
(1983 – Present) | | | 84 | | | Director and
Audit Committee
Chairperson – Andy
Warhol Foundation
Director and Audit
Committee Member –
Systemax, Inc. | |
|
Select Growth Series- 14
Name,
Address,
and Birth Date | | Position(s)
Held with
Fund(s) | | Length of Time
Served | | Principal
Occupation(s)
During
Past 5 Years | | Number of
Portfolios in Fund
Complex Overseen
by Trustee
or Officer | | Other
Directorships
Held by
Trustee
or Officer | |
| independent trustees (continued) | | | | | | | | | | | | | |
|
Thomas F. Madison
2005 Market Street
Philadelphia, PA
19103
February 25, 1936 | | Trustee | | Since
May 1997 | | President and Chief
Executive Officer –
MLM Partners, Inc.
(Small Business Investing
and Consulting)
(January 1993 – Present) | | | 84 | | | Director –
Banner Health
Director –
CenterPoint Energy
Director and Audit
Committee Member –
Digital River, Inc.
Director and Audit
Committee Member –
Rimage
Corporation
Director – Valmont
Industries, Inc. | |
|
Janet L. Yeomans
2005 Market Street
Philadelphia, PA
19103
July 31, 1948 | | Trustee | | Since
April 1999 | | Vice President
(January 2003 – Present)
and Treasurer
(January 2006 – Present)
3M Corporation
Ms. Yeomans has held
various management positions
at 3M Corporation since 1983. | | | 84 | | | None | |
|
J. Richard Zecher
2005 Market Street
Philadelphia, PA
19103
July 3, 1940 | | Trustee | | Since
March 2005 | | Founder –
Investor Analytics
(Risk Management)
(May 1999 – Present)
Founder –
Sutton Asset Management
(Hedge Fund)
(September 1998 – Present) | | | 84 | | | Director and Audit
Committee Member –
Investor Analytics
Director and Audit
Committee Member –
Oxigene, Inc. | |
|
| officers | | | | | | | | | | | | | |
|
David F. Connor
2005 Market Street
Philadelphia, PA
19103
December 2, 1963 | | Vice President,
Deputy General
Counsel, and Secretary | | Vice President since
September 21, 2000
and Secretary
since
October 2005 | | David F. Connor has served as
Vice President and Deputy
General Counsel of
Delaware Investments
since 2000. | | | 84 | | | None3 | |
|
David P. O'Connor
2005 Market Street
Philadelphia, PA
19103
February 21, 1966 | | Senior Vice
President,
General Counsel,
and Chief
Legal Officer | | Senior Vice President,
General Counsel, and
Chief Legal Officer
since
October 2005 | | David P. O'Connor has served in
various executive and legal
capacities at different times at
Delaware Investments. | | | 84 | | | None3 | |
|
John J. O'Connor
2005 Market Street
Philadelphia, PA
19103
June 16, 1957 | | Senior Vice President
and Treasurer | | Treasurer
since
February 2005 | | John J. O'Connor has served in
various executive capacities
at different times at
Delaware Investments. | | | 84 | | | None3 | |
|
Richard Salus
2005 Market Street
Philadelphia, PA
19103
October 4, 1963 | | Senior
Vice President
and
Chief Financial
Officer | | Chief Financial
Officer since
November 1, 2006 | | Richard Salus has served in
various executive capacities
at different times at
Delaware Investments. | | | 84 | | | None3 | |
|
1 Patrick P. Coyne is considered to be an "Interested Trustee" because he is an executive officer of the Fund's(s') investment advisor.
2 Delaware Investments is the marketing name for Delaware Management Holdings, Inc. and its subsidiaries, including the Fund's(s') investment advisor, principal underwriter, and its transfer agent.
3 David F. Connor, David P. O'Connor, John J. O'Connor, and Richard Salus serve in similar capacities for the six portfolios of the Optimum Fund Trust, which have the same investment advisor, principal underwriter, and transfer agent as the registrant. John J. O'Connor also serves in a similar capacity for Lincoln Variable Insurance Products Trust, which has the same investment advisor as the registrant.
The Statement of Additional Information for the Fund(s) includes additional information about the Trustees and Officers and is available, without charge, upon request by calling 800 523-1918.
Select Growth Series- 15
Delaware VIP Trust — Delaware VIP Small Cap Value Series (closed to new investors)
For the 12-month period, the Delaware VIP Small Cap Value Series had a positive return of 16.19% for Standard Class shares and 15.89% for Service Class shares, both with distributions reinvested. The benchmark, the Russell 2000 Value Index, gained 23.48% (source: Lipper).
Despite strong absolute returns, it was a challenging year overall for small-cap value managers, as lower-quality companies and real estate investment trusts (REITs) were often among the market's top performers. The Series held a smaller weighting in REIT investments than those reflected in the benchmark index, a choice based on our belief that the sector remains overpriced. Our smaller holdings compared to the benchmark index allocations had a negative impact on overall Series performance. We believe the generally better performance of companies with lower-quality financial health also had a negative impact on the performance of the Series. We remain committed to investing in high-quality, undervalued companies that are generating strong cash flows, and which we believe offer the potential for long-term appreciation.
Although sector weightings do influence performance, we are committed to conducting bottom-up research and choosing investments one stock at a time. The small-cap universe is comprised of more than 2,000 companies, many of these relatively new and unknown businesses. Therefore, uncovering quality investment opportunities requires a highly disciplined strategy.
To identify those companies with the most attractive growth prospects, we employ exhaustive fundamental research. We look for high-quality companies that generate sustainable revenues, maintain healthy balance sheets, and realize excess cash flow. We also evaluate each company's management, its product pipeline, and its competition. We aim to avoid large positions in any single company, thereby minimizing the effects of an underperformer on the portfolio.
The views expressed are current as of the date of this report and are subject to change.
The performance data quoted below and on the next page represent past performance; past performance does not guarantee future results. Investment return and principal value of an investment will fluctuate so that your shares, when redeemed, may be worth more or less than their original cost. Current performance may be lower or higher than the performance data quoted. Please obtain the performance data for the most recent month end by calling the number noted on the page related to this Series in the introductory section of this report.
You should consider the investment objectives, risks, charges, and expenses of the investment carefully before investing. The Delaware VIP Small Cap Value Series prospectus contains this and other important information about the Series. To obtain a prospectus, contact the company noted on the page related to this Series in the introductory section of this report, either by phone or through the company Web site. We advise you to read the prospectus carefully before you invest.
Delaware VIP Small Cap Value Series
Average Annual Total Returns
For the periods ending Dec. 31, 2006 | | 1 Year | | 5 Years | | 10 Years | | Lifetime | |
| Standard Class Shares* | | | +16.19 | % | | | +15.66 | % | | | +12.66 | % | | | +13.41 | % | |
| Service Class Shares** | | | +15.89 | % | | | +15.40 | % | | | NA | | | | +16.15 | % | |
* Commenced operations on Dec. 27, 1993
** Commenced operations on May 1, 2000
Small Cap Value Series- 1
Delaware VIP Trust — Delaware VIP Small Cap Value Series (continued)
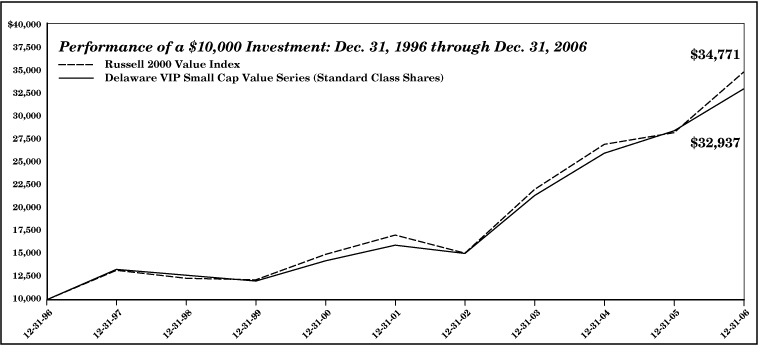
The chart shows a $10,000 investment in the Delaware VIP Small Cap Value Series Standard Class shares for the period from Dec. 31, 1996 through Dec. 31, 2006. All distributions were reinvested. The chart also shows $10,000 invested in the Russell 2000 Value Index for the period from Dec. 31, 1996 through Dec. 31, 2006.
Russell 2000 Value Index measures the performance of those Russell 2000 companies with lower price-to-book ratios and lower forecasted growth values. An index is unmanaged and does not reflect the costs of operating a mutual fund, such as the costs of buying, selling, and holding securities. You cannot invest directly in an index.
Earnings from a variable annuity or variable life investment compound tax free until withdrawal, so no adjustments were made for income taxes.
An expense limitation was in effect for the Delaware VIP Small Cap Value Series during the periods shown.
Performance of Service Class shares will vary due to different charges and expenses.
Performance does not reflect insurance fees related to a variable annuity or variable life investment, or the deferred sales charge that would apply to certain withdrawals of investments held for fewer than eight years. Performance shown here would have been reduced if such fees were included and the expense limitation was removed. For more information about fees, consult your variable annuity or variable life prospectus.
Investments in variable products involve risk. Series that invest in small- and/or medium-sized companies typically involve greater risk, particularly in the short term, than those investing in larger, more established companies. Some portfolios offer more risk than others. Please read both the contract and underlying prospectus for specific details regarding the product's risk profile.
Small Cap Value Series- 2
Delaware VIP Trust — Delaware VIP Small Cap Value Series
Disclosure of Series Expenses
For the Period July 1, 2006 to December 31, 2006
As a shareholder of the Series, you incur ongoing costs, including management fees; distribution and/or service (12b-1) fees; and other Series expenses. This Example is intended to help you understand your ongoing costs (in dollars) of investing in the Series and to compare these costs with the ongoing costs of investing in other mutual funds.
The Example is based on an investment of $1,000 invested at the beginning of the period and held for the entire period from July 1, 2006 to December 31, 2006.
Actual Expenses
The first section of the table shown, "Actual Series Return," provides information about actual account values and actual expenses. You may use the information in this section of the table, together with the amount you invested, to estimate the expenses that you paid over the period. Simply divide your account value by $1,000 (for example, an $8,600 account value divided by $1,000 = 8.6), then multiply the result by the number in the first section under the heading entitled "Expenses Paid During Period" to estimate the expenses you paid on your account during the period.
Hypothetical Example for Comparison Purposes
The second section of the table shown, "Hypothetical 5% Return," provides information about hypothetical account values and hypothetical expenses based on the Series' actual expense ratio and an assumed rate of return of 5% per year before expenses, which is not the Series' actual return. The hypothetical account values and expenses may not be used to estimate the actual ending account balance or expenses you paid for the period. You may use this information to compare the ongoing costs of investing in the Series and other funds. To do so, compare the 5% hypothetical example with the 5% hypothetical examples that appear in the shareholder reports of other funds.
Please note that the expenses shown in the table are meant to highlight your ongoing costs only. As a shareholder of the Series, you do not incur any transaction costs, such as sales charges (loads), redemption fees or exchange fees, but shareholders of other funds may incur such costs. Also, the fees related to the variable annuity investment or the deferred sales charge that could apply have not been included. Therefore, the second section of the table is useful in comparing ongoing costs only, and will not help you determine the relative total costs of owning different funds. The Series' actual expenses shown in the table reflect fee waivers in effect for Service Class shares. The expenses shown in the table assume reinvestment of all dividends and distributions.
Expense Analysis of an Investment of $1,000
| | | Beginning
Account
Value
7/1/06 | | Ending
Account
Value
12/31/06 | | Annualized
Expense
Ratios | | Expenses
Paid During
Period
7/1/06 to
12/31/06* | |
| Actual Series Return | |
| Standard Class | | $ | 1,000.00 | | | $ | 1,071.10 | | | | 0.86 | % | | $ | 4.49 | | |
| Service Class | | | 1,000.00 | | | | 1,069.60 | | | | 1.11 | % | | | 5.79 | | |
| Hypothetical 5% Return (5% return before expenses) | |
| Standard Class | | $ | 1,000.00 | | | $ | 1,020.87 | | | | 0.86 | % | | $ | 4.38 | | |
| Service Class | | | 1,000.00 | | | | 1,019.61 | | | | 1.11 | % | | | 5.65 | | |
*"Expenses Paid During Period" are equal to the Series' annualized expense ratio, multiplied by the average account value over the period, multiplied by 184/365 (to reflect the one-half year period).
Small Cap Value Series- 3
Delaware VIP Trust — Delaware VIP Small Cap Value Series
Sector Allocation and Top 10 Holdings
As of December 31, 2006
Sector designations may be different than the sector designations presented in other Series materials.
| Sector | | Percentage
of Net Assets | |
| Common Stock | | | 94.97 | % | |
| Basic Industry/Capital Goods | | | 11.23 | % | |
| Business Services | | | 1.97 | % | |
| Capital Spending | | | 6.05 | % | |
| Consumer Cyclical | | | 2.79 | % | |
| Consumer Services | | | 13.94 | % | |
| Consumer Staples | | | 2.56 | % | |
| Energy | | | 5.79 | % | |
| Financial Services | | | 18.72 | % | |
| Health Care | | | 6.22 | % | |
| Real Estate | | | 4.58 | % | |
| Technology | | | 14.28 | % | |
| Transportation | | | 3.36 | % | |
| Utilities | | | 3.48 | % | |
| Repurchase Agreements | | | 5.14 | % | |
| Securities Lending Collateral | | | 7.36 | % | |
| Fixed Rate Note | | | 1.39 | % | |
| Variable Rate Notes | | | 5.97 | % | |
| Total Market Value of Securities | | | 107.47 | % | |
| Obligation to Return Securities Lending Collateral | | | (7.36 | %) | |
| Liabilities Net of Receivables and Other Assets | | | (0.11 | %) | |
| Total Net Assets | | | 100.00 | % | |
Holdings are for informational purposes only and are subject to change at any time. They are not a recommendation to buy, sell, or hold any security.
| Top 10 Holdings | | Percentage
of Net Assets | |
| Colonial BancGroup | | | 1.54 | % | |
| Bank of Hawaii | | | 1.36 | % | |
| Whiting Petroleum | | | 1.33 | % | |
| Berkley (W.R.) | | | 1.33 | % | |
| Brandywine Realty Trust | | | 1.32 | % | |
| Brink's | | | 1.29 | % | |
| Emulex | | | 1.26 | % | |
| W-H Energy Services | | | 1.23 | % | |
| Crown | | | 1.21 | % | |
| Compuware | | | 1.17 | % | |
Small Cap Value Series-4
Delaware VIP Trust — Delaware VIP Small Cap Value Series
Statement of Net Assets
December 31, 2006
| | | Number of
Shares | | Market
Value | |
| COMMON STOCK–94.97% | |
| Basic Industry/ Capital Goods–11.23% | |
| Albemarle | | | 190,500 | | | $ | 13,677,900 | | |
| † Alpha Natural Resources | | | 369,900 | | | | 5,263,677 | | |
| Arch Coal | | | 174,100 | | | | 5,228,223 | | |
| Bowater | | | 374,200 | | | | 8,419,500 | | |
| Chaparral Steel | | | 159,400 | | | | 7,056,638 | | |
| Crane | | | 247,500 | | | | 9,068,400 | | |
| † Crown | | | 687,700 | | | | 14,386,684 | | |
| FMC | | | 151,700 | | | | 11,612,635 | | |
| † Griffon | | | 299,530 | | | | 7,638,015 | | |
| IPSCO | | | 131,100 | | | | 12,306,357 | | |
| * MacDermid | | | 26,334 | | | | 897,989 | | |
| † PolyOne | | | 679,400 | | | | 5,095,500 | | |
| * Spartech | | | 314,100 | | | | 8,235,702 | | |
| * Texas Industries | | | 128,000 | | | | 8,221,440 | | |
| Valspar | | | 315,800 | | | | 8,728,712 | | |
| Westlake Chemical | | | 229,000 | | | | 7,186,020 | | |
| | | | | | | | 133,023,392 | | |
| Business Services–1.97% | |
| Brink's | | | 239,700 | | | | 15,321,624 | | |
| † United Stationers | | | 171,100 | | | | 7,988,659 | | |
| | | | | | | | 23,310,283 | | |
| Capital Spending–6.05% | |
| † Casella Waste Systems | | | 482,400 | | | | 5,899,752 | | |
| Gibraltar Industries | | | 323,700 | | | | 7,610,187 | | |
| Harsco | | | 145,900 | | | | 11,102,990 | | |
| † Insituform Technologies Class A | | | 205,800 | | | | 5,321,988 | | |
| * Mueller Industries | | | 277,500 | | | | 8,796,750 | | |
| Mueller Water Products Class A | | | 315,600 | | | | 4,692,972 | | |
| † Mueller Water Products Class B | | | 253,484 | | | | 3,776,912 | | |
| Timken | | | 253,800 | | | | 7,405,884 | | |
| Wabtec | | | 425,800 | | | | 12,935,804 | | |
| Walter Industries | | | 153,400 | | | | 4,149,470 | | |
| | | | | | | | 71,692,709 | | |
| Consumer Cyclical–2.79% | |
| * Beazer Homes USA | | | 234,300 | | | | 11,014,443 | | |
| Furniture Brands International | | | 227,100 | | | | 3,685,833 | | |
| * KB HOME | | | 107,500 | | | | 5,512,600 | | |
| * MDC | | | 143,800 | | | | 8,203,790 | | |
| † WCI Communities | | | 241,600 | | | | 4,633,888 | | |
| | | | | | | | 33,050,554 | | |
| Consumer Services–13.94% | |
| Applebee's International | | | 476,700 | | | | 11,760,189 | | |
| * Belo Class A | | | 324,500 | | | | 5,964,310 | | |
| Borders Group | | | 480,900 | | | | 10,748,115 | | |
| Brunswick | | | 277,500 | | | | 8,852,250 | | |
| * Cato Class A | | | 481,800 | | | | 11,038,038 | | |
| *† CEC Entertainment | | | 297,500 | | | | 11,974,375 | | |
| † Dollar Tree Stores | | | 361,800 | | | | 10,890,180 | | |
| * Kenneth Cole Productions Class A | | | 187,400 | | | | 4,495,726 | | |
| *† Lenox Group | | | 153,000 | | | | 979,200 | | |
| Men's Wearhouse | | | 230,100 | | | | 8,803,626 | | |
| Meredith | | | 190,000 | | | | 10,706,500 | | |
| PETsMART | | | 251,500 | | | | 7,258,290 | | |
| Ross Stores | | | 351,600 | | | | 10,301,880 | | |
| | | Number of
Shares | | Market
Value | |
| COMMON STOCK (continued) | |
| Consumer Services (continued) | |
| * Stage Stores | | | 331,550 | | | $ | 10,075,805 | | |
| * Thor Industries | | | 165,100 | | | | 7,262,749 | | |
| † Timberland Class A | | | 222,200 | | | | 7,017,076 | | |
| Tuesday Morning | | | 345,400 | | | | 5,370,970 | | |
| * Wolverine World Wide | | | 325,650 | | | | 9,287,538 | | |
| † Zale | | | 440,500 | | | | 12,426,505 | | |
| | | | | | | | 165,213,322 | | |
| Consumer Staples–2.56% | |
| American Greetings Class A | | | 316,600 | | | | 7,557,242 | | |
| Bunge Limited | | | 33,200 | | | | 2,407,332 | | |
| † Constellation Brands Class A | | | 360,600 | | | | 10,464,612 | | |
| Del Monte Foods | | | 896,600 | | | | 9,889,498 | | |
| | | | | | | | 30,318,684 | | |
| Energy–5.79% | |
| † Grey Wolf | | | 1,001,800 | | | | 6,872,348 | | |
| † Newfield Exploration | | | 293,400 | | | | 13,481,730 | | |
| Southwest Gas | | | 288,800 | | | | 11,081,256 | | |
| *† TODCO | | | 200,200 | | | | 6,840,834 | | |
| *† W-H Energy Services | | | 299,400 | | | | 14,577,786 | | |
| † Whiting Petroleum | | | 338,900 | | | | 15,792,740 | | |
| | | | | | | | 68,646,694 | | |
| Financial Services–18.72% | |
| Bank of Hawaii | | | 298,600 | | | | 16,109,470 | | |
| BankUnited Financial Class A | | | 397,400 | | | | 11,111,304 | | |
| Berkley (W.R.) | | | 456,543 | | | | 15,755,299 | | |
| * Boston Private Financial | | | 427,200 | | | | 12,051,312 | | |
| Colonial BancGroup | | | 707,400 | | | | 18,208,476 | | |
| First Midwest Bancorp | | | 194,000 | | | | 7,503,920 | | |
| First Republic Bank | | | 340,200 | | | | 13,295,016 | | |
| * Greater Bay Bancorp | | | 440,300 | | | | 11,593,099 | | |
| * Harleysville Group | | | 183,500 | | | | 6,389,470 | | |
| * Independent Bank | | | 128,900 | | | | 4,644,267 | | |
| * Infinity Property & Casualty | | | 211,900 | | | | 10,253,841 | | |
| *† KBW | | | 19,800 | | | | 581,922 | | |
| MAF Bancorp | | | 221,500 | | | | 9,898,835 | | |
| NBT Bancorp | | | 212,000 | | | | 5,408,120 | | |
| * Ohio Casualty | | | 388,600 | | | | 11,584,166 | | |
| Platinum Underwriters | | | 393,100 | | | | 12,162,514 | | |
| Protective Life | | | 203,700 | | | | 9,675,750 | | |
| Provident Bankshares | | | 344,100 | | | | 12,249,960 | | |
| StanCorp Financial | | | 219,200 | | | | 9,874,960 | | |
| Sterling Financial | | | 339,420 | | | | 11,475,790 | | |
| † Triad Guaranty | | | 218,800 | | | | 12,005,556 | | |
| | | | | | | | 221,833,047 | | |
| Health Care–6.22% | |
| Arrow International | | | 278,600 | | | | 9,856,868 | | |
| † Community Health Systems | | | 220,900 | | | | 8,067,268 | | |
| * Owens & Minor | | | 330,200 | | | | 10,325,354 | | |
| † Pediatrix Medical | | | 281,900 | | | | 13,784,910 | | |
| Service Corp International | | | 1,227,400 | | | | 12,580,850 | | |
| STERIS | | | 394,400 | | | | 9,927,048 | | |
| Universal Health Services Class B | | | 164,900 | | | | 9,140,407 | | |
| | | | | | | | 73,682,705 | | |
Small Cap Value Series- 5
Delaware VIP Small Cap Value Series
Statement of Net Assets (continued)
| | | Number of
Shares | | Market
Value | |
| COMMON STOCK (continued) | |
| Real Estate–4.58% | |
| * Ashford Hospitality Trust | | | 605,900 | | | $ | 7,543,455 | | |
| * Brandywine Realty Trust | | | 470,933 | | | | 15,658,522 | | |
| * Education Realty Trust | | | 273,000 | | | | 4,032,210 | | |
| Highland Hospitality | | | 593,100 | | | | 8,451,675 | | |
| Highwoods Properties | | | 238,500 | | | | 9,721,260 | | |
* Washington Real Estate
Investment Trust | | | 222,500 | | | | 8,900,000 | | |
| | | | | | | | 54,307,122 | | |
| Technology–14.28% | |
| Acxiom | | | 474,600 | | | | 12,173,490 | | |
| † BEA Systems | | | 939,700 | | | | 11,821,426 | | |
| † Bell Microproducts | | | 536,200 | | | | 3,780,210 | | |
| *† Brocade Communications Systems | | | 736,600 | | | | 6,047,486 | | |
| *† Checkpoint Systems | | | 392,200 | | | | 7,922,440 | | |
| *† CommScope | | | 430,000 | | | | 13,106,400 | | |
| † Compuware | | | 1,669,000 | | | | 13,902,770 | | |
| † Emulex | | | 764,700 | | | | 14,919,297 | | |
| † Entegris | | | 671,600 | | | | 7,266,712 | | |
| † Insight Enterprises | | | 337,800 | | | | 6,374,286 | | |
| † NETGEAR | | | 262,900 | | | | 6,901,125 | | |
| † Parametric Technology | | | 692,800 | | | | 12,484,256 | | |
| *† Premiere Global Services | | | 982,100 | | | | 9,271,024 | | |
| * QAD | | | 358,500 | | | | 3,007,815 | | |
| † Sybase | | | 472,200 | | | | 11,663,340 | | |
| † Synopsys | | | 457,900 | | | | 12,239,667 | | |
| Technitrol | | | 400,600 | | | | 9,570,334 | | |
| † Vishay Intertechnology | | | 499,000 | | | | 6,756,460 | | |
| | | | | | | | 169,208,538 | | |
| Transportation–3.36% | |
| Alexander & Baldwin | | | 283,800 | | | | 12,583,692 | | |
| † Kirby | | | 332,500 | | | | 11,348,225 | | |
| † Saia | | | 129,900 | | | | 3,014,979 | | |
| SkyWest | | | 291,500 | | | | 7,436,165 | | |
| † YRC Worldwide | | | 144,400 | | | | 5,448,212 | | |
| | | | | | | | 39,831,273 | | |
| Utilities–3.48% | |
| Black Hills | | | 162,600 | | | | 6,006,444 | | |
| *† El Paso Electric | | | 407,000 | | | | 9,918,590 | | |
| * FairPoint Communications | | | 335,500 | | | | 6,357,725 | | |
| * Otter Tail | | | 244,100 | | | | 7,606,156 | | |
| PNM Resources | | | 364,750 | | | | 11,343,725 | | |
| | | | | | | | 41,232,640 | | |
Total Common Stock
(cost $884,452,761) | | | | | | | 1,125,350,963 | | |
| | | Principal
Amount | | Market
Value | |
| REPURCHASE AGREEMENTS–5.14% | |
With BNP Paribas 4.80% 1/2/07
(dated 12/29/06, to be repurchased
at $23,177,355, collateralized by
$24,234,000 U.S. Treasury Bills
due 6/28/07, market value $23,651,246) | | $ | 23,165,000 | | | $ | 23,165,000 | | |
With Cantor Fitzgerald 4.82% 1/2/07
(dated 12/29/06, to be repurchased
at $27,846,906, collateralized by
$2,401,000 U.S. Treasury Notes 4.00%
due 6/15/09, market value $2,366,267,
$14,910,000 U.S. Treasury Notes 6.125%
due 8/15/07, market value $15,355,382
and $9,940,000 U.S. Treasury Notes 6.50%
due 2/15/10, market value $10,692,192) | | | 27,832,000 | | | | 27,832,000 | | |
With UBS Warburg 4.75% 1/2/07
(dated 12/29/06, to be repurchased
at $9,945,246, collateralized by
$10,267,000 U.S. Treasury Bills
due 3/29/07, market value $10,147,603) | | | 9,940,000 | | | | 9,940,000 | | |
Total Repurchase Agreements
(cost $60,937,000) | | | | | | | 60,937,000 | | |
Total Market Value of Securities
Before Securities Lending
Collateral–100.11%
(cost $945,389,761) | | | | | | | 1,186,287,963 | | |
| SECURITIES LENDING COLLATERAL**–7.36% | |
| Short-Term Investments–7.36% | |
| Fixed Rate Note–1.39% | |
Citigroup Global Markets
5.32% 1/2/07 | | | 16,505,500 | | | | 16,505,500 | | |
| | | | | | | | 16,505,500 | | |
| • Variable Rate Notes–5.97% | | | | | | | | | |
American Honda Finance
5.32% 2/21/07 | | | 2,134,445 | | | | 2,134,445 | | |
| ANZ National 5.35% 1/29/08 | | | 474,321 | | | | 474,321 | | |
| Australia New Zealand 5.35% 1/29/08 | | | 2,371,605 | | | | 2,371,605 | | |
| Bank of America 5.32% 2/23/07 | | | 3,083,087 | | | | 3,083,087 | | |
| Bank of New York 5.34% 1/29/08 | | | 1,897,284 | | | | 1,897,284 | | |
| Barclays New York 5.31% 5/18/07 | | | 3,083,087 | | | | 3,083,087 | | |
| Bayerische Landesbank 5.40% 1/29/08 | | | 2,371,605 | | | | 2,371,605 | | |
| Bear Stearns 5.41% 6/29/07 | | | 2,845,926 | | | | 2,845,926 | | |
| BNP Paribas 5.35% 1/29/08 | | | 2,371,605 | | | | 2,371,605 | | |
| Canadian Imperial Bank 5.33% 1/29/09 | | | 1,660,124 | | | | 1,660,124 | | |
| CDC Financial 5.36% 1/29/07 | | | 3,083,087 | | | | 3,083,087 | | |
| Citigroup Global Markets 5.38% 1/5/07 | | | 3,083,087 | | | | 3,083,087 | | |
| Commonwealth Bank 5.35% 1/29/08 | | | 2,371,605 | | | | 2,371,605 | | |
| Deutsche Bank 5.34% 2/23/07 | | | 2,845,926 | | | | 2,845,926 | | |
| Dexia Bank 5.33% 9/28/07 | | | 3,320,238 | | | | 3,319,758 | | |
| Goldman Sachs 5.45% 12/28/07 | | | 3,083,087 | | | | 3,083,087 | | |
| Marshall & Ilsley Bank 5.33% 1/29/08 | | | 2,608,766 | | | | 2,608,766 | | |
Merrill Lynch Mortgage Capital
5.41% 1/8/07 | | | 3,083,087 | | | | 3,083,087 | | |
| Morgan Stanley 5.49% 1/29/08 | | | 3,083,087 | | | | 3,083,087 | | |
Small Cap Value Series-6
Delaware VIP Small Cap Value Series
Statement of Net Assets (continued)
| | | Principal
Amount | | Market
Value | |
| SECURITIES LENDING COLLATERAL (continued) | |
| Short-Term Investments (continued) | |
| Variable Rate Notes (continued) | |
| National Australia Bank 5.32% 3/7/07 | | $ | 2,940,790 | | | $ | 2,940,790 | | |
| National City Bank 5.32% 3/2/07 | | | 2,846,011 | | | | 2,846,182 | | |
| National Rural Utilities 5.34% 1/29/08 | | | 3,747,136 | | | | 3,747,136 | | |
| Nordea Bank New York 5.31% 5/16/07 | | | 1,185,795 | | | | 1,185,773 | | |
| Nordea Bank Norge 5.36% 1/29/08 | | | 2,371,605 | | | | 2,371,605 | | |
| Royal Bank of Scotland 5.34% 1/29/08 | | | 2,371,605 | | | | 2,371,605 | | |
| Societe Generale 5.32% 1/29/08 | | | 1,185,803 | | | | 1,185,802 | | |
| Toronto Dominion 5.32% 5/29/07 | | | 2,845,926 | | | | 2,845,926 | | |
| Wells Fargo 5.36% 1/29/08 | | | 2,371,605 | | | | 2,371,605 | | |
| | | | | | | | 70,721,003 | | |
Total Securities Lending Collateral
(cost $87,226,503) | | | | | | | 87,226,503 | | |
| TOTAL MARKET VALUE OF SECURITIES–107.47% (cost $1,032,616,264) | | $ | 1,273,514,466 | v | |
| OBLIGATION TO RETURN SECURITIES LENDING COLLATERAL**–(7.36%) | | | (87,226,503 | ) | |
| LIABILITIES NET OF RECEIVABLES AND OTHER ASSETS–(0.11%) | | | (1,306,001 | ) | |
| NET ASSETS APPLICABLE TO 35,513,185 SHARES OUTSTANDING–100.00% | | $ | 1,184,981,962 | | |
| NET ASSET VALUE-DELAWARE VIP SMALL CAP VALUE SERIES STANDARD CLASS ($502,800,670 / 15,047,015 Shares) | | $ | 33.42 | | |
| NET ASSET VALUE-DELAWARE VIP SMALL CAP VALUE SERIES SERVICE CLASS ($682,181,292 / 20,466,170 Shares) | | $ | 33.33 | | |
| COMPONENTS OF NET ASSETS AT DECEMBER 31, 2006: | |
| Shares of beneficial interest (unlimited authorization-no par) | | $ | 844,984,406 | | |
| Undistributed net investment income | | | 4,707,941 | | |
| Accumulated net realized gain on investments | | | 94,391,647 | | |
| Net unrealized appreciation of investments and foreign currencies | | | 240,897,968 | | |
| Total net assets | | $ | 1,184,981,962 | | |
* Fully or partially on loan.
** See Note 8 in "Notes to Financial Statements."
v Includes $85,039,366 of securities loaned.
† Non-income producing security for the year ended December 31, 2006.
• Variable rate security. The interest rate shown is the rate as of December 31, 2006.
See accompanying notes
Small Cap Value Series-7
Delaware VIP Trust — Delaware VIP Small Cap Value Series
Statement of Operations
Year Ended December 31, 2006
| INVESTMENT INCOME: | |
| Dividends | | $ | 10,810,091 | | |
| Interest | | | 2,897,556 | | |
| Securities lending income | | | 235,995 | | |
| Foreign tax withheld | | | (10,043 | ) | |
| | | | 13,933,599 | | |
| EXPENSES: | |
| Management fees | | | 7,749,325 | | |
| Distribution expenses - Service Class | | | 1,812,870 | | |
| Accounting and administration expenses | | | 430,821 | | |
| Reports and statements to shareholders | | | 241,112 | | |
| Trustees' fees and benefits | | | 197,476 | | |
| Legal fees | | | 112,500 | | |
| Dividend disbursing and transfer agent fees and expenses | | | 107,705 | | |
| Audit and tax | | | 49,187 | | |
| Insurance fees | | | 39,989 | | |
| Consulting fees | | | 32,974 | | |
| Custodian fees | | | 32,140 | | |
| Registration fees | | | 12,587 | | |
| Dues and services | | | 8,349 | | |
| Trustees' expenses | | | 6,763 | | |
| Taxes (other than taxes on income) | | | 2,897 | | |
| Pricing fees | | | 1,030 | | |
| | | | 10,837,725 | | |
| Less waiver of distribution expenses - Service Class | | | (302,145 | ) | |
| Less expense paid indirectly | | | (6,538 | ) | |
| Total operating expenses | | | 10,529,042 | | |
| NET INVESTMENT INCOME | | | 3,404,557 | | |
NET REALIZED AND UNREALIZED GAIN (LOSS)
ON INVESTMENTS AND FOREIGN CURRENCIES: | |
| Net realized gain (loss) on: | |
| Investments | | | 97,476,738 | | |
| Foreign currencies | | | (404 | ) | |
| Net realized gain | | | 97,476,334 | | |
Net change in unrealized appreciation/depreciation
of investments and foreign currencies | | | 52,899,077 | | |
NET REALIZED AND UNREALIZED GAIN ON
INVESTMENTS AND FOREIGN CURRENCIES | | | 150,375,411 | | |
NET INCREASE IN NET ASSETS RESULTING
FROM OPERATIONS | | $ | 153,779,968 | | |
See accompanying notes
Delaware VIP Trust — Delaware VIP Small Cap Value Series
Statements of Changes in Net Assets
| | | Year Ended | |
| | | 12/31/06 | | 12/31/05 | |
INCREASE IN NET
ASSETS FROM OPERATIONS: | |
| Net investment income | | $ | 3,404,557 | | | $ | 2,287,107 | | |
Net realized gain on investments and
foreign currencies | | | 97,476,334 | | | | 65,405,303 | | |
Net change in unrealized appreciation/
depreciation of investments and
foreign currencies | | | 52,899,077 | | | | 7,533,798 | | |
Net increase in net assets
resulting from operations | | | 153,779,968 | | | | 75,226,208 | | |
DIVIDENDS AND DISTRIBUTIONS
TO SHAREHOLDERS FROM: | |
| Net investment income: | |
| Standard Class | | | (1,141,559 | ) | | | (1,473,097 | ) | |
| Service Class | | | (137,447 | ) | | | (662,000 | ) | |
| Net realized gain on investments: | |
| Standard Class | | | (30,306,999 | ) | | | (27,988,835 | ) | |
| Service Class | | | (37,402,855 | ) | | | (29,872,730 | ) | |
| | | | (68,988,860 | ) | | | (59,996,662 | ) | |
| CAPITAL SHARE TRANSACTIONS: | |
| Proceeds from shares sold: | |
| Standard Class | | | 156,545,638 | | | | 137,932,285 | | |
| Service Class | | | 157,234,652 | | | | 111,030,783 | | |
Net asset value of shares issued upon
reinvestment of dividends and distributions: | |
| Standard Class | | | 31,448,558 | | | | 29,461,932 | | |
| Service Class | | | 37,540,302 | | | | 30,534,730 | | |
| �� | | | 382,769,150 | | | | 308,959,730 | | |
| Cost of shares repurchased: | |
| Standard Class | | | (135,422,040 | ) | | | (98,348,749 | ) | |
| Service Class | | | (72,512,278 | ) | | | (39,373,596 | ) | |
| | | | (207,934,318 | ) | | | (137,722,345 | ) | |
Increase in net assets derived from
capital share transactions | | | 174,834,832 | | | | 171,237,385 | | |
| NET INCREASE IN NET ASSETS | | | 259,625,940 | | | | 186,466,931 | | |
| NET ASSETS: | |
| Beginning of year | | | 925,356,022 | | | | 738,889,091 | | |
End of year (including undistributed
net investment income of
$4,707,941 and $2,582,794, respectively) | | $ | 1,184,981,962 | | | $ | 925,356,022 | | |
See accompanying notes
Small Cap Value Series- 8
Delaware VIP Trust — Delaware VIP Small Cap Value Series
Financial Highlights
Selected data for each share of the Series outstanding throughout each period were as follows:
| | | VIP Small Cap Value Series Standard Class | |
| | | Year Ended | |
| | | 12/31/06 | | 12/31/05 | | 12/31/04 | | 12/31/03 | | 12/31/02 | |
| Net asset value, beginning of period | | $ | 30.830 | | | $ | 30.450 | | | $ | 25.640 | | | $ | 18.140 | | | $ | 19.530 | | |
| Income (loss) from investment operations: | |
| Net investment income1 | | | 0.146 | | | | 0.121 | | | | 0.122 | | | | 0.068 | | | | 0.101 | | |
Net realized and unrealized gain (loss) on investments
and foreign currencies | | | 4.703 | | | | 2.539 | | | | 5.270 | | | | 7.513 | | | | (1.149 | ) | |
| Total from investment operations | | | 4.849 | | | | 2.660 | | | | 5.392 | | | | 7.581 | | | | (1.048 | ) | |
| Less dividends and distributions from: | |
| Net investment income | | | (0.082 | ) | | | (0.114 | ) | | | (0.053 | ) | | | (0.081 | ) | | | (0.104 | ) | |
| Net realized gain on investments | | | (2.177 | ) | | | (2.166 | ) | | | (0.529 | ) | | | – | | | | (0.238 | ) | |
| Total dividends and distributions | | | (2.259 | ) | | | (2.280 | ) | | | (0.582 | ) | | | (0.081 | ) | | | (0.342 | ) | |
| Net asset value, end of period | | $ | 33.420 | | | $ | 30.830 | | | $ | 30.450 | | | $ | 25.640 | | | $ | 18.140 | | |
| Total return2 | | | 16.19 | % | | | 9.42 | % | | | 21.48 | % | | | 41.98 | % | | | (5.60 | %) | |
| Ratios and supplemental data: | |
| Net assets, end of period (000 omitted) | | $ | 502,801 | | | $ | 413,633 | | | $ | 339,542 | | | $ | 265,739 | | | $ | 170,630 | | |
| Ratio of expenses to average net assets | | | 0.84 | % | | | 0.85 | % | | | 0.83 | % | | | 0.86 | % | | | 0.85 | % | |
| Ratio of net investment income to average net assets | | | 0.46 | % | | | 0.41 | % | | | 0.46 | % | | | 0.32 | % | | | 0.52 | % | |
| Portfolio turnover | | | 36 | % | | | 32 | % | | | 37 | % | | | 41 | % | | | 43 | % | |
1The average shares outstanding method has been applied for per share information.
2Total investment return is based on the change in net asset value of a share during the period and assumes reinvestment of dividends and distributions at net asset value.
See accompanying notes
Small Cap Value Series- 9
Delaware VIP Small Cap Value Series
Financial Highlights (continued)
Selected data for each share of the Series outstanding throughout each period were as follows:
| | | VIP Small Cap Value Series Service Class | |
| | | Year Ended | |
| | | 12/31/06 | | 12/31/05 | | 12/31/04 | | 12/31/03 | | 12/31/02 | |
| Net asset value, beginning of period | | $ | 30.760 | | | $ | 30.390 | | | $ | 25.610 | | | $ | 18.130 | | | $ | 19.520 | | |
| Income (loss) from investment operations: | |
| Net investment income1 | | | 0.066 | | | | 0.048 | | | | 0.056 | | | | 0.020 | | | | 0.072 | | |
Net realized and unrealized gain (loss) on investments
and foreign currencies | | | 4.689 | | | | 2.536 | | | | 5.258 | | | | 7.512 | | | | (1.147 | ) | |
| Total from investment operations | | | 4.755 | | | | 2.584 | | | | 5.314 | | | | 7.532 | | | | (1.075 | ) | |
| Less dividends and distributions from: | |
| Net investment income | | | (0.008 | ) | | | (0.048 | ) | | | (0.005 | ) | | | (0.052 | ) | | | (0.077 | ) | |
| Net realized gain on investments | | | (2.177 | ) | | | (2.166 | ) | | | (0.529 | ) | | | – | | | | (0.238 | ) | |
| Total dividends and distributions | | | (2.185 | ) | | | (2.214 | ) | | | (0.534 | ) | | | (0.052 | ) | | | (0.315 | ) | |
| Net asset value, end of period | | $ | 33.330 | | | $ | 30.760 | | | $ | 30.390 | | | $ | 25.610 | | | $ | 18.130 | | |
| Total return2 | | | 15.89 | % | | | 9.15 | % | | | 21.16 | % | | | 41.66 | % | | | (5.72 | %) | |
| Ratios and supplemental data: | |
| Net assets, end of period (000 omitted) | | $ | 682,181 | | | $ | 511,723 | | | $ | 399,347 | | | $ | 248,930 | | | $ | 124,241 | | |
| Ratio of expenses to average net assets | | | 1.09 | % | | | 1.10 | % | | | 1.08 | % | | | 1.08 | % | | | 1.00 | % | |
Ratio of expenses to average net assets prior to expense
limitation and expenses paid indirectly | | | 1.14 | % | | | 1.15 | % | | | 1.13 | % | | | 1.11 | % | | | 1.00 | % | |
| Ratio of net investment income to average net assets | | | 0.21 | % | | | 0.16 | % | | | 0.21 | % | | | 0.10 | % | | | 0.37 | % | |
Ratio of net investment income to average net assets prior
to expense limitation and expenses paid indirectly | | | 0.16 | % | | | 0.11 | % | | | 0.16 | % | | | 0.07 | % | | | 0.37 | % | |
| Portfolio turnover | | | 36 | % | | | 32 | % | | | 37 | % | | | 41 | % | | | 43 | % | |
1The average shares outstanding method has been applied for per share information.
2Total investment return is based on the change in net asset value of a share during the period and assumes reinvestment of dividends and distributions at net asset value. Total investment return reflects waivers and payment of fees by the distributor, as applicable. Performance would have been lower had the expense limitation and waiver not been in effect.
See accompanying notes
Small Cap Value Series- 10
Delaware VIP Trust — Delaware VIP Small Cap Value Series
Notes to Financial Statements
December 31, 2006
Delaware VIP Trust (the "Trust") is organized as a Delaware statutory trust and offers 15 series: Delaware VIP Balanced Series, Delaware VIP Capital Reserves Series, Delaware VIP Cash Reserve Series, Delaware VIP Diversified Income Series, Delaware VIP Emerging Markets Series, Delaware VIP Global Bond Series, Delaware VIP Growth Opportunities Series, Delaware VIP High Yield Series, Delaware VIP International Value Equity Series, Delaware VIP REIT Series, Delaware VIP Select Growth Series, Delaware VIP Small Cap Value Series, Delaware VIP Trend Series, Delaware VIP U.S. Growth Series and Delaware VIP Value Series. These financial statements and the related notes pertain to Delaware VIP Small Cap Value Series (the "Series"). The Trust is an open-end investment company. The Series is considered diversified under the Investment Company Act of 1940, as amended, and offers Standard Class and Service Class shares. The Standard Class shares do not c arry a 12b-1 fee and the Service Class shares carry a 12b-1 fee. The shares of the Series are sold only to separate accounts of life insurance companies.
The investment objective of the Series is to seek capital appreciation.
1. Significant Accounting Policies
The following accounting policies are in accordance with U.S. generally accepted accounting principles and are consistently followed by the Series.
Security Valuation—Equity securities, except those traded on the Nasdaq Stock Market, Inc. (Nasdaq) are valued at the last quoted sales price as of the time of the regular close of the New York Stock Exchange (NYSE) on the valuation date. Securities traded on the Nasdaq are valued in accordance with the Nasdaq Official Closing Price, which may not be the last sales price. If on a particular day an equity security does not trade, then the mean between the bid and asked prices will be used. Short-term debt securities having less than 60 days to maturity are valued at amortized cost, which approximates market value. Securities lending collateral is valued at amortized cost, which approximates market value. Other securities and assets for which market quotations are not readily available are valued at fair value as determined in good faith under the direction of the Series' Board of Trustees. In determining whether market quotations are readily available or fair valuation will be used, various factors will be taken into consideration, such as market closures, or with respect to foreign securities, aftermarket trading, or significant events after local market trading (e.g., government actions or pronouncements, trading volume or volatility on markets, exchanges among dealers, or news events).
In September 2006, the Financial Accounting Standards Board (FASB) issued FASB Statement No. 157 "Fair Value Measurements" (Statement 157). Statement 157 establishes a framework for measuring fair value in generally accepted accounting principles, clarifies the definition of fair value within that framework, and expands disclosures about the use of fair value measurements. Statement 157 is intended to increase consistency and comparability among fair value estimates used in financial reporting. Statement 157 is effective for fiscal years beginning after November 15, 2007. Management does not expect the adoption of Statement 157 to have an impact on the amounts reported in the financial statements.
Federal Income Taxes—The Series intends to continue to qualify for federal income tax purposes as a regulated investment company and make the requisite distributions to shareholders. Accordingly, no provision for federal income taxes has been made in the financial statements.
On July 13, 2006, FASB released FASB Interpretation No. 48 "Accounting for Uncertainty in Income Taxes" (FIN 48). FIN 48 provides guidance for how uncertain tax positions should be recognized, measured, presented and disclosed in the financial statements. FIN 48 requires the evaluation of tax positions taken or expected to be taken in the course of preparing the Series' tax returns to determine whether the tax positions are "more-likely-than-not" of being sustained by the applicable tax authority. Tax positions not deemed to meet the more-likely-than-not threshold would be recorded as a tax benefit or expense in the current year. Adoption of FIN 48 is required for fiscal years beginning after December 15, 2006 and is to be applied to all open tax years as of the effective date. Recent SEC guidance allows implementing FIN 48 in Series net asset value calculations as late as the Series' last net asset value calculation in the first required fi nancial statement reporting period. As a result, the Series will incorporate FIN 48 in its semiannual report on June 30,2007. Although the Series' tax positions are currently being evaluated, management does not expect the adoption of FIN 48 to have a material impact on the Series' financial statements.
Class Accounting—Investment income, common expenses and realized and unrealized gain (loss) on investments are allocated to the classes of the Series on the basis of daily net assets of each class. Distribution expenses relating to a specific class are charged directly to that class.
Repurchase Agreements—The Series may invest in a pooled cash account along with other members of the Delaware Investments® Family of Funds pursuant to an exemptive order issued by the Securities and Exchange Commission. The aggregate daily balance of the pooled cash account is invested in repurchase agreements secured by obligations of the U.S. government. The respective collateral is held by the Series' custodian bank until the maturity of the respective repurchase agreements. Each repurchase agreement is at least 102% collateralized. However, in the event of default or bankruptcy by the counterparty to the agreement, realization of the collateral may be subject to legal proceedings.
Use of Estimates—The preparation of financial statements in conformity with U.S. generally accepted accounting principles requires management to make estimates and assumptions that affect the reported amounts of assets and liabilities at the date of the financial statements and the reported amounts of revenues and expenses during the reporting period. Actual results could differ from those estimates.
Other—Expenses directly attributable to the Series are charged directly to the Series. Other expenses common to various funds within the Delaware Investments® Family of Funds are generally allocated amongst such funds on the basis of average net assets. Management fees and some other expenses are paid monthly. Security transactions are recorded on the date the securities are purchased or sold (trade date) for financial reporting purposes. Costs used in calculating realized gains and losses on the sale of investment securities are those of the specific securities sold. Dividend income is recorded on the ex-dividend date and interest income is recorded on the accrual basis. Distributions received from investments in Real Estate Investment Trusts are recorded as dividend income on ex-dividend date, subject to reclassification upon notice of the ch aracter of such distribution by the issuer.
Small Cap Value Series- 11
Delaware VIP Small Cap Value Series
Notes to Financial Statements (continued)
1. Significant Accounting Policies (continued)
The Series declares and pays dividends from net investment income and distributions from net realized gain on investments, if any, following the close of the fiscal year.
Subject to seeking best execution, the Series may direct certain security trades to brokers who have agreed to rebate a portion of the related brokerage commission to the Series in cash. Such commission rebates are included in realized gain on investments in the accompanying financial statements and totaled $35,474 for the year ended December 31, 2006. In general, best execution refers to many factors, including the price paid or received for a security, the commission charged, the promptness and reliability of execution, the confidentiality and placement accorded the order, and other factors affecting the overall benefit obtained by the Series on the transaction.
The Series receives earnings credits from its custodian when positive cash balances are maintained, which are used to offset custody fees. The expense paid under this arrangement is included in custodian fees on the Statement of Operations with the corresponding expense offset shown as "expense paid indirectly."
2. Investment Management, Administration Agreements and Other Transactions with Affiliates
In accordance with the terms of its investment management agreement, the Series pays Delaware Management Company (DMC), a series of Delaware Management Business Trust and the investment manager, an annual fee which is calculated daily at the rate of 0.75% on the first $500 million of average daily net assets of the Series, 0.70% on the next $500 million, 0.65% on the next $1.5 billion, and 0.60% on average daily net assets in excess of $2.5 billion.
DMC has contractually agreed to waive that portion, if any, of its management fee and reimburse the Series to the extent necessary to ensure that annual operating expenses, exclusive of taxes, interest, brokerage commissions, distribution fees, certain insurance costs and extraordinary expenses, do not exceed 1.03% of average daily net assets of the Series through April 30, 2007. Prior to May 1, 2006 the expense limitation was 0.95% of average daily net assets. No reimbursement was due for the year ended December 31, 2006.
Delaware Service Company, Inc. (DSC), an affiliate of DMC, provides accounting, administration, dividend disbursing and transfer agent services. The Series pays DSC a monthly fee computed at the annual rate of 0.04% of the Series' average daily net assets for accounting and administrative services. The Series pays DSC a monthly fee based on average net assets for dividend disbursing and transfer agent services.
Pursuant to a distribution agreement and distribution plan, the Series pays Delaware Distributors, L.P. (DDLP), the distributor and an affiliate of DMC, an annual distribution and service fee not to exceed 0.30% of the average daily net assets of the Service Class shares. DDLP has contracted to waive distribution and service fees through April 30, 2007 in order to prevent distribution and service fees of the Service Class shares from exceeding 0.25% of average daily net assets. Standard Class shares pay no distribution and service expenses.
At December 31, 2006, the Series had liabilities payable to affiliates as follows:
Investment
Management
Fee Payable to
DMC | | Dividend Disbursing,
Transfer Agent, Accounting
and Administration
and Other Expenses
Payable to DSC | |
Distribution
Fees Payable
to DDLP | | Other
Expenses
Payable
to DMC
and Affiliates* | |
| $ | 719,176 | | | $ | 56,087 | | | $ | 144,847 | | | $ | 94,713 | | |
*DMC, as part of its administrative services, pays operating expenses on behalf of the Series and is reimbursed on a periodic basis. Such expenses include items such as printing of shareholder reports, fees for audit, legal and tax services, custodian fees and trustees' fees.
As provided in the investment management agreement, the Series bears the cost of certain legal and tax services, including internal legal and tax services provided to the Series by DMC and/or its affiliates' employees. For the year ended December 31, 2006, the Series was charged $51,720 for internal legal and tax services provided by DMC and/or its affiliates' employees.
Trustees' fees and benefits include expenses accrued by the Series for each Trustee's retainer, per meeting fees and retirement benefits. Independent Trustees with over five years of uninterrupted service are eligible to participate in a retirement plan that provides for the payment of benefits upon retirement. The amount of the retirement benefit is based on factors set forth in the plan, including the number of years of service. On November 16, 2006, the Board of Trustees unanimously voted to terminate the retirement plan. Payments equal to the net present value of the earned benefits will be made in 2007 to those independent trustees so entitled. The retirement benefit payout for the Series is $138,000. Certain officers of DMC, DSC and DDLP are officers and/or trustees of the Trust. These officers and trustees are paid no compensation by the Series.
3. Investments
For the year ended December 31, 2006, the Series made purchases and sales of investment securities other than short-term investments as follows:
| Purchases | | $ | 461,224,943 | | |
| Sales | | | 370,943,426 | | |
Small Cap Value Series-12
Delaware VIP Small Cap Value Series
Notes to Financial Statements (continued)
3. Investments (continued)
At December 31, 2006, the cost of investments for federal income tax purposes and unrealized appreciation (depreciation) for the Series were as follows:
Cost of
Investments | | Aggregate
Unrealized
Appreciation | | Aggregate
Unrealized
Depreciation | | Net
Unrealized
Appreciation | |
| $ | 1,033,039,430 | | | $ | 259,389,346 | | | $ | (18,914,310 | ) | | $ | 240,475,036 | | |
4. Dividend and Distribution Information
Income and long-term capital gain distributions are determined in accordance with federal income tax regulations, which may differ from U.S. generally accepted accounting principles. Additionally, gains (losses) on foreign currency transactions and net short-term gains on sales of investment securities are treated as ordinary income for federal income tax purposes. The tax character of dividends and distributions paid during the years ended December 31, 2006 and 2005 was as follows:
| | | Year
Ended
12/31/06 | | Year
Ended
12/31/05 | |
| Ordinary income | | $ | 20,780,190 | | | $ | 19,979,753 | | |
| Long term capital gain | | | 48,208,670 | | | | 40,016,909 | | |
| Total | | $ | 68,988,860 | | | $ | 59,996,662 | | |
5. Components of Net Assets on a Tax Basis
As of December 31, 2006, the components of net assets on a tax basis were as follows:
| Shares of beneficial interest | | $ | 844,984,406 | | |
| Undistributed ordinary income | | | 20,870,270 | | |
| Undistributed long-term capital gain | | | 78,652,484 | | |
| Unrealized appreciation of investments and foreign currencies | | | 240,474,802 | | |
| Net assets | | $ | 1,184,981,962 | | |
The differences between book basis and tax basis components of net assets are primarily attributable to tax deferral of losses on wash sales.
For financial reporting purposes, capital accounts are adjusted to reflect the tax character of permanent book/tax differences. Reclassifications are primarily due to tax treatment of gain (loss) on foreign currency transactions. Results of operations and net assets were not affected by these reclassifications. For the year ended December 31, 2006, the Series recorded the following reclassifications:
Undistributed
Net
Investment Income | | Accumulated
Net
Realized Gain (Loss) | |
| $ | (404 | ) | | $ | 404 | | |
Small Cap Value Series-13
Delaware VIP Small Cap Value Series
Notes to Financial Statements (continued)
6. Capital Shares
Transactions in capital shares were as follows:
| | | Year
Ended
12/31/06 | | Year
Ended
12/31/05 | |
| Shares sold: | |
| Standard Class | | | 4,980,616 | | | | 4,608,864 | | |
| Service Class | | | 4,932,974 | | | | 3,758,275 | | |
Shares issued upon reinvestment of dividends
and distributions: | |
| Standard Class | | | 999,954 | | | | 1,042,531 | | |
| Service Class | | | 1,194,030 | | | | 1,080,493 | | |
| | | | 12,107,574 | | | | 10,490,163 | | |
| Shares repurchased: | |
| Standard Class | | | (4,349,582 | ) | | | (3,386,928 | ) | |
| Service Class | | | (2,294,511 | ) | | | (1,345,123 | ) | |
| | | | (6,644,093 | ) | | | (4,732,051 | ) | |
| Net increase | | | 5,463,481 | | | | 5,758,112 | | |
7. Line of Credit
The Series, along with certain other funds in the Delaware Investments® Family of Funds (the "Participants"), participates in a $225,000,000 revolving line of credit facility to be used for temporary or emergency purposes as an additional source of liquidity to fund redemptions of investor shares. The Participants are charged an annual commitment fee, which is allocated across the Participants on the basis of each Participant's allocation of the entire facility. The Participants may borrow up to a maximum of one third of their net assets under the agreement. The Series had no amounts outstanding as of December 31, 2006 or at any time during the year then ended.
8. Securities Lending
The Series, along with other funds in the Delaware Investments® Family of Funds, may lend its securities pursuant to a security lending agreement (Lending Agreement) with JPMorgan Chase. Initial security loans made pursuant to the Lending Agreement are required to be secured by U.S. government obligations and/or cash collateral not less than 102% of the market value of the securities issued in the United States and 105% of the market value of securities issued outside the United States. With respect to each loan, if the aggregate market value of the collateral held on any business day is less than the aggregate market value of the securities which are the subject of such loan, the borrower will be notified to provide additional collateral not less than the applicable collateral requirements. Cash collateral received is invested in fixed income securities, with a weighted average maturity not to exceed 90 days, rated in one of the top two tiers by Standard & Poor's Ratings Group or Moody's Investors Service, Inc. or repurchase agreements collateralized by such securities. However, in the event of default or bankruptcy by the lending agent, realization and/or retention of the collateral may be subject to legal proceedings. In the event the borrower fails to return loaned securities and the collateral received is insufficient to cover the value of the loaned securities and provided such collateral shortfall is not the result of investment losses, the lending agent has agreed to pay the amount of the shortfall to the Series, or at the discretion of the lending agent, replace the loaned securities. The Series continues to record dividends on the securities loaned and is subject to change in value of the securities loaned that may occur during the term of the loan. The Series has the right under the Lending Agreement to recover the securities from the borrower on demand. The security lending agent and the borrower retain a portion of the earnings from the collateral investments. The Series records security lending income net of such allocation.
At December 31, 2006, the market value of securities on loan was $85,039,366, for which cash collateral was received and invested in accordance with the Lending Agreement. Such investments are presented on the Statement of Net Assets under the caption "Securities Lending Collateral."
9. Credit and Market Risk
The Series invests a significant portion of its assets in small companies and may be subject to certain risks associated with ownership of securities of such companies. Investments in small-sized companies may be more volatile than investments in larger companies for a number of reasons, which include limited financial resources or a dependence on narrow product lines.
The Series may invest up to 10% of its total assets in illiquid securities, which may include securities with contractual restrictions on resale, securities exempt from registration under Rule 144A of the Securities Act of 1933, as amended, and other securities which may not be readily marketable. The relative illiquidity of these securities may impair the Series from disposing of them in a timely manner and at a fair price when it is necessary or desirable to do so. While maintaining oversight, the Series' Board of Trustees has delegated to DMC the day-to-day functions of determining whether individual securities are liquid for purposes of the Series' limitation on investments in illiquid assets. At December 31, 2006, there were no Rule 144A securities and no securities have been determined to be illiquid under the Series' Liquidity Procedures.
Small Cap Value Series-14
Delaware VIP Small Cap Value Series
Notes to Financial Statements (continued)
10. Contractual Obligations
The Series enters into contracts in the normal course of business that contain a variety of indemnifications. The Series' maximum exposure under these arrangements is unknown. However, the Series has not had prior claims or losses pursuant to these contracts. Management has reviewed the Series' existing contracts and expects the risk of loss to be remote.
11. Tax Information (Unaudited)
For the fiscal year ended December 31, 2006, the Series designates dividends and distributions paid during the year as follows:
(A)
Long-Term
Capital Gain
Distributions
(Tax Basis) | | (B)
Ordinary
Income
Distributions
(Tax Basis) | | Total
Distributions
(Tax Basis) | | (C)
Qualifying
Dividends1 | |
| | 70 | % | | | 30 | % | | | 100 | % | | | 45 | % | |
(A) and (B) are based on a percentage of the Series' total distributions.
(C) is based on a percentage of the Series' ordinary income distributions.
1 Qualifying dividends represent dividends which qualify for the corporate dividends received deduction.
Small Cap Value Series- 15
Delaware VIP Trust — Delaware VIP Small Cap Value Series
Report of Independent Registered Public Accounting Firm
To the Shareholders and Board of Trustees
Delaware VIP Trust–Delaware VIP Small Cap Value Series
We have audited the accompanying statement of net assets of the Delaware VIP Small Cap Value Series (one of the series constituting Delaware VIP Trust) (the "Series") as of December 31, 2006, and the related statement of operations for the year then ended, the statements of changes in net assets for each of the two years in the period then ended, and the financial highlights for each of the five years in the period then ended. These financial statements and financial highlights are the responsibility of the Series' management. Our responsibility is to express an opinion on these financial statements and financial highlights based on our audits.
We conducted our audits in accordance with the standards of the Public Company Accounting Oversight Board (United States). Those standards require that we plan and perform the audit to obtain reasonable assurance about whether the financial statements and financial highlights are free of material misstatement. We were not engaged to perform an audit of the Series' internal control over financial reporting. Our audits included consideration of internal control over financial reporting as a basis for designing audit procedures that are appropriate in the circumstances, but not for the purpose of expressing an opinion on the effectiveness of the Series' internal control over financial reporting. Accordingly, we express no such opinion. An audit also includes examining, on a test basis, evidence supporting the amounts and disclosures in the financial statements and financial highlights, assessing the accounting principles used and significant es timates made by management, and evaluating the overall financial statement presentation. Our procedures included confirmation of securities owned as of December 31, 2006, by correspondence with the custodian and brokers or by other appropriate auditing procedures where replies from brokers were not received. We believe that our audits provide a reasonable basis for our opinion.
In our opinion, the financial statements and financial highlights referred to above present fairly, in all material respects, the financial position of the Delaware VIP Small Cap Value Series of Delaware VIP Trust at December 31, 2006, the results of its operations for the year then ended, the changes in its net assets for each of the two years in the period then ended, and its financial highlights for each of the five years in the period then ended, in conformity with U.S. generally accepted accounting principles.

Philadelphia, Pennsylvania
February 14, 2007
The Series files its complete schedule of portfolio holdings with the Securities and Exchange Commission for the first and third quarters of each fiscal year on Form N-Q. The Series' Forms N-Q, as well as a description of the policies and procedures that the Series uses to determine how to vote proxies (if any) relating to portfolio securities is available without charge (i) upon request, by calling 800-523-1918; (ii) on the Series' website at http://www.delawareinvestments.com; and (iii) on the Commission's website at http://www.sec.gov. The Series' Forms N-Q may be reviewed and copied at the Commission's Public Reference Room in Washington, DC; information on the operation of the Public Reference Room may be obtained by calling 1-800-SEC-0330.
Information (if any) regarding how the Series voted proxies relating to portfolio securities during the most recently disclosed 12-month period ended June 30 is available without charge (i) through the Series' website at http://www.delawareinvestments.com; and (ii) on the Commission's website at http://www.sec.gov.
Small Cap Value Series- 16
Delaware Investments® Family of Funds
board of trustees/directors and officers addendum
A mutual fund is governed by a Board of Trustees/Directors ("Trustees"), which has oversight responsibility for the management of a fund's business affairs. Trustees establish procedures and oversee and review the performance of the investment manager, the distributor, and others who perform services for the fund. The independent fund trustees, in particular, are advocates for shareholder interests. Each trustee has served in that capacity since he or she was elected to or appointed to the Board of Trustees, and will continue to serve until his or her retirement or the election of a new trustee in his or her place. The following is a list of the Trustees and Officers with certain background and related information.
Name,
Address,
and Birth Date | | Position(s)
Held with
Fund(s) | | Length of Time
Served | | Principal
Occupation(s)
During
Past 5 Years | | Number of
Portfolios in Fund
Complex Overseen
by Trustee
or Officer | | Other
Directorships
Held by
Trustee
or Officer | |
| interested trustees | | | | | | | | | | | | | |
|
Patrick P. Coyne1
2005 Market Street
Philadelphia, PA
19103
April 14, 1963 | | Chairman,
President,
Chief Executive
Officer, and
Trustee | | Chairman and Trustee
since August 16, 2006
President and
Chief Executive Officer
since August 1, 2006 | | Patrick P. Coyne has served in
various executive capacities
at different times at
Delaware Investments.2 | | | 84 | | | None | |
|
| independent trustees | | | | | | | | | | | | | |
|
Thomas L. Bennett
2005 Market Street
Philadelphia, PA
19103
October 4, 1947 | | Trustee | | Since
March 2005 | | Private Investor –
(March 2004 – Present)
Investment Manager –
Morgan Stanley & Co.
(January 1984 – March 2004) | | | 84 | | | None | |
|
John A. Fry
2005 Market Street
Philadelphia, PA
19103
May 28, 1960 | | Trustee | | Since
January 2001 | | President –
Franklin & Marshall College
(June 2002 – Present)
Executive Vice President –
University of Pennsylvania
(April 1995 – June 2002) | | | 84 | | | Director –
Community Health
Systems
Director –
Allied Barton
Security Holdings | |
|
Anthony D. Knerr
2005 Market Street
Philadelphia, PA
19103
December 7, 1938 | | Trustee | | Since
April 1990 | | Founder and Managing Director –
Anthony Knerr & Associates
(Strategic Consulting)
(1990 – Present) | | | 84 | | | None | |
|
Lucinda S. Landreth
2005 Market Street
Philadelphia, PA
19103
June 24, 1947 | | Trustee | | Since
March 2005 | | Chief Investment Officer –
Assurant, Inc.
(Insurance)
(2002 – 2004) | | | 84 | | | None | |
|
Ann R. Leven
2005 Market Street
Philadelphia, PA
19103
November 1, 1940 | | Trustee | | Since
September 1989 | | Consultant –
ARL Associates
(Financial Planning)
(1983 – Present) | | | 84 | | | Director and
Audit Committee
Chairperson – Andy
Warhol Foundation
Director and Audit
Committee Member –
Systemax, Inc. | |
|
Small Cap Value Series- 17
Name,
Address,
and Birth Date | | Position(s)
Held with
Fund(s) | | Length of Time
Served | | Principal
Occupation(s)
During
Past 5 Years | | Number of
Portfolios in Fund
Complex Overseen
by Trustee
or Officer | | Other
Directorships
Held by
Trustee
or Officer | |
| independent trustees (continued) | | | | | | | | | | | | | |
|
Thomas F. Madison
2005 Market Street
Philadelphia, PA
19103
February 25, 1936 | | Trustee | | Since
May 1997 | | President and Chief
Executive Officer –
MLM Partners, Inc.
(Small Business Investing
and Consulting)
(January 1993 – Present) | | | 84 | | | Director –
Banner Health
Director –
CenterPoint Energy
Director and Audit
Committee Member –
Digital River, Inc.
Director and Audit
Committee Member –
Rimage
Corporation
Director – Valmont
Industries, Inc. | |
|
Janet L. Yeomans
2005 Market Street
Philadelphia, PA
19103
July 31, 1948 | | Trustee | | Since
April 1999 | | Vice President
(January 2003 – Present)
and Treasurer
(January 2006 – Present)
3M Corporation
Ms. Yeomans has held
various management positions
at 3M Corporation since 1983. | | | 84 | | | None | |
|
J. Richard Zecher
2005 Market Street
Philadelphia, PA
19103
July 3, 1940 | | Trustee | | Since
March 2005 | | Founder –
Investor Analytics
(Risk Management)
(May 1999 – Present)
Founder –
Sutton Asset Management
(Hedge Fund)
(September 1998 – Present) | | | 84 | | | Director and Audit
Committee Member –
Investor Analytics
Director and Audit
Committee Member –
Oxigene, Inc. | |
|
| officers | | | | | | | | | | | | | |
|
David F. Connor
2005 Market Street
Philadelphia, PA
19103
December 2, 1963 | | Vice President,
Deputy General
Counsel, and Secretary | | Vice President since
September 21, 2000
and Secretary
since
October 2005 | | David F. Connor has served as
Vice President and Deputy
General Counsel of
Delaware Investments
since 2000. | | | 84 | | | None3 | |
|
David P. O'Connor
2005 Market Street
Philadelphia, PA
19103
February 21, 1966 | | Senior Vice
President,
General Counsel,
and Chief
Legal Officer | | Senior Vice President,
General Counsel, and
Chief Legal Officer
since
October 2005 | | David P. O'Connor has served in
various executive and legal
capacities at different times at
Delaware Investments. | | | 84 | | | None3 | |
|
John J. O'Connor
2005 Market Street
Philadelphia, PA
19103
June 16, 1957 | | Senior Vice President
and Treasurer | | Treasurer
since
February 2005 | | John J. O'Connor has served in
various executive capacities
at different times at
Delaware Investments. | | | 84 | | | None3 | |
|
Richard Salus
2005 Market Street
Philadelphia, PA
19103
October 4, 1963 | | Senior
Vice President
and
Chief Financial
Officer | | Chief Financial
Officer since
November 1, 2006 | | Richard Salus has served in
various executive capacities
at different times at
Delaware Investments. | | | 84 | | | None3 | |
|
1 Patrick P. Coyne is considered to be an "Interested Trustee" because he is an executive officer of the Fund's(s') investment advisor.
2 Delaware Investments is the marketing name for Delaware Management Holdings, Inc. and its subsidiaries, including the Fund's(s') investment advisor, principal underwriter, and its transfer agent.
3 David F. Connor, David P. O'Connor, John J. O'Connor, and Richard Salus serve in similar capacities for the six portfolios of the Optimum Fund Trust, which have the same investment advisor, principal underwriter, and transfer agent as the registrant. John J. O'Connor also serves in a similar capacity for Lincoln Variable Insurance Products Trust, which has the same investment advisor as the registrant.
The Statement of Additional Information for the Fund(s) includes additional information about the Trustees and Officers and is available, without charge, upon request by calling 800 523-1918.
Small Cap Value Series- 18
Delaware VIP Trust — Delaware VIP Trend Series
For the 12-month period, the Delaware VIP Trend Series had positive returns of 7.59% for Standard Class shares and 7.34% for Service Class shares (both reflect all distributions reinvested). The benchmark, the Russell 2000 Growth Index, gained 13.35% (source: Lipper).
In general, value stocks strongly outperformed growth stocks, a disparity that reflected, in part, almost indiscriminate risk aversion by investors from late April to early August due to fears about inflation and rising interest rates. The attendant disconnect between price action and fundamentals hit smaller-cap growth stocks hard, and sectors and industries where we had a significant portion of the portfolio positioned — technology, biotech and medical tech, and consumer-related industries — were further punished.
This severe investor pessimism eventually gave way in August, as commodity prices dropped and the Federal Reserve finally paused its two-plus-year regimen of successive rate hikes. Large-cap stocks were the initial beneficiaries, followed in the fourth quarter by a rally in small-cap stocks.
For the year, the Series received a strong contribution from its consumer non-durables holdings. Specialty retailer/apparel manufacturers Under Armour, Crocs, and DSW were up 79%, 57%, and 47%, respectively, on continued strong growth driven by resurgent consumer spending. Stock selection in the business services and basic industry sectors also added value.
Unfortunately, these positive contributions were offset by the adverse impact of some problematic holdings in the Series' technology and healthcare holdings. FDA rejection of Neurocrine Bioscience's insomnia drug caught investors completely by surprise, sending the stock down considerably and providing evidence of an increasingly cautious FDA with respect to new drug approval. The Series holdings in Neurocrine Bioscience were sold before Dec. 31, 2006.
Nervousness in the technology sector was exacerbated by the SEC investigation into past options-granting practices. Some technology holdings were adversely affected by these events, though many later rebounded. Overall, sector selection for the year moderately hindered performance, primarily due to underweights in energy and basic industry.
The views expressed are current as of the date of this report and are subject to change.
The performance data quoted below and on the next page represent past performance; past performance does not guarantee future results. Investment return and principal value of an investment will fluctuate so that your shares, when redeemed, may be worth more or less than their original cost. Current performance may be lower or higher than the performance data quoted. Please obtain the performance data for the most recent month end by calling the number noted on the page related to this Series in the introductory section of this report.
You should consider the investment objectives, risks, charges, and expenses of the investment carefully before investing. The Delaware VIP Trend Series prospectus contains this and other important information about the Series. To obtain a prospectus, contact the company noted on the page related to this Series in the introductory section of this report, either by phone or through the company Web site. We advise you to read the prospectus carefully before you invest.
Delaware VIP Trend Series
Average Annual Total Returns
For the periods ending Dec. 31, 2006 | | 1 Year | | 5 Years | | 10 Years | | Lifetime | |
| Standard Class Shares* | | | +7.59 | % | | | +6.77 | % | | | +10.13 | % | | | +11.50 | % | |
| Service Class Shares** | | | +7.34 | % | | | +6.53 | % | | | NA | | | | -0.31 | % | |
* Commenced operations on Dec. 27, 1993
** Commenced operations on May 1, 2000
Trend Series- 1
Delaware VIP Trust — Delaware VIP Trend Series (continued)
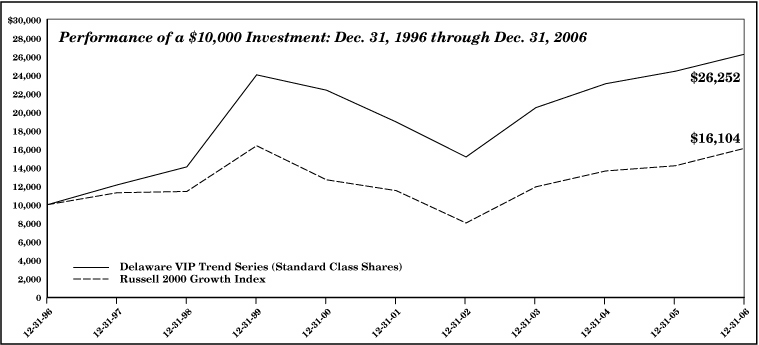
The chart shows a $10,000 investment in the Delaware VIP Trend Series Standard Class shares for the period from Dec. 31, 1996 through Dec. 31, 2006. All distributions were reinvested. The chart also shows $10,000 invested in the Russell 2000 Growth Index for the period from Dec. 31, 1996 through Dec. 31, 2006.
Russell 2000 Growth Index measures the performance of those Russell 2000 companies with higher price-to-book ratios and higher forecasted growth values. An index is unmanaged and does not reflect the costs of operating a mutual fund, such as the costs of buying, selling, and holding securities. You cannot invest directly in an index.
Earnings from a variable annuity or variable life investment compound tax free until withdrawal, so no adjustments were made for income taxes.
An expense limitation was in effect for the Delaware VIP Trend Series during the periods shown.
Performance of Service Class shares will vary due to different charges and expenses.
Performance does not reflect insurance fees related to a variable annuity or variable life investment or the deferred sales charge that would apply to certain withdrawals of investments held for fewer than eight years. Performance shown here would have been reduced if such fees were included and the expense limitation was removed. For more information about fees, consult your variable annuity or variable life prospectus.
Investments in variable products involve risk. Series that invest in small and/or medium-sized companies typically involve greater risk, particularly in the short term, than those investing in larger, more established companies. Some portfolios offer more risk than others. Please read both the contract and underlying prospectus for specific details regarding the product's risk profile.
Trend Series- 2
Delaware VIP Trust — Delaware VIP Trend Series
Disclosure of Series Expenses
For the Period July 1, 2006 to December 31, 2006
As a shareholder of the Series, you incur ongoing costs, including management fees; distribution and/or service (12b-1) fees; and other Series expenses. This Example is intended to help you understand your ongoing costs (in dollars) of investing in the Series and to compare these costs with the ongoing costs of investing in other mutual funds.
The Example is based on an investment of $1,000 invested at the beginning of the period and held for the entire period from July 1, 2006 to December 31, 2006.
Actual Expenses
The first section of the table shown, "Actual Series Return," provides information about actual account values and actual expenses. You may use the information in this section of the table, together with the amount you invested, to estimate the expenses that you paid over the period. Simply divide your account value by $1,000 (for example, an $8,600 account value divided by $1,000 = 8.6), then multiply the result by the number in the first section under the heading entitled "Expenses Paid During Period" to estimate the expenses you paid on your account during the period.
Hypothetical Example for Comparison Purposes
The second section of the table shown, "Hypothetical 5% Return," provides information about hypothetical account values and hypothetical expenses based on the Series' actual expense ratio and an assumed rate of return of 5% per year before expenses, which is not the Series' actual return. The hypothetical account values and expenses may not be used to estimate the actual ending account balance or expenses you paid for the period. You may use this information to compare the ongoing costs of investing in the Series and other funds. To do so, compare the 5% hypothetical example with the 5% hypothetical examples that appear in the shareholder reports of other funds.
Please note that the expenses shown in the table are meant to highlight your ongoing costs only. As a shareholder of the Series, you do not incur any transaction costs, such as sales charges (loads), redemption fees or exchange fees, but shareholders of other funds may incur such costs. Also, the fees related to the variable annuity investment or the deferred sales charge that could apply have not been included. Therefore, the second section of the table is useful in comparing ongoing costs only, and will not help you determine the relative total costs of owning different funds. The Series' actual expenses shown in the table reflect fee waivers in effect for Service Class shares. The expenses shown in the table assume reinvestment of all dividends and distributions.
Expense Analysis of an Investment of $1,000
| | | Beginning
Account
Value
7/1/06 | | Ending
Account
Value
12/31/06 | | Annualized
Expense
Ratios | | Expenses
Paid During
Period
7/1/06 to
12/31/06* | |
| Actual Series Return | |
| Standard Class | | $ | 1,000.00 | | | $ | 1,064.80 | | | | 0.89 | % | | $ | 4.63 | | |
| Service Class | | | 1,000.00 | | | | 1,063.50 | | | | 1.14 | % | | | 5.93 | | |
| Hypothetical 5% Return (5% return before expenses) | |
| Standard Class | | $ | 1,000.00 | | | $ | 1,020.72 | | | | 0.89 | % | | $ | 4.53 | | |
| Service Class | | | 1,000.00 | | | | 1,019.46 | | | | 1.14 | % | | | 5.80 | | |
*"Expenses Paid During Period" are equal to the Series' annualized expense ratio, multiplied by the average account value over the period, multiplied by 184/365 (to reflect the one-half year period).
Trend Series- 3
Delaware VIP Trust — Delaware VIP Trend Series
Sector Allocation and Top 10 Holdings
As of December 31, 2006
Sector designations may be different than the sector designations presented in other Series materials.
| Sector | | Percentage
of Net Assets | |
| Common Stockw | | | 98.43 | % | |
| Basic Industry/Capital Goods | | | 9.59 | % | |
| Business Services | | | 4.87 | % | |
| Consumer Durables | | | 1.18 | % | |
| Consumer Non-Durables | | | 13.02 | % | |
| Consumer Services | | | 4.48 | % | |
| Energy | | | 5.32 | % | |
| Financials | | | 9.91 | % | |
| Health Care | | | 19.95 | % | |
| Technology | | | 27.37 | % | |
| Transportation | | | 2.74 | % | |
| Repurchase Agreements | | | 1.64 | % | |
| Securities Lending Collateral | | | 24.47 | % | |
| Fixed Rate Note | | | 4.63 | % | |
| Variable Rate Notes | | | 19.84 | % | |
| Total Market Value of Securities | | | 124.54 | % | |
| Obligation to Return Securities Lending Collateral | | | (24.47 | %) | |
| Liabilities Net of Receivables and Other Assets | | | (0.07 | %) | |
| Total Net Assets | | | 100.00 | % | |
w Narrow industries are utilized for compliance purposes for diversification whereas broad sectors are used for financial reporting.
Holdings are for informational purposes only and are subject to change at any time. They are not a recommendation to buy, sell, or hold any security.
| Top 10 Holdings | | Percentage
of Net Assets | |
| Coach | | | 2.87 | % | |
| Under Armour Class A | | | 2.54 | % | |
| Dick's Sporting Goods | | | 2.22 | % | |
| Akamai Technologies | | | 2.06 | % | |
| Bucyrus International | | | 2.01 | % | |
| NuVasive | | | 1.97 | % | |
| Sciele Pharma | | | 1.96 | % | |
| Hologic | | | 1.94 | % | |
| United Therapeutics | | | 1.93 | % | |
| Polycom | | | 1.88 | % | |
Trend Series- 4
Delaware VIP Trust — Delaware VIP Trend Series
Statement of Net Assets
December 31, 2006
| | | Number of
Shares | | Market
Value | |
| COMMON STOCK–98.43%w | |
| Basic Industry/Capital Goods–9.59% | |
| * AMCOL International | | | 169,600 | | | $ | 4,704,704 | | |
| * Bucyrus International Class A | | | 209,650 | | | | 10,851,484 | | |
| Carpenter Technology | | | 54,300 | | | | 5,566,836 | | |
| *† Energy Conversion Devices | | | 151,800 | | | | 5,158,164 | | |
| *† Hexcel | | | 220,300 | | | | 3,835,423 | | |
| *† Itron | | | 117,900 | | | | 6,111,936 | | |
| † Mettler-Toledo International | | | 109,400 | | | | 8,626,190 | | |
| MSC Industrial Direct Class A | | | 174,800 | | | | 6,843,420 | | |
| | | | | | | | 51,698,157 | | |
| Business Services–4.87% | |
| *† Advisory Board | | | 138,600 | | | | 7,420,644 | | |
| *† Bright Horizons Family Solutions | | | 61,900 | | | | 2,393,054 | | |
| *† Geo Group | | | 203,000 | | | | 7,616,560 | | |
| † Monster Worldwide | | | 189,500 | | | | 8,838,280 | | |
| | | | | | | | 26,268,538 | | |
| Consumer Durables–1.18% | |
| *† THQ | | | 196,300 | | | | 6,383,676 | | |
| | | | | | | | 6,383,676 | | |
| Consumer Non-Durables–13.02% | |
| † Bare Escentuals | | | 93,900 | | | | 2,917,473 | | |
| *† Carter's | | | 189,000 | | | | 4,819,500 | | |
| † Coach | | | 360,700 | | | | 15,495,672 | | |
| *† Crocs | | | 198,100 | | | | 8,557,920 | | |
| *† Dick's Sporting Goods | | | 244,400 | | | | 11,973,156 | | |
| *† DSW Class A | | | 206,600 | | | | 7,968,562 | | |
| *† J Crew | | | 54,000 | | | | 2,081,700 | | |
| *† Tractor Supply | | | 60,500 | | | | 2,704,955 | | |
| *† Under Armour Class A | | | 270,900 | | | | 13,666,905 | | |
| | | | | | | | 70,185,843 | | |
| Consumer Services–4.48% | |
| * Jackson Hewitt Tax Service | | | 161,800 | | | | 5,496,346 | | |
| *† Sonic | | | 262,964 | | | | 6,297,988 | | |
| *† Texas Roadhouse Class A | | | 494,900 | | | | 6,562,374 | | |
| *† Wynn Resorts | | | 61,600 | | | | 5,781,160 | | |
| | �� | | | | | | 24,137,868 | | |
| Energy–5.32% | |
| * Carbo Ceramics | | | 151,350 | | | | 5,655,950 | | |
| *† Helix Energy Solutions | | | 225,800 | | | | 7,083,346 | | |
| *† Hydril | | | 102,800 | | | | 7,729,532 | | |
| † North American Energy Partners | | | 167,400 | | | | 2,725,272 | | |
| † Veritas DGC | | | 63,800 | | | | 5,463,194 | | |
| | | | | | | | 28,657,294 | | |
| Financials–9.91% | |
| * Aspen Insurance | | | 158,200 | | | | 4,170,152 | | |
| Bankunited Financial Class A | | | 80,800 | | | | 2,259,168 | | |
| City National | | | 77,200 | | | | 5,496,640 | | |
| Delphi Financial Class A | | | 163,950 | | | | 6,633,417 | | |
| Hanover Insurance | | | 154,900 | | | | 7,559,120 | | |
| *† Investment Technology | | | 94,600 | | | | 4,056,448 | | |
| *† Nasdaq Stock Market | | | 110,500 | | | | 3,402,295 | | |
| Waddell & Reed Financial Class A | | | 338,800 | | | | 9,269,568 | | |
| * Webster Financial | | | 119,800 | | | | 5,836,656 | | |
| * Whitney Holding | | | 145,500 | | | | 4,746,210 | | |
| | | | | | | | 53,429,674 | | |
| | | Number of
Shares | | Market
Value | |
| COMMON STOCK (continued) | |
| Health Care–19.95% | |
| *† Align Technology | | | 254,400 | | | $ | 3,553,968 | | |
| *† Cepheid | | | 387,200 | | | | 3,291,200 | | |
| *† Conceptus | | | 311,200 | | | | 6,625,448 | | |
| *† Cubist Pharmaceuticals | | | 225,200 | | | | 4,078,372 | | |
| *† CV Therapeutics | | | 406,500 | | | | 5,674,740 | | |
| *† Digene | | | 141,200 | | | | 6,766,304 | | |
| *† Hologic | | | 221,100 | | | | 10,453,608 | | |
| *† LifeCell | | | 118,800 | | | | 2,867,832 | | |
| *† MannKind | | | 74,300 | | | | 1,225,207 | | |
| *† MGI Pharma | | | 309,000 | | | | 5,688,690 | | |
| *† Nektar Therapeutics | | | 185,500 | | | | 2,821,455 | | |
| *† NuVasive | | | 458,600 | | | | 10,593,660 | | |
| *† PDL BioPharma | | | 414,900 | | | | 8,356,086 | | |
| *† Progenics Pharmaceuticals | | | 298,700 | | | | 7,688,538 | | |
| *† Sciele Pharma | | | 439,800 | | | | 10,555,200 | | |
| *† Techne | | | 85,000 | | | | 4,713,250 | | |
| † Telik | | | 499,400 | | | | 2,212,342 | | |
| † United Therapeutics | | | 191,000 | | | | 10,384,670 | | |
| | | | | | | | 107,550,570 | | |
| Technology–27.37% | |
| *† Akamai Technologies | | | 209,100 | | | | 11,107,391 | | |
| † American Reprographics | | | 177,500 | | | | 5,912,525 | | |
| † Cymer | | | 120,800 | | | | 5,309,160 | | |
| † Emulex | | | 314,500 | | | | 6,135,895 | | |
| † F5 Networks | | | 98,600 | | | | 7,317,106 | | |
| *† Foundry Networks | | | 514,600 | | | | 7,708,708 | | |
| † Guidance Software | | | 32,500 | | | | 506,025 | | |
| *† Informatica | | | 299,200 | | | | 3,653,232 | | |
| † Knot | | | 78,100 | | | | 2,049,344 | | |
| † Macrovision | | | 178,700 | | | | 5,050,062 | | |
| *† Microsemi | | | 431,600 | | | | 8,480,940 | | |
| *† NutriSystem | | | 146,900 | | | | 9,311,991 | | |
| *† Opsware | | | 922,700 | | | | 8,138,214 | | |
| † Polycom | | | 328,500 | | | | 10,153,935 | | |
| *† Powerwave Technologies | | | 1,056,500 | | | | 6,814,425 | | |
| *† Rackable Systems | | | 252,100 | | | | 7,807,537 | | |
| *† salesforce.com | | | 152,000 | | | | 5,540,400 | | |
| *† Shutterfly | | | 214,500 | | | | 3,088,800 | | |
| † Silicon Laboratories | | | 168,600 | | | | 5,841,990 | | |
| *† SiRF Technology | | | 156,800 | | | | 4,001,536 | | |
| † TIBCO Software | | | 719,500 | | | | 6,792,080 | | |
| *† Trident Microsystems | | | 334,700 | | | | 6,084,846 | | |
| *† Varian Semiconductor Equipment | | | 128,900 | | | | 5,867,528 | | |
| *† Wind River Systems | | | 477,400 | | | | 4,893,350 | | |
| | | | | | | | 147,567,020 | | |
| Transportation–2.74% | |
| * Hunt (J.B.) Transport Services | | | 258,200 | | | | 5,362,814 | | |
| UTi Worldwide | | | 313,600 | | | | 9,376,640 | | |
| | | | | | | | 14,739,454 | | |
Total Common Stock
(cost $408,739,889) | | | | | | | 530,618,094 | | |
Trend Series- 5
Delaware VIP Trend Series
Statement of Net Assets (continued)
| | | Principal
Amount | | Market
Value | |
| REPURCHASE AGREEMENTS–1.64% | |
With BNP Paribas 4.80% 1/2/07
(dated 12/29/06, to be repurchased
at $3,354,788, collateralized by
$3,508,000 U.S. Treasury Bills
due 6/28/07, market value $3,423,273) | | $ | 3,353,000 | | | $ | 3,353,000 | | |
With Cantor Fitzgerald 4.82% 1/2/07
(dated 12/29/06, to be repurchased
at $4,030,157, collateralized by
$347,000 U.S. Treasury Notes 4.00%
due 6/15/09, market value $342,493,
$2,158,000 U.S. Treasury Notes 6.125%
due 8/15/07, market value $2,222,533
and $1,439,000 U.S. Treasury Notes 6.50%
due 2/15/10, market value $1,547,584) | | | 4,028,000 | | | | 4,028,000 | | |
With UBS Warburg 4.75% 1/2/07
(dated 12/29/06, to be repurchased
at $1,439,759, collateralized by
$1,486,000 U.S. Treasury Bills
due 3/29/07, market value $1,468,760) | | | 1,439,000 | | | | 1,439,000 | | |
Total Repurchase Agreements
(cost $8,820,000) | | | | | | | 8,820,000 | | |
Total Market Value of Securities
Before Securities Lending
Collateral–100.07%
(cost $417,559,889) | | | | | | | 539,438,094 | | |
| SECURITY LENDING COLLATERAL**–24.47% | |
| Short-Term Investments –24.47% | |
| Fixed Rate Note–4.63% | |
| Citigroup Global Markets 5.32% 1/2/07 | | | 24,961,949 | | | | 24,961,949 | | |
| | | | | | | | 24,961,949 | | |
| • Variable Rate Notes–19.84% | | | | | | | | | |
| American Honda Finance 5.32% 2/21/07 | | | 3,228,009 | | | | 3,228,009 | | |
| ANZ National 5.35% 1/29/08 | | | 717,335 | | | | 717,335 | | |
| | | Principal
Amount | | Market
Value | |
| SECURITY LENDING COLLATERAL (continued) | |
| Short-Term Investments (continued) | |
| • Variable Rate Notes (continued) | | | | | | | | | |
| Australia New Zealand 5.35% 1/29/08 | | $ | 3,586,676 | | | $ | 3,586,676 | | |
| Bank of America 5.32% 2/23/07 | | | 4,662,679 | | | | 4,662,679 | | |
| Bank of New York 5.34% 1/29/08 | | | 2,869,341 | | | | 2,869,341 | | |
| Barclays New York 5.31% 5/18/07 | | | 4,662,679 | | | | 4,662,679 | | |
| Bayerische Landesbank 5.40% 1/29/08 | | | 3,586,676 | | | | 3,586,677 | | |
| Bear Stearns 5.41% 6/29/07 | | | 4,304,012 | | | | 4,304,012 | | |
| BNP Paribas 5.35% 1/29/08 | | | 3,586,676 | | | | 3,586,676 | | |
| Canadian Imperial Bank 5.33% 1/29/09 | | | 2,510,674 | | | | 2,510,674 | | |
| CDC Financial 5.36% 1/29/07 | | | 4,662,679 | | | | 4,662,679 | | |
| Citigroup Global Markets 5.38% 1/5/07 | | | 4,662,679 | | | | 4,662,679 | | |
| Commonwealth Bank 5.35% 1/29/08 | | | 3,586,676 | | | | 3,586,677 | | |
| Deutsche Bank 5.34% 2/23/07 | | | 4,304,012 | | | | 4,304,012 | | |
| Dexia Bank 5.33% 9/28/07 | | | 5,021,334 | | | | 5,020,608 | | |
| Goldman Sachs 5.45% 12/28/07 | | | 4,662,679 | | | | 4,662,679 | | |
| Marshall & Ilsley Bank 5.33% 1/29/08 | | | 3,945,344 | | | | 3,945,344 | | |
Merrill Lynch Mortgage Capital
5.41% 1/8/07 | | | 4,662,679 | | | | 4,662,679 | | |
| Morgan Stanley 5.49% 1/29/08 | | | 4,662,679 | | | | 4,662,679 | | |
| National Australia Bank 5.32% 3/7/07 | | | 4,447,479 | | | | 4,447,479 | | |
| National City Bank 5.32% 3/2/07 | | | 4,304,139 | | | | 4,304,399 | | |
| National Rural Utilities 5.34% 1/29/08 | | | 5,666,949 | | | | 5,666,949 | | |
| Nordea Bank New York 5.31% 5/16/07 | | | 1,793,327 | | | | 1,793,294 | | |
| Nordea Bank Norge 5.36% 1/29/08 | | | 3,586,676 | | | | 3,586,677 | | |
| Royal Bank of Scotland 5.34% 1/29/08 | | | 3,586,676 | | | | 3,586,677 | | |
| Societe Generale 5.32% 1/29/08 | | | 1,793,338 | | | | 1,793,338 | | |
| Toronto Dominion 5.32% 5/29/07 | | | 4,304,012 | | | | 4,304,012 | | |
| Wells Fargo 5.36% 1/29/08 | | | 3,586,676 | | | | 3,586,677 | | |
| | | | | | | | 106,954,296 | | |
Total Securities Lending Collateral
(cost $131,916,245) | | | | | | | 131,916,245 | | |
Trend Series-6
Delaware VIP Trend Series
Statement of Net Assets (continued)
| TOTAL MARKET VALUE OF SECURITIES–124.54% (cost $549,476,134) | | $ | 671,354,339 | v | |
| OBLIGATION TO RETURN SECURITIES LENDING COLLATERAL**–(24.47%) | | | (131,916,245 | ) | |
| LIABILITIES NET OF RECEIVABLES AND OTHER ASSETS–(0.07%) | | | (362,145 | ) | |
| NET ASSETS APPLICABLE TO 15,450,324 SHARES OUTSTANDING–100.00% | | $ | 539,075,949 | | |
| NET ASSET VALUE–DELAWARE VIP TREND SERIES STANDARD CLASS ($410,166,829 / 11,717,566 Shares) | | $ | 35.00 | | |
| NET ASSET VALUE–DELAWARE VIP TREND SERIES SERVICE CLASS ($128,909,120 / 3,732,758 Shares) | | $ | 34.53 | | |
| COMPONENTS OF NET ASSETS AT DECEMBER 31, 2006: | |
| Shares of beneficial interest (unlimited authorization-no par) | | $ | 416,520,640 | | |
| Accumulated net realized gain on investments | | | 677,104 | | |
| Net unrealized appreciation of investments | | | 121,878,205 | | |
| Total net assets | | $ | 539,075,949 | | |
* Fully or partially on loan.
** See Note 8 in "Notes to Financial Statements."
v Includes $128,007,449 of securities loaned.
† Non-income producing security for the year ended December 31, 2006.
• Variable rate security. The interest rate shown is the rate as of December 31, 2006.
w Narrow industries are utilized for compliance purposes for diversification whereas broad sectors are used for financial reporting.
See accompanying notes
Trend Series-7
Delaware VIP Trust — Delaware VIP Trend Series
Statement of Operations
Year Ended December 31, 2006
Delaware VIP Trust — Delaware VIP Trend Series
Statements of Changes in Net Assets
| INVESTMENT INCOME: | |
| Dividends | | $ | 1,822,236 | | |
| Interest | | | 887,133 | | |
| Securities lending income | | | 695,844 | | |
| | | | 3,405,213 | | |
| EXPENSES: | |
| Management fees | | | 4,201,053 | | |
| Distribution expenses – Service Class | | | 379,277 | | |
| Accounting and administration expenses | | | 225,774 | | |
| Reports and statements to shareholders | | | 141,162 | | |
| Trustees' fees and benefits | | | 97,342 | | |
| Legal fees | | | 62,589 | | |
| Dividend disbursing and transfer agent fees and expenses | | | 56,444 | | |
| Audit and tax | | | 36,166 | | |
| Custodian fees | | | 17,661 | | |
| Insurance fees | | | 14,949 | | |
| Consulting fees | | | 14,795 | | |
| Taxes (other than taxes on income) | | | 7,531 | | |
| Dues and services | | | 5,109 | | |
| Trustees' expenses | | | 2,873 | | |
| Pricing fees | | | 645 | | |
| Registration fees | | | 46 | | |
| | | | 5,263,416 | | |
| Less waiver of distribution expenses – Service Class | | | (63,213 | ) | |
| Less expense paid indirectly | | | (1,395 | ) | |
| Total operating expenses | | | 5,198,808 | | |
| NET INVESTMENT LOSS | | | (1,793,595 | ) | |
NET REALIZED AND UNREALIZED GAIN (LOSS)
ON INVESTMENTS: | |
| Net realized gain on investments | | | 80,485,296 | | |
Net change in unrealized appreciation/depreciation
of investments | | | (39,974,574 | ) | |
NET REALIZED AND UNREALIZED GAIN ON
INVESTMENTS AND FOREIGN CURRENCIES | | | 40,510,722 | | |
NET INCREASE IN NET ASSETS RESULTING
FROM OPERATIONS | | $ | 38,717,127 | | |
See accompanying notes
| | | Year Ended | |
| | | 12/31/06 | | 12/31/05 | |
INCREASE (DECREASE) IN NET
ASSETS FROM OPERATIONS: | |
| Net investment loss | | $ | (1,793,595 | ) | | $ | (2,335,580 | ) | |
Net realized gain on investments and
foreign currencies | | | 80,485,296 | | | | 61,610,042 | | |
Net change in unrealized appreciation/
depreciation of investments and
foreign currencies | | | (39,974,574 | ) | | | (31,267,940 | ) | |
Net increase in net assets
resulting from operations | | | 38,717,127 | | | | 28,006,522 | | |
| CAPITAL SHARE TRANSACTIONS: | |
| Proceeds from shares sold: | |
| Standard Class | | | 52,564,087 | | | | 9,925,534 | | |
| Service Class | | | 30,100,215 | | | | 28,703,461 | | |
| | | | 82,664,302 | | | | 38,628,995 | | |
| Cost of shares repurchased: | |
| Standard Class | | | (123,021,971 | ) | | | (102,222,054 | ) | |
| Service Class | | | (29,169,880 | ) | | | (25,751,185 | ) | |
| | | | (152,191,851 | ) | | | (127,973,239 | ) | |
| Decrease in net assets derived from | |
| capital share transactions | | | (69,527,549 | ) | | | (89,344,244 | ) | |
| NET DECREASE IN NET ASSETS | | | (30,810,422 | ) | | | (61,337,722 | ) | |
| NET ASSETS: | |
| Beginning of year | | | 569,886,371 | | | | 631,224,093 | | |
End of year (there was no undistributed net
investment income at either year end) | | $ | 539,075,949 | | | $ | 569,886,371 | | |
See accompanying notes
Trend Series- 8
Delaware VIP Trust — Delaware VIP Trend Series
Financial Highlights
Selected data for each share of the Series outstanding throughout each period were as follows:
| | | Delaware VIP Trend Series Standard Class | |
| | | Year Ended | |
| | | 12/31/06 | | 12/31/05 | | 12/31/04 | | 12/31/03 | | 12/31/02 | |
| Net asset value, beginning of period | | $ | 32.530 | | | $ | 30.730 | | | $ | 27.290 | | | $ | 20.200 | | | $ | 25.230 | | |
| Income (loss) from investment operations: | |
| Net investment loss1 | | | (0.088 | ) | | | (0.108 | ) | | | (0.108 | ) | | | (0.082 | ) | | | (0.085 | ) | |
Net realized and unrealized gain (loss) on investments
and foreign currencies | | | 2.558 | | | | 1.908 | | | | 3.548 | | | | 7.172 | | | | (4.945 | ) | |
| Total from investment operations | | | 2.470 | | | | 1.800 | | | | 3.440 | | | | 7.090 | | | | (5.030 | ) | |
| Net asset value, end of period | | $ | 35.000 | | | $ | 32.530 | | | $ | 30.730 | | | $ | 27.290 | | | $ | 20.200 | | |
| Total return2 | | | 7.59 | % | | | 5.86 | % | | | 12.60 | % | | | 35.10 | % | | | (19.94 | %) | |
| Ratios and supplemental data: | |
| Net assets, end of period (000 omitted) | | $ | 410,167 | | | $ | 450,525 | | | $ | 521,392 | | | $ | 515,829 | | | $ | 415,098 | | |
| Ratio of expenses to average net assets | | | 0.87 | % | | | 0.87 | % | | | 0.84 | % | | | 0.84 | % | | | 0.84 | % | |
| Ratio of net investment loss to average net assets | | | (0.26 | %) | | | (0.36 | %) | | | (0.38 | %) | | | (0.36 | %) | | | (0.38 | %) | |
| Portfolio turnover | | | 64 | % | | | 63 | % | | | 48 | % | | | 50 | % | | | 43 | % | |
1The average shares outstanding method has been applied for per share information.
2Total investment return is based on the change in net asset value of a share during the period and assumes reinvestment of dividends and distributions at net asset value.
See accompanying notes
Trend Series- 9
Delaware VIP Trend Series
Financial Highlights (continued)
Selected data for each share of the Series outstanding throughout each period were as follows:
| | | Delaware VIP Trend Series Service Class | |
| | | Year Ended | |
| | | 12/31/06 | | 12/31/05 | | 12/31/04 | | 12/31/03 | | 12/31/02 | |
| Net asset value, beginning of period | | $ | 32.170 | | | $ | 30.460 | | | $ | 27.120 | | | $ | 20.120 | | | $ | 25.170 | | |
| Income (loss) from investment operations: | |
| Net investment loss1 | | | (0.171 | ) | | | (0.182 | ) | | | (0.178 | ) | | | (0.135 | ) | | | (0.117 | ) | |
Net realized and unrealized gain (loss) on investments
and foreign currencies | | | 2.531 | | | | 1.892 | | | | 3.518 | | | | 7.135 | | | | (4.933 | ) | |
| Total from investment operations | | | 2.360 | | | | 1.710 | | | | 3.340 | | | | 7.000 | | | | (5.050 | ) | |
| Net asset value, end of period | | $ | 34.530 | | | $ | 32.170 | | | $ | 30.460 | | | $ | 27.120 | | | $ | 20.120 | | |
| Total return2 | | | 7.34 | % | | | 5.61 | % | | | 12.32 | % | | | 34.79 | % | | | (20.06 | %) | |
| Ratios and supplemental data: | |
| Net assets, end of period (000 omitted) | | $ | 128,909 | | | $ | 119,361 | | | $ | 109,832 | | | $ | 55,662 | | | $ | 22,136 | | |
| Ratio of expenses to average net assets | | | 1.12 | % | | | 1.12 | % | | | 1.09 | % | | | 1.06 | % | | | 0.99 | % | |
Ratio of expenses to average net assets prior to expense
limitation and expenses paid indirectly | | | 1.17 | % | | | 1.17 | % | | | 1.14 | % | | | 1.09 | % | | | 0.99 | % | |
| Ratio of net investment loss to average net assets | | | (0.51 | %) | | | (0.61 | %) | | | (0.63 | %) | | | (0.58 | %) | | | (0.53 | %) | |
Ratio of net investment loss to average net assets prior
to expense limitation and expenses paid indirectly | | | (0.56 | %) | | | (0.66 | %) | | | (0.68 | %) | | | (0.61 | %) | | | (0.53 | %) | |
| Portfolio turnover | | | 64 | % | | | 63 | % | | | 48 | % | | | 50 | % | | | 43 | % | |
1The average shares outstanding method has been applied for per share information.
2Total investment return is based on the change in net asset value of a share during the period and assumes reinvestment of dividends and distributions at net asset value. Total investment return reflects waivers and payment of fees by the distributor, as applicable. Performance would have been lower had the expense limitation not been in effect.
See accompanying notes
Trend Series- 10
Delaware VIP Trust — Delaware VIP Trend Series
Notes to Financial Statements
December 31, 2006
Delaware VIP Trust (the "Trust") is organized as a Delaware statutory trust and offers 15 series: Delaware VIP Balanced Series, Delaware VIP Capital Reserves Series, Delaware VIP Cash Reserve Series, Delaware VIP Diversified Income Series, Delaware VIP Emerging Markets Series, Delaware VIP Global Bond Series, Delaware VIP Growth Opportunities Series, Delaware VIP High Yield Series, Delaware VIP International Value Equity Series, Delaware VIP REIT Series, Delaware VIP Select Growth Series, Delaware VIP Small Cap Value Series, Delaware VIP Trend Series, Delaware VIP U.S. Growth Series and Delaware VIP Value Series. These financial statements and the related notes pertain to Delaware VIP Trend Series (the "Series"). The Trust is an open-end investment company. The Series is considered diversified under the Investment Company Act of 1940, as amended, and offers Standard Class and Service Class shares. The Standard Class shares do not carry a 12b - -1 fee and the Service Class shares carry a 12b-1 fee. The shares of the Series are sold only to separate accounts of life insurance companies.
The investment objective of the Series is to seek long-term capital appreciation.
1. Significant Accounting Policies
The following accounting policies are in accordance with U.S. generally accepted accounting principles and are consistently followed by the Series.
Security Valuation—Equity securities, except those traded on the Nasdaq Stock Market, Inc. (Nasdaq), are valued at the last quoted sales price as of the time of the regular close of the New York Stock Exchange (NYSE) on the valuation date. Securities traded on the Nasdaq are valued in accordance with the Nasdaq Official Closing Price, which may not be the last sales price. If on a particular day an equity security does not trade, then the mean between the bid and asked prices will be used. Short-term debt securities having less than 60 days to maturity are valued at amortized cost, which approximates market value. Securities lending collateral is valued at amortized cost, which approximates market value. Other securities and assets for which market quotations are not readily available are valued at fair value as determined in good faith under the direction of the Series' Board of Trustees. In determining whether market quotations are readily available or fair valuation will be used, various factors will be taken into consideration, such as market closures, or with respect to foreign securities, aftermarket trading, or significant events after local market trading (e.g., government actions or pronouncements, trading volume or volatility on markets, exchanges among dealers, or news events).
In September 2006, the Financial Accounting Standards Board (FASB) issued FASB Statement No. 157 "Fair Value Measurements" (Statement 157). Statement 157 establishes a framework for measuring fair value in generally accepted accounting principles, clarifies the definition of fair value within that framework, and expands disclosures about the use of fair value measurements. Statement 157 is intended to increase consistency and comparability among fair value estimates used in financial reporting. Statement 157 is effective for fiscal years beginning after November 15, 2007. Management does not expect the adoption of Statement 157 to have an impact on the amounts reported in the financial statements.
Federal Income Taxes—The Series intends to continue to qualify for federal income tax purposes as a regulated investment company and make the requisite distributions to shareholders. Accordingly, no provision for federal income taxes has been made in the financial statements.
On July 13, 2006, FASB released FASB Interpretation No. 48 "Accounting for Uncertainty in Income Taxes" (FIN 48). FIN 48 provides guidance for how uncertain tax positions should be recognized, measured, presented and disclosed in the financial statements. FIN 48 requires the evaluation of tax positions taken or expected to be taken in the course of preparing the Series' tax returns to determine whether the tax positions are "more-likely-than-not" of being sustained by the applicable tax authority. Tax positions not deemed to meet the more-likely-than-not threshold would be recorded as a tax benefit or expense in the current year. Adoption of FIN 48 is required for fiscal years beginning after December 15, 2006 and is to be applied to all open tax years as of the effective date. Recent SEC guidance allows implementing FIN 48 in Series net asset value calculations as late as the Series' last net asset value calculation in the first required fi nancial statement reporting period. As a result, the Series will incorporate FIN 48 in its semiannual report on June 30, 2007. Although the Series' tax positions are currently being evaluated, management does not expect the adoption of FIN 48 to have a material impact on the Series' financial statements.
Class Accounting—Investment income, common expenses and realized and unrealized gain (loss) on investments are allocated to the classes of the Series on the basis of daily net assets of each class. Distribution expenses relating to a specific class are charged directly to that class.
Repurchase Agreements—The Series may invest in a pooled cash account along with other members of the Delaware Investments® Family of Funds pursuant to an exemptive order issued by the Securities and Exchange Commission. The aggregate daily balance of the pooled cash account is invested in repurchase agreements secured by obligations of the U.S. government. The respective collateral is held by the Series' custodian bank until the maturity of the respective repurchase agreements. Each repurchase agreement is at least 102% collateralized. However, in the event of default or bankruptcy by the counterparty to the agreement, realization of the collateral may be subject to legal proceedings.
Use of Estimates—The preparation of financial statements in conformity with U.S. generally accepted accounting principles requires management to make estimates and assumptions that affect the reported amounts of assets and liabilities at the date of the financial statements and the reported amounts of revenues and expenses during the reporting period. Actual results could differ from those estimates.
Other—Expenses directly attributable to the Series are charged directly to the Series. Other expenses common to various funds within the Delaware Investments® Family of Funds are generally allocated amongst such funds on the basis of average net assets. Management fees and some other expenses are paid monthly. Security transactions are recorded on the date the securities are purchased or sold (trade date) for financial reporting purposes. Costs used in calculating realized gains and losses on the sale of investment securities are those of the specific securities sold. Dividend income is recorded on the ex-dividend date and interest income is recorded on the accrual basis.
The Series declares and pays dividends from net investment income and distributions from net realized gain on investments, if any, following the close of the fiscal year.
Trend Series- 11
Delaware VIP Trend Series
Notes to Financial Statements (continued)
1. Significant Accounting Policies (continued)
Subject to seeking best execution, the Series may direct certain security trades to brokers who have agreed to rebate a portion of the related brokerage commission to the Series in cash. Such commission rebates are included in realized gain on investments in the accompanying financial statements and totaled $47,150 for the year ended December 31, 2006. In general, best execution refers to many factors, including the price paid or received for a security, the commission charged, the promptness and reliability of execution, the confidentiality and placement accorded the order, and other factors affecting the overall benefit obtained by the Series on the transaction.
The Series receives earnings credits from its custodian when positive cash balances are maintained, which are used to offset custody fees. The expense paid under this arrangement is included in custodian fees on the Statement of Operations with the corresponding expense offset shown as "expense paid indirectly."
2. Investment Management, Administration Agreements and Other Transactions with Affiliates
In accordance with the terms of its investment management agreement, the Series pays Delaware Management Company (DMC), a series of Delaware Management Business Trust and the investment manager, an annual fee which is calculated daily at the rate of 0.75% on the first $500 million of average daily net assets of the Series, 0.70% on the next $500 million, 0.65% on the next $1.5 billion, and 0.60% on average daily net assets in excess of $2.5 billion.
DMC has contractually agreed to waive that portion, if any, of its management fee and reimburse the Series to the extent necessary to ensure that annual operating expenses, exclusive of taxes, interest, brokerage commissions, distribution fees, certain insurance costs and extraordinary expenses, do not exceed 0.92% of average daily net assets of the Series through April 30, 2007. Prior to May 1, 2006, the expense limitation was 0.95% of average daily net assets. No reimbursement was due for the year ended December 31, 2006.
Delaware Service Company, Inc. (DSC), an affiliate of DMC, provides accounting, administration, dividend disbursing and transfer agent services. The Series pays DSC a monthly fee computed at the annual rate of 0.04% of the Series' average daily net assets for accounting and administrative services. The Series pays DSC a monthly fee based on average net assets for dividend disbursing and transfer agent services.
Pursuant to a distribution agreement and distribution plan, the Series pays Delaware Distributors, L.P. (DDLP), the distributor and an affiliate of DMC, an annual distribution and service fee not to exceed 0.30% of the average daily net assets of the Service Class shares. DDLP has contracted to waive distribution and service fees through April 30, 2007 in order to prevent distribution and service fees of the Service Class shares from exceeding 0.25% of average daily net assets. Standard Class shares pay no distribution and service expenses.
At December 31, 2006, the Series had liabilities payable to affiliates as follows:
Investment
Management
Fee Payable to
DMC | | Dividend Disbursing,
Transfer Agent,
Accounting and Administration
Fees and Other Expenses
Payable to DSC | | Distribution
Fees Payable
to DDLP | | Other
Expenses
Payable
to DMC
and Affiliates* | |
| $ | 348,593 | | | $ | 26,066 | | | $ | 27,878 | | | $ | 67,800 | | |
*DMC, as part of its administrative services, pays operating expenses on behalf of the Series and is reimbursed on a periodic basis. Such expenses include items such as printing of shareholder reports, fees for audit, legal and tax services, custodian fees and trustees' fees.
As provided in the investment management agreement, the Series bears the cost of certain legal and tax services, including internal legal and tax services provided to the Series by DMC and/or its affiliates' employees. For the year ended December 31, 2006, the Series was charged $26,558 for internal legal and tax services provided by DMC and/or its affiliates' employees.
Trustees' fees and benefits include expenses accrued by the Series for each Trustee's retainer, per meeting fees and retirement benefits. Independent Trustees with over five years of uninterrupted service are eligible to participate in a retirement plan that provides for the payment of benefits upon retirement. The amount of the retirement benefit is based on factors set forth in the plan, including the number of years of service. On November 16, 2006, the Board of Trustees unanimously voted to terminate the retirement plan. Payments equal to the net present value of the earned benefits will be made in 2007 to those independent trustees so entitled. The retirement benefit payout for the Series is $66,232. Certain officers of DMC, DSC and DDLP are officers and/or trustees of the Trust. These officers and trustees are paid no compensation by the Series.
3. Investments
For the year ended December 31, 2006, the Series made purchases and sales of investment securities other than short-term investments as follows:
| Purchases | | $ | 349,521,147 | | |
| Sales | | | 414,678,446 | | |
Trend Series- 12
Delaware VIP Trend Series
Notes to Financial Statements (continued)
3. Investments (continued)
At December 31, 2006, the cost of investments for federal income tax purposes and unrealized appreciation (depreciation) for the Series were as follows:
Cost of
Investments | | Aggregate
Unrealized
Appreciation | | Aggregate
Unrealized
Depreciation | | Net Unrealized
Appreciation | |
| $ | 552,389,775 | | | $ | 149,738,922 | | | $ | (30,774,358 | ) | | $ | 118,964,564 | | |
4. Dividend and Distribution Information
Income and long-term capital gain distributions are determined in accordance with federal income tax regulations, which may differ from U.S. generally accepted accounting principles. Additionally, net short-term gains on sales of investment securities are treated as ordinary income for federal income tax purposes. There were no dividends and distributions paid for the years ended December 31, 2006 and 2005.
5. Components of Net Assets on a Tax Basis
As of December 31, 2006, the components of net assets on a tax basis were as follows:
| Shares of beneficial interest | | $ | 416,520,640 | | |
| Undistributed long-term capital gains | | | 3,590,745 | | |
| Unrealized appreciation of investments | | | 118,964,564 | | |
| Net assets | | $ | 539,075,949 | | |
The differences between book basis and tax basis components of net assets are primarily attributable to tax deferral of losses on wash sales.
For financial reporting purposes, capital accounts are adjusted to reflect the tax character of permanent book/tax differences. Reclassifications are primarily due to tax treatment of net operating losses. Results of operations and net assets were not affected by these reclassifications. For the year ended December 31, 2006, the Series recorded the following reclassifications:
Accumulated
Net
Investment Loss | | Paid-in
Capital | |
| $ | 1,793,595 | | | $ | (1,793,595 | ) | |
For federal income tax purposes, capital loss carryforwards may be carried forward and applied against future capital gains. $76,589,457 was utilized in 2006.
6. Capital Shares
Transactions in capital shares were as follows:
| | | Year
Ended
12/31/06 | | Year
Ended
12/31/05 | |
| Shares sold: | |
| Standard Class | | | 1,664,925 | | | | 333,284 | | |
| Service Class | | | 899,447 | | | | 978,144 | | |
| | | | 2,564,372 | | | | 1,311,428 | | |
| Shares repurchased: | |
| Standard Class | | | (3,796,588 | ) | | | (3,453,560 | ) | |
| Service Class | | | (876,515 | ) | | | (873,580 | ) | |
| | | | (4,673,103 | ) | | | (4,327,140 | ) | |
| Net decrease | | | (2,108,731 | ) | | | (3,015,712 | ) | |
Trend Series- 13
Delaware VIP Trend Series
Notes to Financial Statements (continued)
7. Line of Credit
The Series, along with certain other funds in the Delaware Investments® Family of Funds (the "Participants"), participates in a $225,000,000 revolving line of credit facility to be used for temporary or emergency purposes as an additional source of liquidity to fund redemptions of investor shares. The Participants are charged an annual commitment fee, which is allocated across the Participants on the basis of each Participant's allocation of the entire facility. The Participants may borrow up to a maximum of one third of their net assets under the agreement. The Series had no amounts outstanding as of December 31, 2006, or at any time during the year then ended.
8. Securities Lending
The Series, along with other funds in the Delaware Investments® Family of Funds, may lend its securities pursuant to a security lending agreement (Lending Agreement) with JPMorgan Chase. Initial security loans made pursuant to the Lending Agreement are required to be secured by U.S. government obligations and/or cash collateral not less than 102% of the market value of the securities issued in the United States and 105% of the market value of securities issued outside the United States. With respect to each loan, if the aggregate market value of the collateral held on any business day is less than the aggregate market value of the securities which are the subject of such loan, the borrower will be notified to provide additional collateral not less than the applicable collateral requirements. Cash collateral received is invested in fixed income securities, with a weighted average maturity not to exceed 90 days, rated in one of the top two tiers by Standard & Poor's Ratings Group or Moody's Investors Service, Inc. or repurchase agreements collateralized by such securities. However, in the event of default or bankruptcy by the lending agent, realization and/or retention of the collateral may be subject to legal proceedings. In the event the borrower fails to return loaned securities and the collateral received is insufficient to cover the value of the loaned securities and provided such collateral shortfall is not the result of investment losses, the lending agent has agreed to pay the amount of the shortfall to the Series, or at the discretion of the lending agent, replace the loaned securities. The Series continues to record dividends on the securities loaned and is subject to change in value of the securities loaned that may occur during the term of the loan. The Series has the right under the Lending Agreement to recover the securities from the borrower on demand. The security lending agent and the borrower retain a portion of the earn ings from the collateral investments. The Series records security lending income net of such allocation.
At December 31, 2006, the market value of securities on loan was $128,007,449, for which cash collateral was received and invested in accordance with the Lending Agreement. Such investments are presented on the Statement of Net Assets under the caption "Securities Lending Collateral."
9. Credit and Market Risk
The Series invests a significant portion of its assets in small companies and may be subject to certain risks associated with ownership of securities of such companies. Investments in small-sized companies may be more volatile than investments in larger companies for a number of reasons, which include limited financial resources or a dependence on narrow product lines.
The Series may invest up to 10% of its total assets in illiquid securities, which may include securities with contractual restrictions on resale, securities exempt from registration under Rule 144A of the Securities Act of 1933, as amended, and other securities which may not be readily marketable. The relative illiquidity of these securities may impair the Series from disposing of them in a timely manner and at a fair price when it is necessary or desirable to do so. While maintaining oversight, the Series' Board of Trustees has delegated to DMC the day-to-day functions of determining whether individual securities are liquid for purposes of the Series' limitation on investments in illiquid assets. At December 31, 2006, there were no Rule 144A securities and no securities have been determined to be illiquid under the Series' Liquidity Procedures.
10. Contractual Obligations
The Series enters into contracts in the normal course of business that contain a variety of indemnifications. The Series' maximum exposure under these arrangements is unknown. However, the Series has not had prior claims or losses pursuant to these contracts. Management has reviewed the Series' existing contracts and expects the risk of loss to be remote.
Trend Series- 14
Delaware VIP Trust — Delaware VIP Trend Series
Report of Independent Registered Public Accounting Firm
To the Shareholders and Board of Trustees
Delaware VIP Trust–Delaware VIP Trend Series
We have audited the accompanying statement of net assets of the Delaware VIP Trend Series (one of the series constituting Delaware VIP Trust) (the "Series") as of December 31, 2006, and the related statement of operations for the year then ended, the statements of changes in net assets for each of the two years in the period then ended, and the financial highlights for each of the five years in the period then ended. These financial statements and financial highlights are the responsibility of the Series' management. Our responsibility is to express an opinion on these financial statements and financial highlights based on our audits.
We conducted our audits in accordance with the standards of the Public Company Accounting Oversight Board (United States). Those standards require that we plan and perform the audit to obtain reasonable assurance about whether the financial statements and financial highlights are free of material misstatement. We were not engaged to perform an audit of the Series' internal control over financial reporting. Our audits included consideration of internal control over financial reporting as a basis for designing audit procedures that are appropriate in the circumstances, but not for the purpose of expressing an opinion on the effectiveness of the Series' internal control over financial reporting. Accordingly, we express no such opinion. An audit also includes examining, on a test basis, evidence supporting the amounts and disclosures in the financial statements and financial highlights, assessing the accounting principles used and significant es timates made by management, and evaluating the overall financial statement presentation. Our procedures included confirmation of securities owned as of December 31, 2006, by correspondence with the custodian and brokers or by other appropriate auditing procedures where replies from brokers were not received. We believe that our audits provide a reasonable basis for our opinion.
In our opinion, the financial statements and financial highlights referred to above present fairly, in all material respects, the financial position of the Delaware VIP Trend Series of Delaware VIP Trust at December 31, 2006, the results of its operations for the year then ended, the changes in its net assets for each of the two years in the period then ended, and its financial highlights for each of the five years in the period then ended, in conformity with U.S. generally accepted accounting principles.

Philadelphia, Pennsylvania
February 14, 2007
The Series files its complete schedule of portfolio holdings with the Securities and Exchange Commission for the first and third quarters of each fiscal year on Form N-Q. The Series' Forms N-Q, as well as a description of the policies and procedures that the Series uses to determine how to vote proxies (if any) relating to portfolio securities is available without charge (i) upon request, by calling 800-523-1918; (ii) on the Series' website at http://www.delawareinvestments.com; and (iii) on the Commission's website at http://www.sec.gov. The Series' Forms N-Q may be reviewed and copied at the Commission's Public Reference Room in Washington, DC; information on the operation of the Public Reference Room may be obtained by calling 1-800-SEC-0330.
Information (if any) regarding how the Series voted proxies relating to portfolio securities during the most recently disclosed 12-month period ended June 30 is available without charge (i) through the Series' website at http://www.delawareinvestments.com; and (ii) on the Commission's website at http://www.sec.gov.
Trend Series- 15
Delaware Investments® Family of Funds
board of trustees/directors and officers addendum
A mutual fund is governed by a Board of Trustees/Directors ("Trustees"), which has oversight responsibility for the management of a fund's business affairs. Trustees establish procedures and oversee and review the performance of the investment manager, the distributor, and others who perform services for the fund. The independent fund trustees, in particular, are advocates for shareholder interests. Each trustee has served in that capacity since he or she was elected to or appointed to the Board of Trustees, and will continue to serve until his or her retirement or the election of a new trustee in his or her place. The following is a list of the Trustees and Officers with certain background and related information.
Name,
Address,
and Birth Date | | Position(s)
Held with
Fund(s) | | Length of Time
Served | | Principal
Occupation(s)
During
Past 5 Years | | Number of
Portfolios in Fund
Complex Overseen
by Trustee
or Officer | | Other
Directorships
Held by
Trustee
or Officer | |
| interested trustees | | | | | | | | | | | | | |
|
Patrick P. Coyne1
2005 Market Street
Philadelphia, PA
19103
April 14, 1963 | | Chairman,
President,
Chief Executive
Officer, and
Trustee | | Chairman and Trustee
since August 16, 2006
President and
Chief Executive Officer
since August 1, 2006 | | Patrick P. Coyne has served in
various executive capacities
at different times at
Delaware Investments.2 | | | 84 | | | None | |
|
| independent trustees | | | | | | | | | | | | | |
|
Thomas L. Bennett
2005 Market Street
Philadelphia, PA
19103
October 4, 1947 | | Trustee | | Since
March 2005 | | Private Investor –
(March 2004 – Present)
Investment Manager –
Morgan Stanley & Co.
(January 1984 – March 2004) | | | 84 | | | None | |
|
John A. Fry
2005 Market Street
Philadelphia, PA
19103
May 28, 1960 | | Trustee | | Since
January 2001 | | President –
Franklin & Marshall College
(June 2002 – Present)
Executive Vice President –
University of Pennsylvania
(April 1995 – June 2002) | | | 84 | | | Director –
Community Health
Systems
Director –
Allied Barton
Security Holdings | |
|
Anthony D. Knerr
2005 Market Street
Philadelphia, PA
19103
December 7, 1938 | | Trustee | | Since
April 1990 | | Founder and Managing Director –
Anthony Knerr & Associates
(Strategic Consulting)
(1990 – Present) | | | 84 | | | None | |
|
Lucinda S. Landreth
2005 Market Street
Philadelphia, PA
19103
June 24, 1947 | | Trustee | | Since
March 2005 | | Chief Investment Officer –
Assurant, Inc.
(Insurance)
(2002 – 2004) | | | 84 | | | None | |
|
Ann R. Leven
2005 Market Street
Philadelphia, PA
19103
November 1, 1940 | | Trustee | | Since
September 1989 | | Consultant –
ARL Associates
(Financial Planning)
(1983 – Present) | | | 84 | | | Director and
Audit Committee
Chairperson – Andy
Warhol Foundation
Director and Audit
Committee Member –
Systemax, Inc. | |
|
Trend Series- 16
Name,
Address,
and Birth Date | | Position(s)
Held with
Fund(s) | | Length of Time
Served | | Principal
Occupation(s)
During
Past 5 Years | | Number of
Portfolios in Fund
Complex Overseen
by Trustee
or Officer | | Other
Directorships
Held by
Trustee
or Officer | |
| independent trustees (continued) | | | | | | | | | | | | | |
|
Thomas F. Madison
2005 Market Street
Philadelphia, PA
19103
February 25, 1936 | | Trustee | | Since
May 1997 | | President and Chief
Executive Officer –
MLM Partners, Inc.
(Small Business Investing
and Consulting)
(January 1993 – Present) | | | 84 | | | Director –
Banner Health
Director –
CenterPoint Energy
Director and Audit
Committee Member –
Digital River, Inc.
Director and Audit
Committee Member –
Rimage
Corporation
Director – Valmont
Industries, Inc. | |
|
Janet L. Yeomans
2005 Market Street
Philadelphia, PA
19103
July 31, 1948 | | Trustee | | Since
April 1999 | | Vice President
(January 2003 – Present)
and Treasurer
(January 2006 – Present)
3M Corporation
Ms. Yeomans has held
various management positions
at 3M Corporation since 1983. | | | 84 | | | None | |
|
J. Richard Zecher
2005 Market Street
Philadelphia, PA
19103
July 3, 1940 | | Trustee | | Since
March 2005 | | Founder –
Investor Analytics
(Risk Management)
(May 1999 – Present)
Founder –
Sutton Asset Management
(Hedge Fund)
(September 1998 – Present) | | | 84 | | | Director and Audit
Committee Member –
Investor Analytics
Director and Audit
Committee Member –
Oxigene, Inc. | |
|
| officers | | | | | | | | | | | | | |
|
David F. Connor
2005 Market Street
Philadelphia, PA
19103
December 2, 1963 | | Vice President,
Deputy General
Counsel, and Secretary | | Vice President since
September 21, 2000
and Secretary
since
October 2005 | | David F. Connor has served as
Vice President and Deputy
General Counsel of
Delaware Investments
since 2000. | | | 84 | | | None3 | |
|
David P. O'Connor
2005 Market Street
Philadelphia, PA
19103
February 21, 1966 | | Senior Vice
President,
General Counsel,
and Chief
Legal Officer | | Senior Vice President,
General Counsel, and
Chief Legal Officer
since
October 2005 | | David P. O'Connor has served in
various executive and legal
capacities at different times at
Delaware Investments. | | | 84 | | | None3 | |
|
John J. O'Connor
2005 Market Street
Philadelphia, PA
19103
June 16, 1957 | | Senior Vice President
and Treasurer | | Treasurer
since
February 2005 | | John J. O'Connor has served in
various executive capacities
at different times at
Delaware Investments. | | | 84 | | | None3 | |
|
Richard Salus
2005 Market Street
Philadelphia, PA
19103
October 4, 1963 | | Senior
Vice President
and
Chief Financial
Officer | | Chief Financial
Officer since
November 1, 2006 | | Richard Salus has served in
various executive capacities
at different times at
Delaware Investments. | | | 84 | | | None3 | |
|
1 Patrick P. Coyne is considered to be an "Interested Trustee" because he is an executive officer of the Fund's(s') investment advisor.
2 Delaware Investments is the marketing name for Delaware Management Holdings, Inc. and its subsidiaries, including the Fund's(s') investment advisor, principal underwriter, and its transfer agent.
3 David F. Connor, David P. O'Connor, John J. O'Connor, and Richard Salus serve in similar capacities for the six portfolios of the Optimum Fund Trust, which have the same investment advisor, principal underwriter, and transfer agent as the registrant. John J. O'Connor also serves in a similar capacity for Lincoln Variable Insurance Products Trust, which has the same investment advisor as the registrant.
The Statement of Additional Information for the Fund(s) includes additional information about the Trustees and Officers and is available, without charge, upon request by calling 800 523-1918.
Trend Series- 17
Delaware VIP Trust — Delaware VIP U.S. Growth Series
For the 12-month period ended Dec. 31, 2006, the Delaware VIP U.S. Growth Series Standard Class shares with distributions reinvested returned +2.31% and Service Class shares returned +2.06% with distributions reinvested. The benchmark is Russell 1000 Growth Index, which gained 9.07% (source: Lipper).
Our investment approach focuses on individual companies that we believe have particularly good long-term growth prospects over the next five years or longer. The Series' investment portfolio is typically balanced between two types of stocks found in the large-cap growth universe — those of aggressive growth and steady growth companies. During the fiscal period, two stocks that we considered aggressive growth holdings were eBay and Google, which have emerged as leaders in fast-growing segments of the technology market. Holdings in the group of typically steady growers were office products retailer Staples and Walgreen's drug stores.
As long-term investors, we typically seek to avoid large-scale changes as long as we remain confident in the names we own. However, we do respond to new investment opportunities as they become available. For example, we believe that a number of our more aggressive holdings were unreasonably penalized during the fiscal year as investors became more risk averse, and we believe this presented us with attractive buying opportunities. We reduced our positions in Walgreen and Intuit, which have performed well, in order to add to existing positions in Qualcomm and Seagate Technology. The latter two stocks were weak performers on the year; we believed they had growth potential, and they were trading at attractive valuations.
The views expressed are current as of the date of this report and are subject to change.
The performance data quoted below and on the next page represent past performance; past performance does not guarantee future results. Investment return and principal value of an investment will fluctuate so that your shares, when redeemed, may be worth more or less than their original cost. Current performance may be lower or higher than the performance data quoted. Please obtain the performance data for the most recent month end by calling the number noted on the page related to this Series in the introductory section of this report.
You should consider the investment objectives, risks, charges, and expenses of the investment carefully before investing. The Delaware VIP U.S. Growth Series prospectus contains this and other important information about the Series. To obtain a prospectus, contact the company noted on the page related to this Series in the introductory section of this report, either by phone or through the company Web site. We advise you to read the prospectus carefully before you invest.
Average Annual Total Returns
For the periods ending Dec. 31, 2006 | | 1 Year | | 5 Years | | Lifetime | |
| Standard Class Shares* | | | +2.31 | % | | | +1.19 | % | | | -2.86 | % | |
| Service Class Shares** | | | +2.06 | % | | | +0.98 | % | | | -4.51 | % | |
* Commenced operations on Nov. 15, 1999
** Commenced operations on May 1, 2000
U.S. Growth Series- 1
Delaware VIP Trust — Delaware VIP U.S. Growth Series (continued)
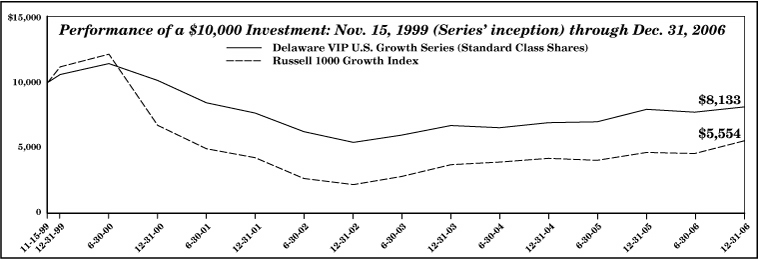
The chart shows a $10,000 investment in the Delaware VIP U.S. Growth Series Standard Class shares for the period from the Series' inception Nov. 15, 1999 through Dec. 31, 2006. All distributions were reinvested. The chart also shows $10,000 invested in the Russell 1000 Growth Index for the period from Nov. 15, 1999 through Dec. 31, 2006.
The Russell 1000 Growth Index measures the performance of those Russell 1000 companies with higher price-to-book ratios and higher forecasted growth values. An index is unmanaged and does not reflect the costs of operating a mutual fund, such as the costs of buying, selling, and holding securities. You cannot invest directly into an index.
Earnings from a variable annuity or variable life investment compound tax free until withdrawal, so no adjustments were made for income taxes.
An expense limitation was in effect for the Delaware VIP U.S. Growth Series during the periods shown.
Performance of Service Class shares will vary due to different charges and expenses.
Performance does not reflect insurance fees related to a variable annuity or variable life investment or the deferred sales charge that would apply to certain withdrawals of investments held for fewer than eight years. Performance shown here would have been reduced if such fees were included and the expense limitation was removed. For more information about fees, consult your variable annuity or variable life prospectus.
Investments in variable products involve risk. Some portfolios offer more risk than others. Please read both the contract and underlying prospectus for specific details regarding the product's risk profile.
U.S. Growth Series- 2
Delaware VIP Trust — Delaware VIP U.S. Growth Series
Disclosure of Series Expenses
For the Period July 1, 2006 to December 31, 2006
As a shareholder of the Series, you incur ongoing costs, including management fees; distribution and/or service (12b-1) fees; and other Series expenses. This Example is intended to help you understand your ongoing costs (in dollars) of investing in the Series and to compare these costs with the ongoing costs of investing in other mutual funds.
The Example is based on an investment of $1,000 invested at the beginning of the period and held for the entire period from July 1, 2006 to December 31, 2006.
Actual Expenses
The first section of the table shown, "Actual Series Return," provides information about actual account values and actual expenses. You may use the information in this section of the table, together with the amount you invested, to estimate the expenses that you paid over the period. Simply divide your account value by $1,000 (for example, an $8,600 account value divided by $1,000 = 8.6), then multiply the result by the number in the first section under the heading entitled "Expenses Paid During Period" to estimate the expenses you paid on your account during the period.
Hypothetical Example for Comparison Purposes
The second section of the table shown, "Hypothetical 5% Return," provides information about hypothetical account values and hypothetical expenses based on the Series' actual expense ratio and an assumed rate of return of 5% per year before expenses, which is not the Series' actual return. The hypothetical account values and expenses may not be used to estimate the actual ending account balance or expenses you paid for the period. You may use this information to compare the ongoing costs of investing in the Series and other funds. To do so, compare the 5% hypothetical example with the 5% hypothetical examples that appear in the shareholder reports of other funds.
Please note that the expenses shown in the table are meant to highlight your ongoing costs only. As a shareholder of the Series, you do not incur any transaction costs, such as sales charges (loads), redemption fees or exchange fees, but shareholders of other funds may incur such costs. Also, the fees related to the variable annuity investment or the deferred sales charge that could apply have not been included. Therefore, the second section of the table is useful in comparing ongoing costs only, and will not help you determine the relative total costs of owning different funds. The Series' actual expenses shown in the table reflect fee waivers in effect for Service Class shares. The expenses shown in the table assume reinvestment of all dividends and distributions.
Expense Analysis of an Investment of $1,000
| | | Beginning
Account
Value
7/1/06 | | Ending
Account
Value
12/31/06 | | Annualized
Expense
Ratios | | Expenses
Paid During
Period
7/1/06 to
12/31/06* | |
| Actual Series Return | |
| Standard Class | | $ | 1,000.00 | | | $ | 1,051.50 | | | | 0.78 | % | | $ | 4.03 | | |
| Service Class | | | 1,000.00 | | | | 1,049.00 | | | | 1.03 | % | | | 5.32 | | |
| Hypothetical 5% Return (5% return before expenses) | |
| Standard Class | | $ | 1,000.00 | | | $ | 1,021.27 | | | | 0.78 | % | | $ | 3.97 | | |
| Service Class | | | 1,000.00 | | | | 1,020.01 | | | | 1.03 | % | | | 5.24 | | |
*"Expenses Paid During Period" are equal to the Series' annualized expense ratio, multiplied by the average account value over the period, multiplied by 184/365 (to reflect the one-half year period).
U.S. Growth Series- 3
Delaware VIP Trust — Delaware VIP U.S. Growth Series
Sector Allocation and Top 10 Holdings
As of December 31, 2006
Sector designations may be different than the sector designations presented in other Series materials.
| Sector | | Percentage
of Net Assets | |
| Common Stock | | | 99.28 | % | |
| Basic Industry/Capital Goods | | | 3.52 | % | |
| Business Services | | | 17.05 | % | |
| Consumer Non-Durables | | | 15.38 | % | |
| Consumer Services | | | 17.01 | % | |
| Financials | | | 8.13 | % | |
| Health Care | | | 17.61 | % | |
| Technology | | | 20.58 | % | |
| Repurchase Agreements | | | 2.31 | % | |
| Total Market Value of Securities | | | 101.59 | % | |
| Liabilities Net of Receivables and Other Assets | | | (1.59 | %) | |
| Total Net Assets | | | 100.00 | % | |
Holdings are for informational purposes only and are subject to change at any time.
They are not a recommendation to buy, sell, or hold any security.
| Top 10 Holdings | | Percentage
of Net Assets | |
| QUALCOMM | | | 4.91 | % | |
| UnitedHealth Group | | | 4.85 | % | |
| Genentech | | | 4.81 | % | |
| IntercontinentalExchange | | | 4.39 | % | |
| Seagate Technology | | | 4.34 | % | |
| United Parcel Service Class B | | | 4.23 | % | |
| Allergan | | | 4.19 | % | |
| Procter & Gamble | | | 4.17 | % | |
| Google Class A | | | 4.16 | % | |
| eBay | | | 4.16 | % | |
U.S. Growth Series- 4
Delaware VIP Trust — Delaware VIP U.S. Growth Series
Statement of Net Assets
December 31, 2006
| | | Number of
Shares | | Market
Value | |
| COMMON STOCK–99.28% | |
| Basic Industry/Capital Goods–3.52% | |
| Praxair | | | 105,000 | | | $ | 6,229,650 | | |
| | | | | | | | 6,229,650 | | |
| Business Services–17.05% | |
| Expeditors International Washington | | | 150,000 | | | | 6,075,000 | | |
| Moody's | | | 90,000 | | | | 6,215,400 | | |
| Paychex | | | 160,000 | | | | 6,326,400 | | |
| † Research in Motion | | | 32,000 | | | | 4,088,960 | | |
| United Parcel Service Class B | | | 100,000 | | | | 7,498,000 | | |
| | | | | | | | 30,203,760 | | |
| Consumer Non-Durables–15.38% | |
| Procter & Gamble | | | 115,000 | | | | 7,391,050 | | |
| Staples | | | 270,000 | | | | 7,209,000 | | |
| Walgreen | | | 160,000 | | | | 7,342,400 | | |
| Wal-Mart Stores | | | 115,000 | | | | 5,310,700 | | |
| | | | | | | | 27,253,150 | | |
| Consumer Services–17.01% | |
| † eBay | | | 245,000 | | | | 7,367,150 | | |
| International Game Technology | | | 135,000 | | | | 6,237,000 | | |
| † MGM MIRAGE | | | 115,000 | | | | 6,595,250 | | |
| Weight Watchers International | | | 110,000 | | | | 5,778,300 | | |
| Western Union | | | 185,000 | | | | 4,147,700 | | |
| | | | | | | | 30,125,400 | | |
| Financials–8.13% | |
| Chicago Mercantile Exchange Class A | | | 13,000 | | | | 6,626,750 | | |
| † IntercontinentalExchange | | | 72,000 | | | | 7,768,800 | | |
| | | | | | | | 14,395,550 | | |
| Health Care–17.61% | |
| Allergan | | | 62,000 | | | | 7,423,880 | | |
| † Genentech | | | 105,000 | | | | 8,518,650 | | |
| UnitedHealth Group | | | 160,000 | | | | 8,596,800 | | |
| † Zimmer | | | 85,000 | | | | 6,662,300 | | |
| | | | | | | | 31,201,630 | | |
| Technology–20.58% | |
| † Google Class A | | | 16,000 | | | | 7,367,680 | | |
| † Intuit | | | 205,000 | | | | 6,254,550 | | |
| QUALCOMM | | | 230,000 | | | | 8,691,700 | | |
| † SanDisk | | | 150,000 | | | | 6,454,500 | | |
| Seagate Technology | | | 290,000 | | | | 7,685,000 | | |
| | | | | | | | 36,453,430 | | |
Total Common Stock
(cost $153,810,381) | | | | | | | 175,862,570 | | |
| | | Principal
Amount | | Market
Value | |
| REPURCHASE AGREEMENTS–2.31% | |
With BNP Paribas 4.80% 1/2/07
(dated 12/29/06, to be repurchased
at $1,556,830, collateralized by
$1,628,000 U.S. Treasury Bills
due 6/28/07, market value $1,588,601) | | $ | 1,556,000 | | | $ | 1,556,000 | | |
With Cantor Fitzgerald 4.82% 1/2/07
(dated 12/29/06, to be repurchased at
$1,870,001, collateralized by $161,000
U.S. Treasury Notes 4.00% due 6/15/09,
market value $158,937, $1,001,000
U.S. Treasury Notes 6.125%
due 8/15/07, market value $1,031,386
and $668,000 U.S. Treasury Notes
6.50% due 2/15/10,
market value $718,170) | | | 1,869,000 | | | | 1,869,000 | | |
With UBS Warburg 4.75% 1/2/07
(dated 12/29/06, to be repurchased
at $668,353, collateralized by
$690,000 U.S. Treasury Bills
due 3/29/07, market value $681,591) | | | 668,000 | | | | 668,000 | | |
Total Repurchase Agreements
(cost $4,093,000) | | | | | | | 4,093,000 | | |
U.S. Growth Series- 5
Delaware VIP U.S. Growth Series
Statement of Net Assets (continued)
| TOTAL MARKET VALUE OF SECURITIES–101.59% (cost $157,903,381) | | $ | 179,955,570 | | |
| LIABILITIES NET OF RECEIVABLES AND OTHER ASSETS–(1.59%) | | | (2,811,071 | ) | |
| NET ASSETS APPLICABLE TO 22,285,981 SHARES OUTSTANDING–100.00% | | $ | 177,144,499 | | |
| NET ASSET VALUE–DELAWARE VIP U.S. GROWTH SERIES STANDARD CLASS ($138,547,902 / 17,412,803 Shares) | | $ | 7.96 | | |
| NET ASSET VALUE–DELAWARE VIP U.S. GROWTH SERIES SERVICE CLASS ($38,596,597 / 4,873,178 Shares) | | $ | 7.92 | | |
| COMPONENTS OF NET ASSETS AT DECEMBER 31, 2006: | |
| Shares of beneficial interest (unlimited authorization-no par) | | $ | 171,173,502 | | |
| Accumulated net realized loss on investments | | | (16,081,192 | ) | |
| Net unrealized appreciation of investments | | | 22,052,189 | | |
| Total net assets | | $ | 177,144,499 | | |
† Non-income producing security for the year ended December 31, 2006.
See accompanying notes
U.S. Growth Series-6
Delaware VIP Trust — Delaware VIP U.S. Growth Series
Statement of Operations
Year Ended December 31, 2006
Delaware VIP Trust — Delaware VIP U.S. Growth Series
Statements of Changes in Net Assets
| INVESTMENT INCOME: | |
| Dividends | | $ | 825,069 | | |
| Interest | | | 101,628 | | |
| | | | 926,697 | | |
| EXPENSES: | |
| Management fees | | | 830,969 | | |
| Distribution expenses – Service Class | | | 116,949 | | |
| Accounting and administration expenses | | | 51,137 | | |
| Trustees' fees and benefits | | | 24,794 | | |
| Audit and tax | | | 12,877 | | |
| Legal fees | | | 12,852 | | |
| Dividend disbursing and transfer agent fees and expenses | | | 12,783 | | |
| Reports and statements to shareholders | | | 8,932 | | |
| Insurance fees | | | 6,823 | | |
| Registration fees | | | 6,561 | | |
| Custodian fees | | | 5,192 | | |
| Consulting fees | | | 2,838 | | |
| Dues and services | | | 1,443 | | |
| Trustees' expenses | | | 832 | | |
| Taxes (other than taxes on income) | | | 567 | | |
| Pricing fees | | | 222 | | |
| | | | 1,095,771 | | |
| Less waiver of distribution expenses – Service Class | | | (19,491 | ) | |
| Less expense paid indirectly | | | (373 | ) | |
| Total operating expenses | | | 1,075,907 | | |
| NET INVESTMENT LOSS | | | (149,210 | ) | |
NET REALIZED AND UNREALIZED GAIN (LOSS)
ON INVESTMENTS: | |
| Net realized loss on investments | | | (5,942,640 | ) | |
Net change in unrealized appreciation/depreciation
of investments | | | 11,250,393 | | |
NET REALIZED AND UNREALIZED GAIN ON
INVESTMENTS | | | 5,307,753 | | |
NET INCREASE IN NET ASSETS RESULTING
FROM OPERATIONS | | $ | 5,158,543 | | |
See accompanying notes
| | | Year Ended | |
| | | 12/31/06 | | 12/31/05 | |
INCREASE (DECREASE) IN NET
ASSETS FROM OPERATIONS: | |
| Net investment loss | | $ | (149,210 | ) | | $ | (142,189 | ) | |
| Net realized gain (loss) on investments | | | (5,942,640 | ) | | | 1,289,624 | | |
Net change in unrealized appreciation/
depreciation of investments | | | 11,250,393 | | | | 7,020,019 | | |
Net increase in net assets
resulting from operations | | | 5,158,543 | | | | 8,167,454 | | |
DIVIDENDS AND DISTRIBUTIONS
TO SHAREHOLDERS FROM: | |
| Net investment income: | |
| Standard Class | | | – | | | | (58,346 | ) | |
| Service Class | | | – | | | | (147,794 | ) | |
| | | | – | | | | (206,140 | ) | |
| CAPITAL SHARE TRANSACTIONS: | |
| Proceeds from shares sold: | |
| Standard Class | | | 102,645,141 | | | | 36,446,938 | | |
| Service Class | | | 4,028,901 | | | | 6,320,210 | | |
Net asset value of shares issued upon
reinvestment of dividends and distributions: | |
| Standard Class | | | – | | | | 58,346 | | |
| Service Class | | | – | | | | 147,794 | | |
| | | | 106,674,042 | | | | 42,973,288 | | |
| Cost of shares repurchased: | |
| Standard Class | | | (14,132,286 | ) | | | (3,859,090 | ) | |
| Service Class | | | (8,271,201 | ) | | | (7,451,404 | ) | |
| | | | (22,403,487 | ) | | | (11,310,494 | ) | |
Increase in net assets derived from
capital share transactions | | | 84,270,555 | | | | 31,662,794 | | |
| NET INCREASE IN NET ASSETS | | | 89,429,098 | | | | 39,624,108 | | |
| NET ASSETS: | |
| Beginning of year | | | 87,715,401 | | | | 48,091,293 | | |
End of year (there was no undistributed
net investment income at either year end) | | $ | 177,144,499 | | | $ | 87,715,401 | | |
See accompanying notes
U.S. Growth Series-7
Delaware VIP Trust — Delaware VIP U.S. Growth Series
Financial Highlights
Selected data for each share of the Series outstanding throughout each period were as follows:
| | | Delaware VIP U.S. Growth Series Standard Class | |
| | | Year Ended | |
| | | 12/31/06 | | 12/31/05 | | 12/31/04 | | 12/31/03 | | 12/31/02 | |
| Net asset value, beginning of period | | $ | 7.780 | | | $ | 6.830 | | | $ | 6.620 | | | $ | 5.370 | | | $ | 7.600 | | |
| Income (loss) from investment operations: | |
| Net investment income (loss)1 | | | (0.003 | ) | | | (0.005 | ) | | | 0.049 | | | | 0.010 | | | | 0.010 | | |
| Net realized and unrealized gain (loss) on investments | | | 0.183 | | | | 0.997 | | | | 0.169 | | | | 1.251 | | | | (2.215 | ) | |
| Total from investment operations | | | 0.180 | | | | 0.992 | | | | 0.218 | | | | 1.261 | | | | (2.205 | ) | |
| Less dividends and distributions from: | |
| Net investment income | | | – | | | | (0.042 | ) | | | (0.008 | ) | | | (0.011 | ) | | | (0.025 | ) | |
| Total dividends and distributions | | | – | | | | (0.042 | ) | | | (0.008 | ) | | | (0.011 | ) | | | (0.025 | ) | |
| Net asset value, end of period | | $ | 7.960 | | | $ | 7.780 | | | $ | 6.830 | | | $ | 6.620 | | | $ | 5.370 | | |
| Total return2 | | | 2.31 | % | | | 14.65 | % | | | 3.30 | % | | | 23.75 | % | | | (29.24 | %) | |
| Ratios and supplemental data: | |
| Net assets, end of period (000 omitted) | | $ | 138,548 | | | $ | 45,653 | | | $ | 10,438 | | | $ | 11,862 | | | $ | 9,595 | | |
| Ratio of expenses to average net assets | | | 0.77 | % | | | 0.81 | % | | | 0.76 | % | | | 0.75 | % | | | 0.75 | % | |
| Ratio of net investment income (loss) to average net assets | | | (0.04 | %) | | | (0.07 | %) | | | 0.77 | % | | | 0.17 | % | | | 0.15 | % | |
| Portfolio turnover | | | 21 | % | | | 91 | % | | | 167 | % | | | 102 | % | | | 101 | % | |
1The average shares outstanding method has been applied for per share information.
2Total investment return is based on the change in net asset value of a share during the period and assumes reinvestment of dividends and distributions at net asset value.
See accompanying notes
U.S. Growth Series- 8
Delaware VIP U.S. Growth Series
Financial Highlights (continued)
Selected data for each share of the Series outstanding throughout each period were as follows:
| | | Delaware VIP U.S. Growth Series Service Class | |
| | | Year Ended | |
| | | 12/31/06 | | 12/31/05 | | 12/31/04 | | 12/31/03 | | 12/31/02 | |
| Net asset value, beginning of period | | $ | 7.760 | | | $ | 6.810 | | | $ | 6.610 | | | $ | 5.360 | | | $ | 7.590 | | |
| Income (loss) from investment operations: | |
| Net investment income (loss)1 | | | (0.022 | ) | | | (0.023 | ) | | | 0.033 | | | | (0.005 | ) | | | 0.001 | | |
| Net realized and unrealized gain (loss) on investments | | | 0.182 | | | | 0.999 | | | | 0.167 | | | | 1.257 | | | | (2.218 | ) | |
| Total from investment operations | | | 0.160 | | | | 0.976 | | | | 0.200 | | | | 1.252 | | | | (2.217 | ) | |
| Less dividends and distributions from: | |
| Net investment income | | | – | | | | (0.026 | ) | | | – | | | | (0.002 | ) | | | (0.013 | ) | |
| Total dividends and distributions | | | – | | | | (0.026 | ) | | | – | | | | (0.002 | ) | | | (0.013 | ) | |
| Net asset value, end of period | | $ | 7.920 | | | $ | 7.760 | | | $ | 6.810 | | | $ | 6.610 | | | $ | 5.360 | | |
| Total return2 | | | 2.06 | % | | | 14.41 | % | | | 3.03 | % | | | 23.37 | % | | | (29.26 | %) | |
| Ratios and supplemental data: | |
| Net assets, end of period (000 omitted) | | $ | 38,596 | | | $ | 42,062 | | | $ | 37,653 | | | $ | 9,718 | | | $ | 666 | | |
| Ratio of expenses to average net assets | | | 1.02 | % | | | 1.06 | % | | | 1.01 | % | | | 0.97 | % | | | 0.90 | % | |
Ratio of expenses to average net assets prior to expense
limitation and expenses paid indirectly | | | 1.07 | % | | | 1.11 | % | | | 1.06 | % | | | 1.00 | % | | | 0.90 | % | |
| Ratio of net investment income (loss) to average net assets | | | (0.29 | %) | | | (0.32 | %) | | | 0.52 | % | | | (0.05 | %) | | | 0.00 | % | |
Ratio of net investment income (loss) to average
net assets prior to expense limitation and
expenses paid indirectly | | | (0.34 | %) | | | (0.37 | %) | | | 0.47 | % | | | (0.08 | %) | | | 0.00 | % | |
| Portfolio turnover | | | 21 | % | | | 91 | % | | | 167 | % | | | 102 | % | | | 101 | % | |
1The average shares outstanding method has been applied for per share information.
2Total investment return is based on the change in net asset value of a share during the period and assumes reinvestment of dividends and distributions at net asset value. Total investment return reflects waivers and payment of fees by the distributor, as applicable. Performance would have been lower had the expense limitation and waiver not been in effect.
See accompanying notes
U.S. Growth Series- 9
Delaware VIP Trust — Delaware VIP U.S. Growth Series
Notes to Financial Statements
December 31, 2006
Delaware VIP Trust (the "Trust") is organized as a Delaware statutory trust and offers 15 series: Delaware VIP Balanced Series, Delaware VIP Capital Reserves Series, Delaware VIP Cash Reserve Series, Delaware VIP Diversified Income Series, Delaware VIP Emerging Markets Series, Delaware VIP Global Bond Series, Delaware VIP Growth Opportunities Series, Delaware VIP High Yield Series, Delaware VIP International Value Equity Series, Delaware VIP REIT Series, Delaware VIP Select Growth Series, Delaware VIP Small Cap Value Series, Delaware VIP Trend Series, Delaware VIP U.S. Growth Series and Delaware VIP Value Series. These financial statements and the related notes pertain to Delaware VIP U.S. Growth Series (the "Series"). The Trust is an open-end investment company. The Series is considered diversified under the Investment Company Act of 1940, as amended, and offers Standard Class and Service Class shares. The Standard Class shares do not carry a 12b-1 fee and the Service Class shares carry a 12b-1 fee. The shares of the Series are sold only to separate accounts of life insurance companies.
The investment objective of the Series is to seek long-term capital appreciation.
1. Significant Accounting Policies
The following accounting policies are in accordance with U.S. generally accepted accounting principles and are consistently followed by the Series.
Security Valuation—Equity securities, except those traded on the Nasdaq Stock Market, Inc. (Nasdaq), are valued at the last quoted sales price as of the time of the regular close of the New York Stock Exchange (NYSE) on the valuation date. Securities traded on the Nasdaq are valued in accordance with the Nasdaq Official Closing Price, which may not be the last sales price. If on a particular day an equity security does not trade, then the mean between the bid and asked prices will be used. Short-term debt securities having less than 60 days to maturity are valued at amortized cost, which approximates market value. Other securities and assets for which market quotations are not readily available are valued at fair value as determined in good faith under the direction of the Series' Board of Trustees. In determining whether market quotations are readily availab le or fair valuation will be used, various factors will be taken into consideration, such as market closures, or with respect to foreign securities, aftermarket trading or significant events after local market trading (e.g., government actions or pronouncements, trading volume or volatility on markets, exchanges among dealers, or news events).
In September 2006, the Financial Accounting Standards Board (FASB) issued FASB Statement No. 157 "Fair Value Measurements" (Statement 157). Statement 157 establishes a framework for measuring fair value in generally accepted accounting principles, clarifies the definition of fair value within that framework, and expands disclosures about the use of fair value measurements. Statement 157 is intended to increase consistency and comparability among fair value estimates used in financial reporting. Statement 157 is effective for fiscal years beginning after November 15, 2007. Management does not expect the adoption of Statement 157 to have an impact on the amounts reported in the financial statements.
Federal Income Taxes—The Series intends to continue to qualify for federal income tax purposes as a regulated investment company and make the requisite distributions to shareholders. Accordingly, no provision for federal income taxes has been made in the financial statements.
On July 13, 2006, FASB released FASB Interpretation No. 48 "Accounting for Uncertainty in Income Taxes" (FIN 48). FIN 48 provides guidance for how uncertain tax positions should be recognized, measured, presented and disclosed in the financial statements. FIN 48 requires the evaluation of tax positions taken or expected to be taken in the course of preparing the Series' tax returns to determine whether the tax positions are "more-likely-than-not" of being sustained by the applicable tax authority. Tax positions not deemed to meet the more-likely-than-not threshold would be recorded as a tax benefit or expense in the current year. Adoption of FIN 48 is required for fiscal years beginning after December 15, 2006 and is to be applied to all open tax years as of the effective date. Recent SEC guidance allows implementing FIN 48 in Series net asset value calculations as late as the Series' last net asset value calculation in the first required fi nancial statement reporting period. As a result, the Series will incorporate FIN 48 in its semiannual report on June 30, 2007. Although the Series' tax positions are currently being evaluated, management does not expect the adoption of FIN 48 to have a material impact on the Series' financial statements.
Class Accounting—Investment income, common expenses and realized and unrealized gain (loss) on investments are allocated to the classes of the Series on the basis of daily net assets of each class. Distribution expenses relating to a specific class are charged directly to that class.
Repurchase Agreements—The Series may invest in a pooled cash account along with other members of the Delaware Investments® Family of Funds pursuant to an exemptive order issued by the Securities and Exchange Commission. The aggregate daily balance of the pooled cash account is invested in repurchase agreements secured by obligations of the U.S. government. The respective collateral is held by the Series' custodian bank until the maturity of the respective repurchase agreements. Each repurchase agreement is at least 102% collateralized. However, in the event of default or bankruptcy by the counterparty to the agreement, realization of the collateral may be subject to legal proceedings.
Use of Estimates—The preparation of financial statements in conformity with U.S. generally accepted accounting principles requires management to make estimates and assumptions that affect the reported amounts of assets and liabilities at the date of the financial statements and the reported amounts of revenues and expenses during the reporting period. Actual results could differ from those estimates.
Other—Expenses directly attributable to the Series are charged directly to the Series. Other expenses common to various funds within the Delaware Investments® Family of Funds are generally allocated amongst such funds on the basis of average net assets. Management fees and some other expenses are paid monthly. Security transactions are recorded on the date the securities are purchased or sold (trade date) for financial reporting purposes. Costs used in calculating realized gains and losses on the sale of investment securities are those of the specific securities sold. Dividend income is recorded on the ex-dividend date and interest income is recorded on the accrual basis.
The Series declares and pays dividends from net investment income and distributions from net realized gain on investments, if any, following the close of the fiscal year.
U.S. Growth Series- 10
Delaware VIP U.S. Growth Series
Notes to Financial Statements (continued)
1. Significant Accounting Policies (continued)
Subject to seeking best execution, the Series may direct certain security trades to brokers who have agreed to rebate a portion of the related brokerage commission to the Series in cash. Such commission rebates are included in realized gain on investments in the accompanying financial statements and totaled $17,921 for the year ended December 31, 2006. In general, best execution refers to many factors, including the price paid or received for a security, the commission charged, the promptness and reliability of execution, the confidentiality and placement accorded the order, and other factors affecting the overall benefit obtained by the Series on the transaction.
The Series receives earnings credits from its custodian when positive cash balances are maintained, which are used to offset custody fees. The expense paid under this arrangement is included in custodian fees on the Statement of Operations with the corresponding expense offset shown as "expense paid indirectly."
2. Investment Management, Administration Agreements and Other Transactions with Affiliates
In accordance with the terms of its investment management agreement, the Series pays Delaware Management Company (DMC), a series of Delaware Management Business Trust and the investment manager, an annual fee which is calculated daily at the rate of 0.65% on the first $500 million of average daily net assets of the Series, 0.60% on the next $500 million, 0.55% on the next $1.5 billion and 0.50% on average daily net assets in excess of $2.5 billion.
DMC has contractually agreed to waive that portion, if any, of its management fee and reimburse the Series to the extent necessary to ensure that annual operating expenses, exclusive of taxes, interest, brokerage commissions, distribution fees, certain insurance costs and extraordinary expenses, do not exceed 0.87% of average daily net assets of the Series through April 30, 2007. Prior to May 1, 2006, the expense limitation was 0.80% of average daily net assets. No reimbursement was due for the year ended December 31, 2006.
Delaware Service Company, Inc. (DSC), an affiliate of DMC, provides accounting, administration, dividend disbursing and transfer agent services. The Series pays DSC a monthly fee computed at the annual rate of 0.04% of the Series' average daily net assets for accounting and administrative services. The Series pays DSC a monthly fee based on average net assets for dividend disbursing and transfer agent services.
Pursuant to a distribution agreement and distribution plan, the Series pays Delaware Distributors, L.P. (DDLP), the distributor and an affiliate of DMC, an annual distribution and service fee not to exceed 0.30% of the average daily net assets of the Service Class shares. DDLP has contracted to waive distribution and service fees through April 30, 2007 in order to prevent distribution and service fees of the Service Class shares from exceeding 0.25% of average daily net assets. Standard Class shares pay no distribution and service expenses.
At December 31, 2006, the Series had liabilities payable to affiliates as follows:
Investment
Management
Fee Payable to
DMC | | Dividend Disbursing,
Transfer Agent,
Accounting and Administration
Fees and Other Expenses
Payable to DSC | | Distribution
Fees Payable
to DDLP | | Other Expenses
Payable to DMC
and Affiliates* | |
| $ | 95,884 | | | $ | 8,152 | | | $ | 8,197 | | | $ | 6,705 | | |
*DMC, as part of its administrative services, pays operating expenses on behalf of the Series and is reimbursed on a periodic basis. Such expenses include items such as printing of shareholder reports, fees for audit, legal and tax services, custodian fees and trustees' fees.
As provided in the investment management agreement, the Series bears the cost of certain legal and tax services, including internal legal and tax services provided to the Series by DMC and/or its affiliates' employees. For the year ended December 31, 2006, the Series was charged $6,332 for internal legal and tax services provided by DMC and/or its affiliates' employees.
Trustees' fees and benefits include expenses accrued by the Series for each Trustee's retainer, per meeting fees and retirement benefits. Independent Trustees with over five years of uninterrupted service are eligible to participate in a retirement plan that provides for the payment of benefits upon retirement. The amount of the retirement benefit is based on factors set forth in the plan, including the number of years of service. On November 16, 2006, the Board of Trustees unanimously voted to terminate the retirement plan. Payments equal to the net present value of the earned benefits will be made in 2007 to those independent trustees so entitled. The retirement benefit payout for the Series is $17,853. Certain officers of DMC, DSC and DDLP are officers and/or trustees of the Trust. These officers and trustees are paid no compensation by the Series.
U.S. Growth Series- 11
Delaware VIP U.S. Growth Series
Notes to Financial Statements (continued)
3. Investments
For the year ended December 31, 2006, the Series made purchases and sales of investment securities other than short-term investments as follows:
| Purchases | | $ | 110,715,987 | | |
| Sales | | | 26,426,857 | | |
At December 31, 2006, the cost of investments for federal income tax purposes and unrealized appreciation (depreciation) for the Series were as follows:
Cost of
Investments | | Aggregate
Unrealized
Appreciation | | Aggregate
Unrealized
Depreciation | | Net Unrealized
Appreciation | |
| $ | 157,903,763 | | | $ | 22,948,145 | | | $ | (896,338 | ) | | $ | 22,051,807 | | |
4. Dividend and Distribution Information
Income and long-term capital gain distributions are determined in accordance with federal income tax regulations, which may differ from U.S. generally accepted accounting principles. Additionally, net short-term gains on sales of investment securities are treated as ordinary income for federal income tax purposes. There were no distributions paid during the year ended December 31, 2006. The tax character of dividends and distributions paid during the year ended December 31, 2005 was as follows:
| | | Year
Ended
12/31/05 | |
| Ordinary income | | $ | 206,140 | | |
5. Components of Net Assets on a Tax Basis
As of December 31, 2006, the components of net assets on a tax basis were as follows:
| Shares of beneficial interest | | $ | 171,173,502 | | |
| Capital loss carryforwards | | | (14,949,348 | ) | |
| Post-October losses | | | (1,131,462 | ) | |
| Unrealized appreciation of investments | | | 22,051,807 | | |
| Net assets | | $ | 177,144,499 | | |
The differences between book basis and tax basis components of net assets are primarily attributable to tax deferral of losses on wash sales.
Post-October losses represent losses realized on investment transactions from November 1, 2006 through December 31, 2006 that, in accordance with federal income tax regulations, the Series has elected to defer and treat as having arisen in the following fiscal year.
For financial reporting purposes, capital accounts are adjusted to reflect the tax character of permanent book/tax differences. Reclassifications are primarily due to tax treatment of net operating losses. Results of operations and net assets were not affected by these reclassifications. For the year ended December 31, 2006, the Series recorded the following reclassificiations:
Accumulated
Net
Investment Loss | | Paid-in
Capital | |
| $ | 149,210 | | | $ | (149,210 | ) | |
For federal income tax purposes, capital loss carryforwards may be carried forward and applied against future capital gains. Capital loss carryforwards remaining at December 31, 2006 will expire as follows: $75,384 expires in 2008, $4,507,939 expires in 2009, $3,675,553 expires in 2010, $1,428,622 expires in 2011, $450,672 expires in 2012 and $4,811,178 expires in 2014.
U.S. Growth Series- 12
Delaware VIP U.S. Growth Series
Notes to Financial Statements (continued)
6. Capital Shares
Transactions in capital shares were as follows:
| | | Year
Ended
12/31/06 | | Year
Ended
12/31/05 | |
| Shares sold: | |
| Standard Class | | | 13,447,718 | | | | 4,883,834 | | |
| Service Class | | | 525,533 | | | | 922,111 | | |
Shares issued upon reinvestment of dividends
and distributions: | |
| Standard Class | | | – | | | | 9,018 | | |
| Service Class | | | – | | | | 22,878 | | |
| | | | 13,973,251 | | | | 5,837,841 | | |
| Shares repurchased: | |
| Standard Class | | | (1,906,393 | ) | | | (550,181 | ) | |
| Service Class | | | (1,073,004 | ) | | | (1,050,132 | ) | |
| | | | (2,979,397 | ) | | | (1,600,313 | ) | |
| Net increase | | | 10,993,854 | | | | 4,237,528 | | |
7. Line of Credit
The Series, along with certain other funds in the Delaware Investments® Family of Funds (the "Participants"), participates in a $225,000,000 revolving line of credit facility to be used for temporary or emergency purposes as an additional source of liquidity to fund redemptions of investor shares. The Participants are charged an annual commitment fee, which is allocated across the Participants on the basis of each Participant's allocation of the entire facility. The Participants may borrow up to a maximum of one third of their net assets under the agreement. The Series had no amounts outstanding as of December 31, 2006, or at any time during the year then ended.
8. Credit and Market Risk
The Series may invest up to 15% of its total assets in illiquid securities, which may include securities with contractual restrictions on resale, securities exempt from registration under Rule 144A of the Securities Act of 1933, as amended, and other securities which may not be readily marketable. The relative illiquidity of these securities may impair the Series from disposing of them in a timely manner and at a fair price when it is necessary or desirable to do so. While maintaining oversight, the Series' Board of Trustees has delegated to DMC the day-to-day functions of determining whether individual securities are liquid for purposes of the Series' limitation on investments in illiquid assets. At December 31, 2006, there were no Rule 144A securities and no securities have been determined to be illiquid under the Series' Liquidity Procedures.
9. Contractual Obligations
The Series enters into contracts in the normal course of business that contain a variety of indemnifications. The Series' maximum exposure under these arrangements is unknown. However, the Series has not had prior claims or losses pursuant to these contracts. Management has reviewed the Series' existing contracts and expects the risk of loss to be remote.
U.S. Growth Series- 13
Delaware VIP Trust — Delaware VIP U.S. Growth Series
Report of Independent Registered Public Accounting Firm
To the Shareholders and Board of Trustees
Delaware VIP Trust — Delaware VIP U.S. Growth Series
We have audited the accompanying statement of net assets of the Delaware VIP U.S. Growth Series (one of the series constituting Delaware VIP Trust) (the "Series") as of December 31, 2006, and the related statement of operations for the year then ended, the statements of changes in net assets for each of the two years in the period then ended, and the financial highlights for each of the five years in the period then ended. These financial statements and financial highlights are the responsibility of the Series' management. Our responsibility is to express an opinion on these financial statements and financial highlights based on our audits.
We conducted our audits in accordance with the standards of the Public Company Accounting Oversight Board (United States). Those standards require that we plan and perform the audit to obtain reasonable assurance about whether the financial statements and financial highlights are free of material misstatement. We were not engaged to perform an audit of the Series' internal control over financial reporting. Our audits included consideration of internal control over financial reporting as a basis for designing audit procedures that are appropriate in the circumstances, but not for the purpose of expressing an opinion on the effectiveness of the Series' internal control over financial reporting. Accordingly, we express no such opinion. An audit also includes examining, on a test basis, evidence supporting the amounts and disclosures in the financial statements and financial highlights, assessing the accounting principles used and significant es timates made by management, and evaluating the overall financial statement presentation. Our procedures included confirmation of securities owned as of December 31, 2006, by correspondence with the custodian and brokers or by other appropriate auditing procedures where replies from brokers were not received. We believe that our audits provide a reasonable basis for our opinion.
In our opinion, the financial statements and financial highlights referred to above present fairly, in all material respects, the financial position of the Delaware VIP U.S. Growth Series of Delaware VIP Trust at December 31, 2006, the results of its operations for the year then ended, the changes in its net assets for each of the two years in the period then ended, and its financial highlights for each of five years in the period then ended, in conformity with U.S. generally accepted accounting principles.

Philadelphia, Pennsylvania
February 14, 2007
The Series files its complete schedule of portfolio holdings with the Securities and Exchange Commission for the first and third quarters of each fiscal year on Form N-Q. The Series' Forms N-Q, as well as a description of the policies and procedures that the Series uses to determine how to vote proxies (if any) relating to portfolio securities is available without charge (i) upon request, by calling 800-523-1918; (ii) on the Series' website at http://www.delawareinvestments.com; and (iii) on the Commission's website at http://www.sec.gov. The Series' Forms N-Q may be reviewed and copied at the Commission's Public Reference Room in Washington, DC; information on the operation of the Public Reference Room may be obtained by calling 1-800-SEC-0330.
Information (if any) regarding how the Series voted proxies relating to portfolio securities during the most recently disclosed 12-month period ended June 30 is available without charge (i) through the Series' website at http://www.delawareinvestments.com; and (ii) on the Commission's website at http://www.sec.gov.
U.S. Growth Series- 14
Delaware Investments® Family of Funds
board of trustees/directors and officers addendum
A mutual fund is governed by a Board of Trustees/Directors ("Trustees"), which has oversight responsibility for the management of a fund's business affairs. Trustees establish procedures and oversee and review the performance of the investment manager, the distributor, and others who perform services for the fund. The independent fund trustees, in particular, are advocates for shareholder interests. Each trustee has served in that capacity since he or she was elected to or appointed to the Board of Trustees, and will continue to serve until his or her retirement or the election of a new trustee in his or her place. The following is a list of the Trustees and Officers with certain background and related information.
Name,
Address,
and Birth Date | | Position(s)
Held with
Fund(s) | | Length of Time
Served | | Principal
Occupation(s)
During
Past 5 Years | | Number of
Portfolios in Fund
Complex Overseen
by Trustee
or Officer | | Other
Directorships
Held by
Trustee
or Officer | |
| interested trustees | | | | | | | | | | | | | |
|
Patrick P. Coyne1
2005 Market Street
Philadelphia, PA
19103
April 14, 1963 | | Chairman,
President,
Chief Executive
Officer, and
Trustee | | Chairman and Trustee
since August 16, 2006
President and
Chief Executive Officer
since August 1, 2006 | | Patrick P. Coyne has served in
various executive capacities
at different times at
Delaware Investments.2 | | | 84 | | | None | |
|
| independent trustees | | | | | | | | | | | | | |
|
Thomas L. Bennett
2005 Market Street
Philadelphia, PA
19103
October 4, 1947 | | Trustee | | Since
March 2005 | | Private Investor –
(March 2004 – Present)
Investment Manager –
Morgan Stanley & Co.
(January 1984 – March 2004) | | | 84 | | | None | |
|
John A. Fry
2005 Market Street
Philadelphia, PA
19103
May 28, 1960 | | Trustee | | Since
January 2001 | | President –
Franklin & Marshall College
(June 2002 – Present)
Executive Vice President –
University of Pennsylvania
(April 1995 – June 2002) | | | 84 | | | Director –
Community Health
Systems
Director –
Allied Barton
Security Holdings | |
|
Anthony D. Knerr
2005 Market Street
Philadelphia, PA
19103
December 7, 1938 | | Trustee | | Since
April 1990 | | Founder and Managing Director –
Anthony Knerr & Associates
(Strategic Consulting)
(1990 – Present) | | | 84 | | | None | |
|
Lucinda S. Landreth
2005 Market Street
Philadelphia, PA
19103
June 24, 1947 | | Trustee | | Since
March 2005 | | Chief Investment Officer –
Assurant, Inc.
(Insurance)
(2002 – 2004) | | | 84 | | | None | |
|
Ann R. Leven
2005 Market Street
Philadelphia, PA
19103
November 1, 1940 | | Trustee | | Since
September 1989 | | Consultant –
ARL Associates
(Financial Planning)
(1983 – Present) | | | 84 | | | Director and
Audit Committee
Chairperson – Andy
Warhol Foundation
Director and Audit
Committee Member –
Systemax, Inc. | |
|
U.S. Growth Series- 15
Name,
Address,
and Birth Date | | Position(s)
Held with
Fund(s) | | Length of Time
Served | | Principal
Occupation(s)
During
Past 5 Years | | Number of
Portfolios in Fund
Complex Overseen
by Trustee
or Officer | | Other
Directorships
Held by
Trustee
or Officer | |
| independent trustees (continued) | | | | | | | | | | | | | |
|
Thomas F. Madison
2005 Market Street
Philadelphia, PA
19103
February 25, 1936 | | Trustee | | Since
May 1997 | | President and Chief
Executive Officer –
MLM Partners, Inc.
(Small Business Investing
and Consulting)
(January 1993 – Present) | | | 84 | | | Director –
Banner Health
Director –
CenterPoint Energy
Director and Audit
Committee Member –
Digital River, Inc.
Director and Audit
Committee Member –
Rimage
Corporation
Director – Valmont
Industries, Inc. | |
|
Janet L. Yeomans
2005 Market Street
Philadelphia, PA
19103
July 31, 1948 | | Trustee | | Since
April 1999 | | Vice President
(January 2003 – Present)
and Treasurer
(January 2006 – Present)
3M Corporation
Ms. Yeomans has held
various management positions
at 3M Corporation since 1983. | | | 84 | | | None | |
|
J. Richard Zecher
2005 Market Street
Philadelphia, PA
19103
July 3, 1940 | | Trustee | | Since
March 2005 | | Founder –
Investor Analytics
(Risk Management)
(May 1999 – Present)
Founder –
Sutton Asset Management
(Hedge Fund)
(September 1998 – Present) | | | 84 | | | Director and Audit
Committee Member –
Investor Analytics
Director and Audit
Committee Member –
Oxigene, Inc. | |
|
| officers | | | | | | | | | | | | | |
|
David F. Connor
2005 Market Street
Philadelphia, PA
19103
December 2, 1963 | | Vice President,
Deputy General
Counsel, and Secretary | | Vice President since
September 21, 2000
and Secretary
since
October 2005 | | David F. Connor has served as
Vice President and Deputy
General Counsel of
Delaware Investments
since 2000. | | | 84 | | | None3 | |
|
David P. O'Connor
2005 Market Street
Philadelphia, PA
19103
February 21, 1966 | | Senior Vice
President,
General Counsel,
and Chief
Legal Officer | | Senior Vice President,
General Counsel, and
Chief Legal Officer
since
October 2005 | | David P. O'Connor has served in
various executive and legal
capacities at different times at
Delaware Investments. | | | 84 | | | None3 | |
|
John J. O'Connor
2005 Market Street
Philadelphia, PA
19103
June 16, 1957 | | Senior Vice President
and Treasurer | | Treasurer
since
February 2005 | | John J. O'Connor has served in
various executive capacities
at different times at
Delaware Investments. | | | 84 | | | None3 | |
|
Richard Salus
2005 Market Street
Philadelphia, PA
19103
October 4, 1963 | | Senior
Vice President
and
Chief Financial
Officer | | Chief Financial
Officer since
November 1, 2006 | | Richard Salus has served in
various executive capacities
at different times at
Delaware Investments. | | | 84 | | | None3 | |
|
1 Patrick P. Coyne is considered to be an "Interested Trustee" because he is an executive officer of the Fund's(s') investment advisor.
2 Delaware Investments is the marketing name for Delaware Management Holdings, Inc. and its subsidiaries, including the Fund's(s') investment advisor, principal underwriter, and its transfer agent.
3 David F. Connor, David P. O'Connor, John J. O'Connor, and Richard Salus serve in similar capacities for the six portfolios of the Optimum Fund Trust, which have the same investment advisor, principal underwriter, and transfer agent as the registrant. John J. O'Connor also serves in a similar capacity for Lincoln Variable Insurance Products Trust, which has the same investment advisor as the registrant.
The Statement of Additional Information for the Fund(s) includes additional information about the Trustees and Officers and is available, without charge, upon request by calling 800 523-1918.
U.S. Growth Series- 16
Delaware VIP Trust — Delaware VIP Value Series
For the 12-month period ended Dec. 31, 2006, the Delaware VIP Value Series Standard Class shares showed a positive return of 24.10% with distributions reinvested, as Service Class shares returned +23.79% with distributions reinvested. The Series benchmark, the Russell 1000 Value Index, gained 22.25% (source: Lipper).
We regularly look to invest in undervalued companies with good business models that we believe are priced well below their intrinsic value. During the most recent period, we focused on companies that we believed to have particularly sound balance sheets, strong dividend yields, and the potential to continue generating relatively stable earnings, even in a weaker economy.
This approach led us to hold small positions in the energy and industrial sectors relative to the benchmark index. As the fiscal year progressed, we found an increasing number of opportunities among technology stocks and added a position in Intel. We continued to hold a relatively large position in the traditionally defensive healthcare sector compared to the benchmark. Several consumer discretionary stocks generated strong gains during the fiscal period, and in healthcare the Series gained from its holding in Merck.
Our holdings in the financial sector were often among our weakest performers. For example, Huntington Bancshares encountered difficulty as the company's earnings suffered from the less profitable lending activities, caused by a challenging interest rate environment. Insurance company Hartford Financial Services also underperformed relative to the overall stock market, hindered by increased competition and a slowdown in the growth of auto insurance premiums, among other factors. Because we still like the outlook for these two companies, we retained these holdings in the portfolio.
The views expressed are current as of the date of this report and are subject to change.
The performance data quoted below and on the next page represent past performance; past performance does not guarantee future results. Investment return and principal value of an investment will fluctuate so that your shares, when redeemed, may be worth more or less than their original cost. Current performance may be lower or higher than the performance data quoted. Please obtain the performance data for the most recent month end by calling the number noted on the page related to this Series in the introductory section of this report.
You should consider the investment objectives, risks, charges, and expenses of the investment carefully before investing. The Delaware VIP Value Series prospectus contains this and other important information about the Series. To obtain a prospectus, contact the company noted on the page related to this Series in the introductory section of this report, either by phone or through the company Web site. We advise you to read the prospectus carefully before you invest.
Instances of high double-digit returns are unusual, cannot be sustained, and were achieved primarily during favorable market conditions.
Delaware VIP Value Series
Average Annual Total Returns
For the periods ending Dec. 31, 2006 | | 1 Year | | 5 Years | | 10 Years | | Lifetime | |
| Standard Class Shares* | | | +24.10 | % | | | +9.55 | % | | | +9.10 | % | | | +10.21 | % | |
| Service Class Shares** | | | +23.79 | % | | | +9.31 | % | | | NA | | | | +8.82 | % | |
* Commenced operations on July 28, 1988
** Commenced operations on May 1, 2000
Value Series- 1
Delaware VIP Trust — Delaware VIP Value Series (continued)
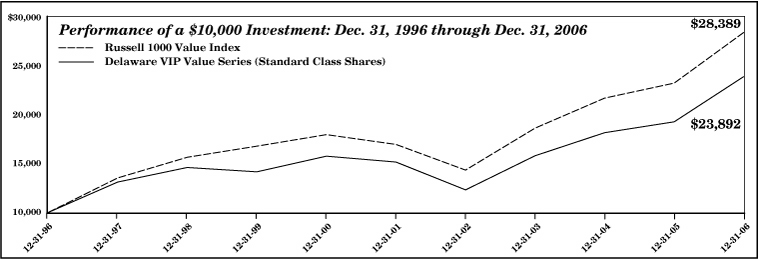
The chart shows a $10,000 investment in the Delaware VIP Value Series Standard Class shares for the period from Dec. 31, 1996 through Dec. 31, 2006. All distributions were reinvested. The chart also shows $10,000 invested in the Russell 1000 Value Index for the period from Dec. 31, 1996 through Dec. 31, 2006.
The Russell 1000 Value Index measures the performance of those Russell 1000 companies with lower price-to-book ratios and lower forecasted growth values. An index is unmanaged and does not reflect the costs of operating a mutual fund, such as the costs of buying, selling, and holding securities. You cannot invest directly in an index.
Earnings from a variable annuity or variable life investment compound tax free until withdrawal, so no adjustments were made for income taxes.
An expense limitation was in effect for the Delaware VIP Value Series during the periods shown.
Performance of Service Class shares will vary due to different charges and expenses.
Performance does not reflect insurance fees related to a variable annuity or variable life investment or the deferred sales charge that would apply to certain withdrawals of investments held for fewer than eight years. Performance shown here would have been reduced if such fees were included and the expense limitation was removed. For more information about fees, consult your variable annuity or variable life prospectus.
Investments in variable products involve risk. Some portfolios offer more risk than others. Please read both the contract and underlying prospectus for specific details regarding the product's risk profile.
Value Series- 2
Delaware VIP Trust — Delaware VIP Value Series
Disclosure of Series Expenses
For the Period July 1, 2006 to December 31, 2006
As a shareholder of the Series, you incur ongoing costs, including management fees; distribution and/or service (12b-1) fees; and other Series expenses. This Example is intended to help you understand your ongoing costs (in dollars) of investing in the Series and to compare these costs with the ongoing costs of investing in other mutual funds.
The Example is based on an investment of $1,000 invested at the beginning of the period and held for the entire period from July 1, 2006 to December 31, 2006.
Actual Expenses
The first section of the table shown, "Actual Series Return," provides information about actual account values and actual expenses. You may use the information in this section of the table, together with the amount you invested, to estimate the expenses that you paid over the period. Simply divide your account value by $1,000 (for example, an $8,600 account value divided by $1,000 = 8.6), then multiply the result by the number in the first section under the heading entitled "Expenses Paid During Period" to estimate the expenses you paid on your account during the period.
Hypothetical Example for Comparison Purposes
The second section of the table shown, "Hypothetical 5% Return," provides information about hypothetical account values and hypothetical expenses based on the Series' actual expense ratio and an assumed rate of return of 5% per year before expenses, which is not the Series' actual return. The hypothetical account values and expenses may not be used to estimate the actual ending account balance or expenses you paid for the period. You may use this information to compare the ongoing costs of investing in the Series and other funds. To do so, compare the 5% hypothetical example with the 5% hypothetical examples that appear in the shareholder reports of other funds.
Please note that the expenses shown in the table are meant to highlight your ongoing costs only. As a shareholder of the Series, you do not incur any transaction costs, such as sales charges (loads), redemption fees or exchange fees, but shareholders of other funds may incur such costs. Also, the fees related to the variable annuity investment or the deferred sales charge that could apply have not been included. Therefore, the second section of the table is useful in comparing ongoing costs only, and will not help you determine the relative total costs of owning different funds. The Series' actual expenses shown in the table reflect fee waivers in effect. The expenses shown in the table assume reinvestment of all dividends and distributions.
Expense Analysis of an Investment of $1,000
| | | Beginning
Account
Value
7/1/06 | | Ending
Account
Value
12/31/06 | | Annualized
Expense
Ratios | | Expenses
Paid During
Period
7/1/06 to
12/31/06* | |
| Actual Series Return | |
| Standard Class | | $ | 1,000.00 | | | $ | 1,164.70 | | | | 0.73 | % | | $ | 3.98 | | |
| Service Class | | | 1,000.00 | | | | 1,163.30 | | | | 0.98 | % | | | 5.34 | | |
| Hypothetical 5% Return (5% return before expenses) | |
| Standard Class | | $ | 1,000.00 | | | $ | 1,021.53 | | | | 0.73 | % | | $ | 3.72 | | |
| Service Class | | | 1,000.00 | | | | 1,020.27 | | | | 0.98 | % | | | 4.99 | | |
*"Expenses Paid During Period" are equal to the Series' annualized expense ratio, multiplied by the average account value over the period, multiplied by 184/365 (to reflect the one-half year period).
Value Series- 3
Delaware VIP Trust — Delaware VIP Value Series
Sector Allocation and Top 10 Holdings
As of December 31, 2006
Sector designations may be different than the sector designations presented in other Series materials.
| Sector | | Percentage
of Net Assets | |
| Common Stock | | | 98.00 | % | |
| Consumer Discretionary | | | 8.56 | % | |
| Consumer Staples | | | 12.21 | % | |
| Energy | | | 6.31 | % | |
| Financials | | | 23.50 | % | |
| Health Care | | | 17.74 | % | |
| Industrials | | | 5.82 | % | |
| Information Technology | | | 11.88 | % | |
| Materials | | | 2.94 | % | |
| Telecommunications | | | 6.10 | % | |
| Utilities | | | 2.94 | % | |
| Repurchase Agreements | | | 1.74 | % | |
| Securities Lending Collateral | | | 9.20 | % | |
| Fixed Rate Note | | | 1.74 | % | |
| Variable Rate Notes | | | 7.46 | % | |
| Total Market Value of Securities | | | 108.94 | % | |
| Obligation to Return Securities Lending Collateral | | | (9.20 | %) | |
| Receivables and Other Assets Net of Liabilities | | | 0.26 | % | |
| Total Net Assets | | | 100.00 | % | |
Holdings are for informational purposes only and are subject to change at any time. They are not a recommendation to buy, sell, or hold any security.
Top 10 Holdings
| | | Percentage
of Net Assets | |
| ConocoPhillips | | | 3.30 | % | |
| Safeway | | | 3.25 | % | |
| Morgan Stanley | | | 3.07 | % | |
| Hewlett-Packard | | | 3.06 | % | |
| AT&T | | | 3.05 | % | |
| Bristol-Myers Squibb | | | 3.05 | % | |
| Verizon Communications | | | 3.05 | % | |
| International Business Machines | | | 3.03 | % | |
| Kimberly-Clark | | | 3.02 | % | |
| Wyeth | | | 3.01 | % | |
Value Series- 4
Delaware VIP Trust — Delaware VIP Value Series
Statement of Net Assets
December 31, 2006
| | | Number of
Shares | | Market
Value | |
| COMMON STOCK–98.00% | |
| Consumer Discretionary–8.56% | |
| * Gap | | | 948,800 | | | $ | 18,501,600 | | |
| *† Idearc | | | 24,305 | | | | 696,338 | | |
| Limited Brands | | | 629,600 | | | | 18,220,624 | | |
| * Mattel | | | 769,900 | | | | 17,445,934 | | |
| | | | | | | | 54,864,496 | | |
| Consumer Staples–12.21% | |
| ConAgra Foods | | | 706,500 | | | | 19,075,500 | | |
| * Heinz (H.J.) | | | 422,400 | | | | 19,012,224 | | |
| Kimberly-Clark | | | 285,300 | | | | 19,386,135 | | |
| * Safeway | | | 602,200 | | | | 20,812,032 | | |
| | | | | | | | 78,285,891 | | |
| Energy–6.31% | |
| Chevron | | | 262,500 | | | | 19,301,625 | | |
| * ConocoPhillips | | | 294,100 | | | | 21,160,495 | | |
| | | | | | | | 40,462,120 | | |
| Financials–23.50% | |
| Allstate | | | 288,700 | | | | 18,797,257 | | |
| * Aon | | | 520,700 | | | | 18,401,538 | | |
| Chubb | | | 363,400 | | | | 19,227,494 | | |
| Hartford Financial Services | | | 192,500 | | | | 17,962,175 | | |
| * Huntington Bancshares | | | 768,300 | | | | 18,247,125 | | |
| Morgan Stanley | | | 241,900 | | | | 19,697,917 | | |
| Wachovia | | | 338,100 | | | | 19,254,795 | | |
| * Washington Mutual | | | 418,700 | | | | 19,046,663 | | |
| | | | | | | | 150,634,964 | | |
| Health Care–17.74% | |
| Abbott Laboratories | | | 389,500 | | | | 18,972,545 | | |
| Baxter International | | | 407,700 | | | | 18,913,203 | | |
| * Bristol-Myers Squibb | | | 742,200 | | | | 19,534,704 | | |
| Merck | | | 405,800 | | | | 17,692,880 | | |
| Pfizer | | | 743,100 | | | | 19,246,290 | | |
| Wyeth | | | 379,200 | | | | 19,308,864 | | |
| | | | | | | | 113,668,486 | | |
| Industrials–5.82% | |
| Donnelley (R.R.) & Sons | | | 523,100 | | | | 18,590,974 | | |
| Waste Management | | | 509,200 | | | | 18,723,284 | | |
| | | | | | | | 37,314,258 | | |
| Information Technology–11.88% | |
| Hewlett-Packard | | | 475,500 | | | | 19,585,845 | | |
| Intel | | | 914,500 | | | | 18,518,625 | | |
| International Business Machines | | | 200,200 | | | | 19,449,430 | | |
| † Xerox | | | 1,097,000 | | | | 18,594,150 | | |
| | | | | | | | 76,148,050 | | |
| Materials–2.94% | |
| * duPont (E.I.) deNemours | | | 386,300 | | | | 18,816,673 | | |
| | | | | | | | 18,816,673 | | |
| Telecommunications–6.10% | |
| * AT&T | | | 547,424 | | | | 19,570,408 | | |
| Verizon Communications | | | 524,400 | | | | 19,528,656 | | |
| | | | | | | | 39,099,064 | | |
| | | Number of
Shares | | Market
Value | |
| COMMON STOCK (continued) | |
| Utilities–2.94% | |
| * Progress Energy | | | 383,400 | | | $ | 18,817,272 | | |
| | | | | | | | 18,817,272 | | |
Total Common Stock
(cost $507,265,134) | | | | | | | 628,111,274 | | |
| | | Principal
Amount | | | |
| REPURCHASE AGREEMENTS–1.74% | |
With BNP Paribas 4.80% 1/2/07
(dated 12/29/06, to be repurchased
at $4,247,264, collateralized by
$4,441,000 U.S. Treasury Bills
due 6/28/07, market value $4,334,593) | | $ | 4,245,000 | | | | 4,245,000 | | |
With Cantor Fitzgerald 4.82% 1/2/07
(dated 12/29/06, to be repurchased
at $5,103,732, collateralized by
$440,000 U.S. Treasury Notes 4.00%
due 6/15/09, market value $433,669,
$2,733,000 U.S. Treasury Notes 6.125%
due 8/15/07, market value $2,814,200
and $1,822,000 U.S. Treasury
Notes 6.50% due 2/15/10,
market value $1,959,571) | | | 5,101,000 | | | | 5,101,000 | | |
With UBS Warburg 4.75% 1/2/07
(dated 12/29/06, to be repurchased
at $1,822,962, collateralized by
$1,882,000 U.S. Treasury Bills
due 3/29/07, market value $1,859,764) | | | 1,822,000 | | | | 1,822,000 | | |
Total Repurchase Agreements
(cost $11,168,000) | | | | | | | 11,168,000 | | |
Total Market Value of Securities
Before Securities Lending
Collateral–99.74%
(cost $518,433,134) | | | | | | | 639,279,274 | | |
| SECURITIES LENDING COLLATERAL**–9.20% | |
| Short-Term Investments–9.20% | |
| Fixed Rate Note–1.74% | |
Citigroup Global Markets
5.32% 1/2/07 | | | 11,153,622 | | | | 11,153,622 | | |
| | | | | | | | 11,153,622 | | |
| • Variable Rate Notes–7.46% | | | | | | | | | |
American Honda Finance
5.32% 2/21/07 | | | 1,442,355 | | | | 1,442,355 | | |
| ANZ National 5.35% 1/29/08 | | | 320,523 | | | | 320,523 | | |
| Australia New Zealand 5.35% 1/29/08 | | | 1,602,616 | | | | 1,602,616 | | |
| Bank of America 5.32% 2/23/07 | | | 2,083,401 | | | | 2,083,401 | | |
| Bank of New York 5.34% 1/29/08 | | | 1,282,093 | | | | 1,282,093 | | |
| Barclays New York 5.31% 5/18/07 | | | 2,083,401 | | | | 2,083,401 | | |
| Bayerische Landesbank 5.40% 1/29/08 | | | 1,602,616 | | | | 1,602,616 | | |
| Bear Stearns 5.41% 6/29/07 | | | 1,923,140 | | | | 1,923,140 | | |
Value Series-5
Delaware VIP Value Series
Statement of Net Assets (continued)
| | | Principal
Amount | | Market
Value | |
| SECURITY LENDING COLLATERAL (continued) | |
| Short-Term Investments (continued) | |
| • Variable Rate Notes (continued) | | | | | | | | | |
| BNP Paribas 5.35% 1/29/08 | | $ | 1,602,617 | | | $ | 1,602,617 | | |
| Canadian Imperial Bank 5.33% 1/29/09 | | | 1,121,832 | | | | 1,121,832 | | |
| CDC Financial 5.36% 1/29/07 | | | 2,083,402 | | | | 2,083,402 | | |
| Citigroup Global Markets 5.38% 1/5/07 | | | 2,083,402 | | | | 2,083,402 | | |
| Commonwealth Bank 5.35% 1/29/08 | | | 1,602,617 | | | | 1,602,617 | | |
| Deutsche Bank 5.34% 2/23/07 | | | 1,923,140 | | | | 1,923,140 | | |
| Dexia Bank 5.33% 9/28/07 | | | 2,243,657 | | | | 2,243,333 | | |
| Goldman Sachs 5.45% 12/28/07 | | | 2,083,402 | | | | 2,083,402 | | |
| Marshall & Ilsley Bank 5.33% 1/29/08 | | | 1,762,878 | | | | 1,762,878 | | |
Merrill Lynch Mortgage Capital
5.41% 1/8/07 | | | 2,083,402 | | | | 2,083,402 | | |
| | | Principal
Amount | | Market
Value | |
| SECURITY LENDING COLLATERAL** (continued) | |
| Short-Term Investments (continued) | |
| • Variable Rate Notes (continued) | | | | | | | | | |
| Morgan Stanley 5.49% 1/29/08 | | $ | 2,083,402 | | | $ | 2,083,402 | | |
| National Australia Bank 5.32% 3/7/07 | | | 1,987,245 | | | �� | 1,987,245 | | |
| National City Bank 5.32% 3/2/07 | | | 1,923,197 | | | | 1,923,313 | | |
| National Rural Utilities 5.34% 1/29/08 | | | 2,532,134 | | | | 2,532,134 | | |
| Nordea Bank New York 5.31% 5/16/07 | | | 801,303 | | | | 801,288 | | |
| Nordea Bank Norge 5.36% 1/29/08 | | | 1,602,617 | | | | 1,602,617 | | |
| Royal Bank of Scotland 5.34% 1/29/08 | | | 1,602,617 | | | | 1,602,617 | | |
| Societe Generale 5.32% 1/29/08 | | | 801,308 | | | | 801,308 | | |
| Toronto Dominion 5.32% 5/29/07 | | | 1,923,140 | | | | 1,923,140 | | |
| Wells Fargo 5.36% 1/29/08 | | | 1,602,617 | | | | 1,602,617 | | |
| | | | | | | | 47,789,851 | | |
Total Securities Lending Collateral
(cost $58,943,473) | | | | | | | 58,943,473 | | |
| TOTAL MARKET VALUE OF SECURITIES–108.94% (cost $577,376,607) | | | 698,222,747 | v | |
| OBLIGATION TO RETURN SECURITIES LENDING COLLATERAL**–(9.20%) | | | (58,943,473 | ) | |
| RECEIVABLES AND OTHER ASSETS NET OF LIABILITIES–0.26% | | | 1,651,193 | | |
| NET ASSETS APPLICABLE TO 27,897,521 SHARES OUTSTANDING–100.00% | | $ | 640,930,467 | | |
| NET ASSET VALUE–DELAWARE VIP VALUE SERIES STANDARD CLASS ($497,525,355 / 21,646,474 Shares) | | $ | 22.98 | | |
| NET ASSET VALUE–DELAWARE VIP VALUE SERIES SERVICE CLASS ($143,405,112 / 6,251,047 Shares) | | $ | 22.94 | | |
| COMPONENTS OF NET ASSETS AT DECEMBER 31, 2006: | |
| Shares of beneficial interest (unlimited authorization–no par) | | $ | 497,125,261 | | |
| Undistributed net investment income | | | 10,435,756 | | |
| Accumulated net realized gain on investments | | | 12,523,310 | | |
| Net unrealized appreciation of investments | | | 120,846,140 | | |
| Total net assets | | $ | 640,930,467 | | |
* Fully or partially on loan.
** See Note 8 in "Notes to Financial Statements."
v Includes $57,324,118 of securities loaned.
† Non-income producing security for the year ended December 31, 2006.
• Variable rate security. The interest rate shown is the rate as of December 31, 2006.
See accompanying notes
Value Series- 6
Delaware VIP Trust — Delaware VIP Value Series
Statement of Operations
Year Ended December 31, 2006
| INVESTMENT INCOME: | |
| Dividends | | $ | 13,761,147 | | |
| Interest | | | 531,568 | | |
| Securities lending income | | | 30,297 | | |
| | | | 14,323,012 | | |
| EXPENSES: | |
| Management fees | | | 3,267,224 | | |
| Distribution expenses – Service Class | | | 305,610 | | |
| Accounting and administration expenses | | | 201,912 | | |
| Reports and statements to shareholders | | | 113,682 | | |
| Trustees' fees and benefits | | | 95,455 | | |
| Dividend disbursing and transfer agent fees and expenses | | | 50,478 | | |
| Legal fees | | | 48,024 | | |
| Audit and tax | | | 30,684 | | |
| Insurance fees | | | 24,115 | | |
| Custodian fees | | | 13,180 | | |
| Consulting fees | | | 11,868 | | |
| Registration fees | | | 8,691 | | |
| Dues and services | | | 3,235 | | |
| Trustees' expenses | | | 3,075 | | |
| Pricing fees | | | 313 | | |
| | | | 4,177,546 | | |
| Less management fees absorbed or waived | | | (238,227 | ) | |
| Less waiver of distribution expenses – Service Class | | | (50,935 | ) | |
| Less expense paid indirectly | | | (2,839 | ) | |
| Total operating expenses | | | 3,885,545 | | |
| NET INVESTMENT INCOME | | | 10,437,467 | | |
NET REALIZED AND UNREALIZED GAIN
ON INVESTMENTS: | |
| Net realized gain on investments | | | 18,468,335 | | |
Net change in unrealized appreciation/depreciation
of investments | | | 83,021,350 | | |
NET REALIZED AND UNREALIZED GAIN ON
INVESTMENTS | | | 101,489,685 | | |
NET INCREASE IN NET ASSETS RESULTING
FROM OPERATIONS | | $ | 111,927,152 | | |
See accompanying notes
Delaware VIP Trust — Delaware VIP Value Series
Statements of Changes in Net Assets
| | | Year Ended | |
| | | 12/31/06 | | 12/31/05 | |
INCREASE (DECREASE) IN NET
ASSETS FROM OPERATIONS: | |
| Net investment income | | $ | 10,437,467 | | | $ | 7,271,468 | | |
| Net realized gain on investments | | | 18,468,335 | | | | 15,751,969 | | |
Net change in unrealized appreciation/
depreciation of investments | | | 83,021,350 | | | | (751,957 | ) | |
Net increase in net assets
resulting from operations | | | 111,927,152 | | | | 22,271,480 | | |
DIVIDENDS AND DISTRIBUTIONS
TO SHAREHOLDERS FROM: | |
| Net investment income: | |
| Standard Class | | | (6,076,791 | ) | | | (5,331,963 | ) | |
| Service Class | | | (1,195,237 | ) | | | (567,103 | ) | |
| Net realized gain on investments: | |
| Standard Class | | | (8,040,632 | ) | | | — | | |
| Service Class | | | (1,846,025 | ) | | | — | | |
| | | | (17,158,685 | ) | | | (5,899,066 | ) | |
| CAPITAL SHARE TRANSACTIONS: | |
| Proceeds from shares sold: | |
| Standard Class | | | 228,533,309 | | | | 67,835,208 | | |
| Service Class | | | 65,252,069 | | | | 46,375,696 | | |
Net asset value of shares issued upon
reinvestment of dividends and distributions: | |
| Standard Class | | | 14,117,423 | | | | 5,331,963 | | |
| Service Class | | | 3,041,262 | | | | 567,103 | | |
| | | | 310,944,063 | | | | 120,109,970 | | |
| Cost of shares repurchased: | |
| Standard Class | | | (169,612,666 | ) | | | (48,165,366 | ) | |
| Service Class | | | (20,390,780 | ) | | | (7,441,636 | ) | |
| | | | (190,003,446 | ) | | | (55,607,002 | ) | |
Increase in net assets derived from
capital share transactions | | | 120,940,617 | | | | 64,502,968 | | |
| NET INCREASE IN NET ASSETS | | | 215,709,084 | | | | 80,875,382 | | |
| NET ASSETS: | |
| Beginning of year | | | 425,221,383 | | | | 344,346,001 | | |
End of year (including undistributed
net investment income of $10,435,756, and
$7,270,317, respectively) | | $ | 640,930,467 | | | $ | 425,221,383 | | |
See accompanying notes
Value Series- 7
Delaware VIP Trust — Delaware VIP Value Series
Financial Highlights
Selected data for each share of the Series outstanding throughout each period were as follows:
| | | Delaware VIP Value Series Standard Class | |
| | | Year Ended | |
| | | 12/31/06 | | 12/31/05 | | 12/31/04 | | 12/31/03 | | 12/31/02 | |
| Net asset value, beginning of period | | $ | 19.230 | | | $ | 18.460 | | | $ | 16.330 | | | $ | 13.000 | | | $ | 16.210 | | |
| Income (loss) from investment operations: | |
| Net investment income1 | | | 0.437 | | | | 0.369 | | | | 0.313 | | | | 0.265 | | | | 0.235 | | |
Net realized and unrealized gain (loss) on investments
and foreign currencies | | | 4.075 | | | | 0.722 | | | | 2.082 | | | | 3.337 | | | | (3.215 | ) | |
| Total from investment operations | | | 4.512 | | | | 1.091 | | | | 2.395 | | | | 3.602 | | | | (2.980 | ) | |
| Less dividends and distributions from: | |
| Net investment income | | | (0.328 | ) | | | (0.321 | ) | | | (0.265 | ) | | | (0.272 | ) | | | (0.230 | ) | |
| Net realized gain on investments | | | (0.434 | ) | | | – | | | | – | | | | – | | | | – | | |
| Total dividends and distributions | | | (0.762 | ) | | | (0.321 | ) | | | (0.265 | ) | | | (0.272 | ) | | | (0.230 | ) | |
| Net asset value, end of period | | $ | 22.980 | | | $ | 19.230 | | | $ | 18.460 | | | $ | 16.330 | | | $ | 13.000 | | |
| Total return2 | | | 24.10 | % | | | 6.03 | % | | | 14.93 | % | | | 28.29 | % | | | (18.68 | %) | |
| Ratios and supplemental data: | |
| Net assets, end of period (000 omitted) | | $ | 497,525 | | | $ | 349,443 | | | $ | 310,704 | | | $ | 302,266 | | | $ | 240,752 | | |
| Ratio of expenses to average net assets | | | 0.72 | % | | | 0.73 | % | | | 0.70 | % | | | 0.70 | % | | | 0.70 | % | |
Ratio of expenses to average net assets prior to expense
limitation and expenses paid indirectly | | | 0.77 | % | | | 0.78 | % | | | 0.75 | % | | | 0.75 | % | | | 0.75 | % | |
| Ratio of net investment income to average net assets | | | 2.12 | % | | | 1.98 | % | | | 1.87 | % | | | 1.88 | % | | | 1.61 | % | |
Ratio of net investment income to average net assets prior
to expense limitation and expenses paid indirectly | | | 2.07 | % | | | 1.93 | % | | | 1.82 | % | | | 1.83 | % | | | 1.56 | % | |
| Portfolio turnover | | | 14 | % | | | 23 | % | | | 124 | % | | | 79 | % | | | 100 | % | |
1The average shares outstanding method has been applied for per share information.
2Total investment return is based on the change in net asset value of a share during the period and assumes reinvestment of dividends and distributions at net asset value. Total investment return reflects waivers and payment of fees by the manager. Performance would have been lower had the waiver not been in effect.
See accompanying notes
Value Series- 8
Delaware VIP Value Series
Financial Highlights (continued)
Selected data for each share of the Series outstanding throughout each period were as follows:
| | | Delaware VIP Value Series Service Class | |
| | | Year Ended | |
| | | 12/31/06 | | 12/31/05 | | 12/31/04 | | 12/31/03 | | 12/31/02 | |
| Net asset value, beginning of period | | $ | 19.200 | | | $ | 18.430 | | | $ | 16.320 | | | $ | 12.990 | | | $ | 16.200 | | |
| Income (loss) from investment operations: | |
| Net investment income1 | | | 0.385 | | | | 0.323 | | | | 0.271 | | | | 0.233 | | | | 0.214 | | |
Net realized and unrealized gain (loss) on investments
and foreign currencies | | | 4.070 | | | | 0.726 | | | | 2.072 | | | | 3.348 | | | | (3.218 | ) | |
| Total from investment operations | | | 4.455 | | | | 1.049 | | | | 2.343 | | | | 3.581 | | | | (3.004 | ) | |
| Less dividends and distributions from: | |
| Net investment income | | | (0.281 | ) | | | (0.279 | ) | | | (0.233 | ) | | | (0.251 | ) | | | (0.206 | ) | |
| Net realized gain on investments | | | (0.434 | ) | | | – | | | | – | | | | – | | | | – | | |
| Total dividends and distributions | | | (0.715 | ) | | | (0.279 | ) | | | (0.233 | ) | | | (0.251 | ) | | | (0.206 | ) | |
| Net asset value, end of period | | $ | 22.940 | | | $ | 19.200 | | | $ | 18.430 | | | $ | 16.320 | | | $ | 12.990 | | |
| Total return2 | | | 23.79 | % | | | 5.79 | % | | | 14.59 | % | | | 28.10 | % | | | (18.81 | %) | |
| Ratios and supplemental data: | |
| Net assets, end of period (000 omitted) | | $ | 143,405 | | | $ | 75,778 | | | $ | 33,642 | | | $ | 14,737 | | | $ | 5,463 | | |
| Ratio of expenses to average net assets | | | 0.97 | % | | | 0.98 | % | | | 0.95 | % | | | 0.92 | % | | | 0.85 | % | |
Ratio of expenses to average net assets prior to expense
limitation and expenses paid indirectly | | | 1.07 | % | | | 1.08 | % | | | 1.05 | % | | | 1.00 | % | | | 0.90 | % | |
| Ratio of net investment income to average net assets | | | 1.87 | % | | | 1.73 | % | | | 1.62 | % | | | 1.66 | % | | | 1.46 | % | |
Ratio of net investment income to average net assets prior
to expense limitation and expenses paid indirectly | | | 1.77 | % | | | 1.63 | % | | | 1.52 | % | | | 1.58 | % | | | 1.41 | % | |
| Portfolio turnover | | | 14 | % | | | 23 | % | | | 124 | % | | | 79 | % | | | 100 | % | |
1The average shares outstanding method has been applied for per share information.
2Total investment return is based on the change in net asset value of a share during the period and assumes reinvestment of dividends and distributions at net asset value. Total investment return reflects waivers and payment of fees by the manager and distributor. Performance would have been lower had the waiver not been in effect.
See accompanying notes
Value Series- 9
Delaware VIP Trust — Delaware VIP Value Series
Notes to Financial Statements
December 31, 2006
Delaware VIP Trust (the "Trust") is organized as a Delaware statutory trust and offers 15 series: Delaware VIP Balanced Series, Delaware VIP Capital Reserves Series, Delaware VIP Cash Reserve Series, Delaware VIP Diversified Income Series, Delaware VIP Emerging Markets Series, Delaware VIP Global Bond Series, Delaware VIP Growth Opportunities Series, Delaware VIP High Yield Series, Delaware VIP International Value Equity Series, Delaware VIP REIT Series, Delaware VIP Select Growth Series, Delaware VIP Small Cap Value Series, Delaware VIP Trend Series, Delaware VIP U.S. Growth Series and Delaware VIP Value Series. These financial statements and the related notes pertain to Delaware VIP Value Series (the "Series"). The Trust is an open-end investment company. The Series is considered diversified under the Investment Company Act of 1940, as amended, and offers Standard Class and Service Class shares. The Standard Class shares do not carry a 12b - -1 fee and the Service Class shares carry a 12b-1 fee. The shares of the Series are sold only to separate accounts of life insurance companies.
The investment objective of the Series is to seek long-term capital appreciation.
1. Significant Accounting Policies
The following accounting policies are in accordance with U.S. generally accepted accounting principles and are consistently followed by the Series.
Security Valuation—Equity securities, except those traded on the Nasdaq Stock Market, Inc. (Nasdaq), are valued at the last quoted sales price as of the time of the regular close of the New York Stock Exchange (NYSE) on the valuation date. Securities traded on the Nasdaq are valued in accordance with the Nasdaq Official Closing Price, which may not be the last sales price. If on a particular day an equity security does not trade, then the mean between the bid and asked prices will be used. Short-term debt securities having less than 60 days to maturity are valued at amortized cost, which approximates market value. Securities lending collateral is valued at amortized cost, which approximates market value. Other securities and assets for which market quotations are not readily available are valued at fair value as determined in good faith under the direction of the Series' Board of Trustees. In determining whether market quotations are readily available or fair valuation will be used, various factors will be taken into consideration, such as market closures, or with respect to foreign securities, aftermarket trading, or significant events after local market trading (e.g., government actions or pronouncements, trading volume or volatility on markets, exchanges among dealers, or news events).
In September 2006, the Financial Accounting Standards Board (FASB) issued FASB Statement No. 157 "Fair Value Measurements" (Statement 157). Statement 157 establishes a framework for measuring fair value in generally accepted accounting principles, clarifies the definition of fair value within that framework, and expands disclosures about the use of fair value measurements. Statement 157 is intended to increase consistency and comparability among fair value estimates used in financial reporting. Statement 157 is effective for fiscal years beginning after November 15, 2007. Management does not expect the adoption of Statement 157 to have an impact on the amounts reported in the financial statements.
Federal Income Taxes—The Series intends to continue to qualify for federal income tax purposes as a regulated investment company and make the requisite distributions to shareholders. Accordingly, no provision for federal income taxes has been made in the financial statements.
On July 13, 2006, FASB released FASB Interpretation No. 48 "Accounting for Uncertainty in Income Taxes" (FIN 48). FIN 48 provides guidance for how uncertain tax positions should be recognized, measured, presented, and disclosed in the financial statements. FIN 48 requires the evaluation of tax positions taken or expected to be taken in the course of preparing the Series' tax returns to determine whether the tax positions are "more-likely-than-not" of being sustained by the applicable tax authority. Tax positions not deemed to meet the more-likely-than-not threshold would be recorded as a tax benefit or expense in the current year. Adoption of FIN 48 is required for fiscal years beginning after December 15, 2006 and is to be applied to all open tax years as of the effective date. Recent SEC guidance allows implementing FIN 48 in Series net asset value calculations as late as the Series' last net asset value calculation in the first required f inancial statement reporting period. As a result, the Series will incorporate FIN 48 in its semiannual report on June 30, 2007. Although the Series tax positions are currently being evaluated, management does not expect the adoption of FIN 48 to have a material impact on the Series financial statements.
Class Accounting—Investment income, common expenses and realized and unrealized gain (loss) on investments are allocated to the classes of the Series on the basis of daily net assets of each class. Distribution expenses relating to a specific class are charged directly to that class.
Repurchase Agreements—The Series may invest in a pooled cash account along with other members of the Delaware Investments® Family of Funds pursuant to an exemptive order issued by the Securities and Exchange Commission. The aggregate daily balance of the pooled cash account is invested in repurchase agreements secured by obligations of the U.S. government. The respective collateral is held by the Series' custodian bank until the maturity of the respective repurchase agreements. Each repurchase agreement is at least 102% collateralized. However, in the event of default or bankruptcy by the counterparty to the agreement, realization of the collateral may be subject to legal proceedings.
Use of Estimates—The preparation of financial statements in conformity with U.S. generally accepted accounting principles requires management to make estimates and assumptions that affect the reported amounts of assets and liabilities at the date of the financial statements and the reported amounts of revenues and expenses during the reporting period. Actual results could differ from those estimates.
Other—Expenses directly attributable to the Series are charged directly to the Series. Other expenses common to various funds within the Delaware Investments® Family of Funds are generally allocated amongst such funds on the basis of average net assets. Management fees and some other expenses are paid monthly. Security transactions are recorded on the date the securities are purchased or sold (trade date) for financial reporting purposes. Costs used in calculating realized gains and losses on the sale of investment securities are those of the specific securities sold. Dividend income is recorded on the ex-dividend date and interest income is recorded on the accrual basis.
The Series declares and pays dividends from net investment income and distributions from net realized gain on investments, if any, following the close of the fiscal year.
Value Series- 10
Delaware VIP Value Series
Notes to Financial Statements (continued)
1. Significant Accounting Policies (continued)
Subject to seeking best execution, the Series may direct certain security trades to brokers who have agreed to rebate a portion of the related brokerage commission to the Series in cash. Such commission rebates are included in realized gain on investments in the accompanying financial statements and totaled $9,233 for the year ended December 31, 2006. In general, best execution refers to many factors, including the price paid or received for a security, the commission charged, the promptness and reliability of execution, the confidentiality and placement accorded the order, and other factors affecting the overall benefit obtained by the Series on the transaction.
The Series receives earnings credits from its custodian when positive cash balances are maintained, which are used to offset custody fees. The expense paid under this arrangement is included in custodian fees on the Statement of Operations with the corresponding expense offset shown as "expense paid indirectly."
2. Investment Management, Administration Agreements and Other Transactions with Affiliates
In accordance with the terms of its investment management agreement, the Series pays Delaware Management Company (DMC), a series of Delaware Management Business Trust and the investment manager, an annual fee which is calculated daily at the rate of 0.65% on the first $500 million of average daily net assets of the Series, 0.60% on the next $500 million, 0.55% on the next $1.5 billion, and 0.50% on average daily net assets in excess of $2.5 billion. DMC has voluntarily agreed to waive management fees in the amount of 0.05% on the first $500 million of average daily net assets until such time as the waiver is discontinued.
DMC has also contractually agreed to waive that portion, if any, of its management fee and reimburse the Series to the extent necessary to ensure that annual operating expenses, exclusive of taxes, interest, brokerage commissions, distribution fees, certain insurance costs and extraordinary expenses, do not exceed 0.86% of average daily net assets of the Series through April 30, 2007. Prior to May 1, 2006 the expense limitation was 0.80% of average daily net assets. No reimbursement was due for the year ended December 31, 2006 under either limitation agreement.
Delaware Service Company, Inc. (DSC), an affiliate of DMC, provides accounting, administration, dividend disbursing and transfer agent services. The Series pays DSC a monthly fee computed at the annual rate of 0.04% of the Series' average daily net assets for accounting and administrative services. The Series pays DSC a monthly fee based on average net assets for dividend disbursing and transfer agent services.
Pursuant to a distribution agreement and distribution plan, the Series pays Delaware Distributors, L.P. (DDLP), the distributor and an affiliate of DMC, an annual distribution and service fee not to exceed 0.30% of the average daily net assets of the Service Class shares. DDLP has contracted to waive distribution and service fees through April 30, 2007 in order to prevent distribution and service fees of the Service Class shares from exceeding 0.25% of average daily net assets. Standard Class shares pay no distribution and service expenses.
At December 31, 2006, the Series had liabilities payable to affiliates as follows:
Investment
Management
Fee Payable to
DMC | | Dividend Disbursing,
Transfer Agent, Accounting
and Administration Fees
and Other Expenses
Payable to DSC | | Distribution
Fee Payable
To DDLP | | Other
Expenses
Payable
to DMC
and Affiliates* | |
| $ | 320,513 | | | $ | 29,569 | | | $ | 29,641 | | | $ | 40,177 | | |
*DMC, as part of its administrative services, pays operating expenses on behalf of the Series and is reimbursed on a periodic basis. Such expenses include items such as printing of shareholder reports, fees for audit, legal and tax services, custodian fees and trustees' fees.
As provided in the investment management agreement, the Series bears the cost of certain legal and tax services, including internal legal and tax services provided to the Series by DMC and/or its affiliates' employees. For the year ended December 31, 2006, the Series was charged $24,585 for internal legal and tax services provided by DMC and/or its affiliates' employees.
Trustees' fees and benefits include expenses accrued by the Series for each Trustee's retainer, per meeting fees and retirement benefits. Independent Trustees with over five years of uninterrupted service are eligible to participate in a retirement plan that provides for the payment of benefits upon retirement. The amount of the retirement benefit is based on factors set forth in the plan, including the number of years of service. On November 16, 2006, the Board of Trustees unanimously voted to terminate the retirement plan. Payments equal to the net present value of the earned benefits will be made in 2007 to those independent trustees so entitled. The retirement benefit payout for the Series is $67,805. Certain officers of DMC, DSC and DDLP are officers and/or trustees of the Trust. These officers and trustees are paid no compensation by the Series.
3. Investments
For the year ended December 31, 2006, the Series made purchases and sales of investment securities other than short-term investments as follows:
| Purchases | | $ | 177,443,745 | | |
| Sales | | | 70,896,543 | | |
Value Series- 11
Delaware VIP Value Series
Notes to Financial Statements (continued)
3. Investments (continued)
At December 31, 2006, the cost of investments for federal income tax purposes and unrealized appreciation (depreciation) for the Series were as follows:
Cost of
Investments | | Aggregate
Unrealized
Appreciation | | Aggregate
Unrealized
Depreciation | | Net Unrealized
Appreciation | |
| $ | 578,494,038 | | | $ | 119,728,709 | | | $ | – | | | $ | 119,728,709 | | |
4. Dividend and Distribution Information
Income and long-term capital gain distributions are determined in accordance with federal income tax regulations, which may differ from U.S. generally accepted accounting principles. Additionally, net short-term gains on sales of investment securities are treated as ordinary income for federal income tax purposes. The tax character of dividends and distributions paid during the years ended December 31, 2006 and 2005 was as follows:
| | | Year
Ended
12/31/06 | | Year
Ended
12/31/05 | |
| Ordinary income | | $ | 7,279,764 | | | $ | 5,899,066 | | |
| Long-term capital gain | | | 9,878,921 | | | | – | | |
| | | $ | 17,158,685 | | | $ | 5,899,066 | | |
5. Components of Net Assets on a Tax Basis
As of December 31, 2006, the components of net assets on a tax basis were as follows:
| Shares of beneficial interest | | $ | 497,125,261 | | |
| Undistributed ordinary income | | | 12,055,699 | | |
| Undistributed long-term capital gain | | | 15,457,654 | | |
| *Capital loss carryforwards | | | (3,436,856 | ) | |
| Unrealized appreciation of investments | | | 119,728,709 | | |
| Net assets | | $ | 640,930,467 | | |
The differences between book basis and tax basis components of net assets are primarily attributable to tax deferral of losses on wash sales.
For federal income tax purposes, capital loss carryforwards may be carried forward and applied against future capital gains. $859,214 was utilized in 2006. Capital loss carryforwards remaining at December 31, 2006 will expire as follows: $1,956,870 expires in 2009 and $1,479,986 expires in 2010.
*The amount of this loss which can be utilized in subsequent years is subject to an annual limitation in accordance with the Internal Revenue Code due to the fund merger with Delaware VIP Devon Series in 2003.
6. Capital Shares
Transactions in capital shares were as follows:
| | | Year
Ended
12/31/06 | | Year
Ended
12/31/05 | |
| Shares sold: | |
| Standard Class | | | 11,365,108 | | | | 3,617,312 | | |
| Service Class | | | 3,147,358 | | | | 2,487,125 | | |
Shares issued upon reinvestment of dividends
and distributions: | |
| Standard Class | | | 713,001 | | | | 296,056 | | |
| Service Class | | | 153,599 | | | | 31,488 | | |
| | | | 15,379,066 | | | | 6,431,981 | | |
| Shares repurchased: | |
| Standard Class | | | (8,598,802 | ) | | | (2,581,332 | ) | |
| Service Class | | | (996,179 | ) | | | (397,840 | ) | |
| | | | (9,594,981 | ) | | | (2,979,172 | ) | |
| Net increase | | | 5,784,085 | | | | 3,452,809 | | |
Value Series- 12
Delaware VIP Value Series
Notes to Financial Statements (continued)
7. Line of Credit
The Series, along with certain other funds in the Delaware Investments® Family of Funds (the "Participants"), participates in a $225,000,000 revolving line of credit facility to be used for temporary or emergency purposes as an additional source of liquidity to fund redemptions of investor shares. The Participants are charged an annual commitment fee, which is allocated across the Participants on the basis of each fund's allocation of the entire facility. The Participants may borrow up to a maximum of one third of their net assets under the agreement. The Series had no amounts outstanding as of December 31, 2006, or at any time during the year then ended.
8. Securities Lending
The Series, along with other funds in the Delaware Investments Family® of Funds, may lend its securities pursuant to a security lending agreement (Lending Agreement) with JPMorgan Chase. Initial security loans made pursuant to the Lending Agreement are required to be secured by U.S. government obligations and/or cash collateral not less than 102% of the market value of the securities issued in the United States and 105% of the market value of securities issued outside the United States. With respect to each loan, if the aggregate market value of the collateral held on any business day is less than the aggregate market value of the securities which are the subject of such loan, the borrower will be notified to provide additional collateral not less than the applicable collateral requirements. Cash collateral received is invested in fixed income securities, with a weighted average maturity not to exceed 90 days, rated in one of the top two tiers by Standard & Poor's Ratings Group or Moody's Investors Service, Inc. or repurchase agreements collateralized by such securities. However, in the event of default or bankruptcy by the lending agent, realization and/or retention of the collateral may be subject to legal proceedings. In the event the borrower fails to return loaned securities and the collateral received is insufficient to cover the value of the loaned securities and provided such collateral shortfall is not the result of investment losses, the lending agent has agreed to pay the amount of the shortfall to the Series, or at the discretion of the lending agent, replace the loaned securities. The Series continues to record dividends on the securities loaned and is subject to change in value of the securities loaned that may occur during the term of the loan. The Series has the right under the Lending Agreement to recover the securities from the borrower on demand. The security lending agent and the borrower retain a portion of the earnings from the collateral investments. The Series records security lending income net of such allocation.
At December 31, 2006, the market value of securities on loan was $57,324,118, for which cash collateral was received and invested in accordance with the Lending Agreement. Such investments are presented on the Statement of Net Assets under the caption "Securities Lending Collateral."
9. Credit and Market Risk
The Series may invest up to 10% of its total assets in illiquid securities, which may include securities with contractual restrictions on resale, securities exempt from registration under Rule 144A of the Securities Act of 1933, as amended, and other securities which may not be readily marketable. The relative illiquidity of these securities may impair the Series from disposing of them in a timely manner and at a fair price when it is necessary or desirable to do so. While maintaining oversight, the Series' Board of Trustees has delegated to DMC the day-to-day functions of determining whether individual securities are liquid for purposes of the Series' limitation on investments in illiquid assets. At December 31, 2006, there were no Rule 144A securities and no securities have been determined to be illiquid under the Series' Liquidity Procedures.
10. Contractual Obligations
The Series enters into contracts in the normal course of business that contain a variety of indemnifications. The Series' maximum exposure under these arrangements is unknown. However, the Series has not had prior claims or losses pursuant to these contracts. Management has reviewed the Series' existing contracts and expects the risk of loss to be remote.
11. Tax Information (Unaudited)
For the fiscal year ended December 31, 2006, the Series designates distributions paid during the year as follow:
(A)
Long-Term
Capital Gains
Distributions
(Tax Basis) | | (B)
Ordinary
Income
Distributions
(Tax Basis) | | Total
Distribution
(Tax Basis) | | (C)
Qualifying
Dividends1 | |
| | 58 | % | | | 42 | % | | | 100 | % | | | 100 | % | |
(A) and (B) are based on a percentage of the Series' total distributions.
(C) is based on a percentage of the Series' ordinary income distributions.
1 Qualifying dividends represent dividends which qualify for the corporate dividends received deduction.
Value Series- 13
Delaware VIP Trust — Delaware VIP Value Series
Report of Independent Registered Public Accounting Firm
To the Shareholders and Board of Trustees
Delaware VIP Trust–Delaware VIP Value Series
We have audited the accompanying statement of net assets of the Delaware VIP Value Series (one of the series constituting Delaware VIP Trust) (the "Series") as of December 31, 2006, and the related statement of operations for the year then ended, the statements of changes in net assets for each of the two years in the period then ended, and the financial highlights for each of the five years in the period then ended. These financial statements and financial highlights are the responsibility of the Series' management. Our responsibility is to express an opinion on these financial statements and financial highlights based on our audits.
We conducted our audits in accordance with the standards of the Public Company Accounting Oversight Board (United States). Those standards require that we plan and perform the audit to obtain reasonable assurance about whether the financial statements and financial highlights are free of material misstatement. We were not engaged to perform an audit of the Series' internal control over financial reporting. Our audits included consideration of internal control over financial reporting as a basis for designing audit procedures that are appropriate in the circumstances, but not for the purpose of expressing an opinion on the effectiveness of the Series' internal control over financial reporting. Accordingly, we express no such opinion. An audit also includes examining, on a test basis, evidence supporting the amounts and disclosures in the financial statements and financial highlights, assessing the accounting principles used and significant es timates made by management, and evaluating the overall financial statement presentation. Our procedures included confirmation of securities owned as of December 31, 2006, by correspondence with the custodian and brokers. We believe that our audits provide a reasonable basis for our opinion.
In our opinion, the financial statements and financial highlights referred to above present fairly, in all material respects, the financial position of the Delaware VIP Value Series of Delaware VIP Trust at December 31, 2006, the results of its operations for the year then ended, the changes in its net assets for each of the two years in the period then ended, and its financial highlights for each of the five years in the period the ended, in conformity with U.S. generally accepted accounting principles.

Philadelphia, Pennsylvania
February 14, 2007
The Series files its complete schedule of portfolio holdings with the Securities and Exchange Commission for the first and third quarters of each fiscal year on Form N-Q. The Series' Forms N-Q, as well as a description of the policies and procedures that the Series uses to determine how to vote proxies (if any) relating to portfolio securities is available without charge (i) upon request, by calling 800-523-1918; (ii) on the Series' website at http://www.delawareinvestments.com; and (iii) on the Commission's website at http://www.sec.gov. The Series' Forms N-Q may be reviewed and copied at the Commission's Public Reference Room in Washington, DC; information on the operation of the Public Reference Room may be obtained by calling 1-800-SEC-0330.
Information (if any) regarding how the Series voted proxies relating to portfolio securities during the most recently disclosed 12-month period ended December 31 is available without charge (i) through the Series' website at http://www.delawareinvestments.com; and (ii) on the Commission's website at http://www.sec.gov.
Value Series- 14
Delaware Investments® Family of Funds
board of trustees/directors and officers addendum
A mutual fund is governed by a Board of Trustees/Directors ("Trustees"), which has oversight responsibility for the management of a fund's business affairs. Trustees establish procedures and oversee and review the performance of the investment manager, the distributor, and others who perform services for the fund. The independent fund trustees, in particular, are advocates for shareholder interests. Each trustee has served in that capacity since he or she was elected to or appointed to the Board of Trustees, and will continue to serve until his or her retirement or the election of a new trustee in his or her place. The following is a list of the Trustees and Officers with certain background and related information.
Name,
Address,
and Birth Date | | Position(s)
Held with
Fund(s) | | Length of Time
Served | | Principal
Occupation(s)
During
Past 5 Years | | Number of
Portfolios in Fund
Complex Overseen
by Trustee
or Officer | | Other
Directorships
Held by
Trustee
or Officer | |
| interested trustees | | | | | | | | | | | | | |
|
Patrick P. Coyne1
2005 Market Street
Philadelphia, PA
19103
April 14, 1963 | | Chairman,
President,
Chief Executive
Officer, and
Trustee | | Chairman and Trustee
since August 16, 2006
President and
Chief Executive Officer
since August 1, 2006 | | Patrick P. Coyne has served in
various executive capacities
at different times at
Delaware Investments.2 | | | 84 | | | None | |
|
| independent trustees | | | | | | | | | | | | | |
|
Thomas L. Bennett
2005 Market Street
Philadelphia, PA
19103
October 4, 1947 | | Trustee | | Since
March 2005 | | Private Investor –
(March 2004 – Present)
Investment Manager –
Morgan Stanley & Co.
(January 1984 – March 2004) | | | 84 | | | None | |
|
John A. Fry
2005 Market Street
Philadelphia, PA
19103
May 28, 1960 | | Trustee | | Since
January 2001 | | President –
Franklin & Marshall College
(June 2002 – Present)
Executive Vice President –
University of Pennsylvania
(April 1995 – June 2002) | | | 84 | | | Director –
Community Health
Systems
Director –
Allied Barton
Security Holdings | |
|
Anthony D. Knerr
2005 Market Street
Philadelphia, PA
19103
December 7, 1938 | | Trustee | | Since
April 1990 | | Founder and Managing Director –
Anthony Knerr & Associates
(Strategic Consulting)
(1990 – Present) | | | 84 | | | None | |
|
Lucinda S. Landreth
2005 Market Street
Philadelphia, PA
19103
June 24, 1947 | | Trustee | | Since
March 2005 | | Chief Investment Officer –
Assurant, Inc.
(Insurance)
(2002 – 2004) | | | 84 | | | None | |
|
Ann R. Leven
2005 Market Street
Philadelphia, PA
19103
November 1, 1940 | | Trustee | | Since
September 1989 | | Consultant –
ARL Associates
(Financial Planning)
(1983 – Present) | | | 84 | | | Director and
Audit Committee
Chairperson – Andy
Warhol Foundation
Director and Audit
Committee Member –
Systemax, Inc. | |
|
Value Series- 15
Name,
Address,
and Birth Date | | Position(s)
Held with
Fund(s) | | Length of Time
Served | | Principal
Occupation(s)
During
Past 5 Years | | Number of
Portfolios in Fund
Complex Overseen
by Trustee
or Officer | | Other
Directorships
Held by
Trustee
or Officer | |
| independent trustees (continued) | | | | | | | | | | | | | |
|
Thomas F. Madison
2005 Market Street
Philadelphia, PA
19103
February 25, 1936 | | Trustee | | Since
May 1997 | | President and Chief
Executive Officer –
MLM Partners, Inc.
(Small Business Investing
and Consulting)
(January 1993 – Present) | | | 84 | | | Director –
Banner Health
Director –
CenterPoint Energy
Director and Audit
Committee Member –
Digital River, Inc.
Director and Audit
Committee Member –
Rimage
Corporation
Director – Valmont
Industries, Inc. | |
|
Janet L. Yeomans
2005 Market Street
Philadelphia, PA
19103
July 31, 1948 | | Trustee | | Since
April 1999 | | Vice President
(January 2003 – Present)
and Treasurer
(January 2006 – Present)
3M Corporation
Ms. Yeomans has held
various management positions
at 3M Corporation since 1983. | | | 84 | | | None | |
|
J. Richard Zecher
2005 Market Street
Philadelphia, PA
19103
July 3, 1940 | | Trustee | | Since
March 2005 | | Founder –
Investor Analytics
(Risk Management)
(May 1999 – Present)
Founder –
Sutton Asset Management
(Hedge Fund)
(September 1998 – Present) | | | 84 | | | Director and Audit
Committee Member –
Investor Analytics
Director and Audit
Committee Member –
Oxigene, Inc. | |
|
| officers | | | | | | | | | | | | | |
|
David F. Connor
2005 Market Street
Philadelphia, PA
19103
December 2, 1963 | | Vice President,
Deputy General
Counsel, and Secretary | | Vice President since
September 21, 2000
and Secretary
since
October 2005 | | David F. Connor has served as
Vice President and Deputy
General Counsel of
Delaware Investments
since 2000. | | | 84 | | | None3 | |
|
David P. O'Connor
2005 Market Street
Philadelphia, PA
19103
February 21, 1966 | | Senior Vice
President,
General Counsel,
and Chief
Legal Officer | | Senior Vice President,
General Counsel, and
Chief Legal Officer
since
October 2005 | | David P. O'Connor has served in
various executive and legal
capacities at different times at
Delaware Investments. | | | 84 | | | None3 | |
|
John J. O'Connor
2005 Market Street
Philadelphia, PA
19103
June 16, 1957 | | Senior Vice President
and Treasurer | | Treasurer
since
February 2005 | | John J. O'Connor has served in
various executive capacities
at different times at
Delaware Investments. | | | 84 | | | None3 | |
|
Richard Salus
2005 Market Street
Philadelphia, PA
19103
October 4, 1963 | | Senior
Vice President
and
Chief Financial
Officer | | Chief Financial
Officer since
November 1, 2006 | | Richard Salus has served in
various executive capacities
at different times at
Delaware Investments. | | | 84 | | | None3 | |
|
1 Patrick P. Coyne is considered to be an "Interested Trustee" because he is an executive officer of the Fund's(s') investment advisor.
2 Delaware Investments is the marketing name for Delaware Management Holdings, Inc. and its subsidiaries, including the Fund's(s') investment advisor, principal underwriter, and its transfer agent.
3 David F. Connor, David P. O'Connor, John J. O'Connor, and Richard Salus serve in similar capacities for the six portfolios of the Optimum Fund Trust, which have the same investment advisor, principal underwriter, and transfer agent as the registrant. John J. O'Connor also serves in a similar capacity for Lincoln Variable Insurance Products Trust, which has the same investment advisor as the registrant.
The Statement of Additional Information for the Fund(s) includes additional information about the Trustees and Officers and is available, without charge, upon request by calling 800 523-1918.
Value Series- 16
Item 2. Code of Ethics
The registrant has adopted a code of ethics that applies to the registrant’s principal executive officer, principal financial officer, principal accounting officer or controller, or persons performing similar functions, regardless of whether these individuals are employed by the registrant or a third party. A copy of the registrant’s Code of Business Ethics has been posted on Delaware Investments’ internet website at www.delawareinvestments.com. Any amendments to the Code of Business Ethics, and information on any waiver from its provisions granted by the registrant, will also be posted on this website within five business days of such amendment or waiver and will remain on the website for at least 12 months.
Item 3. Audit Committee Financial Expert
The registrant’s Board of Trustees/Directors has determined that each member of the registrant’s Audit Committee is an audit committee financial expert, as defined below. For purposes of this item, an “audit committee financial expert” is a person who has the following attributes:
a. An understanding of generally accepted accounting principles and financial statements;
b. The ability to assess the general application of such principles in connection with the accounting for estimates, accruals, and reserves;
c. Experience preparing, auditing, analyzing, or evaluating financial statements that present a breadth and level of complexity of accounting issues that are generally comparable to the breadth and complexity of issues that can reasonably be expected to be raised by the registrant’s financial statements, or experience actively supervising one or more persons engaged in such activities;
d. An understanding of internal controls and procedures for financial reporting; and
e. An understanding of audit committee functions.
An “audit committee financial expert” shall have acquired such attributes through:
a. Education and experience as a principal financial officer, principal accounting officer, controller, public accountant, or auditor or experience in one or more positions that involve the performance of similar functions;
b. Experience actively supervising a principal financial officer, principal accounting officer, controller, public accountant, auditor, or person performing similar functions;
c. Experience overseeing or assessing the performance of companies or public accountants with respect to the preparation, auditing, or evaluation of financial statements; or
d. Other relevant experience.
The registrant’s Board of Trustees/Directors has also determined that each member of the registrant’s Audit Committee is independent. In order to be “independent” for purposes of this item, the Audit Committee member may not: (i) other than in his or her capacity as a member of the Board of Trustees/Directors or any committee thereof, accept directly or indirectly any consulting, advisory or other compensatory fee from the issuer; or (ii) be an “interested person” of the registrant as defined in Section 2(a)(19) of the Investment Company Act of 1940.
The names of the audit committee financial experts on the registrant’s Audit Committee are set forth below:
Thomas L. Bennett (1)
Thomas F. Madison
Janet L. Yeomans (1)
J. Richard Zecher
Item 4. Principal Accountant Fees and Services
(a) Audit fees.
The aggregate fees billed for services provided to the registrant by its independent auditors for the audit of the registrant’s annual financial statements and for services normally provided by the independent auditors in connection with statutory and regulatory filings or engagements were $272,100 for the fiscal year ended December 31, 2006.
(1) The instructions to Form N-CSR require disclosure on the relevant experience of persons who qualify as audit committee financial experts based on “other relevant experience.” The Board of Trustees/Directors has determined that Mr. Bennett qualifies as an audit committee financial expert by virtue of his education, Chartered Financial Analyst designation, and his experience as a credit analyst, portfolio manager and the manager of other credit analysts and portfolio managers. The Board of Trustees/Directors has determined that Ms. Yeomans qualifies as an audit committee financial expert by virtue of her education and experience as the Treasurer of a large global corporation.
The aggregate fees billed for services provided to the registrant by its independent auditors for the audit of the registrant’s annual financial statements and for services normally provided by the independent auditors in connection with statutory and regulatory filings or engagements were $252,200 for the fiscal year ended December 31, 2005.
(b) Audit-related fees.
The aggregate fees billed by the registrant’s independent auditors for services relating to the performance of the audit of the registrant’s financial statements and not reported under paragraph (a) of this Item were $0 for the fiscal year ended December 31, 2006.
The aggregate fees billed by the registrant’s independent auditors for services relating to the performance of the audit of the financial statements of the registrant’s investment adviser and other service providers under common control with the adviser and that relate directly to the operations or financial reporting of the registrant were $28,700 for the registrant’s fiscal year ended December 31, 2006. The percentage of these fees relating to services approved by the registrant’s Audit Committee pursuant to the de minimis exception from the pre-approval requirement in Rule 2-01(c)(7)(i)(C) of Regulation S-X was 0%. These audit-related services were as follows: issuance of report concerning transfer agent’s system of internal accounting control pursuant to Rule 17Ad-13 of the Securities Exchange Act; and issuance of agreed upon procedures report to the registrant’s Board in connection with the pass-through of internal legal cost relating to the operations of the registrant.
The aggregate fees billed by the registrant’s independent auditors for services relating to the performance of the audit of the registrant’s financial statements and not reported under paragraph (a) of this Item were $0 for the fiscal year ended December 31, 2005.
The aggregate fees billed by the registrant’s independent auditors for services relating to the performance of the audit of the financial statements of the registrant’s investment adviser and other service providers under common control with the adviser and that relate directly to the operations or financial reporting of the registrant were $33,875 for the registrant’s fiscal year ended December 31, 2005. The percentage of these fees relating to services approved by the registrant’s Audit Committee pursuant to the de minimis exception from the pre-approval requirement in Rule 2-01(c)(7)(i)(C) of Regulation S-X was 0%. These audit-related services were as follows: issuance of report concerning transfer agent’s system of internal accounting control pursuant to Rule 17Ad-13 of the Securities Exchange Act; and issuance of agreed upon procedures reports to the registrant’s Board in connection with the annual transfer agent and fund accounting service agent contract renewals and the pass-through of internal legal cost relating to the operations of the registrant.
(c) Tax fees.
The aggregate fees billed by the registrant’s independent auditors for tax-related services provided to the registrant were $51,800 for the fiscal year ended December 31, 2006. The percentage of these fees relating to services approved by the registrant’s Audit Committee pursuant to the de minimis exception from the pre-approval requirement in Rule 2-01(c)(7)(i)(C) of Regulation S-X was 0%. These tax-related services were as follows: review of income tax returns.
The aggregate fees billed by the registrant’s independent auditors for tax-related services provided to the registrant’s investment adviser and other service providers under common control with the adviser and that relate directly to the operations or financial reporting of the registrant were $0 for the registrant’s fiscal year ended December 31, 2006.
The aggregate fees billed by the registrant’s independent auditors for tax-related services provided to the registrant were $47,900 for the fiscal year ended December 31, 2005. The percentage of these fees relating to services approved by the registrant’s Audit Committee pursuant to the de minimis exception from the pre-approval requirement in Rule 2-01(c)(7)(i)(C) of Regulation S-X was 0%. These tax-related services were as follows: review of income tax returns.
The aggregate fees billed by the registrant’s independent auditors for tax-related services provided to the registrant’s adviser and other service providers under common control with the adviser and that relate directly to the operations or financial reporting of the registrant were $0 for the registrant’s fiscal year ended December 31, 2005.
(d) All other fees.
The aggregate fees billed for all services provided by the independent auditors to the registrant other than those set forth in paragraphs (a), (b) and (c) of this Item were $0 for the fiscal year ended December 31, 2006.
The aggregate fees billed for all services other than those set forth in paragraphs (b) and (c) of this Item provided by the registrant’s independent auditors to the registrant’s adviser and other service providers under common control with the adviser and that relate directly to the operations or financial reporting of the registrant were $0 for the registrant’s fiscal year ended December 31, 2006.
The aggregate fees billed for all services provided by the independent auditors to the registrant other than those set forth in paragraphs (a), (b) and (c) of this Item were $0 for the fiscal year ended December 31, 2005.
The aggregate fees billed for all services other than those set forth in paragraphs (b) and (c) of this Item provided by the registrant’s independent auditors to the registrant’s adviser and other service providers under common control with the adviser and that relate directly to the
operations or financial reporting of the registrant were $0 for the registrant’s fiscal year ended December 31, 2005.
(e) The registrant’s Audit Committee has established pre-approval policies and procedures as permitted by Rule 2-01(c)(7)(i)(B) of Regulation S-X (the “Pre-Approval Policy”) with respect to services provided by the registrant’s independent auditors. Pursuant to the Pre-Approval Policy, the Audit Committee has pre-approved the services set forth in the table below with respect to the registrant up to the specified fee limits. Certain fee limits are based on aggregate fees to the registrant and other registrants within the Delaware Investments Family of Funds.
Service | | Range of Fees |
Audit Services | | |
Statutory audits or financial audits for new Funds | | up to $25,000 per Fund |
Services associated with SEC registration statements (e.g., Form N-1A, Form N-14, etc.), periodic reports and other documents filed with the SEC or other documents issued in connection with securities offerings (e.g., comfort letters for closed-end Fund offerings, consents), and assistance in responding to SEC comment letters | | up to $10,000 per Fund |
Consultations by Fund management as to the accounting or disclosure treatment of transactions or events and/or the actual or potential impact of final or proposed rules, standards or interpretations by the SEC, FASB, or other regulatory or standard-setting bodies (Note: Under SEC rules, some consultations may be considered “audit-related services” rather than “audit services”) | | up to $25,000 in the aggregate |
| | |
Audit-Related Services | | |
Consultations by Fund management as to the accounting or disclosure treatment of transactions or events and /or the actual or potential impact of final or proposed rules, standards or interpretations by the SEC, FASB, or other regulatory or standard-setting bodies (Note: Under SEC rules, some consultations may be considered “audit services” rather than “audit-related services”) | | up to $25,000 in the aggregate |
| | |
Tax Services | | |
U.S. federal, state and local and international tax planning and advice (e.g., consulting on statutory, regulatory or administrative developments, evaluation of Funds’ tax compliance function, etc.) | | up to $25,000 in the aggregate |
U.S. federal, state and local tax compliance (e.g., excise distribution reviews, etc.) | | up to $5,000 per Fund |
Review of federal, state, local and international income, franchise and other tax returns | | up to $5,000 per Fund |
Under the Pre-Approval Policy, the Audit Committee has also pre-approved the services set forth in the table below with respect to the registrant’s investment adviser and other entities controlling, controlled by or under common control with the investment adviser that provide ongoing services to the registrant (the “Control Affiliates”) up to the specified fee limit. This fee limit is based on aggregate fees to the investment adviser and its Control Affiliates.
Service | | Range of Fees |
Non-Audit Services | | |
Services associated with periodic reports and other documents filed with the SEC and assistance in responding to SEC comment letters | | up to $10,000 in the aggregate |
The Pre-Approval Policy requires the registrant’s independent auditors to report to the Audit Committee at each of its regular meetings regarding all services initiated since the last such report was rendered, including those services authorized by the Pre-Approval Policy.
(f) Not applicable.
(g) The aggregate non-audit fees billed by the registrant’s independent auditors for services rendered to the registrant and to its investment adviser and other service providers under common control with the adviser were $306,508 and $243,135 for the registrant’s fiscal years ended December 31, 2006 and December 31, 2005, respectively.
(h) In connection with its selection of the independent auditors, the registrant’s Audit Committee has considered the independent auditors’ provision of non-audit services to the registrant’s investment adviser and other service providers under common control with the adviser that were not required to be pre-approved pursuant to Rule 2-01(c)(7)(ii) of Regulation S-X. The Audit Committee has determined that the independent auditors’ provision of these services is compatible with maintaining the auditors’ independence.
Item 5. Audit Committee of Listed Registrants
Not applicable.
Item 6. Schedule of Investments
Included as part of report to shareholders filed under Item 1 of this Form N-CSR.
Item 7. Disclosure of Proxy Voting Policies and Procedures for Closed-End Management Investment Companies
Not applicable.
Item 8. Portfolio Managers of Closed-End Management Investment Companies
Not applicable.
Item 9. Purchases of Equity Securities by Closed-End Management Investment Company and Affiliated Purchasers
Not applicable.
Item 10. Submission of Matters to a Vote of Security Holders
Not applicable.
Item 11. Controls and Procedures
(a) The registrant’s principal executive officer and principal financial officer have evaluated the registrant’s disclosure controls and procedures within 90 days of the filing of this report and have concluded that they are effective in providing reasonable assurance that the information required to be disclosed by the registrant in its reports or statements filed under the Securities Exchange Act of 1934 is recorded, processed, summarized and reported within the time periods specified in the rules and forms of the Securities and Exchange Commission.
(b) Management has made changes that have materially affected, or are reasonably likely to materially affect, registrant’s internal controls over financial reporting. To seek to increase the controls’ effectiveness, these changes provide for enhanced review of contracts relating to complex transactions and the applicability of generally accepted accounting principles to such transactions, including enhanced consultation with registrant’s independent public accountants in connection with such reviews.
Because of its inherent limitations, internal control over financial reporting may not prevent or detect misstatements. Also, projections of any evaluation of effectiveness to future periods are subject to the risk that controls may become inadequate because of changes in conditions, or that the degree of compliance with the policies or procedures may deteriorate.
Item 12. Exhibits
(a) (1) Code of Ethics
Not applicable.
(2) Certifications of Principal Executive Officer and Principal Financial Officer pursuant to Rule 30a-2 under the Investment Company Act of 1940 are attached hereto as Exhibit 99.CERT.
(3) Written solicitations to purchase securities pursuant to Rule 23c-1 under the Securities Exchange Act of 1934.
Not applicable.
(b) Certifications pursuant to Section 906 of the Sarbanes-Oxley Act of 2002 are furnished herewith as Exhibit 99.906CERT.
SIGNATURES
Pursuant to the requirements of the Securities Exchange Act of 1934 and the Investment Company Act of 1940, the registrant has duly caused this report to be signed on its behalf, by the undersigned, thereunto duly authorized.
Name of Registrant: |
|
|
PATRICK P. COYNE | |
By: | Patrick P. Coyne |
Title: | Chief Executive Officer |
Date: | March 9, 2007 |
| | |
Pursuant to the requirements of the Securities Exchange Act of 1934 and the Investment Company Act of 1940, this report has been signed below by the following persons on behalf of the registrant and in the capacities and on the dates indicated.
PATRICK P. COYNE | |
By: | Patrick P. Coyne |
Title: | Chief Executive Officer |
Date: | March 9, 2007 |
| |
| |
RICHARD SALUS | |
By: | Richard Salus |
Title: | Chief Financial Officer |
Date: | March 9, 2007 |
| | |