UNITED STATES
SECURITIES AND EXCHANGE COMMISSION
Washington, D.C. 20549
FORM N-CSR
CERTIFIED SHAREHOLDER REPORT OF REGISTERED
MANAGEMENT INVESTMENT COMPANIES
Investment Company Act file number | 811-5162 |
|
Delaware VIP Trust |
(Exact name of registrant as specified in charter) |
|
2005 Market Street Philadelphia, PA | | 19103 |
(Address of principal executive offices) | | (Zip code) |
|
David F. Connor, Esq. 2005 Market Street Philadelphia, PA 19103 |
(Name and address of agent for service) |
|
Registrant’s telephone number, including area code: | (800) 523-1918 | |
|
Date of fiscal year end: | December 31 | |
|
Date of reporting period: | December 31, 2007 | |
| | | | | | | | | |
Item 1. Reports to Stockholders
Delaware VIP Trust — Delaware VIP Balanced Series
For the fiscal year ended Dec. 31, 2007, Delaware VIP Balanced Series returned +0.33% for Standard Class shares with distributions reinvested, and +0.05% for Service Class shares with all distributions reinvested. The Series fell short of its benchmarks: the S&P 500 Index returned +5.49%, and the Lehman Brothers U.S. Aggregate Index returned +6.97% (source: Lipper).
Returns for the portion of assets allocated to equities trailed the equity benchmark, the S&P 500 Index, and detracted from overall performance. In equity investments, the Series’ healthcare investments performed favorably overall. Our investments in telecommunication services also contributed to returns. The fixed income portfolio underperformed the Lehman Brothers U.S. Aggregate Index return.
Overall, the Series seeks a balance of capital appreciation, income, and preservation of capital. During the year 2007, the economic picture was marred by a deepening housing slump and a tumultuous mortgage market. Credit markets, driven by a loss of confidence in the value of many types of debt collateral and the relevance of ratings on that debt, essentially seized up until central banks stepped in to provide sufficient sources of liquidation. By the time the fiscal year ended, the U.S. Federal Reserve had trimmed interest rates at meetings in September, October, and December, for a total of 100 basis points, or one percentage point (to 4.25%).
We had positioned the Series to diminish the effects of private equity take-outs on our corporate bond portfolio. As a result, the Series carried a position in financial hybrid securities that were hurt by the credit crunch early on. The Series also carried an overweight in mortgage and asset-backed investments, which performed poorly during the credit turmoil. Another overweight — in the commercial mortgage-backed sector — also contributed to the performance deficit versus the index. Illiquid markets made it very difficult to adjust the Series’ position as we entered the volatile summer months.
It was a difficult year for the financial sector, as a whole, and several of our financial holdings experienced steep declines, especially Washington Mutual, Discover Financial Services and Huntington Bancshares. At year end, we believed that Washington Mutual could survive the housing market correction and, longer term, offered an attractive risk/reward tradeoff relative to its current price. Despite its decline during the year, we continued to have confidence in Discover’s long-term value. Similarly, we believed Huntington Bancshares, as a traditional bank that profits from spread lending, could meaningfully benefit from an eventual recovery in the economy and credit markets.
The team repositioned the Series to be significantly underweight in the financial sector. Taking into consideration contributions on a duration basis, the Series is now underexposed to corporate bonds in general. In addition, our mortgage investments analysts worked to reduce the asset-backed investment position, and to produce a neutral position versus the benchmark in the structured product area. The Series’ duration was moved to a slightly longer position to capture bond rallies in the weakening economic situation.
The views expressed are current as of the date of this report and are subject to change.
The performance data quoted below represent past performance; past performance does not guarantee future results. Investment return and principal value will fluctuate so your shares, when redeemed, may be worth more or less than their original cost. Please obtain the performance data for the most recent month end by calling the number noted in the introductory section of this report on the page related to this Series.
You should consider the investment objectives, risks, charges, and expenses of the investment company carefully before investing. The Delaware VIP Balanced Series prospectus contains this and other important information about the Series. To obtain a prospectus, contact the company noted on the page related to this Series in the introductory section of this report, either by phone or through the company Web site. We advise you to read the prospectus carefully before you invest.
Delaware VIP Balanced Series
Average annual total returns
For periods ended Dec. 31, 2007 | | 1 year | | 5 years | | 10 years | | Lifetime | |
| | | | | | | | | |
Standard Class shares (commenced operations July 28, 1988) | | +0.33 | % | +8.81 | % | +2.25 | % | +7.75 | % |
| | | | | | | | | |
Service Class shares (commenced operations May 1, 2000) | | +0.05 | % | +8.54 | % | NA | | +2.22 | % |
As disclosed in the Series’ most recent prospectus, expenses for Standard Class and Service Class shares were as follows: The net expense ratios for Standard Class and Service Class shares of the Series were 0.83% and 1.08%, respectively. Total operating expenses for Standard Class and Service Class shares were 0.83% and 1.13%, respectively. Management fees for Standard Class and Service Class shares were 0.65%.
Earnings from a variable annuity or variable life investment compound tax-free until withdrawal and, as a result, no adjustments were made for income taxes.
An expense limitation was in effect for all classes during the periods shown in the Series performance chart above and in the Performance of a $10,000 Investment chart on the next page.
1
Performance of Service Class shares will vary due to different charges and expenses.
Performance data do not reflect insurance fees related to a variable annuity or variable life investment or the deferred sales charge that would apply to certain withdrawals of investments held for fewer than eight years. Performance shown here would have been reduced if such fees were included and the expense limitation removed. For more information about fees, consult your variable annuity or variable life prospectus.
Investments in variable products involve risk. A rise or fall in interest rates can have a significant impact on bond prices and the net asset value (NAV) of the Series. High yielding, noninvestment grade bonds (junk bonds) involve higher risk than investment grade bonds. Adverse conditions may affect the issuer’s ability to pay interest and principal on these securities. The portfolio may have turnover in excess of 100%. High portfolio turnover can increase the Series’ transaction costs and lower returns.
The Series may be invested in foreign high yield corporate bonds, which have special risks that include currency fluctuations, economic and political change, and different accounting standards. Some portfolios offer more risk than others. The Series may utilize futures and swaps for defensive strategy purposes to project or minimize the impact of potential changes.
Please read both the contract and underlying prospectus for specific details regarding the product’s risk profile.
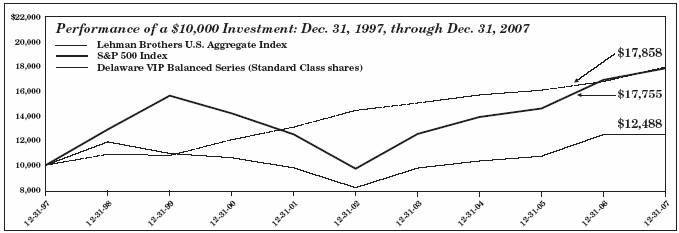
The chart shows a $10,000 investment in the Delaware VIP Balanced Series Standard Class shares for the period from Dec. 31, 1997, through Dec. 31, 2007. Performance of Service Class shares will vary due to different charges and expenses.
The chart also shows $10,000 invested in the S&P 500 Index and Lehman Brothers U.S. Aggregate Index for the period from Dec. 31, 1997, through Dec. 31, 2007. The S&P 500 Index measures the performance of mostly large-capitalization U.S. companies. The Lehman Brothers U.S. Aggregate Index, sometimes also referred to as the Lehman Brothers Aggregate Bond Index, measures the performance of approximately 6,500 publicly issued investment grade (Baa3/BBB- or better) corporate, U.S. government, mortgage- and asset-backed securities with at least one year to maturity and at least $250 million par value outstanding. An index is unmanaged and does not reflect the costs of operating a mutual fund, such as the costs of buying, selling, and holding securities. You cannot invest directly in an index.
2
Delaware VIP Trust — Delaware VIP Balanced Series
Disclosure of Series Expenses
For the Period July 1, 2007 to December 31, 2007
As a shareholder of the Series, you incur ongoing costs, including management fees; distribution and/or service (12b-1) fees; and other Series expenses. This Example is intended to help you understand your ongoing costs (in dollars) of investing in the Series and to compare these costs with the ongoing costs of investing in other mutual funds.
The Example is based on an investment of $1,000 invested at the beginning of the period and held for the entire period from July 1, 2007 to December 31, 2007.
Actual Expenses
The first section of the table shown, “Actual Series Return,” provides information about actual account values and actual expenses. You may use the information in this section of the table, together with the amount you invested, to estimate the expenses that you paid over the period. Simply divide your account value by $1,000 (for example, an $8,600 account value divided by $1,000 = 8.6), then multiply the result by the number in the first section under the heading entitled “Expenses Paid During Period” to estimate the expenses you paid on your account during the period.
Hypothetical Example for Comparison Purposes
The second section of the table shown, “Hypothetical 5% Return,” provides information about hypothetical account values and hypothetical expenses based on the Series’ actual expense ratio and an assumed rate of return of 5% per year before expenses, which is not the Series’ actual return. The hypothetical account values and expenses may not be used to estimate the actual ending account balance or expenses you paid for the period. You may use this information to compare the ongoing costs of investing in the Series and other funds. To do so, compare the 5% hypothetical example with the 5% hypothetical examples that appear in the shareholder reports of other funds.
Please note that the expenses shown in the table are meant to highlight your ongoing costs only. As a shareholder of the Series, you do not incur any transaction costs, such as sales charges (loads), redemption fees or exchange fees, but shareholders of other funds may incur such costs. Also, the fees related to the variable annuity investment or the deferred sales charge that could apply have not been included. Therefore, the second section of the table is useful in comparing ongoing costs only, and will not help you determine the relative total costs of owning different funds. The Series’ actual expenses shown in the table reflect fee waivers in effect. The expenses shown in the table assume reinvestment of all dividends and distributions.
Expense Analysis of an Investment of $1,000
| | Beginning
Account
Value
7/1/07 | | Ending
Account
Value
12/31/07 | | Annualized
Expense
Ratios | | Expenses
Paid During
Period
7/1/07 to
12/31/07* | |
Actual Series Return | | | | | | | | | |
Standard Class | | $ | 1,000.00 | | $ | 958.60 | | 0.85 | % | $ | 4.20 | |
Service Class | | 1,000.00 | | 957.30 | | 1.10 | % | 5.43 | |
Hypothetical 5% Return (5% return before expenses) | | | | | | | | | |
Standard Class | | $ | 1,000.00 | | $ | 1,020.92 | | 0.85 | % | $ | 4.33 | |
Service Class | | 1,000.00 | | 1,019.66 | | 1.10 | % | 5.60 | |
*“Expenses Paid During Period” are equal to the Series’ annualized expense ratio, multiplied by the average account value over the period, multiplied by 184/365 (to reflect the one-half year period).
3
Delaware VIP Trust — Delaware VIP Balanced Series
Sector Allocation and Credit Quality Breakdown
As of December 31, 2007
Sector designations may be different than the sector designations presented in other Series materials.
Sector | | Percentage
of Net Assets | |
Common Stock | | 59.61 | % |
Consumer Discretionary | | 5.54 | % |
Consumer Staples | | 7.43 | % |
Energy | | 4.10 | % |
Financials | | 13.62 | % |
Health Care | | 10.60 | % |
Industrials | | 3.45 | % |
Information Technology | | 7.44 | % |
Materials | | 1.81 | % |
Media | | 0.00 | % |
Telecommunications | | 3.78 | % |
Utilities | | 1.84 | % |
Convertible Preferred Stock | | 0.08 | % |
Preferred Stock | | 0.09 | % |
Agency Asset-Backed Security | | 0.01 | % |
Agency Collateralized Mortgage Obligations | | 2.48 | % |
Agency Mortgage-Backed Securities | | 5.34 | % |
Agency Obligations | | 2.10 | % |
Commercial Mortgage-Backed Securities | | 3.56 | % |
Convertible Bonds | | 0.21 | % |
Corporate Bonds | | 8.11 | % |
Banking | | 0.68 | % |
Basic Industry | | 0.33 | % |
Brokerage | | 0.43 | % |
Capital Goods | | 0.12 | % |
Communications | | 1.35 | % |
Consumer Cyclical | | 0.43 | % |
Consumer Non-Cyclical | | 1.67 | % |
Electric | | 0.53 | % |
Energy | | 0.56 | % |
Finance Companies | | 0.66 | % |
Insurance | | 0.30 | % |
Natural Gas | | 0.72 | % |
Real Estate | | 0.16 | % |
Technology | | 0.04 | % |
Transportation | | 0.13 | % |
Municipal Bonds | | 1.10 | % |
Non-Agency Asset-Backed Securities | | 4.02 | % |
Non-Agency Collateralized Mortgage Obligations | | 8.28 | % |
U.S. Treasury Obligations | | 6.28 | % |
Discount Note | | 1.94 | % |
Securities Lending Collateral | | 5.79 | % |
Total Value of Securities | | 109.00 | % |
Obligation to Return Securities Lending Collateral | | (5.79 | )% |
Liabilities Net of Receivables and Other Assets | | (3.21 | )% |
Total Net Assets | | 100.00 | % |
Credit Quality Breakdown
(as a % of fixed income investments) | | | |
AAA | | 72.03 | % |
AA | | 7.73 | % |
A | | 8.67 | % |
BBB | | 10.47 | % |
BB | | 0.57 | % |
B | | 0.53 | % |
Total | | 100.00 | % |
4
Delaware VIP Trust — Delaware VIP Balanced Series
Statement of Net Assets
December 31, 2007
| | Number of
Shares | | Value
(U.S. $) | |
| | | | | | |
| COMMON STOCK–59.61% | | | | | |
| Consumer Discretionary–5.54% | | | | | |
| Gap | | 25,800 | | $ | 549,024 | |
| Limited Brands | | 24,400 | | 461,892 | |
| Mattel | | 25,500 | | 485,520 | |
| | | | | 1,496,436 | |
| Consumer Staples–7.43% | | | | | |
| Heinz (H.J.) | | 11,200 | | 522,816 | |
* | Kimberly-Clark | | 7,400 | | 513,116 | |
| Kraft Foods Class A | | 15,300 | | 499,239 | |
| Safeway | | 13,800 | | 472,098 | |
| | | | | 2,007,269 | |
| Energy–4.10% | | | | | |
| Chevron | | 5,900 | | 550,647 | |
| ConocoPhillips | | 6,300 | | 556,290 | |
| | | | | 1,106,937 | |
| Financials–13.62% | | | | | |
| Allstate | | 10,200 | | 532,746 | |
| Chubb | | 9,700 | | 529,426 | |
| Discover Financial Services | | 28,750 | | 433,550 | |
| Hartford Financial Services Group | | 5,600 | | 488,264 | |
| Huntington Bancshares | | 31,300 | | 461,988 | |
| Morgan Stanley | | 8,900 | | 472,679 | |
| Wachovia | | 12,200 | | 463,966 | |
| Washington Mutual | | 22,000 | | 299,420 | |
| | | | | 3,682,039 | |
| Health Care–10.60% | | | | | |
| Abbott Laboratories | | 8,500 | | 477,275 | |
| Baxter International | | 8,300 | | 481,815 | |
| Bristol-Myers Squibb | | 17,500 | | 464,100 | |
| Johnson & Johnson | | 7,200 | | 480,240 | |
| Pfizer | | 21,300 | | 484,149 | |
| Wyeth | | 10,800 | | 477,252 | |
| | | | | 2,864,831 | |
| Industrials–3.45% | | | | | |
| Donnelley (R.R.) & Sons | | 13,000 | | 490,620 | |
| Waste Management | | 13,500 | | 441,045 | |
| | | | | 931,665 | |
| Information Technology–7.44% | | | | | |
| Intel | | 19,500 | | 519,870 | |
* | International Business Machines | | 4,700 | | 508,070 | |
| Motorola | | 29,100 | | 466,764 | |
| Xerox | | 31,800 | | 514,842 | |
| | | | | 2,009,546 | |
| Materials–1.81% | | | | | |
| duPont (E.I.) deNemours | | 11,100 | | 489,399 | |
| | | | | 489,399 | |
| Media–0.00% | | | | | |
† | Century Communications | | 5,000 | | 4 | |
| | | | | 4 | |
| Telecommunications–3.78% | | | | | |
| AT&T | | 12,400 | | 515,344 | |
| Verizon Communications | | 11,600 | | 506,804 | |
| | | | | 1,022,148 | |
| Utilities–1.84% | | | | | |
| Progress Energy | | 10,300 | | $ | 498,829 | |
| | | | | 498,829 | |
| Total Common Stock
(cost $15,005,953) | | | | 16,109,103 | |
| | | | | | |
| CONVERTIBLE PREFERRED STOCK–0.08% | | | | | |
· | Citigroup Funding 4.943% exercise price $29.50, expiration date 9/27/08 | | 900 | | 22,599 | |
| Total Convertible Preferred Stock
(cost $28,488) | | | | 22,599 | |
| | | | | | |
| PREFERRED STOCK–0.09% | | | | | |
| Fannie Mae 8.25% | | 900 | | 23,175 | |
| Total Preferred Stock
(cost $22,500) | | | | 23,175 | |
| | Principal
Amount
(U.S. $) | | | |
| | | | | | |
| AGENCY ASSET-BACKED SECURITY–0.01% | | | | | |
· | Fannie Mae Whole Loan | | | | | |
| Series 2002-W11 AV1 5.205% 11/25/32 | | $ | 1,800 | | 1,800 | |
| Total Agency Asset-Backed Security (cost $1,801) | | | | 1,800 | |
| | | | | | |
| AGENCY COLLATERALIZED MORTGAGE OBLIGATIONS–2.48% | | | | | |
| Fannie Mae | | | | | |
| Series 1996-46 ZA 7.50% 11/25/26 | | 16,716 | | 17,550 | |
| Series 2003-122 AJ 4.50% 2/25/28 | | 16,017 | | 15,785 | |
| Series 2005-67 EY 5.50% 8/25/25 | | 15,000 | | 15,094 | |
· | Series 2006-M2 A2F 5.259% 5/25/20 | | 60,000 | | 59,405 | |
| Fannie Mae Grantor Trust | | | | | |
| Series 2001-T8 A2 9.50% 7/25/41 | | 14,001 | | 15,286 | |
| Fannie Mae Whole Loan | | | | | |
| Series 2004-W9 2A1 6.50% 2/25/44 | | 24,260 | | 25,317 | |
| Series 2004-W11 1A2 6.50% 5/25/44 | | 24,795 | | 26,129 | |
| Freddie Mac | | | | | |
| Series 1730 Z 7.00% 5/15/24 | | 14,361 | | 15,264 | |
| Series 2326 ZQ 6.50% 6/15/31 | | 66,818 | | 70,882 | |
| Series 2557 WE 5.00% 1/15/18 | | 25,000 | | 25,081 | |
| Series 2662 MA 4.50% 10/15/31 | | 30,751 | | 30,467 | |
| Series 2694 QG 4.50% 1/15/29 | | 30,000 | | 29,634 | |
| Series 2872 GC 5.00% 11/15/29 | | 40,000 | | 39,964 | |
| Series 3005 ED 5.00% 7/15/25 | | 40,000 | | 38,965 | |
| Series 3022 MB 5.00% 12/15/28 | | 30,000 | | 30,164 | |
| Series 3063 PC 5.00% 2/15/29 | | 60,000 | | 60,520 | |
| Series 3113 QA 5.00% 11/15/25 | | 36,005 | | 36,129 | |
| Series 3173 PE 6.00% 4/15/35 | | 70,000 | | 71,256 | |
| Series 3337 PB 5.50% 7/15/30 | | 20,000 | | 20,285 | |
t | Freddie Mac Structured Pass Through Securities | | | | | |
| Series T-58 2A 6.50% 9/25/43 | | 26,511 | | 27,690 | |
| Total Agency Collateralized Mortgage Obligations (cost $665,790) | | | | 670,867 | |
| | | | | | | |
5
| | Principal
Amount
(U.S. $) | | Value
(U.S. $) | |
| | | | | | |
| AGENCY MORTGAGE-BACKED SECURITIES–5.34% | | | | | |
| Fannie Mae 6.50% 8/1/17 | | $ | 19,148 | | $ | 19,714 | |
· | Fannie Mae ARM 5.968% 8/1/37 | | 53,198 | | 53,722 | |
| Fannie Mae Relocation 30 yr 5.00% 11/1/34 | | 30,919 | | 30,404 | |
| Fannie Mae S.F. 15 yr TBA | | | | | |
| 4.50% 1/1/23 | | 70,000 | | 68,906 | |
| 5.00% 1/1/23 | | 150,000 | | 150,164 | |
| 5.50% 1/1/23 | | 60,000 | | 60,778 | |
| 6.00% 1/1/23 | | 110,000 | | 112,561 | |
| Fannie Mae S.F. 30 yr | | | | | |
| 5.50% 3/1/29 | | 63,538 | | 63,773 | |
| 5.50% 4/1/29 | | 70,041 | | 70,300 | |
| 5.50% 8/1/37 | | 134,987 | | 134,835 | |
| 6.50% 2/1/37 | | 99,321 | | 102,107 | |
| 6.50% 11/1/37 | | 54,630 | | 56,156 | |
| 7.50% 6/1/31 | | 21,219 | | 22,649 | |
| 9.50% 6/1/19 | | 3,138 | | 3,330 | |
· | Freddie Mac ARM | | | | | |
| 5.683% 7/1/36 | | 20,653 | | 20,930 | |
| 6.335% 4/1/34 | | 8,964 | | 9,057 | |
| Freddie Mac S.F. 15 yr | | | | | |
| 4.00% 2/1/14 | | 46,265 | | 45,921 | |
| 5.00% 6/1/18 | | 17,305 | | 17,348 | |
| Freddie Mac S.F. 30 yr | | | | | |
| 6.00% 6/1/37 | | 35,000 | | 35,526 | |
| 7.00% 11/1/33 | | 11,905 | | 12,490 | |
| Freddie Mac S.F. 30 yr TBA 5.00% 1/1/38 | | 210,000 | | 204,882 | |
| GNMA S.F. 30 yr 7.50% 1/15/32 | | 4,929 | | 5,259 | |
| GNMA S.F. 30 yr TBA | | | | | |
| 5.50% 1/1/38 | | 70,000 | | 70,514 | |
| 6.00% 1/1/38 | | 70,000 | | 71,663 | |
| Total Agency Mortgage-Backed Securities (cost $1,434,608) | | | | 1,442,989 | |
| | | | | | |
| AGENCY OBLIGATIONS–2.10% | | | | | |
| Fannie Mae | | | | | |
* | 4.75% 3/12/10 | | 60,000 | | 61,486 | |
* | 4.75% 11/19/12 | | 200,000 | | 207,198 | |
| 4.875% 5/18/12 | | 25,000 | | 26,001 | |
^ | 5.377% 10/9/19 | | 230,000 | | 129,044 | |
| Federal Home Loan Bank 4.50% 10/9/09 | | 25,000 | | 25,397 | |
^ | Resolution Funding Interest Strip 5.24% 10/15/25 | | 275,000 | | 117,862 | |
| Total Agency Obligations
(cost $544,606) | | | | 566,988 | |
| | | | | | |
| COMMERCIAL MORTGAGE-BACKED SECURITIES–3.56% | | | | | |
| Bank of America Commercial Mortgage | | | | | |
· | Series 2004-3 A5 5.316% 6/10/39 | | 30,000 | | 30,861 | |
· | Series 2005-6 AM 5.181% 9/10/47 | | 15,000 | | 14,589 | |
· | Series 2006-3 A4 5.889% 7/10/44 | | 30,000 | | 31,170 | |
| Series 2006-4 A4 5.634% 7/10/46 | | 10,000 | | 10,211 | |
| Bear Stearns Commercial Mortgage Securities | | | | | |
# | Series 2004-ESA E 144A 5.064% 5/14/16 | | $ | 40,000 | | $ | 40,600 | |
· | Series 2007-T28 A4 5.742% 9/11/42 | | 30,000 | | 30,732 | |
t | Commercial Mortgage Pass Through Certificates | | | | | |
#· | Series 2001-J1A A2 144A 6.457% 2/14/34 | | 27,337 | | 28,450 | |
| Series 2006-C7 A2 5.69% 6/10/46 | | 25,000 | | 25,388 | |
· | Credit Suisse Mortgage Capital Certificates Series 2006-C1 AAB 5.555% 2/15/39 | | 15,000 | | 15,215 | |
# | Crown Castle Towers Series 2005-1A C 144A 5.074% 6/15/35 | | 25,000 | | 24,458 | |
| First Union National Bank-Bank of America Commercial Mortgage Trust
Series 2001-C1 C 6.403% 3/15/33 | | 10,000 | | 10,459 | |
| First Union-Lehman Brothers-Bank of America Series 1998-C2 A2 6.56% 11/18/35 | | 19,659 | | 19,645 | |
| General Electric Capital Commercial Mortgage Series 2002-1A A3 6.269% 12/10/35 | | 50,000 | | 52,647 | |
| Goldman Sachs Mortgage Securities II | | | | | |
| Series 2004-GG2 A3 4.602% 8/10/38 | | 20,000 | | 19,965 | |
| Series 2006-GG8 A4 5.56% 11/10/39 | | 40,000 | | 40,624 | |
| Greenwich Capital Commercial Funding Series 2007-GG9 A4 5.444% 3/10/39 | | 25,000 | | 25,148 | |
| JPMorgan Chase Commercial Mortgage Securities | | | | | |
| Series 2002-C1 A3 5.376% 7/12/37 | | 35,000 | | 35,701 | |
| Series 2003-C1 A2 4.985% 1/12/37 | | 68,000 | | 68,228 | |
#· | Series 2006-RR1A A1 144A 5.455% 10/18/52 | | 25,000 | | 21,723 | |
| Lehman Brothers-UBS Commercial Mortgage Trust | | | | | |
| Series 2001-C2 A1 6.27% 6/15/20 | | 4,069 | | 4,099 | |
| Series 2002-C1 A4 6.462% 3/15/31 | | 55,000 | | 58,308 | |
· | Merrill Lynch Mortgage Trust Series 2006-C1 ASB 5.659% 5/12/39 | | 35,000 | | 35,799 | |
| Merrill Lynch/Countrywide Commercial Mortgage Trust Series 2007-5 A1 4.275% 8/12/48 | | 44,688 | | 44,055 | |
· | Morgan Stanley Capital I Series 2007-IQ14 A4 5.692% 4/15/49 | | 25,000 | | 25,482 | |
# | SBA Commercial Mortgage Securities Trust Series 2006-1A B 144A 5.451% 11/15/36 | | 60,000 | | 59,469 | |
6
| | Principal
Amount
(U.S. $) | | Value
(U.S. $) | |
| | | | | | |
| COMMERCIAL MORTGAGE-BACKED SECURITIES (continued) | | | | | |
# | Tower 144A | | | | | | | |
| Series 2004-2A A 4.232% 12/15/14 | | $ | 45,000 | | $ | 44,141 | |
| Series 2006-1 B 5.588% 2/15/36 | | 25,000 | | 24,811 | |
| Series 2006-1 C 5.707% 2/15/36 | | 25,000 | | 24,991 | |
| Wachovia Bank Commercial Mortgage Trust | | | | | |
· | Series 2005-C20 A5 5.087% 7/15/42 | | 15,000 | | 14,936 | |
| Series 2006-C28 A2 5.50% 10/15/48 | | 40,000 | | 40,356 | |
| Series 2007-C30 A3 5.246% 12/15/43 | | 40,000 | | 39,928 | |
| Total Commercial Mortgage-Backed Securities (cost $970,944) | | | | 962,189 | |
| | | | | | |
| CONVERTIBLE BONDS–0.21% | | | | | |
· | U.S. Bancorp 3.176% 9/20/36 exercise price $38.28, expiration date 9/20/36 | | 35,000 | | 34,968 | |
*· | Wyeth 4.886% 1/15/24 exercise price $60.09, expiration date 1/15/24 | | 20,000 | | 21,201 | |
| Total Convertible Bonds
(cost $56,330) | | | | 56,169 | |
| | | | | | |
| CORPORATE BONDS–8.11% | | | | | |
| Banking–0.68% | | | | | |
| JPMorgan Chase 5.75% 1/2/13 | | 30,000 | | 30,605 | |
| JPMorgan Chase Capital XXV 6.80% 10/1/37 | | 25,000 | | 24,111 | |
| Popular North America | | | | | |
| 4.25% 4/1/08 | | 55,000 | | 54,886 | |
· | 5.643% 4/6/09 | | 25,000 | | 25,091 | |
| Popular North America Capital Trust I 6.564% 9/15/34 | | 10,000 | | 8,939 | |
| U.S. Bank North America 4.80% 4/15/15 | | 15,000 | | 14,425 | |
| Wachovia Bank North America 6.60% 1/15/38 | | 10,000 | | 10,083 | |
| Wells Fargo 5.625% 12/11/17 | | 15,000 | | 15,037 | |
| | | | | 183,177 | |
| Basic Industry–0.33% | | | | | |
| duPont (E.I.) deNemours 5.00% 1/15/13 | | 20,000 | | 20,148 | |
| Georgia-Pacific 8.875% 5/15/31 | | 1,000 | | 970 | |
| Lubrizol 4.625% 10/1/09 | | 30,000 | | 30,140 | |
| Potlatch 13.00% 12/1/09 | | 5,000 | | 5,674 | |
| Rohm & Haas 5.60% 3/15/13 | | 31,000 | | 32,249 | |
| | | | | 89,181 | |
| Brokerage–0.43% | | | | | |
| AMVESCAP 4.50% 12/15/09 | | 55,000 | | 54,293 | |
| Goldman Sachs Group 6.75% 10/1/37 | | 33,000 | | 32,435 | |
| Jefferies Group 6.45% 6/8/27 | | 20,000 | | 18,630 | |
| LaBranche 11.00% 5/15/12 | | 1,000 | | 984 | |
| Lazard Group 6.85% 6/15/17 | | 10,000 | | 9,894 | |
| | | | | 116,236 | |
| Capital Goods–0.12% | | | | | |
| L-3 Communications 7.625% 6/15/12 | | $ | 2,000 | | $ | 2,058 | |
· | Masco 5.433% 3/12/10 | | 20,000 | | 19,328 | |
| Textron 6.50% 6/1/12 | | 10,000 | | 10,620 | |
| | | | | 32,006 | |
| Communications–1.35% | | | | | |
| American Tower 7.125% 10/15/12 | | 5,000 | | 5,163 | |
| AT&T 5.10% 9/15/14 | | 5,000 | | 4,955 | |
| AT&T Wireless 8.125% 5/1/12 | | 50,000 | | 55,647 | |
| Citizens Communications 7.125% 3/15/19 | | 5,000 | | 4,775 | |
| Comcast | | | | | |
· | 5.543% 7/14/09 | | 15,000 | | 14,951 | |
| 6.30% 11/15/17 | | 50,000 | | 51,972 | |
# | Donnelley (R.H.) 144A 8.875% 10/15/17 | | 5,000 | | 4,650 | |
| Hughes Network Systems/Finance 9.50% 4/15/14 | | 2,000 | | 2,035 | |
| Rural Cellular 9.875% 2/1/10 | | 5,000 | | 5,213 | |
· | Sprint Nextel 5.243% 6/28/10 | | 15,000 | | 14,422 | |
| Telecom Italia Capital 4.00% 1/15/10 | | 30,000 | | 29,397 | |
| Telefonica Emisiones 5.984% 6/20/11 | | 75,000 | | 77,211 | |
| THOMSON 5.70% 10/1/14 | | 30,000 | | 30,165 | |
| Time Warner Cable 5.40% 7/2/12 | | 45,000 | | 45,135 | |
| Viacom | | | | | |
· | 5.341% 6/16/09 | | 10,000 | | 9,884 | |
| 5.75% 4/30/11 | | 10,000 | | 10,133 | |
| | | | | 365,708 | |
| Consumer Cyclical–0.43% | | | | | |
| CVS Caremark | | | | | |
| 4.875% 9/15/14 | | 10,000 | | 9,672 | |
| 5.75% 6/1/17 | | 15,000 | | 15,124 | |
· | DaimlerChrysler Holding 5.328% 8/3/09 | | 30,000 | | 29,806 | |
| GMAC 6.875% 9/15/11 | | 32,000 | | 27,397 | |
| Host Marriott 7.125% 11/1/13 | | 2,000 | | 2,025 | |
| Majestic Star Casino 9.50% 10/15/10 | | 5,000 | | 4,750 | |
| McDonald’s 6.30% 10/15/37 | | 25,000 | | 26,015 | |
| MGM MIRAGE 7.625% 1/15/17 | | 2,000 | | 1,985 | |
| | | | | 116,774 | |
| Consumer Non-Cyclical–1.67% | | | | | |
| Abbott Laboratories | | | | | |
| 5.15% 11/30/12 | | 30,000 | | 30,694 | |
| 5.60% 11/30/17 | | 40,000 | | 41,175 | |
# | Amgen 144A | | | | | |
| 5.85% 6/1/17 | | 15,000 | | 15,254 | |
| 6.375% 6/1/37 | | 21,000 | | 21,364 | |
| Anheuser Busch 5.50% 1/15/18 | | 20,000 | | 20,457 | |
| Aramark Services 8.50% 2/1/15 | | 2,000 | | 2,035 | |
| AstraZeneca 5.90% 9/15/17 | | 35,000 | | 36,820 | |
| Clorox 5.45% 10/15/12 | | 10,000 | | 10,093 | |
# | Covidien International Finance 144A | | | | | |
| 6.00% 10/15/17 | | 10,000 | | 10,366 | |
| 6.55% 10/15/37 | | 15,000 | | 15,630 | |
7
| | Principal
Amount
(U.S. $) | | Value
(U.S. $) | |
| | | | | | |
| CORPORATE BONDS (continued) | | | | | |
| Consumer Non-Cyclical (continued) | | | | | |
| Diageo Capital | | | | | |
| 5.20% 1/30/13 | | $ | 4,000 | | $ | 4,023 | |
| 5.75% 10/23/17 | | 18,000 | | 18,136 | |
| HCA PIK 9.625% 11/15/16 | | 2,000 | | 2,120 | |
| Kellogg 5.125% 12/3/12 | | 15,000 | | 15,142 | |
| Kraft Foods | | | | | |
| 4.125% 11/12/09 | | 15,000 | | 14,877 | |
| 6.125% 2/1/18 | | 40,000 | | 40,381 | |
| PepsiCo 4.65% 2/15/13 | | 15,000 | | 15,118 | |
| Safeway 6.35% 8/15/17 | | 15,000 | | 15,662 | |
# | UnitedHealth Group 144A | | | | | |
| 5.50% 11/15/12 | | 30,000 | | 30,477 | |
| 6.00% 11/15/17 | | 40,000 | | 40,607 | |
| Wyeth 5.50% 2/1/14 | | 50,000 | | 50,848 | |
| | | | | 451,279 | |
| Electric–0.53% | | | | | |
| AES 7.75% 3/1/14 | | 5,000 | | 5,063 | |
‡# | Calpine 144A 8.496% 7/15/09 | | 196 | | 207 | |
| Commonwealth Edison 6.15% 9/15/17 | | 15,000 | | 15,486 | |
| # Illinois Power 144A 6.125% 11/15/17 | | 10,000 | | 10,122 | |
| Orion Power Holdings 12.00% 5/1/10 | | 5,000 | | 5,475 | |
| Pacific Gas & Electric 5.625% 11/30/17 | | 15,000 | | 15,074 | |
| Pepco Holdings 6.125% 6/1/17 | | 10,000 | | 10,190 | |
# | Power Contract Financing 144A 6.256% 2/1/10 | | 11,083 | | 11,324 | |
| PSEG Power 5.50% 12/1/15 | | 10,000 | | 9,806 | |
| Southwestern Electric Power 5.875% 3/1/18 | | 20,000 | | 19,767 | |
| Virginia Electric & Power 5.10% 11/30/12 | | 30,000 | | 30,160 | |
# | West Penn Power 144A 5.95% 12/15/17 | | 10,000 | | 10,067 | |
| | | | | 142,741 | |
| Energy–0.56% | | | | | |
| Apache 5.25% 4/15/13 | | 15,000 | | 15,371 | |
| CenterPoint Energy Resource 6.125% 11/1/17 | | 10,000 | | 10,196 | |
| Chesapeake Energy 6.625% 1/15/16 | | 2,000 | | 1,965 | |
| Devon Energy 7.95% 4/15/32 | | 5,000 | | 6,137 | |
| EnCana 5.90% 12/1/17 | | 15,000 | | 15,373 | |
| Husky Energy 6.80% 9/15/37 | | 10,000 | | 10,545 | |
| ONEOK Partners 6.15% 10/1/16 | | 5,000 | | 5,088 | |
# | Ras Laffan Liquefied Natural Gas III 144A 5.832% 9/30/16 | | 25,000 | | 25,449 | |
| Suncor Energy 6.50% 6/15/38 | | 15,000 | | 16,093 | |
| TransCanada Pipelines 6.20% 10/15/37 | | 20,000 | | 19,925 | |
| Transocean 6.00% 3/15/18 | | 10,000 | | 9,992 | |
| Whiting Petroleum 7.25% 5/1/13 | | 5,000 | | 4,950 | |
| Williams 7.50% 1/15/31 | | 1,000 | | 1,080 | |
| XTO Energy 6.25% 8/1/17 | | 10,000 | | 10,510 | |
| | | | | 152,674 | |
| Finance Companies–0.66% | | | | | |
· | American Express 6.80% 9/1/66 | | $ | 30,000 | | $ | 30,468 | |
# | Capmark Financial Group 144A 6.30% 5/10/17 | | 17,000 | | 12,693 | |
| FTI Consulting 7.625% 6/15/13 | | 5,000 | | 5,150 | |
| General Electric Capital 5.625% 9/15/17 | | 20,000 | | 20,558 | |
| International Lease Finance | | | | | |
| 5.35% 3/1/12 | | 15,000 | | 15,024 | |
| 5.875% 5/1/13 | | 10,000 | | 10,177 | |
| SLM 5.40% 10/25/11 | | 64,000 | | 58,378 | |
| Washington Mutual | | | | | |
| 5.25% 9/15/17 | | 15,000 | | 12,533 | |
| 5.50% 8/24/11 | | 15,000 | | 13,390 | |
| | | | | 178,371 | |
| Insurance–0.30% | | | | | |
| Berkshire Hathaway Finance 4.85% 1/15/15 | | 15,000 | | 15,044 | |
| Montpelier Re Holdings 6.125% 8/15/13 | | 5,000 | | 4,848 | |
| Unitrin 6.00% 5/15/17 | | 25,000 | | 23,950 | |
| WellPoint | | | | | |
| 5.00% 1/15/11 | | 20,000 | | 20,043 | |
| 5.00% 12/15/14 | | 18,000 | | 17,267 | |
| | | | | 81,152 | |
| Natural Gas–0.72% | | | | | |
| Dynergy Holdings 7.75% 6/1/19 | | 2,000 | | 1,855 | |
| Enterprise Products Operating 5.60% 10/15/14 | | 20,000 | | 19,988 | |
| Inergy Finance 6.875% 12/15/14 | | 5,000 | | 4,888 | |
| Kinder Morgan Energy Partners 5.125% 11/15/14 | | 15,000 | | 14,636 | |
| Southern Union 6.15% 8/16/08 | | 50,000 | | 50,179 | |
| Valero Energy | | | | | |
| 6.125% 6/15/17 | | 10,000 | | 10,181 | |
| 6.625% 6/15/37 | | 10,000 | | 10,103 | |
| Valero Logistics Operations 6.05% 3/15/13 | | 80,000 | | 81,865 | |
| | | | | 193,695 | |
| Real Estate–0.16% | | | | | |
| iStar Financial | | | | | |
| 5.15% 3/1/12 | | 10,000 | | 8,650 | |
| 5.875% 3/15/16 | | 20,000 | | 16,352 | |
| Regency Centers 5.875% 6/15/17 | | 20,000 | | 19,361 | |
| | | | | 44,363 | |
| Technology–0.04% | | | | | |
| Xerox 5.50% 5/15/12 | | 10,000 | | 10,176 | |
| | | | | 10,176 | |
| Transportation–0.13% | | | | | |
# | Erac USA Finance 144A 7.00% 10/15/37 | | 25,000 | | 22,772 | |
| Hertz 8.875% 1/1/14 | | 10,000 | | 10,188 | |
8
| | Principal
Amount
(U.S. $) | | Value
(U.S. $) | |
| | | | | | |
| CORPORATE BONDS (continued) | | | | | |
| Transportation (continued) | | | | | |
| Kansas City Southern Railway 9.50% 10/1/08 | | $ | 1,000 | | $ | 1,025 | |
| | | | | 33,985 | |
| Total Corporate Bonds
(cost $2,193,184) | | | | 2,191,518 | |
| | | | | | |
| MUNICIPAL BONDS–1.10% | | | | | |
| Augusta, Georgia Water & Sewer Revenue 5.25% 10/1/39 (FSA) | | 55,000 | | 57,999 | |
| Buckeye Ohio Tobacco Settlement Financing Authority 5.875% 6/1/47 | | 15,000 | | 14,401 | |
| California State 5.00% 2/1/33 | | 20,000 | | 20,130 | |
| California State University Systemwide Revenue 5.00% 11/1/30 (AMBAC) | | 20,000 | | 20,763 | |
| Illinois State Taxable Pension 5.10% 6/1/33 | | 30,000 | | 28,955 | |
| New Jersey Economic Development Authority Revenue Cigarette Tax 5.75% 6/15/29 | | 40,000 | | 39,250 | |
| New York State Urban Development Series A-1 5.25% 3/15/34 (FGIC) | | 35,000 | | 36,728 | |
| Oregon State Taxable Pension 5.892% 6/1/27 | | 35,000 | | 36,911 | |
| West Virginia Economic Development Authority 5.37% 7/1/20 (MBIA) | | 15,000 | | 15,206 | |
| West Virginia Tobacco Settlement Finance Authority 7.467% 6/1/47 | | 30,000 | | 28,062 | |
| Total Municipal Bonds
(cost $297,348) | | | | 298,405 | |
| | | | | | |
| NON-AGENCY ASSET-BACKED SECURITIES–4.02% | | | | | |
· | Bank of America Credit Card Trust Series 2006-A10 A10 5.008% 2/15/12 | | 380,000 | | 378,363 | |
| Capital Auto Receivables Asset Trust Series 2007-3 A3A 5.02% 9/15/11 | | 25,000 | | 25,186 | |
| Capital One Multi-Asset Execution Trust Series 2007-A7 A7 5.75% 7/15/20 | | 25,000 | | 25,155 | |
| Caterpillar Financial Asset Trust Series 2007-A A3A 5.34% 6/25/12 | | 10,000 | | 10,151 | |
· | Citibank Credit Card Issuance Trust Series 2007-A6 A6 5.238% 7/12/12 | | 300,000 | | 298,043 | |
| CNH Equipment Trust Series 2007-B A3A 5.40% 10/17/11 | | 30,000 | | 30,393 | |
· | Countrywide Asset-Backed Certificates Series 2006-S7 A3 5.712% 11/25/35 | | 25,000 | | 21,633 | |
· | GMAC Mortgage Loan Trust Series 2006-HE3 A2 5.75% 10/25/36 | | 25,000 | | 22,585 | |
| Harley-Davidson Motorcycle Trust Series 2005-2 A2 4.07% 2/15/12 | | 24,389 | | 24,269 | |
| Hyundai Auto Receivables Trust Series 2007-A A3A 5.04% 1/17/12 | | 10,000 | | 10,047 | |
·# | MASTR Specialized Loan Trust Series 2005-2 A2 144A 5.006% 7/25/35 | | $ | 20,759 | | $ | 18,871 | |
· | Merrill Lynch Mortgage Investors Series 2006-AR1 A2C 5.025% 3/25/37 | | 25,000 | | 23,293 | |
| Mid-State Trust | | | | | |
| Series 11 A1 4.864% 7/15/38 | | 17,117 | | 16,837 | |
| Series 2004-1 A 6.005% 8/15/37 | | 8,856 | | 8,645 | |
# | Series 2006-1 A 144A 5.787% 10/15/40 | | 21,035 | | 20,055 | |
| Renaissance Home Equity Loan Trust | | | | | |
| Series 2005-4 A2 5.399% 2/25/36 | | 5,324 | | 5,305 | |
| Series 2007-2 AF2 5.675% 6/25/37 | | 25,000 | | 23,820 | |
| Residential Asset Securities Series 2003-KS9 AI6 4.71% 11/25/33 | | 22,092 | | 21,171 | |
·# | SLM Student Loan Trust Series 2003-4 A5C 144A 5.151% 3/15/33 | | 35,000 | | 34,650 | |
| Structured Asset Securities | | | | | |
| Series 2001-SB1 A2 3.375% 8/25/31 | | 27,774 | | 24,055 | |
| Series 2004-16XS A2 4.91% 8/25/34 | | 4,992 | | 4,977 | |
| Triad Auto Receivables Owner Trust Series 2006-C A4 5.31% 5/13/13 | | 40,000 | | 40,222 | |
| Total Non-Agency Asset-Backed Securities
(cost $1,104,331) | | | | 1,087,726 | |
| | | | | | |
| NON-AGENCY COLLATERALIZED MORTGAGE OBLIGATIONS–8.28% | | | | | |
· | Adjustable Rate Mortgage Trust Series 2005-10 3A11 5.416% 1/25/36 | | 33,005 | | 31,908 | |
| American Home Mortgage Investment Trust Series 2005-2 5A1 5.064% 9/25/35 | | 35,000 | | 34,751 | |
| Bank of America Alternative Loan Trust | | | | | |
| Series 2003-10 2A1 6.00% 12/25/33 | | 57,278 | | 57,421 | |
| Series 2004-2 1A1 6.00% 3/25/34 | | 32,721 | | 32,803 | |
| Series 2005-3 2A1 5.50% 4/25/20 | | 32,902 | | 33,097 | |
| Series 2005-5 2CB1 6.00% 6/25/35 | | 34,267 | | 34,353 | |
| Series 2005-9 5A1 5.50% 10/25/20 | | 22,044 | | 22,175 | |
· | Bank of America Funding Securities Series 2006-F 1A2 5.175% 7/20/36 | | 39,659 | | 38,985 | |
| Bank of America Mortgage Securities | | | | | |
· | Series 2003-D 1A2 7.281% 5/25/33 | | 238 | | 239 | |
| Series 2005-9 2A1 4.75% 10/25/20 | | 37,193 | | 36,670 | |
| Chase Mortgage Finance Series 2003-S8 A2 5.00% 9/25/18 | | 70,100 | | 68,646 | |
| Citicorp Mortgage Securities Series 2006-3 1A4 6.00% 6/25/36 | | 35,000 | | 34,609 | |
| Countrywide Alternative Loan Trust Series 2004-28CB 6A1 6.00% 1/25/35 | | 15,987 | | 16,027 | |
· | Series 2004-J7 1A2 4.673% 8/25/34 | | 6,896 | | 6,862 | |
· | Series 2005-63 3A1 5.891% 11/25/35 | | 43,634 | | 42,366 | |
| Series 2006-2CB A3 5.50% 3/25/36 | | 32,060 | | 31,877 | |
t | Countrywide Home Loan Mortgage Pass Through Trust | | | | | |
· | Series 2004-12 1M 5.096% 8/25/34 | | 25,974 | | 25,426 | |
| Series 2005-23 A1 5.50% 11/25/35 | | 20,611 | | 20,269 | |
9
| | Principal
Amount
(U.S. $) | | Value
(U.S. $) | |
| | | | | | |
| NON-AGENCY COLLATERALIZED MORTGAGE OBLIGATIONS (continued) | | | | | |
| Series 2006-1 A2 6.00% 3/25/36 | | $ | 35,248 | | $ | 35,358 | |
| Series 2006-17 A5 6.00% 12/25/36 | | 22,314 | | 22,579 | |
· | Series 2006-HYB3 3A1A 6.095% 5/20/36 | | 43,116 | | 44,661 | |
· | Series 2006-HYB4 1A2 5.627% 6/20/36 | | 27,144 | | 26,837 | |
| Credit Suisse First Boston Mortgage Securities | | | | | |
| Series 2003-29 5A1 7.00% 12/25/33 | | 10,391 | | 10,388 | |
| Series 2004-1 3A1 7.00% 2/25/34 | | 7,395 | | 7,634 | |
| First Horizon Asset Securities | | | | | |
| Series 2003-5 1A17 8.00% 7/25/33 | | 15,065 | | 16,022 | |
· | Series 2004-AR5 4A1 5.70% 10/25/34 | | 30,761 | | 30,680 | |
· | Series 2007-AR2 1A1 5.855% 8/25/37 | | 18,858 | | 18,882 | |
· | Series 2007-AR3 2A2 6.315% 11/25/37 | | 58,051 | | 58,356 | |
· | GMAC Mortgage Loan Trust Series 2005-AR2 4A 5.183% 5/25/35 | | 37,380 | | 36,785 | |
# | GSMPS Mortgage Loan Trust 144A | | | | | |
| Series 1998-3 A 7.75% 9/19/27 | | 26,514 | | 28,600 | |
| Series 2005-RP1 1A3 8.00% 1/25/35 | | 20,020 | | 21,655 | |
| Series 2005-RP1 1A4 8.50% 1/25/35 | | 11,171 | | 12,175 | |
| GSR Mortgage Loan Trust Series 2006-1F 5A2 6.00% 2/25/36 | | 37,087 | | 36,924 | |
· | JPMorgan Mortgage Trust | | | | | |
| Series 2005-A1 4A1 4.779% 2/25/35 | | 38,259 | | 37,411 | |
| Series 2005-A4 1A1 5.401% 7/25/35 | | 45,469 | | 45,002 | |
| Series 2005-A6 1A2 5.138% 9/25/35 | | 60,000 | | 58,682 | |
| Lehman Mortgage Trust | | | | | |
| Series 2005-2 2A3 5.50% 12/25/35 | | 31,960 | | 31,895 | |
| Series 2006-1 3A3 5.50% 2/25/36 | | 37,439 | | 37,180 | |
· | MASTR Adjustable Rate Mortgages Trust | | | | | |
| Series 2003-6 1A2 6.739% 12/25/33 | | 11,992 | | 12,375 | |
| Series 2005-1 B1 5.561% 3/25/35 | | 39,324 | | 38,397 | |
| Series 2005-6 7A1 5.326% 6/25/35 | | 26,751 | | 26,435 | |
| MASTR Alternative Loans Trust Series 2003-6 3A1 8.00% 9/25/33 | | 5,655 | | 5,853 | |
# | MASTR Reperforming Loan Trust 144A | | | | | |
| Series 2005-1 1A5 8.00% 8/25/34 | | 31,677 | | 34,159 | |
| Series 2005-2 1A4 8.00% 5/25/35 | | 13,922 | | 15,039 | |
| Morgan Stanley Mortgage Loan Trust Series 2006-2 6A 6.50% 2/25/36 | | 20,857 | | 20,915 | |
| Nomura Asset Acceptance | | | | | |
| Series 2005-WF1 2A2 4.786% 3/25/35 | | 65,000 | | 61,214 | |
| Series 2006-AF1 1A2 6.159% 5/25/36 | | 60,000 | | 57,385 | |
| Prime Mortgage Trust Series 2004-CL1 1A1 6.00% 2/25/34 | | 15,273 | | 15,512 | |
| Residential Asset Mortgage Products | | | | | |
| Series 2004-SL1 A3 7.00% 11/25/31 | | 6,444 | | 6,584 | |
| Series 2004-SL4 A3 6.50% 7/25/32 | | 22,947 | | 22,782 | |
| Series 2005-SL1 A2 6.00% 5/25/32 | | 26,093 | | 26,320 | |
· | Residential Funding Mortgage Securities I Series 2006-SA3 3A1 6.038% 9/25/36 | | 39,349 | | 39,349 | |
· | Structured Adjustable Rate Mortgage Loan Trust | | | | | |
| Series 2004-18 5A 5.50% 12/25/34 | | 33,673 | | 33,171 | |
| Series 2006-5 5A4 5.545% 6/25/36 | | 26,736 | | 25,695 | |
| Structured Asset Securities | | | | | |
· | Series 2002-22H 1A 6.965% 11/25/32 | | $ | 9,414 | | $ | 9,457 | |
| Series 2004-12H 1A 6.00% 5/25/34 | | 32,355 | | 32,709 | |
t | Washington Mutual Alternative Mortgage Pass Through Certificates | | | | | |
| Series 2005-9 3CB 5.50% 10/25/20 | | 46,933 | | 47,212 | |
| Series 2006-5 2CB3 6.00% 7/25/36 | | 41,316 | | 41,156 | |
·t | Washington Mutual Mortgage Pass Through Certificates | | | | | |
| Series 2006-AR8 2A3 6.132% 8/25/36 | | 17,862 | | 17,900 | |
| Series 2006-AR10 1A1 5.942% 9/25/36 | | 37,404 | | 37,795 | |
| Series 2006-AR14 1A4 5.647% 11/25/36 | | 27,473 | | 27,406 | |
| Series 2007-HY3 4A1 5.35% 3/25/37 | | 76,826 | | 76,472 | |
| Wells Fargo Mortgage Backed Securities Trust | | | | | |
· | Series 2004-T A1 6.18% 9/25/34 | | 12,202 | | 12,232 | |
| Series 2005-11 1A3 5.50% 11/25/35 | | 87,884 | | 86,869 | |
| Series 2006-7 2A1 6.00% 6/25/36 | | 78,620 | | 78,276 | |
· | Series 2006-AR6 7A1 5.11% 3/25/36 | | 73,256 | | 71,296 | |
· | Series 2006-AR10 5A1 5.597% 7/25/36 | | 35,995 | | 36,263 | |
| Series 2007-13 A7 6.00% 9/25/37 | | 34,245 | | 34,138 | |
| Total Non-Agency Collateralized Mortgage Obligations
(cost $2,246,508) | | | | 2,236,556 | |
| | | | | | |
| U.S. TREASURY OBLIGATIONS–6.28% | | | | | |
* | U.S. Treasury Bonds 4.75% 2/15/37 | | 323,000 | | 338,140 | |
| U.S. Treasury Inflation Index Notes | | | | | |
¥ | 2.00% 1/15/14 | | 50,881 | | 52,571 | |
| 3.875% 1/15/09 | | 25,478 | | 26,239 | |
| U.S. Treasury Notes | | | | | |
* | 3.125% 11/30/09 | | 186,000 | | 186,262 | |
| 3.625% 12/31/12 | | 775,000 | | 781,054 | |
* | 4.25% 11/15/17 | | 272,000 | | 276,824 | |
^ | U.S. Treasury Strip 4.296% 11/15/13 | | 45,000 | | 36,452 | |
| Total U.S. Treasury Obligations
(cost $1,660,784) | | | | 1,697,542 | |
| | | | | | |
¹ | DISCOUNT NOTE–1.94% | | | | | |
| Federal Home Loan Bank 3.25% 1/2/08 | | 523,094 | | 523,048 | |
| Total Discount Note
(cost $523,048) | | | | 523,048 | |
| Total Value of Securities Before Securities Lending Collateral–103.21%
(cost $26,756,223) | | | | 27,890,674 | |
| | Number of
Shares | | | |
| | | | | | |
| SECURITIES LENDING COLLATERAL**–5.79% | | | | | |
| Investment Companies | | | | | |
| Mellon GSL DBT II Collateral Fund | | 1,565,050 | | 1,565,050 | |
| Total Securities Lending Collateral
(cost $1,565,050) | | | | 1,565,050 | |
10
TOTAL VALUE OF SECURITIES–109.00% (cost $28,321,273) | | $ | 29,455,724 | © |
OBLIGATION TO RETURN SECURITIES LENDING COLLATERAL**–(5.79%) | | (1,565,050 | ) |
LIABILITIES NET OF RECEIVABLES AND OTHER ASSETS–(3.21%) | | (866,715 | ) |
NET ASSETS APPLICABLE TO 1,825,861.1 SHARES OUTSTANDING–100.00% | | $ | 27,023,959 | |
NET ASSET VALUE-DELAWARE VIP BALANCED SERIES STANDARD CLASS ($27,018,048 / 1,825,461 Shares) | | $ | 14.80 | |
NET ASSET VALUE-DELAWARE VIP BALANCED SERIES SERVICE CLASS ($5,911 / 400.1 Shares) | | $ | 14.77 | |
COMPONENTS OF NET ASSETS AT DECEMBER 31, 2007: | | | |
Shares of beneficial interest (unlimited authorization–no par) | | $ | 42,694,049 | |
Undistributed net investment income | | 935,008 | |
Accumulated net realized loss on investments | | (17,759,051 | ) |
Net unrealized appreciation of investments | | 1,153,953 | |
Total net assets | | $ | 27,023,959 | |
* | Fully or partially on loan. |
** | See Note 10 in “Notes to Financial Statements.” |
© | Includes $2,130,472 of securities loaned. |
† | Non-income producing security for the year ended December 31, 2007. |
· | Variable rate security. The rate shown is the rate as of December 31, 2007. |
t | Pass Through Agreement. Security represents the contractual right to receive a proportionate amount of underlying payments due to the counterparty pursuant to various agreements related to the rescheduling of obligations and the exchange of certain notes. |
^ | Zero coupon security. The rate shown is the yield at the time of purchase. |
‡ | Non-income producing security. Security is currently in default. |
¥ | Fully or partially pledged as collateral for financial futures contracts. |
# | Security exempt from registration under Rule 144A of the Securities Act of 1933, as amended. At December 31, 2007, the aggregate amount of Rule 144A securities was $684,829, which represented 2.53% of the Series’ net assets. See Note 11 in “Notes to Financial Statements.” |
¹ | The rate shown is the effective yield at the time of purchase. |
Summary of Abbreviations:
AMBAC – Insured by the AMBAC Assurance Corporation
ARM – Adjustable Rate Mortgage
FGIC – Insured by the Financial Guaranty Insurance Company
FSA – Insured by Financial Security Assurance
GNMA – Government National Mortgage Association
MBIA – Insured by the Municipal Bond Insurance Association
PIK – Pay-In-Kind
S.F. – Single Family
TBA – To be announced
yr – Year
The following futures contracts and swap contracts were outstanding at December 31, 2007:
Futures Contracts(1)
Contracts
to Buy | | Notional
Cost | | Notional
Value | | Expiration Date | | Unrealized
Appreciation | |
5 U.S. Treasury 5 year Notes | | $ | 548,174 | | $ | 551,406 | | 3/31/08 | | $ | 3,232 | |
| | | | | | | | | | | | |
11
Swap Contracts(2)
Credit Default Swap Contracts
Swap Counterparty &
Referenced Obligation | | Notional
Amount | | Annual Protection
Payments | | Termination Date | | Unrealized
Appreciation
(Depreciation) | |
Protection Purchased: | | | | | | | | | |
Goldman Sachs | | | | | | | | | |
Bank of America 5 yr CDS | | $ | 30,000 | | 0.48 | % | 12/20/12 | | $ | (5 | ) |
Best Buy | | | | | | | | | |
5 yr CDS | | 38,000 | | 0.60 | % | 9/20/12 | | 269 | |
10 yr CDS | | 20,000 | | 0.98 | % | 9/20/17 | | 113 | |
Kraft Foods 10 yr CDS | | 40,000 | | 0.77 | % | 12/20/17 | | (72 | ) |
Rohm & Haas 5.5 yr CDS | | 31,000 | | 0.37 | % | 3/20/13 | | 103 | |
JPMorgan Chase Bank | | | | | | | | | |
Embarq 7 yr CDS | | 10,000 | | 0.77 | % | 9/20/14 | | 245 | |
Merrill Lynch 5 yr CDS | | 20,000 | | 0.58 | % | 12/20/12 | | 591 | |
Lehman Brothers | | | | | | | | | |
Capmark Financial 5 yr CDS | | 15,000 | | 1.65 | % | 9/20/12 | | 2,793 | |
Gannet 7 yr CDS | | 30,000 | | 0.88 | % | 9/20/14 | | 167 | |
Home Depot 5 yr CDS | | 45,000 | | 0.50 | % | 9/20/12 | | 722 | |
New York Times 7 yr CDS | | 30,000 | | 0.75 | % | 9/20/14 | | 189 | |
Sara Lee 7 yr CDS | | 30,000 | | 0.60 | % | 9/20/14 | | (347 | ) |
Target 5 yr CDS | | 40,000 | | 0.57 | % | 12/20/12 | | (40 | ) |
V.F. 5 yr CDS | | 22,500 | | 0.40 | % | 9/20/12 | | (10 | ) |
Washington Mutual | | | | | | | | | |
4 yr CDS | | 10,300 | | 0.85 | % | 9/20/11 | | 1,117 | |
10 yr CDS | | 15,000 | | 3.15 | % | 12/20/17 | | 90 | |
| | | | | | | | 5,925 | |
Protection Sold: | | | | | | | | | |
Lehman Brothers | | | | | | | | | |
ABX Home Equity Index 06-2 AA | | (20,000 | ) | 0.17 | % | 5/25/46 | | (2,100 | ) |
ABX Home Equity Index 07-1 AA | | (30,000 | ) | 0.15 | % | 8/25/37 | | (2,950 | ) |
Best Buy | | | | | | | | | |
5 yr CDS | | (19,000 | ) | 0.61 | % | 9/20/12 | | (129 | ) |
10 yr CDS | | (10,000 | ) | 0.99 | % | 9/20/17 | | (49 | ) |
Reynolds American 5 yr CDS | | (60,000 | ) | 1.00 | % | 9/20/12 | | 815 | |
| | | | | | | | (4,413 | ) |
TOTAL | | | | | | | | $ | 1,512 | |
| | | | | | | | | | | |
Interest Rate Swap Contract
Notional Amount | | Expiration Date | | Description | | Unrealized Appreciation | |
$ | 415,000 | | 5/2/12 | | Agreement with Goldman Sachs to receive the notional amount multiplied by the fixed rate of 4.987 and to pay the notional amount multiplied by the 3 month LIBOR % | | $ | 14,758 | |
| | | | | | | | | |
The use of futures contracts and swap contracts involves elements of market risk and risks in excess of the amount recognized in the financial statements. The notional value presented above represent the Series’ total exposure in such contracts, whereas only the net unrealized appreciation (depreciation) is reflected in the Series’ net assets.
(1)See Note 8 in “Notes to Financial Statements.”
(2)See Note 9 in “Notes to Financial Statements.”
See accompanying notes
12
Delaware VIP Trust — Delaware VIP Balanced Series
Statement of Operations
Year Ended December 31, 2007
INVESTMENT INCOME: | | | |
Interest | | $ | 640,818 | |
Dividends | | 531,871 | |
Securities lending income | | 8,089 | |
| | 1,180,778 | |
EXPENSES: | | | |
Management fees | | 205,999 | |
Accounting and administration expenses | | 12,675 | |
Audit and tax | | 12,471 | |
Pricing fees | | 9,758 | |
Dividend disbursing and transfer agent fees and expenses | | 7,971 | |
Reports and statements to shareholders | | 7,549 | |
Custodian fees | | 6,889 | |
Legal fees | | 5,846 | |
Trustees’ fees | | 1,524 | |
Dues and services | | 788 | |
Insurance fees | | 700 | |
Consulting fees | | 605 | |
Trustees’ expenses | | 180 | |
Registration fees | | 39 | |
Distribution expenses – Service Class | | 18 | |
| | 273,012 | |
Less expenses absorbed or waived | | (6,971 | ) |
Less waiver of distribution expenses – Service Class | | (3 | ) |
Less expense paid indirectly | | (1,618 | ) |
Total operating expenses | | 264,420 | |
| | | |
NET INVESTMENT INCOME | | 916,358 | |
| | | |
NET REALIZED AND UNREALIZED GAIN (LOSS) ON INVESTMENTS: | | | |
Net realized gain (loss) on: | | | |
Investments | | 2,127,402 | |
Futures contracts | | (14,242 | ) |
Swap contracts | | 20,390 | |
Net realized gain | | 2,133,550 | |
Net change in unrealized appreciation/depreciation of investments | | (2,788,302 | ) |
| | | |
NET REALIZED AND UNREALIZED LOSS ON INVESTMENTS | | (654,752 | ) |
| | | |
NET INCREASE IN NET ASSETS RESULTING FROM OPERATIONS | | $ | 261,606 | |
See accompanying notes
Delaware VIP Trust — Delaware VIP Balanced Series
Statements of Changes in Net Assets
| | Year Ended | |
| | 12/31/07 | | 12/31/06 | |
INCREASE (DECREASE) IN NET ASSETS FROM OPERATIONS: | | | | | |
Net investment income | | $ | 916,358 | | $ | 1,045,074 | |
Net realized gain on investments | | 2,133,550 | | 1,186,084 | |
Net change in unrealized appreciation/depreciation of investments | | (2,788,302 | ) | 3,149,987 | |
Net increase in net assets resulting from operations | | 261,606 | | 5,381,145 | |
| | | | | |
DIVIDENDS AND DISTRIBUTIONS TO SHAREHOLDERS FROM: | | | | | |
Net investment income: | | | | | |
Standard Class | | (1,095,621 | ) | (1,122,023 | ) |
Service Class | | (180 | ) | (144 | ) |
| | (1,095,801 | ) | (1,122,167 | ) |
| | | | | |
CAPITAL SHARE TRANSACTIONS: | | | | | |
Proceeds from shares sold: | | | | | |
Standard Class | | 1,304,963 | | 35,103,629 | |
Net asset value of shares issued upon reinvestment of dividends and distributions: | | | | | |
Standard Class | | 1,095,621 | | 1,122,023 | |
Service Class | | 180 | | 144 | |
Cost of shares repurchased: | | 2,400,764 | | 36,225,796 | |
Standard Class | | (10,175,063 | ) | (43,084,571 | ) |
Decrease in net assets derived from capital share transactions | | (7,774,299 | ) | (6,858,775 | ) |
| | | | | |
NET DECREASE IN NET ASSETS | | (8,608,494 | ) | (2,599,797 | ) |
| | | | | |
NET ASSETS: | | | | | |
Beginning of year | | 35,632,453 | | 38,232,250 | |
End of year (including undistributed net investment income of $935,008 and $1,093,355,
respectively) | | $ | 27,023,959 | | $ | 35,632,453 | |
See accompanying notes
13
Delaware VIP Trust — Delaware VIP Balanced Series
Financial Highlights
Selected data for each share of the Series outstanding throughout each period were as follows:
| | Delaware VIP Balanced Series Standard Class | |
| | Year Ended | |
| | 12/31/07 | | 12/31/06 | | 12/31/05 | | 12/31/04 | | 12/31/03 | |
| | | | | | | | | | | |
Net asset value, beginning of period | | $ | 15.260 | | $ | 13.530 | | $ | 13.360 | | $ | 12.890 | | $ | 11.170 | |
| | | | | | | | | | | |
Income (loss) from investment operations: | | | | | | | | | | | |
Net investment income(1) | | 0.441 | | 0.405 | | 0.341 | | 0.245 | | 0.211 | |
Net realized and unrealized gain (loss) on investments and foreign currencies | | (0.404 | ) | 1.739 | | 0.135 | | 0.493 | | 1.872 | |
Total from investment operations | | 0.037 | | 2.144 | | 0.476 | | 0.738 | | 2.083 | |
| | | | | | | | | | | |
Less dividends and distributions from: | | | | | | | | | | | |
Net investment income | | (0.497 | ) | (0.414 | ) | (0.306 | ) | (0.268 | ) | (0.363 | ) |
Total dividends and distributions | | (0.497 | ) | (0.414 | ) | (0.306 | ) | (0.268 | ) | (0.363 | ) |
| | | | | | | | | | | |
Net asset value, end of period | | $ | 14.800 | | $ | 15.260 | | $ | 13.530 | | $ | 13.360 | | $ | 12.890 | |
| | | | | | | | | | | |
Total return(2) | | 0.33 | % | 16.20 | % | 3.68 | % | 5.84 | % | 19.21 | % |
| | | | | | | | | | | |
Ratios and supplemental data: | | | | | | | | | | | |
Net assets, end of period (000 omitted) | | $ | 27,018 | | $ | 35,626 | | $ | 38,227 | | $ | 45,407 | | $ | 53,233 | |
Ratio of expenses to average net assets | | 0.83 | % | 0.81 | % | 0.80 | % | 0.77 | % | 0.77 | % |
Ratio of expenses to average net assets prior to expense limitation and expenses paid indirectly | | 0.86 | % | 0.84 | % | 0.85 | % | 0.77 | % | 0.77 | % |
Ratio of net investment income to average net assets | | 2.89 | % | 2.88 | % | 2.57 | % | 1.91 | % | 1.80 | % |
Ratio of net investment income to average net assets prior to expense limitation and expenses paid indirectly | | 2.86 | % | 2.85 | % | 2.52 | % | 1.91 | % | 1.80 | % |
Portfolio turnover | | 134 | % | 131 | % | 200 | % | 247 | % | 231 | % |
(1)The average shares outstanding method has been applied for per share information.
(2)Total investment return is based on the change in net asset value of a share during the period and assumes reinvestment of dividends and distributions at net asset value. Total investment return reflects a waiver by the manager, as applicable. Performance would have been lower had the waiver not been in effect.
See accompanying notes
14
Selected data for each share of the Series outstanding throughout each period were as follows:
| | Delaware VIP Balanced Series Service Class | |
| | Year Ended | |
| | 12/31/07 | | 12/31/06 | | 12/31/05 | | 12/31/04 | | 12/31/03 | |
| | | | | | | | | | | |
Net asset value, beginning of period | | $ | 15.240 | | $ | 13.520 | | $ | 13.340 | | $ | 12.880 | | $ | 11.170 | |
| | | | | | | | | | | |
Income (loss) from investment operations: | | | | | | | | | | | |
Net investment income(1) | | 0.403 | | 0.371 | | 0.310 | | 0.214 | | 0.186 | |
Net realized and unrealized gain (loss) on investments and foreign currencies | | (0.409 | ) | 1.732 | | 0.145 | | 0.488 | | 1.867 | |
Total from investment operations | | (0.006 | ) | 2.103 | | 0.455 | | 0.702 | | 2.053 | |
| | | | | | | | | | | |
Less dividends and distributions from: | | | | | | | | | | | |
Net investment income | | (0.464 | ) | (0.383 | ) | (0.275 | ) | (0.242 | ) | (0.343 | ) |
Total dividends and distributions | | (0.464 | ) | (0.383 | ) | (0.275 | ) | (0.242 | ) | (0.343 | ) |
| | | | | | | | | | | |
Net asset value, end of period | | $ | 14.770 | | $ | 15.240 | | $ | 13.520 | | $ | 13.340 | | $ | 12.880 | |
| | | | | | | | | | | |
Total return(2) | | 0.05 | % | 15.88 | % | 3.51 | % | 5.55 | % | 18.90 | % |
| | | | | | | | | | | |
Ratios and supplemental data: | | | | | | | | | | | |
Net assets, end of period (000 omitted) | | $ | 6 | | $ | 6 | | $ | 5 | | $ | 5 | | $ | 5 | |
Ratio of expenses to average net assets | | 1.08 | % | 1.06 | % | 1.05 | % | 1.02 | % | 0.99 | % |
Ratio of expenses to average net assets prior to expense limitation and expenses paid indirectly | | 1.16 | % | 1.14 | % | 1.15 | % | 1.07 | % | 1.02 | % |
Ratio of net investment income to average net assets | | 2.64 | % | 2.63 | % | 2.32 | % | 1.66 | % | 1.58 | % |
Ratio of net investment income to average net assets prior to expense limitation and expenses paid indirectly | | 2.56 | % | 2.55 | % | 2.22 | % | 1.61 | % | 1.55 | % |
Portfolio turnover | | 134 | % | 131 | % | 200 | % | 247 | % | 231 | % |
(1)The average shares outstanding method has been applied for per share information.
(2)Total investment return is based on the change in net asset value of a share during the period and assumes reinvestment of dividends and distributions at net asset value. Total investment return reflects a waiver by the manager and distributor, as applicable. Performance would have been lower had the waiver not been in effect.
See accompanying notes
15
Delaware VIP Trust — Delaware VIP Balanced Series
Notes to Financial Statements
December 31, 2007
Delaware VIP Trust (Trust) is organized as a Delaware statutory trust and offers 14 series: Delaware VIP Balanced Series, Delaware VIP Capital Reserves Series, Delaware VIP Cash Reserve Series, Delaware VIP Diversified Income Series, Delaware VIP Emerging Markets Series, Delaware VIP Growth Opportunities Series, Delaware VIP High Yield Series, Delaware VIP International Value Equity Series, Delaware VIP REIT Series, Delaware VIP Select Growth Series, Delaware VIP Small Cap Value Series, Delaware VIP Trend Series, Delaware VIP U.S. Growth Series and Delaware VIP Value Series. These financial statements and the related notes pertain to Delaware VIP Balanced Series (Series). The Trust is an open-end investment company. The Series is considered diversified under the Investment Company Act of 1940, as amended, and offers Standard Class and Service Class shares. The Standard Class shares do not carry a 12b-1 fee and the Service Class shares carry a 12b-1 fee. The shares of the Series are sold only to separate accounts of life insurance companies.
The investment objective of the Series is to seek a balance of capital appreciation, income and preservation of capital.
1. Significant Accounting Policies
The following accounting policies are in accordance with U.S. generally accepted accounting principles and are consistently followed by the Series.
Security Valuation—Equity securities, except those traded on the Nasdaq Stock Market, Inc. (Nasdaq), are valued at the last quoted sales price as of the time of the regular close of the New York Stock Exchange (NYSE) on the valuation date. Securities traded on the Nasdaq are valued in accordance with the Nasdaq Official Closing Price, which may not be the last sales price. If on a particular day an equity security does not trade, then the mean between the bid and asked prices will be used. U.S. government and agency securities are valued at the mean between the bid and asked prices. Other long-term debt securities, credit default swap contracts and interest rate swap contracts are valued by an independent pricing service or broker and such prices are believed to reflect the fair value of such securities. Short-term debt securities having less than 60 days to maturity are valued at amortized cost, which approximates market value. Securities lending collateral, which is invested in a collective investment vehicle, is valued at unit value per share. Futures contracts and options on futures contracts are valued at the daily quoted settlement prices. Exchange-traded options are valued at the last reported sale price or, if no sales are reported, at the mean between the last reported bid and asked prices. Generally, index swap contracts and other securities and assets for which market quotations are not readily available are valued at fair value as determined in good faith under the direction of the Series’ Board of Trustees. In determining whether market quotations are readily available or fair valuation will be used, various factors will be taken into consideration, such as market closures, or with respect to foreign securities, aftermarket trading, or significant events after local market trading (e.g., government actions or pronouncements, trading volume or volatility on markets, exchanges among dealers, or news events).
In September 2006, the Financial Accounting Standards Board (FASB) issued FASB Statement No. 157 “Fair Value Measurements” (Statement 157). Statement 157 establishes a framework for measuring fair value in U.S. generally accepted accounting principles, clarifies the definition of fair value within that framework, and expands disclosures about the use of fair value measurements. Statement 157 is intended to increase consistency and comparability among fair value estimates used in financial reporting. Statement 157 is effective for fiscal years beginning after November 15, 2007. Management does not expect the adoption of Statement 157 to have a material impact on the amounts reported in the financial statements.
Federal Income Taxes—The Series intends to continue to qualify for federal income tax purposes as a regulated investment company under Subchapter M of the Internal Revenue Code of 1986, as amended, and make the requisite distributions to shareholders. Accordingly, no provision for federal income taxes has been made in the financial statements.
Effective June 29, 2007, the Series adopted FASB Interpretation No. 48 “Accounting for Uncertainty in Income Taxes” (FIN 48). FIN 48 provides guidance for how uncertain tax positions should be recognized, measured, presented and disclosed in the financial statements. FIN 48 requires the evaluation of tax positions taken or expected to be taken in the course of preparing the Series’ tax returns to determine whether the tax positions are “more-likely-than-not” of being sustained by the applicable tax authority. Tax positions not deemed to meet the more-likely-than-not threshold are recorded as a tax benefit or expense in the current year. The adoption of FIN 48 did not result in the recording of any tax benefit or expense in the current period.
Class Accounting—Investment income, common expenses and realized and unrealized gain (loss) on investments are allocated to the classes of the Series on the basis of daily net assets of each class. Distribution expenses relating to a specific class are charged directly to that class.
Repurchase Agreements—The Series may invest in a pooled cash account along with members of the Delaware Investments® Family of Funds pursuant to an exemptive order issued by the Securities and Exchange Commission. The aggregate daily balance of the pooled cash account is invested in repurchase agreements secured by obligations of the U.S. government. The respective collateral is held by the Series’ custodian bank until the maturity of the respective repurchase agreements. Each repurchase agreement is at least 102% collateralized. However, in the event of default or bankruptcy by the counterparty to the agreement, realization of the collateral may be subject to legal proceedings. At December 31, 2007, the Series held no investments in repurchase agreements.
Use of Estimates—The preparation of financial statements in conformity with U.S. generally accepted accounting principles requires management to make estimates and assumptions that affect the reported amounts of assets and liabilities at the date of the financial statements and the reported amounts of revenues and expenses during the reporting period. Actual results could differ from those estimates.
16
Delaware VIP Balanced Series
Notes to Financial Statements (continued)
Other—Expenses directly attributable to the Series are charged directly to the Series. Other expenses common to various funds within the Delaware Investments® Family of Funds are generally allocated amongst such funds on the basis of average net assets. Management fees and some other expenses are paid monthly. Security transactions are recorded on the date the securities are purchased or sold (trade date) for financial reporting purposes. Costs used in calculating realized gains and losses on the sale of investment securities are those of the specific securities sold. Dividend income is recorded on the ex-dividend date and interest income is recorded on the accrual basis. Discounts and premiums are amortized to interest income over the lives of the respective securities. Realized gains (losses) on paydowns of mortgage- and asset-backed securities are classified as interest income.
The Series declares and pays dividends from net investment income and distributions from net realized gain on investments, if any, following the close of the fiscal year.
Subject to seeking best execution, the Series may direct certain security trades to brokers who have agreed to rebate a portion of the related brokerage commission to the Series in cash. There were no commission rebates during the year ended December 31, 2007. In general, best execution refers to many factors, including the price paid or received for a security, the commission charged, the promptness and reliability of execution, the confidentiality and placement accorded the order, and other factors affecting the overall benefit obtained by the Series on the transaction.
The Series receives earnings credits from its custodian when positive cash balances are maintained, which are used to offset custody fees. The expense paid under this arrangement is included in custodian fees on the Statement of Operations with the corresponding expense offset shown as “expense paid indirectly.”
2. Investment Management, Administration Agreements and Other Transactions with Affiliates
In accordance with the terms of its investment management agreement, the Series pays Delaware Management Company (DMC), a series of Delaware Management Business Trust and the investment manager, an annual fee which is calculated daily at the rate of 0.65% on the first $500 million of average daily net assets of the Series, 0.60% on the next $500 million, 0.55% on the next $1.5 billion, and 0.50% on average daily net assets in excess of $2.5 billion.
Prior to May 1, 2007, DMC had contractually agreed to waive that portion, if any, of its management fee and reimburse the Series to the extent necessary to ensure that total annual operating expenses, exclusive of taxes, interest, brokerage fees, inverse floater program expenses, 12b-1 plan expenses, certain insurance costs and non-routine expenses or costs including, but not limited to, those relating to reorganizations, litigation, conducting shareholder meetings, and liquidations, did not exceed 0.80% of average daily net assets of the Series.
Effective October 1, 2007, Delaware Service Company, Inc. (DSC), an affiliate of DMC, provides fund accounting and financial administration oversight services to the Series. For these services, the Series pays DSC fees based on the aggregate daily net assets of the Delaware Investments® Family of Funds at the following annual rate: 0.0050% of the first $30 billion; 0.0045% of the next $10 billion; 0.0040% of the next $10 billion; and 0.0025% of aggregate average daily net assets in excess of $50 billion. The fees payable to DSC under the service agreement described above are allocated among all funds in the Delaware Investments® Family of Funds on a relative net asset value basis. Prior to October 1, 2007, DSC provided fund accounting and administrative services to the Series and received a fee at an annual rate of 0.04% of average daily net assets. For the year ended December 31, 2007, the Series was charged $10,178 for these services.
DSC also provides dividend disbursing and transfer agency services. The Series pays DSC a monthly fee based on the number of shareholder accounts for dividend disbursing and transfer agent services.
Pursuant to a distribution agreement and distribution plan, the Series pays Delaware Distributors, L.P. (DDLP), the distributor and an affiliate of DMC, an annual distribution and service fee not to exceed 0.30% of the average daily net assets of the Service Class shares. DDLP has contracted to waive distribution and service fees through April 30, 2008 in order to prevent distribution and service fees of the Service Class shares from exceeding 0.25% of average daily net assets. Standard Class shares pay no distribution and service expenses.
At December 31, 2007, the Series had liabilities payable to affiliates as follows:
Investment
Management
Fee Payable to
DMC | | Dividend Disbursing,
Transfer Agent Fees
and Other Expenses
Payable to DSC | | Distribution
Fee Payable
To DDLP | | Other
Expenses
Payable
to DMC
and Affiliates* | |
$ | 15,196 | | $ | 1,120 | | $ | 1 | | $ | 2,883 | |
| | | | | | | | | | | |
*DMC, as part of its administrative services, pays operating expenses on behalf of the Series and is reimbursed on a periodic basis. Such expenses include items such as printing of shareholder reports, fees for audit, legal and tax services, custodian fees and trustees’ fees.
As provided in the investment management agreement, the Series bears the cost of certain legal and tax services, including internal legal and tax services provided to the Series by DMC and/or its affiliates’ employees. For the year ended December 31, 2007, the Series was charged $1,658 for internal legal and tax services provided by DMC and/or its affiliates’ employees.
Trustees’ fees include expenses accrued by the Series for each Trustee’s retainer and per meeting fees. Certain officers of DMC, DSC and DDLP are officers and/or Trustees of the Trust. These officers and Trustees are paid no compensation by the Series.
17
Delaware VIP Balanced Series
Notes to Financial Statements (continued)
3. Investments
For the year ended December 31, 2007, the Series made purchases and sales of investment securities other than short-term investments as follows:
Purchases other than U.S. government securities | | $ | 30,665,379 | |
Purchases of U.S. government securities | | 11,695,964 | |
Sales other than U.S. government securities | | 38,602,711 | |
Sales of U.S. government securities | | 11,231,647 | |
At December 31, 2007, the cost of investments for federal income tax purposes and unrealized appreciation (depreciation) for the Series were as follows:
Cost of
Investments | | Aggregate
Unrealized
Appreciation | | Aggregate
Unrealized
Depreciation | | Net Unrealized
Appreciation | |
$ | 28,352,958 | | $ | 2,675,086 | | $ | (1,572,320 | ) | $ | 1,102,766 | |
| | | | | | | | | | | |
4. Dividend and Distribution Information
Income and long-term capital gain distributions are determined in accordance with federal income tax regulations, which may differ from U.S. generally accepted accounting principles. Additionally, net short-term gains on sales of investment securities are treated as ordinary income for federal income tax purposes. The tax character of dividends and distributions paid during the years ended December 31, 2007 and 2006 was as follows:
| | Year
Ended
12/31/07 | | Year
Ended
12/31/06 | |
Ordinary income | | $ | 1,095,801 | | $ | 1,122,167 | |
| | | | | | | |
5. Components of Net Assets on a Tax Basis
As of December 31, 2007, the components of net assets on a tax basis were as follows:
Shares of beneficial interest | | $ | 42,694,049 | |
Undistributed ordinary income | | 935,650 | |
Capital loss carryforwards | | (17,689,162 | ) |
Other temporary differences | | (34,101 | ) |
Unrealized appreciation of investments and swap contracts | | 1,117,523 | |
Net assets | | $ | 27,023,959 | |
The differences between book basis and tax basis components of net assets are primarily attributable to tax deferral of losses on wash sales, mark-to-market of futures contracts, tax treatment of credit default and interest rate swap contracts, market discount and premium on debt instruments, straddle deferrals, and tax treatment of contingent payment debt instruments.
For financial reporting purposes, capital accounts are adjusted to reflect the tax character of permanent book/tax differences. Reclassifications are primarily due to tax treatment of gain (loss) on paydowns of mortgage- and asset-backed securities, contingent payment debt instruments, credit default and interest rate swap contracts and market discount and premium on certain debt instruments. Results of operations and net assets were not affected by these reclassifications. For the year ended December 31, 2007, the Series recorded the following reclassifications:
Undistributed
Net
Investment Income | | Accumulated
Net Realized
(Loss) | |
$ | 21,096 | | $ | (21,096 | ) |
| | | | | |
For federal income tax purposes, capital loss carryforwards may be carried forward and applied against future capital gains. $2,137,896 was utilized in 2007. Capital loss carryforwards remaining at December 31, 2007 will expire as follows: $7,639,801 expires in 2009; $9,576,012 expires in 2010; and $473,349 expires in 2011.
18
Delaware VIP Balanced Series
Notes to Financial Statements (continued)
6. Capital Shares
Transactions in capital shares were as follows:
| | Year
Ended
12/31/07 | | Year
Ended
12/31/06 | |
Shares sold: | | | | | |
Standard Class | | 84,727 | | 2,599,584 | |
| | | | | |
Shares issued upon reinvestment of dividends and distributions: | | | | | |
Standard Class | | 72,993 | | 82,019 | |
Service Class | | 12 | | 10 | |
| | 157,732 | | 2,681,613 | |
| | | | | |
Shares repurchased: | | | | | |
Standard Class | | (667,221 | ) | (3,171,452 | ) |
Net decrease | | (509,489 | ) | (489,839 | ) |
7. Line of Credit
The Series, along with certain other funds in the Delaware Investments® Family of Funds (Participants), participates in a $225,000,000 revolving line of credit facility to be used for temporary or emergency purposes as an additional source of liquidity to fund redemptions of investor shares. The Participants are charged an annual commitment fee, which is allocated across the Participants on the basis of each Participant’s allocation of the entire facility. The Participants may borrow up to a maximum of one third of their net assets under the agreement. The Series had no amounts outstanding as of December 31, 2007, or at any time during the year then ended.
8. Futures Contracts
The Series may invest in financial futures contracts to hedge its existing portfolio securities against fluctuations in fair value caused by changes in prevailing market interest rates. Upon entering into a futures contract, the Series deposits cash or pledges U.S. government securities to a broker, equal to the minimum “initial margin” requirements of the exchange on which the contract is traded. Subsequent payments are received from the broker or paid to the broker each day, based on the daily fluctuation in the market value of the contract. These receipts or payments are known as “variation margin” and are recorded daily by the Series as unrealized gains or losses until the contracts are closed. When the contracts are closed, the Series records a realized gain or loss equal to the difference between the value of the contract at the time it was opened and the value at the time it was closed. Risks of entering into futures contracts include potential imperfect correlation between the futures contracts and the underlying securities and the possibility of an illiquid secondary market for these instruments. The unrealized gain (loss) is included in liabilities net of receivables and other assets on the Statement of Net Assets.
9. Swap Contracts
The Series may enter into interest rate swap contracts, index swap contracts and credit default swap (CDS) contracts in accordance with its investment objectives. The Series may use interest rate swaps to adjust the Series’ sensitivity to interest rates or to hedge against changes in interest rates. Index swaps may be used to gain exposure to markets that the Series invests in, such as the corporate bond market. The Series may also use index swaps as a substitute for future or options contracts if such contracts are not directly available to the Series on favorable terms. The Series may enter into CDS contracts in order to hedge against a credit event, to enhance total return or to gain exposure to certain securities or markets.
An interest rate swap involves payments received by the Series from another party based on a variable or floating interest rate, in return for making payments based on a fixed interest rate. An interest rate swap can also work in reverse with the Series receiving payments based on a fixed interest rate and making payments based on a variable or floating interest rate. Interest rate swaps may be used to adjust the Series’ sensitivity to interest rates or to hedge against changes in interest rates. Periodic payments on such contracts are accrued daily and recorded as unrealized appreciation/depreciation on swap contracts. Upon periodic payment/receipt or termination of the contract, such amounts are recorded as realized gains or losses on swap contracts.
Index swaps involve commitments to pay interest in exchange for a market-linked return based on a notional amount. To the extent the total return of the security, instrument or basket of instruments underlying the transaction exceeds the offsetting interest obligation, the Series will receive a payment from the counterparty. To the extent the total return of the security, instrument or basket of instruments underlying the transaction falls short of the offsetting interest obligation, the Series will make a payment to the counterparty. The change in value of swap contracts outstanding, if any, is recorded as unrealized appreciation or depreciation daily. A realized gain or loss is recorded on maturity or termination of the swap contract.
A CDS contract is a risk-transfer instrument through which one party (purchaser of protection) transfers to another party (seller of protection) the financial risk of a credit event, as it relates to a particular reference security or basket of securities (such as an index). In exchange for the protection offered by the seller of protection, the purchaser of protection agrees to pay the seller of protection a periodic amount at a stated rate that is applied to the notional amount of the CDS contract. In addition, an upfront payment may be made or received by the Series in connection with an unwinding or assignment of a CDS contract. Upon the occurrence of a credit event, the seller of protection would pay the par (or other agreed-upon) value of the referenced security (or basket of securities) to the counterparty.
19
Delaware VIP Balanced Series
Notes to Financial Statements (continued)
During the year ended December 31, 2007, the Series entered into CDS contracts as a purchaser and seller of protection. Periodic payments (receipts) on such contracts are accrued daily and recorded as unrealized losses (gains) on swap contracts. Upon payment (receipt), such amounts are recorded as realized losses (gains) on swap contracts. Upfront payments made or received in connection with CDS contracts are amortized over the expected life of the CDS contracts as unrealized losses (gains) on swap contracts. The change in value of CDS contracts is recorded as unrealized appreciation or depreciation daily. A realized gain or loss is recorded upon a credit event (as defined in the CDS agreement) or the maturity or termination of the agreement.
Credit default swaps may involve greater risks than if the Series had invested in the referenced obligation directly. Credit default swaps are subject to general market risk, liquidity risk, counterparty risk and credit risk. If the Series enters into a CDS contract as a purchaser of protection and no credit event occurs, its exposure is limited to the periodic payments previously made to the counterparty.
Because there is no organized market for swap contracts, the value of open swaps may differ from that which would be realized in the event the Series terminated its position in the agreement. Risks of entering into these agreements include the potential inability of the counterparty to meet the terms of the contracts. This type of risk is generally limited to the amount of favorable movements in the value of the underlying security, instrument, or basket of instruments, if any, at the day of default. Risks also arise from potential losses from adverse market movements and such losses could exceed the unrealized amounts shown above.
10. Securities Lending
The Series, along with other funds in the Delaware Investments® Family of Funds, may lend its securities pursuant to a security lending agreement (Lending Agreement) with Mellon Bank, N.A. (Mellon). With respect to each loan, if the aggregate market value of the collateral held on any business day is less than the aggregate market value of the securities which are the subject of such loan, the borrower will be notified to provide additional collateral not less than the applicable collateral requirements. Cash collateral received is invested in a collective investment vehicle (Collective Trust) established by Mellon for the purpose of investment on behalf of clients participating in its securities lending programs. The Collective Trust invests in fixed income securities, with a weighted average maturity not to exceed 90 days, rated in one of the top two tiers by Standard & Poor’s Ratings Group or Moody’s Investors Service, Inc. or repurchase agreements collateralized by such securities. However, in the event of default or bankruptcy by the lending agent, realization and/or retention of the collateral may be subject to legal proceedings. In the event the borrower fails to return loaned securities and the collateral received is insufficient to cover the value of the loaned securities and provided such collateral shortfall is not the result of investment losses, the lending agent has agreed to pay the amount of the shortfall to the Series, or at the discretion of the lending agent, replace the loaned securities. The Series continues to record dividends or interest, as applicable, on the securities loaned and is subject to change in value of the securities loaned that may occur during the term of the loan. The Series has the right under the Lending Agreement to recover the securities from the borrower on demand. With respect to security loans collateralized by U.S. Treasury obligations, the Series receives a fee from the securities lending agent. With respect to security loans collateralized by cash collateral, the earnings from the collateral investments are shared among the Series, the security lending agent and the borrower. The Series records securities lending income net of allocations to the security lending agent and the borrower.
At December 31, 2007, the market value of the securities on loan was $2,130,472, for which the Series received collateral, comprised of U.S. government obligations valued at $609,735, and cash collateral of $1,565,050. Investments purchased with cash collateral are presented on the Statement of net assets under the caption “Securities Lending Collateral.”
11. Credit and Market Risk
The Series invests in fixed income securities whose value is derived from an underlying pool of mortgages or consumer loans. The value of these securities is sensitive to changes in economic conditions, including delinquencies and/or defaults, and may be adversely affected by shifts in the market’s perception of the issuers and changes in interest rates. Investors receive principal and interest payments as the underlying mortgages and consumer loans are paid back. Some of these securities are collateralized mortgage obligations (CMOs). CMOs are debt securities issued by U.S. government agencies or by financial institutions and other mortgage lenders, which are collateralized by a pool of mortgages held under an indenture. Prepayment of mortgages may shorten the stated maturity of the obligations and can result in a loss of premium, if any has been paid. Certain of these securities may be stripped (securities which provide only the principal or interest feature of the underlying security). The yield to maturity on an interest-only CMO is extremely sensitive not only to changes in prevailing interest rates, but also to the rate of principal payments (including prepayments) on the related underlying mortgage assets. A rapid rate of principal payments may have a material adverse affect on the Series’ yield to maturity. If the underlying mortgage assets experience greater than anticipated prepayments of principal, the Series may fail to fully recoup its initial investment in these securities even if the securities are rated in the highest rating categories.
The Series may invest up to 15% of its net assets in illiquid securities, which may include securities with contractual restrictions on resale, securities exempt from registration under Rule 144A of the Securities Act of 1933, as amended, and other securities which may not be readily marketable. The relative illiquidity of these securities may impair the Series from disposing of them in a timely manner and at a fair price when it is necessary or desirable to do so. While maintaining oversight, the Series’ Board of Trustees has delegated to DMC the day-to-day functions of determining whether individual securities are liquid for purposes of the Series’ limitation on investments in illiquid assets. As of December 31, 2007, no securities have been determined to be illiquid under the Series’ Liquidity Procedures. Rule 144A securities have been identified on the Statement of Net Assets.
12. Contractual Obligations
The Series enters into contracts in the normal course of business that contain a variety of indemnifications. The Series’ maximum exposure under these arrangements is unknown. However, the Series has not had prior claims or losses pursuant to these contracts. Management has reviewed the Series’ existing contracts and expects the risk of loss to be remote.
20
Delaware VIP Balanced Series
Notes to Financial Statements (continued)
13. Tax Information (Unaudited)
For the fiscal year ended December 31, 2007, the Series designates dividends and distributions paid during the year as follows:
(A)
Long-Term
Capital Gain
Distributions
(Tax Basis) | | (B)
Ordinary
Income
Distributions
(Tax Basis) | | Total
Distributions
(Tax Basis) | | (C)
Qualifying
Dividends(1) | |
— | | 100 | % | 100 | % | 50 | % |
(A) and (B) are based on a percentage of the Series’ total distributions.
(C) is based on a percentage of the Series’ ordinary income distributions.
(1)Qualifying dividends represent dividends which qualify for the corporate dividends received deduction.
14. Change in Custodian
On August 9, 2007, Mellon, One Mellon Center, Pittsburgh, PA 15258, became the Series’ custodian.
21
Delaware VIP Trust — Delaware VIP Balanced Series
Report of Independent Registered Public Accounting Firm
To the Shareholders and Board of Trustees
Delaware VIP Trust–Delaware VIP Balanced Series
We have audited the accompanying statement of net assets of the Delaware VIP Balanced Series (one of the series constituting Delaware VIP Trust) (the “Series”) as of December 31, 2007, and the related statement of operations for the year then ended, the statements of changes in net assets for each of the two years in the period then ended, and the financial highlights for each of the five years in the period then ended. These financial statements and financial highlights are the responsibility of the Series’ management. Our responsibility is to express an opinion on these financial statements and financial highlights based on our audits.
We conducted our audits in accordance with the standards of the Public Company Accounting Oversight Board (United States). Those standards require that we plan and perform the audit to obtain reasonable assurance about whether the financial statements and financial highlights are free of material misstatement. We were not engaged to perform an audit of the Series’ internal control over financial reporting. Our audits included consideration of internal control over financial reporting as a basis for designing audit procedures that are appropriate in the circumstances, but not for the purpose of expressing an opinion on the effectiveness of the Series’ internal control over financial reporting. Accordingly, we express no such opinion. An audit also includes examining, on a test basis, evidence supporting the amounts and disclosures in the financial statements and financial highlights, assessing the accounting principles used and significant estimates made by management, and evaluating the overall financial statement presentation. Our procedures included confirmation of securities owned as of December 31, 2007, by correspondence with the custodian and brokers or by other appropriate auditing procedures where replies from brokers were not received. We believe that our audits provide a reasonable basis for our opinion.
In our opinion, the financial statements and financial highlights referred to above present fairly, in all material respects, the financial position of the Delaware VIP Balanced Series of Delaware VIP Trust at December 31, 2007, the results of its operations for the year then ended, the changes in its net assets for each of the two years in the period then ended, and its financial highlights for each of the five years in the period then ended, in conformity with U.S. generally accepted accounting principles.

Philadelphia, Pennsylvania
February 14, 2008
The Series files its complete schedule of portfolio holdings with the Securities and Exchange Commission (Commission) for the first and third quarters of each fiscal year on Form N-Q. The Series’ Forms N-Q, as well as a description of the policies and procedures that the Series uses to determine how to vote proxies (if any) relating to portfolio securities is available without charge (i) upon request, by calling 800-523-1918; and (ii) on the Commission’s website at http://www.sec.gov. In addition, a description of the policies and procedures that the Series uses to determine how to vote proxies (if any) relating to portfolio securities is available without charge on the Delaware Investments® Funds’ website at http://www.delawareinvestments.com. The Series’ Forms N-Q may be reviewed and copied at the Commission’s Public Reference Room in Washington, DC; information on the operation of the Public Reference Room may be obtained by calling 800 SEC-0330.
Information (if any) regarding how the Series voted proxies relating to portfolio securities during the most recently disclosed 12-month period ended June 30 is available without charge (i) through the Delaware Investments® Funds’ website at http://www.delawareinvestments.com; and (ii) on the Commission’s website at http://www.sec.gov.
22
Delaware Investments® Family of Funds
BOARD OF TRUSTEES / DIRECTORS AND OFFICERS ADDENDUM
A mutual fund is governed by a Board of Trustees/Directors (“Trustees”), which has oversight responsibility for the management of a fund’s business affairs. Trustees establish procedures and oversee and review the performance of the investment manager, the distributor, and others who perform services for the fund. The independent fund trustees, in particular, are advocates for shareholder interests. Each trustee has served in that capacity since he or she was elected to or appointed to the Board of Trustees, and will continue to serve until his or her retirement or the election of a new trustee in his or her place. The following is a list of the Trustees and Officers with certain background and related information.
Name,
Address,
and Birth Date | | Position(s)
Held with
Fund(s) | | Length of Time
Served | | Principal
Occupation(s)
During
Past 5 Years | | Number of
Portfolios in Fund Complex Overseen
by Trustee
or Officer | | Other
Directorships
Held by
Trustee
or Officer |
INTERESTED TRUSTEES | | | | | | | | |
| | | | | | | | |
Patrick P. Coyne(1)
2005 Market Street Philadelphia, PA 19103 April 1963 | | Chairman, President, Chief Executive Officer, and Trustee | | Chairman and Trustee since August 16, 2006 President and Chief Executive Officer since August 1, 2006 | | Patrick P. Coyne has served in various executive capacities at different times at Delaware
Investments.(2) | | 84 | | Director –
Kaydon Corp. Board of Governors Member –
Investment Company Institute
(2007 – present) Member of Investment Committee –
Cradle of Liberty Council, BSA (November 2007 – present) Finance Committee Member – St . John Vianney Roman Catholic Church
(2007 – present) |
| | | | | | | | | | |
INDEPENDENT TRUSTEES | | | | | | | | |
| | | | | | | | |
Thomas L. Bennett 2005 Market Street Philadelphia, PA 19103 October 1947 | | Trustee | | Since
March 2005 | | Private Investor – (March 2004 – Present) Investment Manager –
Morgan Stanley & Co.
(January 1984 – March 2004) | | 84 | | Director –
Bryn Mawr
Bank Corp. (BMTC) (April 2007 – Present) Chairman of Investment
Committee –
The Haverford School (2002 – present) Chairman of Investment Committee – Pennsylvania Academy of Fine Arts(2007 – present) Trustee
(2004 – present) Investment Committee
Member – Pennsylvania Horticulture Society(February 2006 – present) |
23
Name,
Address,
and Birth Date | | Position(s)
Held with
Fund(s) | | Length of Time
Served | | Principal
Occupation(s)
During
Past 5 Years | | Number of
Portfolios in Fund Complex Overseen
by Trustee
or Officer | | Other
Directorships
Held by
Trustee
or Officer |
INDEPENDENT TRUSTEES (CONTINUED) | | | | | | |
| | | | | | |
John A. Fry
2005 Market Street
Philadelphia, PA
19103 May 1960 | | Trustee | | Since
January 2001 | | President –
Franklin & Marshall College
(June 2002 – Present) Executive Vice President – University of Pennsylvania (April 1995 – June 2002) | | 84 | | Director –
Community Health Systems Director –
Allied Barton Security Holdings |
| | | | | | | | | | |
Anthony D. Knerr
2005 Market Street
Philadelphia, PA
19103 December 1938 | | Trustee | | Since
April 1990 | | Founder and Managing Director –
Anthony Knerr & Associates (Strategic Consulting)
(1990 – Present) | | 84 | | None |
| | | | | | | | | | |
Lucinda S. Landreth
2005 Market Street
Philadelphia, PA
19103 June 1947 | | Trustee | | Since
March 2005 | | Chief Investment Officer – Assurant, Inc. (Insurance)
(2002 – 2004) | | 84 | | None |
| | | | | | | | | | |
Ann R. Leven
2005 Market Street
Philadelphia, PA
19103 November 1940 | | Trustee | | Since
October 1989 | | Consultant –
ARL Associates (Financial Planning) (1983 – Present) | | 84 | | Director and Audit Committee Member – Systemax, Inc. |
| | | | | | | | | | |
Thomas F. Madison
2005 Market Street
Philadelphia, PA
19103 February 1936 | | Trustee | | Since
May 1997 | | President and Chief Executive Officer – MLM Partners, Inc. (Small Business Investing and Consulting) (January 1993 – Present) | | 84 | | Director –
CenterPoint Energy Director and Audit Committee Member – Digital River, Inc. Director and Audit Committee Member – Rimage Corporation Director and Chair of Compensation and Governance & Nominating Committees –
Valmont Industries, Inc. |
| | | | | | | | | | |
Janet L. Yeomans
2005 Market Street
Philadelphia, PA
19103 July 1948 | | Trustee | | Since
April 1999 | | Treasurer
(January 2006 – Present)
Vice President – Mergers & Acquisitions (January 2003 – January 2006),
and Vice President
(July 1995 – January 2003)
3M Corporation | | 84 | | None |
| | | | | | | | | | |
J. Richard Zecher
2005 Market Street
Philadelphia, PA
19103 July 1940 | | Trustee | | Since
March 2003 | | Founder –
Investor Analytics (Risk Management) (May 1999 – Present)
Founder –
Sutton Asset Management (Hedge Fund)
(September 1998 – Present) | | 84 | | Director and Audit Committee Member – Investor Analytics Director and Audit Committee Member – Oxigene, Inc. |
| | | | | | | | | | | | |
24
Name,
Address,
and Birth Date | | Position(s)
Held with
Fund(s) | | Length of Time
Served | | Principal
Occupation(s)
During
Past 5 Years | | Number of
Portfolios in Fund Complex Overseen
by Trustee
or Officer | | Other
Directorships
Held by
Trustee
or Officer |
OFFICERS | | | | | | | | | | |
| | | | | | | | | | |
David F. Connor
2005 Market Street
Philadelphia, PA
19103 December 1963 | | Vice President, Deputy General Counsel, and Secretary | | Vice President since September 21, 2000 and Secretary since October 2005 | | David F. Connor has served as Vice President and Deputy General Counsel of Delaware Investments since 2000. | | 84 | | None(4) |
| | | | | | | | | | |
Daniel V. Geatens
2005 Market Street
Philadelphia, PA
19103 October 1972 | | Vice President and Treasurer | | Treasurer since October 25, 2007 | | Daniel V. Geatens has served in various capacities at different times at Delaware Investments. | | 84 | | None(4) |
| | | | | | | | | | |
David P. O’Connor
2005 Market Street
Philadelphia, PA
19103 February 1966 | | Senior Vice President, General Counsel, and Chief Legal Officer | | Senior Vice President, General Counsel, and Chief Legal Officer since October 2005 | | David P. O’Connor has served in various executive and legal capacities at different times at Delaware Investments. | | 84 | | None(4) |
| | | | | | | | | | |
Richard Salus
2005 Market Street
Philadelphia, PA
19103 October 1963 | | Senior Vice President and
Chief Financial Officer | | Chief Financial Officer since November 1, 2006 | | Richard Salus has served in various executive capacities at different times at Delaware Investments. | | 84 | | None(4) |
(1) | Patrick P. Coyne is considered to be an “Interested Trustee” because he is an executive officer of the Fund’s(s’) investment advisor. |
(2) | Delaware Investments is the marketing name for Delaware Management Holdings, Inc. and its subsidiaries, including the Fund’s(s’) investment advisor, principal underwriter, and its transfer agent. |
(3) | In 1997, several funds managed by Voyageur Fund Managers, Inc. (the “Voyageur Funds”) were incorporated into the Delaware Investments Family of Funds. Mr. Madison served as a director of the Voyageur Funds from 1993 until 1997. |
(4) | David F. Connor, Daniel V. Geatens, David P. O’Connor, and Richard Salus serve in similar capacities for the six portfolios of the Optimum Fund Trust, which have the same investment advisor, principal underwriter, and transfer agent as the registrant. |
The Statement of Additional Information for the Fund(s) includes additional information about the Trustees and Officers and is available, without charge, upon request by calling 800 523-1918.
25
Delaware VIP Trust — Delaware VIP Capital Reserves Series
For the 12-month period ended Dec. 31, 2007, Delaware VIP Capital Reserves Series returned +4.46% for Standard Class shares and +4.23% for Service Class shares (both figures reflect all distributions reinvested). During the same period, the Series’ benchmark, the Merrill Lynch 1-3 Year Treasury Index, outperformed the Series with a return of +7.32% (source: Lipper).
Delaware VIP Capital Reserves Series seeks a high, stable level of current income while attempting to minimize fluctuations in principal and provide maximum liquidity.
While the Series is appropriate for an investor who has long-term goals and seeks a relatively stable and high flow of income, the Series is not a money market fund, and is not designed for stability of principal as most money market funds are.
We invest primarily in short-term securities, including securities issued or guaranteed by the U.S. government, its agencies, or its instrumentalities; instruments backed by U.S. government securities; and debt securities issued by U.S. corporations.
While the short-term profile of the series shielded it to some degree from the year’s market volatility, 2007 was still tumultuous for diversified bond portfolios, and especially those that include some exposure to corporate and mortgage-backed debt. By March 2007, it was becoming clear that the problems in the U.S. housing market were more severe than originally thought, and in July and August the deepening housing slump touched off global market turmoil in credit markets. By the time the fiscal year ended, the U.S. Federal Reserve had trimmed interest rates at meetings in September, October, and December, for a total of 100 basis points, or one percentage point (to 4.25%).
Generally speaking, we focused on investments of higher credit quality as the market weakened. In our view, however, the agency sector was affected somewhat unfairly at times during the year by the problems occurring in the housing market. After agency securities fell out of favor with investors, we began to view them as having attractive yields and by year end had shifted some Treasury assets to the agency sector, with the idea that agencies had potential to provide a yield advantage over nominal Treasurys, as well as some capital appreciation potential.
The views expressed are current as of the date of this report and are subject to change.
The performance data quoted below represent past performance; past performance does not guarantee future results. Investment return and principal value will fluctuate so your shares, when redeemed, may be worth more or less than their original cost. Please obtain the performance data for the most recent month end by calling the number noted in the introductory section of this report on the page related to this Series.
You should consider the investment objectives, risks, charges, and expenses of the investment company carefully before investing. The Delaware VIP Capital Reserves Series prospectus contains this and other important information about the Series. To obtain a prospectus, contact the company noted on the page related to this Series in the introductory section of this report, either by phone or through the company Web site. We advise you to read the prospectus carefully before you invest.
Delaware VIP Capital Reserves Series
Average annual total returns
For periods ended Dec. 31, 2007 | | 1 year | | 5 years | | 10 years | | Lifetime | |
Standard Class shares (commenced operations July 28, 1988) | | +4.46 | % | +3.82 | % | +4.97 | % | +5.97 | % |
Service Class shares (commenced operations May 1, 2000) | | +4.23 | % | +3.46 | % | NA | | +5.23 | % |
As disclosed in the Series’ most recent prospectus, expenses for Standard Class and Service Class shares were as follows: The net expense ratios for Standard Class and Service Class shares of the Series were 0.70% and 0.95%, respectively. Total operating expenses for Standard Class and Service Class shares were 0.70% and 1.00%, respectively. Management fees for Standard Class and Service Class shares were 0.50%.
Earnings from a variable annuity or variable life investment compound tax-free until withdrawal and, as a result, no adjustments were made for income taxes.
An expense limitation was in effect for all classes during the periods shown in the Series performance chart above and in the Performance of a $10,000 Investment chart on the next page.
Performance of Service Class shares will vary due to different charges and expenses.
Performance data do not reflect insurance fees related to a variable annuity or variable life investment or the deferred sales charge that would apply to certain withdrawals of investments held for fewer than eight years. Performance shown here would have been reduced if such fees were included and the expense limitation removed. For more information about fees, consult your variable annuity or variable life prospectus.
Investments in variable products involve risk. A rise or fall in interest rates can have a significant impact on bond prices and the net asset value (NAV) of the Series. High yielding, noninvestment grade bonds involve higher risk than investment grade bonds. Adverse conditions
1
may affect the issuer’s ability to pay interest and principal on these securities. The portfolio may have turnover in excess of 100%. High portfolio turnover can increase the Series’ transaction costs and lower returns.
The Series may be invested in emerging markets and foreign high yield corporate bonds, which have special risks that include currency fluctuations, economic and political change, and different accounting standards. Some portfolios offer more risk than others. The Series may utilize futures and swaps for defensive strategy purposes to project or minimize the impact of potential changes.
Please read both the contract and underlying prospectus for specific details regarding the product’s risk profile.
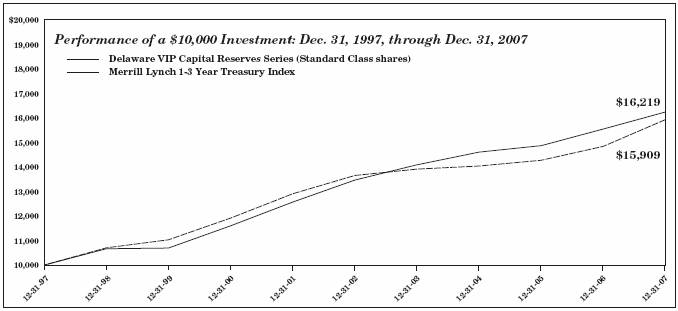
The chart shows a $10,000 investment in the Delaware VIP Capital Reserves Series Standard Class shares for the period from Dec. 31, 1997, through Dec. 31, 2007. Performance of Service Class shares will vary due to different charges and expenses.
The chart also shows $10,000 invested in the Merrill Lynch 1-3 Year Treasury Index for the period from Dec. 31, 1997, through Dec. 31, 2007. The Merrill Lynch 1-3 Year Treasury Index is an unmanaged index of short-term U.S. Treasury obligations having maturities from 1 to 2.99 years. An index is unmanaged and does not reflect the costs of operating a mutual fund, such as the costs of buying, selling, and holding securities. You cannot invest directly in an index.
2
Delaware VIP Trust — Delaware VIP Capital Reserves Series
Disclosure of Series Expenses
For the Period July 1, 2007 to December 31, 2007
As a shareholder of the Series, you incur ongoing costs, including management fees; distribution and/or service (12b-1) fees; and other Series expenses. This Example is intended to help you understand your ongoing costs (in dollars) of investing in the Series and to compare these costs with the ongoing costs of investing in other mutual funds.
The Example is based on an investment of $1,000 invested at the beginning of the period and held for the entire period from July 1, 2007 to December 31, 2007.
Actual Expenses
The first section of the table shown, “Actual Series Return,” provides information about actual account values and actual expenses. You may use the information in this section of the table, together with the amount you invested, to estimate the expenses that you paid over the period. Simply divide your account value by $1,000 (for example, an $8,600 account value divided by $1,000 = 8.6), then multiply the result by the number in the first section under the heading entitled “Expenses Paid During Period” to estimate the expenses you paid on your account during the period.
Hypothetical Example for Comparison Purposes
The second section of the table shown, “Hypothetical 5% Return,” provides information about hypothetical account values and hypothetical expenses based on the Series’ actual expense ratio and an assumed rate of return of 5% per year before expenses, which is not the Series’ actual return. The hypothetical account values and expenses may not be used to estimate the actual ending account balance or expenses you paid for the period. You may use this information to compare the ongoing costs of investing in the Series and other funds. To do so, compare the 5% hypothetical example with the 5% hypothetical examples that appear in the shareholder reports of other funds.
Please note that the expenses shown in the table are meant to highlight your ongoing costs only. As a shareholder of the Series, you do not incur any transaction costs, such as sales charges (loads), redemption fees or exchange fees, but shareholders of other funds may incur such costs. Also, the fees related to the variable annuity investment or the deferred sales charge that could apply have not been included. Therefore, the second section of the table is useful in comparing ongoing costs only, and will not help you determine the relative total costs of owning different funds. The Series’ actual expenses shown in the table reflect fee waivers in effect for Service Class shares. The expenses shown in the table assume reinvestment of all dividends and distributions.
Expense Analysis of an Investment of $1,000
| | Beginning
Account
Value
7/1/07 | | Ending
Account
Value
12/31/07 | | Annualized
Expense
Ratios | | Expenses
Paid During
Period
7/1/07 to
12/31/07* | |
Actual Series Return | | | | | | | | | |
Standard Class | | $ | 1,000.00 | | $ | 1,024.60 | | 0.69 | % | $ | 3.52 | |
Service Class | | 1,000.00 | | 1,023.50 | | 0.94 | % | 4.79 | |
| | | | | | | | | |
Hypothetical 5% Return (5% return before expenses) | | | | | | | | | |
Standard Class | | $ | 1,000.00 | | $ | 1,021.73 | | 0.69 | % | $ | 3.52 | |
Service Class | | 1,000.00 | | 1,020.47 | | 0.94 | % | 4.79 | |
* | “Expenses Paid During Period” are equal to the Series’ annualized expense ratio, multiplied by the average account value over the period, multiplied by 184/365 (to reflect the one-half year period). |
3
Delaware VIP Trust — Delaware VIP Capital Reserves Series
Sector Allocation and Credit Quality Breakdown
As of December 31, 2007
Sector designations may be different than the sector designations presented in other Series materials
Sector | | Percentage
of Net Assets | |
Agency Asset-Backed Securities | | 0.09 | % |
Agency Collateralized Mortgage Obligations | | 1.80 | % |
Agency Mortgage-Backed Securities | | 9.07 | % |
Agency Obligations | | 7.78 | % |
Commercial Mortgage-Backed Securities | | 3.68 | % |
Corporate Bonds | | 20.01 | % |
Banking | | 3.32 | % |
Basic Industry | | 1.03 | % |
Brokerage | | 0.29 | % |
Capital Goods | | 0.49 | % |
Communications | | 5.06 | % |
Consumer Cyclical | | 1.26 | % |
Consumer Non-Cyclical | | 2.31 | % |
Electric | | 1.12 | % |
Finance Companies | | 2.35 | % |
Insurance | | 1.23 | % |
Natural Gas | | 0.34 | % |
Real Estate | | 0.61 | % |
Technology | | 0.60 | % |
Non-Agency Asset-Backed Securities | | 14.47 | % |
Non-Agency Collateralized Mortgage Obligations | | 13.36 | % |
Senior Secured Loans | | 0.98 | % |
U.S. Treasury Obligations | | 24.00 | % |
Discount Notes | | 3.69 | % |
Securities Lending Collateral | | 20.80 | % |
Total Value of Securities | | 119.73 | % |
Obligation to Return Securities Lending Collateral | | (20.80 | )% |
Receivables and Other Assets Net of Liabilities | | 1.07 | % |
Total Net Assets | | 100.00 | % |
Credit Quality Breakdown
(as a % of fixed income investments) | | | |
AAA | | 77.46 | % |
AA | | 6.72 | % |
A | | 6.70 | % |
BBB | | 6.78 | % |
BB | | 1.41 | % |
B | | 0.93 | % |
Total | | 100.00 | % |
4
Delaware VIP Trust — Delaware VIP Capital Reserves Series
Statement of Net Assets
December 31, 2007
| | | Principal
Amount
(U.S.$) | | Value
(U.S.$) | |
| AGENCY ASSET-BACKED SECURITIES–0.09% | | | | | |
· | Fannie Mae Grantor Trust | | | | | |
| Series 2003-T4 2A5 5.407% 9/26/33 | | $ | 36,359 | | $ | 36,716 | |
| Total Agency Asset-Backed Securities (cost $36,065) | | | | 36,716 | |
| | | | | | |
| AGENCY COLLATERALIZED MORTGAGE OBLIGATIONS–1.80% | | | | | |
| Fannie Mae | | | | | |
| Series 2003-122 AJ 4.50% 2/25/28 | | 24,026 | | 23,677 | |
| Series 2005-67 EY 5.50% 8/25/25 | | 40,000 | | 40,251 | |
| Fannie Mae Grantor Trust | | | | | |
| Series 2001-T8 A2 9.50% 7/25/41 | | 21,638 | | 23,624 | |
| Fannie Mae Whole Loan | | | | | |
| Series 2004-W9 2A1 6.50% 2/25/44 | | 50,386 | | 52,580 | |
| Freddie Mac | | | | | |
| Series 2326 ZQ 6.50% 6/15/31 | | 107,936 | | 114,502 | |
| Series 2662 MA 4.50% 10/15/31 | | 47,309 | | 46,872 | |
| Series 2694 QG 4.50% 1/15/29 | | 25,000 | | 24,695 | |
| Series 3113 QA 5.00% 11/15/25 | | 131,059 | | 131,509 | |
| Freddie Mac Stated Final | | | | | |
| Series 5 GC 2.95% 12/15/09 | | 89,394 | | 88,836 | |
· | Freddie Mac Strip | | | | | |
| Series 19 F 5.743% 6/1/28 | | 18,859 | | 18,820 | |
t | Freddie Mac Structured Pass Through Securities Series T-58 2A 6.50% 9/25/43 | | 53,023 | | 55,380 | |
| GNMA | | | | | |
| Series 2002-28 B 5.779% 7/16/24 | | 17,315 | | 17,489 | |
| Series 2002-61 BA 4.648% 3/16/26 | | 27,283 | | 27,346 | |
| Series 2003-78 B 5.11% 10/16/27 | | 55,000 | | 55,462 | |
| Total Agency Collateralized Mortgage Obligations (cost $716,454) | | | | 721,043 | |
| | | | | | |
| AGENCY MORTGAGE-BACKED SECURITIES–9.07% | | | | | |
| Fannie Mae | | | | | |
| 6.50% 8/1/17 | | 26,328 | | 27,107 | |
| 6.52% 1/1/08 | | 9,276 | | 9,243 | |
| 7.00% 11/15/16 | | 53,469 | | 55,522 | |
| 8.50% 9/20/10 | | 2,849 | | 3,037 | |
| 9.00% 4/1/09 | | 3,066 | | 3,076 | |
· | Fannie Mae ARM | | | | | |
| 4.794% 11/1/35 | | 438,073 | | 437,476 | |
| 5.004% 6/1/34 | | 62,568 | | 62,912 | |
| 5.055% 8/1/35 | | 63,593 | | 62,514 | |
| 5.774% 8/1/34 | | 43,700 | | 44,026 | |
| 6.105% 6/1/36 | | 202,188 | | 198,809 | |
| 6.175% 7/1/36 | | 180,543 | | 184,803 | |
| 6.295% 7/1/36 | | 191,406 | | 196,288 | |
| 6.319% 8/1/36 | | 193,614 | | 197,818 | |
| 6.348% 4/1/36 | | 85,291 | | 86,610 | |
| 6.792% 12/1/33 | | 34,292 | | 34,723 | |
| 6.965% 10/1/33 | | 71,579 | | 72,681 | |
| Fannie Mae FHAVA 9.00% 6/1/09 | | $ | 26,993 | | $ | 27,496 | |
| Fannie Mae Relocation 30 yr | | | | | |
| Pool #763656 5.00% 1/1/34 | | 109,480 | | 107,658 | |
| Pool #763742 5.00% 1/1/34 | | 100,252 | | 98,623 | |
| Fannie Mae S.F. 15 yr | | | | | |
| 7.50% 3/1/15 | | 10,528 | | 10,938 | |
| 8.00% 10/1/14 | | 8,166 | | 8,253 | |
| 8.00% 10/1/16 | | 36,848 | | 38,644 | |
| Fannie Mae S.F. 30 yr | | | | | |
| 7.50% 12/1/10 | | 1,443 | | 1,461 | |
| 7.50% 6/1/31 | | 22,047 | | 23,533 | |
| 8.50% 5/1/11 | | 2,491 | | 2,552 | |
| 8.50% 8/1/12 | | 4,545 | | 4,700 | |
| 9.00% 7/1/20 | | 40,783 | | 43,901 | |
| 10.00% 8/1/19 | | 41,817 | | 47,345 | |
· | Freddie Mac ARM | | | | | |
| 5.683% 7/1/36 | | 61,958 | | 62,789 | |
| 6.335% 4/1/34 | | 12,699 | | 12,831 | |
| 7.189% 4/1/33 | | 19,282 | | 19,481 | |
| Freddie Mac Balloon 5 yr | | | | | |
| 4.00% 6/1/08 | | 27,758 | | 27,623 | |
| 4.00% 1/1/09 | | 107,720 | | 106,821 | |
| 4.50% 1/1/10 | | 167,577 | | 165,763 | |
| Freddie Mac Balloon 7 yr | | | | | |
| 4.50% 10/1/09 | | 95,893 | | 95,259 | |
| 5.00% 6/1/11 | | 166,258 | | 166,883 | |
| 5.00% 11/1/11 | | 173,976 | | 174,812 | |
| Freddie Mac Relocation 15 yr | | | | | |
| 3.50% 9/1/18 | | 70,801 | | 67,424 | |
| 3.50% 10/1/18 | | 11,041 | | 10,515 | |
| Freddie Mac S.F. 15 yr | | | | | |
| 4.00% 11/1/13 | | 132,296 | | 131,391 | |
| 4.00% 3/1/14 | | 161,766 | | 160,511 | |
| 5.00% 6/1/18 | | 60,569 | | 60,718 | |
| 8.00% 5/1/15 | | 39,163 | | 41,418 | |
| 8.50% 10/1/15 | | 5,898 | | 6,344 | |
| Freddie Mac S.F. 30 yr | | | | | |
| 7.00% 11/1/33 | | 23,809 | | 24,981 | |
| 9.00% 4/1/17 | | 2,671 | | 2,869 | |
| 9.25% 9/1/08 | | 1,362 | | 1,381 | |
| GNMA I S.F. 15 yr | | | | | |
| 6.00% 1/15/09 | | 2,668 | | 2,700 | |
| 8.50% 8/15/10 | | 2,393 | | 2,401 | |
| GNMA I S.F. 30 yr | | | | | |
| 7.00% 12/15/34 | | 76,125 | | 80,931 | |
| 8.00% 5/15/08 | | 380 | | 382 | |
| 11.00% 11/15/10 | | 109,020 | | 114,984 | |
| GNMA II S.F. 30 yr | | | | | |
| 12.00% 6/20/14 | | 5,257 | | 6,139 | |
| 12.00% 3/20/15 | | 635 | | 733 | |
| 12.00% 2/20/16 | | 2,040 | | 2,357 | |
| Total Agency Mortgage-Backed Securities (cost $3,643,103) | | | | 3,642,190 | |
5
| | | Principal
Amount
(U.S.$) | | Value
(U.S.$) | |
| AGENCY OBLIGATIONS–7.78% | | | | | |
| Federal Home Loan Bank System | | | | | |
| 3.75% 1/8/10 | | $ | 410,000 | | $ | 411,672 | |
| 4.25% 11/20/09 | | 185,000 | | 187,332 | |
| 4.50% 10/9/09 | | 1,490,000 | | 1,513,643 | |
* | Freddie Mac | | | | | |
| 4.125% 11/30/09 | | 765,000 | | 773,082 | |
| 5.00% 1/16/09 | | 235,000 | | 237,607 | |
| Total Agency Obligations
(cost $3,098,115) | | | | 3,123,336 | |
| COMMERCIAL MORTGAGE-BACKED SECURITIES–3.68% | | | | | |
· | Bank of America Commercial Mortgage Securities | | | | | |
| Series 2004-3 A5 5.316% 6/10/39 | | 90,000 | | 92,582 | |
# | Bear Stearns Commercial Mortgage Securities | | | | | |
| Series 2004-ESA E 144A 5.064% 5/14/16 | | 65,000 | | 65,974 | |
t# | Commercial Mortgage Pass Through Certificates | | | | | |
| Series 2001-J1A A2 144A 6.457% 2/14/34 | | 45,561 | | 47,417 | |
# | Crown Castle Towers 144A | | | | | |
· | Series 2005-1A AFL 5.408% 6/15/35 | | 110,000 | | 107,465 | |
| Series 2006-1A B 5.362% 11/15/36 | | 40,000 | | 39,276 | |
| DLJ Commercial Mortgage Series 1998-CF1 A3 6.70% 2/18/31 | | 150,000 | | 149,882 | |
| First Union-Lehman Brothers-Bank of America Series 1998-C2 A2 6.56% 11/18/35 | | 58,977 | | 58,934 | |
| First Union National Bank-Bank of America Commercial Mortgage Trust Series 2001-C1C 6.403% 3/15/33 | | 45,000 | | 47,066 | |
| Goldman Sachs Mortgage Securities II Series 2004-GG2 A3 4.602% 8/10/38 | | 95,000 | | 94,834 | |
| Lehman Brothers-UBS Commercial Mortgage Trust | | | | | |
| Series 2001-C2 A1 6.27% 6/15/20 | | 24,417 | | 24,596 | |
| Series 2003-C8 A2 4.207% 11/15/27 | | 150,000 | | 149,039 | |
| Merrill Lynch/Countrywide Commercial Mortgage Trust Series 2007-5 A1 4.275% 8/12/48 | | 201,097 | | 198,247 | |
· | Morgan Stanley Capital I Series 2007-T27 A4 5.651% 6/11/42 | | 95,000 | | 97,474 | |
# | SBA Commercial Mortgage Securities Trust Series 2006-1A B 144A 5.451% 11/15/36 | | 150,000 | | 148,674 | |
# | Tower 144A | | | | | |
| Series 2006-1 B 5.588% 2/15/36 | | 30,000 | | 29,773 | |
| Series 2006-1 C 5.707% 2/15/36 | | 45,000 | | 44,983 | |
· | Wachovia Bank Commercial Mortgage Trust Series 2005-C20 A5 5.087% 7/15/42 | | 80,000 | | 79,659 | |
| Total Commercial Mortgage-Backed Securities
(cost $1,477,658) | | | | 1,475,875 | |
| | | | | | |
| CORPORATE BONDS–20.01% | | | | | |
| Banking–3.32% | | | | | |
| American Express Centurion Bank 5.55% 10/17/12 | | $ | 280,000 | | $ | 285,214 | |
| Bank One 5.90% 11/15/11 | | 140,000 | | 145,491 | |
· | Capital One 5.211% 3/13/09 | | 180,000 | | 177,350 | |
| Citigroup 4.125% 2/22/10 | | 155,000 | | 152,808 | |
| JPMorgan Chase 5.75% 1/2/13 | | 190,000 | | 193,829 | |
| Popular North America 4.25% 4/1/08 | | 295,000 | | 294,387 | |
| Wells Fargo 5.625% 12/11/17 | | 85,000 | | 85,212 | |
| | | | | 1,334,291 | |
| Basic Industry–1.03% | | | | | |
| duPont (E.I.) deNemours 5.00% 1/15/13 | | 120,000 | | 120,891 | |
| Grupo Minero Mexico 8.25% 4/1/08 | | 100,000 | | 101,460 | |
| Lubrizol 4.625% 10/1/09 | | 120,000 | | 120,560 | |
| Weyerhaeuser 5.95% 11/1/08 | | 70,000 | | 70,581 | |
| | | | | 413,492 | |
| Brokerage–0.29% | | | | | |
| AMVESCAP 4.50% 12/15/09 | | 120,000 | | 118,461 | |
| | | | | 118,461 | |
| Capital Goods–0.49% | | | | | |
| Allied Waste North America 7.875% 4/15/13 | | 20,000 | | 20,550 | |
· | Masco 5.433% 3/12/10 | | 110,000 | | 106,309 | |
| Textron 6.50% 6/1/12 | | 65,000 | | 69,028 | |
| | | | | 195,887 | |
| Communications–5.06% | | | | | |
| AT&T 5.10% 9/15/14 | | 25,000 | | 24,776 | |
| AT&T Wireless 8.125% 5/1/12 | | 365,000 | | 406,222 | |
* | Cisco Systems 5.25% 2/22/11 | | 190,000 | | 194,939 | |
| Citizens Communications 7.125% 3/15/19 | | 74,000 | | 70,670 | |
| Comcast Cable Communications 6.20% 11/15/08 | | 295,000 | | 297,463 | |
| Intelsat Bermuda 11.25% 6/15/16 | | 35,000 | | 36,313 | |
| News America Holdings 7.375% 10/17/08 | | 70,000 | | 71,128 | |
· | Sprint Nextel 5.243% 6/28/10 | | 290,000 | | 278,823 | |
| Telecom Italia Capital 4.00% 1/15/10 | | 150,000 | | 146,986 | |
| Time Warner Cable 5.40% 7/2/12 | | 180,000 | | 180,540 | |
| Viacom | | | | | |
· | 5.341% 6/16/09 | | 105,000 | | 103,780 | |
| 5.75% 4/30/11 | | 145,000 | | 146,934 | |
| Windstream 8.125% 8/1/13 | | 70,000 | | 72,800 | |
| | | | | 2,031,374 | |
| Consumer Cyclical–1.26% | | | | | |
| Costco Wholesale 5.30% 3/15/12 | | 120,000 | | 123,280 | |
· | DaimlerChrysler Holding 5.328% 8/3/09 | | 135,000 | | 134,132 | |
| Lear 8.75% 12/1/16 | | 38,000 | | 34,770 | |
| Penney (J.C.) 7.375% 8/15/08 | | 145,000 | | 146,707 | |
| Wal-Mart Stores 6.875% 8/10/09 | | 65,000 | | 67,958 | |
| | | | | 506,847 | |
6
| | Principal
Amount
(U.S.$) | | Value
(U.S.$) | |
| CORPORATE BONDS (continued) | | | | | |
| Consumer Non-Cyclical–2.31% | | | | | |
| Abbott Laboratories | | | | | |
| 5.15% 11/30/12 | | $ | 130,000 | | $ | 133,009 | |
| 5.60% 11/30/17 | | 210,000 | | 216,168 | |
| Aramark Services 8.50% 2/1/15 | | 75,000 | | 76,313 | |
| Fred Meyer 7.45% 3/1/08 | | 70,000 | | 70,248 | |
| HCA PIK 9.625% 11/15/16 | | 70,000 | | 74,200 | |
| Kellogg 5.125% 12/3/12 | | 90,000 | | 90,851 | |
| Kraft Foods 4.125% 11/12/09 | | 120,000 | | 119,017 | |
# | UnitedHealth Group 144A 5.50% 11/15/12 | | 145,000 | | 147,307 | |
| | | | | 927,113 | |
| Electric–1.12% | | | | | |
| NRG Energy 7.375% 2/1/16 | | 15,000 | | 14,663 | |
| Pacific Gas & Electric 4.20% 3/1/11 | | 120,000 | | 118,169 | |
# | Power Contract Financing 144A 6.256% 2/1/10 | | 33,249 | | 33,972 | |
# | Power Receivables Finance 144A 6.29% 1/1/12 | | 62,682 | | 65,498 | |
| Virginia Electric & Power 5.10% 11/30/12 | | 170,000 | | 170,913 | |
# | West Penn Power 144A 5.95% 12/15/17 | | 45,000 | | 45,304 | |
| | | | | 448,519 | |
| Finance Companies–2.35% | | | | | |
| American Express 5.25% 9/12/11 | | 150,000 | | 151,346 | |
| General Electric Capital 5.50% 4/28/11 | | 365,000 | | 375,739 | |
| International Lease Finance | | | | | |
* | 4.625% 6/2/08 | | 70,000 | | 69,786 | |
| 5.35% 3/1/12 | | 60,000 | | 60,095 | |
| 5.625% 9/20/13 | | 60,000 | | 60,212 | |
| 5.75% 6/15/11 | | 150,000 | | 151,999 | |
·# | Xstrata Finance 144A 5.229% 11/13/09 | | 75,000 | | 74,815 | |
| | | | | 943,992 | |
| Insurance–1.23% | | | | | |
| Berkshire Hathaway Finance 4.125% 1/15/10 | | 305,000 | | 306,249 | |
| Reliastar Financial 6.50% 11/15/08 | | 185,000 | | 186,820 | |
| | | | | 493,069 | |
| Natural Gas–0.34% | | | | | |
| Southern Union 6.15% 8/16/08 | | 135,000 | | 135,482 | |
| | | | | 135,482 | |
| Real Estate–0.61% | | | | | |
| iStar Financial 5.65% 9/15/11 | | 110,000 | | 98,378 | |
| Simon Property Group 5.375% 8/28/08 | | 145,000 | | 144,631 | |
| | | | | 243,009 | |
| Technology–0.60% | | | | | |
| Freescale Semiconductor 8.875% 12/15/14 | | 20,000 | | 17,950 | |
| SunGard Data Systems 9.125% 8/15/13 | | 74,000 | | 75,665 | |
| Xerox 5.50% 5/15/12 | | 145,000 | | 147,551 | |
| | | | | 241,166 | |
| Total Corporate Bonds (cost $7,960,081) | | | | 8,032,702 | |
| NON-AGENCY ASSET-BACKED SECURITIES–14.47% | | | | | |
| Ameriquest Mortgage Securities | | | | | |
| Series2003-11 AF6 5.14% 1/25/34 | | $ | 65,000 | | $ | 61,281 | |
· | Series 2006-R1 A2C 5.055% 3/25/36 | | 100,000 | | 94,858 | |
| Argent Securities Series 2003-W5 AF4 4.66% 10/25/33 | | 9,975 | | 9,885 | |
· | Bank of America Credit Card Trust Series 2006-A10 A10 5.008% 2/15/12 | | 1,150,000 | | 1,145,046 | |
| Capital Auto Receivables Asset Trust Series 2007-3 A3A 5.02% 9/15/11 | | 90,000 | | 90,671 | |
| Caterpillar Financial Asset Trust Series 2007-A A3A 5.34% 6/25/12 | | 30,000 | | 30,452 | |
| Centex Home Equity Series 2005-D AF4 5.27% 10/25/35 | | 155,000 | | 149,376 | |
| Chase Funding Mortgage Loan Asset-Backed Certificates | | | | | |
| Series 2002-3 1A6 4.707% 9/25/13 | | 165,731 | | 166,234 | |
| Series 2003-2 1A4 3.986% 8/25/29 | | 2,726 | | 2,716 | |
| Series 2003-3 1A4 3.303% 11/25/29 | | 63,643 | | 62,809 | |
| Chase Manhattan Auto Owner Trust Series 2006-B A3 5.13% 5/15/11 | | 220,000 | | 220,851 | |
| CIT Equipment Collateral Series 2006-VT2 A3 5.07% 2/20/10 | | 270,000 | | 270,012 | |
· | Citibank Credit Card Issuance Trust Series 2007-A7 A7 5.299% 8/20/14 | | 100,000 | | 100,080 | |
| CitiFinancial Mortgage Securities Series 2004-1 AF2 2.645% 4/25/34 | | 152,999 | | 149,053 | |
| CNH Equipment Trust Series 2007-B A3A 5.40% 10/17/11 | | 40,000 | | 40,523 | |
| Countrywide Asset-Backed Certificates | | | | | |
· | Series 2006-1 AF3 5.348% 7/25/36 | | 280,000 | | 276,482 | |
| Series 2006-13 1AF3 5.944% 1/25/37 | | 160,000 | | 154,044 | |
| Series 2006-S5 A3 5.762% 6/25/35 | | 115,000 | | 99,023 | |
· | Series 2006-S7 A3 5.712% 11/25/35 | | 175,000 | | 151,433 | |
# | Countrywide Asset-Backed NIM Certificates Series 2004-BC1 Note 144A 5.50% 4/25/35 | | 31 | | 6 | |
# | Dunkin Securitization Series 2006-1 A2 144A 5.779% 6/20/31 | | 100,000 | | 96,455 | |
· | GMAC Mortgage Loan Trust Series 2006-HE3 A2 5.75% 10/25/36 | | 95,000 | | 85,822 | |
| Hyundai Auto Receivables Trust Series 2007-A A3A 5.04% 1/17/12 | | 30,000 | | 30,141 | |
| Indymac Seconds Assets Backed Trust Series 2006-1 A2 5.767% 5/25/36 | | 235,000 | | 210,774 | |
| Long Beach Auto Receivables Trust Series 2006-B A3 5.17% 8/15/11 | | 300,000 | | 301,334 | |
·# | MASTR Specialized Loan Trust Series 2005-2 A2 144A 5.006% 7/25/35 | | 26,986 | | 24,532 | |
· | Merrill Lynch Mortgage Investors Series 2006-AR1 A2C 5.025% 3/25/37 | | 80,000 | | 74,538 | |
· | Morgan Stanley Mortgage Loan Trust Series 2006-12XS A1 4.985% 10/25/36 | | 81,771 | | 81,332 | |
7
| | Principal
Amount
(U.S.$) | | Value
(U.S.$) | |
| NON-AGENCY ASSET-BACKED SECURITIES (continued) | | | | | |
| New Century Home Equity Loan Trust Series 2003-5 AI4 4.76% 11/25/33 | | $ | 71,446 | | $ | 70,958 | |
| Renaissance Home Equity Loan Trust | | | | | |
| Series 2005-4 A2 5.399% 2/25/36 | | 6,084 | | 6,063 | |
| Series 2006-1 AF3 5.608% 5/25/36 | | 210,000 | | 208,154 | |
| Series 2006-2 AF3 5.797% 8/25/36 | | 125,000 | | 124,241 | |
| Series 2006-3 AF1 5.917% 11/25/36 | | 76,654 | | 76,132 | |
| Series 2006-3 AF2 5.58% 11/25/36 | | 90,000 | | 88,292 | |
| Series 2007-2 AF2 5.675% 6/25/37 | | 35,000 | | 33,348 | |
| Residential Asset Securities | | | | | |
| Series 2002-KS2 AI5 6.779% 4/25/32 | | 31,746 | | 32,028 | |
| Series 2003-KS9 AI6 4.71% 11/25/33 | | 61,857 | | 59,278 | |
| Series 2004-KS9 AI3 3.79% 8/25/29 | | 28,349 | | 28,127 | |
· | Series 2006-KS3 AI3 5.035% 4/25/36 | | 270,000 | | 257,457 | |
| Residential Funding Mortgage Securities II | | | | | |
· | Series 2001-HS2 A5 6.92% 4/25/31 | | 20,325 | | 20,260 | |
| Series 2006-HSA2 AI2 5.496% 3/25/36 | | 190,000 | | 175,073 | |
# | Silverleaf Finance Series 2005-A A 144A 4.857% 11/15/16 | | 93,624 | | 92,289 | |
| Structured Asset Securities | | | | | |
| Series 2001-SB1 A2 3.375% 8/25/31 | | 37,693 | | 32,646 | |
| Series 2005-4XS 1A2B 4.67% 3/25/35 | | 69,877 | | 69,776 | |
| Series 2005-9XS 1A2A 4.84% 6/25/35 | | 95,000 | | 94,906 | |
| Triad Auto Receivables Owner Trust Series 2006-C A4 5.31% 5/13/13 | | 160,000 | | 160,889 | |
| Total Non-Agency Asset-Backed Securities (cost $5,952,390) | | | | 5,809,680 | |
| | | | | | |
| NON-AGENCY COLLATERALIZED MORTGAGE OBLIGATIONS–13.36% | | | | | |
| Bank of America Alternative Loan Trust | | | | | |
| Series 2003-10 2A1 6.00% 12/25/33 | | 77,898 | | 78,093 | |
| Series 2004-2 1A1 6.00% 3/25/34 | | 65,442 | | 65,606 | |
| Series 2004-11 1CB1 6.00% 12/25/34 | | 35,170 | | 35,258 | |
| Series 2005-9 5A1 5.50% 10/25/20 | | 99,200 | | 99,789 | |
· | Bank of America Funding Series 2006-H 1A2 5.699% 9/20/46 | | 123,344 | | 122,395 | |
· | Bank of America Mortgage Securities Series 2003-D 1A2 7.281% 5/25/33 | | 534 | | 538 | |
| Bear Stearns Asset Backed Securities Series 2005-AC8 A5 5.50% 11/25/35 | | 68,038 | | 68,380 | |
· | Citigroup Mortgage Loan Trust Series 2007-AR5 1AB 5.617% 4/25/37 | | 95,360 | | 94,678 | |
| Countrywide Alternative Loan Trust | | | | | |
| Series 2004-28CB 6A1 6.00% 1/25/35 | | 82,599 | | 82,805 | |
· | Series 2004-J7 1A2 4.673% 8/25/34 | | 9,195 | | 9,149 | |
| Series 2005-1CB 2A2 5.50% 3/25/35 | | 151,280 | | 145,944 | |
| Series 2006-2CB A3 5.50% 3/25/36 | | 64,120 | | 63,754 | |
·t | Countrywide Home Loan Mortgage Pass Through Trust | | | | | | |
| Series 2003-21 A1 4.093% 5/25/33 | | $ | 30,540 | | $ | 30,633 | | |
| Series 2003-46 1A1 4.122% 1/19/34 | | 33,376 | | 33,786 | | |
| Series 2004-12 1M 5.096% 8/25/34 | | 74,210 | | 72,646 | | |
| Series 2004-HYB4 M 4.834% 9/20/34 | | 31,341 | | 29,892 | | |
| Series 2006-HYB4 1A2 5.627% 6/20/36 | | 66,352 | | 65,602 | | |
| Credit Suisse First Boston Mortgage Securities | | | | | | |
| Series 2003-29 5A1 7.00% 12/25/33 | | 20,782 | | 20,776 | | |
| Series 2004-1 3A1 7.00% 2/25/34 | | 6,051 | | 6,246 | | |
| Deutsche Alternative A Securities Loan Trust Series 2003-4XS A6A 4.82% 10/25/33 | | 59,099 | | 58,555 | | |
· | First Horizon Asset Securities | | | | | | |
| Series 2004-AR5 4A1 5.70% 10/25/34 | | 44,219 | | 44,103 | | |
| Series 2007-AR3 2A2 6.315% 11/25/37 | | 193,503 | | 194,521 | | |
· | GMAC Mortgage Loan Trust Series 2005-AR2 4A 5.183% 5/25/35 | | 82,237 | | 80,926 | | |
# | GSMPS Mortgage Loan Trust 144A | | | | | | |
| Series 1998-3 A 7.75% 9/19/27 | | 26,514 | | 28,600 | | |
| Series 2005-RP1 1A3 8.00% 1/25/35 | | 30,031 | | 32,483 | | |
| Series 2005-RP1 1A4 8.50% 1/25/35 | | 13,405 | | 14,611 | | |
| GSR Mortgage Loan Trust | | | | | | |
| Series 2004-2F 9A1 6.00% 9/25/19 | | 12,987 | | 13,062 | | |
· | Series 2007-AR1 1A2 5.739% 3/25/37 | | 186,286 | | 184,595 | | |
· | JPMorgan Mortgage Trust | | | | | | |
| Series 2005-A1 4A1 4.779% 2/25/35 | | 100,866 | | 98,630 | | |
| Series 2005-A4 1A1 5.401% 7/25/35 | | 124,007 | | 122,734 | | |
| Series 2005-A6 1A2 5.138% 9/25/35 | | 105,000 | | 102,693 | | |
| Series 2005-A8 2A1 4.948% 11/25/35 | | 178,019 | | 176,895 | | |
| Series 2007-A1 B1 4.815% 7/25/35 | | 99,263 | | 96,683 | | |
| Lehman Mortgage Trust | | | | | | |
| Series 2005-2 2A3 5.50% 12/25/35 | | 60,723 | | 60,600 | | |
| Series 2006-1 3A3 5.50% 2/25/36 | | 93,598 | | 92,950 | | |
· | MASTR Adjustable Rate Mortgages Trust | | | | | | |
| Series 2003-6 1A2 6.739% 12/25/33 | | 22,140 | | 22,846 | | |
| Series 2005-1 B1 5.561% 3/25/35 | | 113,057 | | 110,393 | | |
| Series 2005-6 7A1 5.326% 6/25/35 | | 76,431 | | 75,528 | | |
# | MASTR Reperforming Loan Trust Series 2005-1 1A5 144A 8.00% 8/25/34 | | 60,714 | | 65,471 | | |
| Nomura Asset Acceptance | | | | | | |
| Series 2005-WF1 2A2 4.786% 3/25/35 | | 100,000 | | 94,175 | | |
| Series 2006-AF1 1A2 6.159% 5/25/36 | | 125,000 | | 119,552 | | |
| Residential Asset Mortgage Products | | | | | | |
| Series 2004-SL1 A3 7.00% 11/25/31 | | 11,170 | | 11,413 | | |
| Series 2004-SL4 A3 6.50% 7/25/32 | | 31,291 | | 31,066 | | |
· | Residential Funding Mortgage Security I Series 2006-SA3 3A1 6.038% 9/25/36 | | 98,372 | | 98,374 | | |
| | | | | | | | | | | | | | | | |
8
| | Principal
Amount
(U.S.$) | | Value
(U.S.$) | |
| NON-AGENCY COLLATERALIZED MORTGAGE OBLIGATIONS (continued) | | | | | |
| Structured Adjustable Rate Mortgage Loan Trust | | | | | |
| Series 2004-18 5A 5.50% 12/25/34 | | $ | 40,408 | | $ | 39,805 | |
· | Series 2005-22 4A2 5.373% 12/25/35 | | 21,650 | | 20,763 | |
· | Series 2006-5 5A4 5.545% 6/25/36 | | 44,559 | | 42,826 | |
| Structured Asset Securities | | | | | |
| Series 2004-5H A2 4.43% 12/25/33 | | 19,536 | | 19,451 | |
| Series 2004-12H 1A 6.00% 5/25/34 | | 28,549 | | 28,861 | |
t | Washington Mutual Alternative Mortgage Pass Through Certificates Series 2006-5 2CB3 6.00% 7/25/36 | | 99,158 | | 98,775 | |
t | Washington Mutual Mortgage Pass Through Certificates | | | | | |
| Series 2003-S10 A2 5.00% 10/25/18 | | 155,938 | | 153,199 | |
· | Series 2006-AR10 1A1 5.942% 9/25/36 | | 104,732 | | 105,826 | |
· | Series 2006-AR14 1A4 5.647% 11/25/36 | | 98,117 | | 97,879 | |
· | Series 2007-HY1 1A1 5.715% 2/25/37 | | 171,478 | | 170,923 | |
· | Series 2007-HY3 4A1 5.35% 3/25/37 | | 415,765 | | 413,848 | |
· | Wells Fargo Mortgage Backed Securities Trust | | | | | |
| Series 2004-EE 2A1 3.989% 12/25/34 | | 168,152 | | 166,499 | |
| Series 2004-T A1 6.18% 9/25/34 | | 15,688 | | 15,727 | |
| Series 2005-AR12 2A10 4.323% 7/25/35 | | 102,530 | | 101,063 | |
| Series 2005-AR16 6A4 5.00% 10/25/35 | | 119,257 | | 119,433 | |
| Series 2006-AR6 7A1 5.11% 3/25/36 | | 265,552 | | 258,448 | |
| Series 2006-AR10 5A1 5.597% 7/25/36 | | 95,988 | | 96,702 | |
| Series 2006-AR11 A7 5.516% 8/25/36 | | 106,341 | | 103,689 | |
| Series 2006-AR12 1A2 6.025% 9/25/36 | | 71,303 | | 70,692 | |
| Series 2006-AR14 2A4 6.088% 10/25/36 | | 82,505 | | 81,880 | |
| Total Non-Agency Collateralized Mortgage Obligations (cost $5,387,321) | | | | 5,363,718 | |
| | | | | | |
« | SENIOR SECURED LOANS–0.98% | | | | | |
| ALLTEL 7.69% 12/21/14 | | 100,000 | | 96,563 | |
| Energy Futures Holdings 8.39% 10/10/14 | | 300,000 | | 294,832 | |
| Total Senior Secured Loans (cost $396,000) | | | | 391,395 | |
| U.S. TREASURY OBLIGATIONS–24.00% | | | | | |
| U.S. Treasury Inflation Index Notes | | | | | |
* | 2.00% 1/15/14 | | $ | 209,178 | | $ | 216,123 | |
¥ | 3.00% 7/15/12 | | 354,401 | | 383,944 | |
* | 3.875% 1/15/09 | | 917,215 | | 944,588 | |
| U.S. Treasury Notes | | | | | |
* | 3.125% 11/30/09 | | 6,289,000 | | 6,297,849 | |
| 3.625% 12/31/12 | | 1,195,000 | | 1,204,337 | |
* | 4.25% 11/15/17 | | 20,000 | | 20,355 | |
* | 4.50% 5/15/10 | | 547,000 | | 565,419 | |
| Total U.S. Treasury Obligations (cost $9,580,436) | | | | 9,632,615 | |
# | DISCOUNT NOTES–3.69% | | | | | |
| Federal Home Loan Bank 3.25% 1/2/08 | | 734,133 | | 734,067 | |
| Freddie Mac 5.02% 1/22/08 | | 750,000 | | 747,847 | |
| Total Discount Notes (cost $1,481,914) | | | | 1,481,914 | |
| | | | | | |
| Total Value of Securities Before Securities Lending Collateral–98.93%
(cost $39,729,537) | | | | 39,711,184 | |
| | Number of
Shares | | | |
SECURITIES LENDING COLLATERAL**–20.80% | | | | | |
Investment Companies Mellon GSL DBT II Collateral Fund | | 8,350,860 | | 8,350,860 | |
Total Securities Lending Collateral (cost $8,350,860) | | | | 8,350,860 | |
9
TOTAL VALUE OF SECURITIES–119.73% (cost $48,080,397) | | $ | 48,062,044 | © |
OBLIGATION TO RETURN SECURITIES LENDING COLLATERAL**–(20.80%) | | (8,350,860 | ) |
RECEIVABLES AND OTHER ASSETS NET OF LIABILITIES–1.07% | | 430,484 | |
NET ASSETS APPLICABLE TO 4,165,278 SHARES OUTSTANDING–100.00% | | $ | 40,141,668 | |
NET ASSET VALUE–DELAWARE VIP CAPITAL RESERVES SERIES STANDARD CLASS ($20,880,276/2,159,956 Shares) | | $ | 9.67 | |
NET ASSET VALUE–DELAWARE VIP CAPITAL RESERVES SERIES SERVICE CLASS ($19,261,392/2,005,322 Shares) | | $ | 9.61 | |
COMPONENTS OF NET ASSETS AT DECEMBER 31, 2007: | | | |
Shares of beneficial interest (unlimited authorization–no par) | | $ | 42,106,673 | |
Undistributed net investment income | | 37,013 | |
Accumulated net realized loss on investments | | (2,053,123 | ) |
Unrealized appreciation of investments and foreign currencies | | 51,105 | |
Total net assets | | $ | 40,141,668 | |
t | Pass Through Agreement. Security represents the contractual right to receive a proportionate amount of underlying payments due to the counterparty pursuant to various agreements related to the rescheduling of obligations and the exchange of certain notes. |
· | Variable rate security. The rate shown is the rate as of December 31, 2007. |
« | Senior Secured Loans generally pay interest at rates which are periodically redetermined by reference to a base lending rate plus a premium. These base lending rates are generally (i) the prime rate offered by one or more United States banks, (ii) the lending rate offered by one or more European banks such as the London Inter-Bank Offered Rate (‘LIBOR’) and (iii) the certificate of deposit rate. Senior Secured Loans may be subject to restrictions on resale. |
¥ | Fully or partially pledged as collateral for financial futures contracts. |
# | Security exempt from registration under Rule 144A of the Securities Act of 1933, as amended. At December 31, 2007, the aggregate amount of Rule 144A securities was $1,204,905, which represented 3.00% of the Series’ net assets. See Note 13 in “Notes to Financial Statements.” |
¹ | The rate shown is the effective yield at the time of purchase. |
* | Fully or partially on loan. |
¹* | See Note 12 in “Notes to financial statements.” |
© | Includes $8,209,072 of securities loaned. |
Summary of Abbreviations:
ARM – Adjustable Rate Mortgage
FHAVA – Federal Housing Administration & Veterans Administration
GNMA – Government National Mortgage Association
NIM – Net Interest Margin
PIK– Pay-in-kind
S.F. – Single Family
yr – Year
The following futures contracts and swap contracts were outstanding at December 31, 2007:
Futures Contracts(1)
Contracts
to Buy | | Notional Cost
(Proceeds) | | Notional
Value | | Expiration Date | | Unrealized
Depreciation | |
5 | U.S. Treasury 5 year Notes | | $ | 552,280 | | $ | 551,406 | | 3/31/08 | | $ | (874 | ) |
(2) | U.S. Treasury 10 year Notes | | (226,557 | ) | (226,781 | ) | 3/31/08 | | (224 | ) |
| | | | | | | | $ | (1,098 | ) |
| | | | | | | | | | | | | |
10
Swap Contracts(2)
Credit Default Swap Contracts
Swap Counterparty &
Referenced Obligation | | Notional
Amount | | Annual Protection
Payments | | Termination
Date | | Unrealized
Appreciation | |
Protection Purchased: | | | | | | | | | |
Goldman Sachs | | | | | | | | | |
Best Buy | | | | | | | | | |
5 yr CDS | | $ | 118,000 | | 0.60 | % | 9/20/12 | | $ | 834 | |
10 yr CDS | | 60,000 | | 0.98 | % | 9/20/17 | | 338 | |
| | | | | | | | $ | 1,172 | |
| | | | | | | | | | | |
Interest Rate Swap Contracts
Notional Amount | | Expiration Date | | Description | | Unrealized
Appreciation | |
$ | 1,000,000 | | 1/8/09 | | Agreement with Goldman Sachs to receive the notional amount multiplied by the fixed rate of 5.071% and to pay the notional amount multiplied by the 3 month LIBOR | | $ | 9,730 | |
| | | | | | | |
1,155,000 | | 5/2/12 | | Agreement with Goldman Sachs to receive the notional amount multiplied by the fixed rate of 4.987% and to pay the notional amount multiplied by the 3 month LIBOR | | 41,072 | |
| | | | | | $ | 50,802 | |
| | | | | | | | | |
Written Option(3)
Number of Contracts | | Notional
Amount | | Exercise
Price | | Expiration Date | | Description | | Unrealized
Appreciation | |
(25) | | $ | 2,500,000 | | $ | 110 | | 3/19/08 | | U.S. Treasury 10 year future | | $ | 5,789 | |
| | | | | | | | | | | | | | |
The use of futures contracts, swap contracts and written options involves elements of market risk and risks in excess of the amount recognized in the financial statements. The notional value presented above represent the Series’ total exposure in such contracts, whereas only the net unrealized appreciation (depreciation) is reflected in the Series’ net assets.
(1) | See Note 9 in “Notes to Financial Statements.” |
(2) | See Note 11 in “Notes to Financial Statements.” |
(3) | See Note 10 in “Notes to Financial Statements.” |
See accompanying notes
11
Delaware VIP Trust — Delaware VIP Capital Reserves Series
Statement of Operations
Year Ended December 31, 2007
INVESTMENT INCOME: | | | |
Interest | | $ | 1,452,110 | |
Securities lending income | | 13,781 | |
| | 1,465,891 | |
| | | |
EXPENSES: | | | |
Management fees | | 181,307 | |
Distribution expenses – Service Class | | 43,106 | |
Accounting and administration expenses | | 14,503 | |
Audit and tax | | 12,573 | |
Dividend disbursing and transfer agent fees and expenses | | 9,254 | |
Pricing fees | | 8,770 | |
Custodian fees | | 8,359 | |
Reports and statements to shareholders | | 7,230 | |
Legal fees | | 4,510 | |
Trustees’ fees | | 1,717 | |
Insurance fees | | 1,037 | |
Consulting fees | | 664 | |
Trustees’ expenses | | 215 | |
Dues and services | | 123 | |
Taxes (other than taxes on income) | | 116 | |
| | 293,484 | |
Less waiver of distribution expenses – Service Class | | (7,185 | ) |
Less expense paid indirectly | | (2,536 | ) |
Total operating expenses | | 283,763 | |
| | | |
NET INVESTMENT INCOME | | 1,182,128 | |
| | | |
NET REALIZED AND UNREALIZED GAIN (LOSS) ON INVESTMENTS AND FOREIGN CURRENCIES: | | | |
Net realized gain (loss) on: | | | |
Investments | | 224,941 | |
Foreign currencies | | 46,524 | |
Futures contracts | | (41,871 | ) |
Options written | | 10,129 | |
Swap contracts | | 58,641 | |
Net realized gain | | 298,364 | |
Net change in unrealized appreciation/depreciation of investments and foreign currencies | | 62,473 | |
| | | |
NET REALIZED AND UNREALIZED GAIN ON
INVESTMENTS AND FOREIGN CURRENCIES | | 360,837 | |
| | | |
NET INCREASE IN NET ASSETS RESULTING
FROM OPERATIONS | | $ | 1,542,965 | |
Delaware VIP Trust — Delaware VIP Capital Reserves Series
Statements of Changes in Net Assets
| | Year Ended | |
| | 12/31/07 | | 12/31/06 | |
INCREASE (DECREASE) IN NET ASSETS FROM OPERATIONS: | | | | | |
Net investment income | | $ | 1,182,128 | | $ | 1,337,119 | |
Net realized gain (loss) on investments and foreign currencies | | 298,364 | | (113,807 | ) |
Net change in unrealized appreciation/ depreciation of investments and foreign currencies | | 62,473 | | 275,106 | |
Net increase in net assets resulting from operations | | 1,542,965 | | 1,498,418 | |
| | | | | |
DIVIDENDS AND DISTRIBUTIONS TO SHAREHOLDERS FROM: | | | | | |
Net investment income: | | | | | |
Standard Class | | (1,047,814 | ) | (1,090,179 | ) |
Service Class | | (652,548 | ) | (379,335 | ) |
| | (1,700,362 | ) | (1,469,514 | ) |
| | | | | |
CAPITAL SHARE TRANSACTIONS: | | | | | |
Proceeds from shares sold: | | | | | |
Standard Class | | 7,597,552 | | 30,958,997 | |
Service Class | | 15,714,176 | | 21,727,142 | |
Net asset value of shares issued upon reinvestment of dividends and distributions: | | | | | |
Standard Class | | 1,047,814 | | 1,087,085 | |
Service Class | | 643,794 | | 370,622 | |
| | 25,003,336 | | 54,143,846 | |
Cost of shares repurchased: | | | | | |
Standard Class | | (10,287,285 | ) | (33,314,414 | ) |
Service Class | | (8,748,585 | ) | (14,914,594 | ) |
| | (19,035,870 | ) | (48,229,008 | ) |
Increase in net assets derived from capital share transactions | | 5,967,466 | | 5,914,838 | |
| | | | | |
NET INCREASE IN NET ASSETS | | 5,810,069 | | 5,943,742 | |
| | | | | |
NET ASSETS: | | | | | |
Beginning of year | | 34,331,599 | | 28,387,857 | |
End of year (including undistributed net investment income of $37,013 and $4,212, respectively) | | $ | 40,141,668 | | $ | 34,331,599 | |
See accompanying notes
12
Delaware VIP Trust — Delaware VIP Capital Reserves Series
Financial Highlights
Selected data for each share of the Series outstanding throughout each period were as follows:
| | Delaware VIP Capital Reserves Series Standard Class | |
| | Year Ended | |
| | 12/31/07 | | 12/31/06 | | 12/31/05 | | 12/31/04 | | 12/31/03 | |
| | | | | | | | | | | |
Net asset value, beginning of period | | $ | 9.710 | | $ | 9.710 | | $ | 9.940 | | $ | 10.020 | | $ | 9.970 | |
| | | | | | | | | | | |
Income (loss) from investment operations: | | | | | | | | | | | |
Net investment income(1) | | 0.324 | | 0.396 | | 0.355 | | 0.356 | | 0.329 | |
Net realized and unrealized gain (loss) on investments and foreign currencies | | 0.099 | | 0.038 | | (0.180 | ) | 0.004 | | 0.125 | |
Total from investment operations | | 0.423 | | 0.434 | | 0.175 | | 0.360 | | 0.454 | |
| | | | | | | | | | | |
Less dividends and distributions from: | | | | | | | | | | | |
Net investment income | | (0.463 | ) | (0.434 | ) | (0.405 | ) | (0.440 | ) | (0.404 | ) |
Total dividends and distributions | | (0.463 | ) | (0.434 | ) | (0.405 | ) | (0.440 | ) | (0.404 | ) |
| | | | | | | | | | | |
Net asset value, end of period | | $ | 9.670 | | $ | 9.710 | | $ | 9.710 | | $ | 9.940 | | $ | 10.020 | |
| | | | | | | | | | | |
Total return(2) | | 4.46 | % | 4.57 | % | 1.79 | % | 3.66 | % | 4.63 | % |
| | | | | | | | | | | |
Ratios and supplemental data: | | | | | | | | | | | |
Net assets, end of period (000 omitted) | | $ | 20,880 | | $ | 22,626 | | $ | 23,895 | | $ | 25,955 | | $ | 34,077 | |
Ratio of expenses to average net assets | | 0.68 | % | 0.71 | % | 0.71 | % | 0.62 | % | 0.63 | % |
Ratio of net investment income to average net assets | | 3.36 | % | 4.10 | % | 3.61 | % | 3.57 | % | 3.36 | % |
Portfolio turnover | | 170 | % | 318 | % | 259 | % | 252 | % | 438 | % |
(1) | The average shares outstanding method has been applied for per share information. |
(2) | Total investment return is based on the change in net asset value of a share during the period and assumes reinvestment of dividends and distributions at net asset value. |
See accompanying notes
13
Selected data for each share of the Series outstanding throughout each period were as follows:
| | Delaware VIP Capital Reserves Series Service Class | |
| | Year Ended | |
| | 12/31/07 | | 12/31/06 | | 12/31/05 | | 12/31/04 | | 12/31/03 | |
| | | | | | | | | | | |
Net asset value, beginning of period | | $ | 9.650 | | $ | 9.650 | | $ | 9.900 | | $ | 10.000 | | $ | 9.970 | |
| | | | | | | | | | | |
Income (loss) from investment operations: | | | | | | | | | | | |
Net investment income(1) | | 0.300 | | 0.372 | | 0.331 | | 0.333 | | 0.308 | |
Net realized and unrealized gain (loss) on investments and foreign currencies | | 0.099 | | 0.037 | | (0.200 | ) | (0.017 | ) | 0.105 | |
Total from investment operations | | 0.399 | | 0.409 | | 0.131 | | 0.316 | | 0.413 | |
| | | | | | | | | | | |
Less dividends and distributions from: | | | | | | | | | | | |
Net investment income | | (0.439 | ) | (0.409 | ) | (0.381 | ) | (0.416 | ) | (0.383 | ) |
Total dividends and distributions | | (0.439 | ) | (0.409 | ) | (0.381 | ) | (0.416 | ) | (0.383 | ) |
| | | | | | | | | | | |
Net asset value, end of period | | $ | 9.610 | | $ | 9.650 | | $ | 9.650 | | $ | 9.900 | | $ | 10.000 | |
| | | | | | | | | | | |
Total return(2) | | 4.23 | % | 4.34 | % | 1.35 | % | 3.23 | % | 4.21 | % |
| | | | | | | | | | | |
Ratios and supplemental data: | | | | | | | | | | | |
Net assets, end of period (000 omitted) | | $ | 19,262 | | $ | 11,706 | | $ | 4,493 | | $ | 7 | | $ | 6 | |
Ratio of expenses to average net assets | | 0.93 | % | 0.96 | % | 0.96 | % | 0.87 | % | 0.85 | % |
Ratio of expenses to average net assets prior to expense limitation and expenses paid indirectly | | 0.98 | % | 1.01 | % | 1.01 | % | 0.92 | % | 0.88 | % |
Ratio of net investment income to average net assets | | 3.11 | % | 3.85 | % | 3.36 | % | 3.32 | % | 3.14 | % |
Ratio of net investment income to average net assets prior to expense limitation and expenses paid indirectly | | 3.06 | % | 3.78 | % | 3.31 | % | 3.27 | % | 3.11 | % |
Portfolio turnover | | 170 | % | 318 | % | 259 | % | 252 | % | 438 | % |
(1) | The average shares outstanding method has been applied for per share information. |
(2) | Total investment return is based on the change in net asset value of a share during the period and assumes reinvestment of dividends and distributions at net asset value. Total investment return reflects a waiver by the distributor. Performance would have been lower had the waiver not been in effect. |
See accompanying notes
14
Delaware VIP Trust — Delaware VIP Capital Reserves Series
Notes to Financial Statements
December 31, 2007
Delaware VIP Trust (Trust) is organized as a Delaware statutory trust and offers 14 series: Delaware VIP Balanced Series, Delaware VIP Capital Reserves Series, Delaware VIP Cash Reserve Series, Delaware VIP Diversified Income Series, Delaware VIP Emerging Markets Series, Delaware VIP Growth Opportunities Series, Delaware VIP High Yield Series, Delaware VIP International Value Equity Series, Delaware VIP REIT Series, Delaware VIP Select Growth Series, Delaware VIP Small Cap Value Series, Delaware VIP Trend Series, Delaware VIP U.S. Growth Series and Delaware VIP Value Series. These financial statements and the related notes pertain to Delaware VIP Capital Reserves Series (Series). The Trust is an open-end investment company. The Series is considered diversified under the Investment Company Act of 1940, as amended, and offers Standard Class and Service Class shares. The Standard Class shares do not carry a 12b-1 fee and the Service Class shares carry a 12b-1 fee. The shares of the Series are sold only to separate accounts of life insurance companies.
The investment objective of the Series is to seek a high, stable level of current income while attempting to minimize fluctuations in principal and provide maximum liquidity.
1. Significant Accounting Policies
The following accounting policies are in accordance with U.S. generally accepted accounting principles and are consistently followed by the Series.
Security Valuation—U.S. government and agency securities are valued at the mean between the bid and asked prices. Other long-term debt securities, credit default swap contracts and interest rate swap contracts are valued by an independent pricing service or broker and such prices are believed to reflect the fair value of such securities. Short-term debt securities having less than 60 days to maturity are valued at amortized cost, which approximates market value. Securities lending collateral, which is invested in a collective investment vehicle, is valued at unit value per share. Foreign currency exchange contracts are valued at the mean between the bid and asked prices of the contracts. Interpolated values are derived when the settlement date of the contract is an interim date for which quotations are not available. Futures contracts and options on futures contracts are valued at the daily quoted settlement prices. Generally, index swap contracts and other securities and assets for which market quotations are not readily available are valued at fair value as determined in good faith under the direction of the Series’ Board of Trustees. In determining whether market quotations are readily available or fair valuation will be used, various factors will be taken into consideration, such as market closures, aftermarket trading, or significant events after local market trading (e.g., government actions or pronouncements, trading volume or volatility on markets, exchanges among dealers, or news events).
In September 2006, the Financial Accounting Standards Board (FASB) issued FASB Statement No. 157 “Fair Value Measurements” (Statement 157). Statement 157 establishes a framework for measuring fair value in U.S. generally accepted accounting principles, clarifies the definition of fair value within that framework, and expands disclosures about the use of fair value measurements. Statement 157 is intended to increase consistency and comparability among fair value estimates used in financial reporting. Statement 157 is effective for fiscal years beginning after November 15, 2007. Management does not expect the adoption of Statement 157 to have a material impact on the amounts reported in the financial statements.
Federal Income Taxes—The Series intends to continue to qualify for federal income tax purposes as a regulated investment company under Subchapter M of the Internal Revenue Code of 1986, as amended, and make the requisite distributions to shareholders. Accordingly, no provision for federal income taxes has been made in the financial statements.
Effective June 29, 2007, the Series adopted FASB Interpretation No. 48 “Accounting for Uncertainty in Income Taxes” (FIN 48). FIN 48 provides guidance for how uncertain tax positions should be recognized, measured, presented and disclosed in the financial statements. FIN 48 requires the evaluation of tax positions taken or expected to be taken in the course of preparing the Series’ tax returns to determine whether the tax positions are “more-likely-than-not” of being sustained by the applicable tax authority. Tax positions not deemed to meet the more-likely-than-not threshold are recorded as a tax benefit or expense in the current year. The adoption of FIN 48 did not result in the recording of any tax benefit or expense in the current period.
Class Accounting—Investment income and common expenses are allocated to the classes of the Series on the basis of “settled shares” of each class in relation to the net assets of the Series. Realized and unrealized gain (loss) on investments is allocated to the classes of the Series on the basis of daily net assets of each class. Distribution expenses relating to a specific class are charged directly to that class.
Repurchase Agreements—The Series may invest in a pooled cash account along with members of the Delaware Investments® Family of Funds pursuant to an exemptive order issued by the Securities and Exchange Commission. The aggregate daily balance of the pooled cash account is invested in repurchase agreements secured by obligations of the U.S. government. The respective collateral is held by the Series’ custodian bank until the maturity of the respective repurchase agreements. Each repurchase agreement is at least 102% collateralized. However, in the event of default or bankruptcy by the counterparty to the agreement, realization of the collateral may be subject to legal proceedings. At December 31, 2007, the Series held no investments in repurchase agreements.
Use of Estimates—The preparation of financial statements in conformity with U.S. generally accepted accounting principles requires management to make estimates and assumptions that affect the reported amounts of assets and liabilities at the date of the financial statements and the reported amounts of revenues and expenses during the reporting period. Actual results could differ from those estimates.
Other—Expenses directly attributable to the Series are charged directly to the Series. Other expenses common to various funds within the Delaware Investments® Family of Funds are generally allocated amongst such funds on the basis of average net assets. Management fees and some other expenses are paid monthly. Security transactions are recorded on the date the securities are purchased or sold (trade date) for financial reporting purposes. Costs used in calculating realized gains and losses on the sale of investment securities are those of the specific securities sold. Interest income is recorded on the accrual basis. Discounts and premiums are amortized to interest income over the lives of the respective securities. Realized gains (losses) on paydowns of mortgage- and asset-backed securities are classified as interest income.
15
Delaware VIP Capital Reserves Series
Notes to Financial Statements (continued)
1. Significant Accounting Policies (continued)
The Series declares dividends daily from net investment income and pays such dividends monthly and declares and pays distributions from net realized gain on investments, if any, following the close of the fiscal year.
The Series may receive earnings credits from its custodian when positive cash balances are maintained, which are used to offset custody fees. The expense paid under this arrangement is included in custodian fees on the Statement of Operations with the corresponding expense offset shown as “expense paid indirectly.”
2. Investment Management, Administration Agreements and Other Transactions with Affiliates
In accordance with the terms of its investment management agreement, the Series pays Delaware Management Company (DMC), a series of Delaware Management Business Trust and the investment manager, an annual fee which is calculated daily at the rate of 0.50% on the first $500 million of average daily net assets of the Series, 0.475% on the next $500 million, 0.45% on the next $1.5 billion, and 0.425% on average daily net assets in excess of $2.5 billion.
Prior to May 1, 2007, DMC had contractually agreed to waive that portion, if any, of its management fee and reimburse the Series to the extent necessary to ensure that total annual operating expenses, exclusive of taxes, interest, brokerage fees, inverse floater program expenses, 12b-1 plan expenses, certain insurance costs and non-routine expenses or costs including, but not limited to, those relating to reorganizations, litigation, conducting shareholder meetings, and liquidations, did not exceed 0.70% of average daily net assets of the Series. No reimbursement was due for the year ended December 31, 2007.
Effective October 1, 2007, Delaware Service Company, Inc. (DSC), an affiliate of DMC, provides fund accounting and financial administration oversight services to the Series. For these services, the Series pays DSC fees based on the aggregate daily net assets of the Delaware Investments® Family of Funds at the following annual rate: 0.0050% of the first $30 billion; 0.0045% of the next $10 billion; 0.0040% of the next $10 billion; and 0.0025% of aggregate average daily net assets in excess of $50 billion. The fees payable to DSC under the service agreement described above are allocated among all funds in the Delaware Investments® Family of Funds on a relative net asset value basis. Prior to October 1, 2007, DSC provided fund accounting and administrative services to the Series and received a fee at an annual rate of 0.04% of average daily net assets. For the year ended December 31, 2007, the Series was charged $11,144 for these services.
DSC also provides dividend disbursing and transfer agency services. The Series pays DSC a monthly fee based on the number of shareholder accounts for dividend disbursing and transfer agent services.
Pursuant to a distribution agreement and distribution plan, the Series pays Delaware Distributors, L.P. (DDLP), the distributor and an affiliate of DMC, an annual distribution and service fee not to exceed 0.30% of the average daily net assets of the Service Class shares. DDLP has contracted to waive distribution and service fees through April 30, 2008 in order to prevent distribution and service fees of the Service Class shares from exceeding 0.25% of average daily net assets. Standard Class shares pay no distribution and service expenses.
At December 31, 2007, the Series had liabilities payable to affiliates as follows:
Investment
Management
Fee Payable to
DMC | | Dividend Disbursing,
Transfer Agent
Fees and Other Expenses
Payable to DSC | | Distribution
Fee Payable
to DDLP | | Other
Expenses
Payable
to DMC
and Affiliates* | |
$ | 16,730 | | $ | 1,445 | | $ | 3,955 | | $ | 3,673 | |
| | | | | | | | | | | |
* | DMC, as part of its administrative services, pays operating expenses on behalf of the Series and is reimbursed on a periodic basis. Such expenses include items such as printing of shareholder reports, fees for audit, legal and tax services, custodian fees and trustees’ fees. |
As provided in the investment management agreement, the Series bears the cost of certain legal and tax services, including internal legal and tax services provided to the Series by DMC and/or its affiliates’ employees. For the year ended December 31, 2007, the Series was charged $1,986 for internal legal and tax services provided by DMC and/or its affiliates’ employees.
Trustees’ fees include expenses accrued by the Series for each Trustee’s retainer and per meeting fees. Certain officers of DMC, DSC and DDLP are officers and/or Trustees of the Trust. These officers and Trustees are paid no compensation by the Series.
3. Investments
For the year ended December 31, 2007, the Series made purchases and sales of investment securities other than short-term investments as follows:
Purchases other than U.S. government securities | | $ | 23,660,245 | |
Purchases of U.S. government securities | | 38,462,782 | |
Sales other than U.S. government securities | | 25,165,083 | |
Sales of U.S. government securities | | 32,870,418 | |
16
Delaware VIP Capital Reserves Series
Notes to Financial Statements (continued)
3. Investments (continued)
At December 31, 2007, the cost of investments for federal income tax purposes and unrealized appreciation (depreciation) for the Series were as follows:
Cost of
Investments | | Aggregate
Unrealized
Appreciation | | Aggregate
Unrealized
Depreciation | | Net Unrealized
Depreciation | |
$ | 48,145,132 | | $ | 219,761 | | $ | (302,849 | ) | $ | (83,088 | ) |
| | | | | | | | | | | |
4. Dividend and Distribution Information
Income and long-term capital gain distributions are determined in accordance with federal income tax regulations, which may differ from U.S. generally accepted accounting principles. Additionally, gains (losses) on foreign currency transactions and net short-term gains on sales of investment securities are treated as ordinary income for federal income tax purposes. The tax character of dividends and distributions paid during the years ended December 31, 2007 and 2006 was as follows:
| | Year
Ended
12/31/07 | | Year
Ended
12/31/06 | |
Ordinary income | | $ | 1,700,362 | | $ | 1,469,514 | |
| | | | | | | |
5. Components of Net Assets on a Tax Basis
As of December 31, 2007, the components of net assets on a tax basis were as follows:
Shares of beneficial interest | | $ | 42,106,673 | |
Undistributed ordinary income | | 48,035 | |
Capital loss carryforwards | | (1,917,527 | ) |
Post-October losses | | (61,495 | ) |
Other temporary differences | | (1,785 | ) |
Unrealized depreciation of investments, swap contracts and foreign currencies | | (32,233 | ) |
Net assets | | $ | 40,141,668 | |
The differences between book basis and tax basis components of net assets are primarily attributable to tax deferral of losses on wash sales, tax treatment of credit default swaps, mark-to-market of options, mark-to-market of futures contracts, tax treatment of market discount and premium on debt instruments and contingent payment debt instruments.
Post-October losses represent losses realized on investments from November 1, 2007 through December 31, 2007 that, in accordance with federal income tax regulations, the Series has elected to defer and treat as having arisen in the following fiscal year.
For financial reporting purposes, capital accounts are adjusted to reflect the tax character of permanent book/tax differences. Reclassifications are primarily due to tax treatment of gain (loss) on foreign currency transactions, tax treatment of interest rate and credit default swaps, paydown gains (losses) on mortgage- and asset-backed securities and market discount and premium on certain debt instruments. Results of operations and net assets were not affected by these reclassifications. For the year ended December 31, 2007, the Series recorded the following reclassifications:
Undistributed
Net
Investment Income | | Accumulated
Net Realized
(Loss) | |
$ | 551,035 | | $ | (551,035 | ) |
| | | | | |
For federal income tax purposes, capital loss carryforwards may be carried forward and applied against future capital gains. Capital loss carryforwards remaining at December 31, 2007 will expire as follows: $1,132,035 expires in 2008; $82,894 expires in 2010; $226,584 expires in 2013; and $238,048 expires in 2014 and $237,966 expires in 2015.
17
Delaware VIP Capital Reserves Series
Notes to Financial Statements (continued)
6. Capital Shares
Transactions in capital shares were as follows:
| | Year
Ended
12/31/07 | | Year
Ended
12/31/06 | |
Shares sold: | | | | | |
Standard Class | | 784,695 | | 3,206,194 | |
Service Class | | 1,634,844 | | 2,258,522 | |
Shares issued upon reinvestment of dividends and distributions: | | | | | |
Standard Class | | 108,370 | | 112,240 | |
Service Class | | 66,936 | | 38,492 | |
| | 2,594,845 | | 5,615,448 | |
Shares repurchased: | | | | | |
Standard Class | | (1,063,367 | ) | (3,448,638 | ) |
Service Class | | (909,573 | ) | (1,549,400 | ) |
| | (1,972,940 | ) | (4,998,038 | ) |
Net increase | | 621,905 | | 617,410 | |
7. Line of Credit
The Series, along with certain other funds in the Delaware Investments® Family of Funds (Participants), participates in a $225,000,000 revolving line of credit facility to be used for temporary or emergency purposes as an additional source of liquidity to fund redemptions of investor shares. The Participants are charged an annual commitment fee, which is allocated across the Participants on the basis of each Participant’s allocation of the entire facility. The Participants may borrow up to a maximum of one third of their net assets under the agreement. The Series had no amounts outstanding as of December 31, 2007, or at any time during the year then ended.
8. Foreign Currency Exchange Contracts
The Series may enter into foreign currency exchange contracts and foreign cross currency exchange contracts as a way of managing foreign exchange rate risk. The Series may enter into these contracts to fix the U.S. dollar value of a security that it has agreed to buy or sell for the period between the date the trade was entered into and the date the security is delivered and paid for. The Series may also use these contracts to hedge the U.S. dollar value of securities it already owns that are denominated in foreign currencies. The change in market value is recorded as an unrealized gain or loss. When the contract is closed, a realized gain or loss is recorded equal to the difference between the value of the contract at the time it was opened and the value at the time it was closed.
The use of foreign currency exchange contracts and foreign cross currency exchange contracts does not eliminate fluctuations in the underlying prices of the securities, but does establish a rate of exchange that can be achieved in the future. Although foreign currency exchange contracts limit the risk of loss due to a decline in the value of the hedged currency, they also limit any potential gain that might result should the value of the currency increase. In addition, the Series could be exposed to risks if the counterparties to the contracts are unable to meet the terms of their contracts. There were no foreign currency exchange contracts outstanding at December 31, 2007.
9. Futures Contracts
The Series may invest in financial futures contracts to hedge its existing portfolio securities against fluctuations in fair value caused by changes in prevailing market interest rates. Upon entering into a futures contract, the Series deposits cash or pledges U.S. government securities to a broker, equal to the minimum “initial margin” requirements of the exchange on which the contract is traded. Subsequent payments are received from the broker or paid to the broker each day, based on the daily fluctuation in the market value of the contract. These receipts or payments are known as “variation margin” and are recorded daily by the Series as unrealized gains or losses until the contracts are closed. When the contracts are closed, the Series records a realized gain or loss equal to the difference between the value of the contract at the time it was opened and the value at the time it was closed. Risks of entering into futures contracts includes potential imperfect correlation between the futures contracts and the underlying securities and the possibility of an illiquid secondary market for these instruments. The unrealized gain (loss) is included in receivables and other assets net of liabilities on the Statement of Net Assets.
10. Options Written
During the year ended December 31, 2007, the Series entered into options contracts in accordance with its investment objectives. When the Series writes an option, a premium is received and a liability is recorded and adjusted on a daily basis to reflect the current market value of the options written. Premiums received from writing options that expire unexercised are treated by the Series on the expiration date as realized gains. The difference between the premium received and the amount paid on effecting a closing purchase transaction, including brokerage commissions, is treated as realized gain or loss. If a call option is exercised, the premium is added to the proceeds from the sale of the underlying security in determining whether the Series has a realized gain or loss. If a put option is exercised, the premium reduces the cost basis of the securities purchased by the Series. The Series, as writer of an option, bears the market risk of an unfavorable change in the price of the security underlying the written option.
18
Delaware VIP Capital Reserves Series
Notes to Financial Statements (continued)
10. Options Written (continued)
Transactions in options written during the year ended December 31, 2007 for the Series were as follows:
| | Number of contracts | | Premiums | |
Options outstanding at December 31, 2006 | | — | | $ | — | |
Options written | | 85 | | 40,384 | |
Options terminated in closing purchase transactions | | (60 | ) | (28,346 | ) |
Options outstanding at December 31, 2007 | | 25 | | $ | 12,038 | |
11. Swap Contracts
The Series may enter into interest rate swap contracts, index swap contracts and credit default swap contracts (CDS) in accordance with its investment objectives. The Series may use interest rate swaps to adjust the Series’ sensitivity to interest rates or to hedge against changes in interest rates. Index swaps may be used to gain exposure to markets that the Series invests in, such as the corporate bond market. The Series may also use index swaps as a substitute for future or options contracts if such contracts are not directly available to the Series on favorable terms. The Series may enter into CDS contracts in order to hedge against a credit event, to enhance total return or to gain exposure to certain securities or markets.
An interest rate swap involves payments received by the Series from another party based on a variable or floating interest rate, in return for making payments based on a fixed interest rate. An interest rate swap can also work in reverse with the Series receiving payments based on a fixed interest rate and making payments based on a variable or floating interest rate. Interest rate swaps may be used to adjust the Series’ sensitivity to interest rates or to hedge against changes in interest rates. Periodic payments on such contracts are accrued daily and recorded as unrealized appreciation/depreciation on swap contracts. Upon periodic payment/receipt or termination of the contract, such amounts are recorded as realized gains or losses on swap contracts.
Index swaps involve commitments to pay interest in exchange for a market-linked return based on a notional amount. To the extent the total return of the security, instrument or basket of instruments underlying the transaction exceeds the offsetting interest obligation, the Series will receive a payment from the counterparty. To the extent the total return of the security, instrument or basket of instruments underlying the transaction falls short of the offsetting interest obligation, the Series will make a payment to the counterparty. The change in value of swap contracts outstanding, if any, is recorded as unrealized appreciation or depreciation daily. A realized gain or loss is recorded on maturity or termination of the swap contract.
A CDS contract is a risk-transfer instrument through which one party (purchaser of protection) transfers to another party (seller of protection) the financial risk of a credit event, as it relates to a particular reference security or basket of securities (such as an index). In exchange for the protection offered by the seller of protection, the purchaser of protection agrees to pay the seller of protection a periodic amount at a stated rate that is applied to the notional amount of the CDS contract. In addition, an upfront payment may be made or received by the Series in connection with an unwinding or assignment of a CDS contract. Upon the occurrence of a credit event, the seller of protection would pay the par (or other agreed-upon) value of the referenced security (or basket of securities) to the counterparty.
During the year ended December 31, 2007, the Series entered into CDS contracts as a purchaser of protection. Periodic payments on such contracts are accrued daily and recorded as unrealized losses on swap contracts. Upon payment, such amounts are recorded as realized losses on swap contracts. Upfront payments made or received in connection with CDS contracts are amortized over the expected life of the CDS contracts as unrealized losses (gains) on swap contracts. The change in value of CDS contracts is recorded as unrealized appreciation or depreciation daily. A realized gain or loss is recorded upon a credit event (as defined in the CDS agreement) or the maturity or termination of the agreement. For the year ended December 31, 2007, the Series did not enter into any CDS contracts as a seller of protection.
Credit default swaps may involve greater risks than if the Series had invested in the referenced obligation directly. Credit default swaps are subject to general market risk, liquidity risk, counterparty risk and credit risk. If the Series enters into a CDS contract as a purchaser of protection and no credit event occurs, its exposure is limited to the periodic payments previously made to the counterparty.
Because there is no organized market for swap contracts, the value of open swaps may differ from that which would be realized in the event the Series terminated its position in the agreement. Risks of entering into these agreements include the potential inability of the counterparty to meet the terms of the contracts. This type of risk is generally limited to the amount of favorable movements in the value of the underlying security, instrument, or basket of instruments, if any, at the day of default. Risks also arise from potential losses from adverse market movements and such losses could exceed the unrealized amounts shown above.
19
Delaware VIP Capital Reserves Series
Notes to Financial Statements (continued)
12. Securities Lending
The Series, along with other funds in the Delaware Investments® Family of Funds, may lend its securities pursuant to a security lending agreement (Lending Agreement) with Mellon Bank, N.A. (Mellon). With respect to each loan, if the aggregate market value of the collateral held on any business day is less than the aggregate market value of the securities which are the subject of such loan, the borrower will be notified to provide additional collateral not less than the applicable collateral requirements. Cash collateral received is invested in a collective investment vehicle (Collective Trust) established by Mellon for the purpose of investment on behalf of clients participating in its securities lending programs. The Collective Trust invests in fixed income securities, with a weighted average maturity not to exceed 90 days, rated in one of the top two tiers by Standard & Poor’s Ratings Group or Moody’s Investors Service, Inc. or repurchase agreements collateralized by such securities. However, in the event of default or bankruptcy by the lending agent, realization and/or retention of the collateral may be subject to legal proceedings. In the event the borrower fails to return loaned securities and the collateral received is insufficient to cover the value of the loaned securities and provided such collateral shortfall is not the result of investment losses, the lending agent has agreed to pay the amount of the shortfall to the Series, or at the discretion of the lending agent, replace the loaned securities. The Series continues to record dividends or interest, as applicable, on the securities loaned and is subject to change in value of the securities loaned that may occur during the term of the loan. The Series has the right under the Lending Agreement to recover the securities from the borrower on demand. With respect to security loans collateralized by U.S. Treasury obligations, the Series receives a fee from the securities lending agent. With respect to security loans collateralized by cash collateral, the earnings from the collateral investments are shared among the Series, the security lending agent and the borrower. The Series records securities lending income net of allocations to the security lending agent and the borrower.
At December 31, 2007, the market value of the securities on loan was $8,209,072, for which cash collateral was received and invested in accordance with the Lending Agreement. Such investments are presented on the Statement of Net Assets under the caption “Securities Lending Collateral.”
13. Credit and Market Risk
The Series invests in fixed income securities whose value is derived from an underlying pool of mortgages or consumer loans. The value of these securities is sensitive to changes in economic conditions, including delinquencies and/or defaults, and may be adversely affected by shifts in the market’s perception of the issuers and changes in interest rates. Investors receive principal and interest payments as the underlying mortgages and consumer loans are paid back. Some of these securities are collateralized mortgage obligations (CMOs). CMOs are debt securities issued by U.S. government agencies or by financial institutions and other mortgage lenders, which are collateralized by a pool of mortgages held under an indenture. Prepayment of mortgages may shorten the stated maturity of the obligations and can result in a loss of premium, if any has been paid. Certain of these securities may be stripped (securities which provide only the principal or interest feature of the underlying security). The yield to maturity on an interest-only CMO is extremely sensitive not only to changes in prevailing interest rates, but also to the rate of principal payments (including prepayments) on the related underlying mortgage assets. A rapid rate of principal payments may have a material adverse affect on the Series’ yield to maturity. If the underlying mortgage assets experience greater than anticipated prepayments of principal, the Series may fail to recoup its initial investment in these securities even if the securities are rated in the highest rating categories.
The Series may invest up to 15% of its net assets in illiquid securities, which may include securities with contractual restrictions on resale, securities exempt from registration under Rule 144A of the Securities Act of 1933, as amended, and other securities which may not be readily marketable. The relative illiquidity of these securities may impair the Series from disposing of them in a timely manner and at a fair price when it is necessary or desirable to do so. While maintaining oversight, the Series’ Board of Trustees has delegated to DMC the day-to-day functions of determining whether individual securities are liquid for purposes of the Series’ limitation on investments in illiquid assets. Rule 144A and illiquid securities have been identified on the Statement of Net Assets.
14. Contractual Obligations
The Series enters into contracts in the normal course of business that contain a variety of indemnifications. The Series’ maximum exposure under these arrangements is unknown. However, the Series has not had prior claims or losses pursuant to these contracts. Management has reviewed the Series’ existing contracts and expects the risk of loss to be remote.
15. Tax Information (Unaudited)
For the fiscal year ended December 31, 2007, the Series designates dividends and distributions paid during the year as follows:
(A)
Long-Term
Capital Gain
Distributions
(Tax Basis) | | (B)
Ordinary
Income
Distributions
(Tax Basis) | | Total
Distributions
(Tax Basis) | |
— | | 100 | % | 100 | % |
(A) and (B) are based on a percentage of the Series’ total distributions.
16. Change in Custodian
On July 26, 2007, Mellon, One Mellon Center, Pittsburgh, PA 15258, became the Series’ custodian.
20
Delaware VIP Trust — Delaware VIP Capital Reserves Series
Report of Independent Registered Public Accounting Firm
To the Shareholders and Board of Trustees
Delaware VIP Trust—Delaware VIP Capital Reserves Series
We have audited the accompanying statement of net assets of the Delaware VIP Capital Reserves Series (one of the series constituting Delaware VIP Trust) (the “Series”) as of December 31, 2007, and the related statement of operations for the year then ended, the statements of changes in net assets for each of the two years in the period then ended, and the financial highlights for each of the five years in the period then ended. These financial statements and financial highlights are the responsibility of the Series’ management. Our responsibility is to express an opinion on these financial statements and financial highlights based on our audits.
We conducted our audits in accordance with the standards of the Public Company Accounting Oversight Board (United States). Those standards require that we plan and perform the audit to obtain reasonable assurance about whether the financial statements and financial highlights are free of material misstatement. We were not engaged to perform an audit of the Series’ internal control over financial reporting. Our audits included consideration of internal control over financial reporting as a basis for designing audit procedures that are appropriate in the circumstances, but not for the purpose of expressing an opinion on the effectiveness of the Series’ internal control over financial reporting. Accordingly, we express no such opinion. An audit also includes examining, on a test basis, evidence supporting the amounts and disclosures in the financial statements and financial highlights, assessing the accounting principles used and significant estimates made by management, and evaluating the overall financial statement presentation. Our procedures included confirmation of securities owned as of December 31, 2007, by correspondence with the custodian and brokers or by other appropriate auditing procedures where replies from brokers were not received. We believe that our audits provide a reasonable basis for our opinion.
In our opinion, the financial statements and financial highlights referred to above present fairly, in all material respects, the financial position of the Delaware VIP Capital Reserves Series of Delaware VIP Trust at December 31, 2007, the results of its operations for the year then ended, the changes in its net assets for each of the two years in the period then ended, and its financial highlights for each of the five years in the period then ended, in conformity with U.S. generally accepted accounting principles.
Philadelphia, Pennsylvania
February 14, 2008
The Series files its complete schedule of portfolio holdings with the Securities and Exchange Commission (Commission) for the first and third quarters of each fiscal year on Form N-Q. The Series’ Forms N-Q, as well as a description of the policies and procedures that the Series uses to determine how to vote proxies (if any) relating to portfolio securities is available without charge (i) upon request, by calling 800 523-1918; and (ii) on the Commission’s website at http://www.sec.gov. In addition, a description of the policies and procedures that the Series uses to determine how to vote proxies (if any) relating to portfolio securities is available without charge on the Delaware Investments® Funds’ website at http://www.delawareinvestments.com. The Series’ Forms N-Q may be reviewed and copied at the Commission’s Public Reference Room in Washington, DC; information on the operation of the Public Reference Room may be obtained by calling 800 SEC-0330.
Information (if any) regarding how the Series voted proxies relating to portfolio securities during the most recently disclosed
12-month period ended June 30 is available without charge (i) through the Delaware Investments® Funds’ website at http://www.delawareinvestments.com; and (ii) on the Commission’s website at http://www.sec.gov.
21
Delaware Investments® Family of Funds
BOARD OF TRUSTEES/DIRECTORS AND OFFICERS ADDENDUM
A mutual fund is governed by a Board of Trustees/Directors (“Trustees”), which has oversight responsibility for the management of a fund’s business affairs. Trustees establish procedures and oversee and review the performance of the investment manager, the distributor, and others who perform services for the fund. The independent fund trustees, in particular, are advocates for shareholder interests. Each trustee has served in that capacity since he or she was elected to or appointed to the Board of Trustees, and will continue to serve until his or her retirement or the election of a new trustee in his or her place. The following is a list of the Trustees and Officers with certain background and related information.
Name,
Address,
and Birth Date | | Position(s)
Held with
Fund(s) | | Length of Time
Served | | Principal
Occupation(s)
During
Past 5 Years | | Number of
Portfolios in Fund
Complex Overseen
by Trustee
or Officer | | Other
Directorships
Held by
Trustee
or Officer | |
INTERESTED TRUSTEES | | | | | | | | | |
Patrick P. Coyne(1)
2005 Market Street
Philadelphia, PA
19103 April 1963 | | Chairman,
President,
Chief Executive
Officer, and
Trustee | | Chairman and Trustee
since August 16, 2006
President and
Chief Executive Officer
since August 1, 2006 | | Patrick P. Coyne has served in various executive capacities at different times at Delaware Investments.(2) | | 84 | | Director –
Kaydon Corp.
Board of Governors
Member –
Investment Company Institute
(2007 – present)
Member of Investment Committee –
Cradle of
Liberty Council, BSA
(November 2007 –
present)
Finance Committee
Member – St. John
Vianney Roman
Catholic Church
(2007 – present) | |
INDEPENDENT TRUSTEES | | | | | | | | | |
Thomas L. Bennett
2005 Market Street
Philadelphia, PA
19103 October 1947 | | Trustee | | Since
March 2005 | | Private Investor – (March 2004 – Present) Investment Manager – Morgan Stanley & Co. (January 1984 – March 2004) | | 84 | | Director –
Bryn Mawr
Bank Corp. (BMTC) (April 2007 – Present) Chairman of
Investment
Committee –
The Haverford School
(2002 – present) Chairman of
Investment
Committee –
Pennsylvania Academy
of Fine Arts
(2007 – present) Trustee
(2004 – present) Investment Committee
Member –
Pennsylvania
Horticulture Society
(February 2006 –
present) | |
22
Name,
Address,
and Birth Date | | Position(s)
Held with
Fund(s) | | Length of Time
Served | | Principal
Occupation(s)
During
Past 5 Years | | Number of
Portfolios in Fund
Complex Overseen
by Trustee
or Officer | | Other
Directorships
Held by
Trustee
or Officer | |
INDEPENDENT TRUSTEES (CONTINUED) | | | | | | | |
John A. Fry
2005 Market Street
Philadelphia, PA
19103
May 1960 | | Trustee | | Since
January 2001 | | President –
Franklin & Marshall College
(June 2002 – Present)
Executive Vice President –
University of Pennsylvania
(April 1995 – June 2002) | | 84 | | Director –
Community Health
Systems
Director –
Allied Barton
Security Holdings | |
Anthony D. Knerr
2005 Market Street
Philadelphia, PA
19103
December 1938 | | Trustee | | Since
April 1990 | | Founder and Managing Director –
Anthony Knerr & Associates
(Strategic Consulting)
(1990 – Present) | | 84 | | None | |
Lucinda S. Landreth
2005 Market Street
Philadelphia, PA
19103
June 1947 | | Trustee | | Since
March 2005 | | Chief Investment Officer –
Assurant, Inc.
(Insurance)
(2002 – 2004) | | 84 | | None | |
Ann R. Leven
2005 Market Street
Philadelphia, PA
19103
November 1940 | | Trustee | | Since
October 1989 | | Consultant –
ARL Associates
(Financial Planning)
(1983 – Present) | | 84 | | Director and Audit
Committee Member –
Systemax, Inc. | |
Thomas F. Madison
2005 Market Street
Philadelphia, PA
19103
February 1936 | | Trustee | | Since
May 1997 | | President and Chief
Executive Officer –
MLM Partners, Inc.
(Small Business Investing
and Consulting)
(January 1993 – Present) | | 84 | | Director –
CenterPoint Energy
Director and Audit
Committee Member –
Digital River, Inc.
Director and Audit
Committee Member –
Rimage
Corporation
Director and Chair of
Compensation and
Governance &
Nominating
Committees –
Valmont Industries, Inc. | |
Janet L. Yeomans
2005 Market Street
Philadelphia, PA
19103
July 1948
| | Trustee | | Since
April 1999 | | Treasurer
(January 2006 – Present)
Vice President –
Mergers & Acquisitions
(January 2003 – January 2006),
and Vice President
(July 1995 – January 2003)
3M Corporation | | 84 | | None | |
J. Richard Zecher
2005 Market Street
Philadelphia, PA
19103
July 1940
| | Trustee | | Since
March 2003 | | Founder –
Investor Analytics
(Risk Management)
(May 1999 – Present)
Founder –
Sutton Asset Management
(Hedge Fund)
(September 1998 – Present) | | 84 | | Director and Audit
Committee Member –
Investor Analytics
Director and Audit
Committee Member –
Oxigene, Inc. | |
23
Name,
Address,
and Birth Date | | Position(s)
Held with
Fund(s) | | Length of Time
Served | | Principal
Occupation(s)
During
Past 5 Years | | Number of
Portfolios in Fund
Complex Overseen
by Trustee
or Officer | | Other
Directorships
Held by
Trustee
or Officer | |
OFFICERS | | | | | | | | | | | |
David F. Connor
2005 Market Street
Philadelphia, PA
19103
December 1963 | | Vice President,
Deputy General
Counsel, and Secretary | | Vice President since
September 21, 2000
and Secretary
since
October 2005 | | David F. Connor has served as
Vice President and Deputy
General Counsel of Delaware Investments
since 2000. | | 84 | | None(4) | |
Daniel V. Geatens
2005 Market Street
Philadelphia, PA
19103
October 1972 | | Vice President
and Treasurer | | Treasurer
since
October 25, 2007 | | Daniel V. Geatens has served in various capacities
at different times at Delaware Investments. | | 84 | | None(4) | |
David P. O’Connor
2005 Market Street
Philadelphia, PA
19103
February 1966 | | Senior Vice
President,
General Counsel,
and Chief
Legal Officer | | Senior Vice President,
General Counsel, and
Chief Legal Officer
since
October 2005 | | David P. O’Connor has served in
various executive and legal
capacities at different times at
Delaware Investments. | | 84 | | None(4) | |
Richard Salus
2005 Market Street
Philadelphia, PA
19103
October 1963 | | Senior
Vice President
and
Chief Financial
Officer | | Chief Financial
Officer since
November 1, 2006 | | Richard Salus has served in
various executive capacities
at different times at
Delaware Investments. | | 84 | | None(4) | |
(1) | Patrick P. Coyne is considered to be an “Interested Trustee” because he is an executive officer of the Fund’s(s’) investment advisor. |
(2) | Delaware Investments is the marketing name for Delaware Management Holdings, Inc. and its subsidiaries, including the Fund’s(s’) investment advisor, principal underwriter, and its transfer agent. |
(3) | In 1997, several funds managed by Voyageur Fund Managers, Inc. (the “Voyageur Funds”) were incorporated into the Delaware Investments Family of Funds. Mr. Madison served as a director of the Voyageur Funds from 1993 until 1997. |
(4) | David F. Connor, Daniel V. Geatens, David P. O’Connor, and Richard Salus serve in similar capacities for the six portfolios of the Optimum Fund Trust, which have the same investment advisor, principal underwriter, and transfer agent as the registrant. |
The Statement of Additional Information for the Fund(s) includes additional information about the Trustees and Officers and is available, without charge, upon request by calling 800 523-1918.
24
Delaware VIP Trust — Delaware VIP Cash Reserve Series
For the 12-month period ended Dec. 31, 2007, the Delaware VIP Cash Reserve Series returned +4.76% for Standard Class shares, and Service Class shares gained 4.50% (both with all distributions reinvested). By comparison, the U.S. Consumer Price Index gained 4.10% (source: bls.gov).
During the year, the U.S. economy showed signs of slowing. As a result, the U.S. Federal Reserve lowered its target for short-term interest rates. At the Fed’s monetary policy meeting in September, the fed funds rate was lowered by a half percentage point. The Fed later lowered the rate by a quarter percentage point in October and a quarter percentage point in December, leaving it at 4.25% at the end of the year.
A challenging period of market activity in the summer months led in part to the Fed’s actions. During the summer, money funds that owned structured investment vehicles (SIVs) and asset-backed commercial paper suffered as issuers of those securities struggled, and were forced to liquidate their underlying assets.
As a result of this credit market turmoil, yields, which move inversely to price, were driven downward on Treasury securities. Liquidity in the commercial paper market became a concern due to the use of subprime loans as collateral for some asset-backed commercial paper. Commercial paper is short-term corporate debt (due in 270 days or less) that represents the largest publicly traded instruments in the money markets.
Conditions in the money markets improved during the autumn months, but the pronounced negative sentiment remained and generally strengthened investor expectations of additional Fed rate cuts. While falling interest rates can be less than ideal for yield-oriented investors, the Fed’s actions remain dependent on the path of the U.S. economy.
The views expressed are current as of the date of this report and are subject to change.
The performance data quoted below represent past performance; past performance does not guarantee future results. Investment return and principal value will fluctuate so your shares, when redeemed, may be worth more or less than their original cost. Please obtain the performance data for the most recent month end by calling the number noted in the introductory section of this report on the page related to this Series.
You should consider the investment objectives, risks, charges, and expenses of the investment company carefully before investing. The Delaware VIP Cash Reserve Series prospectus contains this and other important information about the Series. To obtain a prospectus, contact the company noted on the page related to this Series in the introductory section of this report, either by phone or through the company Web site. We advise you to read the prospectus carefully before you invest.
Delaware VIP Cash Reserve Series Average annual total returns For periods ended Dec. 31, 2007 | | 1 year | | 5 years | | 10 years | | Lifetime | |
Standard Class shares (commenced operations July 28, 1988) | | +4.76 | % | +2.67 | % | +3.43 | % | +4.33 | % |
| | | | | | | | | |
Service Class shares (commenced operations May 1, 2000) | | +4.50 | % | +2.42 | % | NA | | +2.73 | % |
As disclosed in the Series’ most recent prospectus, expenses for Standard Class and Service Class shares were as follows: The net expense ratios for Standard Class and Service Class shares of the Series were 0.66% and 0.91%, respectively. Total operating expenses for Standard Class and Service Class shares were 0.66% and 0.96%, respectively. Management fees for Standard Class and Service Class shares were 0.45%.
Earnings from a variable annuity or variable life investment compound tax-free until withdrawal and, as a result, no adjustments were made for income taxes.
An expense limitation was in effect for all classes during the periods shown in the Series performance chart above and in the Performance of a $10,000 Investment chart on the next page.
Performance of Service Class shares will vary due to different charges and expenses.
Performance data do not reflect insurance fees related to a variable annuity or variable life investment or the deferred sales charge that would apply to certain withdrawals of investments held for fewer than eight years. Performance shown here would have been reduced if such fees were included and the expense limitation removed. For more information about fees, consult your variable annuity or variable life prospectus.
Investments in variable products involve risk. An investment in the Series is not insured or guaranteed by the Federal Deposit Insurance Corporation or any other government agency. Although the Series seeks to preserve the value of an investment at $1.00 per share, it is possible to lose money by investing in the Series. Adverse conditions may affect the issuer’s ability to pay interest and principal on these securities.
Please read both the contract and underlying prospectus for specific details regarding the product’s risk profile.
1
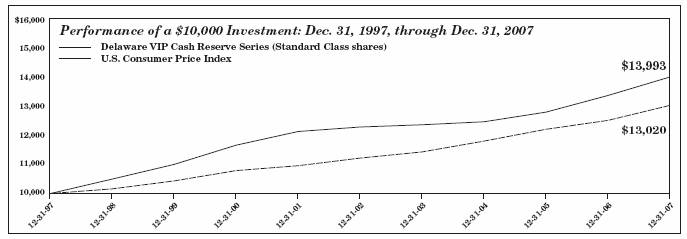
The chart shows a $10,000 investment in the Delaware VIP Cash Reserve Series Standard Class shares for the period from Dec. 31, 1997, through Dec. 31, 2007. Performance of Service Class shares will vary due to different charges and expenses.
The chart also shows $10,000 invested in the U.S. Consumer Price Index for the period from Dec. 31, 1997, through Dec. 31, 2007. The U.S. Consumer Price Index is calculated by the U.S. Department of Labor and measures the rate of consumer price inflation in the United States. An index is unmanaged and does not reflect the costs of operating a mutual fund, such as the costs of buying, selling, and holding securities. You cannot invest directly in an index.
2
Delaware VIP Trust — Delaware VIP Cash Reserve Series
Disclosure of Series Expenses
For the Period July 1, 2007 to December 31, 2007
As a shareholder of the Series, you incur ongoing costs, including management fees; distribution and/or service (12b-1) fees; and other Series expenses. This Example is intended to help you understand your ongoing costs (in dollars) of investing in the Series and to compare these costs with the ongoing costs of investing in other mutual funds.
The Example is based on an investment of $1,000 invested at the beginning of the period and held for the entire period from July 1, 2007 to December 31, 2007.
Actual Expenses
The first section of the table shown, “Actual Series Return,” provides information about actual account values and actual expenses. You may use the information in this section of the table, together with the amount you invested, to estimate the expenses that you paid over the period. Simply divide your account value by $1,000 (for example, an $8,600 account value divided by $1,000 = 8.6), then multiply the result by the number in the first section under the heading entitled “Expenses Paid During Period” to estimate the expenses you paid on your account during the period.
Hypothetical Example for Comparison Purposes
The second section of the table shown, “Hypothetical 5% Return,” provides information about hypothetical account values and hypothetical expenses based on the Series’ actual expense ratio and an assumed rate of return of 5% per year before expenses, which is not the Series’ actual return. The hypothetical account values and expenses may not be used to estimate the actual ending account balance or expenses you paid for the period. You may use this information to compare the ongoing costs of investing in the Series and other funds. To do so, compare the 5% hypothetical example with the 5% hypothetical examples that appear in the shareholder reports of other funds.
Please note that the expenses shown in the table are meant to highlight your ongoing costs only. As a shareholder of the Series, you do not incur any transaction costs, such as sales charges (loads), redemption fees or exchange fees, but shareholders of other funds may incur such costs. Also, the fees related to the variable annuity investment or the deferred sales charge that could apply have not been included. Therefore, the second section of the table is useful in comparing ongoing costs only, and will not help you determine the relative total costs of owning different funds. The Series’ actual expenses shown in the table reflect fee waivers in effect for Service Class shares. The expenses shown in the table assume reinvestment of all dividends and distributions.
Expense Analysis of an Investment of $1,000
| | Beginning
Account
Value
7/1/07 | | Ending
Account
Value
12/31/07 | | Annualized
Expense
Ratios | | Expenses
Paid During
Period
7/1/07 to
12/31/07* | |
Actual Series Return | | | | | | | | | |
Standard Class | | $ | 1,000.00 | | $ | 1,023.40 | | 0.65 | % | $ | 3.32 | |
Service Class | | 1,000.00 | | 1,022.10 | | 0.90 | % | 4.59 | |
Hypothetical 5% Return (5% return before expenses) | | | | | | | | | |
Standard Class | | $ | 1,000.00 | | $ | 1,021.93 | | 0.65 | % | $ | 3.31 | |
Service Class | | 1,000.00 | | 1,020.67 | | 0.90 | % | 4.58 | |
* | “Expenses Paid During Period” are equal to the Series’ annualized expense ratio, multiplied by the average account value over the period, multiplied by 184/365 (to reflect the one-half year period). |
3
Delaware VIP Trust — Delaware VIP Cash Reserve Series
Sector Allocation
As of December 31, 2007
Sector designations may be different than the sector designations presented in other Series materials.
Sector | | Percentage
of Net Assets | |
Certificates of Deposit | | 10.04 | % |
Discounted Commercial Paper | | 79.96 | % |
Colleges and Universities | | 2.44 | % |
Financial Services | | 26.17 | % |
Industrial | | 8.05 | % |
Mortgage Bankers & Brokers | | 41.33 | % |
State Agency | | 1.97 | % |
Floating Rate Notes | | 11.01 | % |
Total Value of Securities | | 101.01 | % |
Liabilities Net of Receivables and Other Assets | | (1.01 | )% |
Total Net Assets | | 100.00 | % |
4
Delaware VIP Trust — Delaware VIP Cash Reserve Series
Statement of Net Assets
December 31, 2007
| | | Principal
Amount | | Value | |
| CERTIFICATES OF DEPOSIT–10.04% | | | | | |
| First Tennessee Bank 4.82% 1/28/08 | | $ | 500,000 | | $ | 500,000 | |
| UBS 5.59% 1/10/08 | | 300,000 | | 300,000 | |
| Westpac Bank 5.19% 1/15/08 | | 500,000 | | 500,000 | |
| Wilmington Trust | | | | | |
| 4.80% 1/8/08 | | 500,000 | | 500,000 | |
| 4.80% 2/20/08 | | 250,000 | | 250,000 | |
| Total Certificates of Deposit
(cost $2,050,000) | | | | 2,050,000 | |
¹ | DISCOUNTED COMMERCIAL PAPER–79.96% | | | | | |
| Colleges and Universities–2.44% | | | | | |
| Leland Stanford Junior University | | | | | |
| 4.629% 1/16/08 | | 500,000 | | 499,038 | |
| | | | | 499,038 | |
| Financial Services–26.17% | | | | | |
| CBA Finance 4.944% 2/21/08 | | 250,000 | | 248,261 | |
| Danske 4.673% 1/31/08 | | 500,000 | | 498,060 | |
| Fortis Banque 4.715% 2/11/08 | | 500,000 | | 497,329 | |
| Natixis | | | | | |
| 5.117% 1/11/08 | | 250,000 | | 249,645 | |
| Nestle Capital | | | | | |
| 3.84% 1/2/08 | | 750,000 | | 749,920 | |
| 5.247% 1/23/08 | | 500,000 | | 498,402 | |
| Nordea North Amercia | | | | | |
| 5.194% 2/19/08 | | 550,000 | | 546,407 | |
| Rabobank USA Financial | | | | | |
| 4.438% 1/7/08 | | 250,000 | | 249,815 | |
| 4.793% 1/22/08 | | 500,000 | | 498,606 | |
| San Paolo IMI US Financial | | | | | |
| 4.477% 1/31/08 | | 250,000 | | 249,071 | |
| 5.022% 1/4/08 | | 539,000 | | 538,785 | |
| Societe Generale North America | | | | | |
| 4.717% 1/29/08 | | 250,000 | | 249,086 | |
| UBS Finance 5.04% 2/27/08 | | 275,000 | | 272,823 | |
| | | | | 5,346,210 | |
| Industrial–8.05% | | | | | |
| Archer Daniels 4.282% 3/5/08 | | 500,000 | | 496,222 | |
| AstraZeneca 4.955% 1/23/08 | | 400,000 | | 398,792 | |
| Koch Industries 4.04% 1/2/08 | | 750,000 | | 749,916 | |
| | | | | 1,644,930 | |
| Mortgage Bankers & Brokers–41.33% | | | | | |
> | Australian & New Zealand | | | | | |
| Banking Group 4.678% 1/31/08 | | 250,000 | | 249,029 | |
| Bank of America | | | | | |
| 4.825% 1/24/08 | | 250,000 | | 249,232 | |
| 5.289% 2/8/08 | | 500,000 | | 497,224 | |
| Bank of Ireland 4.505% 1/10/08 | | 500,000 | | 499,438 | |
| Bank of Nova Scotia 4.789% 1/15/08 | | 500,000 | | 499,071 | |
| Bank of Scotland | | | | | |
| 4.703% 4/14/08 | | 250,000 | | 246,649 | |
| 4.911% 1/25/08 | | 500,000 | | 498,368 | |
| BNP Paribas Finance 5.323% 1/11/08 | | 400,000 | | 399,410 | |
| Deutsche Bank Financial 3.50% 1/2/08 | | 500,000 | | 499,951 | |
| Goldman Sachs Group 4.00% 1/2/08 | | 250,000 | | 249,972 | |
| ING Funding | | | | | |
| 4.728% 4/21/08 | | $ | 250,000 | | $ | 246,408 | |
| 5.156% 1/9/08 | | 500,000 | | 499,428 | |
| JPMorgan Chase Bank | | | | | |
| 4.515% 1/28/08 | | 434,000 | | 432,535 | |
| 4.758% 1/14/08 | | 395,000 | | 394,322 | |
| Lehman Brothers Holdings | | | | | |
| 4.25% 1/2/08 | | 750,000 | | 749,912 | |
| Lloyds TSB Bank 4.509% 2/4/08 | | 500,000 | | 497,880 | |
| Morgan Stanley 5.434% 3/20/08 | | 250,000 | | 247,054 | |
| Royal Bank of Scotland | | | | | |
| 4.816% 2/11/08 | | 500,000 | | 497,272 | |
| Skandinaviska Enskilda Bank | | | | | |
| 4.64% 6/2/08 | | 250,000 | | 245,166 | |
| 4.798% 1/14/08 | | 500,000 | | 499,135 | |
| Westpac Securities 4.923% 3/20/08 | | 250,000 | | 247,328 | |
| | | | | 8,444,784 | |
| State Agency–1.97% | | | | | |
| Swedish Housing Finance | | | | | |
| 4.907% 1/11/08 | | 403,000 | | 402,451 | |
| | | | | 402,451 | |
| Total Discounted Commercial Paper
(cost $16,337,413) | | | | 16,337,413 | |
| | | | | | |
· | FLOATING RATE NOTES–11.01 | | | | | |
| American Express Bank | | | | | |
| 5.246% 9/18/08 | | 500,000 | | 500,000 | |
> | American International Group | | | | | |
| 4.884% 6/23/08 | | 500,000 | | 500,027 | |
> | DnB NOR Bank 4.865% 11/24/08 | | 750,000 | | 750,000 | |
> | Goldman Sachs Group | | | | | |
| 5.084% 8/22/08 | | 500,000 | | 500,000 | |
| Total Floating Rate Notes
(cost $2,250,027) | | | | 2,250,027 | |
5
Delaware VIP Cash Reserve Series
Statement of Net Assets (continued)
TOTAL VALUE OF SECURITIES–101.01% (cost $20,637,440)© | | $ | 20,637,440 | |
LIABILITIES NET OF RECEIVABLES AND OTHER ASSETS–(1.01%) | | (205,651 | ) |
NET ASSETS APPLICABLE TO 20,431,573 SHARES OUTSTANDING–100.00% | | $ | 20,431,789 | |
NET ASSET VALUE-DELAWARE VIP CASH RESERVE SERIES STANDARD CLASS ($20,425,652 / 20,425,438 Shares) | | $ | 1.00 | |
NET ASSET VALUE-DELAWARE VIP CASH RESERVE SERIES SERVICE CLASS ($6,137 / 6,135 Shares) | | 1.00 | |
COMPONENTS OF NET ASSETS AT DECEMBER 31, 2007: | | | |
Shares of beneficial interest (unlimited authorization–no par) | | $ | 20,484,653 | |
Accumulated net realized loss on investments | | (52,864 | ) |
Total net assets | | $ | 20,431,789 | |
¹ | The rate shown is the effective yield at the time of purchase. |
> | Security exempt from registration under Section 4(2) and/or Rule 144A of the Securities Act of 1933, as amended, and may be resold in transactions exempt from registration only to dealers in that program or other “accredited investors”. At December 31, 2007, the aggregate amount of these securities was $1,999,056, which represented 9.78% of the Series’ net assets. See Note 5 in “Notes to Financial Statements.” |
· | Variable rate security. The rate shown is the rate as of December 31, 2007. |
© | Also the cost for federal income tax purposes. |
See accompanying notes
6
Delaware VIP Trust — Delaware VIP Cash Reserve Series
Statement of Operations
Year Ended December 31, 2007
INVESTMENT INCOME: | | | |
Interest | | $ | 1,134,026 | |
| | | |
EXPENSES: | | | |
Management fees | | 96,295 | |
Audit and tax | | 11,964 | |
Accounting and administration expenses | | 8,559 | |
Dividend disbursing and transfer agent fees and expenses | | 6,934 | |
Custodian fees | | 3,680 | |
Reports and statements to shareholders | | 3,097 | |
Legal fees | | 2,916 | |
Pricing fees | | 1,340 | |
Trustees’ fees | | 1,061 | |
Insurance fees | | 521 | |
Consulting fees | | 365 | |
Trustees’ expenses | | 133 | |
Dues and services | | 76 | |
Registration fees | | 31 | |
Distribution expenses – Service Class | | 18 | |
| | 136,990 | |
Less waiver of distribution expenses – Service Class | | (3 | ) |
Less expense paid indirectly | | (581 | ) |
Total operating expenses | | 136,406 | |
| | | |
NET INVESTMENT INCOME | | 997,620 | |
| | | |
NET REALIZED GAIN ON INVESTMENTS | | 432 | |
| | | |
NET INCREASE IN NET ASSETS RESULTING FROM OPERATIONS | | $ | 998,052 | |
See accompanying notes
Delaware VIP Trust — Delaware VIP Cash Reserve Series
Statements of Changes in Net Assets
| | Year Ended | |
| | 12/31/07 | | 12/31/06 | |
INCREASE IN NET ASSETS FROM OPERATIONS: | | | | | |
Net investment income | | $ | 997,620 | | $ | 958,933 | |
Net realized gain on investments | | 432 | | 20 | |
Net increase in net assets resulting from operations | | 998,052 | | 958,953 | |
| | | | | |
DIVIDENDS AND DISTRIBUTIONS TO SHAREHOLDERS FROM: | | | | | |
Net investment income: | | | | | |
Standard Class | | (997,674 | ) | (958,694 | ) |
Service Class | | (264 | ) | (239 | ) |
| | (997,938 | ) | (958,933 | ) |
| | | | | |
CAPITAL SHARE TRANSACTIONS (at $1.00 per share): | | | | | |
Proceeds from shares sold: | | | | | |
Standard Class | | 12,277,446 | | 29,007,341 | |
Net asset value of shares issued upon reinvestment of dividends and distributions: | | | | | |
Standard Class | | 992,220 | | 954,586 | |
Service Class | | 262 | | 237 | |
| | 13,269,928 | | 29,962,164 | |
Cost of shares repurchased: | | | | | |
Standard Class | | (13,815,398 | ) | (32,421,044 | ) |
Decrease in net assets derived from capital share transactions | | (545,470 | ) | (2,458,880 | ) |
| | | | | |
NET DECREASE IN NET ASSETS | | (545,356 | ) | (2,458,860 | ) |
| | | | | |
NET ASSETS: | | | | | |
Beginning of year | | 20,977,145 | | 23,436,005 | |
End of year (there was no undistributed net investment income at either year end) | | $ | 20,431,789 | | $ | 20,977,145 | |
See accompanying notes
7
Delaware VIP Trust — Delaware VIP Cash Reserve Series
Financial Highlights
Selected data for each share of the Series outstanding throughout each period were as follows:
| | Delaware VIP Cash Reserve Series Standard Class | |
| | Year Ended | |
| | 12/31/07 | | 12/31/06 | | 12/31/05 | | 12/31/04(1) | | 12/31/03 | |
| | | | | | | | | | | |
Net asset value, beginning of period | | $ | 1.000 | | $ | 1.000 | | $ | 1.000 | | $ | 1.000 | | $ | 1.000 | |
| | | | | | | | | | | |
Income from investment operations: | | | | | | | | | | | |
Net investment income | | 0.047 | | 0.044 | | 0.027 | | 0.009 | | 0.006 | |
Total from investment operations | | 0.047 | | 0.044 | | 0.027 | | 0.009 | | 0.006 | |
| | | | | | | | | | | |
Less dividends and distributions from: | | | | | | | | | | | |
Net investment income | | (0.047 | ) | (0.044 | ) | (0.027 | ) | (0.009 | ) | (0.006 | ) |
Total dividends and distributions | | (0.047 | ) | (0.044 | ) | (0.027 | ) | (0.009 | ) | (0.006 | ) |
| | | | | | | | | | | |
Net asset value, end of period | | $ | 1.000 | | $ | 1.000 | | $ | 1.000 | | $ | 1.000 | | $ | 1.000 | |
| | | | | | | | | | | |
Total return(2) | | 4.76 | % | 4.49 | % | 2.69 | % | 0.87 | % | 0.61 | % |
| | | | | | | | | | | |
Ratios and supplemental data: | | | | | | | | | | | |
Net assets, end of period (000 omitted) | | $ | 20,426 | | $ | 20,971 | | $ | 23,430 | | $ | 29,831 | | $ | 42,748 | |
Ratio of expenses to average net assets | | 0.64 | % | 0.67 | % | 0.61 | % | 0.55 | % | 0.58 | % |
Ratio of net investment income to average net assets | | 4.66 | % | 4.39 | % | 2.62 | % | 0.82 | % | 0.60 | % |
(1) | On June 10, 2004, DMC voluntarily made a capital contribution of $0.001 per share to the Series in order to eliminate the potential deviation in the Series’ net asset value of $1.00 per share caused by accumulated net realized losses. This contribution had no impact on the Series’ total return. |
(2) | Total investment return is based on the change in net asset value of a share during the period and assumes reinvestment of dividends and distributions at net asset value. |
See accompanying notes
8
Delaware VIP Cash Reserve Series
Financial Highlights (continued)
Selected data for each share of the Series outstanding throughout each period were as follows:
| | Delaware VIP Cash Reserve Series Service Class | |
| | Year Ended | |
| | 12/31/07 | | 12/31/06 | | 12/31/05 | | 12/31/04(1) | | 12/31/03 | |
| | | | | | | | | | | |
Net asset value, beginning of period | | $ | 1.000 | | $ | 1.000 | | $ | 1.000 | | $ | 1.000 | | $ | 1.000 | |
| | | | | | | | | | | |
Income from investment operations: | | | | | | | | | | | |
Net investment income | | 0.044 | | 0.041 | | 0.024 | | 0.006 | | 0.004 | |
Total from investment operations | | 0.044 | | 0.041 | | 0.024 | | 0.006 | | 0.004 | |
| | | | | | | | | | | |
Less dividends and distributions from: | | | | | | | | | | | |
Net investment income | | (0.044 | ) | (0.041 | ) | (0.024 | ) | (0.006 | ) | (0.004 | ) |
Total dividends and distributions | | (0.044 | ) | (0.041 | ) | (0.024 | ) | (0.006 | ) | (0.004 | ) |
| | | | | | | | | | | |
Net asset value, end of period | | $ | 1.000 | | $ | 1.000 | | $ | 1.000 | | $ | 1.000 | | $ | 1.000 | |
| | | | | | | | | | | |
Total return(2) | | 4.50 | % | 4.23 | % | 2.43 | % | 0.60 | % | 0.40 | % |
| | | | | | | | | | | |
Ratios and supplemental data: | | | | | | | | | | | |
Net assets, end of period (000 omitted) | | $ | 6 | | $ | 6 | | $ | 6 | | $ | 5 | | $ | 5 | |
Ratio of expenses to average net assets | | 0.89 | % | 0.92 | % | 0.86 | % | 0.80 | % | 0.80 | % |
Ratio of expenses to average net assets prior to expense limitation and expenses paid indirectly | | 0.94 | % | 0.97 | % | 0.91 | % | 0.85 | % | 0.83 | % |
Ratio of net investment income to average net assets | | 4.41 | % | 4.14 | % | 2.37 | % | 0.57 | % | 0.38 | % |
Ratio of net investment income to average net assets prior to expense limitation and expenses paid indirectly | | 4.36 | % | 4.09 | % | 2.32 | % | 0.52 | % | 0.35 | % |
(1) | On June 10, 2004, DMC voluntarily made a capital contribution of $0.001 per share to the Series in order to eliminate the potential deviation in the Series’ net asset value of $1.00 per share caused by accumulated net realized losses. This contribution had no impact on the Series’ total return. |
(2) | Total investment return is based on the change in net asset value of a share during the period and assumes reinvestment of dividends and distributions at net asset value. Total investment return reflects a waiver by the distributor. Performance would have been lower had the waiver not been in effect. |
See accompanying notes
9
Delaware VIP Trust — Delaware VIP Cash Reserve Series
Notes to Financial Statements
December 31, 2007
Delaware VIP Trust (Trust) is organized as a Delaware statutory trust and offers 14 series: Delaware VIP Balanced Series, Delaware VIP Capital Reserves Series, Delaware VIP Cash Reserve Series, Delaware VIP Diversified Income Series, Delaware VIP Emerging Markets Series, Delaware VIP Growth Opportunities Series, Delaware VIP High Yield Series, Delaware VIP International Value Equity Series, Delaware VIP REIT Series, Delaware VIP Select Growth Series, Delaware VIP Small Cap Value Series, Delaware VIP Trend Series, Delaware VIP U.S. Growth Series and Delaware VIP Value Series. These financial statements and the related notes pertain to Delaware VIP Cash Reserve Series (Series). The Trust is an open-end investment company. The Series is considered diversified under the Investment Company Act of 1940, as amended, and offers Standard Class and Service Class shares. The Standard Class shares do not carry a 12b-1 fee and the Service Class shares carry a 12b-1 fee. The shares of the Series are sold only to separate accounts of life insurance companies.
The investment objective of the Series is to seek to provide maximum current income, while preserving principal and maintaining liquidity, by investing its assets in a diversified portfolio of money market securities and managing the portfolio to maintain a constant net asset value of $1 per share.
1. Significant Accounting Policies
The following accounting policies are in accordance with U.S. generally accepted accounting principles and are consistently followed by the Series.
Security Valuation—Securities are valued at amortized cost, which approximates market value.
In September 2006, the Financial Accounting Standards Board (FASB) issued FASB Statement No. 157 “Fair Value Measurements” (Statement 157). Statement 157 establishes a framework for measuring fair value in U.S. generally accepted accounting principles, clarifies the definition of fair value within that framework, and expands disclosures about the use of fair value measurements. Statement 157 is intended to increase consistency and comparability among fair value estimates used in financial reporting. Statement 157 is effective for fiscal years beginning after November 15, 2007. Management does not expect the adoption of Statement 157 to have a material impact on the amounts reported in the financial statements.
Federal Income Taxes—The Series intends to continue to qualify for federal income tax purposes as a regulated investment company under Subchapter M of the Internal Revenue Code of 1986, as amended, and make the requisite distributions to shareholders. Accordingly, no provision for federal income taxes has been made in the financial statements.
Effective June 29, 2007, the Series adopted FASB Interpretation No. 48 “Accounting for Uncertainty in Income Taxes” (FIN 48). FIN 48 provides guidance for how uncertain tax positions should be recognized, measured, presented and disclosed in the financial statements. FIN 48 requires the evaluation of tax positions taken or expected to be taken in the course of preparing the Series’ tax returns to determine whether the tax positions are “more-likely-than-not” of being sustained by the applicable tax authority. Tax positions not deemed to meet the more-likely-than-not threshold are recorded as a tax benefit or expense in the current year. The adoption of FIN 48 did not result in the recording of any tax benefit or expense in the current period.
Class Accounting—Investment income and common expenses are allocated to the classes of the Series on the basis of “settled shares” of each class in relation to the net assets of the Series. Realized and unrealized gain (loss) on investments is allocated to the classes of the Series on the basis of daily net assets of each class. Distribution expenses relating to a specific class are charged directly to that class.
Repurchase Agreements—The Series may invest in a pooled cash account along with members of the Delaware Investments® Family of Funds pursuant to an exemptive order issued by the Securities and Exchange Commission. The aggregate daily balance of the pooled cash account is invested in repurchase agreements secured by obligations of the U.S. government. The respective collateral is held by the Series’ custodian bank until the maturity of the respective repurchase agreements. Each repurchase agreement is at least 102% collateralized. However, in the event of default or bankruptcy by the counterparty to the agreement, realization of the collateral may be subject to legal proceedings. At December 31, 2007, the Series held no investments in repurchase agreements.
Use of Estimates—The preparation of financial statements in conformity with U.S. generally accepted accounting principles requires management to make estimates and assumptions that affect the reported amounts of assets and liabilities at the date of the financial statements and the reported amounts of revenues and expenses during the reporting period. Actual results could differ from those estimates.
Other—Expenses directly attributable to the Series are charged directly to the Series. Other expenses common to various funds within the Delaware Investments® Family of Funds are generally allocated amongst such funds on the basis of average net assets. Management fees and some other expenses are paid monthly. Security transactions are recorded on the date the securities are purchased or sold (trade date) for financial reporting purposes. Costs used in calculating realized gains and losses on the sale of investment securities are those of the specific securities sold. Interest income is recorded on the accrual basis. Discounts and premiums are amortized to interest income over the lives of the respective securities.
The Series declares dividends daily from net investment income and pays such dividends monthly and declares and pays distributions from net realized gain on investments, if any, following the close of the fiscal year.
The Series may receive earnings credits from its custodian when positive cash balances are maintained, which are used to offset custody fees. The expense paid under this arrangement is included in custodian fees on the Statement of Operations with the corresponding expense offset shown as “expense paid indirectly.”
10
Delaware VIP Cash Reserve Series
Notes to Financial Statements (continued)
2. Investment Management, Administration Agreements and Other Transactions with Affiliates
In accordance with the terms of its investment management agreement, the Series pays Delaware Management Company (DMC), a series of Delaware Management Business Trust and the investment manager, an annual fee which is calculated daily at the rate of 0.45% on the first $500 million of average daily net assets of the Series, 0.40% on the next $500 million, 0.35% on the next $1.5 billion, and 0.30% on average daily net assets in excess of $2.5 billion.
Prior to May 1, 2007, DMC had contractually agreed to waive that portion, if any, of its management fee and reimburse the Series to the extent necessary to ensure that total annual operating expenses, exclusive of taxes, interest, brokerage fees, 12b-1 plan expenses, certain insurance costs and non-routine expenses or costs including, but not limited to, those relating to reorganizations, litigation, conducting shareholder meetings, and liquidations, did not exceed 0.67% of average daily net assets of the Series. No reimbursement was due for the year ended December 31, 2007.
Effective October 1, 2007, Delaware Service Company, Inc. (DSC), an affiliate of DMC, provides fund accounting and financial administration oversight services to the Series. For these services, the Series pays DSC fees based on the aggregate daily net assets of the Delaware Investments® Family of Funds at the following annual rate: 0.0050% of the first $30 billion; 0.0045% of the next $10 billion; 0.0040% of the next $10 billion; and 0.0025% of aggregate average daily net assets in excess of $50 billion. The fees payable to DSC under the service agreement described above are allocated among all funds in the Delaware Investments® Family of Funds on a relative net asset value basis. Prior to October 1, 2007, DSC provided fund accounting and administrative services to the Series and received a fee at an annual rate of 0.04% of average daily net assets. For the year ended December 31, 2007, the Series was charged $6,686 for these services.
DSC also provides dividend disbursing and transfer agency services. The Series pays DSC a monthly fee based on the number of shareholder accounts for dividend disbursing and transfer agent services.
Pursuant to a distribution agreement and distribution plan, the Series pays Delaware Distributors, L.P. (DDLP), the distributor and an affiliate of DMC, an annual distribution and service fee not to exceed 0.30% of the average daily net assets of the Service Class shares. DDLP has contracted to waive distribution and service fees through April 30, 2008 in order to prevent distribution and service fees of the Service Class shares from exceeding 0.25% of average daily net assets. Standard Class shares pay no distribution and service expenses.
At December 31, 2007, the Series had liabilities payable to affiliates as follows:
| | Investment
Management
Fee Payable to
DMC | | Dividend Disbursing,
Transfer Agent
Fees and Other Expenses
Payable to DSC | | Distribution
Fees Payable
to DDLP | | Other
Expenses
Payable
to DMC
and Affiliates* | |
| | $ | 7,966 | | $ | 1,028 | | $ | 1 | | $ | 953 | |
| | | | | | | | | | | | | |
*DMC, as part of its administrative services, pays operating expenses on behalf of the Series and is reimbursed on a periodic basis. Such expenses include items such as printing of shareholder reports, fees for audit, legal and tax services, custodian fees and trustees’ fees.
As provided in the investment management agreement, the Series bears the cost of certain legal and tax services, including internal legal and tax services provided to the Series by DMC and/or its affiliates’ employees. For the year ended December 31, 2007, the Series was charged $1,153 for internal legal and tax services provided by DMC and/or its affiliates’ employees.
Trustees’ fees include expenses accrued by the Series for each Trustee’s retainer and per meeting fees. Certain officers of DMC, DSC and DDLP are officers and/or Trustees of the Trust. These officers and Trustees are paid no compensation by the Series.
3. Dividend and Distribution Information
Income and long-term capital gain distributions are determined in accordance with federal income tax regulations, which may differ from U.S. generally accepted accounting principles. Additionally, net short-term gains on sales of investment securities are treated as ordinary income for federal income tax purposes. The tax character of dividends and distributions paid during the years ended December 31, 2007 and 2006 was as follows:
| | Year
Ended
12/31/07 | | Year
Ended
12/31/06 | |
Ordinary income | | $ | 997,938 | | $ | 958,933 | |
| | | | | | | |
11
Delaware VIP Cash Reserve Series
Notes to Financial Statements (continued)
4. Components of Net Assets on a Tax Basis
As of December 31, 2007, the components of net assets on a tax basis were as follows:
Shares of beneficial interest | | $ | 20,484,653 | |
Capital loss carryforwards | | (52,864 | ) |
Net assets | | $ | 20,431,789 | |
For financial reporting purposes, capital accounts are adjusted to reflect the tax character of permanent book/tax differences. Reclassifications are primarily due to tax treatment of dividends and distributions. Results of operations and net assets were not affected by these reclassifications. For the year ended December 31, 2007, the Series recorded the following reclassifications:
| | Undistributed
Net
Investment Income | | Paid-in
Capital | |
| | $ | 318 | | $ | (318 | ) |
| | | | | | | |
For federal income tax purposes, capital loss carryforwards may be carried forward and applied against future capital gains. $432 was utilized in 2007. Capital loss carryforwards of $52,864 remaining at December 31, 2007 will expire in 2010.
5. Credit and Market Risk
An investment in the Series is not insured or guaranteed by the Federal Deposit Insurance Corporation or any other government agency. Although the Series seeks to preserve the value of your investment at $1.00 per share, it is possible to lose money by investing in the Series.
The Series may invest up to 10% of its net assets in illiquid securities, which may include securities with contractual restrictions on resale, securities exempt from registration under Rule 144A of the Securities Act of 1933, as amended (Act), and other securities which may not be readily marketable. The relative illiquidity of these securities may impair the Series from disposing of them in a timely manner and at a fair price when it is necessary or desirable to do so. While maintaining oversight, the Series’ Board of Trustees has delegated to DMC the day-to-day functions of determining whether individual securities are liquid for purposes of the Series’ limitation on investments in illiquid assets. The Series may also invest in securities exempt from registration under Section 4(2) of the Act, which exempts from registration transactions by an issuer not involving any public offering. As of December 31, 2007, no securities have been determined to be illiquid under the Series’ Liquidity Procedures. Section 4(2) and/or Rule 144A securities have been identified on the Statement of Net Assets.
6. Contractual Obligations
The Series enters into contracts in the normal course of business that contain a variety of indemnifications. The Series’ maximum exposure under these arrangements is unknown. However, the Series has not had prior claims or losses pursuant to these contracts. Management has reviewed the Series’ existing contracts and expects the risk of loss to be remote.
7. Tax Information (Unaudited)
For the fiscal year ended December 31, 2007, the Series designates dividends and distributions paid during the year as follows:
| | (A)
Long-Term
Capital Gain
Distributions
(Tax Basis) | | (B)
Ordinary
Income
Distributions
(Tax Basis) | | Total
Distributions
(Tax Basis) | |
| | — | | 100 | % | 100 | % |
(A) and (B) are based on a percentage of the Series’ total distributions.
8. Change in Custodian
On August 9, 2007, Mellon Bank, N.A., One Mellon Center, Pittsburgh, PA 15258.
12
Delaware VIP Trust — Delaware VIP Cash Reserve Series
Report of Independent Registered Public Accounting Firm
To the Shareholders and Board of Trustees
Delaware VIP Trust–Delaware VIP Cash Reserve Series
We have audited the accompanying statement of net assets of the Delaware VIP Cash Reserve Series (one of the series constituting Delaware VIP Trust) (the “Series”) as of December 31, 2007, and the related statement of operations for the year then ended, the statements of changes in net assets for each of the two years in the period then ended, and the financial highlights for each of the five years in the period then ended. These financial statements and financial highlights are the responsibility of the Series’ management. Our responsibility is to express an opinion on these financial statements and financial highlights based on our audits.
We conducted our audits in accordance with the standards of the Public Company Accounting Oversight Board (United States). Those standards require that we plan and perform the audit to obtain reasonable assurance about whether the financial statements and financial highlights are free of material misstatement. We were not engaged to perform an audit of the Series’ internal control over financial reporting. Our audits included consideration of internal control over financial reporting as a basis for designing audit procedures that are appropriate in the circumstances, but not for the purpose of expressing an opinion on the effectiveness of the Series’ internal control over financial reporting. Accordingly, we express no such opinion. An audit also includes examining, on a test basis, evidence supporting the amounts and disclosures in the financial statements and financial highlights, assessing the accounting principles used and significant estimates made by management, and evaluating the overall financial statement presentation. Our procedures included confirmation of securities owned as of December 31, 2007, by correspondence with the custodian. We believe that our audits provide a reasonable basis for our opinion.
In our opinion, the financial statements and financial highlights referred to above present fairly, in all material respects, the financial position of the Delaware VIP Cash Reserve Series of Delaware VIP Trust at December 31, 2007, the results of its operations for the year then ended, the changes in its net assets for each of the two years in the period then ended, and its financial highlights for each of the five years in the period then ended, in conformity with U.S. generally accepted accounting principles.

Philadelphia, Pennsylvania
February 14, 2008
The Series files its complete schedule of portfolio holdings with the Securities and Exchange Commission (Commission) for the first and third quarters of each fiscal year on Form N-Q. The Series’ Forms N-Q, as well as a description of the policies and procedures that the Series uses to determine how to vote proxies (if any) relating to portfolio securities is available without charge (i) upon request, by calling 800 523-1918; and (ii) on the Commission’s website at http://www.sec.gov. In addition, a description of the policies and procedures that the Series uses to determine how to vote proxies (if any) relating to portfolio securities is available without charge on the Delaware Investments® Funds’ website at http://www.delawareinvestments.com. The Series’ Forms N-Q may be reviewed and copied at the Commission’s Public Reference Room in Washington, DC; information on the operation of the Public Reference Room may be obtained by calling 800 SEC-0330. Information (if any) regarding how the Series voted proxies relating to portfolio securities during the most recently disclosed 12-month period ended June 30 is available without charge (i) through the Delaware Investments® Funds’ website at http://www.delawareinvestments.com; and (ii) on the Commission’s website at http://www.sec.gov.
13
Delaware Investments® Family of Funds
BOARD OF TRUSTEES/DIRECTORS AND OFFICERS ADDENDUM
A mutual fund is governed by a Board of Trustees/Directors (“Trustees”), which has oversight responsibility for the management of a fund’s business affairs. Trustees establish procedures and oversee and review the performance of the investment manager, the distributor, and others who perform services for the fund. The independent fund trustees, in particular, are advocates for shareholder interests. Each trustee has served in that capacity since he or she was elected to or appointed to the Board of Trustees, and will continue to serve until his or her retirement or the election of a new trustee in his or her place. The following is a list of the Trustees and Officers with certain background and related information.
Name,
Address,
and Birth Date | | Position(s)
Held with
Fund(s) | | Length of Time
Served | | Principal
Occupation(s)
During
Past 5 Years | | Number of
Portfolios in Fund
Complex Overseen
by Trustee
or Officer | | Other
Directorships
Held by
Trustee
or Officer | |
| | | | | | | |
INTERESTED TRUSTEES | | | | | | | |
Patrick P. Coyne(1)
2005 Market Street
Philadelphia, PA
19103
April 1963 | | Chairman,
President,
Chief Executive
Officer, and
Trustee | | Chairman and Trustee
since August 16, 2006
President and
Chief Executive Officer
since August 1, 2006 | | Patrick P. Coyne has served in various executive capacities at different times at Delaware Investments.(2) | | 84 | | Director —
Kaydon Corp.
Board of Governors
Member –
Investment Company
Institute
(2007 – present)
Member of Investment
Committee –
Cradle of
Liberty Council, BSA
(November 2007 –
present)
Finance Committee
Member – St. John
Vianney Roman
Catholic Church
(2007 – present) | |
| | | | | | | | | | | |
INDEPENDENT TRUSTEES | | | | | | | |
Thomas L. Bennett
2005 Market Street
Philadelphia, PA
19103
October 1947 | | Trustee | | Since
March 2005 | | Private Investor – (March 2004 – Present)
Investment Manager – Morgan Stanley & Co. (January 1984 – March 2004) | | 84 | | Director —
Bryn Mawr Bank Corp. (BMTC) (April 2007— Present)
Chairman of Investment Committee – The Haverford School (2002 – present)
Chairman of Investment Committee – Pennsylvania Academy of Fine Arts
(2007 – present)
Trustee
(2004 – present)
Investment Committee Member – Pennsylvania Horticulture Society (February 2006 – present) | |
14
Name,
Address,
and Birth Date | | Position(s)
Held with
Fund(s) | | Length of Time
Served | | Principal
Occupation(s)
During
Past 5 Years | | Number of
Portfolios in Fund
Complex Overseen
by Trustee
or Officer | | Other
Directorships
Held by
Trustee
or Officer | |
| | | | | | | | | | | |
INDEPENDENT TRUSTEES (CONTINUED) | | | | | | | |
John A. Fry
2005 Market Street
Philadelphia, PA
19103
May 1960 | | Trustee | | Since
January 2001 | | President – Franklin & Marshall College (June 2002 – Present)
Executive Vice President – University of Pennsylvania (April 1995 – June 2002) | | 84 | | Director — Community Health Systems
Director —
Allied Barton
Security Holdings | |
| | | | | | | | | | | |
Anthony D. Knerr
2005 Market Street
Philadelphia, PA
19103
December 1938 | | Trustee | | Since
April 1990 | | Founder and Managing Director – Anthony Knerr & Associates (Strategic Consulting) (1990 – Present) | | 84 | | None | |
| | | | | | | | | | | |
Lucinda S. Landreth
2005 Market Street
Philadelphia, PA
19103
June 1947 | | Trustee | | Since
March 2005 | | Chief Investment Officer – Assurant, Inc. (Insurance) (2002 – 2004) | | 84 | | None | |
| | | | | | | | | | | |
Ann R. Leven
2005 Market Street
Philadelphia, PA
19103
November 1940 | | Trustee | | Since
October 1989 | | Consultant – ARL Associates (Financial Planning) (1983 – Present) | | 84 | | Director and Audit Committee Member — Systemax, Inc. | |
| | | | | | | | | | | |
Thomas F. Madison
2005 Market Street
Philadelphia, PA
19103
February 1936 | | Trustee | | Since
May 1997 | | President and Chief Executive Officer – MLM Partners, Inc. (Small Business Investing and Consulting) (January 1993 – Present) | | 84 | | Director — CenterPoint Energy
Director and Audit Committee Member — Digital River, Inc.
Director and Audit Committee Member — Rimage Corporation
Director and Chair of Compensation and Governance & Nominating Committees — Valmont Industries, Inc. | |
| | | | | | | | | | | |
Janet L. Yeomans
2005 Market Street
Philadelphia, PA
19103
July 1948 | | Trustee | | Since
April 1999 | | Treasurer (January 2006 — Present) Vice President — Mergers & Acquisitions (January 2003 — January 2006), and Vice President (July 1995 — January 2003) 3M Corporation | | 84 | | None | |
| | | | | | | | | | | |
J. Richard Zecher
2005 Market Street
Philadelphia, PA
19103
July 1940 | | Trustee | | Since
March 2003 | | Founder — Investor Analytics (Risk Management) (May 1999 – Present)
Founder — Sutton Asset Management (Hedge Fund) (September 1998 – Present) | | 84 | | Director and Audit Committee Member — Investor Analytics
Director and Audit Committee Member — Oxigene, Inc. | |
| | | | | | | | | | | | | |
15
Name,
Address,
and Birth Date | | Position(s)
Held with
Fund(s) | | Length of Time
Served | | Principal
Occupation(s)
During
Past 5 Years | | Number of
Portfolios in Fund
Complex Overseen
by Trustee
or Officer | | Other
Directorships
Held by
Trustee
or Officer | |
| | | | | | | | | | | |
OFFICERS | | | | | | | | | | | |
David F. Connor
2005 Market Street
Philadelphia, PA
19103
December 1963 | | Vice President, Deputy General Counsel, and Secretary | | Vice President since September 21, 2000 and Secretary since October 2005 | | David F. Connor has served as Vice President and Deputy General Counsel of Delaware Investments since 2000. | | 84 | | None(4) | |
| | | | | | | | | | | |
Daniel V. Geatens
2005 Market Street
Philadelphia, PA
19103
October 1972 | | Vice President and Treasurer | | Treasurer since October 25, 2007 | | Daniel V. Geatens has served in various capacities at different times at Delaware Investments. | | 84 | | None(4) | |
| | | | | | | | | | | |
David P. O’Connor
2005 Market Street
Philadelphia, PA
19103
February 1966 | | Senior Vice President, General Counsel, and Chief Legal Officer | | Senior Vice President, General Counsel, and Chief Legal Officer since October 2005 | | David P. O’Connor has served in various executive and legal capacities at different times at Delaware Investments. | | 84 | | None(4) | |
| | | | | | | | | | | |
Richard Salus
2005 Market Street
Philadelphia, PA
19103
October 1963 | | Senior Vice President and Chief Financial Officer | | Chief Financial Officer since November 1, 2006 | | Richard Salus has served in various executive capacities at different times at Delaware Investments. | | 84 | | None(4) | |
(1) Patrick P. Coyne is considered to be an “Interested Trustee” because he is an executive officer of the Fund’s(s’) investment advisor.
(2) Delaware Investments is the marketing name for Delaware Management Holdings, Inc. and its subsidiaries, including the Fund’s(s’) investment advisor, principal underwriter, and its transfer agent.
(3) In 1997, several funds managed by Voyageur Fund Managers, Inc. (the “Voyageur Funds”) were incorporated into the Delaware Investments Family of Funds. Mr. Madison served as a director of the Voyageur Funds from 1993 until 1997.
(4) David F. Connor, Daniel V. Geatens, David P. O’Connor, and Richard Salus serve in similar capacities for the six portfolios of the Optimum Fund Trust, which have the same investment advisor, principal underwriter, and transfer agent as the registrant.
The Statement of Additional Information for the Fund(s) includes additional information about the Trustees and Officers and is available, without charge, upon request by calling 800 523-1918.
16
Delaware VIP Trust — Delaware VIP Diversified Income Series
The Delaware Investments Fixed Income team dealt with elevated volatility levels and a general decline in market liquidity in 2007. However, early portfolio positioning helped the Series best the Lehman Brothers U.S. Aggregate Index and outperform most of our peers in the Lipper Multi-Sector Funds category (source: Lipper).
For the year ended Dec. 31, 2007, the Delaware VIP Diversified Income Series returned +7.63% for Standard Class shares and +7.41 for Service Class shares (both figures reflect all distributions reinvested), which exceeded the Lehman Brothers U.S. Aggregate Index return of +6.97%. The Series also outperformed the average return of the Lipper Multi-Sector peer group, +4.51% (source: Lipper).
The month of November, the worst of the fourth quarter, was marked by extremely poor performance of corporate bonds of all quality levels. Lehman reported November as the poorest performance ever for the corporate bond market (versus U.S. Treasury notes and bonds).
The Series started the year with a more conservative quality bias than in recent years. We had an approximately 26.5% allocation to high yield corporate bonds, versus a maximum of 50%. The average rating on the whole fund was an A2 as measured by Moody’s. The domestic high grade allocation of the Series was at 43%. The emerging market position was our most aggressive position at 9% of the Series, versus an allowed maximum exposure to the emerging markets sector of 15%. The Series also had a 3% hedge against lower-rated subprime securitizations, effectively making the play that these investments would perform poorly in the coming year.
Early in the year, subprime securitizations started to experience a significant increase in delinquencies. We decided to further increase the quality of the Series by stopping new money allocations into the high yield corporate portfolio, effectively shrinking it over time. By the end of June, the high yield corporate allocation had shrunk to 22.3%. The high yield income premiums in the marketplace had increased from around 2.4% in early 2007 to 3% at June’s month end, reflecting increased risk and uncertainty. At this point in the year, it was becoming evident that there would be a significant contraction in credit, and that liquidity in the bond market was fading rapidly. We decided to move further into a more conservative posture. High yield exposure was brought to the year-end level of 11%.
Throughout the year, other tactical moves were made to capture flight-to-quality movements, or to capitalize on the worsening credit crunch. The U.S. dollar reacted to the increased volatility, and the new need for Federal Reserve liquidity injections. The Series started the year with a 17.5% exposure to other currencies, divided fairly equally between emerging and developed countries. As we proceeded through the year, we reduced emerging market exposure in favor of higher quality, less volatile developed markets. As gains were made from these investments, we slightly reduced exposure to end the year at a 14% total currency exposure. Foreign bond exposure was always somewhat higher than actual currency exposure to capture rate declines in foreign bond markets. Returns from these investments were a significant contributor to the Series’ return.
Although a healthy exposure to U.S. Treasury notes, futures, and agency debentures helped the Series capture strong rallies in the flight-to-quality moves, exposure to high yield bonds (discussed above), high quality corporate bonds (15% at year end), and mortgage securities (27% at year end), held back returns. These sectors lagged the vigorous move in U.S. Treasury notes as the economy deteriorated (especially in the fourth quarter).
The views expressed are current as of the date of this report and are subject to change.
The performance data quoted below represent past performance; past performance does not guarantee future results. Investment return and principal value will fluctuate so your shares, when redeemed, may be worth more or less than their original cost. Please obtain the performance data for the most recent month end by calling the number noted in the introductory section of this report on the page related to this Series.
You should consider the investment objectives, risks, charges, and expenses of the investment company carefully before investing. The Delaware VIP Diversified Income Series prospectus contains this and other important information about the Series. To obtain a prospectus, contact the company noted on the page related to this Series in the introductory section of this report, either by phone or through the company Web site. We advise you to read the prospectus carefully before you invest.
Delaware VIP Diversified Income Series
Average annual total returns
For periods ended Dec. 31, 2007 | | 1 year | | 3 years | | Lifetime | |
| | | | | | | |
Standard Class shares (commenced operations May 16, 2003) | | +7.63 | % | +4.96 | % | +6.17 | % |
| | | | | | | |
Service Class shares (commenced operations May 16, 2003) | | +7.41 | % | +4.73 | % | +5.88 | % |
1
As disclosed in the Series’ most recent prospectus, expenses for Standard Class and Service Class shares were as follows: The net expense ratios for Standard Class and Service Class shares of the Series were 0.78% and 1.03%, respectively. Total operating expenses for Standard Class and Service Class shares were 0.78% and 1.08%, respectively. Management fees for Standard Class and Service Class shares were 0.65%.
Earnings from a variable annuity or variable life investment compound tax-free until withdrawal and, as a result, no adjustments were made for income taxes.
An expense limitation was in effect for all classes during the periods shown in the Series performance chart on the previous page and in the Performance of a $10,000 Investment chart below.
Performance of Service Class shares will vary due to different charges and expenses.
Performance data do not reflect insurance fees related to a variable annuity or variable life investment or the deferred sales charge that would apply to certain withdrawals of investments held for fewer than eight years. Performance shown here would have been reduced if such fees were included and the expense limitation removed. For more information about fees, consult your variable annuity or variable life prospectus.
Investments in variable products involve risk. A rise or fall in interest rates can have a significant impact on bond prices and the net asset value (NAV) of the Series. High yielding, noninvestment grade bonds (junk bonds) involve higher risk than investment grade bonds. Adverse conditions may affect the issuer’s ability to pay interest and principal on these securities. The portfolio may have turnover in excess of 100%. High portfolio turnover can increase the Series’ transaction costs and lower returns
The Series may utilize futures and swaps for defensive strategy purposes to project or minimize the impact of potential changes.
If, and to the extent that, the Series invests in forward foreign currency contracts or uses other investments to hedge against currency risks, the Series will be subject to the special risks associated with those activities.
The Series may be affected by economic conditions which may hinder a company’s ability to make interest and principal payments on its debt.
This Series will be affected primarily by declines in bond prices, which can be caused by an adverse change in interest rates, adverse economic conditions, or poor performance from specific industries or bond issuers.
The Series will also be affected by prepayment risk due to its holdings of mortgage-backed securities. With prepayment risk, when homeowners pre-pay mortgages during periods of low interest rates, the Series may be forced to redeploy its assets in lower yielding securities. Derivatives risk is the possibility that a fund may experience a significant loss if it employs a derivatives strategy related to a security or a securities index and that security or index moves in the opposite direction from what the portfolio manager had anticipated. Another risk of derivative transactions is the creditworthiness of the counterparty because the transaction depends on the willingness and ability of the counterparty to fulfill its contractual obligations. Derivatives may also involve additional expenses.
The Series may be invested in emerging markets and foreign high yield corporate bonds, which have special risks that include currency fluctuations, economic and political change, and different accounting standards. Some portfolios offer more risk than others.
Please read both the contract and underlying prospectus for specific details regarding the product’s risk profile.
2

The chart shows a $10,000 investment in the Delaware VIP Diversified Income Series Standard Class shares for the period from May 16, 2003, through Dec. 31, 2007. Performance of Service Class shares will vary due to different charges and expenses.
The chart also shows $10,000 invested in the Lehman Brothers U.S. Aggregate Index for the period from May 16, 2003, through Dec. 31, 2007. The Lehman Brothers U.S. Aggregate Index, also sometimes referred to as the Lehman Brothers Aggregate Bond Index, measures the performance of approximately 6,500 publicly issued investment grade (Baa3/BBB- or better) corporate, U.S. government, mortgage- and asset-backed securities with at least one year to maturity and at least $250 million par value outstanding. An index is unmanaged and does not reflect the costs of operating a mutual fund, such as the costs of buying, selling, and holding securities. You cannot invest directly in an index.
3
Delaware VIP Trust — Delaware VIP Diversified Income Series
Disclosure of Series Expenses
For the Period July 1, 2007 to December 31, 2007
As a shareholder of the Series, you incur ongoing costs, including management fees; distribution and/or service (12b-1) fees; and other Series expenses. This Example is intended to help you understand your ongoing costs (in dollars) of investing in the Series and to compare these costs with the ongoing costs of investing in other mutual funds.
The Example is based on an investment of $1,000 invested at the beginning of the period and held for the entire period from July 1, 2007 to December 31, 2007.
Actual Expenses
The first section of the table shown, “Actual Series Return,” provides information about actual account values and actual expenses. You may use the information in this section of the table, together with the amount you invested, to estimate the expenses that you paid over the period. Simply divide your account value by $1,000 (for example, an $8,600 account value divided by $1,000 = 8.6), then multiply the result by the number in the first section under the heading entitled “Expenses Paid During Period” to estimate the expenses you paid on your account during the period.
Hypothetical Example for Comparison Purposes
The second section of the table shown, “Hypothetical 5% Return,” provides information about hypothetical account values and hypothetical expenses based on the Series’ actual expense ratio and an assumed rate of return of 5% per year before expenses, which is not the Series’ actual return. The hypothetical account values and expenses may not be used to estimate the actual ending account balance or expenses you paid for the period. You may use this information to compare the ongoing costs of investing in the Series and other funds. To do so, compare the 5% hypothetical example with the 5% hypothetical examples that appear in the shareholder reports of other funds.
Please note that the expenses shown in the table are meant to highlight your ongoing costs only. As a shareholder of the Series, you do not incur any transaction costs, such as sales charges (loads), redemption fees or exchange fees, but shareholders of other funds may incur such costs. Also, the fees related to the variable annuity investment or the deferred sales charge that could apply have not been included. Therefore, the second section of the table is useful in comparing ongoing costs only, and will not help you determine the relative total costs of owning different funds. The Series’ actual expenses shown in the table reflect fee waivers in effect for Service Class shares. The expenses shown in the table assume reinvestment of all dividends and distributions.
Expense Analysis of an Investment of $1,000
| | Beginning
Account
Value
7/1/07 | | Ending
Account
Value
12/31/07 | | Annualized
Expense
Ratios | | Expenses
Paid During
Period
7/1/07 to
12/31/07* | |
Actual Series Return | | | | | | | | | |
Standard Class | | $ | 1,000.00 | | $ | 1,045.00 | | 0.72 | % | $ | 3.71 | |
Service Class | | 1,000.00 | | 1,045.20 | | 0.97 | % | 5.00 | |
Hypothetical 5% Return (5% return before expenses) | | | | | | | | | |
Standard Class | | $ | 1,000.00 | | $ | 1,021.58 | | 0.72 | % | $ | 3.67 | |
Service Class | | 1,000.00 | | 1,020.32 | | 0.97 | % | 4.94 | |
* | “Expenses Paid During Period” are equal to the Series’ annualized expense ratio, multiplied by the average account value over the period, multiplied by 184/365 (to reflect the one-half year period). |
4
Delaware VIP Trust — Delaware VIP Diversified Income Series
Sector Allocation and Credit Quality Breakdown
As of December 31, 2007
Sector designations may be different than the sector designations presented in other Series materials.
Sector | | Percentage
of Net Assets | |
Agency Asset-Backed Securities | | 0.05 | % |
Agency Collateralized Mortgage Obligations | | 2.63 | % |
Agency Mortgage-Backed Securities | | 12.85 | % |
Agency Obligations | | 10.34 | % |
Commercial Mortgage-Backed Securities | | 3.43 | % |
Convertible Bonds | | 0.57 | % |
Corporate Bonds | | 24.25 | % |
Banking | | 2.97 | % |
Basic Industry | | 1.19 | % |
Brokerage | | 0.91 | % |
Capital Goods | | 1.13 | % |
Communications | | 3.29 | % |
Consumer Cyclical | | 2.82 | % |
Consumer Non-Cyclical | | 2.99 | % |
Electric | | 1.92 | % |
Energy | | 1.77 | % |
Finance Companies | | 1.63 | % |
Industrial | | 0.08 | % |
Insurance | | 1.22 | % |
Natural Gas | | 0.85 | % |
Real Estate | | 0.37 | % |
Technology | | 0.41 | % |
Transportation | | 0.70 | % |
Foreign Agencies | | 1.48 | % |
Austria | | 0.21 | % |
Germany | | 1.27 | % |
Municipal Bonds | | 0.30 | % |
Non-Agency Asset-Backed Securities | | 4.64 | % |
Non-Agency Collateralized Mortgage Obligations | | 7.40 | % |
Regional Agencies | | 1.06 | % |
Australia | | 1.06 | % |
Regional Authorities | | 0.20 | % |
Canada | | 0.20 | % |
Senior Secured Loans | | 1.87 | % |
Sovereign Agencies | | 0.11 | % |
Sovereign Debt | | 14.03 | % |
Austria | | 0.63 | % |
Canada | | 0.40 | % |
Colombia | | 0.08 | % |
Finland | | 0.02 | % |
France | | 0.51 | % |
Germany | | 1.06 | % |
Indonesia | | 0.54 | % |
Japan | | 4.14 | % |
Malaysia | | 0.46 | % |
Mexico | | 1.19 | % |
Norway | | 0.23 | % |
Philippines | | 0.58 | % |
Poland | | 0.37 | % |
Republic of Korea | | 0.13 | % |
Russia | | 1.39 | % |
Turkey | | 1.00 | % |
Ukraine | | 0.07 | % |
United Arabic Emirates | | 0.26 | % |
United Kingdom | | 0.97 | % |
Supranational Banks | | 3.41 | % |
U.S. Treasury Obligations | | 5.74 | % |
Common Stock | | 0.05 | % |
Convertible Preferred Stock | | 0.30 | % |
Preferred Stock | | 0.16 | % |
Warrants | | 0.00 | % |
Discount Note | | 9.69 | % |
Securities Lending Collateral | | 15.74 | % |
Total Value of Securities | | 120.30 | % |
Obligation to Return Securities Lending Collateral | | (15.74 | )% |
Liabilities Net of Receivables and Other Assets | | (4.56 | )% |
Total Net Assets | | 100.00 | % |
| | | | | | |
Credit Quality Breakdown
(as a % of fixed income investments) | | | |
AAA | | 61.76 | % |
AA | | 8.19 | % |
A | | 7.18 | % |
BBB | | 8.75 | % |
BB | | 6.61 | % |
B | | 6.12 | % |
CCC | | 1.18 | % |
D | | 0.05 | % |
Not Rated | | 0.16 | % |
Total | | 100.00 | % |
5
Delaware VIP Trust — Delaware VIP Diversified Income Series
Statement of Net Assets
December 31, 2007
| | | Principal
Amountm | | Value (U.S. $) | |
| | | | | | | | |
| AGENCY ASSET-BACKED SECURITIES–0.05% | | | | | | | |
· | Fannie Mae Grantor Trust Series 2003-T4 2A5 5.407% 9/26/33 | | USD | | 454,482 | | $ | 458,950 | |
· | Fannie Mae Whole Loan Series 2002-W11 AV1 5.205% 11/25/32 | | | | 10,676 | | 10,676 | |
| Total Agency Asset-Backed Securities (cost $463,170) | | | | | | 469,626 | |
| | | | | | | | |
| AGENCY COLLATERALIZED MORTGAGE OBLIGATIONS–2.63% | | | | | | | |
| Fannie Mae | | | | | | | |
| Series 1996-46 ZA 7.50% 11/25/26 | | | | 5,572 | | 5,850 | |
| Series 2002-90 A1 6.50% 6/25/42 | | | | 17,361 | | 18,035 | |
| Series 2002-90 A2 6.50% 11/25/42 | | | | 64,431 | | 66,698 | |
| Series 2003-122 AJ 4.50% 2/25/28 | | | | 82,089 | | 80,897 | |
| Series 2005-67 EY 5.50% 8/25/25 | | | | 1,625,000 | | 1,635,182 | |
| Series 2005-110 MB 5.50% 9/25/35 | | | | 745,497 | | 759,221 | |
* | Series 2006-39 PE 5.50% 10/25/32 | | | | 4,437,000 | | 4,493,061 | |
| Series 2006-M2 A2F 5.259% 5/25/20 | | | | 20,000 | | 19,802 | |
| Fannie Mae Grantor Trust | | | | | | | |
| Series 1999-T2 A1 7.50% 1/19/39 | | | | 1,548 | | 1,629 | |
| Series 2001-T8 A2 9.50% 7/25/41 | | | | 14,001 | | 15,286 | |
| Series 2002-T4 A3 7.50% 12/25/41 | | | | 30,553 | | 32,441 | |
| Series 2004-T1 1A2 6.50% 1/25/44 | | | | 33,314 | | 34,662 | |
| Fannie Mae Whole Loan | | | | | | | |
| Series 2002-W6 2A1 7.00% 6/25/42 | | | | 54,737 | | 57,794 | |
| Series 2004-W9 2A1 6.50% 2/25/44 | | | | 9,331 | | 9,737 | |
| Series 2004-W11 1A2 6.50% 5/25/44 | | | | 99,181 | | 104,515 | |
| Freddie Mac | | | | | | | |
| Series 1730 Z 7.00% 5/15/24 | | | | 140,742 | | 149,591 | |
| Series 2326 ZQ 6.50% 6/15/31 | | | | 215,872 | | 229,005 | |
| Series 2552 KB 4.25% 6/15/27 | | | | 54,791 | | 54,635 | |
| Series 2557 WE 5.00% 1/15/18 | | | | 1,120,000 | | 1,123,619 | |
| Series 2662 MA 4.50% 10/15/31 | | | | 217,624 | | 215,610 | |
| Series 2694 QG 4.50% 1/15/29 | | | | 625,000 | | 617,382 | |
| Series 2872 GC 5.00% 11/15/29 | | | | 220,000 | | 219,804 | |
| Series 2890 PC 5.00% 7/15/30 | | | | 1,575,000 | | 1,574,995 | |
| Series 2915 KP 5.00% 11/15/29 | | | | 265,000 | | 264,837 | |
| Series 3005 ED 5.00% 7/15/25 | | | | 672,000 | | 654,617 | |
| Series 3022 MB 5.00% 12/15/28 | | | | 165,000 | | 165,903 | |
| Series 3063 PC 5.00% 2/15/29 | | | | 1,255,000 | | 1,265,871 | |
| Series 3113 QA 5.00% 11/15/25 | | | | 1,296,187 | | 1,300,645 | |
* | Series 3128 BC 5.00% 10/15/27 | | | | 3,750,000 | | 3,768,119 | |
| Series 3131 MC 5.50% 4/15/33 | | | | 730,000 | | 739,227 | |
| Series 3154 PJ 5.50% 3/15/27 | | | | 1,764,527 | | 1,789,038 | |
| Series 3173 PE 6.00% 4/15/35 | | | | 740,000 | | 753,289 | |
| Series 3337 PB 5.50% 7/15/30 | | | | 815,000 | | 826,603 | |
t | Freddie Mac Structured Pass Through Securities | | | | | | | |
| Series T-54 2A 6.50% 2/25/43 | | | | 29,845 | | 30,582 | |
| Series T-58 2A 6.50% 9/25/43 | | | | 12,476 | | 13,031 | |
| Total Agency Collateralized Mortgage Obligations (cost $22,734,335) | | | | | | 23,091,213 | |
| | | | | | | | |
| AGENCY MORTGAGE-BACKED SECURITIES–12.85% | | | | | | | |
| Fannie Mae | | | | | | | |
| 5.50% 1/1/13 | | USD | | 172,536 | | $ | 173,671 | |
| 6.205% 5/1/09 | | | | 20,816 | | 20,873 | |
| 6.50% 8/1/17 | | | | 57,443 | | 59,143 | |
· | Fannie Mae ARM | | | | | | | |
| 5.055% 8/1/35 | | | | 529,943 | | 520,947 | |
| 5.968% 8/1/37 | | | | 1,615,299 | | 1,631,186 | |
| 6.965% 10/1/33 | | | | 149,179 | | 151,475 | |
| Fannie Mae Relocation 15 yr | | | | | | | |
| 4.00% 9/1/20 | | | | 455,937 | | 437,604 | |
| Fannie Mae Relocation 30 yr | | | | | | | |
| 5.00% 11/1/33 | | | | 53,012 | | 52,151 | |
| 5.00% 8/1/34 | | | | 64,156 | | 63,088 | |
| 5.00% 11/1/34 | | | | 83,044 | | 81,661 | |
| 5.00% 4/1/35 | | | | 226,059 | | 222,171 | |
| 5.00% 10/1/35 | | | | 386,148 | | 379,506 | |
| 5.00% 1/1/36 | | | | 545,551 | | 536,168 | |
| Fannie Mae S.F. 15 yr TBA | | | | | | | |
| 4.50% 1/1/23 | | | | 4,990,000 | | 4,912,031 | |
| 5.00% 1/1/23 | | | | 6,355,000 | | 6,361,952 | |
| 5.50% 1/1/23 | | | | 10,675,000 | | 10,813,444 | |
| 6.00% 1/1/23 | | | | 10,480,000 | | 10,723,985 | |
| Fannie Mae S.F. 30 yr | | | | | | | |
| 5.50% 3/1/29 | | | | 3,177 | | 3,189 | |
| 5.50% 4/1/29 | | | | 3,184 | | 3,195 | |
* | 5.50% 12/1/34 | | | | 2,638,391 | | 2,638,536 | |
* | 5.50% 7/1/37 | | | | 12,810,311 | | 12,795,876 | |
| 5.50% 12/1/37 | | | | 8,579,142 | | 8,569,474 | |
* | 6.00% 7/1/37 | | | | 2,964,077 | | 3,010,195 | |
| 6.00% 12/1/37 | | | | 9,070,907 | | 9,212,039 | |
| 6.50% 9/1/36 | | | | 615,000 | | 632,247 | |
* | 6.50% 11/1/36 | | | | 4,647,089 | | 4,777,405 | |
| 6.50% 2/1/37 | | | | 1,011,273 | | 1,039,632 | |
| 6.50% 8/1/37 | | | | 2,300,000 | | 2,364,252 | |
| 6.50% 10/1/37 | | | | 2,855,128 | | 2,934,888 | |
| 6.50% 11/1/37 | | | | 2,617,282 | | 2,690,397 | |
| 7.50% 3/1/32 | | | | 1,310 | | 1,394 | |
| 7.50% 4/1/32 | | | | 4,035 | | 4,295 | |
| Freddie Mac | | | | | | | |
| 7.00% 1/1/08 | | | | 129 | | 129 | |
· | Freddie Mac ARM | | | | | | | |
| 4.972% 12/1/33 | | | | 233,625 | | 237,546 | |
| 5.683% 7/1/36 | | | | 656,759 | | 665,559 | |
| 6.335% 4/1/34 | | | | 4,482 | | 4,529 | |
* | 6.336% 2/1/37 | | | | 1,839,720 | | 1,895,501 | |
| Freddie Mac Relocation 30 yr | | | | | | | |
| 5.00% 9/1/33 | | | | 102,999 | | 101,579 | |
| Freddie Mac S.F. 15 yr | | | | | | | |
| 4.50% 5/1/20 | | | | 2,315,088 | | 2,275,500 | |
| 5.00% 6/1/18 | | | | 685,725 | | 687,409 | |
| Freddie Mac S.F. 30 yr | | | | | | | |
| 6.00% 6/1/37 | | | | 800,000 | | 812,028 | |
| Freddie Mac S.F. 30 yr TBA | | | | | | | |
| 5.00% 1/1/38 | | | | 15,880,000 | | 15,492,926 | |
6
| | | Principal
Amountm | | Value
(U.S. $ ) | |
| | | | | | | | |
| AGENCY MORTGAGE–BACKED SECURITIES (continued) | | | | | | | |
* | GNMA I S.F. 30 yr | | | | | | | |
| 7.00% 12/15/34 | | USD | | 609,002 | | $ | 647,444 | |
| GNMA S.F. 30 yr TBA | | | | | | | |
| 5.50% 1/1/38 | | | | 1,115,000 | | 1,123,189 | |
| 6.00% 1/1/38 | | | | 1,115,000 | | 1,141,481 | |
| Total Agency Mortgage-Backed Securities (cost $111,943,413) | | | | | | 112,902,890 | |
| | | | | | | | |
| AGENCY OBLIGATIONS–10.34% | | | | | | | |
| Fannie Mae | | | | | | | |
* | 4.375% 3/15/13 | | | | 6,200,000 | | 6,317,991 | |
* | 4.625% 10/15/13 | | | | 5,000,000 | | 5,153,450 | |
* | 4.75% 11/19/12 | | | | 9,500,000 | | 9,841,895 | |
* | 4.875% 5/18/12 | | | | 4,080,000 | | 4,243,388 | |
* | 5.00% 9/15/08 | | | | 1,100,000 | | 1,108,135 | |
| Federal Farm Credit Bank | | | | | | | |
| 5.125% 8/25/16 | | | | 615,000 | | 644,390 | |
| Federal Home Loan Bank System | | | | | | | |
| 3.75% 1/8/10 | | | | 8,600,000 | | 8,635,070 | |
* | 4.25% 11/20/09 | | | | 2,195,000 | | 2,222,675 | |
| 4.50% 10/9/09 | | | | 2,880,000 | | 2,925,697 | |
| 4.875% 11/27/13 | | | | 4,100,000 | | 4,276,972 | |
| 5.375% 8/19/11 | | | | 1,920,000 | | 2,027,545 | |
* | 5.50% 8/13/14 | | | | 1,460,000 | | 1,575,825 | |
^ | Financing Corporation Interest Strip | | | | | | | |
| CPN 4.782% 4/6/12 | | | | 645,000 | | 554,646 | |
| CPN 4.797% 5/2/12 | | | | 125,000 | | 107,542 | |
| CPN 4.901% 10/6/12 | | | | 545,000 | | 456,802 | |
| CPN 4.938% 10/6/13 | | | | 109,000 | | 87,161 | |
| CPN 4.948% 10/6/14 | | | | 650,000 | | 491,809 | |
| CPN 5.079% 2/8/13 | | | | 252,000 | | 207,606 | |
| CPN 5.08% 8/8/13 | | | | 252,000 | | 202,963 | |
| CPN 5.093% 4/6/14 | | | | 135,000 | | 104,654 | |
| CPN 5.101% 10/6/11 | | | | 120,000 | | 104,938 | |
| CPN 5.175% 3/26/12 | | | | 200,000 | | 171,936 | |
| CPN 5.193% 10/6/15 | | | | 353,000 | | 252,448 | |
| CPN 1 5.162% 5/11/12 | | | | 330,000 | | 283,967 | |
| CPN 1 5.283% 5/11/15 | | | | 400,000 | | 292,076 | |
| CPN 1 5.407% 11/11/17 | | | | 700,000 | | 445,750 | |
| CPN 4 5.213% 10/6/15 | | | | 200,000 | | 143,030 | |
| CPN 12 5.10% 12/6/11 | | | | 638,000 | | 553,484 | |
| CPN 13 5.161% 12/27/12 | | | | 100,000 | | 82,893 | |
| CPN 13 5.208% 6/27/13 | | | | 400,000 | | 323,584 | |
| CPN 13 5.366% 12/27/16 | | | | 366,000 | | 244,589 | |
| CPN 15 4.903% 9/7/13 | | | | 860,000 | | 690,211 | |
| CPN 15 5.253% 3/7/16 | | | | 674,000 | | 470,181 | |
| CPN 19 5.074% 12/6/10 | | | | 120,000 | | 108,511 | |
| CPN 19 5.189% 6/6/16 | | | | 120,000 | | 82,597 | |
| CPN A 5.098% 8/8/15 | | | | 150,000 | | 108,385 | |
| CPN A 5.099% 2/8/15 | | | | 150,000 | | 111,159 | |
| CPN A 5.112% 2/8/14 | | | | 252,000 | | 197,179 | |
| CPN D 5.112% 9/26/11 | | | | 550,000 | | 481,598 | |
| CPN D 5.119% 9/26/10 | | | | 600,000 | | 546,713 | |
| Freddie Mac | | | | | | | |
| 4.125% 12/21/12 | | USD | | 5,000,000 | | $ | 5,040,840 | |
* | 4.50% 1/15/13 | | | | 4,000,000 | | 4,099,732 | |
* | 4.50% 7/15/13 | | | | 3,500,000 | | 3,587,224 | |
* | 4.625% 12/19/08 | | | | 525,000 | | 527,962 | |
* | 4.625% 10/25/12 | | | | 7,500,000 | | 7,731,217 | |
| 5.25% 2/24/11 | | | | 3,000,000 | | 3,041,196 | |
* | 5.40% 2/2/12 | | | | 2,180,000 | | 2,212,373 | |
| 5.45% 9/2/11 | | | | 2,180,000 | | 2,202,921 | |
| 5.50% 7/18/16 | | | | 2,200,000 | | 2,372,383 | |
^ | Residual Funding Principal Strip 5.175% 10/15/19 | | | | 5,450,000 | | 3,171,175 | |
| Total Agency Obligations (cost $87,979,910) | | | | | | 90,868,468 | |
| | | | | | | | |
| COMMERCIAL MORTGAGE-BACKED SECURITIES–3.43% | | | | | | | |
| Bank of America Commercial Mortgage Securities | | | | | | | |
· | Series 2004-3 A5 5.316% 6/10/39 | | | | 1,035,000 | | 1,064,689 | |
· | Series 2005-6 AM 5.181% 9/10/47 | | | | 355,000 | | 345,265 | |
· | Series 2006-3 A4 5.889% 7/10/44 | | | | 1,835,000 | | 1,906,593 | |
| Series 2006-4 A4 5.634% 7/10/46 | | | | 1,780,000 | | 1,817,540 | |
| Bear Stearns Commercial Mortgage Securities | | | | | | | |
# | Series 2004-ESA E 144A 5.064% 5/14/16 | | | | 350,000 | | 355,246 | |
· | Series 2007-PW16 A4 5.713% 6/11/40 | | | | 3,155,000 | | 3,246,451 | |
· | Series 2007-T28 A4 5.742% 9/11/42 | | | | 2,160,000 | | 2,212,714 | |
· | Commercial Mortgage Pass Through Certificates | | | | | | | |
# | Series 2001-J1A A2 144A 6.457% 2/14/34 | | | | 177,687 | | 184,927 | |
| Series 2006-C7 A2 5.69% 6/10/46 | | | | 230,000 | | 233,571 | |
· | Credit Suisse Mortgage Capital Certificates | | | | | | | |
| Series 2006-C1 AAB 5.555% 2/15/39 | | | | 115,000 | | 116,651 | |
# | Crown Castle Towers 144A | | | | | | | |
| Series 2005-1A C 5.074% 6/15/35 | | | | 90,000 | | 88,047 | |
| Series 2006-1A B 5.362% 11/15/36 | | | | 830,000 | | 814,977 | |
| General Electric Capital Commercial Mortgage | | | | | | | |
| Series 2002-1A A3 6.269% 12/10/35 | | | | 440,000 | | 463,298 | |
| Goldman Sachs Mortgage Securities II | | | | | | | |
| Series 2006-GG8 A4 5.56% 11/10/39 | | | | 1,390,000 | | 1,411,676 | |
·# | Series 2006-RR2 A1 144A 5.686% 6/23/46 | | | | 345,000 | | 308,847 | |
·# | Series 2006-RR3 A1S 144A 5.659% 7/18/56 | | | | 1,345,000 | | 1,147,272 | |
| Greenwich Capital Commercial Funding | | | | | | | |
| Series 2007-GG9 A4 5.444% 3/10/39 | | | | 1,370,000 | | 1,378,088 | |
7
| | | Principal
Amountm | | Value
(U.S. $) | |
| | | | | | | | |
| COMMERCIAL MORTGAGE-BACKED SECURITIES (continued) | | | | | | | |
| JPMorgan Chase Commercial Mortgage Securities | | | | | | | |
| Series 2002-C1 A3 5.376% 7/12/37 | | USD | | 305,000 | | $ | 311,111 | |
| Series 2002-C2 A2 5.05% 12/12/34 | | | | 345,000 | | 347,823 | |
| Series 2003-C1 A2 4.985% 1/12/37 | | | | 20,000 | | 20,067 | |
| Series 2006-LDP9 A2 5.134% 5/15/47 | | | | 3,200,000 | | 3,134,401 | |
·# | Series 2006-RR1A A1 144A 5.455% 10/18/52 | | | | 1,035,000 | | 899,322 | |
| Lehman Brothers-UBS Commercial Mortgage Trust | | | | | | | |
| Series 2002-C1 A4 6.462% 3/15/31 | | | | 110,000 | | 116,617 | |
| Series 2003-C8 A2 4.207% 11/15/27 | | | | 190,000 | | 188,783 | |
| Merrill Lynch/Countrywide Commercial Mortgage Trust | | | | | | | |
| Series 2007-5 A1 4.275% 8/12/48 | | | | 214,503 | | 211,464 | |
| Morgan Stanley Capital I | | | | | | | |
# | Series 1999-FNV1 G 144A 6.12% 3/15/31 | | | | 110,000 | | 110,352 | |
| Series 2006-IQ12 A4 5.332% 12/15/43 | | | | 2,045,000 | | 2,041,952 | |
| Series 2006-HQ9 A4 5.731% 7/12/44 | | | | 2,500,000 | | 2,569,053 | |
| Series 2007-IQ14 A4 5.692% 4/15/49 | | | | 350,000 | | 356,748 | |
· | Series 2007-T27 A4 5.651% 6/13/42 | | | | 890,000 | | 913,180 | |
·# | Morgan Stanley Dean Witter Capital I Series 2001-TOP1 E 144A 7.336% 2/15/33 | | | | 100,000 | | 102,071 | |
# | Tower 144A | | | | | | | |
| Series 2004-2A A 4.232% 12/15/14 | | | | 65,000 | | 63,759 | |
| Series 2006-1 B 5.588% 2/15/36 | | | | 120,000 | | 119,090 | |
| Series 2006-1 C 5.707% 2/15/36 | | | | 185,000 | | 184,932 | |
| Wachovia Bank Commercial Mortgage Trust | | | | | | | |
| Series 2006-C28 A2 5.50% 10/15/48 | | | | 655,000 | | 660,826 | |
| Series 2007-C30 A3 5.246% 12/15/43 | | | | 715,000 | | 713,713 | |
| Total Commercial Mortgage-Backed Securities (cost $30,127,259) | | | | | | 30,161,116 | |
| | | | | | | | |
| CONVERTIBLE BONDS–0.57% | | | | | | | |
| Advanced Micro Devices 6.00% 5/1/15 exercise price $28.08, expiration date 5/1/15 | | | | 1,770,000 | | 1,267,763 | |
| Electronic Data Systems 3.875% 7/15/23 exercise price $34.14, expiration date 7/15/23 | | | | 1,270,000 | | 1,268,413 | |
| Health Management Group 4.375% 3/15/17 exercise price $24.80, expiration date 3/15/17 | | | | 235,000 | | 231,475 | |
‡ | Mirant (Escrow) 2.50% 6/15/21 exercise price $67.95, expiration date 6/15/21 | | | | 110,000 | | — | |
*· | U.S. Bancorp 3.176% 9/20/36 exercise price $38.28, expiration date 9/20/36 | | | | 900,000 | | 899,190 | |
*· | Wyeth 4.886% 1/15/24 exercise price $60.09, expiration date 1/15/24 | | USD | | 1,220,000 | | $ | 1,293,248 | |
| Total Convertible Bonds (cost $5,144,734) | | | | | | 4,960,089 | |
| | | | | | | | |
| CORPORATE BONDS–24.25% | | | | | | | |
| Banking–2.97% | | | | | | | |
| American Express Centurion Bank 5.55% 10/17/12 | | | | 3,456,000 | | 3,520,358 | |
· | BAC Capital Trust XV 5.924% 6/1/56 | | | | 1,045,000 | | 873,843 | |
·# | Banco Mercantil 144A 6.862% 10/13/21 | | | | 1,320,000 | | 1,305,348 | |
· | Capital One FSB 5.211% 3/13/09 | | | | 1,268,000 | | 1,249,334 | |
^ | Dresdner Bank 4.66% 1/24/08 | | | | 4,245,000 | | 4,520,924 | |
*# | HBOS Treasury Services 144A 5.25% 2/21/17 | | | | 1,500,000 | | 1,531,601 | |
| HSBC Holdings 6.50% 9/15/37 | | | | 590,000 | | 573,687 | |
| JPMorgan Chase Capital XXV 6.80% 10/1/37 | | | | 2,452,000 | | 2,364,853 | |
# | Northern Rock 144A | | | | | | | |
| 5.625% 6/22/17 | | | | 695,000 | | 705,992 | |
· | 6.594% 6/29/49 | | | | 1,000,000 | | 620,944 | |
·# | PNC Preferred Funding Trust I 144A 6.113% 3/29/49 | | | | 700,000 | | 615,958 | |
| Popular North America | | | | | | | |
| 4.25% 4/1/08 | | | | 335,000 | | 334,304 | |
· | 5.643% 4/6/09 | | | | 375,000 | | 376,359 | |
| Popular North America Capital Trust I 6.564% 9/15/34 | | | | 260,000 | | 232,414 | |
| Silicon Valley Bank 5.70% 6/1/12 | | | | 800,000 | | 803,814 | |
| U.S. Bank North America 4.80% 4/15/15 | | | | 720,000 | | 692,419 | |
| Wachovia Bank | | | | | | | |
| 6.00% 11/15/17 | | | | 1,250,000 | | 1,260,676 | |
| 6.60% 1/15/38 | | | | 455,000 | | 458,779 | |
| Wells Fargo 5.625% 12/11/17 | | | | 820,000 | | 822,049 | |
| WM Covered Bond Program 3.875% 9/27/11 | | EUR | | 2,326,000 | | 3,236,646 | |
| | | | | | | 26,100,302 | |
| Basic Industry–1.19% | | | | | | | |
* | AK Steel 7.75% 6/15/12 | | USD | | 370,000 | | 373,700 | |
| duPont (E.I.) deNemours 5.00% 1/15/13 | | | | 1,150,000 | | 1,158,527 | |
| Foundation Pennsylvania Coal 7.25% 8/1/14 | | | | 630,000 | | 625,275 | |
| Freeport McMoRan Copper & Gold 8.25% 4/1/15 | | | | 155,000 | | 164,688 | |
| Georgia-Pacific | | | | | | | |
| 7.70% 6/15/15 | | | | 600,000 | | 594,000 | |
| 8.875% 5/15/31 | | | | 60,000 | | 58,200 | |
| 9.50% 12/1/11 | | | | 445,000 | | 469,475 | |
8
| | | Principal
Amountm | | Value
(U.S. $) | |
| | | | | | | | |
| CORPORATE BONDS (continued) | | | | | | | |
| Basic Industry (continued) | | | | | | | |
# | GTL Trade Finance 144A 7.25% 10/20/17 | | USD | | 816,000 | | $ | 829,645 | |
*# | Ineos Group Holdings 144A 8.50% 2/15/16 | | | | 255,000 | | 228,225 | |
| Lubrizol 4.625% 10/1/09 | | | | 745,000 | | 748,479 | |
# | MacDermid 144A 9.50% 4/15/17 | | | | 690,000 | | 652,050 | |
| Massey Energy | | | | | | | |
| 6.625% 11/15/10 | | | | 165,000 | | 162,113 | |
| 6.875% 12/15/13 | | | | 320,000 | | 303,200 | |
# | Momentive Performance Materials 144A 9.75% 12/1/14 | | | | 180,000 | | 166,500 | |
# | NewPage 144A 10.00% 5/1/12 | | | | 270,000 | | 272,700 | |
# | Norske Skogindustrier 144A 7.125% 10/15/33 | | | | 580,000 | | 488,350 | |
‡ | Port Townsend Paper 12.4312% 8/27/12 | | | | 191,800 | | 189,882 | |
| Potlatch 13.00% 12/1/09 | | | | 675,000 | | 766,006 | |
| Rohm & Haas 5.60% 3/15/13 | | | | 950,000 | | 988,255 | |
·# | Ryerson 144A 12.574% 11/1/14 | | | | 250,000 | | 241,250 | |
# | Steel Dynamics 144A | | | | | | | |
| 6.75% 4/1/15 | | | | 300,000 | | 291,000 | |
| 7.25% 4/15/36 | | | | 345,000 | | 345,482 | |
| 7.375% 11/1/12 | | | | 125,000 | | 126,250 | |
# | Witco 144A 6.875% 2/1/26 | | | | 255,000 | | 206,550 | |
| | | | | | | 10,449,802 | |
| Brokerage–0.91% | | | | | | | |
| AMVESCAP 4.50% 12/15/09 | | | | 180,000 | | 177,691 | |
· | Bear Stearns 5.494% 7/16/09 | | | | 1,066,000 | | 1,025,784 | |
| Goldman Sachs Group 6.75% 10/1/37 | | | | 2,734,000 | | 2,687,178 | |
| Jefferies Group 6.45% 6/8/27 | | | | 915,000 | | 852,312 | |
| JPMorgan Chase 5.75% 1/2/13 | | | | 1,320,000 | | 1,346,602 | |
·# | 144A 9.60% 11/14/10 | | | | 600,000 | | 576,592 | |
| LaBranche | | | | | | | |
| 9.50% 5/15/09 | | | | 600,000 | | 600,750 | |
| 11.00% 5/15/12 | | | | 480,000 | | 472,200 | |
| Lazard Group 6.85% 6/15/17 | | | | 250,000 | | 247,341 | |
| | | | | | | 7,986,450 | |
| Capital Goods–1.13% | | | | | | | |
| Allied Waste North America | | | | | | | |
| 7.375% 4/15/14 | | | | 325,000 | | 325,813 | |
* | 7.875% 4/15/13 | | | | 425,000 | | 436,688 | |
* | Berry Plastics Holding 8.875% 9/15/14 | | | | 245,000 | | 233,975 | |
| Casella Waste Systems 9.75% 2/1/13 | | | | 600,000 | | 615,000 | |
| CPG International I 10.50% 7/1/13 | | | | 380,000 | | 361,000 | |
| General Electric 5.25% 12/6/17 | | | | 900,000 | | 899,799 | |
* | Graham Packaging 9.875% 10/15/14 | | | | 265,000 | | 245,125 | |
| Graphic Packaging International 8.50% 8/15/11 | | | | 235,000 | | 233,825 | |
* | Greenbrier 8.375% 5/15/15 | | | | 115,000 | | 110,400 | |
*# | Hawker Beechcraft Acquisition 144A 9.75% 4/1/17 | | | | 330,000 | | 329,175 | |
| Hexion US Finance 9.75% 11/15/14 | | | | 445,000 | | 482,825 | |
| Interface 10.375% 2/1/10 | | USD | | 440,000 | | $ | 463,100 | |
| Intertape Polymer 8.50% 8/1/14 | | | | 455,000 | | 418,031 | |
| KB Home 8.625% 12/15/08 | | | | 235,000 | | 231,475 | |
| Koppers Industries 9.875% 10/15/13 | | | | 215,000 | | 227,363 | |
| L-3 Communications 7.625% 6/15/12 | | | | 950,000 | | 977,312 | |
· | Masco 5.433% 3/12/10 | | | | 345,000 | | 333,421 | |
· | NXP BV Funding 7.993% 10/15/13 | | | | 300,000 | | 277,125 | |
| Owens Brockway Glass Container 6.75% 12/1/14 | | | | 520,000 | | 520,000 | |
# | Penhall International 144A 12.00% 8/1/14 | | | | 205,000 | | 191,675 | |
* | Rental Services 9.50% 12/1/14 | | | | 400,000 | | 360,000 | |
# | Siemens Finance 144A 6.125% 8/17/26 | | | | 410,000 | | 407,178 | |
| Smurfit-Stone Container Enterprises 8.00% 3/15/17 | | | | 400,000 | | 388,500 | |
*# | SPX 144A 7.625% 12/15/14 | | | | 160,000 | | 163,400 | |
| Textron 6.50% 6/1/12 | | | | 635,000 | | 674,355 | |
| | | | | | | 9,906,560 | |
| Communications–3.29% | | | | | | | |
| America Movil 6.375% 3/1/35 | | | | 295,000 | | 293,177 | |
| American Tower 7.125% 10/15/12 | | | | 660,000 | | 681,450 | |
# | 144A 7.00% 10/15/17 | | | | 175,000 | | 176,750 | |
| AT&T 5.10% 9/15/14 | | | | 225,000 | | 222,984 | |
| AT&T Wireless 8.125% 5/1/12 | | | | 2,060,000 | | 2,292,657 | |
| Broadview Network 11.375% 9/1/12 | | | | 215,000 | | 225,213 | |
* | CCH I Holdings 13.50% 1/15/14 | | | | 515,000 | | 371,444 | |
· | Centennial Communications 10.981% 1/1/13 | | | | 615,000 | | 631,913 | |
| Charter Communications Holdings 13.50% 1/15/11 | | | | 505,000 | | 419,150 | |
| Citizens Communications 7.125% 3/15/19 | | | | 700,000 | | 668,500 | |
| Comcast | | | | | | | |
· | 5.543% 7/14/09 | | | | 395,000 | | 393,706 | |
| 6.30% 11/15/17 | | | | 2,200,000 | | 2,286,747 | |
| Cricket Communications 9.375% 11/1/14 | | | | 465,000 | | 438,263 | |
| Dex Media West 9.875% 8/15/13 | | | | 625,000 | | 651,563 | |
# | Digicel 144A 9.25% 9/1/12 | | | | 475,000 | | 486,305 | |
| Donnelley (R.H.) | | | | | | | |
| 8.875% 1/15/16 | | | | 355,000 | | 333,700 | |
# | 144A 8.875% 10/15/17 | | | | 400,000 | | 372,000 | |
| Grupo Televisa 8.49% 5/11/37 | | MXN | | 17,600,000 | | 1,525,812 | |
·# | Hellas Telecommunications Luxembourg II 144A 10.993% 1/15/15 | | USD | | 325,000 | | 307,938 | |
| Hughes Network Systems/Finance 9.50% 4/15/14 | | | | 472,000 | | 480,260 | |
| Idearc 8.00% 11/15/16 | | | | 1,010,000 | | 931,725 | |
| Intelsat 11.25% 6/15/16 | | | | 425,000 | | 440,938 | |
# | Lamar Media 144A 6.625% 8/15/15 | | | | 165,000 | | 161,288 | |
# | LBI Media 144A 8.50% 8/1/17 | | | | 325,000 | | 314,844 | |
9
| | | Principal
Amountm | | Value
(U.S. $) | |
| | | | | | | | |
| CORPORATE BONDS (continued) | | | | | | | |
| Communications (continued) | | | | | | | |
| Level 3 Financing 9.25% 11/1/14 | | USD | | 980,000 | | $ | 891,800 | |
| Lucent Technologies 6.45% 3/15/29 | | | | 470,000 | | 390,688 | |
| MetroPCS Wireless 9.25% 11/1/14 | | | | 1,150,000 | | 1,086,750 | |
·# | Nortel Networks 144A 9.493% 7/15/11 | | | | 590,000 | | 578,200 | |
| NTL Cable 9.125% 8/15/16 | | | | 310,000 | | 308,450 | |
# | PAETEC Holding 144A 9.50% 7/15/15 | | | | 225,000 | | 220,500 | |
# | Quebecor World 144A 7.75% 3/15/16 | | | | 510,000 | | 492,150 | |
| Qwest 7.50% 10/1/14 | | | | 560,000 | | 571,200 | |
| Qwest Capital Funding 7.25% 2/15/11 | | | | 480,000 | | 475,200 | |
| Rural Cellular | | | | | | | |
| 9.875% 2/1/10 | | | | 820,000 | | 854,850 | |
· | 10.661% 11/1/12 | | | | 175,000 | | 179,375 | |
· | Sprint Nextel 5.243% 6/28/10 | | | | 525,000 | | 504,765 | |
| Telecom Italia Capital 4.00% 1/15/10 | | | | 1,140,000 | | 1,117,091 | |
| Telefonica Emisiones 5.984% 6/20/11 | | | | 365,000 | | 375,763 | |
| THOMSON 5.70% 10/1/14 | | | | 1,325,000 | | 1,332,299 | |
| Time Warner Cable 5.40% 7/2/12 | | | | 1,895,000 | | 1,900,683 | |
| Time Warner Telecom Holdings 9.25% 2/15/14 | | | | 380,000 | | 390,450 | |
| Triton PCS 8.50% 6/1/13 | | | | 675,000 | | 702,000 | |
*# | Univision Communications PIK 144A 9.75% 3/15/15 | | | | 240,000 | | 219,900 | |
| Viacom | | | | | | | |
· | 5.341% 6/16/09 | | | | 390,000 | | 385,470 | |
| 5.75% 4/30/11 | | | | 320,000 | | 324,268 | |
| Windstream 8.125% 8/1/13 | | | | 435,000 | | 452,400 | |
| | | | | | | 28,862,579 | |
| Consumer Cyclical–2.82% | | | | | | | |
*# | Allison Transmission 144A 11.00% 11/1/15 | | | | 270,000 | | 247,050 | |
* | Carrols 9.00% 1/15/13 | | | | 230,000 | | 210,450 | |
| Corrections Corporation of America 7.50% 5/1/11 | | | | 270,000 | | 274,725 | |
| CVS Caremark | | | | | | | |
| 4.875% 9/15/14 | | | | 390,000 | | 377,201 | |
| 5.75% 6/1/17 | | | | 1,257,000 | | 1,267,370 | |
· | DaimlerChrysler Holding 5.328% 8/3/09 | | | | 980,000 | | 973,696 | |
| Ford Motor | | | | | | | |
| 7.45% 7/16/31 | | | | 610,000 | | 455,975 | |
| 7.70% 5/15/97 | | | | 230,000 | | 158,700 | |
| Ford Motor Credit | | | | | | | |
| 5.75% 1/12/09 | | EUR | | 1,096,000 | | 1,546,490 | |
| 7.375% 10/28/09 | | USD | | 110,000 | | 103,580 | |
* | 7.80% 6/1/12 | | | | 15,000 | | 13,162 | |
· | 7.993% 1/13/12 | | | | 740,000 | | 622,093 | |
| 8.00% 12/15/16 | | | | 290,000 | | 246,700 | |
| 9.75% 9/15/10 | | | | 555,000 | | 529,886 | |
# | Galaxy Entertainment Finance 144A 9.875% 12/15/12 | | | | 560,000 | | 593,600 | |
| Gaylord Entertainment 8.00% 11/15/13 | | | | 800,000 | | 800,000 | |
| General Motors | | | | | | | |
| 6.375% 5/1/08 | | USD | | 750,000 | | $ | 746,250 | |
* | 8.375% 7/15/33 | | | | 1,635,000 | | 1,324,350 | |
| Global Cash Access/Finance 8.75% 3/15/12 | | | | 300,000 | | 283,500 | |
| GMAC | | | | | | | |
| 4.75% 9/14/09 | | EUR | | 1,026,000 | | 1,332,527 | |
| 5.375% 6/6/11 | | EUR | | 774,000 | | 935,952 | |
· | 6.119% 5/15/09 | | USD | | 2,630,000 | | 2,450,486 | |
| 6.875% 9/15/11 | | | | 1,855,000 | | 1,588,176 | |
| 6.875% 8/28/12 | | | | 58,000 | | 48,648 | |
| Lear 8.75% 12/1/16 | | | | 740,000 | | 677,100 | |
| Majestic Star Casino 9.50% 10/15/10 | | | | 985,000 | | 935,750 | |
| Mandalay Resort Group | | | | | | | |
| 9.375% 2/15/10 | | | | 250,000 | | 260,000 | |
| 9.50% 8/1/08 | | | | 700,000 | | 717,500 | |
| McDonald’s 6.30% 10/15/37 | | | | 1,060,000 | | 1,103,020 | |
| Neiman Marcus Group PIK 9.00% 10/15/15 | | | | 600,000 | | 621,750 | |
| Penney (J.C.) 7.375% 8/15/08 | | | | 630,000 | | 637,416 | |
| PepsiCo 4.65% 2/15/13 | | | | 960,000 | | 967,538 | |
# | Pokagon Gaming Authority 144A 10.375% 6/15/14 | | | | 395,000 | | 426,600 | |
| Station Casinos | | | | | | | |
| 6.00% 4/1/12 | | | | 105,000 | | 93,975 | |
| 6.625% 3/15/18 | | | | 535,000 | | 369,150 | |
*# | Tenneco 144A 8.125% 11/15/15 | | | | 285,000 | | 283,575 | |
| Toyota Motor Credit 1.30% 3/16/12 | | JPY | | 40,000,000 | | 362,530 | |
# | TRW Automotive 144A 7.00% 3/15/14 | | USD | | 220,000 | | 203,500 | |
| | | | | | | 24,789,971 | |
| Consumer Non-Cyclical–2.99% | | | | | | | |
| Abbott Laboratories | | | | | | | |
| 5.15% 11/30/12 | | | | 1,250,000 | | 1,278,935 | |
| 5.60% 11/30/17 | | | | 2,000,000 | | 2,058,738 | |
| ACCO Brands 7.625% 8/15/15 | | | | 225,000 | | 201,938 | |
# | AmBev International Finance 144A 9.50% 7/24/17 | | BRL | | 1,455,000 | | 694,803 | |
| Amgen 144A | | | | | | | |
# | 5.85% 6/1/17 | | USD | | 651,000 | | 662,025 | |
| 6.375% 6/1/37 | | | | 1,023,000 | | 1,040,731 | |
| Anheuser Busch 5.50% 1/15/18 | | | | 1,205,000 | | 1,232,520 | |
| Aramark 8.50% 2/1/15 | | | | 1,100,000 | | 1,119,250 | |
| AstraZeneca 5.90% 9/15/17 | | | | 2,050,000 | | 2,156,594 | |
# | Cerveceria Nacional Dominicana 144A 8.00% 3/27/14 | | | | 358,000 | | 364,265 | |
* | Chiquita Brands International 8.875% 12/1/15 | | | | 275,000 | | 250,250 | |
| Clorox 5.45% 10/15/12 | | | | 570,000 | | 575,307 | |
* | Constellation Brands 8.125% 1/15/12 | | | | 485,000 | | 488,638 | |
| Cott Beverages 8.00% 12/15/11 | | | | 280,000 | | 261,800 | |
# | Covidien International Finance 144A | | | | | | | |
| 6.00% 10/15/17 | | | | 489,000 | | 506,920 | |
| 6.55% 10/15/37 | | | | 785,000 | | 817,972 | |
10
| | | Principal
Amountm | | Value
(U.S. $) | |
| | | | | | | | |
| CORPORATE BONDS (continued) | | | | | | | |
| Consumer Non-Cyclical (continued) | | | | | | | |
| CRC Health 10.75% 2/1/16 | | USD | | 1,040,000 | | $ | 1,071,200 | |
| Del Monte | | | | | | | |
| 6.75% 2/15/15 | | | | 135,000 | | 128,250 | |
| 8.625% 12/15/12 | | | | 105,000 | | 106,313 | |
| Diageo Capital | | | | | | | |
| 5.20% 1/30/13 | | | | 190,000 | | 191,078 | |
| 5.75% 10/23/17 | | | | 970,000 | | 977,322 | |
| HCA | | | | | | | |
| 9.25% 11/15/16 | | | | 725,000 | | 763,063 | |
| PIK 9.625% 11/15/16 | | | | 660,000 | | 699,600 | |
| Jarden 7.50% 5/1/17 | | | | 505,000 | | 436,825 | |
| Kellogg 5.125% 12/3/12 | | | | 855,000 | | 863,088 | |
| Kraft Foods | | | | | | | |
| 4.125% 11/12/09 | | | | 15,000 | | 14,877 | |
| 6.125% 2/1/18 | | | | 2,075,000 | | 2,094,764 | |
| National Beef Packing 10.50% 8/1/11 | | | | 360,000 | | 343,800 | |
| Omnicare 6.875% 12/15/15 | | | | 400,000 | | 374,000 | |
* | Pilgrim’s Pride 8.375% 5/1/17 | | | | 943,000 | | 928,855 | |
| Safeway 6.35% 8/15/17 | | | | 570,000 | | 595,160 | |
# | Seminole Indian Tribe of Florida 144A 7.804% 10/1/20 | | | | 285,000 | | 294,171 | |
| Universal Hospital PIK 8.50% 6/1/15 | | | | 450,000 | | 456,750 | |
| Wyeth 5.50% 2/1/14 | | | | 2,195,000 | | 2,232,242 | |
| | | | | | | 26,282,044 | |
| Electric–1.92% | | | | | | | |
| AES | | | | | | | |
| 7.75% 3/1/14 | | | | 350,000 | | 354,375 | |
# | 144A 8.00% 10/15/17 | | | | 275,000 | | 282,563 | |
‡# | Calpine 144A 8.496% 7/15/09 | | | | 376,338 | | 398,918 | |
| Commonwealth Edison 6.15% 9/15/17 | | | | 800,000 | | 825,913 | |
| Duquense Light Holdings 5.50% 8/15/15 | | | | 1,050,000 | | 1,011,449 | |
| Elwood Energy 8.159% 7/5/26 | | | | 805,854 | | 809,615 | |
# | Illinois Power 144A 6.125% 11/15/17 | | | | 615,000 | | 622,478 | |
| ISA Capital do Brasil | | | | | | | |
* | 7.875% 1/30/12 | | | | 225,000 | | 230,063 | |
| 8.80% 1/30/17 | | | | 100,000 | | 103,250 | |
# | ISA Capital do Brasil 144A | | | | | | | |
* | 7.875% 1/30/12 | | | | 1,075,000 | | 1,099,187 | |
| 8.80% 1/30/17 | | | | 565,000 | | 583,363 | |
| MidAmerican Energy Holdings 5.95% 5/15/37 | | | | 1,050,000 | | 1,021,943 | |
| Midamerican Funding 6.75% 3/1/11 | | | | 20,000 | | 21,311 | |
| Midwest Generation 8.30% 7/2/09 | | | | 340,385 | | 345,491 | |
| Mirant Americas Generation 8.30% 5/1/11 | | | | 540,000 | | 544,050 | |
| Mirant North America 7.375% 12/31/13 | | | | 430,000 | | 433,225 | |
| NRG Energy 7.375% 2/1/16 | | | | 2,010,000 | | 1,964,774 | |
| Orion Power Holdings 12.00% 5/1/10 | | | | 575,000 | | 629,625 | |
| Pacific Gas & Electric 5.625% 11/30/17 | | | | 810,000 | | 813,983 | |
| Pepco Holdings 6.125% 6/1/17 | | | | 685,000 | | 697,991 | |
| Potomac Electric Power 6.50% 11/15/37 | | USD | | 100,000 | | $ | 101,489 | |
# | Power Contract Financing 144A 6.256% 2/1/10 | | | | 110,831 | | 113,240 | |
| PSEG Power 5.50% 12/1/15 | | | | 560,000 | | 549,119 | |
| Southwestern Electric Power 5.875% 3/1/18 | | | | 1,130,000 | | 1,116,815 | |
| Virginia Electric Power 5.10% 11/30/12 | | | | 1,730,000 | | 1,739,303 | |
# | West Penn Power 144A 5.95% 12/15/17 | | | | 455,000 | | 458,070 | |
| | | | | | | 16,871,603 | |
| Energy–1.77% | | | | | | | |
| Apache 5.25% 4/15/13 | | | | 305,000 | | 312,542 | |
| Chesapeake Energy | | | | | | | |
| 6.375% 6/15/15 | | | | 50,000 | | 48,625 | |
| 6.625% 1/15/16 | | | | 705,000 | | 692,663 | |
| Compton Petroleum Finance 7.625% 12/1/13 | | | | 415,000 | | 388,025 | |
| Devon Energy 7.95% 4/15/32 | | | | 145,000 | | 177,985 | |
| EnCana 5.90% 12/1/17 | | | | 910,000 | | 932,646 | |
| Energy Partners 9.75% 4/15/14 | | | | 450,000 | | 427,500 | |
| Enterprise Products Operating | | | | | | | |
| 5.60% 10/15/14 | | | | 795,000 | | 794,513 | |
· | 8.375% 8/1/66 | | | | 475,000 | | 487,064 | |
| Geophysique-Veritas | | | | | | | |
| 7.50% 5/15/15 | | | | 85,000 | | 86,488 | |
| 7.75% 5/15/17 | | | | 370,000 | | 375,550 | |
*# | Helix Energy Solutions 144A 9.50% 1/15/16 | | | | 220,000 | | 224,950 | |
# | Hilcorp Energy I 144A 9.00% 6/1/16 | | | | 470,000 | | 488,800 | |
| Husky Energy 6.80% 9/15/37 | | | | 480,000 | | 506,179 | |
# | Key Energy Services 144A 8.375% 12/1/14 | | | | 285,000 | | 292,838 | |
# | Lukoil International Finance 144A 6.356% 6/7/17 | | | | 755,000 | | 716,646 | |
| Mariner Energy 8.00% 5/15/17 | | | | 400,000 | | 382,500 | |
# | OPTI Canada 144A | | | | | | | |
| 7.875% 12/15/14 | | | | 250,000 | | 245,625 | |
| 8.25% 12/15/14 | | | | 75,000 | | 74,625 | |
| Petrobras International Finance 5.875% 3/1/18 | | | | 1,140,000 | | 1,139,429 | |
| PetroHawk Energy 9.125% 7/15/13 | | | | 610,000 | | 645,075 | |
| Plains Exploration & Production 7.00% 3/15/17 | | | | 495,000 | | 475,819 | |
# | Ras Laffan Liquefied Natural Gas III 144A | | | | | | | |
| 5.832% 9/30/16 | | | | 425,000 | | 432,611 | |
| 5.838% 9/30/27 | | | | 500,000 | | 473,350 | |
| Siberian Oil 10.75% 1/15/09 | | | | 30,000 | | 31,422 | |
# | Stallion Oilfield Services 144A 9.75% 2/1/15 | | | | 325,000 | | 300,625 | |
| Suncor Energy 6.50% 6/15/38 | | | | 790,000 | | 847,586 | |
11
| | | Principal
Amountm | | Value
(U.S. $) | |
| | | | | | | | |
| CORPORATE BONDS (continued) | | | | | | | |
| Energy (continued) | | | | | | | |
| TransCanada Pipelines | | | | | | | |
| 6.20% 10/15/37 | | USD | | 985,000 | | $ | 981,301 | |
· | 6.35% 5/15/67 | | | | 420,000 | | 394,334 | |
| Whiting Petroleum 7.25% 5/1/13 | | | | 735,000 | | 727,650 | |
| Williams 7.50% 1/15/31 | | | | 925,000 | | 999,000 | |
| XTO Energy 6.25% 8/1/17 | | | | 405,000 | | 425,659 | |
| | | | | | | 15,529,625 | |
| Finance Companies–1.63% | | | | | | | |
· | American Express 6.80% 9/1/66 | | | | 1,130,000 | | 1,147,640 | |
# | Capmark Financial Group 144A 6.30% 5/10/17 | | | | 864,000 | | 645,122 | |
| Cardtronics 9.25% 8/15/13 | | | | 295,000 | | 289,100 | |
| FTI Consulting 7.625% 6/15/13 | | | | 925,000 | | 952,750 | |
| General Electric Capital | | | | | | | |
| 5.125% 1/28/14 | | SEK | | 6,500,000 | | 998,615 | |
| 5.625% 9/15/17 | | USD | | 960,000 | | 986,772 | |
· | 5.81% 2/2/11 | | NOK | | 7,500,000 | | 1,365,283 | |
| General Electric Capital UK Funding 4.625% 1/18/16 | | GBP | | 503,000 | | 929,136 | |
· | HSBC Financial 4.919% 4/24/10 | | CAD | | 688,000 | | 680,551 | |
·# | ILFC E-Capital Trust II 144A 6.25% 12/21/65 | | USD | | 660,000 | | 631,732 | |
| International Lease Finance | | | | | | | |
| 5.35% 3/1/12 | | | | 780,000 | | 781,231 | |
| 5.875% 5/1/13 | | | | 440,000 | | 447,792 | |
| Leucadia National 8.125% 9/15/15 | | | | 475,000 | | 477,375 | |
# | Nuveen Investments 144A 10.50% 11/15/15 | | | | 460,000 | | 460,575 | |
| SLM 5.375% 1/15/13 | | | | 2,510,000 | | 2,247,707 | |
| Washington Mutual | | | | | | | |
* | 5.25% 9/15/17 | | | | 530,000 | | 442,831 | |
| 5.50% 8/24/11 | | | | 545,000 | | 486,508 | |
·# | Xstrata Finance 144A 5.229% 11/13/09 | | | | 310,000 | | 309,234 | |
| | | | | | | 14,279,954 | |
| Industrial–0.08% | | | | | | | |
| American Railcar 7.50% 3/1/14 | | | | 150,000 | | 142,500 | |
| Trimas 9.875% 6/15/12 | | | | 610,000 | | 597,800 | |
| | | | | | | 740,300 | |
| Insurance–1.22% | | | | | | | |
| American International Group 5.85% 1/16/18 | | | | 1,295,000 | | 1,305,935 | |
| Berkshire Hathaway Finance 4.85% 1/15/15 | | | | 655,000 | | 656,939 | |
# | Max USA Holdings 144A 7.20% 4/14/17 | | | | 755,000 | | 763,269 | |
# | Metropolitan Life Global Funding I 144A 4.25% 7/30/09 | | | | 450,000 | | 450,444 | |
| Montpelier Re Holdings 6.125% 8/15/13 | | | | 195,000 | | 189,068 | |
t·# | Twin Reefs Pass Through Trust 144A 6.243% 12/31/49 | | | | 600,000 | | 391,242 | |
# | UnitedHealth Group 144A | | | | | | | |
| 5.50% 11/15/12 | | USD | | 1,500,000 | | $ | 1,523,860 | |
| 6.00% 11/15/17 | | | | 1,950,000 | | 1,979,577 | |
| Unitrin 6.00% 5/15/17 | | | | 775,000 | | 742,447 | |
| Unum Group 5.859% 5/15/09 | | | | 320,000 | | 325,925 | |
| WellPoint | | | | | | | |
| 5.00% 1/15/11 | | | | 1,055,000 | | 1,057,257 | |
| 5.00% 12/15/14 | | | | 836,000 | | 801,968 | |
·# | White Mountains Re Group 144A 7.506% 5/29/49 | | | | 625,000 | | 560,815 | |
| | | | | | | 10,748,746 | |
| Natural Gas–0.85% | | | | | | | |
| AmeriGas Partners 7.125% 5/20/16 | | | | 490,000 | | 477,750 | |
| CenterPoint Energy Resource 6.125% 11/1/17 | | | | 505,000 | | 514,876 | |
| Dynergy Holdings 7.75% 6/1/19 | | | | 1,040,000 | | 964,600 | |
| El Paso | | | | | | | |
* | 6.875% 6/15/14 | | | | 415,000 | | 420,073 | |
| 7.00% 6/15/17 | | | | 360,000 | | 362,173 | |
# | El Paso Performance-Linked Trust 144A 7.75% 7/15/11 | | | | 325,000 | | 335,150 | |
| Ferrellgas Finance Escrow 6.75% 5/1/14 | | | | 195,000 | | 192,319 | |
| Inergy Finance | | | | | | | |
| 6.875% 12/15/14 | | | | 275,000 | | 268,813 | |
| 8.25% 3/1/16 | | | | 75,000 | | 78,000 | |
| Kinder Morgan Energy Partners 5.125% 11/15/14 | | | | 480,000 | | 468,354 | |
| Kinder Morgan Finance 5.35% 1/5/11 | | | | 620,000 | | 615,912 | |
| Regency Energy Partners 8.375% 12/15/13 | | | | 438,000 | | 453,330 | |
| Transocean 6.00% 3/15/18 | | | | 690,000 | | 689,458 | |
| Valero Energy | | | | | | | |
| 6.125% 6/15/17 | | | | 680,000 | | 692,292 | |
| 6.625% 6/15/37 | | | | 535,000 | | 540,531 | |
| Valero Logistics Operations 6.05% 3/15/13 | | | | 415,000 | | 424,677 | |
| | | | | | | 7,498,308 | |
| Real Estate–0.37% | | | | | | | |
| BF Saul REIT 7.50% 3/1/14 | | | | 516,000 | | 477,300 | |
* | Host Marriott 7.125% 11/1/13 | | | | 725,000 | | 734,062 | |
| iStar Financial | | | | | | | |
* | 5.15% 3/1/12 | | | | 375,000 | | 324,373 | |
| 5.875% 3/15/16 | | | | 635,000 | | 519,163 | |
| Regency Centers 5.875% 6/15/17 | | | | 510,000 | | 493,712 | |
·# | USB Realty 144A 6.091% 12/22/49 | | | | 800,000 | | 711,403 | |
| | | | | | | 3,260,013 | |
| Technology–0.41% | | | | | | | |
| Freescale Semiconductor 8.875% 12/15/14 | | | | 320,000 | | 287,200 | |
| International Business Machines 4.00% 11/11/11 | | EUR | | 1,000,000 | | 1,416,119 | |
12
| | | Principal
Amountm | | Value
(U.S. $) | |
| | | | | | | | |
| CORPORATE BONDS (continued) | | | | | | | |
| Technology (continued) | | | | | | | |
| Sungard Data Systems | | | | | | | |
| 9.125% 8/15/13 | | USD | | 345,000 | | $ | 352,763 | |
| 10.25% 8/15/15 | | | | 272,000 | | 279,480 | |
| Xerox 5.50% 5/15/12 | | | | 1,230,000 | | 1,251,642 | |
| | | | | | | 3,587,204 | |
| Transportation–0.70% | | | | | | | |
# | Erac USA Finance 144A 7.00% 10/15/37 | | | | 1,435,000 | | 1,307,134 | |
| Hertz 8.875% 1/1/14 | | | | 935,000 | | 952,531 | |
| Kansas City Southern de Mexico 9.375% 5/1/12 | | | | 805,000 | | 847,263 | |
| Kansas City Southern Railway 9.50% 10/1/08 | | | | 350,000 | | 358,750 | |
‡ | Northwest Airlines 10.00% 2/1/09 | | | | 145,000 | | 5,438 | |
| Red Arrow International Leasing 8.375% 3/31/12 | | RUB | | 59,787,974 | | 2,461,027 | |
| Seabulk International 9.50% 8/15/13 | | USD | | 215,000 | | 228,438 | |
| | | | | | | 6,160,581 | |
| Total Corporate Bonds (cost $215,154,799) | | | | | | 213,054,042 | |
| FOREIGN AGENCIES–1.48%æ | | | | | | | |
| | | | | | | | |
| Austria–0.21% | | | | | | | |
| Oesterreichische Kontrollbank 1.80% 3/22/10 | | JPY | | 196,000,000 | | 1,795,971 | |
| | | | | | | 1,795,971 | |
| Germany–1.27% | | | | | | | |
| KFW | | | | | | | |
| 1.75% 3/23/10 | | JPY | | 100,000,000 | | 915,347 | |
| 3.50% 7/4/21 | | EUR | | 2,194,000 | | 2,835,105 | |
| 4.125% 7/4/17 | | EUR | | 3,441,000 | | 4,870,022 | |
| 6.00% 7/15/09 | | NZD | | 2,210,000 | | 1,633,258 | |
| Rentenbank 1.375% 4/25/13 | | JPY | | 103,000,000 | | 935,279 | |
| | | | | | | 11,189,011 | |
| Total Foreign Agencies (cost $12,428,003) | | | | | | 12,984,982 | |
| | | | | | | | |
| MUNICIPAL BONDS–0.30% | | | | | | | |
| Augusta, Georgia Water & Sewer Revenue 5.25% 10/1/39 (FSA) | | USD | | 85,000 | | 89,636 | |
| Buckeye Tobacco Settlement Financing Authority 5.875% 6/1/47 | | | | 1,380,000 | | 1,324,856 | |
| California State 5.00% 2/1/33 | | | | 25,000 | | 27,260 | |
| California State University Systemwide Revenue 5.00% 11/1/30 (AMBAC) | | | | 95,000 | | 98,624 | |
| Illinois State Taxable Pension 5.10% 6/1/33 | | | | 10,000 | | 9,652 | |
| Massachusetts Health & Education Facilities Authority Revenue Series A 5.00% 7/15/36 | | | | 220,000 | | 229,319 | |
| New Jersey Economic Development Authority Revenue Cigarette Tax 5.75% 6/15/29 | | USD | | 25,000 | | $ | 24,531 | |
| New York State Urban Development Series A-1 5.25% 3/15/34 (FGIC) | | | | 40,000 | | 41,974 | |
| Oregon State Taxable Pension 5.892% 6/1/27 | | | | 5,000 | | 5,273 | |
| West Virginia Tobacco Settlement Finance Authority 7.467% 6/1/47 | | | | 865,000 | | 809,121 | |
| Total Municipal Bonds (cost $2,716,054) | | | | | | 2,660,246 | |
| | | | | | | | |
| NON-AGENCY ASSET-BACKED SECURITIES–4.64% | | | | | | | |
· | Bank of America Credit Card Trust Series 2006-A10 A10 5.008% 2/15/12 | | | | 9,585,000 | | 9,543,718 | |
| Capital Auto Receivables Asset Trust Series 2007-3 A3A 5.02% 9/15/11 | | | | 1,005,000 | | 1,012,489 | |
| Capital One Multi-Asset Execution Trust Series 2007-A7 A7 5.75% 7/15/20 | | | | 900,000 | | 905,569 | |
| Caterpillar Financial Asset Trust Series 2007-A A3A 5.34% 6/25/12 | | | | 325,000 | | 329,895 | |
| Chase Funding Mortgage Loan Asset-Backed Certificates Series 2002-3 1A6 4.707% 9/25/13 | | | | 801,676 | | 804,107 | |
· | Chase Issuance Trust Series 2007-A11 A11 5.028% 7/16/12 | | | | 7,562,500 | | 7,510,841 | |
| Citibank Credit Card Issuance Trust | | | | | | | |
| Series 2007-A3 A3 6.15% 6/15/39 | | | | 1,797,000 | | 1,806,854 | |
· | Series 2007-A6 A6 5.238% 7/12/12 | | | | 10,500,000 | | 10,431,493 | |
· | Series 2007-A7 A7 5.299% 8/20/14 | | | | 1,065,000 | | 1,065,848 | |
| CNH Equipment Trust Series 2007-B A3A 5.40% 10/17/11 | | | | 470,000 | | 476,150 | |
· | Countrywide Asset-Backed Certificates Series 2006-S7 A3 5.712% 11/25/35 | | | | 1,165,000 | | 1,008,110 | |
| Discover Card Master Trust Series 2007-A1 A1 5.65% 3/16/20 | | | | 1,580,000 | | 1,578,004 | |
# | Dunkin Securitization Series 2006-1 A2 144A 5.779% 6/20/31 | | | | 1,325,000 | | 1,278,023 | |
· | GMAC Mortgage Loan Trust Series 2006-HE3 A2 5.75% 10/25/36 | | | | 180,000 | | 162,610 | |
| Hyundai Auto Receivables Trust Series 2007-A A3A 5.04% 1/17/12 | | | | 325,000 | | 326,531 | |
·# | MASTR Specialized Loan Trust Series 2005-2 A2 144A 5.006% 7/25/35 | | | | 193,056 | | 175,500 | |
· | Merrill Lynch Mortgage Investors Series 2006-AR1 A2C 5.025% 3/25/37 | | | | 130,000 | | 121,125 | |
| Mid-State Trust Series 11 A1 4.864% 7/15/38 | | | | 17,117 | | 16,837 | |
| Mid-State Trust Series 2005-1 A 5.745% 1/15/40 | | | | 195,918 | | 187,408 | |
13
| | | Principal
Amountm | | Value
(U.S. $) | |
| | | | | | | | |
| NON-AGENCY ASSET-BACKED SECURITIES (continued) | | | | | | | |
# | Mid-State Trust Series 2006-1 A 144A 5.787% 10/15/40 | | USD | | 239,795 | | $ | 228,630 | |
| Renaissance Home Equity Loan Trust Series 2005-4 A2 5.399% 2/25/36 | | | | 25,859 | | 25,768 | |
· | Residential Asset Securities Series 2006-KS3 AI3 5.035% 4/25/36 | | | | 105,000 | | 100,122 | |
| RSB Bondco Series 2007-A A2 5.72% 4/1/18 | | | | 555,000 | | 577,390 | |
·# | SLM Student Loan Trust Series 2003-4 A5C 144A 5.151% 3/15/33 | | | | 1,035,000 | | 1,024,650 | |
| Structured Asset Securities Series 2001-SB1 A2 3.375% 8/25/31 | | | | 41,661 | | 36,082 | |
| Total Non-Agency Asset-Backed Securities (cost $41,131,275) | | | | | | 40,733,754 | |
| | | | | | | | |
| NON-AGENCY COLLATERALIZED MORTGAGE OBLIGATIONS – 7.40% | | | | | | | |
· | Adjustable Rate Mortgage Trust Series 2005-10 3A11 5.416% 1/25/36 | | | | 1,060,271 | | 1,025,034 | |
| Bank of America Alternative Loan Trust | | | | | | | |
| Series 2003-10 2A1 6.00% 12/25/33 | | | | 1,067,663 | | 1,070,332 | |
| Series 2004-2 1A1 6.00% 3/25/34 | | | | 2,727 | | 2,734 | |
| Series 2004-10 1CB1 6.00% 11/25/34 | | | | 73,176 | | 72,673 | |
| Series 2004-11 1CB1 6.00% 12/25/34 | | | | 4,476 | | 4,487 | |
| Series 2005-1 2A1 5.50% 2/25/20 | | | | 639,866 | | 643,666 | |
| Series 2005-3 2A1 5.50% 4/25/20 | | | | 88,834 | | 89,362 | |
| Series 2005-5 2CB1 6.00% 6/25/35 | | | | 161,989 | | 162,394 | |
| Series 2005-6 7A1 5.50% 7/25/20 | | | | 323,408 | | 321,893 | |
| Series 2005-9 5A1 5.50% 10/25/20 | | | | 451,912 | | 454,595 | |
| Bank of America Funding | | | | | | | |
| Series 2005-8 1A1 5.50% 1/25/36 | | | | 1,237,917 | | 1,226,312 | |
| Series 2006-5 2A10 5.75% 9/25/36 | | | | 1,650,000 | | 1,655,878 | |
| Bank of America Mortgage Securities | | | | | | | |
· | Series 2003-D 1A2 7.281% 5/25/33 | | | | 59 | | 60 | |
| Series 2005-9 2A1 4.75% 10/25/20 | | | | 301,262 | | 297,026 | |
· | Series 2005-A 1A1 4.093% 2/25/35 | | | | 79,272 | | 78,499 | |
· | Bear Stearns Adjustable Rate Mortgage Trust Series 2007-3 1A1 5.48% 5/25/47 | | | | 1,575,744 | | 1,566,071 | |
| Bear Stearns Asset Backed Securities Series 2005-AC8 A5 5.50% 11/25/35 | | | | 280,658 | | 282,068 | |
| Chase Mortgage Finance Series 2003-S8 A2 5.00% 9/25/18 | | | | 520,740 | | 509,942 | |
| Citicorp Mortgage Securities Series 2006-3 1A4 6.00% 6/25/36 | | | | 1,180,000 | | 1,166,806 | |
· | Citigroup Mortgage Loan Trust | | | | | | | |
| Series 2004-UST1 A6 5.087% 8/25/34 | | | | 1,777,191 | | 1,753,959 | |
| Series 2007-AR5 1AB 5.617% 4/25/37 | | | | 771,546 | | 766,034 | |
| Series 2007-AR8 1A3A 6.059% 8/25/37 | | | | 1,333,619 | | 1,327,351 | |
| Countrywide Alternative Loan Trust | | | | | | | |
| Series 2004-28CB 6A1 6.00% 1/25/35 | | | | 375,690 | | 376,630 | |
· | Series 2004-J7 1A2 4.673% 8/25/34 | | USD | | 11,494 | | $ | 11,436 | |
· | Series 2005-63 3A1 5.891% 11/25/35 | | | | 312,709 | | 303,624 | |
| Series 2006-2CB A3 5.50% 3/25/36 | | | | 249,354 | | 247,931 | |
t | Countrywide Home Loan Mortgage Pass Through Trust | | | | | | | |
· | Series 2003-21 A1 4.093% 5/25/33 | | | | 764 | | 766 | |
· | Series 2004-HYB4 M 4.834% 9/20/34 | | | | 373,411 | | 356,140 | |
| Series 2005-23 A1 5.50% 11/25/35 | | | | 1,640,608 | | 1,613,436 | |
| Series 2006-1 A2 6.00% 3/25/36 | | | | 285,900 | | 286,793 | |
| Series 2006-1 A3 6.00% 3/25/36 | | | | 164,490 | | 161,303 | |
| Series 2006-17 A5 6.00% 12/25/36 | | | | 566,765 | | 573,494 | |
· | Series 2006-HYB3 3A1A 6.095% 5/20/36 | | | | 356,688 | | 369,469 | |
· | Series 2007-HYB1 4A2 5.933% 3/25/37 | | | | 2,100,619 | | 2,095,407 | |
| Credit Suisse First Boston Mortgage Securities Series 2003-29 5A1 7.00% 12/25/33 | | | | 9,446 | | 9,443 | |
| First Horizon Asset Securities | | | | | | | |
| Series 2003-5 1A17 8.00% 8/25/33 | | | | 1,883 | | 2,003 | |
· | Series 2004-AR5 4A1 5.70% 10/25/34 | | | | 26,916 | | 26,845 | |
· | Series 2007-AR2 1A1 5.855% 8/25/37 | | | | 1,414,373 | | 1,416,141 | |
· | Series 2007-AR3 2A2 6.315% 11/25/37 | | | | 2,675,176 | | 2,689,262 | |
· | GMAC Mortgage Loan Trust Series 2005-AR2 4A 5.183% 5/25/35 | | | | 1,685,854 | | 1,658,983 | |
# | GSMPS Mortgage Loan Trust 144A | | | | | | | |
| Series 2005-RP1 1A3 8.00% 1/25/35 | | | | 280,287 | | 303,173 | |
| Series 2005-RP1 1A4 8.50% 1/25/35 | | | | 221,177 | | 241,074 | |
| Series 2006-RP1 1A2 7.50% 1/25/36 | | | | 361,398 | | 391,618 | |
| GSR Mortgage Loan Trust | | | | | | | |
| Series 2006-1F 5A2 6.00% 2/25/36 | | | | 214,278 | | 213,341 | |
· | Series 2006-AR1 3A1 5.392% 1/25/36 | | | | 599,550 | | 592,446 | |
· | JPMorgan Mortgage Trust | | | | | | | |
| Series 2004-A6 1A2 4.853% 12/25/34 | | | | 549,058 | | 543,408 | |
| Series 2005-A4 1A1 5.401% 7/25/35 | | | | 314,152 | | 310,925 | |
| Series 2005-A6 1A2 5.138% 9/25/35 | | | | 855,000 | | 836,212 | |
| Series 2005-A8 2A1 4.948% 11/25/35 | | | | 2,220,384 | | 2,206,374 | |
| Lehman Mortgage Trust | | | | | | | |
| Series 2005-2 2A3 5.50% 12/25/35 | | | | 239,696 | | 239,209 | |
| Series 2006-1 3A3 5.50% 2/25/36 | | | | 23,400 | | 23,238 | |
· | MASTR Adjustable Rate Mortgages Trust | | | | | | | |
| Series 2003-6 1A2 6.739% 12/25/33 | | | | 2,767 | | 2,856 | |
| Series 2005-6 7A1 5.326% 6/25/35 | | | | 191,078 | | 188,820 | |
| Series 2006-2 4A1 4.991% 2/25/36 | | | | 53,964 | | 52,734 | |
| MASTR Alternative Loans Trust Series 2003-9 1A1 5.50% 12/25/18 | | | | 49,666 | | 49,433 | |
# | MASTR Reperforming Loan Trust 144A | | | | | | | |
| Series 2005-1 1A5 8.00% 8/25/34 | | | | 435,558 | | 469,686 | |
| Series 2005-2 1A4 8.00% 5/25/35 | | | | 256,169 | | 276,716 | |
| Morgan Stanley Mortgage Loan Trust Series 2006-2 6A 6.50% 2/25/36 | | | | 196,052 | | 196,603 | |
| Nomura Asset Acceptance | | | | | | | |
| Series 2005-WF1 2A2 4.786% 3/25/35 | | | | 275,000 | | 258,982 | |
· | Series 2006-AF1 1A2 6.159% 5/25/36 | | | | 400,000 | | 382,566 | |
14
| | | Principal
Amountm | | Value
(U.S. $) | |
| | | | | | | | |
| NON-AGENCY COLLATERALIZED MORTGAGE OBLIGATIONS (continued) | | | | | | | |
| Prime Mortgage Trust Series 2004-CL1 1A1 6.00% 2/25/34 | | USD | | 9,164 | | $ | 9,307 | |
| Residential Asset Mortgage Products | | | | | | | |
| Series 2004-SL1 A3 7.00% 11/25/31 | | | | 430 | | 439 | |
| Series 2004-SL4 A3 6.50% 7/25/32 | | | | 41,722 | | 41,421 | |
| Series 2005-SL1 A2 6.00% 5/25/32 | | | | 102,196 | | 103,087 | |
· | Residential Funding Mortgage Securities I Series 2006-SA3 3A1 6.038% 9/25/36 | | | | 452,512 | | 452,518 | |
· | Structured Adjustable Rate Mortgage Loan Trust Series 2004-18 5A 5.50% 12/25/34 | | | | 33,673 | | 33,171 | |
| Structured Asset Securities | | | | | | | |
· | Series 2002-22H 1A 6.965% 11/25/32 | | | | 1,412 | | 1,419 | |
| Series 2004-5H A2 4.43% 12/25/33 | | | | 83,131 | | 82,768 | |
| Series 2004-12H 1A 6.00% 5/25/34 | | | | 411,100 | | 415,596 | |
t | Washington Mutual Alternative Mortgage Pass Through Certificates | | | | | | | |
| Series 2005-1 5A2 6.00% 3/25/35 | | | | 49,741 | | 50,130 | |
| Series 2005-9 3CB 5.50% 10/25/20 | | | | 250,311 | | 251,798 | |
| Series 2006-5 2CB3 6.00% 9/25/36 | | | | 475,132 | | 473,295 | |
t | Washington Mutual Mortgage Pass Through Certificates | | | | | | | |
| Series 2004-CB3 1A 6.00% 10/25/34 | | | | 309,222 | | 309,995 | |
| Series 2004-CB3 4A 6.00% 10/25/19 | | | | 90,022 | | 91,456 | |
· | Series 2006-AR10 1A1 5.942% 7/25/36 | | | | 478,774 | | 483,777 | |
· | Series 2006-AR14 2A1 5.761% 11/25/36 | | | | 3,200,876 | | 3,190,823 | |
· | Series 2007-HY1 1A1 5.715% 2/25/37 | | | | 43,969 | | 43,826 | |
· | Series 2007-HY3 4A1 5.35% 3/25/37 | | | | 2,621,130 | | 2,609,047 | |
· | Series 2007-HY6 2A2 5.285% 6/25/37 | | | | 1,433,221 | | 1,408,184 | |
| Wells Fargo Mortgage Backed Securities Trust | | | | | | | |
· | Series 2004-O A1 4.892% 8/25/34 | | | | 3,964,322 | | 3,888,047 | |
· | Series 2004-T A1 6.18% 9/25/34 | | | | 61,882 | | 62,034 | |
| Series 2005-12 1A7 5.50% 11/25/35 | | | | 462,797 | | 450,504 | |
| Series 2005-17 1A2 5.50% 1/25/36 | | | | 375,764 | | 365,783 | |
| Series 2005-18 1A1 5.50% 1/25/36 | | | | 54,417 | | 53,482 | |
· | Series 2005-AR16 6A4 5.00% 10/25/35 | | | | 1,192,566 | | 1,194,329 | |
| Series 2006-1 A3 5.00% 3/25/21 | | | | 812,903 | | 801,472 | |
| Series 2006-2 3A1 5.75% 3/25/36 | | | | 479,349 | | 471,493 | |
| Series 2006-3 A11 5.50% 3/25/36 | | | | 2,295,000 | | 2,203,088 | |
| Series 2006-4 2A3 5.75% 4/25/36 | | | | 247,393 | | 243,691 | |
· | Series 2006-AR5 2A1 5.532% 4/25/36 | | | | 450,731 | | 453,482 | |
· | Series 2006-AR6 7A1 5.11% 3/25/36 | | | | 3,484,224 | | 3,391,024 | |
· | Series 2006-AR10 5A1 5.597% 7/25/36 | | | | 427,945 | | 431,130 | |
· | Series 2006-AR11 A7 5.516% 8/25/36 | | | | 2,260,728 | | 2,204,354 | |
· | Series 2006-AR12 1A2 6.025% 9/25/36 | | | | 263,823 | | 261,559 | |
· | Series 2006-AR14 2A4 6.088% 10/25/36 | | | | 367,522 | | 364,738 | |
· | Series 2006-AR18 2A2 5.718% 11/25/36 | | | | 1,099,983 | | 1,102,078 | |
· | Series 2006-AR19 A1 5.65% 12/25/36 | | | | 1,291,189 | | 1,268,612 | |
| Series 2007-8 2A6 6.00% 7/25/37 | | | | 310,000 | | 302,575 | |
| Series 2007-13 A7 6.00% 9/25/37 | | | | 1,002,901 | | 999,767 | |
| Total Non-Agency Collateralized Mortgage Obligations (cost $64,916,773) | | | | | | 65,020,995 | |
| | | | | | | | |
| REGIONAL AGENCIES–1.06%5 | | | | | | | |
| Australia–1.06% | | | | | | | |
| New South Wales Treasury | | | | | | | |
| 5.50% 3/1/17 | | AUD | | 1,681,000 | | $ | 1,340,096 | |
| 6.00% 5/1/12 | | AUD | | 2,088,000 | | 1,744,725 | |
| Queensland Treasury 6.00% 8/14/13 | | AUD | | 7,497,000 | | 6,255,737 | |
| Total Regional Agency (cost $9,301,346) | | | | | | 9,340,558 | |
| | | | | | | | |
| REGIONAL AUTHORITIES–0.20%5 | | | | | | | |
| Canada–0.20% | | | | | | | |
| Ontario Province 1.875% 1/25/10 | | JPY | | 55,000,000 | | 504,600 | |
| Quebec Province 4.50% 12/1/17 | | CAD | | 1,243,000 | | 1,246,765 | |
| Total Regional Authority (cost $1,710,534) | | | | | | 1,751,365 | |
| | | | | | | | |
« | SENIOR SECURED LOANS–1.87% | | | | | | | |
| Allied Waste North America 7.73% 3/28/14 | | USD | | 92,814 | | 88,899 | |
| ALLTEL 7.69% 12/21/14 | | | | 255,000 | | 246,234 | |
| Aramark | | | | | | | |
| 7.08% 1/26/14 | | | | 456,099 | | 434,911 | |
| 7.485% 1/26/14 | | | | 33,901 | | 32,248 | |
| AWAS 2nd Lien 11.44% 3/21/13 | | | | 410,728 | | 396,353 | |
| Bausch & Lomb 8.34% 4/11/15 | | | | 295,000 | | 294,103 | |
| Building Materials 8.256% 2/22/14 | | | | 298,502 | | 254,721 | |
| Community Health Systems | | | | | | | |
| 7.61% 7/2/14 | | | | 886,531 | | 854,949 | |
| 7.61% 8/25/14 | | | | 43,852 | | 42,289 | |
| Cricket Communications 7.94% 6/16/13 | | | | 124,369 | | 122,892 | |
| Dynegy Holdings 7.65% 4/2/13 | | | | 410,000 | | 389,158 | |
| Energy Futures Holdings | | | | | | | |
| 7.565% 10/10/14 | | | | 1,030,000 | | 1,011,733 | |
| 8.39% 10/10/14 | | | | 950,000 | | 933,636 | |
| Freescale Semiconductor 7.37% 12/1/13 | | | | 234,410 | | 217,572 | |
| Georgia Pacific Term Tranche Loan B 7.115% 12/22/12 | | | | 225,000 | | 214,610 | |
| Goodyear Tire 7.47% 4/30/14 | | | | 270,000 | | 251,775 | |
| HCA 7.12% 11/18/13 | | | | 1,159,750 | | 1,117,709 | |
| Healthsouth 8.62% 3/10/13 | | | | 529,715 | | 506,982 | |
| Idearc 7.35% 11/1/14 | | | | 397,499 | | 378,967 | |
| Jarden 7.67% 1/24/12 | | | | 248,718 | | 240,502 | |
| MacDermid 7.45% 4/12/14 | | | | 201,199 | | 192,145 | |
| MetroPCS Wireless 9.70% 2/20/14 | | | | 235,000 | | 226,710 | |
| NE Energy 7.87% 11/1/13 | | | | 194,971 | | 186,502 | |
| Solar Capital 7.53% 2/11/13 | | | | 194,509 | | 188,242 | |
| Stallion Oilfield Services 10.86% 6/12/13 | | | | 800,000 | | 760,000 | |
| Talecris Biotherapeutics 2nd Lien 11.85% 12/6/14 | | | | 705,000 | | 703,238 | |
| Telesat Canada 9.00% 2/14/08 | | | | 1,345,000 | | 1,284,475 | |
| Time Warner Telecom Holdings 7.62% 1/7/13 | | | | 245,000 | | 236,731 | |
| United Airlines 7.375% 2/1/14 | | | | 573,777 | | 538,097 | |
| Univision Communications 7.60% 9/15/14 | | | | 475,000 | | 433,867 | |
| US Airways Group 8.05% 3/23/14 | | | | 175,000 | | 162,166 | |
| Windstream Term Loan B 6.86% 7/17/13 | | | | 3,567,075 | | 3,509,305 | |
| Total Senior Secured Loans (cost $16,918,977) | | | | | | 16,451,721 | |
15
| | | Principal
Amountm | | Value
(U.S. $) | |
| | | | | | | | |
| SOVEREIGN AGENCIES–0.11%5 | | | | | | | |
| Norway–0.11% | | | | | | | |
| Kommunalbanken 4.25% 10/24/11 | | NOK | | 5,340,000 | | $ | 954,590 | |
| Total Sovereign Agencies (cost $856,555) | | | | | | 954,590 | |
| | | | | | | | |
| SOVEREIGN DEBT–14.03%5 | | | | | | | |
| Austria–0.63% | | | | | | | |
| Republic of Austria | | | | | | | |
| 5.25% 1/4/11 | | EUR | | 1,267,000 | | 1,908,265 | |
# | 144A 4.00% 9/15/16 | | EUR | | 2,546,000 | | 3,618,517 | |
| | | | | | | 5,526,782 | |
| Canada–0.40% | | | | | | | |
| Canadian Government | | | | | | | |
| 3.75% 6/1/12 | | CAD | | 2,710,000 | | 2,714,227 | |
| 4.00% 6/1/17 | | CAD | | 800,000 | | 805,796 | |
| | | | | | | 3,520,023 | |
| Colombia–0.08% | | | | | | | |
| Republic of Colombia 12.00% 10/22/15 | | COP | | 1,343,000,00 | | 740,367 | |
| | | | | | | 740,367 | |
| Finland–0.02% | | | | | | | |
| Republic of Finland 4.75% 2/21/12 | | NOK | | 1,110,000 | | 201,943 | |
| | | | | | | 201,943 | |
| France–0.51% | | | | | | | |
| France Government O.A.T. | | | | | | | |
| 4.00% 10/25/38 | | EUR | | 1,690,000 | | 2,204,426 | |
| 4.00% 4/25/55 | | EUR | | 1,738,000 | | 2,242,320 | |
| | | | | | | 4,446,746 | |
| Germany–1.06% | | | | | | | |
| Bundesobligation 4.25% 10/12/12 | | EUR | | 1,211,000 | | 1,777,057 | |
| Deutschland Republic | | | | | | | |
| 4.25% 7/4/17 | | EUR | | 2,891,000 | | 4,199,983 | |
| 6.25% 1/4/24 | | EUR | | 1,934,000 | | 3,357,842 | |
| | | | | | | 9,334,882 | |
| Indonesia–0.54% | | | | | | | |
| Republic of Indonesia | | | | | | | |
| 6.625% 2/17/37 | | USD | | 1,108,000 | | 1,056,825 | |
| 10.00% 9/17/24 | | IDR | | 4,500,000,000 | | 455,705 | |
| 10.25% 7/15/22 | | IDR | | 9,643,000,000 | | 999,416 | |
| 10.25% 7/15/27 | | IDR | | 21,445,000,000 | | 2,192,445 | |
| | | | | | | 4,704,391 | |
| Japan–4.14% | | | | | | | |
| Japan Government | | | | | | | |
| 5 yr Bond 1.50% 6/20/11 | | JPY | | 605,300,000 | | 5,544,074 | |
| 10 yr Bond 1.70% 3/20/17 | | JPY | | 18,000,000 | | 165,050 | |
| 10 yr Bond 1.70% 9/20/17 | | JPY | | 125,100,000 | | 1,144,906 | |
| 10 yr Bond 1.90% 6/20/16 | | JPY | | 632,800,000 | | 5,930,876 | |
| 20 yr Bond 2.00% 3/20/27 | | JPY | | 1,491,000,00 | | 13,284,110 | |
| 20 yr Bond 2.10% 12/20/26 | | JPY | | 408,700,000 | | 3,682,661 | |
| 20 yr Bond 2.30% 6/20/26 | | JPY | | 584,100,000 | | 5,439,451 | |
| 30 yr Bond 2.40% 3/20/37 | | JPY | | 133,000,000 | | 1,208,164 | |
| | | | | | | 36,399,292 | |
| Malaysia–0.46% | | | | | | | |
| Malaysian Government | | | | | | | |
| 3.718% 6/15/12 | | MYR | | 4,440,000 | | 1,341,550 | |
| 3.756% 4/28/11 | | MYR | | 5,798,000 | | 1,762,994 | |
| 3.814% 2/15/17 | | MYR | | 450,000 | | 132,773 | |
| 7.00% 3/15/09 | | MYR | | 2,542,000 | | 800,203 | |
| | | | | | | 4,037,520 | |
| Mexico–1.19% | | | | | | | |
| Mexican Government | | | | | | | |
| 5.625% 1/15/17 | | USD | | 5,126,000 | | $ | 5,208,016 | |
| 8.00% 12/17/15 | | MXN | | 43,472,000 | | 3,943,620 | |
| 9.00% 12/20/12 | | MXN | | 4,124,000 | | 393,512 | |
| 10.00% 12/5/24 | | MXN | | 8,420,000 | | 898,303 | |
| | | | | | | 10,443,451 | |
| Norway–0.23% | | | | | | | |
| Norwegian Government 6.50% 5/15/13 | | NOK | | 10,081,000 | | 2,017,287 | |
| | | | | | | 2,017,287 | |
| Philippines–0.58% | | | | | | | |
| Philippines Government 6.375% 1/15/32 | | USD | | 5,117,000 | | 5,117,000 | |
| | | | | | | 5,117,000 | |
| Poland–0.37% | | | | | | | |
| Poland Government | | | | | | | |
| 4.75% 4/25/12 | | PLN | | 3,562,000 | | 1,370,674 | |
| 5.25% 10/25/17 | | PLN | | 2,151,000 | | 828,879 | |
| 6.25% 10/24/15 | | PLN | | 2,536,000 | | 1,043,448 | |
| | | | | | | 3,243,001 | |
| Republic of Korea–0.13% | | | | | | | |
| Government of South Korea 4.25% 12/7/21 | | EUR | | 900,000 | | 1,153,743 | |
| | | | | | | 1,153,743 | |
| Russia–1.39% | | | | | | | |
| Russia Government | | | | | | | |
# | 144A 7.50% 3/31/30 | | USD | | 1,056,330 | | 1,204,216 | |
| 7.50% 3/31/30 | | USD | | 9,573,300 | | 10,983,275 | |
| | | | | | | 12,187,491 | |
| Turkey–1.00% | | | | | | | |
| Republic of Turkey 11.875% 1/15/30 | | USD | | 5,567,000 | | 8,795,860 | |
| | | | | | | 8,795,860 | |
| Ukraine–0.07% | | | | | | | |
# | Ukraine Government 144A 6.75% 11/14/17 | | USD | | 662,000 | | 651,408 | |
| | | | | | | 651,408 | |
| United Arabic Emirates–0.26% | | | | | | | |
# | Emirate of Abu Dhabi 144A 5.50% 8/2/12 | | USD | | 2,200,000 | | 2,264,893 | |
| | | | | | | 2,264,893 | |
| United Kingdom–0.97% | | | | | | | |
# | CS International for City of Kiev Ukraine 8.25% 11/26/12 | | USD | | 397,000 | | 399,184 | |
| U.K. Treasury | | | | | | | |
| 4.25% 3/7/11 | | GBP | | 1,740,000 | | 3,441,170 | |
| 4.75% 9/7/15 | | GBP | | 623,000 | | 1,257,681 | |
| 5.00% 3/7/12 | | GBP | | 703,000 | | 1,429,648 | |
| 5.25% 6/7/12 | | GBP | | 369,000 | | 756,735 | |
| 9.00% 7/12/11 | | GBP | | 540,000 | | 1,231,877 | |
| | | | | | | 8,516,295 | |
| Total Sovereign Debt (cost $119,404,894) | | | | | | 123,302,375 | |
| | | | | | | | |
| SUPRANATIONAL BANKS–3.41% | | | | | | | |
| Asia Development Bank | | | | | | | |
| 0.50% 10/9/12 | | AUD | | 759,000 | | 484,268 | |
| 4.75% 6/15/17 | | CAD | | 1,191,000 | | 1,219,920 | |
| European Bank for Reconstruction & Development 12.50% 3/23/09 | | ISK | | 154,100,000 | | 2,418,714 | |
16
| | | Principal
Amountm | | Value
(U.S. $) | |
| | | | | | | | |
| SUPRANATIONAL BANKS (continued) | | | | | | | |
| European Investment Bank | | | | | | | |
| 1.40% 6/20/17 | | JPY | | 258,900,000 | | $ | 2,309,363 | |
| 4.25% 12/7/10 | | GBP | | 826,000 | | 1,617,816 | |
| 4.75% 10/15/17 | | EUR | | 1,567,000 | | 2,319,571 | |
| 6.00% 7/15/09 | | NZD | | 2,340,000 | | 1,728,127 | |
| Inter-American Development Bank | | | | | | | |
| 7.25% 5/24/12 | | NZD | | 11,704,000 | | 8,706,917 | |
| 9.00% 8/6/10 | | BRL | | 1,605,000 | | 868,774 | |
| 13.00% 6/20/08 | | ISK | | 240,900,000 | | 3,809,383 | |
| International Bank for Reconstruction & Development 5.75% 6/25/10 | | RUB | | 26,510,000 | | 1,071,453 | |
| Nordic Investment Bank | | | | | | | |
| 1.70% 4/27/17 | | JPY | | 160,000,000 | | 1,463,929 | |
| 4.625% 7/30/10 | | NOK | | 10,820,000 | | 1,956,976 | |
| Total Supranational Banks (cost $28,590,524) | | | | | | 29,975,211 | |
| | | | | | | | |
| U.S. TREASURY OBLIGATIONS–5.74% | | | | | | | |
*m | U.S. Treasury Bonds 4.75% 2/15/37 | | USD | | 3,631,000 | | 3,801,207 | |
| U.S. Treasury Inflation Index Notes | | | | | | | |
| 3.00% 7/15/12 | | | | 389,260 | | 421,709 | |
| 3.875% 1/15/09 | | | | 350,325 | | 360,780 | |
| U.S. Treasury Notes | | | | | | | |
* | 3.125% 11/30/09 | | | | 17,157,000 | | 17,181,140 | |
| 3.625% 12/31/12 | | | | 21,185,000 | | 21,350,518 | |
* | 4.25% 11/15/17 | | | | 5,514,000 | | 5,611,791 | |
* | 4.50% 5/15/10 | | | | 1,665,000 | | 1,721,064 | |
| Total U.S. Treasury Obligations (cost $50,376,403) | | | | | | 50,448,209 | |
| | | | | | | | |
| | | Number of
Shares | | | |
| | | | | | | | |
| COMMON STOCK–0.05% | | | | | | | |
† | Adelphia Recovery Trust Series Arahova | | | | 1 | | 1 | |
† | Century Communications | | | | 2,500,000 | | 1,625 | |
*† | Mirant | | | | 116 | | 4,522 | |
† | Northwest Airlines | | | | 502 | | 7,288 | |
@†¹= | Port Townsend | | | | 685 | | 427,440 | |
† | Time Warner Cable Class A | | | | 7 | | 193 | |
| Total Common Stock (cost $515,558) | | | | | | 441,069 | |
| | | | | | | | |
| | | Number of
Shares | | Value
(U.S.$) | |
| | | | | | | | |
| CONVERTIBLE PREFERRED STOCK–0.30% | | | | | | | |
· | Citigroup Funding 4.943% exercise price $29.50, expiration date 9/27/08 | | | | 43,100 | | $ | 1,082,241 | |
| General Motors 5.25% exercise price $64.90, expiration date 3/6/32 | | | | 13,275 | | 257,004 | |
| Lucent Technologies Capital Trust I 7.75% exercise price $24.80, expiration date 3/15/17 | | | | 235 | | 205,654 | |
| New York Community Capital Trust V 6.00% exercise price $20.04, expiration date 5/7/51 | | | | 22,000 | | 1,053,800 | |
| Total Convertible Preferred Stock (cost $2,864,170) | | | | | | 2,598,699 | |
| | | | | | | | |
| PREFERRED STOCK–0.16% | | | | | | | |
| Port Townsend | | | | 137 | | 135,630 | |
| Fannie Mae 8.25% | | | | 47,500 | | 1,223,125 | |
| Total Preferred Stock (cost $1,323,130) | | | | | | 1,358,755 | |
| | | | | | | | |
| WARRANTS–0.00% | | | | | | | |
| Port Townsend | | | | 137 | | 3,288 | |
| Total Warrants (cost $3,288) | | | | | | 3,288 | |
| | | | | | | | |
| | | Principal
Amountm | | | |
| | | | | | | | |
| DISCOUNT NOTE–9.69% | | | | | | | |
| Federal Home Loan Bank 3.25% 1/2/08 | | USD | | 85,173,377 | | 85,165,767 | |
| Total Discount Note (cost $85,165,767) | | | | | | 85,165,767 | |
| Total Value of Securities Before Securities Lending Collateral–104.56%
(cost $911,770,871) | | | | | | 918,699,028 | |
| | | | | | | | |
| | | Number of
Shares | | | |
| | | | | | | | |
| SECURITIES LENDING COLLATERAL**–15.74% | | | | | | | |
| Investment Companies Mellon GSL DBT II Collateral Fund | | | | 138,269,641 | | 138,269,641 | |
| Total Securities Lending Collateral (cost $138,269,641) | | | | | | 138,269,641 | |
17
TOTAL VALUE OF SECURITIES–120.30% (cost $1,050,040,512) | | | | | | $ | 1,056,968,669 | 5 |
OBLIGATION TO RETURN SECURITIES LENDING COLLATERAL**–(15.74%) | | | | | | (138,269,641 | ) |
LIABILITIES NET OF RECEIVABLES AND OTHER ASSETS–(4.56%) | | | | | | (40,073,288 | ) |
NET ASSETS APPLICABLE TO 86,109,730 SHARES OUTSTANDING–100.00% | | | | | | $ | 878,625,740 | |
NET ASSET VALUE-DELAWARE VIP DIVERSIFIED INCOME SERIES STANDARD CLASS ($521,510,993 / 51,018,126 Shares) | | | | | | $ | 10.22 | |
NET ASSET VALUE-DELAWARE VIP DIVERSIFIED INCOME SERIES SERVICE CLASS ($357,114,747 / 35,091,604 Shares) | | | | | | $ | 10.18 | |
COMPONENTS OF NET ASSET AT DECEMBER 31, 2007: | | | | | | | |
Shares of beneficial interest (unlimited authorization–no par) | | | | | | $ | 822,044,984 | |
Undistributed net investment income | | | | | | 37,375,178 | |
Accumulated net realized gain on investments | | | | | | 12,990,438 | |
Net unrealized appreciation of investments and foreign currencies | | | | | | 6,215,140 | |
Total net assets | | | | | | $ | 878,625,740 | |
m Principal amount shown is stated in the currency in which each security is denominated. |
|
AUD – Australian Dollar |
BRL – Brazilian Real |
CAD – Canadian Dollar |
CHF – Swiss Francs |
COP – Colombian Peso |
EUR – European Monetary Unit |
GBP – British Pound Sterling |
IDR – Indonesia Rupiahs |
ISK – Iceland Krona |
ISL – Israeli Shekel |
JPY – Japanese Yen |
MXN – Mexican Peso |
MYR – Malaysia Ringgit |
NOK – Norwegian Kroner |
NZD – New Zealand Dollar |
PLN – Polish Zloty |
RUB – Russian Rubles |
SEK – Swedish Krona |
TRY – Turkish Lira |
USD – United States Dollar |
ZAR – South African Rand |
|
# | Security exempt from registration under Rule 144A of the Securities Act of 1933, as amended. At December 31, 2007, the aggregate amount of Rule 144A securities was $53,337,978, which represented 6.07% of the Series’ net assets. See Note 13 in “Notes to Financials.” |
¹ | Restricted Security. Investment in a security not registered under the Securities Act of 1933, as amended. This security has certain restrictions on resale which may limit its liquidity. At December 31, 2007, the aggregate amount of the restricted security was $427,440 or 0.05% of the Series’ net assets. See Note 13 in “Notes to Financial Statements.” |
· | Variable rate security. The rate shown is the rate as of December 31, 2007. |
^ | Zero coupon security. The rate shown is the yield at the time of purchase. |
| The rate shown is the effective yield at the time of purchase. |
‡ | Non-income producing security. Security is currently in default. |
@ | Illiquid security. At December 31, 2007, the aggregate amount of illiquid securities was $427,440, which represented 0.05% of the Series’ net assets. See Note 13 in “Notes to Financial Statements.” |
= | Security is being fair valued in accordance with the Series’ fair valuation policy. At December 31, 2007, the aggregate amount of fair valued securities was $427,440, which represented 0.05% of the Series’ net assets. See Note 1 in “Notes to Financial Statements.” |
m | Fully or partially pledged as collateral for financial futures contracts. |
t | Pass Through Agreement. Security represents the contractual right to receive a proportionate amount of underlying payments due to the counterparty pursuant to various agreements related to the rescheduling of obligations and the exchange of certain notes. |
† | Non-income producing security for the year ended December 31, 2007. |
« | Senior Secured Loans generally pay interest at rates which are periodically redetermined by reference to a base lending rate plus a premium. These base lending rates are generally (i) the prime rate offered by one or more United States banks, (ii) the lending rate offered by one or more European banks such as the London Inter-Bank Offered Rate (LIBOR) and (iii) the certificate of deposit rate. Senior Secured Loans may be subject to restrictions on resale. |
5 | Securities have been classified by country of origin. |
18
* | Fully or partially on loan. |
** | See Note 12 in “Notes to Financial Statements.” |
© | Includes $138,085,618 of securities loaned. |
Summary of Abbreviations: |
AMBAC – Insured by the AMBAC Assurance Corporation |
ARM – Adjustable Rate Mortgage |
CPN – Coupon |
FGIC – Insured by the Financial Guaranty Insurance Company |
FSA – Insured by Financial Security Assurance |
GNMA – Government National Mortgage Association |
O.A.T. – Obligation Assimilable au Tresor (Treasury Security) |
PIK – Pay-in-kind |
REIT – Real Estate Investment Trust |
S.F. – Single Family |
TBA – To be announced |
yr – Year |
The following foreign currency exchange contracts and foreign cross currency exchange contracts, futures contracts, and swap contracts were outstanding at December 31, 2007:
Foreign Currency Exchange Contracts(1)
Contracts to Receive (Deliver) | | In Exchange For | | Settlement Date | | Unrealized
Appreciation
(Depreciation) | |
AUD | 485,238 | | NZD | (556,656 | ) | 1/31/08 | | $ | (518 | ) |
AUD | (10,250,602 | ) | USD | 8,764,982 | | 1/31/08 | | (203,283 | ) |
BRL | (6,763,750 | ) | USD | 3,712,266 | | 1/31/08 | | (87,592 | ) |
BRL | (800,204 | ) | USD | 437,629 | | 1/31/08 | | (11,924 | ) |
CAD | 1,063,260 | | GBP | (524,243 | ) | 1/31/08 | | 29,741 | |
CAD | (2,752,106 | ) | USD | 2,760,000 | | 2/29/08 | | (11,186 | ) |
COP | (2,558,186 | ) | USD | 1,262,990 | | 1/31/08 | | (4,693 | ) |
COP | (3,159,280 | ) | USD | 1,564,000 | | 1/31/08 | | (1,549 | ) |
EUR | 1,760,534 | | GBP | (1,266,000 | ) | 1/31/08 | | 57,730 | |
EUR | 2,393,967 | | ISK | (219,036,040 | ) | 1/31/08 | | 37,935 | |
EUR | 2,105,537 | | ISK | (192,646,120 | ) | 1/31/08 | | 33,365 | |
EUR | 4,681,310 | | NOK | (37,702,709 | ) | 1/31/08 | | (95,761 | ) |
EUR | 498,296 | | NZD | (957,435 | ) | 1/31/08 | | (3,455 | ) |
EUR | 1,418,553 | | PLN | (5,136,298 | ) | 1/31/08 | | (7,612 | ) |
EUR | (3,154,553 | ) | USD | 4,527,017 | | 1/31/08 | | (79,366 | ) |
GBP | 1,435,256 | | JPY | (323,766,375 | ) | 1/31/08 | | (64,444 | ) |
GBP | 664,525 | | USD | (1,331,176 | ) | 1/31/08 | | (12,067 | ) |
IDR | (50,691,942,000 | ) | USD | 524,243 | | 1/31/08 | | (29,078 | ) |
ISL | (2,658,941 | ) | USD | 669,000 | | 1/30/08 | | (20,631 | ) |
JPY | 538,198,109 | | EUR | (3,312,396 | ) | 1/31/08 | | 55,808 | |
JPY | 899,763,072 | | USD | (7,989,514 | ) | 1/31/08 | | 107,203 | |
MXN | (12,961,866 | ) | USD | 1,193,212 | | 1/31/08 | | 8,608 | |
MXN | (11,548,514 | ) | USD | 1,062,567 | | 1/31/08 | | 7,131 | |
MXN | (9,958,141 | ) | USD | 916,660 | | 1/31/08 | | 6,571 | |
MXN | 5,379,000 | | USD | (488,157 | ) | 7/24/08 | | (4,274 | ) |
MYR | (11,019,488 | ) | USD | 3,296,208 | | 1/31/08 | | (38,926 | ) |
NZD | (9,385,525 | ) | USD | 7,122,669 | | 1/31/08 | | (43,975 | ) |
NZD | (3,193,339 | ) | USD | 2,405,542 | | 1/31/08 | | (32,843 | ) |
NZD | (3,192,211 | ) | USD | 2,401,181 | | 1/31/08 | | (36,342 | ) |
NOK | 5,662,134 | | USD | (1,013,510 | ) | 1/31/08 | | 27,462 | |
SEK | 27,725,542 | | EUR | (2,933,858 | ) | 1/31/08 | | 5,432 | |
TRY | (1,596,572 | ) | USD | 1,321,446 | | 1/31/08 | | (31,555 | ) |
ZAR | (18,541,652 | ) | USD | 2,654,500 | | 1/31/08 | | (30,665 | ) |
| | | | | | | | $ | (474,753 | ) |
19
Futures Contracts(2)
Contracts
To Buy (Sell) | | Notional Cost
(Proceeds) | | Notional
Value | | Expiration Date | | Unrealized
Appreciation
(Depreciation) | |
47 | | Canadian 10 yr Bond | | $ | 5,368,822 | | $ | 5,435,210 | | 3/31/08 | | $ | 66,388 | |
96 | | Euro Bond | | 16,159,612 | | 15,846,982 | | 3/31/08 | | (312,630 | ) |
46 | | Long Gilt Bond | | 10,341,784 | | 10,074,482 | | 3/31/08 | | (267,302 | ) |
52 | | U.S. Treasury 2 yr Notes | | 10,916,147 | | 10,933,000 | | 3/31/08 | | 16,853 | |
1,058 | | U.S. Treasury 5 yr Notes | | 116,475,666 | | 116,677,563 | | 3/31/08 | | 201,897 | |
(85) | | U.S. Long Bond | | (10,104,799 | ) | (9,891,875 | ) | 3/31/08 | | 212,924 | |
| | | | | | | | | | $ | (81,870 | ) |
| | | | | | | | | | | | | | |
Swap Contracts(3)
Swap Counterparty &
Referenced Obligation | | Notional
Amount | | Annual Protection
Payments | | Termination Date | | Unrealized
Appreciation
(Depreciation) | |
| | Protection Purchased: | | | | | | | | | |
| | Lehman Brothers | | | | | | | | | |
| | Autozone 7 yr CDS | | $ | 850,000 | | 0.445 | % | 6/20/14 | | $ | 2,894 | |
| | Avon Products 7 yr CDS | | 850,000 | | 0.245 | % | 6/20/14 | | 5,498 | |
| | Campbell Soup 7 yr CDS | | 850,000 | | 0.18 | % | 6/20/14 | | 4,059 | |
| | Capmark 5 yr CDS | | 470,000 | | 1.65 | % | 9/20/12 | | 87,519 | |
| | CDX Emerging Markets 8.1 yr CDS | | 4,695,000 | | 1.75 | % | 12/20/12 | | 824 | |
| | Computer SCI 7 yr CDS | | 850,000 | | 1.00 | % | 6/20/14 | | (25,690 | ) |
| | Gannett 7 yr CDS | | 737,000 | | 0.88 | % | 9/20/14 | | 4,104 | |
| | Home Depot 5 yr CDS | | 2,100,000 | | 0.50 | % | 9/20/12 | | 33,681 | |
| | Kimberly Clark 7 yr CDS | | 850,000 | | 0.195 | % | 6/20/14 | | 8,861 | |
| | McDonald’s 7 yr CDS | | 850,000 | | 0.18 | % | 6/20/14 | | 5,434 | |
| | Newell Rubber 7 yr CDS | | 850,000 | | 0.385 | % | 6/20/14 | | 333 | |
| | New York Times 7 yr CDS | | 737,000 | | 0.75 | % | 9/20/14 | | 4,646 | |
| | Sara Lee 7 yr CDS | | 737,000 | | 0.60 | % | 9/20/14 | | (8,516 | ) |
| | Sysco 7 yr CDS | | 850,000 | | 0.32 | % | 6/20/14 | | (515 | ) |
| | Target 5 yr CDS | | 1,125,000 | | 0.57 | % | 12/20/12 | | (1,136 | ) |
| | TJX Companies 7 yr CDS | | 850,000 | | 0.61 | % | 6/20/14 | | (1,479 | ) |
| | V.F. | | | | | | | | | |
| | 5 yr CDS | | 450,000 | | 0.40 | % | 9/20/12 | | (195 | ) |
| | 7 yr CDS | | 850,000 | | 0.365 | % | 6/20/14 | | 5,940 | |
| | Washington Mutual | | | | | | | | | |
| | 4 yr CDS | | 751,800 | | 0.85 | % | 9/20/11 | | 81,527 | |
| | 10 yr CDS | | 545,000 | | 3.15 | % | 12/20/17 | | 3,272 | |
| | Goldman Sachs | | | | | | | | | |
| | Bank of America 5 yr CDS | | 1,360,000 | | 0.48 | % | 12/20/12 | | (251 | ) |
| | Beazer Homes 5 yr CDS | | 1,625,000 | | 3.08 | % | 6/20/12 | | 385,433 | |
| | Best Buy | | | | | | | | | |
| | 5 yr CDS | | 1,100,000 | | 0.60 | % | 9/20/12 | | 7,778 | |
| | 10 yr CDS | | 550,000 | | 0.98 | % | 9/20/17 | | 3,093 | |
| | Kraft Food 10 yr CDS | | 2,075,000 | | 0.77 | % | 12/20/17 | | (3,716 | ) |
| | Rohm & Haas 5.5 yr CDS | | 950,000 | | 0.37 | % | 3/20/13 | | 3,153 | |
| | J.P. Morgan | | | | | | | | | |
| | CDX Emerging Markets 8.1 yr CDS | | 4,697,000 | | 1.75 | % | 12/20/12 | | 6,636 | |
| | Embarq 7 yr CDS | | 985,000 | | 0.77 | % | 9/20/14 | | 24,165 | |
| | Merrill Lynch 5 yr CDS | | 600,000 | | 0.58 | % | 12/20/12 | | 17,739 | |
| | | | | | | | | | $ | 655,091 | |
| | | | | | | | | | | | | |
20
Swap Counterparty &
Referenced Obligation | | Notional
Amount | | Annual Protection
Payments | | Termination Date | | Unrealized
Appreciation
(Depreciation) | |
| | Protection Sold: | | | | | | | | | |
| | Goldman Sachs | | | | | | | | | |
| | ABX Home Equity Index
06-2 AA | | $ | 1,200,000 | | 0.17 | % | 5/25/46 | | $ | (54,000 | ) |
| | Lehman Brothers | | | | | | | | | |
| | ABX Home Equity Index
06-2 AA | | 1,660,000 | | 0.17 | % | 5/25/46 | | (174,300 | ) |
| | 7-1 AA | | 2,500,000 | | 0.15 | % | 8/25/37 | | (245,900 | ) |
| | Beazer Homes 5 yr CDS | | 1,625,000 | | 3.43 | % | 6/20/12 | | (373,161 | ) |
| | Best Buy
5 yr CDS | | 550,000 | | 0.61 | % | 9/20/12 | | (3,720 | ) |
| | 10 yr CDS | | 275,000 | | 0.99 | % | 9/20/17 | | (1,340 | ) |
| | Reynolds American 5 yr CDS | | 1,474,000 | | 1.00 | % | 9/20/12 | | 20,019 | |
| | | | | | | | | | $ | (832,402 | ) |
| | | | | | | | | | | | | |
The use of foreign currency and foreign cross currency exchange contracts, futures contracts and swap contracts involves elements of market risks in excess of the amount recognized in the financial statements. The notional value presented above represent the Series’ total exposure in such contracts, whereas only the net unrealized appreciation (depreciation) is reflected in the Series’ net assets.
(1)See Note 8 in “Notes to Financials.”
(2)See Note 9 in “Notes to Financials.”
(3)See Note 11 in “Notes to Financials.”
See accompanying notes
21
Delaware VIP Trust — Delaware VIP Diversified Income Series
Statement of Operations
Year Ended December 31, 2007
INVESTMENT INCOME: | | | |
Interest | | $ | 40,564,026 | |
Securities lending income | | 328,554 | |
Dividends | | 277,489 | |
Foreign tax withheld | | (3,657 | ) |
| | 41,166,412 | |
| | | |
EXPENSES: | | | |
Management fees | | 4,341,342 | |
Distribution expenses – Service Class | | 815,431 | |
Accounting and administration expenses | | 271,975 | |
Legal fees | | 86,938 | |
Dividend disbursing and transfer agent fees and expenses | | 75,595 | |
Reports and statements to shareholders | | 73,256 | |
Custodian fees | | 65,225 | |
Audit and tax | | 42,907 | |
Trustees’ fees | | 29,479 | |
Pricing fees | | 26,397 | |
Insurance fees | | 23,322 | |
Consulting fees | | 11,252 | |
Trustees’ expenses | | 4,354 | |
Taxes (other than taxes on income) | | 2,902 | |
Dues and services | | 2,029 | |
Registration fees | | 724 | |
| | 5,873,128 | |
Less waiver of distribution expenses – Service Class | | (135,905 | ) |
Less expense paid indirectly | | (62,404 | ) |
Total operating expenses | | 5,674,819 | |
| | | |
NET INVESTMENT INCOME | | 35,491,593 | |
| | | |
NET REALIZED AND UNREALIZED GAIN (LOSS) ON INVESTMENTS AND FOREIGN CURRENCIES: | | | |
Net realized gain (loss) on: | | | |
Investments | | (2,149,305 | ) |
Futures contracts | | 6,784,539 | |
Swap contracts | | 8,751,968 | |
Options written | | 53,609 | |
Foreign currencies | | 2,304,701 | |
Net realized gain | | 15,745,512 | |
Net change in unrealized appreciation/depreciation of investments and foreign currencies | | (1,546,316 | ) |
| | | |
NET REALIZED AND UNREALIZED GAIN ON INVESTMENTS AND FOREIGN CURRENCIES | | 14,199,196 | |
| | | |
NET INCREASE IN NET ASSETS RESULTING FROM OPERATIONS | | $ | 49,690,789 | |
See accompanying notes
Delaware VIP Trust — Delaware VIP Diversified Income Series
Statements of Changes in Net Assets
| | Year Ended | |
| | 12/31/07 | | 12/31/06 | |
INCREASE (DECREASE) IN NET ASSETS FROM OPERATIONS: | | | | | |
Net investment income | | $ | 35,491,593 | | $ | 18,138,021 | |
Net realized gain on investments and foreign currencies | | 15,745,512 | | 1,855,330 | |
Net change in unrealized appreciation/ depreciation of investments and foreign currencies | | (1,546,316 | ) | 9,416,957 | |
Net increase in net assets resulting from operations | | 49,690,789 | | 29,410,308 | |
| | | | | |
DIVIDENDS AND DISTRIBUTIONS TO SHAREHOLDERS FROM: | | | | | |
Net investment income: | | | | | |
Standard Class | | (10,799,019 | ) | (1,927,505 | ) |
Service Class | | (6,977,327 | ) | (2,054,268 | ) |
Net realized gain on investments: | | | | | |
Standard Class | | (882,938 | ) | — | |
Service Class | | (614,951 | ) | — | |
| | (19,274,235 | ) | (3,981,773 | ) |
| | | | | |
CAPITAL SHARE TRANSACTIONS: | | | | | |
Proceeds from shares sold: | | | | | |
Standard Class | | 248,039,572 | | 202,710,123 | |
Service Class | | 169,225,333 | | 95,407,632 | |
Net asset value of shares issued upon reinvestment of dividends and distributions: | | | | | |
Standard Class | | 11,681,957 | | 1,927,505 | |
Service Class | | 7,592,278 | | 2,054,268 | |
| | 436,539,140 | | 302,099,528 | |
Cost of shares repurchased: | | | | | |
Standard Class | | (51,186,995 | ) | (15,934,779 | ) |
Service Class | | (40,114,941 | ) | (30,302,103 | ) |
| | (91,301,936 | ) | (46,236,882 | ) |
Increase in net assets derived from capital share transactions | | 345,237,204 | | 255,862,646 | |
| | | | | |
NET INCREASE IN NET ASSETS | | 375,653,758 | | 281,291,181 | |
| | | | | |
NET ASSETS: | | | | | |
Beginning of year | | 502,971,982 | | 221,680,801 | |
End of year (including undistributed net investment income of $37,375,178 and $17,313,698, respectively) | | $ | 878,625,740 | | $ | 502,971,982 | |
See accompanying notes
22
Delaware VIP Trust — Delaware VIP Diversified Income Series
Financial Highlights
Selected data for each share of the Series outstanding throughout each period were as follows:
| | Delaware VIP Diversified Income Series Standard Class | |
| | 12/31/07 | | 12/31/06 | | Year Ended
12/31/05 | | 12/31/04 | | 5/16/03(1)
to
12/31/03 | |
| | | | | | | | | | | |
Net asset value, beginning of period | | $ | 9.830 | | $ | 9.260 | | $ | 9.450 | | $ | 8.940 | | $ | 8.500 | |
| | | | | | | | | | | |
Income (loss) from investment operations: | | | | | | | | | | | |
Net investment income(2) | | 0.527 | | 0.496 | | 0.373 | | 0.348 | | 0.240 | |
Net realized and unrealized gain (loss) on investments and foreign currencies | | 0.207 | | 0.227 | | (0.416 | ) | 0.395 | | 0.200 | |
Total from investment operations | | 0.734 | | 0.723 | | (0.043 | ) | 0.743 | | 0.440 | |
| | | | | | | | | | | |
Less dividends and distributions from: | | | | | | | | | | | |
Net investment income | | (0.318 | ) | (0.153 | ) | (0.099 | ) | (0.233 | ) | — | |
Net realized gain on investments | | (0.026 | ) | — | | (0.048 | ) | — | | — | |
Total dividends and distributions | | (0.344 | ) | (0.153 | ) | (0.147 | ) | (0.233 | ) | — | |
| | | | | | | | | | | |
Net asset value, end of period | | $ | 10.220 | | $ | 9.830 | | $ | 9.260 | | $ | 9.450 | | $ | 8.940 | |
| | | | | | | | | | | |
Total return(3) | | 7.63 | % | 7.92 | % | (0.45 | )% | 8.47 | % | 5.18 | % |
| | | | | | | | | | | |
Ratios and supplemental data: | | | | | | | | | | | |
Net assets, end of period (000 omitted) | | $ | 521,511 | | $ | 294,248 | | $ | 90,811 | | $ | 14,770 | | $ | 2,104 | |
Ratio of expenses to average net assets | | 0.73 | % | 0.79 | % | 0.79 | % | 0.80 | % | 0.80 | % |
Ratio of expenses to average net assets prior to expense limitation and expenses paid indirectly | | 0.73 | % | 0.79 | % | 0.86 | % | 0.98 | % | 1.59 | % |
Ratio of net investment income to average net assets | | 5.30 | % | 5.26 | % | 4.02 | % | 3.82 | % | 4.43 | % |
Ratio of net investment income to average net assets prior to expense limitation and expenses paid indirectly | | 5.30 | % | 5.26 | % | 3.95 | % | 3.64 | % | 3.64 | % |
Portfolio turnover | | 299 | % | 311 | % | 400 | % | 493 | % | 521 | % |
(1)Commencement of operations; ratios and portfolio turnover have been annualized and total return has not been annualized.
(2)The average shares outstanding method has been applied for per share information.
(3)Total investment return is based on the change in net asset value of a share during the period and assumes reinvestment of dividends and distributions at net asset value. Total investment return reflects a waiver by the manager, as applicable. Performance would have been lower had the waiver not been in effect.
See accompanying notes
23
Selected data for each share of the Series outstanding throughout each period were as follows:
| | Delaware VIP Diversified Income Series Service Class | |
| | 12/31/07 | | 12/31/06 | | Year Ended
12/31/05 | | 12/31/04 | | 5/16/03(1)
to
12/31/03 | |
| | | | | | | | | | | |
Net asset value, beginning of period | | $ | 9.790 | | $ | 9.230 | | $ | 9.410 | | $ | 8.930 | | $ | 8.500 | |
| | | | | | | | | | | |
Income (loss) from investment operations: | | | | | | | | | | | |
Net investment income(2) | | 0.502 | | 0.472 | | 0.350 | | 0.326 | | 0.216 | |
Net realized and unrealized gain (loss) on investments and foreign currencies | | 0.209 | | 0.218 | | (0.406 | ) | 0.373 | | 0.214 | |
Total from investment operations | | 0.711 | | 0.690 | | (0.056 | ) | 0.699 | | 0.430 | |
| | | | | | | | | | | |
Less dividends and distributions from: | | | | | | | | | | | |
Net investment income | | (0.295 | ) | (0.130 | ) | (0.076 | ) | (0.219 | ) | — | |
Net realized gain on investments | | (0.026 | ) | — | | (0.048 | ) | — | | — | |
Total dividends and distributions | | (0.321 | ) | (0.130 | ) | (0.124 | ) | (0.219 | ) | — | |
| | | | | | | | | | | |
Net asset value, end of period | | $ | 10.180 | | $ | 9.790 | | $ | 9.230 | | $ | 9.410 | | $ | 8.930 | |
| | | | | | | | | | | |
Total return(3) | | 7.41 | % | 7.57 | % | (0.59 | )% | 7.85 | % | 5.06 | % |
| | | | | | | | | | | |
Ratios and supplemental data: | | | | | | | | | | | |
Net assets, end of period (000 omitted) | | $ | 357,115 | | $ | 208,724 | | $ | 130,870 | | $ | 47,417 | | $ | — | |
Ratio of expenses to average net assets | | 0.98 | % | 1.04 | % | 1.04 | % | 1.05 | % | 1.05 | % |
Ratio of expenses to average net assets prior to expense limitation and expenses paid indirectly | | 1.03 | % | 1.09 | % | 1.16 | % | 1.28 | % | 1.89 | % |
Ratio of net investment income to average net assets | | 5.05 | % | 5.01 | % | 3.77 | % | 3.57 | % | 4.18 | % |
Ratio of net investment income to average net assets prior to expense limitation and expenses paid indirectly | | 5.00 | % | 4.96 | % | 3.65 | % | 3.34 | % | 3.34 | % |
Portfolio turnover | | 299 | % | 311 | % | 400 | % | 493 | % | 521 | % |
(1)Commencement of operations; ratios and portfolio turnover have been annualized and total return has not been annualized.
(2)The average shares outstanding method has been applied for per share information.
(3)Total investment return is based on the change in net asset value of a share during the period and assumes reinvestment of dividends and distributions at net asset value. Total investment return reflects a waiver by the manager and distributor, as applicable. Performance would have been lower had the waiver not been in effect.
See accompanying notes
24
Delaware VIP Trust — Delaware VIP Diversified Income Series
Notes to Financial Statements
December 31, 2007
Delaware VIP Trust (Trust) is organized as a Delaware statutory trust and offers 14 series: Delaware VIP Balanced Series, Delaware VIP Capital Reserves Series, Delaware VIP Cash Reserve Series, Delaware VIP Diversified Income Series, Delaware VIP Emerging Markets Series, Delaware VIP Growth Opportunities Series, Delaware VIP High Yield Series, Delaware VIP International Value Equity Series, Delaware VIP REIT Series, Delaware VIP Select Growth Series, Delaware VIP Small Cap Value Series, Delaware VIP Trend Series, Delaware VIP U.S. Growth Series and Delaware VIP Value Series. These financial statements and the related notes pertain to Delaware VIP Diversified Income Series (Series). The Trust is an open-end investment company. The Series is considered diversified under the Investment Company Act of 1940, as amended, and offers Standard Class and Service Class shares. The Standard Class shares do not carry a 12b-1 fee and the Service Class shares carry a 12b-1 fee. The shares of the Series are sold only to separate accounts of life insurance companies.
The investment objective of the Series is to seek maximum long-term total return consistent with reasonable risk.
1. Significant Accounting Policies
The following accounting policies are in accordance with U.S. generally accepted accounting principles and are consistently followed by the Series.
Security Valuation—Equity securities, except those traded on the Nasdaq Stock Market, Inc. (Nasdaq), are valued at the last quoted sales price as of the time of the regular close of the New York Stock Exchange (NYSE) on the valuation date. Securities traded on the Nasdaq are valued in accordance with the Nasdaq Official Closing Price, which may not be the last sales price. If on a particular day an equity security does not trade, then the mean between the bid and asked prices will be used. Securities listed on a foreign exchange are valued at the last quoted sales price on the valuation date. U.S. government and agency securities are valued at the mean between the bid and asked prices. Other long-term debt securities, credit default swap contracts and interest rate swap contracts are valued by an independent pricing service or broker and such prices are believed to reflect the fair value of such securities. Short-term debt securities having less than 60 days to maturity are valued at amortized cost, which approximates market value. Securities lending collateral, which is invested in a collective investment vehicle, is valued at unit value per share. Foreign currency exchange contracts are valued at the mean between the bid and asked prices of the contracts. Interpolated values are derived when the settlement date of the contract is an interim date for which quotations are not available. Futures contracts are valued at the daily quoted settlement prices. Exchange-traded options are valued at the last reported sale price or, if no sales are reported, at the mean between the last reported bid and asked prices. Generally, index swap contracts and other securities and assets for which market quotations are not readily available are valued at fair value as determined in good faith under the direction of the Series’ Board of Trustees. In determining whether market quotations are readily available or fair valuation will be used, various factors will be taken into consideration, such as market closures, or with respect to foreign securities, aftermarket trading, or significant events after local market trading (e.g., government actions or pronouncements, trading volume or volatility on markets, exchanges among dealers, or news events).
In September 2006, the Financial Accounting Standards Board (FASB) issued FASB Statement No. 157 “Fair Value Measurements” (Statement 157). Statement 157 establishes a framework for measuring fair value in U.S. generally accepted accounting principles, clarifies the definition of fair value within that framework, and expands disclosures about the use of fair value measurements. Statement 157 is intended to increase consistency and comparability among fair value estimates used in financial reporting. Statement 157 is effective for fiscal years beginning after November 15, 2007. Management does not expect the adoption of Statement 157 to have a material impact on the amounts reported in the financial statements.
Federal Income Taxes—The Series intends to continue to qualify for federal income tax purposes as a regulated investment company under Subchapter M of the Internal Revenue Code of 1986, as amended, and make the requisite distributions to shareholders. Accordingly, no provision for federal income taxes has been made in the financial statements.
Effective June 29, 2007, the Series adopted FASB Interpretation No. 48 “Accounting for Uncertainty in Income Taxes” (FIN 48). FIN 48 provides guidance for how uncertain tax positions should be recognized, measured, presented and disclosed in the financial statements. FIN 48 requires the evaluation of tax positions taken or expected to be taken in the course of preparing the Series’ tax returns to determine whether the tax positions are “more-likely-than-not” of being sustained by the applicable tax authority. Tax positions not deemed to meet the more-likely-than-not threshold are recorded as a tax benefit or expense in the current year. The adoption of FIN 48 did not result in the recording of any tax benefit or expense in the current period.
Class Accounting—Investment income, common expenses and realized and unrealized gain (loss) on investments are allocated to the classes of the Series on the basis of daily net assets of each class. Distribution expenses relating to a specific class are charged directly to that class.
Repurchase Agreements—The Series may invest in a pooled cash account along with members of the Delaware Investments® Family of Funds pursuant to an exemptive order issued by the Securities and Exchange Commission. The aggregate daily balance of the pooled cash account is invested in repurchase agreements secured by obligations of the U.S. government. The respective collateral is held by the Series’ custodian bank until the maturity of the respective repurchase agreements. Each repurchase agreement is at least 102% collateralized. However, in the event of default or bankruptcy by the counterparty to the agreement, realization of the collateral may be subject to legal proceedings. At December 31, 2007, the Series held no investments in repurchase agreements.
Foreign Currency Transactions—Transactions denominated in foreign currencies are recorded at the prevailing exchange rates on the valuation date. The value of all assets and liabilities denominated in foreign currencies are translated into U.S. dollars at the exchange rate of such currencies against the U.S. dollar daily. Transaction gains or losses resulting from changes in exchange rates during the reporting period or upon settlement of the foreign currency transaction are reported in operations for the current period. The Series isolates that portion of realized gains and losses on investments in debt securities, which are due to changes in the foreign exchange rates from that which are due to changes in market prices of debt securities. The Series reports certain foreign currency related transactions as components of realized gains (losses) for financial reporting purposes, whereas such components are treated as ordinary income (loss) for federal income tax purposes.
25
Delaware VIP Diversified Income Series
Notes to Financial Statements (continued)
Use of Estimates—The preparation of financial statements in conformity with U.S. generally accepted accounting principles requires management to make estimates and assumptions that affect the reported amounts of assets and liabilities at the date of the financial statements and the reported amounts of revenues and expenses during the reporting period. Actual results could differ from those estimates.
Other—Expenses directly attributable to the Series are charged directly to the Series. Other expenses common to various funds within the Delaware Investments® Family of Funds are generally allocated amongst such funds on the basis of average net assets. Management fees and some other expenses are paid monthly. Security transactions are recorded on the date the securities are purchased or sold (trade date) for financial reporting purposes. Costs used in calculating realized gains and losses on the sale of investment securities are those of the specific securities sold. Dividend income is recorded on the ex-dividend date and interest income is recorded on the accrual basis. Withholding taxes have been provided for in accordance with the Series’ understanding of the applicable country’s tax rules and rates. Discounts and premiums on non-convertible bonds are amortized to interest income over the lives of the respective securities. Realized gains (losses) on paydowns of mortgage- and asset-backed securities are classified as interest income.
The Series declares and pays dividends from net investment income and distributions from net realized gain on investments, if any, following the close of the fiscal year.
The Series may receive earnings credits from its custodian when positive cash balances are maintained, which are used to offset custody fees. The expense paid under this arrangement is included in custodian fees on the Statement of Operations with the corresponding expense offset shown as “expense paid indirectly.”
2. Investment Management, Administration Agreements and Other Transactions with Affiliates
In accordance with the terms of its investment management agreement, the Series pays Delaware Management Company (DMC), a series of Delaware Management Business Trust and the investment manager, an annual fee which is calculated daily at the rate of 0.65% on the first $500 million of average daily net assets of the Series, 0.60% on the next $500 million, 0.55% on the next $1.5 billion, and 0.50% on the average daily net assets in excess of $2.5 billion.
Prior to May 1, 2007, DMC had contractually agreed to waive that portion, if any, of its management fee and reimburse the Series to the extent necessary to ensure that total annual operating expenses, exclusive of taxes, interest, brokerage fees, inverse floater program expenses, 12b-1 plan expenses, certain insurance costs and non-routine expenses or costs including, but not limited to, those relating to reorganizations, litigation, conducting shareholder meetings, and liquidations, did not exceed 0.81% of average daily net assets of the Series. No reimbursement was due for the year ended December 31, 2007.
Effective October 1, 2007, Delaware Service Company, Inc. (DSC), an affiliate of DMC, provides fund accounting and financial administration oversight services to the Series. For these services, the Series pays DSC fees based on the aggregate daily net assets of the Delaware Investments® Family of Funds at the following annual rate: 0.0050% of the first $30 billion; 0.0045% of the next $10 billion; 0.0040% of the next $10 billion; and 0.0025% of aggregate average daily net assets in excess of $50 billion. The fees payable to DSC under the service agreement described above are allocated among all funds in the Delaware Investments® Family of Funds on a relative net asset value basis. Prior to October 1, 2007, DSC provided fund accounting and administrative services to the Series and received a fee at an annual rate of 0.04% of average daily net assets. For the year ended December 31, 2007, the Series was charged $199,494 for these services.
DSC also provides dividend disbursing and transfer agency services. The Series pays DSC a monthly fee based on the number of shareholder accounts for dividend disbursing and transfer agent services.
Pursuant to a distribution agreement and distribution plan, the Series pays Delaware Distributors, L.P. (DDLP), the distributor and an affiliate of DMC, an annual distribution and service fee not to exceed 0.30% of the average daily net assets of the Service Class shares. DDLP has contracted to waive distribution and service fees through April 30, 2008 in order to prevent distribution and service fees of the Service Class shares from exceeding 0.25% of average daily net assets. Standard Class shares pay no distribution and service expenses.
At December 31, 2007, the Series had liabilities payable to affiliates as follows:
Investment
Management
Fee Payable to
DMC | | Dividend Disbursing,
Transfer Agent
Fees and Other Expenses
Payable to DSC | | Distribution
Fees Payable
to DDLP | | Other Expenses
Payable to DMC
and Affiliates* | |
$ | 458,598 | | $ | 13,387 | | $ | 74,416 | | $ | 54,091 | |
| | | | | | | | | | | |
*DMC, as part of its administrative services, pays operating expenses on behalf of the Series and is reimbursed on a periodic basis. Such expenses include items such as printing of shareholder reports, fees for audit, legal and tax services, custodian fees and trustees’ fees.
As provided in the investment management agreement, the Series bears the cost of certain legal and tax services, including internal legal and tax services provided to the Series by DMC and/or its affiliates’ employees. For the year ended December 31, 2007, the Series was charged $38,652 for internal legal and tax services provided by DMC and/or its affiliates’ employees.
26
Delaware VIP Diversified Income Series
Notes to Financial Statements (continued)
Trustees’ fees include expenses accrued by the Series for each Trustee’s retainer and per meeting fees. Certain officers of DMC, DSC and DDLP are officers and/or Trustees of the Trust. These officers and Trustees are paid no compensation by the Series.
3. Investments
For the year ended December 31, 2007, the Series made purchases and sales of investment securities other than short-term investments as follows:
Purchases other than U.S. government securities | | $ | 1,667,273,822 | |
Purchases of U.S. government securities | | 538,630,691 | |
Sales other than U.S. government securities | | 1,341,660,447 | |
Sales of U.S. government securities | | 519,769,081 | |
At December 31, 2007, the cost of investments for federal income tax purposes and unrealized appreciation (depreciation) for the Series were as follows:
Cost of
Investments | | Aggregate
Unrealized
Appreciation | | Aggregate
Unrealized
Depreciation | | Net Unrealized
Appreciation | |
$ | 1,050,333,262 | | $ | 15,816,707 | | $ | (9,181,300 | ) | $ | 6,635,407 | |
| | | | | | | | | | | |
4. Dividend and Distribution Information
Income and long-term capital gain distributions are determined in accordance with federal income tax regulations, which may differ from U.S. generally accepted accounting principles. Additionally, gains (losses) on foreign currency transactions and net short-term gains on sales of investment securities are treated as ordinary income for federal income tax purposes. The tax character of dividends and distributions paid during the years ended December 31, 2007 and 2006 was as follows:
| | Year
Ended
12/31/07 | | Year
Ended
12/31/06 | |
Ordinary income | | $ | 19,213,099 | | $ | 3,981,773 | |
Long-term capital gain | | 61,136 | | — | |
| | $ | 19,274,235 | | $ | 3,981,773 | |
5. Components of Net Assets on a Tax Basis
As of December 31, 2007, the components of net assets on a tax basis were as follows:
Shares of beneficial interest | | $ | 822,044,984 | |
Undistributed ordinary income | | 50,043,258 | |
Undistributed long-term capital gains | | 3,251,351 | |
Other temporary differences | | (2,757,599 | ) |
Unrealized appreciation of investments, swap contracts and foreign currencies | | 6,043,746 | |
Net assets | | $ | 878,625,740 | |
The differences between book basis and tax basis components of net assets are primarily attributable to tax deferral of losses on wash sales, contingent payment debt instruments, mark-to-market of futures contracts, straddle loss deferrals, mark-to-market of foreign currency contracts and tax treatment of credit default swaps.
For financial reporting purposes, capital accounts are adjusted to reflect the tax character of permanent book/tax differences. Reclassifications are primarily due to tax treatment of paydowns of mortgage- and asset-backed securities, contingent payment debt instruments, credit default swap contracts, gain (loss) on foreign currency transactions and foreign future contracts. Results of operations and net assets were not affected by these reclassifications. For the year ended December 31, 2007, the Series recorded the following reclassifications:
Undistributed
Net
Investment Income | | Accumulated
Net Realized
Gain | |
$ | 2,346,233 | | $ | (2,346,233 | ) |
| | | | | |
27
Delaware VIP Diversified Income Series
Notes to Financial Statements (continued)
6. Capital Shares
Transactions in capital shares were as follows:
| | Year
Ended
12/31/07 | | Year
Ended
12/31/06 | |
Shares sold: | | | | | |
Standard Class | | 24,961,702 | | 21,608,848 | |
Service Class | | 17,034,144 | | 10,150,801 | |
| | | | | |
Shares issued upon reinvestment of dividends and distributions: | | | | | |
Standard Class | | 1,196,922 | | 209,284 | |
Service Class | | 780,296 | | 223,533 | |
| | 43,973,064 | | 32,192,466 | |
Shares repurchased: | | | | | |
Standard Class | | (5,084,546 | ) | (1,676,554 | ) |
Service Class | | (4,052,036 | ) | (3,228,944 | ) |
| | (9,136,582 | ) | (4,905,498 | ) |
Net increase | | 34,836,482 | | 27,286,968 | |
7. Line of Credit
The Series, along with certain other funds in the Delaware Investments® Family of Funds (Participants), participates in a $225,000,000 revolving line of credit facility to be used for temporary or emergency purposes as an additional source of liquidity to fund redemptions of investor shares. The Participants are charged an annual commitment fee, which is allocated across the Participants on the basis of each Participant’s allocation of the entire facility. The Participants may borrow up to a maximum of one third of their net assets under the agreement. The Series had no amounts outstanding as of December 31, 2007, or at any time during the year then ended.
8. Foreign Currency Exchange Contracts
The Series may enter into foreign currency exchange contracts and foreign cross currency exchange contracts as a way of managing foreign exchange rate risk. The Series may enter into these contracts to fix the U.S. dollar value of a security that it has agreed to buy or sell for the period between the date the trade was entered into and the date the security is delivered and paid for. The Series may also use these contracts to hedge the U.S. dollar value of securities it already owns that are denominated in foreign currencies. The change in market value is recorded as an unrealized gain or loss. When the contract is closed, a realized gain or loss is recorded equal to the difference between the value of the contract at the time it was opened and the value at the time it was closed.
The use of foreign currency exchange contracts and foreign cross currency exchange contracts does not eliminate fluctuations in the underlying prices of the securities, but does establish a rate of exchange that can be achieved in the future. Although foreign currency exchange contracts limit the risk of loss due to a decline in the value of the hedged currency, they also limit any potential gain that might result should the value of the currency increase. In addition, the Series could be exposed to risks if the counterparties to the contracts are unable to meet the terms of their contracts. The unrealized gain (loss) is included in liabilities net of receivables and other assets on the Statement of Net Assets.
9. Futures Contracts
The Series may invest in financial futures contracts to hedge its existing portfolio securities against fluctuations in fair value caused by changes in prevailing market interest rates. Upon entering into a futures contract, the Series deposits cash or pledges U.S. government securities to a broker, equal to the minimum “initial margin” requirements of the exchange on which the contract is traded. Subsequent payments are received from the broker or paid to the broker each day, based on the daily fluctuation in the market value of the contract. These receipts or payments are known as “variation margin” and are recorded daily by the Series as unrealized gains or losses until the contracts are closed. When the contracts are closed, the Series records a realized gain or loss equal to the difference between the value of the contract at the time it was opened and the value at the time it was closed. Risks of entering into futures contracts include potential imperfect correlation between the futures contracts and the underlying securities and the possibility of an illiquid secondary market for these instruments. The unrealized gain (loss) is included in liabilities net of receivables and other assets on the Statement of Net Assets.
10. Options Written
During the year ended December 31, 2007, the Series entered into options contracts in accordance with its investment objectives. When the Series writes an option, a premium is received and a liability is recorded and adjusted on a daily basis to reflect the current market value of the options written. Premiums received from writing options that expire unexercised are treated by the Series on the expiration date as realized gains. The difference between the premium received and the amount paid on effecting a closing purchase transaction, including brokerage commissions, is treated as realized gain or loss. If a call option is exercised, the premium is added to the proceeds from the sale of the underlying security in determining whether the Series has a realized gain or loss. If a put option is exercised, the premium reduces the cost basis of the securities purchased by the Series. The Series, as writer of an option, bears the market risk of an unfavorable change in the price of the security underlying the written option.
28
Delaware VIP Diversified Income Series
Notes to Financial Statements (continued)
Transactions in options written during the year ended December 31, 2007 for the Series were as follows:
| | Number of contracts | | Premiums | |
Options outstanding at December 31, 2006 | | — | | $ | — | |
Options written | | 8,359,719 | | 53,609 | |
Options expired | | (8,359,719 | ) | (53,609 | ) |
Options outstanding at December 31, 2007 | | — | | $ | — | |
11. Swap Contracts
The Series may enter into interest rate swap contracts, index swap contracts and credit default swap (CDS) contracts in accordance with its investment objectives. The Series may use interest rate swaps to adjust the Series’ sensitivity to interest rates or to hedge against changes in interest rates. Index swaps may be used to gain exposure to markets that the Series invests in, such as the corporate bond market. The Series may also use index swaps as a substitute for future or options contracts if such contracts are not directly available to the Series on favorable terms. The Series may enter into CDS contracts in order to hedge against a credit event, to enhance total return or to gain exposure to certain securities or markets.
An interest rate swap involves payments received by the Series from another party based on a variable or floating interest rate, in return for making payments based on a fixed interest rate. An interest rate swap can also work in reverse with the Series receiving payments based on a fixed interest rate and making payments based on a variable or floating interest rate. Interest rate swaps may be used to adjust the Series’ sensitivity to interest rates or to hedge against changes in interest rates. Periodic payments on such contracts are accrued daily and recorded as unrealized appreciation/depreciation on swap contracts. Upon periodic payment/receipt or termination of the contract, such amounts are recorded as realized gains or losses on swap contracts.
Index swaps involve commitments to pay interest in exchange for a market-linked return based on a notional amount. To the extent the total return of the security, instrument or basket of instruments underlying the transaction exceeds the offsetting interest obligation, the Series will receive a payment from the counterparty. To the extent the total return of the security, instrument or basket of instruments underlying the transaction falls short of the offsetting interest obligation, the Series will make a payment to the counterparty. The change in value of swap contracts outstanding, if any, is recorded as unrealized appreciation or depreciation daily. A realized gain or loss is recorded on maturity or termination of the swap contract.
A CDS contract is a risk-transfer instrument through which one party (purchaser of protection) transfers to another party (seller of protection) the financial risk of a credit event, as it relates to a particular reference security or basket of securities (such as an index). In exchange for the protection offered by the seller of protection, the purchaser of protection agrees to pay the seller of protection a periodic amount at a stated rate that is applied to the notional amount of the CDS contract. In addition, an upfront payment may be made or received by the Series in connection with an unwinding or assignment of a CDS contract. Upon the occurrence of a credit event, the seller of protection would pay the par (or other agreed-upon) value of the referenced security (or basket of securities) to the counterparty.
During the year ended December 31, 2007, the Series entered into CDS contracts as a purchaser and seller of protection. Periodic payments (receipts) on such contracts are accrued daily and recorded as unrealized losses (gains) on swap contracts. Upon payment (receipt), such amounts are recorded as realized losses (gains) on swap contracts. Upfront payments made or received in connection with CDS contracts are amortized over the expected life of the CDS contracts as unrealized losses (gains) on swap contracts. The change in value of CDS contracts is recorded as unrealized appreciation or depreciation daily. A realized gain or loss is recorded upon a credit event (as defined in the CDS agreement) or the maturity or termination of the agreement.
Credit default swaps may involve greater risks than if the Series had invested in the referenced obligation directly. Credit default swaps are subject to general market risk, liquidity risk, counterparty risk and credit risk. If the Series enters into a CDS contract as a purchaser of protection and no credit event occurs, its exposure is limited to the periodic payments previously made to the counterparty.
Because there is no organized market for swap contracts, the value of open swaps may differ from that which would be realized in the event the Series terminated its position in the agreement. Risks of entering into these agreements include the potential inability of the counterparty to meet the terms of the contracts. This type of risk is generally limited to the amount of favorable movements in the value of the underlying security, instrument, or basket of instruments, if any, at the day of default. Risks also arise from potential losses from adverse market movements and such losses could exceed the unrealized amounts shown above.
29
Delaware VIP Diversified Income Series
Notes to Financial Statements (continued)
12. Securities Lending
The Series, along with other funds in the Delaware Investments® Family of Funds, may lend its securities pursuant to a security lending agreement (Lending Agreement) with Mellon Bank, N.A. (Mellon). With respect to each loan, if the aggregate market value of the collateral held on any business day is less than the aggregate market value of the securities which are the subject of such loan, the borrower will be notified to provide additional collateral not less than the applicable collateral requirements. Cash collateral received is invested in a collective investment vehicle (Collective Trust) established by Mellon for the purpose of investment on behalf of clients participating in its securities lending programs. The Collective Trust invests in fixed income securities, with a weighted average maturity not to exceed 90 days, rated in one of the top two tiers by Standard & Poor’s Ratings Group or Moody’s Investors Service, Inc. or repurchase agreements collateralized by such securities. However, in the event of default or bankruptcy by the lending agent, realization and/or retention of the collateral may be subject to legal proceedings. In the event the borrower fails to return loaned securities and the collateral received is insufficient to cover the value of the loaned securities and provided such collateral shortfall is not the result of investment losses, the lending agent has agreed to pay the amount of the shortfall to the Series, or at the discretion of the lending agent, replace the loaned securities. The Series continues to record dividends or interest, as applicable, on the securities loaned and is subject to change in value of the securities loaned that may occur during the term of the loan. The Series has the right under the Lending Agreement to recover the securities from the borrower on demand. With respect to security loans collateralized by U.S. Treasury obligations, the Series receives a fee from the securities lending agent. With respect to security loans collateralized by cash collateral, the earnings from the collateral investments are shared among the Series, the security lending agent and the borrower. The Series records securities lending income net of allocations to the security lending agent and the borrower.
At December 31, 2007, the market value of the securities on loan was $138,085,618, for which the Series received collateral, comprised of U.S. government obligations valued at $2,047,195, and cash collateral of $138,269,641. Investments purchased with cash collateral are presented on the Statement of Net Assets under the caption “Securities Lending Collateral.”
13. Credit and Market Risk
Some countries in which the Series may invest require governmental approval for the repatriation of investment income, capital or the proceeds of sales of securities by foreign investors. In addition, if there is deterioration in a country’s balance of payments or for other reasons, a country may impose temporary restrictions on foreign capital remittances abroad.
The securities exchanges of certain foreign markets are substantially smaller, less liquid and more volatile than the major securities markets in the United States. Consequently, acquisition and disposition of securities by the Series may be inhibited. In addition, a significant portion of the aggregate market value of securities listed on the major securities exchanges in emerging markets are held by a smaller number of investors. This may limit the number of shares available for acquisition or disposition by the Series.
The Series invests in fixed income securities whose value is derived from underlying mortgages or consumer loans. The value of these securities is sensitive to changes in economic conditions, including delinquencies and/or defaults, and may be adversely affected by shifts in the market’s perception of the issuers and changes in interest rates. Investors receive principal and interest payments as the underlying mortgages or consumer loans are paid back. Some of these securities are collateralized mortgage obligations (CMOs). CMOs are debt securities issued by U.S. government agencies or by financial institutions and other mortgage lenders, which are collateralized by a pool of mortgages held under an indenture. Prepayment of mortgages may shorten the stated maturity of the obligations and can result in a loss of premium, if any has been paid. Certain of these securities may be stripped (securities which provide only the principal or interest feature of the underlying security). The yield to maturity on an interest-only CMO is extremely sensitive not only to changes in prevailing interest rates, but also to the rate of principal payments (including prepayments) on the related underlying mortgage assets. A rapid rate of principal payments may have a material adverse affect on the Series’ yield to maturity. If the underlying mortgage assets experience greater than anticipated prepayments of principal, the Series may fail to fully recoup its initial investment in these securities even if the securities are rated in the highest rating categories.
The Series invests a portion of its assets in high yield fixed income securities, which carry ratings of BB or lower by Standard & Poor’s Ratings Group and/or Ba or lower by Moody’s Investors Service, Inc. Investments in these higher yielding securities are generally accompanied by a greater degree of credit risk than higher rated securities. Additionally, lower rated securities may be more susceptible to adverse economic and competitive industry conditions than investment-grade securities.
The Series may invest up to 15% of its net assets in illiquid securities, which may include securities with contractual restrictions on resale, securities exempt from registration under Rule 144A of the Securities Act of 1933, as amended, and other securities which may not be readily marketable. The relative illiquidity of these securities may impair the Series from disposing of them in a timely manner and at a fair price when it is necessary or desirable to do so. While maintaining oversight, the Series’ Board of Trustees has delegated to DMC the day-to-day functions of determining whether individual securities are liquid for purposes of the Series’ limitation on investments in illiquid assets. Rule 144A and illiquid securities have been identified on the Statement of Net Assets.
14. Contractual Obligations
The Series enters into contracts in the normal course of business that contain a variety of indemnifications. The Series’ maximum exposure under these arrangements is unknown. However, the Series has not had prior claims or losses pursuant to these contracts. Management has reviewed the Series’ existing contracts and expects the risk of loss to be remote.
30
Delaware VIP Diversified Income Series
Notes to Financial Statements (continued)
15. Tax Information (Unaudited)
For the fiscal year ended December 31, 2007, the Series designates dividends and distributions paid during the year as follows:
(A)
Long-Term
Capital Gain
Distributions
(Tax Basis) | | (B)
Ordinary
Income
Distributions
(Tax Basis) | | Total
Distributions
(Tax Basis) | |
— | % | 100 | % | 100 | % |
(A) and (B) are based on a percentage of the Series’ total distributions.
16. Change in Custodian
On August 9, 2007, Mellon, One Mellon Center, Pittsburgh, PA 15258, became the Series’ custodian.
31
Delaware VIP Trust — Delaware VIP Diversified Income Series
Report of Independent Registered Public Accounting Firm
To the Shareholders and Board of Trustees
Delaware VIP Trust–Delaware VIP Diversified Income Series
We have audited the accompanying statement of net assets of the Delaware VIP Diversified Income Series (one of the series constituting Delaware VIP Trust) (the “Series”) as of December 31, 2007, and the related statement of operations for the year then ended, the statements of changes in net assets for each of the two years in the period then ended, and the financial highlights for each of the four years in the period then ended and for the period May 16, 2003 (commencement of operations) through December 31, 2003. These financial statements and financial highlights are the responsibility of the Series’ management. Our responsibility is to express an opinion on these financial statements and financial highlights based on our audits.
We conducted our audits in accordance with the standards of the Public Company Accounting Oversight Board (United States). Those standards require that we plan and perform the audit to obtain reasonable assurance about whether the financial statements and financial highlights are free of material misstatement. We were not engaged to perform an audit of the Series’ internal control over financial reporting. Our audits included consideration of internal control over financial reporting as a basis for designing audit procedures that are appropriate in the circumstances, but not for the purpose of expressing an opinion on the effectiveness of the Series’ internal control over financial reporting. Accordingly, we express no such opinion. An audit also includes examining, on a test basis, evidence supporting the amounts and disclosures in the financial statements and financial highlights, assessing the accounting principles used and significant estimates made by management, and evaluating the overall financial statement presentation. Our procedures included confirmation of securities owned as of December 31, 2007, by correspondence with the custodian and brokers or by other appropriate auditing procedures where replies from brokers were not received. We believe that our audits provide a reasonable basis for our opinion.
In our opinion, the financial statements and financial highlights referred to above present fairly, in all material respects, the financial position of the Delaware VIP Diversified Income Series of Delaware VIP Trust at December 31, 2007, the results of its operations for the year then ended, the changes in its net assets for each of the two years in the period then ended, and its financial highlights for each of the four years in the period then ended and for the period May 16, 2003 (commencement of operations) through December 31, 2003, in conformity with U.S. generally accepted accounting principles.

Philadelphia, Pennsylvania
February 14, 2008
The Series files its complete schedule of portfolio holdings with the Securities and Exchange Commission (Commission) for the first and third quarters of each fiscal year on Form N-Q. The Series’ Forms N-Q, as well as a description of the policies and procedures that the Series uses to determine how to vote proxies (if any) relating to portfolio securities is available without charge (i) upon request, by calling 800-523-1918; and (ii) on the Commission’s website at http://www.sec.gov. In addition, a description of the policies and procedures that the Series uses to determine how to vote proxies (if any) relating to portfolio securities is available without charge on the Delaware Investments® Funds’ website at http://www.delawareinvestments.com. The Series’ Forms N-Q may be reviewed and copied at the Commission’s Public Reference Room in Washington, DC; information on the operation of the Public Reference Room may be obtained by calling 800 SEC-0330.
Information (if any) regarding how the Series voted proxies relating to portfolio securities during the most recently disclosed 12-month period ended June 30 is available without charge (i) through the Delaware Investments® Funds’ website at http://www.delawareinvestments.com; and (ii) on the Commission’s website at http://www.sec.gov.
32
Delaware Investments® Family of Funds
BOARD OF TRUSTEES/DIRECTORS AND OFFICERS ADDENDUM
A mutual fund is governed by a Board of Trustees/Directors (“Trustees”), which has oversight responsibility for the management of a fund’s business affairs. Trustees establish procedures and oversee and review the performance of the investment manager, the distributor, and others who perform services for the fund. The independent fund trustees, in particular, are advocates for shareholder interests. Each trustee has served in that capacity since he or she was elected to or appointed to the Board of Trustees, and will continue to serve until his or her retirement or the election of a new trustee in his or her place. The following is a list of the Trustees and Officers with certain background and related information.
Name,
Address,
and Birth Date | | Position(s)
Held with
Fund(s) | | Length of Time
Served | | Principal
Occupation(s)
During
Past 5 Years | | Number of
Portfolios in Fund Complex Overseen
by Trustee
or Officer | | Other
Directorships
Held by
Trustee
or Officer |
INTERESTED TRUSTEES | | | | | | | | |
| | | | | | | | |
Patrick P. Coyne(1)
2005 Market Street
Philadelphia, PA
19103 April 1963 | | Chairman, President, Chief Executive Officer, and Trustee | | Chairman and Trustee since August 16, 2006 President and Chief Executive Officer since August 1, 2006 | | Patrick P. Coyne has served in various executive capacities at different times at Delaware Investments.(2) | | 84 | | Director – Kaydon Corp. Board of Governors Member – Investment Company Institute (2007 – present) Member of Investment Committee – Cradle of Liberty Council, BSA (November 2007 – present) Finance Committee Member – St . John Vianney Roman Catholic Church
(2007 – present) |
| | | | | | | | | | |
INDEPENDENT TRUSTEES | | | | | | | | |
| | | | | | | | |
Thomas L. Bennett
2005 Market Street
Philadelphia, PA
19103 October 1947 | | Trustee | | Since
March 2005 | | Private Investor – (March 2004 – Present) Investment Manager –
Morgan Stanley & Co.
(January 1984 – March 2004) | | 84 | | Director – Bryn Mawr
Bank Corp. (BMTC) (April 2007 – Present) Chairman of Investment Committee – The Haverford School (2002 – present) Chairman of Investment Committee – Pennsylvania Academy of Fine Arts(2007 – present) Trustee (2004 – present) Investment Committee
Member – Pennsylvania Horticulture Society(February 2006 – present) |
33
Name,
Address,
and Birth Date | | Position(s)
Held with
Fund(s) | | Length of Time
Served | | Principal
Occupation(s)
During
Past 5 Years | | Number of
Portfolios in Fund Complex Overseen
by Trustee
or Officer | | Other
Directorships
Held by
Trustee
or Officer |
INDEPENDENT TRUSTEES (CONTINUED) | | | | | | |
| | | | | | |
John A. Fry
2005 Market Street
Philadelphia, PA
19103 May 1960 | | Trustee | | Since
January 2001 | | President –
Franklin & Marshall College (June 2002 – Present) Executive Vice President – University of Pennsylvania (April 1995 – June 2002) | | 84 | | Director –
Community Health Systems Director –
Allied Barton
Security Holdings |
| | | | | | | | | | |
Anthony D. Knerr
2005 Market Street
Philadelphia, PA
19103 December 1938 | | Trustee | | Since
April 1990 | | Founder and Managing Director – Anthony Knerr & Associates (Strategic Consulting) (1990 – Present) | | 84 | | None |
| | | | | | | | | | |
Lucinda S. Landreth
2005 Market Street
Philadelphia, PA
19103 June 1947 | | Trustee | | Since
March 2005 | | Chief Investment Officer – Assurant, Inc. (Insurance)
(2002 – 2004) | | 84 | | None |
| | | | | | | | | | |
Ann R. Leven
2005 Market Street
Philadelphia, PA
19103 November 1940 | | Trustee | | Since
October 1989 | | Consultant –
ARL Associates (Financial Planning) (1983 – Present) | | 84 | | Director and Audit Committee Member – Systemax, Inc. |
| | | | | | | | | | |
Thomas F. Madison
2005 Market Street
Philadelphia, PA
19103 February 1936 | | Trustee | | Since
May 1997 | | President and Chief Executive Officer – MLM Partners, Inc. (Small Business Investing and Consulting) (January 1993 – Present) | | 84 | | Director – CenterPoint Energy Director and Audit Committee Member – Digital River, Inc. Director and Audit Committee Member – Rimage Corporation Director and Chair of Compensation and Governance & Nominating Committees – Valmont Industries, Inc. |
| | | | | | | | | | |
Janet L. Yeomans
2005 Market Street
Philadelphia, PA
19103 July 1948 | | Trustee | | Since
April 1999 | | Treasurer (January 2006 – Present) Vice President – Mergers & Acquisitions (January 2003 – January 2006), and Vice President
(July 1995 – January 2003)
3M Corporation | | 84 | | None |
| | | | | | | | | | |
J. Richard Zecher
2005 Market Street
Philadelphia, PA
19103 July 1940 | | Trustee | | Since
March 2003 | | Founder – Investor Analytics (Risk Management) (May 1999 – Present)
Founder – Sutton Asset Management (Hedge Fund) (September 1998 – Present) | | 84 | | Director and Audit Committee Member – Investor Analytics Director and Audit Committee Member – Oxigene, Inc. |
| | | | | | | | | | | | |
34
Name,
Address,
and Birth Date | | Position(s)
Held with
Fund(s) | | Length of Time
Served | | Principal
Occupation(s)
During
Past 5 Years | | Number of
Portfolios in Fund Complex Overseen
by Trustee
or Officer | | Other
Directorships
Held by
Trustee
or Officer |
OFFICERS | | | | | | | | | | |
| | | | | | | | | | |
David F. Connor
2005 Market Street
Philadelphia, PA
19103 December 1963 | | Vice President, Deputy General Counsel, and Secretary | | Vice President since September 21, 2000 and Secretary since October 2005 | | David F. Connor has served as Vice President and Deputy General Counsel of Delaware Investments since 2000. | | 84 | | None(4) |
| | | | | | | | | | |
Daniel V. Geatens
2005 Market Street
Philadelphia, PA
19103 October 1972 | | Vice President and Treasurer | | Treasurer since October 25, 2007 | | Daniel V. Geatens has served in various capacities at different times at Delaware Investments. | | 84 | | None(4) |
| | | | | | | | | | |
David P. O’Connor
2005 Market Street
Philadelphia, PA
19103 February 1966 | | Senior Vice President, General Counsel, and Chief Legal Officer | | Senior Vice President, General Counsel, and Chief Legal Officer since October 2005 | | David P. O’Connor has served in various executive and legal capacities at different times at Delaware Investments. | | 84 | | None(4) |
| | | | | | | | | | |
Richard Salus
2005 Market Street
Philadelphia, PA
19103 October 1963 | | Senior Vice President and
Chief Financial Officer | | Chief Financial Officer since November 1, 2006 | | Richard Salus has served in various executive capacities at different times at Delaware Investments. | | 84 | | None(4) |
| | | | | | | | | | |
(1) | Patrick P. Coyne is considered to be an “Interested Trustee” because he is an executive officer of the Fund’s(s’) investment advisor. |
(2) | Delaware Investments is the marketing name for Delaware Management Holdings, Inc. and its subsidiaries, including the Fund’s(s’) investment advisor, principal underwriter, and its transfer agent. |
(3) | In 1997, several funds managed by Voyageur Fund Managers, Inc. (the “Voyageur Funds”) were incorporated into the Delaware Investments Family of Funds. Mr. Madison served as a director of the Voyageur Funds from 1993 until 1997. |
(4) | David F. Connor, Daniel V. Geatens, David P. O’Connor, and Richard Salus serve in similar capacities for the six portfolios of the Optimum Fund Trust, which have the same investment advisor, principal underwriter, and transfer agent as the registrant. |
The Statement of Additional Information for the Fund(s) includes additional information about the Trustees and Officers and is available, without charge, upon request by calling 800 523-1918.
35
Delaware VIP Trust — Delaware VIP Emerging Markets Series
Delaware VIP Emerging Markets Series Standard Class shares returned +38.86%, and its Service Class shares returned +38.51% (both reflect all distributions reinvested) for the fiscal year ended Dec. 31, 2007. The Series performance lagged behind the performance of the benchmark, the MSCI Emerging Markets Index, which returned +39.37% (source: Lipper).
This fiscal year was the first full year in which the Series was managed by Liu-Er Chen and our Boston-based team of emerging markets analysts. Accordingly, We continued to follow our practice of letting our fundamental investment process guide the Series, rather than aiming for specific allocations to countries or sectors. In our experience, this generally results in carrying more exposure to attractive markets and sectors, compared to that of the benchmark. Furthermore, it generally results in less exposure to countries and sectors that our process deems to be unfavorable, on either an absolute or a relative basis.
During the year, we maintained our dedication to finding investment ideas that met our strict valuation criteria. We also continued investing with an eye toward the long term, maintaining an investment horizon of between three and five years. We were mindful of valuation swings that we saw over the course of the year, and we continued our disciplined adherence to our investment methodology.
The generally strong performance of emerging markets highlighted what we view as the positive fundamentals that underlay many of our emerging markets holdings. These included: a) growing national GDPs supported by both domestic demand and high commodity prices; b) good macroeconomic fundamentals, marked by high current account surpluses, strong currencies, and prudent fiscal and monetary policies; and c) high rates of earnings growth at the corporate level.
The views expressed are current as of the date of this report and are subject to change.
The performance data quoted below represent past performance; past performance does not guarantee future results. Investment return and principal value will fluctuate so your shares, when redeemed, may be worth more or less than their original cost. Please obtain the performance data for the most recent month end by calling the number noted in the introductory section of this report on the page related to this Series.
You should consider the investment objectives, risks, charges, and expenses of the investment company carefully before investing. The Delaware VIP Emerging Markets Series prospectus contains this and other important information about the Series. To obtain a prospectus, contact the company noted on the page related to this Series in the introductory section of this report, either by phone or through the company Web site. We advise you to read the prospectus carefully before you invest.
Instances of high double-digit returns are unusual, cannot be sustained, and were achieved primarily during favorable market conditions.
Delaware VIP Emerging Markets Series
Average annual total returns
For periods ended Dec. 31, 2007 | | 1 year | | 5 years | | 10 years | | Lifetime | |
Standard Class shares (commenced operations May 1, 1997) | | +38.86 | % | +38.64 | % | +15.81 | % | +13.47 | % |
Service Class shares (commenced operations May 1, 2000) | | +38.51 | % | +38.31 | % | NA | | +22.28 | % |
As disclosed in the Series’ most recent prospectus, expenses for Standard Class and Service Class shares were as follows: The net expense ratios for Standard Class and Service Class shares of the Series were 1.50% and 1.75%, respectively. Total operating expenses for Standard Class and Service Class shares were 1.55% and 1.85%, respectively. Management fees for Standard Class and Service Class shares were 1.25%.
Management has contracted to reimburse expenses and/or waive its management fees from May 1, 2007, through April 30, 2008, as disclosed in the most recent prospectus.
Earnings from a variable annuity or variable life investment compound tax-free until withdrawal and, as a result, no adjustments were made for income taxes.
An expense limitation was in effect for all classes during the periods shown in the Series performance chart above and in the Performance of a $10,000 Investment chart on the next page.
Performance of Service Class shares will vary due to different charges and expenses.
Performance data do not reflect insurance fees related to a variable annuity or variable life investment or the deferred sales charge that would apply to certain withdrawals of investments held for fewer than eight years. Performance shown here would have been reduced if such fees were included and the expense limitation removed. For more information about fees, consult your variable annuity or variable life prospectus.
Investments in variable products involve risk.
1
The Series invests in emerging markets, which have special risks that include currency fluctuations, economic and political change, and different accounting standards. Some portfolios offer more risk than others.
Please read both the contract and underlying prospectus for specific details regarding the product’s risk profile.
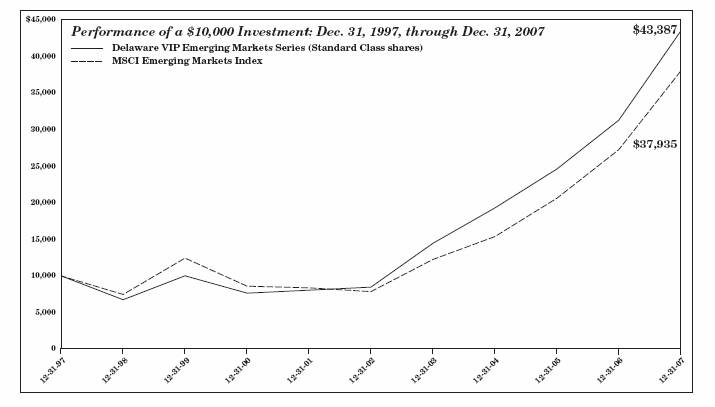
The chart shows a $10,000 investment in the Delaware VIP Emerging Markets Series Standard Class shares for the period from Dec. 31, 1997, through Dec. 31, 2007. Performance of Service Class shares will vary due to different charges and expenses.
The chart also shows $10,000 invested in the MSCI Emerging Markets Index for the period from Dec. 31, 1997, through Dec. 31, 2007. The MSCI Emerging Markets Index is a U.S. dollar–denominated index comprised of stocks of countries with below-average per capita GDP as defined by the World Bank, foreign ownership restrictions, a tax regulatory environment, and greater perceived market risk than that of developed countries. An index is unmanaged and does not reflect the costs of operating a mutual fund, such as the costs of buying, selling, and holding securities. You cannot invest directly in an index.
2
Delaware VIP Trust — Delaware VIP Emerging Markets Series
Disclosure of Series Expenses
For the Period July 1, 2007 to December 31, 2007
As a shareholder of the Series, you incur ongoing costs, including management fees; distribution and/or service (12b-1) fees; and other Series expenses. This Example is intended to help you understand your ongoing costs (in dollars) of investing in the Series and to compare these costs with the ongoing costs of investing in other mutual funds.
The Example is based on an investment of $1,000 invested at the beginning of the period and held for the entire period from July 1, 2007 to December 31, 2007.
Actual Expenses
The first section of the table shown, “Actual Series Return,” provides information about actual account values and actual expenses. You may use the information in this section of the table, together with the amount you invested, to estimate the expenses that you paid over the period. Simply divide your account value by $1,000 (for example, an $8,600 account value divided by $1,000 = 8.6), then multiply the result by the number in the first section under the heading entitled “Expenses Paid During Period” to estimate the expenses you paid on your account during the period.
Hypothetical Example for Comparison Purposes
The second section of the table shown, “Hypothetical 5% Return,” provides information about hypothetical account values and hypothetical expenses based on the Series’ actual expense ratio and an assumed rate of return of 5% per year before expenses, which is not the Series’ actual return. The hypothetical account values and expenses may not be used to estimate the actual ending account balance or expenses you paid for the period. You may use this information to compare the ongoing costs of investing in the Series and other funds. To do so, compare the 5% hypothetical example with the 5% hypothetical examples that appear in the shareholder reports of other funds.
Please note that the expenses shown in the table are meant to highlight your ongoing costs only. As a shareholder of the Series, you do not incur any transaction costs, such as sales charges (loads), redemption fees or exchange fees, but shareholders of other funds may incur such costs. Also, the fees related to the variable annuity investment or the deferred sales charge that could apply have not been included. Therefore, the second section of the table is useful in comparing ongoing costs only, and will not help you determine the relative total costs of owning different funds. The Series’ actual expenses shown in the table reflect fee waivers in effect. The expenses shown in the table assume reinvestment of all dividends and distributions.
Expense Analysis of an Investment of $1,000
| | Beginning
Account
Value
7/1/07 | | Ending
Account
Value
12/31/07 | | Annualized Expense
Ratios | | Expenses
Paid During
Period
7/1/07 to
12/31/07* | |
Actual Series Return | | | | | | | | | |
Standard Class | | $ | 1,000.00 | | $ | 1,146.60 | | 1.47 | % | $ | 7.95 | |
Service Class | | 1,000.00 | | 1,145.30 | | 1.72 | % | 9.30 | |
| | | | | | | | | |
Hypothetical 5% Return (5% return before expenses) | | | | | | | | | |
Standard Class | | $ | 1,000.00 | | $ | 1,017.80 | | 1.47 | % | $ | 7.48 | |
Service Class | | 1,000.00 | | 1,016.53 | | 1.72 | % | 8.74 | |
* | “Expenses Paid During Period” are equal to the Series’ annualized expense ratio, multiplied by the average account value over the period, multiplied by 184/365 (to reflect the one-half year period). |
3
Delaware VIP Trust — Delaware VIP Emerging Markets Series
Country and Sector Allocations
As of December 31, 2007
Country and sector designations may be different than the country and sector designations presented in other Series materials.
Sector | | Percentage
of Net Assets | |
Common Stock | | 91.51 | % |
Argentina | | 2.38 | % |
Australia | | 0.28 | % |
Brazil | | 9.71 | % |
Chile | | 0.84 | % |
China | | 10.64 | % |
Colombia | | 0.35 | % |
Hungary | | 0.86 | % |
India | | 1.44 | % |
Indonesia | | 3.02 | % |
Israel | | 1.07 | % |
Kazakhstan | | 1.14 | % |
Malaysia | | 3.35 | % |
Mexico | | 5.09 | % |
Pakistan | | 0.15 | % |
Peru | | 1.22 | % |
Philippines | | 0.31 | % |
Poland | | 1.54 | % |
Republic of Korea | | 13.29 | % |
Russia | | 8.66 | % |
South Africa | | 7.99 | % |
Taiwan | | 8.60 | % |
Thailand | | 2.51 | % |
Turkey | | 3.85 | % |
United Kingdom | | 1.71 | % |
United States | | 1.51 | % |
Preferred Stock | | 5.55 | % |
Brazil | | 3.23 | % |
Republic of Korea | | 1.62 | % |
Russia | | 0.70 | % |
Participation Notes | | 2.11 | % |
Discount Note | | 2.67 | % |
Securities Lending Collateral | | 6.64 | % |
Total Value of Securities | | 108.48 | % |
Obligation to Return Securities Lending Collateral | | (6.64 | )% |
Liabilities Net of Receivables and Other Assets | | (1.84 | )% |
Total Net Assets | | 100.00 | % |
Consumer Discretionary | | 7.19 | % |
Consumer Staples | | 6.51 | % |
Energy | | 20.17 | % |
Financials | | 10.36 | % |
Industrials | | 6.58 | % |
Information Technology | | 8.30 | % |
Materials | | 16.00 | % |
Telecommunication Services | | 14.03 | % |
Utilities | | 7.92 | % |
Total | | 97.06 | % |
4
Delaware VIP Trust — Delaware VIP Emerging Markets Series
Statement of Net Assets
December 31, 2007
| | | Number of
Shares | | Value
(U.S. $ ) | |
| COMMON STOCK–91.51%D | | | | | |
| Argentina–2.38% | | | | | |
* | Cresud ADR | | 242,919 | | $ | 4,834,088 | |
†# | Grupo Clarin Class B 144A GDR | | 209,100 | | 3,784,710 | |
*† | Grupo Financiero Galicia ADR | | 214,200 | | 1,623,636 | |
| IRSA Inversiones y Representaciones GDR | | 181,000 | | 2,635,360 | |
| Petrobras Energia Participaciones ADR | | 202,200 | | 2,820,690 | |
| | | | | 15,698,484 | |
| Australia–0.28% | | | | | |
*† | Alara Uranium | | 119,472 | | 13,089 | |
† | Gindalbie Metals | | 529,779 | | 557,190 | |
† | Murchison Metals | | 37,103 | | 112,841 | |
*† | Strike Resources | | 658,604 | | 1,154,466 | |
| | | | | 1,837,586 | |
| Brazil–9.71% | | | | | |
| AES Tiete | | 89,909,000 | | 3,990,343 | |
| Centrais Eletricas Brasileiras | | 1,216,923 | | 16,360,094 | |
* | Cia Vale do Rio Doce ADR | | 78,502 | | 2,196,486 | |
† | Cosan Class A | | 127,200 | | 1,602,720 | |
† | CSU Cardsystem | | 309,600 | | 1,000,112 | |
| Energias do Brasil | | 499,000 | | 8,101,742 | |
| Petroleo Brasileiro ADR | | 242,000 | | 23,285,240 | |
* | Tim Participacoes ADR | | 72,000 | | 2,516,400 | |
† | Triunfo Participacoes e Investimentos | | 78,700 | | 305,073 | |
* | Votorantim Celulose e Papel ADR | | 158,600 | | 4,727,866 | |
| | | | | 64,086,076 | |
| Chile–0.84% | | | | | |
| Inversiones Aguas Metropolitanas | | 237,618 | | 286,315 | |
# | Inversiones Aguas Metropolitanas 144A ADR | | 51,717 | | 1,246,318 | |
* | Sociedad Quimica y Minera de Chile ADR | | 22,700 | | 4,012,225 | |
| | | | | 5,544,858 | |
| China–10.64%n | | | | | |
*† | 51job ADR | | 67,300 | | 1,212,746 | |
† | Asiainfo Holdings | | 36,900 | | 405,900 | |
† | Baidu.com ADR | | 12,100 | | 4,723,719 | |
| China Mobile | | 215,200 | | 3,805,358 | |
| China Mobile ADR | | 47,800 | | 4,152,386 | |
* | China Netcom Group ADR | | 114,800 | | 6,819,120 | |
† | China New Town Development | | 648,000 | | 265,233 | |
* | China Petroleum & Chemical ADR | | 24,400 | | 3,616,080 | |
| China Telecom | | 9,718,000 | | 7,726,050 | |
* | China Unicom | | 3,327,021 | | 7,636,555 | |
| China Unicom ADR | | 163,100 | | 3,653,440 | |
*† | China Water Affairs Group | | 3,714,000 | | 2,285,978 | |
| CNPC | | 3,456,900 | | 2,211,955 | |
| Fountain Set Holdings | | 1,987,200 | | 504,540 | |
† | GCL Poly Energy Holdings | | 93,000 | | 44,601 | |
* | New World China Land | | 394,800 | | 354,376 | |
* | PetroChina | | 2,128,000 | | 3,792,935 | |
* | PetroChina ADR | | 42,700 | | 7,492,569 | |
| Road King Infrastructure | | 193,000 | | 341,527 | |
| Sinotrans | | 4,379,000 | | 1,931,623 | |
| Texwinca Holdings | | 2,414,000 | | $ | 2,169,922 | |
† | Tom Group | | 26,542,000 | | 2,144,189 | |
| TravelSky Technology Class H | | 2,815,000 | | 2,992,415 | |
| | | | | 70,283,217 | |
| Colombia–0.35% | | | | | |
*†# | Almacenes Exito 144A GDR | | 274,500 | | 2,326,909 | |
| | | | | 2,326,909 | |
| Hungary–0.86% | | | | | |
| Magyar Telekom Telecommunications | | 415,992 | | 2,159,752 | |
| OTP Bank | | 69,034 | | 3,500,486 | |
| | | | | 5,660,238 | |
| India–1.44% | | | | | |
* | Icici Bank ADR | | 41,300 | | 2,539,950 | |
*# | Reliance Industries 144A GDR | | 43,696 | | 6,445,160 | |
*† | Sify ADR | | 102,500 | | 541,200 | |
| | | | | 9,526,310 | |
| Indonesia–3.02% | | | | | |
| Aneka Tambang | | 7,313,000 | | 3,484,303 | |
| Bank Mandiri Persero | | 8,775,720 | | 3,270,228 | |
| Gudang Garam | | 4,205,727 | | 3,806,162 | |
| Tambang Batubara Bukit Asam | | 6,238,925 | | 7,971,099 | |
| United Tractors | | 1,223,000 | | 1,419,320 | |
| | | | | 19,951,112 | |
| Israel–1.07% | | | | | |
| Israel Chemicals | | 555,142 | | 7,055,889 | |
| | | | | 7,055,889 | |
| Kazakhstan–1.14% | | | | | |
| KazMunaiGas Exploration Production GDR | | 243,186 | | 7,538,766 | |
| | | | | 7,538,766 | |
| Malaysia–3.35% | | | | | |
| Bursa Malaysia | | 352,900 | | 1,525,996 | |
| Eastern & Oriental | | 4,015,375 | | 3,254,069 | |
| Hong Leong Bank | | 2,376,217 | | 4,562,740 | |
| KLCC Property Holdings | | 1,766,200 | | 1,869,277 | |
| Media Prima | | 1,612,000 | | 1,369,737 | |
| MISC - Foreign | | 404,412 | | 1,210,668 | |
| Oriental Holdings | | 1,436,600 | | 2,867,118 | |
| Tanjong | | 379,610 | | 2,123,612 | |
| UEM World | | 2,787,500 | | 3,321,061 | |
| | | | | 22,104,278 | |
| Mexico–5.09% | | | | | |
| America Movil Series L ADR | | 62,800 | | 3,855,292 | |
| Cemex ADR | | 185,085 | | 4,784,447 | |
| Controladora Comercial Mexicana | | 794,200 | | 2,000,595 | |
| Fomento Economico Mexicano ADR | | 176,000 | | 6,717,920 | |
| Grupo Mexico Series B | | 454,389 | | 2,855,280 | |
*† | Grupo Simec ADR | | 143,300 | | 1,483,155 | |
| Grupo Televisa ADR | | 483,200 | | 11,485,664 | |
| TV Azteca | | 663,900 | | 398,328 | |
| | | | | 33,580,681 | |
| Pakistan–0.15% | | | | | |
| Oil & Gas Development GDR | | 48,282 | | 987,367 | |
| | | | | 987,367 | |
| | | | | | | | |
5
| | | Number of
Shares | | Value
(U.S. $ ) | |
| COMMON STOCK (continued) | | | | | |
| Peru–1.22% | | | | | |
| Cia de Minas Buenaventura ADR | | 142,400 | | $ | 8,059,840 | |
| | | | | 8,059,840 | |
| Philippines–0.31% | | | | | |
| Manila Water | | 121,800 | | 54,652 | |
* | Philippine Long Distance Telephone ADR | | 26,400 | | 1,999,008 | |
| | | | | 2,053,660 | |
| Poland–1.54% | | | | | |
| Polski Koncern Naftowy Orlen | | 293,760 | | 6,175,278 | |
| Telekomunikacja Polska | | 434,628 | | 3,962,686 | |
| | | | | 10,137,964 | |
| Republic of Korea–13.29% | | | | | |
| Cheil Industries | | 28,260 | | 1,578,975 | |
| CJ | | 41,089 | | 3,621,437 | |
† | CJ CheilJedang | | 10,463 | | 3,308,638 | |
† | D&Shop | | 279,500 | | 1,925,941 | |
| GS Holdings | | 50,000 | | 3,103,470 | |
| Hana Financial Group | | 53,600 | | 2,886,002 | |
| Hyundai Elevator | | 17,340 | | 2,500,830 | |
| Kookmin Bank | | 61,489 | | 4,532,605 | |
* | Kookmin Bank ADR | | 87,200 | | 6,393,503 | |
| Korea Electric Power | | 127,730 | | 5,410,501 | |
| Korea Electric Power ADR | | 293,600 | | 6,121,560 | |
| Korea Gas | | 37,706 | | 2,610,278 | |
| KT | | 112,200 | | 5,861,423 | |
* | KT ADR | | 23,427 | | 604,417 | |
| Lotte Confectionery | | 2,172 | | 3,921,461 | |
| Lotte Shopping | | 6,100 | | 2,691,419 | |
* | POSCO ADR | | 26,400 | | 3,970,824 | |
| Samsung Electronics | | 22,930 | | 13,620,096 | |
| SK | | 9,171 | | 1,939,917 | |
† | SK Communications | | 67,000 | | 2,326,267 | |
† | SK Energy | | 22,652 | | 4,380,125 | |
| SK Telecom | | 16,757 | | 4,457,558 | |
| | | | | 87,767,247 | |
| Russia–8.66% | | | | | |
† | Chelyabinsk Zink Plant GDR | | 77,800 | | 894,700 | |
=† | Fifth Power Generation GDR | | 19,492 | | 171,247 | |
| Gazprom ADR | | 429,310 | | 24,170,153 | |
| LUKOIL ADR | | 27,664 | | 2,337,608 | |
| LUKOIL ADR (London International Exchange) | | 187,068 | | 16,143,968 | |
| Mobile TeleSystems ADR | | 70,100 | | 7,135,479 | |
| NovaTek GDR | | 81,645 | | 6,278,501 | |
=† | TGK-5 GDR | | 8,043 | | 28,808 | |
| | | | | 57,160,464 | |
| South Africa–7.99% | | | | | |
| ArcelorMittal South Africa | | 306,772 | | 6,099,691 | |
| Barloworld | | 117,710 | | 1,846,667 | |
† | Freeworld Coatings | | 72,121 | | 110,834 | |
* | Gold Fields ADR | | 326,245 | | 4,632,679 | |
| JD Group | | 550,074 | | 4,086,493 | |
| MTN Group | | 147,500 | | 2,751,471 | |
| Sasol | | 121,822 | | 6,015,682 | |
| Sasol ADR | | 65,300 | | $ | 3,230,391 | |
| Standard Bank Group | | 362,093 | | 5,278,699 | |
| Steinhoff International Holdings | | 418,714 | | 1,183,256 | |
| Sun International | | 146,847 | | 3,123,039 | |
| Telkom | | 499,691 | | 10,044,776 | |
* | Tiger Brands | | 49,997 | | 1,223,525 | |
| Tongaat-Hulett Group | | 242,673 | | 3,146,088 | |
| | | | | 52,773,291 | |
| Taiwan–8.60% | | | | | |
| Cathay Financial Holding | | 1,931,188 | | 4,025,542 | |
† | China Life Insurance | | 4,464,000 | | 2,491,471 | |
| China Steel | | 6,140,860 | | 8,237,048 | |
| Etron Technology | | 2,923,204 | | 2,586,986 | |
| Evergreen Marine | | 8,911,000 | | 8,133,384 | |
| Formosa Chemicals & Fibre | | 2,255,330 | | 5,772,199 | |
| MediaTek | | 335,250 | | 4,352,151 | |
| President Chain Store | | 1,461,549 | | 3,839,778 | |
| Synnex Technology International | | 1,026,018 | | 2,562,672 | |
| Taiwan Semiconductor Manufacturing | | 2,312,585 | | 4,421,224 | |
| United Microelectronics | | 7,193,743 | | 4,469,748 | |
| Walsin Lihwa | | 14,272,000 | | 5,897,160 | |
| | | | | 56,789,363 | |
| Thailand–2.51% | | | | | |
| Bangkok Bank | | 724,224 | | 2,579,987 | |
| Charoen Pokphand Foods–Foreign | | 21,104,200 | | 2,881,974 | |
| Land & Houses NVDR | | 6,629,101 | | 1,475,976 | |
| PTT Exploration & Production–Foreign | | 587,900 | | 2,862,271 | |
| Siam Cement NVDR | | 981,493 | | 6,759,874 | |
| | | | | 16,560,082 | |
| Turkey–3.85% | | | | | |
| Alarko Gayrimenkul Yatirim Ortakligi | �� | 29,369 | | 660,189 | |
| Alarko Holding | | 1,107,964 | | 3,491,594 | |
| Haci Omer Sabanci Holding | | 350,000 | | 1,933,205 | |
| Turk Sise ve Cam Fabrikalari | | 1,719,608 | | 3,475,294 | |
| Turkcell Iletisim Hizmet | | 200,400 | | 2,196,635 | |
| Turkcell Iletisim Hizmet ADR | | 72,300 | | 1,993,311 | |
| Turkiye Is Bankasi Class C | | 1,364,084 | | 8,585,758 | |
| Yazicilar Holding | | 353,282 | | 3,055,575 | |
| | | | | 25,391,561 | |
| United Kingdom–1.71% | | | | | |
| Anglo American | | 110,532 | | 6,764,004 | |
† | Dev Property Development | | 449,300 | | 718,617 | |
| Griffin Mining | | 1,846,472 | | 3,439,371 | |
† | Mwana Africa | | 470,093 | | 399,287 | |
| | | | | 11,321,279 | |
| United States–1.51% | | | | | |
*† | Applied Micro Circuits | | 139,775 | | 1,221,634 | |
| ConocoPhillips | | 64,600 | | 5,704,180 | |
† | HLS Systems International | | 145,100 | | 1,294,292 | |
† | NII Holdings | | 36,800 | | 1,778,176 | |
| | | | | 9,998,282 | |
| Total Common Stock (cost $496,954,113) | | | | 604,194,804 | |
| | | | | | | | |
6
| | | Number of
Shares | | Value
(U.S. $ ) | |
| PREFERRED STOCK–5.55% | | | | | |
| Brazil–3.23% | | | | | |
| Banco do Estado do Rio Grande do Sul Class B | | 371,100 | | $ | 2,291,230 | |
| Braskem Class A | | 246,200 | | 1,991,730 | |
| Centrais Elecricas Brasileiras Class B | | 229,498 | | 2,958,977 | |
| CIA Vale do Rio Doce Class A | | 461,280 | | 13,151,663 | |
| LA Fonte Participacoes | | 1,875,000 | | 937,500 | |
| | | | | 21,331,100 | |
| Republic of Korea–1.62% | | | | | |
| CJ | | 31,500 | | 1,023,023 | |
| CJ CheilJedang | | 18,500 | | 1,766,894 | |
| Hyundai Motor | | 76,342 | | 2,805,584 | |
| Samsung Electronics | | 11,195 | | 5,118,814 | |
| | | | | 10,714,315 | |
| Russia–0.70% | | | | | |
| Transneft | | 2,315 | | 4,595,275 | |
| | | | | 4,595,275 | |
| Total Preferred Stock (cost $26,850,261) | | | | 36,640,690 | |
| | | | | | |
| PARTICIPATION NOTES–2.11% | | | | | |
=# | Lehman CW12 Hindalco Industiries 144A | | 1,340,834 | | 7,310,701 | |
=# | Lehman Indian Oil CW LEPO 144A | | 100,339 | | 2,022,440 | |
=# | Lehman Oil & Natural Gas CW LEPO 144A | | 146,971 | | 4,613,521 | |
| Total Participation Notes (cost $10,169,134) | | | | 13,946,662 | |
| | | | | | | |
| | | Principal
Amount | | Value
(U.S. $ ) | |
¹ | DISCOUNT NOTE–2.67% | | | | | |
| Federal Home Loan Bank
3.25% 1/2/08 | | $ | 17,633,183 | | $ | 17,631,608 | |
| Total Discount Note (cost $17,631,608) | | | | 17,631,608 | |
| | | | | | |
| Total Value of Securities Before Securities Lending Collateral–101.84%
(cost $551,605,116) | | | | 672,413,764 | |
| | | | | | |
| | | Number of
Shares | | | |
| | | | | | |
| SECURITIES LENDING COLLATERAL**–6.64% | | | | | |
| Investment Companies Mellon GSL DBT II Collateral Fund | | 43,853,097 | | 43,853,097 | |
| Total Securities Lending Collateral (cost $43,853,097) | | | | 43,853,097 | |
| | | | | | | | |
7
TOTAL VALUE OF SECURITIES–108.48% (cost $595,458,213) | | $ | 716,266,861 | © |
OBLIGATION TO RETURN SECURITIES LENDING COLLATERAL**–(6.64%) | | (43,853,097 | ) |
LIABILITIES NET OF RECEIVABLES AND OTHER ASSETS–(1.84%) | | (12,124,791 | ) |
NET ASSETS APPLICABLE TO 23,753,347 SHARES OUTSTANDING–100.00% | | $ | 660,288,973 | |
NET ASSET VALUE-DELAWARE VIP EMERGING MARKETS SERIES STANDARD CLASS ($346,779,458 / 12,456,438 Shares) | | $ | 27.84 | |
NET ASSET VALUE-DELAWARE VIP EMERGING MARKETS SERIES SERVICE CLASS ($313,509,515 / 11,296,909 Shares) | | $ | 27.75 | |
COMPONENTS OF NET ASSETS AT DECEMBER 31, 2007: | | | |
Shares of beneficial interest (unlimited authorization–no par) | | $ | 448,606,755 | |
Undistributed net investment income | | 5,919,158 | |
Accumulated net realized gain on investments | | 84,956,899 | |
Net unrealized appreciation of investments and foreign currencies | | 120,806,161 | |
Total net assets | | $ | 660,288,973 | |
† | Non-income producing security for the year ended December 31, 2007. |
¹ | The rate shown is the effective yield as of the time of purchase. |
* | Fully or partially on loan. |
** | See Note 9 in “Notes to Financial Statements.” |
© | Includes $42,126,431 of securities loaned. |
# | Security exempt from registration under Rule 144A of the Securities Act of 1933, as amended. At December 31, 2007, the aggregate amount of Rule 144A securities was $27,749,759, which represented 4.20% of Series’ net assets. See Note 10 in “Notes to Financial Statements.” |
= | Security is being fair valued in accordance with the Series’ fair valuation policy. At December 31, 2007, the aggregate amount of fair valued securities was $14,146,717, which represented 2.14% of the Series’ net assets. See Note 1 in “Notes to Financial Statements.” |
D | Securities have been classified by country of origin. Classification by type of business has been presented on page 4 in “Country and Sector Allocations.” |
n | Securities listed and traded on the Hong Kong Stock Exchange. These securities have significant business operations in China. |
Summary of Abbreviations:
ADR – American Depositary Receipts
GDR – Global Depositary Receipts
LEPO – Low Exercise Price Option
NVDR – Non-Voting Depositary Receipts
See accompanying notes
8
Delaware VIP Trust — Delaware VIP Emerging Markets Series
Statement of Operations
Year Ended December 31, 2007
INVESTMENT INCOME: | | | |
Dividends | | $ | 13,428,923 | |
Interest | | 268,512 | |
Securities lending income | | 89,736 | |
Foreign tax withheld | | (1,255,967 | ) |
| | 12,531,204 | |
| | | |
EXPENSES: | | | |
Management fees | | 6,114,541 | |
Custodian fees | | 688,301 | |
Distribution expenses – Service Class | | 677,992 | |
Accounting and administration expenses | | 196,320 | |
Legal fees | | 61,253 | |
Dividend disbursing and transfer agent fees and expenses | | 58,491 | |
Reports and statements to shareholders | | 49,239 | |
Audit and tax | | 40,324 | |
Trustees’ fees | | 22,707 | |
Insurance fees | | 18,091 | |
Pricing fees | | 12,885 | |
Consulting fees | | 8,846 | |
Taxes (other than taxes on income) | | 3,914 | |
Trustees’ expenses | | 3,139 | |
Dues and services | | 1,709 | |
| | 7,957,752 | |
Less expenses absorbed or waived | | (40,214 | ) |
Less waiver of distribution expenses – Service Class | | (112,999 | ) |
Less expense paid indirectly | | (37,027 | ) |
Total operating expenses | | 7,767,512 | |
| | | |
NET INVESTMENT INCOME | | 4,763,692 | |
| | | |
NET REALIZED AND UNREALIZED GAIN (LOSS) ON INVESTMENTS AND FOREIGN CURRENCIES: | | | |
Net realized gain (loss) on: | | | |
Investments | | 88,444,555 | |
Foreign currencies | | (971,204 | ) |
Net realized gain | | 87,473,351 | |
Net change in unrealized appreciation/depreciation of investments and foreign currencies | | 62,012,987 | |
| | | |
NET REALIZED AND UNREALIZED GAIN ON INVESTMENTS AND FOREIGN CURRENCIES | | 149,486,338 | |
| | | |
NET INCREASE IN NET ASSETS RESULTING FROM OPERATIONS | | $ | 154,250,030 | |
See accompanying notes
Delaware VIP Trust — Delaware VIP Emerging Markets Series
Statement of Changes in Net Assets
| | Year Ended | |
| | 12/31/07 | | 12/31/06 | |
INCREASE IN NET ASSETS FROM OPERATIONS: | | | | | |
Net investment income | | $ | 4,763,692 | | $ | 6,174,862 | |
Net realized gain on investments and foreign currencies | | 87,473,351 | | 29,823,647 | |
Net change in unrealized appreciation/ depreciation of investments and foreign currencies | | 62,012,987 | | 30,008,281 | |
Net increase in net assets resulting from operations | | 154,250,030 | | 66,006,790 | |
| | | | | |
DIVIDENDS AND DISTRIBUTIONS TO SHAREHOLDERS FROM: | | | | | |
Net investment income: | | | | | |
Standard Class | | (3,783,511 | ) | (1,865,697 | ) |
Service Class | | (2,797,530 | ) | (1,148,824 | ) |
Net realized gain on investments: | | | | | |
Standard Class | | (16,362,104 | ) | (3,946,372 | ) |
Service Class | | (13,663,407 | ) | (2,908,845 | ) |
| | (36,606,552 | ) | (9,869,738 | ) |
CAPITAL SHARE TRANSACTIONS: | | | | | |
Proceeds from shares sold: | | | | | |
Standard Class | | 144,959,043 | | 90,207,572 | |
Service Class | | 150,649,303 | | 89,316,167 | |
Net asset value of shares issued upon reinvestment of dividends and distributions: | | | | | |
Standard Class | | 20,145,615 | | 5,812,069 | |
Service Class | | 16,460,937 | | 4,057,669 | |
| | 332,214,898 | | 189,393,477 | |
Cost of shares repurchased: | | | | | |
Standard Class | | (70,546,768 | ) | (58,049,374 | ) |
Service Class | | (66,332,038 | ) | (39,040,035 | ) |
| | (136,878,806 | ) | (97,089,409 | ) |
Increase in net assets derived from capital share transactions | | 195,336,092 | | 92,304,068 | |
| | | | | |
NET INCREASE IN NET ASSETS | | 312,979,570 | | 148,441,120 | |
| | | | | |
NET ASSETS: | | | | | |
Beginning of year | | 347,309,403 | | 198,868,283 | |
End of year (including undistributed net investment income of $5,919,158 and $5,402,981, respectively) | | $ | 660,288,973 | | $ | 347,309,403 | |
See accompanying notes
9
Delaware VIP Trust — Delaware VIP Emerging Markets Series
Financial Highlights
Selected data for each share of the Series outstanding throughout each period were as follows:
| | Delaware VIP Emerging Markets Series Standard Class
Year Ended | |
| | 12/31/07 | | 12/31/06 | | 12/31/05 | | 12/31/04 | | 12/31/03 | |
| | | | | | | | | | | |
Net asset value, beginning of period | | $ | 22.240 | | $ | 18.200 | | $ | 14.500 | | $ | 11.180 | | $ | 6.770 | |
| | | | | | | | | | | |
Income from investment operations: | | | | | | | | | | | |
Net investment income(1) | | 0.267 | | 0.457 | | 0.412 | | 0.263 | | 0.210 | |
Net realized and unrealized gain on investments and foreign currencies | | 7.564 | | 4.340 | | 3.519 | | 3.388 | | 4.410 | |
Total from investment operations | | 7.831 | | 4.797 | | 3.931 | | 3.651 | | 4.620 | |
| | | | | | | | | | | |
Less dividends and distributions from: | | | | | | | | | | | |
Net investment income | | (0.419 | ) | (0.243 | ) | (0.051 | ) | (0.331 | ) | (0.210 | ) |
Net realized gain on investments | | (1.812 | ) | (0.514 | ) | (0.180 | ) | — | | — | |
Total dividends and distributions | | (2.231 | ) | (0.757 | ) | (0.231 | ) | (0.331 | ) | (0.210 | ) |
| | | | | | | | | | | |
Net asset value, end of period | | $ | 27.840 | | $ | 22.240 | | $ | 18.200 | | $ | 14.500 | | $ | 11.180 | |
| | | | | | | | | | | |
Total return(2) | | 38.86 | % | 27.13 | % | 27.49 | % | 33.47 | % | 70.54 | % |
| | | | | | | | | | | |
Ratios and supplemental data: | | | | | | | | | | | |
Net assets, end of period (000 omitted) | | $ | 346,779 | | $ | 189,572 | | $ | 120,292 | | $ | 36,966 | | $ | 14,304 | |
Ratio of expenses to average net assets | | 1.47 | % | 1.51 | % | 1.47 | % | 1.50 | % | 1.49 | % |
Ratio of expenses to average net assets prior to expense limitation and expenses paid indirectly | | 1.48 | % | 1.56 | % | 1.57 | % | 1.63 | % | 1.58 | % |
Ratio of net investment income to average net assets | | 1.09 | % | 2.37 | % | 2.55 | % | 2.15 | % | 2.64 | % |
Ratio of net investment income to average net assets prior to expense limitation and expenses paid indirectly | | 1.08 | % | 2.32 | % | 2.45 | % | 2.02 | % | 2.55 | % |
Portfolio turnover | | 92 | % | 67 | % | 18 | % | 34 | % | 71 | % |
(1) | The average shares outstanding method has been applied for per share information. |
(2) | Total investment return is based on the change in net asset value of a share during the period and assumes reinvestment of dividends and distributions at net asset value. Total investment return reflects a waiver by the manager. Performance would have been lower had the waiver not been in effect. |
See accompanying notes
10
Selected data for each share of the Series outstanding throughout each period were as follows:
| | Delaware VIP Emerging Markets Series Service Class
Year Ended | |
| | 12/31/07 | | 12/31/06 | | 12/31/05 | | 12/31/04 | | 12/31/03 | |
| | | | | | | | | | | |
Net asset value, beginning of period | | $ | 22.180 | | $ | 18.160 | | $ | 14.480 | | $ | 11.170 | | $ | 6.770 | |
| | | | | | | | | | | |
Income from investment operations: | | | | | | | | | | | |
Net investment income(1) | | 0.205 | | 0.409 | | 0.372 | | 0.231 | | 0.197 | |
Net realized and unrealized gain on investments and foreign currencies | | 7.548 | | 4.328 | | 3.507 | | 3.397 | | 4.402 | |
Total from investment operations | | 7.753 | | 4.737 | | 3.879 | | 3.628 | | 4.599 | |
| | | | | | | | | | | |
Less dividends and distributions from: | | | | | | | | | | | |
Net investment income | | (0.371 | ) | (0.203 | ) | (0.019 | ) | (0.318 | ) | (0.199 | ) |
Net realized gain on investments | | (1.812 | ) | (0.514 | ) | (0.180 | ) | — | | — | |
Total dividends and distributions | | (2.183 | ) | (0.717 | ) | (0.199 | ) | (0.318 | ) | (0.199 | ) |
| | | | | | | | | | | |
Net asset value, end of period | | $ | 27.750 | | $ | 22.180 | | $ | 18.160 | | $ | 14.480 | | $ | 11.170 | |
| | | | | | | | | | | |
Total return(2) | | 38.51 | % | 26.81 | % | 27.11 | % | 33.26 | % | 70.10 | % |
| | | | | | | | | | | |
Ratios and supplemental data: | | | | | | | | | | | |
Net assets, end of period (000 omitted) | | $ | 313,510 | | $ | 157,737 | | $ | 78,576 | | $ | 12,045 | | $ | 144 | |
Ratio of expenses to average net assets | | 1.72 | % | 1.76 | % | 1.72 | % | 1.75 | % | 1.71 | % |
Ratio of expenses to average net assets prior to expense limitation and expenses paid indirectly | | 1.78 | % | 1.86 | % | 1.87 | % | 1.93 | % | 1.83 | % |
Ratio of net investment income to average net assets | | 0.84 | % | 2.12 | % | 2.30 | % | 1.90 | % | 2.42 | % |
Ratio of net investment income to average net assets prior to expense limitation and expenses paid indirectly | | 0.78 | % | 2.02 | % | 2.15 | % | 1.72 | % | 2.30 | % |
Portfolio turnover | | 92 | % | 67 | % | 18 | % | 34 | % | 71 | % |
(1) | The average shares outstanding method has been applied for per share information. |
(2) | Total investment return is based on the change in net asset value of a share during the period and assumes reinvestment of dividends and distributions at net asset value. Total investment return reflects a waiver by the manager and distributor, as applicable. Performance would have been lower had the waiver not been in effect. |
See accompanying notes
11
Delaware VIP Trust — Delaware VIP Emerging Markets Series
Notes to Financial Statements
December 31, 2007
Delaware VIP Trust (Trust) is organized as a Delaware statutory trust and offers 14 series: Delaware VIP Balanced Series, Delaware VIP Capital Reserves Series, Delaware VIP Cash Reserve Series, Delaware VIP Diversified Income Series, Delaware VIP Emerging Markets Series, Delaware VIP Growth Opportunities Series, Delaware VIP High Yield Series, Delaware VIP International Value Equity Series, Delaware VIP REIT Series, Delaware VIP Select Growth Series, Delaware VIP Small Cap Value Series, Delaware VIP Trend Series, Delaware VIP U.S. Growth Series and Delaware VIP Value Series. These financial statements and the related notes pertain to Delaware VIP Emerging Markets Series (Series). The Trust is an open-end investment company. The Series is considered non-diversified under the Investment Company Act of 1940, as amended, and offers Standard Class and Service Class shares. The Standard Class shares do not carry a 12b-1 fee and the Service Class shares carry a 12b-1 fee. The shares of the Series are sold only to separate accounts of life insurance companies.
The investment objective of the Series is to seek long-term capital appreciation.
1. Significant Accounting Policies
The following accounting policies are in accordance with U.S. generally accepted accounting principles and are consistently followed by the Series.
Security Valuation—Equity securities, except those traded on the Nasdaq Stock Market, Inc. (Nasdaq), are valued at the last quoted sales price as of the time of the regular close of the New York Stock Exchange (NYSE) on the valuation date. Securities traded on the Nasdaq are valued in accordance with the Nasdaq Official Closing Price, which may not be the last sales price. If on a particular day an equity security does not trade, then the mean between the bid and asked prices will be used. Securities listed on a foreign exchange are valued at the last quoted sales price on the valuation date. Short-term debt securities having less than 60 days to maturity are valued at amortized cost, which approximates market value. Securities lending collateral, which is invested in a collective investment vehicle, is valued at unit value per share. Foreign currency exchange contracts are valued at the mean between the bid and asked prices of the contracts. Interpolated values are derived when the settlement date of the contract is an interim date for which quotations are not available. Other securities and assets for which market quotations are not readily available are valued at fair value as determined in good faith under the direction of the Series’ Board of Trustees. In determining whether market quotations are readily available or fair valuation will be used, various factors will be taken into consideration, such as market closures, aftermarket trading, or significant events after local market trading (e.g., government actions or pronouncements, trading volume or volatility on markets, exchanges among dealers, or news events).
In September 2006, the Financial Accounting Standards Board (FASB) issued FASB Statement No. 157, “Fair Value Measurements” (Statement 157). Statement 157 establishes a framework for measuring fair value in U.S. generally accepted accounting principles, clarifies the definition of fair value within that framework, and expands disclosures about the use of fair value measurements. Statement 157 is intended to increase consistency and comparability among fair value estimates used in financial reporting. Statement 157 is effective for fiscal years beginning after November 15, 2007. Management does not expect the adoption of Statement 157 to have a material impact on the amounts reported in the financial statements.
Federal Income Taxes—The Series intends to continue to qualify for federal income tax purposes as a regulated investment company under Subchapter M of the Internal Revenue Code of 1986, as amended, and make the requisite distributions to shareholders. Accordingly, no provision for federal income taxes has been made in the financial statements.
Effective June 29, 2007, the Series adopted FASB Interpretation No. 48 “Accounting for Uncertainty in Income Taxes” (FIN 48). FIN 48 provides guidance for how uncertain tax positions should be recognized, measured, presented and disclosed in the financial statements. FIN 48 requires the evaluation of tax positions taken or expected to be taken in the course of preparing the Series’ tax returns to determine whether the tax positions are “more-likely-than-not” of being sustained by the applicable tax authority. Tax positions not deemed to meet the more-likely-than-not threshold are recorded as a tax benefit or expense in the current year. The adoption of FIN 48 did not result in the recording of any tax benefit or expense in the current period.
Class Accounting—Investment income, common expenses and realized and unrealized gain (loss) on investments are allocated to the classes of the Series on the basis of daily net assets of each class. Distribution expenses relating to a specific class are charged directly to that class.
Repurchase Agreements—The Series may invest in a pooled cash account along with members of the Delaware Investments® Family of Funds pursuant to an exemptive order issued by the Securities and Exchange Commission. The aggregate daily balance of the pooled cash account is invested in repurchase agreements secured by obligations of the U.S. government. The respective collateral is held by the Series’ custodian bank until the maturity of the respective repurchase agreements. Each repurchase agreement is at least 102% collateralized. However, in the event of default or bankruptcy by the counterparty to the agreement, realization of the collateral may be subject to legal proceedings. At December 31, 2007, the Series held no investments in repurchase agreements.
Foreign Currency Transactions—Transactions denominated in foreign currencies are recorded at the prevailing exchange rates on the valuation date. The value of all assets and liabilities denominated in foreign currencies are translated into U.S. dollars at the exchange rate of such currencies against the U.S. dollar daily. Transaction gains or losses resulting from changes in exchange rates during the reporting period or upon settlement of the foreign currency transaction are reported in operations for the current period. The Series does not isolate that portion of realized gains and losses on investments which are due to changes in foreign exchange rates from that which are due to changes in market prices. The Series reports certain foreign currency related transactions as components of realized gains (losses) for financial reporting purposes, whereas such components are treated as ordinary income (loss) for federal income tax purposes.
Use of Estimates—The preparation of financial statements in conformity with U.S. generally accepted accounting principles requires management to make estimates and assumptions that affect the reported amounts of assets and liabilities at the date of the financial statements and the reported amounts of revenues and expenses during the reporting period. Actual results could differ from those estimates.
12
Delaware VIP Emerging Markets Series
Notes to Financial Statements (continued)
1. Significant Accounting Policies (continued)
Other—Expenses directly attributable to the Series are charged directly to the Series. Other expenses common to various funds within the Delaware Investments® Family of Funds are generally allocated amongst such funds on the basis of average net assets. Management fees and some other expenses are paid monthly. Security transactions are recorded on the date the securities are purchased or sold (trade date) for financial reporting purposes. Costs used in calculating realized gains and losses on the sale of investment securities are those of the specific securities sold. Dividend income is recorded on the ex-dividend date and interest income is recorded on the accrual basis. Foreign dividends are also recorded on the ex-dividend date or as soon after the ex-dividend date that the Series is aware of such dividends, net of all non-rebatable tax withholdings. Withholding taxes on foreign dividends have been recorded in accordance with the Series’ understanding of the applicable country’s tax rules and rates.
The Series declares and pays dividends from net investment income and distributions from net realized gain on investments, if any, following the close of the fiscal year.
The Series may receive earnings credits from its custodian when positive cash balances are maintained, which are used to offset custody fees. The expense paid under this arrangement is included in custodian fees on the Statement of Operations with the corresponding expense offset shown as “expense paid indirectly.”
2. Investment Management, Administration Agreements and Other Transactions with Affiliates
In accordance with the terms of its investment management agreement, the Series pays Delaware Management Company (DMC), a series of Delaware Management Business Trust and the investment manager, an annual fee which is calculated daily at the rate of 1.25% on the first $500 million of average daily net assets of the Series, 1.20% on the next $500 million, 1.15% on the next $1.5 billion, and 1.10% on average daily net assets in excess of $2.5 billion.
DMC has contractually agreed to waive that portion, if any, of its management fee and reimburse the Series to the extent necessary to ensure that total annual operating expenses, exclusive of taxes, interest, brokerage fees, 12b-1 plan expenses, certain insurance costs and non-routine expenses or costs including, but not limited to, those relating to reorganizations, litigation, conducting shareholder meetings, and liquidations, do not exceed 1.50% of average daily net assets of the Series through April 30, 2008.
Effective October 1, 2007, Delaware Service Company, Inc. (DSC), an affiliate of DMC, provides fund accounting and financial administration oversight services to the Series. For these services, the Series pays DSC fees based on the aggregate daily net assets of the Delaware Investments® Family of Funds at the following annual rate: 0.0050% of the first $30 billion; 0.0045% of the next $10 billion; 0.0040% of the next $10 billion; and 0.0025% of aggregate average daily net assets in excess of $50 billion. The fees payable to DSC under the service agreement described above are allocated among all funds in the Delaware Investments® Family of Funds on a relative net asset value basis. Prior to October 1, 2007, DSC provided fund accounting and administrative services to the Series and received a fee at an annual rate of 0.04% of average daily net assets. For the year ended December 31, 2007, the Series was charged $139,284 for these services.
DSC also provides dividend disbursing and transfer agency services. The Series pays DSC a monthly fee based on the number of shareholder accounts for dividend disbursing and transfer agent services.
Pursuant to a distribution agreement and distribution plan, the Series pays Delaware Distributors, L.P. (DDLP), the distributor and an affiliate of DMC, an annual distribution and service fee not to exceed 0.30% of the average daily net assets of the Service Class shares. DDLP has contracted to waive distribution and service fees through April 30, 2008 in order to prevent distribution and service fees of the Service Class shares from exceeding 0.25% of average daily net assets. Standard Class shares pay no distribution and service expenses.
At December 31, 2007, the Series had liabilities payable to affiliates as follows:
Investment
Management
Fee Payable to
DMC | | Dividend Disbursing,
Transfer Agent Fees
and Other Expenses
Payable to DSC | | Distribution
Fees Payable
to DDLP | | Other
Expenses
Payable
to DMC
and Affiliates* | |
$ | 685,676 | | $ | 11,004 | | $ | 65,540 | | $ | 30,677 | |
| | | | | | | | | | | |
*DMC as part of its administrative services, pays operating expenses on behalf of the Series and is reimbursed on a periodic basis. Such expenses include items such as printing of shareholder reports, fees for audit, legal and tax services, custodian fees and trustees’ fees.
As provided in the investment management agreement, the Series bears the cost of certain legal and tax services, including internal legal and tax services provided to the Series by DMC and/or its affiliates’ employees. For the year ended December 31, 2007, the Series was charged $28,372 for internal legal and tax services provided by DMC and/or its affiliates’ employees.
Trustees’ fees include expenses accrued by the Series for each Trustee’s retainer and per meeting fees. Certain officers of DMC, DSC and DDLP are officers and/or Trustees of the Trust. These officers and Trustees are paid no compensation by the Series.
13
Delaware VIP Emerging Markets Series
Notes to Financial Statements (continued)
3. Investments
For the year ended December 31, 2007, the Series made purchases and sales of investment securities other than short-term investments as follows:
Purchases | | $ | 613,804,569 | |
Sales | | 445,354,595 | |
At December 31, 2007, the cost of investments for federal income tax purposes and unrealized appreciation (depreciation) for the Series were as follows:
Cost of
Investments | | Aggregate
Unrealized
Appreciation | | Aggregate
Unrealized
Depreciation | | Net Unrealized
Appreciation | |
$ | 597,722,045 | | $ | 140,500,022 | | $ | (21,955,206 | ) | $ | 118,544,816 | |
| | | | | | | | | | | |
4. Dividend and Distribution Information
Income and long-term capital gain distributions are determined in accordance with federal income tax regulations, which may differ from U.S. generally accepted accounting principles. Additionally, gains (losses) on foreign currency transactions and net short-term gains on sales of investment securities are treated as ordinary income for federal income tax purposes. The tax character of dividends and distributions paid during the years ended December 31, 2007 and 2006 was as follows:
| | Year
Ended
12/31/07 | | Year
Ended
12/31/06 | |
Ordinary income | | $ | 13,358,322 | | $ | 5,745,436 | |
Long-term capital gain | | 23,248,230 | | 4,124,302 | |
| | $ | 36,606,552 | | $ | 9,869,738 | |
5. Components of Net Assets on a Tax Basis
As of December 31, 2007, the components of net assets on a tax basis were as follows:
Shares of beneficial interest | | $ | 448,606,755 | |
Undistributed ordinary income | | 68,391,102 | |
Undistributed long-term capital gains | | 24,956,703 | |
Post-October currency losses | | (207,916 | ) |
Unrealized appreciation of investments and foreign currencies | | 118,542,329 | |
Net assets | | $ | 660,288,973 | |
The differences between book basis and tax basis components of net assets are primarily attributable to tax deferral of losses on wash sales and tax recognition of unrealized gain on investments in passive foreign investment companies.
Post-October currency losses represent losses realized on foreign currency transactions from November 1, 2007 through December 31, 2007 that, in accordance with federal income tax regulations, the Series has elected to defer and treat as having arisen in the following fiscal year.
For financial reporting purposes, capital accounts are adjusted to reflect the tax character of permanent book/tax differences. Reclassifications are primarily due to tax treatment of gain (loss) on foreign currency transactions, dividends and distributions and passive foreign investment companies. Results of operations and net assets were not affected by these reclassifications. For the year ended December 31, 2007, the Series recorded the following reclassifications:
Undistributed
Net
Investment Income | | Accumulated
Net Realized
Gain | | Paid-in
Capital | |
$ | 2,333,526 | | $ | (2,358,021 | ) | $ | 24,495 | |
| | | | | | | | |
14
Delaware VIP Emerging Markets Series
Notes to Financial Statements (continued)
6. Capital Shares
Transactions in capital shares were as follows:
| | Year
Ended
12/31/07 | | Year
Ended
12/31/06 | |
Shares sold: | | | | | |
Standard Class | | 5,823,019 | | 4,700,048 | |
Service Class | | 6,063,437 | | 4,637,136 | |
| | | | | |
Shares issued upon reinvestment of dividends and distributions: | | | | | |
Standard Class | | 986,563 | | 310,143 | |
Service Class | | 807,304 | | 216,640 | |
| | 13,680,323 | | 9,863,967 | |
| | | | | |
Shares repurchased: | | | | | |
Standard Class | | (2,876,176 | ) | (3,097,082 | ) |
Service Class | | (2,684,391 | ) | (2,070,320 | ) |
| | (5,560,567 | ) | (5,167,402 | ) |
Net increase | | 8,119,756 | | 4,696,565 | |
7. Line of Credit
The Series, along with certain other funds in the Delaware Investments® Family of Funds (Participants), participates in a $225,000,000 revolving line of credit facility to be used for temporary or emergency purposes as an additional source of liquidity to fund redemptions of investor shares. The Participants are charged an annual commitment fee, which is allocated across the Participants on the basis of each Participant’s allocation of the entire facility. The Participants may borrow up to a maximum of one third of their net assets under the agreement. The Series had no amounts outstanding as of December 31, 2007, or at any time during the year then ended.
8. Foreign Currency Exchange Contracts
The Series may enter into foreign currency exchange contracts as a way of managing foreign exchange rate risk. The Series may enter into these contracts to fix the U.S. dollar value of a security that it has agreed to buy or sell for the period between the date the trade was entered into and the date the security is delivered and paid for. The Series may also use these contracts to hedge the U.S. dollar value of securities it already owns that are denominated in foreign currencies. The change in market value is recorded as an unrealized gain or loss. When the contract is closed, a realized gain or loss is recorded equal to the difference between the value of the contract at the time it was opened and the value at the time it was closed.
The use of foreign currency exchange contracts does not eliminate fluctuations in the underlying prices of the securities, but does establish a rate of exchange that can be achieved in the future. Although foreign currency exchange contracts limit the risk of loss due to a decline in the value of the hedged currency, they also limit any potential gain that might result should the value of the currency increase. In addition, the Series could be exposed to risks if the counterparties to the contracts are unable to meet the terms of their contracts. There were no foreign currency exchange contracts outstanding at December 31, 2007.
9. Securities Lending
The Series, along with other funds in the Delaware Investments® Family of Funds, may lend its securities pursuant to a security lending agreement (Lending Agreement) with Mellon Bank, N.A. (Mellon). With respect to each loan, if the aggregate market value of the collateral held on any business day is less than the aggregate market value of the securities which are the subject of such loan, the borrower will be notified to provide additional collateral not less than the applicable collateral requirements. Cash collateral received is invested in a collective investment vehicle (Collective Trust) established by Mellon for the purpose of investment on behalf of clients participating in its securities lending programs. The Collective Trust invests in fixed income securities, with a weighted average maturity not to exceed 90 days, rated in one of the top two tiers by Standard & Poor’s Ratings Group or Moody’s Investors Service, Inc. or repurchase agreements collateralized by such securities. However, in the event of default or bankruptcy by the lending agent, realization and/or retention of the collateral may be subject to legal proceedings. In the event the borrower fails to return loaned securities and the collateral received is insufficient to cover the value of the loaned securities and provided such collateral shortfall is not the result of investment losses, the lending agent has agreed to pay the amount of the shortfall to the Series, or at the discretion of the lending agent, replace the loaned securities. The Series continues to record dividends or interest, as applicable, on the securities loaned and is subject to change in value of the securities loaned that may occur during the term of the loan. The Series has the right under the Lending Agreement to recover the securities from the borrower on demand. With respect to security loans collateralized by U.S. Treasury obligations, the Series receives a fee from the securities lending agent. With respect to security loans collateralized by cash collateral, the earnings from the collateral investments are shared among the Series, the security lending agent and the borrower. The Series records securities lending income net of allocations to the security lending agent and the borrower.
At December 31, 2007, the market value of the securities on loan was $42,126,431, for which cash collateral was received and invested in accordance with the Lending Agreement. Such investments are presented on the Statement of Net Assets under the caption “Securities Lending Collateral.”
15
Delaware VIP Emerging Markets Series
Notes to Financial Statements (continued)
10. Credit and Market Risk
Some countries in which the Series may invest require governmental approval for the repatriation of investment income, capital or the proceeds of sales of securities by foreign investors. In addition, if there is deterioration in a country’s balance of payments or for other reasons, a country may impose temporary restrictions on foreign capital remittances abroad.
The securities exchanges of certain foreign markets are substantially smaller, less liquid and more volatile than the major securities markets in the United States. Consequently, acquisition and disposition of securities by the Series may be inhibited. In addition, a significant portion of the aggregate market value of equity securities listed on the major securities exchanges in emerging markets are held by a smaller number of investors. This may limit the number of shares available for acquisition or disposition by the Series.
The Series may invest up to 10% of its net assets in illiquid securities, which may include securities with contractual restrictions on resale, securities exempt from registration under Rule 144A of the Securities Act of 1933, as amended, and other securities which may not be readily marketable. The relative illiquidity of these securities may impair the Series from disposing of them in a timely manner and at a fair price when it is necessary or desirable to do so. While maintaining oversight, the Series’ Board of Trustees has delegated to DMC the day-to-day functions of determining whether individual Rule 144A securities are liquid for purposes of the Series’ limitation on investments in illiquid assets. As of December 31, 2007, no securities have been determined to be illiquid under the Series’ Liquidity Procedures. Rule 144A securities have been identified on the Statement of Net Assets.
11. Contractual Obligations
The Series enters into contracts in the normal course of business that contain a variety of indemnifications. The Series’ maximum exposure under these arrangements is unknown. However, the Series has not had prior claims or losses pursuant to these contracts. Management has reviewed the Series’ existing contracts and expects the risk of loss to be remote.
12. Tax Information (Unaudited)
For the fiscal year ended December 31, 2007, the Series designates dividends and distributions paid during the year as follows:
(A)
Long-Term
Capital Gain
Distributions
(Tax Basis) | | (B)
Ordinary
Income
Distributions
(Tax Basis) | | Total
Distributions
(Tax Basis) | |
64 | % | 36 | % | 100 | % |
(A) and (B) are based on a percentage of the Series’ total distributions.
The Delaware VIP Emerging Markets Series intends to pass through foreign tax credits in the maximum amount of $515,903. The gross foreign source income earned during the fiscal year 2007 by Delaware VIP Emerging Markets Series was $13,029,933.
13. Change in Custodian
On October 17, 2007, Mellon, One Mellon Center, Pittsburgh, PA 15258 became the Series’ custodian.
16
Delaware VIP Trust — Delaware VIP Emerging Markets Series
Report of Independent Registered Public Accounting Firm
To the Shareholders and Board of Trustees
Delaware VIP Trust–Delaware VIP Emerging Markets Series
We have audited the accompanying statement of net assets of the Delaware VIP Emerging Markets Series (one of the series constituting Delaware VIP Trust) (the “Series”) as of December 31, 2007, and the related statement of operations for the year then ended, the statements of changes in net assets for each of the two years in the period then ended, and the financial highlights for each of the five years in the period then ended. These financial statements and financial highlights are the responsibility of the Series’ management. Our responsibility is to express an opinion on these financial statements and financial highlights based on our audits.
We conducted our audits in accordance with the standards of the Public Company Accounting Oversight Board (United States). Those standards require that we plan and perform the audit to obtain reasonable assurance about whether the financial statements and financial highlights are free of material misstatement. We were not engaged to perform an audit of the Series’ internal control over financial reporting. Our audits included consideration of internal control over financial reporting as a basis for designing audit procedures that are appropriate in the circumstances, but not for the purpose of expressing an opinion on the effectiveness of the Series’ internal control over financial reporting. Accordingly, we express no such opinion. An audit also includes examining, on a test basis, evidence supporting the amounts and disclosures in the financial statements and financial highlights, assessing the accounting principles used and significant estimates made by management, and evaluating the overall financial statement presentation. Our procedures included confirmation of securities owned as of December 31, 2007, by correspondence with the custodian and brokers or by other appropriate auditing procedures where replies from brokers were not received. We believe that our audits provide a reasonable basis for our opinion.
In our opinion, the financial statements and financial highlights referred to above present fairly, in all material respects, the financial position of the Delaware VIP Emerging Markets Series of Delaware VIP Trust at December 31, 2007, the results of its operations for the year then ended, the changes in its net assets for each of the two years in the period then ended, and its financial highlights for each of the five years in the period then ended, in conformity with U.S. generally accepted accounting principles.

Philadelphia, Pennsylvania
February 14, 2008
The Series files its complete schedule of portfolio holdings with the Securities and Exchange Commission (Commission) for the first and third quarters of each fiscal year on Form N-Q. The Series’ Forms N-Q, as well as a description of the policies and procedures that the Series uses to determine how to vote proxies (if any) relating to portfolio securities is available without charge (i) upon request, by calling 800 523-1918; and (ii) on the Commission’s website at http://www.sec.gov. In addition, a description of the policies and procedures that the Series uses to determine how to vote proxies (if any) relating to portfolio securities is available without charge on the Delaware Investments® Funds’ website at http://www.delawareinvestments.com. The Series’ Forms N-Q may be reviewed and copied at the Commission’s Public Reference Room in Washington, DC; information on the operation of the Public Reference Room may be obtained by calling 800 SEC-0330.
Information (if any) regarding how the Series voted proxies relating to portfolio securities during the most recently disclosed 12-month period ended June 30 is available without charge (i) through the Delaware Investments® Funds’ website at http://www.delawareinvestments.com; and (ii) on the Commission’s website at http://www.sec.gov.
17
Delaware Investments® Family of Funds
BOARD OF TRUSTEES/DIRECTORS AND OFFICERS ADDENDUM
A mutual fund is governed by a Board of Trustees/Directors (“Trustees”), which has oversight responsibility for the management of a fund’s business affairs. Trustees establish procedures and oversee and review the performance of the investment manager, the distributor, and others who perform services for the fund. The independent fund trustees, in particular, are advocates for shareholder interests. Each trustee has served in that capacity since he or she was elected to or appointed to the Board of Trustees, and will continue to serve until his or her retirement or the election of a new trustee in his or her place. The following is a list of the Trustees and Officers with certain background and related information.
Name,
Address,
and Birth Date | | Position(s)
Held with
Fund(s) | | Length of Time
Served | | Principal
Occupation(s)
During
Past 5 Years | | Number of
Portfolios in Fund
Complex Overseen
by Trustee
or Officer | | Other
Directorships
Held by
Trustee
or Officer | |
| | | | | | | | | |
INTERESTED TRUSTEES | | | | | | | | | |
| | | | | | | | | | | |
Patrick P. Coyne(1) 2005 Market Street Philadelphia, PA 19103
April 1963 | | Chairman, President, Chief Executive Officer, and Trustee | | Chairman and Trustee since August 16, 2006
President and Chief Executive Officer since August 1, 2006 | | Patrick P. Coyne has served in various executive capacities at different times at Delaware Investments.(2) | | 84 | | Director — Kaydon Corp.
Board of Governors Member – Investment Company Institute (2007 – present)
Member of Investment Committee – Cradle of Liberty Council, BSA (November 2007 – present)
Finance Committee Member – St. John Vianney Roman Catholic Church (2007 – present) | |
| | | | | | | | | | | |
INDEPENDENT TRUSTEES | | | | | | | | | |
| | | | | | | | | | | |
Thomas L. Bennett
2005 Market Street Philadelphia, PA 19103
October 1947 | | Trustee | | Since
March 2005 | | Private Investor – (March 2004 – Present)
Investment Manager – Morgan Stanley & Co. (January 1984 – March 2004) | | 84 | | Director — Bryn Mawr Bank Corp. (BMTC) (April 2007 — Present)
Chairman of Investment Committee – The Haverford School (2002 – present)
Chairman of Investment Committee – Pennsylvania Academy of Fine Arts (2007 – present)
Trustee (2004 – present)
Investment Committee Member – Pennsylvania Horticulture Society (February 2006 – present) | |
18
Name,
Address,
and Birth Date | | Position(s)
Held with
Fund(s) | | Length of Time
Served | | Principal
Occupation(s)
During
Past 5 Years | | Number of
Portfolios in Fund
Complex Overseen
by Trustee
or Officer | | Other
Directorships
Held by
Trustee
or Officer | |
| | | | | | | |
INDEPENDENT TRUSTEES (CONTINUED) | | | | | | | |
| | | | | | | |
John A. Fry
2005 Market Street Philadelphia, PA
19103
May 1960 | | Trustee | | Since
January 2001 | | President – Franklin & Marshall College (June 2002 – Present)
Executive Vice President – University of Pennsylvania (April 1995 – June 2002) | | 84 | | Director — Community Health Systems
Director — Allied Barton Security Holdings | |
| | | | | | | | | | | |
Anthony D. Knerr
2005 Market Street
Philadelphia, PA 19103
December 1938 | | Trustee | | Since
April 1990 | | Founder and Managing Director – Anthony Knerr & Associates (Strategic Consulting) (1990 – Present) | | 84 | | None | |
| | | | | | | | | | | |
Lucinda S. Landreth
2005 Market Street Philadelphia, PA 19103
June 1947 | | Trustee | | Since
March 2005 | | Chief Investment Officer – Assurant, Inc. (Insurance)
(2002 – 2004) | | 84 | | None | |
| | | | | | | | | | | |
Ann R. Leven
2005 Market Street Philadelphia, PA 19103
November 1940 | | Trustee | | Since
October 1989 | | Consultant – ARL Associates (Financial Planning) (1983 – Present) | | 84 | | Director and Audit Committee Member — Systemax, Inc. | |
| | | | | | | | | | | |
Thomas F. Madison
2005 Market Street
Philadelphia, PA 19103
February 1936 | | Trustee | | Since
May 1997 | | President and Chief Executive Officer — MLM Partners, Inc. (Small Business Investing and Consulting) (January 1993 – Present) | | 84 | | Director — CenterPoint Energy
Director and Audit Committee Member — Digital River, Inc.
Director and Audit Committee Member — Rimage Corporation
Director and Chair of Compensation and Governance & Nominating Committees — Valmont Industries, Inc. | |
| | | | | | | | | | | |
Janet L. Yeomans
2005 Market Street Philadelphia, PA 19103
July 1948 | | Trustee | | Since
April 1999 | | Treasurer (January 2006 — Present) Vice President — Mergers & Acquisitions (January 2003 — January 2006), and Vice President (July 1995 – January 2003) 3M Corporation | | 84 | | None | |
| | | | | | | | | | | |
J. Richard Zecher
2005 Market Street Philadelphia, PA 19103
July 1940 | | Trustee | | Since
March 2003 | | Founder — Investor Analytics (Risk Management) (May 1999 – Present)
Founder — Sutton Asset Management (Hedge Fund) (September 1998 – Present) | | 84 | | Director and Audit Committee Member — Investor Analytics
Director and Audit Committee Member — Oxigene, Inc. | |
19
Name,
Address,
and Birth Date | | Position(s)
Held with
Fund(s) | | Length of Time
Served | | Principal
Occupation(s)
During
Past 5 Years | | Number of
Portfolios in Fund
Complex Overseen
by Trustee
or Officer | | Other
Directorships
Held by
Trustee
or Officer | |
| | | | | | | | | | | |
OFFICERS | | | | | | | | | | | |
| | | | | | | | | | | |
David F. Connor
2005 Market Street Philadelphia, PA 19103
December 1963 | | Vice President, Deputy General Counsel, and Secretary | | Vice President since September 21, 2000 and Secretary since October 2005 | | David F. Connor has served as Vice President and Deputy General Counsel of Delaware Investments since 2000. | | 84 | | None(4) | |
| | | | | | | | | | | |
Daniel V. Geatens
2005 Market Street Philadelphia, PA 19103
October 1972 | | Vice President and Treasurer | | Treasurer
since
October 25, 2007 | | Daniel V. Geatens has served in various capacities at different times at Delaware Investments. | | 84 | | None(4) | |
| | | | | | | | | | | |
David P. O’Connor
2005 Market Street Philadelphia, PA 19103
February 1966 | | Senior Vice President, General Counsel, and Chief Legal Officer | | Senior Vice President, General Counsel, and Chief Legal Officer since October 2005 | | David P. O’Connor has served in various executive and legal capacities at different times at Delaware Investments. | | 84 | | None(4) | |
| | | | | | | | | | | |
Richard Salus
2005 Market Street Philadelphia, PA 19103
October 1963 | | Senior Vice President and Chief Financial Officer | | Chief Financial Officer since November 1, 2006 | | Richard Salus has served in various executive capacities at different times at Delaware Investments. | | 84 | | None(4) | |
(1) | Patrick P. Coyne is considered to be an “Interested Trustee” because he is an executive officer of the Fund’s(s’) investment advisor. |
(2) | Delaware Investments is the marketing name for Delaware Management Holdings, Inc. and its subsidiaries, including the Fund’s(s’) investment advisor, principal underwriter, and its transfer agent. |
(3) | In 1997, several funds managed by Voyageur Fund Managers, Inc. (the “Voyageur Funds”) were incorporated into the Delaware Investments Family of Funds. Mr. Madison served as a director of the Voyageur Funds from 1993 until 1997. |
(4) | David F. Connor, Daniel V. Geatens, David P. O’Connor, and Richard Salus serve in similar capacities for the six portfolios of the Optimum Fund Trust, which have the same investment advisor, principal underwriter, and transfer agent as the registrant. |
The Statement of Additional Information for the Fund(s) includes additional information about the Trustees and Officers and is available, without charge, upon request by calling 800 523-1918.
20
Delaware VIP Trust — Delaware VIP Growth Opportunities Series
For the 12-month period ended Dec. 31, 2007, the Delaware VIP Growth Opportunities Series Standard Class shares returned +12.96%, while Service Class shares returned +12.71% (both figures reflect all distributions reinvested). The Series’ benchmark, the Russell Midcap® Growth Index, returned +11.43% (source: Lipper).
Materials- and energy-related stocks were among the better-performing sectors in the Russell Midcap Growth Index. Energy stocks benefited from climbing oil prices, which surpassed $95 per barrel for the first time. In contrast, many consumer-related companies underperformed, and financial stocks fell behind the overall market because of worries about subprime loans.
The vast majority of the Series’ outperformance relative to our benchmark came from successful stock selection, as opposed to sector positioning. Because we tend to keep the Series’ sector weightings relatively close to those of the Russell Midcap Growth Index, it’s common for stock selection to have the most significant impact on our performance. During the past 12 months, we outperformed the index most significantly in the healthcare sector. We also saw favorable results from a number of our energy-related investments.
During the period, we made no dramatic changes to our sector allocations. We continued to try to identify the best available companies in our mid-cap investment universe, and found a variety of opportunities we believed offered good total return potential relative to their risk.
We own a number of what we believe to be high-quality companies. These companies have been successfully taking market share from their competitors and providing solid financial results. We have maintained significant weightings in defensive sectors such as healthcare. We’re also somewhat overweighted in business services and technology stocks, which we believe are operating in a favorable overall environment.
The views expressed are current as of the date of this report and are subject to change.
The performance data quoted below represent past performance; past performance does not guarantee future results. Investment return and principal value will fluctuate so your shares, when redeemed, may be worth more or less than their original cost. Please obtain the performance data for the most recent month end by calling the number noted in the introductory section of this report on the page related to this Series.
You should consider the investment objectives, risks, charges, and expenses of the investment company carefully before investing. The Delaware VIP Growth Opportunities Series prospectus contains this and other important information about the Series. To obtain a prospectus, contact the company noted on the page related to this Series in the introductory section of this report, either by phone or through the company Web site. We advise you to read the prospectus carefully before you invest.
Delaware VIP Growth Opportunities Series
Average annual total returns
For periods ended Dec. 31, 2007 | | 1 year | | 5 years | | 10 years | | Lifetime | |
| | | | | | | | | |
Standard Class shares (commenced operations July 12, 1991) | | +12.96 | % | +16.25 | % | +9.04 | % | +10.13 | % |
| | | | | | | | | |
Service Class shares (commenced operations May 1, 2000) | | +12.71 | % | +15.98 | % | N/A | | +1.62 | % |
As disclosed in the Series’ most recent prospectus, expenses for Standard Class and Service Class shares were as follows: The net expense ratios for Standard Class and Service Class shares of the Series were 0.90% and 1.15%, respectively. Total operating expenses for Standard Class and Service Class shares were 0.90% and 1.20%, respectively. Management fees for Standard Class and Service Class shares were 0.75%.
Earnings from a variable annuity or variable life investment compound tax-free until withdrawal and, as a result, no adjustments were made for income taxes.
An expense limitation was in effect for all classes during the periods shown in the Series performance chart above and in the Performance of a $10,000 Investment chart on the next page.
Performance of Service Class shares will vary due to different charges and expenses.
Performance data do not reflect insurance fees related to a variable annuity or variable life investment or the deferred sales charge that would apply to certain withdrawals of investments held for fewer than eight years. Performance shown here would have been reduced if such fees were included and the expense limitation removed. For more information about fees, consult your variable annuity or variable life prospectus.
Investments in variable products involve risk. Prices of growth company securities may be more volatile than the prices of other securities, particularly over the short term. The Series will be particularly affected by declines in stock prices, which could be caused by a drop in the overall equity market or poor performance from particular companies or industries. Series that invest in small and/or medium-sized company stocks typically involve greater risk, particularly in the short term, than those investing in large, more established companies. Some portfolios offer more risk than others.
1
Please read both the contract and underlying prospectus for specific details regarding the product’s risk profile.

The chart shows a $10,000 investment in the Delaware VIP Growth Opportunities Series Standard Class shares for the period from Dec. 31, 1997, through Dec. 31, 2007. Performance of Service Class shares will vary due to different charges and expenses.
The chart also shows $10,000 invested in the Russell Midcap Growth Index for the period from Dec. 31, 1997, through Dec. 31, 2007. The Russell Midcap Growth Index measures the performance of those Russell Midcap companies with higher price-to-book ratios and higher forecasted growth values. The stocks are also members of the Russell 1000 Growth Index. An index is unmanaged and does not reflect the costs of operating a mutual fund, such as the costs of buying, selling, and holding securities. You cannot invest directly in an index.
2
Delaware VIP Trust — Delaware VIP Growth Opportunities Series
Disclosure of Series Expenses
For the Period July 1, 2007 to December 31, 2007
As a shareholder of the Series, you incur ongoing costs, including management fees; distribution and/or service (12b-1) fees; and other Series expenses. This Example is intended to help you understand your ongoing costs (in dollars) of investing in the Series and to compare these costs with the ongoing costs of investing in other mutual funds.
The Example is based on an investment of $1,000 invested at the beginning of the period and held for the entire period from July 1, 2007 to December 31, 2007.
Actual Expenses
The first section of the table shown, “Actual Series Return,” provides information about actual account values and actual expenses. You may use the information in this section of the table, together with the amount you invested, to estimate the expenses that you paid over the period. Simply divide your account value by $1,000 (for example, an $8,600 account value divided by $1,000 = 8.6), then multiply the result by the number in the first section under the heading entitled “Expenses Paid During Period” to estimate the expenses you paid on your account during the period.
Hypothetical Example for Comparison Purposes
The second section of the table shown, “Hypothetical 5% Return,” provides information about hypothetical account values and hypothetical expenses based on the Series’ actual expense ratio and an assumed rate of return of 5% per year before expenses, which is not the Series’ actual return. The hypothetical account values and expenses may not be used to estimate the actual ending account balance or expenses you paid for the period. You may use this information to compare the ongoing costs of investing in the Series and other funds. To do so, compare the 5% hypothetical example with the 5% hypothetical examples that appear in the shareholder reports of other funds.
Please note that the expenses shown in the table are meant to highlight your ongoing costs only. As a shareholder of the Series, you do not incur any transaction costs, such as sales charges (loads), redemption fees or exchange fees, but shareholders of other funds may incur such costs. Also, the fees related to the variable annuity investment or the deferred sales charge that could apply have not been included. Therefore, the second section of the table is useful in comparing ongoing costs only, and will not help you determine the relative total costs of owning different funds. The Series’ actual expenses shown in the table reflect fee waivers in effect for Service Class shares. The expenses shown in the table assume reinvestment of all dividends and distributions.
Expense Analysis of an Investment of $1,000
| | Beginning
Account
Value
7/1/07 | | Ending
Account
Value
12/31/07 | | Annualized
Expense
Ratios | | Expenses
Paid During
Period
7/1/07 to
12/31/07* | |
Actual Series Return | | | | | | | | | |
Standard Class | | $ | 1,000.00 | | $ | 991.20 | | 0.90 | % | $ | 4.52 | |
Service Class | | 1,000.00 | | 990.10 | | 1.15 | % | 5.77 | |
| | | | | | | | | |
Hypothetical 5% Return (5% return before expenses) | | | | | | | | | |
Standard Class | | $ | 1,000.00 | | $ | 1,020.67 | | 0.90 | % | $ | 4.58 | |
Service Class | | 1,000.00 | | 1,019.41 | | 1.15 | % | 5.85 | |
* | “Expenses Paid During Period” are equal to the Series’ annualized expense ratio, multiplied by the average account value over the period, multiplied by 184/365 (to reflect the one-half year period). |
3
Delaware VIP Trust — Delaware VIP Growth Opportunities Series
Sector Allocation and Top 10 Holdings
As of December 31, 2007
Sector designations may be different than the sector designations presented in other Series materials.
Sector | | Percentage
of Net Assets | |
Common Stockw | | 100.14 | % |
Basic Industry/Capital Goods | | 13.06 | % |
Business Services | | 5.32 | % |
Consumer Non-Durables | | 13.92 | % |
Consumer Services | | 5.71 | % |
Energy | | 9.97 | % |
Financials | | 8.39 | % |
Health Care | | 14.09 | % |
Technology | | 27.08 | % |
Transportation | | 1.06 | % |
Utilities | | 1.54 | % |
Discount Note | | 1.72 | % |
Securities Lending Collateral | | 23.35 | % |
Total Value of Securities | | 125.21 | % |
Obligation to Return Securities Lending Collateral | | (23.35 | )% |
Liabilities Net of Receivables and Other Assets | | (1.86 | )% |
Total Net Assets | | 100.00 | % |
w | Narrow industries are utilized for compliance purposes for diversification whereas broad sectors are used for financial reporting. |
Holdings are for informational purposes only and are subject to change at any time. They are not a recommendation to buy, sell, or hold any security.
Top 10 Holdings | | Percentage
of Net Assets | |
National Oilwell Varco | | 3.20 | % |
Omniture | | 2.56 | % |
Nuance Communications | | 2.41 | % |
Manitowoc | | 2.20 | % |
Geophysique-Veritas ADR | | 2.19 | % |
MEMC Electronic Materials | | 2.17 | % |
Medco Health Solutions | | 2.07 | % |
Citrix Systems | | 2.06 | % |
Smith International | | 2.03 | % |
Urban Outfitters | | 2.03 | % |
4
Delaware VIP Trust — Delaware VIP Growth Opportunities Series
Statement of Net Assets
December 31, 2007
| | Number of
Shares | | Value | |
| | | | | | |
| COMMON STOCK–100.14%w | | | | | |
| Basic Industry/Capital Goods–13.06% | | | | | |
| Allegheny Technologies | | 6,700 | | $ | 578,880 | |
† | First Solar | | 1,800 | | 480,852 | |
| Joy Global | | 12,500 | | 822,750 | |
| Manitowoc | | 19,800 | | 966,834 | |
† | Mettler-Toledo International | | 5,800 | | 660,040 | |
| Oshkosh Truck | | 9,900 | | 467,874 | |
† | Quanta Services | | 21,500 | | 564,160 | |
| Roper Industries | | 9,800 | | 612,892 | |
* | Trinity Industries | | 21,400 | | 594,064 | |
| | | | | 5,748,346 | |
| Business Services–5.32% | | | | | |
| Dun & Bradstreet | | 6,000 | | 531,780 | |
| Expeditors International Washington | | 14,700 | | 656,796 | |
† | Fiserv | | 13,300 | | 738,017 | |
| Paychex | | 11,500 | | 416,530 | |
| | | | | 2,343,123 | |
| Consumer Non-Durables–13.92% | | | | | |
*† | Amazon.com | | 8,800 | | 815,232 | |
*† | Crocs | | 16,800 | | 618,408 | |
† | Dick’s Sporting Goods | | 20,000 | | 555,200 | |
* | Flowers Foods | | 29,050 | | 680,061 | |
| Guess | | 5,700 | | 215,973 | |
*† | J Crew Group | | 11,700 | | 564,057 | |
| Nordstrom | | 12,000 | | 440,760 | |
* | Tiffany & Co | | 8,900 | | 409,667 | |
† | Ulta Salon Cosmetics & Fragrance | | 2,900 | | 49,735 | |
† | Under Armour Class A | | 20,300 | | 886,501 | |
*† | Urban Outfitters | | 32,700 | | 891,402 | |
| | | | | 6,126,996 | |
| Consumer Services–5.71% | | | | | |
| Host Hotels & Resorts | | 19,039 | | 324,425 | |
| International Game Technology | | 17,200 | | 755,596 | |
* | Marriott International Class A | | 10,700 | | 365,726 | |
| Starwood Hotels & Resorts Worldwide | | 12,500 | | 550,375 | |
| Wynn Resorts | | 4,600 | | 515,798 | |
| | | | | 2,511,920 | |
| Energy–9.97% | | | | | |
*† | Geophysique-Veritas ADR | | 17,200 | | 964,060 | |
† | Helix Energy Solutions Group | | 14,500 | | 601,750 | |
| Helmerich & Payne | | 12,900 | | 516,903 | |
† | National Oilwell Varco | | 19,200 | | 1,410,432 | |
| Smith International | | 12,100 | | 893,585 | |
| | | | | 4,386,730 | |
| Financials–8.39% | | | | | |
*† | Affiliated Managers Group | | 5,700 | | 669,522 | |
*† | Interactive Brokers Group Class A | | 19,500 | | 630,240 | |
† | IntercontinentalExchange | | 1,200 | | 231,000 | |
* | Legg Mason | | 4,800 | | 351,120 | |
* | Lehman Brothers Holdings | | 10,200 | | 667,488 | |
† | Oaktree Capital Group | | 10,400 | | 340,600 | |
* | People’s United Financial | | 29,400 | | 523,320 | |
| T. Rowe Price Group | | 4,600 | | 280,048 | |
| | | | | 3,693,338 | |
| Health Care–14.09% | | | | | |
† | Abraxis BioScience | | 8,549 | | $ | 587,915 | |
*† | Amylin Pharmaceuticals | | 12,200 | | 451,400 | |
*† | APP Pharmaceuticals | | 43,900 | | 450,853 | |
† | Barr Pharmaceuticals | | 14,000 | | 743,400 | |
† | DaVita | | 9,000 | | 507,150 | |
† | Express Scripts | | 4,700 | | 343,100 | |
† | Inverness Medical Innovations | | 9,200 | | 516,856 | |
† | Medco Health Solutions | | 9,000 | | 912,600 | |
* | Omnicare | | 10,700 | | 244,067 | |
† | OSI Pharmaceuticals | | 9,700 | | 470,547 | |
* | Quest Diagnostics | | 7,500 | | 396,750 | |
† | Regeneron Pharmaceuticals | | 23,800 | | 574,770 | |
| | | | | 6,199,408 | |
| Technology–27.08% | | | | | |
† | American Tower Class A | | 14,500 | | 617,700 | |
† | ANSYS | | 1,600 | | 66,336 | |
† | Atheros Communications | | 13,500 | | 412,290 | |
† | Citrix Systems | | 23,800 | | 904,638 | |
*† | F5 Networks | | 27,800 | | 792,856 | |
*† | Focus Media Holding ADR | | 4,100 | | 232,921 | |
| L-3 Communications Holdings | | 5,900 | | 625,046 | |
† | McAfee | | 6,500 | | 243,750 | |
† | MEMC Electronic Materials | | 10,800 | | 955,692 | |
*† | Microsemi | | 33,300 | | 737,262 | |
† | Network Appliance | | 21,200 | | 529,152 | |
† | NII Holdings | | 12,000 | | 579,840 | |
*† | Nuance Communications | | 56,800 | | 1,061,024 | |
† | Omniture | | 33,800 | | 1,125,201 | |
† | salesforce.com | | 10,600 | | 664,514 | |
* | Satyam Computer Services ADR | | 26,500 | | 708,080 | |
† | Sina | | 9,000 | | 398,790 | |
† | Sykes Enterprises | | 34,400 | | 619,200 | |
† | Varian Semiconductor Equipment Associates | | 6,900 | | 255,300 | |
*† | VMware Class A | | 4,600 | | 390,954 | |
| | | | | 11,920,546 | |
| Transportation–1.06% | | | | | |
* | Hunt (J.B.) Transport Services | | 17,000 | | 468,350 | |
| | | | | 468,350 | |
| Utilities–1.54% | | | | | |
| Alliant Energy | | 16,700 | | 679,523 | |
| | | | | 679,523 | |
| Total Common Stock (cost $35,759,521) | | | | 44,078,280 | |
5
| | Principal
Amount | | Value | |
| | | | | | |
¹ | DISCOUNT NOTE–1.72% | | | | | |
| Federal Home Loan Bank 3.25% 1/2/08 | | $ | 759,137 | | $ | 759,069 | |
| Total Discount Note (cost $759,069) | | | | 759,069 | |
| | | | | | |
| Total Value of Securities Before Securities Lending Collateral—101.86%
(cost $36,518,590) | | | | 44,837,349 | |
| | | | | | | | |
| | Number of
Shares | | Value | |
| | | | | |
SECURITIES LENDING COLLATERAL**–23.35% | | | | | |
Investment Companies Mellon GSL DBT II Collateral Fund | | 10,277,127 | | $ | 10,277,127 | |
Total Securities Lending Collateral (cost $10,277,127) | | | | 10,277,127 | |
| | | | | | |
TOTAL VALUE OF SECURITIES–125.21% (cost $46,795,717) | | 55,114,476 | © |
OBLIGATION TO RETURN SECURITIES LENDING COLLATERAL**–(23.35%) | | (10,277,127 | ) |
LIABILITIES NET OF RECEIVABLES AND OTHER ASSETS–(1.86%) | | (820,714 | ) |
NET ASSETS APPLICABLE TO 2,070,288 SHARES OUTSTANDING–100.00% | | $ | 44,016,635 | |
NET ASSET VALUE–DELAWARE VIP GROWTH OPPORTUNITIES SERIES STANDARD CLASS ($31,945,197 / 1,495,704 Shares) | | $ | 21.36 | |
NET ASSET VALUE–DELAWARE VIP GROWTH OPPORTUNITIES SERIES SERVICE CLASS ($12,071,438 / 574,584 Shares) | | $ | 21.01 | |
COMPONENTS OF NET ASSETS AT DECEMBER 31, 2007: | | | |
Shares of beneficial interest (unlimited authorization–no par) | | $ | 31,594,571 | |
Accumulated net realized gain on investments | | 4,103,305 | |
Net unrealized appreciation of investments | | 8,318,759 | |
Total net assets | | $ | 44,016,635 | |
w | | Narrow industries are utilized for compliance purposes for diversification whereas broad sectors are used for financial reporting. |
† | | Non-income producing security for the year ended December 31, 2007. |
# | | The rate shown is the effective yield at the time of purchase. |
* | | Fully or partially on loan. |
** | | See Note 8 in “Notes to Financial Statements.” |
© | | Includes $9,996,042 of securities loaned. |
ADR – American Depositary Receipts
See accompanying notes
6
Delaware VIP Trust — Delaware VIP
Growth Opportunities Series
Statement of Operations
Year Ended December 31, 2007
INVESTMENT INCOME: | | | |
Dividends | | $ | 261,373 | |
Interest | | 17,725 | |
Securities lending income | | 45,294 | |
| | 324,392 | |
| | | |
EXPENSES: | | | |
Management fees | | 368,413 | |
Distribution expenses – Service Class | | 37,987 | |
Accounting and administration expenses | | 19,646 | |
Reports and statements to shareholders | | 14,999 | |
Audit and tax | | 13,282 | |
Dividend disbursing and transfer agent fees and expenses | | 10,316 | |
Legal fees | | 6,285 | |
Custodian fees | | 3,399 | |
Trustees’ fees | | 2,335 | |
Insurance fees | | 1,206 | |
Dues and services | | 1,042 | |
Consulting fees | | 915 | |
Pricing fees | | 568 | |
Taxes (other than taxes on income) | | 345 | |
Trustees’ expenses | | 285 | |
Registration fees | | 31 | |
| | 481,054 | |
Less waiver of distribution expenses – Service Class | | (6,331 | ) |
Less expense paid indirectly | | (1,127 | ) |
Total operating expenses | | 473,596 | |
| | | |
NET INVESTMENT LOSS | | (149,204 | ) |
| | | |
NET REALIZED AND UNREALIZED GAIN (LOSS) ON INVESTMENTS: | | | |
Net realized gain on investments | | 8,936,402 | |
Net change in unrealized appreciation/depreciation of investments | | (2,633,177 | ) |
| | | |
NET REALIZED AND UNREALIZED GAIN ON INVESTMENTS | | 6,303,225 | |
| | | |
NET INCREASE IN NET ASSETS RESULTING FROM OPERATIONS | | $ | 6,154,021 | |
| | | | | |
See accompanying notes
Delaware VIP Trust — Delaware VIP
Growth Opportunities Series
Statements of Changes in Net Assets
| | Year Ended | |
| | 12/31/07 | | 12/31/06 | |
INCREASE (DECREASE) IN NET ASSETS FROM OPERATIONS: | | | | | |
Net investment loss | | $ | (149,204 | ) | $ | (94,468 | ) |
Net realized gain on investments | | 8,936,402 | | 6,652,389 | |
Net change in unrealized appreciation/ depreciation of investments | | (2,633,177 | ) | (3,075,782 | ) |
Net increase in net assets resulting from operations | | 6,154,021 | | 3,482,139 | |
| | | | | |
CAPITAL SHARE TRANSACTIONS: | | | | | |
Proceeds from shares sold: | | | | | |
Standard Class | | 3,088,179 | | 38,229,325 | |
Service Class | | 1,733,487 | | 12,382,384 | |
| | 4,821,666 | | 50,611,709 | |
Cost of shares repurchased: | | | | | |
Standard Class | | (14,652,826 | ) | (48,030,272 | ) |
Service Class | | (3,361,589 | ) | (15,056,667 | ) |
| | (18,014,415 | ) | (63,086,939 | ) |
Decrease in net assets derived from capital share transactions | | (13,192,749 | ) | (12,475,230 | ) |
| | | | | |
NET DECREASE IN NET ASSETS | | (7,038,728 | ) | (8,993,091 | ) |
| | | | | |
NET ASSETS: | | | | | |
Beginning of year | | 51,055,363 | | 60,048,454 | |
End of year (there was no undistributed net investment income at either year end) | | $ | 44,016,635 | | $ | 51,055,363 | |
See accompanying notes
7
Delaware VIP Trust — Delaware VIP Growth Opportunities Series
Financial Highlights
Selected data for each share of the Series outstanding throughout each period were as follows:
| | Delaware VIP Growth Opportunities Series Standard Class | |
| | Year Ended | |
| | 12/31/07 | | 12/31/06 | | 12/31/05 | | 12/31/04 | | 12/31/03 | |
| | | | | | | | | | | |
Net asset value, beginning of period | | $ | 18.910 | | $ | 17.780 | | $ | 15.960 | | $ | 14.190 | | $ | 10.060 | |
| | | | | | | | | | | |
Income (loss) from investment operations: | | | | | | | | | | | |
Net investment loss(1) | | (0.050 | ) | (0.021 | ) | (0.056 | ) | (0.031 | ) | (0.032 | ) |
Net realized and unrealized gain on investments | | 2.500 | | 1.151 | | 1.876 | | 1.801 | | 4.162 | |
Total from investment operations | | 2.450 | | 1.130 | | 1.820 | | 1.770 | | 4.130 | |
| | | | | | | | | | | |
Net asset value, end of period | | $ | 21.360 | | $ | 18.910 | | $ | 17.780 | | $ | 15.960 | | $ | 14.190 | |
| | | | | | | | | | | |
Total return(2) | | 12.96 | % | 6.36 | % | 11.40 | % | 12.47 | % | 41.05 | % |
| | | | | | | | | | | |
Ratios and supplemental data: | | | | | | | | | | | |
Net assets, end of period (000 omitted) | | $ | 31,945 | | $ | 38,859 | | $ | 46,000 | | $ | 56,875 | | $ | 65,368 | |
Ratio of expenses to average net assets | | 0.90 | % | 0.91 | % | 0.90 | % | 0.84 | % | 0.85 | % |
Ratio of net investment loss to average net assets | | (0.24 | )% | (0.11 | )% | (0.35 | )% | (0.21 | )% | (0.27 | )% |
Portfolio turnover | | 91 | % | 67 | % | 75 | % | 94 | % | 94 | % |
(1) | The average shares outstanding method has been applied for per share information. |
(2) | Total investment return is based on the change in net asset value of a share during the period and assumes reinvestment of dividends and distributions at net asset value. |
See accompanying notes
8
Selected data for each share of the Series outstanding throughout each period were as follows:
| | Delaware VIP Growth Opportunities Series Service Class | |
| | Year Ended | |
| | 12/31/07 | | 12/31/06 | | 12/31/05 | | 12/31/04 | | 12/31/03 | |
| | | | | | | | | | | |
Net asset value, beginning of period | | $ | 18.640 | | $ | 17.580 | | $ | 15.810 | | $ | 14.100 | | $ | 10.010 | |
| | | | | | | | | | | |
Income (loss) from investment operations: | | | | | | | | | | | |
Net investment loss(1) | | (0.101 | ) | (0.066 | ) | (0.096 | ) | (0.066 | ) | (0.058 | ) |
Net realized and unrealized gain on investments | | 2.471 | | 1.126 | | 1.866 | | 1.776 | | 4.148 | |
Total from investment operations | | 2.370 | | 1.060 | | 1.770 | | 1.710 | | 4.090 | |
| | | | | | | | | | | |
Net asset value, end of period | | $ | 21.010 | | $ | 18.640 | | $ | 17.580 | | $ | 15.810 | | $ | 14.100 | |
| | | | | | | | | | | |
Total return(2) | | 12.71 | % | 6.03 | % | 11.20 | % | 12.13 | % | 40.86 | % |
| | | | | | | | | | | |
Ratios and supplemental data: | | | | | | | | | | | |
Net assets, end of period (000 omitted) | | $ | 12,072 | | $ | 12,196 | | $ | 14,048 | | $ | 15,082 | | $ | 16,906 | |
Ratio of expenses to average net assets | | 1.15 | % | 1.16 | % | 1.15 | % | 1.09 | % | 1.07 | % |
Ratio of expenses to average net assets prior to expense limitation and expenses paid indirectly | | 1.20 | % | 1.21 | % | 1.20 | % | 1.14 | % | 1.10 | % |
Ratio of net investment loss to average net assets | | (0.49 | )% | (0.36 | )% | (0.60 | )% | (0.46 | )% | (0.49 | )% |
Ratio of net investment loss to average net assets prior to expense limitation and expenses paid indirectly | | (0.54 | )% | (0.41 | )% | (0.65 | )% | (0.51 | )% | (0.52 | )% |
Portfolio turnover | | 91 | % | 67 | % | 75 | % | 94 | % | 94 | % |
(1) | The average shares outstanding method has been applied for per share information. |
(2) | Total investment return is based on the change in net asset value of a share during the period and assumes reinvestment of dividends and distributions at net asset value. Total investment return reflects a waiver by the distributor. Performance would have been lower had the waiver not been in effect. |
See accompanying notes
9
Delaware VIP Trust — Delaware VIP Growth Opportunities Series
Notes to Financial Statements
December 31, 2007
Delaware VIP Trust (Trust) is organized as a Delaware statutory trust and offers 14 series: Delaware VIP Balanced Series, Delaware VIP Capital Reserves Series, Delaware VIP Cash Reserve Series, Delaware VIP Diversified Income Series, Delaware VIP Emerging Markets Series, Delaware VIP Growth Opportunities Series, Delaware VIP High Yield Series, Delaware VIP International Value Equity Series, Delaware VIP REIT Series, Delaware VIP Select Growth Series, Delaware VIP Small Cap Value Series, Delaware VIP Trend Series, Delaware VIP U.S. Growth Series and Delaware VIP Value Series. These financial statements and the related notes pertain to Delaware VIP Growth Opportunities Series (Series). The Trust is an open-end investment company. The Series is considered diversified under the Investment Company Act of 1940, as amended, and offers Standard Class and Service Class shares. The Standard Class shares do not carry a 12b-1 fee and the Service Class shares carry a 12b-1 fee. The shares of the Series are sold only to separate accounts of life insurance companies.
The investment objective of the Series is to seek long-term capital appreciation.
1. Significant Accounting Policies
The following accounting policies are in accordance with U.S. generally accepted accounting principles and are consistently followed by the Series.
Security Valuation—Equity securities, except those traded on the Nasdaq Stock Market, Inc. (Nasdaq), are valued at the last quoted sales price as of the time of the regular close of the New York Stock Exchange (NYSE) on the valuation date. Securities traded on the Nasdaq are valued in accordance with the Nasdaq Official Closing Price, which may not be the last sales price. If on a particular day an equity security does not trade, then the mean between the bid and asked prices will be used. Short-term debt securities having less than 60 days to maturity are valued at amortized cost, which approximates market value. Securities lending collateral, which is invested in a collective investment vehicle, is valued at unit value per share. Other securities and assets for which market quotations are not readily available are valued at fair value as determined in good faith under the direction of the Series’ Board of Trustees. In determining whether market quotations are readily available or fair valuation will be used, various factors will be taken into consideration, such as market closures, or with respect to foreign securities, aftermarket trading, or significant events after local market trading (e.g., government actions or pronouncements, trading volume or volatility on markets, exchanges among dealers, or news events).
In September 2006, the Financial Accounting Standards Board (FASB) issued FASB Statement No. 157 “Fair Value Measurements” (Statement 157). Statement 157 establishes a framework for measuring fair value in U.S. generally accepted accounting principles, clarifies the definition of fair value within that framework, and expands disclosures about the use of fair value measurements. Statement 157 is intended to increase consistency and comparability among fair value estimates used in financial reporting. Statement 157 is effective for fiscal years beginning after November 15, 2007. Management does not expect the adoption of Statement 157 to have a material impact on the amounts reported in the financial statements.
Federal Income Taxes—The Series intends to continue to qualify for federal income tax purposes as a regulated investment company under Subchapter M of the Internal Revenue Code of 1986, as amended, and make the requisite distributions to shareholders. Accordingly, no provision for federal income taxes has been made in the financial statements.
Effective June 29, 2007, the Series adopted FASB Interpretation No. 48 “Accounting for Uncertainty in Income Taxes” (FIN 48). FIN 48 provides guidance for how uncertain tax positions should be recognized, measured, presented and disclosed in the financial statements. FIN 48 requires the evaluation of tax positions taken or expected to be taken in the course of preparing the Series’ tax returns to determine whether the tax positions are “more-likely-than-not” of being sustained by the applicable tax authority. Tax positions not deemed to meet the more-likely-than-not threshold are recorded as a tax benefit or expense in the current year. The adoption of FIN 48 did not result in the recording of any tax benefit or expense in the current period.
Class Accounting—Investment income, common expenses and realized and unrealized gain (loss) on investments are allocated to the classes of the Series on the basis of daily net assets of each class. Distribution expenses relating to a specific class are charged directly to that class.
Repurchase Agreements—The Series may invest in a pooled cash account along with members of the Delaware Investments® Family of Funds pursuant to an exemptive order issued by the Securities and Exchange Commission. The aggregate daily balance of the pooled cash account is invested in repurchase agreements secured by obligations of the U.S. government. The respective collateral is held by the Series’ custodian bank until the maturity of the respective repurchase agreements. Each repurchase agreement is at least 102% collateralized. However, in the event of default or bankruptcy by the counterparty to the agreement, realization of the collateral may be subject to legal proceedings. At December 31, 2007, the Series held no investments in repurchase agreements.
Use of Estimates—The preparation of financial statements in conformity with U.S. generally accepted accounting principles requires management to make estimates and assumptions that affect the reported amounts of assets and liabilities at the date of the financial statements and the reported amounts of revenues and expenses during the reporting period. Actual results could differ from those estimates.
Other—Expenses directly attributable to the Series are charged directly to the Series. Other expenses common to various funds within the Delaware Investments® Family of Funds are generally allocated amongst such funds on the basis of average net assets. Management fees and some other expenses are paid monthly. Security transactions are recorded on the date the securities are purchased or sold (trade date) for financial reporting purposes. Costs used in calculating realized gains and losses on the sale of investment securities are those of the specific securities sold. Dividend income is recorded on the ex-dividend date and interest income is recorded on the accrual basis.
The Series declares and pays dividends from net investment income and distributions from net realized gain on investments, if any, following the close of the fiscal year.
10
Delaware VIP Growth Opportunities Series
Notes to Financial Statements (continued)
Subject to seeking best execution, the Series may direct certain security trades to brokers who have agreed to rebate a portion of the related brokerage commission to the Series in cash. Such commission rebates are included in realized gain on investments in the accompanying financial statements and totaled $1,520 for the year ended December 31, 2007. In general, best execution refers to many factors, including the price paid or received for a security, the commission charged, the promptness and reliability of execution, the confidentiality and placement accorded the order, and other factors affecting the overall benefit obtained by the Series on the transaction.
The Series may receive earnings credits from its custodian when positive cash balances are maintained, which are used to offset custody fees. The expense paid under this arrangement is included in custodian fees on the Statement of Operations with the corresponding expense offset shown as “expense paid indirectly.”
2. Investment Management, Administration Agreements and Other Transactions with Affiliates
In accordance with the terms of its investment management agreement, the Series pays Delaware Management Company (DMC), a series of Delaware Management Business Trust and the investment manager, an annual fee which is calculated daily at the rate of 0.75% on the first $500 million of average daily net assets of the Series, 0.70% on the next $500 million, 0.65% on the next $1.5 billion, and 0.60% on average daily net assets in excess of $2.5 billion.
Prior to May 1, 2007, DMC had contractually agreed to waive that portion, if any, of its management fee and reimburse the Series to the extent necessary to ensure that total annual operating expenses, exclusive of taxes, interest, brokerage fees, 12b-1 plan expenses, certain insurance costs and non-routine expenses or costs including, but not limited to, those relating to reorganizations, litigation, conducting shareholder meetings, and liquidations, did not exceed 0.95% of average daily net assets of the Series. No reimbursement was due for the year ended December 31, 2007.
Effective October 1, 2007, Delaware Service Company, Inc. (DSC), an affiliate of DMC, provides fund accounting and financial administration oversight services to the Series. For these services, the Series pays DSC fees based on the aggregate daily net assets of the Delaware Investments® Family of Funds at the following annual rate: 0.0050% of the first $30 billion; 0.0045% of the next $10 billion; 0.0040% of the next $10 billion; and 0.0025% of aggregate average daily net assets in excess of $50 billion. The fees payable to DSC under the service agreement described above are allocated among all funds in the Delaware Investments® Family of Funds on a relative net asset value basis. Prior to October 1, 2007, DSC provided fund accounting and administrative services to the Series and received a fee at an annual rate of 0.04% of average daily net assets. For the year ended December 31, 2007, the Series was charged $15,567 for these services.
DSC also provides dividend disbursing and transfer agency services. The Series pays DSC a monthly fee based on the number of shareholder accounts for dividend disbursing and transfer agent services.
Pursuant to a distribution agreement and distribution plan, the Series pays Delaware Distributors, L.P. (DDLP), the distributor and an affiliate of DMC, an annual distribution and service fee not to exceed 0.30% of the average daily net assets of the Service Class shares. DDLP has contracted to waive distribution and service fees through April 30, 2008 in order to prevent distribution and service fees of the Service Class shares from exceeding 0.25% of average daily net assets. Standard Class shares pay no distribution and service expenses.
At December 31, 2007, the Series had liabilities payable to affiliates as follows:
Investment
Management
Fee Payable to
DMC | | Dividend Disbursing,
Transfer Agent
Fees and Other Expenses
Payable to DSC | | Distribution
Fees Payable
to DDLP | | Other Expenses
Payable to DMC
and Affiliates* | |
$ | 28,651 | | $ | 1,447 | | $ | 2,587 | | $ | 8,007 | |
| | | | | | | | | | | |
* DMC, as part of its administrative services, pays operating expenses on behalf of the Series and is reimbursed on a periodic basis. Such expenses include items such as printing of shareholder reports, fees for audit, legal and tax services, custodian fees and trustees’ fees.
As provided in the investment management agreement, the Series bears the cost of certain legal and tax services, including internal legal and tax services provided to the Series by DMC and/or its affiliates’ employees. For the year ended December 31, 2007, the Series was charged $2,607 for internal legal and tax services provided by DMC and/or its affiliates’ employees.
Trustees’ fees include expenses accrued by the Series for each Trustee’s retainer and per meeting fees. Certain officers of DMC, DSC and DDLP are officers and/or Trustees of the Trust. These officers and Trustees are paid no compensation by the Series.
3. Investments
For the year ended December 31, 2007, the Series made purchases and sales of investment securities other than short-term investments as follows:
Purchases | | $ | 44,130,636 | |
Sales | | 57,118,815 | |
11
Delaware VIP Growth Opportunities Series
Notes to Financial Statements (continued)
At December 31, 2007, the cost of investments for federal income tax purposes and unrealized appreciation (depreciation) for the Series were as follows:
Cost of
Investments | | Aggregate
Unrealized
Appreciation | | Aggregate
Unrealized
Depreciation | | Net Unrealized
Appreciation | |
$ | 46,923,047 | | $ | 9,897,490 | | $ | (1,706,061 | ) | $ | 8,191,429 | |
| | | | | | | | | | | |
4. Dividend and Distribution Information
Income and long-term capital gain distributions are determined in accordance with federal income tax regulations, which may differ from U.S. generally accepted accounting principles. Additionally, net short-term gains on sales of investment securities are treated as ordinary income for federal income tax purposes. There were no dividends and distributions paid during the years ended December 31, 2007 and 2006.
5. Components of Net Assets on a Tax Basis
As of December 31, 2007, the components of net assets on a tax basis were as follows:
Shares of beneficial interest | | $ | 31,594,571 | |
Undistributed long-term capital gains | | 4,230,635 | |
Unrealized appreciation of investments | | 8,191,429 | |
Net assets | | $ | 44,016,635 | |
The differences between book basis and tax basis components of net assets are primarily attributable to tax deferral of losses on wash sales.
For financial reporting purposes, capital accounts are adjusted to reflect the tax character of permanent book/tax differences. Reclassifications are primarily due to tax treatment of net operating losses. Results of operations and net assets were not affected by these reclassifications. For the year ended December 31, 2007, the Series recorded the following reclassifications:
Accumulated
Net
Investment Loss | | Paid-in
Capital | |
$ | 149,204 | | $ | (149,204 | ) |
| | | | | |
$4,767,587 of capital loss carryforwards from prior years were utilized in 2007.
6. Capital Shares
Transactions in capital shares were as follows:
| | Year
Ended
12/31/07 | | Year
Ended
12/31/06 | |
Shares sold: | | | | | |
Standard Class | | 145,059 | | 2,215,596 | |
Service Class | | 82,864 | | 725,687 | |
| | 227,923 | | 2,941,283 | |
Shares repurchased: | | | | | |
Standard Class | | (704,758 | ) | (2,747,292 | ) |
Service Class | | (162,477 | ) | (870,649 | ) |
| | (867,235 | ) | (3,617,941 | ) |
Net decrease | | (639,312 | ) | (676,658 | ) |
7. Line of Credit
The Series, along with certain other funds in the Delaware Investments® Family of Funds (Participants), participates in a $225,000,000 revolving line of credit facility to be used for temporary or emergency purposes as an additional source of liquidity to fund redemptions of investor shares. The Participants are charged an annual commitment fee, which is allocated across the Participants on the basis of each Participant’s allocation of the entire facility. The Participants may borrow up to a maximum of one third of their net assets under the agreement. The Series had no amounts outstanding as of December 31, 2007, or at any time during the year then ended.
12
Delaware VIP Growth Opportunities Series
Notes to Financial Statements (continued)
8. Securities Lending
The Series, along with other funds in the Delaware Investments® Family of Funds, may lend its securities pursuant to a security lending agreement (Lending Agreement) with Mellon Bank, N.A. (Mellon). With respect to each loan, if the aggregate market value of the collateral held on any business day is less than the aggregate market value of the securities which are the subject of such loan, the borrower will be notified to provide additional collateral not less than the applicable collateral requirements. Cash collateral received is invested in a collective investment vehicle (Collective Trust) established by Mellon for the purpose of investment on behalf of clients participating in its securities lending programs. The Collective Trust invests in fixed income securities, with a weighted average maturity not to exceed 90 days, rated in one of the top two tiers by Standard & Poor’s Ratings Group or Moody’s Investors Service, Inc. or repurchase agreements collateralized by such securities. However, in the event of default or bankruptcy by the lending agent, realization and/or retention of the collateral may be subject to legal proceedings. In the event the borrower fails to return loaned securities and the collateral received is insufficient to cover the value of the loaned securities and provided such collateral shortfall is not the result of investment losses, the lending agent has agreed to pay the amount of the shortfall to the Series, or at the discretion of the lending agent, replace the loaned securities. The Series continues to record dividends or interest, as applicable, on the securities loaned and is subject to change in value of the securities loaned that may occur during the term of the loan. The Series has the right under the Lending Agreement to recover the securities from the borrower on demand. With respect to security loans collateralized by U.S. Treasury obligations, the Series receives a fee from the securities lending agent. With respect to security loans collateralized by cash collateral, the earnings from the collateral investments are shared among the Series, the security lending agent and the borrower. The Series records securities lending income net of allocations to the security lending agent and the borrower.
At December 31, 2007, the market value of the securities on loan was $9,996,042, for which the Series received collateral, comprised of U.S. government obligations valued at $39,098, and cash collateral of $10,277,127. Investments purchased with cash collateral are presented on the Statement of Net Assets under the caption “Securities Lending Collateral.”
9. Credit and Market Risk
The Series invests a significant portion of its assets in small- and mid-sized companies and may be subject to certain risks associated with ownership of securities of such companies. Investments in small- or mid-sized companies may be more volatile than investments in larger companies for a number of reasons, which include more limited financial resources or a dependence on narrow product lines.
The Series may invest up to 10% of its net assets in illiquid securities, which may include securities with contractual restrictions on resale, securities exempt from registration under Rule 144A of the Securities Act of 1933, as amended, and other securities which may not be readily marketable. The relative illiquidity of these securities may impair the Series from disposing of them in a timely manner and at a fair price when it is necessary or desirable to do so. While maintaining oversight, the Series’ Board of Trustees has delegated to DMC the day-to-day functions of determining whether individual securities are liquid for purposes of the Series’ limitation on investments in illiquid assets. As of December 31, 2007, there were no Rule 144A securities and no securities have been determined to be illiquid under the Series’ Liquidity Procedures.
10. Contractual Obligations
The Series enters into contracts in the normal course of business that contain a variety of indemnifications. The Series’ maximum exposure under these arrangements is unknown. However, the Series has not had prior claims or losses pursuant to these contracts. Management has reviewed the Series’ existing contracts and expects the risk of loss to be remote.
11. Change in Custodian
On August 2, 2007, Mellon, One Mellon Center, Pittsburgh, PA 15258 became the Series’ custodian.
13
Delaware VIP Trust — Delaware VIP Growth Opportunities Series
Report of Independent Registered Public Accounting Firm
To the Shareholders and Board of Trustees
Delaware VIP Trust—Delaware VIP Growth Opportunities Series
We have audited the accompanying statement of net assets of the Delaware VIP Growth Opportunities Series (one of the series constituting Delaware VIP Trust) (the “Series”) as of December 31, 2007, and the related statement of operations for the year then ended, the statements of changes in net assets for each of the two years in the period then ended, and the financial highlights for each of the five years in the period then ended. These financial statements and financial highlights are the responsibility of the Series’ management. Our responsibility is to express an opinion on these financial statements and financial highlights based on our audits.
We conducted our audits in accordance with the standards of the Public Company Accounting Oversight Board (United States). Those standards require that we plan and perform the audit to obtain reasonable assurance about whether the financial statements and financial highlights are free of material misstatement. We were not engaged to perform an audit of the Series’ internal control over financial reporting. Our audits included consideration of internal control over financial reporting as a basis for designing audit procedures that are appropriate in the circumstances, but not for the purpose of expressing an opinion on the effectiveness of the Series’ internal control over financial reporting. Accordingly, we express no such opinion. An audit also includes examining, on a test basis, evidence supporting the amounts and disclosures in the financial statements and financial highlights, assessing the accounting principles used and significant estimates made by management, and evaluating the overall financial statement presentation. Our procedures included confirmation of securities owned as of December 31, 2007, by correspondence with the custodian and brokers or by other appropriate auditing procedures where replies from brokers were not received. We believe that our audits provide a reasonable basis for our opinion.
In our opinion, the financial statements and financial highlights referred to above present fairly, in all material respects, the financial position of the Delaware VIP Growth Opportunities Series of Delaware VIP Trust at December 31, 2007, the results of its operations for the year then ended, the changes in its net assets for each of the two years in the period then ended, and its financial highlights for each of the five years in the period then ended, in conformity with U.S. generally accepted accounting principles.

Philadelphia, Pennsylvania
February 14, 2008
The Series files its complete schedule of portfolio holdings with the Securities and Exchange Commission (Commission) for the first and third quarters of each fiscal year on Form N-Q. The Series’ Forms N-Q, as well as a description of the policies and procedures that the Series uses to determine how to vote proxies (if any) relating to portfolio securities is available without charge (i) upon request, by calling 800 523-1918; and (ii) on the Commission’s website at http://www.sec.gov. In addition, a description of the policies and procedures that the Series uses to determine how to vote proxies (if any) relating to portfolio securities is available without charge on the Delaware Investments® Funds’ website at http://www.delawareinvestments.com. The Series’ Forms N-Q may be reviewed and copied at the Commission’s Public Reference Room in Washington, DC; information on the operation of the Public Reference Room may be obtained by calling 800 SEC-0330.
Information (if any) regarding how the Series voted proxies relating to portfolio securities during the most recently disclosed 12-month period ended June 30 is available without charge (i) through the Delaware Investments® Funds’ website at http://www.delawareinvestments.com; and (ii) on the Commission’s website at http://www.sec.gov.
14
Delaware Investments® Family of Funds
BOARD OF TRUSTEES/DIRECTORS AND OFFICERS ADDENDUM
A mutual fund is governed by a Board of Trustees/Directors (“Trustees”), which has oversight responsibility for the management of a fund’s business affairs. Trustees establish procedures and oversee and review the performance of the investment manager, the distributor, and others who perform services for the fund. The independent fund trustees, in particular, are advocates for shareholder interests. Each trustee has served in that capacity since he or she was elected to or appointed to the Board of Trustees, and will continue to serve until his or her retirement or the election of a new trustee in his or her place. The following is a list of the Trustees and Officers with certain background and related information.
Name,
Address,
and Birth Date | | Position(s)
Held with
Fund(s) | | Length of Time
Served | | Principal
Occupation(s)
During
Past 5 Years | | Number of
Portfolios in Fund
Complex Overseen
by Trustee
or Officer | | Other
Directorships
Held by
Trustee
or Officer |
INTERESTED TRUSTEES | | | | | | | | |
| | | | | | | | | | |
Patrick P. Coyne(1)
2005 Market Street
Philadelphia, PA
19103
April 1963
| | Chairman,
President,
Chief Executive
Officer, and
Trustee | | Chairman and Trustee
since August 16, 2006
President and
Chief Executive Officer
since August 1, 2006 | | Patrick P. Coyne has served in
various executive capacities
at different times at
Delaware Investments.(2) | | 84 | | Director –
Kaydon Corp.
Board of Governors
Member –
Investment Company Institute
(2007 – present)
Member of Investment
Committee –
Cradle of
Liberty Council, BSA
(November 2007 –
present)
Finance Committee
Member – St. John
Vianney Roman
Catholic Church
(2007 – present) |
| | | | | | | | | | |
INDEPENDENT TRUSTEES | | | | | | | | |
| | | | | | | | |
Thomas L. Bennett
2005 Market Street
Philadelphia, PA
19103
October 1947 | | Trustee | | Since
March 2005 | | Private Investor –
(March 2004 – Present)
Investment Manager –
Morgan Stanley & Co.
(January 1984 – March 2004) | | 84 | | Director –
Bryn Mawr
Bank Corp. (BMTC) (April 2007 – Present)
Chairman of
Investment
Committee –
The Haverford School
(2002 – present)
Chairman of
Investment
Committee –
Pennsylvania Academy
of Fine Arts
(2007 – present)
Trustee
(2004 – present)
Investment Committee
Member –
Pennsylvania
Horticulture Society
(February 2006 –
present) |
15
Name,
Address,
and Birth Date | | Position(s)
Held with
Fund(s) | | Length of Time
Served | | Principal
Occupation(s)
During
Past 5 Years | | Number of
Portfolios in Fund
Complex Overseen
by Trustee
or Officer | | Other
Directorships
Held by
Trustee
or Officer |
INDEPENDENT TRUSTEES (CONTINUED) | | | | | | |
| | | | | | | | | | |
John A. Fry
2005 Market Street
Philadelphia, PA
19103
May 1960
| | Trustee | | Since
January 2001 | | President –
Franklin & Marshall College
(June 2002 – Present)
Executive Vice President –
University of Pennsylvania
(April 1995 – June 2002) | | 84 | | Director –
Community Health
Systems
Director –
Allied Barton
Security Holdings |
Anthony D. Knerr
2005 Market Street
Philadelphia, PA
19103
December 1938
| | Trustee | | Since
April 1990 | | Founder and Managing Director –
Anthony Knerr & Associates
(Strategic Consulting)
(1990 – Present) | | 84 | | None |
Lucinda S. Landreth
2005 Market Street
Philadelphia, PA
19103
June 1947 | | Trustee | | Since
March 2005 | | Chief Investment Officer –
Assurant, Inc.
(Insurance)
(2002 – 2004) | | 84 | | None |
Ann R. Leven
2005 Market Street
Philadelphia, PA
19103
November 1940
| | Trustee | | Since
October 1989 | | Consultant –
ARL Associates
(Financial Planning)
(1983 – Present) | | 84 | | Director and Audit
Committee Member –
Systemax, Inc. |
Thomas F. Madison
2005 Market Street
Philadelphia, PA
19103
February 1936
| | Trustee | | Since
May 1997 | | President and Chief
Executive Officer –
MLM Partners, Inc.
(Small Business Investing
and Consulting)
(January 1993 – Present) | | 84 | | Director –
CenterPoint Energy
Director and Audit
Committee Member –
Digital River, Inc.
Director and Audit
Committee Member –
Rimage
Corporation
Director and Chair of
Compensation and
Governance &
Nominating
Committees –
Valmont Industries, Inc. |
Janet L. Yeomans
2005 Market Street
Philadelphia, PA
19103
July 1948
| | Trustee | | Since
April 1999 | | Treasurer
(January 2006 – Present)
Vice President –
Mergers & Acquisitions
(January 2003 – January 2006),
and Vice President
(July 1995 – January 2003)
3M Corporation | | 84 | | None |
J. Richard Zecher
2005 Market Street
Philadelphia, PA
19103
July 1940
| | Trustee | | Since
March 2003 | | Founder –
Investor Analytics
(Risk Management)
(May 1999 – Present)
Founder –
Sutton Asset Management
(Hedge Fund)
(September 1998 – Present) | | 84 | | Director and Audit
Committee Member –
Investor Analytics
Director and Audit
Committee Member –
Oxigene, Inc. |
16
Name,
Address,
and Birth Date | | Position(s)
Held with
Fund(s) | | Length of Time
Served | | Principal
Occupation(s)
During
Past 5 Years | | Number of
Portfolios in Fund
Complex Overseen
by Trustee
or Officer | | Other
Directorships
Held by
Trustee
or Officer |
OFFICERS | | | | | | | | | | |
| | | | | | | | | | |
David F. Connor
2005 Market Street
Philadelphia, PA
19103
December 1963
| | Vice President,
Deputy General
Counsel, and Secretary | | Vice President since
September 21, 2000
and Secretary
since
October 2005 | | David F. Connor has served as
Vice President and Deputy
General Counsel of
Delaware Investments
since 2000. | | 84 | | None(4) |
Daniel V. Geatens
2005 Market Street
Philadelphia, PA
19103
October 1972 | | Vice President
and Treasurer | | Treasurer
since
October 25, 2007 | | Daniel V. Geatens has served in various capacities
at different times at
Delaware Investments. | | 84 | | None(4) |
David P. O’Connor
2005 Market Street
Philadelphia, PA
19103
February 1966
| | Senior Vice
President,
General Counsel,
and Chief
Legal Officer | | Senior Vice President,
General Counsel, and
Chief Legal Officer
since
October 2005 | | David P. O’Connor has served in
various executive and legal
capacities at different times at
Delaware Investments. | | 84 | | None(4) |
Richard Salus
2005 Market Street
Philadelphia, PA
19103
October 1963
| | Senior
Vice President
and
Chief Financial
Officer | | Chief Financial
Officer since
November 1, 2006 | | Richard Salus has served in
various executive capacities
at different times at
Delaware Investments. | | 84 | | None(4) |
(1) | Patrick P. Coyne is considered to be an “Interested Trustee” because he is an executive officer of the Fund’s(s’) investment advisor. |
(2) | Delaware Investments is the marketing name for Delaware Management Holdings, Inc. and its subsidiaries, including the Fund’s(s’) investment advisor, principal underwriter, and its transfer agent. |
(3) | In 1997, several funds managed by Voyageur Fund Managers, Inc. (the “Voyageur Funds”) were incorporated into the Delaware Investments Family of Funds. Mr. Madison served as a director of the Voyageur Funds from 1993 until 1997. |
(4) | David F. Connor, Daniel V. Geatens, David P. O’Connor, and Richard Salus serve in similar capacities for the six portfolios of the Optimum Fund Trust, which have the same investment advisor, principal underwriter, and transfer agent as the registrant. |
The Statement of Additional Information for the Fund(s) includes additional information about the Trustees and Officers and is available, without charge, upon request by calling 800 523-1918.
17
Delaware VIP Trust — Delaware VIP High Yield Series
For the year ended Dec. 31, 2007, Delaware VIP High Yield Series returned +2.79% for Standard Class shares and +2.55% for Service Class shares (both figures reflect all distributions reinvested). During that same period, the Series’ benchmark, the Bear Stearns High Yield Index, gained 2.09%. (source: Lipper).
We continued to focus on security selection as the primary driver of the Series’ performance. It became clear during the first quarter of the fiscal year that the problems in the U.S. housing market were more severe than many originally thought; in July and August, the deepening housing slump touched off global market turmoil. As a result, the high yield bond market experienced some of the most volatile price swings in recent memory during the summer months.
In July, high yield bonds suffered their worst monthly losses in more than five years as a result of credit concerns that were spurred, in our opinion, by the subprime mortgage crisis. In September, the market recovered strongly when the Federal Reserve trimmed the discount rate and the fed funds rate by 50 basis points each, or half a percentage point. The central bank cut the rates again in both October and December, eventually bringing the fed funds rate down to 4.25%.
During the fiscal period, the higher credit quality sectors (BB-rated bonds in particular) outperformed lower credit quality sectors (CCC-rated bonds). The better-performing high yield industry sectors were utilities, chemicals, and energy. The worst-performing areas of the market were housing, retail, and financials.
In managing the portfolio, we generally favored B-rated credits over higher-quality credits, given the additional yield compensation for the risk accepted. The utilities, energy, and capital goods sectors were the strongest relative contributors to performance. An underweight position versus the index in stronger-performing, higher-quality securities, as well as credit-specific issues, were the biggest detractors from results.
We increased positions in General Motors and Ford ahead of the successful negotiations with the United Auto Workers in September. The resolution of these talks allows Ford and General Motors to lower their cost structures, which should in turn allow them to compete more effectively. Subsequently, we reduced our auto and auto loan exposure during the fourth quarter, after GMAC made a clear commitment to continue to support Rescap, its mortgage lending operation. The Series maintained its positions in General Motors, GMAC, and Ford at the end of the period.
The views expressed are current as of the date of this report and are subject to change.
The performance data quoted below represent past performance; past performance does not guarantee future results. Investment return and principal value will fluctuate so your shares, when redeemed, may be worth more or less than their original cost. Please obtain the performance data for the most recent month end by calling the number noted in the introductory section of this report on the page related to this Series.
You should consider the investment objectives, risks, charges, and expenses of the investment company carefully before investing. The Delaware VIP High Yield Series prospectus contains this and other important information about the Series. To obtain a prospectus, contact the company noted on the page related to this Series in the introductory section of this report, either by phone or through the company Web site. We advise you to read the prospectus carefully before you invest.
Delaware VIP High Yield Series
Average annual total returns
For periods ended Dec. 31, 2007 | | 1 year | | 5 years | | 10 years | | Lifetime | |
| | | | | | | | | |
Standard Class shares (commenced operations July 28, 1988) | | +2.79 | % | +11.98 | % | +3.25 | % | +6.83 | % |
| | | | | | | | | |
Service Class shares (commenced operations May 1, 2000) | | +2.55 | % | +11.76 | % | NA | | +5.61 | % |
As disclosed in the Series’ most recent prospectus, expenses for Standard Class and Service Class shares were as follows: The net expense ratios for Standard Class and Service Class shares of the Series were 0.74% and 0.99%, respectively. Total operating expenses for Standard Class and Service Class shares were 0.77% and 1.07%, respectively. Management fees for Standard Class and Service Class shares were 0.65%.
Management has contracted to reimburse expenses and/or waive its management fees from May 1, 2007, through April 30, 2008, as disclosed in the most recent prospectus.
Earnings from a variable annuity or variable life investment compound tax-free until withdrawal and, as a result, no adjustments were made for income taxes.
An expense limitation was in effect for all classes during the periods shown in the Series performance chart previous page and in the Performance of a $10,000 Investment chart below.
1
Performance of Service Class shares will vary due to different charges and expenses.
Performance data do not reflect insurance fees related to a variable annuity or variable life investment or the deferred sales charge that would apply to certain withdrawals of investments held for fewer than eight years. Performance shown here would have been reduced if such fees were included and the expense limitation removed. For more information about fees, consult your variable annuity or variable life prospectus.
Investments in variable products involve risk. A rise or fall in interest rates can have a significant impact on bond prices and the net asset value (NAV) of the Series. High yielding, noninvestment grade (junk bonds) bonds involve higher risk than investment grade bonds. Adverse conditions may affect the issuer’s ability to pay interest and principal on these securities. The portfolio may have turnover in excess of 100%. High portfolio turnover can increase the Series’ transaction costs and lower returns.
The Series may be invested in emerging markets and foreign high yield corporate bonds, which have special risks that include currency fluctuations, economic and political change, and different accounting standards. Some portfolios offer more risk than others.
Please read both the contract and underlying prospectus for specific details regarding the product’s risk profile.

The chart shows a $10,000 investment in the Delaware VIP High Yield Series Standard Class shares for the period from Dec. 31, 1997, through Dec. 31, 2007. Performance of Service Class shares will vary due to different charges and expenses.
The chart also shows $10,000 invested in the Bear Stearns High Yield Index for the period from Dec. 31, 1997, through Dec. 31, 2007. The Bear Stearns High Yield Index measures the performance of high yield bonds (rated BB or lower) that have high income potential. An index is unmanaged and does not reflect the costs of operating a mutual fund, such as the costs of buying, selling, and holding securities. You cannot invest directly in an index.
2
Delaware VIP Trust — Delaware VIP High Yield Series
Disclosure of Series Expenses
For the Period July 1, 2007 to December 31, 2007
As a shareholder of the Series, you incur ongoing costs, including management fees; distribution and/or service (12b-1) fees; and other Series expenses. This Example is intended to help you understand your ongoing costs (in dollars) of investing in the Series and to compare these costs with the ongoing costs of investing in other mutual funds.
The Example is based on an investment of $1,000 invested at the beginning of the period and held for the entire period from July 1, 2007 to December 31, 2007.
Actual Expenses
The first section of the table shown, “Actual Series Return,” provides information about actual account values and actual expenses. You may use the information in this section of the table, together with the amount you invested, to estimate the expenses that you paid over the period. Simply divide your account value by $1,000 (for example, an $8,600 account value divided by $1,000 = 8.6), then multiply the result by the number in the first section under the heading entitled “Expenses Paid During Period” to estimate the expenses you paid on your account during the period.
Hypothetical Example for Comparison Purposes
The second section of the table shown, “Hypothetical 5% Return,” provides information about hypothetical account values and hypothetical expenses based on the Series’ actual expense ratio and an assumed rate of return of 5% per year before expenses, which is not the Series’ actual return. The hypothetical account values and expenses may not be used to estimate the actual ending account balance or expenses you paid for the period. You may use this information to compare the ongoing costs of investing in the Series and other funds. To do so, compare the 5% hypothetical example with the 5% hypothetical examples that appear in the shareholder reports of other funds.
Please note that the expenses shown in the table are meant to highlight your ongoing costs only. As a shareholder of the Series, you do not incur any transaction costs, such as sales charges (loads), redemption fees or exchange fees, but shareholders of other funds may incur such costs. Also, the fees related to the variable annuity investment or the deferred sales charge that could apply have not been included. Therefore, the second section of the table is useful in comparing ongoing costs only, and will not help you determine the relative total costs of owning different funds. The Series’ actual expenses shown in the table reflect fee waivers in effect. The expenses shown in the table assume reinvestment of all dividends and distributions.
Expense Analysis of an Investment of $1,000
| | Beginning
Account
Value
7/1/07 | | Ending
Account
Value
12/31/07 | | Annualized
Expense
Ratios | | Expenses
Paid During
Period
7/1/07 to
12/31/07* | |
Actual Series Return | | | | | | | | | |
Standard Class | | $ | 1,000.00 | | $ | 986.70 | | 0.75 | % | $ | 3.76 | |
Service Class | | 1,000.00 | | 986.70 | | 1.00 | % | 5.01 | |
| | | | | | | | | |
Hypothetical 5% Return (5% return before expenses) | | | | | | | | | |
Standard Class | | $ | 1,000.00 | | $ | 1,021.42 | | 0.75 | % | $ | 3.82 | |
Service Class | | 1,000.00 | | 1,020.16 | | 1.00 | % | 5.09 | |
*“Expenses Paid During Period” are equal to the Series’ annualized expense ratio, multiplied by the average account value over the period, multiplied by 184/365 (to reflect the one-half year period).
3
Delaware VIP Trust — Delaware VIP High Yield Series
Sector Allocation and Credit Quality Breakdown
As of December 31, 2007
Sector designations may be different than the sector designations presented in other Series materials.
Sector | | Percentage
of Net Assets | |
Corporate Bonds | | 73.80 | % |
Basic Industry | | 6.36 | % |
Brokerage | | 1.13 | % |
Capital Goods | | 5.45 | % |
Consumer Cyclical | | 4.78 | % |
Consumer Non-Cyclical | | 3.35 | % |
Energy | | 12.47 | % |
Finance & Investments | | 1.11 | % |
Media | | 4.63 | % |
Real Estate | | 1.25 | % |
Services Cyclical | | 10.87 | % |
Services Non-Cyclical | | 4.42 | % |
Technology & Electronics | | 0.77 | % |
Telecommunications | | 12.15 | % |
Utilities | | 5.06 | % |
Senior Secured Loans | | 11.16 | % |
Common Stock | | 0.35 | % |
Convertible Preferred Stock | | 0.46 | % |
Preferred Stock | | 0.11 | % |
Warrants | | 0.00 | % |
Discount Note | | 12.68 | % |
Securities Lending Collateral | | 7.94 | % |
Total Value of Securities | | 106.50 | % |
Obligation to Return Securities Lending Collateral | | (7.94 | )% |
Receivables and Other Assets Net of Liabilities | | 1.44 | % |
Total Net Assets | | 100.00 | % |
Credit Quality Breakdown
(as a % of fixed income investments) | | | |
AAA | | 13.95 | % |
BBB | | 2.63 | % |
BB | | 26.44 | % |
B | | 47.90 | % |
CCC | | 8.03 | % |
D | | 0.35 | % |
Not Rated | | 0.70 | % |
Total | | 100.00 | % |
4
Delaware VIP Trust — Delaware VIP High Yield Series
Statement of Net Assets
December 31, 2007
| | Principal
Amount
(U.S. $ ) | | Value
(U.S. $ ) | |
| CORPORATE BONDS–73.80% | | | | | |
| Basic Industry–6.36% | | | | | |
* | AK Steel 7.75% 6/15/12 | | $ | 1,393,000 | | $ | 1,406,930 | |
| Freeport McMoRan Copper & Gold 8.25% 4/1/15 | | 1,123,000 | | 1,193,188 | |
| Georgia-Pacific | | 1,018,000 | | 1,007,820 | |
| 7.70% 6/15/15 | | | | | |
| 8.875% 5/15/31 | | 1,715,000 | | 1,663,550 | |
| 9.50% 12/1/11 | | 430,000 | | 453,650 | |
# | GTL Trade Finance 144A 7.25% 10/20/17 | | 710,000 | | 721,873 | |
| Hexion US Finance 9.75% 11/15/14 | | 1,689,000 | | 1,832,565 | |
*# | Ineos Group Holdings 144A 8.50% 2/15/16 | | 1,044,000 | | 934,380 | |
# | MacDermid 144A 9.50% 4/15/17 | | 2,787,000 | | 2,633,714 | |
*# | Momentive Performance Materials 144A 9.75% 12/1/14 | | 1,891,000 | | 1,749,175 | |
# | NewPage 144A 10.00% 5/1/12 | | 990,000 | | 999,900 | |
‡ | Port Townsend Paper 12.4312% 8/27/12 | | 533,400 | | 528,066 | |
| Potlatch 13.00% 12/1/09 | | 2,078,000 | | 2,358,164 | |
·# | Ryerson 144A 12.574% 11/1/14 | | 1,010,000 | | 974,650 | |
# | Sappi Papier 144A 6.75% 6/15/12 | | 2,230,000 | | 2,191,100 | |
# | Steel Dynamics | | | | | |
| 6.75% 4/1/15 144A | | 752,000 | | 729,440 | |
| 7.375% 11/1/12 | | 511,000 | | 516,110 | |
| Witco 6.875% 2/1/26 | | 580,000 | | 469,800 | |
| | | | | 22,364,075 | |
| Brokerage–1.13% | | | | | |
| LaBranche | | | | | |
* | 9.50% 5/15/09 | | 2,032,000 | | 2,034,540 | |
| 11.00% 5/15/12 | | 1,980,000 | | 1,947,825 | |
| | | | | 3,982,365 | |
| Capital Goods–5.45% | | | | | |
| American Railcar Industries 7.50% 3/1/14 | | 560,000 | | 532,000 | |
* | Berry Plastics Holding 8.875% 9/15/14 | | 903,000 | | 862,365 | |
| CPG International 10.50% 7/1/13 | | 1,322,000 | | 1,255,900 | |
* | Graham Packaging 9.875% 10/15/14 | | 988,000 | | 913,900 | |
* | Graphic Packaging International 8.50% 8/15/11 | | 872,000 | | 867,640 | |
* | Greenbrier 8.375% 5/15/15 | | 413,000 | | 396,480 | |
*# | Hawker Beechcraft Acquisition 144A 9.75% 4/1/17 | | 1,311,000 | | 1,307,723 | |
| Interface 10.375% 2/1/10 | | 1,788,000 | | 1,881,870 | |
| Intertape Polymer 8.50% 8/1/14 | | 1,202,000 | | 1,104,338 | |
| Koppers Industries 9.875% 10/15/13 | | 902,000 | | 953,865 | |
| L-3 Communications 7.625% 6/15/12 | | 1,700,000 | | 1,748,875 | |
· | NXP BV Funding 7.993% 10/15/13 | | 1,006,000 | | 929,293 | |
| Owens-Brockway Glass Container 6.75% 12/1/14 | | 1,905,000 | | 1,904,999 | |
| Smurfit-Stone Container Enterprises 8.00% 3/15/17 | | 1,612,000 | | 1,565,655 | |
*# | SPX 144A 7.625% 12/15/14 | | 595,000 | | 607,644 | |
| Trimas 9.875% 6/15/12 | | 2,362,000 | | 2,314,759 | |
| | | | 19,147,306 | |
| Consumer Cyclical–4.78% | | | | | |
*# | Allison Transmission 144A 11.00% 11/1/15 | | $ | 1,129,000 | | $ | 1,033,035 | |
* | Carrols 9.00% 1/15/13 | | 846,000 | | 774,090 | |
| Ford Motor Credit | | | | | |
| 7.375% 10/28/09 | | 174,000 | | 163,844 | |
* | 7.45% 7/16/31 | | 2,292,000 | | 1,713,270 | |
| 7.80% 6/1/12 | | 1,045,000 | | 916,929 | |
· | 7.993% 1/13/12 | | 779,000 | | 654,879 | |
* | General Motors 8.375% 7/15/33 | | 2,200,000 | | 1,782,000 | |
| GMAC | | | | | |
· | 6.119% 5/15/09 | | 1,897,000 | | 1,767,518 | |
| 6.875% 9/15/11 | | 248,000 | | 212,328 | |
| 6.875% 8/28/12 | | 746,000 | | 625,712 | |
| KB Home 8.625% 12/15/08 | | 964,000 | | 949,540 | |
| Lear 8.75% 12/1/16 | | 2,762,000 | | 2,527,230 | |
| Neiman Marcus Group PIK 9.00% 10/15/15 | | 1,805,000 | | 1,870,431 | |
# | Tenneco 144A 8.125% 11/15/15 | | 1,065,000 | | 1,059,675 | |
# | TRW Automotive 144A 7.00% 3/15/14 | | 820,000 | | 758,500 | |
| | | | | 16,808,981 | |
| Consumer Non-Cyclical–3.35% | | | | | |
| ACCO Brands 7.625% 8/15/15 | | 865,000 | | 776,338 | |
* | Chiquita Brands International 8.875% 12/1/15 | | 1,005,000 | | 914,550 | |
* | Constellation Brands 8.125% 1/15/12 | | 1,754,000 | | 1,767,155 | |
| Cott Beverages USA 8.00% 12/15/11 | | 1,025,000 | | 958,375 | |
| Del Monte | | | | | |
| 6.75% 2/15/15 | | 480,000 | | 456,000 | |
| 8.625% 12/15/12 | | 385,000 | | 389,813 | |
* | Jarden 7.50% 5/1/17 | | 1,924,000 | | 1,664,260 | |
| National Beef Packing 10.50% 8/1/11 | | 1,370,000 | | 1,308,350 | |
* | Pilgrim’s Pride 8.375% 5/1/17 | | 3,589,000 | | 3,535,164 | |
| | | | | 11,770,005 | |
| Energy–12.47% | | | | | |
| AmeriGas Partners 7.125% 5/20/16 | | 1,773,000 | | 1,728,675 | |
| Chesapeake Energy | | | | | |
| 6.375% 6/15/15 | | 1,260,000 | | 1,225,350 | |
| 6.625% 1/15/16 | | 1,522,000 | | 1,495,365 | |
| Compton Petroleum Finance 7.625% 12/1/13 | | 3,028,000 | | 2,831,179 | |
| Dynergy Holdings 7.75% 6/1/19 | | 3,850,000 | | 3,570,874 | |
| El Paso | | | | | |
* | 6.875% 6/15/14 | | 1,566,000 | | 1,585,143 | |
* | 7.00% 6/15/17 | | 1,875,000 | | 1,886,319 | |
# | El Paso Performance-Linked Trust 144A 7.75% 7/15/11 | | 1,013,000 | | 1,044,636 | |
| Energy Partners 9.75% 4/15/14 | | 1,875,000 | | 1,781,250 | |
| Ferrellgas Finance Escrow 6.75% 5/1/14 | | 819,000 | | 807,739 | |
| Foundation Pennsylvania Coal 7.25% 8/1/14 | | 2,322,000 | | 2,304,585 | |
5
| | | Principal
Amount
(U.S. $) | | Value
(U.S. $) | |
| CORPORATE BONDS (continued) | | | | | |
| Energy (continued) | | | | | |
| Geophysique-Veritas | | | | | |
* | 7.50% 5/15/15 | | $ | 307,000 | | $ | 312,373 | |
| 7.75% 5/15/17 | | 922,000 | | 935,830 | |
*# | Helix Energy Solutions 144A | | | | | |
| 9.50% 1/15/16 | | 800,000 | | 818,000 | |
# | Hilcorp Energy I 144A | | | | | |
| 7.75% 11/1/15 | | 1,294,000 | | 1,277,825 | |
* | 9.00% 6/1/16 | | 1,075,000 | | 1,118,000 | |
| Inergy Finance | | 861,000 | | 841,628 | |
| 6.875% 12/15/14 | | | | | |
| 8.25% 3/1/16 | | 394,000 | | 409,760 | |
# | Key Energy Services 144A | | | | | |
| 8.375% 12/1/14 | | 1,095,000 | | 1,125,113 | |
* | Kinder Morgan Finance 5.35% 1/5/11 | | 133,000 | | 132,123 | |
| Mariner Energy 8.00% 5/15/17 | | 1,246,000 | | 1,191,488 | |
| Massey Energy | | 446,000 | | 438,195 | |
| 6.625% 11/15/10 | | | | | |
| 6.875% 12/15/13 | | 1,565,000 | | 1,482,838 | |
# | OPTI Canada 144A | | | | | |
| 7.875% 12/15/14 | | 720,000 | | 707,400 | |
| 8.25% 12/15/14 | | 389,000 | | 387,055 | |
| PetroHawk Energy 9.125% 7/15/13 | | 1,878,000 | | 1,985,985 | |
| Plains Exploration & Production | | | | | |
| 7.00% 3/15/17 | | 1,826,000 | | 1,755,243 | |
| Regency Energy Partners | | | | | |
| 8.375% 12/15/13 | | 1,476,000 | | 1,527,660 | |
# | Stallion Oilfield Services 144A | | | | | |
| 9.75% 2/1/15 | | 850,000 | | 786,250 | |
| Whiting Petroleum 7.25% 5/1/13 | | 2,674,000 | | 2,647,259 | |
| Williams 7.50% 1/15/31 | | 3,418,000 | | 3,691,439 | |
| | | | | 43,832,579 | |
| Finance & Investments–1.11% | | | | | |
| Leucadia National 8.125% 9/15/15 | | 1,959,000 | | 1,968,795 | |
# | Nuveen Investments 144A | | | | | |
| 10.50% 11/15/15 | | 1,865,000 | | 1,867,331 | |
| Unum Group 5.859% 5/15/09 | | 50,000 | | 50,926 | |
| | | | | 3,887,052 | |
| Media–4.63% | | | | | |
| Charter Communications Holdings | | | | | |
| 13.50% 1/15/11 | | 3,245,000 | | 2,693,350 | |
* | Dex Media West 9.875% 8/15/13 | | 1,634,000 | | 1,703,445 | |
| Idearc 8.00% 11/15/16 | | 3,814,000 | | 3,518,414 | |
# | Lamar Media 144A 6.625% 8/15/15 | | 691,000 | | 675,453 | |
# | LBI Media 144A 8.50% 8/1/17 | | 953,000 | | 923,219 | |
# | Quebecor World 144A | | | | | |
| 7.75% 3/15/16 | | 1,890,000 | | 1,823,850 | |
| 9.75% 1/15/15 | | 1,629,000 | | 1,231,931 | |
| RH Donnelley | | | | | |
* | 8.875% 1/15/16 | | 933,000 | | 877,020 | |
# | 8.875% 10/15/17 144A | | 2,172,000 | | 2,019,960 | |
*# | Univision Communications PIK 144A | | | | | |
| 9.75% 3/15/15 | | 898,000 | | 822,793 | |
| | | | | 16,289,435 | |
| Real Estate–1.25% | | | | | |
| BF Saul REIT 7.50% 3/1/14 | | $ | 1,816,000 | | $ | 1,679,800 | |
* | Host Marriott 7.125% 11/1/13 | | 2,665,000 | | 2,698,313 | |
| | | | | 4,378,113 | |
| Services Cyclical–10.87% | | | | | |
| Aramark Services 8.50% 2/1/15 | | 3,579,000 | | 3,641,632 | |
# | Cardtronics 144A 9.25% 8/15/13 | | 1,803,000 | | 1,766,940 | |
| Corrections Corporation of America | | | | | |
| 7.50% 5/1/11 | | 1,028,000 | | 1,045,990 | |
| FTI Consulting 7.625% 6/15/13 | | 3,652,000 | | 3,761,559 | |
# | Galaxy Entertainment Finance 144A | | | | | |
| 9.875% 12/15/12 | | 2,130,000 | | 2,257,800 | |
| Gaylord Entertainment | | | | | |
| 8.00% 11/15/13 | | 1,789,000 | | 1,789,000 | |
| Global Cash Access 8.75% 3/15/12 | | 788,000 | | 744,660 | |
| Hertz 8.875% 1/1/14 | | 3,450,000 | | 3,514,688 | |
| Kansas City Southern de Mexico | | | | | |
| 9.375% 5/1/12 | | 3,037,000 | | 3,196,443 | |
| Kansas City Southern Railway | | | | | |
| 9.50% 10/1/08 | | 1,127,000 | | 1,155,175 | |
| Majestic Star Casino | | | | | |
| 9.50% 10/15/10 | | 2,539,000 | | 2,412,050 | |
| Mandalay Resort Group | | | | | |
| 9.375% 2/15/10 | | 648,000 | | 673,920 | |
| 9.50% 8/1/08 | | 1,891,000 | | 1,938,275 | |
| MGM Mirage 7.625% 1/15/17 | | 975,000 | | 967,688 | |
# | Penhall International 144A | | | | | |
| 12.00% 8/1/14 | | 857,000 | | 801,295 | |
# | Pokagon Gaming Authority | | | | | |
| 144A 10.375% 6/15/14 | | 3,235,000 | | 3,493,800 | |
| Rental Service 9.50% 12/1/14 | | 1,464,000 | | 1,317,600 | |
| Seabulk International 9.50% 8/15/13 | | 825,000 | | 876,563 | |
# | Seminole Indian Tribe of Florida 144A | | | | | |
| 7.804% 10/1/20 | | 1,135,000 | | 1,171,524 | |
| Station Casinos | | | | | |
| 6.00% 4/1/12 | | 385,000 | | 344,575 | |
| 6.625% 3/15/18 | | 1,932,000 | | 1,333,080 | |
| | | | | 38,204,257 | |
| Services Non-Cyclical–4.42% | | | | | |
| Allied Waste North America | | | | | |
* | 7.375% 4/15/14 | | 891,000 | | 893,228 | |
| 7.875% 4/15/13 | | 1,889,000 | | 1,940,948 | |
| Casella Waste Systems 9.75% 2/1/13 | | 3,039,000 | | 3,114,974 | |
| CRC Health 10.75% 2/1/16 | | 559,000 | | 575,770 | |
| HCA 9.25% 11/15/16 | | 2,600,000 | | 2,736,500 | |
| 9.625% 11/15/16 PIK | | 2,523,000 | | 2,674,380 | |
| Health Management Associates | | | | | |
| 4.375% 8/1/23 | | 865,000 | | 852,025 | |
| Omnicare 6.875% 12/15/15 | | 1,628,000 | | 1,522,180 | |
| Universal Hospital PIK 8.50% 6/1/15 | | 1,194,000 | | 1,211,910 | |
| | | | | 15,521,915 | |
| Technology & Electronics–0.77% | | | | | |
* | Freescale Semiconductor | | | | | |
| 8.875% 12/15/14 | | 1,180,000 | | 1,059,050 | |
| Sungard Data Systems | | | | | |
| 9.125% 8/15/13 | | 1,303,000 | | 1,332,318 | |
* | 10.25% 8/15/15 | | 324,000 | | 332,910 | |
| | | | | 2,724,278 | |
6
| | | Principal
Amount
(U.S. $) | | Value
(U.S. $) | |
| CORPORATE BONDS (continued) | | | | | |
| Telecommunications–12.15% | | | | | |
‡ | Allegiance Telecom 11.75% 2/15/08 | | $ | 565,000 | | $ | 41,358 | |
| American Tower | | | | | |
# | 7.00% 10/15/17 144A | | 1,686,000 | | 1,702,860 | |
| 7.125% 10/15/12 | | 1,769,000 | | 1,826,493 | |
| Broadview Network 11.375% 9/1/12 | | 1,254,000 | | 1,313,565 | |
· | Centennial Communications | | | | | |
| 10.981% 1/1/13 | | 1,617,000 | | 1,661,468 | |
| Citizens Communications | | | | | |
| 7.125% 3/15/19 | | 2,839,000 | | 2,711,244 | |
| Cricket Communications | | | | | |
| 9.375% 11/1/14 | | 2,427,000 | | 2,287,448 | |
# | Digicel 144A 9.25% 9/1/12 | | 1,704,000 | | 1,744,555 | |
·# | Hellas Telecommunications | | | | | |
| Luxembourg II 144A 10.993% 1/15/15 | | 1,367,000 | | 1,295,233 | |
| Hughes Network Systems/Finance | | | | | |
| 9.50% 4/15/14 | | 1,733,000 | | 1,763,328 | |
o | Inmarsat Finance 10.375% 11/15/12 | | 3,836,000 | | 3,744,894 | |
| Intelsat 11.25% 6/15/16 | | 1,778,000 | | 1,844,675 | |
* | Level 3 Financing 9.25% 11/1/14 | | 1,918,000 | | 1,745,380 | |
| Lucent Technologies 6.45% 3/15/29 | | 1,774,000 | | 1,474,638 | |
| MetroPCS Wireless 9.25% 11/1/14 | | 3,498,000 | | 3,305,609 | |
#· | Nortel Networks 144A 9.493% 7/15/11 | | 2,124,000 | | 2,081,520 | |
| NTL Cable 9.125% 8/15/16 | | 1,167,000 | | 1,161,165 | |
# | PAETEC Holding 144A 9.50% 7/15/15 | | 1,496,000 | | 1,466,080 | |
* | Qwest Capital Funding 7.25% 2/15/11 | | 1,966,000 | | 1,946,340 | |
| Qwest 7.50% 10/1/14 | | 1,425,000 | | 1,453,500 | |
| Rural Cellular | | | | | |
| 9.875% 2/1/10 | | 1,742,000 | | 1,816,035 | |
· | 10.661% 11/1/12 | | 493,000 | | 505,325 | |
| Time Warner Telecom Holdings | | | | | |
| 9.25% 2/15/14 | | 928,000 | | 953,520 | |
| Triton PCS 8.50% 6/1/13 | | 984,000 | | 1,023,360 | |
| Windstream 8.125% 8/1/13 | | 1,777,000 | | 1,848,080 | |
| | | | | 42,717,673 | |
| Utilities–5.06% | | | | | |
| AES | | | | | |
| 7.75% 3/1/14 | | 1,368,000 | | 1,385,100 | |
# | 144A 8.00% 10/15/17 | | 1,212,000 | | 1,245,330 | |
‡# | Calpine 144A 8.496% 7/15/09 | | 1,177,692 | | 1,248,354 | |
| Elwood Energy 8.159% 7/5/26 | | 1,961,171 | | 1,970,321 | |
| Midwest Generation 8.30% 7/2/09 | | 928,322 | | 942,247 | |
| Mirant Americas Generation 8.30% 5/1/11 | | 2,233,000 | | 2,249,748 | |
| Mirant North America 7.375% 12/31/13 | | 1,814,000 | | 1,827,605 | |
| NRG Energy 7.375% 2/1/16 | | 5,403,000 | | 5,281,432 | |
| Orion Power Holdings 12.00% 5/1/10 | | 1,495,000 | | 1,637,025 | |
| | | | | 17,787,162 | |
| Total Corporate Bonds | | | | | |
| (cost $264,814,556) | | | | 259,415,196 | |
| | | | | | |
« | SENIOR SECURED LOANS–11.16% | | | | | |
| AlixPartners 0.00% 10/12/13 | | 887,758 | | 863,345 | |
| ALLTEL 7.69% 12/21/14 | | 960,000 | | 927,000 | |
| Aramark | | | | | |
| 7.08% 1/26/14 | | 929,599 | | 886,415 | |
| 7.485% 1/26/14 | | 65,401 | | 62,212 | |
| Bausch & Lomb | | | | | |
| 8.34% 4/11/15 | | $ | 237,000 | | $ | 236,408 | |
| 8.34% 4/11/15 | | 948,000 | | 944,985 | |
| BNY ConvergEx Group 7.39% 9/29/13 | | 1,235,714 | | 1,200,187 | |
| Building Materials 8.256% 2/22/14 | | 1,567,135 | | 1,337,283 | |
| Coffeyville Resources | | | | | |
| 5.26% 12/28/10 | | 154,701 | | 149,964 | |
| 8.365% 12/28/13 | | 504,535 | | 489,399 | |
| Community Health Systems | | | | | |
| 7.61% 7/2/14 | | 3,410,097 | | 3,288,612 | |
| 7.61% 8/25/14 | | 168,677 | | 162,668 | |
| Dynegy Holdings | | | | | |
| 7.28% 4/2/13 | | 230,000 | | 216,200 | |
| 7.65% 4/2/13 | | 1,680,000 | | 1,594,597 | |
| Energy Futures Holdings | | | | | |
| 7.565% 10/10/14 | | 4,150,000 | | 4,076,399 | |
| 8.39% 10/10/14 | | 3,300,000 | | 3,243,158 | |
| Ford Motor 8.36% 11/29/13 | | 1,309,884 | | 1,214,918 | |
| Freescale Semiconductor 7.37% 12/1/13 | | 1,446,357 | | 1,342,465 | |
| General Motors 7.745% 11/17/13 | | 744,375 | | 697,297 | |
| Georgia Pacific Term Tranche Loan B | | | | | |
| 7.115% 12/22/12 | | 925,000 | | 882,284 | |
| Goodyear Tire 7.47% 4/30/14 | | 1,100,000 | | 1,025,750 | |
| HCA 7.12% 11/18/13 | | 1,785,000 | | 1,720,294 | |
| Idearc 7.35% 11/1/14 | | 423,932 | | 404,168 | |
| Jarden 7.67% 1/24/12 | | 994,873 | | 962,008 | |
| MacDermid 7.45% 4/12/14 | | 787,462 | | 752,026 | |
| MetroPCS Wireless 9.70% 2/20/14 | | 950,000 | | 914,175 | |
| Michaels Stores 7.625% 10/11/13 | | 1,851,929 | | 1,709,331 | |
| NE Energy 7.87% 11/1/13 | | 250,000 | | 239,141 | |
| Solar Capital Corp 7.53% 2/11/13 | | 783,023 | | 757,794 | |
| Talecris Biotherapeutics 2nd Lien | | | | | |
| 11.85% 12/6/14 | | 1,075,000 | | 1,072,313 | |
| Telesat Canada 9.00% 2/14/08 | | 2,500,000 | | 2,387,500 | |
| Time Warner Telecom Holdings | | | | | |
| 7.62% 1/7/13 | | 984,560 | | 951,331 | |
| Travelport 8.13% 8/1/13 | | 681,734 | | 619,046 | |
| Univision Communications | | | | | |
| 7.60% 9/15/14 | | 70,470 | | 64,367 | |
| 7.60% 9/15/14 | | 2,029,530 | | 1,853,783 | |
| Total Senior Secured Loans | | | | | |
| (cost $40,465,404) | | | | 39,248,823 | |
| | | Number of
Shares | | | |
| COMMON STOCK–0.35% | | | | | |
@=†p | Avado Brands | | 1,813 | | 0 | |
† | Century Communications | | 2,820,000 | | 1,833 | |
† | Foster Wheeler | | 1 | | 136 | |
*† | Mirant | | 827 | | 32,236 | |
@=†p | Port Townsend | | 1,905 | | 1,188,720 | |
| Total Common Stock
(cost $1,465,375) | | | | 1,222,925 | |
7
| | | Number of
Shares | | Value
(U.S. $ ) | |
| CONVERTIBLE PREFERRED STOCK–0.46% | | | | | |
| General Motors 5.25% exercise price $64.90, expiration date 3/6/32 | | 39,700 | | $ | 768,592 | |
| Lucent Technologies Capital Trust I 7.75% exercise price $24.80, expiration date 3/15/17 | | 970 | | 848,871 | |
| Total Convertible Preferred Stock
(cost $1,732,710) | | | | 1,617,463 | |
| | | | | | |
| PREFERRED STOCK–0.11% | | | | | |
| Port Townsend | | 381 | | 377,190 | |
| Total Preferred Stock
(cost $377,190) | | | | 377,190 | |
| | | | | | |
| WARRANTS–0.00% | | | | | |
| Port Townsend | | 381 | | 9,144 | |
†# | Solutia 144A, exercise price $7.59, expiration date 7/15/09 | | 850 | | 0 | |
| Total Warrants
(cost $81,575) | | | | 9,144 | |
| | | | | | | |
| | | Principal
Amount
(U.S. $ ) | | Value
(U.S. $ ) | |
# | DISCOUNT NOTE–12.68% | | | | | |
| Federal Home Loan Bank 3.25% 1/2/08 | | $ | 44,567,046 | | $ | 44,563,064 | |
| Total Discount Note
(cost $44,563,064) | | | | 44,563,064 | |
| | | | | | |
| Total Value of Securities Before Securities Lending Collateral—98.56%
(cost $353,499,874) | | | | 346,453,805 | |
| | | Number of
Shares | | | |
| SECURITIES LENDING COLLATERAL**–7.94% | | | | | |
| Investment Companies Mellon GSL DBT II Collateral Fund | | 27,924,434 | | 27,924,434 | |
| Total Securities Lending Collateral
(cost $27,924,434) | | | | 27,924,434 | |
| | | | | | | | |
TOTAL VALUE OF SECURITIES–106.50% (cost $381,424,308) | | 374,378,239 | © |
OBLIGATION TO RETURN SECURITIES LENDING COLLATERAL**–(7.94%) | | (27,924,434 | ) |
RECEIVABLES AND OTHER ASSETS NET OF LIABILITIES–1.44% | | 5,075,149 | |
NET ASSETS APPLICABLE TO 59,204,416 SHARES OUTSTANDING–100.00% | | $ | 351,528,954 | |
NET ASSET VALUE–DELAWARE VIP HIGH YIELD SERIES STANDARD CLASS ($132,666,864 / 22,308,096 Shares) | | $ | 5.95 | |
NET ASSET VALUE–DELAWARE VIP HIGH YIELD SERIES SERVICE CLASS ($218,862,090 / 36,896,320 Shares) | | $ | 5.93 | |
COMPONENTS OF NET ASSETS AT DECEMBER 31, 2007: | | | |
Shares of beneficial interest (unlimited authorization–no par) | | $ | 381,141,915 | |
Undistributed net investment income | | 26,466,659 | |
Accumulated net realized loss on investments | | (49,033,551 | ) |
Net unrealized depreciation of investments | | (7,046,069 | ) |
Total net assets | | $ | 351,528,954 | |
# | Security exempt from registration under Rule 144A of the Securities Act of 1933, as amended. At December 31, 2007, the aggregate amount of Rule 144A securities was $53,121,026, which represented 15.11% of the Series’ net assets. See Note 10 in “Notes to Financial Statements.” |
p | Restricted Security. Investment in a security not registered under the Securities Act of 1933, as amended. This security has certain restrictions on resale which may limit its liquidity. At December 31, 2007, the aggregate amount of the restricted securities was $1,188,720, or 0.34% of the Series’ net assets. See Note 10 in “Notes to Financial Statements.” |
† | Non-income producing security for the year ended December 31, 2007. |
‡ | Non-income producing security. Security is currently in default. |
· | Variable rate security. The rate shown is the rate as of December 31, 2007. |
o | Step coupon bond. Indicates security that has a zero coupon that remains in effect until a predetermined date at which time the stated interest rate becomes effective. |
= | Security is being fair valued in accordance with the Series’ fair valuation policy. At December 31, 2007, the aggregate amount of fair valued securities was $1,188,720, which represented 0.34% of the Series’ net assets. See Note 1 in “Notes to Financial Statements.” |
@ | Illiquid security. At December 31, 2007, the aggregate amount of illiquid securities was $1,188,720, which represented 0.34% of the Series’ net assets. See Note 10 in “Notes to Financial Statements.” |
« | Senior Secured Loans generally pay interest at rates which are periodically redetermined by reference to a base lending rate plus a premium. These base lending rates are generally (i) the prime rate offered by one or more United States banks, (ii) the lending rate offered by one or more European banks such as the London Inter-Bank Offered Rate (LIBOR) and (iii) the certificate of deposit rate. Senior Secured Loans may be subject to restrictions on resale. |
¹ | The rate shown is the effective yield at the time of purchase. |
* | Fully or partially on loan. |
** | See Note 9 in “Notes to Financial Statements.” |
© | Includes $27,254,493 of securities loaned. |
Summary of Abbreviations:
PIK – Pay-in-kind
REIT – Real Estate Investment Trust
See accompanying notes
8
Delaware VIP Trust – Delaware VIP High Yield Series
Statement of Operations
Year Ended December 31, 2007
INVESTMENT INCOME: | | | |
Interest | | $ | 28,414,626 | |
Securities lending income | | 198,105 | |
Dividends | | 126,183 | |
Foreign tax withheld | | (1,053 | ) |
| | 28,737,861 | |
| | | |
EXPENSES: | | | |
Management fees | | 2,222,197 | |
Distribution expenses – Service Class | | 651,900 | |
Accounting and administration expenses | | 136,733 | |
Reports and statements to shareholders | | 53,327 | |
Legal fees | | 44,149 | |
Dividend disbursing and transfer agent fees and expenses | | 41,944 | |
Audit and tax | | 27,747 | |
Trustees’ fees | | 16,032 | |
Insurance fees | | 9,387 | |
Custodian fees | | 7,200 | |
Consulting fees | | 6,048 | |
Pricing fees | | 5,368 | |
Trustees’ expenses | | 2,064 | |
Dues and services | | 1,395 | |
Taxes (other than taxes on income) | | 751 | |
| | 3,226,242 | |
Less expenses absorbed or waived | | (22,338 | ) |
Less waiver of distribution expenses – Service Class | | (108,650 | ) |
Less expense paid indirectly | | (4,549 | ) |
Total operating expenses | | 3,090,705 | |
| | | |
NET INVESTMENT INCOME | | 25,647,156 | |
| | | |
NET REALIZED AND UNREALIZED LOSS ON INVESTMENTS: | | | |
Net realized loss on: | | | |
Investments | | (3,721,079 | ) |
Swap contracts | | (87,163 | ) |
Net realized loss | | (3,808,242 | ) |
Net change in unrealized appreciation/depreciation of investments | | (14,605,416 | ) |
| | | |
NET REALIZED AND UNREALIZED LOSS ON INVESTMENTS | | (18,413,658 | ) |
| | | |
NET INCREASE IN NET ASSETS RESULTING FROM OPERATIONS | | $ | 7,233,498 | |
See accompanying notes
Delaware VIP Trust – Delaware VIP High Yield Series
Statements of Changes in Net Assets
| | Year Ended | |
| | 12/31/07 | | 12/31/06 | |
INCREASE (DECREASE) IN NET ASSETS FROM OPERATIONS: | | | | | |
Net investment income | | $ | 25,647,156 | | $ | 20,738,501 | |
Net realized gain (loss) on investments | | (3,808,242 | ) | 342,427 | |
Net change in unrealized appreciation/depreciation of investments | | (14,605,416 | ) | 9,806,997 | |
Net increase in net assets resulting from operations | | 7,233,498 | | 30,887,925 | |
| | | | | |
DIVIDENDS AND DISTRIBUTIONS TO SHAREHOLDERS FROM: | | | | | |
Net investment income: | | | | | |
Standard Class | | (7,721,397 | ) | (5,223,811 | ) |
Service Class | | (13,348,959 | ) | (10,890,450 | ) |
| | (21,070,356 | ) | (16,114,261 | ) |
| | | | | |
CAPITAL SHARE TRANSACTIONS: | | | | | |
Proceeds from shares sold: | | | | | |
Standard Class | | 65,104,401 | | 65,283,017 | |
Service Class | | 74,660,812 | | 64,586,970 | |
Net asset value of shares issued upon reinvestment of dividends and distributions: | | | | | |
Standard Class | | 7,721,397 | | 5,223,811 | |
Service Class | | 13,348,959 | | 10,890,450 | |
| | 160,835,569 | | 145,984,248 | |
Cost of shares repurchased: | | | | | |
Standard Class | | (40,639,801 | ) | (40,279,258 | ) |
Service Class | | (61,174,025 | ) | (46,658,029 | ) |
| | (101,813,826 | ) | (86,937,287 | ) |
Increase in net assets derived from capital share transactions | | 59,021,743 | | 59,046,961 | |
| | | | | |
NET INCREASE IN NET ASSETS | | 45,184,885 | | 73,820,625 | |
| | | | | |
NET ASSETS: | | | | | |
Beginning of year | | 306,344,069 | | 232,523,444 | |
End of year (including undistributed net investment income of $26,466,659 and $21,003,046, respectively) | | $ | 351,528,954 | | $ | 306,344,069 | |
See accompanying notes
9
Delaware VIP Trust – Delaware VIP High Yield Series
Financial Highlights
Selected data for each share of the Series outstanding throughout each period were as follows:
| | Delaware VIP High Yield Series Standard Class
Year Ended | |
| | 12/31/07 | | 12/31/06 | | 12/31/05 | | 12/31/04 | | 12/31/03 | |
| | | | | | | | | | | |
Net asset value, beginning of period | | $ | 6.200 | | $ | 5.910 | | $ | 6.110 | | $ | 5.690 | | $ | 4.790 | |
| | | | | | | | | | | |
Income (loss) from investment operations: | | | | | | | | | | | |
Net investment income(1) | | 0.464 | | 0.473 | | 0.434 | | 0.437 | | 0.489 | |
Net realized and unrealized gain (loss) on investments and foreign currencies | | (0.290 | ) | 0.226 | | (0.227 | ) | 0.332 | | 0.804 | |
Total from investment operations | | 0.174 | | 0.699 | | 0.207 | | 0.769 | | 1.293 | |
| | | | | | | | | | | |
Less dividends and distributions from: | | | | | | | | | | | |
Net investment income | | (0.424 | ) | (0.409 | ) | (0.407 | ) | (0.349 | ) | (0.393 | ) |
Total dividends and distributions | | (0.424 | ) | (0.409 | ) | (0.407 | ) | (0.349 | ) | (0.393 | ) |
| | | | | | | | | | | |
Net asset value, end of period | | $ | 5.950 | | $ | 6.200 | | $ | 5.910 | | $ | 6.110 | | $ | 5.690 | |
| | | | | | | | | | | |
Total return(2) | | 2.79 | % | 12.45 | % | 3.59 | % | 14.25 | % | 28.74 | % |
| | | | | | | | | | | |
Ratios and supplemental data: | | | | | | | | | | | |
Net assets, end of period (000 omitted) | | $ | 132,667 | | $ | 105,576 | | $ | 70,139 | | $ | 65,418 | | $ | 71,061 | |
Ratio of expenses to average net assets | | 0.75 | % | 0.78 | % | 0.78 | % | 0.75 | % | 0.77 | % |
Ratio of expenses to average net assets prior to expense limitation and expenses paid indirectly | | 0.75 | % | 0.78 | % | 0.78 | % | 0.75 | % | 0.77 | % |
Ratio of net investment income to average net assets | | 7.66 | % | 8.01 | % | 7.39 | % | 7.66 | % | 9.33 | % |
Ratio of net investment income to average net assets prior to expense limitation and expenses paid indirectly | | 7.66 | % | 8.01 | % | 7.39 | % | 7.66 | % | 9.33 | % |
Portfolio turnover | | 143 | % | 132 | % | 162 | % | 429 | % | 716 | % |
(1) The average shares outstanding method has been applied for per share information.
(2) Total investment return is based on the change in net asset value of a share during the period and assumes reinvestment of dividends and distributions at net asset value. Total investment return reflects a waiver by the manager, as applicable. Performance would have been lower had the waiver not been in effect.
See accompanying notes
10
Delaware VIP High Yield Series
Financial Highlights (continued)
Selected data for each share of the Series outstanding throughout each period were as follows:
| | Delaware VIP High Yield Series Service Class | |
| | Year Ended | |
| | 12/31/07 | | 12/31/06 | | 12/31/05 | | 12/31/04 | | 12/31/03 | |
| | | | | | | | | | | |
Net asset value, beginning of period | | $ | 6.190 | | $ | 5.900 | | $ | 6.100 | | $ | 5.680 | | $ | 4.780 | |
| | | | | | | | | | | |
Income (loss) from investment operations: | | | | | | | | | | | |
Net investment income(1) | | 0.448 | | 0.458 | | 0.419 | | 0.423 | | 0.477 | |
Net realized and unrealized gain (loss) on investments and foreign currencies | | (0.299 | ) | 0.226 | | (0.226 | ) | 0.334 | | 0.809 | |
| | | | | | | | | | | |
Total from investment operations | | 0.149 | | 0.684 | | 0.193 | | 0.757 | | 1.286 | |
| | | | | | | | | | | |
Less dividends and distributions from: | | | | | | | | | | | |
Net investment income | | (0.409 | ) | (0.394 | ) | (0.393 | ) | (0.337 | ) | (0.386 | ) |
Total dividends and distributions | | (0.409 | ) | (0.394 | ) | (0.393 | ) | (0.337 | ) | (0.386 | ) |
| | | | | | | | | | | |
Net asset value, end of period | | $ | 5.930 | | $ | 6.190 | | $ | 5.900 | | $ | 6.100 | | $ | 5.680 | |
| | | | | | | | | | | |
Total return(2) | | 2.55 | % | 12.19 | % | 3.34 | % | 14.02 | % | 28.61 | % |
| | | | | | | | | | | |
Ratios and supplemental data: | | | | | | | | | | | |
Net assets, end of period (000 omitted) | | $ | 218,862 | | $ | 200,768 | | $ | 162,384 | | $ | 130,983 | | $ | 68,295 | |
Ratio of expenses to average net assets | | 1.00 | % | 1.03 | % | 1.03 | % | 1.00 | % | 0.99 | % |
Ratio of expenses to average net assets prior to expense limitation and expenses paid indirectly | | 1.05 | % | 1.08 | % | 1.08 | % | 1.05 | % | 1.02 | % |
Ratio of net investment income to average net assets | | 7.41 | % | 7.76 | % | 7.14 | % | 7.41 | % | 9.11 | % |
Ratio of net investment income to average net assets prior to expense limitation and expenses paid indirectly | | 7.36 | % | 7.71 | % | 7.09 | % | 7.36 | % | 9.08 | % |
Portfolio turnover | | 143 | % | 132 | % | 162 | % | 429 | % | 716 | % |
(1)The average shares outstanding method has been applied for per share information.
(2)Total investment return is based on the change in net asset value of a share during the period and assumes reinvestment of dividends and distributions at net asset value. Total investment return reflects a waiver by the manager and distributor, as applicable. Performance would have been lower had the waiver not been in effect.
See accompanying notes
11
Delaware VIP Trust — Delaware VIP High Yield Series
Notes to Financial Statements
December 31, 2007
Delaware VIP Trust (Trust) is organized as a Delaware statutory trust and offers 14 series: Delaware VIP Balanced Series, Delaware VIP Capital Reserves Series, Delaware VIP Cash Reserve Series, Delaware VIP Diversified Income Series, Delaware VIP Emerging Markets Series, Delaware VIP Growth Opportunities Series, Delaware VIP High Yield Series, Delaware VIP International Value Equity Series, Delaware VIP REIT Series, Delaware VIP Select Growth Series, Delaware VIP Small Cap Value Series, Delaware VIP Trend Series, Delaware VIP U.S. Growth Series and Delaware VIP Value Series. These financial statements and the related notes pertain to Delaware VIP High Yield Series (Series). The Trust is an open-end investment company. The Series is considered diversified under the Investment Company Act of 1940, as amended, and offers Standard Class and Service Class shares. The Standard Class shares do not carry a 12b-1 fee and the Service Class shares carry a 12b-1 fee. The shares of the Series are sold only to separate accounts of life insurance companies.
The investment objective of the Series is to seek total return and, as a secondary objective, high current income.
1. Significant Accounting Policies
The following accounting policies are in accordance with U.S. generally accepted accounting principles and are consistently followed by the Series.
Security Valuation—Equity securities, except those traded on the Nasdaq Stock Market, Inc. (Nasdaq), are valued at the last quoted sales price as of the time of the regular close of the New York Stock Exchange (NYSE) on the valuation date. Securities traded on the Nasdaq are valued in accordance with the Nasdaq Official Closing Price, which may not be the last sales price. If on a particular day an equity security does not trade, then the mean between the bid and asked prices will be used. Other long-term debt securities, credit default swap contracts and interest rate swap contracts are valued by an independent pricing service and such prices are believed to reflect the fair value of such securities. Short-term debt securities having less than 60 days to maturity are valued at amortized cost, which approximates market value. Securities lending collateral, which is invested in a collective investment vehicle is valued at unit value per share. Generally, index swap contracts and other securities and assets for which market quotations are not readily available are valued at fair value as determined in good faith under the direction of the Series’ Board of Trustees. In determining whether market quotations are readily available or fair valuation will be used, various factors will be taken into consideration, such as market closures, or with respect to foreign securities, aftermarket trading or significant events after local market trading (e.g., government actions or pronouncements, trading volume or volatility on markets, exchanges among dealers, or news events).
In September 2006, the Financial Accounting Standards Board (FASB) issued FASB Statement No. 157 “Fair Value Measurements” (Statement 157). Statement 157 establishes a framework for measuring fair value in U.S. generally accepted accounting principles, clarifies the definition of fair value within that framework, and expands disclosures about the use of fair value measurements. Statement 157 is intended to increase consistency and comparability among fair value estimates used in financial reporting. Statement 157 is effective for fiscal years beginning after November 15, 2007. Management does not expect the adoption of Statement 157 to have a material impact on the amounts reported in the financial statements.
Federal Income Taxes—The Series intends to continue to qualify for federal income tax purposes as a regulated investment company under Subchapter M of the Internal Revenue Code of 1986, as amended, and make the requisite distributions to shareholders. Accordingly, no provision for federal income taxes has been made in the financial statements.
Effective June 29, 2007, the Series adopted FASB Interpretation No. 48 “Accounting for Uncertainty in Income Taxes” (FIN 48). FIN 48 provides guidance for how uncertain tax positions should be recognized, measured, presented and disclosed in the financial statements. FIN 48 requires the evaluation of tax positions taken or expected to be taken in the course of preparing the Series’ tax returns to determine whether the tax positions are “more-likely-than-not” of being sustained by the applicable tax authority. Tax positions not deemed to meet the more-likely-than-not threshold are recorded as a tax benefit or expense in the current year. The adoption of FIN 48 did not result in the recording of any tax benefit or expense in the current period.
Class Accounting—Investment income, common expenses and realized and unrealized gain (loss) on investments are allocated to the classes of the Series on the basis of daily net assets of each class. Distribution expenses relating to a specific class are charged directly to that class.
Repurchase Agreements—The Series may invest in a pooled cash account along with members of the Delaware Investments® Family of Funds pursuant to an exemptive order issued by the Securities and Exchange Commission. The aggregate daily balance of the pooled cash account is invested in repurchase agreements secured by obligations of the U.S. government. The respective collateral is held by the Series’ custodian bank until the maturity of the respective repurchase agreements. Each repurchase agreement is at least 102% collateralized. However, in the event of default or bankruptcy by the counterparty to the agreement, realization of the collateral may be subject to legal proceedings. At December 31, 2007, the Series held no investments in repurchase agreements.
Use of Estimates—The preparation of financial statements in conformity with U.S. generally accepted accounting principles requires management to make estimates and assumptions that affect the reported amounts of assets and liabilities at the date of the financial statements and the reported amounts of revenues and expenses during the reporting period. Actual results could differ from those estimates.
Other—Expenses directly attributable to the Series are charged directly to the Series. Other expenses common to various funds within the Delaware Investments® Family of Funds are generally allocated amongst such funds on the basis of average net assets. Management fees and some other expenses are paid monthly. Security transactions are recorded on the date the securities are purchased or sold (trade date) for financial reporting purposes. Costs used in calculating realized gains and losses on the sale of investment securities are those of the specific securities sold. Dividend income is recorded on the ex-dividend date and interest income is recorded on the accrual basis. Discounts and premiums on non-convertible bonds are amortized to interest income over the lives of the respective securities. Realized gains (losses) on paydowns of mortgage- and asset-backed securities are classified as interest income.
The Series declares and pays dividends from net investment income and distributions from net realized gain on investments, if any, following the close of the fiscal year.
The Series may receive earnings credits from its custodian when positive cash balances are maintained, which are used to offset custody fees. The expense paid under this arrangement is included in custodian fees on the Statement of Operations with the corresponding expense offset shown as “expense paid indirectly.”
12
Delaware VIP High Yield Series
Notes to Financial Statements (continued)
2. Investment Management, Administration Agreements and Other Transactions with Affiliates
In accordance with the terms of its investment management agreement, the Series pays Delaware Management Company (DMC), a series of Delaware Management Business Trust and the investment manager, an annual fee which is calculated daily at the rate of 0.65% on the first $500 million of average daily net assets of the Series, 0.60% on the next $500 million, 0.55% on the next $1.5 billion, and 0.50% on average daily net assets in excess of $2.5 billion.
DMC has contractually agreed to waive that portion, if any, of its management fee and reimburse the Series to the extent necessary to ensure that total annual operating expenses, exclusive of taxes, interest, brokerage fees, inverse floater program expenses, 12b-1 plan expenses, certain insurance costs and non-routine expenses or costs including, but not limited to, those relating to reorganizations, litigation, conducting shareholder meetings, and liquidations, do not exceed 0.74% of average daily net assets of the Series from May 1, 2007 through April 30, 2008. Prior to May 1, 2007, the expense limitation was 0.78% of average daily net assets.
Effective October 1, 2007, Delaware Service Company, Inc. (DSC), an affiliate of DMC, provides fund accounting and financial administration oversight services to the Series. For these services, the Series pays DSC fees based on the aggregate daily net assets of the Delaware Investments® Family of Funds at the following annual rate: 0.0050% of the first $30 billion; 0.0045% of the next $10 billion; 0.0040% of the next $10 billion; and 0.0025% of aggregate average daily net assets in excess of $50 billion. The fees payable to DSC under the service agreement described above are allocated among all funds in the Delaware Investments® Family of Funds on a relative net asset value basis. Prior to October 1, 2007, DSC provided fund accounting and administrative services to the Series and received a fee at an annual rate of 0.04% of average daily net assets. For the year ended December 31, 2007, the Series was charged $105,249 for these services.
DSC also provides dividend disbursing and transfer agency services. The Series pays DSC a monthly fee based on the number of shareholder accounts for dividend disbursing and transfer agent services.
Pursuant to a distribution agreement and distribution plan, the Series pays Delaware Distributors, L.P. (DDLP), the distributor and an affiliate of DMC, an annual distribution and service fee not to exceed 0.30% of the average daily net assets of the Service Class shares. DDLP has contracted to waive distribution and service fees through April 30, 2008 in order to prevent distribution and service fees of the Service Class shares from exceeding 0.25% of average daily net assets. Standard Class shares pay no distribution and service expenses.
At December 31, 2007, the Series had liabilities payable to affiliates as follows:
Investment
Management
Fee Payable to
DMC | | Dividend Disbursing,
Transfer Agent,
Fees and Other Expenses
Payable to DSC | | Distribution
Fees Payable
to DDLP | | Other
Expenses
Payable
to DMC
and Affiliates* | |
$ | 185,269 | | $ | 6,229 | | $ | 46,508 | | $ | 23,989 | |
| | | | | | | | | | | |
*DMC, as part of its administrative services, pays operating expenses on behalf of the Series and is reimbursed on a periodic basis. Such expenses include items such as printing of shareholder reports, fees for audit, legal and tax services, custodian fees and trustees’ fees.
As provided in the investment management agreement, the Series bears the cost of certain legal and tax services, including internal legal and tax services provided to the Series by DMC and/or its affiliates’ employees. For the year ended December 31, 2007, the Series was charged $18,565 for internal legal and tax services provided by DMC and/or its affiliates’ employees.
Trustees’ fees include expenses accrued by the Series for each Trustee’s retainer and per meeting fees. Certain officers of DMC, DSC and DDLP are officers and/or Trustees of the Trust. These officers and Trustees are paid no compensation by the Series.
3. Investments
For the year ended December 31, 2007, the Series made purchases and sales of investment securities other than short-term investments as follows:
Purchases | | $ | 463,678,254 | |
Sales | | 440,610,878 | |
At December 31, 2007, the cost of investments for federal income tax purposes and unrealized appreciation (depreciation) for the Series were as follows:
Cost of
Investments | | Aggregate
Unrealized
Appreciation | | Aggregate
Unrealized
Depreciation | | Net Unrealized
Depreciation | |
$ | 381,987,546 | | $ | 2,099,301 | | $ | (9,708,608 | ) | $ | (7,609,307 | ) |
| | | | | | | | | | | |
13
Delaware VIP High Yield Series
Notes to Financial Statements (continued)
4. Dividend and Distribution Information
Income and long-term capital gain distributions are determined in accordance with federal income tax regulations, which may differ from U.S. generally accepted accounting principles. Additionally, net short-term gains on sales of investment securities are treated as ordinary income for federal income tax purposes. The tax character of dividends and distributions paid during the years ended December 31, 2007 and 2006 was as follows:
| | Year
Ended
12/31/07 | | Year
Ended
12/31/06 | |
Ordinary income | | $ | 21,070,356 | | $ | 16,114,261 | |
| | | | | | | |
5. Components of Net Assets on a Tax Basis
As of December 31, 2007, the components of net assets on a tax basis were as follows:
Shares of beneficial interest | | $ | 381,141,915 | |
Undistributed ordinary income | | 26,466,659 | |
Capital loss carryforwards | | (43,176,348 | ) |
Post-October losses | | (5,293,965 | ) |
Unrealized depreciation of investments | | (7,609,307 | ) |
Net assets | | $ | 351,528,954 | |
The differences between book basis and tax basis components of net assets are primarily attributable to tax deferral of losses on wash sales and tax treatment of market discount and premium on debt instruments.
Post-October losses represent losses realized on investment transactions from November 1, 2007 through December 31, 2007 that, in accordance with federal income tax regulations, the Series has elected to defer and treat as having arisen in the following fiscal year.
For financial reporting purposes, capital accounts are adjusted to reflect the tax character of permanent book/tax differences. Reclassifications are primarily due to tax treatment of paydown gain (loss) on mortgage- and asset-backed securities, credit default swap contracts and market discount and premium on certain debt instruments. Results of operations and net assets were not affected by these reclassifications. For the year ended December 31, 2007, the Series recorded the following reclassifications:
Undistributed
Net
Investment Income | | Accumulated
Net Realized
Loss | |
$ | 886,813 | | $ | (886,813 | ) |
| | | | | |
For federal income tax purposes, capital loss carryforwards may be carried forward and applied against future capital gains. Capital loss carryforwards remaining at December 31, 2007 will expire as follows: $19,963,415 expires in 2008; $18,082,790 expires in 2009; $4,569,135 expires in 2010; and $561,008 expires in 2015.
6. Capital Shares
Transactions in capital shares were as follows:
| | Year
Ended
12/31/07 | | Year
Ended
12/31/06 | |
Shares sold: | | | | | |
Standard Class | | 10,759,290 | | 11,147,480 | |
Service Class | | 12,343,224 | | 10,971,704 | |
Shares issued upon reinvestment of dividends and distributions: | | | | | |
Standard Class | | 1,295,537 | | 918,069 | |
Service Class | | 2,239,758 | | 1,917,333 | |
| | 26,637,809 | | 24,954,586 | |
Shares repurchased: | | | | | |
Standard Class | | (6,771,726 | ) | (6,900,107 | ) |
Service Class | | (10,138,883 | ) | (7,953,893 | ) |
| | (16,910,609 | ) | (14,854,000 | ) |
Net increase | | 9,727,200 | | 10,100,586 | |
14
Delaware VIP High Yield Series
Notes to Financial Statements (continued)
7. Line of Credit
The Series, along with certain other funds in the Delaware Investments® Family of Funds (Participants), participates in a $225,000,000 revolving line of credit facility to be used for temporary or emergency purposes as an additional source of liquidity to fund redemptions of investor shares. The Participants are charged an annual commitment fee, which is allocated across the Participants on the basis of each Participant’s allocation of the entire facility. The Participants may borrow up to a maximum of one third of their net assets under the agreement. The Series had no amounts outstanding as of December 31, 2007, or at any time during the year then ended.
8. Swap Contracts
The Series may enter into interest rate swap contracts, index swap contracts and credit default swap (CDS) contracts in accordance with its investment objectives. The Series may use interest rate swaps to adjust the Series’ sensitivity to interest rates or to hedge against changes in interest rates. Index swaps may be used to gain exposure to markets that the Series invests in, such as the corporate bond market. The Series may also use index swaps as a substitute for future or options contracts if such contracts are not directly available to the Series on favorable terms. The Series may enter into CDS contracts in order to hedge against a credit event, to enhance total return or to gain exposure to certain securities or markets.
An interest rate swap involves payments received by the Series from another party based on a variable or floating interest rate, in return for making payments based on a fixed interest rate. An interest rate swap can also work in reverse with the Series receiving payments based on a fixed interest rate and making payments based on a variable or floating interest rate. Interest rate swaps may be used to adjust the Series’ sensitivity to interest rates or to hedge against changes in interest rates. Periodic payments on such contracts are accrued daily and recorded as unrealized appreciation/depreciation on swap contracts. Upon periodic payment/receipt or termination of the contract, such amounts are recorded as realized gains or losses on swap contracts.
Index swaps involve commitments to pay interest in exchange for a market-linked return based on a notional amount. To the extent the total return of the security, instrument or basket of instruments underlying the transaction exceeds the offsetting interest obligation, the Series will receive a payment from the counterparty. To the extent the total return of the security, instrument or basket of instruments underlying the transaction falls short of the offsetting interest obligation, the Series will make a payment to the counterparty. The change in value of swap contracts outstanding, if any, is recorded as unrealized appreciation or depreciation daily. A realized gain or loss is recorded on maturity or termination of the swap contract.
A CDS contract is a risk-transfer instrument through which one party (purchaser of protection) transfers to another party (seller of protection) the financial risk of a credit event, as it relates to a particular reference security or basket of securities (such as an index). In exchange for the protection offered by the seller of protection, the purchaser of protection agrees to pay the seller of protection a periodic amount at a stated rate that is applied to the notional amount of the CDS contract. In addition, an upfront payment may be made or received by the Series in connection with an unwinding or assignment of a CDS contract. Upon the occurrence of a credit event, the seller of protection would pay the par (or other agreed-upon) value of the referenced security (or basket of securities) to the counterparty.
During the year ended December 31, 2007, the Series entered into CDS contracts as a purchaser and seller of protection. Periodic payments (receipts) on such contracts are accrued daily and recorded as unrealized losses (gains) on swap contracts. Upon payment (receipt), such amounts are recorded as realized losses (gains) on swap contracts. Upfront payments made or received in connection with CDS contracts are amortized over the expected life of the CDS contracts as unrealized losses (gains) on swap contracts. The change in value of CDS contracts is recorded as unrealized appreciation or depreciation daily. A realized gain or loss is recorded upon a credit event (as defined in the CDS agreement) or the maturity or termination of the agreement.
Credit default swaps may involve greater risks than if the Series had invested in the referenced obligation directly. Credit default swaps are subject to general market risk, liquidity risk, counterparty risk and credit risk. If the Series enters into a CDS contract as a purchaser of protection and no credit event occurs, its exposure is limited to the periodic payments previously made to the counterparty.
Because there is no organized market for swap contracts, the value of open swaps may differ from that which would be realized in the event the Series terminated its position in the agreement. Risks of entering into these agreements include the potential inability of the counterparty to meet the terms of the contracts. This type of risk is generally limited to the amount of favorable movements in the value of the underlying security, instrument, or basket of instruments, if any, at the day of default. Risks also arise from potential losses from adverse market movements and such losses could exceed the unrealized amounts shown above. There were no swap contracts outstanding at December 31, 2007.
15
Delaware VIP High Yield Series
Notes to Financial Statements (continued)
9. Securities Lending
The Series, along with other funds in the Delaware Investments® Family of Funds, may lend its securities pursuant to a security lending agreement (Lending Agreement) with Mellon Bank, N.A. (Mellon). With respect to each loan, if the aggregate market value of the collateral held on any business day is less than the aggregate market value of the securities which are the subject of such loan, the borrower will be notified to provide additional collateral not less than the applicable collateral requirements. Cash collateral received is invested in a collective investment vehicle (Collective Trust) established by Mellon for the purpose of investment on behalf of clients participating in its securities lending programs. The Collective Trust invests in fixed income securities, with a weighted average maturity not to exceed 90 days, rated in one of the top two tiers by Standard & Poor’s Ratings Group or Moody’s Investors Service, Inc. or repurchase agreements collateralized by such securities. However, in the event of default or bankruptcy by the lending agent, realization and/or retention of the collateral may be subject to legal proceedings. In the event the borrower fails to return loaned securities and the collateral received is insufficient to cover the value of the loaned securities and provided such collateral shortfall is not the result of investment losses, the lending agent has agreed to pay the amount of the shortfall to the Series, or at the discretion of the lending agent, replace the loaned securities. The Series continues to record dividends or interest, as applicable, on the securities loaned and is subject to change in value of the securities loaned that may occur during the term of the loan. The Series has the right under the Lending Agreement to recover the securities from the borrower on demand. With respect to security loans collateralized by U.S. Treasury obligations, the Series receives a fee from the securities lending agent. With respect to security loans collateralized by cash collateral, the earnings from the collateral investments are shared among the Series, the security lending agent and the borrower. The Series records securities lending income net of allocations to the security lending agent and the borrower.
At December 31, 2007, the market value of the securities on loan was $27,254,493, for which cash collateral was received and invested in accordance with the Lending Agreement. Such investments are presented on the Statement of Net Assets under the caption “Securities Lending Collateral.”
10. Credit and Market Risk
The Series invests in high yield fixed income securities, which carry ratings of BB or lower by Standard & Poor’s Ratings Group and/or Ba or lower by Moody’s Investors Service, Inc. Investments in these higher yielding securities are generally accompanied by a greater degree of credit risk than higher rated securities. Additionally, lower rated securities may be more susceptible to adverse economic and competitive industry conditions than investment-grade securities.
The Series may invest up to 15% of its net assets in illiquid securities, which may include securities with contractual restrictions on resale, securities exempt from registration under Rule 144A of the Securities Act of 1933, as amended, and other securities which may not be readily marketable. The relative illiquidity of these securities may impair the Series from disposing of them in a timely manner and at a fair price when it is necessary or desirable to do so. While maintaining oversight, the Series’ Board of Trustees has delegated to DMC the day-to-day functions of determining whether individual securities are liquid for purposes of the Series’ limitation on investments in illiquid assets. Rule 144A and illiquid securities have been identified on the Statement of Net Assets.
11. Contractual Obligations
The Series enters into contracts in the normal course of business that contain a variety of indemnifications. The Series’ maximum exposure under these arrangements is unknown. However, the Series has not had prior claims or losses pursuant to these contracts. Management has reviewed the Series’ existing contracts and expects the risk of loss to be remote.
12. Tax Information (Unaudited)
For the fiscal year ended December 31, 2007, the Series designates dividends and distributions paid during the year as follows:
(A)
Long-Term}
Capital Gain
Distributions
(Tax Basis) | | (B)
Ordinary
Income
Distributions
(Tax Basis) | | Total
Distributions
(Tax Basis) | |
— | | 100 | % | 100 | % |
(A) and (B) are based on a percentage of the Series’ total distributions.
13. Change in Custodian
On August 9, 2007, Mellon, One Mellon Center, Pittsburgh, PA 15258 became the Series’ custodian.
16
Delaware VIP Trust — Delaware VIP High Yield Series
Report of Independent Registered Public Accounting Firm
To the Shareholders and Board of Trustees
Delaware VIP Trust–Delaware VIP High Yield Series
We have audited the accompanying statement of net assets of the Delaware VIP High Yield Series (one of the series constituting Delaware VIP Trust) (the “Series”) as of December 31, 2007, and the related statement of operations for the year then ended, the statements of changes in net assets for each of the two years in the period then ended, and the financial highlights for each of the five years in the period then ended. These financial statements and financial highlights are the responsibility of the Series’ management. Our responsibility is to express an opinion on these financial statements and financial highlights based on our audits.
We conducted our audits in accordance with the standards of the Public Company Accounting Oversight Board (United States). Those standards require that we plan and perform the audit to obtain reasonable assurance about whether the financial statements and financial highlights are free of material misstatement. We were not engaged to perform an audit of the Series’ internal control over financial reporting. Our audits included consideration of internal control over financial reporting as a basis for designing audit procedures that are appropriate in the circumstances, but not for the purpose of expressing an opinion on the effectiveness of the Series’ internal control over financial reporting. Accordingly, we express no such opinion. An audit also includes examining, on a test basis, evidence supporting the amounts and disclosures in the financial statements and financial highlights, assessing the accounting principles used and significant estimates made by management, and evaluating the overall financial statement presentation. Our procedures included confirmation of securities owned as of December 31, 2007, by correspondence with the custodian and brokers or by other appropriate auditing procedures where replies from brokers were not received. We believe that our audits provide a reasonable basis for our opinion.
In our opinion, the financial statements and financial highlights referred to above present fairly, in all material respects, the financial position of the Delaware VIP High Yield Series of Delaware VIP Trust at December 31, 2007, the results of its operations for the year then ended, the changes in its net assets for each of the two years in the period then ended, and its financial highlights for each of the five years in the period then ended, in conformity with U.S. generally accepted accounting principles.

Philadelphia, Pennsylvania
February 14, 2008
The Series files its complete schedule of portfolio holdings with the Securities and Exchange Commission (Commission) for the first and third quarters of each fiscal year on Form N-Q. The Series’ Forms N-Q, as well as a description of the policies and procedures that the Series uses to determine how to vote proxies (if any) relating to portfolio securities is available without charge (i) upon request, by calling 800-523-1918; and (ii) on the Commission’s website at http://www.sec.gov. In addition, a description of the policies and procedures that the Series uses to determine how to vote proxies (if any) relating to portfolio securities is available without charge on the Delaware Investments® Funds’ website at http://www.delawareinvestments.com. The Series’ Forms N-Q may be reviewed and copied at the Commission’s Public Reference Room in Washington, DC; information on the operation of the Public Reference Room may be obtained by calling 800 SEC-0330.
Information (if any) regarding how the Series voted proxies relating to portfolio securities during the most recently disclosed 12-month period ended December 31 is available without charge (i) through the Delaware Investments® Funds’ website at http://www.delawareinvestments.com; and (ii) on the Commission’s website at http://www.sec.gov.
17
Delaware Investments® Family of Funds
BOARD OF TRUSTEES/DIRECTORS AND OFFICERS ADDENDUM
A mutual fund is governed by a Board of Trustees/Directors (“Trustees”), which has oversight responsibility for the management of a fund’s business affairs. Trustees establish procedures and oversee and review the performance of the investment manager, the distributor, and others who perform services for the fund. The independent fund trustees, in particular, are advocates for shareholder interests. Each trustee has served in that capacity since he or she was elected to or appointed to the Board of Trustees, and will continue to serve until his or her retirement or the election of a new trustee in his or her place. The following is a list of the Trustees and Officers with certain background and related information.
Name,
Address,
and Birth Date | | Position(s)
Held with
Fund(s) | | Length of Time
Served | | Principal
Occupation(s)
During
Past 5 Years | | Number of
Portfolios in Fund
Complex Overseen
by Trustee
or Officer | | Other
Directorships
Held by
Trustee
or Officer | |
INTERESTED TRUSTEES | | | | | | | | | | | |
| | | | | | | | | | | |
Patrick P. Coyne(1)
2005 Market Street
Philadelphia, PA
19103
April 1963 | | Chairman, President, Chief Executive Officer, and Trustee | | Chairman and Trustee since August 16, 2006
President and Chief Executive Officer since August 1, 2006 | | Patrick P. Coyne has served in various executive capacities at different times at Delaware Investments.(2) | | 84 | | Director —
Kaydon Corp.
Board of Governors Member — Investment Company Institute (2007 — present)
Member of Investment Committee — Cradle of Liberty Council, BSA (November 2007 — present)
Finance Committee Member — St. John Vianney Roman Catholic Church (2007 — present) | |
| | | | | | | | | | | |
INDEPENDENT TRUSTEES | | | | | | | | | | | |
| | | | | | | | | | | |
Thomas L. Bennett
2005 Market Street
Philadelphia, PA
19103
October 1947 | | Trustee | | Since
March 2005 | | Private Investor — (March 2004 — Present)
Investment Manager — Morgan Stanley & Co. (January 1984 — March 2004) | | 84 | | Director —
Bryn Mawr Bank Corp. (BMTC) (April 2007 — Present)
Chairman of Investment Committee — The Haverford School (2002 — present)
Chairman of Investment Committee — Pennsylvania Academy of Fine Arts (2007 — present)
Trustee (2004 — present)
Investment Committee Member — Pennsylvania Horticulture Society (February 2006 — present) | |
18
Name,
Address,
and Birth Date | | Position(s)
Held with
Fund(s) | | Length of Time
Served | | Principal
Occupation(s)
During
Past 5 Years | | Number of
Portfolios in Fund
Complex Overseen
by Trustee
or Officer | | Other
Directorships
Held by
Trustee
or Officer | |
INDEPENDENT TRUSTEES (CONTINUED) | | | | | | | | | | | |
| | | | | | | | | | | |
John A. Fry
2005 Market Street
Philadelphia, PA
19103
May 1960 | | Trustee | | Since
January 2001 | | President — Franklin & Marshall College (June 2002 — Present)
Executive Vice President — University of Pennsylvania (April 1995 — June 2002) | | 84 | | Director — Community Health Systems
Director — Allied Barton Security Holdings | |
| | | | | | | | | | | |
Anthony D. Knerr
2005 Market Street
Philadelphia, PA
19103
December 1938 | | Trustee | | Since
April 1990 | | Founder and Managing Director — Anthony Knerr & Associates (Strategic Consulting) (1990 — Present) | | 84 | | None | |
| | | | | | | | | | | |
Lucinda S. Landreth
2005 Market Street
Philadelphia, PA
19103
June 1947 | | Trustee | | Since
March 2005 | | Chief Investment Officer — Assurant, Inc. (Insurance) (2002 — 2004) | | 84 | | None | |
| | | | | | | | | | | |
Ann R. Leven
2005 Market Street
Philadelphia, PA
19103
November 1940 | | Trustee | | Since
October 1989 | | Consultant — ARL Associates (Financial Planning) (1983 — Present) | | 84 | | Director and Audit Committee Member — Systemax, Inc. | |
| | | | | | | | | | | |
Thomas F. Madison
2005 Market Street
Philadelphia, PA
19103
February 1936 | | Trustee | | Since
May 1997 | | President and Chief Executive Officer — MLM Partners, Inc. (Small Business Investing and Consulting) (January 1993 — Present) | | 84 | | Director — CenterPoint Energy Director and Audit Committee Member — Digital River, Inc.
Director and Audit Committee Member — Rimage Corporation
Director and Chair of Compensation and Governance & Nominating Committees — Valmont Industries, Inc. | |
| | | | | | | | | | | |
Janet L. Yeomans
2005 Market Street
Philadelphia, PA
19103
July 1948 | | Trustee | | Since
April 1999 | | Treasurer (January 2006 — Present) Vice President — Mergers & Acquisitions (January 2003 — January 2006), and Vice President (July 1995 — January 2003) 3M Corporation | | 84 | | None | |
| | | | | | | | | | | |
J. Richard Zecher
2005 Market Street
Philadelphia, PA
19103
July 1940 | | Trustee | | Since
March 2003 | | Founder — Investor Analytics (Risk Management) (May 1999 — Present)
Founder — Sutton Asset Management (Hedge Fund) (September 1998 — Present) | | 84 | | Director and Audit Committee Member — Investor Analytics
Director and Audit Committee Member — Oxigene, Inc. | |
19
Name,
Address,
and Birth Date | | Position(s)
Held with
Fund(s) | | Length of Time
Served | | Principal
Occupation(s)
During
Past 5 Years | | Number of
Portfolios in Fund
Complex Overseen
by Trustee
or Officer | | Other
Directorships
Held by
Trustee
or Officer | |
OFFICERS | | | | | | | | | | | |
| | | | | | | | | | | |
David F. Connor
2005 Market Street
Philadelphia, PA
19103
December 1963 | | Vice President, Deputy General Counsel, and Secretary | | Vice President since September 21, 2000 and Secretary since October 2005 | | David F. Connor has served as Vice President and Deputy General Counsel of Delaware Investments since 2000. | | 84 | | None(4) | |
| | | | | | | | | | | |
Daniel V. Geatens
2005 Market Street
Philadelphia, PA
19103
October 1972 | | Vice President and Treasurer | | Treasurer since October 25, 2007 | | Daniel V. Geatens has served in various capacities at different times at Delaware Investments. | | 84 | | None(4) | |
| | | | | | | | | | | |
David P. O’Connor
2005 Market Street
Philadelphia, PA
19103
February 1966 | | Senior Vice President, General Counsel, and Chief Legal Officer | | Senior Vice President, General Counsel, and Chief Legal Officer since October 2005 | | David P. O’Connor has served in various executive and legal capacities at different times at Delaware Investments. | | 84 | | None(4) | |
| | | | | | | | | | | |
Richard Salus
2005 Market Street
Philadelphia, PA
19103
October 1963 | | Senior Vice President and Chief Financial Officer | | Chief Financial Officer since November 1, 2006 | | Richard Salus has served in various executive capacities at different times at Delaware Investments. | | 84 | | None(4) | |
(1) Patrick P. Coyne is considered to be an “Interested Trustee” because he is an executive officer of the Fund’s(s’) investment advisor.
(2) Delaware Investments is the marketing name for Delaware Management Holdings, Inc. and its subsidiaries, including the Fund’s(s’) investment advisor, principal underwriter, and its transfer agent.
(3) In 1997, several funds managed by Voyageur Fund Managers, Inc. (the “Voyageur Funds”) were incorporated into the Delaware Investments Family of Funds. Mr. Madison served as a director of the Voyageur Funds from 1993 until 1997.
(4) David F. Connor, Daniel V. Geatens, David P. O’Connor, and Richard Salus serve in similar capacities for the six portfolios of the Optimum Fund Trust, which have the same investment advisor, principal underwriter, and transfer agent as the registrant.
The Statement of Additional Information for the Fund(s) includes additional information about the Trustees and Officers and is available, without charge, upon request by calling 800 523-1918.
20
Delaware VIP Trust — Delaware VIP International Value Equity Series
During the fiscal period ended Dec. 31, 2007, Delaware VIP International Value Equity Series’ Standard Class shares returned +5.24%, and its Service Class shares returned +4.98% with all distributions reinvested. In comparison, the Fund’s benchmark, the MSCI EAFE (Europe, Australasia, Far East) Index, returned +11.15% (source: Lipper).
Established international markets made healthy gains during 2007, which were often supported by a declining U.S. dollar. Growth stocks outpaced their value counterparts — a reversal of the trend seen in recent years. As value investors, we remained focused on the lower-priced segment of the market, which did not fare as well as growth-oriented investments and held back returns in the Series compared to the index.
Many of the stronger performing stocks were those of companies positioned to benefit from global economic growth, such as the growth taking place in China and India. Certain cyclical (more economically sensitive) groups also performed very well as they benefited from strong and growing demand from Asia. The Series’ performance gained from its holdings in the technology sector, and our healthcare holdings fared better than others in the sector.
Among the past fiscal year’s poorly performing sectors was financials. Its troubles began with concerns about the U.S. subprime mortgage market. Global financial stocks broadly sold off, with many solid businesses appearing to suffer nearly as much as some of the more obviously poor-quality companies. Our overweighting in the poor-performing consumer discretionary sector, as well as relatively weak stock selection there, detracted from results.
We remained very much focused on individual bottom-up stock selection over this fiscal year. We sought attractively valued stocks with competitive advantages that we believed were not being fully appreciated by the market. In all types of markets, we looked for solid, well-run businesses that were temporarily out of favor but offered long-term appreciation potential.
The views expressed are current as of the date of this report and are subject to change.
The performance data quoted below represent past performance; past performance does not guarantee future results. Investment return and principal value will fluctuate so your shares, when redeemed, may be worth more or less than their original cost. Please obtain the performance data for the most recent month end by calling the number noted in the introductory section of this report on the page related to this Series.
You should consider the investment objectives, risks, charges, and expenses of the investment company carefully before investing. The Delaware VIP International Value Equity Series prospectus contains this and other important information about the Series. To obtain a prospectus, contact the company noted on the page related to this Series in the introductory section of this report, either by phone or through the company Web site. We advise you to read the prospectus carefully before you invest.
Instances of high double-digit returns are unusual, cannot be sustained, and were achieved primarily during favorable market conditions.
Delaware VIP International Value Equity Series
Average annual total returns
For periods ending Dec. 31, 2007 | | 1 year | | 5 years | | 10 years | | Lifetime | |
Standard Class shares (commenced operations Oct. 29, 1992) | | +5.24 | % | +20.73 | % | +9.90 | % | +10.38 | % |
| | | | | | | | | |
Service Class shares (commenced operations May 1, 2000) | | +4.98 | % | +20.43 | % | NA | | +10.22 | % |
As disclosed in the Series’ most recent prospectus, expenses for Standard Class and Service Class shares were as follows: The net expense ratios for Standard Class and Service Class shares of the Series were 1.00% and 1.25%, respectively. Total operating expenses for Standard Class and Service Class shares were 1.00% and 1.30%, respectively. Management fees for Standard Class and Service Class shares were 0.85%.
Earnings from a variable annuity or variable life investment compound tax-free until withdrawal and, as a result, no adjustments were made for income taxes.
An expense limitation was in effect for all classes during the periods shown in the Series performance chart above and in the Performance of a $10,000 Investment chart on the next page.
Performance of Service Class shares will vary due to different charges and expenses.
Performance data do not reflect insurance fees related to a variable annuity or variable life investment or the deferred sales charge that would apply to certain withdrawals of investments held for fewer than eight years. Performance shown here would have been reduced if such fees were included and the expense limitation removed. For more information about fees, consult your variable annuity or variable life prospectus.
1
Investments in variable products involve risk. Foreign investments are subject to risks not ordinarily associated with domestic investments, such as currency, economic and political risks, and different accounting standards. A value stock may not increase in price as anticipated if other investors do not share the portfolio managers’ perception of the company’s value or if factors that would typically increase the price of the security do not occur. This Series will be particularly affected by declines in stock prices, which can be caused by a drop in the stock market or poor performance in specific industries or companies. Some portfolios offer more risk than others.
Please read both the contract and underlying prospectus for specific details regarding the product’s risk profile.
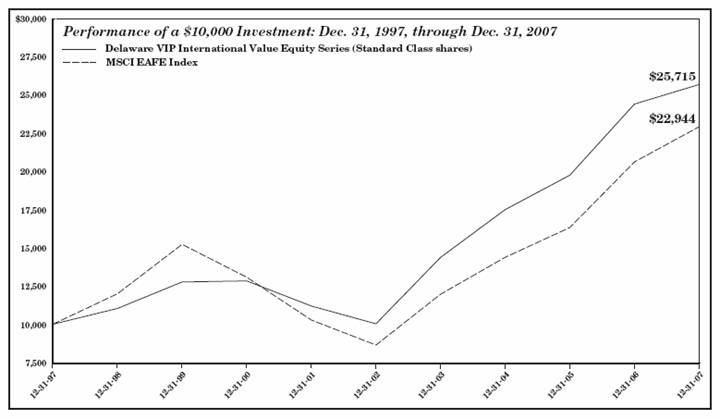
The chart shows a $10,000 investment in the Delaware VIP International Value Equity Series Standard Class shares for the period from Dec. 31, 1997, through Dec. 31, 2007. Performance of Service Class shares will vary due to different charges and expenses.
The chart also shows $10,000 invested in the MSCI EAFE Index for the period from Dec. 31, 1997, through Dec. 31, 2007. The MSCI EAFE Index measures the equity market performance of 21 developed market countries in Europe, Australasia, and the Far East. An index is unmanaged and does not reflect the costs of operating a mutual fund, such as the costs of buying, selling, and holding securities. You cannot invest directly in an index.
2
Delaware VIP Trust — Delaware VIP International Value Equity Series
Disclosure of Series Expenses
For the Period July 1, 2007 to December 31, 2007
As a shareholder of the Series, you incur ongoing costs, including management fees; distribution and/or service (12b-1) fees; and other Series expenses. This Example is intended to help you understand your ongoing costs (in dollars) of investing in the Series and to compare these costs with the ongoing costs of investing in other mutual funds.
The Example is based on an investment of $1,000 invested at the beginning of the period and held for the entire period from July 1, 2007 to December 31, 2007.
Actual Expenses
The first section of the table shown, “Actual Series Return,” provides information about actual account values and actual expenses. You may use the information in this section of the table, together with the amount you invested, to estimate the expenses that you paid over the period. Simply divide your account value by $1,000 (for example, an $8,600 account value divided by $1,000 = 8.6), then multiply the result by the number in the first section under the heading entitled “Expenses Paid During Period” to estimate the expenses you paid on your account during the period.
Hypothetical Example for Comparison Purposes
The second section of the table shown, “Hypothetical 5% Return,” provides information about hypothetical account values and hypothetical expenses based on the Series’ actual expense ratio and an assumed rate of return of 5% per year before expenses, which is not the Series’ actual return. The hypothetical account values and expenses may not be used to estimate the actual ending account balance or expenses you paid for the period. You may use this information to compare the ongoing costs of investing in the Series and other funds. To do so, compare the 5% hypothetical example with the 5% hypothetical examples that appear in the shareholder reports of other funds.
Please note that the expenses shown in the table are meant to highlight your ongoing costs only. As a shareholder of the Series, you do not incur any transaction costs, such as sales charges (loads), redemption fees or exchange fees, but shareholders of other funds may incur such costs. Also, the fees related to the variable annuity investment or the deferred sales charge that could apply have not been included. Therefore, the second section of the table is useful in comparing ongoing costs only, and will not help you determine the relative total costs of owning different funds. The Series’ actual expenses shown in the table reflect fee waivers in effect for Service Class shares. The expenses shown in the table assume reinvestment of all dividends and distributions.
Expense Analysis of an Investment of $1,000
| | Beginning
Account
Value
7/1/07 | | Ending
Account
Value
12/31/07 | | Annualized
Expense
Ratios | | Expenses
Paid During
Period
7/1/07 to
12/31/07* | |
Actual Series Return | | | | | | | | | |
Standard Class | | $ | 1,000.00 | | $ | 943.50 | | 0.99 | % | $ | 4.85 | |
Service Class | | 1,000.00 | | 942.20 | | 1.24 | % | 6.07 | |
Hypothetical 5% Return (5% return before expenses) | | | | | | | | | |
Standard Class | | $ | 1,000.00 | | $ | 1,020.21 | | 0.99 | % | $ | 5.04 | |
Service Class | | 1,000.00 | | 1,018.95 | | 1.24 | % | 6.31 | |
* | “Expenses Paid During Period” are equal to the Series’ annualized expense ratio, multiplied by the average account value over the period, multiplied by 184/365 (to reflect the one-half year period). |
3
Delaware VIP Trust — Delaware VIP International Value Equity Series
Country and Sector Allocations
As of December 31, 2007
Country and sector designations may be different than the country and sector designations presented in other Series materials.
Country | | Percentage
of Net Assets | |
Common Stock | | 98.40 | % |
Australia | | 3.62 | % |
Belgium | | 1.70 | % |
Canada | | 3.31 | % |
Denmark | | 2.38 | % |
Finland | | 2.83 | % |
France | | 17.02 | % |
Germany | | 5.08 | % |
Hong Kong | | 1.59 | % |
Ireland | | 1.09 | % |
Japan | | 19.49 | % |
Mexico | | 2.99 | % |
Netherlands | | 5.00 | % |
Republic of Korea | | 1.81 | % |
Sweden | | 2.10 | % |
Switzerland | | 2.08 | % |
Taiwan | | 2.24 | % |
United Kingdom | | 24.07 | % |
Discount Note | | 0.46 | % |
Securities Lending Collateral | | 16.45 | % |
Total Value of Securities | | 115.31 | % |
Obligation to Return Securities Lending Collateral | | (16.45 | )% |
Receivables and Other Assets Net of Liabilities | | 1.14 | % |
Total Net Assets | | 100.00 | % |
Sector | | Percentage
of Net Assets | |
Consumer Discretionary | | 19.78 | % |
Consumer Staples | | 5.37 | % |
Energy | | 6.45 | % |
Financials | | 17.88 | % |
Health Care | | 13.27 | % |
Industrials | | 10.94 | % |
Information Technology | | 9.46 | % |
Materials | | 3.80 | % |
Telecommunication Services | | 9.22 | % |
Utilities | | 2.23 | % |
Total | | 98.40 | % |
4
Delaware VIP Trust — Delaware VIP International Value Equity Series
Statement of Net Assets
December 31, 2007
| | | Number of
Shares | | Value
(U.S. $) | |
| COMMON STOCK–98.40%D | | | | | |
| Australia–3.62% | | | | | |
| Coca-Cola Amatil | | 305,605 | | $ | 2,539,194 | |
| Telstra | | 446,362 | | 1,834,794 | |
| Telstra–Receipt | | 429,016 | | 1,191,955 | |
| | | | | 5,565,943 | |
| Belgium–1.70% | | | | | |
* | Dexia | | 104,022 | | 2,615,681 | |
| | | | | 2,615,681 | |
| Canada–3.31% | | | | | |
† | CGI Group Class A | | 436,694 | | 5,093,115 | |
| | | | | 5,093,115 | |
| Denmark–2.38% | | | | | |
| Novo Nordisk Class B | | 55,996 | | 3,671,330 | |
| | | | | 3,671,330 | |
| Finland–2.83% | | | | | |
| Nokia | | 112,608 | | 4,358,300 | |
| | | | | 4,358,300 | |
| France–17.02% | | | | | |
* | AXA | | 76,341 | | 3,051,576 | |
| Cia de Saint-Gobain | | 32,644 | | 3,072,346 | |
* | Lafarge | | 24,969 | | 4,536,750 | |
| Lagardere | | 34,617 | | 2,591,173 | |
| Publicis Groupe | | 85,496 | | 3,341,417 | |
* | Sanofi-Aventis | | 46,360 | | 4,261,087 | |
| Total | | 64,253 | | 5,328,997 | |
| | | | | 26,183,346 | |
| Germany–5.08% | | | | | |
| Bayerische Motoren Werke | | 64,084 | | 3,996,288 | |
| Metro | | 45,711 | | 3,817,850 | |
| | | | | 7,814,138 | |
| Hong Kong–1.59% | | | | | |
* | Techtronic Industries | | 2,454,859 | | 2,449,036 | |
| | | | | 2,449,036 | |
| Ireland–1.09% | | | | | |
| Anglo Irish Bank | | 104,764 | | 1,672,645 | |
| | | | | 1,672,645 | |
| Japan–19.49% | | | | | |
* | Asahi Glass | | 263,000 | | 3,535,122 | |
* | Canon | | 56,680 | | 2,642,898 | |
| Don Quijote | | 145,400 | | 2,868,364 | |
| Fujitsu | | 374,000 | | 2,525,304 | |
| Mitsubishi UFJ Financial Group | | 256,000 | | 2,403,443 | |
* | NGK Spark Plug | | 183,000 | | 3,209,720 | |
| Nissan Motor | | 308,900 | | 3,406,985 | |
| Ono Pharmaceutical | | 59,500 | | 2,785,061 | |
| Round One | | 1,534 | | 3,067,449 | |
| Terumo | | 67,200 | | 3,543,184 | |
| | | | | 29,987,530 | |
| Mexico–2.99% | | | | | |
| Cemex ADR | | 51,598 | | 1,333,808 | |
| Telefonos de Mexico ADR | | 88,916 | | 3,275,666 | |
| | | | | 4,609,474 | |
| Netherlands–5.00% | | | | | |
| ING Groep CVA | | 97,069 | | $ | 3,789,472 | |
| Koninklijke Philips Electronics | | 90,599 | | 3,903,140 | |
| | | | | 7,692,612 | |
| Republic of Korea–1.81% | | | | | |
| Kookmin Bank | | 37,784 | | 2,785,213 | |
| | | | | 2,785,213 | |
| Sweden–2.10% | | | | | |
| Nordea Bank | | 193,147 | | 3,226,236 | |
| | | | | 3,226,236 | |
| Switzerland–2.08% | | | | | |
| Novartis | | 58,336 | | 3,196,564 | |
| | | | | 3,196,564 | |
| Taiwan–2.24% | | | | | |
| Chunghwa Telecom ADR | | 163,727 | | 3,456,283 | |
| | | | | 3,456,283 | |
| United Kingdom–24.07% | | | | | |
| AstraZeneca | | 70,822 | | 3,045,023 | |
| BP | | 378,640 | | 4,626,649 | |
† | British Airways | | 383,903 | | 2,356,921 | |
| Greggs | | 20,611 | | 1,939,438 | |
| HBOS | | 177,104 | | 2,588,071 | |
| Kesa Electricals | | 596,349 | | 2,763,677 | |
| National Grid | | 207,620 | | 3,440,332 | |
| Royal Bank of Scotland Group | | 183,014 | | 1,614,479 | |
| Standard Chartered | | 105,802 | | 3,876,322 | |
| Tomkins | | 608,345 | | 2,136,360 | |
| Travis Perkins | | 79,556 | | 1,903,113 | |
| Vodafone Group | | 1,041,929 | | 3,887,751 | |
| WPP Group | | 222,594 | | 2,859,217 | |
| | | | | 37,037,353 | |
| Total Common Stock
(cost $136,333,126) | | | | 151,414,799 | |
| | | Principal
Amount | | | |
¹ | DISCOUNT NOTE–0.46% | | | | | |
| Federal Home Loan Bank 3.25% 1/2/08 | | $ | 705,127 | | 705,064 | |
| Total Discount Note (cost $705,064) | | | | 705,064 | |
| | | | | | |
| Total Value of Securities Before Securities Lending Collateral–98.86%
(cost $137,038,190) | | | | 152,119,863 | |
| | | | | | | |
| | | Number of
Shares | | | |
| SECURITIES LENDING COLLATERAL**–16.45% | | | | | |
| Investment Companies Mellon GSL DBT II Collateral Fund | | 25,306,978 | | 25,306,978 | |
| Total Securities Lending Collateral
(cost $25,306,978) | | | | 25,306,978 | |
5
TOTAL VALUE OF SECURITIES–115.31% (cost $162,345,168) | | $ | 177,426,841 | © |
OBLIGATION TO RETURN SECURITIES LENDING COLLATERAL**–(16.45%) | | (25,306,978 | ) |
RECEIVABLES AND OTHER ASSETS NET OF LIABILITIES–1.14% | | 1,751,607 | |
NET ASSETS APPLICABLE TO 10,467,441 SHARES OUTSTANDING–100.00% | | $ | 153,871,470 | |
NET ASSET VALUE–DELAWARE VIP INTERNATIONAL VALUE EQUITY SERIES STANDARD CLASS ($153,690,754 / 10,455,114 Shares) | | $ | 14.70 | |
NET ASSET VALUE–DELAWARE VIP INTERNATIONAL VALUE EQUITY SERIES SERVICE CLASS ($180,716 / 12,327 Shares) | | $ | 14.66 | |
COMPONENTS OF NET ASSETS AT DECEMBER 31, 2007: | | | |
Shares of beneficial interest (unlimited authorization–no par) | | $ | 126,479,194 | |
Undistributed net investment income | | 2,732,837 | |
Accumulated net realized gain on investments | | 9,586,338 | |
Net unrealized appreciation of investments and foreign currencies | | 15,073,101 | |
Total net assets | | $ | 153,871,470 | |
† | | Non-income producing security for the year ended December 31, 2007. |
* | | Fully or partially on loan. |
** | | See Note 9 in “Notes to Financial Statements.” |
© | | Includes $24,085,381 of securities loaned. |
D | | Securities have been classified by country of origin. Classification by type of business has been presented on page 4 in “Country and Sector Allocations.” |
¹ | | The rate shown is the effective yield at the time of purchase. |
Summary of Abbreviations:
ADR – American Depositary Receipts
CVA – Dutch Certificate
See accompanying notes
6
Delaware VIP Trust —
Delaware VIP International Value Equity Series
Statement of Operations
Year Ended December 31, 2007
INVESTMENT INCOME: | | | |
Dividends | | $ | 4,534,673 | |
Securities lending income | | 196,301 | |
Interest | | 108,246 | |
Foreign tax withheld | | (325,266 | ) |
| | 4,513,954 | |
EXPENSES: | | | |
Management fees | | 1,445,757 | |
Accounting and administration expenses | | 68,028 | |
Custodian fees | | 53,731 | |
Reports and statements to shareholders | | 23,591 | |
Dividend disbursing and transfer agent fees and expenses | | 22,161 | |
Legal fees | | 20,899 | |
Audit and tax | | 19,677 | |
Taxes (other than taxes on income) | | 9,020 | |
Trustees’ fees | | 8,126 | |
Pricing fees | | 5,168 | |
Insurance fees | | 4,458 | |
Consulting fees | | 3,133 | |
Trustees’ expenses | | 997 | |
Registration fees | | 645 | |
Dues and services | | 625 | |
Distribution expenses – Service Class | | 506 | |
| | 1,686,522 | |
Less waiver of distribution expenses – Service Class | | (85 | ) |
Less expense paid indirectly | | (2,547 | ) |
Total operating expenses | | 1,683,890 | |
| | | |
NET INVESTMENT INCOME | | 2,830,064 | |
| | | |
NET REALIZED AND UNREALIZED GAIN (LOSS) ON INVESTMENTS AND FOREIGN CURRENCIES: | | | |
Net realized gain (loss) on: | | | |
Investments | | 9,546,083 | |
Foreign currencies | | (81,312 | ) |
Net realized gain | | 9,464,771 | |
Net change in unrealized appreciation/depreciation of investments and foreign currencies | | (3,269,329 | ) |
| | | |
NET REALIZED AND UNREALIZED GAIN ON INVESTMENTS AND FOREIGN CURRENCIES | | 6,195,442 | |
| | | |
NET INCREASE IN NET ASSETS RESULTING FROM OPERATIONS | | $ | 9,025,506 | |
See accompanying notes
Delaware VIP Trust —
Delaware VIP International Value Equity Series
Statements of Changes in Net Assets
| | Year Ended | |
| | 12/31/07 | | 12/31/06 | |
INCREASE (DECREASE) IN NET ASSETS FROM OPERATIONS: | | | | | |
Net investment income | | $ | 2,830,064 | | $ | 4,008,491 | |
Net realized gain on investments and foreign currencies | | 9,464,771 | | 66,425,012 | |
Net change in unrealized appreciation/depreciation of investments and foreign currencies | | (3,269,329 | ) | (35,420,048 | ) |
Net increase in net assets resulting from operations | | 9,025,506 | | 35,013,455 | |
| | | | | |
DIVIDENDS AND DISTRIBUTIONS TO SHAREHOLDERS FROM: | | | | | |
Net investment income: | | | | | |
Standard Class | | (3,694,827 | ) | (4,683,222 | ) |
Service Class | | (3,271 | ) | (1,608 | ) |
Net realized gain on investments: | | | | | |
Standard Class | | (65,626,826 | ) | (9,267,611 | ) |
Service Class | | (64,716 | ) | (3,444 | ) |
| | (69,389,640 | ) | (13,955,885 | ) |
CAPITAL SHARE TRANSACTIONS: | | | | | |
Proceeds from shares sold: | | | | | |
Standard Class | | 2,885,952 | | 90,482,396 | |
Service Class | | 130,583 | | 336 | |
Net asset value of shares issued upon reinvestment of dividends and distributions: | | | | | |
Standard Class | | 69,321,653 | | 13,950,833 | |
Service Class | | 67,987 | | 5,052 | |
| | 72,406,175 | | 104,438,617 | |
Cost of shares repurchased: | | | | | |
Standard Class | | (31,233,434 | ) | (113,759,501 | ) |
Service Class | | (13,734 | ) | (14,980 | ) |
| | (31,247,168 | ) | (113,774,481 | ) |
Increase (decrease) in net assets derived from capital share transactions | | 41,159,007 | | (9,335,864 | ) |
| | | | | |
NET INCREASE (DECREASE) IN NET ASSETS | | (19,205,127 | ) | 11,721,706 | |
| | | | | |
NET ASSETS: | | | | | |
Beginning of year | | 173,076,597 | | 161,354,891 | |
End of year (including undistributed net investment income of $2,732,837 and $3,678,748, respectively) | | $ | 153,871,470 | | $ | 173,076,597 | |
See accompanying notes
7
Delaware VIP Trust — Delaware VIP International Value Equity Series
Financial Highlights
Selected data for each share of the Series outstanding throughout each period were as follows:
| | Delaware VIP International Value Equity Series Standard Class
Year Ended | |
| | 12/31/07 | | 12/31/06 | | 12/31/05 | | 12/31/04 | | 12/31/03 | |
Net asset value, beginning of period | | $ | 23.100 | | $ | 20.380 | | $ | 18.550 | | $ | 15.660 | | $ | 11.550 | |
| | | | | | | | | | | |
Income from investment operations: | | | | | | | | | | | |
Net investment income(1) | | 0.273 | | 0.512 | | 0.496 | | 0.396 | | 0.373 | |
Net realized and unrealized gain on investments and foreign currencies | | 0.858 | | 4.043 | | 1.838 | | 2.920 | | 4.355 | |
Total from investment operations | | 1.131 | | 4.555 | | 2s.334 | | 3.316 | | 4.728 | |
| | | | | | | | | | | |
Less dividends and distributions from: | | | | | | | | | | | |
Net investment income | | (0.508 | ) | (0.616 | ) | (0.291 | ) | (0.426 | ) | (0.314 | ) |
Net realized gain on investments | | (9.023 | ) | (1.219 | ) | (0.213 | ) | — | | (0.304 | ) |
Total dividends and distributions | | (9.531 | ) | (1.835 | ) | (0.504 | ) | (0.426 | ) | (0.618 | ) |
| | | | | | | | | | | |
Net asset value, end of period | | $ | 14.700 | | $ | 23.100 | | $ | 20.380 | | $ | 18.550 | | $ | 15.660 | |
| | | | | | | | | | | |
Total return(2) | | 5.24 | % | 23.59 | % | 12.87 | % | 21.79 | % | 43.44 | % |
| | | | | | | | | | | |
Ratios and supplemental data: | | | | | | | | | | | |
Net assets, end of period (000 omitted) | | $ | 153,691 | | $ | 173,017 | | $ | 161,293 | | $ | 164,544 | | $ | 167,813 | |
Ratio of expenses to average net assets | | 0.99 | % | 1.01 | % | 1.00 | % | 0.99 | % | 0.98 | % |
Ratio of expenses to average net assets prior to expense limitation and expenses paid indirectly | | 0.99 | % | 1.01 | % | 1.02 | % | 0.99 | % | 0.99 | % |
Ratio of net investment income to average net assets | | 1.66 | % | 2.44 | % | 2.63 | % | 2.46 | % | 2.96 | % |
Ratio of net investment income to average net assets prior to expense limitation and expenses paid indirectly | | 1.66 | % | 2.44 | % | 2.61 | % | 2.46 | % | 2.95 | % |
Portfolio turnover | | 21 | % | 114 | % | 8 | % | 10 | % | 11 | % |
(1) | The average shares outstanding method has been applied for per share information. |
(2) | Total investment return is based on the change in net asset value of a share during the period and assumes reinvestment of dividends and distributions at net asset value. Total investment return reflects a waiver by the manager, as applicable. Performance would have been lower had the waiver not been in effect. |
See accompanying notes
8
Delaware VIP International Value Equity Series
Fianancial Highlights (continued)
Selected data for each share of the Series outstanding throughout each period were as follows:
| | Delaware VIP International Value Equity Series Service Class
Year Ended | |
| | 12/31/07 | | 12/31/06 | | 12/31/05 | | 12/31/04 | | 12/31/03 | |
Net asset value, beginning of period | | $ | 23.050 | | $ | 20.350 | | $ | 18.520 | | $ | 15.650 | | $ | 11.550 | |
| | | | | | | | | | | |
Income from investment operations: | | | | | | | | | | | |
Net investment income(1) | | 0.233 | | 0.459 | | 0.449 | | 0.356 | | 0.345 | |
Net realized and unrealized gain on investments and foreign currencies | | 0.856 | | 4.029 | | 1.845 | | 2.911 | | 4.355 | |
Total from investment operations | | 1.089 | | 4.488 | | 2.294 | | 3.267 | | 4.700 | |
| | | | | | | | | | | |
Less dividends and distributions from: | | | | | | | | | | | |
Net investment income | | (0.456 | ) | (0.569 | ) | (0.251 | ) | (0.397 | ) | (0.296 | ) |
Net realized gain on investments | | (9.023 | ) | (1.219 | ) | (0.213 | ) | — | | (0.304 | ) |
Total dividends and distributions | | (9.479 | ) | (1.788 | ) | (0.464 | ) | (0.397 | ) | (0.600 | ) |
| | | | | | | | | | | |
Net asset value, end of period | | $ | 14.660 | | $ | 23.050 | | $ | 20.350 | | $ | 18.520 | | $ | 15.650 | |
| | | | | | | | | | | |
Total return(2) | | 4.98 | % | 23.24 | % | 12.65 | % | 21.44 | % | 43.11 | % |
| | | | | | | | | | | |
Ratios and supplemental data: | | | | | | | | | | | |
Net assets, end of period (000 omitted) | | $ | 180 | | $ | 60 | | $ | 62 | | $ | 95 | | $ | 109 | |
Ratio of expenses to average net assets | | 1.24 | % | 1.26 | % | 1.25 | % | 1.24 | % | 1.20 | % |
Ratio of expenses to average net assets prior to expense limitation and expenses paid indirectly | | 1.29 | % | 1.31 | % | 1.32 | % | 1.29 | % | 1.24 | % |
Ratio of net investment income to average net assets | | 1.41 | % | 2.19 | % | 2.38 | % | 2.21 | % | 2.74 | % |
Ratio of net investment income to average net assets prior to expense limitation and expenses paid indirectly | | 1.36 | % | 2.14 | % | 2.31 | % | 2.16 | % | 2.70 | % |
Portfolio turnover | | 21 | % | 114 | % | 8 | % | 10 | % | 11 | % |
(1) | The average shares outstanding method has been applied for per share information. |
(2) | Total investment return is based on the change in net asset value of a share during the period and assumes reinvestment of dividends and distributions at net asset value. Total investment return reflects a waiver by the manager and distributor, as applicable. Performance would have been lower had the waiver not been in effect. |
See accompanying notes
9
Delaware VIP Trust — Delaware VIP International Value Equity Series
Notes to Financial Statements
December 31, 2007
Delaware VIP Trust (Trust) is organized as a Delaware statutory trust and offers 14 series: Delaware VIP Balanced Series, Delaware VIP Capital Reserves Series, Delaware VIP Cash Reserve Series, Delaware VIP Diversified Income Series, Delaware VIP Emerging Markets Series, Delaware VIP Growth Opportunities Series, Delaware VIP High Yield Series, Delaware VIP International Value Equity Series, Delaware VIP REIT Series, Delaware VIP Select Growth Series, Delaware VIP Small Cap Value Series, Delaware VIP Trend Series, Delaware VIP U.S. Growth Series and Delaware VIP Value Series. These financial statements and the related notes pertain to Delaware VIP International Value Equity Series (Series). The Trust is an open-end investment company. The Series is considered diversified under the Investment Company Act of 1940, as amended, and offers Standard Class and Service Class shares. The Standard Class shares do not carry a 12b-1 fee and the Service Class shares carry a 12b-1 fee. The shares of the Series are sold only to separate accounts of life insurance companies.
The investment objective of the Series is to seek long-term growth without undue risk to principal.
1. Significant Accounting Policies
The following accounting policies are in accordance with U.S. generally accepted accounting principles and are consistently followed by the Series.
Security Valuation—Equity securities, except those traded on the Nasdaq Stock Market, Inc. (Nasdaq), are valued at the last quoted sales price as of the time of the regular close of the New York Stock Exchange (NYSE) on the valuation date. Securities traded on the Nasdaq are valued in accordance with the Nasdaq Official Closing Price, which may not be the last sales price. If on a particular day an equity security does not trade, then the mean between the bid and asked prices will be used. Securities listed on a foreign exchange are valued at the last quoted sales price on the valuation date. Short-term debt securities having less than 60 days to maturity are valued at amortized cost, which approximates market value. Securities lending collateral, which is invested in a collective investment vehicle, is valued at unit value per share. Foreign currency exchange contracts are valued at the mean between the bid and asked prices of the contracts. Interpolated values are derived when the settlement date of the contract is an interim date for which quotations are not available. Other securities and assets for which market quotations are not readily available are valued at fair value as determined in good faith under the direction of the Series’ Board of Trustees. In determining whether market quotations are readily available or fair valuation will be used, various factors will be taken into consideration, such as market closures, or with respect to foreign securities, aftermarket trading, or significant events after local market trading (e.g., government actions or pronouncements, trading volume or volatility on markets, exchanges among dealers, or news events).
In September 2006, the Financial Accounting Standards Board (FASB) issued FASB Statement No. 157 “Fair Value Measurements” (Statement 157). Statement 157 establishes a framework for measuring fair value in U.S. generally accepted accounting principles, clarifies the definition of fair value within that framework, and expands disclosures about the use of fair value measurements. Statement 157 is intended to increase consistency and comparability among fair value estimates used in financial reporting. Statement 157 is effective for fiscal years beginning after November 15, 2007. Management does not expect the adoption of Statement 157 to have a material impact on the amounts reported in the financial statements.
Federal Income Taxes—The Series intends to continue to qualify for federal income tax purposes as a regulated investment company under Subchapter M of the Internal Revenue Code of 1986, as amended, and make the requisite distributions to shareholders. Accordingly, no provision for federal income taxes has been made in the financial statements.
Effective June 29, 2007, the Series adopted FASB Interpretation No. 48 “Accounting for Uncertainty in Income Taxes” (FIN 48). FIN 48 provides guidance for how uncertain tax positions should be recognized, measured, presented and disclosed in the financial statements. FIN 48 requires the evaluation of tax positions taken or expected to be taken in the course of preparing the Series’ tax returns to determine whether the tax positions are “more-likely-than-not” of being sustained by the applicable tax authority. Tax positions not deemed to meet the more-likely-than-not threshold are recorded as a tax benefit or expense in the current year. The adoption of FIN 48 did not result in the recording of any tax benefit or expense in the current period.
Class Accounting—Investment income, common expenses and realized and unrealized gain (loss) on investments are allocated to the classes of the Series on the basis of daily net assets of each class. Distribution expenses relating to a specific class are charged directly to that class.
Repurchase Agreements—The Series may invest in a pooled cash account along with members of the Delaware Investments® Family of Funds pursuant to an exemptive order issued by the Securities and Exchange Commission. The aggregate daily balance of the pooled cash account is invested in repurchase agreements secured by obligations of the U.S. government. The respective collateral is held by the Series’ custodian bank until the maturity of the respective repurchase agreements. Each repurchase agreement is at least 102% collateralized. However, in the event of default or bankruptcy by the counterparty to the agreement, realization of the collateral may be subject to legal proceedings. At December 31, 2007, the Series held no investments in repurchase agreements.
Foreign Currency Transactions—Transactions denominated in foreign currencies are recorded at the prevailing exchange rates on the valuation date. The value of all assets and liabilities denominated in foreign currencies are translated into U.S. dollars at the exchange rate of such currencies against the U.S. dollar daily. Transaction gains or losses resulting from changes in exchange rates during the reporting period or upon settlement of the foreign currency transaction are reported in operations for the current period. The Series does not isolate that portion of realized gains and losses on investments which are due to changes in foreign exchange rates from that which are due to changes in market prices. The Series reports certain foreign currency related transactions as components of realized gains (losses) for financial reporting purposes, whereas such components are treated as ordinary income (loss) for federal income tax purposes.
Use of Estimates—The preparation of financial statements in conformity with U.S. generally accepted accounting principles requires management to make estimates and assumptions that affect the reported amounts of assets and liabilities at the date of the financial statements and the reported amounts of revenues and expenses during the reporting period. Actual results could differ from those estimates.
10
Delaware VIP International Value Equity Series
Notes to Financial Statements (continued)
1. Significant Accounting Policies (continued)
Other—Expenses directly attributable to the Series are charged directly to the Series. Other expenses common to various funds within the Delaware Investments® Family of Funds are generally allocated amongst such funds on the basis of average net assets. Management fees and some other expenses are paid monthly. Security transactions are recorded on the date the securities are purchased or sold (trade date) for financial reporting purposes. Costs used in calculating realized gains and losses on the sale of investment securities are those of the specific securities sold. Dividend income is recorded on the ex-dividend date and interest income is recorded on the accrual basis. Foreign dividends are also recorded on the ex-dividend date or as soon after the ex-dividend date that the Series is aware of such dividends, net of all non-rebatable tax withholdings. Withholding taxes on foreign dividends have been recorded in accordance with the Series’ understanding of the applicable country’s tax rules and rates.
The Series declares and pays dividends from net investment income and distributions from net realized gain on investments, if any, following the close of the fiscal year.
The Series may receive earnings credits from its custodian when positive cash balances are maintained, which are used to offset custody fees. The expense paid under this arrangement is included in custodian fees on the Statement of Operations with the corresponding expense offset shown as “expense paid indirectly.”
2. Investment Management, Administration Agreements and Other Transactions with Affiliates
In accordance with the terms of its investment management agreement, the Series pays Delaware Management Company (DMC), a series of Delaware Management Business Trust and the investment manager, an annual fee which is calculated daily at the rate of 0.85% on the first $500 million of average daily net assets of the Series, 0.80% on the next $500 million, 0.75% on the next $1.5 billion, and 0.70% on average daily net assets in excess of $2.5 billion.
Prior to May 1, 2007, DMC had contractually agreed to waive that portion, if any, of its management fee and reimburse the Series to the extent necessary to ensure that total annual operating expenses, exclusive of taxes, interest, brokerage fees, 12b-1 plan expenses, certain insurance costs and non-routine expenses or costs including, but not limited to, those relating to reorganizations, litigation, conducting shareholder meetings, and liquidations, did not exceed 1.08% of average daily net assets of the Series. No reimbursement was due for the year ended December 31, 2007.
Effective October 1, 2007, Delaware Service Company, Inc. (DSC), an affiliate of DMC, provides fund accounting and financial administration oversight services to the Series. For these services, the Series pays DSC fees based on the aggregate daily net assets of the Delaware Investments® Family of Funds at the following annual rate: 0.0050% of the first $30 billion; 0.0045% of the next $10 billion; 0.0040% of the next $10 billion; and 0.0025% of aggregate average daily net assets in excess of $50 billion. The fees payable to DSC under the service agreement described above are allocated among all funds in the Delaware Investments® Family of Funds on a relative net asset value basis. Prior to October 1, 2007, DSC provided fund accounting and administrative services to the Series and received a fee at an annual rate of 0.04% of average daily net assets. For the year ended December 31, 2007, the Series was charged $53,817 for these services.
DSC also provides dividend disbursing and transfer agency services. The Series pays DSC a monthly fee based on the number of shareholder accounts for dividend disbursing and transfer agent services.
Pursuant to a distribution agreement and distribution plan, the Series pays Delaware Distributors, L.P. (DDLP), the distributor and an affiliate of DMC, an annual distribution and service fee not to exceed 0.30% of the average daily net assets of the Service Class shares. DDLP has contracted to waive distribution and service fees through April 30, 2008 in order to prevent distribution and service fees of the Service Class shares from exceeding 0.25% of average daily net assets. Standard Class shares pay no distribution and service expenses.
At December 31, 2007, the Series had liabilities payable to affiliates as follows:
Investment
Management
Fee Payable to
DMC | | Dividend Disbursing,
Transfer Agent
Fees and Other Expenses
Payable to DSC | | Distribution
Fees Payable
to DDLP | | Other
Expenses
Payable
to
Affiliates* | |
$ | 112,728 | | $ | 2,957 | | $ | 39 | | $ | 6,201 | |
| | | | | | | | | | | |
*DMC, as part of its administrative services, pays operating expenses on behalf of the Series and is reimbursed on a periodic basis. Such expenses include items such as printing of shareholder reports, fees for audit, legal and tax services, custodian fees and trustees’ fees.
As provided in the investment management agreement, the Series bears the cost of certain legal and tax services, including internal legal and tax services provided to the Series by DMC and/or its affiliates’ employees. For the year ended December 31, 2007, the Series was charged $9,071 for internal legal and tax services provided by DMC and/or its affiliates’ employees.
Trustees’ fees include expenses accrued by the Series for each Trustee’s retainer and per meeting fees. Certain officers of DMC, DSC and DDLP are officers and/or Trustees of the Trust. These officers and Trustees are paid no compensation by the Series.
11
Delaware VIP International Value Equity Series
Notes to Financial Statements (continued)
3. Investments
For the year ended December 31, 2007, the Series made purchases and sales of investment securities other than short-term investments as follows:
Purchases | | $ | 35,497,294 | |
Sales | | 59,581,230 | |
At December 31, 2007, the cost of investments for federal income tax purposes and unrealized appreciation (depreciation) for the Series were as follows:
Cost of
Investments | | Aggregate
Unrealized
Appreciation | | Aggregate
Unrealized
Depreciation | | Net Unrealized
Appreciation | |
$ | 162,806,410 | | $ | 26,170,154 | | $ | (11,549,723 | ) | $ | 14,620,431 | |
| | | | | | | | | | | |
4. Dividend and Distribution Information
Income and long-term capital gain distributions are determined in accordance with federal income tax regulations, which may differ from U.S. generally accepted accounting principles. Additionally, gains (losses) on foreign currency transactions and net short-term gains on sales of investment securities are treated as ordinary income for federal income tax purposes. The tax character of dividends and distributions paid during the years ended December 31, 2007 and 2006 was as follows:
| | Year
Ended
12/31/07 | | Year
Ended
12/31/06 | |
Ordinary income | | $ | 4,884,812 | | $ | 4,773,624 | |
Long-term capital gain | | 64,504,828 | | 9,182,261 | |
Total | | $ | 69,389,640 | | $ | 13,955,885 | |
5. Components of Net Assets on a Tax Basis
As of December 31, 2007, the components of net assets on a tax basis were as follows:
Shares of beneficial interest | | $ | 126,479,194 | |
Undistributed ordinary income | | 5,273,577 | |
Undistributed long-term capital gains | | 7,506,840 | |
Unrealized appreciation of investments and foreign currencies | | 14,611,859 | |
Net assets | | $ | 153,871,470 | |
The differences between book basis and tax basis components of net assets are primarily attributable to tax deferral of losses on wash sales.
For financial reporting purposes, capital accounts are adjusted to reflect the tax character of permanent book/tax differences. Reclassifications are primarily due to tax treatment of gain (loss) on foreign currency transactions, dividends and distributions and market timing settlement. Results of operations and net assets were not affected by these reclassifications. For the year ended December 31, 2007, the Series recorded the following reclassifications:
Undistributed
Net
Investment Income | | Accumulated
Net Realized
Gain | | Paid-in Capital | |
$ | (77,877 | ) | $ | 560,988 | | $ | (483,111 | ) |
| | | | | | | | |
12
Delaware VIP International Value Equity Series
Notes to Financial Statements (continued)
6. Capital Shares
Transactions in capital shares were as follows:
| | Year
Ended
12/31/07 | | Year
Ended
12/31/06 | |
Shares sold: | | | | | |
Standard Class | | 118,564 | | 4,684,879 | |
Service Class | | 5,928 | | 15 | |
Shares issued upon reinvestment of dividends and distributions: | | | | | |
Standard Class | | 4,754,572 | | 686,895 | |
Service Class | | 4,666 | | 249 | |
| | 4,883,730 | | 5,372,038 | |
Shares repurchased: | | | | | |
Standard Class | | (1,907,104 | ) | (5,796,253 | ) |
Service Class | | (842 | ) | (712 | ) |
| | (1,907,946 | ) | (5,796,965 | ) |
Net increase (decrease) | | 2,975,784 | | (424,927 | ) |
7. Line of Credit
The Series, along with certain other funds in the Delaware Investments® Family of Funds (Participants), participates in a $225,000,000 revolving line of credit facility to be used for temporary or emergency purposes as an additional source of liquidity to fund redemptions of investor shares. The Participants are charged an annual commitment fee, which is allocated across the Participants on the basis of each Participant’s allocation of the entire facility. The Participants may borrow up to a maximum of one third of their net assets under the agreement. The Series had no amounts outstanding as of December 31, 2007, or at any time during the year then ended.
8. Foreign Currency Exchange Contracts
The Series may enter into foreign currency exchange contracts as a way of managing foreign exchange rate risk. The Series may enter into these contracts to fix the U.S. dollar value of a security that it has agreed to buy or sell for the period between the date the trade was entered into and the date the security is delivered and paid for. The Series may also use these contracts to hedge the U.S. dollar value of securities it already owns that are denominated in foreign currencies. The change in market value is recorded as an unrealized gain or loss. When the contract is closed, a realized gain or loss is recorded equal to the difference between the value of the contract at the time it was opened and the value at the time it was closed.
The use of foreign currency exchange contracts does not eliminate fluctuations in the underlying prices of the securities, but does establish a rate of exchange that can be achieved in the future. Although foreign currency exchange contracts limit the risk of loss due to a decline in the value of the hedged currency, they also limit any potential gain that might result should the value of the currency increase. In addition, the Series could be exposed to risks if the counterparties to the contracts are unable to meet the terms of their contracts. There were no foreign currency exchange contracts outstanding at December 31, 2007.
9. Securities Lending
The Series, along with other funds in the Delaware Investments® Family of Funds, may lend its securities pursuant to a security lending agreement (Lending Agreement) with Mellon Bank, N.A. (Mellon). With respect to each loan, if the aggregate market value of the collateral held on any business day is less than the aggregate market value of the securities which are the subject of such loan, the borrower will be notified to provide additional collateral not less than the applicable collateral requirements. Cash collateral received is invested in a collective investment vehicle (Collective Trust) established by Mellon for the purpose of investment on behalf of clients participating in its securities lending programs. The Collective Trust invests in fixed income securities, with a weighted average maturity not to exceed 90 days, rated in one of the top two tiers by Standard & Poor’s Ratings Group or Moody’s Investors Service, Inc. or repurchase agreements collateralized by such securities. However, in the event of default or bankruptcy by the lending agent, realization and/or retention of the collateral may be subject to legal proceedings. In the event the borrower fails to return loaned securities and the collateral received is insufficient to cover the value of the loaned securities and provided such collateral shortfall is not the result of investment losses, the lending agent has agreed to pay the amount of the shortfall to the Series, or at the discretion of the lending agent, replace the loaned securities. The Series continues to record dividends or interest, as applicable, on the securities loaned and is subject to change in value of the securities loaned that may occur during the term of the loan. The Series has the right under the Lending Agreement to recover the securities from the borrower on demand. With respect to security loans collateralized by U.S. Treasury obligations, the Series receives a fee from the securities lending agent. With respect to security loans collateralized by cash collateral, the earnings from the collateral investments are shared among the Series, the security lending agent and the borrower. The Series records securities lending income net of allocations to the security lending agent and the borrower.
At December 31, 2007, the market value of the securities on loan was $24,085,381, for which cash collateral was received and invested in accordance with the Lending Agreement. Such investments are presented on the Statement of Net Assets under the caption “Securities Lending Collateral.”
13
Delaware VIP International Value Equity Series
Notes to Financial Statements (continued)
10. Credit and Market Risk
Some countries in which the Series may invest require governmental approval for the repatriation of investment income, capital or the proceeds of sales of securities by foreign investors. In addition, if there is deterioration in a country’s balance of payments or for other reasons, a country may impose temporary restrictions on foreign capital remittances abroad.
The securities exchanges of certain foreign markets are substantially smaller, less liquid, and more volatile than the major securities markets in the United States. Consequently, acquisition and disposition of securities by the Series may be inhibited. In addition, a significant portion of the aggregate market value of equity securities listed on the major securities exchanges in emerging markets are held by a smaller number of investors. This may limit the number of shares available for acquisition or disposition by the Series.
The Series may invest up to 10% of its net assets in illiquid securities, which may include securities with contractual restrictions on resale, securities exempt from registration under Rule 144A of the Securities Act of 1933, as amended, and other securities which may not be readily marketable. The relative illiquidity of these securities may impair the Series from disposing of them in a timely manner and at a fair price when it is necessary or desirable to do so. While maintaining oversight, the Series’ Board of Trustees has delegated to DMC the day-to-day functions of determining whether individual securities are liquid for purposes of the Series’ limitation on investments in illiquid assets. As of December 31, 2007, there were no Rule 144A securities and no securities have been determined to be illiquid under the Series’ Liquidity Procedures.
11. Contractual Obligations
The Series enters into contracts in the normal course of business that contain a variety of indemnifications. The Series’ maximum exposure under these arrangements is unknown. However, the Series has not had prior claims or losses pursuant to these contracts. Management has reviewed the Series’ existing contracts and expects the risk of loss to be remote.
12. Tax Information (Unaudited)
For the fiscal year ended December 31, 2007, the Series designates dividends and distributions paid during the year as follows:
(A)
Long-Term
Capital Gain
Distributions
(Tax Basis) | | (B)
Ordinary
Income
Distributions
(Tax Basis) | | Total
Distributions
(Tax Basis) | |
93 | % | 7 | % | 100 | % |
(A) and (B) are based on a percentage of the Series��� total distributions.
The Delaware VIP International Value Equity Series intends to pass through foreign tax credits in the maximum amount of $223,097. The gross foreign source income earned during the fiscal year 2007 by Delaware VIP International Value Equity Series was $4,333,367.
13. Change in Custodian
On August 2, 2007, Mellon, One Mellon Center, Pittsburgh, PA 15258, became the Series’ custodian.
14
Delaware VIP Trust — Delaware VIP International Value Equity Series
Report of Independent Registered Public Accounting Firm
To the Shareholders and Board of Trustees
Delaware VIP Trust–Delaware VIP International Value Equity Series
We have audited the accompanying statement of net assets of the Delaware VIP International Value Equity Series (one of the series constituting Delaware VIP Trust) (the “Series”) as of December 31, 2007, and the related statement of operations for the year then ended, the statements of changes in net assets for each of the two years in the period then ended, and the financial highlights for each of the five years in the period then ended. These financial statements and financial highlights are the responsibility of the Series’ management. Our responsibility is to express an opinion on these financial statements and financial highlights based on our audits.
We conducted our audits in accordance with the standards of the Public Company Accounting Oversight Board (United States). Those standards require that we plan and perform the audit to obtain reasonable assurance about whether the financial statements and financial highlights are free of material misstatement. We were not engaged to perform an audit of the Series’ internal control over financial reporting. Our audits included consideration of internal control over financial reporting as a basis for designing audit procedures that are appropriate in the circumstances, but not for the purpose of expressing an opinion on the effectiveness of the Series’ internal control over financial reporting. Accordingly, we express no such opinion. An audit also includes examining, on a test basis, evidence supporting the amounts and disclosures in the financial statements and financial highlights, assessing the accounting principles used and significant estimates made by management, and evaluating the overall financial statement presentation. Our procedures included confirmation of securities owned as of December 31, 2007, by correspondence with the custodian and brokers or by other appropriate auditing procedures where replies from brokers were not received. We believe that our audits provide a reasonable basis for our opinion.
In our opinion, the financial statements and financial highlights referred to above present fairly, in all material respects, the financial position of the Delaware VIP International Value Equity Series of Delaware VIP Trust at December 31, 2007, the results of its operations for the year then ended, the changes in its net assets for each of the two years in the period then ended, and its financial highlights for each of the five years in the period then ended, in conformity with U.S. generally accepted accounting principles.

Philadelphia, Pennsylvania
February 14, 2008
The Series files its complete schedule of portfolio holdings with the Securities and Exchange Commission (Commission) for the first and third quarters of each fiscal year on Form N-Q. The Series’ Forms N-Q, as well as a description of the policies and procedures that the Series uses to determine how to vote proxies (if any) relating to portfolio securities is available without charge (i) upon request, by calling 800 523-1918; and (ii) on the Commission’s website at http://www.sec.gov. In addition, a description of the policies and procedures that the Series uses to determine how to vote proxies (if any) relating to portfolio securities is available without charge on the Delaware Investments® Funds’ website at http://www.delawareinvestments.com. The Series’ Forms N-Q may be reviewed and copied at the Commission’s Public Reference Room in Washington, DC; information on the operation of the Public Reference Room may be obtained by calling 800 SEC-0330.
Information (if any) regarding how the Series voted proxies relating to portfolio securities during the most recently disclosed 12-month period ended June 30 is available without charge (i) through the Delaware Investments® Funds’ website at http://www.delawareinvestments.com; and (ii) on the Commission’s website at http://www.sec.gov.
15
Delaware Investments® Family of Funds
BOARD OF TRUSTEES/DIRECTORS AND OFFICERS ADDENDUM
A mutual fund is governed by a Board of Trustees/Directors (“Trustees”), which has oversight responsibility for the management of a fund’s business affairs. Trustees establish procedures and oversee and review the performance of the investment manager, the distributor, and others who perform services for the fund. The independent fund trustees, in particular, are advocates for shareholder interests. Each trustee has served in that capacity since he or she was elected to or appointed to the Board of Trustees, and will continue to serve until his or her retirement or the election of a new trustee in his or her place. The following is a list of the Trustees and Officers with certain background and related information.
Name,
Address,
and Birth Date | | Position(s)
Held with
Fund(s) | | Length of Time
Served | | Principal
Occupation(s)
During
Past 5 Years | | Number of
Portfolios in Fund
Complex Overseen
by Trustee
or Officer | | Other
Directorships
Held by
Trustee
or Officer | |
| | | | | | | | | | | |
INTERESTED TRUSTEES | | | | | | | | | |
| | | | | | | | | | | |
Patrick P. Coyne(1)
2005 Market Street
Philadelphia, PA
19103 April 1963 | | Chairman,
President,
Chief Executive
Officer, and
Trustee | | Chairman and Trustee
since August 16, 2006
President and
Chief Executive Officer
since August 1, 2006 | | Patrick P. Coyne has served in
various executive capacities
at different times at
Delaware Investments.(2) | | 84 | | Director –
Kaydon Corp. Board of Governors
Member –
Investment Company Institute
(2007 – present) Member of Investment
Committee –
Cradle of
Liberty Council, BSA
(November 2007 –
present) Finance Committee
Member – St. John
Vianney Roman
Catholic Church
(2007 – present) | |
| | | | | | | | | | | |
INDEPENDENT TRUSTEES | | | | | | | | | |
| | | | | | | | | | | |
Thomas L. Bennett
2005 Market Street
Philadelphia, PA
19103 October 1947 | | Trustee | | Since
March 2005 | | Private Investor –
(March 2004 – Present) Investment Manager –
Morgan Stanley & Co.
(January 1984 – March 2004) | | 84 | | Director –
Bryn Mawr
Bank Corp. (BMTC) (April 2007 – Present)
Chairman of
Investment
Committee –
The Haverford School
(2002 – present)
Chairman of
Investment
Committee –
Pennsylvania Academy
of Fine Arts
(2007 – present)
Trustee
(2004 – present)
Investment Committee
Member –
Pennsylvania
Horticulture Society
(February 2006 –
present) | |
16
Name,
Address,
and Birth Date | | Position(s)
Held with
Fund(s) | | Length of Time
Served | | Principal
Occupation(s)
During
Past 5 Years | | Number of
Portfolios in Fund
Complex Overseen
by Trustee
or Officer | | Other
Directorships
Held by
Trustee
or Officer | |
| | | | | | | | | | | |
INDEPENDENT TRUSTEES (CONTINUED) | | | | | | | |
| | | | | | | | | | | |
John A. Fry
2005 Market Street
Philadelphia, PA
19103 May 1960 | | Trustee | | Since
January 2001 | | President –
Franklin & Marshall College
(June 2002 – Present) Executive Vice President –
University of Pennsylvania
(April 1995 – June 2002) | | 84 | | Director –
Community Health
Systems
Director –
Allied Barton
Security Holdings | |
| | | | | | | | | | | |
Anthony D. Knerr
2005 Market Street
Philadelphia, PA
19103 December 1938 | | Trustee | | Since
April 1990 | | Founder and Managing Director –
Anthony Knerr & Associates
(Strategic Consulting)
(1990 – Present) | | 84 | | None | |
| | | | | | | | | | | |
Lucinda S. Landreth
2005 Market Street
Philadelphia, PA
19103
June 1947 | | Trustee | | Since
March 2005 | | Chief Investment Officer –
Assurant, Inc.
(Insurance)
(2002 – 2004) | | 84 | | None | |
| | | | | | | | | | | |
Ann R. Leven
2005 Market Street
Philadelphia, PA
19103 November 1940 | | Trustee | | Since
October 1989 | | Consultant –
ARL Associates
(Financial Planning)
(1983 – Present) | | 84 | | Director and Audit
Committee Member –
Systemax, Inc. | |
| | | | | | | | | | | |
Thomas F. Madison
2005 Market Street
Philadelphia, PA
19103 February 1936 | | Trustee | | Since
May 1997 | | President and Chief
Executive Officer –
MLM Partners, Inc.
(Small Business Investing
and Consulting)
(January 1993 – Present) | | 84 | | Director –
CenterPoint Energy
Director and Audit
Committee Member –
Digital River, Inc.
Director and Audit
Committee Member –
Rimage
Corporation
Director and Chair of
Compensation and
Governance &
Nominating
Committees –
Valmont Industries, Inc. | |
| | | | | | | | | | | |
Janet L. Yeomans
2005 Market Street
Philadelphia, PA
19103 July 1948 | | Trustee | | Since
April 1999 | | Treasurer
(January 2006 – Present)
Vice President –
Mergers & Acquisitions
(January 2003 – January 2006),
and Vice President
(July 1995 – January 2003)
3M Corporation | | 84 | | None | |
| | | | | | | | | | | |
J. Richard Zecher
2005 Market Street
Philadelphia, PA
19103 July 1940 | | Trustee | | Since
March 2003 | | Founder –
Investor Analytics
(Risk Management)
(May 1999 – Present)
Founder –
Sutton Asset Management
(Hedge Fund)
(September 1998 – Present) | | 84 | | Director and Audit
Committee Member –
Investor Analytics
Director and Audit
Committee Member –
Oxigene, Inc. | |
17
Name,
Address,
and Birth Date | | Position(s)
Held with
Fund(s) | | Length of Time
Served | | Principal
Occupation(s)
During
Past 5 Years | | Number of
Portfolios in Fund
Complex Overseen
by Trustee
or Officer | | Other
Directorships
Held by
Trustee
or Officer | |
| | | | | | | | | | | |
OFFICERS | | | | | | | | | | | |
| | | | | | | | | | | |
David F. Connor
2005 Market Street
Philadelphia, PA
19103 December 1963 | | Vice President,
Deputy General
Counsel, and Secretary | | Vice President since
September 21, 2000
and Secretary
since
October 2005 | | David F. Connor has served as
Vice President and Deputy
General Counsel of
Delaware Investments
since 2000. | | 84 | | None(4) | |
| | | | | | | | | | | |
Daniel V. Geatens
2005 Market Street
Philadelphia, PA
19103 October 1972 | | Vice President
and Treasurer | | Treasurer
since
October 25, 2007 | | Daniel V. Geatens has served in various capacities
at different times at
Delaware Investments. | | 84 | | None(4) | |
| | | | | | | | | | | |
David P. O’Connor
2005 Market Street
Philadelphia, PA
19103 February 1966 | | Senior Vice
President,
General Counsel,
and Chief
Legal Officer | | Senior Vice President,
General Counsel, and
Chief Legal Officer
since
October 2005 | | David P. O’Connor has served in
various executive and legal
capacities at different times at
Delaware Investments. | | 84 | | None(4) | |
| | | | | | | | | | | |
Richard Salus
2005 Market Street
Philadelphia, PA
19103 October 1963 | | Senior
Vice President
and
Chief Financial
Officer | | Chief Financial
Officer since
November 1, 2006 | | Richard Salus has served in
various executive capacities
at different times at
Delaware Investments. | | 84 | | None(4) | |
(1) | Patrick P. Coyne is considered to be an “Interested Trustee” because he is an executive officer of the Fund’s(s’) investment advisor. |
(2) | Delaware Investments is the marketing name for Delaware Management Holdings, Inc. and its subsidiaries, including the Fund’s(s’) investment advisor, principal underwriter, and its transfer agent. |
(3) | In 1997, several funds managed by Voyageur Fund Managers, Inc. (the “Voyageur Funds”) were incorporated into the Delaware Investments Family of Funds. Mr. Madison served as a director of the Voyageur Funds from 1993 until 1997. |
(4) | David F. Connor, Daniel V. Geatens, David P. O’Connor, and Richard Salus serve in similar capacities for the six portfolios of the Optimum Fund Trust, which have the same investment advisor, principal underwriter, and transfer agent as the registrant. |
The Statement of Additional Information for the Fund(s) includes additional information about the Trustees and Officers and is available, without charge, upon request by calling 800 523-1918.
18
Delaware VIP Trust — Delaware VIP REIT Series
For the 12-month period ended Dec. 31, 2007, the Delaware VIP REIT Series returned - -13.94% for Standard Class shares with distributions reinvested, as Service Class shares returned -14.18% with all distributions reinvested. The Series benchmark, the FTSE NAREIT Equity REITs Index, returned -15.69% (source: NAREIT).
Despite a good start to the year, REITs ended their run of calendar-year gains in 2007, as tumultuous credit markets, high valuations, and negative funding flows dragged down the NAREIT Index. The fourth quarter of 2007 was particularly weak and accounted for approximately 80% of the decline in the NAREIT Index for the year. The credit crisis of 2007 increased funding costs across all property sectors, and the absence of the leveraged buyer reduced sales volumes.
Early in the year, the commercial real estate market had peaked, with valuations hitting all-time highs. In the securitized and private equity real estate markets, valuations were also at record highs. That point, in our opinion, was the zenith of the REIT market and the point at which it reversed course — spurred by surging default rates on subprime mortgages, falling home sales numbers, failing mortgage companies, and dramatic write-downs by major investment and money-center banks.
Stock selection led our performance versus the index, with our sector allocation decisions resulting in a minimal contribution to relative returns. On the year, we fared best against the benchmark in sectors such as regional malls, shopping centers, and mixed-use REITs — sectors of the REIT market that showed declines, but where our holdings fared somewhat better.
During the year, specialty REITs were an area of the market that posted positive returns. Although we also made gains in the sector, we were underweight versus the index and underperformed the benchmark constituents. In the sector, we were underweight timber REITs such as Plum Creek and Rayonier, whose intrinsic values have been justified by high per-acre sales of timber. We believed these securities were near to fully valued and decided not to initiate positions or add to existing positions. Stock selection in healthcare and industrial REITs also contributed positively to the Series’ returns versus the index. The Series held Plum Creek at the end of the period; Rayonier was sold during the period.
At the end of the 12-month fiscal period, economic uncertainty had led us to take a defensive posture. REIT investors have recently favored properties that are better insulated against short-term economic stress, including properties featuring long-term leases and high credit–quality tenants.
In our opinion, REIT stocks at year end were at discounts to net asset value (gross real estate value less debt), at levels not seen for nearly a decade. We believe in valuing REIT shares versus real estate, stocks, and bonds in our analyses. At period end, REITs appeared to us cheap versus real estate, fair to slightly expensive compared to bonds, and still expensive versus stocks.
The views expressed are current as of the date of this report and are subject to change.
The performance data quoted below represent past performance; past performance does not guarantee future results. Investment return and principal value will fluctuate so your shares, when redeemed, may be worth more or less than their original cost. Please obtain the performance data for the most recent month end by calling the number noted in the introductory section of this report on the page related to this Series.
You should consider the investment objectives, risks, charges, and expenses of the investment company carefully before investing. The Delaware VIP REIT Series prospectus contains this and other important information about the Series. To obtain a prospectus, contact the company noted on the page related to this Series in the introductory section of this report, either by phone or through the company Web site. We advise you to read the prospectus carefully before you invest.
Delaware VIP REIT Series
Average annual total returns
For periods ended Dec. 31, 2007 | | 1 year | | 5 years | | Lifetime | |
| | | | | | | |
Standard Class shares (commenced operations May 4, 1998) | | -13.94 | % | +16.59 | % | +11.45 | % |
| | | | | | | |
Service Class shares (commenced operations May 1, 2000) | | -14.18 | % | +16.30 | % | +14.87 | % |
As disclosed in the Series’ most recent prospectus, expenses for Standard Class and Service Class shares were as follows: The net expense ratios for Standard Class and Service Class shares of the Series were 0.83% and 1.08%, respectively. Total operating expenses for Standard Class and Service Class shares were 0.83% and 1.13%, respectively. Management fees for Standard Class and Service Class shares were 0.73%.
Management has contracted to reimburse expenses or waive all or a portion of its management fees from May 1, 2007, through April 30, 2008, as disclosed in the most recent prospectus.
1
Earnings from a variable annuity or variable life investment compound tax-free until withdrawal and, as a result, no adjustments were made for income taxes.
An expense limitation was in effect for all classes during the periods shown in the Series performance chart on previous page and in the Performance of a $10,000 Investment chart below.
Performance data does not reflect insurance fees related to a variable annuity or variable life investment or the deferred sales charge that would apply to certain withdrawals of investments held for fewer than eight years. Performance shown here would have been reduced if such fees were included and the expense limitation removed. For more information about fees, consult your variable annuity or variable life prospectus.
Investments in variable products involve risk. Series that invest in REITs are subject to many of the risks associated with direct real estate ownership and, as such, may be adversely affected by declines in real estate values, and general and local economic conditions. Series that concentrate investments in one industry may involve greater risks than more diversified funds, including more potential for volatility. The Series is also affected by interest rate changes, particularly if the REITs held in the portfolio use floating rate debt to finance their ongoing obligations. Some portfolios offer more risk than others.
Please read both the contract and underlying prospectus for specific details regarding the product’s risk profile.
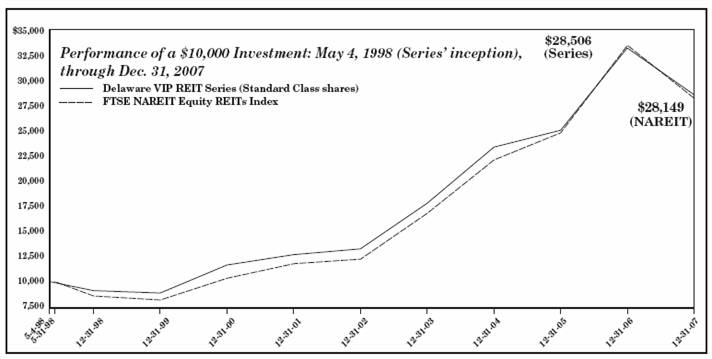
The chart shows a $10,000 investment in the Delaware VIP REIT Series Standard Class shares for the period from the Series’ inception on May 4, 1998, through Dec. 31, 2007. Performance of Service Class shares will vary due to different charges and expenses.
The chart also shows $10,000 invested in the FTSE NAREIT Equity REITs Index for the period from May 31, 1998, through Dec. 31, 2007. The FTSE NAREIT Equity REITs Index is a composite of real estate investment trusts that invest in many types of U.S. properties. An index is unmanaged and does not reflect the costs of operating a mutual fund, such as the costs of buying, selling, and holding securities. You cannot invest directly in an index.
2
Delaware VIP Trust — Delaware VIP REIT Series
Disclosure of Series Expenses
For the Period July 1, 2007 to December 31, 2007
As a shareholder of the Series, you incur ongoing costs, including management fees; distribution and/or service (12b-1) fees; and other Series expenses. This Example is intended to help you understand your ongoing costs (in dollars) of investing in the Series and to compare these costs with the ongoing costs of investing in other mutual funds.
The Example is based on an investment of $1,000 invested at the beginning of the period and held for the entire period from July 1, 2007 to December 31, 2007.
Actual Expenses
The first section of the table shown, “Actual Series Return,” provides information about actual account values and actual expenses. You may use the information in this section of the table, together with the amount you invested, to estimate the expenses that you paid over the period. Simply divide your account value by $1,000 (for example, an $8,600 account value divided by $1,000 = 8.6), then multiply the result by the number in the first section under the heading entitled “Expenses Paid During Period” to estimate the expenses you paid on your account during the period.
Hypothetical Example for Comparison Purposes
The second section of the table shown, “Hypothetical 5% Return,” provides information about hypothetical account values and hypothetical expenses based on the Series’ actual expense ratio and an assumed rate of return of 5% per year before expenses, which is not the Series’ actual return. The hypothetical account values and expenses may not be used to estimate the actual ending account balance or expenses you paid for the period. You may use this information to compare the ongoing costs of investing in the Series and other funds. To do so, compare the 5% hypothetical example with the 5% hypothetical examples that appear in the shareholder reports of other funds.
Please note that the expenses shown in the table are meant to highlight your ongoing costs only. As a shareholder of the Series, you do not incur any transaction costs, such as sales charges (loads), redemption fees or exchange fees, but shareholders of other funds may incur such costs. Also, the fees related to the variable annuity investment or the deferred sales charge that could apply have not been included. Therefore, the second section of the table is useful in comparing ongoing costs only, and will not help you determine the relative total costs of owning different funds. The Series’ actual expenses shown in the table reflect fee waivers in effect for Service Class shares. The expenses shown in the table assume reinvestment of all dividends and distributions.
Expense Analysis of an Investment of $1,000
| | Beginning
Account
Value
7/1/07 | | Ending
Account
Value
12/31/07 | | Annualized
Expense
Ratios | | Expenses
Paid During
Period
7/1/07 to
12/31/07* | |
Actual Series Return | | | | | | | | | |
Standard Class | | $ | 1,000.00 | | $ | 906.10 | | 0.83 | % | $ | 3.99 | |
Service Class | | 1,000.00 | | 904.90 | | 1.08 | % | 5.19 | |
Hypothetical 5% Return (5% return before expenses) | | | | | | | | | |
Standard Class | | $ | 1,000.00 | | $ | 1,021.02 | | 0.83 | % | $ | 4.23 | |
Service Class | | 1,000.00 | | 1,019.76 | | 1.08 | % | 5.50 | |
* “Expenses Paid During Period” are equal to the Series’ annualized expense ratio, multiplied by the average account value over the period, multiplied by 184/365 (to reflect the one-half year period).
3
Delaware VIP Trust — Delaware VIP REIT Series
Sector Allocation and Top 10 Holdings
As of December 31, 2007
Sector designations may be different than the sector designations presented in other Series materials.
Sector | | Percentage
of Net Assets | |
Common Stock | | 96.18 | % |
Diversified REITs | | 6.20 | % |
Health Care REITs | | 7.48 | % |
Hotel REITs | | 5.93 | % |
Industrial REITs | | 8.43 | % |
Mall REITs | | 16.53 | % |
Manufactured Housing REITs | | 1.51 | % |
Multifamily REITs | | 11.94 | % |
Office REITs | | 13.08 | % |
Office/Industrial REITs | | 2.70 | % |
Real Estate Operating Companies | | 3.44 | % |
Self-Storage REITs | | 4.72 | % |
Shopping Center REITs | | 12.34 | % |
Specialty REITs | | 1.88 | % |
Discount Note | | 3.25 | % |
Securities Lending Collateral | | 21.80 | % |
Total Value of Securities | | 121.23 | % |
Obligation to Return Securities Lending Collateral | | (21.80 | )% |
Receivables and Other Assets Net of Liabilities | | 0.57 | % |
Total Net Assets | | 100.00 | % |
Holdings are for informational purposes only and are subject to change at any time. They are not a recommendation to buy, sell, or hold any security.
Top 10 Holdings | | Percentage
of Net Assets | |
Simon Property Group | | 8.79 | % |
Vornado Realty Trust | | 6.20 | % |
ProLogis | | 5.13 | % |
Boston Properties | | 5.03 | % |
Public Storage | | 4.72 | % |
General Growth Properties | | 4.49 | % |
Host Hotels & Resorts | | 3.94 | % |
Equity Residential | | 3.76 | % |
Ventas | | 3.45 | % |
Kimco Realty | | 3.41 | % |
4
Delaware VIP Trust — Delaware VIP REIT Series
Statement of Net Assets
December 31, 2007
| | Number of
Shares | | Value | |
| | | | | | |
| COMMON STOCK–96.18% | | | | | |
| Diversified REITs–6.20% | | | | | |
* | Vornado Realty Trust | | 343,601 | | $ | 30,219,708 | |
| | | | | 30,219,708 | |
| Health Care REITs–7.48% | | | | | |
| HCP | | 269,000 | | 9,355,820 | |
* | Health Care REIT | | 230,500 | | 10,301,045 | |
* | Ventas | | 371,300 | | 16,801,325 | |
| | | | | 36,458,190 | |
| Hotel REITs–5.93% | | | | | |
* | Ashford Hospitality Trust | | 515,600 | | 3,707,164 | |
| Hersha Hospitality Trust | | 628,690 | | 5,972,555 | |
* | Host Hotels & Resorts | | 1,128,096 | | 19,222,756 | |
| | | | | 28,902,475 | |
| Industrial REITs–8.43% | | | | | |
* | AMB Property | | 280,055 | | 16,119,966 | |
| ProLogis | | 394,193 | | 24,983,952 | |
| | | | | 41,103,918 | |
| Mall REITs–16.53% | | | | | |
* | General Growth Properties | | 531,523 | | 21,888,117 | |
* | Macerich | | 223,100 | | 15,853,486 | |
* | Simon Property Group | | 493,199 | | 42,839,266 | |
| | | | | 80,580,869 | |
| Manufactured Housing REITs–1.51% | | | | | |
| Equity Lifestyle Properties | | 161,600 | | 7,380,272 | |
| | | | | 7,380,272 | |
| Multifamily REITs–11.94% | | | | | |
* | Apartment Investment & Management | | 263,900 | | 9,165,247 | |
* | AvalonBay Communities | | 93,474 | | 8,799,642 | |
* | BRE Properties | | 225,500 | | 9,139,515 | |
* | Equity Residential | | 502,400 | | 18,322,528 | |
* | Essex Property Trust | | 40,608 | | 3,958,874 | |
* | Home Properties | | 87,700 | | 3,933,345 | |
* | UDR | | 245,100 | | 4,865,235 | |
| | | | | 58,184,386 | |
| Office REITs–13.08% | | | | | |
* | Alexandria Real Estate Equities | | 102,596 | | 10,430,935 | |
* | Boston Properties | | 267,200 | | 24,531,632 | |
* | Highwoods Properties | | 197,100 | | 5,790,798 | |
* | Kilroy Realty | | 138,600 | | 7,617,456 | |
* | SL Green Realty | | 164,637 | | 15,386,974 | |
| | | | 63,757,795 | |
| Office/Industrial REITs–2.70% | | | | | |
* | Digital Realty Trust | | 254,600 | | $ | 9,769,002 | |
| PS Business Parks | | 64,200 | | 3,373,710 | |
| | | | | 13,142,712 | |
| Real Estate Operating Companies–3.44% | | | | | |
| Brookfield Properties | | 343,300 | | 6,608,525 | |
* | Marriott International Class A | | 161,100 | | 5,506,398 | |
| Starwood Hotels & Resorts Worldwide | | 106,250 | | 4,678,188 | |
| | | | | 16,793,111 | |
| Self-Storage REITs–4.72% | | | | | |
* | Public Storage | | 313,100 | | 22,984,671 | |
| | | | | 22,984,671 | |
| Shopping Center REITs–12.34% | | | | | |
* | Developers Diversified Realty | | 155,378 | | 5,949,424 | |
* | Equity One | | 171,000 | | 3,938,130 | |
* | Federal Realty Investment Trust | | 184,089 | | 15,122,911 | |
* | Kimco Realty | | 456,100 | | 16,602,040 | |
* | Kite Realty Group Trust | | 325,196 | | 4,965,743 | |
| Regency Centers | | 210,539 | | 13,577,660 | |
| | | | | 60,155,908 | |
| Specialty REITs–1.88% | | | | | |
* | Plum Creek Timber | | 199,000 | | 9,161,960 | |
| | | | | 9,161,960 | |
| Total Common Stock
(cost $543,162,150) | | | | 468,825,975 | |
| | | | | | | | |
| | Principal
Amount | | | |
| | | | | | |
¹ | DISCOUNT NOTE–3.25% | | | | | |
| Federal Home Loan Bank 3.25% 1/2/08 | | $ | 15,827,857 | | 15,826,443 | |
| Total Discount Note
(cost $15,826,443) | | | | 15,826,443 | |
| Total Value of Securities Before Securities Lending Collateral–99.43%
(cost $558,988,593) | | | | 484,652,418 | |
| | | | | | | |
| | Number of
Shares | | | |
| | | | | | |
| SECURITIES LENDING COLLATERAL**–21.80% | | | | | |
| Investment Companies | | | | | |
| Mellon GSL DBT II Collateral Fund | | 106,251,507 | | 106,251,507 | |
| Total Securities Lending Collateral
(cost $106,251,507) | | | | 106,251,507 | |
5
TOTAL VALUE OF SECURITIES–121.23% (cost $665,240,100) | | $ | 590,903,925 | © |
OBLIGATION TO RETURN SECURITIES LENDING COLLATERAL**–(21.80%) | | (106,251,507 | ) |
RECEIVABLES AND OTHER ASSETS NET OF LIABILITIES–0.57% | | 2,781,890 | |
NET ASSETS APPLICABLE TO 30,829,454 SHARES OUTSTANDING–100.00% | | $ | 487,434,308 | |
NET ASSET VALUE–DELAWARE VIP REIT SERIES STANDARD CLASS
($250,071,806 / 15,797,903 Shares) | | $ | 15.83 | |
NET ASSET VALUE–DELAWARE VIP REIT SERIES SERVICE CLASS
($237,362,502 / 15,031,551 Shares) | | $ | 15.79 | |
COMPONENTS OF NET ASSETS AT DECEMBER 31, 2007: | | | |
Shares of beneficial interest (unlimited authorization–no par) | | $ | 408,744,622 | |
Undistributed net investment income | | 12,461,749 | |
Accumulated net realized gain on investments | | 140,564,112 | |
Net unrealized depreciation of investments | | (74,336,175 | ) |
Total net assets | | $ | 487,434,308 | |
REIT – Real Estate Investment Trust
¹ | The rate shown is the effective yield at the time of purchase. |
* | Fully or partially on loan. |
** | See Note 8 in “Notes to Financial Statements.” |
© | Includes $114,399,383 of securities loaned. |
See accompanying notes
6
Delaware VIP Trust — Delaware VIP REIT Series
Statement of Operations
Year Ended December 31, 2007
INVESTMENT INCOME: | | | |
Dividends | | $ | 15,690,910 | |
Interest | | 1,124,938 | |
Securities lending income | | 181,084 | |
Foreign tax withheld | | (33,019 | ) |
| | 16,963,913 | |
EXPENSES: | | | |
Management fees | | 5,804,058 | |
Distribution expenses – Service Class | | 918,987 | |
Accounting and administration expenses | | 318,047 | |
Reports and statements to shareholders | | 160,488 | |
Legal fees | | 98,104 | |
Dividend disbursing and transfer agent fees and expenses | | 90,002 | |
Audit and tax | | 43,427 | |
Trustees’ fees | | 38,796 | |
Taxes (other than taxes on income) | | 19,575 | |
Consulting fees | | 17,190 | |
Custodian fees | | 15,032 | |
Insurance fees | | 13,031 | |
Dues and services | | 5,137 | |
Trustees’ expenses | | 4,264 | |
Pricing fees | | 467 | |
| | 7,546,605 | |
Less waiver of distribution expenses – Service Class | | (153,165 | ) |
Less expense paid indirectly | | (7,256 | ) |
Total operating expenses | | 7,386,184 | |
| | | |
NET INVESTMENT INCOME | | 9,577,729 | |
| | | |
NET REALIZED AND UNREALIZED GAIN (LOSS) ON INVESTMENTS: | | | |
Net realized gain on investments | | 144,195,167 | |
Net change in unrealized appreciation/depreciation of investments | | (250,820,722 | ) |
| | | |
NET REALIZED AND UNREALIZED LOSS ON INVESTMENTS | | (106,625,555 | ) |
| | | |
NET DECREASE IN NET ASSETS RESULTING FROM OPERATIONS | | $ | (97,047,826 | ) |
See accompanying notes
Delaware VIP Trust — Delaware VIP REIT Series
Statements of Changes in Net Assets
| | Year Ended | |
| | 12/31/07 | | 12/31/06 | |
INCREASE (DECREASE) IN NET ASSETS FROM OPERATIONS: | | | | | |
Net investment income | | $ | 9,577,729 | | $ | 15,460,663 | |
Net realized gain on investments | | 144,195,167 | | 195,940,779 | |
Net change in unrealized appreciation/depreciation of investments | | (250,820,722 | ) | 30,768,216 | |
Net increase (decrease) in net assets resulting from operations | | (97,047,826 | ) | 242,169,658 | |
| | | | | |
DIVIDENDS AND DISTRIBUTIONS TO SHAREHOLDERS FROM: | | | | | |
Net investment income: | | | | | |
Standard Class | | (9,041,997 | ) | (13,253,838 | ) |
Service Class | | (3,547,975 | ) | (3,839,355 | ) |
Net realized gain on investments: | | | | | |
Standard Class | | (135,325,510 | ) | (44,190,646 | ) |
Service Class | | (64,108,734 | ) | (14,446,942 | ) |
| | (212,024,216 | ) | (75,730,781 | ) |
CAPITAL SHARE TRANSACTIONS: | | | | | |
Proceeds from shares sold: | | | | | |
Standard Class | | 75,197,309 | | 141,651,178 | |
Service Class | | 71,656,487 | | 86,531,629 | |
Net asset value of shares issued upon reinvestment of dividends and distributions: | | | | | |
Standard Class | | 144,367,507 | | 57,444,484 | |
Service Class | | 67,656,709 | | 18,286,297 | |
| | 358,878,012 | | 303,913,588 | |
Cost of shares repurchased: | | | | | |
Standard Class | | (444,572,124 | ) | (278,178,009 | ) |
Service Class | | (105,088,495 | ) | (44,657,293 | ) |
| | (549,660,619 | ) | (322,835,302 | ) |
Decrease in net assets derived from capital share transactions | | (190,782,607 | ) | (18,921,714 | ) |
| | | | | |
NET INCREASE (DECREASE) IN NET ASSETS | | (499,854,649 | ) | 147,517,163 | |
NET ASSETS: | | | | | |
Beginning of year | | 987,288,957 | | 839,771,794 | |
End of year (including undistributed net investment income of $12,461,749 and $15,460,663, respectively) | | $ | 487,434,308 | | $ | 987,288,957 | |
See accompanying notes
7
Delaware VIP Trust — Delaware VIP REIT Series
Financial Highlights
Selected data for each share of the Series outstanding throughout each period were as follows:
| | Delaware VIP REIT Series Standard Class | |
| | Year Ended | |
| | 12/31/07 | | 12/31/06 | | 12/31/05 | | 12/31/04 | | 12/31/03 | |
| | | | | | | | | | | |
Net asset value, beginning of period | | $ | 22.860 | | $ | 18.770 | | $ | 19.080 | | $ | 15.140 | | $ | 11.730 | |
| | | | | | | | | | | |
Income (loss) from investment operations: | | | | | | | | | | | |
Net investment income(1) | | 0.253 | | 0.378 | | 0.523 | | 0.504 | | 0.586 | |
Net realized and unrealized gain (loss) on investments | | (2.541 | ) | 5.424 | | 0.618 | | 4.112 | | 3.271 | |
Total from investment operations | | (2.288 | ) | 5.802 | | 1.141 | | 4.616 | | 3.857 | |
| | | | | | | | | | | |
Less dividends and distributions from: | | | | | | | | | | | |
Net investment income | | (0.297 | ) | (0.395 | ) | (0.360 | ) | (0.332 | ) | (0.342 | ) |
Net realized gain on investments | | (4.445 | ) | (1.317 | ) | (1.091 | ) | (0.344 | ) | (0.105 | ) |
Total dividends and distributions | | (4.742 | ) | (1.712 | ) | (1.451 | ) | (0.676 | ) | (0.447 | ) |
| | | | | | | | | | | |
Net asset value, end of period | | $ | 15.830 | | $ | 22.860 | | $ | 18.770 | | $ | 19.080 | | $ | 15.140 | |
| | | | | | | | | | | |
Total return(2) | | (13.94 | )% | 32.63 | % | 7.17 | % | 31.38 | % | 34.02 | % |
| | | | | | | | | | | |
Ratios and supplemental data: | | | | | | | | | | | |
Net assets, end of period (000 omitted) | | $ | 250,072 | | $ | 672,738 | | $ | 637,889 | | $ | 624,223 | | $ | 359,958 | |
Ratio of expenses to average net assets | | 0.83 | % | 0.84 | % | 0.85 | % | 0.84 | % | 0.86 | % |
Ratio of net investment income to average net assets | | 1.30 | % | 1.87 | % | 2.89 | % | 3.11 | % | 4.51 | % |
Portfolio turnover | | 72 | % | 100 | % | 42 | % | 38 | % | 37 | % |
(1)The average shares outstanding method has been applied for per share information.
(2)Total investment return is based on the change in net asset value of a share during the period and assumes reinvestment of dividends and distributions at net asset value.
See accompanying notes
8
Selected data for each share of the Series outstanding throughout each period were as follows:
| | Delaware VIP REIT Series Service Class
Year Ended | |
| | 12/31/07 | | 12/31/06 | | 12/31/05 | | 12/31/04 | | 12/31/03 | |
| | | | | | | | | | | |
Net asset value, beginning of period | | $ | 22.820 | | $ | 18.740 | | $ | 19.050 | | $ | 15.130 | | $ | 11.720 | |
| | | | | | | | | | | |
Income (loss) from investment operations: | | | | | | | | | | | |
Net investment income(1) | | 0.205 | | 0.327 | | 0.478 | | 0.464 | | 0.556 | |
Net realized and unrealized gain (loss) on investments | | (2.544 | ) | 5.420 | | 0.622 | | 4.102 | | 3.283 | |
Total from investment operations | | (2.339 | ) | 5.747 | | 1.100 | | 4.566 | | 3.839 | |
| | | | | | | | | | | |
Less dividends and distributions from: | | | | | | | | | | | |
Net investment income | | (0.246 | ) | (0.350 | ) | (0.319 | ) | (0.302 | ) | (0.324 | ) |
Net realized gain on investments | | (4.445 | ) | (1.317 | ) | (1.091 | ) | (0.344 | ) | (0.105 | ) |
Total dividends and distributions | | (4.691 | ) | (1.667 | ) | (1.410 | ) | (0.646 | ) | (0.429 | ) |
| | | | | | | | | | | |
Net asset value, end of period | | $ | 15.790 | | $ | 22.820 | | $ | 18.740 | | $ | 19.050 | | $ | 15.130 | |
| | | | | | | | | | | |
Total return(2) | | (14.18 | )% | 32.32 | % | 6.86 | % | 31.09 | % | 33.73 | % |
| | | | | | | | | | | |
Ratios and supplemental data: | | | | | | | | | | | |
Net assets, end of period (000 omitted) | | $ | 237,362 | | $ | 314,551 | | $ | 201,883 | | $ | 160,976 | | $ | 68,276 | |
Ratio of expenses to average net assets | | 1.08 | % | 1.09 | % | 1.10 | % | 1.09 | % | 1.08 | % |
Ratio of expenses to average net assets prior to expense limitation and expenses paid indirectly | | 1.13 | % | 1.14 | % | 1.15 | % | 1.14 | % | 1.11 | % |
Ratio of net investment income to average net assets | | 1.05 | % | 1.62 | % | 2.64 | % | 2.86 | % | 4.29 | % |
Ratio of net investment income to average net assets prior to expense limitation and expenses paid indirectly | | 1.00 | % | 1.57 | % | 2.59 | % | 2.81 | % | 4.26 | % |
Portfolio turnover | | 72 | % | 100 | % | 42 | % | 38 | % | 37 | % |
(1)The average shares outstanding method has been applied for per share information.
(2)Total investment return is based on the change in net asset value of a share during the period and assumes reinvestment of dividends and distributions at net asset value. Total investment return reflects a waiver by the distributor. Performance would have been lower had the waiver not been in effect.
See accompanying notes
9
Delaware VIP Trust — Delaware VIP REIT Series
Notes to Financial Statements
December 31, 2007
Delaware VIP Trust (Trust) is organized as a Delaware statutory trust and offers 14 series: Delaware VIP Balanced Series, Delaware VIP Capital Reserves Series, Delaware VIP Cash Reserve Series, Delaware VIP Diversified Income Series, Delaware VIP Emerging Markets Series, Delaware VIP Growth Opportunities Series, Delaware VIP High Yield Series, Delaware VIP International Value Equity Series, Delaware VIP REIT Series, Delaware VIP Select Growth Series, Delaware VIP Small Cap Value Series, Delaware VIP Trend Series, Delaware VIP U.S. Growth Series and Delaware VIP Value Series. These financial statements and the related notes pertain to Delaware VIP REIT Series (Series). The Trust is an open-end investment company. The Series is considered non-diversified under the Investment Company Act of 1940, as amended, and offers Standard Class and Service Class shares. The Standard Class shares do not carry a 12b-1 fee and the Service Class shares carry a 12b-1 fee. The shares of the Series are sold only to separate accounts of life insurance companies.
The investment objective of the Series is to seek maximum long-term total return, with capital appreciation as a secondary objective.
1. Significant Accounting Policies
The following accounting policies are in accordance with U.S. generally accepted accounting principles and are consistently followed by the Series.
Security Valuation—Equity securities, except those traded on the Nasdaq Stock Market, Inc. (Nasdaq), are valued at the last quoted sales price as of the time of the regular close of the New York Stock Exchange (NYSE) on the valuation date. Securities traded on the Nasdaq are valued in accordance with the Nasdaq Official Closing Price, which may not be the last sales price. If on a particular day an equity security does not trade, then the mean between the bid and asked prices will be used. Short-term debt securities having less than 60 days to maturity are valued at amortized cost, which approximates market value. Securities lending collateral, which is invested in a collective investment vehicle, is valued at unit value per share. Other securities and assets for which market quotations are not readily available are valued at fair value as determined in good faith under the direction of the Series’ Board of Trustees. In determining whether market quotations are readily available or fair valuation will be used, various factors will be taken into consideration, such as market closures, or with respect to foreign securities, aftermarket trading, or significant events after local market trading (e.g., government actions or pronouncements, trading volume or volatility on markets, exchanges among dealers, or news events).
In September 2006, the Financial Accounting Standards Board (FASB) issued FASB Statement No. 157 “Fair Value Measurements” (Statement 157). Statement 157 establishes a framework for measuring fair value in U.S. generally accepted accounting principles, clarifies the definition of fair value within that framework, and expands disclosures about the use of fair value measurements. Statement 157 is intended to increase consistency and comparability among fair value estimates used in financial reporting. Statement 157 is effective for fiscal years beginning after November 15, 2007. Management does not expect the adoption of Statement 157 to have a material impact on the amounts reported in the financial statements.
Federal Income Taxes—The Series intends to continue to qualify for federal income tax purposes as a regulated investment company under Subchapter M of the Internal Revenue Code of 1986, as amended, and make the requisite distributions to shareholders. Accordingly, no provision for federal income taxes has been made in the financial statements.
Effective June 29, 2007, the Series adopted FASB Interpretation No. 48 “Accounting for Uncertainty in Income Taxes” (FIN 48).
FIN 48 provides guidance for how uncertain tax positions should be recognized, measured, presented and disclosed in the financial statements. FIN 48 requires the evaluation of tax positions taken or expected to be taken in the course of preparing the Series’ tax returns to determine whether the tax positions are “more-likely-than-not” of being sustained by the applicable tax authority. Tax positions not deemed to meet the more-likely-than-not threshold are recorded as a tax benefit or expense in the current year. The adoption of FIN 48 did not result in the recording of any tax benefit or expense in the current period.
Class Accounting—Investment income, common expenses and realized and unrealized gain (loss) on investments are allocated to the classes of the Series on the basis of daily net assets of each class. Distribution expenses relating to a specific class are charged directly to that class.
Repurchase Agreements—The Series may invest in a pooled cash account along with members of the Delaware Investments® Family of Funds pursuant to an exemptive order issued by the Securities and Exchange Commission. The aggregate daily balance of the pooled cash account is invested in repurchase agreements secured by obligations of the U.S. government. The respective collateral is held by the Series’ custodian bank until the maturity of the respective repurchase agreements. Each repurchase agreement is at least 102% collateralized. However, in the event of default or bankruptcy by the counterparty to the agreement, realization of the collateral may be subject to legal proceedings. At December 31, 2007, the Series held no investments in repurchase agreements.
Use of Estimates—The preparation of financial statements in conformity with U.S. generally accepted accounting principles requires management to make estimates and assumptions that affect the reported amounts of assets and liabilities at the date of the financial statements and the reported amounts of revenues and expenses during the reporting period. Actual results could differ from those estimates.
Other—Expenses directly attributable to the Series are charged directly to the Series. Other expenses common to various funds within the Delaware Investments® Family of Funds are generally allocated amongst such funds on the basis of average net assets. Management fees and some other expenses are paid monthly. Security transactions are recorded on the date the securities are purchased or sold (trade date) for financial reporting purposes. Costs used in calculating realized gains and losses on the sale of investment securities are those of the specific securities sold. Dividend income is recorded on the ex-dividend date and interest income is recorded on the accrual basis. Distributions received from investments in real estate investment trusts (REITs) are recorded as dividend income on ex-dividend date, subject to reclassification upon notice of the character of such distributions by the issuer. The financial statements reflect an estimate of the reclassification of the distribution character.
The Series declares and pays dividends from net investment income and distributions from net realized gain on investments, if any, following the close of the fiscal year.
10
Delaware VIP REIT Series
Notes to Financial Statements (continued)
1. Significant Accounting Policies (continued)
Subject to seeking best execution, the Series may direct certain security trades to brokers who have agreed to rebate a portion of the related brokerage commission to the Series in cash. Such commission rebates are included in realized gain on investments in the accompanying financial statements and totaled $2,002 for the year ended December 31, 2007. In general, best execution refers to many factors, including the price paid or received for a security, the commission charged, the promptness and reliability of execution, the confidentiality and placement accorded the order, and other factors affecting the overall benefit obtained by the Series on the transaction.
The Series receives earnings credits from its custodian when positive cash balances are maintained, which are used to offset custody fees. The expense paid under this arrangement is included in custodian fees on the Statement of Operations with the corresponding expense offset shown as “expense paid indirectly.”
2. Investment Management, Administration Agreements and Other Transactions with Affiliates
In accordance with the terms of its investment management agreement, the Series pays Delaware Management Company (DMC), a series of Delaware Management Business Trust and the investment manager, an annual fee which is calculated daily at the rate of 0.75% on the first $500 million of average daily net assets of the Series, 0.70% on the next $500 million, 0.65% on the next $1.5 billion, and 0.60% on average daily net assets in excess of $2.5 billion.
DMC has contractually agreed to waive that portion, if any, of its management fee and reimburse the Series to the extent necessary to ensure that total annual operating expenses, exclusive of taxes, interest, brokerage fees, 12b-1 plan expenses, certain insurance costs and non-routine expenses or costs including, but not limited to, those relating to reorganizations, litigation, conducting shareholder meetings, and liquidations, do not exceed 1.00% of average daily net assets of the Series through April 30, 2008. No reimbursement was due for the year ended December 31, 2007.
Effective October 1, 2007, Delaware Service Company, Inc. (DSC), an affiliate of DMC, provides fund accounting and financial administration oversight services to the Series. For these services, the Series pays DSC fees based on the aggregate daily net assets of the Delaware Investments® Family of Funds at the following annual rate: 0.0050% of the first $30 billion; 0.0045% of the next $10 billion; 0.0040% of the next $10 billion; and 0.0025% of aggregate average daily net assets in excess of $50 billion. The fees payable to DSC under the service agreement described above are allocated among all funds in the Delaware Investments® Family of Funds on a relative net asset value basis. Prior to October 1, 2007, DSC provided fund accounting and administrative services to the Series and received a fee at an annual rate of 0.04% of average daily net assets. For the year ended December 31, 2007, the Series was charged $270,324 for these services.
DSC also provides dividend disbursing and transfer agency services. The Series pays DSC a monthly fee based on the number of shareholder accounts for dividend disbursing and transfer agent services.
Pursuant to a distribution agreement and distribution plan, the Series pays Delaware Distributors, L.P. (DDLP), the distributor and an affiliate of DMC, an annual distribution and service fee not to exceed 0.30% of the average daily net assets of the Service Class shares. DDLP has contracted to waive distribution and service fees through April 30, 2008 in order to prevent distribution and service fees of the Service Class shares from exceeding 0.25% of average daily net assets. Standard Class shares pay no distribution and service expenses.
At December 31, 2007, the Series had liabilities payable to affiliates as follows:
Investment
Management
Fee Payable to
DMC | | Dividend Disbursing,
Transfer Agent
Fees and Other Expenses
Payable to DSC | | Distribution
Fees Payable
to DDLP | | Other Expenses
Payable to DMC
and Affiliates* | |
$ | 320,644 | | $ | 9,277 | | $ | 52,041 | | $ | 69,109 | |
| | | | | | | | | | | |
*DMC, as part of its administrative services, pays operating expenses on behalf of the Series and is reimbursed on a periodic basis. Such expenses include items such as printing of shareholder reports, fees for audit, legal and tax services, custodian fees and trustees’ fees.
As provided in the investment management agreement, the Series bears the cost of certain legal and tax services, including internal legal and tax services provided to the Series by DMC and/or its affiliates’ employees. For the year ended December 31, 2007, the Series was charged $39,799 for internal legal and tax services provided by DMC and/or its affiliates’ employees.
Trustees’ fees include expenses accrued by the Series for each Trustee’s retainer and per meeting fees. Certain officers of DMC, DSC and DDLP are officers and/or Trustees of the Trust. These officers and Trustees are paid no compensation by the Series.
11
Delaware VIP REIT Series
Notes to Financial Statements (continued)
3. Investments
For the year ended December 31, 2007, the Series made purchases and sales of investment securities other than short-term investments as follows:
Purchases | | $ | 552,042,176 | |
Sales | | 930,903,377 | |
At December 31, 2007, the cost of investments for federal income tax purposes and unrealized appreciation (depreciation) for the Series were as follows:
Cost of
Investments | | Aggregate
Unrealized
Appreciation | | Aggregate
Unrealized
Depreciation | | Net Unrealized
Depreciation | |
$ | 670,109,164 | | $ | 8,719,696 | | $ | (87,924,935 | ) | $ | (79,205,239 | ) |
| | | | | | | | | | | |
4. Dividend and Distribution Information
Income and long-term capital gain distributions are determined in accordance with federal income tax regulations, which may differ from U.S. generally accepted accounting principles. Additionally, net short-term gains on sales of investment securities are treated as ordinary income for federal income tax purposes. The tax character of dividends and distributions paid during the years ended December 31, 2007 and 2006 was as follows:
| | Year
Ended
12/31/07 | | Year
Ended
12/31/06 | |
Ordinary income | | $ | 45,545,390 | | $ | 17,111,655 | |
Long-term capital gain | | 166,478,826 | | 58,619,126 | |
Total | | $ | 212,024,216 | | $ | 75,730,781 | |
5. Components of Net Assets on a Tax Basis
As of December 31, 2007, the components of net assets on a tax basis were as follows:
Shares of beneficial interest | | $ | 408,744,622 | |
Undistributed ordinary income | | 41,089,862 | |
Undistributed long-term capital gain | | 116,805,063 | |
Unrealized depreciation of investments | | (79,205,239 | ) |
Net assets | | $ | 487,434,308 | |
The differences between book basis and tax basis components of net assets are primarily attributable to tax deferral of losses on wash sales.
The undistributed earnings for the Series may be subject to reclassification upon notice of the tax character of distributions received from investments in REITs.
For financial reporting purposes, capital accounts are adjusted to reflect the tax character of permanent book/tax differences. Reclassifications are primarily due to tax treatment of REIT dividends and distributions. Results of operations and net assets were not affected by these reclassifications. For the year ended December 31, 2007, the Series recorded the following reclassifications:
Undistributed
Net
Investment Income | | Accumulated
Net Realilzed
Gain | |
$ | 13,329 | | $ | (13.329 | ) |
| | | | | |
12
Delaware VIP REIT Series
Notes to Financial Statements (continued)
6. Capital Shares
Transactions in capital shares were as follows:
| | Year
Ended
12/31/07 | | Year
Ended
12/31/06 | |
Shares sold: | | | | | |
Standard Class | | 3,319,228 | | 6,992,847 | |
Service Class | | 3,502,721 | | 4,285,149 | |
| | | | | |
Shares issued upon reinvestment of dividends
and distributions: | | | | | |
Standard Class | | 7,392,090 | | 2,985,680 | |
Service Class | | 3,466,020 | | 950,431 | |
| | 17,680,059 | | 15,214,107 | |
Shares repurchased: | | | | | |
Standard Class | | (24,342,883 | ) | (14,534,587 | ) |
Service Class | | (5,724,040 | ) | (2,221,709 | ) |
| | (30,066,923 | ) | (16,756,296 | ) |
Net decrease | | (12,386,864 | ) | (1,542,189 | ) |
7. Line of Credit
The Series, along with certain other funds in the Delaware Investments® Family of Funds (Participants), participates in a $225,000,000 revolving line of credit facility to be used for temporary or emergency purposes as an additional source of liquidity to fund redemptions of investor shares. The Participants are charged an annual commitment fee, which is allocated across the Participants on the basis of each Participant’s allocation of the entire facility. The Participants may borrow up to a maximum of one third of their net assets under the agreement. The Series had no amounts outstanding as of December 31, 2007, or at any time during the year then ended.
8. Securities Lending
The Series, along with other funds in the Delaware Investments® Family of Funds, may lend its securities pursuant to a security lending agreement (Lending Agreement) with Mellon Bank, N.A. (Mellon). With respect to each loan, if the aggregate market value of the collateral held on any business day is less than the aggregate market value of the securities which are the subject of such loan, the borrower will be notified to provide additional collateral not less than the applicable collateral requirements. Cash collateral received is invested in a collective investment vehicle (Collective Trust) established by Mellon for the purpose of investment on behalf of clients participating in its securities lending programs. The Collective Trust invests in fixed income securities, with a weighted average maturity not to exceed 90 days, rated in one of the top two tiers by Standard & Poor’s Ratings Group or Moody’s Investors Service, Inc. or repurchase agreements collateralized by such securities. However, in the event of default or bankruptcy by the lending agent, realization and/or retention of the collateral may be subject to legal proceedings. In the event the borrower fails to return loaned securities and the collateral received is insufficient to cover the value of the loaned securities and provided such collateral shortfall is not the result of investment losses, the lending agent has agreed to pay the amount of the shortfall to the Series, or at the discretion of the lending agent, replace the loaned securities. The Series continues to record dividends or interest, as applicable, on the securities loaned and is subject to change in value of the securities loaned that may occur during the term of the loan. The Series has the right under the Lending Agreement to recover the securities from the borrower on demand. With respect to security loans collateralized by U.S. Treasury obligations, the Series receives a fee from the securities lending agent. With respect to security loans collateralized by cash collateral, the earnings from the collateral investments are shared among the Series, the security lending agent and the borrower. The Series records securities lending income net of allocations to the security lending agent and the borrower.
At December 31, 2007, the market value of the securities on loan was $114,399,383, for which the Series received collateral, comprised of U.S. government obligations valued at $11,659,569, and cash collateral of $106,251,507. Investments purchased with cash collateral are presented on the Statement of Net Assets under the caption “Securities Lending Collateral.”
9. Credit and Market Risk
The Series concentrates its investments in the real estate industry and is subject to some of the risks associated with that industry. If the Series holds real estate directly as a result of defaults or receives rental income directly from real estate holdings, its tax status as a regulated investment company may be jeopardized. The Series is also affected by interest rate changes, particularly if the REITs it holds use floating rate debt to finance their ongoing operations. Its investments may also tend to fluctuate more in value than a portfolio that invests in a broader range of industries.
The Series may invest up to 10% of its net assets in illiquid securities, which may include securities with contractual restrictions on resale, securities exempt from registration under Rule 144A of the Securities Act of 1933, as amended, and other securities which may not be readily marketable. The relative illiquidity of these securities may impair the Series from disposing of them in a timely manner and at a fair price when it is necessary or desirable to do so. While maintaining oversight, the Series’ Board of Trustees has delegated to DMC the day-to-day functions of determining whether individual securities are liquid for purposes of the Series’ limitation on investments in illiquid assets. As of December 31, 2007, there were no Rule 144A securities and no securities have been determined to be illiquid under the Series’ Liquidity Procedures.
13
Delaware VIP REIT Series
Notes to Financial Statements (continued)
10. Contractual Obligations
The Series enters into contracts in the normal course of business that contain a variety of indemnifications. The Series’ maximum exposure under these arrangements is unknown. However, the Series has not had prior claims or losses pursuant to these contracts. Management has reviewed the Series’ existing contracts and expects the risk of loss to be remote.
11. Tax Information (Unaudited)
For the fiscal year ended December 31, 2007, the Series designates dividends and distributions paid during the year as follows:
(A)
Long-Term
Capital Gain
Distributions
(Tax Basis) | | (B)
Ordinary
Income
Distributions
(Tax Basis) | | Total
Distributions
(Tax Basis) | |
79 | % | 21 | % | 100 | % |
(A) and (B) are based on a percentage of the Series’ total distributions.
12. Change in Custodian
On August 2, 2007, Mellon, One Mellon Center, Pittsburgh, PA 15258, became the Series’ custodian.
14
Delaware VIP Trust — Delaware VIP REIT Series
Report of Independent Registered Public Accounting Firm
To the Shareholders and Board of Trustees
Delaware VIP Trust—Delaware VIP REIT Series
We have audited the accompanying statement of net assets of the Delaware VIP REIT Series (one of the series constituting Delaware VIP Trust) (the “Series”) as of December 31, 2007, and the related statement of operations for the year then ended, the statements of changes in net assets for each of the two years in the period then ended, and the financial highlights for each of the five years in the period then ended. These financial statements and financial highlights are the responsibility of the Series’ management. Our responsibility is to express an opinion on these financial statements and financial highlights based on our audits.
We conducted our audits in accordance with the standards of the Public Company Accounting Oversight Board (United States). Those standards require that we plan and perform the audit to obtain reasonable assurance about whether the financial statements and financial highlights are free of material misstatement. We were not engaged to perform an audit of the Series’ internal control over financial reporting. Our audits included consideration of internal control over financial reporting as a basis for designing audit procedures that are appropriate in the circumstances, but not for the purpose of expressing an opinion on the effectiveness of the Series’ internal control over financial reporting. Accordingly, we express no such opinion. An audit also includes examining, on a test basis, evidence supporting the amounts and disclosures in the financial statements and financial highlights, assessing the accounting principles used and significant estimates made by management, and evaluating the overall financial statement presentation. Our procedures included confirmation of securities owned as of December 31, 2007, by correspondence with the custodian. We believe that our audits provide a reasonable basis for our opinion.
In our opinion, the financial statements and financial highlights referred to above present fairly, in all material respects, the financial position of the Delaware VIP REIT Series of Delaware VIP Trust at December 31, 2007, the results of its operations for the year then ended, the changes in its net assets for each of the two years in the period then ended, and its financial highlights for each of the five years in the period then ended, in conformity with U.S. generally accepted accounting principles.

Philadelphia, Pennsylvania
February 14, 2008
The Series files its complete schedule of portfolio holdings with the Securities and Exchange Commission (Commission) for the first and third quarters of each fiscal year on Form N-Q. The Series’ Forms N-Q, as well as a description of the policies and procedures that the Series uses to determine how to vote proxies (if any) relating to portfolio securities is available without charge (i) upon request, by calling 800-523-1918; and (ii) on the Commission’s website at http://www.sec.gov. In addition, a description of the policies and procedures that the Series uses to determine how to vote proxies (if any) relating to portfolio securities is available without charge on the Delaware Investments® Funds’ website at http://www.delawareinvestments.com. The Series’ Forms N-Q may be reviewed and copied at the Commission’s Public Reference Room in Washington, DC; information on the operation of the Public Reference Room may be obtained by calling 800 SEC-0330.
Information (if any) regarding how the Series voted proxies relating to portfolio securities during the most recently disclosed 12-month period ended June 30 is available without charge (i) through the Delaware Investments® Funds’ website at http://www.delawareinvestments.com; and (ii) on the Commission’s website at http://www.sec.gov.
15
Delaware Investments® Family of Funds
BOARD OF TRUSTEES/DIRECTORS AND OFFICERS ADDENDUM
A mutual fund is governed by a Board of Trustees/Directors (“Trustees”), which has oversight responsibility for the management of a fund’s business affairs. Trustees establish procedures and oversee and review the performance of the investment manager, the distributor, and others who perform services for the fund. The independent fund trustees, in particular, are advocates for shareholder interests. Each trustee has served in that capacity since he or she was elected to or appointed to the Board of Trustees, and will continue to serve until his or her retirement or the election of a new trustee in his or her place. The following is a list of the Trustees and Officers with certain background and related information.
Name,
Address,
and Birth Date | | Position(s)
Held with
Fund(s) | | Length of Time
Served | | Principal
Occupation(s)
During
Past 5 Years | | Number of
Portfolios in Fund Complex Overseen
by Trustee
or Officer | | Other
Directorships
Held by
Trustee
or Officer |
INTERESTED TRUSTEES | | | | | | | | |
| | | | | | | | |
Patrick P. Coyne(1)
2005 Market Street
Philadelphia, PA
19103 April 1963 | | Chairman, President, Chief Executive Officer, and Trustee | | Chairman and Trustee since August 16, 2006 President and Chief Executive Officer since August 1, 2006 | | Patrick P. Coyne has served in various executive capacities at different times at Delaware Investments.(2) | | 84 | | Director –
Kaydon Corp. Board of Governors Member – Investment Company Institute (2007 – present) Member of Investment Committee – Cradle of Liberty Council, BSA (November 2007 – present) Finance Committee Member – St . John Vianney Roman Catholic Church
(2007 – present) |
| | | | | | | | | | |
INDEPENDENT TRUSTEES | | | | | | | | |
| | | | | | | | |
Thomas L. Bennett
2005 Market Street
Philadelphia, PA
19103 October 1947 | | Trustee | | Since
March 2005 | | Private Investor – (March 2004 – Present) Investment Manager –
Morgan Stanley & Co.
(January 1984 – March 2004) | | 84 | | Director –
Bryn Mawr
Bank Corp. (BMTC) (April 2007 – Present) Chairman of Investment Committee – The Haverford School (2002 – present) Chairman of Investment Committee – Pennsylvania Academy of Fine Arts(2007 – present) Trustee
(2004 – present) Investment Committee
Member – Pennsylvania Horticulture Society(February 2006 – present) |
| | | | | | | | | | | | |
16
Name,
Address,
and Birth Date | | Position(s)
Held with
Fund(s) | | Length of Time
Served | | Principal
Occupation(s)
During
Past 5 Years | | Number of
Portfolios in Fund Complex Overseen
by Trustee
or Officer | | Other
Directorships
Held by
Trustee
or Officer |
INDEPENDENT TRUSTEES (CONTINUED) | | | | | | |
| | | | | | |
John A. Fry
2005 Market Street
Philadelphia, PA
19103 May 1960 | | Trustee | | Since January 2001 | | President – Franklin & Marshall College (June 2002 – Present) Executive Vice President – University of Pennsylvania (April 1995 – June 2002) | | 84 | | Director –
Community
Health Systems Director –
Allied Barton
Security Holdings |
| | | | | | | | | | |
Anthony D. Knerr
2005 Market Street
Philadelphia, PA
19103 December 1938 | | Trustee | | Since
April 1990 | | Founder and Managing Director – Anthony Knerr & Associates (Strategic Consulting) (1990 – Present) | | 84 | | None |
| | | | | | | | | | |
Lucinda S. Landreth
2005 Market Street
Philadelphia, PA
19103 June 1947 | | Trustee | | Since
March 2005 | | Chief Investment Officer – Assurant, Inc. (Insurance)
(2002 – 2004) | | 84 | | None |
| | | | | | | | | | |
Ann R. Leven
2005 Market Street
Philadelphia, PA
19103 November 1940 | | Trustee | | Since
October 1989 | | Consultant – ARL Associates (Financial Planning) (1983 – Present) | | 84 | | Director and Audit Committee Member – Systemax, Inc. |
| | | | | | | | | | |
Thomas F. Madison
2005 Market Street
Philadelphia, PA
19103 February 1936 | | Trustee | | Since
May 1997 | | President and Chief Executive Officer – MLM Partners, Inc. (Small Business Investing and Consulting) (January 1993 – Present) | | 84 | | Director – CenterPoint Energy Director and Audit Committee Member – Digital River, Inc. Director and Audit Committee Member – Rimage Corporation Director and Chair of Compensation and Governance & Nominating Committees – Valmont Industries, Inc. |
| | | | | | | | | | |
Janet L. Yeomans
2005 Market Street
Philadelphia, PA
19103 July 1948 | | Trustee | | Since
April 1999 | | Treasurer (January 2006 – Present) Vice President – Mergers & Acquisitions (January 2003 – January 2006), and Vice President
(July 1995 – January 2003)
3M Corporation | | 84 | | None |
| | | | | | | | | | |
J. Richard Zecher
2005 Market Street
Philadelphia, PA
19103 July 1940 | | Trustee | | Since
March 2003 | | Founder – Investor Analytics (Risk Management) (May 1999 – Present) Founder – Sutton Asset Management (Hedge Fund) (September 1998 – Present) | | 84 | | Director and Audit Committee Member – Investor Analytics Director and Audit Committee Member – Oxigene, Inc. |
17
Name,
Address,
and Birth Date | | Position(s)
Held with
Fund(s) | | Length of Time
Served | | Principal
Occupation(s)
During
Past 5 Years | | Number of
Portfolios in Fund Complex Overseen
by Trustee
or Officer | | Other
Directorships
Held by
Trustee
or Officer |
OFFICERS | | | | | | | | | | |
| | | | | | | | | | |
David F. Connor
2005 Market Street
Philadelphia, PA
19103 December 1963 | | Vice President, Deputy General Counsel, and Secretary | | Vice President since September 21, 2000 and Secretary since October 2005 | | David F. Connor has served as Vice President and Deputy General Counsel of Delaware Investments since 2000. | | 84 | | None(4) |
| | | | | | | | | | |
Daniel V. Geatens
2005 Market Street
Philadelphia, PA
19103 October 1972 | | Vice President and Treasurer | | Treasurer since October 25, 2007 | | Daniel V. Geatens has served in various capacities at different times at Delaware Investments. | | 84 | | None(4) |
| | | | | | | | | | |
David P. O’Connor
2005 Market Street
Philadelphia, PA
19103 February 1966 | | Senior Vice President, General Counsel, and Chief Legal Officer | | Senior Vice President, General Counsel, and Chief Legal Officer since October 2005 | | David P. O’Connor has served in various executive and legal capacities at different times at Delaware Investments. | | 84 | | None(4) |
| | | | | | | | | | |
Richard Salus
2005 Market Street
Philadelphia, PA
19103 October 1963 | | Senior Vice President and
Chief Financial Officer | | Chief Financial Officer since November 1, 2006 | | Richard Salus has served in various executive capacities at different times at Delaware Investments. | | 84 | | None(4) |
(1) | Patrick P. Coyne is considered to be an “Interested Trustee” because he is an executive officer of the Fund’s(s’) investment advisor. |
(2) | Delaware Investments is the marketing name for Delaware Management Holdings, Inc. and its subsidiaries, including the Fund’s(s’) investment advisor, principal underwriter, and its transfer agent. |
(3) | In 1997, several funds managed by Voyageur Fund Managers, Inc. (the “Voyageur Funds”) were incorporated into the Delaware Investments Family of Funds. Mr. Madison served as a director of the Voyageur Funds from 1993 until 1997. |
(4) | David F. Connor, Daniel V. Geatens, David P. O’Connor, and Richard Salus serve in similar capacities for the six portfolios of the Optimum Fund Trust, which have the same investment advisor, principal underwriter, and transfer agent as the registrant. |
The Statement of Additional Information for the Fund(s) includes additional information about the Trustees and Officers and is available, without charge, upon request by calling 800 523-1918.
18
Delaware VIP Trust — Delaware VIP Select Growth Series
For the 12-month period ended Dec. 31, 2007, the Delaware VIP Select Growth Series Standard Class shares returned +9.64%, and the Service Class shares returned +9.37% (both figures reflect all distributions reinvested). The Series’ benchmark, the Russell 3000® Growth Index, returned +11.40% (source: Lipper).
The Series’ performance trailed that of the index substantially during a brief period in March and April. This was not due to any operational difficulties in the companies we owned but rather the outsized performance of traditional cyclical sectors such as energy, materials, and integrated oils. We usually avoid stocks in these sectors, in which commodity prices or economic cycles drive returns, rather than the unique competitive advantages that we typically seek to identify in our investments. Consequently, we had difficulty keeping up with the index during the spring months.
The challenging environment in credit markets, which evolved from the subprime mortgage crisis, led to concerns about how volatility would affect the global economic activity. Consequently, many companies that had direct exposure to credit, or were strongly influenced by economic activity, were punished to varying degrees. Although the market rebounded somewhat in the second half of August and in September, further worries about companies’ exposure to bad debts, along with signs of slowing corporate earnings, weighed on investor sentiment and led to declining stock valuations again in mid-October.
We believed that, as a result of turbulent markets, investors in the second half of the fiscal year had begun to search for the kind of companies that we seek to hold: companies with a unique competitive advantage that helps them manage their way through economic cycles. Such companies consequently have stable cash flows with plenty of cash on the balance sheet, and are able to self-finance their businesses without relying on the banking system or on the capital markets for growth. We typically own companies with these characteristics and consequently we made up a significant amount of performance relative to the benchmark by the end of the fiscal period.
Our concern about credit markets and their potential impact on the global economy was felt particularly in regard to their effect on the consumer. As a result, we remained generally underexposed to consumer-driven businesses and continued to monitor the Series’ exposure to consumer discretionary spending.
At year end, we believed that, true to our investment strategy, the Series was made up of value-creating companies that earn incremental returns on capital above their own cost of capital. Further, we believed that such value-creating companies are rewarded by the market over time.
The views expressed are current as of the date of this report and are subject to change.
The performance data quoted below represent past performance; past performance does not guarantee future results. Investment return and principal value will fluctuate so your shares, when redeemed, may be worth more or less than their original cost. Please obtain the performance data for the most recent month end by calling the number noted in the introductory section of this report on the page related to this Series.
You should consider the investment objectives, risks, charges, and expenses of the investment company carefully before investing. The Delaware VIP Select Growth Series prospectus contains this and other important information about the Series. To obtain a prospectus, contact the company noted on the page related to this Series in the introductory section of this report, either by phone or through the company Web site. We advise you to read the prospectus carefully before you invest.
Delaware VIP Select Growth Series
Average annual total returns
For periods ended Dec. 31, 2007 | | 1 year | | 5 years | | Lifetime | |
| | | | | | | |
Standard Class shares (commenced operations May 3, 1999) | | +9.64 | % | +14.52 | % | +1.34 | % |
| | | | | | | |
Service Class shares (commenced operations May 1, 2000) | | +9.37 | % | +14.25 | % | -2.47 | % |
As disclosed in the Series’ most recent prospectus, expenses for Standard Class and Service Class shares were as follows: The net expense ratios for Standard Class and Service Class shares of the Series were 0.93% and 1.18%, respectively. Total operating expenses for Standard Class and Service Class shares were 0.93% and 1.23%, respectively. Management fees for Standard Class and Service Class shares were 0.75%.
Earnings from a variable annuity or variable life investment compound tax-free until withdrawal and, as a result, no adjustments were made for income taxes.
An expense limitation was in effect for all classes during the periods shown in the Series performance chart above and in the Performance of a $10,000 Investment chart on the next page.
Performance of Service Class shares will vary due to different charges and expenses.
1
Performance data do not reflect insurance fees related to a variable annuity or variable life investment or the deferred sales charge that would apply to certain withdrawals of investments held for fewer than eight years. Performance shown here would have been reduced if such fees were included and the expense limitation removed. For more information about fees, consult your variable annuity or variable life prospectus.
Investments in variable products involve risk. Series that invest in growth or small and/or medium-sized company stocks typically involve greater risk, particularly in the short term, than those investing in larger, more established companies. The Series will be particularly affected by declines in stock prices, which tend to fluctuate more than bond prices. Stock prices may be negatively affected by a drop in the overall equity market or poor performance in specific companies or industries. Stocks of companies with high growth expectations may be more susceptible to price declines if they do not meet those high expectations. Some portfolios offer more risk than others.
Please read both the contract and underlying prospectus for specific details regarding the product’s risk profile.
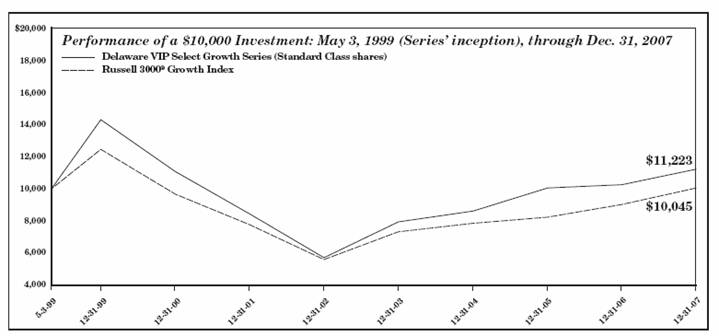
The chart shows a $10,000 investment in the Delaware VIP Select Growth Series Standard Class shares for the period from May 3, 1999, through Dec. 31, 2007. Performance of Service Class shares will vary due to different charges and expenses.
The chart also shows $10,000 invested in the Russell 3000 Growth Index for the period from the Series’ inception on May 3, 1999, through Dec. 31, 2007. The Russell 3000 Growth Index measures the performance of those Russell 3000 Index companies with higher price-to-book ratios and higher forecasted growth values. An index is unmanaged and does not reflect the costs of operating a mutual fund, such as the costs of buying, selling, and holding securities. You cannot invest directly in an index.
2
Delaware VIP Trust — Delaware VIP Select Growth Series
Disclosure of Series Expenses
For the Period July 1, 2007 to December 31, 2007
As a shareholder of the Series, you incur ongoing costs, including management fees; distribution and/or service (12b-1) fees; and other Series expenses. This Example is intended to help you understand your ongoing costs (in dollars) of investing in the Series and to compare these costs with the ongoing costs of investing in other mutual funds.
The Example is based on an investment of $1,000 invested at the beginning of the period and held for the entire period from July 1, 2007 to December 31, 2007.
Actual Expenses
The first section of the table shown, “Actual Series Return,” provides information about actual account values and actual expenses. You may use the information in this section of the table, together with the amount you invested, to estimate the expenses that you paid over the period. Simply divide your account value by $1,000 (for example, an $8,600 account value divided by $1,000 = 8.6), then multiply the result by the number in the first section under the heading entitled “Expenses Paid During Period” to estimate the expenses you paid on your account during the period.
Hypothetical Example for Comparison Purposes
The second section of the table shown, “Hypothetical 5% Return,” provides information about hypothetical account values and hypothetical expenses based on the Series’ actual expense ratio and an assumed rate of return of 5% per year before expenses, which is not the Series’ actual return. The hypothetical account values and expenses may not be used to estimate the actual ending account balance or expenses you paid for the period. You may use this information to compare the ongoing costs of investing in the Series and other funds. To do so, compare the 5% hypothetical example with the 5% hypothetical examples that appear in the shareholder reports of other funds.
Please note that the expenses shown in the table are meant to highlight your ongoing costs only. As a shareholder of the Series, you do not incur any transaction costs, such as sales charges (loads), redemption fees or exchange fees, but shareholders of other funds may incur such costs. Also, the fees related to the variable annuity investment or the deferred sales charge that could apply have not been included. Therefore, the second section of the table is useful in comparing ongoing costs only, and will not help you determine the relative total costs of owning different funds. The Series’ actual expenses shown in the table reflect fee waivers in effect for Service Class shares. The expenses shown in the table assume reinvestment of all dividends and distributions.
Expense Analysis of an Investment of $1,000
| | Beginning
Account
Value
7/1/07 | | Ending
Account
Value
12/31/07 | | Annualized
Expense
Ratios | | Expenses
Paid During
Period
7/1/07 to
12/31/07* | |
Actual Series Return | | | | | | | | | |
Standard Class | | $ | 1,000.00 | | $ | 1,051.50 | | 0.95 | % | $ | 4.91 | |
Service Class | | 1,000.00 | | 1,051.30 | | 1.20 | % | 6.20 | |
| | | | | | | | | |
Hypothetical 5% Return (5% return before expenses) | | | | | | | | | |
Standard Class | | $ | 1,000.00 | | $ | 1,020.42 | | 0.95 | % | $ | 4.84 | |
Service Class | | 1,000.00 | | 1,019.16 | | 1.20 | % | 6.11 | |
“Expenses Paid During Period” are equal to the Series’ annualized expense ratio, multiplied by the average account value over the period, multiplied by 184/365 (to reflect the one-half year period).
3
Delaware VIP Trust — Delaware VIP Select Growth Series
Sector Allocation and Top 10 Holdings
As of December 31, 2007
Sector designations may be different than the sector designations presented in other Series materials.
Sector | | Percentage
of Net Assets | |
Common Stockt | | 98.81 | % |
Basic Industry/Capital Goods | | 0.55 | % |
Business Services | | 14.49 | % |
Consumer Non-Durables | | 9.77 | % |
Consumer Services | | 15.92 | % |
Energy | | 2.47 | % |
Financials | | 8.21 | % |
Health Care | | 15.06 | % |
Technology | | 32.34 | % |
Discount Note | | 0.84 | % |
Securities Lending Collateral | | 16.71 | % |
Total Value of Securities | | 116.36 | % |
Obligation to Return Securities Lending Collateral | | (16.71 | )% |
Receivables and Other Assets Net of Liabilities | | 0.35 | % |
Total Net Assets | | 100.00 | % |
t | Narrow industries are utilized for compliance purposes for diversification whereas broad sectors are used for financial reporting. |
Holdings are for informational purposes only and are subject to change at any time. They are not a recommendation to buy, sell, or hold any security.
Top 10 Holdings | | Percentage
of Net Assets | |
UnitedHealth Group | | 6.11 | % |
Weight Watchers International | | 5.54 | % |
QUALCOMM | | 5.39 | % |
Research in Motion | | 4.91 | % |
NetFlix | | 4.79 | % |
Teradata | | 4.36 | % |
Seagate Technology | | 4.32 | % |
Intuit | | 3.88 | % |
IntercontinentalExchange | | 3.66 | % |
Genentech | | 3.50 | % |
4
Delaware VIP Trust — Delaware VIP Select Growth Series
Statement of Net Assets
December 31, 2007
| | Number of
Shares | | Value | |
| | | | | | |
| COMMON STOCK–98.81%t | | | | | |
| Basic Industry/Capital Goods–0.55% | | | | | |
| Praxair | | 1,000 | | $ | 88,710 | |
| | | | | 88,710 | |
| Business Services–14.49% | | | | | |
| Corporate Executive Board | | 5,500 | | 330,550 | |
| Equifax | | 3,800 | | 138,168 | |
| Expeditors International Washington | | 7,700 | | 344,036 | |
† | Global Cash Access Holdings | | 35,500 | | 215,130 | |
* | MasterCard Class A | | 800 | | 172,160 | |
| Paychex | | 4,000 | | 144,880 | |
† | Research in Motion | | 7,050 | | 799,470 | |
| Reuters Group | | 15,800 | | 200,125 | |
| Reuters Group ADR | | 200 | | 15,236 | |
| | | | | 2,359,755 | |
| Consumer Non-Durables–9.77% | | | | | |
*† | NetFlix | | 29,300 | | 779,966 | |
| NIKE Class B | | 1,000 | | 64,240 | |
*† | Peet’s Coffee & Tea | | 7,500 | | 218,025 | |
| Staples | | 6,000 | | 138,420 | |
† | Starbucks | | 5,300 | | 108,491 | |
* | Whole Foods Market | | 6,900 | | 281,520 | |
| | | | | 1,590,662 | |
| Consumer Services–15.92% | | | | | |
† | eBay | | 9,400 | | 311,986 | |
* | Heartland Payment Systems | | 17,000 | | 455,600 | |
* | IHOP | | 12,600 | | 460,908 | |
| International Game Technology | | 1,600 | | 70,288 | |
| Jackson Hewitt Tax Service | | 4,900 | | 155,575 | |
† | MGM MIRAGE | | 1,900 | | 159,638 | |
| Strayer Education | | 450 | | 76,761 | |
| Weight Watchers International | | 19,972 | | 902,335 | |
| | | | | 2,593,091 | |
| Energy–2.47% | | | | | |
† | Core Laboratories | | 1,900 | | 236,968 | |
| EOG Resources | | 1,000 | | 89,250 | |
| Suncor Energy | | 700 | | 76,111 | |
| | | | | 402,329 | |
| Financials–8.21% | | | | | |
*† | Affiliated Managers Group | | 300 | | 35,238 | |
| Bank of New York Mellon | | 3,941 | | 192,163 | |
| CME Group | | 275 | | 188,650 | |
† | IntercontinentalExchange | | 3,100 | | 596,750 | |
* | NYMEX Holdings | | 300 | | 40,083 | |
* | optionsXpress Holdings | | 7,400 | | 250,268 | |
* | Pzena Investment Management Class A | | 3,000 | | 34,200 | |
| | | | | 1,337,352 | |
| Health Care–15.06% | | | | | |
† | Abiomed | | 9,000 | | 139,860 | |
| Allergan | | 6,400 | | 411,136 | |
† | Genentech | | 8,500 | | 570,095 | |
† | Medco Health Solutions | | 900 | | 91,260 | |
| UnitedHealth Group | | 17,100 | | 995,220 | |
† | Zimmer Holdings | | 3,700 | | 244,755 | |
| | | | 2,452,326 | |
| Technology–32.34% | | | | | |
† | Apple | | 1,100 | | $ | 217,888 | |
| Blackbaud | | 4,800 | | 134,592 | |
† | Crown Castle International | | 9,300 | | 386,880 | |
† | Google Class A | | 750 | | 518,610 | |
† | Intuit | | 20,000 | | 632,200 | |
† | j2 Global Communications | | 17,000 | | 359,890 | |
| QUALCOMM | | 22,300 | | 877,506 | |
*† | SanDisk | | 4,500 | | 149,265 | |
| Seagate Technology | | 27,600 | | 703,800 | |
† | Sun Microsystems | | 14,200 | | 257,446 | |
† | Teradata | | 25,900 | | 709,919 | |
† | VeriFone Holdings | | 13,700 | | 318,525 | |
| | | | | 5,266,521 | |
| Total Common Stock (cost $13,545,185) | | | | 16,090,746 | |
| | Principal
Amount | | | |
¹ | DISCOUNT NOTE–0.84% | | | | | |
| Federal Home Loan Bank 3.25% 1/2/08 | | $ | 136,025 | | 136,012 | |
| Total Discount Note
(cost $136,012) | | | | 136,012 | |
| Total Value of Securities Before Securities Lending Collateral–99.65%
(cost $13,681,197) | | | | 16,226,758 | |
| | | | | | | |
| | Number of
Shares | | | |
| | | | | |
SECURITIES LENDING COLLATERAL**–16.71% | | | | | |
Investment Companies Mellon GSL DBT II Collateral Fund | | 2,721,170 | | 2,721,170 | |
Total Securities Lending Collateral
(cost $2,721,170) | | | | 2,721,170 | |
5
TOTAL VALUE OF SECURITIES–116.36% (cost $16,402,367) | | $ | 18,947,928 | © |
OBLIGATION TO RETURN SECURITIES LENDING COLLATERAL**–(16.71%) | | (2,721,170 | ) |
RECEIVABLES AND OTHER ASSETS NET OF LIABILITIES–0.35% | | 57,640 | |
NET ASSETS APPLICABLE TO 1,482,083 SHARES OUTSTANDING–100.00% | | $ | 16,284,398 | |
NET ASSET VALUE–DELAWARE VIP SELECT GROWTH SERIES STANDARD CLASS
($12,234,265 / 1,109,020 Shares) | | $ | 11.03 | |
NET ASSET VALUE–DELAWARE VIP SELECT GROWTH SERIES SERVICE CLASS
($4,050,133 / 373,063 Shares) | | $ | 10.86 | |
COMPONENTS OF NET ASSETS AT DECEMBER 31, 2007: | | | |
Shares of beneficial interest (unlimited authorization-no par) | | $ | 59,844,957 | |
Accumulated net investment loss | | (306 | ) |
Accumulated net realized loss on investments | | (46,105,814 | ) |
Net unrealized appreciation of investments | | 2,545,561 | |
Total net assets | | $ | 16,284,398 | |
¹ | | The rate shown is the effective yield at the time of purchase. |
t | | Narrow industries are utilized for compliance purposes for diversification whereas broad sectors are used for financial reporting. |
† | | Non-income producing security for the year ended December 31, 2007. |
* | | Fully or partially on loan. |
** | | See Note 8 in “Notes to Financial Statements.” |
© | | Includes $2,729,507 of securities loaned. |
ADR – American Depositary Receipts
See accompanying notes
6
Delaware VIP Trust — Delaware VIP Select Growth Series
Statement of Operations
Year Ended December 31, 2007
INVESTMENT INCOME: | | | |
Dividends | | $ | 100,669 | |
Interest | | 4,814 | |
Foreign tax withheld | | (11 | ) |
Securities lending income | | 13,980 | |
| | 119,452 | |
EXPENSES: | | | |
Management fees | | 133,482 | |
Distribution expenses – Service Class | | 12,816 | |
Audit and tax | | 12,265 | |
Accounting and administration expenses | | 7,118 | |
Dividend disbursing and transfer agent fees and expenses | | 6,863 | |
Reports and statements to shareholders | | 2,624 | |
Legal fees | | 2,561 | |
Custodian fees | | 1,605 | |
Trustees’ fees | | 851 | |
Dues and services | | 711 | |
Insurance fees | | 413 | |
Pricing fees | | 378 | |
Consulting fees | | 334 | |
Trustees’ expenses | | 104 | |
Registration fees | | 31 | |
| | 182,156 | |
Less expenses absorbed or waived | | (2,767 | ) |
Less waiver of distribution expenses – Service Class | | (2,136 | ) |
Less expense paid indirectly | | (546 | ) |
Total operating expenses | | 176,707 | |
| | | |
NET INVESTMENT LOSS | | (57,255 | ) |
| | | |
NET REALIZED AND UNREALIZED GAIN (LOSS) ON INVESTMENTS AND FOREIGN CURRENCIES: | | | |
Net realized gain (loss) on: | | | |
Investments | | 3,120,054 | |
Foreign currencies | | (1,098 | ) |
Net realized gain | | 3,118,956 | |
Net change in unrealized appreciation/depreciation of investments | | (1,448,966 | ) |
| | | |
NET REALIZED AND UNREALIZED GAIN ON INVESTMENTS AND FOREIGN CURRENCIES: | | 1,669,990 | |
| | | |
NET INCREASE IN NET ASSETS RESULTING FROM OPERATIONS | | $ | 1,612,735 | |
See accompanying notes
Delaware VIP Trust — Delaware VIP Select Growth Series
Statements of Changes in Net Assets
| | Year Ended | |
| | 12/31/07 | | 12/31/06 | |
| | | | | |
INCREASE (DECREASE) IN NET ASSETS FROM OPERATIONS: | | | | | |
Net investment loss | | $ | (57,255 | ) | $ | (87,417 | ) |
Net realized gain on investments and foreign currencies | | 3,118,956 | | 1,055,200 | |
Net change in unrealized appreciation/ depreciation of investments | | (1,448,966 | ) | (666,516 | ) |
Net increase in net assets resulting from operations | | 1,612,735 | | 301,267 | |
| | | | | |
CAPITAL SHARE TRANSACTIONS: | | | | | |
Proceeds from shares sold: | | | | | |
Standard Class | | 258,640 | | 15,031,576 | |
Service Class | | 213,484 | | 4,970,607 | |
| | 472,124 | | 20,002,183 | |
Cost of shares repurchased: | | | | | |
Standard Class | | (4,169,619 | ) | (18,980,519 | ) |
Service Class | | (1,102,588 | ) | (5,539,539 | ) |
| | (5,272,207 | ) | (24,520,058 | ) |
Decrease in net assets derived from capital share transactions | | (4,800,083 | ) | (4,517,875 | ) |
| | | | | |
NET DECREASE IN NET ASSETS | | (3,187,348 | ) | (4,216,608 | ) |
| | | | | |
NET ASSETS: | | | | | |
Beginning of year | | 19,471,746 | | 23,688,354 | |
End of year (including accumulated net investment loss of $(306) and $(133), respectively) | | $ | 16,284,398 | | $ | 19,471,746 | |
See accompanying notes
7
Delaware VIP Trust — Delaware VIP Select Growth Series
Financial Highlights
Selected data for each share of the Series outstanding throughout each period were as follows:
| | Delaware VIP Select Growth Series Standard Class | |
| | Year Ended | |
| | 12/31/07 | | 12/31/06 | | 12/31/05 | | 12/31/04 | | 12/31/03 | |
| | | | | | | | | | | | | | | | |
Net asset value, beginning of period | | $ | 10.060 | | $ | 9.880 | | $ | 8.460 | | $ | 7.810 | | $ | 5.600 | |
| | | | | | | | | | | | | | | | |
Income (loss) from investment operations: | | | | | | | | | | | |
Net investment loss(1) | | (0.028 | ) | (0.035 | ) | (0.022 | ) | (0.011 | ) | (0.016 | ) |
Net realized and unrealized gain on investments and foreign currencies | | 0.998 | | 0.215 | | 1.442 | | 0.661 | | 2.226 | |
Total from investment operations | | 0.970 | | 0.180 | | 1.420 | | 0.650 | | 2.210 | |
| | | | | | | | | | | |
Net asset value, end of period | | $ | 11.030 | | $ | 10.060 | | $ | 9.880 | | $ | 8.460 | | $ | 7.810 | |
| | | | | | | | | | | |
Total return(2) | | 9.64 | % | 1.82 | % | 16.78 | % | 8.32 | % | 39.46 | % |
| | | | | | | | | | | |
Ratios and supplemental data: | | | | | | | | | | | |
Net assets, end of period (000 omitted) | | $ | 12,234 | | $ | 14,901 | | $ | 18,612 | | $ | 20,493 | | $ | 23,089 | |
Ratio of expenses to average net assets | | 0.93 | % | 0.91 | % | 0.90 | % | 0.83 | % | 0.83 | % |
Ratio of expenses to average net assets prior to expense limitation and expenses paid indirectly | | 0.95 | % | 0.94 | % | 0.97 | % | 0.83 | % | 0.83 | % |
Ratio of net investment loss to average net assets | | (0.26 | )% | (0.36 | )% | (0.26 | )% | (0.14 | )% | (0.24 | )% |
Ratio of net investment loss to average net assets prior to expense limitation and expenses paid indirectly | | (0.28 | )% | (0.39 | )% | (0.33 | )% | (0.14 | )% | (0.24 | )% |
Portfolio turnover | | 46 | % | 50 | % | 133 | % | 86 | % | 72 | % |
(1) | The average shares outstanding method has been applied for per share information. |
(2) | Total investment return is based on the change in net asset value of a share during the period and assumes reinvestment of dividends and distributions at net asset value. Total investment return reflects a waiver by the manager, as applicable. Performance would have been lower had the waiver not been in effect. |
See accompanying notes
8
Selected data for each share of the Series outstanding throughout each period were as follows:
| | Delaware VIP Select Growth Series Service Class | |
| | Year Ended | |
| | 12/31/07 | | 12/31/06 | | 12/31/05 | | 12/31/04 | | 12/31/03 | |
| | | | | | | | | | | | | | | | |
Net asset value, beginning of period | | $ | 9.930 | | $ | 9.780 | | $ | 8.390 | | $ | 7.760 | | $ | 5.580 | |
| | | | | | | | | | | | | | | | |
Income (loss) from investment operations: | | | | | | | | | | | |
Net investment loss(1) | | (0.054 | ) | (0.059 | ) | (0.043 | ) | (0.030 | ) | (0.030 | ) |
Net realized and unrealized gain on investments and foreign currencies | | 0.984 | | 0.209 | | 1.433 | | 0.660 | | 2.210 | |
Total from investment operations | | 0.930 | | 0.150 | | 1.390 | | 0.630 | | 2.180 | |
| | | | | | | | | | | |
Net asset value, end of period | | $ | 10.860 | | $ | 9.930 | | $ | 9.780 | | $ | 8.390 | | $ | 7.760 | |
| | | | | | | | | | | |
Total return(2) | | 9.37 | % | 1.53 | % | 16.57 | % | 8.12 | % | 39.07 | % |
| | | | | | | | | | | |
Ratios and supplemental data: | | | | | | | | | | | |
Net assets, end of period (000 omitted) | | $ | 4,050 | | $ | 4,571 | | $ | 5,076 | | $ | 5,148 | | $ | 5,670 | |
Ratio of expenses to average net assets | | 1.18 | % | 1.16 | % | 1.15 | % | 1.08 | % | 1.05 | % |
Ratio of expenses to average net assets prior to expense limitation and expenses paid indirectly | | 1.25 | % | 1.24 | % | 1.27 | % | 1.13 | % | 1.08 | % |
Ratio of net investment loss to average net assets | | (0.51 | )% | (0.61 | )% | (0.51 | )% | (0.39 | )% | (0.46 | )% |
Ratio of net investment loss to average net assets prior to expense limitation and expenses paid indirectly | | (0.58 | )% | (0.69 | )% | (0.63 | )% | (0.44 | )% | (0.49 | )% |
Portfolio turnover | | 46 | % | 50 | % | 133 | % | 86 | % | 72 | % |
(1) | The average shares outstanding method has been applied for per share information. |
(2) | Total investment return is based on the change in net asset value of a share during the period and assumes reinvestment of dividends and distributions at net asset value. Total investment return reflects a waiver by the manager and distributor, as applicable. Performance would have been lower had the waiver not been in effect. |
See accompanying notes
9
Delaware VIP Trust — Delaware VIP Select Growth Series
Notes to Financial Statements
December 31, 2007
Delaware VIP Trust (Trust) is organized as a Delaware statutory trust and offers 14 series: Delaware VIP Balanced Series, Delaware VIP Capital Reserves Series, Delaware VIP Cash Reserve Series, Delaware VIP Diversified Income Series, Delaware VIP Emerging Markets Series, Delaware VIP Growth Opportunities Series, Delaware VIP High Yield Series, Delaware VIP International Value Equity Series, Delaware VIP REIT Series, Delaware VIP Select Growth Series, Delaware VIP Small Cap Value Series, Delaware VIP Trend Series, Delaware VIP U.S. Growth Series and Delaware VIP Value Series. These financial statements and the related notes pertain to Delaware VIP Select Growth Series (Series). The Trust is an open-end investment company. The Series is considered diversified under the Investment Company Act of 1940, as amended, and offers Standard Class and Service Class shares. The Standard Class shares do not carry a 12b-1 fee and the Service Class shares carry a 12b-1 fee. The shares of the Series are sold only to separate accounts of life insurance companies.
The investment objective of the Series is to seek long-term capital appreciation.
1. Significant Accounting Policies
The following accounting policies are in accordance with U.S. generally accepted accounting principles and are consistently followed by the Series.
Security Valuation—Equity securities, except those traded on the Nasdaq Stock Market, Inc. (Nasdaq), are valued at the last quoted sales price as of the time of the regular close of the New York Stock Exchange (NYSE) on the valuation date. Securities traded on the Nasdaq are valued in accordance with the Nasdaq Official Closing Price, which may not be the last sales price. If on a particular day an equity security does not trade, then the mean between the bid and asked prices will be used. Short-term debt securities having less than 60 days to maturity are valued at amortized cost, which approximates market value. Securities lending collateral, which is invested in a collective investment vehicle, is valued at unit value per share. Other securities and assets for which market quotations are not readily available are valued at fair value as determined in good faith under the direction of the Series’ Board of Trustees. In determining whether market quotations are readily available or fair valuation will be used, various factors will be taken into consideration, such as market closures, or with respect to foreign securities, aftermarket trading, or significant events after local market trading (e.g., government actions or pronouncements, trading volume or volatility on markets, exchanges among dealers, or news events).
In September 2006, the Financial Accounting Standards Board (FASB) issued FASB Statement No. 157 “Fair Value Measurements” (Statement 157). Statement 157 establishes a framework for measuring fair value in U.S. generally accepted accounting principles, clarifies the definition of fair value within that framework, and expands disclosures about the use of fair value measurements. Statement 157 is intended to increase consistency and comparability among fair value estimates used in financial reporting. Statement 157 is effective for fiscal years beginning after November 15, 2007. Management does not expect the adoption of Statement 157 to have a material impact on the amounts reported in the financial statements.
Federal Income Taxes—The Series intends to continue to qualify for federal income tax purposes as a regulated investment company under Subchapter M of the Internal Revenue Code of 1986, as amended, and make the requisite distributions to shareholders. Accordingly, no provision for federal income taxes has been made in the financial statements.
Effective June 29, 2007, the Series adopted FASB Interpretation No. 48 “Accounting for Uncertainty in Income Taxes” (FIN 48). FIN 48 provides guidance for how uncertain tax positions should be recognized, measured, presented and disclosed in the financial statements. FIN 48 requires the evaluation of tax positions taken or expected to be taken in the course of preparing the Series’ tax returns to determine whether the tax positions are “more-likely-than-not” of being sustained by the applicable tax authority. Tax positions not deemed to meet the more-likely-than-not threshold are recorded as a tax benefit or expense in the current year. The adoption of FIN 48 did not result in the recording of any tax benefit or expense in the current period.
Class Accounting—Investment income, common expenses and realized and unrealized gain (loss) on investments are allocated to the classes of the Series on the basis of daily net assets of each class. Distribution expenses relating to a specific class are charged directly to that class.
Repurchase Agreements—The Series may invest in a pooled cash account along with members of the Delaware Investments® Family of Funds pursuant to an exemptive order issued by the Securities and Exchange Commission. The aggregate daily balance of the pooled cash account is invested in repurchase agreements secured by obligations of the U.S. government. The respective collateral is held by the Series’ custodian bank until the maturity of the respective repurchase agreements. Each repurchase agreement is at least 102% collateralized. However, in the event of default or bankruptcy by the counterparty to the agreement, realization of the collateral may be subject to legal proceedings. At December 31, 2007, the Series held no investments in repurchase agreements.
Use of Estimates—The preparation of financial statements in conformity with U.S. generally accepted accounting principles requires management to make estimates and assumptions that affect the reported amounts of assets and liabilities at the date of the financial statements and the reported amounts of revenues and expenses during the reporting period. Actual results could differ from those estimates.
Other—Expenses directly attributable to the Series are charged directly to the Series. Other expenses common to various funds within the Delaware Investments® Family of Funds are generally allocated amongst such funds on the basis of average net assets. Management fees and some other expenses are paid monthly. Security transactions are recorded on the date the securities are purchased or sold (trade date) for financial reporting purposes. Costs used in calculating realized gains and losses on the sale of investment securities are those of the specific securities sold. Dividend income is recorded on the ex-dividend date and interest income is recorded on the accrual basis. Foreign dividends are also recorded on the ex-dividend date or as soon after the ex-dividend date that the Series is aware of such dividends, net of all non-rebatable tax withholdings. Withholding taxes on foreign dividends have been recorded in accordance with the Series’ understanding of the applicable country’s tax rules and rates.
The Series declares and pays dividends from net investment income and distributions from net realized gain on investments, if any, following the close of the fiscal year.
10
Delaware VIP Select Growth Series
Notes to Financial Statements (continued)
Subject to seeking best execution, the Series may direct certain security trades to brokers who have agreed to rebate a portion of the related brokerage commission to the Series in cash. Such commission rebates are included in realized gain on investments in the accompanying financial statements and totaled $3,092 for the year ended December 31, 2007. In general, best execution refers to many factors, including the price paid or received for a security, the commission charged, the promptness and reliability of execution, the confidentiality and placement accorded the order, and other factors affecting the overall benefit obtained by the Series on the transaction.
The Series may receive earnings credits from its custodian when positive cash balances are maintained, which are used to offset custody fees. The expense paid under this arrangement is included in custodian fees on the Statement of Operations with the corresponding expense offset shown as “expense paid indirectly.”
2. Investment Management, Administration Agreements and Other Transactions with Affiliates
In accordance with the terms of its investment management agreement, the Series pays Delaware Management Company (DMC), a series of Delaware Management Business Trust and the investment manager, an annual fee which is calculated daily at the rate of 0.75% on the first $500 million of average daily net assets of the Series, 0.70% on the next $500 million, 0.65% on the next $1.5 billion, and 0.60% on average daily net assets in excess of $2.5 billion.
Prior to May 1, 2007, DMC had contractually agreed to waive that portion, if any, of its management fee and reimburse the Series to the extent necessary to ensure that total annual operating expenses, exclusive of taxes, interest, brokerage fees, 12b-1 plan expenses, certain insurance costs and non-routine expenses or costs including, but not limited to, those relating to reorganizations, litigation, conducting shareholder meetings, and liquidations, did not exceed 0.90% of average daily net assets of the Series.
Effective October 1, 2007, Delaware Service Company, Inc. (DSC), an affiliate of DMC, provides fund accounting and financial administration oversight services to the Series. For these services, the Series pays DSC fees based on the aggregate daily net assets of the Delaware Investments® Family of Funds at the following annual rate: 0.0050% of the first $30 billion; 0.0045% of the next $10 billion; 0.0040% of the next $10 billion; and 0.0025% of aggregate average daily net assets in excess of $50 billion. The fees payable to DSC under the service agreement described above are allocated among all funds in the Delaware Investments® Family of Funds on a relative net asset value basis. Prior to October 1, 2007, DSC provided fund accounting and administrative services to the Series and received a fee at an annual rate of 0.04% of average daily net assets. For the year ended December 31, 2007, the Series was charged $5,617 for these services.
DSC also provides dividend disbursing and transfer agency services. The Series pays DSC a monthly fee based on the number of shareholder accounts for dividend disbursing and transfer agent services.
Pursuant to a distribution agreement and distribution plan, the Series pays Delaware Distributors, L.P. (DDLP), the distributor and an affiliate of DMC, an annual distribution and service fee not to exceed 0.30% of the average daily net assets of the Service Class shares. DDLP has contracted to waive distribution and service fees through April 30, 2008 in order to prevent distribution and service fees of the Service Class shares from exceeding 0.25% of average daily net assets. Standard Class shares pay no distribution and service expenses.
At December 31, 2007, the Series had liabilities payable to affiliates as follows:
Investment
Management
Fee Payable to
DMC | | Dividend Disbursing,
Transfer Agent
Fees and Other Expenses
Payable to DSC | | Distribution
Fees Payable
to DDLP | | Other
Expenses
Payable
to DMC
and Affiliates* | |
$ | 10,484 | | $ | 1,007 | | $ | 866 | | $ | 1,406 | |
| | | | | | | | | | | |
*DMC, as part of its administrative services, pays operating expenses on behalf of the Series and is reimbursed on a periodic basis. Such expenses include items such as printing of shareholder reports, fees for audit, legal and tax services, custodian fees and trustees’ fees.
As provided in the investment management agreement, the Series bears the cost of certain legal and tax services, including internal legal and tax services provided to the Series by DMC and/or its affiliates’ employees. For the year ended December 31, 2007, the Series was charged $932 for internal legal and tax services provided by DMC and/or its affiliates’ employees.
Trustees’ fees include expenses accrued by the Series for each Trustee’s retainer and per meeting fees. Certain officers of DMC, DSC and DDLP are officers and/or Trustees of the Trust. These officers and Trustees are paid no compensation by the Series.
3. Investments
For the year ended December 31, 2007, the Series made purchases and sales of investment securities other than short-term investments as follows:
Purchases | | $ | 8,035,285 | |
Sales | | 13,062,168 | |
11
Delaware VIP Select Growth Series
Notes to Financial Statements (continued)
At December 31, 2007, the cost of investments for federal income tax purposes and unrealized appreciation (depreciation) for the Series were as follows:
Cost of
Investments | | Aggregate
Unrealized
Appreciation | | Aggregate
Unrealized
Depreciation | | Net Unrealized
Appreciation | |
$ | 16,426,749 | | $ | 3,304,657 | | $ | (783,478 | ) | $ | 2,521,179 | |
| | | | | | | | | | | |
4. Dividend and Distribution Information
Income and long-term capital gain distributions are determined in accordance with federal income tax regulations, which may differ from U.S. generally accepted accounting principles. Additionally, gains (losses) on foreign currency transactions and net short-term gains on sales of investment securities are treated as ordinary income for federal income tax purposes. There were no dividends and distributions paid during the years ended December 31, 2007 and 2006.
5. Components of Net Assets on a Tax Basis
As of December 31, 2007, the components of net assets on a tax basis were as follows:
Shares of beneficial interest | | $ | 59,844,957 | |
Capital loss carryforwards | | (46,081,432 | ) |
Post-October currency losses | | (306 | ) |
Unrealized appreciation of investments | | 2,521,179 | |
Net assets | | $ | 16,284,398 | |
The differences between book basis and tax basis components of net assets are primarily attributable to tax deferral of losses on wash sales.
Post-October currency losses represent losses realized on foreign currency transactions from November 1, 2007 through December 31, 2007 that, in accordance with federal income tax regulations, the Series has elected to defer and treat as having arisen in the following fiscal year.
For financial reporting purposes, capital accounts are adjusted to reflect the tax character of permanent book/tax differences. Reclassifications are primarily due to tax treatment of net operating losses and gain (loss) on foreign currency transactions. Results of operations and net assets were not affected by these reclassifications. For the year ended December 31, 2007, the Series recorded the following reclassifications:
Accumulated
Net
Investment Loss | | Accumulated
Net
Realized (Loss) | | Paid-in
Capital | |
$ | 57,082 | | $ | 1,098 | | $ | (58,180 | ) |
| | | | | | | | |
For federal income tax purposes, capital loss carryforwards may be carried forward and applied against future capital gains. $3,020,929 was utilized in 2007. Capital loss carryforwards remaining at December 31, 2007 will expire as follows: $1,026,554 expires in 2008; $30,958,389 expires in 2009; $10,812,739 expires in 2010; and $3,283,750 expires in 2011.
6. Capital Shares
Transactions in capital shares were as follows:
| | Year
Ended
12/31/07 | | Year
Ended
12/31/06 | |
Shares sold: | | | | | |
Standard Class | | 23,723 | | 1,691,049 | |
Service Class | | 20,061 | | 560,656 | |
| | 43,784 | | 2,251,705 | |
| | | | | |
Shares repurchased: | | | | | |
Standard Class | | (395,299 | ) | (2,093,415 | ) |
Service Class | | (107,301 | ) | (619,563 | ) |
| | (502,600 | ) | (2,712,978 | ) |
Net decrease | | (458,816 | ) | (461,273 | ) |
12
Delaware VIP Select Growth Series
Notes to Financial Statements (continued)
7. Line of Credit
The Series, along with certain other funds in the Delaware Investments® Family of Funds (Participants), participates in a $225,000,000 revolving line of credit facility to be used for temporary or emergency purposes as an additional source of liquidity to fund redemptions of investor shares. The Participants are charged an annual commitment fee, which is allocated across the Participants on the basis of each Participant’s allocation of the entire facility. The Participants may borrow up to a maximum of one third of their net assets under the agreement. The Series had no amounts outstanding as of December 31, 2007, or at any time during the year then ended.
8. Securities Lending
The Series, along with other funds in the Delaware Investments® Family of Funds, may lend its securities pursuant to a security lending agreement (Lending Agreement) with Mellon Bank, N.A. (Mellon). With respect to each loan, if the aggregate market value of the collateral held on any business day is less than the aggregate market value of the securities which are the subject of such loan, the borrower will be notified to provide additional collateral not less than the applicable collateral requirements. Cash collateral received is invested in a collective investment vehicle (Collective Trust) established by Mellon for the purpose of investment on behalf of clients participating in its securities lending programs. The Collective Trust invests in fixed income securities, with a weighted average maturity not to exceed 90 days, rated in one of the top two tiers by Standard & Poor’s Ratings Group or Moody’s Investors Service, Inc. or repurchase agreements collateralized by such securities. However, in the event of default or bankruptcy by the lending agent, realization and/or retention of the collateral may be subject to legal proceedings. In the event the borrower fails to return loaned securities and the collateral received is insufficient to cover the value of the loaned securities and provided such collateral shortfall is not the result of investment losses, the lending agent has agreed to pay the amount of the shortfall to the Series, or at the discretion of the lending agent, replace the loaned securities. The Series continues to record dividends or interest, as applicable, on the securities loaned and is subject to change in value of the securities loaned that may occur during the term of the loan. The Series has the right under the Lending Agreement to recover the securities from the borrower on demand. With respect to security loans collateralized by U.S. Treasury obligations, the Series receives a fee from the securities lending agent. With respect to security loans collateralized by cash collateral, the earnings from the collateral investments are shared among the Series, the security lending agent and the borrower. The Series records securities lending income net of allocations to the security lending agent and the borrower.
At December 31, 2007, the market value of the securities on loan was $2,729,507, for which the Series received collateral, comprised of U.S. government obligations valued at $100,324, and cash collateral of $2,721,170. Investments purchased with cash collateral are presented on the Statement of Net Assets under the caption “Securities Lending Collateral.”
9. Credit and Market Risk
The Series invests a significant portion of its assets in small- and mid-sized companies and may be subject to certain risks associated with ownership of securities of such companies. Investments in small- or mid-sized companies may be more volatile than investments in larger companies for a number of reasons, which include more limited financial resources or a dependence on narrow product lines.
The Series may invest up to 15% of its net assets in illiquid securities, which may include securities with contractual restrictions on resale, securities exempt from registration under Rule 144A of the Securities Act of 1933, as amended, and other securities which may not be readily marketable. The relative illiquidity of these securities may impair the Series from disposing of them in a timely manner and at a fair price when it is necessary or desirable to do so. While maintaining oversight, the Series’ Board of Trustees has delegated to DMC the day-to-day functions of determining whether individual securities are liquid for purposes of the Series’ limitation on investments in illiquid assets. As of December 31, 2007, there were no Rule 144A securities and no securities have been determined to be illiquid under the Series’ Liquidity Procedures.
9. Contractual Obligations
The Series enters into contracts in the normal course of business that contain a variety of indemnifications. The Series’ maximum exposure under these arrangements is unknown. However, the Series has not had prior claims or losses pursuant to these contracts. Management has reviewed the Series’ existing contracts and expects the risk of loss to be remote.
10. Change in Custodian
On August 2, 2007, Mellon, One Mellon Center, Pittsburgh, PA 15258, became the Series’ custodian.
13
Delaware VIP Trust — Delaware VIP Select Growth Series
Report of Independent Registered Public Accounting Firm
To the Shareholders and Board of Trustees
We have audited the accompanying statement of net assets of the Delaware VIP Select Growth Series (one of the series constituting Delaware VIP Trust) (the “Series”) as of December 31, 2007, and the related statement of operations for the year then ended, the statements of changes in net assets for each of the two years in the period then ended, and the financial highlights for each of the five years in the period then ended. These financial statements and financial highlights are the responsibility of the Series’ management. Our responsibility is to express an opinion on these financial statements and financial highlights based on our audits.
We conducted our audits in accordance with the standards of the Public Company Accounting Oversight Board (United States). Those standards require that we plan and perform the audit to obtain reasonable assurance about whether the financial statements and financial highlights are free of material misstatement. We were not engaged to perform an audit of the Series’ internal control over financial reporting. Our audits included consideration of internal control over financial reporting as a basis for designing audit procedures that are appropriate in the circumstances, but not for the purpose of expressing an opinion on the effectiveness of the Series’ internal control over financial reporting. Accordingly, we express no such opinion. An audit also includes examining, on a test basis, evidence supporting the amounts and disclosures in the financial statements and financial highlights, assessing the accounting principles used and significant estimates made by management, and evaluating the overall financial statement presentation. Our procedures included confirmation of securities owned as of December 31, 2007, by correspondence with the custodian and brokers or by other appropriate auditing procedures where replies from brokers were not received. We believe that our audits provide a reasonable basis for our opinion.
In our opinion, the financial statements and financial highlights referred to above present fairly, in all material respects, the financial position of the Delaware VIP Select Growth Series of Delaware VIP Trust at December 31, 2007, the results of its operations for the year then ended, the changes in its net assets for each of the two years in the period then ended, and its financial highlights for each of the five years in the period then ended, in conformity with U.S. generally accepted accounting principles.

Philadelphia, Pennsylvania
February 14, 2008
The Series files its complete schedule of portfolio holdings with the Securities and Exchange Commission (Commission) for the first and third quarters of each fiscal year on Form N-Q. The Series’ Forms N-Q, as well as a description of the policies and procedures that the Series uses to determine how to vote proxies (if any) relating to portfolio securities is available without charge (i) upon request, by calling 800 523-1918; and (ii) on the Commission’s website at http://www.sec.gov. In addition, a description of the policies and procedures that the Series uses to determine how to vote proxies (if any) relating to portfolio securities is available without charge on the Delaware Investments® Funds’ website at http://www.delawareinvestments.com. The Series’ Forms N-Q may be reviewed and copied at the Commission’s Public Reference Room in Washington, DC; information on the operation of the Public Reference Room may be obtained by calling 800 SEC-0330.
Information (if any) regarding how the Series voted proxies relating to portfolio securities during the most recently disclosed 12- month period ended June 30 is available without charge (i) through the Delaware Investments® Funds’ website at http://www.delawareinvestments.com; and (ii) on the Commission’s website at http://www.sec.gov.
14
Delaware Investments® Family of Funds
BOARD OF TRUSTEES/DIRECTORS AND OFFICERS ADDENDUM
A mutual fund is governed by a Board of Trustees/Directors (“Trustees”), which has oversight responsibility for the management of a fund’s business affairs. Trustees establish procedures and oversee and review the performance of the investment manager, the distributor, and others who perform services for the fund. The independent fund trustees, in particular, are advocates for shareholder interests. Each trustee has served in that capacity since he or she was elected to or appointed to the Board of Trustees, and will continue to serve until his or her retirement or the election of a new trustee in his or her place. The following is a list of the Trustees and Officers with certain background and related information.
Name,
Address,
and Birth Date | | Position(s)
Held with
Fund(s) | | Length of Time
Served | | Principal
Occupation(s)
During
Past 5 Years | | Number of
Portfolios in Fund
Complex Overseen
by Trustee
or Officer | | Other
Directorships
Held by
Trustee
or Officer |
INTERESTED TRUSTEES | | | | | | | | |
| | | | | | | | | | |
Patrick P. Coyne(1)
2005 Market Street
Philadelphia, PA
19103 April 1963 | | Chairman, President, Chief Executive Officer, and Trustee | | Chairman and Trustee since August 16, 2006 President and Chief Executive Officer since August 1, 2006 | | Patrick P. Coyne has served in various executive capacities at different times at Delaware Investments.(2) | | 84 | | Director — Kaydon Corp.
Board of Governors Member – Investment Company Institute (2007 – present)
Member of Investment Committee – Cradle of Liberty Council, BSA (November 2007 – present)
Finance Committee Member – St. John Vianney Roman Catholic Church (2007 – present) |
| | | | | | | | | | |
INDEPENDENT TRUSTEES | | | | | | | | |
| | | | | | | | | | |
Thomas L. Bennett
2005 Market Street
Philadelphia, PA
19103 October 1947 | | Trustee | | Since March 2005 | | Private Investor – (March 2004 – Present) Investment Manager – Morgan Stanley & Co. (January 1984 – March 2004) | | 84 | | Director — Bryn Mawr Bank Corp. (BMTC) (April 2007 — Present) Chairman of Investment Committee – The Haverford School (2002 – present) Chairman of Investment Committee – Pennsylvania Academy of Fine Arts
(2007 – present) Trustee
(2004 – present) Investment Committee Member – Pennsylvania Horticulture Society (February 2006 – present) |
15
Name,
Address,
and Birth Date | | Position(s)
Held with
Fund(s) | | Length of Time
Served | | Principal
Occupation(s)
During
Past 5 Years | | Number of
Portfolios in Fund
Complex Overseen
by Trustee
or Officer | | Other
Directorships
Held by
Trustee
or Officer |
INDEPENDENT TRUSTEES (CONTINUED) | | | | | | |
| | | | | | | | | | |
John A. Fry
2005 Market Street
Philadelphia, PA
19103 May 1960 | | Trustee | | Since January 2001 | | President – Franklin & Marshall College (June 2002 – Present) Executive Vice President – University of Pennsylvania (April 1995 – June 2002) | | 84 | | Director — Community Health Systems Director — Allied Barton Security Holdings |
| | | | | | | | | | |
Anthony D. Knerr
2005 Market Street
Philadelphia, PA
19103 December 1938 | | Trustee | | Since April 1990 | | Founder and Managing Director – Anthony Knerr & Associates (Strategic Consulting)
(1990 – Present) | | 84 | | None |
| | | | | | | | | | |
Lucinda S. Landreth
2005 Market Street
Philadelphia, PA
19103
June 1947 | | Trustee | | Since March 2005 | | Chief Investment Officer – Assurant, Inc. (Insurance)
(2002 – 2004) | | 84 | | None |
| | | | | | | | | | |
Ann R. Leven
2005 Market Street
Philadelphia, PA
19103
November 1940 | | Trustee | | Since October 1989 | | Consultant – ARL Associates (Financial Planning) (1983 – Present) | | 84 | | Director and Audit Committee Member – Systemax, Inc. |
| | | | | | | | | | |
Thomas F. Madison
2005 Market Street
Philadelphia, PA
19103 February 1936 | | Trustee | | Since May 1997 | | President and Chief Executive Officer — MLM Partners, Inc. (Small Business Investing and Consulting) (January 1993 – Present) | | 84 | | Director — CenterPoint Energy Director and Audit Committee Member — Digital River, Inc. Director and Audit Committee Member — Rimage Corporation Director and Chair of Compensation and Governance & Nominating Committees — Valmont Industries, Inc. |
| | | | | | | | | | |
Janet L. Yeomans
2005 Market Street
Philadelphia, PA
19103
July 1948 | | Trustee | | Since April 1999 | | Treasurer (January 2006 – Present) Vice President – Mergers & Acquisitions (January 2003 – January 2006),
and Vice President (July 1995 – January 2003)
3M Corporation | | 84 | | None |
| | | | | | | | | | |
J. Richard Zecher
2005 Market Street
Philadelphia, PA
19103 July 1940 | | Trustee | | Since March 2003 | | Founder — Investor Analytics (Risk Management) (May 1999 – Present) Founder — Sutton Asset Management (Hedge Fund) (September 1998 – Present) | | 84 | | Director and Audit Committee Member — Investor Analytics Director and Audit Committee Member — Oxigene, Inc. |
16
Name,
Address,
and Birth Date | | Position(s)
Held with
Fund(s) | | Length of Time
Served | | Principal
Occupation(s)
During
Past 5 Years | | Number of
Portfolios in Fund
Complex Overseen
by Trustee
or Officer | | Other
Directorships
Held by
Trustee
or Officer |
OFFICERS | | | | | | | | | | |
| | | | | | | | | | |
David F. Connor
2005 Market Street
Philadelphia, PA
19103 December 1963 | | Vice President, Deputy General Counsel, and Secretary | | Vice President since September 21, 2000 and Secretary since October 2005 | | David F. Connor has served as Vice President and Deputy General Counsel of Delaware Investments since 2000. | | 84 | | None(4) |
| | | | | | | | | | |
Daniel V. Geatens
2005 Market Street
Philadelphia, PA
19103 October 1972 | | Vice President and Treasurer | | Treasurer since October 25, 2007 | | Daniel V. Geatens has served in various capacities at different times at Delaware Investments. | | 84 | | None(4) |
| | | | | | | | | | |
David P. O’Connor
2005 Market Street
Philadelphia, PA
19103 February 1966 | | Senior Vice President, General Counsel, and Chief Legal Officer | | Senior Vice President, General Counsel, and Chief Legal Officer since October 2005 | | David P. O’Connor has served in various executive and legal capacities at different times at Delaware Investments. | | 84 | | None(4) |
| | | | | | | | | | |
Richard Salus
2005 Market Street
Philadelphia, PA
19103 October 1963 | | Senior Vice President and Chief Financial Officer | | Chief Financial Officer since November 1, 2006 | | Richard Salus has served in various executive capacities at different times at Delaware Investments. | | 84 | | None(4) |
(1) | Patrick P. Coyne is considered to be an “Interested Trustee” because he is an executive officer of the Fund’s(s’) investment advisor. |
(2) | Delaware Investments is the marketing name for Delaware Management Holdings, Inc. and its subsidiaries, including the Fund’s(s’) investment advisor, principal underwriter, and its transfer agent. |
(3) | In 1997, several funds managed by Voyageur Fund Managers, Inc. (the “Voyageur Funds”) were incorporated into the Delaware Investments Family of Funds. Mr. Madison served as a director of the Voyageur Funds from 1993 until 1997. |
(4) | David F. Connor, Daniel V. Geatens, David P. O’Connor, and Richard Salus serve in similar capacities for the six portfolios of the Optimum Fund Trust, which have the same investment advisor, principal underwriter, and transfer agent as the registrant. |
The Statement of Additional Information for the Fund(s) includes additional information about the Trustees and Officers and is available, without charge, upon request by calling 800 523-1918.
17
Delaware VIP Trust — Delaware VIP Small Cap Value Series (closed to new investors)
For the 12-month period, the Delaware VIP Small Cap Value Series returned - -6.62% for Standard Class shares and -6.84% for Service Class shares, both with all distributions reinvested. The benchmark, the Russell 2000® Value Index, returned -9.78% (source: Lipper).
The investment climate during the past year was a difficult one for small-capitalization equity investors. Despite slowing economic growth and increased market volatility, U.S. equity markets delivered modest gains during the first half of the fiscal period. Much of these gains were diminished, however, as concerns over problems in the subprime mortgage market began to surface in late July and early August 2007.
Within U.S. markets, negative performance was pronounced among stocks of homebuilders, banks, mortgage companies, and real estate companies. On the other hand, the healthcare and technology sectors, which were largely unscathed by the troubled credit and housing markets, turned in relatively strong performances for the period.
We continued to extensively analyze companies within the small-capitalization universe in search of those with significant free cash flow. During the period, there were no fundamental changes made to our sector allocations. While the Series turned in a positive performance during roughly the first half of the year, its gains were offset by significant market deterioration during the latter months of the period.
We attribute the Series’ outperformance of its benchmark to both stock selection and sector allocation within the Series. Specifically, we benefited from underweight positions versus the index in the market’s poorest performing sectors — real estate investment trusts (REITs), financial services, and consumer cyclicals. In contrast, the Series held overweight positions in basic industries, healthcare, and technology, which were among the market’s strongest performing sectors.
Stress in the credit markets, coupled with slower growth, led to broadly disappointing performance among REITs during the period. Performance within the Series was no exception. For example, Brandywine Realty Trust, a suburban office properties manager, failed to meet the expectations we had set for its stock. Brandywine Realty is one of many REITs that generated disappointing returns during the fiscal year period. The Series held Brandywine Realty at year end.
We do not plan to alter our investment strategy and will continue to focus on small companies generating strong cash flows that we believe can deliver positive long-term value through stock repurchase, dividend growth, and debt reduction.
The views expressed are current as of the date of this report and are subject to change.
The performance data quoted below represent past performance; past performance does not guarantee future results. Investment return and principal value will fluctuate so your shares, when redeemed, may be worth more or less than their original cost. Please obtain the performance data for the most recent month end by calling the number noted in the introductory section of this report on the page related to this Series.
You should consider the investment objectives, risks, charges, and expenses of the investment company carefully before investing. The Delaware VIP Small Cap Value Series prospectus contains this and other important information about the Series. To obtain a prospectus, contact the company noted on the page related to this Series in the introductory section of this report, either by phone or through the company Web site. We advise you to read the prospectus carefully before you invest.
Delaware VIP Small Cap Value Series
Average annual total returns
For periods ended Dec. 31, 2007 | | 1 year | | 5 years | | 10 years | | Lifetime | |
| | | | | | | | | |
Standard Class shares (commenced operations Dec. 27, 1993) | | -6.62 | % | +15.41 | % | +8.75 | % | +11.85 | % |
| | | | | | | | | |
Service Class shares (commenced operations May 1, 2000) | | -6.84 | % | +15.13 | % | NA | | +12.86 | % |
As disclosed in the Series’ most recent prospectus, expenses for Standard Class and Service Class shares were as follows: The net expense ratios for Standard Class and Service Class shares of the Series were 0.83% and 1.08%, respectively. Total operating expenses for Standard Class and Service Class shares were 0.83% and 1.13%, respectively. Management fees for Standard Class and Service Class shares were 0.72%.
Earnings from a variable annuity or variable life investment compound tax-free until withdrawal and, as a result, no adjustments were made for income taxes.
An expense limitation was in effect for all classes during the periods shown in the Series performance chart above and in the Performance of a $10,000 Investment chart on the next page.
Performance of Service Class shares will vary due to different charges and expenses.
Performance data do not reflect insurance fees related to a variable annuity or variable life investment or the deferred sales charge that would apply to certain withdrawals of investments held for fewer than eight years. Performance shown here would have been reduced if such
1
fees were included and the expense limitation removed. For more information about fees, consult your variable annuity or variable life prospectus.
Investments in variable products involve risk. A value stock may not increase in price as anticipated if other investors do not share the portfolio managers’ perception of the company’s value or if factors that would typically increase the price of the security do not occur. This Series will be affected primarily by declines in stock prices, which can be caused by a drop in the stock market or poor performance in specific industries or companies. Some portfolios offer more risk than others. Series that invest in small and/or medium-sized company stocks typically involve greater risk, particularly in the short term, than those investing in larger, more established companies.
Please read both the contract and underlying prospectus for specific details regarding the product’s risk profile.

The chart shows a $10,000 investment in the Delaware VIP Small Cap Value Series Standard Class shares for the period from Dec. 31, 1997, through Dec. 31, 2007. Performance of Service Class shares will vary due to different charges and expenses.
The chart also shows $10,000 invested in the Russell 2000 Value Index from Dec. 31, 1997, through Dec. 31, 2007. The Russell 2000 Value Index measures the performance of those Russell 2000 companies with lower price-to-book ratios and lower forecasted growth values. An index is unmanaged and does not reflect the costs of operating a mutual fund, such as the costs of buying, selling, and holding securities. You cannot invest directly in an index.
2
Delaware VIP Trust — Delaware VIP Small Cap Value Series
Disclosure of Series Expenses
For the Period July 1, 2007 to December 31, 2007
As a shareholder of the Series, you incur ongoing costs, including management fees; distribution and/or service (12b-1) fees; and other Series expenses. This Example is intended to help you understand your ongoing costs (in dollars) of investing in the Series and to compare these costs with the ongoing costs of investing in other mutual funds.
The Example is based on an investment of $1,000 invested at the beginning of the period and held for the entire period from July 1, 2007 to December 31, 2007.
Actual Expenses
The first section of the table shown, “Actual Series Return,” provides information about actual account values and actual expenses. You may use the information in this section of the table, together with the amount you invested, to estimate the expenses that you paid over the period. Simply divide your account value by $1,000 (for example, an $8,600 account value divided by $1,000 = 8.6), then multiply the result by the number in the first section under the heading entitled “Expenses Paid During Period” to estimate the expenses you paid on your account during the period.
Hypothetical Example for Comparison Purposes
The second section of the table shown, “Hypothetical 5% Return,” provides information about hypothetical account values and hypothetical expenses based on the Series’ actual expense ratio and an assumed rate of return of 5% per year before expenses, which is not the Series’ actual return. The hypothetical account values and expenses may not be used to estimate the actual ending account balance or expenses you paid for the period. You may use this information to compare the ongoing costs of investing in the Series and other funds. To do so, compare the 5% hypothetical example with the 5% hypothetical examples that appear in the shareholder reports of other funds.
Please note that the expenses shown in the table are meant to highlight your ongoing costs only. As a shareholder of the Series, you do not incur any transaction costs, such as sales charges (loads), redemption fees or exchange fees, but shareholders of other funds may incur such costs. Also, the fees related to the variable annuity investment or the deferred sales charge that could apply have not been included. Therefore, the second section of the table is useful in comparing ongoing costs only, and will not help you determine the relative total costs of owning different funds. The Series’ actual expenses shown in the table reflect fee waivers in effect for Service Class shares. The expenses shown in the table assume reinvestment of all dividends and distributions.
Expense Analysis of an Investment of $1,000
| | Beginning
Account
Value
7/1/07 | | Ending
Account
Value
12/31/07 | | Annualized
Expense
Ratios | | Expenses
Paid During
Period
7/1/07 to
12/31/07* | |
Actual Series Return | | | | | | | | | |
Standard Class | | $ | 1,000.00 | | $ | 867.70 | | 0.81 | % | $ | 3.81 | |
Service Class | | 1,000.00 | | 866.60 | | 1.06 | % | 4.99 | |
Hypothetical 5% Return (5% return before expenses) | | | | | | | | | |
Standard Class | | $ | 1,000.00 | | $ | 1,021.12 | | 0.81 | % | $ | 4.13 | |
Service Class | | 1,000.00 | | 1,019.86 | | 1.06 | % | 5.40 | |
* “Expenses Paid During Period” are equal to the Series’ annualized expense ratio, multiplied by the average account value over the period, multiplied by 184/365 (to reflect the one-half year period).
3
Delaware VIP Trust — Delaware VIP Small Cap Value Series
Sector Allocation and Top 10 Holdings
As of December 31, 2007
Sector designations may be different than the sector designations presented in other Series materials.
Sector | | Percentage
of Net Assets | |
Common Stock | | 97.41 | % |
Basic Industry/Capital Goods | | 11.60 | % |
Business Services | | 2.51 | % |
Capital Spending | | 9.00 | % |
Consumer Cyclical | | 0.95 | % |
Consumer Services | | 11.15 | % |
Consumer Staples | | 2.53 | % |
Energy | | 7.62 | % |
Financial Services | | 19.06 | % |
Health Care | | 7.42 | % |
Real Estate | | 4.04 | % |
Technology | | 13.96 | % |
Transportation | | 4.12 | % |
Utilities | | 3.45 | % |
Discount Note | | 2.73 | % |
Securities Lending Collateral | | 23.45 | % |
Total Value of Securities | | 123.59 | % |
Obligation to Return Securities Lending Collateral | | (23.45 | )% |
Liabilities Net of Receivables and Other Assets | | (0.14 | )% |
Total Net Assets | | 100.00 | % |
Holdings are for informational purposes only and are subject to change at any time. They are not a recommendation to buy, sell, or hold any security.
Top 10 Holdings | | Percentage
of Net Assets | |
Whiting Petroleum | | 2.17 | % |
Bank of Hawaii | | 1.67 | % |
FMC | | 1.65 | % |
Crown Holdings | | 1.60 | % |
Newfield Exploration | | 1.59 | % |
Actuant Class A | | 1.58 | % |
Brink’s | | 1.57 | % |
Quanex | | 1.56 | % |
Kirby | | 1.54 | % |
Owens & Minor | | 1.53 | % |
4
Delaware VIP Trust — Delaware VIP Small Cap Value Series
Statement of Net Assets
December 31, 2007
| | Number of
Shares | | Value | |
| | | | | | |
| COMMON STOCK–97.41% | | | | | |
| Basic Industry/Capital Goods–11.60% | | | | | |
* | AbitibiBowater | | 255,788 | | $ | 5,271,791 | |
* | Albemarle | | 341,500 | | 14,086,875 | |
* | Arch Coal | | 229,500 | | 10,311,435 | |
*† | Crown Holdings | | 611,000 | | 15,672,150 | |
| Cytec Industries | | 190,100 | | 11,706,358 | |
* | FMC | | 295,400 | | 16,114,069 | |
*† | Griffon | | 196,930 | | 2,451,779 | |
* | Hercules | | 280,600 | | 5,429,610 | |
* | Quanex | | 295,300 | | 15,326,070 | |
* | Texas Industries | | 119,100 | | 8,348,910 | |
† | Trimas | | 118,900 | | 1,259,151 | |
* | Valspar | | 338,300 | | 7,625,282 | |
| | | | | 113,603,480 | |
| Business Services–2.51% | | | | | |
| Brink’s | | 256,700 | | 15,335,258 | |
*† | United Stationers | | 200,800 | | 9,278,968 | |
| | | | | 24,614,226 | |
| Capital Spending–9.00% | | | | | |
* | Actuant Class A | | 455,500 | | 15,491,555 | |
*† | Casella Waste Systems | | 264,100 | | 3,443,864 | |
*† | Gardner Denver | | 292,900 | | 9,665,700 | |
| Harsco | | 218,700 | | 14,012,109 | |
* | Insteel Industries | | 309,600 | | 3,631,608 | |
* | Mueller Industries | | 251,700 | | 7,296,783 | |
* | Mueller Water Products Class B | | 271,584 | | 2,707,692 | |
* | Timken | | 271,900 | | 8,931,915 | |
* | Wabtec | | 365,200 | | 12,577,488 | |
* | Walter Industries | | 290,000 | | 10,419,700 | |
| | | | | 88,178,414 | |
| Consumer Cyclical–0.95% | | | | | |
* | MDC Holdings | | 250,200 | | 9,289,926 | |
| | | | | 9,289,926 | |
| Consumer Services–11.15% | | | | | |
* | Belo Class A | | 329,500 | | 5,746,480 | |
* | Borders Group | | 515,100 | | 5,485,815 | |
* | Cato Class A | | 586,800 | | 9,189,288 | |
*† | CEC Entertainment | | 275,100 | | 7,141,596 | |
† | Dollar Tree Stores | | 351,300 | | 9,105,696 | |
* | Men’s Wearhouse | | 243,400 | | 6,566,932 | |
* | Meredith | | 199,200 | | 10,952,016 | |
* | PETsMART | | 269,400 | | 6,338,982 | |
* | Ross Stores | | 376,600 | | 9,629,662 | |
* | Ruby Tuesday | | 433,800 | | 4,229,550 | |
* | Stage Stores | | 402,825 | | 5,961,810 | |
* | Thor Industries | | 176,800 | | 6,720,168 | |
† | Warnaco Group | | 168,700 | | 5,870,760 | |
* | Wolverine World Wide | | 354,850 | | 8,700,922 | |
*† | Zale | | 471,800 | | 7,577,108 | |
| | | | | 109,216,785 | |
| Consumer Staples–2.53% | | | | | |
* | American Greetings Class A | | 333,100 | | 6,761,930 | |
*† | Constellation Brands Class A | | 386,200 | | 9,129,768 | |
| Del Monte Foods | | 936,400 | | 8,858,344 | |
| | | | | 24,750,042 | |
| Energy–7.62% | | | | | |
*† | Grey Wolf | | 1,001,800 | | $ | 5,339,594 | |
*† | Hercules Offshore | | 370,190 | | 8,803,118 | |
*† | Newfield Exploration | | 295,600 | | 15,578,120 | |
* | Southwest Gas | | 313,700 | | 9,338,849 | |
*† | W-H Energy Services | | 253,600 | | 14,254,856 | |
† | Whiting Petroleum | | 369,300 | | 21,293,838 | |
| | | | | 74,608,375 | |
| Financial Services–19.06% | | | | | |
* | Bank of Hawaii | | 319,800 | | 16,354,571 | |
* | BankUnited Financial Class A | | 522,000 | | 3,601,800 | |
| Berkley (W.R.) | | 451,043 | | 13,445,592 | |
* | Boston Private Financial Holdings | | 485,400 | | 13,144,632 | |
* | Colonial BancGroup | | 757,800 | | 10,260,612 | |
* | East West Bancorp | | 306,000 | | 7,414,380 | |
* | First Midwest Bancorp | | 256,200 | | 7,839,720 | |
* | Hancock Holding | | 202,900 | | 7,750,780 | |
* | Harleysville Group | | 266,400 | | 9,425,232 | |
* | Independent Bank | | 176,000 | | 4,790,720 | |
* | Infinity Property & Casualty | | 226,500 | | 8,183,445 | |
* | NBT Bancorp | | 245,600 | | 5,604,592 | |
| Platinum Underwriters Holdings | | 421,000 | | 14,970,760 | |
| Protective Life | | 263,300 | | 10,800,566 | |
* | Provident Bankshares | | 416,200 | | 8,902,518 | |
* | Selective Insurance Group | | 608,400 | | 13,987,116 | |
| StanCorp Financial Group | | 261,900 | | 13,194,522 | |
* | Sterling Bancshares | | 769,100 | | 8,583,156 | |
* | Sterling Financial | | 505,520 | | 8,487,681 | |
| | | | | 186,742,395 | |
| Health Care–7.42% | | | | | |
*† | AMERIGROUP | | 307,400 | | 11,204,730 | |
* | Owens & Minor | | 353,700 | | 15,007,491 | |
† | Pediatrix Medical Group | | 179,400 | | 12,226,110 | |
* | Service International | | 968,200 | | 13,603,210 | |
* | STERIS | | 422,500 | | 12,184,900 | |
* | Universal Health Services Class B | | 164,900 | | 8,442,880 | |
| | | | | 72,669,321 | |
| Real Estate–4.04% | | | | | |
* | Ashford Hospitality Trust | | 633,000 | | 4,551,270 | |
* | Brandywine Realty Trust | | 504,433 | | 9,044,484 | |
* | Education Realty Trust | | 324,800 | | 3,650,752 | |
* | Highwoods Properties | | 308,900 | | 9,075,482 | |
* | Washington Real Estate Investment Trust | | 423,000 | | 13,286,430 | |
| | | | | 39,608,418 | |
| Technology–13.96% | | | | | |
*† | Bell Microproducts | | 536,200 | | 3,222,562 | |
*† | Brocade Communications Systems | | 1,028,200 | | 7,546,988 | |
† | Checkpoint Systems | | 336,500 | | 8,742,270 | |
† | Cirrus Logic | | 1,179,900 | | 6,229,872 | |
† | Compuware | | 1,487,800 | | 13,211,664 | |
*† | Emulex | | 629,900 | | 10,279,968 | |
† | Entegris | | 719,300 | | 6,207,559 | |
*† | Insight Enterprises | | 364,400 | | 6,646,656 | |
5
| | Number of
Shares | | Value | |
| | | | | | |
| COMMON STOCK (continued) | | | | | |
| Technology (continued) | | | | | |
† | Parametric Technology | | 763,000 | | $ | 13,619,550 | |
*† | Premiere Global Services | | 491,050 | | 7,292,093 | |
* | QAD | | 358,500 | | 3,348,390 | |
*† | Sybase | | 391,300 | | 10,209,017 | |
† | Sykes Enterprises | | 579,400 | | 10,429,200 | |
*† | Syniverse Holdings | | 418,100 | | 6,513,998 | |
*† | Synopsys | | 490,500 | | 12,718,665 | |
*† | Vishay Intertechnology | | 921,100 | | 10,509,751 | |
| | | | | 136,728,203 | |
| Transportation–4.12% | | | | | |
* | Alexander & Baldwin | | 283,800 | | 14,661,108 | |
*† | Kirby | | 323,900 | | 15,054,872 | |
*† | Saia | | 169,400 | | 2,253,020 | |
* | SkyWest | | 312,200 | | 8,382,570 | |
| | | | | 40,351,570 | |
| Utilities–3.45% | | | | | |
* | Black Hills | | 144,200 | | 6,359,220 | |
*† | El Paso Electric | | 435,900 | | 11,145,963 | |
* | FairPoint Communications | | 275,600 | | 3,588,312 | |
* | Otter Tail | | 203,900 | | 7,054,940 | |
* | PNM Resources | | 263,050 | | 5,642,423 | |
| | | | | 33,790,858 | |
| Total Common Stock
(cost $842,451,117) | | | | 954,152,013 | |
| | | | | | | |
| | Principal
Amount | | Value | |
| | | | | | |
¹ | DISCOUNT NOTE–2.73% | | | | | |
| Federal Home Loan Bank 3.25% 1/2/08 | | $ | 26,733,826 | | $ | 26,731,438 | |
| Total Discount Note
(cost $26,731,438) | | | | 26,731,438 | |
| | | | | | |
| Total Value of Securities Before Securities Lending Collateral–100.14%
(cost $869,182,555) | | | | 980,883,451 | |
| | | | | | | | |
| | Number of
Shares | | | |
| | | | | |
SECURITIES LENDING COLLATERAL**–23.45% | | | | | |
Investment Companies | | | | | |
Mellon GSL DBT II Collateral Fund | | 229,693,345 | | 229,693,345 | |
Total Securities Lending Collateral
(cost $229,693,345) | | | | 229,693,345 | |
TOTAL VALUE OF SECURITIES–123.59% (cost $1,098,875,900) | | 1,210,576,796 | © |
OBLIGATION TO RETURN SECURITIES LENDING COLLATERAL**–(23.45%) | | (229,693,345 | ) |
LIABILITIES NET OF RECEIVABLES AND OTHER ASSETS–(0.14%) | | (1,411,430 | ) |
NET ASSETS APPLICABLE TO 34,253,171 SHARES OUTSTANDING–100.00% | | $ | 979,472,021 | |
NET ASSET VALUE–DELAWARE VIP SMALL CAP VALUE SERIES STANDARD CLASS ($353,411,992 / 12,337,353 Shares) | | $ | 28.65 | |
NET ASSET VALUE–DELAWARE VIP SMALL CAP VALUE SERIES SERVICE CLASS
($626,060,029 / 21,915,818 Shares) | | $ | 28.57 | |
COMPONENTS OF NET ASSETS AT DECEMBER 31, 2007: | | | |
Shares of beneficial interest (unlimited authorization–no par) | | $ | 808,660,586 | |
Undistributed net investment income | | 5,706,091 | |
Accumulated net realized gain on investments | | 53,404,448 | |
Net unrealized appreciation of investments | | 111,700,896 | |
Total net assets | | $ | 979,472,021 | |
† | Non-income producing security for the year ended December 31, 2007. |
¹ | The rate shown is the effective yield at the time of purchase. |
* | Fully or partially on loan. |
** | See Note 8 in “Notes to Financial Statements.” |
© | Includes $218,423,709 of securities loaned. |
See accompanying notes
6
Delaware VIP Trust — Delaware VIP Small Cap Value Series
Statement of Operations
Year Ended December 31, 2007
INVESTMENT INCOME: | | | |
Dividends | | $ | 14,016,680 | |
Interest | | 1,859,661 | |
Securities lending income | | 672,412 | |
Foreign tax withheld | | (3,510 | ) |
| | 16,545,243 | |
| | | |
EXPENSES: | | | |
Management fees | | 8,299,806 | |
Distribution expenses – Service Class | | 2,111,891 | |
Accounting and administration expenses | | 464,559 | |
Reports and statements to shareholders | | 205,529 | |
Legal fees | | 148,546 | |
Dividend disbursing and transfer agent fees and expenses | | 132,465 | |
Audit and tax | | 71,700 | |
Trustees’ fees | | 55,331 | |
Insurance fees | | 26,442 | |
Consulting fees | | 21,651 | |
Custodian fees | | 17,841 | |
Trustees’ expenses | | 6,674 | |
Dues and services | | 6,628 | |
Taxes (other than taxes on income) | | 4,096 | |
Pricing fees | | 1,044 | |
| | 11,574,203 | |
Less waiver of distribution expenses – Service Class | | (351,982 | ) |
Less expense paid indirectly | | (5,343 | ) |
Total operating expenses | | 11,216,878 | |
| | | |
NET INVESTMENT INCOME | | 5,328,365 | |
| | | |
NET REALIZED AND UNREALIZED GAIN (LOSS) ON INVESTMENTS AND FOREIGN CURRENCIES: | | | |
Net realized gain on: | | | |
Investments | | 53,909,531 | |
Foreign currencies | | 78 | |
Net realized gain | | 53,909,609 | |
Net change in unrealized appreciation/depreciation of investments and foreign currencies | | (129,197,072 | ) |
| | | |
NET REALIZED AND UNREALIZED LOSS ON INVESTMENTS AND FOREIGN CURRENCIES | | (75,287,463 | ) |
| | | |
NET DECREASE IN NET ASSETS RESULTING FROM OPERATIONS | | $ | (69,959,098 | ) |
See accompanying notes
Delaware VIP Trust — Delaware VIP Small Cap Value Series
Statements of Changes in Net Assets
| | Year Ended | |
| | 12/31/07 | | 12/31/06 | |
INCREASE (DECREASE) IN NET ASSETS FROM OPERATIONS: | | | | | |
Net investment income | | $ | 5,328,365 | | $ | 3,404,557 | |
Net realized gain on investments and foreign currencies | | 53,909,609 | | 97,476,334 | |
Net change in unrealized appreciation/depreciation of investments and foreign currencies | | (129,197,072 | ) | 52,899,077 | |
Net increase (decrease) in net assets resulting from operations | | (69,959,098 | ) | 153,779,968 | |
| | | | | |
DIVIDENDS AND DISTRIBUTIONS TO SHAREHOLDERS FROM: | | | | | |
Net investment income: | | | | | |
Standard Class | | (2,479,347 | ) | (1,141,559 | ) |
Service Class | | (1,850,946 | ) | (137,447 | ) |
Net realized gain on investments: | | | | | |
Standard Class | | (39,389,141 | ) | (30,306,999 | ) |
Service Class | | (55,507,589 | ) | (37,402,855 | ) |
| | (99,227,023 | ) | (68,988,860 | ) |
| | | | | |
CAPITAL SHARE TRANSACTIONS: | | | | | |
Proceeds from shares sold: | | | | | |
Standard Class | | 143,627,279 | | 156,545,638 | |
Service Class | | 65,343,778 | | 157,234,652 | |
Net asset value of shares issued upon reinvestment of dividends and distributions: | | | | | |
Standard Class | | 41,868,488 | | 31,448,558 | |
Service Class | | 57,358,535 | | 37,540,302 | |
| | 308,198,080 | | 382,769,150 | |
Cost of shares repurchased: | | | | | |
Standard Class | | (152,155,497 | ) | (135,422,040 | ) |
Service Class | | (192,366,403 | ) | (72,512,278 | ) |
| | (344,521,900 | ) | (207,934,318 | ) |
Increase (decrease) in net assets derived from capital share transactions | | (36,323,820 | ) | 174,834,832 | |
| | | | | |
NET INCREASE (DECREASE) IN NET ASSETS | | (205,509,941 | ) | 259,625,940 | |
| | | | | |
NET ASSETS: | | | | | |
Beginning of year | | 1,184,981,962 | | 925,356,022 | |
End of year (including undistributed net investment income of $5,706,091 and $4,707,941, respectively) | | $ | 979,472,021 | | $ | 1,184,981,962 | |
See accompanying notes
7
Delaware VIP Trust — Delaware VIP Small Cap Value Series
Financial Highlights
Selected data for each share of the Series outstanding throughout each period were as follows:
| | VIP Small Cap Value Series Standard Class
Year Ended | |
| | 12/31/07 | | 12/31/06 | | 12/31/05 | | 12/31/04 | | 12/31/03 | |
| | | | | | | | | | | | | | | | |
Net asset value, beginning of period | | $ | 33.420 | | $ | 30.830 | | $ | 30.450 | | $ | 25.640 | | $ | 18.140 | |
| | | | | | | | | | | |
Income (loss) from investment operations: | | | | | | | | | | | |
Net investment income(1) | | 0.194 | | 0.146 | | 0.121 | | 0.122 | | 0.068 | |
Net realized and unrealized gain (loss) on investments and foreign currencies | | (2.127 | ) | 4.703 | | 2.539 | | 5.270 | | 7.513 | |
Total from investment operations | | (1.933 | ) | 4.849 | | 2.660 | | 5.392 | | 7.581 | |
| | | | | | | | | | | |
Less dividends and distributions from: | | | | | | | | | | | |
Net investment income | | (0.168 | ) | (0.082 | ) | (0.114 | ) | (0.053 | ) | (0.081 | ) |
Net realized gain on investments | | (2.669 | ) | (2.177 | ) | (2.166 | ) | (0.529 | ) | — | |
Total dividends and distributions | | (2.837 | ) | (2.259 | ) | (2.280 | ) | (0.582 | ) | (0.081 | ) |
| | | | | | | | | | | |
Net asset value, end of period | | $ | 28.650 | | $ | 33.420 | | $ | 30.830 | | $ | 30.450 | | $ | 25.640 | |
| | | | | | | | | | | |
Total return(2) | | (6.62 | )% | 16.19 | % | 9.42 | % | 21.48 | % | 41.98 | % |
| | | | | | | | | | | |
Ratios and supplemental data: | | | | | | | | | | | |
Net assets, end of period (000 omitted) | | $ | 353,412 | | $ | 502,801 | | $ | 413,633 | | $ | 339,542 | | $ | 265,739 | |
Ratio of expenses to average net assets | | 0.81 | % | 0.84 | % | 0.85 | % | 0.83 | % | 0.86 | % |
Ratio of net investment income to average net assets | | 0.61 | % | 0.46 | % | 0.41 | % | 0.46 | % | 0.32 | % |
Portfolio turnover | | 27 | % | 36 | % | 32 | % | 37 | % | 41 | % |
(1) The average shares outstanding method has been applied for per share information.
(2) Total investment return is based on the change in net asset value of a share during the period and assumes reinvestment of dividends and distributions at net asset value.
See accompanying notes
8
Selected data for each share of the Series outstanding throughout each period were as follows:
| | VIP Small Cap Value Series Service Class
Year Ended | |
| | 12/31/07 | | 12/31/06 | | 12/31/05 | | 12/31/04 | | 12/31/03 | |
| | | | | | | | | | | |
Net asset value, beginning of period | | $ | 33.330 | | $ | 30.760 | | $ | 30.390 | | $ | 25.610 | | $ | 18.130 | |
| | | | | | | | | | | | | | | | |
Income (loss) from investment operations: | | | | | | | | | | | |
| | | | | | | | | | | |
Net investment income(1) | | 0.115 | | 0.066 | | 0.048 | | 0.056 | | 0.020 | |
Net realized and unrealized gain (loss) on investments and foreign currencies | | (2.117 | ) | 4.689 | | 2.536 | | 5.258 | | 7.512 | |
Total from investment operations | | (2.002 | ) | 4.755 | | 2.584 | | 5.314 | | 7.532 | |
| | | | | | | | | | | |
Less dividends and distributions from: | | | | | | | | | | | |
Net investment income | | (0.089 | ) | (0.008 | ) | (0.048 | ) | (0.005 | ) | (0.052 | ) |
Net realized gain on investments | | (2.669 | ) | (2.177 | ) | (2.166 | ) | (0.529 | ) | — | |
Total dividends and distributions | | (2.758 | ) | (2.185 | ) | (2.214 | ) | (0.534 | ) | (0.052 | ) |
| | | | | | | | | | | |
Net asset value, end of period | | $ | 28.570 | | $ | 33.330 | | $ | 30.760 | | $ | 30.390 | | $ | 25.610 | |
| | | | | | | | | | | |
Total return(2) | | (6.84 | )% | 15.89 | % | 9.15 | % | 21.16 | % | 41.66 | % |
| | | | | | | | | | | |
Ratios and supplemental data: | | | | | | | | | | | |
Net assets, end of period (000 omitted) | | $ | 626,060 | | $ | 682,181 | | $ | 511,723 | | $ | 399,347 | | $ | 248,930 | |
Ratio of expenses to average net assets | | 1.06 | % | 1.09 | % | 1.10 | % | 1.08 | % | 1.08 | % |
Ratio of expenses to average net assets prior to expense limitation and expenses paid indirectly | | 1.11 | % | 1.14 | % | 1.15 | % | 1.13 | % | 1.11 | % |
Ratio of net investment income to average net assets | | 0.36 | % | 0.21 | % | 0.16 | % | 0.21 | % | 0.10 | % |
Ratio of net investment income to average net assets prior to expense limitation and expenses paid indirectly | | 0.31 | % | 0.16 | % | 0.11 | % | 0.16 | % | 0.07 | % |
Portfolio turnover | | 27 | % | 36 | % | 32 | % | 37 | % | 41 | % |
(1) The average shares outstanding method has been applied for per share information.
(2) Total investment return is based on the change in net asset value of a share during the period and assumes reinvestment of dividends and distributions at net asset value. Total investment return reflects a waiver by the distributor. Performance would have been lower had the waiver not been in effect.
See accompanying notes
9
Delaware VIP Trust — Delaware VIP Small Cap Value Series
Notes to Financial Statements
December 31, 2007
Delaware VIP Trust (Trust) is organized as a Delaware statutory trust and offers 14 series: Delaware VIP Balanced Series, Delaware VIP Capital Reserves Series, Delaware VIP Cash Reserve Series, Delaware VIP Diversified Income Series, Delaware VIP Emerging Markets Series, Delaware VIP Growth Opportunities Series, Delaware VIP High Yield Series, Delaware VIP International Value Equity Series, Delaware VIP REIT Series, Delaware VIP Select Growth Series, Delaware VIP Small Cap Value Series, Delaware VIP Trend Series, Delaware VIP U.S. Growth Series and Delaware VIP Value Series. These financial statements and the related notes pertain to Delaware VIP Small Cap Value Series (Series). The Trust is an open-end investment company. The Series is considered diversified under the Investment Company Act of 1940, as amended, and offers Standard Class and Service Class shares. The Standard Class shares do not carry a 12b-1 fee and the Service Class shares carry a 12b-1 fee. The shares of the Series are sold only to separate accounts of life insurance companies.
The investment objective of the Series is to seek capital appreciation.
1. Significant Accounting Policies
The following accounting policies are in accordance with U.S. generally accepted accounting principles and are consistently followed by the Series.
Security Valuation—Equity securities, except those traded on the Nasdaq Stock Market, Inc. (Nasdaq) are valued at the last quoted sales price as of the time of the regular close of the New York Stock Exchange (NYSE) on the valuation date. Securities traded on the Nasdaq are valued in accordance with the Nasdaq Official Closing Price, which may not be the last sales price. If on a particular day an equity security does not trade, then the mean between the bid and asked prices will be used. Short-term debt securities having less than 60 days to maturity are valued at amortized cost, which approximates market value. Securities lending collateral, which is invested in a collective investment vehicle, is valued at unit value per share. Other securities and assets for which market quotations are not readily available are valued at fair value as determined in good faith under the direction of the Series’ Board of Trustees. In determining whether market quotations are readily available or fair valuation will be used, various factors will be taken into consideration, such as market closures, or with respect to foreign securities, aftermarket trading, or significant events after local market trading (e.g., government actions or pronouncements, trading volume or volatility on markets, exchanges among dealers, or news events).
In September 2006, the Financial Accounting Standards Board (FASB) issued FASB Statement No. 157 “Fair Value Measurements” (Statement 157). Statement 157 establishes a framework for measuring fair value in U.S. generally accepted accounting principles, clarifies the definition of fair value within that framework, and expands disclosures about the use of fair value measurements. Statement 157 is intended to increase consistency and comparability among fair value estimates used in financial reporting. Statement 157 is effective for fiscal years beginning after November 15, 2007. Management does not expect the adoption of Statement 157 to have a material impact on the amounts reported in the financial statements.
Federal Income Taxes—The Series intends to continue to qualify for federal income tax purposes as a regulated investment company under subchapter M of the Internal Revenue Code of 1986, as amended, and make the requisite distributions to shareholders. Accordingly, no provision for federal income taxes has been made in the financial statements.
Effective June 29, 2007, the Series adopted FASB Interpretation No. 48 “Accounting for Uncertainty in Income Taxes” (FIN 48). FIN 48 provides guidance for how uncertain tax positions should be recognized, measured, presented and disclosed in the financial statements. FIN 48 requires the evaluation of tax positions taken or expected to be taken in the course of preparing the Series’ tax returns to determine whether the tax positions are “more-likely-than-not” of being sustained by the applicable tax authority. Tax positions not deemed to meet the more-likely-than-not threshold are recorded as a tax benefit or expense in the current year. The adoption of FIN 48 did not result in the recording of any tax benefit or expense in the current period.
Class Accounting—Investment income, common expenses and realized and unrealized gain (loss) on investments are allocated to the classes of the Series on the basis of daily net assets of each class. Distribution expenses relating to a specific class are charged directly to that class.
Repurchase Agreements—The Series may invest in a pooled cash account along with members of the Delaware Investments® Family of Funds pursuant to an exemptive order issued by the Securities and Exchange Commission. The aggregate daily balance of the pooled cash account is invested in repurchase agreements secured by obligations of the U.S. government. The respective collateral is held by the Series’ custodian bank until the maturity of the respective repurchase agreements. Each repurchase agreement is at least 102% collateralized. However, in the event of default or bankruptcy by the counterparty to the agreement, realization of the collateral may be subject to legal proceedings. At December 31, 2007, the Series held no investments in repurchase agreements.
Use of Estimates—The preparation of financial statements in conformity with U.S. generally accepted accounting principles requires management to make estimates and assumptions that affect the reported amounts of assets and liabilities at the date of the financial statements and the reported amounts of revenues and expenses during the reporting period. Actual results could differ from those estimates.
Other—Expenses directly attributable to the Series are charged directly to the Series. Other expenses common to various funds within the Delaware Investments® Family of Funds are generally allocated amongst such funds on the basis of average net assets. Management fees and some other expenses are paid monthly. Security transactions are recorded on the date the securities are purchased or sold (trade date) for financial reporting purposes. Costs used in calculating realized gains and losses on the sale of investment securities are those of the specific securities sold. Dividend income is recorded on the ex-dividend date and interest income is recorded on the accrual basis. Distributions received from investments in real estate investment trusts are recorded as dividend income on ex-dividend date, subject to reclassification upon notice of the character of such distribution by the issuer. Foreign dividends are also recorded on the ex-dividend date or as soon after the ex-dividend date that the Series is aware of such dividends, net of all non-rebatable tax withholdings. Withholding taxes on foreign dividends have been recorded in accordance with the Series’ understanding of the applicable country’s tax rules and rates.
10
Delaware VIP Small Cap Value Series
Notes to Financial Statements (Continued)
The Series declares and pays dividends from net investment income and distributions from net realized gain on investments, if any, following the close of the fiscal year.
Subject to seeking best execution, the Series may direct certain security trades to brokers who have agreed to rebate a portion of the related brokerage commission to the Series in cash. Such commission rebates are included in realized gain on investments in the accompanying financial statements and totaled $3,714 for the year ended December 31, 2007. In general, best execution refers to many factors, including the price paid or received for a security, the commission charged, the promptness and reliability of execution, the confidentiality and placement accorded the order, and other factors affecting the overall benefit obtained by the Series on the transaction.
The Series receives earnings credits from its custodian when positive cash balances are maintained, which are used to offset custody fees. The expense paid under this arrangement is included in custodian fees on the Statement of Operations with the corresponding expense offset shown as “expense paid indirectly.”
2. Investment Management, Administration Agreements and Other Transactions with Affiliates
In accordance with the terms of its investment management agreement, the Series pays Delaware Management Company (DMC), a series of Delaware Management Business Trust and the investment manager, an annual fee which is calculated daily at the rate of 0.75% on the first $500 million of average daily net assets of the Series, 0.70% on the next $500 million, 0.65% on the next $1.5 billion, and 0.60% on average daily net assets in excess of $2.5 billion.
Prior to May 1, 2007, DMC had contractually agreed to waive that portion, if any, of its management fee and reimburse the Series to the extent necessary to ensure that total annual operating expenses, exclusive of taxes, interest, brokerage fees, 12b-1 plan expenses, certain insurance costs and non-routine expenses or costs including, but not limited to, those relating to reorganizations, litigation, conducting shareholder meetings, and liquidations, did not exceed 1.03% of average daily net assets of the Series. No reimbursement was due for the year ended December 31, 2007.
Effective October 1, 2007, Delaware Service Company, Inc. (DSC), an affiliate of DMC, provides fund accounting and financial administration oversight services to the Series. For these services, the Series pays DSC fees based on the aggregate daily net assets of the Delaware Investments® Family of Funds at the following annual rate: 0.0050% of the first $30 billion; 0.0045% of the next $10 billion; 0.0040% of the next $10 billion; and 0.0025% of aggregate average daily net assets in excess of $50 billion. The fees payable to DSC under the service agreement described above are allocated among all funds in the Delaware Investments® Family of Funds on a relative net asset value basis. Prior to October 1, 2007, DSC provided fund accounting and administrative services to the Series and received a fee at an annual rate of 0.04% of average daily net assets. For the year ended December 31, 2007, the Series was charged $373,120 for these services.
DSC also provides dividend disbursing and transfer agency services. The Series pays DSC a monthly fee based on the number of shareholder accounts for dividend disbursing and transfer agent services.
Pursuant to a distribution agreement and distribution plan, the Series pays Delaware Distributors, L.P. (DDLP), the distributor and an affiliate of DMC, an annual distribution and service fee not to exceed 0.30% of the average daily net assets of the Service Class shares. DDLP has contracted to waive distribution and service fees through April 30, 2008 in order to prevent distribution and service fees of the Service Class shares from exceeding 0.25% of average daily net assets. Standard Class shares pay no distribution and service expenses.
At December 31, 2007, the Series had liabilities payable to affiliates as follows:
Investment
Management
Fee Payable to
DMC | | Dividend Disbursing,
Transfer Agent Fees
and Other Expenses
Payable to DSC | | Distribution
Fees Payable
to DDLP | | Other
Expenses
Payable
to DMC
and Affiliates* | |
$ | 613,952 | | $ | 18,073 | | $ | 135,198 | | $ | 90,429 | |
| | | | | | | | | | | |
* | DMC, as part of its administrative services, pays operating expenses on behalf of the Series and is reimbursed on a periodic basis. Such expenses include items such as printing of shareholder reports, fees for audit, legal and tax services, custodian fees and trustees’ fees. |
As provided in the investment management agreement, the Series bears the cost of certain legal and tax services, including internal legal and tax services provided to the Series by DMC and/or its affiliates’ employees. For the year ended December 31, 2007, the Series was charged $60,972 for internal legal and tax services provided by DMC and/or its affiliates’ employees.
Trustees’ fess include expenses accrued by the Series for Each Trustee’s retainer and per meeting fees. Certain officers of DMC, DSC and DDLP are officers and/or Trustees of the Trust. These officers and Trustees are paid no compensation by the Series.
11
Delaware VIP Small Cap Value Series
Notes to Financial Statements (Continued)
3. Investments
For the year ended December 31, 2007, the Series made purchases and sales of investment securities other than short-term investments as follows:
Purchases | | $ | 297,993,103 | |
Sales | | 393,138,702 | |
At December 31, 2007, the cost of investments for federal income tax purposes and unrealized appreciation (depreciation) for the Series were as follows:
Cost of
Investments | | Aggregate
Unrealized
Appreciation | | Aggregate
Unrealized
Depreciation | | Net Unrealized
Appreciation | |
$ | 1,099,042,170 | | $ | 212,696,666 | | $ | (101,162,040 | ) | $ | 111,534,626 | |
| | | | | | | | | | | |
4. Dividend and Distribution Information
Income and long-term capital gain distributions are determined in accordance with federal income tax regulations, which may differ from U.S. generally accepted accounting principles. Additionally, gains (losses) on foreign currency transactions and net short-term gains on sales of investment securities are treated as ordinary income for federal income tax purposes. The tax character of dividends and distributions paid during the years ended December 31, 2007 and 2006 was as follows:
| | Year
Ended
12/31/07 | | Year
Ended
12/31/06 | |
Ordinary income | | $ | 20,507,892 | | $ | 20,780,190 | |
Long-term capital gain | | 78,719,131 | | 48,208,670 | |
Total | | $ | 99,227,023 | | $ | 68,988,860 | |
5. Components of Net Assets on a Tax Basis
As of December 31, 2007, the components of net assets on a tax basis were as follows:
Shares of beneficial interest | | $ | 808,660,586 | |
Undistributed ordinary income | | 8,487,945 | |
Undistributed long-term capital gains | | 53,508,049 | |
Post-October losses | | (2,719,185 | |
Unrealized appreciation of investments | | 111,534,626 | |
Net assets | | $ | 979,472,021 | |
The differences between book basis and tax basis components of net assets are primarily attributable to tax deferral of losses on wash sales.
Post-October losses represent losses realized on investment transactions from November 1, 2007 through December 31, 2007 that, in accordance with federal income tax regulations, the Series has elected to defer and treat as having arisen in the following fiscal year.
For financial reporting purposes, capital accounts are adjusted to reflect the tax character of permanent book/tax differences. Reclassifications are primarily due to tax treatment of gain (loss) on foreign currency transactions. Results of operations and net assets were not affected by these reclassifications. For the year ended December 31, 2007, the Series recorded the following reclassifications:
Undistributed
Net
Investment Income | | Accumulated
Net Realized
Gain | |
$ | 78 | | $ | (78 | ) |
| | | | | |
12
Delaware VIP Small Cap Value Series
Notes to Financial Statements (Continued)
6. Capital Shares
Transactions in capital shares were as follows:
| | Year
Ended
12/31/07 | | Year
Ended
12/31/06 | |
Shares sold: | | | | | |
Standard Class | | 2,031,001 | | 4,980,616 | |
Service Class | | 4,522,808 | | 4,932,974 | |
| | | | | |
Shares issued upon reinvestment of dividends and distributions: | | | | | |
Standard Class | | 1,317,448 | | 999,954 | |
Service Class | | 1,805,999 | | 1,194,030 | |
| | 9,677,256 | | 12,107,574 | |
| | | | | |
Shares repurchased: | | | | | |
Standard Class | | (6,058,111 | ) | (4,349,582 | ) |
Service Class | | (4,879,159 | ) | (2,294,511 | ) |
| | (10,937,270 | ) | (6,644,093 | ) |
Net increase (decrease) | | (1,260,014 | ) | 5,463,481 | |
7. Line of Credit
The Series, along with certain other funds in the Delaware Investments® Family of Funds (Participants), participates in a $225,000,000 revolving line of credit facility to be used for temporary or emergency purposes as an additional source of liquidity to fund redemptions of investor shares. The Participants are charged an annual commitment fee, which is allocated across the Participants on the basis of each Participant’s allocation of the entire facility. The Participants may borrow up to a maximum of one third of their net assets under the agreement. The Series had no amounts outstanding as of December 31, 2007, or at any time during the year then ended.
8. Securities Lending
The Series, along with other funds in the Delaware Investments® Family of Funds, may lend its securities pursuant to a security lending agreement (Lending Agreement) with Mellon Bank, N.A. (Mellon). With respect to each loan, if the aggregate market value of the collateral held on any business day is less than the aggregate market value of the securities which are the subject of such loan, the borrower will be notified to provide additional collateral not less than the applicable collateral requirements. Cash collateral received is invested in a collective investment vehicle (Collective Trust) established by Mellon for the purpose of investment on behalf of clients participating in its securities lending programs. The Collective Trust invests in fixed income securities, with a weighted average maturity not to exceed 90 days, rated in one of the top two tiers by Standard & Poor’s Ratings Group or Moody’s Investors Service, Inc. or repurchase agreements collateralized by such securities. However, in the event of default or bankruptcy by the lending agent, realization and/or retention of the collateral may be subject to legal proceedings. In the event the borrower fails to return loaned securities and the collateral received is insufficient to cover the value of the loaned securities and provided such collateral shortfall is not the result of investment losses, the lending agent has agreed to pay the amount of the shortfall to the Series, or at the discretion of the lending agent, replace the loaned securities. The Series continues to record dividends or interest, as applicable, on the securities loaned and is subject to change in value of the securities loaned that may occur during the term of the loan. The Series has the right under the Lending Agreement to recover the securities from the borrower on demand. With respect to security loans collateralized by U.S. Treasury obligations, the Series receives a fee from the securities lending agent. With respect to security loans collateralized by cash collateral, the earnings from the collateral investments are shared among the Series, the security lending agent and the borrower. The Series records securities lending income net of allocations to the security lending agent and the borrower.
At December 31, 2007, the market value of the securities on loan was $218,423,709, for which the Series received collateral, comprised of U.S. government obligations valued at $713,205, and cash collateral of $229,693,345. Investments purchased with cash collateral are presented on the Statement of Net Assets under the caption “Securities Lending Collateral.”
9. Credit and Market Risk
The Series invests a significant portion of its assets in small companies and may be subject to certain risks associated with ownership of securities of such companies. Investments in small-sized companies may be more volatile than investments in larger companies for a number of reasons, which include limited financial resources or a dependence on narrow product lines.
The Series may invest up to 10% of its net assets in illiquid securities, which may include securities with contractual restrictions on resale, securities exempt from registration under Rule 144A of the Securities Act of 1933, as amended, and other securities which may not be readily marketable. The relative illiquidity of these securities may impair the Series from disposing of them in a timely manner and at a fair price when it is necessary or desirable to do so. While maintaining oversight, the Series’ Board of Trustees has delegated to DMC the day-to-day functions of determining whether individual securities are liquid for purposes of the Series’ limitation on investments in illiquid assets. As of December 31, 2007, there were no Rule 144A securities and no securities have been determined to be illiquid under the Series’ Liquidity Procedures.
13
Delaware VIP Small Cap Value Series
Notes to Financial Statements (Continued)
10. Contractual Obligations
The Series enters into contracts in the normal course of business that contain a variety of indemnifications. The Series’ maximum exposure under these arrangements is unknown. However, the Series has not had prior claims or losses pursuant to these contracts. Management has reviewed the Series’ existing contracts and expects the risk of loss to be remote.
11. Tax Information (Unaudited)
For the fiscal year ended December 31, 2007, the Series designates dividends and distributions paid during the year as follows:
(A)
Long-Term
Capital Gain
Distributions
(Tax Basis) | | (B)
Ordinary
Income
Distributions
(Tax Basis) | | Total
Distributions
(Tax Basis) | | (C)
Qualifying
Dividends(1) | |
79% | | 21 | % | 100 | % | 45 | % |
(A) and (B) are based on a percentage of the Series’ total distributions.
(C) is based on a percentage of the Series’ ordinary income distributions.
(1) Qualifying dividends represent dividends which qualify for the corporate dividends received deduction.
12. Change in Custodian
On August 2, 2007, Mellon, One Mellon Center, Pittsburgh, PA 15258, became the Series’ custodian.
14
Delaware VIP Trust — Delaware VIP Small Cap Value Series
Report of Independent Registered Public Accounting Firm
To the Shareholders and Board of Trustees
Delaware VIP Trust–Delaware VIP Small Cap Value Series
We have audited the accompanying statement of net assets of the Delaware VIP Small Cap Value Series (one of the series constituting Delaware VIP Trust) (the “Series”) as of December 31, 2007, and the related statement of operations for the year then ended, the statements of changes in net assets for each of the two years in the period then ended, and the financial highlights for each of the five years in the period then ended. These financial statements and financial highlights are the responsibility of the Series’ management. Our responsibility is to express an opinion on these financial statements and financial highlights based on our audits.
We conducted our audits in accordance with the standards of the Public Company Accounting Oversight Board (United States). Those standards require that we plan and perform the audit to obtain reasonable assurance about whether the financial statements and financial highlights are free of material misstatement. We were not engaged to perform an audit of the Series’ internal control over financial reporting. Our audits included consideration of internal control over financial reporting as a basis for designing audit procedures that are appropriate in the circumstances, but not for the purpose of expressing an opinion on the effectiveness of the Series’ internal control over financial reporting. Accordingly, we express no such opinion. An audit also includes examining, on a test basis, evidence supporting the amounts and disclosures in the financial statements and financial highlights, assessing the accounting principles used and significant estimates made by management, and evaluating the overall financial statement presentation. Our procedures included confirmation of securities owned as of December 31, 2007, by correspondence with the custodian. We believe that our audits provide a reasonable basis for our opinion.
In our opinion, the financial statements and financial highlights referred to above present fairly, in all material respects, the financial position of the Delaware VIP Small Cap Value Series of Delaware VIP Trust at December 31, 2007, the results of its operations for the year then ended, the changes in its net assets for each of the two years in the period then ended, and its financial highlights for each of the five years in the period then ended, in conformity with U.S. generally accepted accounting principles.

Philadelphia, Pennsylvania
February 14, 2008
The Series files its complete schedule of portfolio holdings with the Securities and Exchange Commission (Commission) for the first and third quarters of each fiscal year on Form N-Q. The Series’ Forms N-Q, as well as a description of the policies and procedures that the Series uses to determine how to vote proxies (if any) relating to portfolio securities is available without charge (i) upon request, by calling 800 523-1918; and (ii) on the Commission’s website at http://www.sec.gov. In addition, a description of the policies and procedures that the Series uses to determine how to vote proxies (if any) relating to portfolio securities is available without charge on the Delaware Investments® Funds’ website at http://www.delawareinvestments.com. The Series’ Forms N-Q may be reviewed and copied at the Commission’s Public Reference Room in Washington, DC; information on the operation of the Public Reference Room may be obtained by calling 800 SEC-0330.
Information (if any) regarding how the Series voted proxies relating to portfolio securities during the most recently disclosed 12-month period ended June 30 is available without charge (i) through the Delaware Investments® Funds’ website at http://www.delawareinvestments.com; and (ii) on the Commission’s website at http://www.sec.gov.
15
Delaware Investments® Family of Funds
BOARD OF TRUSTEES/DIRECTORS AND OFFICERS ADDENDUM
A mutual fund is governed by a Board of Trustees/Directors (“Trustees”), which has oversight responsibility for the management of a fund’s business affairs. Trustees establish procedures and oversee and review the performance of the investment manager, the distributor, and others who perform services for the fund. The independent fund trustees, in particular, are advocates for shareholder interests. Each trustee has served in that capacity since he or she was elected to or appointed to the Board of Trustees, and will continue to serve until his or her retirement or the election of a new trustee in his or her place. The following is a list of the Trustees and Officers with certain background and related information.
Name,
Address,
and Birth Date | | Position(s)
Held with
Fund(s) | | Length of Time
Served | | Principal
Occupation(s)
During
Past 5 Years | | Number of
Portfolios in Fund
Complex Overseen
by Trustee
or Officer | | Other
Directorships
Held by
Trustee
or Officer | |
INTERESTED TRUSTEES | | | | | | | | | |
| | | | | | | | | | | |
Patrick P. Coyne(1)
2005 Market Street
Philadelphia, PA 19103
April 1963 | | Chairman, President, Chief Executive Officer, and Trustee | | Chairman and Trustee since August 16, 2006
President and Chief Executive Officer since August 1, 2006 | | Patrick P. Coyne has served in various executive capacities at different times at Delaware Investments.(2) | | 84 | | Director –
Kaydon Corp.
Board of Governors Member – Investment Company Institute (2007 – present)
Member of Investment Committee – Cradle of Liberty Council, BSA (November 2007 – present)
Finance Committee Member – St. John Vianney Roman Catholic Church (2007 – present) | |
| | | | | | | | | | | |
INDEPENDENT TRUSTEES | | | | | | | | | |
| | | | | | | | | | | |
Thomas L. Bennett
2005 Market Street Philadelphia, PA 19103
October 1947 | | Trustee | | Since
March 2005 | | Private Investor – (March 2004 – Present)
Investment Manager – Morgan Stanley & Co. (January 1984 – March 2004) | | 84 | | Director – Bryn Mawr Bank Corp. (BMTC) (April 2007 – Present)
Chairman of Investment Committee – The Haverford School
(2002 – present)
Chairman of Investment Committee – Pennsylvania Academy of Fine Arts
(2007 – present)
Trustee
(2004 – present)
Investment Committee Member – Pennsylvania Horticulture Society (February 2006 – present) | |
16
Name,
Address,
and Birth Date | | Position(s)
Held with
Fund(s) | | Length of Time
Served | | Principal
Occupation(s)
During
Past 5 Years | | Number of
Portfolios in Fund
Complex Overseen
by Trustee
or Officer | | Other
Directorships
Held by
Trustee
or Officer | |
INDEPENDENT TRUSTEES (CONTINUED) | | | | | | | |
| | | | | | | |
John A. Fry
2005 Market Street Philadelphia, PA
19103
May 1960 | | Trustee | | Since
January 2001 | | President –
Franklin & Marshall College
(June 2002 – Present)
Executive Vice President – University of Pennsylvania (April 1995 – June 2002) | | 84 | | Director – Community Health Systems
Director –
Allied Barton Security Holdings | |
| | | | | | | | | | | |
Anthony D. Knerr
2005 Market Street
Philadelphia, PA 19103
December 1938 | | Trustee | | Since
April 1990 | | Founder and Managing Director – Anthony Knerr & Associates (Strategic Consulting) (1990 – Present) | | 84 | | None | |
| | | | | | | | | | | |
Lucinda S. Landreth
2005 Market Street Philadelphia, PA 19103
June 1947 | | Trustee | | Since
March 2005 | | Chief Investment Officer – Assurant, Inc.
(Insurance)
(2002 – 2004) | | 84 | | None | |
| | | | | | | | | | | |
Ann R. Leven
2005 Market Street Philadelphia, PA 19103
November 1940 | | Trustee | | Since
October 1989 | | Consultant –
ARL Associates
(Financial Planning)
(1983 – Present) | | 84 | | Director and Audit Committee Member – Systemax, Inc. | |
| | | | | | | | | | | |
Thomas F. Madison
2005 Market Street
Philadelphia, PA 19103
February 1936 | | Trustee | | Since
May 1997 | | President and Chief Executive Officer – MLM Partners, Inc.
(Small Business Investing and Consulting)
(January 1993 – Present) | | 84 | | Director – CenterPoint Energy
Director and Audit Committee Member – Digital River, Inc.
Director and Audit Committee Member – Rimage Corporation
Director and Chair of Compensation and Governance & Nominating Committees – Valmont Industries, Inc. | |
| | | | | | | | | | | |
Janet L. Yeomans
2005 Market Street Philadelphia, PA 19103
July 1948 | | Trustee | | Since
April 1999 | | Treasurer
(January 2006 – Present) Vice President – Mergers & Acquisitions
(January 2003 – January 2006),
and Vice President
(July 1995 – January 2003)
3M Corporation | | 84 | | None | |
| | | | | | | | | | | |
J. Richard Zecher
2005 Market Street Philadelphia, PA 19103
July 1940 | | Trustee | | Since
March 2003 | | Founder –
Investor Analytics
(Risk Management)
(May 1999 – Present)
Founder –
Sutton Asset Management (Hedge Fund) (September 1998 – Present) | | 84 | | Director and Audit Committee Member – Investor Analytics
Director and Audit Committee Member – Oxigene, Inc. | |
17
Name,
Address,
and Birth Date | | Position(s)
Held with
Fund(s) | | Length of Time
Served | | Principal
Occupation(s)
During
Past 5 Years | | Number of
Portfolios in Fund
Complex Overseen
by Trustee
or Officer | | Other
Directorships
Held by
Trustee
or Officer | |
OFFICERS | | | | | | | | | | | |
| | | | | | | | | | | |
David F. Connor
2005 Market Street Philadelphia, PA 19103
December 1963 | | Vice President, Deputy General Counsel, and Secretary | | Vice President since September 21, 2000 and Secretary since October 2005 | | David F. Connor has served as Vice President and Deputy General Counsel of Delaware Investments since 2000. | | 84 | | None(4) | |
| | | | | | | | | | | |
Daniel V. Geatens
2005 Market Street Philadelphia, PA 19103
October 1972 | | Vice President and Treasurer | | Treasurer
since
October 25, 2007 | | Daniel V. Geatens has served in various capacities at different times at Delaware Investments. | | 84 | | None(4) | |
| | | | | | | | | | | |
David P. O’Connor
2005 Market Street Philadelphia, PA 19103
February 1966 | | Senior Vice President, General Counsel, and Chief Legal Officer | | Senior Vice President, General Counsel, and Chief Legal Officer since October 2005 | | David P. O’Connor has served in various executive and legal capacities at different times at Delaware Investments. | | 84 | | None(4) | |
| | | | | | | | | | | |
Richard Salus
2005 Market Street Philadelphia, PA 19103
October 1963 | | Senior Vice President and Chief Financial Officer | | Chief Financial Officer since November 1, 2006 | | Richard Salus has served in various executive capacities at different times at Delaware Investments. | | 84 | | None(4) | |
(1) | Patrick P. Coyne is considered to be an “Interested Trustee” because he is an executive officer of the Fund’s(s’) investment advisor. |
(2) | Delaware Investments is the marketing name for Delaware Management Holdings, Inc. and its subsidiaries, including the Fund’s(s’) investment advisor, principal underwriter, and its transfer agent. |
(3) | In 1997, several funds managed by Voyageur Fund Managers, Inc. (the “Voyageur Funds”) were incorporated into the Delaware Investments Family of Funds. Mr. Madison served as a director of the Voyageur Funds from 1993 until 1997. |
(4) | David F. Connor, Daniel V. Geatens, David P. O’Connor, and Richard Salus serve in similar capacities for the six portfolios of the Optimum Fund Trust, which have the same investment advisor, principal underwriter, and transfer agent as the registrant. |
The Statement of Additional Information for the Fund(s) includes additional information about the Trustees and Officers and is available, without charge, upon request by calling 800 523-1918.
18
Delaware VIP Trust — Delaware VIP Trend Series
For the 12-month period ended Dec. 31, 2007, the Delaware VIP Trend Series Standard Class shares returned +10.75%, and the Service Class shares returned +10.46% (both figures reflect returns with all distributions reinvested). The Series’ benchmark, the Russell 2000® Growth Index, returned +7.05% (source: Lipper).
Within the index, the consumer discretionary, healthcare, producer durables, and technology sectors led the market. Two of our top contributors were in the consumer discretionary category — Crocs and Shutterfly. Crocs is the maker of a popular and colorful resin footwear, and Shutterfly is an online publishing service that showed strong growth until the last month of the fiscal year. The Series held positions in both stocks at year end.
We worked to identify common stocks of small, growth-oriented or emerging growth companies that we believed offered above-average opportunities for long-term price appreciation. Another holding that helped performance relative to the benchmark was UAP Holding Corp. The agriculture operations and distribution company benefited from the increased prices for corn due to the increasing supply of corn based ethanol. During the year, they agreed to be acquired for a signficant premium. UAP was sold late in the year.
Financial services and technology stocks generally performed poorly. Among our technology holdings, Akamai Technologies, a content delivery company, was a disappointing holding and detracted from the Series’ performance. Akamai’s stock was down, we believed, because of investor concerns over its ability to maintain pricing power in an increasingly competitive landscape. We sold Akamai during the year.
The views expressed are current as of the date of this report and are subject to change.
The performance data quoted below represent past performance; past performance does not guarantee future results. Investment return and principal value will fluctuate so your shares, when redeemed, may be worth more or less than their original cost. Please obtain the performance data for the most recent month end by calling the number noted in the introductory section of this report on the page related to this Series.
You should consider the investment objectives, risks, charges, and expenses of the investment company carefully before investing. The Delaware VIP Trend Series prospectus contains this and other important information about the Series. To obtain a prospectus, contact the company noted on the page related to this Series in the introductory section of this report, either by phone or through the company Web site. We advise you to read the prospectus carefully before you invest.
Delaware VIP Trend Series
Average annual total returns
For periods ended Dec. 31, 2007 | | 1 year | | 5 years | | 10 years | | Lifetime | |
| | | | | | | | | |
Standard Class shares (commenced operations Dec. 27, 1993) | | +10.75 | % | +13.92 | % | +9.13 | % | +11.44 | % |
| | | | | | | | | |
Service Class shares (commenced operations May 1, 2000) | | +10.46 | % | +13.65 | % | NA | | +1.03 | % |
As disclosed in the Series’ most recent prospectus, expenses for Standard Class and Service Class shares were as follows: The net expense ratios for Standard Class and Service Class shares of the Series were 0.86% and 1.11%, respectively. Total operating expenses for Standard Class and Service Class shares were 0.86% and 1.16%, respectively. Management fees for Standard Class and Service Class shares were 0.74%.
Earnings from a variable annuity or variable life investment compound tax-free until withdrawal and, as a result, no adjustments were made for income taxes.
An expense limitation was in effect for all classes during the periods shown in the Series performance chart above and in the Performance of a $10,000 Investment chart on the next page.
Performance of Service Class shares will vary due to different charges and expenses.
Performance data do not reflect insurance fees related to a variable annuity or variable life investment or the deferred sales charge that would apply to certain withdrawals of investments held for fewer than eight years. Performance shown here would have been reduced if such fees were included and the expense limitation removed. For more information about fees, consult your variable annuity or variable life prospectus.
Investments in variable products involve risk. Prices of growth companies’ securities may be more volatile than other securities, particularly over the short term. The Series will be particularly affected by declines in stock prices, which could be caused by a drop in the overall equity market or poor performance from particular companies or industries. Series that invest in small and/or medium-sized company stocks typically involve greater risk, particularly in the short term, than those investing in larger, more established companies. Some portfolios offer more risk than others.
Please read both the contract and underlying prospectus for specific details regarding the product’s risk profile.
1

The chart shows a $10,000 investment in the Delaware VIP Trend Series Standard Class shares for the period from Dec. 31, 1997, through Dec. 31, 2007. Performance of Service Class shares will vary due to different charges and expenses.
The chart also shows $10,000 invested in the Russell 2000 Growth Index for the period from Dec. 31, 1997, through Dec. 31, 2007. The Russell 2000 Growth Index includes performance of those Russell 2000 companies with higher price-to-book ratios and higher forecasted growth values. An index is unmanaged and does not reflect the costs of operating a mutual fund, such as the costs of buying, selling, and holding securities. You cannot invest directly in an index.
2
Delaware VIP Trust — Delaware VIP Trend Series
Disclosure of Series Expenses
For the Period July 1, 2007 to December 31, 2007
As a shareholder of the Series, you incur ongoing costs, including management fees; distribution and/or service (12b-1) fees; and other Series expenses. This Example is intended to help you understand your ongoing costs (in dollars) of investing in the Series and to compare these costs with the ongoing costs of investing in other mutual funds.
The Example is based on an investment of $1,000 invested at the beginning of the period and held for the entire period from July 1, 2007 to December 31, 2007.
Actual Expenses
The first section of the table shown, “Actual Series Return,” provides information about actual account values and actual expenses. You may use the information in this section of the table, together with the amount you invested, to estimate the expenses that you paid over the period. Simply divide your account value by $1,000 (for example, an $8,600 account value divided by $1,000 = 8.6), then multiply the result by the number in the first section under the heading entitled “Expenses Paid During Period” to estimate the expenses you paid on your account during the period.
Hypothetical Example for Comparison Purposes
The second section of the table shown, “Hypothetical 5% Return,” provides information about hypothetical account values and hypothetical expenses based on the Series’ actual expense ratio and an assumed rate of return of 5% per year before expenses, which is not the Series’ actual return. The hypothetical account values and expenses may not be used to estimate the actual ending account balance or expenses you paid for the period. You may use this information to compare the ongoing costs of investing in the Series and other funds. To do so, compare the 5% hypothetical example with the 5% hypothetical examples that appear in the shareholder reports of other funds.
Please note that the expenses shown in the table are meant to highlight your ongoing costs only. As a shareholder of the Series, you do not incur any transaction costs, such as sales charges (loads), redemption fees or exchange fees, but shareholders of other funds may incur such costs. Also, the fees related to the variable annuity investment or the deferred sales charge that could apply have not been included. Therefore, the second section of the table is useful in comparing ongoing costs only, and will not help you determine the relative total costs of owning different funds. The Series’ actual expenses shown in the table reflect fee waivers in effect for Service Class shares. The expenses shown in the table assume reinvestment of all dividends and distributions.
Expense Analysis of an Investment of $1,000
| | Beginning
Account
Value
7/1/07 | | Ending
Account
Value
12/31/07 | | Annualized
Expense
Ratios | | Expenses
Paid During
Period
7/1/07 to
12/31/07* | |
Actual Series Return | | | | | | | | | |
Standard Class | | $ | 1,000.00 | | $ | 1,001.60 | | 0.85 | % | $ | 4.29 | |
Service Class | | 1,000.00 | | 1,000.30 | | 1.10 | % | 5.55 | |
Hypothetical 5% Return (5% return before expenses) | | | | | | | | | |
Standard Class | | $ | 1,000.00 | | $ | 1,020.92 | | 0.85 | % | $ | 4.33 | |
Service Class | | 1,000.00 | | 1,019.66 | | 1.10 | % | 5.60 | |
* | “Expenses Paid During Period” are equal to the Series’ annualized expense ratio, multiplied by the average account value over the period, multiplied by 184/365 (to reflect the one-half year period). |
3
Delaware VIP Trust — Delaware VIP Trend Series
Sector allocation and top 10 holdings
As of December 31, 2007
Sector designations may be different than the sector designations presented in other Series materials.
Sector | | Percentage
of Net Assets | |
Common Stock | | 96.50 | % |
Basic Industry/Capital Goods | | 12.07 | % |
Business Services | | 9.40 | % |
Consumer Non-Durables | | 8.78 | % |
Consumer Services | | 5.35 | % |
Energy | | 5.81 | % |
Financials | | 8.99 | % |
Health Care | | 20.04 | % |
Technology | | 24.59 | % |
Transportation | | 1.47 | % |
Discount Note | | 3.28 | % |
Securities Lending Collateral | | 23.91 | % |
Total Value of Securities | | 123.69 | % |
Obligation to Return Securities Lending Collateral | | (23.91 | )% |
Receivables and Other Assets Net of Liabilities | | 0.22 | % |
Total Net Assets | | 100.00 | % |
Holdings are for informational purposes only and are subject to change at any time. They are not a recommendation to buy, sell, or hold any security.
Top 10 Holdings | | Percentage
of Net Assets | |
United Therapeutics | | 3.08 | % |
Omniture | | 2.53 | % |
Nuance Communications | | 2.39 | % |
Wright Medical Group | | 2.32 | % |
Taleo Class A | | 2.10 | % |
Solera Holdings | | 2.07 | % |
Under Armour Class A | | 1.98 | % |
Waddell & Reed Financial Class A | | 1.96 | % |
Shutterfly | | 1.95 | % |
Bucyrus International Class A | | 1.92 | % |
4
Delaware VIP Trust — Delaware VIP Trend Series
Statement of Net Assets
December 31, 2007
| | | Number of
Shares | | Value | |
| | | | | | |
| COMMON STOCK–96.50% | | | | | |
| Basic Industry/Capital Goods–12.07% | | | | | |
* | Bucyrus International Class A | | 98,150 | | $ | 9,755,129 | |
† | Haynes International | | 100,400 | | 6,977,800 | |
*† | Hexcel | | 319,900 | | 7,767,172 | |
*† | Itron | | 70,900 | | 6,804,273 | |
* | Kaydon | | 129,000 | | 7,035,660 | |
† | Mettler-Toledo International | | 71,400 | | 8,125,320 | |
† | Middleby | | 122,100 | | 9,355,302 | |
| MSC Industrial Direct Class A | | 136,200 | | 5,512,014 | |
| | | | | 61,332,670 | |
| Business Services–9.40% | | | | | |
† | Advisory Board | | 144,000 | | 9,243,360 | |
† | Cardtronics | | 240,500 | | 2,431,455 | |
*† | Concur Technologies | | 248,400 | | 8,994,564 | |
† | Emergency Medical Services | | 245,900 | | 7,199,952 | |
† | EnergySolutions | | 103,100 | | 2,782,669 | |
*† | Geo Group | | 207,100 | | 5,798,800 | |
*† | Monster Worldwide | | 153,600 | | 4,976,640 | |
† | TeleTech Holdings | | 298,900 | | 6,357,603 | |
| | | | | 47,785,043 | |
| Consumer Non-Durables–8.78% | | | | | |
*† | Crocs | | 191,100 | | 7,034,391 | |
*† | Dick’s Sporting Goods | | 229,600 | | 6,373,696 | |
*† | Gymboree | | 92,000 | | 2,802,320 | |
*† | J Crew Group | | 146,800 | | 7,077,228 | |
*† | lululemon athletica | | 69,900 | | 3,311,163 | |
*† | Lumber Liquidators | | 69,700 | | 626,603 | |
*† | Pacific Sunwear of California | | 231,000 | | 3,259,410 | |
*† | Under Armour Class A | | 230,700 | | 10,074,669 | |
*† | Zumiez | | 166,100 | | 4,046,196 | |
| | | | | 44,605,676 | |
| Consumer Services–5.35% | | | | | |
*† | Cenveo | | 488,300 | | 8,530,601 | |
† | Melco PBL Entertainment ADR | | 256,400 | | 2,963,984 | |
*† | Sonic | | 185,064 | | 4,052,902 | |
*† | Texas Roadhouse Class A | | 524,400 | | 5,799,864 | |
* | Wynn Resorts | | 52,100 | | 5,841,973 | |
| | | | | 27,189,324 | |
| Energy–5.81% | | | | | |
* | Carbo Ceramics | | 132,150 | | 4,915,980 | |
† | Core Laboratories | | 57,600 | | 7,183,872 | |
† | Helix Energy Solutions Group | | 195,500 | | 8,113,250 | |
*† | ION Geophysical | | 373,700 | | 5,896,986 | |
† | North American Energy Partners | | 252,300 | | 3,418,665 | |
| | | | | 29,528,753 | |
| Financials–8.99% | | | | | |
* | Delphi Financial Group Class A | | 135,950 | | 4,796,316 | |
| Hanover Insurance Group | | 145,800 | | 6,677,640 | |
† | Investment Technology Group | | 154,600 | | 7,357,414 | |
| KKR Financial Holdings | | 182,800 | | 2,568,340 | |
† | Meruelo Maddux Properties | | 306,900 | | 1,227,600 | |
† | Nasdaq Stock Market | | 73,300 | | 3,627,617 | |
*† | Signature Bank | | 71,600 | | 2,416,500 | |
* | Waddell & Reed Financial Class A | | 276,000 | | 9,960,840 | |
| Webster Financial | | 74,300 | | 2,375,371 | |
* | Whitney Holding | | 178,600 | | 4,670,390 | |
| | | | | 45,678,028 | |
| Health Care–20.04% | | | | | |
† | Abraxis BioScience | | 44,549 | | 3,063,635 | |
*† | ACADIA Pharmaceuticals | | 463,600 | | 5,132,052 | |
*† | Align Technology | | 409,200 | | 6,825,456 | |
† | APP Pharmaceuticals | | 435,300 | | 4,470,531 | |
† | Cepheid | | 242,200 | | 6,381,970 | |
*† | Conceptus | | 180,700 | | 3,476,668 | |
=†p | Cougar Biotechnology Restricted PIPE | | 114,800 | | 3,658,240 | |
† | Immucor | | 171,700 | | 5,836,083 | |
† | Isis Pharmaceuticals | | 231,200 | | 3,641,400 | |
*† | LifeCell | | 136,300 | | 5,875,893 | |
*† | Martek Biosciences | | 183,500 | | 5,427,930 | |
*† | Medarex | | 729,700 | | 7,603,474 | |
*† | Progenics Pharmaceuticals | | 130,000 | | 2,349,100 | |
*† | Regeneron Pharmaceuticals | | 267,600 | | 6,462,540 | |
*† | TriZetto Group | | 240,000 | | 4,168,800 | |
*† | United Therapeutics | | 160,500 | | 15,672,824 | |
*† | Wright Medical Group | | 404,500 | | 11,799,265 | |
| | | | | 101,845,861 | |
| Technology–24.59% | | | | | |
*† | Atheros Communications | | 170,000 | | 5,191,800 | |
*† | Data Domain | | 298,300 | | 7,857,222 | |
*† | Equinix | | 54,400 | | 5,498,208 | |
† | F5 Networks | | 338,100 | | 9,642,612 | |
*† | Foundry Networks | | 318,200 | | 5,574,864 | |
*† | Informatica | | 306,400 | | 5,521,328 | |
*† | Microsemi | | 405,800 | | 8,984,412 | |
*† | Nuance Communications | | 649,300 | | 12,128,924 | |
*† | Omniture | | 386,700 | | 12,873,243 | |
† | salesforce.com | | 128,900 | | 8,080,741 | |
*† | Shutterfly | | 387,700 | | 9,932,874 | |
† | Silicon Laboratories | | 212,100 | | 7,938,903 | |
† | Solera Holdings | | 425,000 | | 10,531,500 | |
*† | Synchronoss Technologies | | 128,700 | | 4,561,128 | |
† | Taleo Class A | | 358,100 | | 10,664,218 | |
| | | | | 124,981,977 | |
| Transportation–1.47% | | | | | |
* | Hunt (J.B.) Transport Services | | 270,400 | | 7,449,520 | |
| | | | | 7,449,520 | |
| Total Common Stock
(cost $394,703,198) | | | | 490,396,852 | |
| | | | | | | |
5
| | | Principal
Amount | | Value | |
| | | | | | |
¹ | DISCOUNT NOTE–3.28% | | | | | |
| Federal Home Loan Bank 3.25% 1/2/08 | | $ | 16,690,013 | | $ | 16,688,522 | |
| Total Discount Note
(cost $16,688,522) | | | | 16,688,522 | |
| | | | | | |
| Total Value of Securities Before Securities Lending Collateral–99.78%
(cost $411,391,720) | | | | 507,085,374 | |
| | | | | | |
| | | Number of
Shares | | | |
| | | | | | |
| SECURITIES LENDING COLLATERAL**–23.91% | | | | | |
| Investment Companies | | | | | |
| Mellon GSL DBT II Collateral Fund | | 121,504,773 | | 121,504,773 | |
| Total Securities Lending Collateral
(cost $121,504,773) | | | | 121,504,773 | |
| | | | | | | | |
6
TOTAL VALUE OF SECURITIES–123.69% (cost $532,896,493) | | $ | 628,590,147 | © |
OBLIGATION TO RETURN SECURITIES LENDING COLLATERAL**–(23.91%) | | (121,504,773 | ) |
RECEIVABLES AND OTHER ASSETS NET OF LIABILITIES–0.22% | | 1,103,930 | |
NET ASSETS APPLICABLE TO 13,256,771 SHARES OUTSTANDING–100.00% | | $ | 508,189,304 | |
NET ASSET VALUE–DELAWARE VIP TREND SERIES STANDARD CLASS
($376,100,901 / 9,769,838 Shares) | | $ | 38.50 | |
NET ASSET VALUE–DELAWARE VIP TREND SERIES SERVICE CLASS
($132,088,403 / 3,486,933 Shares) | | $ | 37.88 | |
COMPONENTS OF NET ASSETS AT DECEMBER 31, 2007: | | | |
Shares of beneficial interest (unlimited authorization–no par) | | $ | 335,017,663 | |
Accumulated net realized gain on investments | | 77,477,987 | |
Net unrealized appreciation of investments | | 95,693,654 | |
Total net assets | | $ | 508,189,304 | |
† | Non-income producing security for the year ended December 31, 2007. |
¹ | The rate shown is the effective yield at the time of purchase. |
* | Fully or partially on loan. |
** | See Note 8 in “Notes to Financial Statements.” |
© | Includes $120,149,446 of securities loaned. |
p | Restricted Security. Investment in a security not registered under the Securities Act of 1933. This security has certain restrictions on resale which may limit its liquidity. At December 31, 2007, the aggregate amount of the restricted securities was $3,658,240 or 0.72% of the Series’ net assets. See Note 9 in “Notes to Financial Statements.” |
= | Security is being fair valued in accordance with the Series’ fair valuation policy. At December 31, 2007, the aggregate amount of fair valued securities was $3,658,240, which represented 0.72% of the Series’ net assets. See Note 1 in “Notes to Financial Statements.” |
Summary of Abbreviations:
ADR – American Depositary Receipts
PIPE – Private Investment in Public Equity
See accompanying notes
7
Delaware VIP Trust — Delaware VIP Trend Series
Statement of Operations
Year Ended December 31, 2007
INVESTMENT INCOME: | | | |
Dividends | | $ | 1,913,768 | |
Interest | | 731,122 | |
Securities lending income | | 659,713 | |
| | 3,304,603 | |
| | | |
EXPENSES: | | | |
Management fees | | 3,967,354 | |
Distribution expenses – Service Class | | 398,404 | |
Accounting and administration expenses | | 212,394 | |
Reports and statements to shareholders | | 170,978 | |
Legal fees | | 63,198 | |
Dividend disbursing and transfer agent fees and expenses | | 62,652 | |
Audit and tax | | 35,581 | |
Trustees’ fees | | 25,336 | |
Insurance fees | | 13,758 | |
Custodian fees | | 12,993 | |
Consulting fees | | 9,626 | |
Dues and services | | 3,585 | |
Trustees’ expenses | | 3,134 | |
Pricing fees | | 718 | |
Taxes (other than taxes on income) | | 137 | |
Registration fees | | 38 | |
| | 4,979,886 | |
Less waiver of distribution expenses – Service Class | | (66,401 | ) |
Less expense paid indirectly | | (4,233 | ) |
Total operating expenses | | 4,909,252 | |
| | | |
NET INVESTMENT LOSS | | (1,604,649 | ) |
| | | |
NET REALIZED AND UNREALIZED GAIN (LOSS) ON INVESTMENTS: | | | |
Net realized gain on investments | | 82,004,502 | |
Net change in unrealized appreciation/depreciation of investments | | (26,184,551 | ) |
| | | |
NET REALIZED AND UNREALIZED GAIN ON INVESTMENTS | | 55,819,951 | |
| | | |
NET INCREASE IN NET ASSETS RESULTING FROM OPERATIONS | | $ | 54,215,302 | |
See accompanying notes
Delaware VIP Trust — Delaware VIP Trend Series
Statements of Changes in Net Assets
| | Year Ended | |
| | 12/31/07 | | 12/31/06 | |
INCREASE (DECREASE) IN NET ASSETS FROM OPERATIONS: | | | | | |
Net investment loss | | $ | (1,604,649 | ) | $ | (1,793,595 | ) |
Net realized gain on investments | | 82,004,502 | | 80,485,296 | |
Net change in unrealized appreciation/depreciation of investments | | (26,184,551 | ) | (39,974,574 | ) |
Net increase in net assets resulting from operations | | 54,215,302 | | 38,717,127 | |
| | | | | |
DIVIDENDS AND DISTRIBUTIONS TO SHAREHOLDERS FROM: | | | | | |
Net realized gain on investments: | | | | | |
Standard Class | | (2,703,675 | ) | — | |
Service Class | | (895,295 | ) | — | |
| | (3,598,970 | ) | — | |
| | | | | |
CAPITAL SHARE TRANSACTIONS: | | | | | |
Proceeds from shares sold: | | | | | |
Standard Class | | 11,908,516 | | 52,564,087 | |
Service Class | | 21,394,067 | | 30,100,215 | |
Net asset value of shares issued upon reinvestment of dividends and distributions: | | | | | |
Standard Class | | 2,703,675 | | — | |
Service Class | | 895,295 | | — | |
| | 36,901,553 | | 82,664,302 | |
Cost of shares repurchased: | | | | | |
Standard Class | | (87,164,309 | ) | (123,021,971 | ) |
Service Class | | (31,240,221 | ) | (29,169,880 | ) |
| | (118,404,530 | ) | (152,191,851 | ) |
Decrease in net assets derived from capital share transactions | | (81,502,977 | ) | (69,527,549 | ) |
| | | | | |
NET DECREASE IN NET ASSETS | | (30,886,645 | ) | (30,810,422 | ) |
| | | | | |
NET ASSETS: | | | | | |
Beginning of year | | 539,075,949 | | 569,886,371 | |
End of year (there was no undistributed net investment income at either year end) | | $ | 508,189,304 | | $ | 539,075,949 | |
See accompanying notes
8
Delaware VIP Trust — Delaware VIP Trend Series
Financial Highlights
Selected data for each share of the Series outstanding throughout each period were as follows:
| | Delaware VIP Trend Series Standard Class
Year Ended | |
| | 12/31/07 | | 12/31/06 | | 12/31/05 | | 12/31/04 | | 12/31/03 | |
| | | | | | | | | | | |
Net asset value, beginning of period | | $ | 35.000 | | $ | 32.530 | | $ | 30.730 | | $ | 27.290 | | $ | 20.200 | |
| | | | | | | | | | | |
Income (loss) from investment operations: | | | | | | | | | | | |
Net investment loss(1) | | (0.090 | ) | (0.088 | ) | (0.108 | ) | (0.108 | ) | (0.082 | ) |
Net realized and unrealized gain on investments and foreign currencies | | 3.836 | | 2.558 | | 1.908 | | 3.548 | | 7.172 | |
Total from investment operations | | 3.746 | | 2.470 | | 1.800 | | 3.440 | | 7.090 | |
| | | | | | | | | | | |
Less dividends and distributions from: | | | | | | | | | | | |
Net realized gain on investments | | (0.246 | ) | — | | — | | — | | — | |
Total dividends and distributions | | (0.246 | ) | — | | — | | — | | — | |
| | | | | | | | | | | |
Net asset value, end of period | | $ | 38.500 | | $ | 35.000 | | $ | 32.530 | | $ | 30.730 | | $ | 27.290 | |
| | | | | | | | | | | |
Total return(2) | | 10.75 | % | 7.59 | % | 5.86 | % | 12.60 | % | 35.10 | % |
| | | | | | | | | | | |
Ratios and supplemental data: | | | | | | | | | | | |
Net assets, end of period (000 omitted) | | $ | 376,101 | | $ | 410,167 | | $ | 450,525 | | $ | 521,392 | | $ | 515,829 | |
Ratio of expenses to average net assets | | 0.86 | % | 0.87 | % | 0.87 | % | 0.84 | % | 0.84 | % |
Ratio of net investment loss to average net assets | | (0.24 | )% | (0.26 | )% | (0.36 | )% | (0.38 | )% | (0.36 | )% |
Portfolio turnover | | 78 | % | 64 | % | 63 | % | 48 | % | 50 | % |
(1) The average shares outstanding method has been applied for per share information.
(2) Total investment return is based on the change in net asset value of a share during the period and assumes reinvestment of dividends and distributions at net asset value.
See accompanying notes
9
Selected data for each share of the Series outstanding throughout each period were as follows:
| | Delaware VIP Trend Series Service Class
Year Ended | |
| | 12/31/07 | | 12/31/06 | | 12/31/05 | | 12/31/04 | | 12/31/03 | |
| | | | | | | | | | | |
Net asset value, beginning of period | | $ | 34.530 | | $ | 32.170 | | $ | 30.460 | | $ | 27.120 | | $ | 20.120 | |
| | | | | | | | | | | |
Income (loss) from investment operations: | | | | | | | | | | | |
Net investment loss(1) | | (0.184 | ) | (0.171 | ) | (0.182 | ) | (0.178 | ) | (0.135 | ) |
Net realized and unrealized gain on investments and foreign currencies | | 3.780 | | 2.531 | | 1.892 | | 3.518 | | 7.135 | |
Total from investment operations | | 3.596 | | 2.360 | | 1.710 | | 3.340 | | 7.000 | |
| | | | | | | | | | | |
Less dividends and distributions from: | | | | | | | | | | | |
Net realized gain on investments | | (0.246 | ) | — | | — | | — | | — | |
Total dividends and distributions | | (0.246 | ) | — | | — | | — | | — | |
| | | | | | | | | | | |
Net asset value, end of period | | $ | 37.880 | | $ | 34.530 | | $ | 32.170 | | $ | 30.460 | | $ | 27.120 | |
| | | | | | | | | | | |
Total return(2) | | 10.46 | % | 7.34 | % | 5.61 | % | 12.32 | % | 34.79 | % |
| | | | | | | | | | | |
Ratios and supplemental data: | | | | | | | | | | | |
Net assets, end of period (000 omitted) | | $ | 132,088 | | $ | 128,909 | | $ | 119,361 | | $ | 109,832 | | $ | 55,662 | |
Ratio of expenses to average net assets | | 1.11 | % | 1.12 | % | 1.12 | % | 1.09 | % | 1.06 | % |
Ratio of expenses to average net assets prior to expense limitation and expenses paid indirectly | | 1.16 | % | 1.17 | % | 1.17 | % | 1.14 | % | 1.09 | % |
Ratio of net investment loss to average net assets | | (0.49 | )% | (0.51 | )% | (0.61 | )% | (0.63 | )% | (0.58 | )% |
Ratio of net investment loss to average net assets prior to expense limitation and expenses paid indirectly | | (0.54 | )% | (0.56 | )% | (0.66 | )% | (0.68 | )% | (0.61 | )% |
Portfolio turnover | | 78 | % | 64 | % | 63 | % | 48 | % | 50 | % |
(1) The average shares outstanding method has been applied for per share information.
(2) Total investment return is based on the change in net asset value of a share during the period and assumes reinvestment of dividends and distributions at net asset value. Total investment return reflects a waiver by the distributor. Performance would have been lower had the waiver not been in effect.
See accompanying notes
10
Delaware VIP Trust — Delaware VIP Trend Series
Notes to Financial Statements
December 31, 2007
Delaware VIP Trust (Trust) is organized as a Delaware statutory trust and offers 14 series: Delaware VIP Balanced Series, Delaware VIP Capital Reserves Series, Delaware VIP Cash Reserve Series, Delaware VIP Diversified Income Series, Delaware VIP Emerging Markets Series, Delaware VIP Growth Opportunities Series, Delaware VIP High Yield Series, Delaware VIP International Value Equity Series, Delaware VIP REIT Series, Delaware VIP Select Growth Series, Delaware VIP Small Cap Value Series, Delaware VIP Trend Series, Delaware VIP U.S. Growth Series and Delaware VIP Value Series. These financial statements and the related notes pertain to Delaware VIP Trend Series (Series). The Trust is an open-end investment company. The Series is considered diversified under the Investment Company Act of 1940, as amended, and offers Standard Class and Service Class shares. The Standard Class shares do not carry a 12b-1 fee and the Service Class shares carry a 12b-1 fee. The shares of the Series are sold only to separate accounts of life insurance companies.
The investment objective of the Series is to seek long-term capital appreciation.
1. Significant Accounting Policies
The following accounting policies are in accordance with U.S. generally accepted accounting principles and are consistently followed by the Series.
Security Valuation—Equity securities, except those traded on the Nasdaq Stock Market, Inc. (Nasdaq), are valued at the last quoted sales price as of the time of the regular close of the New York Stock Exchange (NYSE) on the valuation date. Securities traded on the Nasdaq are valued in accordance with the Nasdaq Official Closing Price, which may not be the last sales price. If on a particular day an equity security does not trade, then the mean between the bid and asked prices will be used. Short-term debt securities having less than 60 days to maturity are valued at amortized cost, which approximates market value. Securities lending collateral, which is invested in a collective investment vehicle, is valued at unit value per share. Other securities and assets for which market quotations are not readily available are valued at fair value as determined in good faith under the direction of the Series’ Board of Trustees. In determining whether market quotations are readily available or fair valuation will be used, various factors will be taken into consideration, such as market closures, or with respect to foreign securities, aftermarket trading, or significant events after local market trading (e.g., government actions or pronouncements, trading volume or volatility on markets, exchanges among dealers, or news events).
In September 2006, the Financial Accounting Standards Board (FASB) issued FASB Statement No. 157 “Fair Value Measurements” (Statement 157). Statement 157 establishes a framework for measuring fair value in U.S. generally accepted accounting principles, clarifies the definition of fair value within that framework, and expands disclosures about the use of fair value measurements. Statement 157 is intended to increase consistency and comparability among fair value estimates used in financial reporting. Statement 157 is effective for fiscal years beginning after November 15, 2007. Management does not expect the adoption of Statement 157 to have a material impact on the amounts reported in the financial statements.
Federal Income Taxes—The Series intends to continue to qualify for federal income tax purposes as a regulated investment company under Subchapter M of the Internal Revenue Code of 1986, as amended, and make the requisite distributions to shareholders. Accordingly, no provision for federal income taxes has been made in the financial statements.
Effective June 29, 2007, the Series adopted FASB Interpretation No. 48 “Accounting for Uncertainty in Income Taxes” (FIN 48). FIN 48 provides guidance for how uncertain tax positions should be recognized, measured, presented and disclosed in the financial statements. FIN 48 requires the evaluation of tax positions taken or expected to be taken in the course of preparing the Series’ tax returns to determine whether the tax positions are “more-likely-than-not” of being sustained by the applicable tax authority. Tax positions not deemed to meet the more-likely-than-not threshold are recorded as a tax benefit or expense in the current year. The adoption of FIN 48 did not result in the recording of any tax benefit or expense in the current period.
Class Accounting—Investment income, common expenses and realized and unrealized gain (loss) on investments are allocated to the classes of the Series on the basis of daily net assets of each class. Distribution expenses relating to a specific class are charged directly to that class.
Repurchase Agreements—The Series may invest in a pooled cash account along with members of the Delaware Investments® Family of Funds pursuant to an exemptive order issued by the Securities and Exchange Commission. The aggregate daily balance of the pooled cash account is invested in repurchase agreements secured by obligations of the U.S. government. The respective collateral is held by the Series’ custodian bank until the maturity of the respective repurchase agreements. Each repurchase agreement is at least 102% collateralized. However, in the event of default or bankruptcy by the counterparty to the agreement, realization of the collateral may be subject to legal proceedings. At December 31, 2007, the Series held no investments in repurchase agreements.
Use of Estimates—The preparation of financial statements in conformity with U.S. generally accepted accounting principles requires management to make estimates and assumptions that affect the reported amounts of assets and liabilities at the date of the financial statements and the reported amounts of revenues and expenses during the reporting period. Actual results could differ from those estimates.
Other—Expenses directly attributable to the Series are charged directly to the Series. Other expenses common to various funds within the Delaware Investments® Family of Funds are generally allocated amongst such funds on the basis of average net assets. Management fees and some other expenses are paid monthly. Security transactions are recorded on the date the securities are purchased or sold (trade date) for financial reporting purposes. Costs used in calculating realized gains and losses on the sale of investment securities are those of the specific securities sold. Dividend income is recorded on the ex-dividend date and interest income is recorded on the accrual basis.
The Series declares and pays dividends from net investment income and distributions from net realized gain on investments, if any, following the close of the fiscal year.
11
Delaware VIP Trend Series
Notes to Financial Statements (continued)
Subject to seeking best execution, the Series may direct certain security trades to brokers who have agreed to rebate a portion of the related brokerage commission to the Series in cash. Such commission rebates are included in realized gain on investments in the accompanying financial statements and totaled $14,775 for the year ended December 31, 2007. In general, best execution refers to many factors, including the price paid or received for a security, the commission charged, the promptness and reliability of execution, the confidentiality and placement accorded the order, and other factors affecting the overall benefit obtained by the Series on the transaction.
The Series receives earnings credits from its custodian when positive cash balances are maintained, which are used to offset custody fees. The expense paid under this arrangement is included in custodian fees on the Statement of Operations with the corresponding expense offset shown as “expense paid indirectly.”
2. Investment Management, Administration Agreements and Other Transactions with Affiliates
In accordance with the terms of its investment management agreement, the Series pays Delaware Management Company (DMC), a series of Delaware Management Business Trust and the investment manager, an annual fee which is calculated daily at the rate of 0.75% on the first $500 million of average daily net assets of the Series, 0.70% on the next $500 million, 0.65% on the next $1.5 billion, and 0.60% on average daily net assets in excess of $2.5 billion.
Prior to May 1, 2007, DMC had contractually agreed to waive that portion, if any, of its management fee and reimburse the Series to the extent necessary to ensure that total annual operating expenses, exclusive of taxes, interest, brokerage fees, 12b-1 plan expenses, certain insurance costs and non-routine expenses or costs including, but not limited to, those relating to reorganizations, litigation, conducting shareholder meetings, and liquidations, do not exceed 0.92% of average daily net assets of the Series. No reimbursement was due for the year ended December 31, 2007.
Effective October 1, 2007, Delaware Service Company, Inc. (DSC), an affiliate of DMC, provides fund accounting and financial administration oversight services to the Series. For these services, the Series pays DSC fees based on the aggregate daily net assets of the Delaware Investments® Family of Funds at the following annual rate: 0.0050% of the first $30 billion; 0.0045% of the next $10 billion; 0.0040% of the next $10 billion; and 0.0025% of aggregate average daily net assets in excess of $50 billion. The fees payable to DSC under the service agreement described above are allocated among all funds in the Delaware Investments® Family of Funds on a relative net asset value basis. Prior to October 1, 2007, DSC provided fund accounting and administrative services to the Series and received a fee at an annual rate of 0.04% of average daily net assets. For the year ended December 31, 2007, the Series was charged $165,826 for these services.
DSC also provides dividend disbursing and transfer agency services. The Series pays DSC a monthly fee based on the number of shareholder accounts for dividend disbursing and transfer agent services.
Pursuant to a distribution agreement and distribution plan, the Series pays Delaware Distributors, L.P. (DDLP), the distributor and an affiliate of DMC, an annual distribution and service fee not to exceed 0.30% of the average daily net assets of the Service Class shares. DDLP has contracted to waive distribution and service fees through April 30, 2008 in order to prevent distribution and service fees of the Service Class shares from exceeding 0.25% of average daily net assets. Standard Class shares pay no distribution and service expenses.
At December 31, 2007, the Series had liabilities payable to affiliates as follows:
Investment
Management
Fee Payable to
DMC | | Dividend Disbursing,
Transfer Agent
Fees and Other Expenses
Payable to DSC | | Distribution
Fees Payable
to DDLP | | Other
Expenses
Payable
to DMC
and Affiliates* | |
$ | 328,505 | | $ | 9,041 | | $ | 28,487 | | $ | 29,504 | |
| | | | | | | | | | | |
*DMC, as part of its administrative services, pays operating expenses on behalf of the Series and is reimbursed on a periodic basis. Such expenses include items such as printing of shareholder reports, fees for audit, legal and tax services, custodian fees and trustees’ fees.
As provided in the investment management agreement, the Series bears the cost of certain legal and tax services, including internal legal and tax services provided to the Series by DMC and/or its affiliates’ employees. For the year ended December 31, 2007, the Series was charged $28,409 for internal legal and tax services provided by DMC and/or its affiliates’ employees.
Trustees’ fees include expenses accrued by the Series for each Trustee’s retainer and per meeting fees. Certain officers of DMC, DSC and DDLP are officers and/or Trustees of the Trust. These officers and Trustees are paid no compensation by the Series.
3. Investments
For the year ended December 31, 2007, the Series made purchases and sales of investment securities other than short-term investments as follows:
Purchases | | $ | 403,186,446 | |
Sales | | 499,080,288 | |
12
Delaware VIP Trend Series
Notes to Financial Statements (continued)
At December 31, 2007, the cost of investments for federal income tax purposes and unrealized appreciation (depreciation) for the Series were as follows:
Cost of
Investments | | Aggregate
Unrealized
Appreciation | | Aggregate
Unrealized
Depreciation | | Net Unrealized
Appreciation | |
$ | 533,551,844 | | $ | 119,066,341 | | $ | (24,028,038 | ) | $ | 95,038,303 | |
| | | | | | | | | | | |
4. Dividend and Distribution Information
Income and long-term capital gain distributions are determined in accordance with federal income tax regulations, which may differ from U.S. generally accepted accounting principles. Additionally, net short-term gains on sales of investment securities are treated as ordinary income for federal income tax purposes. There were no dividends and distributions paid for the year ended December 31, 2006. The tax character of dividends and distributions paid during the year ended December 31, 2007 was as follows:
| | Year
Ended
12/31/07 | |
Long-term capital gain | | $ | 3,598,970 | |
| | | | |
5. Components of Net Assets on a Tax Basis
As of December 31, 2007, the components of net assets on a tax basis were as follows:
Shares of beneficial interest | | $ | 335,017,663 | |
Undistributed ordinary income | | 742,584 | |
Undistributed long-term capital gains | | 77,390,754 | |
Unrealized appreciation of investments | | 95,038,303 | |
Net assets | | $ | 508,189,304 | |
The differences between book basis and tax basis components of net assets are primarily attributable to tax deferral of losses on wash sales.
For financial reporting purposes, capital accounts are adjusted to reflect the tax character of permanent book/tax differences. Reclassifications are primarily due to tax treatment of net operating losses. Results of operations and net assets were not affected by these reclassifications. For the year ended December 31, 2007, the Series recorded the following reclassifications:
Accumulated
Net
Investment Loss | | Accumulated
Net Realized
Gain | |
$ | 1,604,649 | | $ | (1,604,649 | ) |
| | | | | |
6. Capital Shares
Transactions in capital shares were as follows:
| | Year
Ended
12/31/07 | | Year
Ended
12/31/06 | |
Shares sold: | | | | | |
Standard Class | | 312,164 | | 1,664,925 | |
Service Class | | 570,419 | | 899,447 | |
| | | | | |
Shares issued upon reinvestment of dividends and distributions: | | | | | |
Standard Class | | 74,811 | | — | |
Service Class | | 25,128 | | — | |
| | 982,522 | | 2,564,372 | |
| | | | | |
Shares repurchased: | | | | | |
Standard Class | | (2,334,703 | ) | (3,796,588 | ) |
Service Class | | (841,372 | ) | (876,515 | ) |
| | (3,176,075 | ) | (4,673,103 | ) |
Net decrease | | (2,193,553 | ) | (2,108,731 | ) |
13
Delaware VIP Trend Series
Notes to Financial Statements (continued)
7. Line of Credit
The Series, along with certain other funds in the Delaware Investments® Family of Funds (Participants), participates in a $225,000,000 revolving line of credit facility to be used for temporary or emergency purposes as an additional source of liquidity to fund redemptions of investor shares. The Participants are charged an annual commitment fee, which is allocated across the Participants on the basis of each Participant’s allocation of the entire facility. The Participants may borrow up to a maximum of one third of their net assets under the agreement. The Series had no amounts outstanding as of December 31, 2007, or at any time during the year then ended.
8. Securities Lending
The Series, along with other funds in the Delaware Investments® Family of Funds, may lend its securities pursuant to a security lending agreement (Lending Agreement) with Mellon Bank, N.A. (Mellon). With respect to each loan, if the aggregate market value of the collateral held on any business day is less than the aggregate market value of the securities which are the subject of such loan, the borrower will be notified to provide additional collateral not less than the applicable collateral requirements. Cash collateral received is invested in a collective investment vehicle (Collective Trust) established by Mellon for the purpose of investment on behalf of clients participating in its securities lending programs. The Collective Trust invests in fixed income securities, with a weighted average maturity not to exceed 90 days, rated in one of the top two tiers by Standard & Poor’s Ratings Group or Moody’s Investors Service, Inc. or repurchase agreements collateralized by such securities. However, in the event of default or bankruptcy by the lending agent, realization and/or retention of the collateral may be subject to legal proceedings. In the event the borrower fails to return loaned securities and the collateral received is insufficient to cover the value of the loaned securities and provided such collateral shortfall is not the result of investment losses, the lending agent has agreed to pay the amount of the shortfall to the Series, or at the discretion of the lending agent, replace the loaned securities. The Series continues to record dividends or interest, as applicable, on the securities loaned and is subject to change in value of the securities loaned that may occur during the term of the loan. The Series has the right under the Lending Agreement to recover the securities from the borrower on demand. With respect to security loans collateralized by U.S. Treasury obligations, the Series receives a fee from the securities lending agent. With respect to security loans collateralized by cash collateral, the earnings from the collateral investments are shared among the Series, the security lending agent and the borrower. The Series records securities lending income net of allocations to the security lending agent and the borrower.
At December 31, 2007, the market value of the securities on loan was $120,149,446, for which the Series received collateral, comprised of U.S. government obligations valued at $2,700,751, and cash collateral of $121,504,773. Investments purchased with cash collateral are presented on the Statement of Net Assets under the caption “Securities Lending Collateral.”
9. Credit and Market Risk
The Series invests a significant portion of its assets in small companies and may be subject to certain risks associated with ownership of securities of such companies. Investments in small-sized companies may be more volatile than investments in larger companies for a number of reasons, which include limited financial resources or a dependence on narrow product lines.
The Series may invest up to 10% of its net assets in illiquid securities, which may include securities with contractual restrictions on resale, securities exempt from registration under Rule 144A of the Securities Act of 1933, as amended, and other securities which may not be readily marketable. The relative illiquidity of these securities may impair the Series from disposing of them in a timely manner and at a fair price when it is necessary or desirable to do so. While maintaining oversight, the Series’ Board of Trustees has delegated to DMC the day-to-day functions of determining whether individual securities are liquid for purposes of the Series’ limitation on investments in illiquid assets. As of December 31, 2007, there were no Rule 144A securities and no securities have been determined to be illiquid under the Series’ Liquidity Procedures.
10. Contractual Obligations
The Series enters into contracts in the normal course of business that contain a variety of indemnifications. The Series’ maximum exposure under these arrangements is unknown. However, the Series has not had prior claims or losses pursuant to these contracts. Management has reviewed the Series’ existing contracts and expects the risk of loss to be remote.
11. Tax Information (Unaudited)
For the fiscal year ended December 31, 2007, the Series designates dividends and distributions paid during the year as follows:
(A)
Long-Term
Capital Gain
Distributions
(Tax Basis) | | (B)
Ordinary
Income
Distributions
(Tax Basis) | | Total
Distributions
(Tax Basis) | |
100 | % | — | % | 100 | % |
(A) and (B) are based on a percentage of the Series’ total distributions.
12. Change in Custodian
On August 2, 2007, Mellon, One Mellon Center, Pittsburgh, PA 15258, became the Series’ custodian.
14
Delaware VIP Trust — Delaware VIP Trend Series
Report of Independent Registered Public Accounting Firm
To the Shareholders and Board of Trustees
Delaware VIP Trust–Delaware VIP Trend Series
We have audited the accompanying statement of net assets of the Delaware VIP Trend Series (one of the series constituting Delaware VIP Trust) (the “Series”) as of December 31, 2007, and the related statement of operations for the year then ended, the statements of changes in net assets for each of the two years in the period then ended, and the financial highlights for each of the five years in the period then ended. These financial statements and financial highlights are the responsibility of the Series’ management. Our responsibility is to express an opinion on these financial statements and financial highlights based on our audits.
We conducted our audits in accordance with the standards of the Public Company Accounting Oversight Board (United States). Those standards require that we plan and perform the audit to obtain reasonable assurance about whether the financial statements and financial highlights are free of material misstatement. We were not engaged to perform an audit of the Series’ internal control over financial reporting. Our audits included consideration of internal control over financial reporting as a basis for designing audit procedures that are appropriate in the circumstances, but not for the purpose of expressing an opinion on the effectiveness of the Series’ internal control over financial reporting. Accordingly, we express no such opinion. An audit also includes examining, on a test basis, evidence supporting the amounts and disclosures in the financial statements and financial highlights, assessing the accounting principles used and significant estimates made by management, and evaluating the overall financial statement presentation. Our procedures included confirmation of securities owned as of December 31, 2007, by correspondence with the custodian and brokers or by other appropriate auditing procedures where replies from brokers were not received. We believe that our audits provide a reasonable basis for our opinion.
In our opinion, the financial statements and financial highlights referred to above present fairly, in all material respects, the financial position of the Delaware VIP Trend Series of Delaware VIP Trust at December 31, 2007, the results of its operations for the year then ended, the changes in its net assets for each of the two years in the period then ended, and its financial highlights for each of the five years in the period then ended, in conformity with U.S. generally accepted accounting principles.

Philadelphia, Pennsylvania
February 14, 2008
The Series files its complete schedule of portfolio holdings with the Securities and Exchange Commission (Commission) for the first and third quarters of each fiscal year on Form N-Q. The Series’ Forms N-Q, as well as a description of the policies and procedures that the Series uses to determine how to vote proxies (if any) relating to portfolio securities is available without charge (i) upon request, by calling 800 523-1918; and (ii) on the Commission’s website at http://www.sec.gov. In addition, a description of the policies and procedures that the Series uses to determine how to vote proxies (if any) relating to portfolio securities is available without charge on the Delaware Investments® Funds’ website at http://www.delawareinvestments.com. The Series’ Forms N-Q may be reviewed and copied at the Commission’s Public Reference Room in Washington, DC; information on the operation of the Public Reference Room may be obtained by calling 800 SEC-0330.
Information (if any) regarding how the Series voted proxies relating to portfolio securities during the most recently disclosed 12-month period ended June 30 is available without charge (i) through the Delaware Investments® Funds’ website at http://www.delawareinvestments.com; and (ii) on the Commission’s website at http://www.sec.gov.
15
Delaware Investments® Family of Funds
BOARD OF TRUSTEES/DIRECTORS AND OFFICERS ADDENDUM
A mutual fund is governed by a Board of Trustees/Directors (“Trustees”), which has oversight responsibility for the management of a fund’s business affairs. Trustees establish procedures and oversee and review the performance of the investment manager, the distributor, and others who perform services for the fund. The independent fund trustees, in particular, are advocates for shareholder interests. Each trustee has served in that capacity since he or she was elected to or appointed to the Board of Trustees, and will continue to serve until his or her retirement or the election of a new trustee in his or her place. The following is a list of the Trustees and Officers with certain background and related information.
Name,
Address,
and Birth Date | | Position(s)
Held with
Fund(s) | | Length of Time
Served | | Principal
Occupation(s)
During
Past 5 Years | | Number of
Portfolios in Fund
Complex Overseen
by Trustee
or Officer | | Other
Directorships
Held by
Trustee
or Officer | |
INTERESTED TRUSTEES | | | | | | | | | |
| | | | | | | | | |
Patrick P. Coyne (1)
2005 Market Street Philadelphia, PA
19103
April 1963 | | Chairman, President,
Chief Executive Officer, and
Trustee | | Chairman and Trustee
since August 16, 2006
President and
Chief Executive Officer since August 1, 2006 | | Patrick P. Coyne has served in
various executive capacities
at different times at
Delaware Investments. (2) | | 84 | | Director –
Kaydon Corp.
Board of Governors Member –
Investment Company
Institute (2007 – present)
Member of Investment
Committee – Cradle of Liberty Council, BSA
(November 2007 –present)
Finance Committee Member – St. John Vianney Roman
Catholic Church
(2007 – present) | |
| | | | | | | | | | | |
INDEPENDENT TRUSTEES | | | | | | | | | |
| | | | | | | | | |
Thomas L. Bennett
2005 Market Street Philadelphia, PA
19103
October 1947 | | Trustee | | Since
March 2005 | | Private Investor – (March 2004 – Present)
Investment Manager – Morgan Stanley & Co. (January 1984 – March 2004) | | 84 | | Director –
Bryn Mawr
Bank Corp. (BMTC) (April 2007 – Present)
Chairman of Investment Committee – The Haverford School (2002 – present)
Chairman of
Investment
Committee – Pennsylvania Academy of Fine Arts (2007 – present)
Trustee
(2004 – present)
Investment Committee
Member –
Pennsylvania
Horticulture Society
(February 2006 –
present) | |
16
Name,
Address,
and Birth Date | | Position(s)
Held with
Fund(s) | | Length of Time
Served | | Principal
Occupation(s)
During
Past 5 Years | | Number of
Portfolios in Fund
Complex Overseen
by Trustee
or Officer | | Other
Directorships
Held by
Trustee
or Officer | |
INDEPENDENT TRUSTEES (CONTINUED) | | | | | | | |
| | | | | | | |
John A. Fry
2005 Market Street Philadelphia, PA
19103
May 1960 | | Trustee | | Since
January 2001 | | President – Franklin & Marshall College (June 2002 – Present)
Executive Vice President – University of Pennsylvania (April 1995 – June 2002) | | 84 | | Director – Community Health Systems
Director – Allied Barton Security Holdings | |
| | | | | | | | | | | |
Anthony D. Knerr
2005 Market Street
Philadelphia, PA
19103
December 1938 | | Trustee | | Since
April 1990 | | Founder and Managing Director – Anthony Knerr & Associates (Strategic Consulting) (1990 – Present) | | 84 | | None | |
| | | | | | | | | | | |
Lucinda S. Landreth
2005 Market Street Philadelphia, PA 19103
June 1947 | | Trustee | | Since
March 2005 | | Chief Investment Officer –
Assurant, Inc.
(Insurance)
(2002 – 2004) | | 84 | | None | |
| | | | | | | | | | | |
Ann R. Leven
2005 Market Street
Philadelphia, PA
19103
November 1940 | | Trustee | | Since
October 1989 | | Consultant –
ARL Associates
(Financial Planning)
(1983 – Present) | | 84 | | Director and Audit Committee Member – Systemax, Inc. | |
| | | | | | | | | | | |
Thomas F. Madison
2005 Market Street
Philadelphia, PA
19103
February 1936 | | Trustee | | Since
May 1997 | | President and Chief Executive Officer – MLM Partners, Inc.
(Small Business Investing and Consulting)
(January 1993 – Present) | | 84 | | Director –
CenterPoint Energy
Director and Audit Committee Member – Digital River, Inc.
Director and Audit Committee Member – Rimage Corporation
Director and Chair of Compensation and Governance & Nominating Committees – Valmont Industries, Inc. | |
| | | | | | | | | | | |
Janet L. Yeomans
2005 Market Street Philadelphia, PA
19103
July 1948 | | Trustee | | Since
April 1999 | | Treasurer
(January 2006 – Present) Vice President – Mergers & Acquisitions
(January 2003 – January 2006),
and Vice President
(July 1995 – January 2003)
3M Corporation | | 84 | | None | |
| | | | | | | | | | | |
J. Richard Zecher
2005 Market Street Philadelphia, PA
19103
July 1940 | | Trustee | | Since
March 2003 | | Founder –
Investor Analytics
(Risk Management)
(May 1999 – Present)
Founder –
Sutton Asset Management (Hedge Fund) (September 1998 – Present) | | 84 | | Director and Audit Committee Member – Investor Analytics
Director and Audit Committee Member – Oxigene, Inc. | |
| | | | | | | | | | | | | | |
17
Name,
Address,
and Birth Date | | Position(s)
Held with
Fund(s) | | Length of Time
Served | | Principal
Occupation(s)
During
Past 5 Years | | Number of
Portfolios in Fund
Complex Overseen
by Trustee
or Officer | | Other
Directorships
Held by
Trustee
or Officer | |
OFFICERS | | | | | | | | | | | |
| | | | | | | | | | | |
David F. Connor
2005 Market Street Philadelphia, PA 19103
December 1963 | | Vice President, Deputy General Counsel, and Secretary | | Vice President since September 21, 2000 and Secretary since October 2005 | | David F. Connor has served as Vice President and Deputy General Counsel of Delaware Investments since 2000. | | 84 | | None(4) | |
| | | | | | | | | | | |
Daniel V. Geatens
2005 Market Street Philadelphia, PA 19103
October 1972 | | Vice President and Treasurer | | Treasurer
since
October 25, 2007 | | Daniel V. Geatens has served in various capacities at different times at Delaware Investments. | | 84 | | None(4) | |
| | | | | | | | | | | |
David P. O’Connor
2005 Market Street Philadelphia, PA 19103
February 1966 | | Senior Vice President, General Counsel, and Chief Legal Officer | | Senior Vice President, General Counsel, and Chief Legal Officer since October 2005 | | David P. O’Connor has served in various executive and legal capacities at different times at Delaware Investments. | | 84 | | None(4) | |
| | | | | | | | | | | |
Richard Salus
2005 Market Street Philadelphia, PA 19103
October 1963 | | Senior Vice President and Chief Financial Officer | | Chief Financial Officer since November 1, 2006 | | Richard Salus has served in various executive capacities at different times at Delaware Investments. | | 84 | | None(4) | |
(1) | Patrick P. Coyne is considered to be an “Interested Trustee” because he is an executive officer of the Fund’s(s’) investment advisor. |
(2) | Delaware Investments is the marketing name for Delaware Management Holdings, Inc. and its subsidiaries, including the Fund’s(s’) investment advisor, principal underwriter, and its transfer agent. |
(3) | In 1997, several funds managed by Voyageur Fund Managers, Inc. (the “Voyageur Funds”) were incorporated into the Delaware Investments Family of Funds. Mr. Madison served as a director of the Voyageur Funds from 1993 until 1997. |
(4) | David F. Connor, Daniel V. Geatens, David P. O’Connor, and Richard Salus serve in similar capacities for the six portfolios of the Optimum Fund Trust, which have the same investment advisor, principal underwriter, and transfer agent as the registrant. |
The Statement of Additional Information for the Fund(s) includes additional information about the Trustees and Officers and is available, without charge, upon request by calling 800 523-1918.
18
Delaware VIP Trust — Delaware VIP U.S. Growth Series
For the 12-month period ended Dec. 31, 2007, the Delaware VIP U.S. Growth Series Standard Class shares returned +12.56%, and the Service Class shares returned +12.37% (both figures reflect returns with all distributions reinvested). The Series’ benchmark, the Russell 1000 Growth® Index, returned +11.81% (source: Lipper).
Our broad investment approach remained consistent throughout the fiscal year. From January through June, we made no major position changes, despite our stretch of underperformance versus the benchmark in March and April. This was not due to any operational difficulties in the companies we owned, but rather the outsized performance of traditional cyclical sectors such as energy, materials, and integrated oils. We usually avoid stocks in these sectors, in which commodity prices or economic cycles drive returns, rather than the unique competitive advantages that we typically seek to identify in our investments. Consequently, we had difficulty keeping up with the index during the spring months.
In the second half of the fiscal year, market activity reflected a shift in investor sentiment, away from risk. From July through September, we made up some of our earlier underperformance versus the Russell 1000 Growth Index. The shift in investor sentiment began in earnest in the third week of July as problems in the subprime mortgage market spilled over and created concerns about broader credit availability and a sharper focus on financial institutions holding credit portfolios. The challenging environment in credit markets also led to concerns about the impact on global economic activity. Consequently, many companies that had direct exposure to credit, or were strongly influenced by economic activity, were punished to varying degrees. Although the market rebounded somewhat in the second half of August and in September, further worries about companies’ exposure to bad debts, along with signs of slowing corporate earnings, weighed on investor sentiment and led to declining stock valuations again in the middle of October.
We believe that, as a result of turbulent markets, investors began to search for the kind of companies that we seek to hold: companies with a unique competitive advantage that helps them manage their way through economic cycles. Such companies consequently have stable cash flows, plenty of cash on the balance sheet, and are able to self-finance their businesses without relying on the banking system or on the capital markets for growth.
As a result of the credit markets and their potential impact on the global economy and the consumer, we remained generally underexposed to consumer-driven businesses and continued to monitor the Series’ exposure to consumer discretionary spending.
At year end, we believed that, true to our stated overall investment strategy, the Series was made up of value-creating companies that earn incremental returns on capital above their own cost of capital. Further, we believe that such value-creating companies are rewarded by the market over time.
The views expressed are current as of the date of this report and are subject to change.
The performance data quoted below represent past performance; past performance does not guarantee future results. Investment return and principal value will fluctuate so your shares, when redeemed, may be worth more or less than their original cost. Please obtain the performance data for the most recent month end by calling the number noted in the introductory section of this report on the page related to this Series.
You should consider the investment objectives, risks, charges, and expenses of the investment company carefully before investing. The Delaware VIP U.S. Growth Series prospectus contains this and other important information about the Series. To obtain a prospectus, contact the company noted on the page related to this Series in the introductory section of this report, either by phone or through the company Web site. We advise you to read the prospectus carefully before you invest.
Delaware VIP U.S. Growth Series
Average annual total returns
For periods ended Dec. 31, 2007 | | 1 year | | 5 years | | Lifetime | |
Standard Class shares (commenced operations Nov. 15, 1999) | | +12.56 | % | +11.04 | % | -1.08 | % |
Service Class shares (commenced operations May 1, 2000) | | +12.37 | % | +10.77 | % | -2.46 | % |
As disclosed in the Series’ most recent prospectus, expenses for Standard Class and Service Class shares were as follows: The net expense ratios for Standard Class and Service Class shares of the Series were 0.76% and 1.01%, respectively. Total operating expenses for Standard Class and Service Class shares were 0.76% and 1.06%, respectively. Management fees for Standard Class and Service Class shares were 0.65%.
Earnings from a variable annuity or variable life investment compound tax-free until withdrawal and, as a result, no adjustments were made for income taxes.
An expense limitation was in effect for all classes during the periods shown in the Series performance chart above and in the Performance of a $10,000 Investment chart on the next page.
1
Performance of Service Class shares will vary due to different charges and expenses.
Performance data do not reflect insurance fees related to a variable annuity or variable life investment or the deferred sales charge that would apply to certain withdrawals of investments held for fewer than eight years. Performance shown here would have been reduced if such fees were included and the expense limitation removed. For more information about fees, consult your variable annuity or variable life prospectus.
Investments in variable products involve risk. Prices of growth companies’ securities may be more volatile than other securities, particularly over the short term. Convertible and preferred securities have many of the same characteristics as stocks, including many of the same risks. In addition, convertible bonds may be more sensitive to changes in interest rates than stocks. Convertible bonds may also have credit ratings below investment grade (that is, they may be junk bonds), meaning that they carry a higher risk of failure by the issuer to pay principal and/or interest when due. The Series will be particularly affected by declines in stock prices, which tend to fluctuate more than bond prices. Stock prices may be negatively affected by a drop in the stock market or poor performance in specific industries or companies. Stocks of companies with high growth expectations may be more susceptible to price declines if they do not meet those high expectations. Some portfolios offer more risk than others.
Please read both the contract and underlying prospectus for specific details regarding the product’s risk profile.
The chart shows a $10,000 investment in the Delaware VIP U.S. Growth Series Standard Class shares for the period from the Series’ inception on Nov. 15, 1999, through Dec. 31, 2007. Performance of Service Class shares will vary due to different charges and expenses.
The chart also shows $10,000 invested in the Russell 1000 Growth Index for the period from Nov. 15, 1999, through Dec. 31, 2007. The Russell 1000 Growth Index measures the performance of those Russell 1000 companies with higher price-to-book ratios and higher forecasted growth values. An index is unmanaged and does not reflect the costs of operating a mutual fund, such as the costs of buying, selling, and holding securities. You cannot invest directly in an index.
2
Delaware VIP Trust — Delaware VIP U.S. Growth Series
Disclosure of Series Expenses
For the Period July 1, 2007 to December 31, 2007
As a shareholder of the Series, you incur ongoing costs, including management fees; distribution and/or service (12b-1) fees; and other Series expenses. This Example is intended to help you understand your ongoing costs (in dollars) of investing in the Series and to compare these costs with the ongoing costs of investing in other mutual funds.
The Example is based on an investment of $1,000 invested at the beginning of the period and held for the entire period from July 1, 2007 to December 31, 2007.
Actual Expenses
The first section of the table shown, “Actual Series Return,” provides information about actual account values and actual expenses. You may use the information in this section of the table, together with the amount you invested, to estimate the expenses that you paid over the period. Simply divide your account value by $1,000 (for example, an $8,600 account value divided by $1,000 = 8.6), then multiply the result by the number in the first section under the heading entitled “Expenses Paid During Period” to estimate the expenses you paid on your account during the period.
Hypothetical Example for Comparison Purposes
The second section of the table shown, “Hypothetical 5% Return,” provides information about hypothetical account values and hypothetical expenses based on the Series’ actual expense ratio and an assumed rate of return of 5% per year before expenses, which is not the Series’ actual return. The hypothetical account values and expenses may not be used to estimate the actual ending account balance or expenses you paid for the period. You may use this information to compare the ongoing costs of investing in the Series and other funds. To do so, compare the 5% hypothetical example with the 5% hypothetical examples that appear in the shareholder reports of other funds.
Please note that the expenses shown in the table are meant to highlight your ongoing costs only. As a shareholder of the Series, you do not incur any transaction costs, such as sales charges (loads), redemption fees or exchange fees, but shareholders of other funds may incur such costs. Also, the fees related to the variable annuity investment or the deferred sales charge that could apply have not been included. Therefore, the second section of the table is useful in comparing ongoing costs only, and will not help you determine the relative total costs of owning different funds. The Series’ actual expenses shown in the table reflect fee waivers in effect for Service Class shares. The expenses shown in the table assume reinvestment of all dividends and distributions.
Expense Analysis of an Investment of $1,000
| | Beginning
Account
Value
7/1/07 | | Ending
Account
Value
12/31/07 | | Annualized
Expense
Ratios | | Expenses
Paid During
Period
7/1/07 to
12/31/07* | |
Actual Series Return | | | | | | | | | |
Standard Class | | $ | 1,000.00 | | $ | 1,082.10 | | 0.73 | % | $ | 3.83 | |
Service Class | | 1,000.00 | | 1,081.40 | | 0.98 | % | 5.14 | |
| | | | | | | | | |
Hypothetical 5% Return (5% return before expenses) | | | | | | | | | |
Standard Class | | $ | 1,000.00 | | $ | 1,021.52 | | 0.73 | % | $ | 3.72 | |
Service Class | | 1,000.00 | | 1,020.26 | | 0.98 | % | 4.99 | |
* | “Expenses Paid During Period” are equal to the Series’ annualized expense ratio, multiplied by the average account value over the period, multiplied by 184/365 (to reflect the one-half year period). |
3
Delaware VIP Trust — Delaware VIP U.S. Growth Series
Sector Allocation and Top 10 Holdings
As of December 31, 2007
Sector designations may be different than the sector designations presented in other Series materials.
Sector | | Percentage
of Net Assets | |
Common Stockt | | 99.09 | % |
Basic Industry/Capital Goods | | 3.40 | % |
Business Services | | 17.85 | % |
Consumer Non-Durables | | 11.89 | % |
Consumer Services | | 12.24 | % |
Financials | | 7.94 | % |
Health Care | | 16.13 | % |
Technology | | 29.64 | % |
Discount Note | | 1.84 | % |
Securities Lending Collateral | | 6.01 | % |
Total Value of Securities | | 106.94 | % |
Obligation to Return Securities Lending Collateral | | (6.01 | )% |
Liabilities Net of Receivables and Other Assets | | (0.93 | )% |
Total Net Assets | | 100.00 | % |
t Narrow industries are utilized for compliance purposes for diversification whereas broad sectors are used for financial reporting.
Holdings are for informational purposes only and are subject to change at any time. They are not a recommendation to buy, sell, or hold any security.
Top 10 Holdings | | Percentage
of Net Assets | |
Google Class A | | 5.66 | % |
UnitedHealth Group | | 5.36 | % |
QUALCOMM | | 4.93 | % |
Research in Motion | | 4.64 | % |
IntercontinentalExchange | | 4.43 | % |
Genentech | | 4.11 | % |
Seagate Technology | | 3.91 | % |
Intuit | | 3.88 | % |
Procter & Gamble | | 3.75 | % |
Allergan | | 3.61 | % |
4
Delaware VIP Trust — Delaware VIP U.S. Growth Series
Statement of Net Assets
December 31, 2007
| | | Number of
Shares | | Value | |
| COMMON STOCK–99.09%t | | | | | |
| Basic Industry/Capital Goods–3.40% | | | | | |
| Praxair | | 75,000 | | $ | 6,653,250 | |
| | | | | 6,653,250 | |
| Business Services–17.85% | | | | | |
| Expeditors International Washington | | 125,000 | | 5,585,000 | |
* | MasterCard Class A | | 18,500 | | 3,981,200 | |
| Paychex | | 125,000 | | 4,527,500 | |
† | Research in Motion | | 80,000 | | 9,072,000 | |
* | Reuters Group ADR | | 80,000 | | 6,094,400 | |
| United Parcel Service Class B | | 80,000 | | 5,657,600 | |
| | | | | 34,917,700 | |
| Consumer Non-Durable–11.89% | | | | | |
| Procter & Gamble | | 100,000 | | 7,342,000 | |
| Staples | | 265,000 | | 6,113,550 | |
| Walgreen | | 145,000 | | 5,521,600 | |
| Wal-Mart Stores | | 90,000 | | 4,277,700 | |
| | | | | 23,254,850 | |
| Consumer Services–12.24% | | | | | |
† | eBay | | 190,000 | | 6,306,100 | |
| International Game Technology | | 145,000 | | 6,369,850 | |
† | MGM MIRAGE | | 75,000 | | 6,301,500 | |
* | Weight Watchers International | | 110,000 | | 4,969,800 | |
| | | | | 23,947,250 | |
| Financials–7.94% | | | | | |
| CME Group | | 10,000 | | 6,860,000 | |
† | IntercontinentalExchange | | 45,000 | | 8,662,500 | |
| | | | | 15,522,500 | |
| Health Care–16.13% | | | | | |
| Allergan | | 110,000 | | 7,066,400 | |
*† | Genentech | | 120,000 | | 8,048,400 | |
| UnitedHealth Group | | 180,000 | | 10,476,000 | |
† | Zimmer Holdings | | 90,000 | | 5,953,500 | |
| | | | | 31,544,300 | |
| Technology–29.64% | | | | | |
† | Apple | | 29,000 | | 5,744,320 | |
*† | Crown Castle International | | 135,000 | | 5,616,000 | |
† | Google Class A | | 16,000 | | 11,063,680 | |
† | Intuit | | 240,000 | | 7,586,400 | |
* | QUALCOMM | | 245,000 | | 9,640,750 | |
*† | SanDisk | | 80,000 | | 2,653,600 | |
| Seagate Technology | | 300,000 | | 7,650,000 | |
† | Sun Microsystems | | 155,000 | | 2,810,150 | |
† | Teradata | | 190,000 | | 5,207,900 | |
| | | | | 57,972,800 | |
| Total Common Stock (cost $170,911,980) | | | | 193,812,650 | |
| | | | | | |
| | | Principal
Amount | | Value | |
¹ | DISCOUNT NOTE–1.84% | | | | | |
| Federal Home Loan Bank 3.25% 1/2/08 | | $ | 3,594,649 | | $ | 3,594,328 | |
| Total Discount Note (cost $3,594,328) | | | | 3,594,328 | |
| | | | | | |
| Total Value of Securities Before Securities Lending Collateral–100.93%
(cost $174,506,308) | | | | 197,406,978 | |
| | | | | |
| | Number of
Shares | | | |
| SECURITIES LENDING COLLATERAL**–6.01% | | | | | |
| Investment Companies Mellon GSL DBT II Collateral Fund | | 11,752,700 | | 11,752,700 | |
| Total Securities Lending Collateral (cost $11,752,700) | | | | 11,752,700 | |
| | | | | | | | | |
5
TOTAL VALUE OF SECURITIES–106.94% (cost $ 186,259,008) | | $ | 209,159,678 | © |
OBLIGATION TO RETURN SECURITIES LENDING COLLATERAL**–(6.01%) | | (11,752,700 | ) |
LIABILITIES NET OF RECEIVABLES AND OTHER ASSETS–(0.93%) | | (1,817,588 | ) |
NET ASSETS APPLICABLE TO 21,857,709 SHARES OUTSTANDING–100.00% | | $ | 195,589,390 | |
NET ASSET VALUE–DELAWARE VIP U.S. GROWTH SERIES STANDARD CLASS ($153,838,981 / 17,164,583 Shares) | | $ | 8.96 | |
NET ASSET VALUE–DELAWARE VIP U.S. GROWTH SERIES SERVICE CLASS ($41,750,409 / 4,693,126 Shares) | | $ | 8.90 | |
COMPONENTS OF NET ASSETS AT DECEMBER 31, 2007: | | | |
Shares of beneficial interest (unlimited authorization–no par) | | $ | 168,834,956 | |
Undistributed net investment income | | 49,867 | |
Accumulated net realized gain on investments | | 3,803,897 | |
Net unrealized appreciation of investments | | 22,900,670 | |
Total net assets | | $ | 195,589,390 | |
* | | Fully or partially on loan. |
** | | See Note 8 in “Notes to Financial Statements.” |
© | | Includes $12,191,796 of securities loaned. |
† | | Non-income producing security for the year ended December 31, 2007. |
¹ | | The rate shown is the effective yield at the time of purchase. |
t | | Narrow industries are utilized for compliance purposes for diversification whereas broad sectors are used for financial reporting. |
ADR – American Depositary Receipts
See accompanying notes
6
Delaware VIP Trust — Delaware VIP U.S. Growth Series
Statement of Operations
Year Ended December 31, 2007
INVESTMENT INCOME: | | | |
Dividends | | $ | 1,385,696 | |
Interest | | 127,930 | |
Securities lending income | | 14,720 | |
| | 1,528,346 | |
EXPENSES: | | | |
Management fees | | 1,202,411 | |
Distribution expenses – Service Class | | 120,851 | |
Accounting and administration expenses | | 73,985 | |
Dividend disbursing and transfer agent fees and expenses | | 24,263 | |
Legal fees | | 21,627 | |
Audit and tax | | 18,474 | |
Reports and statements to shareholders | | 13,933 | |
Trustees’ fees | | 8,724 | |
Insurance fees | | 4,917 | |
Custodian fees | | 4,640 | |
Consulting fees | | 3,403 | |
Trustees’ expenses | | 1,103 | |
Dues and services | | 1,068 | |
Pricing fees | | 247 | |
| | 1,499,646 | |
Less waiver of distribution expenses – Service Class | | (20,142 | ) |
Less expense paid indirectly | | (1,025 | ) |
Total operating expenses | | 1,478,479 | |
| | | |
NET INVESTMENT INCOME | | 49,867 | |
| | | |
NET REALIZED AND UNREALIZED GAIN ON INVESTMENTS: | | | |
Net realized gain on investments | | 19,885,089 | |
Net change in unrealized appreciation/ depreciation of investments | | 848,481 | |
| | | |
NET REALIZED AND UNREALIZED GAIN ON INVESTMENTS | | 20,733,570 | |
| | | |
NET INCREASE IN NET ASSETS RESULTING FROM OPERATIONS | | $ | 20,783,437 | |
Delaware VIP Trust — Delaware VIP U.S. Growth Series
Statements of Changes in Net Assets
| | Year Ended | |
| | 12/31/07 | | 12/31/06 | |
INCREASE (DECREASE) IN NET ASSETS FROM OPERATIONS: | | | | | |
Net investment income (loss) | | $ | 49,867 | | $ | (149,210 | ) |
Net realized gain (loss) on investments | | 19,885,089 | | (5,942,640 | ) |
Net change in unrealized appreciation/depreciation of investments | | 848,481 | | 11,250,393 | |
Net increase in net assets resulting from operations | | 20,783,437 | | 5,158,543 | |
| | | | | |
CAPITAL SHARE TRANSACTIONS: | | | | | |
Proceeds from shares sold: | | | | | |
Standard Class | | 85,833,894 | | 102,645,141 | |
Service Class | | 6,501,029 | | 4,028,901 | |
| | 92,334,923 | | 106,674,042 | |
Cost of shares repurchased: | | | | | |
Standard Class | | (86,691,890 | ) | (14,132,286 | ) |
Service Class | | (7,981,579 | ) | (8,271,201 | ) |
| | (94,673,469 | ) | (22,403,487 | ) |
Increase (decrease) in net assets derived from capital share transactions | | (2,338,546 | ) | 84,270,555 | |
| | | | | |
NET INCREASE IN NET ASSETS | | 18,444,891 | | 89,429,098 | |
| | | | | |
NET ASSETS: | | | | | |
Beginning of year | | 177,144,499 | | 87,715,401 | |
End of year (including undistributed net investment income of $49,867 and $-, respectively) | | $ | 195,589,390 | | $ | 177,144,499 | |
See accompanying notes
7
Delaware VIP Trust — Delaware VIP U.S. Growth Series
Financial Highlights
Selected data for each share of the Series outstanding throughout each period were as follows:
| | Delaware VIP U.S. Growth Series Standard Class
Year Ended | |
| | 12/31/07 | | 12/31/06 | | 12/31/05 | | 12/31/04 | | 12/31/03 | |
| | | | | | | | | | | |
Net asset value, beginning of period | | $ | 7.960 | | $ | 7.780 | | $ | 6.830 | | $ | 6.620 | | $ | 5.370 | |
| | | | | | | | | | | |
Income (loss) from investment operations: | | | | | | | | | | | |
Net investment income (loss)(1) | | 0.007 | | (0.003 | ) | (0.005 | ) | 0.049 | | 0.010 | |
Net realized and unrealized gain on investments | | 0.993 | | 0.183 | | 0.997 | | 0.169 | | 1.251 | |
Total from investment operations | | 1.000 | | 0.180 | | 0.992 | | 0.218 | | 1.261 | |
| | | | | | | | | | | |
Less dividends and distributions from: | | | | | | | | | | | |
Net investment income | | — | | — | | (0.042 | ) | (0.008 | ) | (0.011 | ) |
Total dividends and distributions | | — | | — | | (0.042 | ) | (0.008 | ) | (0.011 | ) |
| | | | | | | | | | | |
Net asset value, end of period | | $ | 8.960 | | $ | 7.960 | | $ | 7.780 | | $ | 6.830 | | $ | 6.620 | |
| | | | | | | | | | | |
Total return(2) | | 12.56 | % | 2.31 | % | 14.65 | % | 3.30 | % | 23.75 | % |
| | | | | | | | | | | |
Ratios and supplemental data: | | | | | | | | | | | |
Net assets, end of period (000 omitted) | | $ | 153,839 | | $ | 138,548 | | $ | 45,653 | | $ | 10,438 | | $ | 11,862 | |
Ratio of expenses to average net assets | | 0.74 | % | 0.77 | % | 0.81 | % | 0.76 | % | 0.75 | % |
Ratio of net investment income (loss) to average net assets | | 0.08 | % | (0.04 | )% | (0.07 | )% | 0.77 | % | 0.17 | % |
Portfolio turnover | | 52 | % | 21 | % | 91 | % | 167 | % | 102 | % |
(1) | The average shares outstanding method has been applied for per share information. |
(2) | Total investment return is based on the change in net asset value of a share during the period and assumes reinvestment of dividends and distributions at net asset value. |
See accompanying notes
8
Selected data for each share of the Series outstanding throughout each period were as follows:
| | Delaware VIP U.S. Growth Series Service Class | |
| | Year Ended | |
| | 12/31/07 | | 12/31/06 | | 12/31/05 | | 12/31/04 | | 12/31/03 | |
| | | | | | | | | | | |
Net asset value, beginning of period | | $ | 7.920 | | $ | 7.760 | | $ | 6.810 | | $ | 6.610 | | $ | 5.360 | |
| | | | | | | | | | | |
Income (loss) from investment operations: | | | | | | | | | | | |
Net investment income (loss)(1) | | (0.014 | ) | (0.022 | ) | (0.023 | ) | 0.033 | | (0.005 | ) |
Net realized and unrealized gain on investments | | 0.994 | | 0.182 | | 0.999 | | 0.167 | | 1.257 | |
Total from investment operations | | 0.980 | | 0.160 | | 0.976 | | 0.200 | | 1.252 | |
| | | | | | | | | | | |
Less dividends and distributions from: | | | | | | | | | | | |
Net investment income | | — | | — | | (0.026 | ) | — | | (0.002 | ) |
Total dividends and distributions | | — | | — | | (0.026 | ) | — | | (0.002 | ) |
| | | | | | | | | | | |
Net asset value, end of period | | $ | 8.900 | | $ | 7.920 | | $ | 7.760 | | $ | 6.810 | | $ | 6.610 | |
| | | | | | | | | | | |
Total return(2) | | 12.37 | % | 2.06 | % | 14.41 | % | 3.03 | % | 23.37 | % |
| | | | | | | | | | | |
Ratios and supplemental data: | | | | | | | | | | | |
Net assets, end of period (000 omitted) | | $ | 41,750 | | $ | 38,596 | | $ | 42,062 | | $ | 37,653 | | $ | 9,718 | |
Ratio of expenses to average net assets | | 0.99 | % | 1.02 | % | 1.06 | % | 1.01 | % | 0.97 | % |
Ratio of expenses to average net assets prior to expense limitation and expenses paid indirectly | | 1.04 | % | 1.07 | % | 1.11 | % | 1.06 | % | 1.00 | % |
Ratio of net investment income (loss) to average net assets | | (0.17 | )% | (0.29 | )% | (0.32 | )% | 0.52 | % | (0.05 | )% |
Ratio of net investment income (loss) to average net assets prior to expense limitation and expenses paid indirectly | | (0.22 | )% | (0.34 | )% | (0.37 | )% | 0.47 | % | (0.08 | )% |
Portfolio turnover | | 52 | % | 21 | % | 91 | % | 167 | % | 102 | % |
(1) | The average shares outstanding method has been applied for per share information. |
(2) | Total investment return is based on the change in net asset value of a share during the period and assumes reinvestment of dividends and distributions at net asset value. Total investment return reflects a waiver by the distributor. Performance would have been lower had the waiver not been in effect. |
See accompanying notes
9
Delaware VIP Trust — Delaware VIP U.S. Growth Series
Notes to Financial Statements
December 31, 2007
Delaware VIP Trust (Trust) is organized as a Delaware statutory trust and offers 14 series: Delaware VIP Balanced Series, Delaware VIP Capital Reserves Series, Delaware VIP Cash Reserve Series, Delaware VIP Diversified Income Series, Delaware VIP Emerging Markets Series, Delaware VIP Growth Opportunities Series, Delaware VIP High Yield Series, Delaware VIP International Value Equity Series, Delaware VIP REIT Series, Delaware VIP Select Growth Series, Delaware VIP Small Cap Value Series, Delaware VIP Trend Series, Delaware VIP U.S. Growth Series and Delaware VIP Value Series. These financial statements and the related notes pertain to Delaware VIP U.S. Growth Series (Series). The Trust is an open-end investment company. The Series is considered diversified under the Investment Company Act of 1940, as amended, and offers Standard Class and Service Class shares. The Standard Class shares do not carry a 12b-1 fee and the Service Class shares carry a 12b-1 fee. The shares of the Series are sold only to separate accounts of life insurance companies.
The investment objective of the Series is to seek long-term capital appreciation.
1. Significant Accounting Policies
The following accounting policies are in accordance with U.S. generally accepted accounting principles and are consistently followed by the Series.
Security Valuation—Equity securities, except those traded on the Nasdaq Stock Market, Inc. (Nasdaq), are valued at the last quoted sales price as of the time of the regular close of the New York Stock Exchange (NYSE) on the valuation date. Securities traded on the Nasdaq are valued in accordance with the Nasdaq Official Closing Price, which may not be the last sales price. If on a particular day an equity security does not trade, then the mean between the bid and asked prices will be used. Short-term debt securities having less than 60 days to maturity are valued at amortized cost, which approximates market value. Securities lending collateral, which is invested in a collective investment vehicle, is valued at unit value per share. Other securities and assets for which market quotations are not readily available are valued at fair value as determined in good faith under the direction of the Series’ Board of Trustees. In determining whether market quotations are readily available or fair valuation will be used, various factors will be taken into consideration, such as market closures, or with respect to foreign securities, aftermarket trading or significant events after local market trading (e.g., government actions or pronouncements, trading volume or volatility on markets, exchanges among dealers, or news events).
In September 2006, the Financial Accounting Standards Board (FASB) issued FASB Statement No. 157 “Fair Value Measurements” (Statement 157). Statement 157 establishes a framework for measuring fair value in U.S. generally accepted accounting principles, clarifies the definition of fair value within that framework, and expands disclosures about the use of fair value measurements. Statement 157 is intended to increase consistency and comparability among fair value estimates used in financial reporting. Statement 157 is effective for fiscal years beginning after November 15, 2007. Management does not expect the adoption of Statement 157 to have a material impact on the amounts reported in the financial statements.
Federal Income Taxes—The Series intends to continue to qualify for federal income tax purposes as a regulated investment company under Subchapter M of the Internal Revenue Code of 1986, as amended, and make the requisite distributions to shareholders. Accordingly, no provision for federal income taxes has been made in the financial statements.
Effective June 29, 2007, the Series adopted FASB Interpretation No. 48 “Accounting for Uncertainty in Income Taxes” (FIN 48). FIN 48 provides guidance for how uncertain tax positions should be recognized, measured, presented and disclosed in the financial statements. FIN 48 requires the evaluation of tax positions taken or expected to be taken in the course of preparing the Series’ tax returns to determine whether the tax positions are “more-likely-than-not” of being sustained by the applicable tax authority. Tax positions not deemed to meet the more-likely-than-not threshold are recorded as a tax benefit or expense in the current year. The adoption of FIN 48 did not result in the recording of any tax benefit or expense in the current period.
Class Accounting—Investment income, common expenses and realized and unrealized gain (loss) on investments are allocated to the classes of the Series on the basis of daily net assets of each class. Distribution expenses relating to a specific class are charged directly to that class.
Repurchase Agreements—The Series may invest in a pooled cash account along with members of the Delaware Investments® Family of Funds pursuant to an exemptive order issued by the Securities and Exchange Commission. The aggregate daily balance of the pooled cash account is invested in repurchase agreements secured by obligations of the U.S. government. The respective collateral is held by the Series’ custodian bank until the maturity of the respective repurchase agreements. Each repurchase agreement is at least 102% collateralized. However, in the event of default or bankruptcy by the counterparty to the agreement, realization of the collateral may be subject to legal proceedings. At December 31, 2007, the Series held no investments in repurchase agreements.
Use of Estimates—The preparation of financial statements in conformity with U.S. generally accepted accounting principles requires management to make estimates and assumptions that affect the reported amounts of assets and liabilities at the date of the financial statements and the reported amounts of revenues and expenses during the reporting period. Actual results could differ from those estimates.
Other—Expenses directly attributable to the Series are charged directly to the Series. Other expenses common to various funds within the Delaware Investments® Family of Funds are generally allocated amongst such funds on the basis of average net assets. Management fees and some other expenses are paid monthly. Security transactions are recorded on the date the securities are purchased or sold (trade date) for financial reporting purposes. Costs used in calculating realized gains and losses on the sale of investment securities are those of the specific securities sold. Dividend income is recorded on the ex-dividend date and interest income is recorded on the accrual basis.
The Series declares and pays dividends from net investment income and distributions from net realized gain on investments, if any, following the close of the fiscal year.
10
Delaware VIP U.S. Growth Series
Notes to Financial Statements (continued)
1. Significant Accounting Policies (continued)
Subject to seeking best execution, the Series may direct certain security trades to brokers who have agreed to rebate a portion of the related brokerage commission to the Series in cash. Such commission rebates are included in realized gain on investments in the accompanying financial statements and totaled $13,634 for the year ended December 31, 2007. In general, best execution refers to many factors, including the price paid or received for a security, the commission charged, the promptness and reliability of execution, the confidentiality and placement accorded the order, and other factors affecting the overall benefit obtained by the Series on the transaction.
The Series receives earnings credits from its custodian when positive cash balances are maintained, which are used to offset custody fees. The expense paid under this arrangement is included in custodian fees on the Statement of Operations with the corresponding expense offset shown as “expense paid indirectly.”
2. Investment Management, Administration Agreements and Other Transactions with Affiliates
In accordance with the terms of its investment management agreement, the Series pays Delaware Management Company (DMC), a series of Delaware Management Business Trust and the investment manager, an annual fee which is calculated daily at the rate of 0.65% on the first $500 million of average daily net assets of the Series, 0.60% on the next $500 million, 0.55% on the next $1.5 billion and 0.50% on average daily net assets in excess of $2.5 billion.
Prior to May 1, 2007, DMC had contractually agreed to waive that portion, if any, of its management fee and reimburse the Series to the extent necessary to ensure that total annual operating expenses, exclusive of taxes, interest, brokerage fees, 12b-1 plan expenses, certain insurance costs and non-routine expenses or costs including, but not limited to, those relating to reorganizations, litigation, conducting shareholder meetings, and liquidations, did not exceed 0.87% of average daily net assets of the Series. No reimbursement was due for the year ended December 31, 2007.
Effective October 1, 2007, Delaware Service Company, Inc. (DSC), an affiliate of DMC, provides fund accounting and financial administration oversight services to the Series. For these services, the Series pays DSC fees based on the aggregate daily net assets of the Delaware Investments® Family of Funds at the following annual rate: 0.0050% of the first $30 billion; 0.0045% of the next $10 billion; 0.0040% of the next $10 billion; and 0.0025% of aggregate average daily net assets in excess of $50 billion. The fees payable to DSC under the service agreement described above are allocated among all funds in the Delaware Investments® Family of Funds on a relative net asset value basis. Prior to October 1, 2007, DSC provided fund accounting and administrative services to the Series and received a fee at an annual rate of 0.04% of average daily net assets. For the year ended December 31, 2007, the Series was charged $57,199 for these services.
DSC also provides dividend disbursing and transfer agency services. The Series pays DSC a monthly fee based on the number of shareholder accounts for dividend disbursing and transfer agent services.
Pursuant to a distribution agreement and distribution plan, the Series pays Delaware Distributors, L.P. (DDLP), the distributor and an affiliate of DMC, an annual distribution and service fee not to exceed 0.30% of the average daily net assets of the Service Class shares. DDLP has contracted to waive distribution and service fees through April 30, 2008 in order to prevent distribution and service fees of the Service Class shares from exceeding 0.25% of average daily net assets. Standard Class shares pay no distribution and service expenses.
At December 31, 2007, the Series had liabilities payable to affiliates as follows:
Investment
Management
Fee Payable to
DMC | | Dividend Disbursing,
Transfer Agent
Fees and Other Expenses
Payable to DSC | | Distribution
Fees Payable
to DDLP | | Other Expenses
Payable to DMC
and Affiliates* | |
$ | 106,316 | | $ | 3,512 | | $ | 8,890 | | $ | 7,649 | |
| | | | | | | | | | | |
* DMC, as part of its administrative services, pays operating expenses on behalf of the Series and is reimbursed on a periodic basis. Such expenses include items such as printing of shareholder reports, fees for audit, legal and tax services, custodian fees and trustees’ fees.
As provided in the investment management agreement, the Series bears the cost of certain legal and tax services, including internal legal and tax services provided to the Series by DMC and/or its affiliates’ employees. For the year ended December 31, 2007, the Series was charged $9,935 for internal legal and tax services provided by DMC and/or its affiliates’ employees.
Trustees’ fees include expenses accrued by the Series for each Trustee’s retainer and per meeting fees. Certain officers of DMC, DSC and DDLP are officers and/or Trustees of the Trust. These officers and Trustees are paid no compensation by the Series.
11
Delaware VIP U.S. Growth Series
Notes to Financial Statements (continued)
3. Investments
For the year ended December 31, 2007, the Series made purchases and sales of investment securities other than short-term investments as follows:
Purchases | | $ | 94,450,341 | |
Sales | | 97,233,750 | |
At December 31, 2007, the cost of investments for federal income tax purposes and unrealized appreciation (depreciation) for the Series were as follows:
Cost of
Investments | | Aggregate
Unrealized
Appreciation | | Aggregate
Unrealized
Depreciation | | Net Unrealized
Appreciation | |
$ | 187,033,059 | | $ | 27,660,623 | | $ | (5,534,004 | ) | $ | 22,126,619 | |
| | | | | | | | | | | |
4. Dividend and Distribution Information
Income and long-term capital gain distributions are determined in accordance with federal income tax regulations, which may differ from U.S. generally accepted accounting principles. Additionally, net short-term gains on sales of investment securities are treated as ordinary income for federal income tax purposes. There were no distributions paid during the years ended December 31, 2007 and 2006.
5. Components of Net Assets on a Tax Basis
As of December 31, 2007, the components of net assets on a tax basis were as follows:
Shares of beneficial interest | | $ | 168,834,956 | |
Undistributed ordinary income | | 248,441 | |
Undistributed long-term capital gains | | 4,379,374 | |
Unrealized appreciation of investments | | 22,126,619 | |
Net assets | | $ | 195,589,390 | |
The differences between book basis and tax basis components of net assets are primarily attributable to tax deferral of losses on wash sales.
$14,949,348 of capital loss carryforwards from prior years was utilized in 2007.
6. Capital Shares
Transactions in capital shares were as follows:
| | Year
Ended
12/31/07 | | Year
Ended
12/31/06 | |
Shares sold: | | | | | |
Standard Class | | 10,186,308 | | 13,447,718 | |
Service Class | | 772,781 | | 525,533 | |
| | 10,959,089 | | 13,973,251 | |
Shares repurchased: | | | | | |
Standard Class | | (10,434,528 | ) | (1,906,393 | ) |
Service Class | | (952,833 | ) | (1,073,004 | ) |
| | (11,387,361 | ) | (2,979,397 | ) |
Net increase (decrease) | | (428,272 | ) | 10,993,854 | |
7. Line of Credit
The Series, along with certain other funds in the Delaware Investments® Family of Funds (Participants), participates in a $225,000,000 revolving line of credit facility to be used for temporary or emergency purposes as an additional source of liquidity to fund redemptions of investor shares. The Participants are charged an annual commitment fee, which is allocated across the Participants on the basis of each Participant’s allocation of the entire facility. The Participants may borrow up to a maximum of one third of their net assets under the agreement. The Series had no amounts outstanding as of December 31, 2007, or at any time during the year then ended.
12
Delaware VIP U.S. Growth Series
Notes to Financial Statements (continued)
8. Securities Lending
The Series, along with other funds in the Delaware Investments® Family of Funds, may lend its securities pursuant to a security lending agreement (Lending Agreement) with Mellon Bank, N.A. (Mellon). With respect to each loan, if the aggregate market value of the collateral held on any business day is less than the aggregate market value of the securities which are the subject of such loan, the borrower will be notified to provide additional collateral not less than the applicable collateral requirements. Cash collateral received is invested in a collective investment vehicle (Collective Trust) established by Mellon for the purpose of investment on behalf of clients participating in its securities lending programs. The Collective Trust invests in fixed income securities, with a weighted average maturity not to exceed 90 days, rated in one of the top two tiers by Standard & Poor’s Ratings Group or Moody’s Investors Service, Inc. or repurchase agreements collateralized by such securities. However, in the event of default or bankruptcy by the lending agent, realization and/or retention of the collateral may be subject to legal proceedings. In the event the borrower fails to return loaned securities and the collateral received is insufficient to cover the value of the loaned securities and provided such collateral shortfall is not the result of investment losses, the lending agent has agreed to pay the amount of the shortfall to the Series, or at the discretion of the lending agent, replace the loaned securities. The Series continues to record dividends or interest, as applicable, on the securities loaned and is subject to change in value of the securities loaned that may occur during the term of the loan. The Series has the right under the Lending Agreement to recover the securities from the borrower on demand. With respect to security loans collateralized by U.S. Treasury obligations, the Series receives a fee from the securities lending agent. With respect to security loans collateralized by cash collateral, the earnings from the collateral investments are shared among the Series, the security lending agent and the borrower. The Series records securities lending income net of allocations to the security lending agent and the borrower.
At December 31, 2007, the market value of the securities on loan was $12,191,796, for which the Series received collateral, comprised of U.S. government obligations valued at $840,141, and cash collateral of $11,752,700. Investments purchased with cash collateral are presented on the Statement of Net Assets under the caption “Securities Lending Collateral.”
9. Credit and Market Risk
The Series may invest up to 15% of its net assets in illiquid securities, which may include securities with contractual restrictions on resale, securities exempt from registration under Rule 144A of the Securities Act of 1933, as amended, and other securities which may not be readily marketable. The relative illiquidity of these securities may impair the Series from disposing of them in a timely manner and at a fair price when it is necessary or desirable to do so. While maintaining oversight, the Series’ Board of Trustees has delegated to DMC the day-to-day functions of determining whether individual securities are liquid for purposes of the Series’ limitation on investments in illiquid assets. As of December 31, 2007, there were no Rule 144A securities and no securities have been determined to be illiquid under the Series’ Liquidity Procedures.
10. Contractual Obligations
The Series enters into contracts in the normal course of business that contain a variety of indemnifications. The Series’ maximum exposure under these arrangements is unknown. However, the Series has not had prior claims or losses pursuant to these contracts. Management has reviewed the Series’ existing contracts and expects the risk of loss to be remote.
11. Change in Custodian
On August 2, 2007, Mellon, One Mellon Center, Pittsburgh, PA 15258, became the Series’ Custodian.
13
Delaware VIP Trust — Delaware VIP U.S. Growth Series
Report of Independent Registered Public Accounting Firm
To the Shareholders and Board of Trustees
Delaware VIP Trust — Delaware VIP U.S. Growth Series
We have audited the accompanying statement of net assets of the Delaware VIP U.S. Growth Series (one of the series constituting Delaware VIP Trust) (the “Series”) as of December 31, 2007, and the related statement of operations for the year then ended, the statements of changes in net assets for each of the two years in the period then ended, and the financial highlights for each of the five years in the period then ended. These financial statements and financial highlights are the responsibility of the Series’ management. Our responsibility is to express an opinion on these financial statements and financial highlights based on our audits.
We conducted our audits in accordance with the standards of the Public Company Accounting Oversight Board (United States). Those standards require that we plan and perform the audit to obtain reasonable assurance about whether the financial statements and financial highlights are free of material misstatement. We were not engaged to perform an audit of the Series’ internal control over financial reporting. Our audits included consideration of internal control over financial reporting as a basis for designing audit procedures that are appropriate in the circumstances, but not for the purpose of expressing an opinion on the effectiveness of the Series’ internal control over financial reporting. Accordingly, we express no such opinion. An audit also includes examining, on a test basis, evidence supporting the amounts and disclosures in the financial statements and financial highlights, assessing the accounting principles used and significant estimates made by management, and evaluating the overall financial statement presentation. Our procedures included confirmation of securities owned as of December 31, 2007, by correspondence with the custodian and brokers or by other appropriate auditing procedures where replies from brokers were not received. We believe that our audits provide a reasonable basis for our opinion.
In our opinion, the financial statements and financial highlights referred to above present fairly, in all material respects, the financial position of the Delaware VIP U.S. Growth Series of Delaware VIP Trust at December 31, 2007, the results of its operations for the year then ended, the changes in its net assets for each of the two years in the period then ended, and its financial highlights for each of the five years in the period then ended, in conformity with U.S. generally accepted accounting principles.

Philadelphia, Pennsylvania
February 14, 2008
The Series files its complete schedule of portfolio holdings with the Securities and Exchange Commission (Commission) for the first and third quarters of each fiscal year on Form N-Q. The Series’ Forms N-Q, as well as a description of the policies and procedures that the Series uses to determine how to vote proxies (if any) relating to portfolio securities is available without charge (i) upon request, by calling 800-523-1918; and (ii) on the Commission’s website at http://www.sec.gov. In addition, a description of the policies and procedures that the Series uses to determine how to vote proxies (if any) relating to portfolio securities is available without charge on the Delaware Investments® Funds’ website at http://www.delawareinvestments.com. The Series’ Forms N-Q may be reviewed and copied at the Commission’s Public Reference Room in Washington, DC; information on the operation of the Public Reference Room may be obtained by calling 800 SEC-0330.
Information (if any) regarding how the Series voted proxies relating to portfolio securities during the most recently disclosed 12-month period ended June 30 is available without charge (i) through the Delaware Investments® Funds’ website at http://www.delawareinvestments.com; and (ii) on the Commission’s website at http://www.sec.gov.
14
Delaware Investments® Family of Funds
BOARD OF TRUSTEES/DIRECTORS AND OFFICERS ADDENDUM
A mutual fund is governed by a Board of Trustees/Directors (“Trustees”), which has oversight responsibility for the management of a fund’s business affairs. Trustees establish procedures and oversee and review the performance of the investment manager, the distributor, and others who perform services for the fund. The independent fund trustees, in particular, are advocates for shareholder interests. Each trustee has served in that capacity since he or she was elected to or appointed to the Board of Trustees, and will continue to serve until his or her retirement or the election of a new trustee in his or her place. The following is a list of the Trustees and Officers with certain background and related information.
Name,
Address,
and Birth Date | | Position(s)
Held with
Fund(s) | | Length of Time
Served | | Principal
Occupation(s)
During
Past 5 Years | | Number of
Portfolios in Fund
Complex Overseen
by Trustee
or Officer | | Other
Directorships
Held by
Trustee
or Officer | |
INTERESTED TRUSTEES | |
Patrick P. Coyne(1)
2005 Market Street
Philadelphia, PA
19103
April 1963 | | Chairman,
President,
Chief Executive
Officer, and
Trustee | | Chairman and Trustee
since August 16, 2006
President and
Chief Executive Officer
since August 1, 2006 | | Patrick P. Coyne has served in various executive capacities at different times at Delaware Investments.(2) | | 84 | | Director –
Kaydon Corp.
Board of Governors
Member –
Investment Company Institute
(2007 – present)
Member of Investment Committee –
Cradle of
Liberty Council, BSA
(November 2007 –
present)
Finance Committee
Member – St. John
Vianney Roman
Catholic Church
(2007 – present) | |
INDEPENDENT TRUSTEES | |
Thomas L. Bennett
2005 Market Street
Philadelphia, PA
19103
October 1947 | | Trustee | | Since
March 2005 | | Private Investor –(March 2004 – Present)
Investment Manager – Morgan Stanley & Co.(January 1984 – March 2004)
| | 84 | | Director –
Bryn Mawr
Bank Corp. (BMTC) (April 2007 – Present)
Chairman of
Investment
Committee –
The Haverford School
(2002 – present)
Chairman of
Investment
Committee –
Pennsylvania Academy
of Fine Arts
(2007 – present)
Trustee
(2004 – present)
Investment Committee
Member –
Pennsylvania
Horticulture Society
(February 2006 –
present) | |
15
Name,
Address,
and Birth Date | | Position(s)
Held with
Fund(s) | | Length of Time
Served | | Principal
Occupation(s)
During
Past 5 Years | | Number of
Portfolios in Fund
Complex Overseen
by Trustee
or Officer | | Other
Directorships
Held by
Trustee
or Officer | |
INDEPENDENT TRUSTEES (CONTINUED) | |
John A. Fry
2005 Market Street
Philadelphia, PA
19103
May 1960 | | Trustee | | Since
January 2001 | | President – Franklin & Marshall College (June 2002 – Present)
Executive Vice President – University of Pennsylvania (April 1995 – June 2002) | | 84 | | Director – Community Health Systems
Director – Allied Barton Security Holdings | |
Anthony D. Knerr
2005 Market Street
Philadelphia, PA
19103
December 1938 | | Trustee | | Since
April 1990 | | Founder and Managing Director – Anthony Knerr & Associates (Strategic Consulting) (1990 – Present) | | 84 | | None | |
Lucinda S. Landreth
2005 Market Street
Philadelphia, PA
19103
June 1947 | | Trustee | | Since
March 2005 | | Chief Investment Officer – Assurant, Inc. (Insurance) (2002 – 2004) | | 84 | | None | |
Ann R. Leven
2005 Market Street Philadelphia, PA 19103
November 1940 | | Trustee | | Since
October 1989 | | Consultant – ARL Associates (Financial Planning) (1983 – Present) | | 84 | | Director and Audit Committee Member – Systemax, Inc. | |
Thomas F. Madison
2005 Market Street
Philadelphia, PA
19103
February 1936 | | Trustee | | Since
May 1997 | | President and Chief Executive Officer – MLM Partners, Inc. (Small Business Investing and Consulting) (January 1993 – Present) | | 84 | | Director – CenterPoint Energy
Director and Audit Committee Member – Digital River, Inc.
Director and Audit Committee Member – Rimage Corporation
Director and Chair of Compensation and Governance & Nominating Committees – Valmont Industries, Inc. | |
Janet L. Yeomans
2005 Market Street
Philadelphia, PA
19103
July 1948 | | Trustee | | Since
April 1999 | | Treasurer (January 2006 – Present) Vice President – Mergers & Acquisitions (January 2003 – January 2006), and Vice President (July 1995 – January 2003) 3M Corporation | | 84 | | None | |
J. Richard Zecher
2005 Market Street
Philadelphia, PA
19103
July 1940 | | Trustee | | Since
March 2003 | | Founder – Investor Analytics (Risk Management) (May 1999 – Present)
Founder – Sutton Asset Management (Hedge Fund) (September 1998 – Present) | | 84 | | Director and Audit Committee Member – Investor Analytics
Director and Audit Committee Member – Oxigene, Inc. | |
16
Name,
Address,
and Birth Date | | Position(s)
Held with
Fund(s) | | Length of Time
Served | | Principal
Occupation(s)
During
Past 5 Years | | Number of
Portfolios in Fund
Complex Overseen
by Trustee
or Officer | | Other
Directorships
Held by
Trustee
or Officer | |
OFFICERS | | | | | | | | | | | |
David F. Connor
2005 Market Street
Philadelphia, PA
19103
December 1963 | | Vice President, Deputy General Counsel, and Secretary | | Vice President since September 21, 2000 and Secretary since
October 2005 | | David F. Connor has served as Vice President and Deputy General Counsel of Delaware Investments since 2000. | | 84 | | None(4) | |
Daniel V. Geatens
2005 Market Street
Philadelphia, PA
19103
October 1972 | | Vice President and Treasurer | | Treasurer since
October 25, 2007 | | Daniel V. Geatens has served in various capacities at different times at Delaware Investments. | | 84 | | None(4) | |
David P. O’Connor
2005 Market Street
Philadelphia, PA
19103
February 1966 | | Senior Vice President, General Counsel, and Chief Legal Officer | | Senior Vice President, General Counsel, and Chief Legal Officer since
October 2005 | | David P. O’Connor has served in various executive and legal capacities at different times at Delaware Investments. | | 84 | | None(4) | |
Richard Salus
2005 Market Street
Philadelphia, PA
19103
October 1963 | | Senior Vice President and Chief Financial Officer | | Chief Financial
Officer
since
November 1, 2006 | | Richard Salus has served in various executive capacities at different times at Delaware Investments. | | 84 | | None(4) | |
(1) Patrick P. Coyne is considered to be an “Interested Trustee” because he is an executive officer of the Fund’s(s’) investment advisor.
(2) Delaware Investments is the marketing name for Delaware Management Holdings, Inc. and its subsidiaries, including the Fund’s(s’) investment advisor, principal underwriter, and its transfer agent.
(3) In 1997, several funds managed by Voyageur Fund Managers, Inc. (the “Voyageur Funds”) were incorporated into the Delaware Investments Family of Funds. Mr. Madison served as a director of the Voyageur Funds from 1993 until 1997.
(4) David F. Connor, Daniel V. Geatens, David P. O’Connor, and Richard Salus serve in similar capacities for the six portfolios of the Optimum Fund Trust, which have the same investment advisor, principal underwriter, and transfer agent as the registrant.
The Statement of Additional Information for the Fund(s) includes additional information about the Trustees and Officers and is available, without charge, upon request by calling 800 523-1918.
17
Delaware VIP Trust — Delaware VIP Value Series
For the 12-month period ended Dec. 31, 2007, the Delaware VIP Value Series Standard Class shares returned -2.72%, while Service Class shares returned -3.00% (both figures reflect returns with all distributions reinvested). The Series’ benchmark, the Russell 1000® Value Index, returned -0.17% (source: Lipper).
We regularly look to invest in undervalued companies with good business models that we believe are priced well below their intrinsic value. During the most recent fiscal year, we focused on companies that we believed to have particularly sound balance sheets, strong dividend yields, and the potential to continue to generate relatively stable earnings, even in a weaker economy.
In the face of a slowing economy, declining corporate earnings growth, and a weaker housing market, stocks turned in only moderate gains during the past year. Within the slowing economic environment, however, we found an increasing number of opportunities within the technology sector — this despite the fact that technology is not considered a traditional value sector. For example, Hewlett-Packard (HP), which manufactures computers, printers, and other devices, performed particularly well. HP successfully grew its sales and earnings as the company benefited from new leadership and restructuring efforts. The Series’ healthcare investments, including Merck and Baxter International, also performed favorably. Merck and HP holdings were sold late in the year.
The Series’ underweight allocation in the energy sector had a negative impact on performance as rising commodity prices propelled energy sector shares during the period. Disappointing stock selection in the consumer discretionary sector also hurt the Series’ returns relative to the performance benchmark. Limited Brands was a notable underperformer within the consumer discretionary sector; we maintained a position in Limited Brands because we believed in the company’s longer-term prospects. Furthermore, it was a difficult year for the financial sector, as a whole, and several of our financial holdings experienced steep declines, especially Washington Mutual, Discover Financial Services, and Huntington Bancshares. At year end, we believed that Washington Mutual could survive the housing market correction and, longer term, offered an attractive risk/reward tradeoff relative to its current price. Despite its decline during the year, we continued to have confidence in Discover’s long-term value. Similarly, we believed Huntington Bancshares, as a traditional bank that profits from spread lending, could meaningfully benefit from an eventual recovery in the economy and credit markets.
The views expressed are current as of the date of this report and are subject to change.
The performance data quoted below represent past performance; past performance does not guarantee future results. Investment return and principal value will fluctuate so your shares, when redeemed, may be worth more or less than their original cost. Please obtain the performance data for the most recent month end by calling the number noted in the introductory section of this report on the page related to this Series.
You should consider the investment objectives, risks, charges, and expenses of the investment company carefully before investing. The Delaware VIP Value Series prospectus contains this and other important information about the Series. To obtain a prospectus, contact the company noted on the page related to this Series in the introductory section of this report, either by phone or through the company Web site. We advise you to read the prospectus carefully before you invest.
Delaware VIP Value Series
Average annual total returns
For periods ended Dec. 31, 2007 | | 1 year | | 5 years | | 10 years | | Lifetime | |
| | | | | | | | | |
Standard Class shares (commenced operations July 28, 1988) | | -2.72 | % | +13.55 | % | +5.90 | % | +9.50 | % |
Service Class shares (commenced operations May 1, 2000) | | -3.00 | % | +13.27 | % | NA | | +7.20 | % |
As disclosed in the Series’ most recent prospectus, expenses for Standard Class and Service Class shares were as follows: The net expense ratios for Standard Class and Service Class shares of the Series were 0.76% and 1.01%, respectively. Total operating expenses for Standard Class and Service Class shares were 0.76% and 1.06%, respectively. Management fees for Standard Class and Service Class shares were 0.65%.
Management has voluntarily agreed to reimburse expenses and/or waive its management fees in the amount of 0.05% of the Series’ average net assets until the waiver is discontinued, as disclosed in the most recent prospectus.
Earnings from a variable annuity or variable life investment compound tax-free until withdrawal and, as a result, no adjustments were made for income taxes.
An expense limitation was in effect for all classes during the periods shown in the Series performance chart above and in the Performance of a $10,000 Investment chart on the next page.
Performance of Service Class shares will vary due to different charges and expenses.
Performance data do not reflect insurance fees related to a variable annuity or variable life investment or the deferred sales charge that would apply to certain withdrawals of investments held for fewer than eight years. Performance shown here would have been reduced if such fees were included and the expense limitation removed. For more information about fees, consult your variable annuity or variable life prospectus.
1
Investments in variable products involve risk. A value stock may not increase in price as anticipated if other investors do not share the portfolio managers’ perception of the company’s value or if factors that would typically increase the price of the security do not occur. This Series will be particularly affected by declines in stock prices, which can be caused by a drop in the stock market or poor performance in specific industries or companies. The portfolio may have turnover in excess of 100%. High portfolio turnover can increase the Series’ transaction costs and lower returns Some portfolios offer more risk than others.
Please read both the contract and underlying prospectus for specific details regarding the product’s risk profile.
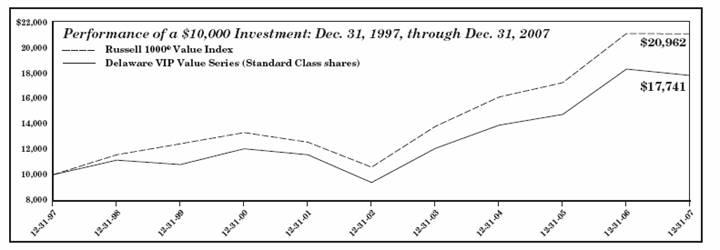
The chart shows a $10,000 investment in the Delaware VIP Value Series Standard Class shares for the period from Dec. 31, 1997, through Dec. 31, 2007. Performance of Service Class shares will vary due to different charges and expenses.
The chart also shows $10,000 invested in the Russell 1000 Value Index for the period from Dec. 31, 1997, through Dec. 31, 2007. The Russell 1000 Value Index measures the performance of those Russell 1000 companies with lower price-to-book ratios and lower forecasted growth values. An index is unmanaged and does not reflect the costs of operating a mutual fund, such as the costs of buying, selling, and holding securities. You cannot invest directly in an index.
2
Delaware VIP Trust — Delaware VIP Value Series
Disclosure of Series Expenses
For the Period July 1, 2007 to December 31, 2007
As a shareholder of the Series, you incur ongoing costs, including management fees; distribution and/or service (12b-1) fees; and other Series expenses. This Example is intended to help you understand your ongoing costs (in dollars) of investing in the Series and to compare these costs with the ongoing costs of investing in other mutual funds.
The Example is based on an investment of $1,000 invested at the beginning of the period and held for the entire period from July 1, 2007 to December 31, 2007.
Actual Expenses
The first section of the table shown, “Actual Series Return,” provides information about actual account values and actual expenses. You may use the information in this section of the table, together with the amount you invested, to estimate the expenses that you paid over the period. Simply divide your account value by $1,000 (for example, an $8,600 account value divided by $1,000 = 8.6), then multiply the result by the number in the first section under the heading entitled “Expenses Paid During Period” to estimate the expenses you paid on your account during the period.
Hypothetical Example for Comparison Purposes
The second section of the table shown, “Hypothetical 5% Return,” provides information about hypothetical account values and hypothetical expenses based on the Series’ actual expense ratio and an assumed rate of return of 5% per year before expenses, which is not the Series’ actual return. The hypothetical account values and expenses may not be used to estimate the actual ending account balance or expenses you paid for the period. You may use this information to compare the ongoing costs of investing in the Series and other funds. To do so, compare the 5% hypothetical example with the 5% hypothetical examples that appear in the shareholder reports of other funds.
Please note that the expenses shown in the table are meant to highlight your ongoing costs only. As a shareholder of the Series, you do not incur any transaction costs, such as sales charges (loads), redemption fees or exchange fees, but shareholders of other funds may incur such costs. Also, the fees related to the variable annuity investment or the deferred sales charge that could apply have not been included. Therefore, the second section of the table is useful in comparing ongoing costs only, and will not help you determine the relative total costs of owning different funds. The Series’ actual expenses shown in the table reflect fee waivers in effect. The expenses shown in the table assume reinvestment of all dividends and distributions.
Expense Analysis of an Investment of $1,000
| | Beginning
Account
Value
7/1/07 | | Ending
Account
Value
12/31/07 | | Annualized
Expense
Ratios | | Expenses
Paid During
Period
7/1/07 to
12/31/07* | |
Actual Series Return | | | | | | | | | |
Standard Class | | $ | 1,000.00 | | $ | 908.90 | | 0.68 | % | $ | 3.27 | |
Service Class | | 1,000.00 | | 907.90 | | 0.93 | % | 4.47 | |
Hypothetical 5% Return (5% return before expenses) | | | | | | | | | |
Standard Class | | $ | 1,000.00 | | $ | 1,021.78 | | 0.68 | % | $ | 3.47 | |
Service Class | | 1,000.00 | | 1,020.52 | | 0.93 | % | 4.74 | |
* “Expenses Paid During Period” are equal to the Series’ annualized expense ratio, multiplied by the average account value over the period, multiplied by 184/365 (to reflect the one-half year period).
3
Delaware VIP Trust — Delaware VIP Value Series
Sector Allocation and Top 10 Holdings
As of December 31, 2007
Sector designations may be different than the sector designations presented in other Series materials.
Sector | | Percentage
of Net Assets | |
Common Stock | | 98.92 | % |
Consumer Discretionary | | 8.85 | % |
Consumer Staples | | 12.09 | % |
Energy | | 6.48 | % |
Financials | | 22.60 | % |
Health Care | | 17.72 | % |
Industrials | | 5.99 | % |
Information Technology | | 12.64 | % |
Materials | | 2.98 | % |
Telecommunications | | 6.66 | % |
Utilities | | 2.91 | % |
Discount Note | | 0.91 | % |
Securities Lending Collateral | | 6.86 | % |
Total Value of Securities | | 106.69 | % |
Obligation to Return Securities Lending Collateral | | (6.86 | )% |
Receivables and Other Assets Net of Liabilities | | 0.17 | % |
Total Net Assets | | 100.00 | % |
Holdings are for informational purposes only and are subject to change at any time. They are not a recommendation to buy, sell, or hold any security.
Top 10 Holdings | | Percentage
of Net Assets | |
AT&T | | 3.41 | % |
ConocoPhillips | | 3.30 | % |
Gap | | 3.27 | % |
Verizon Communications | | 3.25 | % |
Allstate | | 3.24 | % |
International Business Machines | | 3.22 | % |
Safeway | | 3.18 | % |
Donnelley (R.R.) & Sons | | 3.17 | % |
Chevron | | 3.17 | % |
Motorola | | 3.17 | % |
4
Delaware VIP Trust — Delaware VIP Value Series
Statement of Net Assets
December 31, 2007
| | Number of
Shares | | Value | |
| COMMON STOCK–98.92% | | | | | |
| Consumer Discretionary–8.85% | | | | | |
| Gap | | 929,300 | | $ | 19,775,504 | |
* | Limited Brands | | 893,800 | | 16,919,634 | |
| Mattel | | 882,800 | | 16,808,512 | |
| | | | | 53,503,650 | |
| Consumer Staples–12.09% | | | | | |
| Heinz (H.J.) | | 392,000 | | 18,298,560 | |
* | Kimberly-Clark | | 260,800 | | 18,083,872 | |
| Kraft Foods Class A | | 537,000 | | 17,522,310 | |
| Safeway | | 562,200 | | 19,232,862 | |
| | | | | 73,137,604 | |
| Energy–6.48% | | | | | |
| Chevron | | 205,500 | | 19,179,315 | |
| ConocoPhillips | | 226,400 | | 19,991,120 | |
| | | | | 39,170,435 | |
| Financials–22.60% | | | | | |
| Allstate | | 374,700 | | 19,570,581 | |
| Chubb | | 341,500 | | 18,639,070 | |
| Discover Financial Services | | 1,062,800 | | 16,027,024 | |
| Hartford Financial Services Group | | 201,000 | | 17,525,190 | |
| Huntington Bancshares | | 1,172,300 | | 17,303,148 | |
| Morgan Stanley | | 342,200 | | 18,174,242 | |
| Wachovia | | 471,000 | | 17,912,130 | |
* | Washington Mutual | | 847,300 | | 11,531,753 | |
| | | | | 136,683,138 | |
| Health Care–17.72% | | | | | |
| Abbott Laboratories | | 321,900 | | 18,074,685 | |
| Baxter International | | 311,800 | | 18,099,990 | |
| Bristol-Myers Squibb | | 692,900 | | 18,375,708 | |
| Johnson & Johnson | | 262,400 | | 17,502,080 | |
| Pfizer | | 817,500 | | 18,581,775 | |
| Wyeth | | 374,700 | | 16,557,993 | |
| | | | | 107,192,231 | |
| Industrials–5.99% | | | | | |
| Donnelley (R.R.) & Sons | | 508,200 | | 19,179,468 | |
| Waste Management | | 521,600 | | 17,040,672 | |
| | | | | 36,220,140 | |
| Information Technology–12.64% | | | | | |
| Intel | | 715,400 | | $ | 19,072,564 | |
* | International Business Machines | | 180,400 | | 19,501,240 | |
| Motorola | | 1,195,500 | | 19,175,820 | |
| Xerox | | 1,156,700 | | 18,726,973 | |
| | | | | 76,476,597 | |
| Materials–2.98% | | | | | |
| duPont (E.I.) deNemours | | 409,100 | | 18,037,219 | |
| | | | | 18,037,219 | |
| Telecommunications–6.66% | | | | | |
| AT&T | | 496,324 | | 20,627,225 | |
| Verizon Communications | | 450,400 | | 19,677,976 | |
| | | | | 40,305,201 | |
| Utilities–2.91% | | | | | |
| Progress Energy | | 364,000 | | 17,628,520 | |
| | | | | 17,628,520 | |
| Total Common Stock
(cost $550,234,500) | | | | 598,354,735 | |
| | | Principal
Amount | | | |
| | | | | | |
¹ | DISCOUNT NOTE – 0.91% | | | | | |
| Federal Home Loan Bank 3.25% 1/2/08 | | $ | 5,533,999 | | 5,533,505 | |
| Total Discount Note
(cost $5,533,505) | | | | 5,533,505 | |
| | | | | | |
| Total Value of Securities Before Securities Lending Collateral–99.83%
(cost $555,768,005) | | | | 603,888,240 | |
| | | | | | | |
| | | Number of
Shares | | | |
| | | | | | |
| SECURITIES LENDING COLLATERAL**–6.86% | | | | | |
| Investment Companies | | | | | |
| Mellon GSL DBT II Collateral Fund | | 41,465,400 | | 41,465,400 | |
| Total Securities Lending Collateral
(cost $41,465,400) | | | | 41,465,400 | |
5
TOTAL VALUE OF SECURITIES–106.69% (cost $597,233,405) | | $ | 645,353,640 | © |
OBLIGATION TO RETURN SECURITIES LENDING COLLATERAL**–(6.86%) | | (41,465,400 | ) |
RECEIVABLES AND OTHER ASSETS NET OF LIABILITIES–0.17% | | 1,004,958 | |
NET ASSETS APPLICABLE TO 28,234,048 SHARES OUTSTANDING–100.00% | | $ | 604,893,198 | |
NET ASSET VALUE–DELAWARE VIP VALUE SERIES STANDARD CLASS
($427,011,037 / 19,918,478 Shares) | | $ | 21.44 | |
NET ASSET VALUE–DELAWARE VIP VALUE SERIES SERVICE CLASS
($177,882,161 / 8,315,570 Shares) | | $ | 21.39 | |
COMPONENTS OF NET ASSETS AT DECEMBER 31, 2007: | | | |
Shares of beneficial interest (unlimited authorization–no par) | | $ | 506,967,927 | |
Undistributed net investment income | | 13,561,903 | |
Accumulated net realized gain on investments | | 36,243,133 | |
Net unrealized appreciation of investments | | 48,120,235 | |
Total net assets | | $ | 604,893,198 | |
* | Fully or partially on loan. |
** | See Note 8 in “Notes to Financial Statements.” |
© | Includes $57,862,764 of securities loaned. |
¹ | The rate shown is the effective yield at the time of purchase. |
See accompanying notes
6
Delaware VIP Trust — Delaware VIP Value Series
Statement of Operations
Year Ended December 31, 2007
INVESTMENT INCOME: | | | |
Dividends | | $ | 18,142,759 | |
Interest | | 457,851 | |
Securities lending income | | 114,158 | |
| | 18,714,768 | |
| | | |
EXPENSES: | | | |
Management fees | | 4,314,592 | |
Distribution expenses – Service Class | | 524,216 | |
Accounting and administration expenses | | 270,940 | |
Legal fees | | 83,380 | |
Reports and statements to shareholders | | 82,196 | |
Dividend disbursing and transfer agent fees and expenses | | 76,577 | |
Audit and tax | | 43,865 | |
Trustees’ fees | | 31,913 | |
Custodian fees | | 17,744 | |
Insurance fees | | 16,385 | |
Consulting fees | | 12,199 | |
Trustees’ expenses | | 4,002 | |
Dues and services | | 3,179 | |
Pricing fees | | 370 | |
| | 5,481,558 | |
Less management fees waived | | (250,000 | ) |
Less waiver of distribution expenses – Service Class | | (87,369 | ) |
Less expense paid indirectly | | (2,104 | ) |
Total operating expenses | | 5,142,085 | |
| | | |
NET INVESTMENT INCOME | | 13,572,683 | |
| | | |
NET REALIZED AND UNREALIZED GAIN (LOSS) ON INVESTMENTS: | | | |
Net realized gain on investments | | 40,805,307 | |
Net change in unrealized appreciation/depreciation of investments | | (72,725,905 | ) |
| | | |
NET REALIZED AND UNREALIZED LOSS ON INVESTMENTS | | (31,920,598 | ) |
| | | |
NET DECREASE IN NET ASSETS RESULTING FROM OPERATIONS | | $ | (18,347,915 | ) |
See accompanying notes
Delaware VIP Trust — Delaware VIP Value Series
Statements of Changes in Net Assets
| | Year Ended | |
| | 12/31/07 | | 12/31/06 | |
INCREASE (DECREASE) IN NET ASSETS FROM OPERATIONS: | | | | | |
Net investment income | | $ | 13,572,683 | | $ | 10,437,467 | |
Net realized gain on investments | | 40,805,307 | | 18,468,335 | |
Net change in unrealized appreciation/depreciation of investments | | (72,725,905 | ) | 83,021,350 | |
Net increase (decrease) in net assets resulting from operations | | (18,347,915 | ) | 111,927,152 | |
| | | | | |
DIVIDENDS AND DISTRIBUTIONS TO SHAREHOLDERS FROM: | | | | | |
Net investment income: | | | | | |
Standard Class | | (8,265,695 | ) | (6,076,791 | ) |
Service Class | | (2,192,836 | ) | (1,195,237 | ) |
Net realized gain on investments: | | | | | |
Standard Class | | (13,046,395 | ) | (8,040,632 | ) |
Service Class | | (4,027,094 | ) | (1,846,025 | ) |
| | (27,532,020 | ) | (17,158,685 | ) |
| | | | | |
CAPITAL SHARE TRANSACTIONS: | | | | | |
Proceeds from shares sold: | | | | | |
Standard Class | | 118,656,212 | | 228,533,309 | |
Service Class | | 81,713,936 | | 65,252,069 | |
Net asset value of shares issued upon reinvestment of dividends and distributions: | | | | | |
Standard Class | | 21,312,090 | | 14,117,423 | |
Service Class | | 6,219,930 | | 3,041,262 | |
| | 227,902,168 | | 310,944,063 | |
Cost of shares repurchased: | | | | | |
Standard Class | | (177,513,591 | ) | (169,612,666 | ) |
Service Class | | (40,545,911 | ) | (20,390,780 | ) |
| | (218,059,502 | ) | (190,003,446 | ) |
Increase in net assets derived from capital share transactions | | 9,842,666 | | 120,940,617 | |
| | | | | |
NET INCREASE (DECREASE) IN NET ASSETS | | (36,037,269 | ) | 215,709,084 | |
| | | | | |
NET ASSETS: | | | | | |
Beginning of year | | 640,930,467 | | 425,221,383 | |
End of year (including undistributed net investment income of $13,561,903 and $10,435,756, respectively) | | $ | 604,893,198 | | $ | 640,930,467 | |
See accompanying notes
7
Delaware VIP Trust — Delaware VIP Value Series
Financial Highlights
Selected data for each share of the Series outstanding throughout each period were as follows:
| | Delaware VIP Value Series Standard Class | |
| | Year Ended | |
| | 12/31/07 | | 12/31/06 | | 12/31/05 | | 12/31/04 | | 12/31/03 | |
| | | | | | | | | | | |
Net asset value, beginning of period | | $ | 22.980 | | $ | 19.230 | | $ | 18.460 | | $ | 16.330 | | $ | 13.000 | |
| | | | | | | | | | | |
Income (loss) from investment operations: | | | | | | | | | | | |
Net investment income(1) | | 0.472 | | 0.437 | | 0.369 | | 0.313 | | 0.265 | |
Net realized and unrealized gain (loss) on investments and foreign currencies | | (1.058 | ) | 4.075 | | 0.722 | | 2.082 | | 3.337 | |
Total from investment operations | | (0.586 | ) | 4.512 | | 1.091 | | 2.395 | | 3.602 | |
| | | | | | | | | | | |
Less dividends and distributions from: | | | | | | | | | | | |
Net investment income | | (0.370 | ) | (0.328 | ) | (0.321 | ) | (0.265 | ) | (0.272 | ) |
Net realized gain on investments | | (0.584 | ) | (0.434 | ) | — | | — | | — | |
Total dividends and distributions | | (0.954 | ) | (0.762 | ) | (0.321 | ) | (0.265 | ) | (0.272 | ) |
| | | | | | | | | | | |
Net asset value, end of period | | $ | 21.440 | | $ | 22.980 | | $ | 19.230 | | $ | 18.460 | | $ | 16.330 | |
| | | | | | | | | | | |
Total return(2) | | (2.72 | )% | 24.10 | % | 6.03 | % | 14.93 | % | 28.29 | % |
| | | | | | | | | | | |
Ratios and supplemental data: | | | | | | | | | | | |
Net assets, end of period (000 omitted) | | $ | 427,011 | | $ | 497,525 | | $ | 349,443 | | $ | 310,704 | | $ | 302,266 | |
Ratio of expenses to average net assets | | 0.69 | % | 0.72 | % | 0.73 | % | 0.70 | % | 0.70 | % |
Ratio of expenses to average net assets prior to expense limitation and expenses paid indirectly | | 0.73 | % | 0.77 | % | 0.78 | % | 0.75 | % | 0.75 | % |
Ratio of net investment income to average net assets | | 2.07 | % | 2.12 | % | 1.98 | % | 1.87 | % | 1.88 | % |
Ratio of net investment income to average net assets prior to expense limitation and expenses paid indirectly | | 2.03 | % | 2.07 | % | 1.93 | % | 1.82 | % | 1.83 | % |
Portfolio turnover | | 29 | % | 14 | % | 23 | % | 124 | % | 79 | % |
(1) The average shares outstanding method has been applied for per share information.
(2) Total investment return is based on the change in net asset value of a share during the period and assumes reinvestment of dividends and distributions at net asset value. Total investment return reflects a waiver by the manager. Performance would have been lower had the waiver not been in effect.
See accompanying notes
8
Selected data for each share of the Series outstanding throughout each period were as follows:
| | Delaware VIP Value Series Service Class | |
| | Year Ended | |
| | 12/31/07 | | 12/31/06 | | 12/31/05 | | 12/31/04 | | 12/31/03 | |
| | | | | | | | | | | |
Net asset value, beginning of period | | $ | 22.940 | | $ | 19.200 | | $ | 18.430 | | $ | 16.320 | | $ | 12.990 | |
| | | | | | | | | | | |
Income (loss) from investment operations: | | | | | | | | | | | |
Net investment income(1) | | 0.415 | | 0.385 | | 0.323 | | 0.271 | | 0.233 | |
Net realized and unrealized gain (loss) on investments and foreign currencies | | (1.063 | ) | 4.070 | | 0.726 | | 2.072 | | 3.348 | |
Total from investment operations | | (0.648 | ) | 4.455 | | 1.049 | | 2.343 | | 3.581 | |
| | | | | | | | | | | |
Less dividends and distributions from: | | | | | | | | | | | |
Net investment income | | (0.318 | ) | (0.281 | ) | (0.279 | ) | (0.233 | ) | (0.251 | ) |
Net realized gain on investments | | (0.584 | ) | (0.434 | ) | — | | — | | — | |
Total dividends and distributions | | (0.902 | ) | (0.715 | ) | (0.279 | ) | (0.233 | ) | (0.251 | ) |
| | | | | | | | | | | |
Net asset value, end of period | | $ | 21.390 | | $ | 22.940 | | $ | 19.200 | | $ | 18.430 | | $ | 16.320 | |
| | | | | | | | | | | |
Total return(2) | | (3.00 | )% | 23.79 | % | 5.79 | % | 14.59 | % | 28.10 | % |
| | | | | | | | | | | |
Ratios and supplemental data: | | | | | | | | | | | |
Net assets, end of period (000 omitted) | | $ | 177,882 | | $ | 143,405 | | $ | 75,778 | | $ | 33,642 | | $ | 14,737 | |
Ratio of expenses to average net assets | | 0.94 | % | 0.97 | % | 0.98 | % | 0.95 | % | 0.92 | % |
Ratio of expenses to average net assets prior to expense limitation and expenses paid indirectly | | 1.03 | % | 1.07 | % | 1.08 | % | 1.05 | % | 1.00 | % |
Ratio of net investment income to average net assets | | 1.82 | % | 1.87 | % | 1.73 | % | 1.62 | % | 1.66 | % |
Ratio of net investment income to average net assets prior to expense limitation and expenses paid indirectly | | 1.73 | % | 1.77 | % | 1.63 | % | 1.52 | % | 1.58 | % |
Portfolio turnover | | 29 | % | 14 | % | 23 | % | 124 | % | 79 | % |
(1) The average shares outstanding method has been applied for per share information.
(2) Total investment return is based on the change in net asset value of a share during the period and assumes reinvestment of dividends and distributions at net asset value. Total investment return reflects a waiver by the manager and distributor. Performance would have been lower had the waiver not been in effect.
See accompanying notes
9
Delaware VIP Trust — Delaware VIP Value Series
Notes to Financial Statements
December 31, 2007
Delaware VIP Trust (Trust) is organized as a Delaware statutory trust and offers 14 series: Delaware VIP Balanced Series, Delaware VIP Capital Reserves Series, Delaware VIP Cash Reserve Series, Delaware VIP Diversified Income Series, Delaware VIP Emerging Markets Series, Delaware VIP Growth Opportunities Series, Delaware VIP High Yield Series, Delaware VIP International Value Equity Series, Delaware VIP REIT Series, Delaware VIP Select Growth Series, Delaware VIP Small Cap Value Series, Delaware VIP Trend Series, Delaware VIP U.S. Growth Series and Delaware VIP Value Series. These financial statements and the related notes pertain to Delaware VIP Value Series (Series). The Trust is an open-end investment company. The Series is considered diversified under the Investment Company Act of 1940, as amended, and offers Standard Class and Service Class shares. The Standard Class shares do not carry a 12b-1 fee and the Service Class shares carry a 12b-1 fee. The shares of the Series are sold only to separate accounts of life insurance companies.
The investment objective of the Series is to seek long-term capital appreciation.
1. Significant Accounting Policies
The following accounting policies are in accordance with U.S. generally accepted accounting principles and are consistently followed by the Series.
Security Valuation—Equity securities, except those traded on the Nasdaq Stock Market, Inc. (Nasdaq), are valued at the last quoted sales price as of the time of the regular close of the New York Stock Exchange (NYSE) on the valuation date. Securities traded on the Nasdaq are valued in accordance with the Nasdaq Official Closing Price, which may not be the last sales price. If on a particular day an equity security does not trade, then the mean between the bid and asked prices will be used. Short-term debt securities having less than 60 days to maturity are valued at amortized cost, which approximates market value. Securities lending collateral, which is invested in a collective investment vehicle, is valued at unit value per share. Other securities and assets for which market quotations are not readily available are valued at fair value as determined in good faith under the direction of the Series’ Board of Trustees. In determining whether market quotations are readily available or fair valuation will be used, various factors will be taken into consideration, such as market closures, or with respect to foreign securities, aftermarket trading, or significant events after local market trading (e.g., government actions or pronouncements, trading volume or volatility on markets, exchanges among dealers, or news events).
In September 2006, the Financial Accounting Standards Board (FASB) issued FASB Statement No. 157 “Fair Value Measurements” (Statement 157). Statement 157 establishes a framework for measuring fair value in U.S. generally accepted accounting principles, clarifies the definition of fair value within that framework, and expands disclosures about the use of fair value measurements. Statement 157 is intended to increase consistency and comparability among fair value estimates used in financial reporting. Statement 157 is effective for fiscal years beginning after November 15, 2007. Management does not expect the adoption of Statement 157 to have a material impact on the amounts reported in the financial statements.
Federal Income Taxes—The Series intends to continue to qualify for federal income tax purposes as a regulated investment company under Subchapter M of the Internal Revenue Code of 1986, as amended, and make the requisite distributions to shareholders. Accordingly, no provision for federal income taxes has been made in the financial statements.
Effective June 29, 2007, the Series adopted FASB Interpretation No. 48 “Accounting for Uncertainty in Income Taxes” (FIN 48). FIN 48 provides guidance for how uncertain tax positions should be recognized, measured, presented and disclosed in the financial statements. FIN 48 requires the evaluation of tax positions taken or expected to be taken in the course of preparing the Series’ tax returns to determine whether the tax positions are “more-likely-than-not” of being sustained by the applicable tax authority. Tax positions not deemed to meet the more-likely-than-not threshold are recorded as a tax benefit or expense in the current year. The adoption of FIN 48 did not result in the recording of any tax benefit or expense in the current period.
Class Accounting—Investment income, common expenses and realized and unrealized gain (loss) on investments are allocated to the classes of the Series on the basis of daily net assets of each class. Distribution expenses relating to a specific class are charged directly to that class.
Repurchase Agreements—The Series may invest in a pooled cash account along with members of the Delaware Investments® Family of Funds pursuant to an exemptive order issued by the Securities and Exchange Commission. The aggregate daily balance of the pooled cash account is invested in repurchase agreements secured by obligations of the U.S. government. The respective collateral is held by the Series’ custodian bank until the maturity of the respective repurchase agreements. Each repurchase agreement is at least 102% collateralized. However, in the event of default or bankruptcy by the counterparty to the agreement, realization of the collateral may be subject to legal proceedings. At December 31, 2007, the Series held no investments in repurchase agreements.
Use of Estimates—The preparation of financial statements in conformity with U.S. generally accepted accounting principles requires management to make estimates and assumptions that affect the reported amounts of assets and liabilities at the date of the financial statements and the reported amounts of revenues and expenses during the reporting period. Actual results could differ from those estimates.
Other—Expenses directly attributable to the Series are charged directly to the Series. Other expenses common to various funds within the Delaware Investments® Family of Funds are generally allocated amongst such funds on the basis of average net assets. Management fees and some other expenses are paid monthly. Security transactions are recorded on the date the securities are purchased or sold (trade date) for financial reporting purposes. Costs used in calculating realized gains and losses on the sale of investment securities are those of the specific securities sold. Dividend income is recorded on the ex-dividend date and interest income is recorded on the accrual basis.
The Series declares and pays dividends from net investment income and distributions from net realized gain on investments, if any, following the close of the fiscal year.
10
Delaware VIP Value Series
Notes to Financial Statements (continued)
1. Significant Accounting Policies (continued)
Subject to seeking best execution, the Series may direct certain security trades to brokers who have agreed to rebate a portion of the related brokerage commission to the Series in cash. Such commission rebates are included in realized gain on investments in the accompanying financial statements and totaled $1,089 for the year ended December 31, 2007. In general, best execution refers to many factors, including the price paid or received for a security, the commission charged, the promptness and reliability of execution, the confidentiality and placement accorded the order, and other factors affecting the overall benefit obtained by the Series on the transaction.
The Series receives earnings credits from its custodian when positive cash balances are maintained, which are used to offset custody fees. The expense paid under this arrangement is included in custodian fees on the Statement of Operations with the corresponding expense offset shown as “expense paid indirectly.”
2. Investment Management, Administration Agreements and Other Transactions with Affiliates
In accordance with the terms of its investment management agreement, the Series pays Delaware Management Company (DMC), a series of Delaware Management Business Trust and the investment manager, an annual fee which is calculated daily at the rate of 0.65% on the first $500 million of average daily net assets of the Series, 0.60% on the next $500 million, 0.55% on the next $1.5 billion, and 0.50% on average daily net assets in excess of $2.5 billion.
Prior to May 1, 2007, DMC had also contractually agreed to waive that portion, if any, of its management fee and reimburse the Series to the extent necessary to ensure that total annual operating expenses, exclusive of taxes, interest, brokerage fees, 12b-1 plan expenses, certain insurance costs and non-routine expenses or costs including, but not limited to those relating to reorganizations, litigation, conducting shareholder meetings, and liquidations, did not exceed 0.86% of average daily net assets of the Series. No reimbursement was due for the year ended December 31, 2007 under the limitation agreement. DMC has voluntarily agreed to waive management fees in the amount of 0.05% on the first $500 million of average daily net assets until such time as the waiver is discontinued. The waiver may be discontinued at any time because it is voluntary.
Effective October 1, 2007, Delaware Service Company, Inc. (DSC), an affiliate of DMC, provides fund accounting and financial administration oversight services to the Series. For these services, the Series pays DSC fees based on the aggregate daily net assets of the Delaware Investments® Family of Funds at the following annual rate: 0.0050% of the first $30 billion; 0.0045% of the next $10 billion; 0.0040% of the next $10 billion; and 0.0025% of aggregate average daily net assets in excess of $50 billion. The fees payable to DSC under the service agreement described above are allocated among all funds in the Delaware Investments® Family of Funds on a relative net asset value basis. Prior to October 1, 2007, DSC provided fund accounting and administrative services to the Series and received a fee at an annual rate of 0.04% of average daily net assets. For the year ended December 31, 2007, the Series was charged $213,490 for these services.
DSC also provides dividend disbursing and transfer agency services. The Series pays DSC a monthly fee based on the number of shareholder accounts for dividend disbursing and transfer agent services.
Pursuant to a distribution agreement and distribution plan, the Series pays Delaware Distributors, L.P. (DDLP), the distributor and an affiliate of DMC, an annual distribution and service fee not to exceed 0.30% of the average daily net assets of the Service Class shares. DDLP has contracted to waive distribution and service fees through April 30, 2008 in order to prevent distribution and service fees of the Service Class shares from exceeding 0.25% of average daily net assets. Standard Class shares pay no distribution and service expenses.
At December 31, 2007, the Series had liabilities payable to affiliates as follows:
Investment
Management
Fee Payable to
DMC | | Dividend Disbursing,
Transfer Agent
Fees and Other Expenses
Payable to DSC | | Distribution
Fees Payable
To DDLP | | Other
Expenses
Payable
to DMC
and Affiliates* | |
$ | 313,187 | | $ | 10,243 | | $ | 38,234 | | $ | 31,695 | |
| | | | | | | | | | | |
*DMC, as part of its administrative services, pays operating expenses on behalf of the Series and is reimbursed on a periodic basis. Such expenses include items such as printing of shareholder reports, fees for audit, legal and tax services, custodian fees and trustees’ fees.
As provided in the investment management agreement, the Series bears the cost of certain legal and tax services, including internal legal and tax services provided to the Series by DMC and/or its affiliates’ employees. For the year ended December 31, 2007, the Series was charged $35,887 for internal legal and tax services provided by DMC and/or its affiliates’ employees.
Trustees’ fees include expenses accrued by the Series for each Trustee’s retainer and per meeting fees. Certain officers of DMC, DSC and DDLP are officers and/or Trustees of the Trust. These officers and Trustees are paid no compensation by the Series.
11
Delaware VIP Value Series
Notes to Financial Statements (continued)
3. Investments
For the year ended December 31, 2007, the Series made purchases and sales of investment securities other than short-term investments as follows:
Purchases | | $ | 191,780,475 | |
Sales | | 189,279,595 | |
At December 31, 2007, the cost of investments for federal income tax purposes and unrealized appreciation (depreciation) for the Series were as follows:
Cost of
Investments | | Aggregate
Unrealized
Appreciation | | Aggregate
Unrealized
Depreciation | | Net Unrealized
Appreciation | |
$ | 598,631,595 | | $ | 96,124,630 | | $ | (49,402,585 | ) | $ | 46,722,045 | |
| | | | | | | | | | | |
4. Dividend and Distribution Information
Income and long-term capital gain distributions are determined in accordance with federal income tax regulations, which may differ from U.S. generally accepted accounting principles. Additionally, net short-term gains on sales of investment securities are treated as ordinary income for federal income tax purposes. The tax character of dividends and distributions paid during the years ended December 31, 2007 and 2006 was as follows:
| | Year
Ended
12/31/07 | | Year
Ended
12/31/06 | |
Ordinary income | | $ | 12,066,479 | | $ | 7,279,764 | |
Long-term capital gain | | 15,465,541 | | 9,878,921 | |
| | $ | 27,532,020 | | $ | 17,158,685 | |
5. Components of Net Assets on a Tax Basis
As of December 31, 2007, the components of net assets on a tax basis were as follows:
Shares of beneficial interest | | $ | 506,967,927 | |
Undistributed ordinary income | | 22,199,029 | |
Undistributed long-term capital gains | | 31,581,839 | |
*Capital loss carryforwards | | (2,577,642 | ) |
Unrealized appreciation of investments | | 46,722,045 | |
Net assets | | $ | 604,893,198 | |
The differences between book basis and tax basis components of net assets are primarily attributable to tax deferral of losses on wash sales and the limitation of capital loss carryforward in accordance with the Internal Revenue Code due to the fund merger with Delaware VIP Devon Series in 2003.
For financial reporting purposes, capital accounts are adjusted to reflect the tax character of permanent book/tax differences. Reclassifications are primarily due to tax treatment of dividends and distributions. Results of operations and net assets were not affected by these reclassifications. For the year ended December 31, 2007, the Series recorded the following reclassifications:
Undistributed
Net
Investment Income | | Accumulated
Net Realized
Gain | |
$ | 11,995 | | $ | (11,995 | ) |
| | | | | |
For federal income tax purposes, capital loss carryforwards may be carried forward and applied against future capital gains. $859,214 was utilized in 2007. Capital loss carryforwards remaining at December 31, 2007 will expire as follows: $1,097,656 expires in 2009 and $1,479,986 expires in 2010.
*The amount of this loss which can be utilized in subsequent years is subject to an annual limitation in accordance with the Internal Revenue Code due to the fund merger with Delaware VIP Devon Series in 2003.
12
Delaware VIP Value Series
Notes to Financial Statements (continued)
6. Capital Shares
Transactions in capital shares were as follows:
| | Year
Ended
12/31/07 | | Year
Ended
12/31/06 | |
Shares sold: | | | | | |
Standard Class | | 5,186,575 | | 11,365,108 | |
Service Class | | 3,572,443 | | 3,147,358 | |
| | | | | |
Shares issued upon reinvestment of dividends and distributions: | | | | | |
Standard Class | | 952,709 | | 713,001 | |
Service Class | | 278,172 | | 153,599 | |
| | 9,989,899 | | 15,379,066 | |
Shares repurchased: | | | | | |
Standard Class | | (7,867,280 | ) | (8,598,802 | ) |
Service Class | | (1,786,092 | ) | (996,179 | ) |
| | (9,653,372 | ) | (9,594,981 | ) |
Net increase | | 336,527 | | 5,784,085 | |
7. Line of Credit
The Series, along with certain other funds in the Delaware Investments® Family of Funds (Participants), participates in a $225,000,000 revolving line of credit facility to be used for temporary or emergency purposes as an additional source of liquidity to fund redemptions of investor shares. The Participants are charged an annual commitment fee, which is allocated across the Participants on the basis of each fund’s allocation of the entire facility. The Participants may borrow up to a maximum of one third of their net assets under the agreement. The Series had no amounts outstanding as of December 31, 2007, or at any time during the year then ended.
8. Securities Lending
The Series, along with other funds in the Delaware Investments® Family of Funds, may lend its securities pursuant to a security lending agreement (Lending Agreement) with Mellon Bank, N.A. (Mellon). With respect to each loan, if the aggregate market value of the collateral held on any business day is less than the aggregate market value of the securities which are the subject of such loan, the borrower will be notified to provide additional collateral not less than the applicable collateral requirements. Cash collateral received is invested in a collective investment vehicle (Collective Trust) established by Mellon for the purpose of investment on behalf of clients participating in its securities lending programs. The Collective Trust invests in fixed income securities, with a weighted average maturity not to exceed 90 days, rated in one of the top two tiers by Standard & Poor’s Ratings Group or Moody’s Investors Service, Inc. or repurchase agreements collateralized by such securities. However, in the event of default or bankruptcy by the lending agent, realization and/or retention of the collateral may be subject to legal proceedings. In the event the borrower fails to return loaned securities and the collateral received is insufficient to cover the value of the loaned securities and provided such collateral shortfall is not the result of investment losses, the lending agent has agreed to pay the amount of the shortfall to the Series, or at the discretion of the lending agent, replace the loaned securities. The Series continues to record dividends or interest, as applicable, on the securities loaned and is subject to change in value of the securities loaned that may occur during the term of the loan. The Series has the right under the Lending Agreement to recover the securities from the borrower on demand. With respect to security loans collateralized by U.S. Treasury obligations, the Series receives a fee from the securities lending agent. With respect to security loans collateralized by cash collateral, the earnings from the collateral investments are shared among the Series, the security lending agent and the borrower. The Series records securities lending income net of allocations to the security lending agent and the borrower.
At December 31, 2007, the market value of the securities on loan was $57,862,764, for which the Series received collateral, comprised of U.S. government obligations valued at $18,777,600, and cash collateral of $41,465,400. Investments purchased with cash collateral are presented on the Statement of Net Assets under the caption “Securities Lending Collateral.”
9. Credit and Market Risk
The Series may invest up to 10% of its net assets in illiquid securities, which may include securities with contractual restrictions on resale, securities exempt from registration under Rule 144A of the Securities Act of 1933, as amended, and other securities which may not be readily marketable. The relative illiquidity of these securities may impair the Series from disposing of them in a timely manner and at a fair price when it is necessary or desirable to do so. While maintaining oversight, the Series’ Board of Trustees has delegated to DMC the day-to-day functions of determining whether individual securities are liquid for purposes of the Series’ limitation on investments in illiquid assets. As of December 31, 2007, there were no Rule 144A securities and no securities have been determined to be illiquid under the Series’ Liquidity Procedures.
10. Contractual Obligations
The Series enters into contracts in the normal course of business that contain a variety of indemnifications. The Series’ maximum exposure under these arrangements is unknown. However, the Series has not had prior claims or losses pursuant to these contracts. Management has reviewed the Series’ existing contracts and expects the risk of loss to be remote.
13
Delaware VIP Value Series
Notes to Financial Statements (continued)
11. Tax Information (Unaudited)
For the fiscal year ended December 31, 2007, the Series designates dividends and distributions paid during the year as follows:
(A)
Long-Term
Capital Gain
Distributions
(Tax Basis) | | (B)
Ordinary
Income
Distributions
(Tax Basis) | | Total
Distributions
(Tax Basis) | | (C)
Qualifying
Dividends(1) | |
56 | % | 44 | % | 100 | % | 100 | % |
(A) and (B) are based on a percentage of the Series’ total distributions.
(C) is based on a percentage of the Series’ ordinary income distributions.
(1) Qualifying dividends represent dividends which qualify for the corporate dividends received deduction.
12. Change in Custodian
On August 2, 2007, Mellon, One Mellon Center, Pittsburgh, PA 15258, became the Series’ Custodian.
14
Delaware VIP Trust — Delaware VIP Value Series
Report of Independent Registered Public Accounting Firm
To the Shareholders and Board of Trustees
Delaware VIP Trust–Delaware VIP Value Series
We have audited the accompanying statement of net assets of the Delaware VIP Value Series (one of the series constituting Delaware VIP Trust) (the “Series”) as of December 31, 2007, and the related statement of operations for the year then ended, the statements of changes in net assets for each of the two years in the period then ended, and the financial highlights for each of the five years in the period then ended. These financial statements and financial highlights are the responsibility of the Series’ management. Our responsibility is to express an opinion on these financial statements and financial highlights based on our audits.
We conducted our audits in accordance with the standards of the Public Company Accounting Oversight Board (United States). Those standards require that we plan and perform the audit to obtain reasonable assurance about whether the financial statements and financial highlights are free of material misstatement. We were not engaged to perform an audit of the Series’ internal control over financial reporting. Our audits included consideration of internal control over financial reporting as a basis for designing audit procedures that are appropriate in the circumstances, but not for the purpose of expressing an opinion on the effectiveness of the Series’ internal control over financial reporting. Accordingly, we express no such opinion. An audit also includes examining, on a test basis, evidence supporting the amounts and disclosures in the financial statements and financial highlights, assessing the accounting principles used and significant estimates made by management, and evaluating the overall financial statement presentation. Our procedures included confirmation of securities owned as of December 31, 2007, by correspondence with the custodian. We believe that our audits provide a reasonable basis for our opinion.
In our opinion, the financial statements and financial highlights referred to above present fairly, in all material respects, the financial position of the Delaware VIP Value Series of Delaware VIP Trust at December 31, 2007, the results of its operations for the year then ended, the changes in its net assets for each of the two years in the period then ended, and its financial highlights for each of the five years in the period then ended, in conformity with U.S. generally accepted accounting principles.

Philadelphia, Pennsylvania
February 14, 2008
The Series files its complete schedule of portfolio holdings with the Securities and Exchange Commission (Commission) for the first and third quarters of each fiscal year on Form N-Q. The Series’ Forms N-Q, as well as a description of the policies and procedures that the Series uses to determine how to vote proxies (if any) relating to portfolio securities is available without charge (i) upon request, by calling 800 523-1918; and (ii) on the Commission’s website at http://www.sec.gov. In addition, a description of the policies and procedures that the Series uses to determine how to vote proxies (if any) relating to portfolio securities is available without charge on the Delaware Investments® Funds’ website at http://www.delawareinvestments.com. The Series’ Forms N-Q may be reviewed and copied at the Commission’s Public Reference Room in Washington, DC; information on the operation of the Public Reference Room may be obtained by calling 800 SEC-0330.
Information (if any) regarding how the Series voted proxies relating to portfolio securities during the most recently disclosed
12-month period ended June 30 is available without charge (i) through the Delaware Investments® Funds’ website at http://www.delawareinvestments.com; and (ii) on the Commission’s website at http://www.sec.gov.
15
Delaware Investments® Family of Funds
BOARD OF TRUSTEES/DIRECTORS AND OFFICERS ADDENDUM
A mutual fund is governed by a Board of Trustees/Directors (“Trustees”), which has oversight responsibility for the management of a fund’s business affairs. Trustees establish procedures and oversee and review the performance of the investment manager, the distributor, and others who perform services for the fund. The independent fund trustees, in particular, are advocates for shareholder interests. Each trustee has served in that capacity since he or she was elected to or appointed to the Board of Trustees, and will continue to serve until his or her retirement or the election of a new trustee in his or her place. The following is a list of the Trustees and Officers with certain background and related information.
Name,
Address,
and Birth Date | | Position(s)
Held with
Fund(s) | | Length of Time
Served | | Principal
Occupation(s)
During
Past 5 Years | | Number of
Portfolios in Fund
Complex Overseen
by Trustee
or Officer | | Other
Directorships
Held by
Trustee
or Officer |
INTERESTED TRUSTEES | | | | | | | |
| | | | | | | | | | |
Patrick P.Coyne (1)
2005 Market Street Philadelphia, PA 19103 April 1963 | | Chairman, President,
Chief Executive Officer, and Trustee | | Chairman and Trustee since August 16, 2006 President and Chief Executive Officer since August 1, 2006 | | Patrick P. Coyne has served in various executive capacities at different times at Delaware Investments.(2) | | 84 | | Director –
Kaydon Corp.
Board of Governors
Member –
Investment Company Institute (2007 – present)
Member of Investment Committee – Cradle of Liberty Council, BSA (November 2007 – present)
Finance Committee Member – St. John Vianney Roman Catholic Church (2007 – present) |
| | | | | | | | |
INDEPENDENT TRUSTEES | | | | | | | | |
| | | | | | | | |
Thomas L. Bennett
2005 Market Street Philadelphia, PA 19103 October 1947 | | Trustee | | Since March 2005 | | Private Investor – (March 2004 – Present) Investment Manager – Morgan Stanley & Co. (January 1984 – March 2004) | | 84 | | Director –
Bryn Mawr
Bank Corp. (BMTC) (April 2007 – Present) Chairman of Investment Committee – The Haverford School (2002 – present) Chairman of Investment Committee – Pennsylvania Academy of Fine Arts (2007 – present) Trustee (2004 – present) Investment Committee Member – Pennsylvania Horticulture Society (February 2006 – present) |
16
Name,
Address,
and Birth Date | | Position(s)
Held with
Fund(s) | | Length of Time
Served | | Principal
Occupation(s)
During
Past 5 Years | | Number of
Portfolios in Fund
Complex Overseen
by Trustee
or Officer | | Other
Directorships
Held by
Trustee
or Officer |
INTERESTED TRUSTEES | | | | | | | | |
| | | | | | | | |
John A. Fry
2005 Market Street Philadelphia, PA 19103 May 1960 | | Trustee | | Since January 2001 | | President – Franklin & Marshall College (June 2002 – Present) Executive Vice President – University of Pennsylvania (April 1995 – June 2002) | | 84 | | Director – Community Health Systems Director – Allied Barton Security Holdings |
| | | | | | | | | | |
Anthony D. Knerr
2005 Market Street Philadelphia, PA 19103 December 1938 | | Trustee | | Since April 1990 | | Founder and Managing Director – Anthony Knerr & Associates (Strategic Consulting) (1990 – Present) | | 84 | | None |
| | | | | | | | | | |
Lucinda S. Landreth
2005 Market Street Philadelphia, PA 19103 June 1947 | | Trustee | | Since March 2005 | | Chief Investment Officer – Assurant, Inc. (Insurance) (2002 – 2004) | | 84 | | None |
| | | | | | | | | | |
Ann R. Leven 2005
Market Street Philadelphia, PA 19103 November 1940 | | Trustee | | Since October 1989 | | Consultant – ARL Associates (Financial Planning) (1983 – Present) | | 84 | | Director and Audit Committee Member – Systemax, Inc. |
| | | | | | | | | | |
Thomas F. Madison
2005 Market Street Philadelphia, PA 19103 February 1936 | | Trustee | | Since
May 1997 | | President and Chief Executive Officer – MLM Partners, Inc. (Small Business Investing and Consulting) (January 1993 – Present) | | 84 | | Director – CenterPoint Energy Director and Audit Committee Member – Digital River, Inc. Director and Audit Committee Member – Rimage Corporation Director and Chair of Compensation and Governance & Nominating Committees – Valmont Industries, Inc. |
| | | | | | | | | | |
Janet L. Yeomans
2005 Market Street Philadelphia, PA 19103 July 1948 | | Trustee | | Since April 1999 | | Treasurer (January 2006 – Present) Vice President – Mergers & Acquisitions (January 2003 – January 2006), and Vice President (July 1995 – January 2003) 3M Corporation | | 84 | | None |
| | | | | | | | | | |
J. Richard Zecher 2005 Market Street Philadelphia, PA 19103 July 1940 | | Trustee | | Since March 2003 | | Founder – Investor Analytics (Risk Management) (May 1999 – Present) Founder – Sutton Asset Management (Hedge Fund) (September 1998 – Present) | | 84 | | Director and Audit Committee Member – Investor Analytics Director and Audit Committee Member – Oxigene, Inc. |
17
Name,
Address,
and Birth Date | | Position(s)
Held with
Fund(s) | | Length of Time
Served | | Principal
Occupation(s)
During
Past 5 Years | | Number of
Portfolios in Fund
Complex Overseen
by Trustee
or Officer | | Other
Directorships
Held by
Trustee
or Officer |
OFFICERS | | | | | | | | | | |
| | | | | | | | | | |
David F. Connor
2005 Market Street Philadelphia, PA 19103 December 1963 | | Vice President, Deputy General Counsel, and Secretary | | Vice President since September 21, 2000 and Secretary since October 2005 | | David F. Connor has served as Vice President and Deputy General Counsel of Delaware Investments since 2000. | | 84 | | None(4) |
| | | | | | | | | | |
Daniel V. Geatens
2005 Market Street Philadelphia, PA 19103 October 1972 | | Vice President and Treasurer | | Treasurer since October 25, 2007 | | Daniel V. Geatens has served in various capacities at different times at Delaware Investments. | | 84 | | None(4) |
| | | | | | | | | | |
David P. O’Connor
2005 Market Street Philadelphia, PA 19103 February 1966 | | Senior Vice President, General Counsel, and Chief Legal Officer | | Senior Vice President, General Counsel, and Chief Legal Officer since October 2005 | | David P. O’Connor has served in various executive and legal capacities at different times at Delaware Investments. | | 84 | | None(4) |
| | | | | | | | | | |
Richard Salus 2005 Market Street Philadelphia, PA 19103 October 1963 | | Senior Vice President and Chief Financial Officer | | Chief Financial Officer since November 1, 2006 | | Richard Salus has served in various executive capacities at different times at Delaware Investments. | | 84 | | None(4) |
(1) Patrick P. Coyne is considered to be an “Interested Trustee” because he is an executive officer of the Fund’s(s’) investment advisor.
(2) Delaware Investments is the marketing name for Delaware Management Holdings, Inc. and its subsidiaries, including the Fund’s(s’) investment advisor, principal underwriter, and its transfer agent.
(3) In 1997, several funds managed by Voyageur Fund Managers, Inc. (the “Voyageur Funds”) were incorporated into the Delaware Investments Family of Funds. Mr. Madison served as a director of the Voyageur Funds from 1993 until 1997.
(4) David F. Connor, Daniel V. Geatens, David P. O’Connor, and Richard Salus serve in similar capacities for the six portfolios of the Optimum Fund Trust, which have the same investment advisor, principal underwriter, and transfer agent as the registrant.
The Statement of Additional Information for the Fund(s) includes additional information about the Trustees and Officers and is available, without charge, upon request by calling 800 523-1918.
18
Item 2. Code of Ethics
The registrant has adopted a code of ethics that applies to the registrant’s principal executive officer, principal financial officer, principal accounting officer or controller, or persons performing similar functions, regardless of whether these individuals are employed by the registrant or a third party. A copy of the registrant’s Code of Business Ethics has been posted on Delaware Investments’ internet website at www.delawareinvestments.com. Any amendments to the Code of Business Ethics, and information on any waiver from its provisions granted by the registrant, will also be posted on this website within five business days of such amendment or waiver and will remain on the website for at least 12 months.
Item 3. Audit Committee Financial Expert
The registrant’s Board of Trustees/Directors has determined that each member of the registrant’s Audit Committee is an audit committee financial expert, as defined below. For purposes of this item, an “audit committee financial expert” is a person who has the following attributes:
a. An understanding of generally accepted accounting principles and financial statements;
b. The ability to assess the general application of such principles in connection with the accounting for estimates, accruals, and reserves;
c. Experience preparing, auditing, analyzing, or evaluating financial statements that present a breadth and level of complexity of accounting issues that are generally comparable to the breadth and complexity of issues that can reasonably be expected to be raised by the registrant’s financial statements, or experience actively supervising one or more persons engaged in such activities;
d. An understanding of internal controls and procedures for financial reporting; and
e. An understanding of audit committee functions.
An “audit committee financial expert” shall have acquired such attributes through:
a. Education and experience as a principal financial officer, principal accounting officer, controller, public accountant, or auditor or experience in one or more positions that involve the performance of similar functions;
b. Experience actively supervising a principal financial officer, principal accounting officer, controller, public accountant, auditor, or person performing similar functions;
c. Experience overseeing or assessing the performance of companies or public accountants with respect to the preparation, auditing, or evaluation of financial statements; or
d. Other relevant experience.
The registrant’s Board of Trustees/Directors has also determined that each member of the registrant’s Audit Committee is independent. In order to be “independent” for purposes of this item, the Audit Committee member may not: (i) other than in his or her capacity as a member of the Board of Trustees/Directors or any committee thereof, accept directly or indirectly any consulting, advisory or other compensatory fee from the issuer; or (ii) be an “interested person” of the registrant as defined in Section 2(a)(19) of the Investment Company Act of 1940.
The names of the audit committee financial experts on the registrant’s Audit Committee are set forth below:
Thomas L. Bennett (1)
Thomas F. Madison
Janet L. Yeomans (1)
J. Richard Zecher
Item 4. Principal Accountant Fees and Services
(a) Audit fees.
The aggregate fees billed for services provided to the registrant by its independent auditors for the audit of the registrant’s annual financial statements and for services normally provided by the independent auditors in connection with statutory and regulatory filings or engagements were $293,600 for the fiscal year ended December 31, 2007.
(1) The instructions to Form N-CSR require disclosure on the relevant experience of persons who qualify as audit committee financial experts based on “other relevant experience.” The Board of Trustees/Directors has determined that Mr. Bennett qualifies as an audit committee financial expert by virtue of his education, Chartered Financial Analyst designation, and his experience as a credit analyst, portfolio manager and the manager of other credit analysts and portfolio managers. The Board of Trustees/Directors has determined that Ms. Yeomans qualifies as an audit committee financial expert by virtue of her education and experience as the Treasurer of a large global corporation.
The aggregate fees billed for services provided to the registrant by its independent auditors for the audit of the registrant’s annual financial statements and for services normally provided by the independent auditors in connection with statutory and regulatory filings or engagements were $272,100 for the fiscal year ended December 31, 2006.
(b) Audit-related fees.
The aggregate fees billed by the registrant’s independent auditors for services relating to the performance of the audit of the registrant’s financial statements and not reported under paragraph (a) of this Item were $0 for the fiscal year ended December 31, 2007.
The aggregate fees billed by the registrant’s independent auditors for services relating to the performance of the audit of the financial statements of the registrant’s investment adviser and other service providers under common control with the adviser and that relate directly to the operations or financial reporting of the registrant were $19,074 for the registrant’s fiscal year ended December 31, 2007. The percentage of these fees relating to services approved by the registrant’s Audit Committee pursuant to the de minimis exception from the pre-approval requirement in Rule 2-01(c)(7)(i)(C) of Regulation S-X was 0%. These audit-related services were as follows: issuance of report concerning transfer agent’s system of internal accounting control pursuant to Rule 17Ad-13 of the Securities Exchange Act.
The aggregate fees billed by the registrant’s independent auditors for services relating to the performance of the audit of the registrant’s financial statements and not reported under paragraph (a) of this Item were $0 for the fiscal year ended December 31, 2006.
The aggregate fees billed by the registrant’s independent auditors for services relating to the performance of the audit of the financial statements of the registrant’s investment adviser and other service providers under common control with the adviser and that relate directly to the operations or financial reporting of the registrant were $28,700 for the registrant’s fiscal year ended December 31, 2006. The percentage of these fees relating to services approved by the registrant’s Audit Committee pursuant to the de minimis exception from the pre-approval requirement in Rule 2-01(c)(7)(i)(C) of Regulation S-X was 0%. These audit-related services were as follows: issuance of report concerning transfer agent’s system of internal accounting control pursuant to Rule 17Ad-13 of the Securities Exchange Act; and issuance of agreed upon procedures report to the registrant’s Board in connection with the pass-through of internal legal cost relating to the operations of the registrant.
(c) Tax fees.
The aggregate fees billed by the registrant’s independent auditors for tax-related services provided to the registrant were $109,901 for the fiscal year ended December 31, 2007. The percentage of these fees relating to services approved by the registrant’s Audit Committee pursuant to the de minimis exception from the pre-approval requirement in Rule 2-01(c)(7)(i)(C) of Regulation S-X was 0%. These tax-related services were as follows: review of income tax returns, review of excise distribution calculations, and tax compliance services related to investments in foreign securities.
The aggregate fees billed by the registrant’s independent auditors for tax-related services provided to the registrant’s investment adviser and other service providers under common control with the adviser and that relate directly to the operations or financial reporting of the registrant were $0 for the registrant’s fiscal year ended December 31, 2007.
The aggregate fees billed by the registrant’s independent auditors for tax-related services provided to the registrant were $51,800 for the fiscal year ended December 31, 2006. The percentage of these fees relating to services approved by the registrant’s Audit Committee pursuant to the de minimis exception from the pre-approval requirement in Rule 2-01(c)(7)(i)(C) of Regulation S-X was 0%. These tax-related services were as follows: review of income tax returns and review of annual excise distribution calculations.
The aggregate fees billed by the registrant’s independent auditors for tax-related services provided to the registrant’s adviser and other service providers under common control with the adviser and that relate directly to the operations or financial reporting of the registrant were $0 for the registrant’s fiscal year ended December 31, 2006.
(d) All other fees.
The aggregate fees billed for all services provided by the independent auditors to the registrant other than those set forth in paragraphs (a), (b) and (c) of this Item were $0 for the fiscal year ended December 31, 2007.
The aggregate fees billed for all services other than those set forth in paragraphs (b) and (c) of this Item provided by the registrant’s independent auditors to the registrant’s adviser and other service providers under common control with the adviser and that relate directly to the operations or financial reporting of the registrant were $0 for the registrant’s fiscal year ended December 31, 2007.
The aggregate fees billed for all services provided by the independent auditors to the registrant other than those set forth in paragraphs (a), (b) and (c) of this Item were $0 for the fiscal year ended December 31, 2006.
The aggregate fees billed for all services other than those set forth in paragraphs (b) and (c) of this Item provided by the registrant’s independent auditors to the registrant’s adviser and other service providers under common control with the adviser and that relate directly to the operations or financial reporting of the registrant were $0 for the registrant’s fiscal year ended December 31, 2006.
(e) The registrant’s Audit Committee has established pre-approval policies and procedures as permitted by Rule 2-01(c)(7)(i)(B) of Regulation S-X (the “Pre-Approval Policy”) with respect to services provided by the registrant’s independent auditors. Pursuant to the Pre-Approval Policy, the Audit Committee has pre-approved the services set forth in the table below with respect to the registrant up to the specified fee limits. Certain fee limits are based on aggregate fees to the registrant and other registrants within the Delaware Investments Family of Funds.
Service | | Range of Fees |
Audit Services | | |
| | |
Statutory audits or financial audits for new Funds | | up to $25,000 per Fund |
| | |
Services associated with SEC registration statements (e.g., Form N-1A, Form N-14, etc.), periodic reports and other documents filed with the SEC or other documents issued in connection with securities offerings (e.g., comfort letters for closed-end Fund offerings, consents), and assistance in responding to SEC comment letters | | up to $10,000 per Fund |
| | |
Consultations by Fund management as to the accounting or disclosure treatment of transactions or events and/or the actual or potential impact of final or proposed rules, standards or interpretations by the SEC, FASB, or other regulatory or standard-setting bodies (Note: Under SEC rules, some consultations may be considered “audit-related services” rather than “audit services”) | | up to $25,000 in the aggregate |
| | |
Audit-Related Services | | |
| | |
Consultations by Fund management as to the accounting or disclosure treatment of transactions or events and /or the actual or potential impact of final or proposed rules, standards or interpretations by the SEC, FASB, or other regulatory or standard-setting bodies (Note: Under SEC rules, some consultations may be considered “audit services” rather than “audit-related services”) | | up to $25,000 in the aggregate |
| | |
Tax Services | | |
| | |
U.S. federal, state and local and international tax planning and advice (e.g., consulting on statutory, regulatory or administrative developments, evaluation of Funds’ tax compliance function, etc.) | | up to $25,000 in the aggregate |
| | |
U.S. federal, state and local tax compliance (e.g., excise distribution reviews, etc.) | | up to $5,000 per Fund |
| | |
Review of federal, state, local and international income, franchise and other tax returns | | up to $5,000 per Fund |
Under the Pre-Approval Policy, the Audit Committee has also pre-approved the services set forth in the table below with respect to the registrant’s investment adviser and other entities controlling, controlled by or under common control with the investment adviser that provide ongoing services to the registrant (the “Control Affiliates”) up to the specified fee limit. This fee limit is based on aggregate fees to the investment adviser and its Control Affiliates.
Service | | Range of Fees |
Non-Audit Services | | |
| | |
Services associated with periodic reports and other documents filed with the SEC and assistance in responding to SEC comment letters | | up to $10,000 in the aggregate |
The Pre-Approval Policy requires the registrant’s independent auditors to report to the Audit Committee at each of its regular meetings regarding all services initiated since the last such report was rendered, including those services authorized by the Pre-Approval Policy.
(f) Not applicable.
(g) The aggregate non-audit fees billed by the registrant’s independent auditors for services rendered to the registrant and to its investment adviser and other service providers under common control with the adviser were $364,263 and $306,508 for the registrant’s fiscal years ended December 31, 2007 and December 31, 2006, respectively.
(h) In connection with its selection of the independent auditors, the registrant’s Audit Committee has considered the independent auditors’ provision of non-audit services to the registrant’s investment adviser and other service providers under common control with the adviser that were not required to be pre-approved pursuant to Rule 2-01(c)(7)(ii) of Regulation S-X. The Audit Committee has determined that the independent auditors’ provision of these services is compatible with maintaining the auditors’ independence.
Item 5. Audit Committee of Listed Registrants
Not applicable.
Item 6. Schedule of Investments
Included as part of report to shareholders filed under Item 1 of this Form N-CSR.
Item 7. Disclosure of Proxy Voting Policies and Procedures for Closed-End Management Investment Companies
Not applicable.
Item 8. Portfolio Managers of Closed-End Management Investment Companies
Not applicable.
Item 9. Purchases of Equity Securities by Closed-End Management Investment Company and Affiliated Purchasers
Not applicable.
Item 10. Submission of Matters to a Vote of Security Holders
Not applicable.
Item 11. Controls and Procedures
The registrant’s principal executive officer and principal financial officer have evaluated the registrant’s disclosure controls and procedures within 90 days of the filing of this report and have concluded that they are effective in providing reasonable assurance that the information required to be disclosed by the registrant in its reports or statements filed under the Securities Exchange Act of 1934 is recorded, processed, summarized and reported within the time periods specified in the rules and forms of the Securities and Exchange Commission.
There were no significant changes in the registrant’s internal control over financial reporting that occurred during the second fiscal quarter of the period covered by the report to stockholders included herein (i.e., the registrant’s fourth fiscal quarter) that have materially affected, or are reasonably likely to materially affect, the registrant’s internal control over financial reporting.
Item 12. Exhibits
(a) (1) Code of Ethics
Not applicable.
(2) Certifications of Principal Executive Officer and Principal Financial Officer pursuant to Rule 30a-2 under the Investment Company Act of 1940 are attached hereto as Exhibit 99.CERT.
(3) Written solicitations to purchase securities pursuant to Rule 23c-1 under the Securities Exchange Act of 1934.
Not applicable.
(b) Certifications pursuant to Section 906 of the Sarbanes-Oxley Act of 2002 are furnished herewith as Exhibit 99.906CERT.
SIGNATURES
Pursuant to the requirements of the Securities Exchange Act of 1934 and the Investment Company Act of 1940, the registrant has duly caused this report to be signed on its behalf, by the undersigned, thereunto duly authorized.
Name of Registrant: Delaware VIP Trust
PATRICK P. COYNE | | |
By: | | Patrick P. Coyne |
Title: | | Chief Executive Officer |
Date: | | March 4, 2008 |
| | | | |
Pursuant to the requirements of the Securities Exchange Act of 1934 and the Investment Company Act of 1940, this report has been signed below by the following persons on behalf of the registrant and in the capacities and on the dates indicated.
PATRICK P. COYNE | | |
By: | | Patrick P. Coyne |
Title: | | Chief Executive Officer |
Date: | | March 4, 2008 |
| | | | |
RICHARD SALUS | | |
By: | | Richard Salus |
Title: | | Chief Financial Officer |
Date: | | March 4, 2008 |
| | | | |