UNITED STATES
SECURITIES AND EXCHANGE COMMISSION
WASHINGTON, D.C. 20549
FORMN-CSR
CERTIFIED SHAREHOLDER REPORT OF REGISTERED
MANAGEMENT INVESTMENT COMPANIES
Investment Company Act file number:811-01716
AB CAP FUND, INC.
(Exact name of registrant as specified in charter)
1345 Avenue of the Americas, New York, New York 10105
(Address of principal executive offices) (Zip code)
Joseph J. Mantineo
AllianceBernstein L.P.
1345 Avenue of the Americas
New York, New York 10105
(Name and address of agent for service)
Registrant’s telephone number, including area code: (800)221-5672
Date of fiscal year end: December 31, 2018
Date of reporting period: December 31, 2018
ITEM 1. REPORTS TO STOCKHOLDERS.
DEC 12.31.18

ANNUAL REPORT
AB FLEXFEETM CORE OPPORTUNITIES PORTFOLIO

Beginning January 1, 2021, as permitted by new regulations adopted by the Securities and Exchange Commission, the Fund’s annual and semi-annual shareholder reports will no longer be sent by mail, unless you specifically request paper copies of the reports. Instead, the reports will be made available on a website, and you will be notified by mail each time a report is posted and provided with a website address to access the report.
If you already elected to receive shareholder reports electronically, you will not be affected by this change and you need not take any action. You may elect to receive shareholder reports and other communications from the Fund electronically at any time by contacting your financial intermediary (such as a broker-dealer or bank) or, if you are a direct investor, by calling the Fund at (800) 221 5672.
You may elect to receive all future reports in paper form free of charge. If you invest through a financial intermediary, you can contact your financial intermediary to request that you continue to receive paper copies of your shareholder reports; if you invest directly with the Fund, you can call the Fund at (800) 221 5672. Your election to receive reports in paper form will apply to all funds held in your account with your financial intermediary or, if you invest directly, to all AB Mutual Funds you hold.
| | |
| |
| Investment Products Offered | | • Are Not FDIC Insured• May Lose Value• Are Not Bank Guaranteed |
Investors should consider the investment objectives, risks, charges and expenses of the Fund carefully before investing. For copies of our prospectus or summary prospectus, which contain this and other information, visit us online at www.abfunds.com or contact your AB representative. Please read the prospectus and/or summary prospectus carefully before investing.
This shareholder report must be preceded or accompanied by the Fund’s prospectus for individuals who are not current shareholders of the Fund.
You may obtain a description of the Fund’s proxy voting policies and procedures, and information regarding how the Fund voted proxies relating to portfolio securities during the most recent12-month period ended June 30, without charge. Simply visit AB’s website at www.abfunds.com, or go to the Securities and Exchange Commission’s (the “Commission”) website at www.sec.gov, or call AB at (800) 227 4618.
The Fund files its complete schedule of portfolio holdings with the Commission for the first and third quarters of each fiscal year. The Fund’s portfolio holdings reports are available on the Commission’s website at www.sec.gov. The Fund’s portfolio holdings reports may also be reviewed and copied at the Commission’s Public Reference Room in Washington, DC; information on the operation of the Public Reference Room may be obtained by calling (800) SEC 0330. AB publishes full portfolio holdings for the Fund monthly at www.abfunds.com.
AllianceBernstein Investments, Inc. (ABI) is the distributor of the AB family of mutual funds. ABI is a member of FINRA and is an affiliate of AllianceBernstein L.P., the Adviser of the funds.
The [A/B] logo is a registered service mark of AllianceBernstein and AllianceBernstein® is a registered service mark used by permission of the owner, AllianceBernstein L.P.
| | |
| FROM THE PRESIDENT | |  |
Dear Shareholder,
We are pleased to provide this report for AB FlexFee Core Opportunities Portfolio (the “Fund”). Please review the discussion of Fund performance, the market conditions during the reporting period and the Fund’s investment strategy.
As always, AB strives to keep clients ahead of what’s next by:
| + | | Transforming uncommon insights into uncommon knowledge with a global research scope |
| + | | Navigating markets with seasoned investment experience and sophisticated solutions |
| + | | Providing thoughtful investment insights and actionable ideas |
Whether you’re an individual investor or a multi-billion-dollar institution, we put knowledge and experience to work for you.
AB’s global research organization connects and collaborates across platforms and teams to deliver impactful insights and innovative products. Better insights lead to better opportunities—anywhere in the world.
For additional information about AB’s range of products and shareholder resources, please log on to www.abfunds.com.
Thank you for your investment in the AB Mutual Funds.
Sincerely,

Robert M. Keith
President and Chief Executive Officer, AB Mutual Funds
| | |
| |
| abfunds.com | | AB FLEXFEE CORE OPPORTUNITIES PORTFOLIO | 1 |
ANNUAL REPORT
February 07, 2019
This report provides management’s discussion of fund performance for AB FlexFee Core Opportunities Portfolio for the annual reporting period ended December 31, 2018.
The Fund’s investment objective is long-term growth of capital.
NAV RETURNS AS OF DECEMBER 31, 2018(unaudited)
| | | | | | | | |
| | |
| | | 6 Months | | | 12 Months | |
| | |
| AB FLEXFEE CORE OPPORTUNITIES PORTFOLIO | | | | | | | | |
| | |
| Advisor Class Shares | | | -5.57% | | | | -3.09% | |
| | |
| S&P 500 Index | | | -6.85% | | | | -4.38% | |
INVESTMENT RESULTS
The table above shows the Fund’s performance compared to its benchmark, the Standard and Poor’s (“S&P”) 500 Index, for thesix- and12-month periods ended December 31, 2018.
The Fund outperformed the benchmark for both periods. The Fund’s performance-based advisory fee for the performance period from June 28, 2017 through December 31, 2018 was accrued between itsmid-point and maximum rates. For both periods, stock selection within the communication-services sector contributed, relative to the benchmark. Stock selection in energy and an underweight to utilities detracted.
During the12-month period, stock selection within the financials sector and an overweight to consumer discretionary contributed, while stock selection in consumer discretionary detracted.
During thesix-month period, stock selection in health care and an underweight to technology contributed, while selection in industrials detracted.
The Fund did not utilize derivatives during either period.
MARKET REVIEW AND INVESTMENT STRATEGY
Global equities ended 2018 in negative territory, marking one of the worst years for the stock market in a decade. Despite a relatively strong start to the year and US stock indices reaching record highs, volatility spiked toward the end of the 12-month period ended December 31, 2018. Investors worried about the outlook for corporate earnings growth amid a more challenging global growth environment and as the benefits of tax reform roll off. The US Federal Reserve raised rates four times during 2018 as expected, but softened its tone in December, and signaled that it might
| | |
| |
| 2 | AB FLEXFEE CORE OPPORTUNITIES PORTFOLIO | | abfunds.com |
slow its pace of rate hikes in 2019. An upsurge in geopolitical uncertainty regarding Brexit and budget discussions between Italy and its European Union partners sparked a flight to quality in the region. Slowing Chinese growth and continuingUS-China trade tensions dampened investor sentiment in China toward the end of the period. In the US, growth stocks outperformed value stocks, in terms of style, andlarge-cap stocks outperformed theirsmall-cap peers.
The Fund’s Senior Investment Management Team looks for attractively valued companies with competitive advantages and strong fundamentals, including strong cash-flow generation, sustainable growth and healthy balance sheets. The Fund is conservatively positioned in an uncertain environment, with a bias towards companies demonstrating high profitability and dividend growth.
INVESTMENT POLICIES
The Fund invests primarily in the equity securities of US companies that the Adviser believes are undervalued. The Adviser believes that, over time, a company’s stock price will come to reflect its intrinsic economic value. The Fund may invest in companies of any size and in any industry.
The Adviser depends heavily upon the fundamental analysis and research of its large internal research staff in making investment decisions for the Fund. The research staff follows a primary research universe of approximately 500, largely US, companies. In determining a company’s intrinsic economic value, the Adviser takes into account many fundamental and financial factors that it believes bear on the company’s ability to perform in the future, including earnings growth, prospective cash flows, dividend growth and growth in book value. The Adviser then ranks each of the companies in its research universe in the relative order of disparity between their intrinsic economic values and their current stock prices, with companies with the greatest disparities receiving the highest rankings (i.e., being considered the most undervalued). The Adviser anticipates that the Fund’s portfolio normally will include companies ranking in the top three deciles of the Adviser’s valuation model.
The Adviser recognizes that the perception of what is a “value” stock is relative and the factors considered in determining whether a stock is a “value” stock may, and often will, have differing relative significance in different phases of an economic cycle. Also, at different times, and as a result of how individual companies are valued in the market, the Fund may be attracted to investments in companies with different market capitalizations (i.e., large-,mid- or small-capitalization) or companies engaged in particular types of business (e.g., banks and
(continued on next page)
| | |
| |
| abfunds.com | | AB FLEXFEE CORE OPPORTUNITIES PORTFOLIO | 3 |
other financial institutions), although the Fund does not intend to concentrate in any particular industries or businesses. The Fund’s portfolio emphasis upon particular industries or sectors will be aby-product of the stock selection process rather than the result of assigned targets or ranges.
The Fund may enter into derivatives transactions, such as options, futures contracts, forwards, and swaps. The Fund may use options strategies involving the purchase and/or writing of various combinations of call and/or put options, including on individual securities and stock indices, futures contracts (including futures contracts on individual securities and stock indices) or shares of exchange-traded funds. These transactions may be used, for example, in an effort to earn extra income, to adjust exposure to individual securities or markets, or to protect all or a portion of the Fund’s portfolio from a decline in value, sometimes within certain ranges.
| | |
| |
| 4 | AB FLEXFEE CORE OPPORTUNITIES PORTFOLIO | | abfunds.com |
DISCLOSURES AND RISKS
Benchmark Disclosure
The S&P 500® Index is unmanaged and does not reflect fees and expenses associated with the active management of a mutual fund portfolio. The S&P 500 Index includes 500 US stocks and is a common representation of the performance of the overall US stock market. An investor cannot invest directly in an index, and its results are not indicative of the performance for any specific investment, including the Fund.
A Word About Risk
Market Risk: The value of the Fund’s investments will fluctuate as the stock or bond market fluctuates. The value of its investments may decline, sometimes rapidly and unpredictably, simply because of economic changes or other events that affect large portions of the market. It includes the risk that a particular style of investing, such as the Fund’s value approach, may be underperforming the market generally.
Capitalization Risk: Investments in small- andmid-capitalization companies may be more volatile than investments in large-capitalization companies. Investments in small- andmid-capitalization companies may have additional risks because these companies may have limited product lines, markets or financial resources.
Derivatives Risk: Derivatives may be illiquid, difficult to price, and leveraged so that small changes may produce disproportionate losses for the Fund, and may be subject to counterparty risk to a greater degree than more traditional investments.
Management Risk: The Fund is subject to management risk because it is an actively managed investment fund. The Adviser will apply its investment techniques and risk analyses in making investment decisions for the Fund, but there is no guarantee that its techniques will produce the intended results.
These risks are fully discussed in the Fund’s prospectus. As with all investments, you may lose money by investing in the Fund.
An Important Note About Historical Performance
The investment return and principal value of an investment in the Fund will fluctuate, so that shares, when redeemed, may be worth more or less than their original cost. Performance shown in this report represents past performance and does not guarantee future results. Current performance may be lower or higher than the performance information shown. You may obtain performance information current to the most recentmonth-end by visiting www.abfunds.com. The Fund has been in operation only for a short
| | |
| |
| abfunds.com | | AB FLEXFEE CORE OPPORTUNITIES PORTFOLIO | 5 |
DISCLOSURES AND RISKS(continued)
period of time, and therefore has a very limited historical performance period. This limited performance period is unlikely to be representative of the performance the Fund will achieve over a longer period.
All fees and expenses related to the operation of the Fund have been deducted. Net asset value (“NAV”) returns do not reflect sales charges; if sales charges were reflected, the Fund’s quoted performance would be lower. SEC returns reflect the applicable sales charges for each share class. Returns for the different share classes will vary due to different expenses associated with each class. Performance assumes reinvestment of distributions and does not account for taxes.
| | |
| |
| 6 | AB FLEXFEE CORE OPPORTUNITIES PORTFOLIO | | abfunds.com |
HISTORICAL PERFORMANCE
GROWTH OF A $10,000 INVESTMENT IN THE FUND(unaudited)
6/28/20171 TO 12/31/2018
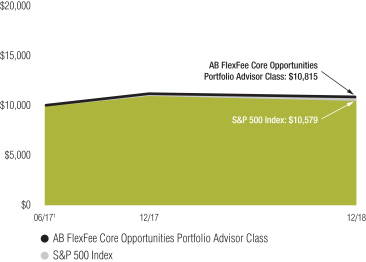
This chart illustrates the total value of an assumed $10,000 investment in AB FlexFee Core Opportunities Portfolio Advisor Class shares (from 6/28/20171 to 12/31/2018) as compared to the performance of the Fund’s benchmark.
| 1 | Inception date: 6/28/2017. |
| | |
| |
| abfunds.com | | AB FLEXFEE CORE OPPORTUNITIES PORTFOLIO | 7 |
HISTORICAL PERFORMANCE(continued)
AVERAGE ANNUAL RETURNS AS OF DECEMBER 31, 2018(unaudited)
| | | | | | | | |
| | |
| | | NAV Returns | | | SEC Returns
(reflects applicable
sales charges) | |
| | |
| ADVISOR CLASS SHARES1 | | | | | | | | |
| | |
| 1 Year | | | -3.09% | | | | -3.09% | |
| | |
| Since Inception2 | | | 5.33% | | | | 5.33% | |
SEC AVERAGE ANNUAL RETURNS
AS OF THE MOST RECENT CALENDARQUARTER-END
DECEMBER 31, 2018(unaudited)
| | | | |
| |
| | | SEC Returns
(reflects applicable
sales charges) | |
| |
| ADVISOR CLASS SHARES | | | | |
| |
| 1 Year | | | -3.09% | |
| |
| Since Inception2 | | | 5.33% | |
The Fund’s current prospectus fee table shows the Fund’s total annual operating expense ratio as 35.60% for Advisor Class shares, gross of any fee waivers or expense reimbursements. Contractual fee waivers and/or expense reimbursements limit the Fund’s annual operating expense ratio exclusive of the Fund’s advisory fees, acquired fund fees and expenses other than the advisory fees of any AB mutual funds in which the Fund may invest, interest expense, taxes, extraordinary expenses, and brokerage commissions and other transaction costs to 0.05% for Advisor Class shares. These waivers/reimbursements may not be terminated before April 30, 2019. Any fees waived and expenses borne by the Adviser through December 31, 2018 may be reimbursed by the Fund until the end of the third fiscal year after the fiscal period in which the fee was waived or the expense was borne, provided that no reimbursement payment will be made that would cause the Fund’s total annual operating expenses to exceed these expense limitations. Absent reimbursements or waivers, performance would have been lower. The Financial Highlights section of this report sets forth expense ratio data for the current reporting period; the expense ratio shown above may differ from the expense ratio in the Financial Highlights section since they are based on different time periods.
| 1 | This share class is offered at NAV to eligible investors and the SEC returns are the same as the NAV returns. |
| 2 | Inception date: 6/28/2017. |
| | |
| |
| 8 | AB FLEXFEE CORE OPPORTUNITIES PORTFOLIO | | abfunds.com |
EXPENSE EXAMPLE
(unaudited)
As a shareholder of the Fund, you incur two types of costs: (1) transaction costs, including sales charges (loads) on purchase payments, contingent deferred sales charges on redemptions and (2) ongoing costs, including advisory fees; distribution(12b-1) fees; and other Fund expenses. This example is intended to help you understand your ongoing costs (in dollars) of investing in the Fund and to compare these costs with the ongoing costs of investing in other mutual funds.
This Example is based on an investment of $1,000 invested at the beginning of the period and held for the entire period as indicated below.
Actual Expenses
The table below provides information about actual account values and actual expenses. You may use the information, together with the amount you invested, to estimate the expenses that you paid over the period. Simply divide your account value by $1,000 (for example, an $8,600 account value divided by $1,000 = 8.6), then multiply the result by the number under the heading entitled “Expenses Paid During Period” to estimate the expenses you paid on your account during this period.
Hypothetical Example for Comparison Purposes
The table below also provides information about hypothetical account values and hypothetical expenses based on the Fund’s actual expense ratio and an assumed annual rate of return of 5% before expenses, which is not the Fund’s actual return. The hypothetical account values and expenses may not be used to estimate the actual ending account balance or expenses you paid for the period. You may use this information to compare the ongoing costs of investing in the Fund and other funds by comparing this 5% hypothetical example with the 5% hypothetical examples that appear in the shareholder reports of other funds.
Please note that the expenses shown in the table are meant to highlight your ongoing costs only and do not reflect any transactional costs, such as sales charges (loads), or contingent deferred sales charges on redemptions. Therefore, the hypothetical example is useful in comparing ongoing costs only, and will not help you determine the relative total costs of owning different funds. In addition, if these transactional costs were included, your costs would have been higher.
| | | | | | | | | | | | | | | | | | | | | | | | |
| | | Beginning
Account
Value
7/1/2018 | | | Ending
Account
Value
12/31/2018 | | | Expenses
Paid
During
Period* | | | Annualized
Expense
Ratio* | | | Total
Expenses
Paid
During
Period+ | | | Total
Annualized
Expense
Ratio+ | |
| Advisor Class | | | | | | | | | | | | | | | | | | | | | | | | |
Actual | | $ | 1,000 | | | $ | 944.30 | | | $ | 9.16 | | | | 1.87 | % | | $ | 9.26 | | | | 1.89 | % |
Hypothetical** | | $ | 1,000 | | | $ | 1,015.78 | | | $ | 9.50 | | | | 1.87 | % | | $ | 9.60 | | | | 1.89 | % |
| | |
| |
| abfunds.com | | AB FLEXFEE CORE OPPORTUNITIES PORTFOLIO | 9 |
EXPENSE EXAMPLE(continued)
| * | Expenses are equal to the classes’ annualized expense ratios multiplied by the average account value over the period, multiplied by 184/365 (to reflect theone-half year period). |
| + | In connection with the Fund’s investments in affiliated/unaffiliated underlying portfolios, the Fund incurs no direct expenses, but bears proportionate shares of the fees and expenses (i.e., operating, administrative and investment advisory fees) of the affiliated/unaffiliated underlying portfolios. The Adviser has contractually agreed to waive its fees from the Fund in an amount equal to the Fund’s pro rata share of certain acquired fund fees and expenses of the affiliated underlying portfolios. The Fund’s total expenses are equal to the classes’ annualized expense ratio plus the Fund’s pro rata share of the weighted average expense ratio of the affiliated/unaffiliated underlying portfolios in which it invests, multiplied by the average account value over the period, multiplied by 184/365 (to reflect theone-half year period). |
| ** | Assumes 5% annual return before expenses. |
| | |
| |
| 10 | AB FLEXFEE CORE OPPORTUNITIES PORTFOLIO | | abfunds.com |
PORTFOLIO SUMMARY
December 31, 2018(unaudited)
PORTFOLIO STATISTICS
Net Assets ($mil): $1.0
TEN LARGEST HOLDINGS2
| | | | | | | | |
| | |
| Company | | U.S. $ Value | | | Percent of
Net Assets | |
| | |
| Verizon Communications, Inc. | | $ | 41,322 | | | | 4.2 | % |
| | |
| Berkshire Hathaway, Inc. – Class B | | | 39,407 | | | | 4.0 | |
| | |
| Microsoft Corp. | | | 38,596 | | | | 3.9 | |
| | |
| Alphabet, Inc. – Class C | | | 38,317 | | | | 3.9 | |
| | |
| Raytheon Co. | | | 36,497 | | | | 3.7 | |
| | |
| Monster Beverage Corp. | | | 34,798 | | | | 3.6 | |
| | |
| DR Horton, Inc. | | | 33,204 | | | | 3.4 | |
| | |
| Phillips 66 | | | 32,737 | | | | 3.4 | |
| | |
| Walmart, Inc. | | | 29,436 | | | | 3.0 | |
| | |
| Cigna Corp. | | | 27,728 | | | | 2.8 | |
| | |
| | $ | 352,042 | | | | 35.9 | % |
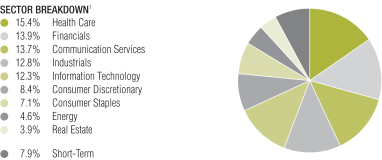
| 1 | All data are as of December 31, 2018. The Fund’s sector breakdown is expressed as a percentage of total investments and may vary over time. |
Please note: The sector classifications presented herein are based on the Global Industry Classification Standard (GICS) which was developed by Morgan Stanley Capital International and Standard & Poor’s. The components are divided into sector, industry group, and industrysub-indices as classified by the GICS for each of the market capitalization indices in the broad market. These sector classifications are broadly defined. The “Portfolio of Investments” section of the report reflects more specific industry information and is consistent with the investment restrictions discussed in the Fund’s prospectus.
| | |
| |
| abfunds.com | | AB FLEXFEE CORE OPPORTUNITIES PORTFOLIO | 11 |
PORTFOLIO OF INVESTMENTS
December 31, 2018
| | | | | | | | |
| Company | | Shares | | | U.S. $ Value | |
| |
COMMON STOCKS – 94.0% | | | | | | | | |
Health Care – 15.7% | | | | | | | | |
Biotechnology – 5.6% | | | | | | | | |
Biogen, Inc.(a) | | | 55 | | | $ | 16,551 | |
Gilead Sciences, Inc. | | | 137 | | | | 8,569 | |
Regeneron Pharmaceuticals, Inc.(a) | | | 43 | | | | 16,060 | |
Vertex Pharmaceuticals, Inc.(a) | | | 84 | | | | 13,920 | |
| | | | | | | | |
| | | | | | | 55,100 | |
| | | | | | | | |
Health Care Equipment & Supplies – 0.9% | | | | | | | | |
Intuitive Surgical, Inc.(a) | | | 18 | | | | 8,620 | |
| | | | | | | | |
| | |
Health Care Providers & Services – 6.6% | | | | | | | | |
Anthem, Inc. | | | 57 | | | | 14,970 | |
Cigna Corp. | | | 146 | | | | 27,728 | |
UnitedHealth Group, Inc. | | | 88 | | | | 21,923 | |
| | | | | | | | |
| | | | | | | 64,621 | |
| | | | | | | | |
Pharmaceuticals – 2.6% | | | | | | | | |
Eli Lilly & Co. | | | 144 | | | | 16,664 | |
Roche Holding AG (Sponsored ADR) | | | 300 | | | | 9,324 | |
| | | | | | | | |
| | | | | | | 25,988 | |
| | | | | | | | |
| | | | | | | 154,329 | |
| | | | | | | | |
Financials – 14.2% | | | | | | | | |
Banks – 2.5% | | | | | | | | |
JPMorgan Chase & Co. | | | 252 | | | | 24,600 | |
| | | | | | | | |
| | |
Capital Markets – 0.6% | | | | | | | | |
Northern Trust Corp. | | | 74 | | | | 6,186 | |
| | | | | | | | |
| | |
Consumer Finance – 1.6% | | | | | | | | |
Capital One Financial Corp. | | | 207 | | | | 15,647 | |
| | | | | | | | |
| | |
Diversified Financial Services – 4.0% | | | | | | | | |
Berkshire Hathaway, Inc. – Class B(a) | | | 193 | | | | 39,407 | |
| | | | | | | | |
| | |
Insurance – 5.5% | | | | | | | | |
Aflac, Inc. | | | 139 | | | | 6,333 | |
Allstate Corp. (The) | | | 196 | | | | 16,195 | |
Fidelity National Financial, Inc. | | | 449 | | | | 14,117 | |
Reinsurance Group of America, Inc. – Class A | | | 121 | | | | 16,968 | |
| | | | | | | | |
| | | | | | | 53,613 | |
| | | | | | | | |
| | | | | | | 139,453 | |
| | | | | | | | |
Communication Services – 14.0% | | | | | | | | |
Diversified Telecommunication Services – 4.2% | | | | | | | | |
Verizon Communications, Inc. | | | 735 | | | | 41,322 | |
| | | | | | | | |
| | |
Entertainment – 2.7% | | | | | | | | |
Walt Disney Co. (The) | | | 241 | | | | 26,426 | |
| | | | | | | | |
| | |
| |
| 12 | AB FLEXFEE CORE OPPORTUNITIES PORTFOLIO | | abfunds.com |
PORTFOLIO OF INVESTMENTS(continued)
| | | | | | | | |
| Company | | Shares | | | U.S. $ Value | |
| |
Interactive Media & Services – 3.9% | | | | | | | | |
Alphabet, Inc. – Class C(a) | | | 37 | | | $ | 38,317 | |
| | | | | | | | |
| | |
Media – 3.2% | | | | | | | | |
Comcast Corp. – Class A | | | 719 | | | | 24,482 | |
Discovery, Inc. – Class A(a) | | | 256 | | | | 6,333 | |
| | | | | | | | |
| | | | | | | 30,815 | |
| | | | | | | | |
| | | | | | | 136,880 | |
| | | | | | | | |
Industrials – 13.1% | | | | | | | | |
Aerospace & Defense – 4.6% | | | | | | | | |
Hexcel Corp. | | | 155 | | | | 8,888 | |
Raytheon Co. | | | 238 | | | | 36,497 | |
| | | | | | | | |
| | | | | | | 45,385 | |
| | | | | | | | |
Airlines – 0.8% | | | | | | | | |
Southwest Airlines Co. | | | 158 | | | | 7,344 | |
| | | | | | | | |
| | |
Building Products – 1.4% | | | | | | | | |
Allegion PLC | | | 176 | | | | 14,029 | |
| | | | | | | | |
| | |
Construction & Engineering – 0.6% | | | | | | | | |
Jacobs Engineering Group, Inc. | | | 101 | | | | 5,904 | |
| | | | | | | | |
| | |
Electrical Equipment – 0.8% | | | | | | | | |
Acuity Brands, Inc. | | | 66 | | | | 7,587 | |
| | | | | | | | |
| | |
Machinery – 3.0% | | | | | | | | |
Altra Industrial Motion Corp. | | | 466 | | | | 11,720 | |
Crane Co. | | | 162 | | | | 11,693 | |
Parker-Hannifin Corp. | | | 39 | | | | 5,817 | |
| | | | | | | | |
| | | | | | | 29,230 | |
| | | | | | | | |
Road & Rail – 1.9% | | | | | | | | |
Kansas City Southern | | | 62 | | | | 5,918 | |
Knight-Swift Transportation Holdings, Inc. | | | 224 | | | | 5,616 | |
Saia, Inc.(a) | | | 126 | | | | 7,033 | |
| | | | | | | | |
| | | | | | | 18,567 | |
| | | | | | | | |
| | | | | | | 128,046 | |
| | | | | | | | |
Information Technology – 12.6% | | | | | | | | |
Communications Equipment – 1.0% | | | | | | | | |
Arista Networks, Inc.(a) | | | 44 | | | | 9,271 | |
| | | | | | | | |
| | |
Electronic Equipment, Instruments & Components – 0.9% | | | | | | | | |
Keysight Technologies, Inc.(a) | | | 148 | | | | 9,188 | |
| | | | | | | | |
| | |
IT Services – 4.8% | | | | | | | | |
Accenture PLC – Class A | | | 58 | | | | 8,178 | |
Akamai Technologies, Inc.(a) | | | 141 | | | | 8,612 | |
Cognizant Technology Solutions Corp. – Class A | | | 120 | | | | 7,618 | |
| | |
| |
| abfunds.com | | AB FLEXFEE CORE OPPORTUNITIES PORTFOLIO | 13 |
PORTFOLIO OF INVESTMENTS(continued)
| | | | | | | | |
| Company | | Shares | | | U.S. $ Value | |
| |
Euronet Worldwide, Inc.(a) | | | 85 | | | $ | 8,702 | |
Visa, Inc. – Class A | | | 106 | | | | 13,986 | |
| | | | | | | | |
| | | | | | | 47,096 | |
| | | | | | | | |
Semiconductors & Semiconductor Equipment – 0.8% | | | | | | | | |
Xilinx, Inc. | | | 92 | | | | 7,836 | |
| | | | | | | | |
| | |
Software – 3.9% | | | | | | | | |
Microsoft Corp. | | | 380 | | | | 38,596 | |
| | | | | | | | |
| | |
Technology Hardware, Storage & Peripherals – 1.2% | | | | | | | | |
Apple, Inc. | | | 73 | | | | 11,515 | |
| | | | | | | | |
| | | | | | | 123,502 | |
| | | | | | | | |
Consumer Discretionary – 8.6% | | | | | | | | |
Household Durables – 4.0% | | | | | | | | |
DR Horton, Inc. | | | 958 | | | | 33,204 | |
Garmin Ltd. | | | 103 | | | | 6,522 | |
| | | | | | | | |
| | | | | | | 39,726 | |
| | | | | | | | |
Internet & Direct Marketing Retail – 1.6% | | | | | | | | |
Booking Holdings, Inc.(a) | | | 9 | | | | 15,502 | |
| | | | | | | | |
| | |
Specialty Retail – 3.0% | | | | | | | | |
Home Depot, Inc. (The) | | | 83 | | | | 14,261 | |
Murphy USA, Inc.(a) | | | 102 | | | | 7,817 | |
Ulta Salon Cosmetics & Fragrance, Inc.(a) | | | 29 | | | | 7,101 | |
| | | | | | | | |
| | | | | | | 29,179 | |
| | | | | | | | |
| | | | | | | 84,407 | |
| | | | | | | | |
Consumer Staples – 7.3% | | | | | | | | |
Beverages – 3.6% | | | | | | | | |
Monster Beverage Corp.(a) | | | 707 | | | | 34,798 | |
| | | | | | | | |
| | |
Food & Staples Retailing – 3.7% | | | | | | | | |
Walgreens Boots Alliance, Inc. | | | 104 | | | | 7,106 | |
Walmart, Inc. | | | 316 | | | | 29,436 | |
| | | | | | | | |
| | | | | | | 36,542 | |
| | | | | | | | |
| | | | | | | 71,340 | |
| | | | | | | | |
Energy – 4.6% | | | | | | | | |
Oil, Gas & Consumable Fuels – 4.6% | | | | | | | | |
Noble Energy, Inc. | | | 684 | | | | 12,832 | |
Phillips 66 | | | 380 | | | | 32,737 | |
| | | | | | | | |
| | | | | | | 45,569 | |
| | | | | | | | |
Real Estate – 3.9% | | | | | | | | |
Equity Real Estate Investment Trusts (REITs) – 2.0% | | | | | | | | |
Regency Centers Corp. | | | 334 | | | | 19,599 | |
| | | | | | | | |
| | |
| |
| 14 | AB FLEXFEE CORE OPPORTUNITIES PORTFOLIO | | abfunds.com |
PORTFOLIO OF INVESTMENTS(continued)
| | | | | | | | |
| Company | | Shares | | | U.S. $ Value | |
| |
Real Estate Management & Development – 1.9% | | | | | | | | |
CBRE Group, Inc. – Class A(a) | | | 477 | | | $ | 19,099 | |
| | | | | | | | |
| | | | | | | 38,698 | |
| | | | | | | | |
Total Common Stocks
(cost $924,305) | | | | | | | 922,224 | |
| | | | | | | | |
| | | | | | | | |
SHORT-TERM INVESTMENTS – 8.0% | | | | | | | | |
Investment Companies – 8.0% | | | | | | | | |
AB Fixed Income Shares, Inc. – Government Money Market Portfolio – Class AB, 2.31%(b)(c)(d)
(cost $78,556) | | | 78,556 | | | | 78,556 | |
| | | | | | | | |
| | |
Total Investments – 102.0%
(cost $1,002,861) | | | | | | | 1,000,780 | |
Other assets less liabilities – (2.0)% | | | | | | | (20,021 | ) |
| | | | | | | | |
| | |
Net Assets – 100.0% | | | | | | $ | 980,759 | |
| | | | | | | | |
| (a) | Non-income producing security. |
| (b) | To obtain a copy of the fund’s shareholder report, please go to the Securities and Exchange Commission’s website at www.sec.gov, or call AB at(800) 227-4618. |
| (c) | The rate shown represents the7-day yield as of period end. |
| (d) | Affiliated investments. |
Glossary:
ADR – American Depositary Receipt
See notes to financial statements.
| | |
| |
| abfunds.com | | AB FLEXFEE CORE OPPORTUNITIES PORTFOLIO | 15 |
STATEMENT OF ASSETS & LIABILITIES
December 31, 2018
| | | | |
| Assets | | | | |
Investments in securities, at value
Unaffiliated issuers (cost $924,305) | | $ | 922,224 | |
Affiliated issuers (cost $78,556) | | | 78,556 | |
Cash | | | 60 | |
Receivable for investment securities sold | | | 82,948 | |
Receivable from Adviser | | | 74,885 | |
Unaffiliated dividends receivable | | | 1,076 | |
Affiliated dividends receivable | | | 182 | |
| | | | |
Total assets | | | 1,159,931 | |
| | | | |
| Liabilities | | | | |
Dividends payable | | | 89,890 | |
Audit and tax fee payable | | | 52,539 | |
Legal fee payable | | | 14,658 | |
Custody fee payable | | | 9,326 | |
Transfer Agent fee payable | | | 739 | |
Accrued expenses and other liabilities | | | 12,020 | |
| | | | |
Total liabilities | | | 179,172 | |
| | | | |
Net Assets | | $ | 980,759 | |
| | | | |
| Composition of Net Assets | | | | |
Capital stock, at par | | $ | 10 | |
Additionalpaid-in capital | | | 997,696 | |
Accumulated loss | | | (16,947 | ) |
| | | | |
| | $ | 980,759 | |
| | | | |
Net Asset Value Per Share—11 billion shares of capital stock authorized, $.0001 par value
| | | | | | | | | | | | |
| Class | | Net Assets | | | Shares
Outstanding | | | Net Asset
Value | |
| |
| Advisor | | $ | 980,759 | | | | 100,001 | | | $ | 9.81 | |
| |
See notes to financial statements.
| | |
| |
| 16 | AB FLEXFEE CORE OPPORTUNITIES PORTFOLIO | | abfunds.com |
STATEMENT OF OPERATIONS
Year Ended December 31, 2018
| | | | | | | | |
| Investment Income | | | | | | | | |
Dividends
Unaffiliated issuers (net of foreign taxes withheld of $26) | | $ | 13,458 | | | | | |
Affiliated issuers | | | 2,547 | | | $ | 16,005 | |
| | | | | | | | |
| Expenses | | | | | | | | |
Advisory fee (see Note B) | | | 12,997 | | | | | |
Transfer agency—Advisor Class | | | 2,178 | | | | | |
Administrative | | | 80,419 | | | | | |
Audit and tax | | | 57,799 | | | | | |
Amortization of offering expenses | | | 33,389 | | | | | |
Legal | | | 31,619 | | | | | |
Custodian | | | 26,319 | | | | | |
Directors’ fees | | | 24,784 | | | | | |
Registration fees | | | 7,889 | | | | | |
Printing | | | 4,929 | | | | | |
Miscellaneous | | | 17,637 | | | | | |
| | | | | | | | |
Total expenses | | | 299,959 | | | | | |
Less: expenses waived and reimbursed by the Adviser (see Note B and Note D) | | | (286,633 | ) | | | | |
| | | | | | | | |
Net expenses | | | | | | | 13,326 | |
| | | | | | | | |
Net investment income | | | | | | | 2,679 | |
| | | | | | | | |
| Realized and Unrealized Gain (Loss) on Investments | | | | | | | | |
Net realized gain on: | | | | | | | | |
Investment transactions | | | | | | | 62,463 | |
Net change in unrealized appreciation/depreciation on: | | | | | | | | |
Investments | | | | | | | (99,934 | ) |
| | | | | | | | |
Net loss on investments | | | | | | | (37,471 | ) |
| | | | | | | | |
Net Decrease in Net Assets from Operations | | | | | | $ | (34,792 | ) |
| | | | | | | | |
See notes to financial statements.
| | |
| |
| abfunds.com | | AB FLEXFEE CORE OPPORTUNITIES PORTFOLIO | 17 |
STATEMENT OF CHANGES IN NET ASSETS
| | | | | | | | |
| | | Year Ended
December 31,
2018 | | | June 28, 2017(a)
to
December 31, 2017 | |
| Increase (Decrease) in Net Assets from Operations | | | | | | | | |
Net investment income | | $ | 2,679 | | | $ | 3,652 | |
Net realized gain on investment | | | 62,463 | | | | 14,969 | |
Net change in unrealized appreciation/depreciation on investments | | | (99,934 | ) | | | 97,853 | |
| | | | | | | | |
Net increase (decrease) in net assets from operations | | | (34,792 | ) | | | 116,474 | |
| Distributions to Shareholders* | | | | | | | | |
Advisor Class | | | (89,891 | ) | | | (11,040 | ) |
| Capital Stock Transactions | | | | | | | | |
Net increase | | | 5 | | | | 1,000,003 | |
| | | | | | | | |
Total increase (decrease) | | | (124,678 | ) | | | 1,105,437 | |
| Net Assets | | | | | | | | |
Beginning of period | | | 1,105,437 | | | | – 0 | – |
| | | | | | | | |
End of period | | $ | 980,759 | | | $ | 1,105,437 | |
| | | | | | | | |
| (a) | Commencement of operations. |
| * | The prior year’s amounts have been reclassified to conform with the current year’s presentation. See Note H, Recent Accounting Pronouncements, in the Notes to Financial Statements for more information. |
See notes to financial statements.
| | |
| |
| 18 | AB FLEXFEE CORE OPPORTUNITIES PORTFOLIO | | abfunds.com |
NOTES TO FINANCIAL STATEMENTS
December 31, 2018
NOTE A
Significant Accounting Policies
AB Cap Fund, Inc. (the “Company”), which is a Maryland corporation, is registered under the Investment Company Act of 1940 as anopen-end management investment company. The Company operates as a series company comprised of 29 portfolios currently in operation. Each portfolio is considered to be a separate entity for financial reporting and tax purposes. This report relates only to the AB FlexFee Core Opportunities Portfolio (the “Fund”), a diversified portfolio. The Fund commenced operations on June 28, 2017. The Fund has authorized issuance of Class A, Class B, Class C, Advisor Class, Class R, Class K, Class I, Class Z, Class T, Class 1, and Class 2 shares. Class A, Class B, Class C, Class R, Class K, Class I, Class Z, Class T, Class 1, and Class 2 shares have not been issued. As of December 31, 2018, AllianceBernstein L.P. (the “Adviser”) was the sole shareholder of Advisor Class shares. Advisor Class shares are sold without an initial or contingent deferred sales charge and are not subject to ongoing distribution expenses. All eleven classes of shares have identical voting, dividend, liquidation and other rights, except that the classes bear different distribution and transfer agency expenses. Each class has exclusive voting rights with respect to its distribution plan. The financial statements have been prepared in conformity with U.S. generally accepted accounting principles (“U.S. GAAP”), which require management to make certain estimates and assumptions that affect the reported amounts of assets and liabilities in the financial statements and amounts of income and expenses during the reporting period. Actual results could differ from those estimates. The Fund is an investment company under U.S. GAAP and follows the accounting and reporting guidance applicable to investment companies. The following is a summary of significant accounting policies followed by the Fund.
1. Security Valuation
Portfolio securities are valued at their current market value determined on the basis of market quotations or, if market quotations are not readily available or are deemed unreliable, at “fair value” as determined in accordance with procedures established by and under the general supervision of the Fund’s Board of Directors (the “Board”).
In general, the market values of securities which are readily available and deemed reliable are determined as follows: securities listed on a national securities exchange (other than securities listed on the NASDAQ Stock Market, Inc. (“NASDAQ”)) or on a foreign securities exchange are valued at the last sale price at the close of the exchange or foreign securities exchange. If there has been no sale on such day, the securities are valued at the last traded price from the previous day. Securities listed on more than one exchange are valued by reference to the principal exchange on
| | |
| |
| abfunds.com | | AB FLEXFEE CORE OPPORTUNITIES PORTFOLIO | 19 |
NOTES TO FINANCIAL STATEMENTS(continued)
which the securities are traded; securities listed only on NASDAQ are valued in accordance with the NASDAQ Official Closing Price; listed or over the counter (“OTC”) market put or call options are valued at the mid level between the current bid and ask prices. If either a current bid or current ask price is unavailable, the Adviser will have discretion to determine the best valuation (e.g., last trade price in the case of listed options); open futures are valued using the closing settlement price or, in the absence of such a price, the most recent quoted bid price. If there are no quotations available for the day of valuation, the last available closing settlement price is used; U.S. Government securities and any other debt instruments having 60 days or less remaining until maturity are generally valued at market by an independent pricing vendor, if a market price is available. If a market price is not available, the securities are valued at amortized cost. This methodology is commonly used for short term securities that have an original maturity of 60 days or less, as well as short term securities that had an original term to maturity that exceeded 60 days. In instances when amortized cost is utilized, the Valuation Committee (the “Committee”) must reasonably conclude that the utilization of amortized cost is approximately the same as the fair value of the security. Such factors the Committee will consider include, but are not limited to, an impairment of the creditworthiness of the issuer or material changes in interest rates. Fixed-income securities, including mortgage-backed and asset-backed securities, may be valued on the basis of prices provided by a pricing service or at a price obtained from one or more of the major broker-dealers. In cases where broker-dealer quotes are obtained, the Adviser may establish procedures whereby changes in market yields or spreads are used to adjust, on a daily basis, a recently obtained quoted price on a security. Swaps and other derivatives are valued daily, primarily using independent pricing services, independent pricing models using market inputs, as well as third party broker-dealers or counterparties. Open end mutual funds are valued at the closing net asset value per share, while exchange traded funds are valued at the closing market price per share.
Securities for which market quotations are not readily available (including restricted securities) or are deemed unreliable are valued at fair value as deemed appropriate by the Adviser. Factors considered in making this determination may include, but are not limited to, information obtained by contacting the issuer, analysts, analysis of the issuer’s financial statements or other available documents. In addition, the Fund may use fair value pricing for securities primarily traded innon-U.S. markets because most foreign markets close well before the Fund values its securities at 4:00 p.m., Eastern Time. The earlier close of these foreign markets gives rise to the possibility that significant events, including broad market moves, may have occurred in the interim and may materially affect the value of those securities. To account for this, the Fund generally values many of its foreign equity securities using fair value prices based on third party vendor modeling tools to the extent available.
| | |
| |
| 20 | AB FLEXFEE CORE OPPORTUNITIES PORTFOLIO | | abfunds.com |
NOTES TO FINANCIAL STATEMENTS(continued)
2. Fair Value Measurements
In accordance with U.S. GAAP regarding fair value measurements, fair value is defined as the price that the Fund would receive to sell an asset or pay to transfer a liability in an orderly transaction between market participants at the measurement date. U.S. GAAP establishes a framework for measuring fair value, and a three-level hierarchy for fair value measurements based upon the transparency of inputs to the valuation of an asset or liability (including those valued based on their market values as described in Note A.1 above). Inputs may be observable or unobservable and refer broadly to the assumptions that market participants would use in pricing the asset or liability. Observable inputs reflect the assumptions market participants would use in pricing the asset or liability based on market data obtained from sources independent of the Fund. Unobservable inputs reflect the Fund’s own assumptions about the assumptions that market participants would use in pricing the asset or liability based on the best information available in the circumstances. Each investment is assigned a level based upon the observability of the inputs which are significant to the overall valuation. The three-tier hierarchy of inputs is summarized below.
| | • | | Level 1—quoted prices in active markets for identical investments |
| | • | | Level 2—other significant observable inputs (including quoted prices for similar investments, interest rates, prepayment speeds, credit risk, etc.) |
| | • | | Level 3—significant unobservable inputs (including the Fund’s own assumptions in determining the fair value of investments) |
Where readily available market prices or relevant bid prices are not available for certain equity investments, such investments may be valued based on similar publicly traded investments, movements in relevant indices since last available prices or based upon underlying company fundamentals and comparable company data (such as multiples to earnings or other multiples to equity). Where an investment is valued using an observable input, such as another publicly traded security, the investment will be classified as Level 2. If management determines that an adjustment is appropriate based on restrictions on resale, illiquidity or uncertainty, and such adjustment is a significant component of the valuation, the investment will be classified as Level 3. An investment will also be classified as Level 3 where management uses company fundamentals and other significant inputs to determine the valuation.
| | |
| |
| abfunds.com | | AB FLEXFEE CORE OPPORTUNITIES PORTFOLIO | 21 |
NOTES TO FINANCIAL STATEMENTS(continued)
The following table summarizes the valuation of the Fund’s investments by the above fair value hierarchy levels as of December 31, 2018:
| | | | | | | | | | | | | | | | |
Investments in Securities | | Level 1 | | | Level 2 | | | Level 3 | | | Total | |
Assets: | | | | | | | | | | | | | | | | |
Common Stocks^ | | $ | 922,224 | | | $ | – 0 | – | | $ | – 0 | – | | $ | 922,224 | |
Short-Term Investments: | | | | | | | | | | | | | | | | |
Investment Companies | | | 78,556 | | | | – 0 | – | | | – 0 | – | | | 78,556 | |
| | | | | | | | | | | | | | | | |
Total Investments in Securities | | | 1,000,780 | | | | – 0 | – | | | – 0 | – | | | 1,000,780 | |
Other Financial Instruments* | | | – 0 | – | | | – 0 | – | | | – 0 | – | | | – 0 | – |
| | | | | | | | | | | | | | | | |
Total** | | $ | 1,000,780 | | | $ | – 0 | – | | $ | – 0 | – | | $ | 1,000,780 | |
| | | | | | | | | | | | | | | | |
| ^ | See Portfolio of Investments for sector classifications. |
| * | Other financial instruments are derivative instruments, such as futures, forwards and swaps, which are valued at the unrealized appreciation/(depreciation) on the instrument. Other financial instruments may also include swaps with upfront premiums, options written and swaptions written which are valued at market value. |
| ** | There were no transfers between any levels during the reporting period. |
The Fund recognizes all transfers between levels of the fair value hierarchy assuming the financial instrument was transferred at the beginning of the reporting period.
The Adviser established the Committee to oversee the pricing and valuation of all securities held in the Fund. The Committee operates under pricing and valuation policies and procedures established by the Adviser and approved by the Board, including pricing policies which set forth the mechanisms and processes to be employed on a daily basis to implement these policies and procedures. In particular, the pricing policies describe how to determine market quotations for securities and other instruments. The Committee’s responsibilities include: 1) fair value and liquidity determinations (and oversight of any third parties to whom any responsibility for fair value and liquidity determinations is delegated), and 2) regular monitoring of the Adviser’s pricing and valuation policies and procedures and modification or enhancement of these policies and procedures (or recommendation of the modification of these policies and procedures) as the Committee believes appropriate.
The Committee is also responsible for monitoring the implementation of the pricing policies by the Adviser’s Pricing Group (the “Pricing Group”) and any third party which performs certain pricing functions in accordance with the pricing policies. The Pricing Group is responsible for the oversight of the third party on aday-to-day basis. The Committee and the Pricing Group perform a series of activities to provide reasonable assurance of the accuracy of prices including: 1) periodic vendor due diligence meetings, review of methodologies, new developments and process at vendors, 2)
| | |
| |
| 22 | AB FLEXFEE CORE OPPORTUNITIES PORTFOLIO | | abfunds.com |
NOTES TO FINANCIAL STATEMENTS(continued)
daily comparison of security valuation versus prior day for all securities that exceeded established thresholds, and 3) daily review of unpriced, stale, and variance reports with exceptions reviewed by senior management and the Committee.
In addition, several processes outside of the pricing process are used to monitor valuation issues including: 1) performance and performance attribution reports are monitored for anomalous impacts based upon benchmark performance, and 2) portfolio managers review all portfolios for performance and analytics (which are generated using the Adviser’s prices).
3. Currency Translation
Assets and liabilities denominated in foreign currencies and commitments under forward currency exchange contracts are translated into U.S. dollars at the mean of the quoted bid and ask prices of such currencies against the U.S. dollar. Purchases and sales of portfolio securities are translated into U.S. dollars at the rates of exchange prevailing when such securities were acquired or sold. Income and expenses are translated into U.S. dollars at the rates of exchange prevailing when accrued.
Net realized gain or loss on foreign currency transactions represents foreign exchange gains and losses from sales and maturities of foreign fixed income investments, holding of foreign currencies, currency gains or losses realized between the trade and settlement dates on foreign investment transactions, and the difference between the amounts of dividends, interest and foreign withholding taxes recorded on the Fund’s books and the U.S. dollar equivalent amounts actually received or paid. Net unrealized currency gains and losses from valuing foreign currency denominated assets and liabilities at period end exchange rates are reflected as a component of net unrealized appreciation and depreciation of foreign currency denominated assets and liabilities.
4. Taxes
It is the Fund’s policy to meet the requirements of the Internal Revenue Code applicable to regulated investment companies and to distribute all of its investment company taxable income and net realized gains, if any, to shareholders. Therefore, no provisions for federal income or excise taxes are required. The Fund may be subject to taxes imposed by countries in which it invests. Such taxes are generally based on income and/or capital gains earned or repatriated. Taxes are accrued and applied to net investment income, net realized gains and net unrealized appreciation/depreciation as such income and/or gains are earned.
| | |
| |
| abfunds.com | | AB FLEXFEE CORE OPPORTUNITIES PORTFOLIO | 23 |
NOTES TO FINANCIAL STATEMENTS(continued)
In accordance with U.S. GAAP requirements regarding accounting for uncertainties in income taxes, management has analyzed the Fund’s tax positions taken or expected to be taken on federal and state income tax returns for all open tax years (all years since inception of the Fund) and has concluded that no provision for income tax is required in the Fund’s financial statements.
5. Investment Income and Investment Transactions
Dividend income is recorded on theex-dividend date or as soon as the Fund is informed of the dividend. Interest income is accrued daily. Investment transactions are accounted for on the date securities are purchased or sold. Investment gains or losses are determined on the identified cost basis. The Fund amortizes premiums and accretes discounts as adjustments to interest income.
6. Expense Allocations
Expenses of the Company are charged proportionately to each portfolio or based on other appropriate methods.
7. Dividends and Distributions
Dividends and distributions to shareholders, if any, are recorded on theex-dividend date. Income dividends and capital gains distributions are determined in accordance with federal tax regulations and may differ from those determined in accordance with U.S. GAAP. To the extent these differences are permanent, such amounts are reclassified within the capital accounts based on their federal tax basis treatment; temporary differences do not require such reclassification.
8. Offering Expenses
Offering expenses of $68,085 were deferred and amortized on a straight line basis over a one year period starting from June 28, 2017 (commencement of operations).
NOTE B
Advisory Fee and Other Transactions with Affiliates
Under the terms of the investment advisory agreement, the Fund pays the Adviser an advisory fee at an annual rate of .55% of the Fund’s average daily net assets (“Base Fee”). The advisory fee is increased or decreased from the Base Fee by a performance adjustment (“Performance Adjustment”) that depends on whether, and to what extent, the investment performance of the Advisor Class shares of the Fund (“Measuring Class”) exceeds, or is exceeded by, the performance of the S&P 500 Index (“Index”) plus 1.40% (“Index Hurdle”) over the Performance Period (as defined below). The Performance Adjustment is calculated and accrued daily, according to a schedule that adds or subtracts .00357% of the Fund’s average daily net assets for each .01% of absolute performance by
| | |
| |
| 24 | AB FLEXFEE CORE OPPORTUNITIES PORTFOLIO | | abfunds.com |
NOTES TO FINANCIAL STATEMENTS(continued)
which the performance of the Measuring Class exceeds or lags the Index Hurdle for the period from the beginning of the Performance Period through the current business day. The maximum Performance Adjustment (positive or negative) will not exceed an annualized rate of +/- .50% (“Maximum Performance Adjustment”) of the Fund’s average daily net assets, which would occur when the performance of the Measuring Class exceeds, or is exceeded by, the Index Hurdle by 1.40% or more for the Performance Period. On a monthly basis, the Fund will pay the Adviser the minimum fee rate of .05% on an annualized basis (Base Fee minus the Maximum Performance Adjustment) applied to the average daily net assets for the month. At the end of the Performance Period, the Fund will pay to the Adviser the total advisory fee, less the amount of any minimum fees paid during the Performance Period and any waivers described below. The period over which performance is measured (“Performance Period”) was initially from the commencement of operations to December 31, 2018 and thereafter is each12-month period beginning on the first day in the month of January through December 31 of the same year. In addition, the Adviser has agreed to waive its advisory fee by limiting the Fund’s accrual of the advisory fee (Base Fee plus Performance Adjustment) on any day to the amount corresponding to the maximum fee rate multiplied by the Fund’s current net assets if such amount is less than the amount that would have been accrued based on the Fund’s average daily net assets for the Performance Period. For the year ended December 31, 2018, the Fund accrued advisory fees of $12,997, as reflected in the statement of operations, at an annual effective rate (excluding the impact from any expense waivers in effect) of 1.13% of the Fund’s average net assets, which reflected a .58% Performance Adjustment of $6,679. For the Performance Period from June 28, 2017 to December 31, 2018, the Fund accrued advisory fees of $15,102, at an annual effective rate (excluding the impact from any expense waivers in effect) of .90% of the Fund’s average net assets, which reflected a .35% Performance Adjustment of $5,836.
The Adviser has agreed to waive its fees and bear certain expenses through April 30, 2019 to the extent necessary to limit total expenses (other than the advisory fee, acquired fund fees and expenses other than the advisory fees of any AB mutual funds in which the Fund may invest, interest expense, taxes, extraordinary expenses, and brokerage commissions and other transaction costs) on an annual basis from exceeding .05% of average daily net assets. For the year ended December 31, 2018, the reimbursement waivers amounted to $205,969. Any fees waived and expenses borne by the Adviser through December 31, 2018 are subject to repayment by the Fund until the end of the third fiscal year after the fiscal period in which the fees were waived or the expenses were borne; such waivers/expenses borne that are subject to repayment amount to $171,134 for the fiscal period ended December 31, 2017, and $205,969 for the year ended December 31, 2018. In any case, no repayment will be
| | |
| |
| abfunds.com | | AB FLEXFEE CORE OPPORTUNITIES PORTFOLIO | 25 |
NOTES TO FINANCIAL STATEMENTS(continued)
made that would cause the Fund’s total annual expenses (subject to the exclusions set forth above) to exceed .05%.
During 2017, AXA S.A. (“AXA”), a French holding company for the AXA Group, a worldwide leader in life, property and casualty and health insurance and asset management, announced its intention to pursue the sale of a minority stake in its subsidiary, AXA Equitable Holdings, Inc. (“AXA Equitable”), the holding company for a diversified financial services organization, through an initial public offering (“IPO”). AXA Equitable is the holding company for a diverse group of financial services companies, including AllianceBernstein L.P., the investment adviser to the Funds (“the Adviser”). During the second quarter of 2018, AXA Equitable completed the IPO, and, as a result, AXA held approximately 72.2% of the outstanding common stock of AXA Equitable as of September 30, 2018. Contemporaneously with the IPO, AXA sold $862.5 million aggregate principal amount of its 7.25% mandatorily exchangeable notes (the “MxB Notes”) due May 15, 2021 and exchangeable into up to 43,125,000 shares of common stock (or approximately 7% of the outstanding shares of common stock of AXA Equitable). AXA retains ownership (including voting rights) of such shares of common stock until the MxB Notes are exchanged, which may be on a date that is earlier than the maturity date at AXA’s option upon the occurrence of certain events.
In March 2018, AXA announced its intention to sell its entire interest in AXA Equitable over time, subject to market conditions and other factors (the “Plan”). It is anticipated that one or more of the transactions contemplated by the Plan may ultimately result in the indirect transfer of a “controlling block” of voting securities of the Adviser (a “Change of Control Event”) and therefore may be deemed an “assignment” causing a termination of each Fund’s current investment advisory agreement. In order to ensure that the existing investment advisory services could continue uninterrupted, at meetings held in late July through early August 2018, the Boards of Directors/Trustees (each a “Board” and collectively, the “Boards”) approved new investment advisory agreements with the Adviser, in connection with the Plan. The Boards also agreed to call and hold a joint meeting of shareholders on October 11, 2018 for shareholders of each Fund to (1) approve the new investment advisory agreement with the Adviser that would be effective after the first Change of Control Event and (2) approve any future advisory agreement approved by the Board and that has terms not materially different from the current agreement, in the event there are subsequent Change of Control Events arising from completion of the Plan that terminate the advisory agreement after the first Change of Control Event. Approval of a future advisory agreement means that shareholders may not have another opportunity to vote on a new agreement with the Adviser even upon a change of control, as long as no single person or group of persons acting together gains “control” (as defined in the 1940 Act) of AXA Equitable.
| | |
| |
| 26 | AB FLEXFEE CORE OPPORTUNITIES PORTFOLIO | | abfunds.com |
NOTES TO FINANCIAL STATEMENTS(continued)
At the October 11, 2018 meeting, shareholders approved the new and future investment advisory agreements.
On November 20, 2018, AXA completed a public offering of 60,000,000 shares of AXA Equitable’s common stock and simultaneously sold 30,000,000 of such shares to AXA Equitable pursuant to a separate agreement with it. As a result AXA currently owns approximately 59.2% of the shares of common stock of AXA Equitable.
Pursuant to the investment advisory agreement, the Fund may reimburse the Adviser for certain legal and accounting services provided to the Fund by the Adviser. For the year ended December 31, 2018, the Adviser voluntarily agreed to waive such fees in the amount of $80,419.
The Fund compensates AllianceBernstein Investor Services, Inc. (“ABIS”), a wholly-owned subsidiary of the Adviser, under a Transfer Agency Agreement for providing personnel and facilities to perform transfer agency services for the Fund. ABIS may make payments to intermediaries that provide omnibus account services,sub-accounting services and/or networking services. The compensation retained by ABIS amounted to $374 for the year ended December 31, 2018.
The Fund may invest in AB Government Money Market Portfolio (the “Government Money Market Portfolio”) which has a contractual annual advisory fee rate of ..20% of the portfolio’s average daily net assets and bears its own expenses. Effective August 1, 2018, the Adviser has contractually agreed to waive .10% of the advisory fee of Government Money Market Portfolio until August 31, 2019. In connection with the investment by the Fund in Government Money Market Portfolio, the Adviser has contractually agreed to waive its investment advisory fee from the Fund in an amount equal to the Fund’s pro rata share of the effective advisory fee of Government Money Market Portfolio, as borne indirectly by the Fund as an acquired fund fee and expense. For the year ended December 31, 2018, such waiver amounted to $241.
A summary of the Fund’s transactions in AB mutual funds for the year ended December 31, 2018 is as follows:
| | | | | | | | | | | | | | | | | | | | |
Fund | | Market Value
12/31/17
(000) | | | Purchases
at Cost
(000) | | | Sales
Proceeds
(000) | | | Market Value
12/31/18
(000) | | | Dividend
Income
(000) | |
Government Money Market Portfolio | | $ | 201 | | | $ | 489 | | | $ | 611 | | | $ | 79 | | | $ | 3 | |
Government Money Market Portfolio* | | | – 0 | – | | | 50 | | | | 50 | | | | – 0 | – | | | 0 | ** |
| | | | | | | | | | | | | | | | | | | | |
Total | | | | | | | | | | | | | | $ | 79 | | | $ | 3 | |
| | | | | | | | | | | | | | | | | | | | |
| * | Investment of cash collateral for securities lending transactions (see Note D). |
| ** | Amount is less than $500. |
| | |
| |
| abfunds.com | | AB FLEXFEE CORE OPPORTUNITIES PORTFOLIO | 27 |
NOTES TO FINANCIAL STATEMENTS(continued)
Brokerage commissions paid on investment transactions for the year ended December 31, 2018 amounted to $583, of which $0 and $0, respectively, was paid to Sanford C. Bernstein & Co. LLC and Sanford C. Bernstein Limited, affiliates of the Adviser.
NOTE C
Investment Transactions
Purchases and sales of investment securities (excluding short-term investments) for the year ended December 31, 2018, were as follows:
| | | | | | | | |
| | | Purchases | | | Sales | |
Investment securities (excluding U.S. government securities) | | $ | 1,498,416 | | | $ | 1,420,625 | |
U.S. government securities | | | – 0 | – | | | – 0 | – |
The cost of investments for federal income tax purposes, gross unrealized appreciation and unrealized depreciation are as follows:
| | | | |
Cost | | $ | 1,012,062 | |
| | | | |
Gross unrealized appreciation | | $ | 49,705 | |
Gross unrealized depreciation | | | (60,987 | ) |
| | | | |
Net unrealized depreciation | | $ | (11,282 | ) |
| | | | |
1. Derivative Financial Instruments
The Fund may use derivatives in an effort to earn income and enhance returns, to replace more traditional direct investments, to obtain exposure to otherwise inaccessible markets (collectively, “investment purposes”), or to hedge or adjust the risk profile of its portfolio.
The Fund did not engage in derivative transactions for the year ended December 31, 2018.
2. Currency Transactions
The Fund may invest innon-U.S. Dollar-denominated securities on a currency hedged or unhedged basis. The Fund may seek investment opportunities by taking long or short positions in currencies through the use of currency-related derivatives, including forward currency exchange contracts, futures and options on futures, swaps, and other options. The Fund may enter into transactions for investment opportunities when it anticipates that a foreign currency will appreciate or depreciate in value but securities denominated in that currency are not held by the Fund and do not present attractive investment opportunities. Such transactions may also be used when the Adviser believes that it may be more efficient than a direct investment in a foreign currency-denominated security. The Fund may also conduct currency exchange contracts on a spot basis (i.e., for cash at the spot rate prevailing in the currency exchange market for buying or selling currencies).
| | |
| |
| 28 | AB FLEXFEE CORE OPPORTUNITIES PORTFOLIO | | abfunds.com |
NOTES TO FINANCIAL STATEMENTS(continued)
NOTE D
Securities Lending
The Fund may enter into securities lending transactions. Under the Fund’s securities lending program, all loans of securities will be collateralized continually by cash. The Fund will be compensated for the loan from a portion of the net return from the income earned on cash collateral after a rebate is paid to the borrower (in some cases, this rebate may be a “negative rebate” or fee paid by the borrower to the Fund in connection with the loan), and payments are made for fees of the securities lending agent and for certain other administrative expenses. It is the policy of the Fund to receive collateral consisting of cash in an amount exceeding the value of the securities loaned. A Fund will have the right to call a loan and obtain the securities loaned at any time on notice to the borrower within the normal and customary settlement time for the securities. While the securities are on loan, the borrower is obligated to pay the Fund amounts equal to any income or other distributions from the securities. The Fund will not be able to exercise voting rights with respect to any securities during the existence of a loan, but will have the right to regain ownership of loaned securities in order to exercise voting or other ownership rights. The lending agent has agreed to indemnify the Fund in the case of default of any securities borrower. Collateral received and securities loaned are marked to market daily to ensure that the securities loaned are secured by collateral. The lending agent currently invests the cash collateral received in Government Money Market Portfolio, an eligible money market vehicle, in accordance with the investment restrictions of the Fund, and as approved by the Board. The collateral received on securities loaned is recorded as an asset as well as a corresponding liability in the statement of assets and liabilities. When the Fund lends securities, its investment performance will continue to reflect changes in the value of the securities loaned. At December 31, 2018, the Fund had no securities on loan and had received no cash collateral. The Fund earned net securities lending income of $28 from Government Money Market Portfolio, inclusive of a rebate expense paid to the borrower, for the year ended December 31, 2018; this amount is reflected in the statement of operations. In connection with the cash collateral investment by the Fund in the Government Money Market Portfolio, the Adviser has agreed to waive a portion of the Fund’s share of the advisory fees of Government Money Market Portfolio, as borne indirectly by the Fund as an acquired fund fee and expense. For the year ended December 31, 2018, such waiver amounted to $4. A principal risk of lending portfolio securities is that the borrower will fail to return the loaned securities upon termination of the loan and that the collateral will not be sufficient to replace the loaned securities.
| | |
| |
| abfunds.com | | AB FLEXFEE CORE OPPORTUNITIES PORTFOLIO | 29 |
NOTES TO FINANCIAL STATEMENTS(continued)
NOTE E
Capital Stock
Each class consists of 1,000,000,000 authorized shares. Transactions in capital shares for each class were as follows:
| | | | | | | | | | | | | | | | | | | | | | | | |
| | | | | | | | | | | | | | | | | | | | | | | | |
| | | Shares | | | | | | Amount | | | | |
| | | Year Ended
December 31, 2018 | | | June 28, 2017*
to December 31, 2017 | | | | | | Year Ended
December 31, 2018 | | | June 28, 2017* to December 31, 2017 | | | | |
| | | | | | | | |
| Advisor Class | | | | | | | | | | | | | | | | | | | | | | | | |
Shares sold | | | 1 | | | | 100,000 | | | | | | | $ | 5 | | | $ | 1,000,003 | | | | | |
| | | | | |
Shares issued in reinvestment of dividends and distributions | | | 0 | (a) | | | 0 | (a) | | | | | | | 0 | (b) | | | 0 | (b) | | | | |
| | | | | |
Net increase | | | 1 | | | | 100,000 | | | | | | | $ | 5 | | | $ | 1,000,003 | | | | | |
| | | | | |
| * | Commencement of operations. |
NOTE F
Risks Involved in Investing in the Fund
Capitalization Risk—Investments in small- andmid-capitalization companies may be more volatile than investments in large-capitalization companies. Investments in small- andmid-capitalization companies may have additional risks because these companies may have limited product lines, markets or financial resources.
Derivatives Risk—The Fund may enter into derivative transactions such as forwards, options, futures and swaps. Derivatives may be illiquid, difficult to price, and leveraged so that small changes may produce disproportionate losses for the Fund, and subject to counterparty risk to a greater degree than more traditional investments. Derivatives may result in significant losses, including losses that are far greater than the value of the derivatives reflected on the statement of assets and liabilities.
Indemnification Risk—In the ordinary course of business, the Fund enters into contracts that contain a variety of indemnifications. The Fund’s maximum exposure under these arrangements is unknown. However, the Fund has not had prior claims or losses pursuant to these indemnification provisions and expects the risk of loss thereunder to be remote. Therefore, the Fund has not accrued any liability in connection with these indemnification provisions.
| | |
| |
| 30 | AB FLEXFEE CORE OPPORTUNITIES PORTFOLIO | | abfunds.com |
NOTES TO FINANCIAL STATEMENTS(continued)
NOTE G
Distributions to Shareholders
The tax character of distributions paid during the fiscal year ended December 31, 2018 and fiscal period ended December 31, 2017 were as follows:
| | | | | | | | |
| | | 2018 | | | 2017 | |
Distributions paid from: | | | | | | | | |
Ordinary income | | $ | 69,729 | | | $ | 11,040 | |
Net long-term capital gains | | | 20,162 | | | | – 0 | – |
| | | | | | | | |
Total taxable distributions paid | | $ | 89,891 | | | $ | 11,040 | |
| | | | | | | | |
As of December 31, 2018, the components of accumulated earnings/(deficit) on a tax basis were as follows:
| | | | |
Accumulated capital and other losses | | $ | (5,665 | )(a) |
Unrealized appreciation/(depreciation) | | | (11,282 | )(b) |
| | | | |
Total accumulated earnings/(deficit) | | $ | (16,947 | ) |
| | | | |
| (a) | As of December 31, 2018, the Fund had a post-October capital loss deferral of $5,665. |
| (b) | The difference between book-basis and tax-basis unrealized appreciation/(depreciation) is attributable primarily to the tax deferral of losses on wash sales. |
For tax purposes, net realized capital losses may be carried over to offset future capital gains, if any. Funds are permitted to carry forward capital losses for an indefinite period, and such losses will retain their character as either short-term or long-term capital losses. As of December 31, 2018, the Fund did not have any capital loss carryforwards.
During the current fiscal year, permanent differences primarily due to the tax treatment of offering costs resulted in a net decrease in accumulated loss and a net decrease in additional paid-in capital. These reclassifications had no effect on net assets.
NOTE H
Recent Accounting Pronouncements
In August 2018, the Financial Accounting Standards Board issued an Accounting Standards Update, ASU2018-13, Fair Value Measurement (Topic 820), Disclosure Framework-Changes to the Disclosure Requirements for Fair Value Measurement which removes, modifies and adds disclosures to Topic 820. The amendments in this ASU2018-13 apply to all entities that are required, under existing U.S. GAAP, to make disclosures about recurring or nonrecurring fair value measurements. The amendments in this ASU2018-13 are effective for all entities for fiscal years, and interim periods within those fiscal years, beginning after December 15, 2019. At this time, management is evaluating the implications of these changes on the financial statements.
| | |
| |
| abfunds.com | | AB FLEXFEE CORE OPPORTUNITIES PORTFOLIO | 31 |
NOTES TO FINANCIAL STATEMENTS(continued)
In October 2018, the U.S. Securities and Exchange Commission adopted amendments to certain disclosure requirements included in RegulationS-X that had become “redundant, duplicative, overlapping, outdated or superseded, in light of the other Commission disclosure requirements, GAAP or changes in the information environment.” The compliance date for the amendments to RegulationS-X was November 5, 2018 (for reporting period end dates of September 30, 2018 or after). Management has adopted the amendments which simplified certain disclosure requirements on the financial statements.
NOTE I
Subsequent Events
Management has evaluated subsequent events for possible recognition or disclosure in the financial statements through the date the financial statements are issued. Management has determined that there are no material events that would require disclosure in the Fund’s financial statements through this date.
| | |
| |
| 32 | AB FLEXFEE CORE OPPORTUNITIES PORTFOLIO | | abfunds.com |
FINANCIAL HIGHLIGHTS
Selected Data For A Shares Of Capital Stock Outstanding Throughout Each Period
| | | | | | | | |
| | | Advisor Class | |
| | | Year Ended
December 31,
2018 | | | June 28,
2017(a) to
December 31,
2017 | |
| | | | |
Net asset value, beginning of period | | | $ 11.05 | | | | $ 10.00 | |
| | | | |
Income From Investment Operations | | | | | | | | |
| | |
Net investment income(b)(c) | | | .03 | | | | .04 | |
| | |
Net realized and unrealized gain (loss) on investments | | | (.37 | ) | | | 1.12 | |
| | | | |
Net increase (decrease) in net asset value from operations | | | (.34 | ) | | | 1.16 | |
| | | | |
Less: Dividends and Distributions | | | | | | | | |
Dividends from net investment income | | | (.05 | ) | | | (.03 | ) |
Distributions from net realized gain on investment transactions | | | (.85 | ) | | | (.08 | ) |
| | | | |
Total dividends and distributions | | | (.90 | ) | | | (.11 | ) |
| | | | |
Net asset value, end of period | | | $ 9.81 | | | | $ 11.05 | |
| | | | |
| | |
Total Return | | | | | | | | |
| | |
Total investment return based on net asset value(d) | | | (3.09 | )% | | | 11.60 | % |
| | |
Ratios/Supplemental Data | | | | | | | | |
| | |
Net assets, end of period (000’s omitted) | | | $981 | | | | $1,105 | |
| | |
Ratio to average net assets of: | | | | | | | | |
| | |
Expenses, net of waivers/reimbursements(e)† | | | 1.16 | %(g) | | | .41 | %(f) |
| | |
Expenses, before waivers/reimbursements(e)† | | | 26.11 | %(g) | | | 38.86 | %(f) |
| | |
Net investment income(c) | | | .23 | % | | | .68 | %(f) |
| | |
Portfolio turnover rate | | | 144 | % | | | 53 | % |
| | | | | | | | |
| | | |
† Expense ratios exclude the estimated acquired fund fees of | | | | | | | | |
affiliated/unaffiliated underlying portfolios | | | .02 | % | | | .03 | % |
| (a) | Commencement of operations. |
| (b) | Based on average shares outstanding. |
| (c) | Net of expenses waived/reimbursed by the Adviser. |
| (d) | Total investment return is calculated assuming an initial investment made at the net asset value at the beginning of the period, reinvestment of all dividends and distributions at net asset value during the period, and redemption on the last day of the period.Total investment return does not reflect the deduction of taxes that a shareholder would pay on fund distributions or the redemption of fund shares. Total investment return for a period of less than one year is not annualized. |
| (e) | In connection with the Fund’s investments in affiliated underlying portfolios, the Fund incurs no direct expenses but bears proportionate shares of the acquired fund fees and expenses (i.e. operating, administrative and investment advisory fees) of the affiliated underlying portfolios. The Adviser has contractually agreed to waive its fees from the Fund in an amount equal to the Fund’s pro rata share of certain acquired fund fees and expenses, and for the year ended December 31, 2018, and the period ended December 31, 2017, such waiver amounted to 0.02% and 0.03% (annualized), respectively. |
| (g) | The advisory fee reflected in the Fund’s expense ratio may be higher or lower than the Base Fee plus Performance Adjustment due to the different time periods over which the fee is calculated (i.e., the financial reporting period vs. the Performance Period). |
See notes to financial statements.
| | |
| |
| abfunds.com | | AB FLEXFEE CORE OPPORTUNITIES PORTFOLIO | 33 |
REPORT OF INDEPENDENT REGISTERED
PUBLIC ACCOUNTING FIRM
To the Shareholders and the Board of Directors of
AB FlexFee Core Opportunities Portfolio:
Opinion on the Financial Statements
We have audited the accompanying statement of assets and liabilities of AB FlexFee Core Opportunities Portfolio (the “Fund”) (one of the portfolios constituting AB Cap Fund, Inc. (the “Company”)), including the portfolio of investments, as of December 31, 2018, and the related statement of operations for the year then ended and the statements of changes in net assets and the financial highlights for the year then ended and the period June 28, 2017 (commencement of operations) to December 31, 2017 and the related notes (collectively referred to as the “financial statements”). In our opinion, the financial statements present fairly, in all material respects, the financial position of the Fund (one of the portfolios constituting AB Cap Fund, Inc.) at December 31, 2018, the results of its operations for the year then ended and the changes in its net assets and its financial highlights for the year then ended and the period June 28, 2017 (commencement of operations) to December 31, 2017, in conformity with U.S. generally accepted accounting principles.
Basis for Opinion
These financial statements are the responsibility of the Company’s management. Our responsibility is to express an opinion on the Fund’s financial statements based on our audits. We are a public accounting firm registered with the Public Company Accounting Oversight Board (United States) (“PCAOB”) and are required to be independent with respect to the Company in accordance with the U.S. federal securities laws and the applicable rules and regulations of the Securities and Exchange Commission and the PCAOB.
We conducted our audits in accordance with the standards of the PCAOB. Those standards require that we plan and perform the audit to obtain reasonable assurance about whether the financial statements are free of material misstatement, whether due to error or fraud. The Company is not required to have, nor were we engaged to perform, an audit of the Company’s internal control over financial reporting. As part of our audits, we are required to obtain an understanding of internal control over financial reporting, but not for the purpose of expressing an opinion on the effectiveness of the Company’s internal control over financial reporting. Accordingly, we express no such opinion.
Our audits included performing procedures to assess the risks of material misstatement of the financial statements, whether due to error or fraud, and performing procedures that respond to those risks. Such procedures
| | |
| |
| 34 | AB FLEXFEE CORE OPPORTUNITIES PORTFOLIO | | abfunds.com |
REPORT OF INDEPENDENT REGISTERED
PUBLIC ACCOUNTING FIRM(continued)
included examining, on a test basis, evidence regarding the amounts and disclosures in the financial statements. Our procedures included confirmation of securities owned as of December 31, 2018, by correspondence with the custodian and others or by other appropriate auditing procedures where replies from others were not received. Our audits also included evaluating the accounting principles used and significant estimates made by management, as well as evaluating the overall presentation of the financial statements. We believe that our audits provide a reasonable basis for our opinion.

We have served as the auditor of one or more of the AB investment companies since 1968.
New York, New York
February 26, 2019
| | |
| |
| abfunds.com | | AB FLEXFEE CORE OPPORTUNITIES PORTFOLIO | 35 |
2018 FEDERAL TAX INFORMATION
(unaudited)
For Federal income tax purposes, the following information is furnished with respect to the distributions paid by the Fund for the calendar year ended December 31, 2018. For corporate shareholders 19.25% of dividends paid qualify for the dividends received deduction.
For individual shareholders, the Fund designates 15.38% of dividends paid as qualified dividend income.
| | |
| |
| 36 | AB FLEXFEE CORE OPPORTUNITIES PORTFOLIO | | abfunds.com |
RESULTS OF STOCKHOLDER MEETING
(unaudited)
A Special Meeting of Stockholders of the AB Cap Fund, Inc. (the “Company”)—AB FlexFee Core Opportunities Portfolio (the “Fund”) was held on October 11, 2018. A description of the proposals and number of shares voted at the Meeting are as follows (the proposal number shown below corresponds to the proposal number in the Fund’s proxy statement):
| 1. | To approve and vote upon the election of Directors for the Company, each such Director to serve for a term of indefinite duration and until his or her successor is duly elected and qualifies. |
| | | | | | | | |
Director: | | Voted
For: | | | Authority
Withheld: | |
Michael J. Downey | | | 153,531,217 | | | | 1,117,868 | |
William H. Foulk, Jr.* | | | 153,385,034 | | | | 1,264,050 | |
Nancy P. Jacklin | | | 153,607,746 | | | | 1,041,339 | |
Robert M. Keith | | | 153,546,025 | | | | 1,103,060 | |
Carol C. McMullen | | | 153,649,415 | | | | 999,670 | |
Gary L. Moody | | | 153,545,113 | | | | 1,103,972 | |
Marshall C. Turner, Jr. | | | 153,507,495 | | | | 1,141,590 | |
Earl D. Weiner | | | 153,514,727 | | | | 1,134,358 | |
| 2. | To vote upon the approval of new advisory agreements for the Fund with AllianceBernstein L.P. |
| | | | | | | | | | | | | | |
Voted
For: | | | Voted
Against: | | | Abstain: | | | Broker
Non-Votes: | |
| | 100,000 | | | | – 0 | – | | | – 0 | – | | | – 0 | – |
| * | Mr. Foulk retired on December 31, 2018. |
| | |
| |
| abfunds.com | | AB FLEXFEE CORE OPPORTUNITIES PORTFOLIO | 37 |
BOARD OF DIRECTORS
Marshall C. Turner, Jr(1), Chairman
Michael J. Downey(1)
Nancy P. Jacklin(1)
Robert M. Keith,President and Chief Executive Officer
Carol C. McMullen(1)
Garry L. Moody(1)
Earl D. Weiner(1)
OFFICERS
Frank V. Caruso(2),Senior Vice President
John H. Fogarty(2),Vice President
Vinay Thapar(2),Vice President
Emilie D. Wrapp,Secretary
Michael B. Reyes,Senior Analyst
Joseph J. Mantineo,Treasurer and Chief Financial Officer
Phyllis J. Clarke,Controller
Vincent S. Noto,Chief Compliance Officer
| | |
Custodian and Accounting Agent Brown Brothers Harriman & Co. 50 Post Office Square Boston, MA 02110 Principal Underwriter AllianceBernstein Investments, Inc. 1345 Avenue of the Americas New York, NY 10105 Transfer Agent AllianceBernstein Investor Services, Inc. P.O. Box 786003 San Antonio, TX 78278-6003 Toll-Free (800)221-6003 | | Independent Registered Public Accounting Firm Ernst & Young LLP 5 Times Square New York, NY 10036 Legal Counsel Seward & Kissel LLP One Battery Park Plaza New York, NY 10004 |
| 1 | Member of the Audit Committee, the Governance and Nominating Committee and the Independent Directors Committee. |
| 2 | The management of, and investment decisions for, the Fund’s portfolio are made by the Adviser’s Relative Value Investment Team. While the members of the team work jointly to determine the investment strategy, including security selection, for the Fund, Messrs. Caruso, Fogarty and Thapar, who are members of U.S. Growth Equities, are primarily responsible for theday-to-day management of the Fund. |
| | |
| |
| 38 | AB FLEXFEE CORE OPPORTUNITIES PORTFOLIO | | abfunds.com |
MANAGEMENT OF THE FUND
Board of Directors Information
The business and affairs of the Fund are managed under the direction of the Board of Directors. Certain information concerning the Fund’s Directors is set forth below.
| | | | | | | | |
NAME,
ADDRESS*, AGE,
(YEAR FIRST ELECTED**) | | PRINCIPAL
OCCUPATION(S)
DURING PAST FIVE YEARS
AND OTHER INFORMATION*** | | PORTFOLIOS
IN AB FUND
COMPLEX
OVERSEEN BY
DIRECTOR | | | OTHER PUBLIC
COMPANY
DIRECTORSHIPS
CURRENTLY HELD BY DIRECTOR |
| INTERESTED DIRECTOR | | | | | | |
| | | |
Robert M. Keith,# 1345 Avenue of the Americas New York, NY 10105 58 (2015) | | Senior Vice President of AllianceBernstein L.P. (the “Adviser”) and the head of AllianceBernstein Investments, Inc. (“ABI”) since July 2008; Director of ABI and President of the AB Mutual Funds. Previously, he served as Executive Managing Director of ABI from December 2006 to June 2008. Prior to joining ABI in 2006, Executive Managing Director of Bernstein Global Wealth Management, and prior thereto, Senior Managing Director and Global Head of Client Service and Sales of the Adviser’s institutional investment management business since 2004. Prior thereto, he was Managing Director and Head of North American Client Service and Sales in the Adviser’s institutional investment management business, with which he had been associated since prior to 2004. | | | 95 | | | None |
| | | | | | | | |
| | |
| |
| abfunds.com | | AB FLEXFEE CORE OPPORTUNITIES PORTFOLIO | 39 |
MANAGEMENT OF THE FUND(continued)
| | | | | | | | |
NAME,
ADDRESS*, AGE,
(YEAR FIRST ELECTED**) | | PRINCIPAL
OCCUPATION(S)
DURING PAST FIVE YEARS
AND OTHER INFORMATION*** | | PORTFOLIOS
IN AB FUND
COMPLEX
OVERSEEN BY
DIRECTOR | | | OTHER PUBLIC
COMPANY
DIRECTORSHIPS
CURRENTLY HELD BY DIRECTOR |
DISINTERESTED DIRECTORS
| | | | | | |
| | | |
Marshall C. Turner, Jr.,## Chairman of the Board 77 (2015) | | Private Investor since prior to 2014. Former Chairman and CEO of Dupont Photomasks, Inc. (components of semi-conductor manufacturing). He has extensive operating leadership, and venture capital investing experience, including five interim or full-time CEO roles, and prior service as general partner of institutional venture capital partnerships. He also has extensive non-profit board leadership experience, and currently serves on the boards of two education and science-related non-profit organizations. He has served as a director of one AB Fund since 1992, and director or trustee of multiple AB funds since 2005. He has been Chairman of the AB Funds since January 2014, and the Chairman of the Independent Directors Committees of such AB Funds since February 2014. | | | 95 | | | Xilinx, Inc. (programmable logicsemi-conductors) since 2007 |
| | | | | | | | |
| | | |
Michael J. Downey,## 75 (2015) | | Private Investor since prior to 2014. Formerly, managing partner of Lexington Capital, LLC (investment advisory firm) from December 1997 until December 2003. He also served as a Director of Prospect Acquisition Corp. (financial services) from 2007 until 2009. From 1987 until 1993, Chairman and CEO of Prudential Mutual Fund Management, director of the Prudential mutual funds, and member of the Executive Committee of Prudential Securities Inc. He has served as a director or trustee of the AB Funds since 2005 and is a director and Chairman of one other registered investment company. | | | 95 | | | The Asia Pacific Fund, Inc. (registered investment company) since prior to 2014 |
| | |
| |
| 40 | AB FLEXFEE CORE OPPORTUNITIES PORTFOLIO | | abfunds.com |
MANAGEMENT OF THE FUND(continued)
| | | | | | | | |
NAME,
ADDRESS*, AGE,
(YEAR FIRST ELECTED**) | | PRINCIPAL
OCCUPATION(S)
DURING PAST FIVE YEARS
AND OTHER INFORMATION*** | | PORTFOLIOS
IN AB FUND
COMPLEX
OVERSEEN BY
DIRECTOR | | | OTHER PUBLIC
COMPANY
DIRECTORSHIPS
CURRENTLY HELD BY DIRECTOR |
DISINTERESTED DIRECTORS
(continued) | | | | | | |
| | | |
Nancy P. Jacklin,## 70 (2015) | | Private Investor since prior to 2014. Professorial Lecturer at the Johns Hopkins School of Advanced International Studies (2008-2015). U.S. Executive Director of the International Monetary Fund (which is responsible for ensuring the stability of the international monetary system), (December 2002-May 2006); Partner, Clifford Chance (1992-2002); Sector Counsel, International Banking and Finance, and Associate General Counsel, Citicorp (1985-1992); Assistant General Counsel (International), Federal Reserve Board of Governors (1982-1985); and Attorney Advisor, U.S. Department of the Treasury (1973-1982). Member of the Bar of the District of Columbia and of New York; and member of the Council on Foreign Relations. She has served as a director or trustee of the AB Funds since 2006 and has been Chair of the Governance and Nominating Committees of the AB Funds since August 2014. | | | 95 | | | None |
| | |
| |
| abfunds.com | | AB FLEXFEE CORE OPPORTUNITIES PORTFOLIO | 41 |
MANAGEMENT OF THE FUND(continued)
| | | | | | | | |
NAME,
ADDRESS*, AGE,
(YEAR FIRST ELECTED**) | | PRINCIPAL
OCCUPATION(S)
DURING PAST FIVE YEARS
AND OTHER INFORMATION*** | | PORTFOLIOS
IN AB FUND
COMPLEX
OVERSEEN BY
DIRECTOR | | | OTHER PUBLIC
COMPANY
DIRECTORSHIPS
CURRENTLY HELD BY DIRECTOR |
DISINTERESTED DIRECTORS
(continued) | | | | | | |
| | | |
Carol C. McMullen,## 63 (2016) | | Managing Director of Slalom Consulting (consulting) since 2014 and private investor and member of the Partners Healthcare Investment Committee. Formerly, Director of Norfolk & Dedham Group (mutual property and casualty insurance) from 2011 until November 2016; Director of Partners Community Physicians Organization (healthcare) from 2014 until December 2016; and Managing Director of The Crossland Group (consulting) from 2012 until 2013. She has held a number of senior positions in the asset and wealth management industries, including at Eastern Bank (where her roles included President of Eastern Wealth Management), Thomson Financial (Global Head of Sales for Investment Management), and Putnam Investments (where her roles included Head of Global Investment Research). She has served on a number of private company and non-profit boards, and as a director or trustee of the AB Funds since June 2016. | | | 95 | | | None |
| | | | | | | | |
| | |
| |
| 42 | AB FLEXFEE CORE OPPORTUNITIES PORTFOLIO | | abfunds.com |
MANAGEMENT OF THE FUND(continued)
| | | | | | | | |
NAME,
ADDRESS*, AGE,
(YEAR FIRST ELECTED**) | | PRINCIPAL
OCCUPATION(S)
DURING PAST FIVE YEARS
AND OTHER INFORMATION*** | | PORTFOLIOS
IN AB FUND
COMPLEX
OVERSEEN BY
DIRECTOR | | | OTHER PUBLIC
COMPANY
DIRECTORSHIPS
CURRENTLY HELD BY DIRECTOR |
DISINTERESTED DIRECTORS
(continued) | | | | | | |
| | | |
Garry L. Moody,## 66 (2015) | | Independent Consultant. Formerly, Partner, Deloitte & Touche LLP (1995-2008) where he held a number of senior positions, including Vice Chairman, and U.S. and Global Investment Management Practice Managing Partner; President, Fidelity Accounting and Custody Services Company (1993-1995), where he was responsible for the accounting, pricing, custody and reporting for the Fidelity mutual funds; and Partner, Ernst & Young LLP (1975-1993), where he served as the National Director of Mutual Fund Tax Services and Managing Partner of its Chicago Office Tax department. He is a member of the Trustee Advisory Board of BoardIQ, a biweekly publication focused on issues and news affecting directors of mutual funds. He has served as a director or trustee and as Chairman of the Audit Committees of the AB Funds since 2008. | | | 95 | | | None |
| | | | | | | | |
| | | |
Earl D. Weiner,## 79 (2015) | | Of Counsel, and Partner prior to January 2007, of the law firm Sullivan & Cromwell LLP and is a former member of the ABA Federal Regulation of Securities Committee Task Force to draft editions of the Fund Director’s Guidebook. He also serves as a director or trustee of various non-profit organizations and has served as Chairman or Vice Chairman of a number of them. He has served as a director or trustee of the AB Funds since 2007 and served as Chairman of the Governance and Nominating Committees of the AB Funds from 2007 until August 2014. | | | 95 | | | None |
| | |
| |
| abfunds.com | | AB FLEXFEE CORE OPPORTUNITIES PORTFOLIO | 43 |
MANAGEMENT OF THE FUND(continued)
| * | The address for each of the Fund’s disinterested Directors is c/o AllianceBernstein L.P., Attention: Legal & Compliance Department—Mutual Fund Legal, 1345 Avenue of the Americas, New York, NY 10105. |
| ** | There is no stated term of office for the Fund’s Directors. |
| *** | The information above includes each Director’s principal occupation during the last five years and other information relating to the experience, attributes and skills relevant to each Director’s qualifications to serve as a Director, which led to the conclusion that each Director should serve as a Director for the Fund. |
| # | Mr. Keith is an “interested person” of the Fund, as defined in the 1940 Act, due to his position as a Senior Vice President of the Adviser. |
| ## | Member of the Audit Committee, the Governance and Nominating Committee and the Independent Directors Committee. |
| | |
| |
| 44 | AB FLEXFEE CORE OPPORTUNITIES PORTFOLIO | | abfunds.com |
MANAGEMENT OF THE FUND(continued)
Officer Information
| | | | |
NAME, ADDRESS*
AND AGE | | POSITION(S)
HELD WITH FUND | | PRINCIPAL OCCUPATION
DURING PAST 5 YEARS |
Robert M. Keith, 58 | | President and Chief Executive Officer | | See biography above. |
| | | | |
Frank V. Caruso, 62 | | Senior Vice President | | Senior Vice President of the Adviser**, with which he has been associated since prior to 2014. He is also Chief Investment Officer of US Growth Equities. |
| | | | |
John H. Fogarty 49 | | Vice President | | Senior Vice President of the Adviser**, with which he has been associated since prior to 2014. |
| | | | |
Vinay Thapar 40 | | Vice President | | Senior Vice President of the Adviser**, with which he has been associated since prior to 2014. |
| | | | |
Emilie D. Wrapp, 63 | | Secretary | | Senior Vice President, Assistant General Counsel and Assistant Secretary of ABI**, with which she has been associated since prior to 2014. |
| | | | |
Michael B. Reyes 42 | | Senior Analyst | | Vice President of the Adviser**, with which he has been associated since prior to 2014. |
| | | | |
Joseph J. Mantineo, 59 | | Treasurer and Chief Financial Officer | | Senior Vice President of AllianceBernstein Investor Services (“ABIS”)**, with which he has been associated since prior to 2014. |
| | | | |
Phyllis J. Clarke, 58 | | Controller | | Vice President of ABIS**, with which she has been associated since prior to 2014. |
| | | | |
Vince S. Noto, 54 | | Chief Compliance Officer | | Senior Vice President since 2015 and Mutual Fund Chief Compliance Officer of the Adviser** since 2014. Prior thereto, he was Vice President and Director of Mutual Fund Compliance of the Adviser** since 2012. |
| * | The address for each of the Fund’s Officers is 1345 Avenue of the Americas, New York, NY 10105. |
| ** | The Adviser, ABI and ABIS are affiliates of the Fund. |
The Fund’s Statement of Additional Information (“SAI”) has additional information about the Fund’s Directors and Officers and is available without charge upon request. Contact your financial representative or AB at (800)227-4618, or visit www.abfunds.com, for a free prospectus or SAI.
| | |
| |
| abfunds.com | | AB FLEXFEE CORE OPPORTUNITIES PORTFOLIO | 45 |
Information Regarding the Review and Approval of the Fund’s Advisory Agreement
As described in more detail in the Proxy Statement for the AB Funds dated August 20, 2018, the Boards of the AB Funds, at a meeting held onJuly 31-August 2, 2018, approved new advisory agreements with the Adviser (the “Proposed Agreements”) for the AB Funds, including AB Cap Fund, Inc. in respect of AB FlexFeeTM Core Opportunities Portfolio (the “Fund”), in connection with the planned disposition by AXA S.A. of its remaining shares of AXA Equitable Holdings, Inc. (the indirect holder of a majority of the partnership interests in the Adviser and the indirect parent of AllianceBernstein Corporation, the general partner of the Adviser) in one or more transactions and the related potential for one or more “assignments” (within the meaning of section 2(a)(4) of the Investment Company Act) of the advisory agreements for the AB Funds, including the Fund’s Advisory Agreement, resulting in the automatic termination of such advisory agreements.
At the same meeting, the AB Boards also considered and approved interim advisory agreements with the Adviser (the “Interim Advisory Agreements”) for the AB Funds, including the Fund, to be effective only in the event that stockholder approval of a Proposed Agreement had not been obtained as of the date of one or more transactions resulting in an “assignment” of the Adviser’s advisory agreements, resulting in the automatic termination of such advisory agreements.
The shareholders of the Fund subsequently approved the Proposed Agreements at an annual meeting of shareholders called for the purpose of electing Directors and voting on the Proposed Agreements.
A discussion regarding the basis for the Boards’ approvals at a meeting held onJuly 31-August 2, 2018 is set forth below.
Information Regarding the Review and Approval of the Fund’s Proposed New Advisory Agreement and Interim Advisory Agreement in the Context of Potential Assignments
At a meeting of the AB Boards held on July31-August 2, 2018, the Adviser presented its recommendation that the Boards consider and approve the Proposed Agreements. Section 15(c) of the 1940 Act provides that, after an initial period, a Fund’s Current Agreement and currentsub-advisory agreement, as applicable, will remain in effect only if the Board, including a majority of the Independent Directors, annually reviews and approves them. Each of the Current Agreements had been approved by a Board within theone-year period prior to approval of its related Proposed Agreement, except that the Current Agreements for certain FlexFee funds were approved in February 2017. In connection with their approval of the Proposed Agreements, the Boards considered their conclusions in connection with their most recent approvals of the Current Agreements, in particular in cases where the last approval of a Current Agreement was relatively recent, including the Boards’ general satisfaction with the nature
| | |
| |
| 46 | AB FLEXFEE CORE OPPORTUNITIES PORTFOLIO | | abfunds.com |
and quality of services being provided and, as applicable, in the case of certain Funds, actions taken or to be taken in an effort to improve investment performance or reduce expense ratios. The Directors also reviewed updated information provided by the Adviser in respect of each Fund. Also in connection with their approval of the Proposed Agreements, the Boards considered a representation made to them at that time by the Adviser that there were no additional developments not already disclosed to the Boards since their most recent approvals of the Current Agreements that would be a material consideration to the Boards in connection with their consideration of the Proposed Agreements, except for matters disclosed to the Boards by the Adviser. The Directors considered the fact that each Proposed Agreement would have corresponding terms and conditions identical to those of the corresponding Current Agreement with the exception of the effective date and initial term under the Proposed Agreement.
The Directors considered their knowledge of the nature and quality of the services provided by the Adviser to each Fund gained from their experience as directors or trustees of registered investment companies advised by the Adviser, their overall confidence in the Adviser’s integrity and competence they have gained from that experience, the Adviser’s initiative in identifying and raising potential issues with the Directors and its responsiveness, frankness and attention to concerns raised by the Directors in the past, including the Adviser’s willingness to consider and implement organizational and operational changes designed to improve investment results and the services provided to the Funds. The Directors noted that they have four regular meetings each year, at each of which they review extensive materials and information from the Adviser, including information on the investment performance of each Fund.
The Directors also considered all factors they believed relevant, including the specific matters discussed below. During the course of their deliberations, the Directors evaluated, among other things, the reasonableness of the management fees of the Funds they oversee. The Directors did not identify any particular information that wasall-important or controlling, and different Directors may have attributed different weights to the various factors. The Directors determined that the selection of the Adviser to manage the Funds, and the overall arrangements between the Funds and the Adviser, as provided in the Proposed Agreements, including the management fees, were fair and reasonable in light of the services performed under the Current Agreements and to be performed under the Proposed Agreements, expenses incurred and to be incurred and such other matters as the Directors considered relevant in the exercise of their business judgment. The material factors and conclusions that formed the basis for the Directors’ determinations included the following:
Nature, Extent and Quality of Services Provided
The Directors considered the scope and quality of services to be provided by the Adviser under the Proposed Agreements, including the quality of
| | |
| |
| abfunds.com | | AB FLEXFEE CORE OPPORTUNITIES PORTFOLIO | 47 |
the investment research capabilities of the Adviser and the other resources it has dedicated to performing services for the Funds. They also considered the information that had been provided to them by the Adviser concerning the anticipated implementation of the Plan and the Adviser’s representation that it did not anticipate that such implementation would affect the management or structure of the Adviser, have a material adverse effect on the Adviser, or adversely affect the quality of the services provided to the Funds by the Adviser and its affiliates. The Directors noted that the Adviser from time to time reviews each Fund’s investment strategies and from time to time proposes changes intended to improve the Fund’s relative or absolute performance for the Directors’ consideration. They also noted the professional experience and qualifications of each Fund’s portfolio management team and other senior personnel of the Adviser. The Directors also considered that certain Proposed Agreements, similar to the corresponding Current Agreements, provide that the Funds will reimburse the Adviser for the cost to it of providing certain clerical, accounting, administrative and other services to the Funds by employees of the Adviser or its affiliates. Requests for these reimbursements are made on a quarterly basis and subject to approval by the Directors. The Directors noted that the Adviser did not request any reimbursements from certain Funds in the Fund’s latest fiscal year reviewed. The Directors noted that the methodology to be used to determine the reimbursement amounts had been reviewed by an independent consultant retained by the Funds’ former Senior Officer/Independent Compliance Officer. The quality of administrative and other services, including the Adviser’s role in coordinating the activities of the Funds’ other service providers, also was considered. The Directors of each Fund concluded that, overall, they were satisfied with the nature, extent and quality of services to be provided to the Funds under the Proposed Agreement for the Fund.
Costs of Services to be Provided and Profitability
The Directors reviewed a schedule of the revenues and expenses and related notes indicating the profitability of each Fund to the Adviser for calendar years 2016 and 2017, as applicable, that had been prepared with an expense allocation methodology arrived at in consultation with an independent consultant retained by the Funds’ former Senior Officer/Independent Compliance Officer. The Directors noted the assumptions and methods of allocation used by the Adviser in preparing fund-specific profitability data and understood that there are a number of potentially acceptable allocation methodologies for information of this type. The Directors noted that the profitability information reflected all revenues and expenses of the Adviser’s relationship with a Fund, including those relating to its subsidiaries that provide transfer agency, distribution and brokerage services to the Fund, as applicable. The Directors recognized that it is difficult to make comparisons of the profitability of the Proposed Agreements with the profitability of fund advisory contracts for unaffiliated funds because comparative information is not generally publicly available and is
| | |
| |
| 48 | AB FLEXFEE CORE OPPORTUNITIES PORTFOLIO | | abfunds.com |
affected by numerous factors. The Directors focused on the profitability of the Adviser’s relationship with each Fund before taxes and distribution expenses, as applicable. The Directors noted that certain Funds were not profitable to the Adviser in one or more periods reviewed. The Directors concluded that the Adviser’s level of profitability from its relationship with the other Funds was not unreasonable. The Directors were unable to consider historical information about the profitability of certain Funds that had recently commenced operations and for which historical profitability information was not available. The Adviser agreed to provide the Directors with profitability information in connection with future proposed continuances of the Proposed Agreements.
Fall-Out Benefits
The Directors considered the other benefits to the Adviser and its affiliates from their relationships with the Funds, including, but not limited to, as applicable, benefits relating to soft dollar arrangements (whereby investment advisers receive brokerage and research services from brokers that execute agency transactions for their clients) in the case of certain Funds;12b-1 fees and sales charges received by the principal underwriter (which is a wholly owned subsidiary of the Adviser) in respect of certain classes of the shares of most of the Funds; brokerage commissions paid by certain Funds to brokers affiliated with the Adviser; and transfer agency fees paid by most of the Funds to a wholly owned subsidiary of the Adviser. The Directors recognized that the Adviser’s profitability would be somewhat lower, and that a Fund’s unprofitability to the Adviser would be exacerbated, without these benefits. The Directors understood that the Adviser also might derive reputational and other benefits from its association with the Funds.
Investment Results
In addition to the information reviewed by the Directors in connection with the Board meeting at which the Proposed Agreements were approved, the Directors receive detailed performance information for the Funds at each regular Board meeting during the year.
The Boards’ consideration of each Proposed Agreement was informed by their most recent approval of the related Current Agreement, and, in the case of certain Funds, their discussion with the Adviser of the reasons for those Funds’ underperformance in certain periods. The Directors also reviewed updated performance information and, in some cases, discussed with the Adviser the reasons for changes in performance or continued underperformance. On the basis of this review, the Directors concluded that each Fund’s investment performance was acceptable.
Management Fees and Other Expenses
The Directors considered the management fee rate payable by each Fund to the Adviser and information prepared by an independent service provider
| | |
| |
| abfunds.com | | AB FLEXFEE CORE OPPORTUNITIES PORTFOLIO | 49 |
(the ‘‘15(c) provider’’) concerning management fee rates payable by other funds in the same category as the Fund. The Directors recognized that it is difficult to make comparisons of management fees because there are variations in the services that are included in the fees paid by other funds. The Directors compared each Fund’s contractual management fee rate with a peer group median, and where applicable, took into account the impact on the management fee rate of the administrative expense reimbursement paid to the Adviser in the latest fiscal year. In the case of the ACS Funds, the Directors noted that the management fee rate is zero but also were cognizant that the Adviser is indirectly compensated by the wrap fee program sponsors that use the ACS Funds as an investment vehicle for their clients.
The Directors also considered the Adviser’s fee schedule for other clients pursuing a similar investment style to each Fund. For this purpose, they reviewed the relevant advisory fee information from the Adviser’s Form ADV and in a report from the Funds’ Senior Analyst and noted the differences between a Fund’s fee schedule, on the one hand, and the Adviser’s institutional fee schedule and the schedule of fees charged by the Adviser to any offshore funds and for services to anysub-advised funds pursuing a similar investment strategy as the Fund, on the other, as applicable. The Directors noted that the Adviser may, in some cases, agree to fee rates with large institutional clients that are lower than those reviewed by the Directors and that they had previously discussed with the Adviser its policies in respect of such arrangements. The Adviser also informed the Directors that, in the case of certain Funds, there were no institutional products managed by the Adviser that have a substantially similar investment style. The Directors also discussed these matters with their independent fee consultant.
The Adviser reviewed with the Directors the significantly greater scope of the services it provides to each Fund relative to institutional, offshore fund andsub-advised fund clients, as applicable. In this regard, the Adviser noted, among other things, that, compared to institutional and offshore orsub-advisory accounts, each Fund, as applicable, (i) demands considerably more portfolio management, research and trading resources due to significantly higher daily cash flows (in the case ofopen-end Funds); (ii) has more tax and regulatory restrictions and compliance obligations; (iii) must prepare and file or distribute regulatory and other communications about fund operations; and (iv) must provide shareholder servicing to retail investors. The Adviser also reviewed the greater legal risks presented by the large and changing population of Fund shareholders who may assert claims against the Adviser in individual or class actions, and the greater entrepreneurial risk in offering new fund products, which require substantial investment to launch, may not succeed, and generally must be priced to compete with larger, more established funds resulting in lack of profitability to the Adviser until a new fund achieves scale. In light of the substantial differences in services rendered by the Adviser to institutional,
| | |
| |
| 50 | AB FLEXFEE CORE OPPORTUNITIES PORTFOLIO | | abfunds.com |
offshore fund andsub-advised fund clients as compared to the Funds, and the different risk profile, the Directors considered these fee comparisons inapt and did not place significant weight on them in their deliberations.
The Directors noted that many of the Funds may invest in shares of exchange-traded funds (‘‘ETFs’’), subject to the restrictions and limitations of the 1940 Act as these may be varied as a result of exemptive orders issued by the SEC. The Directors also noted that ETFs pay advisory fees pursuant to their advisory contracts. The Directors concluded, based on the Adviser’s explanation of how it uses ETFs when they are the most cost-effective way to obtain desired exposures, in some cases pending purchases of underlying securities, that each Fund’s management fee would be for services that would be in addition to, rather than duplicative of, the services provided under the advisory contracts of the ETFs.
With respect to each Fund’s management fee, the Directors considered the total expense ratio of the Fund in comparison to a peer group and peer universe selected by the 15(c) service provider. The Directors also considered the Adviser’s expense caps for certain Funds. The Directors view expense ratio information as relevant to their evaluation of the Adviser’s services because the Adviser is responsible for coordinating services provided to a Fund by others.
The Boards’ consideration of each Proposed Agreement was informed by their most recent approval of the related Current Agreement, and, in the case of certain Funds, their discussion with the Adviser of the reasons for those Funds’ expense ratios in certain periods. The Directors also reviewed updated expense ratio information and, in some cases, discussed with the Adviser the reasons for the expense ratios of certain Funds. On the basis of this review, the Directors concluded that each Fund’s expense ratio was acceptable.
The Directors did not consider comparative expense information for the ACS Funds because those Funds do not bear ordinary expenses.
Economies of Scale
The Directors noted that the management fee schedules for certain Funds do not contain breakpoints and that they had discussed their strong preference for breakpoints in advisory contracts with the Adviser. The Directors took into consideration prior presentations by an independent consultant on economies of scale in the mutual fund industry and for the Funds, and by the Adviser concerning certain of its views on economies of scale. The Directors also had requested and received from the Adviser certain updates on economies of scale in advance of the Board meeting. The Directors believe that economies of scale may be realized (if at all) by the Adviser across a variety of products and services, and not only in respect of a single fund. The Directors noted that there is no established methodology for setting breakpoints that give effect to the fund-specific
| | |
| |
| abfunds.com | | AB FLEXFEE CORE OPPORTUNITIES PORTFOLIO | 51 |
services provided by a fund’s adviser and to the economies of scale that an adviser may realize in its overall mutual fund business or those components of it which directly or indirectly affect a fund’s operations. The Directors observed that in the mutual fund industry as a whole, as well as among funds similar to each Fund, there is no uniformity or pattern in the fees and asset levels at which breakpoints (if any) apply. The Directors also noted that the advisory agreements for many funds do not have breakpoints at all. The Directors informed the Adviser that they would monitor the asset levels of the Funds without breakpoints and their profitability to the Adviser and anticipated revisiting the question of breakpoints in the future if circumstances warrant doing so.
The Directors did not consider the extent to which fee levels in the Advisory Agreement for the ACS Funds reflect economies of scale because that Advisory Agreement does not provide for any compensation to be paid to the Adviser by the ACS Funds and the expense ratio of each of those Funds is zero.
Interim Advisory Agreements
In approving the Interim Advisory Agreements, the Boards, with the assistance of independent counsel, considered similar factors to those considered in approving the Proposed Agreements. The Interim Advisory Agreements approved by the Boards are identical to the Proposed Agreements, as well as the Current Agreements, in all material respects except for their proposed effective and termination dates and provisions intended to comply with the requirements of the relevant SEC rule, such as provisions requiring escrow of advisory fees. Under the Interim Advisory Agreements, the Adviser would continue to manage a Fund pursuant to an Interim Advisory Agreement until a new advisory agreement was approved by stockholders or until the end of the150-day period, whichever would occur earlier. All fees earned by the Adviser under an Interim Advisory Agreement would be held in escrow pending shareholder approval of the Proposed Agreement. Upon approval of a new advisory agreement by stockholders, the escrowed management fees would be paid to the Adviser, and the Interim Advisory Agreement would terminate.
| | |
| |
| 52 | AB FLEXFEE CORE OPPORTUNITIES PORTFOLIO | | abfunds.com |
This page is not part of the Shareholder Report or the Financial Statements.
AB FAMILY OF FUNDS
US EQUITY
US CORE
Core Opportunities Fund
FlexFee™ US Thematic Portfolio
Select US Equity Portfolio
US GROWTH
Concentrated Growth Fund
Discovery Growth Fund
FlexFee™ Large Cap Growth Portfolio
Growth Fund
Large Cap Growth Fund
Small Cap Growth Portfolio
US VALUE
Discovery Value Fund
Equity Income Fund
Relative Value Fund
Small Cap Value Portfolio
Value Fund
INTERNATIONAL/ GLOBAL EQUITY
INTERNATIONAL/ GLOBAL CORE
FlexFee™ International Strategic Core Portfolio
Global Core Equity Portfolio
International Portfolio
International Strategic Core Portfolio
Sustainable Global Thematic Fund
Tax-Managed International Portfolio
Tax-Managed Wealth Appreciation Strategy
Wealth Appreciation Strategy
INTERNATIONAL/ GLOBAL GROWTH
Concentrated International Growth Portfolio
FlexFee™ Emerging Markets Growth Portfolio
INTERNATIONAL/ GLOBAL EQUITY(continued)
Sustainable International Thematic Fund
INTERNATIONAL/ GLOBAL VALUE
All China Equity Portfolio
International Value Fund
FIXED INCOME
MUNICIPAL
High Income Municipal Portfolio
Intermediate California Municipal Portfolio
Intermediate Diversified Municipal Portfolio
Intermediate New York Municipal Portfolio
Municipal Bond Inflation Strategy
Tax-Aware Fixed Income Portfolio
National Portfolio
Arizona Portfolio
California Portfolio
Massachusetts Portfolio
Minnesota Portfolio
New Jersey Portfolio
New York Portfolio
Ohio Portfolio
Pennsylvania Portfolio
Virginia Portfolio
TAXABLE
Bond Inflation Strategy
FlexFee™ High Yield Portfolio1
FlexFee™ International Bond Portfolio
Global Bond Fund
High Income Fund
Income Fund
Intermediate Bond Portfolio
Limited Duration High Income Portfolio
Short Duration Portfolio
ALTERNATIVES
All Market Real Return Portfolio
Global Real Estate Investment Fund
Select US Long/Short Portfolio
Unconstrained Bond Fund
MULTI-ASSET
All Market Income Portfolio
All Market Total Return Portfolio
Conservative Wealth Strategy
Emerging Markets Multi-Asset Portfolio
Global Risk Allocation Fund
Tax-Managed All Market Income Portfolio
TARGET-DATE
Multi-Manager Select Retirement Allocation Fund
Multi-Manager Select 2010 Fund
Multi-Manager Select 2015 Fund
Multi-Manager Select 2020 Fund
Multi-Manager Select 2025 Fund
Multi-Manager Select 2030 Fund
Multi-Manager Select 2035 Fund
Multi-Manager Select 2040 Fund
Multi-Manager Select 2045 Fund
Multi-Manager Select 2050 Fund
Multi-Manager Select 2055 Fund
Multi-Manager Select 2060 Fund
CLOSED-END FUNDS
Alliance California Municipal Income Fund
AllianceBernstein Global High Income Fund
AllianceBernstein National Municipal Income Fund
We also offer Government Money Market Portfolio, which serves as the money market fund exchange vehicle for the AB mutual funds. You could lose money by investing in the Fund. Although the Fund seeks to preserve the value of your investment at $1.00 per share, it cannot guarantee it will do so. The Fund may impose a fee upon sale of your shares or may temporarily suspend your ability to sell shares if the Fund’s liquidity falls below required minimums because of market conditions or other factors. An investment in the Fund is not insured or guaranteed by the Federal Deposit Insurance Corporation or any other government agency. The Fund’s sponsor has no legal obligation to provide financial support to the Fund, and you should not expect that the sponsor will provide financial support to the Fund at any time.
Investors should consider the investment objectives, risks, charges and expenses of the Fund carefully before investing. For copies of our prospectus or summary prospectus, which contain this and other information, visit us online at www.abfunds.com or contact your AB representative. Please read the prospectus and/or summary prospectus carefully before investing.
| 1 | Prior to February 23, 2018, FlexFee High Yield Portfolio was named High Yield Portfolio. |
| | |
| |
| abfunds.com | | AB FLEXFEE CORE OPPORTUNITIES PORTFOLIO | 53 |
NOTES
| | |
| |
| 54 | AB FLEXFEE CORE OPPORTUNITIES PORTFOLIO | | abfunds.com |
NOTES
| | |
| |
| abfunds.com | | AB FLEXFEE CORE OPPORTUNITIES PORTFOLIO | 55 |
NOTES
| | |
| |
| 56 | AB FLEXFEE CORE OPPORTUNITIES PORTFOLIO | | abfunds.com |
AB FLEXFEE CORE OPPORTUNITIES PORTFOLIO
1345 Avenue of the Americas
New York, NY 10105
800 221 5672
FFCO-0151-1218 
DEC 12.31.18

ANNUAL REPORT
AB FLEXFEETM EMERGING MARKETS GROWTH PORTFOLIO

Beginning January 1, 2021, as permitted by new regulations adopted by the Securities and Exchange Commission, the Fund’s annual and semi-annual shareholder reports will no longer be sent by mail, unless you specifically request paper copies of the reports. Instead, the reports will be made available on a website, and you will be notified by mail each time a report is posted and provided with a website address to access the report.
If you already elected to receive shareholder reports electronically, you will not be affected by this change and you need not take any action. You may elect to receive shareholder reports and other communications from the Fund electronically at any time by contacting your financial intermediary (such as a broker-dealer or bank) or, if you are a direct investor, by calling the Fund at (800) 221 5672.
You may elect to receive all future reports in paper form free of charge. If you invest through a financial intermediary, you can contact your financial intermediary to request that you continue to receive paper copies of your shareholder reports; if you invest directly with the Fund, you can call the Fund at (800) 221 5672. Your election to receive reports in paper form will apply to all funds held in your account with your financial intermediary or, if you invest directly, to all AB Mutual Funds you hold.
| | |
| |
| Investment Products Offered | | • Are Not FDIC Insured• May Lose Value• Are Not Bank Guaranteed |
Investors should consider the investment objectives, risks, charges and expenses of the Fund carefully before investing. For copies of our prospectus or summary prospectus, which contain this and other information, visit us online at www.abfunds.com or contact your AB representative. Please read the prospectus and/or summary prospectus carefully before investing.
This shareholder report must be preceded or accompanied by the Fund’s prospectus for individuals who are not current shareholders of the Fund.
You may obtain a description of the Fund’s proxy voting policies and procedures, and information regarding how the Fund voted proxies relating to portfolio securities during the most recent12-month period ended June 30, without charge. Simply visit AB’s website at www.abfunds.com, or go to the Securities and Exchange Commission’s (the “Commission”) website at www.sec.gov, or call AB at (800) 227 4618.
The Fund files its complete schedule of portfolio holdings with the Commission for the first and third quarters of each fiscal year. The Fund’s portfolio holdings reports are available on the Commission’s website at www.sec.gov. The Fund’s portfolio holdings reports may also be reviewed and copied at the Commission’s Public Reference Room in Washington, DC; information on the operation of the Public Reference Room may be obtained by calling (800) SEC 0330. AB publishes full portfolio holdings for the Fund monthly at www.abfunds.com.
AllianceBernstein Investments, Inc. (ABI) is the distributor of the AB family of mutual funds. ABI is a member of FINRA and is an affiliate of AllianceBernstein L.P., the Adviser of the funds.
The [A/B] logo is a registered service mark of AllianceBernstein and AllianceBernstein® is a registered service mark used by permission of the owner, AllianceBernstein L.P.
| | |
| FROM THE PRESIDENT | |  |
Dear Shareholder,
We are pleased to provide this report for AB FlexFee Emerging Markets Growth Portfolio (the “Fund”). Please review the discussion of Fund performance, the market conditions during the reporting period and the Fund’s investment strategy.
As always, AB strives to keep clients ahead of what’s next by:
| + | | Transforming uncommon insights into uncommon knowledge with a global research scope |
| + | | Navigating markets with seasoned investment experience and sophisticated solutions |
| + | | Providing thoughtful investment insights and actionable ideas |
Whether you’re an individual investor or a multi-billion-dollar institution, we put knowledge and experience to work for you.
AB’s global research organization connects and collaborates across platforms and teams to deliver impactful insights and innovative products. Better insights lead to better opportunities—anywhere in the world.
For additional information about AB’s range of products and shareholder resources, please log on to www.abfunds.com.
Thank you for your investment in the AB Mutual Funds.
Sincerely,

Robert M. Keith
President and Chief Executive Officer, AB Mutual Funds
| | |
| |
| abfunds.com | | AB FLEXFEE EMERGING MARKETS GROWTH PORTFOLIO | 1 |
ANNUAL REPORT
February 19, 2019
This report provides management’s discussion of fund performance for AB FlexFee Emerging Markets Growth Portfolio for the annual reporting period ended December 31, 2018.
The Fund’s investment objective is to seek long-term growth of capital.
NAV RETURNS AS OF DECEMBER 31, 2018(unaudited)
| | | | | | | | |
| | |
| | | 6 Months | | | 12 Months | |
| | |
| AB FLEXFEE EMERGING MARKETS GROWTH PORTFOLIO | | | | | | | | |
| | |
| Advisor Class Shares1 | | | -20.90% | | | | -25.26% | |
| | |
| MSCI EM Index (net) | | | -8.48% | | | | -14.57% | |
| 1 | The returns shown are based on net asset values calculated for shareholder transactions and may differ from the returns shown in the Financial Highlights, which reflect adjustments made to the net asset values in accordance with accounting principles generally accepted in the United States of America. |
INVESTMENT RESULTS
The table above shows the Fund’s performance compared to its benchmark, the Morgan Stanley Capital International Emerging Markets (“MSCI EM”) Index (net), for the six- and 12-month periods ended December 31, 2018.
The Fund underperformed the benchmark for both periods. The Fund’s performance-based advisory fee, for the performance period from July 1, 2017 through December 31, 2018, was accrued at the minimum rate.
Underperformance versus the benchmark for both periods was driven primarily by stock selection in China, and was spread evenly across a range of sectors. The US-China trade dispute that began in the spring of 2018 escalated over the course of the year. The Fund’s Chinese holdings are tied to domestic growth, and therefore mostly insulated from the direct impact of a trade war, performed poorly as sentiment weighed heavily on these growth stocks. The broad-based sell-off continued until the end of 2018, despite many of the companies reporting solid earnings results. A sharp sell-off in Indian financial stocks during the six-month period also detracted from returns, although this underperformance was mitigated toward the end of the reporting period, as Indian stocks rebounded. Holdings in Brazil contributed amid optimism over the results of the country’s presidential election.
During the periods, both an overweight and stock selection in the technology sector detracted. Stock selection in financials also detracted, although an overweight in the sector somewhat offset the losses.
| | |
| |
| 2 | AB FLEXFEE EMERGING MARKETS GROWTH PORTFOLIO | | abfunds.com |
The Fund utilized futures for investment purposes, which detracted from absolute performance for both periods.
MARKET REVIEW AND INVESTMENT STRATEGY
Emerging-market equities fell sharply during 2018, amid concerns about the US-China trade dispute, rising US interest rates and weakening commodity prices. Investor sentiment regarding China worsened in the second half of 2018 due to trade woes and slowing growth. Toward the end of the reporting period, China and the US initiated serious trade talks, and China was making significant concessions towards reaching a mutually beneficial deal including committing to purchase US soybeans and revising its Made in China 2025 initiative to remove market share targets. In the third quarter of 2018, Indian markets fell sharply due to fears around higher funding costs that spread after missed debt payments by a key Indian infrastructure lender. With the government stepping in to prevent broader contagion and falling oil prices, Indian markets recovered in the fourth quarter. Rising interest rates weighed on global markets in 2018, as the US Federal Reserve (the “Fed”) raised its target benchmark rate four times. However, the likelihood of continued rate increases fell toward the end of the reporting period, boosting sentiment on emerging markets, as the Fed adopted a more dovish tone.
The Fund’s Senior Portfolio Management Team (the “Team”) remains calm in this difficult market environment, continuing to focus on long-term fundamentals and to allocate capital where the Team has the most conviction. Recent pullbacks in some high-quality businesses are viewed as opportunities to add to the Fund’s best ideas. The Team remains highly confident in the Fund’s positioning and believes that performance potential is attractive, as the headwinds that drove underperformance in 2018 abate.
INVESTMENT POLICIES
At least 80% of the Fund’s net assets will under normal circumstances be invested in securities of emerging-market companies and related derivatives. An emerging-market country is a country whose per capita gross national income is not classified as “High Income” by the World Bank, that is not a member of the Organization for Economic Co-Operation and Development, or that is represented in a MSCI emerging-market equity index. Examples of emerging-market countries include Argentina, Brazil, Chile, Croatia, Egypt, Hong Kong, India, Indonesia, Kazakhstan, Malaysia, Mexico, the People’s Republic of China, Peru, the Philippines, Poland, Russia, South Africa, Taiwan, Thailand, Turkey and Venezuela. Emerging-market countries may include countries referred to as “frontier” markets, such as Egypt, Nigeria and Vietnam. In managing the Fund, the Adviser will employ a “bottom up” investment process that focuses on a company’s prospective earnings growth, valuation and business quality. The Adviser
(continued on next page)
| | |
| |
| abfunds.com | | AB FLEXFEE EMERGING MARKETS GROWTH PORTFOLIO | 3 |
will typically look for companies that have strong, experienced management teams and the potential to support greater than expected earnings growth rates, and will combine fundamental and quantitative analyses in its stock selection process. The Adviser will not target any particular country, sector or market capitalization weightings for the Fund.
Fluctuations in currency exchange rates can have a dramatic impact on the returns of equity securities. While the Adviser may hedge the foreign currency exposure resulting from the Fund’s security positions through the use of currency-related derivatives, it is not required to do so. The Fund may also take long and short positions in currencies (or related derivatives) independent of any such security positions, including taking a position in a currency when it does not hold any securities traded in that currency.
| | |
| |
| 4 | AB FLEXFEE EMERGING MARKETS GROWTH PORTFOLIO | | abfunds.com |
DISCLOSURES AND RISKS
Benchmark Disclosure
The MSCI EM Index is unmanaged and does not reflect fees and expenses associated with the active management of a mutual fund portfolio. The MSCI EM Index (net, free float-adjusted, market capitalization weighted) represents the equity market performance of emerging markets. MSCI makes no express or implied warranties or representations, and shall have no liability whatsoever with respect to any MSCI data contained herein. The MSCI data may not be further redistributed or used as a basis for other indices, any securities or financial products. This report is not approved, reviewed or produced by MSCI. An investor cannot invest directly in an index, and its results are not indicative of the performance for any specific investment, including the Fund.
A Word About Risk
Emerging-Market Risk: Investments in emerging-market countries may have more risk because the markets are less developed and less liquid, and because these investments may be subject to increased economic, political, regulatory or other uncertainties.
Market Risk: The value of the Fund’s assets will fluctuate as the stock or bond market fluctuates. The value of its investments may decline, sometimes rapidly and unpredictably, simply because of economic changes or other events that affect large portions of the market. It includes the risk that a particular style of investing, such as the Fund’s growth approach, may underperform the market generally.
Foreign (Non-US) Risk: Investments in securities of non-US issuers may involve more risk than those of US issuers. These securities may fluctuate more widely in price and may be less liquid due to adverse market, economic, political, regulatory or other factors.
Currency Risk: Fluctuations in currency exchange rates may negatively affect the value of the Fund’s investments or reduce its returns.
Derivatives Risk: Derivatives may be illiquid, difficult to price, and leveraged so that small changes may produce disproportionate losses for the Fund, and may be subject to counterparty risk to a greater degree than more traditional investments.
Sector Risk: The Fund may have more risk because of concentrated investments in a particular market sector, such as the technology or financial services sector. Market or economic factors affecting that sector could have a major effect on the value of the Fund’s investments.
Management Risk: The Fund is subject to management risk because it is an actively managed investment fund. The Adviser will apply its investment
| | |
| |
| abfunds.com | | AB FLEXFEE EMERGING MARKETS GROWTH PORTFOLIO | 5 |
DISCLOSURES AND RISKS(continued)
techniques and risk analyses in making investment decisions for the Fund, but there is no guarantee that its techniques will produce the intended results.
These risks are fully discussed in the Fund’s prospectus. As with all investments, you may lose money by investing in the Fund.
An Important Note About Historical Performance
The investment return and principal value of an investment in the Fund will fluctuate, so that shares, when redeemed, may be worth more or less than their original cost. Performance shown in this report represents past performance and does not guarantee future results. Current performance may be lower or higher than the performance information shown. You may obtain performance information current to the most recent month-end by visiting www.abfunds.com.
All fees and expenses related to the operation of the Fund have been deducted. Net asset value (“NAV”) returns do not reflect sales charges; if sales charges were reflected, the Fund’s quoted performance would be lower. SEC returns reflect the applicable sales charges for each share class. Returns for the different share classes will vary due to different expenses associated with each class. Performance assumes reinvestment of distributions and does not account for taxes.
| | |
| |
| 6 | AB FLEXFEE EMERGING MARKETS GROWTH PORTFOLIO | | abfunds.com |
HISTORICAL PERFORMANCE
GROWTH OF A $10,000 INVESTMENT IN THE FUND(unaudited)
11/13/20141 TO 12/31/2018
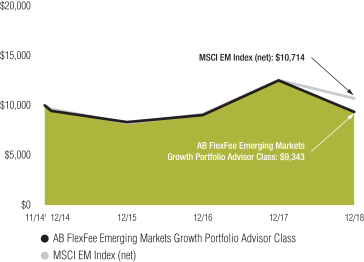
This chart illustrates the total value of an assumed $10,000 investment in AB FlexFee Emerging Markets Growth Portfolio Advisor Class shares (from 11/13/20141 to 12/31/2018) as compared to the performance of the Fund’s benchmark.
| 1 | Inception date: 11/13/2014. |
| | |
| |
| abfunds.com | | AB FLEXFEE EMERGING MARKETS GROWTH PORTFOLIO | 7 |
HISTORICAL PERFORMANCE(continued)
AVERAGE ANNUAL RETURNS AS OF DECEMBER 31, 2018(unaudited)
| | | | | | | | |
| | |
| | | NAV Returns | | | SEC Returns
(reflects applicable
sales charges) | |
| | |
| ADVISOR CLASS SHARES1 | | | | | | | | |
| | |
| 1 Year | | | -25.26% | | | | -25.26% | |
| | |
| Since Inception2 | | | -1.63% | | | | -1.63% | |
SEC AVERAGE ANNUAL RETURNS
AS OF THE MOST RECENT CALENDAR QUARTER-END
DECEMBER 31, 2018(unaudited)
| | | | |
| |
| | | SEC Returns
(reflects applicable
sales charges) | |
| |
| ADVISOR CLASS SHARES | | | | |
| |
| 1 Year | | | -25.26% | |
| |
| Since Inception2 | | | -1.63% | |
The Fund’s current prospectus fee table shows the Fund’s total annual operating expense ratio as 7.08% for Advisor Class shares, gross of any fee waivers or expense reimbursements. Contractual fee waivers and/or expense reimbursements limit the Fund’s annual operating expense ratio exclusive of the Fund’s advisory fee, acquired fund fees and expenses other than the advisory fees of any AB mutual funds in which the Fund may invest, interest expense, taxes, extraordinary expenses, and brokerage commissions and other transaction costs to 0.10% for Advisor Class shares. These waivers/reimbursements may not be terminated before June 11, 2019. Any fees waived and expenses borne by the Adviser through December 31, 2018, may be reimbursed by the Fund until the end of the third fiscal year after the fiscal period in which the fee was waived or the expense was borne, provided that no reimbursement payment will be made that would cause the Fund’s total other expenses to exceed the expense limitation. Absent reimbursements or waivers, performance would have been lower. The Financial Highlights section of this report sets forth expense ratio data for the current reporting period; the expense ratio shown above may differ from the expense ratio in the Financial Highlights section since they are based on different time periods.
| 1 | This share class is offered at NAV to eligible investors and the SEC returns are the same as the NAV returns. |
| 2 | Inception date: 11/13/2014. |
| | |
| |
| 8 | AB FLEXFEE EMERGING MARKETS GROWTH PORTFOLIO | | abfunds.com |
EXPENSE EXAMPLE
(unaudited)
As a shareholder of the Fund, you incur two types of costs: (1) transaction costs, including sales charges (loads) on purchase payments, contingent deferred sales charges on redemptions and (2) ongoing costs, including advisory fees; distribution(12b-1) fees; and other Fund expenses. This example is intended to help you understand your ongoing costs (in dollars) of investing in the Fund and to compare these costs with the ongoing costs of investing in other mutual funds.
The Example is based on an investment of $1,000 invested at the beginning of the period and held for the entire period as indicated below.
Actual Expenses
The table below provides information about actual account values and actual expenses. You may use the information, together with the amount you invested, to estimate the expenses that you paid over the period. Simply divide your account value by $1,000 (for example, an $8,600 account value divided by $1,000 = 8.6), then multiply the result by the number under the heading entitled “Expenses Paid During Period” to estimate the expenses you paid on your account during this period.
Hypothetical Example for Comparison Purposes
The table below also provides information about hypothetical account values and hypothetical expenses based on the Fund’s actual expense ratio and an assumed annual rate of return of 5% before expenses, which is not the Fund’s actual return. The hypothetical account values and expenses may not be used to estimate the actual ending account balance or expenses you paid for the period. You may use this information to compare the ongoing costs of investing in the Fund and other funds by comparing this 5% hypothetical example with the 5% hypothetical examples that appear in the shareholder reports of other funds.
Please note that the expenses shown in the table are meant to highlight your ongoing costs only and do not reflect any transactional costs, such as sales charges (loads), or contingent deferred sales charges on redemptions. Therefore, the hypothetical example is useful in comparing ongoing costs only, and will not help you determine the relative total costs of owning different funds. In addition, if these transactional costs were included, your costs would have been higher.
| | | | | | | | | | | | | | | | |
| | | Beginning
Account Value
7/1/2018 | | | Ending
Account Value
12/31/2018 | | | Expenses Paid
During Period* | | | Annualized
Expense Ratio* | |
| Advisor Class | | | | | | | | | | | | | |
Actual | | $ | 1,000 | | | $ | 790.10 | | | $ | 0.68 | | | | 0.15 | % |
Hypothetical** | | $ | 1,000 | | | $ | 1,024.45 | | | $ | 0.77 | | | | 0.15 | % |
| * | Expenses are equal to the classes’ annualized expense ratios multiplied by the average account value over the period, multiplied by 184/365 (to reflect the one-half year period). |
| ** | Assumes 5% annual return before expenses. |
| | |
| |
| abfunds.com | | AB FLEXFEE EMERGING MARKETS GROWTH PORTFOLIO | 9 |
PORTFOLIO SUMMARY
December 31, 2018(unaudited)
PORTFOLIO STATISTICS
Net Assets ($mil): $4.7
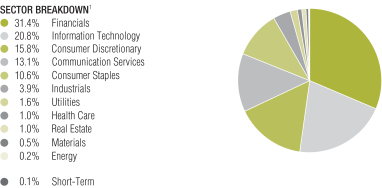
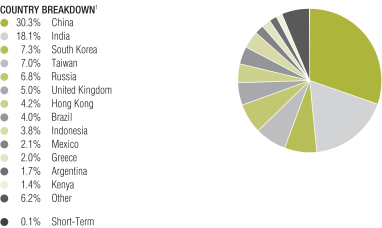
| 1 | All data are as of December 31, 2018. The Fund’s sector and country breakdowns are expressed as a percentage of total investments (excluding security lending collateral) and may vary over time. “Other” country weightings represent 1.2% or less in the following countries: Malaysia, Netherlands, Peru, Philippines, Poland, South Africa, Switzerland, United Arab Emirates and Vietnam. |
Please note: The sector classifications presented herein are based on the Global Industry Classification Standard (GICS) which was developed by Morgan Stanley Capital International and Standard & Poor’s. The components are divided into sector, industry group, and industry sub-indices as classified by the GICS for each of the market capitalization indices in the broad market. These sector classifications are broadly defined. The “Portfolio of Investments” section of the report reflects more specific industry information and is consistent with the investment restrictions discussed in the Fund’s prospectus.
| | |
| |
| 10 | AB FLEXFEE EMERGING MARKETS GROWTH PORTFOLIO | | abfunds.com |
PORTFOLIO SUMMARY(continued)
December 31, 2018(unaudited)
TEN LARGEST HOLDINGS1
| | | | | | | | |
| | |
| Company | | U.S. $ Value | | | Percent of
Net Assets | |
| | |
| Alibaba Group Holding Ltd. (Sponsored ADR) | | $ | 297,305 | | | | 6.4 | % |
| | |
| Tencent Holdings Ltd. | | | 248,498 | | | | 5.3 | |
| | |
| Taiwan Semiconductor Manufacturing Co., Ltd. | | | 246,882 | | | | 5.3 | |
| | |
| Samsung Electronics Co., Ltd. (Preference Shares) | | | 241,895 | | | | 5.2 | |
| | |
| Housing Development Finance Corp., Ltd. | | | 186,759 | | | | 4.0 | |
| | |
| AIA Group Ltd. | | | 147,861 | | | | 3.2 | |
| | |
| HDFC Bank Ltd. | | | 140,099 | | | | 3.0 | |
| | |
| Kweichow Moutai Co., Ltd. – Class A | | | 132,109 | | | | 2.8 | |
| | |
| Bank Central Asia Tbk PT | | | 124,783 | | | | 2.7 | |
| | |
| Prudential PLC | | | 121,960 | | | | 2.6 | |
| | |
| | $ | 1,888,151 | | | | 40.5 | % |
| | |
| |
| abfunds.com | | AB FLEXFEE EMERGING MARKETS GROWTH PORTFOLIO | 11 |
PORTFOLIO OF INVESTMENTS
December 31, 2018
| | | | | | | | | | | | |
| Company | | | | |
Shares | | | U.S. $ Value | |
| |
| | | | | | | | | | | | |
COMMON STOCKS – 100.7% | | | | | | | | | | | | |
Financials – 32.0% | | | | | | | | | | | | |
Banks – 17.4% | | | | | | | | | | | | |
Banco Macro SA (ADR) | | | | | | | 1,782 | | | $ | 78,800 | |
Bank Central Asia Tbk PT | | | | | | | 69,000 | | | | 124,783 | |
Bank Mandiri Persero Tbk PT | | | | | | | 46,000 | | | | 23,597 | |
Credicorp Ltd. | | | | | | | 230 | | | | 50,984 | |
Grupo Financiero Banorte SAB de CV – Class O | | | | | | | 20,350 | | | | 99,339 | |
HDFC Bank Ltd. | | | | | | | 4,610 | | | | 140,099 | |
IndusInd Bank Ltd. | | | | | | | 4,110 | | | | 94,142 | |
Itau Unibanco Holding SA (ADR) | | | | | | | 6,915 | | | | 63,203 | |
Sberbank of Russia PJSC (Sponsored ADR) | | | | | | | 7,929 | | | | 86,902 | |
TCS Group Holding PLC (GDR)(a) | | | | | | | 3,040 | | | | 47,302 | |
| | | | | | | | | | | | |
| | | | | | | | | | | 809,151 | |
| | | | | | | | | | | | |
Consumer Finance – 2.7% | | | | | | | | | | | | |
Manappuram Finance Ltd. | | | | | | | 27,440 | | | | 36,565 | |
Muthoot Finance Ltd. | | | | | | | 3,910 | | | | 28,986 | |
Repco Home Finance Ltd. | | | | | | | 10,830 | | | | 61,804 | |
| | | | | | | | | | | | |
| | | | | | | | | | | 127,355 | |
| | | | | | | | | | | | |
Insurance – 5.8% | | | | | | | | | | | | |
AIA Group Ltd. | | | | | | | 17,800 | | | | 147,861 | |
Prudential PLC | | | | | | | 6,830 | | | | 121,960 | |
| | | | | | | | | | | | |
| | | | | | | | | | | 269,821 | |
| | | | | | | | | | | | |
Thrifts & Mortgage Finance – 6.1% | | | | | | | | | | | | |
Housing Development Finance Corp., Ltd. | | | | | | | 6,640 | | | | 186,759 | |
Indiabulls Housing Finance Ltd. | | | | | | | 8,150 | | | | 99,453 | |
| | | | | | | | | | | | |
| | | | | | | | | | | 286,212 | |
| | | | | | | | | | | | |
| | | | | | | | | | | 1,492,539 | |
| | | | | | | | | | | | |
Information Technology – 21.1% | | | | | | | | | | | | |
Electronic Equipment, Instruments & Components – 6.1% | | | | | | | | | | | | |
Elite Material Co., Ltd. | | | | | | | 34,000 | | | | 72,726 | |
Hangzhou Hikvision Digital Technology Co., Ltd. – Class A | | | | | | | 24,600 | | | | 92,791 | |
Samsung SDI Co., Ltd. | | | | | | | 120 | | | | 23,587 | |
Sunny Optical Technology Group Co., Ltd. | | | | | | | 6,000 | | | | 53,364 | |
Tongda Group Holdings Ltd. | | | | | | | 220,000 | | | | 21,831 | |
Zhejiang Dahua Technology Co., Ltd. – Class A | | | | | | | 12,500 | | | | 20,977 | |
| | | | | | | | | | | | |
| | | | | | | | | | | 285,276 | |
| | | | | | | | | | | | |
IT Services – 0.3% | | | | | | | | | | | | |
My EG Services Bhd | | | | | | | 60,500 | | | | 14,296 | |
| | | | | | | | | | | | |
| | | |
Semiconductors & Semiconductor Equipment – 9.5% | | | | | | | | | | | | |
Koh Young Technology, Inc. | | | | | | | 490 | | | | 36,276 | |
Realtek Semiconductor Corp. | | | | | | | 3,000 | | | | 13,914 | |
| | |
| |
| 12 | AB FLEXFEE EMERGING MARKETS GROWTH PORTFOLIO | | abfunds.com |
PORTFOLIO OF INVESTMENTS(continued)
| | | | | | | | | | | | |
| Company | | | | |
Shares | | | U.S. $ Value | |
| |
| | | | | | | | | | | | |
Silergy Corp. | | | | | | | 7,000 | | | $ | 103,010 | |
SK Hynix, Inc. | | | | | | | 800 | | | | 43,613 | |
Taiwan Semiconductor Manufacturing Co., Ltd. | | | | | | | 34,000 | | | | 246,882 | |
| | | | | | | | | | | | |
| | | | | | | | | | | 443,695 | |
| | | | | | | | | | | | |
Technology Hardware, Storage & Peripherals – 5.2% | | | | | | | | | | | | |
Samsung Electronics Co., Ltd. | | | | | | | 2,820 | | | | 98,169 | |
Samsung Electronics Co., Ltd. (Preference Shares) | | | | | | | 5,030 | | | | 143,726 | |
| | | | | | | | | | | | |
| | | | | | | | | | | 241,895 | |
| | | | | | | | | | | | |
| | | | | | | | | | | 985,162 | |
| | | | | | | | | | | | |
Consumer Discretionary – 15.8% | | | | | | | | | | | | |
Auto Components – 0.6% | | | | | | | | | | | | |
MRF Ltd. | | | | | | | 28 | | | | 26,765 | |
| | | | | | | | | | | | |
| | | |
Diversified Consumer Services – 0.6% | | | | | | | | | | | | |
Four Seasons Education Cayman, Inc. (ADR) | | | | | | | 1,102 | | | | 2,700 | |
Fu Shou Yuan International Group Ltd. | | | | | | | 34,000 | | | | 25,649 | |
| | | | | | | | | | | | |
| | | | | | | | | | | 28,349 | |
| | | | | | | | | | | | |
Hotels, Restaurants & Leisure – 3.6% | | | | | | | | | | | | |
CVC Brasil Operadora e Agencia de Viagens SA | | | | | | | 2,500 | | | | 39,410 | |
Huazhu Group Ltd. (ADR) | | | | | | | 810 | | | | 23,190 | |
OPAP SA | | | | | | | 10,830 | | | | 94,192 | |
Premium Leisure Corp. | | | | | | | 845,000 | | | | 12,855 | |
| | | | | | | | | | | | |
| | | | | | | | | | | 169,647 | |
| | | | | | | | | | | | |
Internet & Direct Marketing Retail – 11.0% | | | | | | | | | | | | |
Alibaba Group Holding Ltd. (Sponsored ADR)(b) | | | | | | | 2,169 | | | | 297,305 | |
Baozun, Inc. (Sponsored ADR)(b)(c) | | | | | | | 1,870 | | | | 54,623 | |
Ctrip.com International Ltd. (ADR)(b) | | | | | | | 4,460 | | | | 120,687 | |
MakeMyTrip Ltd.(b) | | | | | | | 1,680 | | | | 40,874 | |
| | | | | | | | | | | | |
| | | | | | | | | | | 513,489 | |
| | | | | | | | | | | | |
| | | | | | | | | | | 738,250 | |
| | | | | | | | | | | | |
Communication Services – 13.4% | | | | | | | | | | | | |
Diversified Telecommunication Services – 0.7% | | | | | | | | | | | | |
Tower Bersama Infrastructure Tbk PT | | | | | | | 124,000 | | | | 30,991 | |
| | | | | | | | | | | | |
| | | |
Entertainment – 0.6% | | | | | | | | | | | | |
IMAX China Holding, Inc.(a) | | | | | | | 11,200 | | | | 29,711 | |
| | | | | | | | | | | | |
| | | |
Interactive Media & Services – 9.2% | | | | | | | | | | | | |
58.com, Inc. (ADR)(b) | | | | | | | 1,660 | | | | 89,989 | |
Mail.Ru Group Ltd. (GDR)(a)(b) | | | | | | | 1,300 | | | | 30,498 | |
Tencent Holdings Ltd. | | | | | | | 6,200 | | | | 248,498 | |
Yandex NV – Class A(b) | | | | | | | 2,160 | | | | 59,076 | |
| | | | | | | | | | | | |
| | | | | | | | | | | 428,061 | |
| | | | | | | | | | | | |
| | |
| |
| abfunds.com | | AB FLEXFEE EMERGING MARKETS GROWTH PORTFOLIO | 13 |
PORTFOLIO OF INVESTMENTS(continued)
| | | | | | | | | | | | |
| Company | | | | |
Shares | | | U.S. $ Value | |
| |
| | | | | | | | | | | | |
Media – 1.4% | | | | | | | | | | | | |
Naspers Ltd. – Class N | | | | | | | 239 | | | $ | 47,852 | |
Sun TV Network Ltd. | | | | | | | 2,020 | | | | 17,547 | |
| | | | | | | | | | | | |
| | | | | | | | | | | 65,399 | |
| | | | | | | | | | | | |
Wireless Telecommunication Services – 1.5% | | | | | | | | | | | | |
Safaricom PLC | | | | | | | 315,190 | | | | 68,822 | |
| | | | | | | | | | | | |
| | | | | | | | | | | 622,984 | |
| | | | | | | | | | | | |
Consumer Staples – 10.8% | |
Beverages – 5.6% | |
Coca-Cola HBC AG(b) | | | | | | | 240 | | | | 7,512 | |
Heineken NV | | | | | | | 520 | | | | 45,961 | |
Kweichow Moutai Co., Ltd. – Class A | | | | | | | 1,530 | | | | 132,109 | |
Wuliangye Yibin Co., Ltd. – Class A | | | | | | | 10,060 | | | | 74,781 | |
| | | | | | | | | | | | |
| | | | | | | | | | | 260,363 | |
| | | | | | | | | | | | |
Food & Staples Retailing – 0.5% | | | | | | | | | | | | |
Dino Polska SA(a)(b) | | | | | | | 880 | | | | 22,598 | |
| | | | | | | | | | | | |
| | | |
Personal Products – 2.5% | | | | | | | | | | | | |
Unilever PLC | | | | | | | 2,210 | | | | 116,031 | |
| | | | | | | | | | | | |
| | | |
Tobacco – 2.2% | | | | | | | | | | | | |
ITC Ltd. | | | | | | | 25,520 | | | | 102,880 | |
| | | | | | | | | | | | |
| | | | | | | | | | | 501,872 | |
| | | | | | | | | | | | |
Industrials – 3.9% | | | | | | | | | | | | |
Air Freight & Logistics – 0.5% | | | | | | | | | | | | |
ZTO Express Cayman, Inc. (ADR) | | | | | | | 1,430 | | | | 22,637 | |
| | | | | | | | | | | | |
| | | |
Professional Services – 1.3% | | | | | | | | | | | | |
51job, Inc. (ADR)(b) | | | | | | | 1,000 | | | | 62,440 | |
| | | | | | | | | | | | |
| | | |
Road & Rail – 2.1% | | | | | | | | | | | | |
Globaltrans Investment PLC (Sponsored GDR)(a) | | | | | | | 10,900 | | | | 98,754 | |
| | | | | | | | | | | | |
| | | | | | | | | | | 183,831 | |
| | | | | | | | | | | | |
Utilities – 1.6% | | | | | | | | | | | | |
Electric Utilities – 1.6% | | | | | | | | | | | | |
Equatorial Energia SA | | | | | | | 3,900 | | | | 74,910 | |
| | | | | | | | | | | | |
| | | |
Health Care – 1.0% | | | | | | | | | | | | |
Health Care Equipment & Supplies – 0.3% | | | | | | | | | | | | |
Yestar Healthcare Holdings Co., Ltd. | | | | | | | 57,500 | | | | 13,410 | |
| | | | | | | | | | | | |
| | | |
Health Care Providers & Services – 0.7% | | | | | | | | | | | | |
NMC Health PLC | | | | | | | 980 | | | | 34,203 | |
| | | | | | | | | | | | |
| | | | | | | | | | | 47,613 | |
| | | | | | | | | | | | |
| | |
| |
| 14 | AB FLEXFEE EMERGING MARKETS GROWTH PORTFOLIO | | abfunds.com |
PORTFOLIO OF INVESTMENTS(continued)
| | | | | | | | | | | | |
| Company | | | | |
Shares | | | U.S. $ Value | |
| |
| | | | | | | | | | | | |
Materials – 0.5% | | | | | | | | | | | | |
Metals & Mining – 0.5% | | | | | | | | | | | | |
JSW Steel Ltd. | | | | | | | 5,550 | | | $ | 24,422 | |
| | | | | | | | | | | | |
| | | |
Real Estate – 0.3% | | | | | | | | | | | | |
Real Estate Management & Development – 0.3% | | | | | | | | | | | | |
Vincom Retail JSC(b) | | | | | | | 11,920 | | | | 14,326 | |
| | | | | | | | | | | | |
| | | |
Energy – 0.3% | | | | | | | | | | | | |
Oil, Gas & Consumable Fuels – 0.3% | | | | | | | | | | | | |
Petroleo Brasileiro SA (Preference Shares) | | | | | | | 2,100 | | | | 12,249 | |
| | | | | | | | | | | | |
| | | |
Total Common Stocks
(cost $5,220,626) | | | | | | | | | | | 4,698,158 | |
| | | | | | | | | | | | |
| | | | | | | | | | | | |
EQUITY LINKED NOTES – 0.9% | | | | | | | | | | | | |
Real Estate – 0.6% | | | | | | | | | | | | |
Vincom Retail JSC, Deutsche Bank AG, expiring 11/12/27(b) | | | | | | | 26,180 | | | | 31,497 | |
| | | | | | | | | | | | |
| | | |
Consumer Discretionary – 0.3% | | | | | | | | | | | | |
Mobile World Investment Corp., Macquarie Bank Ltd., expiring 3/31/20 | | | | | | | 3,666 | | | | 13,754 | |
| | | | | | | | | | | | |
| | | |
Total Equity Linked Notes
(cost $66,295) | | | | | | | | | | | 45,251 | |
| | | | | | | | | | | | |
| | | |
| | | | | | Principal
Amount
(000) | | | | |
SHORT-TERM INVESTMENTS – 0.1% | | | | | | | | | | | | |
Time Deposits – 0.1% | | | | | | | | | | | | |
BBH, Grand Cayman | | | | | | | | | | | | |
(1.45)%, 1/03/19 | | | CHF | | | | 0 | * | | | 12 | |
(0.57)%, 1/02/19 | | | EUR | | | | 1 | | | | 924 | |
0.37%, 1/02/19 | | | GBP | | | | 1 | | | | 1,093 | |
0.51%, 1/02/19 | | | SGD | | | | 0 | * | | | 42 | |
1.52%, 1/02/19 | | | HKD | | | | 3 | | | | 436 | |
4.84%, 1/02/19 | | | ZAR | | | | 5 | | | | 314 | |
| | | | | | | | | | | | |
| | | |
Total Time Deposits
(cost $2,818) | | | | | | | | | | | 2,821 | |
| | | | | | | | | | | | |
Total Investments Before Security Lending
Collateral for Securities Loaned – 101.7%
(cost $5,289,739) | | | | | | | | | | | 4,746,230 | |
| | | | | | | | | | | | |
| | |
| |
| abfunds.com | | AB FLEXFEE EMERGING MARKETS GROWTH PORTFOLIO | 15 |
PORTFOLIO OF INVESTMENTS(continued)
| | | | | | | | | | | | |
| Company | | | | |
Shares | | | U.S. $ Value | |
| |
| | | | | | | | | | | | |
INVESTMENTS OF CASH COLLATERAL FOR SECURITIES LOANED – 0.7% | | | | | | | | | | | | |
Investment Companies – 0.7% | | | | | | | | | | | | |
AB Fixed Income Shares, Inc. –
Government Money Market Portfolio – Class AB, 2.31%(d)(e)(f)
(cost $31,250) | | | | | | | 31,250 | | | $ | 31,250 | |
| | | | | | | | | | | | |
| | | |
Total Investments – 102.4%
(cost $5,320,989) | | | | | | | | | | | 4,777,480 | |
Other assets less liabilities – (2.4)% | | | | | | | | | | | (111,851 | ) |
| | | | | | | | | | | | |
| | | |
Net Assets – 100.0% | | | | | | | | | | $ | 4,665,629 | |
| | | | | | | | | | | | |
| * | Principal amount less than 500. |
| (a) | Security is exempt from registration under Rule 144A of the Securities Act of 1933. These securities are considered restricted, but liquid and may be resold in transactions exempt from registration, normally to qualified institutional buyers. At December 31, 2018, the aggregate market value of these securities amounted to $228,863 or 4.9% of net assets. |
| (b) | Non-income producing security. |
| (c) | Represents entire or partial securities out on loan. See Note E for securities lending information. |
| (d) | The rate shown represents the 7-day yield as of period end. |
| (e) | Affiliated investments. |
| (f) | To obtain a copy of the fund’s shareholder report, please go to the Securities and Exchange Commission’s website at www.sec.gov, or call AB at (800) 227-4618. |
Currency Abbreviations:
CHF – Swiss Franc
EUR – Euro
GBP – Great British Pound
HKD – Hong Kong Dollar
SGD – Singapore Dollar
ZAR – South African Rand
Glossary:
ADR – American Depositary Receipt
GDR – Global Depositary Receipt
JSC – Joint Stock Company
PJSC – Public Joint Stock Company
See notes to financial statements.
| | |
| |
| 16 | AB FLEXFEE EMERGING MARKETS GROWTH PORTFOLIO | | abfunds.com |
STATEMENT OF ASSETS & LIABILITIES
December 31, 2018
| | | | |
| Assets | | | | |
Investments in securities, at value | | | | |
Unaffiliated issuers (cost $5,289,739) | | $ | 4,746,230 | (a) |
Affiliated issuers (cost $31,250—including investment of cash collateral for securities loaned of $31,250) | | | 31,250 | |
Foreign currencies, at value (cost $5,471) | | | 5,472 | |
Receivable from Adviser | | | 21,389 | |
Unaffiliated dividends receivable | | | 1,318 | |
Affiliated dividends receivable | | | 71 | |
| | | | |
Total assets | | | 4,805,730 | |
| | | | |
| Liabilities | | | | |
Audit and tax fee payable | | | 44,143 | |
Payable for collateral received on securities loaned | | | 31,250 | |
Custody fee payable | | | 19,124 | |
Legal fee payable | | | 7,332 | |
Due to Custodian | | | 3,229 | |
Transfer Agent fee payable | | | 3,000 | |
Accrued expenses and other liabilities | | | 32,023 | |
| | | | |
Total liabilities | | | 140,101 | |
| | | | |
Net Assets | | $ | 4,665,629 | |
| | | | |
| Composition of Net Assets | | | | |
Capital stock, at par | | $ | 53 | |
Additional paid-in capital | | | 5,287,256 | |
Accumulated loss | | | (621,680 | ) |
| | | | |
| | $ | 4,665,629 | |
| | | | |
Net Asset Value Per Share—30 billion shares of capital stock authorized, $.0001 par value
| | | | | | | | | | | | |
| Class | | Net Assets | | | Shares
Outstanding | | | Net Asset
Value | |
| |
| Advisor | | $ | 4,665,629 | | | | 532,967 | | | $ | 8.75 | |
| |
| (a) | Includes securities on loan with a value of $29,210 (See Note D). |
See notes to financial statements.
| | |
| |
| abfunds.com | | AB FLEXFEE EMERGING MARKETS GROWTH PORTFOLIO | 17 |
STATEMENT OF OPERATIONS
Year Ended December 31, 2018
| | | | | | | | |
| Investment Income | | | | | | | | |
Dividends | | | | | | | | |
Unaffiliated issuers (net of foreign taxes withheld of $9,120) | | $ | 104,872 | | | | | |
Affiliated issuers | | | 1,358 | | | | | |
Interest | | | 84 | | | $ | 106,314 | |
| | | | | | | | |
| Expenses | | | | | | | | |
Advisory fee (see Note B) | | | 2,866 | | | | | |
Transfer agency—Advisor Class | | | 11,678 | | | | | |
Audit and tax | | | 79,689 | | | | | |
Administrative | | | 67,044 | | | | | |
Custodian | | | 61,890 | | | | | |
Legal | | | 32,008 | | | | | |
Registration fees | | | 27,602 | | | | | |
Directors’ fees | | | 24,778 | | | | | |
Printing | | | 10,088 | | | | | |
Miscellaneous | | | 40,375 | | | | | |
| | | | | | | | |
Total expenses | | | 358,018 | | | | | |
Less: expenses waived and reimbursed by the Adviser (see Note B and Note D) | | | (349,486 | ) | | | | |
| | | | | | | | |
Net expenses | | | | | | | 8,532 | |
| | | | | | | | |
Net investment income | | | | | | | 97,782 | |
| | | | | | | | |
| Realized and Unrealized Gain (Loss) on Investment and Foreign Currency Transactions | | | | | | | | |
Net realized gain (loss) on: | | | | | | | | |
Investment transactions | | | | | | | 250,835 | (a) |
Futures | | | | | | | (9,887 | ) |
Foreign currency transactions | | | | | | | (4,682 | ) |
Net change in unrealized appreciation/depreciation on: | | | | | | | | |
Investments | | | | | | | (1,902,948 | )(b) |
Foreign currency denominated assets and liabilities | | | | | | | (43 | ) |
| | | | | | | | |
Net loss on investment and foreign currency transactions | | | | | | | (1,666,725 | ) |
| | | | | | | | |
Net Decrease in Net Assets from Operations | | | | | | $ | (1,568,943 | ) |
| | | | | | | | |
| (a) | Net of foreign capital gains taxes of $378. |
| (b) | Net of decrease in accrued foreign capital gains taxes of $3,781. |
See notes to financial statements.
| | |
| |
| 18 | AB FLEXFEE EMERGING MARKETS GROWTH PORTFOLIO | | abfunds.com |
STATEMENT OF CHANGES IN NET ASSETS
| | | | | | | | | | | | |
| | | Year Ended
December 31,
2018 | | | For the Period
July 1, 2017 to
December 31,
2017(a) | | | Year Ended
June 30,
2017 | |
| Increase (Decrease) in Net Assets from Operations | | | | | | | | |
Net investment income | | $ | 97,782 | | | $ | 30,286 | | | $ | 16,249 | |
Net realized gain on investment and foreign currency transactions | | | 236,266 | | | | 365,943 | | | | 60,220 | |
Net change in unrealized appreciation/depreciation on investments and foreign currency denominated assets and liabilities | | | (1,902,991 | ) | | | 366,427 | | | | 976,566 | |
| | | | | | | | | | | | |
Net increase (decrease) in net assets from operations | | | (1,568,943 | ) | | | 762,656 | | | | 1,053,035 | |
Distributions to Shareholders | | | | | | | | | | | | |
Class A | | | – 0 | – | | | – 0 | – | | | (5 | ) |
Advisor Class | | | (237,979 | ) | | | (41,135 | ) | | | (12,998 | ) |
| Capital Stock Transactions | | | | | | | | | | | | |
Net increase (decrease) | | | 320,998 | | | | – 0 | – | | | (21,297 | ) |
| | | | | | | | | | | | |
Total increase (decrease) | | | (1,485,924 | ) | | | 721,521 | | | | 1,018,735 | |
| Net Assets | | | | | | | | | | | | |
Beginning of period | | | 6,151,553 | | | | 5,430,032 | | | | 4,411,297 | |
| | | | | | | | | | | | |
End of period | | $ | 4,665,629 | | | $ | 6,151,553 | | | $ | 5,430,032 | |
| | | | | | | | | | | | |
| (a) | The Fund changed its fiscal year end from June 30 to December 31. |
See notes to financial statements.
| | |
| |
| abfunds.com | | AB FLEXFEE EMERGING MARKETS GROWTH PORTFOLIO | 19 |
NOTES TO FINANCIAL STATEMENTS
December 31, 2018
NOTE A
Significant Accounting Policies
AB Cap Fund, Inc. (the “Company”), which is a Maryland corporation, is registered under the Investment Company Act of 1940 as an open-end management investment company. The Company operates as a series company comprised of 29 portfolios currently in operation. Each portfolio is considered to be a separate entity for financial reporting and tax purposes. This report relates only to the AB FlexFee Emerging Markets Growth Portfolio (the “Fund”), a diversified portfolio. On December 29, 2016, the Fund’s name was changed from the AB Emerging Markets Growth Portfolio to the AB Performance Fee Series – Emerging Markets Growth Portfolio. On May 9, 2017, the Fund’s name was changed to its current name, the AB FlexFee Emerging Markets Growth Portfolio. The Fund has authorized issuance of Class A, Class C, Advisor Class, Class R, Class K, Class I, Class Z, Class T, Class 1, and Class 2 shares. Class R, Class K, Class I, Class Z, Class T, Class 1 or Class 2 shares have not been issued, and no shares of Class A or Class C were outstanding as of December 31, 2018. Advisor Class shares are sold without an initial or contingent deferred sales charge and are not subject to ongoing distribution expenses. All ten classes of shares have identical voting, dividend, liquidation and other rights, except that the classes bear different distribution and transfer agency expenses. Each class has exclusive voting rights with respect to its distribution plan. The financial statements have been prepared in conformity with U.S. generally accepted accounting principles (“U.S. GAAP”), which require management to make certain estimates and assumptions that affect the reported amounts of assets and liabilities in the financial statements and amounts of income and expenses during the reporting period. Actual results could differ from those estimates. The Fund is an investment company under U.S. GAAP and follows the accounting and reporting guidance applicable to investment companies. The following is a summary of significant accounting policies followed by the Fund.
1. Security Valuation
Portfolio securities are valued at their current market value determined on the basis of market quotations or, if market quotations are not readily available or are deemed unreliable, at “fair value” as determined in accordance with procedures established by and under the general supervision of the Fund’s Board of Directors (the “Board”).
In general, the market values of securities which are readily available and deemed reliable are determined as follows: securities listed on a national securities exchange (other than securities listed on the NASDAQ Stock
| | |
| |
| 20 | AB FLEXFEE EMERGING MARKETS GROWTH PORTFOLIO | | abfunds.com |
NOTES TO FINANCIAL STATEMENTS(continued)
Market, Inc. (“NASDAQ”)) or on a foreign securities exchange are valued at the last sale price at the close of the exchange or foreign securities exchange. If there has been no sale on such day, the securities are valued at the last traded price from the previous day. Securities listed on more than one exchange are valued by reference to the principal exchange on which the securities are traded; securities listed only on NASDAQ are valued in accordance with the NASDAQ Official Closing Price; listed or over the counter (“OTC”) market put or call options are valued at the mid level between the current bid and ask prices. If either a current bid or current ask price is unavailable, the Adviser will have discretion to determine the best valuation (e.g., last trade price in the case of listed options); open futures are valued using the closing settlement price or, in the absence of such a price, the most recent quoted bid price. If there are no quotations available for the day of valuation, the last available closing settlement price is used; U.S. Government securities and any other debt instruments having 60 days or less remaining until maturity are generally valued at market by an independent pricing vendor, if a market price is available. If a market price is not available, the securities are valued at amortized cost. This methodology is commonly used for short term securities that have an original maturity of 60 days or less, as well as short term securities that had an original term to maturity that exceeded 60 days. In instances when amortized cost is utilized, the Valuation Committee (the “Committee”) must reasonably conclude that the utilization of amortized cost is approximately the same as the fair value of the security. Such factors the Committee will consider include, but are not limited to, an impairment of the creditworthiness of the issuer or material changes in interest rates. Fixed-income securities, including mortgage-backed and asset-backed securities, may be valued on the basis of prices provided by a pricing service or at a price obtained from one or more of the major broker-dealers. In cases where broker-dealer quotes are obtained, the Adviser may establish procedures whereby changes in market yields or spreads are used to adjust, on a daily basis, a recently obtained quoted price on a security. Swaps and other derivatives are valued daily, primarily using independent pricing services, independent pricing models using market inputs, as well as third party broker-dealers or counterparties. Open end mutual funds are valued at the closing net asset value per share, while exchange traded funds are valued at the closing market price per share.
Securities for which market quotations are not readily available (including restricted securities) or are deemed unreliable are valued at fair value as deemed appropriate by the Adviser. Factors considered in making this determination may include, but are not limited to, information obtained by contacting the issuer, analysts, analysis of the issuer’s financial statements or other available documents. In addition, the Fund may use fair value pricing for securities primarily traded in non-U.S. markets because most foreign
| | |
| |
| abfunds.com | | AB FLEXFEE EMERGING MARKETS GROWTH PORTFOLIO | 21 |
NOTES TO FINANCIAL STATEMENTS(continued)
markets close well before the Fund values its securities at 4:00 p.m., Eastern Time. The earlier close of these foreign markets gives rise to the possibility that significant events, including broad market moves, may have occurred in the interim and may materially affect the value of those securities. To account for this, the Fund generally values many of its foreign equity securities using fair value prices based on third party vendor modeling tools to the extent available.
2. Fair Value Measurements
In accordance with U.S. GAAP regarding fair value measurements, fair value is defined as the price that the Fund would receive to sell an asset or pay to transfer a liability in an orderly transaction between market participants at the measurement date. U.S. GAAP establishes a framework for measuring fair value, and a three-level hierarchy for fair value measurements based upon the transparency of inputs to the valuation of an asset or liability (including those valued based on their market values as described in Note A.1 above). Inputs may be observable or unobservable and refer broadly to the assumptions that market participants would use in pricing the asset or liability. Observable inputs reflect the assumptions market participants would use in pricing the asset or liability based on market data obtained from sources independent of the Fund. Unobservable inputs reflect the Fund’s own assumptions about the assumptions that market participants would use in pricing the asset or liability based on the best information available in the circumstances. Each investment is assigned a level based upon the observability of the inputs which are significant to the overall valuation. The three-tier hierarchy of inputs is summarized below.
| | • | | Level 1—quoted prices in active markets for identical investments |
| | • | | Level 2—other significant observable inputs (including quoted prices for similar investments, interest rates, prepayment speeds, credit risk, etc.) |
| | • | | Level 3—significant unobservable inputs (including the Fund’s own assumptions in determining the fair value of investments) |
Where readily available market prices or relevant bid prices are not available for certain equity investments, such investments may be valued based on similar publicly traded investments, movements in relevant indices since last available prices or based upon underlying company fundamentals and comparable company data (such as multiples to earnings or other multiples to equity). Where an investment is valued using an observable input such as another publicly traded security, the investment will be classified as Level 2. If management determines that an adjustment is appropriate based on restrictions on resale, illiquidity or uncertainty, and such adjustment is a significant component of the valuation, the investment will be
| | |
| |
| 22 | AB FLEXFEE EMERGING MARKETS GROWTH PORTFOLIO | | abfunds.com |
NOTES TO FINANCIAL STATEMENTS(continued)
classified as Level 3. An investment will also be classified as Level 3 where management uses company fundamentals and other significant inputs to determine the valuation.
The following table summarizes the valuation of the Fund’s investments by the above fair value hierarchy levels as of December 31, 2018:
| | | | | | | | | | | | | | | | |
Investments in
Securities | | Level 1 | | | Level 2 | | | Level 3 | | | Total | |
Assets: | | | | | | | | | | | | | | | | |
Common Stocks: | | | | | | | | | | | | | | | | |
Financials | | $ | 566,629 | | | $ | 925,910 | | | $ | – 0 | – | | $ | 1,492,539 | |
Information Technology | | | – 0 | – | | | 985,162 | | | | – 0 | – | | | 985,162 | |
Consumer Discretionary | | | 539,379 | | | | 198,871 | | | | – 0 | – | | | 738,250 | |
Communication Services | | | 248,385 | | | | 374,599 | | | | – 0 | – | | | 622,984 | |
Consumer Staples | | | – 0 | – | | | 501,872 | | | | – 0 | – | | | 501,872 | |
Industrials | | | 183,831 | | | | – 0 | – | | | – 0 | – | | | 183,831 | |
Utilities | | | – 0 | – | | | 74,910 | | | | – 0 | – | | | 74,910 | |
Health Care | | | – 0 | – | | | 47,613 | | | | – 0 | – | | | 47,613 | |
Materials | | | – 0 | – | | | 24,422 | | | | – 0 | – | | | 24,422 | |
Real Estate | | | – 0 | – | | | 14,326 | | | | – 0 | – | | | 14,326 | |
Energy | | | – 0 | – | | | 12,249 | | | | – 0 | – | | | 12,249 | |
Equity Linked Notes: | | | | | | | | | | | | | | | | |
Real Estate | | | – 0 | – | | | 31,497 | | | | – 0 | – | | | 31,497 | |
Consumer Discretionary | | | – 0 | – | | | 13,754 | | | | – 0 | – | | | 13,754 | |
Short-Term Investments: | | | | | | | | | | | | | | | | |
Time Deposits | | | – 0 | – | | | 2,821 | | | | – 0 | – | | | 2,821 | |
Investments of Cash Collateral for Securities Loaned in Affiliated Money Market Fund | | | 31,250 | | | | – 0 | – | | | – 0 | – | | | 31,250 | |
| | | | | | | | | | | | | | | | |
Total Investments in Securities | | | 1,569,474 | | | | 3,208,006 | † | | | – 0 | – | | | 4,777,480 | |
Other Financial Instruments* | | | – 0 | – | | | – 0 | – | | | – 0 | – | | | – 0 | – |
| | | | | | | | | | | | | | | | |
Total^ | | $ | 1,569,474 | | | $ | 3,208,006 | | | $ | – 0 | – | | $ | 4,777,480 | |
| | | | | | | | | | | | | | | | |
| † | A significant portion of the Fund’s foreign equity investments are categorized as Level 2 investments since they are valued using fair value prices based on third party vendor modeling tools to the extent available, see note A.1. |
| * | Other financial instruments are derivative instruments, such as futures, forwards and swaps, which are valued at the unrealized appreciation/(depreciation) on the instrument. Other financial instruments may also include swaps with upfront premiums, options written and swaptions written which are valued at market value. |
| ^ | An amount of $288,008 was transferred from Level 1 to Level 2 due to the above mentioned foreign equity fair valuation using third party vendor modeling tools during the reporting period. An amount of $122,191 was transferred from Level 2 to Level 1 due to the above mentioned foreign equity fair valuation using third party vendor modeling tools not being used during the reporting period. |
The Fund recognizes all transfers between levels of the fair value hierarchy assuming the financial instrument was transferred at the beginning of the reporting period.
| | |
| |
| abfunds.com | | AB FLEXFEE EMERGING MARKETS GROWTH PORTFOLIO | 23 |
NOTES TO FINANCIAL STATEMENTS(continued)
Following is a reconciliation of investments in which significant unobservable inputs (Level 3) were used in determining fair value.
| | | | |
| | | Common Stocks:
Consumer
Discretionary | |
Balance as of 12/31/17 | | $ | 39,148 | |
Realized gain (loss) | | | 555 | |
Change in unrealized appreciation/depreciation | | | (7,893 | ) |
Purchases | | | – 0 | – |
Sales | | | (31,810 | ) |
Transfers into Level 3 | | | – 0 | – |
Transfers out of Level 3 | | | – 0 | – |
| | | | |
Balance as of 12/31/18 | | $ | – 0 | – |
| | | | |
Net change in unrealized appreciation/depreciation from investments held as of 12/31/18** | | $ | – 0 | – |
| | | | |
| ** | The unrealized appreciation/depreciation is included in net change in unrealized appreciation/depreciation of investments and other financial instruments in the accompanying statement of operations. |
The Adviser established the Committee to oversee the pricing and valuation of all securities held in the Fund. The Committee operates under pricing and valuation policies and procedures established by the Adviser and approved by the Board, including pricing policies which set forth the mechanisms and processes to be employed on a daily basis to implement these policies and procedures. In particular, the pricing policies describe how to determine market quotations for securities and other instruments. The Committee’s responsibilities include: 1) fair value and liquidity determinations (and oversight of any third parties to whom any responsibility for fair value and liquidity determinations is delegated), and 2) regular monitoring of the Adviser’s pricing and valuation policies and procedures and modification or enhancement of these policies and procedures (or recommendation of the modification of these policies and procedures) as the Committee believes appropriate.
The Committee is also responsible for monitoring the implementation of the pricing policies by the Adviser’s Pricing Group (the “Pricing Group”) and any third party which performs certain pricing functions in accordance with the pricing policies. The Pricing Group is responsible for the oversight of the third party on a day-to-day basis. The Committee and the Pricing Group perform a series of activities to provide reasonable assurance of the accuracy of prices including: 1) periodic vendor due diligence meetings, review of methodologies, new developments and process at vendors, 2) daily comparison of security valuation versus prior day for all securities that exceeded established thresholds, and 3) daily review of unpriced, stale, and variance reports with exceptions reviewed by senior management and the Committee.
| | |
| |
| 24 | AB FLEXFEE EMERGING MARKETS GROWTH PORTFOLIO | | abfunds.com |
NOTES TO FINANCIAL STATEMENTS(continued)
In addition, several processes outside of the pricing process are used to monitor valuation issues including: 1) performance and performance attribution reports are monitored for anomalous impacts based upon benchmark performance, and 2) portfolio managers review all portfolios for performance and analytics (which are generated using the Adviser’s prices).
3. Currency Translation
Assets and liabilities denominated in foreign currencies and commitments under forward currency exchange contracts are translated into U.S. dollars at the mean of the quoted bid and ask prices of such currencies against the U.S. dollar. Purchases and sales of portfolio securities are translated into U.S. dollars at the rates of exchange prevailing when such securities were acquired or sold. Income and expenses are translated into U.S. dollars at rates of exchange prevailing when accrued.
Net realized gain or loss on foreign currency transactions represents foreign exchange gains and losses from sales and maturities of foreign fixed income investments, holding of foreign currencies, currency gains or losses realized between the trade and settlement dates on foreign investment transactions, and the difference between the amounts of dividends, interest and foreign withholding taxes recorded on the Fund’s books and the U.S. dollar equivalent amounts actually received or paid. Net unrealized currency gains and losses from valuing foreign currency denominated assets and liabilities at period end exchange rates are reflected as a component of net unrealized appreciation and depreciation of foreign currency denominated assets and liabilities.
4. Taxes
It is the Fund’s policy to meet the requirements of the Internal Revenue Code applicable to regulated investment companies and to distribute all of its investment company taxable income and net realized gains, if any, to shareholders. Therefore, no provisions for federal income or excise taxes are required. The Fund may be subject to taxes imposed by countries in which it invests. Such taxes are generally based on income and/or capital gains earned or repatriated. Taxes are accrued and applied to net investment income, net realized gains and net unrealized appreciation/depreciation as such income and/or gains are earned.
In accordance with U.S. GAAP requirements regarding accounting for uncertainties in income taxes, management has analyzed the Fund’s tax positions taken or expected to be taken on federal and state income tax returns for all open tax years (the current and prior three years) and has concluded that no provision for income tax is required in the Fund’s financial statements.
| | |
| |
| abfunds.com | | AB FLEXFEE EMERGING MARKETS GROWTH PORTFOLIO | 25 |
NOTES TO FINANCIAL STATEMENTS(continued)
5. Investment Income and Investment Transactions
Dividend income is recorded on the ex-dividend date or as soon as the Fund is informed of the dividend. Interest income is accrued daily. Investment transactions are accounted for on the date securities are purchased or sold. Investment gains and losses are determined on the identified cost basis. The Fund amortizes premiums and accretes discounts as adjustments to interest income.
6. Expense Allocations
Expenses of the Company are charged proportionately to each portfolio or based on other appropriate methods.
7. Dividends and Distributions
Dividends and distributions to shareholders, if any, are recorded on the ex-dividend date. Income dividends and capital gains distributions are determined in accordance with federal tax regulations and may differ from those determined in accordance with U.S. GAAP. To the extent these differences are permanent, such amounts are reclassified within the capital accounts based on their federal tax basis treatment; temporary differences do not require such reclassification.
8. Change of Fiscal Year End
The Fund changed its fiscal year end from June 30 to December 31 in 2017.
NOTE B
Advisory Fee and Other Transactions with Affiliates
Effective July 1, 2017, under an amended investment advisory agreement, the Fund calculates and accrues daily a base fee, at an annualized rate of .75% of the Fund’s average daily net assets (“Base Fee”). The advisory fee is increased or decreased from the Base Fee by a performance adjustment (“Performance Adjustment”) that depends on whether, and to what extent, the investment performance of the Advisor Class shares of the Fund (“Measuring Class”) exceeds, or is exceeded by, the performance of the MSCI Emerging Markets Index (net) (“Index”) plus 1.75% (“Index Hurdle”) over the Performance Period (as defined below). For the period from August 4, 2017 to October 31, 2017, the MSCI Emerging Markets Index with IDCo Fair Value Pricing (net) was used for purposes of calculating the Performance Adjustment. The Performance Adjustment is calculated and accrued daily, according to a schedule that adds or subtracts .004% of the Fund’s average daily net assets for each .01% of absolute performance by which the performance of the Measuring Class exceeds or lags the Index Hurdle for the period from the beginning of the Performance Period through the current business day. The maximum Performance Adjustment (positive or negative) will not exceed an annualized rate of+/- .70% (“Maximum Performance Adjustment”) of the Fund’s average
| | |
| |
| 26 | AB FLEXFEE EMERGING MARKETS GROWTH PORTFOLIO | | abfunds.com |
NOTES TO FINANCIAL STATEMENTS(continued)
daily net assets, which would occur when the performance of the Measuring Class exceeds, or is exceeded by, the Index Hurdle by 1.75% for the Performance Period. On a monthly basis, the Fund will pay the Adviser the minimum fee rate of .05% on an annualized basis (Base Fee minus the Maximum Performance Adjustment) applied to the average daily net assets for the month. At the end of the Performance Period, the Fund will pay to the Adviser the total advisory fee, less the amount of any minimum fees paid during the Performance Period and any waivers described below in this section. The Performance Period was initially from July 1, 2017 to December 31, 2018 and thereafter is each 12-month period beginning on the first day in the month of January through December 31 of the same year. In addition, the Adviser has agreed to waive its advisory fee by limiting the Fund’s accrual of the advisory fee (Base Fee plus Performance Adjustment) on any day to the amount corresponding to the maximum fee rate multiplied by the Fund’s current net assets if such amount is less than the amount that would have been accrued based on the Fund’s average daily net assets for the Performance Period. For the year ended December 31, 2018, the Fund accrued advisory fees of $2,866, as reflected in the statement of operations, at an annual effective rate (excluding the impact from any expense waivers in effect) of .05% of the Fund’s average net assets, which reflected a (.70)% Performance Adjustment of $(40,109). For the Performance Period from July 1, 2017 to December 31, 2018, the Fund accrued advisory fees of $4,337, at an annual effective rate (excluding the impact from any expense waivers in effect) of .05% of the Fund’s average net assets, which reflected a (.70)% Performance Adjustment of $(60,717). Prior to July 1, 2017, under the terms of the investment advisory agreement, the Fund paid the Adviser an advisory fee at an annual rate of 1.175% of the first $1 billion of the Fund’s average daily net assets, 1.05% of the next $1 billion up to $2 billion, 1.00% of the excess of $2 billion up to $3 billion, .90% of the excess of $3 billion up to $6 billion, and .85% of the excess of $6 billion. The fee was accrued daily and paid monthly.
The Adviser has agreed to waive its fees and bear certain expenses through June 11, 2019 to the extent necessary to limit total expenses (other than the advisory fee, acquired fund fees and expenses other than the advisory fees of any AB mutual funds in which the Fund may invest, interest expense, taxes, extraordinary expenses, and brokerage commissions and other transaction costs) on an annual basis from exceeding .10% of average daily net assets (the “Expense Cap”). For the year ended December 31, 2018, the reimbursements/waivers amounted to $282,312. Prior to July 1, 2017, the Adviser agreed to waive its fees and bear certain expenses to the extent necessary to limit total operating expenses (excluding acquired fund fees and expenses other than the advisory fees of any AB mutual funds in which the Fund may invest, interest expense,
| | |
| |
| abfunds.com | | AB FLEXFEE EMERGING MARKETS GROWTH PORTFOLIO | 27 |
NOTES TO FINANCIAL STATEMENTS(continued)
taxes, extraordinary expenses, and brokerage commissions and other transaction costs) on an annual basis to 1.45% of the daily average net assets for Advisor Class shares (the “Old Expense Cap”). Any fees waived and expenses borne by the Adviser through December 31, 2018 are subject to repayment by the Fund until the end of the third fiscal year after the fiscal period in which the fee was waived or the expense was borne; such waivers/expenses borne that are subject to repayment amount to $230,326 for the year ended June 30, 2017, $169,436 for the period ended December 31, 2017, and $282,312 for the year ended December 31, 2018. In any case, no repayment will be made that would cause the Fund’s total annual expenses (subject to the exclusions set forth above) to exceed .10% or, for fees waived or expenses borne prior to July 1, 2017, the Old Expense Cap. Also, prior to July 1, 2017, the Adviser was voluntarily waiving its advisory fee for the Fund in an additional amount of .05% of average daily net assets. For the year ended June 30, 2017, such waiver amounted to $2,420.
During 2017, AXA S.A. (“AXA”), a French holding company for the AXA Group, a worldwide leader in life, property and casualty and health insurance and asset management, announced its intention to pursue the sale of a minority stake in its subsidiary, AXA Equitable Holdings, Inc. (“AXA Equitable”), the holding company for a diversified financial services organization, through an initial public offering (“IPO”). AXA Equitable is the holding company for a diverse group of financial services companies, including AllianceBernstein L.P., the investment adviser to the Funds (“the Adviser”). During the second quarter of 2018, AXA Equitable completed the IPO, and, as a result, AXA held approximately 72.2% of the outstanding common stock of AXA Equitable as of September 30, 2018. Contemporaneously with the IPO, AXA sold $862.5 million aggregate principal amount of its 7.25% mandatorily exchangeable notes (the “MxB Notes”) due May 15, 2021 and exchangeable into up to 43,125,000 shares of common stock (or approximately 7% of the outstanding shares of common stock of AXA Equitable). AXA retains ownership (including voting rights) of such shares of common stock until the MxB Notes are exchanged, which may be on a date that is earlier than the maturity date at AXA’s option upon the occurrence of certain events.
In March 2018, AXA announced its intention to sell its entire interest in AXA Equitable over time, subject to market conditions and other factors (the “Plan”). It is anticipated that one or more of the transactions contemplated by the Plan may ultimately result in the indirect transfer of a “controlling block” of voting securities of the Adviser (a “Change of Control Event”) and therefore may be deemed an “assignment” causing a termination of each Fund’s current investment advisory agreement. In order to ensure that the existing investment advisory services could continue uninterrupted, at
| | |
| |
| 28 | AB FLEXFEE EMERGING MARKETS GROWTH PORTFOLIO | | abfunds.com |
NOTES TO FINANCIAL STATEMENTS(continued)
meetings held in late July through early August 2018, the Boards of Directors/Trustees (each a “Board” and collectively, the “Boards”) approved new investment advisory agreements with the Adviser, in connection with the Plan. The Boards also agreed to call and hold a joint meeting of shareholders on October 11, 2018 for shareholders of each Fund to (1) approve the new investment advisory agreement with the Adviser that would be effective after the first Change of Control Event and (2) approve any future advisory agreement approved by the Board and that has terms not materially different from the current agreement, in the event there are subsequent Change of Control Events arising from completion of the Plan that terminate the advisory agreement after the first Change of Control Event. Approval of a future advisory agreement means that shareholders may not have another opportunity to vote on a new agreement with the Adviser even upon a change of control, as long as no single person or group of persons acting together gains “control” (as defined in the 1940 Act) of AXA Equitable.
At the October 11, 2018 meeting, shareholders approved the new and future investment advisory agreements.
On November 20, 2018, AXA completed a public offering of 60,000,000 shares of AXA Equitable’s common stock and simultaneously sold 30,000,000 of such shares to AXA Equitable pursuant to a separate agreement with it. As a result AXA currently owns approximately 59.2% of the shares of common stock of AXA Equitable.
Pursuant to the investment advisory agreement, the Fund may reimburse the Adviser for certain legal and accounting services provided to the Fund by the Adviser. For the year ended December 31, 2018, the Adviser voluntarily agreed to waive such fees in the amount of $67,044.
The Fund compensates AllianceBernstein Investor Services, Inc. (“ABIS”), a wholly-owned subsidiary of the Adviser, under a Transfer Agency Agreement for providing personnel and facilities to perform transfer agency services for the Fund. ABIS may make payments to intermediaries that provide omnibus account services, sub-accounting services and/or networking services. Such compensation retained by ABIS amounted to $10,040 for the year ended December 31, 2018.
The Fund may invest in AB Government Money Market Portfolio (the “Government Money Market Portfolio”) which has a contractual annual advisory fee rate of .20% of the portfolio’s average daily net assets and bears its own expenses. Effective August 1, 2018, the Adviser has contractually agreed to waive .10% of the advisory fee of Government Money Market Portfolio until August 31, 2019. In connection with the investment
| | |
| |
| abfunds.com | | AB FLEXFEE EMERGING MARKETS GROWTH PORTFOLIO | 29 |
NOTES TO FINANCIAL STATEMENTS(continued)
by the Fund in Government Money Market Portfolio, the Adviser has contractually agreed to waive its advisory fee from the Fund in an amount equal to the Fund’s pro rata share of the effective advisory fee of Government Money Market Portfolio, as borne indirectly by the Fund as an acquired fund fee and expense. For the year ended December 31, 2018, such waiver amounted to $105.
A summary of the Fund’s transactions in AB mutual funds for the year ended December 31, 2018 is as follows:
| | | | | | | | | | | | | | | | | | | | |
Fund | | Market Value
12/31/17
(000) | | | Purchases
at Cost
(000) | | | Sales
Proceeds
(000) | | | Market Value
12/31/18
(000) | | | Dividend
Income
(000) | |
Government Money Market Portfolio | | $ | 59 | | | $ | 2,521 | | | $ | 2,580 | | | $ | – 0 | – | | $ | 1 | |
Government Money Market Portfolio** | | | – 0 | – | | | 663 | | | | 632 | | | | 31 | | | | 0 | * |
| | | | | | | | | | | | | | | | | | | | |
Total | | | | | | | | | | | | | | $ | 31 | | | $ | 1 | |
| | | | | | | | | | | | | | | | | | | | |
| * | Amount is less than $500. |
| ** | Investment of cash collateral for securities lending transactions (see Note D). |
Brokerage commissions paid on investment transactions for the year ended December 31, 2018 amounted to $8,859, of which $0 and $0, respectively, was paid to Sanford C. Bernstein & Co. LLC and Sanford C. Bernstein Limited, affiliates of the Adviser.
NOTE C
Investment Transactions
Purchases and sales of investment securities (excluding short-term investments) for the year ended December 31, 2018 were as follows:
| | | | | | | | |
| | | Purchases | | | Sales | |
Investment securities (excluding U.S. government securities) | | $ | 4,967,897 | | | $ | 4,754,619 | |
U.S. government securities | | | – 0 | – | | | – 0 | – |
The cost of investments for federal income tax purposes, gross unrealized appreciation and unrealized depreciation (excluding foreign currency contracts) are as follows:
| | | | |
Cost | | $ | 5,336,894 | |
| | | | |
Gross unrealized appreciation | | $ | 431,034 | |
Gross unrealized depreciation | | | (990,448 | ) |
| | | | |
Net unrealized depreciation | | $ | (559,414 | ) |
| | | | |
| | |
| |
| 30 | AB FLEXFEE EMERGING MARKETS GROWTH PORTFOLIO | | abfunds.com |
NOTES TO FINANCIAL STATEMENTS(continued)
1. Derivative Financial Instruments
The Fund may use derivatives in an effort to earn income and enhance returns, to replace more traditional direct investments, to obtain exposure to otherwise inaccessible markets (collectively, “investment purposes”), or to hedge or adjust the risk profile of its portfolio.
The principal types of derivatives utilized by the Fund, as well as the methods in which they may be used are:
The Fund may buy or sell futures for investment purposes or for the purpose of hedging its portfolio against adverse effects of potential movements in the market. The Fund bears the market risk that arises from changes in the value of these instruments and the imperfect correlation between movements in the price of the futures and movements in the price of the assets, reference rates or indices which they are designed to track. Among other things, the Fund may purchase or sell futures for foreign currencies or options thereon for non-hedging purposes as a means of making direct investment in foreign currencies, as described below under “Currency Transactions”.
At the time the Fund enters into a future, the Fund deposits and maintains as collateral an initial margin with the broker, as required by the exchange on which the transaction is effected. Such amount of shown as due from broker on the statement of assets and liabilities. Pursuant to the contract, the Fund agrees to receive from or pay to the broker an amount of cash equal to the daily fluctuation in the value of the contract. Such receipts or payments are known as variation margin and are recorded by the Fund as unrealized gains or losses. Risks may arise from the potential inability of a counter party to meet the terms of the contract. The credit/counterparty risk for exchange traded futures is generally less than privately negotiated futures, since the clearinghouse, which is the issuer or counterparty to each exchange-traded future, has robust risk mitigation standards, including the requirement to provide initial and variation margin. When the contract is closed, the Fund records realized gain or loss equal to the difference between the value of the contract at the time it was opened and the time it was closed.
Use of long futures subjects the Fund to risk of loss in excess of the amounts shown on the statement of assets and liabilities, up to the notional value of the future. Use of short futures subjects the Fund to unlimited risk of loss. Under some circumstances, futures exchanges may establish daily limits on the amount that the price of a future can vary from the previous day’s settlement price, which could effectively prevent liquidation of unfavorable positions.
| | |
| |
| abfunds.com | | AB FLEXFEE EMERGING MARKETS GROWTH PORTFOLIO | 31 |
NOTES TO FINANCIAL STATEMENTS(continued)
During year ended December 31, 2018, the Fund held futures for non-hedging purposes.
During the year ended December 31, 2018 the Fund had entered into the following derivatives:
| | | | | | | | | | |
Derivative Type | | Location of Gain
or (Loss) on
Derivatives Within
Statement
of Operations | | Realized Gain
or (Loss) on
Derivatives | | | Change in
Unrealized
Appreciation or
(Depreciation) | |
Equity contracts | | Net realized gain/(loss) on futures; Net change in unrealized appreciation/depreciation on futures | | $ | (9,887 | ) | | $ | – 0 | – |
| | | | | | | | | | |
Total | | | | $ | (9,887 | ) | | $ | – 0 | – |
| | | | | | | | | | |
The following table represents the average monthly volume of the Fund’s derivative transactions during the year ended December 31, 2018:
| | | | |
Futures: | | | | |
Average original value of buy contracts | | $ | 73,340 | (a) |
| (a) | Positions were open for two months during the reporting period. |
2. Currency Transactions
The Fund may invest in non-U.S. Dollar-denominated securities on a currency hedged or unhedged basis. The Fund may seek investment opportunities by taking long or short positions in currencies through the use of currency-related derivatives, including forward currency exchange contracts, futures and options on futures, swaps, and other options. The Fund may enter into transactions for investment opportunities when it anticipates that a foreign currency will appreciate or depreciate in value but securities denominated in that currency are not held by the Fund and do not present attractive investment opportunities. Such transactions may also be used when the Adviser believes that it may be more efficient than a direct investment in a foreign currency-denominated security. The Fund may also conduct currency exchange contracts on a spot basis (i.e., for cash at the spot rate prevailing in the currency exchange market for buying or selling currencies).
NOTE D
Securities Lending
The Fund may enter into securities lending transactions. Under the Fund’s securities lending program, all loans of securities will be collateralized continually by cash. The Fund will be compensated for the loan from a portion of the net return from the income earned on cash collateral after a rebate is paid to the borrower (in some cases, this rebate may be a “negative rebate”
| | |
| |
| 32 | AB FLEXFEE EMERGING MARKETS GROWTH PORTFOLIO | | abfunds.com |
NOTES TO FINANCIAL STATEMENTS(continued)
or fee paid by the borrower to the Fund in connection with the loan), and payments are made for fees of the securities lending agent and for certain other administrative expenses. It is the policy of the Fund to receive collateral consisting of cash in an amount exceeding the value of the securities loaned. A Fund will have the right to call a loan and obtain the securities loaned at any time on notice to the borrower within the normal and customary settlement time for the securities. While the securities are on loan, the borrower is obligated to pay the Fund amounts equal to any income or other distributions from the securities. The Fund will not be able to exercise voting rights with respect to any securities during the existence of a loan, but will have the right to regain ownership of loaned securities in order to exercise voting or other ownership rights. The lending agent has agreed to indemnify the Fund in the case of default of any securities borrower. Collateral received and securities loaned are marked to market daily to ensure that the securities loaned are secured by collateral. The lending agent currently invests the cash collateral received in Government Money Market Portfolio, an eligible money market vehicle, in accordance with the investment restrictions of the Fund, and as approved by the Board. The collateral received on securities loaned is recorded as an asset as well as a corresponding liability in the statement of assets and liabilities. When the Fund lends securities, its investment performance will continue to reflect changes in the value of the securities loaned. At December 31, 2018, the Fund had securities on loan with a value of $29,210 and had received cash collateral which has been invested into Government Money Market Portfolio of $31,250. The cash collateral will be adjusted on the next business day to maintain the required collateral amount. The Fund earned net securities lending income of $270 from Government Money Market Portfolio, inclusive of a rebate expense paid to the borrower, for the year ended December 31, 2018; this amount is reflected in the statement of operations. In connection with the cash collateral investment by the Fund in the Government Money Market Portfolio, the Adviser has agreed to waive a portion of the Fund’s share of the advisory fees of Government Money Market Portfolio, as borne indirectly by the Fund as an acquired fund fee and expense. For the year ended December 31, 2018, such waiver amounted to $25. A principal risk of lending portfolio securities is that the borrower will fail to return the loaned securities upon termination of the loan and that the collateral will not be sufficient to replace the loaned securities.
| | |
| |
| abfunds.com | | AB FLEXFEE EMERGING MARKETS GROWTH PORTFOLIO | 33 |
NOTES TO FINANCIAL STATEMENTS(continued)
NOTE E
Capital Stock
Each class consists of 3,000,000,000 authorized shares. Transactions in capital shares for each class were as follows:
| | | | | | | | | | | | | | | | | | | | | | | | | | | | |
| | | | | | | | | | | | | | | | | | | | | | | | | | | | |
| | | Shares | | | | | Amount | | | |
| | | Year
Ended
December 31,
2018 | | | July 1,
2017 to
December 31,
2017(a) | | | Year
Ended
June 30,
2017 | | | | | Year
Ended
December 31,
2018 | | | July 1,
2017 to
December 31,
2017(a) | | | Year
Ended
June 30,
2017 | | | |
| | | | | | |
| Class A | | | | | | | | | | | | | | | | | | | | | | | | | | | | |
Shares redeemed | | | – 0 | – | | | – 0 | – | | | (1,000 | ) | | | | $ | – 0 | – | | $ | – 0 | – | | $ | (10,750 | ) | | |
| | | |
Net decrease | | | – 0 | – | | | – 0 | – | | | (1,000 | ) | | | | $ | – 0 | – | | $ | – 0 | – | | $ | (10,750 | ) | | |
| | | |
| | | | | | | | | | | | | | | | | | | | | | | | | | | | |
Class C | | | | | | | | | | | | | | | | | | | | | | | | | | | | |
Shares redeemed | | | – 0 | – | | | – 0 | – | | | (1,000 | ) | | | | $ | – 0 | – | | $ | – 0 | – | | $ | (10,550 | ) | | |
| | | |
Net decrease | | | – 0 | – | | | – 0 | – | | | (1,000 | ) | | | | $ | – 0 | – | | $ | – 0 | – | | $ | (10,550 | ) | | |
| | | |
| | | | | | | | | | | | | | | | | | | | | | | | | | | | |
Advisor Class | | | | | | | | | | | | | | | | | | | | | | | | | | | | |
Shares sold | | | 7,800 | | | | – 0 | – | | | 0 | (b) | | | | $ | 83,021 | | | $ | – 0 | – | | $ | 3 | | | |
| | | |
Shares issued in reinvestment of dividends and distributions | | | 27,167 | | | | 0 | (b) | | | – 0 | – | | | | | 237,979 | | | | 0 | (c) | | | – 0 | – | | |
| | | |
Shares redeemed | | | 0 | (b) | | | – 0 | – | | | – 0 | – | | | | | (2 | ) | | | – 0 | – | | | – 0 | – | | |
| | | |
Net increase | | | 34,967 | | | | 0 | (b) | | | 0 | (b) | | | | $ | 320,998 | | | $ | 0 | (c) | | $ | 3 | | | |
| | | |
| (a) | The Fund changed its fiscal year end from June 30 to December 31. |
At December 31, 2018, the Adviser owned 98% of the Fund’s outstanding shares. Significant transactions by such shareholder, if any, may impact the Fund’s performance.
NOTE F
Risks Involved in Investing in the Fund
Emerging Market Risk—Investments in emerging market countries may have more risk because the markets are less developed and less liquid, and because these investments may be subject to increased economic, political, regulatory or other uncertainties.
Foreign (Non-U.S.) Risk—Investments in securities of non-U.S. issuers may involve more risk than those of U.S. issuers. These securities may fluctuate more widely in price and may be less liquid due to adverse market, economic, political, regulatory or other factors.
| | |
| |
| 34 | AB FLEXFEE EMERGING MARKETS GROWTH PORTFOLIO | | abfunds.com |
NOTES TO FINANCIAL STATEMENTS(continued)
Currency Risk—Fluctuations in currency exchange rates may negatively affect the value of the Fund’s investments or reduce its returns.
Derivatives Risk—The Fund may enter into derivative transactions such as forwards, options, futures and swaps. Derivatives may be illiquid, difficult to price, and leveraged so that small changes may produce disproportionate losses for the Fund, and may be subject to counterparty risk to a greater degree than more traditional investments. Derivatives may result in significant losses, including losses that are far greater than the value of the derivatives reflected in the statement of assets and liabilities.
Sector Risk—The Fund may have more risk because of concentrated investments in a particular market sector, such as the technology or financial services sector. Market or economic factors affecting that sector could have a major effect on the value of the Fund’s investments.
Indemnification Risk—In the ordinary course of business, the Fund enters into contracts that contain a variety of indemnifications. The Fund’s maximum exposure under these arrangements is unknown. However, the Fund has not had prior claims or losses pursuant to these indemnification provisions and expects the risk of loss thereunder to be remote. Therefore, the Fund has not accrued any liability in connection with these indemnification provisions.
NOTE G
Joint Credit Facility
A number of open-end mutual funds managed by the Adviser, including the Fund, participate in a $325 million revolving credit facility (the “Facility”) intended to provide short-term financing if necessary, subject to certain restrictions in connection with abnormal redemption activity. Commitment fees related to the Facility are paid by the participating funds and are included in miscellaneous expenses in the statement of operations. The Fund did not utilize the Facility during the year ended December 31, 2018.
NOTE H
Distributions to Shareholders
The tax character of distributions paid during the fiscal year ended December 31, 2018, period ended December 31, 2017, and the year ended June 30, 2017 were as follows:
| | | | | | | | | | | | |
| | | December 2018 | | | December 2017 | | | June 2017 | |
Distributions paid from: | | | | | | | | |
Ordinary income | | $ | 97,273 | | | $ | 41,135 | | | $ | 13,003 | |
Net long-term capital gains | | | 140,706 | | | | – 0 | – | | | – 0 | – |
| | | | | | | | | | | | |
Total taxable distributions paid | | $ | 237,979 | | | $ | 41,135 | | | $ | 13,003 | |
| | | | | | | | | | | | |
| | |
| |
| abfunds.com | | AB FLEXFEE EMERGING MARKETS GROWTH PORTFOLIO | 35 |
NOTES TO FINANCIAL STATEMENTS(continued)
As of December 31, 2018, the components of accumulated earnings/(deficit) on a tax basis were as follows:
| | | | |
Accumulated capital and other losses | | $ | (61,130 | )(a) |
Unrealized appreciation/(depreciation) | | | (559,693 | )(b) |
| | | | |
Total accumulated earnings/(deficit) | | $ | (620,823 | )(c) |
| | | | |
| (a) | During the fiscal year, the Fund utilized $161,277 of capital loss carry forwards to offset current year net realized gains. As of December 31, 2018, the Fund had a post-October capital loss deferral of $61,130. |
| (b) | The differences between book-basis and tax-basis unrealized appreciation/(depreciation) are attributable primarily to the tax deferral of losses on wash sales and the tax treatment of passive foreign investment companies (PFICs). |
| (c) | The difference between book-basis and tax-basis components of accumulated earnings/(deficit) is attributable primarily to the accrual of foreign capital gains tax. |
For tax purposes, net realized capital losses may be carried over to offset future capital gains, if any. Funds are permitted to carry forward capital losses for an indefinite period, and such losses will retain their character as either short-term or long-term capital losses. As of December 31, 2018, the Fund did not have any capital loss carryforwards.
During the current fiscal year, permanent differences primarily due to nondeductible taxes paid and taxable overdistributions resulted in a net decrease in accumulated loss and a net decrease in additional paid-in capital. These reclassifications had no effect on net assets.
NOTE I
Recent Accounting Pronouncements
In August 2018, the Financial Accounting Standards Board issued an Accounting Standards Update, ASU 2018-13, Fair Value Measurement (Topic 820), Disclosure Framework-Changes to the Disclosure Requirements for Fair Value Measurement which removes, modifies and adds disclosures to Topic 820. The amendments in this ASU 2018-13 apply to all entities that are required, under existing U.S. GAAP, to make disclosures about recurring or nonrecurring fair value measurements. The amendments in this ASU 2018-13 are effective for all entities for fiscal years, and interim periods within those fiscal years, beginning after December 15, 2019. At this time, management is evaluating the implications of these changes on the financial statements.
In October 2018, the U.S. Securities and Exchange Commission adopted amendments to certain disclosure requirements included in Regulation S-X that had become “redundant, duplicative, overlapping, outdated or superseded, in light of the other Commission disclosure requirements, GAAP or changes in the information environment.” The compliance date for the amendments to Regulation S-X was November 5, 2018 (for reporting
| | |
| |
| 36 | AB FLEXFEE EMERGING MARKETS GROWTH PORTFOLIO | | abfunds.com |
NOTES TO FINANCIAL STATEMENTS(continued)
period end dates of September 30, 2018 or after). Management has adopted the amendments which simplified certain disclosure requirements on the financial statements.
NOTE J
Subsequent Events
Management has evaluated subsequent events for possible recognition or disclosure in the financial statements through the date the financial statements are issued. Management has determined that there are no material events that would require disclosure in the Fund’s financial statements through this date.
| | |
| |
| abfunds.com | | AB FLEXFEE EMERGING MARKETS GROWTH PORTFOLIO | 37 |
FINANCIAL HIGHLIGHTS
Selected Data For A Share Of Capital Stock Outstanding Throughout Each Period
| | | | | | | | | | | | | | | | | | | | |
| | | Advisor Class | |
| | | Year
Ended
December 31,
2018 | | | July 1,
2017 to
December 31,
2017(a) | | | Year Ended June 30, | | | November 13,
2014(b) to
June 30,
2015 | |
| | | 2017 | | | 2016 | |
| | | | |
| | | | | | | | | | | | | | | | | | | | |
Net asset value, beginning of period | | | $ 12.35 | | | | $ 10.90 | | | | $ 8.82 | | | | $ 9.64 | | | | $ 10.00 | |
| | | | |
Income From Investment Operations | | | | | | | | | | | | | | | | | | | | |
| | | | | |
Net investment income(c)(d) | | | .20 | | | | .06 | | | | .03 | | | | .02 | | | | .01 | |
| | | | | |
Net realized and unrealized gain (loss) on investment and foreign currency transactions | | | (3.33 | ) | | | 1.47 | | | | 2.08 | | | | (.82 | ) | | | (.37 | ) |
| | | | | |
Capital Contributions | | | – 0 | – | | | – 0 | – | | | – 0 | – | | | .00 | (e) | | | – 0 | – |
| | | | |
Net increase (decrease) in net asset value from operations | | | (3.13 | ) | | | 1.53 | | | | 2.11 | | | | (.80 | ) | | | (.36 | ) |
| | | | |
Less: Dividends | | | | | | | | | | | | | | | | | | | | |
| | | | | |
Dividends from net investment income | | | (.19 | ) | | | (.08 | ) | | | (.03 | ) | | | (.02 | ) | | | – 0 | – |
| | | | | |
Distributions from net realized gain on investment and foreign currency transactions | | | (.28 | ) | | | – 0 | – | | | – 0 | – | | | – 0 | – | | | – 0 | – |
| | | | |
Total dividends and distributions | | | (.47 | ) | | | (.08 | ) | | | (.03 | ) | | | (.02 | ) | | | – 0 | – |
| | | | |
Net asset value, end of period | | | $ 8.75 | | | | $ 12.35 | | | | $ 10.90 | | | | $ 8.82 | | | | $ 9.64 | |
| | | | |
| | | | | |
Total Return | | | | | | | | | | | | | | | | | | | | |
| | | | | |
Total investment return based on net asset value(f) | | | (25.34 | )%^ | | | 13.96 | % | | | 24.06 | % | | | (8.27 | )% | | | (3.60 | )% |
| | | | | |
Ratios/Supplemental Data | | | | | | | | | | | | | | | | | | | | |
| | | | | |
Net assets, end of period (000’s omitted) | | | $4,666 | | | | $6,152 | | | | $5,430 | | | | $4,394 | | | | $4,799 | |
| | | | | |
Ratio to average net assets of: | | | | | | | | | | | | | | | | | | | | |
| | | | | |
Expenses, net of waivers/reimbursements | | | .15 | %(g) | | | .15 | %(h) | | | 1.40 | % | | | 1.40 | % | | | 1.45 | %(h) |
| | | | | |
Expenses, before waivers/reimbursements | | | 6.25 | %(g) | | | 7.08 | %(h) | | | 7.50 | % | | | 7.99 | % | | | 8.01 | %(h) |
| | | | | |
Net investment income(d) | | | 1.71 | % | | | 1.02 | %(h) | | | .34 | % | | | .28 | % | | | .22 | %(h) |
| | | | | |
Portfolio turnover rate | | | 83 | % | | | 30 | % | | | 79 | % | | | 77 | % | | | 31 | % |
See footnote summary on page 39.
| | |
| |
| 38 | AB FLEXFEE EMERGING MARKETS GROWTH PORTFOLIO | | abfunds.com |
FINANCIAL HIGHLIGHTS(continued)
Selected Data For A Share Of Capital Stock Outstanding Throughout Each Period
| (a) | The Fund changed its fiscal year end from June 30 to December 31. |
| (b) | Commencement of operations. |
| (c) | Based on average shares outstanding. |
| (d) | Net of expenses waived/reimbursed by the Adviser. |
| (e) | Amount is less than $0.005. |
| (f) | Total investment return is calculated assuming an initial investment made at the net asset value at the beginning of the period, reinvestment of all dividends and distributions at net asset value during the period, and redemption on the last day of the period. Total investment return does not reflect the deduction of taxes that a shareholder would pay on fund distributions or the redemption of fund shares. Total investment return for a period of less than one year is not annualized. |
| (g) | The advisory fee reflected in the Fund’s expense ratio may be higher or lower than the Base Fee plus Performance Adjustment due to the different time periods over which the fee is calculated (i.e., the financial reporting period vs. the Performance Period). |
| ^ | The net asset value and total return include adjustments in accordance with accounting principles generally accepted in the United States of America for financial reporting purposes. As such, the net asset value and total return for shareholder transactions may differ from financial statements. |
See notes to financial statements.
| | |
| |
| abfunds.com | | AB FLEXFEE EMERGING MARKETS GROWTH PORTFOLIO | 39 |
REPORT OF INDEPENDENT REGISTERED
PUBLIC ACCOUNTING FIRM
To the Shareholders and the Board of Directors of AB FlexFee Emerging Markets Growth Portfolio:
Opinion on the Financial Statements
We have audited the accompanying statement of assets and liabilities of AB FlexFee Emerging Markets Growth Portfolio (the “Fund”) (one of the portfolios constituting AB Cap Fund, Inc. (the “Company”)), including the portfolio of investments, as of December 31, 2018, and the related statement of operations for the year then ended, the statements of changes in net assets for the year then ended, the period July 1, 2017 to December 31, 2017 and the year ended June 30, 2017, the financial highlights for the year then ended, the period July 1, 2017 to December 31, 2017, each of the two years in the period ended June 30, 2017 and the period November 13, 2014 (commencement of operations) to June 30, 2015 and the related notes (collectively referred to as the “financial statements”). In our opinion, the financial statements present fairly, in all material respects, the financial position of the Fund (one of the portfolios constituting AB Cap Fund, Inc.) at December 31, 2018, the results of its operations for the year then ended, the changes in its net assets for the year then ended, the period July 1, 2017 to December 31, 2017 and the year ended June 30, 2017, and its financial highlights for the year then ended, the period July 1, 2017 to December 31, 2017, each of the two years in the period ended June 30, 2017 and the period November 13, 2014 (commencement of operations) to June 30, 2015, in conformity with U.S. generally accepted accounting principles.
Basis for Opinion
These financial statements are the responsibility of the Company’s management. Our responsibility is to express an opinion on the Fund’s financial statements based on our audits. We are a public accounting firm registered with the Public Company Accounting Oversight Board (United States) (“PCAOB”) and are required to be independent with respect to the Company in accordance with the U.S. federal securities laws and the applicable rules and regulations of the Securities and Exchange Commission and the PCAOB.
We conducted our audits in accordance with the standards of the PCAOB. Those standards require that we plan and perform the audit to obtain reasonable assurance about whether the financial statements are free of material misstatement, whether due to error or fraud. The Company is not required to have, nor were we engaged to perform, an audit of the Company’s internal control over financial reporting. As part of our audits,
| | |
| |
| 40 | AB FLEXFEE EMERGING MARKETS GROWTH PORTFOLIO | | abfunds.com |
REPORT OF INDEPENDENT REGISTERED
PUBLIC ACCOUNTING FIRM(continued)
we are required to obtain an understanding of internal control over financial reporting, but not for the purpose of expressing an opinion on the effectiveness of the Company’s internal control over financial reporting. Accordingly, we express no such opinion.
Our audits included performing procedures to assess the risks of material misstatement of the financial statements, whether due to error or fraud, and performing procedures that respond to those risks. Such procedures included examining, on a test basis, evidence regarding the amounts and disclosures in the financial statements. Our procedures included confirmation of securities owned as of December 31, 2018, by correspondence with the custodian and others or by other appropriate auditing procedures where replies from others were not received. Our audits also included evaluating the accounting principles used and significant estimates made by management, as well as evaluating the overall presentation of the financial statements. We believe that our audits provide a reasonable basis for our opinion.

We have served as the auditor of one or more of the AB investment companies since 1968.
New York, New York
February 26, 2019
| | |
| |
| abfunds.com | | AB FLEXFEE EMERGING MARKETS GROWTH PORTFOLIO | 41 |
2018 FEDERAL TAX INFORMATION
(unaudited)
For Federal income tax purposes, the following information is furnished with respect to the distributions paid by the Fund for the calendar year ended December 31, 2018.
For individual shareholders, the Fund designates 67.85% of dividends paid as qualified dividend income.
| | |
| |
| 42 | AB FLEXFEE EMERGING MARKETS GROWTH PORTFOLIO | | abfunds.com |
RESULTS OF STOCKHOLDER MEETING
(unaudited)
A Special Meeting of Stockholders of the AB Cap Fund, Inc. (the “Company”)—AB FlexFee Emerging Markets Growth Portfolio (the “Fund”) was held on October 11, 2018. A description of the proposals and number of shares voted at the Meeting are as follows (the proposal number shown below corresponds to the proposal number in the Fund’s proxy statement):
| 1. | To approve and vote upon the election of Directors for the Company, each such Director to serve for a term of indefinite duration and until his or her successor is duly elected and qualifies. |
| | | | | | | | |
Director: | | Voted
For: | | | Authority
Withheld: | |
Michael J. Downey | | | 153,531,217 | | | | 1,117,868 | |
William H. Foulk, Jr.* | | | 153,385,034 | | | | 1,264,050 | |
Nancy P. Jacklin | | | 153,607,746 | | | | 1,041,339 | |
Robert M. Keith | | | 153,546,025 | | | | 1,103,060 | |
Carol C. McMullen | | | 153,649,415 | | | | 999,670 | |
Gary L. Moody | | | 153,545,113 | | | | 1,103,972 | |
Marshall C. Turner, Jr. | | | 153,507,495 | | | | 1,141,590 | |
Earl D. Weiner | | | 153,514,727 | | | | 1,134,358 | |
| 2. | To vote upon the approval of new advisory agreements for the Fund with AllianceBernstein L.P. |
| | | | | | | | | | | | | | |
Voted
For: | | | Voted
Against: | | | Abstain: | | | Broker
Non-Votes: | |
| | 498,000 | | | | – 0 | – | | | – 0 | – | | | 250 | |
| * | Mr. Foulk retired on December 31, 2018. |
| | |
| |
| abfunds.com | | AB FLEXFEE EMERGING MARKETS GROWTH PORTFOLIO | 43 |
BOARD OF DIRECTORS
| | |
Marshall C. Turner, Jr.(1),Chairman Michael J. Downey(1) Nancy P. Jacklin(1) | | Robert M. Keith,President and Chief Executive Officer Carol C. McMullen(1) Garry L. Moody(1) Earl D. Weiner(1) |
OFFICERS
| | |
Laurent Saltiel(2),Vice President
Emilie D. Wrapp,Secretary Michael B. Reyes,Senior Analyst Joseph J. Mantineo,Treasurer andChief Financial Officer | | Phyllis J. Clarke,Controller
Vincent S. Noto,Chief Compliance Officer |
| | |
Custodian and Accounting Agent Brown Brothers Harriman & Co. 50 Post Office Square Boston, MA 02110 Principal Underwriter AllianceBernstein Investments, Inc. 1345 Avenue of the Americas New York, NY 10105 Transfer Agent AllianceBernstein Investor Services, Inc. P.O. Box 786003 San Antonio, TX 78278-6003 Toll-Free (800) 221-5672 | | Independent Registered Public Accounting Firm Ernst & Young LLP 5 Times Square New York, NY 10036 Legal Counsel Seward & Kissel LLP One Battery Park Plaza New York, NY 10004 |
| 1 | Member of the Audit Committee, the Governance and Nominating Committee and the Independent Directors Committee. |
| 2 | The day-to-day management of, and investment decisions for, the portfolio is made by the Adviser. Mr. Saltiel is the investment professional with the most significant responsibility for the day-to-day management of the Fund’s portfolio. |
| | |
| |
| 44 | AB FLEXFEE EMERGING MARKETS GROWTH PORTFOLIO | | abfunds.com |
MANAGEMENT OF THE FUND
Board of Directors Information
The business and affairs of the Fund are managed under the direction of the Board of Directors. Certain information concerning the Fund’s Directors is set forth below.
| | | | | | | | |
NAME,
ADDRESS*, AGE,
(YEAR FIRST ELECTED**) | | PRINCIPAL
OCCUPATION(S)
DURING PAST FIVE YEARS
AND OTHER INFORMATION*** | | PORTFOLIOS
IN AB FUNDS
COMPLEX
OVERSEEN BY
DIRECTOR | | | OTHER PUBLIC
COMPANY
DIRECTORSHIPS
CURRENTLY HELD
BY DIRECTOR |
| INTERESTED DIRECTOR | | | | | | |
| | | |
Robert M. Keith,# 1345 Avenue of the Americas New York, NY 10105 58
(2015) | | Senior Vice President of AllianceBernstein L.P. (the “Adviser”) and the head of AllianceBernstein Investments, Inc. (“ABI”) since July 2008; Director of ABI and President of the AB Mutual Funds. Previously, he served as Executive Managing Director of ABI from December 2006 to June 2008. Prior to joining ABI in 2006, Executive Managing Director of Bernstein Global Wealth Management, and prior thereto, Senior Managing Director and Global Head of Client Service and Sales of the Adviser’s institutional investment management business since 2004. Prior thereto, he was Managing Director and Head of North American Client Service and Sales in the Adviser’s institutional investment management business, with which he had been associated since prior to 2004. | | | 95 | | | None |
| | | | | | | | |
| | |
| |
| abfunds.com | | AB FLEXFEE EMERGING MARKETS GROWTH PORTFOLIO | 45 |
MANAGEMENT OF THE FUND(continued)
| | | | | | | | |
NAME,
ADDRESS*, AGE,
(YEAR FIRST ELECTED**) | | PRINCIPAL
OCCUPATION(S)
DURING PAST FIVE YEARS
AND OTHER INFORMATION*** | | PORTFOLIOS
IN AB FUNDS
COMPLEX
OVERSEEN BY
DIRECTOR | | | OTHER PUBLIC
COMPANY
DIRECTORSHIPS
CURRENTLY HELD
BY DIRECTOR |
DISINTERESTED DIRECTORS
| | | | | | |
| | | |
Marshall C. Turner, Jr.,## Chairman of the Board 77 (2015) | | Private Investor since prior to 2014. Former Chairman and CEO of Dupont Photomasks, Inc. (components of semi-conductor manufacturing). He has extensive operating leadership, and venture capital investing experience, including five interim or full-time CEO roles, and prior service as general partner of institutional venture capital partnerships. He also has extensive non-profit board leadership experience, and currently serves on the boards of two education and science-related non-profit organizations. He has served as a director of one AB Fund since 1992, and director or trustee of multiple AB funds since 2005. He has been Chairman of the AB Funds since January 2014, and the Chairman of the Independent Directors Committees of such AB Funds since February 2014. | | | 95 | | | Xilinx, Inc. (programmable logic semi-conductors) since 2007 |
| | | | | | | | |
| | | |
Michael J. Downey,## 75 (2015) | | Private Investor since prior to 2014. Formerly, managing partner of Lexington Capital, LLC (investment advisory firm) from December 1997 until December 2003. He also served as a Director of Prospect Acquisition Corp. (financial services) from 2007 until 2009. From 1987 until 1993, Chairman and CEO of Prudential Mutual Fund Management, director of the Prudential mutual funds, and member of the Executive Committee of Prudential Securities Inc. He has served as a director or trustee of the AB Funds since 2005 and is a director and Chairman of one other registered investment company. | | | 95 | | | The Asia Pacific Fund, Inc. (registered investment company) since prior to 2014 |
| | |
| |
| 46 | AB FLEXFEE EMERGING MARKETS GROWTH PORTFOLIO | | abfunds.com |
MANAGEMENT OF THE FUND(continued)
| | | | | | | | |
NAME,
ADDRESS*, AGE,
(YEAR FIRST ELECTED**) | | PRINCIPAL
OCCUPATION(S)
DURING PAST FIVE YEARS
AND OTHER INFORMATION*** | | PORTFOLIOS
IN AB FUNDS
COMPLEX
OVERSEEN BY
DIRECTOR | | | OTHER PUBLIC
COMPANY
DIRECTORSHIPS
CURRENTLY HELD
BY DIRECTOR |
DISINTERESTED DIRECTORS
(continued) | | | | | | |
| | | |
Nancy P. Jacklin,## 70 (2015) | | Private Investor since prior to 2014. Professorial Lecturer at the Johns Hopkins School of Advanced International Studies (2008-2015). U.S. Executive Director of the International Monetary Fund (which is responsible for ensuring the stability of the international monetary system), (December 2002-May 2006); Partner, Clifford Chance (1992-2002); Sector Counsel, International Banking and Finance, and Associate General Counsel, Citicorp (1985-1992); Assistant General Counsel (International), Federal Reserve Board of Governors (1982-1985); and Attorney Advisor, U.S. Department of the Treasury (1973-1982). Member of the Bar of the District of Columbia and of New York; and member of the Council on Foreign Relations. She has served as a director or trustee of the AB Funds since 2006 and has been Chair of the Governance and Nominating Committees of the AB Funds since August 2014. | | | 95 | | | None |
| | |
| |
| abfunds.com | | AB FLEXFEE EMERGING MARKETS GROWTH PORTFOLIO | 47 |
MANAGEMENT OF THE FUND(continued)
| | | | | | | | |
NAME,
ADDRESS*, AGE,
(YEAR FIRST ELECTED**) | | PRINCIPAL
OCCUPATION(S)
DURING PAST FIVE YEARS
AND OTHER INFORMATION*** | | PORTFOLIOS
IN AB FUNDS
COMPLEX
OVERSEEN BY
DIRECTOR | | | OTHER PUBLIC
COMPANY
DIRECTORSHIPS
CURRENTLY HELD
BY DIRECTOR |
DISINTERESTED DIRECTORS
(continued) | | | | | | |
| | | |
Carol C. McMullen,## 63 (2016) | | Managing Director of Slalom Consulting (consulting) since 2014 and private investor and member of the Partners Healthcare Investment Committee. Formerly, Director of Norfolk & Dedham Group (mutual property and casualty insurance) from 2011 until November 2016; Director of Partners Community Physicians Organization (healthcare) from 2014 until December 2016; and Managing Director of The Crossland Group (consulting) from 2012 until 2013. She has held a number of senior positions in the asset and wealth management industries, including at Eastern Bank (where her roles included President of Eastern Wealth Management), Thomson Financial (Global Head of Sales for Investment Management), and Putnam Investments (where her roles included Head of Global Investment Research). She has served on a number of private company and non-profit boards, and as a director or trustee of the AB Funds since June 2016. | | | 95 | | | None |
| | | | | | | | |
| | |
| |
| 48 | AB FLEXFEE EMERGING MARKETS GROWTH PORTFOLIO | | abfunds.com |
MANAGEMENT OF THE FUND(continued)
| | | | | | | | |
NAME,
ADDRESS*, AGE,
(YEAR FIRST ELECTED**) | | PRINCIPAL
OCCUPATION(S)
DURING PAST FIVE YEARS
AND OTHER INFORMATION*** | | PORTFOLIOS
IN AB FUNDS
COMPLEX
OVERSEEN BY
DIRECTOR | | | OTHER PUBLIC
COMPANY
DIRECTORSHIPS
CURRENTLY HELD
BY DIRECTOR |
DISINTERESTED DIRECTORS
(continued) | | | | | | |
| | | |
Garry L. Moody,## 66 (2015) | | Independent Consultant. Formerly, Partner, Deloitte & Touche LLP (1995-2008) where he held a number of senior positions, including Vice Chairman, and U.S. and Global Investment Management Practice Managing Partner; President, Fidelity Accounting and Custody Services Company (1993-1995), where he was responsible for the accounting, pricing, custody and reporting for the Fidelity mutual funds; and Partner, Ernst & Young LLP (1975-1993), where he served as the National Director of Mutual Fund Tax Services and Managing Partner of its Chicago Office Tax department. He is a member of the Trustee Advisory Board of BoardIQ, a biweekly publication focused on issues and news affecting directors of mutual funds. He has served as a director or trustee and as Chairman of the Audit Committees of the AB Funds since 2008. | | | 95 | | | None |
| | | | | | | | |
| | | |
Earl D. Weiner,## 79 (2015) | | Of Counsel, and Partner prior to January 2007, of the law firm Sullivan & Cromwell LLP and is a former member of the ABA Federal Regulation of Securities Committee Task Force to draft editions of the Fund Director’s Guidebook. He also serves as a director or trustee of various non-profit organizations and has served as Chairman or Vice Chairman of a number of them. He has served as a director or trustee of the AB Funds since 2007 and served as Chairman of the Governance and Nominating Committees of the AB Funds from 2007 until August 2014. | | | 95 | | | None |
| | |
| |
| abfunds.com | | AB FLEXFEE EMERGING MARKETS GROWTH PORTFOLIO | 49 |
MANAGEMENT OF THE FUND(continued)
| * | The address for each of the Fund’s disinterested Directors is c/o AllianceBernstein L.P., Attention: Legal & Compliance Department - Mutual Fund Legal, 1345 Avenue of the Americas, New York, NY 10105. |
| ** | There is no stated term of office for the Fund’s Directors. |
| *** | The information above includes each Director’s principal occupation during the last five years and other information relating to the experience, attributes and skills relevant to each Director’s qualifications to serve as a Director, which led to the conclusion that each Director should serve as a Director for the Fund. |
| # | Mr. Keith is an “interested person” of the Fund, as defined in the 1940 Act, due to his position as a Senior Vice President of the Adviser. |
| ## | Member of the Audit Committee, the Governance and Nominating Committee and the Independent Directors Committee. |
| | |
| |
| 50 | AB FLEXFEE EMERGING MARKETS GROWTH PORTFOLIO | | abfunds.com |
MANAGEMENT OF THE FUND(continued)
Officer Information
Certain information concerning the Fund’s Officers is listed below:
| | | | |
Robert M. Keith
58 | | President and Chief Executive Officer | | See biography above. |
| | | | |
Laurent Saltiel
49 | | Vice President | | Senior Vice President of the Adviser with which he has been associated since prior to 2014. |
| | | | |
Emilie D. Wrapp
63 | | Secretary | | Senior Vice President, Assistant General Counsel and Assistant Secretary of ABI**, with which she has been associated since prior to 2014. |
| | | | |
Michael B. Reyes
42 | | Senior Analyst | | Vice President of the Adviser**, with which he has been associated since prior to 2014. |
| | | | |
Joseph J. Mantineo
59 | | Treasurer and Chief Financial Officer | | Senior Vice President of AllianceBernstein Investor Services (“ABIS”)**, with which he has been associated since prior to 2014. |
| | | | |
Phyllis J. Clarke
58 | | Controller | | Vice President of ABIS**, with which she has been associated since prior to 2014. |
| | | | |
Vincent S. Noto 54 | | Chief Compliance Officer | | Senior Vice President since 2015 and Mutual Fund Chief Compliance Officer of the Adviser** since 2014. Prior thereto, he was Vice President and Director of Mutual Fund Compliance of the Adviser** since 2012. |
| * | The address for each of the Fund’s Officers is 1345 Avenue of the Americas, New York, NY 10105. |
| ** | The Adviser, ABI and ABIS are affiliates of the Fund. |
The Fund’s Statement of Additional Information (“SAI”) has additional information about the Fund’s Directors and Officers and is available without charge upon request. Contact your financial representative or AB at (800) 227-4618, or visit www.abfunds.com, for a free prospectus or SAI.
| | |
| |
| abfunds.com | | AB FLEXFEE EMERGING MARKETS GROWTH PORTFOLIO | 51 |
Information Regarding the Review and Approval of the Fund’s Advisory Agreement
As described in more detail in the Proxy Statement for the AB Funds dated August 20, 2018, the Boards of the AB Funds, at a meeting held on July 31-August 2, 2018, approved new advisory agreements with the Adviser (the “Proposed Agreements”) for the AB Funds, including AB Cap Fund, Inc. in respect of AB FlexFeeTM Emerging Markets Growth Portfolio (the “Fund”), in connection with the planned disposition by AXA S.A. of its remaining shares of AXA Equitable Holdings, Inc. (the indirect holder of a majority of the partnership interests in the Adviser and the indirect parent of AllianceBernstein Corporation, the general partner of the Adviser) in one or more transactions and the related potential for one or more “assignments” (within the meaning of section 2(a)(4) of the Investment Company Act) of the advisory agreements for the AB Funds, including the Fund’s Advisory Agreement, resulting in the automatic termination of such advisory agreements.
At the same meeting, the AB Boards also considered and approved interim advisory agreements with the Adviser (the “Interim Advisory Agreements”) for the AB Funds, including the Fund, to be effective only in the event that stockholder approval of a Proposed Agreement had not been obtained as of the date of one or more transactions resulting in an “assignment” of the Adviser’s advisory agreements, resulting in the automatic termination of such advisory agreements.
The shareholders of the Fund subsequently approved the Proposed Agreements at an annual meeting of shareholders called for the purpose of electing Directors and voting on the Proposed Agreements.
A discussion regarding the basis for the Boards’ approvals at a meeting held on July 31-August 2, 2018 is set forth below.
Information Regarding the Review and Approval of the Fund’s Proposed New Advisory Agreement and Interim Advisory Agreement in the Context of Potential Assignments
At a meeting of the AB Boards held on July 31-August 2, 2018, the Adviser presented its recommendation that the Boards consider and approve the Proposed Agreements. Section 15(c) of the 1940 Act provides that, after an initial period, a Fund’s Current Agreement and current sub-advisory agreement, as applicable, will remain in effect only if the Board, including a majority of the Independent Directors, annually reviews and approves them. Each of the Current Agreements had been approved by a Board within the one-year period prior to approval of its related Proposed Agreement, except that the Current Agreements for certain FlexFee funds were approved in February 2017. In connection with their approval of the Proposed Agreements, the Boards considered their conclusions in connection with their most recent approvals of the Current Agreements, in particular in cases where the last approval of a Current Agreement was relatively recent, including the Boards’ general satisfaction with the nature and quality of services
| | |
| |
| 52 | AB FLEXFEE EMERGING MARKETS GROWTH PORTFOLIO | | abfunds.com |
being provided and, as applicable, in the case of certain Funds, actions taken or to be taken in an effort to improve investment performance or reduce expense ratios. The Directors also reviewed updated information provided by the Adviser in respect of each Fund. Also in connection with their approval of the Proposed Agreements, the Boards considered a representation made to them at that time by the Adviser that there were no additional developments not already disclosed to the Boards since their most recent approvals of the Current Agreements that would be a material consideration to the Boards in connection with their consideration of the Proposed Agreements, except for matters disclosed to the Boards by the Adviser. The Directors considered the fact that each Proposed Agreement would have corresponding terms and conditions identical to those of the corresponding Current Agreement with the exception of the effective date and initial term under the Proposed Agreement.
The Directors considered their knowledge of the nature and quality of the services provided by the Adviser to each Fund gained from their experience as directors or trustees of registered investment companies advised by the Adviser, their overall confidence in the Adviser’s integrity and competence they have gained from that experience, the Adviser’s initiative in identifying and raising potential issues with the Directors and its responsiveness, frankness and attention to concerns raised by the Directors in the past, including the Adviser’s willingness to consider and implement organizational and operational changes designed to improve investment results and the services provided to the Funds. The Directors noted that they have four regular meetings each year, at each of which they review extensive materials and information from the Adviser, including information on the investment performance of each Fund.
The Directors also considered all factors they believed relevant, including the specific matters discussed below. During the course of their deliberations, the Directors evaluated, among other things, the reasonableness of the management fees of the Funds they oversee. The Directors did not identify any particular information that was all-important or controlling, and different Directors may have attributed different weights to the various factors. The Directors determined that the selection of the Adviser to manage the Funds, and the overall arrangements between the Funds and the Adviser, as provided in the Proposed Agreements, including the management fees, were fair and reasonable in light of the services performed under the Current Agreements and to be performed under the Proposed Agreements, expenses incurred and to be incurred and such other matters as the Directors considered relevant in the exercise of their business judgment. The material factors and conclusions that formed the basis for the Directors’ determinations included the following:
Nature, Extent and Quality of Services Provided
The Directors considered the scope and quality of services to be provided by the Adviser under the Proposed Agreements, including the quality of the
| | |
| |
| abfunds.com | | AB FLEXFEE EMERGING MARKETS GROWTH PORTFOLIO | 53 |
investment research capabilities of the Adviser and the other resources it has dedicated to performing services for the Funds. They also considered the information that had been provided to them by the Adviser concerning the anticipated implementation of the Plan and the Adviser’s representation that it did not anticipate that such implementation would affect the management or structure of the Adviser, have a material adverse effect on the Adviser, or adversely affect the quality of the services provided to the Funds by the Adviser and its affiliates. The Directors noted that the Adviser from time to time reviews each Fund’s investment strategies and from time to time proposes changes intended to improve the Fund’s relative or absolute performance for the Directors’ consideration. They also noted the professional experience and qualifications of each Fund’s portfolio management team and other senior personnel of the Adviser. The Directors also considered that certain Proposed Agreements, similar to the corresponding Current Agreements, provide that the Funds will reimburse the Adviser for the cost to it of providing certain clerical, accounting, administrative and other services to the Funds by employees of the Adviser or its affiliates. Requests for these reimbursements are made on a quarterly basis and subject to approval by the Directors. The Directors noted that the Adviser did not request any reimbursements from certain Funds in the Fund’s latest fiscal year reviewed. The Directors noted that the methodology to be used to determine the reimbursement amounts had been reviewed by an independent consultant retained by the Funds’ former Senior Officer/Independent Compliance Officer. The quality of administrative and other services, including the Adviser’s role in coordinating the activities of the Funds’ other service providers, also was considered. The Directors of each Fund concluded that, overall, they were satisfied with the nature, extent and quality of services to be provided to the Funds under the Proposed Agreement for the Fund.
Costs of Services to be Provided and Profitability
The Directors reviewed a schedule of the revenues and expenses and related notes indicating the profitability of each Fund to the Adviser for calendar years 2016 and 2017, as applicable, that had been prepared with an expense allocation methodology arrived at in consultation with an independent consultant retained by the Funds’ former Senior Officer/Independent Compliance Officer. The Directors noted the assumptions and methods of allocation used by the Adviser in preparing fund-specific profitability data and understood that there are a number of potentially acceptable allocation methodologies for information of this type. The Directors noted that the profitability information reflected all revenues and expenses of the Adviser’s relationship with a Fund, including those relating to its subsidiaries that provide transfer agency, distribution and brokerage services to the Fund, as applicable. The Directors recognized that it is difficult to make comparisons of the profitability of the Proposed Agreements with the profitability of fund advisory contracts for unaffiliated funds because comparative information is not generally publicly available and is
| | |
| |
| 54 | AB FLEXFEE EMERGING MARKETS GROWTH PORTFOLIO | | abfunds.com |
affected by numerous factors. The Directors focused on the profitability of the Adviser’s relationship with each Fund before taxes and distribution expenses, as applicable. The Directors noted that certain Funds were not profitable to the Adviser in one or more periods reviewed. The Directors concluded that the Adviser’s level of profitability from its relationship with the other Funds was not unreasonable. The Directors were unable to consider historical information about the profitability of certain Funds that had recently commenced operations and for which historical profitability information was not available. The Adviser agreed to provide the Directors with profitability information in connection with future proposed continuances of the Proposed Agreements.
Fall-Out Benefits
The Directors considered the other benefits to the Adviser and its affiliates from their relationships with the Funds, including, but not limited to, as applicable, benefits relating to soft dollar arrangements (whereby investment advisers receive brokerage and research services from brokers that execute agency transactions for their clients) in the case of certain Funds; 12b-1 fees and sales charges received by the principal underwriter (which is a wholly owned subsidiary of the Adviser) in respect of certain classes of the shares of most of the Funds; brokerage commissions paid by certain Funds to brokers affiliated with the Adviser; and transfer agency fees paid by most of the Funds to a wholly owned subsidiary of the Adviser. The Directors recognized that the Adviser’s profitability would be somewhat lower, and that a Fund’s unprofitability to the Adviser would be exacerbated, without these benefits. The Directors understood that the Adviser also might derive reputational and other benefits from its association with the Funds.
Investment Results
In addition to the information reviewed by the Directors in connection with the Board meeting at which the Proposed Agreements were approved, the Directors receive detailed performance information for the Funds at each regular Board meeting during the year.
The Boards’ consideration of each Proposed Agreement was informed by their most recent approval of the related Current Agreement, and, in the case of certain Funds, their discussion with the Adviser of the reasons for those Funds’ underperformance in certain periods. The Directors also reviewed updated performance information and, in some cases, discussed with the Adviser the reasons for changes in performance or continued underperformance. On the basis of this review, the Directors concluded that each Fund’s investment performance was acceptable.
Management Fees and Other Expenses
The Directors considered the management fee rate payable by each Fund to the Adviser and information prepared by an independent service provider
| | |
| |
| abfunds.com | | AB FLEXFEE EMERGING MARKETS GROWTH PORTFOLIO | 55 |
(the “15(c) provider”) concerning management fee rates payable by other funds in the same category as the Fund. The Directors recognized that it is difficult to make comparisons of management fees because there are variations in the services that are included in the fees paid by other funds. The Directors compared each Fund’s contractual management fee rate with a peer group median, and where applicable, took into account the impact on the management fee rate of the administrative expense reimbursement paid to the Adviser in the latest fiscal year. In the case of the ACS Funds, the Directors noted that the management fee rate is zero but also were cognizant that the Adviser is indirectly compensated by the wrap fee program sponsors that use the ACS Funds as an investment vehicle for their clients.
The Directors also considered the Adviser’s fee schedule for other clients pursuing a similar investment style to each Fund. For this purpose, they reviewed the relevant advisory fee information from the Adviser’s Form ADV and in a report from the Funds’ Senior Analyst and noted the differences between a Fund’s fee schedule, on the one hand, and the Adviser’s institutional fee schedule and the schedule of fees charged by the Adviser to any offshore funds and for services to any sub-advised funds pursuing a similar investment strategy as the Fund, on the other, as applicable. The Directors noted that the Adviser may, in some cases, agree to fee rates with large institutional clients that are lower than those reviewed by the Directors and that they had previously discussed with the Adviser its policies in respect of such arrangements. The Adviser also informed the Directors that, in the case of certain Funds, there were no institutional products managed by the Adviser that have a substantially similar investment style. The Directors also discussed these matters with their independent fee consultant.
The Adviser reviewed with the Directors the significantly greater scope of the services it provides to each Fund relative to institutional, offshore fund and sub-advised fund clients, as applicable. In this regard, the Adviser noted, among other things, that, compared to institutional and offshore or sub-advisory accounts, each Fund, as applicable, (i) demands considerably more portfolio management, research and trading resources due to significantly higher daily cash flows (in the case of open-end Funds); (ii) has more tax and regulatory restrictions and compliance obligations; (iii) must prepare and file or distribute regulatory and other communications about fund operations; and (iv) must provide shareholder servicing to retail investors. The Adviser also reviewed the greater legal risks presented by the large and changing population of Fund shareholders who may assert claims against the Adviser in individual or class actions, and the greater entrepreneurial risk in offering new fund products, which require substantial investment to launch, may not succeed, and generally must be priced to compete with larger, more established funds resulting in lack of profitability to the Adviser until a new fund achieves scale. In light of the substantial differences in services rendered by the Adviser to institutional,
| | |
| |
| 56 | AB FLEXFEE EMERGING MARKETS GROWTH PORTFOLIO | | abfunds.com |
offshore fund and sub-advised fund clients as compared to the Funds, and the different risk profile, the Directors considered these fee comparisons inapt and did not place significant weight on them in their deliberations.
The Directors noted that many of the Funds may invest in shares of exchange-traded funds (“ETFs”), subject to the restrictions and limitations of the 1940 Act as these may be varied as a result of exemptive orders issued by the SEC. The Directors also noted that ETFs pay advisory fees pursuant to their advisory contracts. The Directors concluded, based on the Adviser’s explanation of how it uses ETFs when they are the most cost-effective way to obtain desired exposures, in some cases pending purchases of underlying securities, that each Fund’s management fee would be for services that would be in addition to, rather than duplicative of, the services provided under the advisory contracts of the ETFs.
With respect to each Fund’s management fee, the Directors considered the total expense ratio of the Fund in comparison to a peer group and peer universe selected by the 15(c) service provider. The Directors also considered the Adviser’s expense caps for certain Funds. The Directors view expense ratio information as relevant to their evaluation of the Adviser’s services because the Adviser is responsible for coordinating services provided to a Fund by others.
The Boards’ consideration of each Proposed Agreement was informed by their most recent approval of the related Current Agreement, and, in the case of certain Funds, their discussion with the Adviser of the reasons for those Funds’ expense ratios in certain periods. The Directors also reviewed updated expense ratio information and, in some cases, discussed with the Adviser the reasons for the expense ratios of certain Funds. On the basis of this review, the Directors concluded that each Fund’s expense ratio was acceptable.
The Directors did not consider comparative expense information for the ACS Funds because those Funds do not bear ordinary expenses.
Economies of Scale
The Directors noted that the management fee schedules for certain Funds do not contain breakpoints and that they had discussed their strong preference for breakpoints in advisory contracts with the Adviser. The Directors took into consideration prior presentations by an independent consultant on economies of scale in the mutual fund industry and for the Funds, and by the Adviser concerning certain of its views on economies of scale. The Directors also had requested and received from the Adviser certain updates on economies of scale in advance of the Board meeting. The Directors believe that economies of scale may be realized (if at all) by the Adviser across a variety of products and services, and not only in respect of a single fund. The Directors noted that there is no established
| | |
| |
| abfunds.com | | AB FLEXFEE EMERGING MARKETS GROWTH PORTFOLIO | 57 |
methodology for setting breakpoints that give effect to the fund-specific services provided by a fund’s adviser and to the economies of scale that an adviser may realize in its overall mutual fund business or those components of it which directly or indirectly affect a fund’s operations. The Directors observed that in the mutual fund industry as a whole, as well as among funds similar to each Fund, there is no uniformity or pattern in the fees and asset levels at which breakpoints (if any) apply. The Directors also noted that the advisory agreements for many funds do not have breakpoints at all. The Directors informed the Adviser that they would monitor the asset levels of the Funds without breakpoints and their profitability to the Adviser and anticipated revisiting the question of breakpoints in the future if circumstances warrant doing so.
The Directors did not consider the extent to which fee levels in the Advisory Agreement for the ACS Funds reflect economies of scale because that Advisory Agreement does not provide for any compensation to be paid to the Adviser by the ACS Funds and the expense ratio of each of those Funds is zero.
Interim Advisory Agreements
In approving the Interim Advisory Agreements, the Boards, with the assistance of independent counsel, considered similar factors to those considered in approving the Proposed Agreements. The Interim Advisory Agreements approved by the Boards are identical to the Proposed Agreements, as well as the Current Agreements, in all material respects except for their proposed effective and termination dates and provisions intended to comply with the requirements of the relevant SEC rule, such as provisions requiring escrow of advisory fees. Under the Interim Advisory Agreements, the Adviser would continue to manage a Fund pursuant to an Interim Advisory Agreement until a new advisory agreement was approved by stockholders or until the end of the 150-day period, whichever would occur earlier. All fees earned by the Adviser under an Interim Advisory Agreement would be held in escrow pending shareholder approval of the Proposed Agreement. Upon approval of a new advisory agreement by stockholders, the escrowed management fees would be paid to the Adviser, and the Interim Advisory Agreement would terminate.
| | |
| |
| 58 | AB FLEXFEE EMERGING MARKETS GROWTH PORTFOLIO | | abfunds.com |
This page is not part of the Shareholder Report or the Financial Statements.
AB FAMILY OF FUNDS
US EQUITY
US CORE
Core Opportunities Fund
FlexFee™ US Thematic Portfolio
Select US Equity Portfolio
US GROWTH
Concentrated Growth Fund
Discovery Growth Fund
FlexFee™ Large Cap Growth Portfolio
Growth Fund
Large Cap Growth Fund
Small Cap Growth Portfolio
US VALUE
Discovery Value Fund
Equity Income Fund
Relative Value Fund
Small Cap Value Portfolio
Value Fund
INTERNATIONAL/ GLOBAL EQUITY
INTERNATIONAL/ GLOBAL CORE
FlexFee™ International Strategic Core Portfolio
Global Core Equity Portfolio
International Portfolio
International Strategic Core Portfolio
Sustainable Global Thematic Fund
Tax-Managed International Portfolio
Tax-Managed Wealth Appreciation Strategy
Wealth Appreciation Strategy
INTERNATIONAL/ GLOBAL GROWTH
Concentrated International Growth Portfolio
FlexFee™ Emerging Markets Growth Portfolio
INTERNATIONAL/ GLOBAL EQUITY(continued)
Sustainable International Thematic Fund
INTERNATIONAL/ GLOBAL VALUE
All China Equity Portfolio
International Value Fund
FIXED INCOME
MUNICIPAL
High Income Municipal Portfolio
Intermediate California Municipal Portfolio
Intermediate Diversified Municipal Portfolio
Intermediate New York Municipal Portfolio
Municipal Bond Inflation Strategy
Tax-Aware Fixed Income Portfolio
National Portfolio
Arizona Portfolio
California Portfolio
Massachusetts Portfolio
Minnesota Portfolio
New Jersey Portfolio
New York Portfolio
Ohio Portfolio
Pennsylvania Portfolio
Virginia Portfolio
TAXABLE
Bond Inflation Strategy
FlexFee™ High Yield Portfolio1
FlexFee™ International Bond Portfolio
Global Bond Fund
High Income Fund
Income Fund
Intermediate Bond Portfolio
Limited Duration High Income Portfolio
Short Duration Portfolio
ALTERNATIVES
All Market Real Return Portfolio
Global Real Estate Investment Fund
Select US Long/Short Portfolio
Unconstrained Bond Fund
MULTI-ASSET
All Market Income Portfolio
All Market Total Return Portfolio
Conservative Wealth Strategy
Emerging Markets Multi-Asset Portfolio
Global Risk Allocation Fund
Tax-Managed All Market Income Portfolio
TARGET-DATE
Multi-Manager Select Retirement Allocation Fund
Multi-Manager Select 2010 Fund
Multi-Manager Select 2015 Fund
Multi-Manager Select 2020 Fund
Multi-Manager Select 2025 Fund
Multi-Manager Select 2030 Fund
Multi-Manager Select 2035 Fund
Multi-Manager Select 2040 Fund
Multi-Manager Select 2045 Fund
Multi-Manager Select 2050 Fund
Multi-Manager Select 2055 Fund
Multi-Manager Select 2060 Fund
CLOSED-END FUNDS
Alliance California Municipal Income Fund
AllianceBernstein Global High Income Fund
AllianceBernstein National Municipal Income Fund
We also offer Government Money Market Portfolio, which serves as the money market fund exchange vehicle for the AB mutual funds. You could lose money by investing in the Fund. Although the Fund seeks to preserve the value of your investment at $1.00 per share, it cannot guarantee it will do so. The Fund may impose a fee upon sale of your shares or may temporarily suspend your ability to sell shares if the Fund’s liquidity falls below required minimums because of market conditions or other factors. An investment in the Fund is not insured or guaranteed by the Federal Deposit Insurance Corporation or any other government agency. The Fund’s sponsor has no legal obligation to provide financial support to the Fund, and you should not expect that the sponsor will provide financial support to the Fund at any time.
Investors should consider the investment objectives, risks, charges and expenses of the Fund carefully before investing. For copies of our prospectus or summary prospectus, which contain this and other information, visit us online at www.abfunds.com or contact your AB representative. Please read the prospectus and/or summary prospectus carefully before investing.
| 1 | Prior to February 23, 2018, FlexFee High Yield Portfolio was named High Yield Portfolio. |
| | |
| |
| abfunds.com | | AB FLEXFEE EMERGING MARKETS GROWTH PORTFOLIO | 59 |
NOTES
| | |
| |
| 60 | AB FLEXFEE EMERGING MARKETS GROWTH PORTFOLIO | | abfunds.com |
AB FLEXFEE EMERGING MARKETS GROWTH PORTFOLIO
1345 Avenue of the Americas
New York, NY 10105
800 221 5672
FFEMG-0151-1218 
DEC 12.31.18

ANNUAL REPORT
AB FLEXFEETM INTERNATIONAL STRATEGIC CORE PORTFOLIO

Beginning January 1, 2021, as permitted by new regulations adopted by the Securities and Exchange Commission, the Fund’s annual and semi-annual shareholder reports will no longer be sent by mail, unless you specifically request paper copies of the reports. Instead, the reports will be made available on a website, and you will be notified by mail each time a report is posted and provided with a website address to access the report.
If you already elected to receive shareholder reports electronically, you will not be affected by this change and you need not take any action. You may elect to receive shareholder reports and other communications from the Fund electronically at any time by contacting your financial intermediary (such as a broker-dealer or bank) or, if you are a direct investor, by calling the Fund at (800) 221 5672.
You may elect to receive all future reports in paper form free of charge. If you invest through a financial intermediary, you can contact your financial intermediary to request that you continue to receive paper copies of your shareholder reports; if you invest directly with the Fund, you can call the Fund at (800) 221 5672. Your election to receive reports in paper form will apply to all funds held in your account with your financial intermediary or, if you invest directly, to all AB Mutual Funds you hold.
| | |
| |
| Investment Products Offered | | • Are Not FDIC Insured• May Lose Value• Are Not Bank Guaranteed |
Investors should consider the investment objectives, risks, charges and expenses of the Fund carefully before investing. For copies of our prospectus or summary prospectus, which contain this and other information, visit us online at www.abfunds.com or contact your AB representative. Please read the prospectus and/or summary prospectus carefully before investing.
This shareholder report must be preceded or accompanied by the Fund’s prospectus for individuals who are not current shareholders of the Fund.
You may obtain a description of the Fund’s proxy voting policies and procedures, and information regarding how the Fund voted proxies relating to portfolio securities during the most recent12-month period ended June 30, without charge. Simply visit AB’s website at www.abfunds.com, or go to the Securities and Exchange Commission’s (the “Commission”) website at www.sec.gov, or call AB at (800) 227 4618.
The Fund files its complete schedule of portfolio holdings with the Commission for the first and third quarters of each fiscal year. The Fund’s portfolio holdings reports are available on the Commission’s website at www.sec.gov. The Fund’s portfolio holdings reports may also be reviewed and copied at the Commission’s Public Reference Room in Washington, DC; information on the operation of the Public Reference Room may be obtained by calling (800) SEC 0330. AB publishes full portfolio holdings for the Fund monthly at www.abfunds.com.
AllianceBernstein Investments, Inc. (ABI) is the distributor of the AB family of mutual funds. ABI is a member of FINRA and is an affiliate of AllianceBernstein L.P., the Adviser of the funds.
The [A/B] logo is a registered service mark of AllianceBernstein and AllianceBernstein® is a registered service mark used by permission of the owner, AllianceBernstein L.P.
| | |
| FROM THE PRESIDENT | |  |
Dear Shareholder,
We are pleased to provide this report for AB FlexFee International Strategic Core Portfolio (the “Fund”). Please review the discussion of Fund performance, the market conditions during the reporting period and the Fund’s investment strategy.
As always, AB strives to keep clients ahead of what’s next by:
| + | | Transforming uncommon insights into uncommon knowledge with a global research scope |
| + | | Navigating markets with seasoned investment experience and sophisticated solutions |
| + | | Providing thoughtful investment insights and actionable ideas |
Whether you’re an individual investor or a multi-billion-dollar institution, we put knowledge and experience to work for you.
AB’s global research organization connects and collaborates across platforms and teams to deliver impactful insights and innovative products. Better insights lead to better opportunities—anywhere in the world.
For additional information about AB’s range of products and shareholder resources, please log on to www.abfunds.com.
Thank you for your investment in the AB Mutual Funds.
Sincerely,

Robert M. Keith
President and Chief Executive Officer, AB Mutual Funds
| | |
| |
| abfunds.com | | AB FLEXFEE INTERNATIONAL STRATEGIC CORE PORTFOLIO | 1 |
ANNUAL REPORT
February 11, 2019
This report provides management’s discussion of fund performance for AB FlexFee International Strategic Core Portfolio for the annual reporting period ended December 31, 2018.
The Fund’s investment objective is to seek long-term growth of capital.
NAV RETURNS AS OF DECEMBER 31, 2018(unaudited)
| | | | | | | | |
| | |
| | | 6 Months | | | 12 Months | |
| | |
| AB FLEXFEE INTERNATIONAL STRATEGIC CORE PORTFOLIO | | | | | | | | |
| | |
| Advisor Class Shares | | | -10.58% | | | | -9.08% | |
| | |
| MSCI EAFE Index (net) | | | -11.35% | | | | -13.79% | |
INVESTMENT RESULTS
The table above shows the Fund’s performance compared to its benchmark, the Morgan Stanley Capital International Europe, Australasia and the Far East (“MSCI EAFE”) Index (net), for thesix- and12-month periods ended December 31, 2018.
The Fund outperformed the benchmark for both periods. The Fund’s performance-based advisory fee for the performance period from June 28, 2017 through December 31, 2018 was accrued at its maximum rate. For both periods, security selection within the financials sector contributed, relative to the benchmark. Country allocation (a result ofbottom-up security analysis combined with fundamental research) contributed because of an underweight to Germany, while an underweight to Switzerland detracted. Sector allocation detracted, particularly an underweight in utilities.
During the12-month period, security selection in the consumer-discretionary sector contributed. Country-wise, an overweight to Israel contributed, while an underweight to France detracted. An underweight in health care also detracted.
For the six-month period, stock selection in industrials contributed. Country-wise, an underweight to Japan contributed, while an overweight to Canada detracted. An overweight in technology detracted as well.
The Fund utilized derivatives in the form of currency forwards for hedging purposes, which added to absolute returns during both periods.
| | |
| |
| 2 | AB FLEXFEE INTERNATIONAL STRATEGIC CORE PORTFOLIO | | abfunds.com |
MARKET REVIEW AND INVESTMENT STRATEGY
Global equities ended 2018 in negative territory, marking one of the worst years for the stock market in a decade. Despite a relatively strong start to the year and US stock indices reaching record highs, volatility spiked toward the end of the 12-month period ended December 31, 2018. Investors worried about the outlook for corporate earnings growth amid a more challenging global growth environment and as the benefits of tax reform roll off. The US Federal Reserve raised rates four times during the period, as expected, but softened its tone in December and signaled that it might slow its pace of rate hikes in 2019. An upsurge in geopolitical uncertainty regarding Brexit and budget discussions between Italy and its European Union partners sparked a flight to quality in the region. Slowing Chinese growth and continuingUS-China trade tensions dampened investor sentiment in China toward the end of the period. In the US, growth stocks outperformed value stocks, in terms of style, andlarge-cap stocks outperformed theirsmall-cap peers.
The Fund’s Senior Investment Management Team (the “Team”) continues to be aware of the valuations of the most stable companies in the investable universe. The Fund is positioned in such a way as to avoid the most expensive companies based on price to free cash flow, while at the same time aiming to provide downside protection in case of asell-off. The Team is careful to avoid companies suffering from technological disruptions and changes in consumer preference. The Team continues to uncover what it believes are attractive opportunities with below-market volatility, and looks for a diverse set of opportunities in companies with strong capital stewardship and business models with solid recurring revenues even in cyclical industries, and in companies benefiting from favorable regulations.
INVESTMENT POLICIES
The Adviser seeks to achieve the Fund’s investment objective by investing, under normal circumstances, primarily in common stocks ofnon-US companies, and in companies in at least three countries other than the United States.
The Fund will invest in companies that are determined by the Adviser to offer favorable long-term sustainable profitability, price stability and attractive valuations. The Adviser will employ an integrated approach that combines both fundamental and quantitative research to identify attractive investment opportunities. Factors that the Adviser will consider in this regard will include: a company’s record and projections of profitability, accuracy and availability of information with respect to the company, success and experience of management,
(continued on next page)
| | |
| |
| abfunds.com | | AB FLEXFEE INTERNATIONAL STRATEGIC CORE PORTFOLIO | 3 |
competitive advantage, low stock price volatility and liquidity of the company’s securities. The Adviser will compare these results to the characteristics of the general stock markets to determine the relative attractiveness of each company at a given time. The Adviser will weigh economic, political and market factors in making investment decisions. The Adviser will seek to manage the Fund so that it is subject to less share price volatility than many other international mutual funds, although there can be no guarantee that the Adviser will be successful in this regard.
The Fund will primarily invest inmid- and large-capitalization companies, which are currently defined for the Fund as companies that have market capitalizations of $1.5 billion or more. The Fund’s holdings ofnon-US companies will generally include some companies located in emerging markets.
Fluctuations in currency exchange rates can have a dramatic impact on the returns of equity securities. The Adviser may adjust the foreign currency exposure resulting from the Fund’s security positions through the use of currency-related derivatives, primarily in an effort to minimize the currency risk to which the Fund is subject. However, the Adviser is not required to use such derivatives.
| | |
| |
| 4 | AB FLEXFEE INTERNATIONAL STRATEGIC CORE PORTFOLIO | | abfunds.com |
DISCLOSURES AND RISKS
Benchmark Disclosure
The MSCI EAFE Index is unmanaged and does not reflect fees and expenses associated with the active management of a mutual fund portfolio. The MSCI EAFE Index (net, free float-adjusted, market capitalization weighted) represents the equity market performance of developed markets, excluding the US and Canada. MSCI makes no express or implied warranties or representations, and shall have no liability whatsoever with respect to any MSCI data contained herein. The MSCI data may not be further redistributed or used as a basis for other indices, any securities or financial products. This report is not approved, reviewed or produced by MSCI. Net returns include the reinvestment of dividends after deduction ofnon-US withholding tax. An investor cannot invest directly in an index, and its results are not indicative of the performance for any specific investment, including the Fund.
A Word About Risk
Market Risk: The value of the Fund’s assets will fluctuate as the stock or bond markets fluctuate. The value of the Fund’s investments may decline, sometimes rapidly and unpredictably, simply because of economic changes or other events that affect large portions of the market.
Foreign(Non-US) Risk:Investments in securities ofnon-US issuers may involve more risk than those of US issuers. These securities may fluctuate more widely in price and may be less liquid due to adverse market, economic, political, regulatory or other factors. These risks may be heightened with respect to investments in emerging-market countries, where there may be an increased amount of economic, political and social instability.
Currency Risk:Fluctuations in currency exchange rates may negatively affect the value of the Fund’s investments or reduce its returns.
Capitalization Risk:Investments inmid-capitalization companies may be more volatile than investments in large-capitalization companies. Investments inmid-capitalization companies may have additional risks because these companies have limited product lines, markets or financial resources.
Derivatives Risk:Derivatives may be illiquid, difficult to price, and leveraged so that small changes may produce disproportionate losses for the Fund, and may be subject to counterparty risk to a greater degree than more traditional investments.
Management Risk:The Fund is subject to management risk because it is an actively managed investment fund. The Adviser will apply its investment techniques and risk analyses in making investment decisions for the Fund, but there is no guarantee that its techniques will produce the intended results.
| | |
| |
| abfunds.com | | AB FLEXFEE INTERNATIONAL STRATEGIC CORE PORTFOLIO | 5 |
DISCLOSURES AND RISKS(continued)
These risks are fully discussed in the Fund’s prospectus. As with all investments, you may lose money by investing in the Fund.
An Important Note About Historical Performance
The investment return and principal value of an investment in the Fund will fluctuate, so that shares, when redeemed, may be worth more or less than their original cost. Performance shown in this report represents past performance and does not guarantee future results. Current performance may be lower or higher than the performance information shown. You may obtain performance information current to the most recentmonth-end by visiting www.abfunds.com. The Fund has been in operation only for a short period of time, and therefore has a very limited historical performance period. This limited performance period is unlikely to be representative of the performance the Fund will achieve over a longer period.
All fees and expenses related to the operation of the Fund have been deducted. Net asset value (“NAV”) returns do not reflect sales charges; if sales charges were reflected, the Fund’s quoted performance would be lower. SEC returns reflect the applicable sales charges for each share class. Returns for the different share classes will vary due to different expenses associated with each class. Performance assumes reinvestment of distributions and does not account for taxes.
| | |
| |
| 6 | AB FLEXFEE INTERNATIONAL STRATEGIC CORE PORTFOLIO | | abfunds.com |
HISTORICAL PERFORMANCE
GROWTH OF A $10,000 INVESTMENT IN THE FUND(unaudited)
6/28/20171 TO 12/31/2018
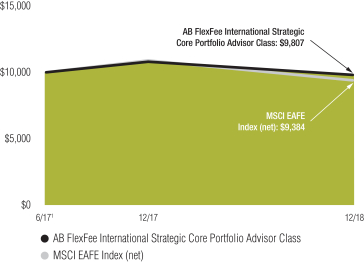
This chart illustrates the total value of an assumed $10,000 investment in AB FlexFee International Strategic Core Portfolio Advisor Class shares (from 6/28/20171 to 12/31/2018) as compared to the performance of the Fund’s benchmark.
| 1 | Inception date: 6/28/2017. |
| | |
| |
| abfunds.com | | AB FLEXFEE INTERNATIONAL STRATEGIC CORE PORTFOLIO | 7 |
HISTORICAL PERFORMANCE(continued)
AVERAGE ANNUAL RETURNS AS OF DECEMBER 31, 2018(unaudited)
| | | | | | | | |
| | |
| | | NAV Returns | | | SEC Returns
(reflects applicable sales charges) | |
| | |
| ADVISOR CLASS SHARES1 | | | | | | | | |
| | |
| 1 Year | | | -9.08% | | | | -9.08% | |
| | |
| Since Inception2 | | | -1.28% | | | | -1.28% | |
SEC AVERAGE ANNUAL RETURNS
AS OF THE MOST RECENT CALENDARQUARTER-END
DECEMBER 31, 2018(unaudited)
| | | | |
| |
| | | SEC Returns
(reflects applicable sales charges) | |
| |
| ADVISOR CLASS SHARES | | | | |
| |
| 1 Year | | | -9.08% | |
| |
| Since Inception2 | | | -1.28% | |
The Fund’s current prospectus fee table shows the Fund’s total annual operating expense ratio as 13.02% for Advisor Class shares, gross of any fee waivers or expense reimbursements. Contractual fee waivers and/or expense reimbursements limit the Fund’s annual operating expense ratio exclusive of the Fund’s advisory fees, acquired fund fees and expenses other than the advisory fees of any AB mutual funds in which the Fund may invest, interest expense, taxes, extraordinary expenses, and brokerage commissions and other transaction costs to 0.10% for Advisor Class shares. These waivers/reimbursements may not be terminated before June 11, 2019. Any fees waived and expenses borne by the Adviser through December 31, 2018 may be reimbursed by the Fund until the end of the third fiscal year after the fiscal period in which the fee was waived or the expense was borne, provided that no reimbursement payment will be made that would cause the Fund’s total annual operating expenses to exceed these expense limitations. Absent reimbursements or waivers, performance would have been lower. The Financial Highlights section of this report sets forth expense ratio data for the current reporting period; the expense ratio shown above may differ from the expense ratio in the Financial Highlights section since they are based on different time periods.
| 1 | This share class is offered at NAV to eligible investors and the SEC returns are the same as the NAV returns. |
| 2 | Inception date: 6/28/2017. |
| | |
| |
| 8 | AB FLEXFEE INTERNATIONAL STRATEGIC CORE PORTFOLIO | | abfunds.com |
EXPENSE EXAMPLE
(unaudited)
As a shareholder of the Fund, you incur two types of costs: (1) transaction costs, including sales charges (loads) on purchase payments, contingent deferred sales charges on redemptions and (2) ongoing costs, including advisory fees; distribution (12b-1) fees; and other Fund expenses. This example is intended to help you understand your ongoing costs (in dollars) of investing in the Fund and to compare these costs with the ongoing costs of investing in other mutual funds.
The Example is based on an investment of $1,000 invested at the beginning of the period and held for the entire period as indicated below.
Actual Expenses
The table below provides information about actual account values and actual expenses. You may use the information, together with the amount you invested, to estimate the expenses that you paid over the period. Simply divide your account value by $1,000 (for example, an $8,600 account value divided by $1,000 = 8.6), then multiply the result by the number under the heading entitled “Expenses Paid During Period” to estimate the expenses you paid on your account during this period.
Hypothetical Example for Comparison Purposes
The table below also provides information about hypothetical account values and hypothetical expenses based on the Fund’s actual expense ratio and an assumed annual rate of return of 5% before expenses, which is not the Fund’s actual return. The hypothetical account values and expenses may not be used to estimate the actual ending account balance or expenses you paid for the period. You may use this information to compare the ongoing costs of investing in the Fund and other funds by comparing this 5% hypothetical example with the 5% hypothetical examples that appear in the shareholder reports of other funds.
Please note that the expenses shown in the table are meant to highlight your ongoing costs only and do not reflect any transactional costs, such as sales charges (loads), or contingent deferred sales charges on redemptions. Therefore, the hypothetical example is useful in comparing ongoing costs only, and will not help you determine the relative total costs of owning different funds. In addition, if these transactional costs were included, your costs would have been higher.
| | |
| |
| abfunds.com | | AB FLEXFEE INTERNATIONAL STRATEGIC CORE PORTFOLIO | 9 |
EXPENSE EXAMPLE(continued)
| | | | | | | | | | | | | | | | | | | | | | | | |
| | | Beginning
Account
Value
7/1/2018 | | | Ending
Account
Value
12/31/2018 | | | Expenses
Paid
During
Period* | | | Annualized
Expense
Ratio* | | | Total
Expenses
Paid
During
Period+ | | | Total
Annualized
Expense
Ratio+ | |
| Advisor Class | | | | | | | | | | | | | | | | | | | | | | | | |
Actual | | $ | 1,000 | | | $ | 894.20 | | | $ | 3.87 | | | | 0.81 | % | | $ | 3.96 | | | | 0.83 | % |
Hypothetical** | | $ | 1,000 | | | $ | 1,021.12 | | | $ | 4.13 | | | | 0.81 | % | | $ | 4.23 | | | | 0.83 | % |
| * | Expenses are equal to the classes’ annualized expense ratios multiplied by the average account value over the period, multiplied by 184/365 (to reflect the one-half year period). |
| + | In connection with the Fund’s investments in affiliated/unaffiliated underlying portfolios, the Fund incurs no direct expenses, but bears proportionate shares of the fees and expenses (i.e., operating, administrative and investment advisory fees) of the affiliated/unaffiliated underlying portfolios. The Adviser has contractually agreed to waive its fees from the Fund in an amount equal to the Fund’s pro rata share of certain acquired fund fees and expenses of the affiliated underlying portfolios. The Fund’s total expenses are equal to the classes’ annualized expense ratio plus the Fund’s pro rata share of the weighted average expense ratio of the affiliated/unaffiliated underlying portfolios in which it invests, multiplied by the average account value over the period, multiplied by 184/365 (to reflect the one-half year period). |
| ** | Assumes 5% annual return before expenses. |
| | |
| |
| 10 | AB FLEXFEE INTERNATIONAL STRATEGIC CORE PORTFOLIO | | abfunds.com |
PORTFOLIO SUMMARY
December 31, 2018(unaudited)
PORTFOLIO STATISTICS
Net Assets ($mil): $2.9
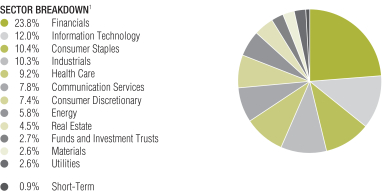
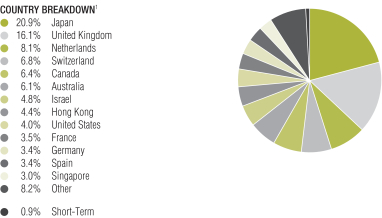
| 1 | All data are as of December 31, 2018. The Fund’s sector and country breakdowns are expressed as a percentage of total investments and may vary over time. The Fund also enters into derivative transactions, which may be used for hedging or investment purposes (see “Portfolio of Investments” section of the report for additional details). “Other” country weightings represent 2.8% or less in the following countries: Denmark, Finland, Norway, Portugal and South Korea. |
Please note: The sector classifications presented herein are based on the Global Industry Classification Standard (GICS) which was developed by Morgan Stanley Capital International and Standard & Poor’s. The components are divided into sector, industry group, and industrysub-indices as classified by the GICS for each of the market capitalization indices in the broad market. These sector classifications are broadly defined. The “Portfolio of Investments” section of the report reflects more specific industry information and is consistent with the investment restrictions discussed in the Fund’s prospectus.
| | |
| |
| abfunds.com | | AB FLEXFEE INTERNATIONAL STRATEGIC CORE PORTFOLIO | 11 |
PORTFOLIO SUMMARY(continued)
December 31, 2018(unaudited)
TEN LARGEST HOLDINGS1
| | | | | | | | |
| | |
| Company | | U.S. $ Value | | | Percent of
Net Assets | |
| | |
| Roche Holding AG | | $ | 91,359 | | | | 3.1 | % |
| | |
| iShares MSCI EAFE ETF | | | 80,529 | | | | 2.8 | |
| | |
| Nice Ltd. | | | 72,589 | | | | 2.5 | |
| | |
| HKT Trust & HKT Ltd. – Class SS | | | 72,027 | | | | 2.5 | |
| | |
| RELX PLC | | | 71,759 | | | | 2.5 | |
| | |
| Royal Dutch Shell PLC – Class B | | | 64,878 | | | | 2.2 | |
| | |
| Nippon Telegraph & Telephone Corp. | | | 61,199 | | | | 2.1 | |
| | |
| Oracle Corp. Japan | | | 57,130 | | | | 2.0 | |
| | |
| Royal Bank of Canada | | | 54,208 | | | | 1.8 | |
| | |
| Novo Nordisk A/S – Class B | | | 53,735 | | | | 1.8 | |
| | |
| | $ | 679,413 | | | | 23.3 | % |
| | |
| |
| 12 | AB FLEXFEE INTERNATIONAL STRATEGIC CORE PORTFOLIO | | abfunds.com |
PORTFOLIO OF INVESTMENTS
December 31, 2018
| | | | | | | | |
| Company | | Shares | | | U.S. $ Value | |
| |
COMMON STOCKS – 96.9% | | | | | | | | |
Financials – 23.9% | | | | | | | | |
Banks – 13.5% | | | | | | | | |
Bank LeumiLe-Israel BM | | | 3,990 | | | $ | 24,120 | |
BOC Hong Kong Holdings Ltd. | | | 6,500 | | | | 24,126 | |
DBS Group Holdings Ltd. | | | 2,400 | | | | 41,736 | |
DNB ASA | | | 1,770 | | | | 28,411 | |
Hang Seng Bank Ltd. | | | 1,500 | | | | 33,602 | |
Mitsubishi UFJ Financial Group, Inc. | | | 5,800 | | | | 28,464 | |
Oversea-Chinese Banking Corp., Ltd. | | | 2,141 | | | | 17,709 | |
Royal Bank of Canada | | | 792 | | | | 54,208 | |
Seven Bank Ltd. | | | 12,800 | | | | 36,539 | |
Sumitomo Mitsui Financial Group, Inc. | | | 700 | | | | 23,076 | |
Toronto-Dominion Bank (The) | | | 960 | | | | 47,719 | |
Westpac Banking Corp. | | | 1,860 | | | | 32,866 | |
| | | | | | | | |
| | | | | | | 392,576 | |
| | | | | | | | |
Capital Markets – 3.0% | |
Euronext NV(a) | | | 430 | | | | 24,776 | |
Partners Group Holding AG | | | 57 | | | | 34,676 | |
Singapore Exchange Ltd. | | | 5,300 | | | | 27,776 | |
| | | | | | | | |
| | | | | | | 87,228 | |
| | | | | | | | |
Diversified Financial Services – 1.0% | |
ORIX Corp. | | | 2,100 | | | | 30,685 | |
| | | | | | | | |
|
Insurance – 6.4% | |
Admiral Group PLC | | | 1,340 | | | | 34,965 | |
Allianz SE (REG) | | | 99 | | | | 19,895 | |
Direct Line Insurance Group PLC | | | 5,420 | | | | 22,032 | |
NN Group NV | | | 1,350 | | | | 53,674 | |
Sampo Oyj – Class A | | | 550 | | | | 24,376 | |
Swiss Re AG | | | 359 | | | | 33,028 | |
| | | | | | | | |
| | | | | | | 187,970 | |
| | | | | | | | |
| | | | | | | 698,459 | |
| | | | | | | | |
Information Technology – 12.0% | |
IT Services – 3.5% | |
Amadeus IT Group SA – Class A | | | 703 | | | | 48,913 | |
Capgemini SE | | | 377 | | | | 37,498 | |
Otsuka Corp. | | | 600 | | | | 16,513 | |
| | | | | | | | |
| | | | | | | 102,924 | |
| | | | | | | | |
Software – 7.8% | |
Check Point Software Technologies Ltd.(b) | | | 417 | | | | 42,805 | |
Constellation Software, Inc./Canada | | | 65 | | | | 41,606 | |
Nice Ltd.(b) | | | 670 | | | | 72,589 | |
Oracle Corp. Japan | | | 900 | | | | 57,130 | |
SAP SE | | | 150 | | | | 14,888 | |
| | | | | | | | |
| | | | | | | 229,018 | |
| | | | | | | | |
| | |
| |
| abfunds.com | | AB FLEXFEE INTERNATIONAL STRATEGIC CORE PORTFOLIO | 13 |
PORTFOLIO OF INVESTMENTS(continued)
| | | | | | | | |
| Company | | Shares | | | U.S. $ Value | |
| |
Technology Hardware, Storage & Peripherals – 0.7% | |
Samsung Electronics Co., Ltd. | | | 180 | | | $ | 6,266 | |
Samsung Electronics Co., Ltd. (GDR)(a) | | | 15 | | | | 12,998 | |
| | | | | | | | |
| | | | | | | 19,264 | |
| | | | | | | | |
| | | | | | | 351,206 | |
| | | | | | | | |
Consumer Staples – 10.4% | |
Beverages – 0.6% | |
Diageo PLC | | | 505 | | | | 18,046 | |
| | | | | | | | |
|
Food & Staples Retailing – 2.0% | |
Koninklijke Ahold Delhaize NV | | | 1,740 | | | | 43,956 | |
Seven & i Holdings Co., Ltd. | | | 300 | | | | 13,037 | |
| | | | | | | | |
| | | | | | | 56,993 | |
| | | | | | | | |
Food Products – 2.6% | |
Nestle SA (REG) | | | 510 | | | | 41,393 | |
Salmar ASA | | | 700 | | | | 34,719 | |
| | | | | | | | |
| | | | | | | 76,112 | |
| | | | | | | | |
Personal Products – 1.6% | |
Unilever PLC | | | 905 | | | | 47,515 | |
| | | | | | | | |
|
Tobacco – 3.6% | |
British American Tobacco PLC | | | 1,273 | | | | 40,506 | |
Imperial Brands PLC | | | 900 | | | | 27,316 | |
Philip Morris International, Inc. | | | 570 | | | | 38,053 | |
| | | | | | | | |
| | | | | | | 105,875 | |
| | | | | | | | |
| | | | | | | 304,541 | |
| | | | | | | | |
Industrials – 10.3% | | | | | | | | |
Aerospace & Defense – 0.9% | | | | | | | | |
BAE Systems PLC | | | 4,430 | | | | 25,910 | |
| | | | | | | | |
|
Airlines – 1.4% | |
Qantas Airways Ltd. | | | 10,140 | | | | 41,366 | |
| | | | | | | | |
|
Construction & Engineering – 1.3% | |
Taisei Corp. | | | 900 | | | | 38,546 | |
| | | | | | | | |
|
Professional Services – 6.1% | |
Experian PLC | | | 1,290 | | | | 31,272 | |
Intertek Group PLC | | | 407 | | | | 24,910 | |
RELX PLC | | | 3,480 | | | | 71,759 | |
Wolters Kluwer NV | | | 850 | | | | 49,986 | |
| | | | | | | | |
| | | | | | | 177,927 | |
| | | | | | | | |
Road & Rail – 0.6% | |
East Japan Railway Co. | | | 200 | | | | 17,662 | |
| | | | | | | | |
| | | | | | | 301,411 | |
| | | | | | | | |
| | |
| |
| 14 | AB FLEXFEE INTERNATIONAL STRATEGIC CORE PORTFOLIO | | abfunds.com |
PORTFOLIO OF INVESTMENTS(continued)
| | | | | | | | |
| Company | | Shares | | | U.S. $ Value | |
| |
Health Care – 9.3% | |
Pharmaceuticals – 9.3% | |
Astellas Pharma, Inc. | | | 3,100 | | | $ | 39,608 | |
GlaxoSmithKline PLC | | | 1,210 | | | | 23,060 | |
H Lundbeck A/S | | | 580 | | | | 25,527 | |
Novo Nordisk A/S – Class B | | | 1,170 | | | | 53,735 | |
Roche Holding AG | | | 368 | | | | 91,359 | |
Sanofi | | | 425 | | | | 36,869 | |
| | | | | | | | |
| | | | | | | 270,158 | |
| | | | | | | | |
Communication Services – 7.9% | |
Diversified Telecommunication Services – 5.3% | |
HKT Trust & HKT Ltd. – Class SS | | | 50,000 | | | | 72,027 | |
Nippon Telegraph & Telephone Corp. | | | 1,500 | | | | 61,199 | |
TELUS Corp. | | | 600 | | | | 19,887 | |
| | | | | | | | |
| | | | | | | 153,113 | |
| | | | | | | | |
Entertainment – 1.1% | |
CTS Eventim AG & Co. KGaA | | | 226 | | | | 8,440 | |
Daiichikosho Co., Ltd. | | | 500 | | | | 23,766 | |
| | | | | | | | |
| | | | | | | 32,206 | |
| | | | | | | | |
Interactive Media & Services – 0.7% | |
Kakaku.com, Inc. | | | 1,200 | | | | 21,226 | |
| | | | | | | | |
|
Media – 0.8% | |
Quebecor, Inc. – Class B | | | 1,079 | | | | 22,715 | |
| | | | | | | | |
| | | | | | | 229,260 | |
| | | | | | | | |
Consumer Discretionary – 7.4% | |
Hotels, Restaurants & Leisure – 2.4% | |
Aristocrat Leisure Ltd. | | | 2,500 | | | | 38,485 | |
Compass Group PLC | | | 1,470 | | | | 30,936 | |
| | | | | | | | |
| | | | | | | 69,421 | |
| | | | | | | | |
Household Durables – 2.4% | |
Auto Trader Group PLC(a) | | | 5,870 | | | | 34,066 | |
Nikon Corp. | | | 2,400 | | | | 35,748 | |
| | | | | | | | |
| | | | | | | 69,814 | |
| | | | | | | | |
Internet & Direct Marketing Retail – 0.5% | |
Moneysupermarket.com Group PLC | | | 4,100 | | | | 14,395 | |
| | | | | | | | |
|
Leisure Products – 1.5% | |
Bandai Namco Holdings, Inc. | | | 1,000 | | | | 44,899 | |
| | | | | | | | |
|
Multiline Retail – 0.6% | |
Wesfarmers Ltd. | | | 770 | | | | 17,493 | |
| | | | | | | | |
| | | | | | | 216,022 | |
| | | | | | | | |
Energy – 5.8% | |
Oil, Gas & Consumable Fuels – 5.8% | |
Caltex Australia Ltd. | | | 930 | | | | 16,685 | |
Equinor ASA | | | 910 | | | | 19,303 | |
| | |
| |
| abfunds.com | | AB FLEXFEE INTERNATIONAL STRATEGIC CORE PORTFOLIO | 15 |
PORTFOLIO OF INVESTMENTS(continued)
| | | | | | | | |
| Company | | Shares | | | U.S. $ Value | |
| |
Repsol SA | | | 890 | | | $ | 14,309 | |
Royal Dutch Shell PLC – Class B | | | 2,170 | | | | 64,878 | |
Showa Shell Sekiyu KK | | | 1,900 | | | | 26,323 | |
TOTAL SA | | | 525 | | | | 27,691 | |
| | | | | | | | |
| | | | | | | 169,189 | |
| | | | | | | | |
Real Estate – 4.6% | |
Equity Real Estate Investment Trusts (REITs) – 3.3% | |
Merlin Properties Socimi SA | | | 2,920 | | | | 36,072 | |
Nippon Building Fund, Inc. | | | 6 | | | | 37,781 | |
Nippon Prologis REIT, Inc. | | | 10 | | | | 21,105 | |
| | | | | | | | |
| | | | | | | 94,958 | |
| | | | | | | | |
Real Estate Management & Development – 1.3% | |
Vonovia SE | | | 840 | | | | 37,866 | |
| | | | | | | | |
| | | | | | | 132,824 | |
| | | | | | | | |
Materials – 2.7% | |
Chemicals – 1.6% | |
Covestro AG(a) | | | 395 | | | | 19,562 | |
Victrex PLC | | | 860 | | | | 25,096 | |
| | | | | | | | |
| | | | | | | 44,658 | |
| | | | | | | | |
Metals & Mining – 1.1% | |
Northern Star Resources Ltd. | | | 5,030 | | | | 32,834 | |
| | | | | | | | |
| | | | | | | 77,492 | |
| | | | | | | | |
Utilities – 2.6% | |
Electric Utilities – 1.8% | |
EDP – Energias de Portugal SA | | | 10,060 | | | | 35,193 | |
Kansai Electric Power Co., Inc. (The) | | | 1,200 | | | | 17,996 | |
| | | | | | | | |
| | | | | | | 53,189 | |
| | | | | | | | |
Gas Utilities – 0.8% | |
Tokyo Gas Co., Ltd. | | | 900 | | | | 22,762 | |
| | | | | | | | |
| | | | | | | 75,951 | |
| | | | | | | | |
Total Common Stocks
(cost $2,961,043) | | | | | | | 2,826,513 | |
| | | | | | | | |
| | | | | | | | |
INVESTMENT COMPANIES – 2.8% | |
Funds and Investment Trusts – 2.8% | |
iShares MSCI EAFE ETF(c)
(cost $86,255) | | | 1,370 | | | | 80,529 | |
| | | | | | | | |
| | | | | | | | |
RIGHTS – 0.0% | |
Energy – 0.0% | |
Oil, Gas & Consumable Fuels – 0.0% | |
Repsol SA, expiring 1/09/19(b)
(cost $409) | | | 890 | | | | 408 | |
| | | | | | | | |
| | |
| |
| 16 | AB FLEXFEE INTERNATIONAL STRATEGIC CORE PORTFOLIO | | abfunds.com |
PORTFOLIO OF INVESTMENTS(continued)
| | | | | | | | |
| Company | | Shares | | | U.S. $ Value | |
| |
SHORT-TERM INVESTMENTS – 0.9% | |
Investment Companies – 0.9% | |
AB Fixed Income Shares, Inc. – Government Money Market Portfolio – Class AB, 2.31%(c)(d)(e)
(cost $26,411) | | | 26,411 | | | $ | 26,411 | |
| | | | | | | | |
Total Investments – 100.6%
(cost $3,074,118) | | | | | | | 2,933,861 | |
Other assets less liabilities – (0.6)% | | | | | | | (16,468 | ) |
| | | | | | | | |
| | |
Net Assets – 100.0% | | | | | | $ | 2,917,393 | |
| | | | | | | | |
FORWARD CURRENCY EXCHANGE CONTRACTS (see Note C)
| | | | | | | | | | | | | | | | |
| Counterparty | | Contracts to
Deliver
(000) | | | In Exchange
For
(000) | | | Settlement
Date | | | Unrealized
Appreciation/
(Depreciation) | |
Brown Brothers Harriman & Co. | | USD | 18 | | | JPY | 1,950 | | | | 1/07/19 | | | $ | 121 | |
Brown Brothers Harriman & Co. | | AUD | 40 | | | USD | 28 | | | | 3/15/19 | | | | 273 | |
Brown Brothers Harriman & Co. | | CAD | 243 | | | USD | 182 | | | | 3/15/19 | | | | 3,809 | |
Brown Brothers Harriman & Co. | | CHF | 16 | | | USD | 16 | | | | 3/15/19 | | | | (32 | ) |
Brown Brothers Harriman & Co. | | EUR | 30 | | | USD | 34 | | | | 3/15/19 | | | | (210 | ) |
Brown Brothers Harriman & Co. | | GBP | 22 | | | USD | 28 | | | | 3/15/19 | | | | 487 | |
Brown Brothers Harriman & Co. | | GBP | 45 | | | USD | 57 | | | | 3/15/19 | | | | (426 | ) |
Brown Brothers Harriman & Co. | | HKD | 304 | | | USD | 39 | | | | 3/15/19 | | | | 76 | |
Brown Brothers Harriman & Co. | | ILS | 483 | | | USD | 130 | | | | 3/15/19 | | | | 592 | |
Brown Brothers Harriman & Co. | | JPY | 9,140 | | | USD | 83 | | | | 3/15/19 | | | | (1,051 | ) |
Brown Brothers Harriman & Co. | | NOK | 540 | | | USD | 64 | | | | 3/15/19 | | | | 1,141 | |
Brown Brothers Harriman & Co. | | SEK | 52 | | | USD | 6 | | | | 3/15/19 | | | | (129 | ) |
Brown Brothers Harriman & Co. | | SGD | 63 | | | USD | 46 | | | | 3/15/19 | | | | (256 | ) |
Brown Brothers Harriman & Co. | | USD | 44 | | | AUD | 61 | | | | 3/15/19 | | | | (690 | ) |
Brown Brothers Harriman & Co. | | USD | 6 | | | CAD | 8 | | | | 3/15/19 | | | | (98 | ) |
Brown Brothers Harriman & Co. | | USD | 46 | | | CHF | 45 | | | | 3/15/19 | | | | 175 | |
Brown Brothers Harriman & Co. | | USD | 331 | | | EUR | 288 | | | | 3/15/19 | | | | 788 | |
Brown Brothers Harriman & Co. | | USD | 9 | | | EUR | 8 | | | | 3/15/19 | | | | (70 | ) |
Brown Brothers Harriman & Co. | | USD | 74 | | | GBP | 58 | | | | 3/15/19 | | | | 577 | |
Brown Brothers Harriman & Co. | | USD | 20 | | | HKD | 160 | | | | 3/15/19 | | | | 11 | |
Brown Brothers Harriman & Co. | | USD | 6 | | | ILS | 22 | | | | 3/15/19 | | | | 23 | |
Brown Brothers Harriman & Co. | | USD | 165 | | | JPY | 18,507 | | | | 3/15/19 | | | | 4,649 | |
Brown Brothers Harriman & Co. | | USD | 30 | | | NOK | 263 | | | | 3/15/19 | | | | 252 | |
Brown Brothers Harriman & Co. | | USD | 75 | | | SEK | 674 | | | | 3/15/19 | | | | 1,324 | |
Citibank, NA | | KRW | 19,808 | | | USD | 18 | | | | 2/20/19 | | | | (171 | ) |
| | | | | | | | | | | | | | | | |
| | | $ | 11,165 | |
| | | | | | | | | | | | | | | | |
| (a) | Security is exempt from registration under Rule 144A of the Securities Act of 1933. These securities are considered restricted, but liquid and may be resold in transactions exempt from registration, normally to qualified institutional buyers. At December 31, 2018, the aggregate market value of these securities amounted to $91,402 or 3.1% of net assets. |
| (b) | Non-income producing security. |
| | |
| |
| abfunds.com | | AB FLEXFEE INTERNATIONAL STRATEGIC CORE PORTFOLIO | 17 |
PORTFOLIO OF INVESTMENTS(continued)
| (c) | To obtain a copy of the fund’s shareholder report, please go to the Securities and Exchange Commission’s website at www.sec.gov. Additionally, shareholder reports for AB funds can be obtained by calling AB at (800)227-4618. |
| (d) | Affiliated investments. |
| (e) | The rate shown represents the7-day yield as of period end. |
Currency Abbreviations:
AUD – Australian Dollar
CAD – Canadian Dollar
CHF – Swiss Franc
EUR – Euro
GBP – Great British Pound
HKD – Hong Kong Dollar
ILS – Israeli Shekel
JPY – Japanese Yen
KRW – South Korean Won
NOK – Norwegian Krone
SEK – Swedish Krona
SGD – Singapore Dollar
USD – United States Dollar
Glossary:
EAFE – Europe, Australia, and Far East
ETF – Exchange Traded Fund
GDR – Global Depositary Receipt
MSCI – Morgan Stanley Capital International
REG – Registered Shares
See notes to financial statements.
| | |
| |
| 18 | AB FLEXFEE INTERNATIONAL STRATEGIC CORE PORTFOLIO | | abfunds.com |
STATEMENT OF ASSETS & LIABILITIES
December 31, 2018
| | | | |
| Assets | | | | |
Investments in securities, at value | | | | |
Unaffiliated issuers (cost $3,047,707) | | $ | 2,907,450 | |
Affiliated issuers (cost $26,411) | | | 26,411 | |
Foreign currencies, at value (cost $41,832) | | | 42,024 | |
Receivable from Adviser | | | 98,336 | |
Receivable for investment securities sold | | | 36,539 | |
Unrealized appreciation on forward currency exchange contracts | | | 14,298 | |
Unaffiliated dividends receivable | | | 7,430 | |
Affiliated dividends receivable | | | 90 | |
| | | | |
Total assets | | | 3,132,578 | |
| | | | |
| Liabilities | | | | |
Payable for investment securities purchased and foreign
currency transactions | | | 70,082 | |
Audit and tax fee payable | | | 65,033 | |
Custody fee payable | | | 29,860 | |
Legal fee payable | | | 14,658 | |
Unrealized depreciation on forward currency exchange contracts | | | 3,133 | |
Transfer Agent fee payable | | | 1,632 | |
Accrued expenses and other liabilities | | | 30,787 | |
| | | | |
Total liabilities | | | 215,185 | |
| | | | |
Net Assets | | $ | 2,917,393 | |
| | | | |
| Composition of Net Assets | | | | |
Capital stock, at par | | $ | 31 | |
Additionalpaid-in capital | | | 3,066,538 | |
Accumulated loss | | | (149,176 | ) |
| | | | |
| | $ | 2,917,393 | |
| | | | |
Net Asset Value Per Share—11 billion shares of capital stock authorized, $.0001 par value
| | | | | | | | | | | | |
| Class | | Net Assets | | | Shares
Outstanding | | | Net Asset
Value | |
| |
| Advisor | | $ | 2,917,393 | | | | 307,550 | | | $ | 9.49 | |
| | | | | | | | | | | | |
See notes to financial statements.
| | |
| |
| abfunds.com | | AB FLEXFEE INTERNATIONAL STRATEGIC CORE PORTFOLIO | 19 |
STATEMENT OF OPERATIONS
Year Ended December 31, 2018
| | | | | | | | |
| Investment Income | | | | | | | | |
Dividends | | | | | | | | |
Unaffiliated issuers (net of foreign taxes withheld of $9,129) | | $ | 95,579 | | | | | |
Affiliated issuers | | | 553 | | | $ | 96,132 | |
| | | | | | | | |
| Expenses | | | | | | | | |
Advisory fee (see Note B) | | | 49,680 | | | | | |
Transfer agency-Advisor Class | | | 6,669 | | | | | |
Custodian | | | 79,152 | | | | | |
Administrative | | | 70,260 | | | | | |
Audit and tax | | | 65,464 | | | | | |
Amortization of offering expenses | | | 33,390 | | | | | |
Legal | | | 32,261 | | | | | |
Registration fees | | | 27,625 | | | | | |
Directors’ fees | | | 24,785 | | | | | |
Printing | | | 9,895 | | | | | |
Miscellaneous | | | 34,914 | | | | | |
| | | | | | | | |
Total expenses | | | 434,095 | | | | | |
Less: expenses waived and reimbursed by the Adviser (see Note B) | | | (386,138 | ) | | | | |
| | | | | | | | |
Net expenses | | | | | | | 47,957 | |
| | | | | | | | |
Net investment income | | | | | | | 48,175 | |
| | | | | | | | |
| Realized and Unrealized Gain (Loss) on Investment and Foreign Currency Transactions | | | | | | | | |
Net realized gain (loss) on: | | | | | | | | |
Investment transactions | | | | | | | 6,705 | |
Forward currency exchange contracts | | | | | | | (8,753 | ) |
Foreign currency transactions | | | | | | | (200 | ) |
Net change in unrealized appreciation/depreciation on: | | | | | | | | |
Investments | | | | | | | (351,359 | ) |
Forward currency exchange contracts | | | | | | | 14,025 | |
Foreign currency denominated assets and liabilities | | | | | | | (29 | ) |
| | | | | | | | |
Net loss on investment and foreign currency transactions | | | | | | | (339,611 | ) |
| | | | | | | | |
Net Decrease in Net Assets from Operations | | | | | | $ | (291,436 | ) |
| | | | | | | | |
See notes to financial statements.
| | |
| |
| 20 | AB FLEXFEE INTERNATIONAL STRATEGIC CORE PORTFOLIO | | abfunds.com |
STATEMENT OF CHANGES IN NET ASSETS
| | | | | | | | |
| | | Year Ended
December 31,
2018 | | | June 28,
2017(a) to
December 31,
2017 | |
| Increase (Decrease) in Net Assets from Operations | | | | | | | | |
Net investment income | | $ | 48,175 | | | $ | 26,843 | |
Net realized loss on investment and foreign currency transactions | | | (2,248 | ) | | | (374 | ) |
Net change in unrealized appreciation/depreciation on investments and foreign currency denominated assets and liabilities | | | (337,363 | ) | | | 208,242 | |
| | | | | | | | |
Net increase (decrease) in net assets from operations | | | (291,436 | ) | | | 234,711 | |
Distributions to Shareholders* | | | | | | | | |
Advisor Class | | | (71,640 | ) | | | (25,890 | ) |
| Capital Stock Transactions | | | | | | | | |
Net increase | | | 71,645 | | | | 3,000,003 | |
| | | | | | | | |
Total decrease | | | (291,431 | ) | | | 3,208,824 | |
| Net Assets | | | | | | | | |
Beginning of period | | | 3,208,824 | | | | – 0 | – |
| | | | | | | | |
End of period | | $ | 2,917,393 | | | $ | 3,208,824 | |
| | | | | | | | |
| (a) | Commencement of operations. |
| * | The prior year’s amounts have been reclassified to conform with the current year’s presentation. See Note G, Recent Accounting Pronouncements, in the Notes to Financial Statements for more information. |
See notes to financial statements.
| | |
| |
| abfunds.com | | AB FLEXFEE INTERNATIONAL STRATEGIC CORE PORTFOLIO | 21 |
NOTES TO FINANCIAL STATEMENTS
December 31, 2018
NOTE A
Significant Accounting Policies
AB Cap Fund, Inc. (the “Company”), which is a Maryland corporation, is registered under the Investment Company Act of 1940 as anopen-end management investment company. The Company operates as a series company comprised of 29 portfolios currently in operation. Each portfolio is considered to be a separate entity for financial reporting and tax purposes. This report relates only to the AB FlexFee International Strategic Core Portfolio (the “Fund”), a diversified portfolio. The Fund commenced operations on June 28, 2017. The Fund has authorized issuance of Class A, Class B, Class C, Advisor Class, Class R, Class K, Class I, Class Z, Class T, Class 1, and Class 2 shares. Class A, Class B, Class C, Class R, Class K, Class I, Class Z, Class T, Class 1, and Class 2 shares have not been issued. As of December 31, 2018, AllianceBernstein L.P. (the “Adviser”) was the sole shareholder of Advisor Class shares. Advisor Class shares are sold without an initial or contingent deferred sales charge and are not subject to ongoing distribution expenses. All eleven classes of shares have identical voting, dividend, liquidation and other rights, except that the classes bear different distribution and transfer agency expenses. Each class has exclusive voting rights with respect to its distribution plan. The financial statements have been prepared in conformity with U.S. generally accepted accounting principles (“U.S. GAAP”), which require management to make certain estimates and assumptions that affect the reported amounts of assets and liabilities in the financial statements and amounts of income and expenses during the reporting period. Actual results could differ from those estimates. The Fund is an investment company under U.S. GAAP and follows the accounting and reporting guidance applicable to investment companies. The following is a summary of significant accounting policies followed by the Fund.
1. Security Valuation
Portfolio securities are valued at their current market value determined on the basis of market quotations or, if market quotations are not readily available or are deemed unreliable, at “fair value” as determined in accordance with procedures established by and under the general supervision of the Fund’s Board of Directors (the “Board”).
In general, the market values of securities which are readily available and deemed reliable are determined as follows: securities listed on a national securities exchange (other than securities listed on the NASDAQ Stock Market, Inc. (“NASDAQ”)) or on a foreign securities exchange are valued at the last sale price at the close of the exchange or foreign securities exchange. If there has been no sale on such day, the securities are valued at the last traded price from the previous day. Securities listed on more
| | |
| |
| 22 | AB FLEXFEE INTERNATIONAL STRATEGIC CORE PORTFOLIO | | abfunds.com |
NOTES TO FINANCIAL STATEMENTS(continued)
than one exchange are valued by reference to the principal exchange on which the securities are traded; securities listed only on NASDAQ are valued in accordance with the NASDAQ Official Closing Price; listed or over the counter (“OTC”) market put or call options are valued at the mid level between the current bid and ask prices. If either a current bid or current ask price is unavailable, the Adviser will have discretion to determine the best valuation (e.g., last trade price in the case of listed options); open futures are valued using the closing settlement price or, in the absence of such a price, the most recent quoted bid price. If there are no quotations available for the day of valuation, the last available closing settlement price is used; U.S. Government securities and any other debt instruments having 60 days or less remaining until maturity are generally valued at market by an independent pricing vendor, if a market price is available. If a market price is not available, the securities are valued at amortized cost. This methodology is commonly used for short term securities that have an original maturity of 60 days or less, as well as short term securities that had an original term to maturity that exceeded 60 days. In instances when amortized cost is utilized, the Valuation Committee (the “Committee”) must reasonably conclude that the utilization of amortized cost is approximately the same as the fair value of the security. Such factors the Committee will consider include, but are not limited to, an impairment of the creditworthiness of the issuer or material changes in interest rates. Fixed-income securities, including mortgage-backed and asset-backed securities, may be valued on the basis of prices provided by a pricing service or at a price obtained from one or more of the major broker-dealers. In cases where broker-dealer quotes are obtained, the Adviser may establish procedures whereby changes in market yields or spreads are used to adjust, on a daily basis, a recently obtained quoted price on a security. Swaps and other derivatives are valued daily, primarily using independent pricing services, independent pricing models using market inputs, as well as third party broker-dealers or counterparties. Open end mutual funds are valued at the closing net asset value per share, while exchange traded funds are valued at the closing market price per share.
Securities for which market quotations are not readily available (including restricted securities) or are deemed unreliable are valued at fair value as deemed appropriate by the Adviser. Factors considered in making this determination may include, but are not limited to, information obtained by contacting the issuer, analysts, analysis of the issuer’s financial statements or other available documents. In addition, the Fund may use fair value pricing for securities primarily traded innon-U.S. markets because most foreign markets close well before the Fund values its securities at 4:00 p.m., Eastern Time. The earlier close of these foreign markets gives rise to the possibility that significant events, including broad market moves, may have occurred in the interim and may materially affect the
| | |
| |
| abfunds.com | | AB FLEXFEE INTERNATIONAL STRATEGIC CORE PORTFOLIO | 23 |
NOTES TO FINANCIAL STATEMENTS(continued)
value of those securities. To account for this, the Fund generally values many of its foreign equity securities using fair value prices based on third party vendor modeling tools to the extent available.
2. Fair Value Measurements
In accordance with U.S. GAAP regarding fair value measurements, fair value is defined as the price that the Fund would receive to sell an asset or pay to transfer a liability in an orderly transaction between market participants at the measurement date. U.S. GAAP establishes a framework for measuring fair value, and a three-level hierarchy for fair value measurements based upon the transparency of inputs to the valuation of an asset or liability (including those valued based on their market values as described in Note A.1 above). Inputs may be observable or unobservable and refer broadly to the assumptions that market participants would use in pricing the asset or liability. Observable inputs reflect the assumptions market participants would use in pricing the asset or liability based on market data obtained from sources independent of the Fund. Unobservable inputs reflect the Fund’s own assumptions about the assumptions that market participants would use in pricing the asset or liability based on the best information available in the circumstances. Each investment is assigned a level based upon the observability of the inputs which are significant to the overall valuation. The three-tier hierarchy of inputs is summarized below.
| | • | | Level 1—quoted prices in active markets for identical investments |
| | • | | Level 2—other significant observable inputs (including quoted prices for similar investments, interest rates, prepayment speeds, credit risk, etc.) |
| | • | | Level 3—significant unobservable inputs (including the Fund’s own assumptions in determining the fair value of investments) |
Where readily available market prices or relevant bid prices are not available for certain equity investments, such investments may be valued based on similar publicly traded investments, movements in relevant indices since last available prices or based upon underlying company fundamentals and comparable company data (such as multiples to earnings or other multiples to equity). Where an investment is valued using an observable input, such as another publicly traded security, the investment will be classified as Level 2. If management determines that an adjustment is appropriate based on restrictions on resale, illiquidity or uncertainty, and such adjustment is a significant component of the valuation, the investment will be classified as Level 3. An investment will also be classified as Level 3 where management uses company fundamentals and other significant inputs to determine the valuation.
| | |
| |
| 24 | AB FLEXFEE INTERNATIONAL STRATEGIC CORE PORTFOLIO | | abfunds.com |
NOTES TO FINANCIAL STATEMENTS(continued)
The fair value of debt instruments, such as bonds, andover-the-counter derivatives is generally based on market price quotations, recently executed market transactions (where observable) or industry recognized modeling techniques and are generally classified as Level 2. Pricing vendor inputs to Level 2 valuations may include quoted prices for similar investments in active markets, interest rate curves, coupon rates, currency rates, yield curves, option adjusted spreads, default rates, credit spreads and other unique security features in order to estimate the relevant cash flows which is then discounted to calculate fair values. If these inputs are unobservable and significant to the fair value, these investments will be classified as Level 3. In addition,non-agency rated investments are classified as Level 3.
The following table summarizes the valuation of the Fund’s investments by the above fair value hierarchy levels as of December 31, 2018:
| | | | | | | | | | | | | | | | |
Investments in
Securities | | Level 1 | | | Level 2 | | | Level 3 | | | Total | |
Assets: | | | | | | | | | | | | | | | | |
Common Stocks: | | | | | | | | | | | | | | | | |
Financials | | $ | 101,927 | | | $ | 596,532 | | | $ | – 0 | – | | $ | 698,459 | |
Information Technology | | | 84,411 | | | | 266,795 | | | | – 0 | – | | | 351,206 | |
Consumer Staples | | | 38,053 | | | | 266,488 | | | | – 0 | – | | | 304,541 | |
Industrials | | | – 0 | – | | | 301,411 | | | | – 0 | – | | | 301,411 | |
Health Care | | | – 0 | – | | | 270,158 | | | | – 0 | – | | | 270,158 | |
Communication Services | | | 42,602 | | | | 186,658 | | | | – 0 | – | | | 229,260 | |
Consumer Discretionary | | | – 0 | – | | | 216,022 | | | | – 0 | – | | | 216,022 | |
Energy | | | – 0 | – | | | 169,189 | | | | – 0 | – | | | 169,189 | |
Real Estate | | | – 0 | – | | | 132,824 | | | | – 0 | – | | | 132,824 | |
Materials | | | – 0 | – | | | 77,492 | | | | – 0 | – | | | 77,492 | |
Utilities | | | – 0 | – | | | 75,951 | | | | – 0 | – | | | 75,951 | |
Investment Companies | | | 80,529 | | | | – 0 | – | | | – 0 | – | | | 80,529 | |
Rights | | | 408 | | | | – 0 | – | | | – 0 | – | | | 408 | |
Short-Term Investments: | | | | | | | | | | | | | | | | |
Investment Companies | | | 26,411 | | | | – 0 | – | | | – 0 | – | | | 26,411 | |
| | | | | | | | | | | | | | | | |
Total Investments in Securities | | | 374,341 | | | | 2,559,520 | † | | | – 0 | – | | | 2,933,861 | |
Other Financial Instruments*: | | | | | | | | | | | | | | | | |
Assets | | | | | | | | | | | | | | | | |
Forward Currency Exchange Contracts | | | – 0 | – | | | 14,298 | | | | – 0 | – | | | 14,298 | |
Liabilities | | | | | | | | | | | | | | | | |
Forward Currency Exchange Contracts | | | – 0 | – | | | (3,133 | ) | | | – 0 | – | | | (3,133 | ) |
| | | | | | | | | | | | | | | | |
Total^ | | $ | 374,341 | | | $ | 2,570,685 | | | $ | – 0 | – | | $ | 2,945,026 | |
| | | | | | | | | | | | | | | | |
| † | A significant portion of the Fund’s foreign equity investments are categorized as Level 2 investments since they are valued using fair value prices based on third party vendor modeling tools to the extent available, see note A.1. |
| * | Other financial instruments are derivative instruments, such as futures, forwards and swaps, which are valued at the unrealized appreciation/(depreciation) on the instrument. Other financial instruments may also include swaps with upfront premiums, options written and swaptions written which are valued at market value. |
| ^ | An amount of $98,926 was transferred from Level 1 to Level 2 due to the above mentioned foreign equity fair valuation using third party vendor modeling tools during the reporting period. There were no transfers from Level 2 to Level 1 during the reporting period. |
| | |
| |
| abfunds.com | | AB FLEXFEE INTERNATIONAL STRATEGIC CORE PORTFOLIO | 25 |
NOTES TO FINANCIAL STATEMENTS(continued)
The Fund recognizes all transfers between levels of the fair value hierarchy assuming the financial instrument was transferred at the beginning of the reporting period.
The Adviser established the Committee to oversee the pricing and valuation of all securities held in the Fund. The Committee operates under pricing and valuation policies and procedures established by the Adviser and approved by the Board, including pricing policies which set forth the mechanisms and processes to be employed on a daily basis to implement these policies and procedures. In particular, the pricing policies describe how to determine market quotations for securities and other instruments. The Committee’s responsibilities include: 1) fair value and liquidity determinations (and oversight of any third parties to whom any responsibility for fair value and liquidity determinations is delegated), and 2) regular monitoring of the Adviser’s pricing and valuation policies and procedures and modification or enhancement of these policies and procedures (or recommendation of the modification of these policies and procedures) as the Committee believes appropriate.
The Committee is also responsible for monitoring the implementation of the pricing policies by the Adviser’s Pricing Group (the “Pricing Group”) and any third party which performs certain pricing functions in accordance with the pricing policies. The Pricing Group is responsible for the oversight of the third party on aday-to-day basis. The Committee and the Pricing Group perform a series of activities to provide reasonable assurance of the accuracy of prices including: 1) periodic vendor due diligence meetings, review of methodologies, new developments and process at vendors, 2) daily comparison of security valuation versus prior day for all securities that exceeded established thresholds, and 3) daily review of unpriced, stale, and variance reports with exceptions reviewed by senior management and the Committee.
In addition, several processes outside of the pricing process are used to monitor valuation issues including: 1) performance and performance attribution reports are monitored for anomalous impacts based upon benchmark performance, and 2) portfolio managers review all portfolios for performance and analytics (which are generated using the Adviser’s prices).
3. Currency Translation
Assets and liabilities denominated in foreign currencies and commitments under forward currency exchange contracts are translated into U.S. dollars at the mean of the quoted bid and ask prices of such currencies against the U.S. dollar. Purchases and sales of portfolio securities are translated into U.S. dollars at the rates of exchange prevailing when such securities were acquired or sold. Income and expenses are translated into U.S. dollars at the rates of exchange prevailing when accrued.
| | |
| |
| 26 | AB FLEXFEE INTERNATIONAL STRATEGIC CORE PORTFOLIO | | abfunds.com |
NOTES TO FINANCIAL STATEMENTS(continued)
Net realized gain or loss on foreign currency transactions represents foreign exchange gains and losses from sales and maturities of foreign fixed income investments, holding of foreign currencies, currency gains or losses realized between the trade and settlement dates on foreign investment transactions, and the difference between the amounts of dividends, interest and foreign withholding taxes recorded on the Fund’s books and the U.S. dollar equivalent amounts actually received or paid. Net unrealized currency gains and losses from valuing foreign currency denominated assets and liabilities at period end exchange rates are reflected as a component of net unrealized appreciation and depreciation of foreign currency denominated assets and liabilities.
4. Taxes
It is the Fund’s policy to meet the requirements of the Internal Revenue Code applicable to regulated investment companies and to distribute all of its investment company taxable income and net realized gains, if any, to shareholders. Therefore, no provisions for federal income or excise taxes are required. The Fund may be subject to taxes imposed by countries in which it invests. Such taxes are generally based on income and/or capital gains earned or repatriated. Taxes are accrued and applied to net investment income, net realized gains and net unrealized appreciation/depreciation as such income and/or gains are earned.
In accordance with U.S. GAAP requirements regarding accounting for uncertainties in income taxes, management has analyzed the Fund’s tax positions taken or expected to be taken on federal and state income tax returns for all open tax years (all years since inception of the Fund), and has concluded that no provision for income tax is required in the Fund’s financial statements.
5. Investment Income and Investment Transactions
Dividend income is recorded on theex-dividend date or as soon as the Fund is informed of the dividend. Interest income is accrued daily. Investment transactions are accounted for on the date securities are purchased or sold. Investment gains or losses are determined on the identified cost basis. The Fund amortizes premiums and accretes discounts as adjustments to interest income.
6. Expense Allocations
Expenses of the Company are charged proportionately to each portfolio or based on other appropriate methods.
7. Dividends and Distributions
Dividends and distributions to shareholders, if any, are recorded on theex-dividend date. Income dividends and capital gains distributions are determined in accordance with federal tax regulations and may differ from
| | |
| |
| abfunds.com | | AB FLEXFEE INTERNATIONAL STRATEGIC CORE PORTFOLIO | 27 |
NOTES TO FINANCIAL STATEMENTS(continued)
those determined in accordance with U.S. GAAP. To the extent these differences are permanent, such amounts are reclassified within the capital accounts based on their federal tax basis treatment; temporary differences do not require such reclassification.
8. Offering Expenses
Offering expenses of $68,085 were deferred and amortized on a straight line basis over a one year period starting from June 28, 2017 (commencement of operations).
NOTE B
Advisory Fee and Other Transactions with Affiliates
Under the terms of the investment advisory agreement, the Fund pays the Adviser an advisory fee at an annual rate of .55% of the Fund’s average daily net assets (“Base Fee”). The advisory fee is increased or decreased from the Base Fee by a performance adjustment (“Performance Adjustment”) that depends on whether, and to what extent, the investment performance of the Advisor Class shares of the Fund (“Measuring Class”) exceeds, or is exceeded by, the performance of the MSCI EAFE Index (net) (“Index”) plus 1.40% (“Index Hurdle”) over the Performance Period (as defined below). For the period from August 4, 2017 to October 31, 2017, the MSCI EAFE Index with IDCo Fair Value Pricing (net) was used for purposes of calculating the Performance Adjustment. The Performance Adjustment is calculated and accrued daily, according to a schedule that adds or subtracts .00357% of the Fund’s average daily net assets for each .01% of absolute performance by which the performance of the Measuring Class exceeds or lags the Index Hurdle for the period from the beginning of the Performance Period through the current business day. The maximum Performance Adjustment (positive or negative) will not exceed an annualized rate of +/- .50% (“Maximum Performance Adjustment”) of the Fund’s average daily net assets, which would occur when the performance of the Measuring Class exceeds, or is exceeded by, the Index Hurdle by 1.40% or more for the Performance Period. On a monthly basis, the Fund will pay the Adviser the minimum fee rate of .05% on an annualized basis (Base Fee minus the Maximum Performance Adjustment) applied to the average daily net assets for the month. At the end of the Performance Period, the Fund will pay to the Adviser the total advisory fee, less the amount of any minimum fees paid during the Performance Period and any waivers described below. The period over which performance is measured (“Performance Period”) was initially from the commencement of operations to December 31, 2018 and thereafter is each12-month period beginning on the first business day in the month of January through December 31 of the same year. In addition, the Adviser has agreed to waive its advisory fee by limiting the Fund’s accrual of the advisory fee (Base Fee plus Performance Adjustment) on any day to the amount corresponding to the maximum fee rate multiplied by the Fund’s
| | |
| |
| 28 | AB FLEXFEE INTERNATIONAL STRATEGIC CORE PORTFOLIO | | abfunds.com |
NOTES TO FINANCIAL STATEMENTS(continued)
current net assets if such amount is less than the amount that would have been accrued based on the Fund’s average daily net assets for the Performance Period. For the year ended December 31, 2018, the Fund accrued advisory fees of $49,680 based on the Fund’s average net assets, as reflected in the statement of operations. As of December 31, 2018, the Fund used current net assets pursuant to the above-referenced waiver agreement to calculate the Performance Adjustment, resulting in a waiver of $5,375 and a net advisory fee of $44,305, at an annual effective rate (excluding the impact from any other expense waivers in effect, as noted below) of 1.56% of the Fund’s current net assets, which reflected a 1.03% Performance Adjustment of $29,364. For the Performance Period from June 28, 2017 to December 31, 2018, the Fund accrued advisory fees of $50,469 based on the Fund’s average net assets. As noted above, the Fund used current net assets as of December 31, 2018 to calculate the Performance Adjustment for the Performance Period, resulting in a waiver of $5,375 and a net advisory fee of $45,094, at an annual effective rate (excluding the impact from any other expense waivers in effect, as noted below) of 1.05% of the Fund’s current net assets, which reflected a 0.50% Performance Adjustment of $21,473. The advisory fee accrued during the financial reporting period may be higher than the Base Fee plus the Maximum Performance Adjustment (or lower than the Base Fee minus the Maximum Performance Adjustment) because the actual fee is calculated based on performance over a longer time period for the initial Performance Period.
The Adviser has agreed to waive its fees and bear certain expenses through June 11, 2019 to the extent necessary to limit total expenses (other than the advisory fee, acquired fund fees and expenses other than the advisory fees of any AB mutual funds in which the Fund may invest, interest expense, taxes, extraordinary expenses, and brokerage commissions and other transaction costs) on an annual basis from exceeding .10% of average daily net assets. For the year ended December 31, 2018, such reimbursements/waivers amounted to $310,438. Any fees waived and expenses borne by the Adviser through December 31, 2018 are subject to repayment by the Fund until the end of the third fiscal year after the fiscal period in which the fees were waived or the expenses were borne; such waivers that are subject to repayment amount to $194,120 for the fiscal period ended December 31, 2017 and $310,438 for the year ended December 31, 2018. In any case, no repayment will be made that would cause the Fund’s total annual expenses (subject to the exclusions set forth above) to exceed .10%.
During 2017, AXA S.A. (“AXA”), a French holding company for the AXA Group, a worldwide leader in life, property and casualty and health insurance and asset management, announced its intention to pursue the sale of a minority stake in its subsidiary, AXA Equitable Holdings, Inc. (“AXA Equitable”), the holding company for a diversified financial services organization, through an initial public offering (“IPO”). AXA Equitable is the holding company for a diverse group of financial services companies,
| | |
| |
| abfunds.com | | AB FLEXFEE INTERNATIONAL STRATEGIC CORE PORTFOLIO | 29 |
NOTES TO FINANCIAL STATEMENTS(continued)
including AllianceBernstein L.P., the investment adviser to the Funds (“the Adviser”). During the second quarter of 2018, AXA Equitable completed the IPO, and, as a result, AXA held approximately 72.2% of the outstanding common stock of AXA Equitable as of September 30, 2018. Contemporaneously with the IPO, AXA sold $862.5 million aggregate principal amount of its 7.25% mandatorily exchangeable notes (the “MxB Notes”) due May 15, 2021 and exchangeable into up to 43,125,000 shares of common stock (or approximately 7% of the outstanding shares of common stock of AXA Equitable). AXA retains ownership (including voting rights) of such shares of common stock until the MxB Notes are exchanged, which may be on a date that is earlier than the maturity date at AXA’s option upon the occurrence of certain events.
In March 2018, AXA announced its intention to sell its entire interest in AXA Equitable over time, subject to market conditions and other factors (the “Plan”). It is anticipated that one or more of the transactions contemplated by the Plan may ultimately result in the indirect transfer of a “controlling block” of voting securities of the Adviser (a “Change of Control Event”) and therefore may be deemed an “assignment” causing a termination of each Fund’s current investment advisory agreement. In order to ensure that the existing investment advisory services could continue uninterrupted, at meetings held in late July through early August 2018, the Boards of Directors/Trustees (each a “Board” and collectively, the “Boards”) approved new investment advisory agreements with the Adviser, in connection with the Plan. The Boards also agreed to call and hold a joint meeting of shareholders on October 11, 2018 for shareholders of each Fund to (1) approve the new investment advisory agreement with the Adviser that would be effective after the first Change of Control Event and (2) approve any future advisory agreement approved by the Board and that has terms not materially different from the current agreement, in the event there are subsequent Change of Control Events arising from completion of the Plan that terminate the advisory agreement after the first Change of Control Event. Approval of a future advisory agreement means that shareholders may not have another opportunity to vote on a new agreement with the Adviser even upon a change of control, as long as no single person or group of persons acting together gains “control” (as defined in the 1940 Act) of AXA Equitable.
At the October 11, 2018 meeting, shareholders approved the new and future investment advisory agreements.
On November 20, 2018, AXA completed a public offering of 60,000,000 shares of AXA Equitable’s common stock and simultaneously sold 30,000,000 of such shares to AXA Equitable pursuant to a separate agreement with it. As a result AXA currently owns approximately 59.2% of the shares of common stock of AXA Equitable.
Pursuant to the investment advisory agreement, the Fund may reimburse the Adviser for certain legal and accounting services provided to the Fund by the Adviser. For the year ended December 31, 2018, the Adviser voluntarily agreed to waive such fees in the amount to $70,260.
| | |
| |
| 30 | AB FLEXFEE INTERNATIONAL STRATEGIC CORE PORTFOLIO | | abfunds.com |
NOTES TO FINANCIAL STATEMENTS(continued)
The Fund compensates AllianceBernstein Investor Services, Inc. (“ABIS”), a wholly-owned subsidiary of the Adviser, under a Transfer Agency Agreement for providing personnel and facilities to perform transfer agency services for the Fund. ABIS may make payments to intermediaries that provide omnibus account services,sub-accounting services and/or networking services. The compensation retained by ABIS amounted to $6,970 for the year ended December 31, 2018.
The Fund may invest in AB Government Money Market Portfolio (the “Government Money Market Portfolio”) which has a contractual annual advisory fee rate of .20% of the portfolio’s average daily net assets and bears its own expenses. Effective August 1, 2018, the Adviser has contractually agreed to waive .10% of the advisory fee of Government Money Market Portfolio until August 31, 2019. In connection with the investment by the Fund in Government Money Market Portfolio, the Adviser has contractually agreed to waive its advisory fee from the Fund in an amount equal to the Fund’s pro rata share of the effective advisory fee of Government Money Market Portfolio, as borne indirectly by the Fund as an acquired fund fee and expense. For the year ended December 31, 2018, such waiver amounted to $65.
A summary of the Fund’s transactions in AB mutual funds for the year ended December 31, 2018 is as follows:
| | | | | | | | | | | | | | | | | | | | |
Fund | | Market Value
12/31/17
(000) | | | Purchases
at Cost
(000) | | | Sales
Proceeds
(000) | | | Market Value
12/31/18
(000) | | | Dividend
Income
(000) | |
Government Money Market Portfolio | | $ | 501 | | | $ | 1,707 | | | $ | 2,182 | | | $ | 26 | | | $ | 1 | |
Brokerage commissions paid on investment transactions for the year ended December 31, 2018 amounted to $2,678, of which $0 and $0, respectively, was paid to Sanford C. Bernstein & Co. LLC and Sanford C. Bernstein Limited, affiliates of the Adviser.
NOTE C
Investment Transactions
Purchases and sales of investment securities (excluding short-term investments) for the year ended December 31, 2018 were as follows:
| | | | | | | | |
| | | Purchases | | | Sales | |
Investment securities (excluding U.S. government securities) | | $ | 2,629,952 | | | $ | 2,578,081 | |
U.S. government securities | | | – 0 | – | | | – 0 | – |
| | |
| |
| abfunds.com | | AB FLEXFEE INTERNATIONAL STRATEGIC CORE PORTFOLIO | 31 |
NOTES TO FINANCIAL STATEMENTS(continued)
The cost of investments for federal income tax purposes, gross unrealized appreciation and unrealized depreciation are as follows:
| | | | |
Cost | | $ | 3,087,135 | |
| | | | |
Gross unrealized appreciation | | $ | 133,680 | |
Gross unrealized depreciation | | | (287,123 | ) |
| | | | |
Net unrealized depreciation | | $ | (153,443 | ) |
| | | | |
1. Derivative Financial Instruments
The Fund may use derivatives in an effort to earn income and enhance returns, to replace more traditional direct investments, to obtain exposure to otherwise inaccessible markets (collectively, “investment purposes”), or to hedge or adjust the risk profile of its portfolio.
The principal types of derivatives utilized by the Fund, as well as the methods in which they may be used are:
| | • | | Forward Currency Exchange Contracts |
The Fund may enter into forward currency exchange contracts in order to hedge its exposure to changes in foreign currency exchange rates on its foreign portfolio holdings, to hedge certain firm purchase and sales commitments denominated in foreign currencies and fornon-hedging purposes as a means of making direct investments in foreign currencies, as described below under “Currency Transactions”.
A forward currency exchange contract is a commitment to purchase or sell a foreign currency at a future date at a negotiated forward rate. The gain or loss arising from the difference between the original contract and the closing of such contract would be included in net realized gain or loss on forward currency exchange contracts. Fluctuations in the value of open forward currency exchange contracts are recorded for financial reporting purposes as unrealized appreciation and/or depreciation by the Fund. Risks may arise from the potential inability of a counterparty to meet the terms of a contract and from unanticipated movements in the value of a foreign currency relative to the U.S. dollar.
During the year ended December 31, 2018, the Fund held forward currency exchange contracts for hedging purposes.
The Fund typically enters into International Swaps and Derivatives Association, Inc. Master Agreements (“ISDA Master Agreement”) with its OTC derivative contract counterparties in order to, among other things, reduce its credit risk to OTC counterparties. ISDA Master Agreements include provisions for general obligations, representations, collateral and events of default or termination. Under an ISDA Master Agreement, the Fund typically may offset with the OTC counterparty certain derivative financial
| | |
| |
| 32 | AB FLEXFEE INTERNATIONAL STRATEGIC CORE PORTFOLIO | | abfunds.com |
NOTES TO FINANCIAL STATEMENTS(continued)
instruments’ payables and/or receivables with collateral held and/or posted and create one single net payment(close-out netting) in the event of default or termination. In the event of a default by an OTC counterparty, the return of collateral with market value in excess of the Fund’s net liability, held by the defaulting party, may be delayed or denied.
The Fund’s ISDA Master Agreements may contain provisions for early termination of OTC derivative transactions in the event the net assets of the Fund decline below specific levels (“net asset contingent features”). If these levels are triggered, the Fund’s OTC counterparty has the right to terminate such transaction and require the Fund to pay or receive a settlement amount in connection with the terminated transaction. If OTC derivatives were held at period end, please refer to netting arrangements by the OTC counterparty table below for additional details.
During the year ended December 31, 2018, the Fund had entered into the following derivatives:
| | | | | | | | | | | | |
| | | Asset Derivatives | | | Liability Derivatives | |
Derivative Type | | Statement of
Assets and
Liabilities
Location | | Fair Value | | | Statement of
Assets and
Liabilities
Location | | Fair Value | |
Foreign currency contracts | | Unrealized appreciation on forward currency exchange contracts | | $ | 14,298 | | | Unrealized depreciation on forward currency exchange contracts | | $ | 3,133 | |
| | | | | | | | | | | | |
Total | | | | $ | 14,298 | | | | | $ | 3,133 | |
| | | | | | | | | | | | |
| | | | | | | | | | |
Derivative Type | | Location of Gain
or (Loss) on
Derivatives Within
Statement of
Operations | | Realized Gain
or (Loss) on
Derivatives | | | Change in
Unrealized
Appreciation or
(Depreciation) | |
Foreign currency contracts | | Net realized gain/(loss) on forward currency exchange contracts; Net change in unrealized appreciation/depreciation on forward currency exchange contracts | | $ | (8,753 | ) | | $ | 14,025 | |
| | | | | | | | | | |
Total | | | | $ | (8,753 | ) | | $ | 14,025 | |
| | | | | | | | | | |
The following table represents the average monthly volume of the Fund’s derivative transactions during the year ended December 31, 2018:
| | | | |
Forward Currency Exchange Contracts: | | | | |
Average principal amount of buy contracts | | $ | 886,371 | |
Average principal amount of sale contracts | | $ | 871,514 | |
| | |
| |
| abfunds.com | | AB FLEXFEE INTERNATIONAL STRATEGIC CORE PORTFOLIO | 33 |
NOTES TO FINANCIAL STATEMENTS(continued)
For financial reporting purposes, the Fund does not offset derivative assets and derivative liabilities that are subject to netting arrangements in the statement of assets and liabilities.
All OTC derivatives held at period end were subject to netting arrangements. The following table presents the Fund’s derivative assets and liabilities by OTC counterparty net of amounts available for offset under ISDA Master Agreements (“MA”) and net of the related collateral received/pledged by the Fund as of December 31, 2018. Exchange-traded derivatives and centrally cleared swaps are not subject to netting arrangements and as such are excluded from the table.
| | | | | | | | | | | | | | | | | | | | |
Counterparty | | Derivative
Assets
Subject
to a MA | | | Derivatives
Available
for Offset | | | Cash
Collateral
Received* | | | Security
Collateral
Received* | | | Net
Amount of
Derivatives
Assets | |
Brown Brothers Harriman & Co. | | $ | 14,298 | | | $ | (2,962 | ) | | $ | – 0 | – | | $ | – 0 | – | | $ | 11,336 | |
| | | | | | | | | | | | | | | | | | | | |
Total | | $ | 14,298 | | | $ | (2,962 | ) | | $ | – 0 | – | | $ | – 0 | – | | $ | 11,336 | ^ |
| | | | | | | | | | | | | | | | | | | | |
| | | | | |
Counterparty | | Derivative
Liabilities
Subject
to a MA | | | Derivatives
Available
for Offset | | | Cash
Collateral
Pledged* | | | Security
Collateral
Pledged* | | | Net
Amount of
Derivatives
Liabilities | |
Brown Brothers Harriman & Co. | | $ | 2,962 | | | $ | (2,962 | ) | | $ | – 0 | – | | $ | – 0 | – | | $ | – 0 | – |
Citibank, N.A. | | | 171 | | | | – 0 | – | | | – 0 | – | | | – 0 | – | | | 171 | |
| | | | | | | | | | | | | | | | | | | | |
Total | | $ | 3,133 | | | $ | (2,962 | ) | | $ | – 0 | – | | $ | – 0 | – | | $ | 171 | ^ |
| | | | | | | | | | | | | | | | | | | | |
| * | The actual collateral received/pledged may be more than the amount reported due to overcollateralization. |
| ^ | Net amount represents the net receivable/payable that would be due from/to the counterparty in the event of default or termination. The net amount from OTC financial derivative instruments can only be netted across transactions governed under the same master agreement with the same counterparty. |
2. Currency Transactions
The Fund may invest innon-U.S. Dollar-denominated securities on a currency hedged or unhedged basis. The Fund may seek investment opportunities by taking long or short positions in currencies through the use of currency-related derivatives, including forward currency exchange contracts, futures and options on futures, swaps, and other options. The Fund may enter into transactions for investment opportunities when it anticipates that a foreign currency will appreciate or depreciate in value but securities denominated in that currency are not held by the Fund and do not present attractive investment opportunities. Such transactions may also be used when the Adviser believes that it may be more efficient than a direct investment in a foreign currency-denominated security. The Fund may also conduct currency exchange contracts on a spot basis (i.e., for cash at the spot rate prevailing in the currency exchange market for buying or selling currencies).
| | |
| |
| 34 | AB FLEXFEE INTERNATIONAL STRATEGIC CORE PORTFOLIO | | abfunds.com |
NOTES TO FINANCIAL STATEMENTS(continued)
NOTE D
Capital Stock
Each class consists of 1,000,000,000 authorized shares. Transactions in capital shares for each class were as follows:
| | | | | | | | | | | | | | | | | | | | | | | | |
| | | | | | | | | | | | | | | | | | | | | | | | |
| | | Shares | | | | | | Amount | | | | |
| | | Year Ended
December 31,
2018 | | | June 28, 2017* to December 31, 2017 | | | | | | Year Ended
December 31,
2018 | | | June 28, 2017* to December 31, 2017 | | | | |
| | | | | | | | |
| Advisor Class | | | | | | | | | | | | | | | | | | | | | | | | |
Shares sold | | | 1 | | | | 300,000 | | | | | | | $ | 5 | | | $ | 3,000,003 | | | | | |
| | | | | |
Shares issued in reinvestment of dividends and distributions | | | 7,549 | | | | 0 | (a) | | | | | | | 71,640 | | | | 0 | (b) | | | | |
| | | | | |
Net increase | | | 7,550 | | | | 300,000 | | | | | | | $ | 71,645 | | | $ | 3,000,003 | | | | | |
| | | | | |
| * | Commencement of operations. |
NOTE E
Risks Involved in Investing in the Fund
Foreign (Non-U.S.) Risk—Investments in securities ofnon-U.S. issuers may involve more risk than those of U.S. issuers. These securities may fluctuate more widely in price and may be less liquid due to adverse market, economic, political, regulatory or other factors. These risks may be heightened with respect to investments in emerging market countries, where there may be an increased amount of economic, political and social instability.
Currency Risk—Fluctuations in currency exchange rates may negatively affect the value of the Fund’s investments or reduce its returns.
Capitalization Risk—Investments inmid-capitalization companies may be more volatile than investments in large-capitalization companies. Investments inmid-capitalization companies may have additional risks because these companies have limited product lines, markets or financial resources.
Derivatives Risk—The Fund may enter into derivative transactions such as forwards, options, futures and swaps. Derivatives may be illiquid, difficult to price, and leveraged so that small changes may produce disproportionate losses for the Fund, and subject to counterparty risk to a greater degree than more traditional investments. Derivatives may result in significant losses, including losses that are far greater than the value of the derivatives reflected on the statement of assets and liabilities.
| | |
| |
| abfunds.com | | AB FLEXFEE INTERNATIONAL STRATEGIC CORE PORTFOLIO | 35 |
NOTES TO FINANCIAL STATEMENTS(continued)
Indemnification Risk—In the ordinary course of business, the Fund enters into contracts that contain a variety of indemnifications. The Fund’s maximum exposure under these arrangements is unknown. However, the Fund has not had prior claims or losses pursuant to these indemnification provisions and expects the risk of loss thereunder to be remote. Therefore, the Fund has not accrued any liability in connection with these indemnification provisions.
NOTE F
Distributions to Shareholders
The tax character of distributions paid during the fiscal year ended December 31, 2018 and the fiscal period ended December 31, 2017 were as follows:
| | | | | | | | |
| | | 2018 | | | 2017 | |
Distributions paid from: | | | | | | | | |
Ordinary income | | $ | 69,816 | | | $ | 25,890 | |
Net long-term capital gains | | | 1,824 | | | | – 0 | – |
| | | | | | | | |
Total taxable distributions paid | | $ | 71,640 | | | $ | 25,890 | |
| | | | | | | | |
As of December 31, 2018, the components of accumulated earnings/(deficit) on a tax basis were as follows:
| | | | |
Undistributed ordinary income | | $ | 18,421 | |
Accumulated capital and other losses | | | (14,125 | )(a) |
Unrealized appreciation/(depreciation) | | | (153,472 | )(b) |
| | | | |
Total accumulated earnings/(deficit) | | $ | (149,176 | ) |
| | | | |
| (a) | As of December 31, 2018, the Fund had a post-October short term capital loss deferral of $9,753 and a post-October long term capital loss deferral of $4,372. |
| (b) | The differences between book-basis and tax-basis unrealized appreciation/(depreciation) are attributable primarily to the tax deferral of losses on wash sales, the tax treatment of passive foreign investment companies (PFICs), and the recognition for tax purposes of unrealized gains/losses on certain derivative instruments. |
For tax purposes, net realized capital losses may be carried over to offset future capital gains, if any. Funds are permitted to carry forward capital losses for an indefinite period, and such losses will retain their character as either short-term or long-term capital losses. As of December 31, 2018, the Fund did not have any capital loss carryforwards.
During the current fiscal year, permanent differences primarily due to the tax treatment of offering costs resulted in a net decrease in accumulated loss and a net decrease in additional paid-in capital. These reclassifications had no effect on net assets.
| | |
| |
| 36 | AB FLEXFEE INTERNATIONAL STRATEGIC CORE PORTFOLIO | | abfunds.com |
NOTES TO FINANCIAL STATEMENTS(continued)
NOTE G
Recent Accounting Pronouncements
In August 2018, the Financial Accounting Standards Board issued an Accounting Standards Update, ASU2018-13, Fair Value Measurement (Topic 820), Disclosure Framework-Changes to the Disclosure Requirements for Fair Value Measurement which removes, modifies and adds disclosures to Topic 820. The amendments in this ASU2018-13 apply to all entities that are required, under existing U.S. GAAP, to make disclosures about recurring or nonrecurring fair value measurements. The amendments in this ASU2018-13 are effective for all entities for fiscal years, and interim periods within those fiscal years, beginning after December 15, 2019. At this time, management is evaluating the implications of these changes on the financial statements.
In October 2018, the U.S. Securities and Exchange Commission adopted amendments to certain disclosure requirements included in RegulationS-X that had become “redundant, duplicative, overlapping, outdated or superseded, in light of the other Commission disclosure requirements, GAAP or changes in the information environment.” The compliance date for the amendments to RegulationS-X was November 5, 2018 (for reporting period end dates of September 30, 2018 or after). Management has adopted the amendments which simplified certain disclosure requirements on the financial statements.
NOTE H
Subsequent Events
Management has evaluated subsequent events for possible recognition or disclosure in the financial statements through the date the financial statements are issued. Management has determined that there are no material events that would require disclosure in the Fund’s financial statements through this date.
| | |
| |
| abfunds.com | | AB FLEXFEE INTERNATIONAL STRATEGIC CORE PORTFOLIO | 37 |
FINANCIAL HIGHLIGHTS
Selected Data For A Share Of Beneficial Interest Outstanding Throughout Each Period
| | | | | | | | |
| | | Advisor Class | |
| | | Year Ended
December 31,
2018 | | | June 28,
2017(a) to
December 31,
2017 | |
| | | | |
Net asset value, beginning of period | | | $ 10.70 | | | | $ 10.00 | |
| | | | |
Income From Investment Operations | | | | | | | | |
| | |
Net investment income(b)(c) | | | .16 | | | | .09 | |
| | |
Net realized and unrealized gain (loss) on investment and foreign currency transactions | | | (1.13 | ) | | | .70 | |
| | | | |
Net increase (decrease) in net asset value from operations | | | (.97 | ) | | | .79 | |
| | | | |
Less: Dividends and Distributions | | | | | | | | |
| | |
Dividends from net investment income | | | (.14 | ) | | | (.08 | ) |
| | |
Distributions from net realized gain on investment and foreign currency transactions | | | (.10 | ) | | | (.01 | ) |
| | | | |
Total dividends and distributions | | | (.24 | ) | | | (.09 | ) |
| | | | |
Net asset value, end of period | | | $ 9.49 | | | | $ 10.70 | |
| | | | |
| | |
Total Return | | | | | | | | |
| | |
Total investment return based on net asset value(d) | | | (9.08 | )% | | | 7.86 | % |
| | |
Ratios/Supplemental Data | | | | | | | | |
| | |
Net assets, end of period (000’s omitted) | | | $2,917 | | | | $3,209 | |
| | |
Ratio to average net assets of: | | | | | | | | |
| | |
Expenses, net of waivers/reimbursements† | | | 1.49 | %(f) | | | .15 | %(e) |
| | |
Expenses, before waivers/reimbursements† | | | 13.45 | %(f) | | | 14.14 | %(e) |
| | |
Net investment income(c) | | | 1.49 | % | | | 1.70 | %(e) |
| | |
Portfolio turnover rate | | | 80 | % | | | 29 | % |
| | | | | | | | |
| |
† Expense ratios exclude the estimated acquired fund fees of affiliated/unaffiliated underlying | |
portfolios | | | .01 | % | | | .01 | % |
| (a) | Commencement of operations. |
| (b) | Based on average shares outstanding. |
| (c) | Net of expenses waived/reimbursed by the Adviser. |
| (d) | Total investment return is calculated assuming an initial investment made at the net asset value at the beginning of the period, reinvestment of all dividends and distributions at net asset value during the period, and redemption on the last day of the period. Total investment return does not reflect the deduction of taxes that a shareholder would pay on fund distributions or the redemption of fund shares. Total investment return for a period of less than one year is not annualized. |
| (f) | The advisory fee reflected in the Fund’s expense ratio may be higher or lower than the Base Fee plus Performance Adjustment due to the different time periods over which the fee is calculated (i.e., the financial reporting period vs. the Performance Period). |
See notes to financial statements.
| | |
| |
| 38 | AB FLEXFEE INTERNATIONAL STRATEGIC CORE PORTFOLIO | | abfunds.com |
REPORT OF INDEPENDENT REGISTERED
PUBLIC ACCOUNTING FIRM
To the Shareholders and the Board of Directors of
AB FlexFee International Strategic Core Portfolio:
Opinion on the Financial Statements
We have audited the accompanying statement of assets and liabilities of AB FlexFee International Strategic Core Portfolio (the “Fund”) (one of the portfolios constituting AB Cap Fund, Inc. (the “Company”)), including the portfolio of investments, as of December 31, 2018, and the related statement of operations for the year then ended, the statements of changes in net assets and the financial highlights for the year then ended and the period June 28, 2017 (commencement of operations) to December 31, 2017 and the related notes (collectively referred to as the “financial statements”). In our opinion, the financial statements present fairly, in all material respects, the financial position of the Fund (one of the portfolios constituting AB Cap Fund, Inc.) at December 31, 2018, the results of its operations for the year then ended, and the changes in its net assets and its financial highlights for the year then ended and the period June 28, 2017 (commencement of operations) to December 31, 2017, in conformity with U.S. generally accepted accounting principles.
Basis for Opinion
These financial statements are the responsibility of the Company’s management. Our responsibility is to express an opinion on the Fund’s financial statements based on our audits. We are a public accounting firm registered with the Public Company Accounting Oversight Board (United States) (“PCAOB”) and are required to be independent with respect to the Company in accordance with the U.S. federal securities laws and the applicable rules and regulations of the Securities and Exchange Commission and the PCAOB.
We conducted our audits in accordance with the standards of the PCAOB. Those standards require that we plan and perform the audit to obtain reasonable assurance about whether the financial statements are free of material misstatement, whether due to error or fraud. The Company is not required to have, nor were we engaged to perform, an audit of the Company’s internal control over financial reporting. As part of our audits, we are required to obtain an understanding of internal control over financial reporting, but not for the purpose of expressing an opinion on the effectiveness of the Company’s internal control over financial reporting. Accordingly, we express no such opinion.
Our audits included performing procedures to assess the risks of material misstatement of the financial statements, whether due to error or fraud, and performing procedures that respond to those risks. Such procedures included examining, on a test basis, evidence regarding the amounts and
| | |
| |
| abfunds.com | | AB FLEXFEE INTERNATIONAL STRATEGIC CORE PORTFOLIO | 39 |
REPORT OF INDEPENDENT REGISTERED
PUBLIC ACCOUNTING FIRM(continued)
disclosures in the financial statements. Our procedures included confirmation of securities owned as of December 31, 2018, by correspondence with the custodian and others or by other appropriate auditing procedures where replies from others were not received. Our audits also included evaluating the accounting principles used and significant estimates made by management, as well as evaluating the overall presentation of the financial statements. We believe that our audits provide a reasonable basis for our opinion.

We have served as the auditor of one or more of the AB investment companies since 1968.
New York, New York
February 26, 2019
| | |
| |
| 40 | AB FLEXFEE INTERNATIONAL STRATEGIC CORE PORTFOLIO | | abfunds.com |
2018 FEDERAL TAX INFORMATION
(unaudited)
For Federal income tax purposes, the following information is furnished with respect to the distributions paid by the Fund for the calendar year ended December 31, 2018. For corporate shareholders, 1.79% of dividends paid qualify for the dividends received deduction.
For individual shareholders, the Fund designates 100% of dividends paid as qualified dividend income.
| | |
| |
| abfunds.com | | AB FLEXFEE INTERNATIONAL STRATEGIC CORE PORTFOLIO | 41 |
RESULTS OF STOCKHOLDER MEETING
(unaudited)
A Special Meeting of Stockholders of the AB Cap Fund, Inc. (the “Company”)—AB FlexFee International Strategic Core Portfolio (the “Fund”) was held on October 11, 2018. A description of the proposals and number of shares voted at the Meeting are as follows (the proposal number shown below corresponds to the proposal number in the Fund’s proxy statement):
| 1. | To approve and vote upon the election of Directors for the Company, each such Director to serve for a term of indefinite duration and until his or her successor is duly elected and qualifies. |
| | | | | | | | |
Director: | | Voted
For: | | | Authority
Withheld: | |
Michael J. Downey | | | 153,531,217 | | | | 1,117,868 | |
William H. Foulk, Jr.* | | | 153,385,034 | | | | 1,264,050 | |
Nancy P. Jacklin | | | 153,607,746 | | | | 1,041,339 | |
Robert M. Keith | | | 153,546,025 | | | | 1,103,060 | |
Carol C. McMullen | | | 153,649,415 | | | | 999,670 | |
Gary L. Moody | | | 153,545,113 | | | | 1,103,972 | |
Marshall C. Turner, Jr. | | | 153,507,495 | | | | 1,141,590 | |
Earl D. Weiner | | | 153,514,727 | | | | 1,134,358 | |
| 2. | To vote upon the approval of new advisory agreements for the Fund with AllianceBernstein L.P. |
| | | | | | | | | | | | |
Voted
For: | | Voted
Against: | | | Abstain: | | | Broker
Non-Votes: | |
| 300,000 | | | – 0 | – | | | – 0 | – | | | – 0 | – |
| * | Mr. Foulk retired on December 31, 2018. |
| | |
| |
| 42 | AB FLEXFEE INTERNATIONAL STRATEGIC CORE PORTFOLIO | | abfunds.com |
BOARD OF DIRECTORS
| | |
Marshall C. Turner, Jr(1), Chairman Michael J. Downey(1) Nancy P. Jacklin(1) Robert M. Keith,President and Chief Executive Officer | | Carol C. McMullen(1) Garry L. Moody(1) Earl D. Weiner(1) |
|
|
|
|
OFFICERS
| | |
Kent W. Hargis(2),Vice President Sammy Suzuki(2),Vice President Emilie D. Wrapp,Secretary Michael B. Reyes,Senior Analyst | | Joseph J. Mantineo,Treasurer and Chief Financial Officer Phyllis J. Clarke,Controller Vincent S. Noto,Chief Compliance Officer |
| | |
Custodian and Accounting Agent Brown Brothers Harriman & Co. 50 Post Office Square
Boston, MA 02110 Principal Underwriter AllianceBernstein Investments, Inc.
1345 Avenue of the Americas
New York, NY 10105 Transfer Agent AllianceBernstein Investor Services, Inc. P.O. Box 786003
San Antonio, TX78278-6003
Toll-Free (800)221-6003 | | Independent Registered Public Accounting Firm Ernst & Young LLP
5 Times Square
New York, NY 10036 Legal Counsel Seward & Kissel LLP
One Battery Park Plaza
New York, NY 10004 |
|
|
|
|
|
|
|
|
|
|
|
|
| 1 | Member of the Audit Committee, the Governance and Nominating Committee and the Independent Directors Committee. |
| 2 | Theday-to-day management of, and investment decisions for, the portfolio is made by the Adviser. Messrs. Hargis and Suzuki are the investment professionals with the most significant responsibility for theday-to-day management of the Fund’s portfolio. |
| | |
| |
| abfunds.com | | AB FLEXFEE INTERNATIONAL STRATEGIC CORE PORTFOLIO | 43 |
MANAGEMENT OF THE FUND
Board of Directors Information
The business and affairs of the Fund are managed under the direction of the Board of Directors. Certain information concerning the Fund’s Directors is set forth below.
| | | | | | | | |
NAME,
ADDRESS*, AGE,
(YEAR FIRST ELECTED**) | | PRINCIPAL
OCCUPATION(S)
DURING PAST FIVE YEARS
AND OTHER INFORMATION*** | | PORTFOLIOS
IN AB FUNDS
COMPLEX
OVERSEEN BY
DIRECTOR | | | OTHER PUBLIC
COMPANY
DIRECTORSHIPS
CURRENTLY HELD
BY DIRECTOR |
| INTERESTED DIRECTOR | | | | | | |
| | | |
Robert M. Keith,# 1345 Avenue of the Americas New York, NY 10105 58 (2015) | | Senior Vice President of AllianceBernstein L.P. (the “Adviser”) and the head of AllianceBernstein Investments, Inc. (“ABI”) since July 2008; Director of ABI and President of the AB Mutual Funds. Previously, he served as Executive Managing Director of ABI from December 2006 to June 2008. Prior to joining ABI in 2006, Executive Managing Director of Bernstein Global Wealth Management, and prior thereto, Senior Managing Director and Global Head of Client Service and Sales of the Adviser’s institutional investment management business since 2004. Prior thereto, he was Managing Director and Head of North American Client Service and Sales in the Adviser’s institutional investment management business, with which he had been associated since prior to 2004. | | | 95 | | | None |
| | | | | | | | |
| | |
| |
| 44 | AB FLEXFEE INTERNATIONAL STRATEGIC CORE PORTFOLIO | | abfunds.com |
MANAGEMENT OF THE FUND(continued)
| | | | | | | | |
NAME,
ADDRESS*, AGE,
(YEAR FIRST ELECTED**) | | PRINCIPAL
OCCUPATION(S)
DURING PAST FIVE YEARS
AND OTHER INFORMATION*** | | PORTFOLIOS
IN AB FUNDS
COMPLEX
OVERSEEN BY
DIRECTOR | | | OTHER PUBLIC
COMPANY
DIRECTORSHIPS
CURRENTLY HELD
BY DIRECTOR |
DISINTERESTED DIRECTORS
| | | | | | |
| | | |
Marshall C. Turner, Jr.,## Chairman of the Board 77 (2015) | | Private Investor since prior to 2014. Former Chairman and CEO of Dupont Photomasks, Inc. (components of semi-conductor manufacturing). He has extensive operating leadership, and venture capital investing experience, including five interim or full-time CEO roles, and prior service as general partner of institutional venture capital partnerships. He also has extensive non-profit board leadership experience, and currently serves on the boards of two education and science-related non-profit organizations. He has served as a director of one AB Fund since 1992, and director or trustee of multiple AB funds since 2005. He has been Chairman of the AB Funds since January 2014, and the Chairman of the Independent Directors Committees of such AB Funds since February 2014. | | | 95 | | | Xilinx, Inc. (programmable logicsemi-conductors) since 2007 |
| | | | | | | | |
| | | |
Michael J. Downey,## 75 (2015) | | Private Investor since prior to 2014. Formerly, managing partner of Lexington Capital, LLC (investment advisory firm) from December 1997 until December 2003. He also served as a Director of Prospect Acquisition Corp. (financial services) from 2007 until 2009. From 1987 until 1993, Chairman and CEO of Prudential Mutual Fund Management, director of the Prudential mutual funds, and member of the Executive Committee of Prudential Securities Inc. He has served as a director or trustee of the AB Funds since 2005 and is a director and Chairman of one other registered investment company. | | | 95 | | | The Asia Pacific Fund, Inc. (registered investment company) since prior to 2014 |
| | |
| |
| abfunds.com | | AB FLEXFEE INTERNATIONAL STRATEGIC CORE PORTFOLIO | 45 |
MANAGEMENT OF THE FUND(continued)
| | | | | | | | |
NAME,
ADDRESS*, AGE,
(YEAR FIRST ELECTED**) | | PRINCIPAL
OCCUPATION(S)
DURING PAST FIVE YEARS
AND OTHER INFORMATION*** | | PORTFOLIOS
IN AB FUNDS
COMPLEX
OVERSEEN BY
DIRECTOR | | | OTHER PUBLIC
COMPANY
DIRECTORSHIPS
CURRENTLY HELD
BY DIRECTOR |
DISINTERESTED DIRECTORS
(continued) | | | | | | |
| | | |
Nancy P. Jacklin,## 70 (2015) | | Private Investor since prior to 2014. Professorial Lecturer at the Johns Hopkins School of Advanced International Studies (2008-2015). U.S. Executive Director of the International Monetary Fund (which is responsible for ensuring the stability of the international monetary system), (December 2002-May 2006); Partner, Clifford Chance (1992-2002); Sector Counsel, International Banking and Finance, and Associate General Counsel, Citicorp (1985-1992); Assistant General Counsel (International), Federal Reserve Board of Governors (1982-1985); and Attorney Advisor, U.S. Department of the Treasury (1973-1982). Member of the Bar of the District of Columbia and of New York; and member of the Council on Foreign Relations. She has served as a director or trustee of the AB Funds since 2006 and has been Chair of the Governance and Nominating Committees of the AB Funds since August 2014. | | | 95 | | | None |
| | |
| |
| 46 | AB FLEXFEE INTERNATIONAL STRATEGIC CORE PORTFOLIO | | abfunds.com |
MANAGEMENT OF THE FUND(continued)
| | | | | | | | |
NAME,
ADDRESS*, AGE,
(YEAR FIRST ELECTED**) | | PRINCIPAL
OCCUPATION(S)
DURING PAST FIVE YEARS
AND OTHER INFORMATION*** | | PORTFOLIOS
IN AB FUNDS
COMPLEX
OVERSEEN BY
DIRECTOR | | | OTHER PUBLIC
COMPANY
DIRECTORSHIPS
CURRENTLY HELD
BY DIRECTOR |
DISINTERESTED DIRECTORS
(continued) | | | | | | |
| | | |
Carol C. McMullen,## 63 (2016) | | Managing Director of Slalom Consulting (consulting) since 2014 and private investor and member of the Partners Healthcare Investment Committee. Formerly, Director of Norfolk & Dedham Group (mutual property and casualty insurance) from 2011 until November 2016; Director of Partners Community Physicians Organization (healthcare) from 2014 until December 2016; and Managing Director of The Crossland Group (consulting) from 2012 until 2013. She has held a number of senior positions in the asset and wealth management industries, including at Eastern Bank (where her roles included President of Eastern Wealth Management), Thomson Financial (Global Head of Sales for Investment Management), and Putnam Investments (where her roles included Head of Global Investment Research). She has served on a number of private company and non-profit boards, and as a director or trustee of the AB Funds since June 2016. | | | 95 | | | None |
| | | | | | | | |
| | |
| |
| abfunds.com | | AB FLEXFEE INTERNATIONAL STRATEGIC CORE PORTFOLIO | 47 |
MANAGEMENT OF THE FUND(continued)
| | | | | | | | |
NAME,
ADDRESS*, AGE,
(YEAR FIRST ELECTED**) | | PRINCIPAL
OCCUPATION(S)
DURING PAST FIVE YEARS
AND OTHER INFORMATION*** | | PORTFOLIOS
IN AB FUNDS
COMPLEX
OVERSEEN BY
DIRECTOR | | | OTHER PUBLIC
COMPANY
DIRECTORSHIPS
CURRENTLY HELD
BY DIRECTOR |
DISINTERESTED DIRECTORS
(continued) | | | | | | |
| | | |
Garry L. Moody,## 66 (2015) | | Independent Consultant. Formerly, Partner, Deloitte & Touche LLP (1995-2008) where he held a number of senior positions, including Vice Chairman, and U.S. and Global Investment Management Practice Managing Partner; President, Fidelity Accounting and Custody Services Company (1993-1995), where he was responsible for the accounting, pricing, custody and reporting for the Fidelity mutual funds; and Partner, Ernst & Young LLP (1975-1993), where he served as the National Director of Mutual Fund Tax Services and Managing Partner of its Chicago Office Tax department. He is a member of the Trustee Advisory Board of BoardIQ, a biweekly publication focused on issues and news affecting directors of mutual funds. He has served as a director or trustee and as Chairman of the Audit Committees of the AB Funds since 2008. | | | 95 | | | None |
| | | | | | | | |
| | | |
Earl D. Weiner,## 79 (2015) | | Of Counsel, and Partner prior to January 2007, of the law firm Sullivan & Cromwell LLP and is a former member of the ABA Federal Regulation of Securities Committee Task Force to draft editions of the Fund Director’s Guidebook. He also serves as a director or trustee of various non-profit organizations and has served as Chairman or Vice Chairman of a number of them. He has served as a director or trustee of the AB Funds since 2007 and served as Chairman of the Governance and Nominating Committees of the AB Funds from 2007 until August 2014. | | | 95 | | | None |
| | |
| |
| 48 | AB FLEXFEE INTERNATIONAL STRATEGIC CORE PORTFOLIO | | abfunds.com |
MANAGEMENT OF THE FUND(continued)
| * | The address for each of the Fund’s disinterested Directors is c/o AllianceBernstein L.P., Attention: Legal & Compliance Department—Mutual Fund Legal, 1345 Avenue of the Americas, New York, NY 10105. |
| ** | There is no stated term of office for the Fund’s Directors. |
| *** | The information above includes each Director’s principal occupation during the last five years and other information relating to the experience, attributes and skills relevant to each Director’s qualifications to serve as a Director, which led to the conclusion that each Director should serve as a Director for the Fund. |
| # | Mr. Keith is an “interested person” of the Fund, as defined in the 1940 Act, due to his position as a Senior Vice President of the Adviser. |
| ## | Member of the Audit Committee, the Governance and Nominating Committee and the Independent Directors Committee. |
| | |
| |
| abfunds.com | | AB FLEXFEE INTERNATIONAL STRATEGIC CORE PORTFOLIO | 49 |
MANAGEMENT OF THE FUND(continued)
Officer Information
| | | | |
NAME, ADDRESS*
AND AGE | | POSITION(S)
HELD WITH FUND | | PRINCIPAL OCCUPATION
DURING PAST 5 YEARS |
Robert M. Keith, 58 | | President and Chief Executive Officer | | See biography above. |
| | | | |
Kent W. Hargis, 50 | | Vice President | | Senior Vice President of the Adviser**, with which he has been associated since prior to 2014. |
| | | | |
Sammy Suzuki, 48 | | Vice President | | Senior Vice President of the Adviser**, with which he has been associated since prior to 2014. |
| | | | |
Emilie D. Wrapp, 63 | | Secretary | | Senior Vice President, Assistant General Counsel and Assistant Secretary of ABI**, with which she has been associated since prior to 2014. |
| | | | |
Michael B. Reyes 42 | | Senior Analyst | | Vice President of the Adviser,** with which he has been associated since prior to 2014. |
| | | | |
Joseph J. Mantineo, 59 | | Treasurer and Chief Financial Officer | | Senior Vice President of AllianceBernstein Investor Services (“ABIS”)**, with which he has been associated since prior to 2014. |
| | | | |
Phyllis J. Clarke, 58 | | Controller | | Vice President of ABIS**, with which she has been associated since prior to 2014. |
| | | | |
Vince S. Noto, 54 | | Chief Compliance Officer | | Senior Vice President since 2015 and Mutual Fund Chief Compliance Officer of the Adviser** since 2014. Prior thereto, he was Vice President and Director of Mutual Fund Compliance of the Adviser** since 2014. |
| * | The address for each of the Fund’s Officers is 1345 Avenue of the Americas, New York, NY 10105. |
| ** | The Adviser, ABI and ABIS are affiliates of the Fund. |
The Fund’s Statement of Additional Information (“SAI”) has additional information about the Fund’s Directors and Officers and is available without charge upon request. Contact your financial representative or AB at(800) 227-4618, or visit www.abfunds.com, for a free prospectus or SAI.
| | |
| |
| 50 | AB FLEXFEE INTERNATIONAL STRATEGIC CORE PORTFOLIO | | abfunds.com |
Information Regarding the Review and Approval of the Fund’s Advisory Agreement
As described in more detail in the Proxy Statement for the AB Funds dated August 20, 2018, the Boards of the AB Funds, at a meeting held onJuly 31-August 2, 2018, approved new advisory agreements with the Adviser (the “Proposed Agreements”) for the AB Funds, including AB Cap Fund, Inc. in respect of AB FlexFeeTM International Strategic Core Portfolio (the “Fund”), in connection with the planned disposition by AXA S.A. of its remaining shares of AXA Equitable Holdings, Inc. (the indirect holder of a majority of the partnership interests in the Adviser and the indirect parent of AllianceBernstein Corporation, the general partner of the Adviser) in one or more transactions and the related potential for one or more “assignments” (within the meaning of section 2(a)(4) of the Investment Company Act) of the advisory agreements for the AB Funds, including the Fund’s Advisory Agreement, resulting in the automatic termination of such advisory agreements.
At the same meeting, the AB Boards also considered and approved interim advisory agreements with the Adviser (the “Interim Advisory Agreements”) for the AB Funds, including the Fund, to be effective only in the event that stockholder approval of a Proposed Agreement had not been obtained as of the date of one or more transactions resulting in an “assignment” of the Adviser’s advisory agreements, resulting in the automatic termination of such advisory agreements.
The shareholders of the Fund subsequently approved the Proposed Agreements at an annual meeting of shareholders called for the purpose of electing Directors and voting on the Proposed Agreements.
A discussion regarding the basis for the Boards’ approvals at a meeting held onJuly 31-August 2, 2018 is set forth below.
Information Regarding the Review and Approval of the Fund’s Proposed New Advisory Agreement and Interim Advisory Agreement in the Context of Potential Assignments
At a meeting of the AB Boards held on July31-August 2, 2018, the Adviser presented its recommendation that the Boards consider and approve the Proposed Agreements. Section 15(c) of the 1940 Act provides that, after an initial period, a Fund’s Current Agreement and currentsub-advisory agreement, as applicable, will remain in effect only if the Board, including a majority of the Independent Directors, annually reviews and approves them. Each of the Current Agreements had been approved by a Board within theone-year period prior to approval of its related Proposed Agreement, except that the Current Agreements for certain FlexFee funds were approved in February 2017. In connection with their approval of the Proposed Agreements, the Boards considered their conclusions in connection with their most recent approvals of the Current Agreements, in particular in cases where the last approval of a Current Agreement was relatively recent, including the Boards’ general satisfaction with the nature
| | |
| |
| abfunds.com | | AB FLEXFEE INTERNATIONAL STRATEGIC CORE PORTFOLIO | 51 |
and quality of services being provided and, as applicable, in the case of certain Funds, actions taken or to be taken in an effort to improve investment performance or reduce expense ratios. The Directors also reviewed updated information provided by the Adviser in respect of each Fund. Also in connection with their approval of the Proposed Agreements, the Boards considered a representation made to them at that time by the Adviser that there were no additional developments not already disclosed to the Boards since their most recent approvals of the Current Agreements that would be a material consideration to the Boards in connection with their consideration of the Proposed Agreements, except for matters disclosed to the Boards by the Adviser. The Directors considered the fact that each Proposed Agreement would have corresponding terms and conditions identical to those of the corresponding Current Agreement with the exception of the effective date and initial term under the Proposed Agreement.
The Directors considered their knowledge of the nature and quality of the services provided by the Adviser to each Fund gained from their experience as directors or trustees of registered investment companies advised by the Adviser, their overall confidence in the Adviser’s integrity and competence they have gained from that experience, the Adviser’s initiative in identifying and raising potential issues with the Directors and its responsiveness, frankness and attention to concerns raised by the Directors in the past, including the Adviser’s willingness to consider and implement organizational and operational changes designed to improve investment results and the services provided to the Funds. The Directors noted that they have four regular meetings each year, at each of which they review extensive materials and information from the Adviser, including information on the investment performance of each Fund.
The Directors also considered all factors they believed relevant, including the specific matters discussed below. During the course of their deliberations, the Directors evaluated, among other things, the reasonableness of the management fees of the Funds they oversee. The Directors did not identify any particular information that wasall-important or controlling, and different Directors may have attributed different weights to the various factors. The Directors determined that the selection of the Adviser to manage the Funds, and the overall arrangements between the Funds and the Adviser, as provided in the Proposed Agreements, including the management fees, were fair and reasonable in light of the services performed under the Current Agreements and to be performed under the Proposed Agreements, expenses incurred and to be incurred and such other matters as the Directors considered relevant in the exercise of their business judgment. The material factors and conclusions that formed the basis for the Directors’ determinations included the following:
Nature, Extent and Quality of Services Provided
The Directors considered the scope and quality of services to be provided by the Adviser under the Proposed Agreements, including the quality of
| | |
| |
| 52 | AB FLEXFEE INTERNATIONAL STRATEGIC CORE PORTFOLIO | | abfunds.com |
the investment research capabilities of the Adviser and the other resources it has dedicated to performing services for the Funds. They also considered the information that had been provided to them by the Adviser concerning the anticipated implementation of the Plan and the Adviser’s representation that it did not anticipate that such implementation would affect the management or structure of the Adviser, have a material adverse effect on the Adviser, or adversely affect the quality of the services provided to the Funds by the Adviser and its affiliates. The Directors noted that the Adviser from time to time reviews each Fund’s investment strategies and from time to time proposes changes intended to improve the Fund’s relative or absolute performance for the Directors’ consideration. They also noted the professional experience and qualifications of each Fund’s portfolio management team and other senior personnel of the Adviser. The Directors also considered that certain Proposed Agreements, similar to the corresponding Current Agreements, provide that the Funds will reimburse the Adviser for the cost to it of providing certain clerical, accounting, administrative and other services to the Funds by employees of the Adviser or its affiliates. Requests for these reimbursements are made on a quarterly basis and subject to approval by the Directors. The Directors noted that the Adviser did not request any reimbursements from certain Funds in the Fund’s latest fiscal year reviewed. The Directors noted that the methodology to be used to determine the reimbursement amounts had been reviewed by an independent consultant retained by the Funds’ former Senior Officer/Independent Compliance Officer. The quality of administrative and other services, including the Adviser’s role in coordinating the activities of the Funds’ other service providers, also was considered. The Directors of each Fund concluded that, overall, they were satisfied with the nature, extent and quality of services to be provided to the Funds under the Proposed Agreement for the Fund.
Costs of Services to be Provided and Profitability
The Directors reviewed a schedule of the revenues and expenses and related notes indicating the profitability of each Fund to the Adviser for calendar years 2016 and 2017, as applicable, that had been prepared with an expense allocation methodology arrived at in consultation with an independent consultant retained by the Funds’ former Senior Officer/Independent Compliance Officer. The Directors noted the assumptions and methods of allocation used by the Adviser in preparing fund-specific profitability data and understood that there are a number of potentially acceptable allocation methodologies for information of this type. The Directors noted that the profitability information reflected all revenues and expenses of the Adviser’s relationship with a Fund, including those relating to its subsidiaries that provide transfer agency, distribution and brokerage services to the Fund, as applicable. The Directors recognized that it is difficult to make comparisons of the profitability of the Proposed Agreements with the profitability of fund advisory contracts for unaffiliated funds because comparative information is not generally publicly available and is
| | |
| |
| abfunds.com | | AB FLEXFEE INTERNATIONAL STRATEGIC CORE PORTFOLIO | 53 |
affected by numerous factors. The Directors focused on the profitability of the Adviser’s relationship with each Fund before taxes and distribution expenses, as applicable. The Directors noted that certain Funds were not profitable to the Adviser in one or more periods reviewed. The Directors concluded that the Adviser’s level of profitability from its relationship with the other Funds was not unreasonable. The Directors were unable to consider historical information about the profitability of certain Funds that had recently commenced operations and for which historical profitability information was not available. The Adviser agreed to provide the Directors with profitability information in connection with future proposed continuances of the Proposed Agreements.
Fall-Out Benefits
The Directors considered the other benefits to the Adviser and its affiliates from their relationships with the Funds, including, but not limited to, as applicable, benefits relating to soft dollar arrangements (whereby investment advisers receive brokerage and research services from brokers that execute agency transactions for their clients) in the case of certain Funds;12b-1 fees and sales charges received by the principal underwriter (which is a wholly owned subsidiary of the Adviser) in respect of certain classes of the shares of most of the Funds; brokerage commissions paid by certain Funds to brokers affiliated with the Adviser; and transfer agency fees paid by most of the Funds to a wholly owned subsidiary of the Adviser. The Directors recognized that the Adviser’s profitability would be somewhat lower, and that a Fund’s unprofitability to the Adviser would be exacerbated, without these benefits. The Directors understood that the Adviser also might derive reputational and other benefits from its association with the Funds.
Investment Results
In addition to the information reviewed by the Directors in connection with the Board meeting at which the Proposed Agreements were approved, the Directors receive detailed performance information for the Funds at each regular Board meeting during the year.
The Boards’ consideration of each Proposed Agreement was informed by their most recent approval of the related Current Agreement, and, in the case of certain Funds, their discussion with the Adviser of the reasons for those Funds’ underperformance in certain periods. The Directors also reviewed updated performance information and, in some cases, discussed with the Adviser the reasons for changes in performance or continued underperformance. On the basis of this review, the Directors concluded that each Fund’s investment performance was acceptable.
Management Fees and Other Expenses
The Directors considered the management fee rate payable by each Fund to the Adviser and information prepared by an independent service provider
| | |
| |
| 54 | AB FLEXFEE INTERNATIONAL STRATEGIC CORE PORTFOLIO | | abfunds.com |
(the “15(c) provider”) concerning management fee rates payable by other funds in the same category as the Fund. The Directors recognized that it is difficult to make comparisons of management fees because there are variations in the services that are included in the fees paid by other funds. The Directors compared each Fund’s contractual management fee rate with a peer group median, and where applicable, took into account the impact on the management fee rate of the administrative expense reimbursement paid to the Adviser in the latest fiscal year. In the case of the ACS Funds, the Directors noted that the management fee rate is zero but also were cognizant that the Adviser is indirectly compensated by the wrap fee program sponsors that use the ACS Funds as an investment vehicle for their clients.
The Directors also considered the Adviser’s fee schedule for other clients pursuing a similar investment style to each Fund. For this purpose, they reviewed the relevant advisory fee information from the Adviser’s Form ADV and in a report from the Funds’ Senior Analyst and noted the differences between a Fund’s fee schedule, on the one hand, and the Adviser’s institutional fee schedule and the schedule of fees charged by the Adviser to any offshore funds and for services to anysub-advised funds pursuing a similar investment strategy as the Fund, on the other, as applicable. The Directors noted that the Adviser may, in some cases, agree to fee rates with large institutional clients that are lower than those reviewed by the Directors and that they had previously discussed with the Adviser its policies in respect of such arrangements. The Adviser also informed the Directors that, in the case of certain Funds, there were no institutional products managed by the Adviser that have a substantially similar investment style. The Directors also discussed these matters with their independent fee consultant.
The Adviser reviewed with the Directors the significantly greater scope of the services it provides to each Fund relative to institutional, offshore fund andsub-advised fund clients, as applicable. In this regard, the Adviser noted, among other things, that, compared to institutional and offshore orsub-advisory accounts, each Fund, as applicable, (i) demands considerably more portfolio management, research and trading resources due to significantly higher daily cash flows (in the case ofopen-end Funds); (ii) has more tax and regulatory restrictions and compliance obligations; (iii) must prepare and file or distribute regulatory and other communications about fund operations; and (iv) must provide shareholder servicing to retail investors. The Adviser also reviewed the greater legal risks presented by the large and changing population of Fund shareholders who may assert claims against the Adviser in individual or class actions, and the greater entrepreneurial risk in offering new fund products, which require substantial investment to launch, may not succeed, and generally must be priced to compete with larger, more established funds resulting in lack of profitability to the Adviser until a new fund achieves scale. In light of the substantial differences in services rendered by the Adviser to institutional,
| | |
| |
| abfunds.com | | AB FLEXFEE INTERNATIONAL STRATEGIC CORE PORTFOLIO | 55 |
offshore fund andsub-advised fund clients as compared to the Funds, and the different risk profile, the Directors considered these fee comparisons inapt and did not place significant weight on them in their deliberations.
The Directors noted that many of the Funds may invest in shares of exchange-traded funds (“ETFs”), subject to the restrictions and limitations of the 1940 Act as these may be varied as a result of exemptive orders issued by the SEC. The Directors also noted that ETFs pay advisory fees pursuant to their advisory contracts. The Directors concluded, based on the Adviser’s explanation of how it uses ETFs when they are the most cost-effective way to obtain desired exposures, in some cases pending purchases of underlying securities, that each Fund’s management fee would be for services that would be in addition to, rather than duplicative of, the services provided under the advisory contracts of the ETFs.
With respect to each Fund’s management fee, the Directors considered the total expense ratio of the Fund in comparison to a peer group and peer universe selected by the 15(c) service provider. The Directors also considered the Adviser’s expense caps for certain Funds. The Directors view expense ratio information as relevant to their evaluation of the Adviser’s services because the Adviser is responsible for coordinating services provided to a Fund by others.
The Boards’ consideration of each Proposed Agreement was informed by their most recent approval of the related Current Agreement, and, in the case of certain Funds, their discussion with the Adviser of the reasons for those Funds’ expense ratios in certain periods. The Directors also reviewed updated expense ratio information and, in some cases, discussed with the Adviser the reasons for the expense ratios of certain Funds. On the basis of this review, the Directors concluded that each Fund’s expense ratio was acceptable.
The Directors did not consider comparative expense information for the ACS Funds because those Funds do not bear ordinary expenses.
Economies of Scale
The Directors noted that the management fee schedules for certain Funds do not contain breakpoints and that they had discussed their strong preference for breakpoints in advisory contracts with the Adviser. The Directors took into consideration prior presentations by an independent consultant on economies of scale in the mutual fund industry and for the Funds, and by the Adviser concerning certain of its views on economies of scale. The Directors also had requested and received from the Adviser certain updates on economies of scale in advance of the Board meeting. The Directors believe that economies of scale may be realized (if at all) by the Adviser across a variety of products and services, and not only in respect of a single fund. The Directors noted that there is no established
| | |
| |
| 56 | AB FLEXFEE INTERNATIONAL STRATEGIC CORE PORTFOLIO | | abfunds.com |
methodology for setting breakpoints that give effect to the fund-specific services provided by a fund’s adviser and to the economies of scale that an adviser may realize in its overall mutual fund business or those components of it which directly or indirectly affect a fund’s operations. The Directors observed that in the mutual fund industry as a whole, as well as among funds similar to each Fund, there is no uniformity or pattern in the fees and asset levels at which breakpoints (if any) apply. The Directors also noted that the advisory agreements for many funds do not have breakpoints at all. The Directors informed the Adviser that they would monitor the asset levels of the Funds without breakpoints and their profitability to the Adviser and anticipated revisiting the question of breakpoints in the future if circumstances warrant doing so.
The Directors did not consider the extent to which fee levels in the Advisory Agreement for the ACS Funds reflect economies of scale because that Advisory Agreement does not provide for any compensation to be paid to the Adviser by the ACS Funds and the expense ratio of each of those Funds is zero.
Interim Advisory Agreements
In approving the Interim Advisory Agreements, the Boards, with the assistance of independent counsel, considered similar factors to those considered in approving the Proposed Agreements. The Interim Advisory Agreements approved by the Boards are identical to the Proposed Agreements, as well as the Current Agreements, in all material respects except for their proposed effective and termination dates and provisions intended to comply with the requirements of the relevant SEC rule, such as provisions requiring escrow of advisory fees. Under the Interim Advisory Agreements, the Adviser would continue to manage a Fund pursuant to an Interim Advisory Agreement until a new advisory agreement was approved by stockholders or until the end of the150-day period, whichever would occur earlier. All fees earned by the Adviser under an Interim Advisory Agreement would be held in escrow pending shareholder approval of the Proposed Agreement. Upon approval of a new advisory agreement by stockholders, the escrowed management fees would be paid to the Adviser, and the Interim Advisory Agreement would terminate.
| | |
| |
| abfunds.com | | AB FLEXFEE INTERNATIONAL STRATEGIC CORE PORTFOLIO | 57 |
This page is not part of the Shareholder Report or the Financial Statements.
AB FAMILY OF FUNDS
US EQUITY
US CORE
Core Opportunities Fund
FlexFee™ US Thematic Portfolio
Select US Equity Portfolio
US GROWTH
Concentrated Growth Fund
Discovery Growth Fund
FlexFee™ Large Cap Growth Portfolio
Growth Fund
Large Cap Growth Fund
Small Cap Growth Portfolio
US VALUE
Discovery Value Fund
Equity Income Fund
Relative Value Fund
Small Cap Value Portfolio
Value Fund
INTERNATIONAL/ GLOBAL EQUITY
INTERNATIONAL/ GLOBAL CORE
FlexFee™ International Strategic Core Portfolio
Global Core Equity Portfolio
International Portfolio
International Strategic Core Portfolio
Sustainable Global Thematic Fund
Tax-Managed International Portfolio
Tax-Managed Wealth Appreciation Strategy
Wealth Appreciation Strategy
INTERNATIONAL/ GLOBAL GROWTH
Concentrated International Growth Portfolio
FlexFee™ Emerging Markets Growth Portfolio
INTERNATIONAL/ GLOBAL EQUITY(continued)
Sustainable International Thematic Fund
INTERNATIONAL/ GLOBAL VALUE
All China Equity Portfolio
International Value Fund
FIXED INCOME
MUNICIPAL
High Income Municipal Portfolio
Intermediate California Municipal Portfolio
Intermediate Diversified Municipal Portfolio
Intermediate New York Municipal Portfolio
Municipal Bond Inflation Strategy
Tax-Aware Fixed Income Portfolio
National Portfolio
Arizona Portfolio
California Portfolio
Massachusetts Portfolio
Minnesota Portfolio
New Jersey Portfolio
New York Portfolio
Ohio Portfolio
Pennsylvania Portfolio
Virginia Portfolio
TAXABLE
Bond Inflation Strategy
FlexFee™ High Yield Portfolio1
FlexFee™ International Bond Portfolio
Global Bond Fund
High Income Fund
Income Fund
Intermediate Bond Portfolio
Limited Duration High Income Portfolio
Short Duration Portfolio
ALTERNATIVES
All Market Real Return Portfolio
Global Real Estate Investment Fund
Select US Long/Short Portfolio
Unconstrained Bond Fund
MULTI-ASSET
All Market Income Portfolio
All Market Total Return Portfolio
Conservative Wealth Strategy
Emerging Markets Multi-Asset Portfolio
Global Risk Allocation Fund
Tax-Managed All Market Income Portfolio
TARGET-DATE
Multi-Manager Select Retirement Allocation Fund
Multi-Manager Select 2010 Fund
Multi-Manager Select 2015 Fund
Multi-Manager Select 2020 Fund
Multi-Manager Select 2025 Fund
Multi-Manager Select 2030 Fund
Multi-Manager Select 2035 Fund
Multi-Manager Select 2040 Fund
Multi-Manager Select 2045 Fund
Multi-Manager Select 2050 Fund
Multi-Manager Select 2055 Fund
Multi-Manager Select 2060 Fund
CLOSED-END FUNDS
Alliance California Municipal Income Fund
AllianceBernstein Global High Income Fund
AllianceBernstein National Municipal Income Fund
We also offer Government Money Market Portfolio, which serves as the money market fund exchange vehicle for the AB mutual funds. You could lose money by investing in the Fund. Although the Fund seeks to preserve the value of your investment at $1.00 per share, it cannot guarantee it will do so. The Fund may impose a fee upon sale of your shares or may temporarily suspend your ability to sell shares if the Fund’s liquidity falls below required minimums because of market conditions or other factors. An investment in the Fund is not insured or guaranteed by the Federal Deposit Insurance Corporation or any other government agency. The Fund’s sponsor has no legal obligation to provide financial support to the Fund, and you should not expect that the sponsor will provide financial support to the Fund at any time.
Investors should consider the investment objectives, risks, charges and expenses of the Fund carefully before investing. For copies of our prospectus or summary prospectus, which contain this and other information, visit us online at www.abfunds.com or contact your AB representative. Please read the prospectus and/or summary prospectus carefully before investing.
| 1 | Prior to February 23, 2018, FlexFee High Yield Portfolio was named High Yield Portfolio. |
| | |
| |
| 58 | AB FLEXFEE INTERNATIONAL STRATEGIC CORE PORTFOLIO | | abfunds.com |
NOTES
| | |
| |
| abfunds.com | | AB FLEXFEE INTERNATIONAL STRATEGIC CORE PORTFOLIO | 59 |
NOTES
| | |
| |
| 60 | AB FLEXFEE INTERNATIONAL STRATEGIC CORE PORTFOLIO | | abfunds.com |
AB FLEXFEE INTERNATIONAL STRATEGIC CORE PORTFOLIO
1345 Avenue of the Americas
New York, NY 10105
800 221 5672
FFISCP-0151-1218 
DEC 12.31.18

ANNUAL REPORT
AB FLEXFEETM LARGE CAP GROWTH PORTFOLIO

Beginning January 1, 2021, as permitted by new regulations adopted by the Securities and Exchange Commission, the Fund’s annual and semi-annual shareholder reports will no longer be sent by mail, unless you specifically request paper copies of the reports. Instead, the reports will be made available on a website, and you will be notified by mail each time a report is posted and provided with a website address to access the report.
If you already elected to receive shareholder reports electronically, you will not be affected by this change and you need not take any action. You may elect to receive shareholder reports and other communications from the Fund electronically at any time by contacting your financial intermediary (such as a broker-dealer or bank) or, if you are a direct investor, by calling the Fund at (800) 221 5672.
You may elect to receive all future reports in paper form free of charge. If you invest through a financial intermediary, you can contact your financial intermediary to request that you continue to receive paper copies of your shareholder reports; if you invest directly with the Fund, you can call the Fund at (800) 221 5672. Your election to receive reports in paper form will apply to all funds held in your account with your financial intermediary or, if you invest directly, to all AB Mutual Funds you hold.
| | |
| |
| Investment Products Offered | | • Are Not FDIC Insured• May Lose Value• Are Not Bank Guaranteed |
Investors should consider the investment objectives, risks, charges and expenses of the Fund carefully before investing. For copies of our prospectus or summary prospectus, which contain this and other information, visit us online at www.abfunds.com or contact your AB representative. Please read the prospectus and/or summary prospectus carefully before investing.
This shareholder report must be preceded or accompanied by the Fund’s prospectus for individuals who are not current shareholders of the Fund.
You may obtain a description of the Fund’s proxy voting policies and procedures, and information regarding how the Fund voted proxies relating to portfolio securities during the most recent12-month period ended June 30, without charge. Simply visit AB’s website at www.abfunds.com, or go to the Securities and Exchange Commission’s (the “Commission”) website at www.sec.gov, or call AB at (800) 227 4618.
The Fund files its complete schedule of portfolio holdings with the Commission for the first and third quarters of each fiscal year. The Fund’s portfolio holdings reports are available on the Commission’s website at www.sec.gov. The Fund’s portfolio holdings reports may also be reviewed and copied at the Commission’s Public Reference Room in Washington, DC; information on the operation of the Public Reference Room may be obtained by calling (800) SEC 0330. AB publishes full portfolio holdings for the Fund monthly at www.abfunds.com.
AllianceBernstein Investments, Inc. (ABI) is the distributor of the AB family of mutual funds. ABI is a member of FINRA and is an affiliate of AllianceBernstein L.P., the Adviser of the funds.
The [A/B] logo is a registered service mark of AllianceBernstein and AllianceBernstein® is a registered service mark used by permission of the owner, AllianceBernstein L.P.
| | |
| FROM THE PRESIDENT | |  |
Dear Shareholder,
We are pleased to provide this report for AB FlexFee Large Cap Growth Portfolio (the “Fund”). Please review the discussion of Fund performance, the market conditions during the reporting period and the Fund’s investment strategy.
As always, AB strives to keep clients ahead of what’s next by:
| + | | Transforming uncommon insights into uncommon knowledge with a global research scope |
| + | | Navigating markets with seasoned investment experience and sophisticated solutions |
| + | | Providing thoughtful investment insights and actionable ideas |
Whether you’re an individual investor or a multi-billion-dollar institution, we put knowledge and experience to work for you.
AB’s global research organization connects and collaborates across platforms and teams to deliver impactful insights and innovative products. Better insights lead to better opportunities—anywhere in the world.
For additional information about AB’s range of products and shareholder resources, please log on to www.abfunds.com.
Thank you for your investment in the AB Mutual Funds.
Sincerely,

Robert M. Keith
President and Chief Executive Officer, AB Mutual Funds
| | |
| |
| abfunds.com | | AB FLEXFEE LARGE CAP GROWTH PORTFOLIO | 1 |
ANNUAL REPORT
February 07, 2019
This report provides management’s discussion of fund performance for AB FlexFee Large Cap Growth Portfolio for the annual reporting period ended December 31, 2018.
The Fund’s investment objective is long-term growth of capital.
NAV RETURNS AS OF DECEMBER 31, 2018(unaudited)
| | | | | | | | |
| | |
| | | 6 Months | | | 12 Months | |
| | |
| AB FLEXFEE LARGE CAP GROWTH PORTFOLIO | | | | | | | | |
| | |
| Advisor Class Shares | | | -5.66% | | | | 2.87% | |
| | |
| Russell 1000 Growth Index | | | -8.17% | | | | -1.51% | |
INVESTMENT RESULTS
The table above shows the Fund’s performance compared to its benchmark, the Russell 1000 Growth Index, for thesix- and12-month periods ended December 31, 2018.
The Fund outperformed the benchmark for both periods. The Fund’s performance-based advisory fee for the performance period from June 28, 2017 through December 31, 2018 was accrued at its maximum rate. For both periods, stock selection within the health care and technology sectors contributed, relative to the benchmark, while selection in consumer staples detracted.
During the12-month period, an underweight to the industrials sector contributed, while stock selection and an underweight in consumer discretionary detracted.
During thesix-month period, an overweight to health care contributed. Stock section in communication services and an underweight to real estate detracted.
The Fund did not utilize derivatives during either period.
MARKET REVIEW AND INVESTMENT STRATEGY
Global equities ended 2018 in negative territory, marking one of the worst years for the stock market in a decade. Despite a relatively strong start to the year and US stock indices reaching record highs, volatility spiked toward the end of the 12-month period ended December 31, 2018. Investors worried about the outlook for corporate earnings growth amid a more challenging global growth environment and as the benefits of tax reform roll off. The US Federal Reserve raised rates four times during 2018 as expected, but softened its tone in December, and signaled that it might
| | |
| |
| 2 | AB FLEXFEE LARGE CAP GROWTH PORTFOLIO | | abfunds.com |
slow its pace of rate hikes in 2019. An upsurge in geopolitical uncertainty regarding Brexit and budget discussions between Italy and its European Union partners sparked a flight to quality in the region. Slowing Chinese growth and continuingUS-China trade tensions dampened investor sentiment in China toward the end of the period. In the US, growth stocks outperformed value stocks, in terms of style, andlarge-cap stocks outperformed theirsmall-cap peers.
The Fund’s Senior Investment Management Team (the “Team”) believes that over time, fundamentals and earnings growth can be the most significant catalysts for stock performance, which heightens the importance of active stock selection. The Team selects companies that exhibit attractive growth potential, high or improving return on capital and competitive advantages against their peers. The Team believes that this philosophy can deliver strong investment returns over time.
INVESTMENT POLICIES
The Fund invests primarily in equity securities of a limited number of large, carefully selected, high-quality US companies. The Fund invests primarily in the domestic equity securities of companies selected by the Fund’s Adviser for their growth potential within various market sectors. The Fund emphasizes investments in large, seasoned companies. Under normal circumstances, the Fund will invest at least 80% of its net assets in common stocks of large-capitalization companies.
The Adviser expects that normally the Fund’s portfolio will tend to emphasize investments in securities issued by US companies, although it may invest in foreign securities.
The investment team allocates the Fund’s investments among broad sector groups based on the fundamental company research conducted by the Adviser’s internal research staff, assessing the current and forecasted investment opportunities and conditions, as well as diversification and risk considerations. The investment team may vary the percentage allocations among market sectors and may change the market sectors in which the Fund invests as companies’ potential for growth within a sector matures and new trends for growth emerge.
The Adviser’s research focus is in companies with high sustainable growth prospects, high or improving return on invested capital, transparent business models, and strong and lasting competitive advantages.
The Fund may enter into derivatives transactions, such as options, futures contracts, forwards and swaps. The Fund may use options strategies involving the purchase and/or writing of various combinations of call and/or put options, including on individual securities and
(continued on next page)
| | |
| |
| abfunds.com | | AB FLEXFEE LARGE CAP GROWTH PORTFOLIO | 3 |
stock indices, futures contracts (including futures contracts on individual securities and stock indices) or shares of exchange-traded funds. These transactions may be used, for example, in an effort to earn extra income, to adjust exposure to individual securities or markets, or to protect all or a portion of the Fund’s portfolio from a decline in value, sometimes within certain ranges.
| | |
| |
| 4 | AB FLEXFEE LARGE CAP GROWTH PORTFOLIO | | abfunds.com |
DISCLOSURES AND RISKS
Benchmark Disclosure
The Russell 1000® Growth Index is unmanaged and does not reflect fees and expenses associated with the active management of a mutual fund portfolio. The Russell 1000 Growth Index represents the performance oflarge-cap growth companies within the US. An investor cannot invest directly in an index, and its results are not indicative of the performance for any specific investment, including the Fund.
A Word About Risk
Market Risk: The value of the Fund’s assets will fluctuate as the stock or bond market fluctuates. The value of its investments may decline, sometimes rapidly and unpredictably, simply because of economic changes or other events that affect large portions of the market. It includes the risk that a particular style of investing, such as the Fund’s growth approach, may underperform the market generally.
Foreign(Non-US) Risk: Investments in securities ofnon-US issuers may involve more risk than those of US issuers. These securities may fluctuate more widely in price and may be less liquid due to adverse market, economic, political, regulatory or other factors.
Derivatives Risk: Derivatives may be illiquid, difficult to price, and leveraged so that small changes may produce disproportionate losses for the Fund, and may be subject to counterparty risk to a greater degree than more traditional investments.
Management Risk: The Fund is subject to management risk because it is an actively managed investment fund. The Adviser will apply its investment techniques and risk analyses in making investment decisions for the Fund, but there is no guarantee that its techniques will produce the intended results.
These risks are fully discussed in the Fund’s prospectus. As with all investments, you may lose money by investing in the Fund.
An Important Note About Historical Performance
The investment return and principal value of an investment in the Fund will fluctuate, so that shares, when redeemed, may be worth more or less than their original cost. Performance shown in this report represents past performance and does not guarantee future results. Current performance may be lower or higher than the performance information shown. You may obtain performance information current to the most recentmonth-end by visiting www.abfunds.com. The Fund has been in operation only for a short period of time, and therefore has a very limited historical performance period. This limited performance period is unlikely to be representative of the performance the Fund will achieve over a longer period.
| | |
| |
| abfunds.com | | AB FLEXFEE LARGE CAP GROWTH PORTFOLIO | 5 |
DISCLOSURES AND RISKS(continued)
All fees and expenses related to the operation of the Fund have been deducted. Net asset value (“NAV”) returns do not reflect sales charges; if sales charges were reflected, the Fund’s quoted performance would be lower. SEC returns reflect the applicable sales charges for each share class. Returns for the different share classes will vary due to different expenses associated with each class. Performance assumes reinvestment of distributions and does not account for taxes.
| | |
| |
| 6 | AB FLEXFEE LARGE CAP GROWTH PORTFOLIO | | abfunds.com |
HISTORICAL PERFORMANCE
GROWTH OF A $10,000 INVESTMENT IN THE FUND(unaudited)
6/28/20171 TO 12/31/2018
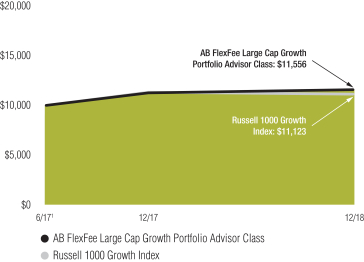
This chart illustrates the total value of an assumed $10,000 investment in AB FlexFee Large Cap Growth Portfolio Advisor Class shares (from 6/28/20171 to 12/31/2018) as compared to the performance of the Fund’s benchmark.
| 1 | Inception date: 6/28/2017. |
| | |
| |
| abfunds.com | | AB FLEXFEE LARGE CAP GROWTH PORTFOLIO | 7 |
HISTORICAL PERFORMANCE(continued)
AVERAGE ANNUAL RETURNS AS OF DECEMBER 31, 2018(unaudited)
| | | | | | | | |
| | |
| | | NAV Returns | | | SEC Returns
(reflects applicable
sales charges) | |
| | |
| ADVISOR CLASS SHARES1 | | | | | | | | |
| | |
| 1 Year | | | 2.87% | | | | 2.87% | |
| | |
| Since Inception2 | | | 10.05% | | | | 10.05% | |
SEC AVERAGE ANNUAL RETURNS
AS OF THE MOST RECENT CALENDARQUARTER-END
DECEMBER 31, 2018(unaudited)
| | | | |
| |
| | | SEC Returns
(reflects applicable
sales charges) | |
| |
| ADVISOR CLASS SHARES | | | | |
| |
| 1 Year | | | 2.87% | |
| |
| Since Inception2 | | | 10.05% | |
The Fund’s current prospectus fee table shows the Fund’s total annual operating expense ratio as 33.94% for Advisor Class shares, gross of any fee waivers or expense reimbursements. Contractual fee waivers and/or expense reimbursements limit the Fund’s annual operating expense ratio exclusive of the Fund’s advisory fees, acquired fund fees and expenses other than the advisory fees of any AB mutual funds in which the Fund may invest, interest expense, taxes, extraordinary expenses, and brokerage commissions and other transaction costs to 0.05% for Advisor Class shares. These waivers/reimbursements may not be terminated before April 30, 2019. Any fees waived and expenses borne by the Adviser through December 31, 2018 may be reimbursed by the Fund until the end of the third fiscal year after the fiscal period in which the fee was waived or the expense was borne, provided that no reimbursement payment will be made that would cause the Fund’s total annual operating expenses to exceed these expense limitations. Absent reimbursements or waivers, performance would have been lower. The Financial Highlights section of this report sets forth expense ratio data for the current reporting period; the expense ratio shown above may differ from the expense ratio in the Financial Highlights section since they are based on different time periods.
| 1 | This share class is offered at NAV to eligible investors and the SEC returns are the same as the NAV returns. |
| 2 | Inception date: 6/28/2017. |
| | |
| |
| 8 | AB FLEXFEE LARGE CAP GROWTH PORTFOLIO | | abfunds.com |
EXPENSE EXAMPLE
(unaudited)
As a shareholder of the Fund, you incur two types of costs: (1) transaction costs, including sales charges (loads) on purchase payments, contingent deferred sales charges on redemptions and (2) ongoing costs, including advisory fees; distribution(12b-1) fees; and other Fund expenses. This example is intended to help you understand your ongoing costs (in dollars) of investing in the Fund and to compare these costs with the ongoing costs of investing in other mutual funds.
This Example is based on an investment of $1,000 invested at the beginning of the period and held for the entire period as indicated below.
Actual Expenses
The table below provides information about actual account values and actual expenses. You may use the information, together with the amount you invested, to estimate the expenses that you paid over the period. Simply divide your account value by $1,000 (for example, an $8,600 account value divided by $1,000 = 8.6), then multiply the result by the number under the heading entitled “Expenses Paid During Period” to estimate the expenses you paid on your account during this period.
Hypothetical Example for Comparison Purposes
The table below also provides information about hypothetical account values and hypothetical expenses based on the Fund’s actual expense ratio and an assumed annual rate of return of 5% before expenses, which is not the Fund’s actual return. The hypothetical account values and expenses may not be used to estimate the actual ending account balance or expenses you paid for the period. You may use this information to compare the ongoing costs of investing in the Fund and other funds by comparing this 5% hypothetical example with the 5% hypothetical examples that appear in the shareholder reports of other funds.
Please note that the expenses shown in the table are meant to highlight your ongoing costs only and do not reflect any transactional costs, such as sales charges (loads), or contingent deferred sales charges on redemptions. Therefore, the hypothetical example is useful in comparing ongoing costs only, and will not help you determine the relative total costs of owning different funds. In addition, if these transactional costs were included, your costs would have been higher.
| | | | | | | | | | | | | | | | | | | | | | | | |
| | | Beginning
Account
Value
7/1/2018 | | | Ending
Account
Value
12/31/2018 | | | Expenses
Paid
During
Period* | | | Annualized
Expense
Ratio* | | | Total
Expenses
Paid
During
Period+ | | | Total
Annualized
Expense
Ratio+ | |
| Advisor Class | | | | | | | | | | | | | | | | | | | | | | | | |
Actual | | $ | 1,000 | | | $ | 943.40 | | | $ | 6.27 | | | | 1.28 | % | | $ | 6.32 | | | | 1.29 | % |
Hypothetical** | | $ | 1,000 | | | $ | 1,018.75 | | | $ | 6.51 | | | | 1.28 | % | | $ | 6.56 | | | | 1.29 | % |
| | |
| |
| abfunds.com | | AB FLEXFEE LARGE CAP GROWTH PORTFOLIO | 9 |
EXPENSE EXAMPLE(continued)
| * | Expenses are equal to the classes’ annualized expense ratios multiplied by the average account value over the period, multiplied by 184/365 (to reflect the one-half year period). |
| + | In connection with the Fund’s investments in affiliated/unaffiliated underlying portfolios, the Fund incurs no direct expenses, but bears proportionate shares of the fees and expenses (i.e., operating, administrative and investment advisory fees) of the affiliated/unaffiliated underlying portfolios. The Adviser has contractually agreed to waive its fees from the Fund in an amount equal to the Fund’s pro rata share of certain acquired fund fees and expenses of the affiliated underlying portfolios. The Fund’s total expenses are equal to the classes’ annualized expense ratio plus the Fund’s pro rata share of the weighted average expense ratio of the affiliated/unaffiliated underlying portfolios in which it invests, multiplied by the average account value over the period, multiplied by 184/365 (to reflect the one-half year period). |
| ** | Assumes 5% annual return before expenses. |
| | |
| |
| 10 | AB FLEXFEE LARGE CAP GROWTH PORTFOLIO | | abfunds.com |
PORTFOLIO SUMMARY
December 31, 2018(unaudited)
PORTFOLIO STATISTICS
Net Assets ($mil): $136.7
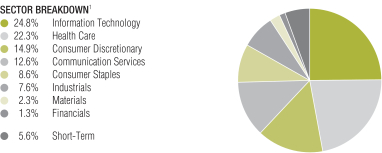
TEN LARGEST HOLDINGS2
| | | | | | | | |
| | |
| Company | | U.S. $ Value | | | Percent of
Net Assets | |
| | |
| Alphabet, Inc. – Class C | | $ | 10,776,558 | | | | 7.9 | % |
| | |
| Visa, Inc. – Class A | | | 6,472,977 | | | | 4.7 | |
| | |
| Microsoft Corp. | | | 6,227,866 | | | | 4.6 | |
| | |
| UnitedHealth Group, Inc. | | | 5,760,651 | | | | 4.2 | |
| | |
| Home Depot, Inc. (The) | | | 5,485,182 | | | | 4.0 | |
| | |
| Monster Beverage Corp. | | | 5,457,267 | | | | 4.0 | |
| | |
| NIKE, Inc. – Class B | | | 4,700,773 | | | | 3.4 | |
| | |
| Intuitive Surgical, Inc. | | | 4,624,930 | | | | 3.4 | |
| | |
| PayPal Holdings, Inc. | | | 4,160,016 | | | | 3.0 | |
| | |
| Costco Wholesale Corp. | | | 4,059,940 | | | | 3.0 | |
| | |
| | $ | 57,726,160 | | | | 42.2 | % |
| 1 | All data are as of December 31, 2018. The Fund’s sector breakdown is expressed as a percentage of total investments and may vary over time. |
Please note: The sector classifications presented herein are based on the Global Industry Classification Standard (GICS) which was developed by Morgan Stanley Capital International and Standard & Poor’s. The components are divided into sector, industry group, and industrysub-indices as classified by the GICS for each of the market capitalization indices in the broad market. These sector classifications are broadly defined. The “Portfolio of Investments” section of the report reflects more specific industry information and is consistent with the investment restrictions discussed in the Fund’s prospectus.
| | |
| |
| abfunds.com | | AB FLEXFEE LARGE CAP GROWTH PORTFOLIO | 11 |
PORTFOLIO OF INVESTMENTS
December 31, 2018
| | | | | | | | |
| Company | | Shares | | | U.S. $ Value | |
| |
COMMON STOCKS – 94.9% | | | | | | | | |
Information Technology – 24.9% | | | | | | | | |
Communications Equipment – 1.9% | | | | | | | | |
Arista Networks, Inc.(a) | | | 12,681 | | | $ | 2,671,887 | |
| | | | | | | | |
| | |
Electronic Equipment, Instruments & Components – 1.6% | | | | | | | | |
Amphenol Corp. – Class A | | | 8,433 | | | | 683,242 | |
Cognex Corp. | | | 21,701 | | | | 839,178 | |
IPG Photonics Corp.(a) | | | 5,801 | | | | 657,195 | |
| | | | | | | | |
| | | | | | | 2,179,615 | |
| | | | | | | | |
IT Services – 8.2% | | | | | | | | |
Fiserv, Inc.(a) | | | 7,245 | | | | 532,435 | |
PayPal Holdings, Inc.(a) | | | 49,471 | | | | 4,160,016 | |
Visa, Inc. – Class A | | | 49,060 | | | | 6,472,977 | |
| | | | | | | | |
| | | | | | | 11,165,428 | |
| | | | | | | | |
Semiconductors & Semiconductor Equipment – 3.9% | | | | | | | | |
ASML Holding NV (ADR) | | | 5,960 | | | | 927,495 | |
Texas Instruments, Inc. | | | 5,744 | | | | 542,808 | |
Xilinx, Inc. | | | 44,830 | | | | 3,818,171 | |
| | | | | | | | |
| | | | | | | 5,288,474 | |
| | | | | | | | |
Software – 6.9% | | | | | | | | |
Adobe Systems, Inc.(a) | | | 9,533 | | | | 2,156,746 | |
ANSYS, Inc.(a) | | | 389 | | | | 55,604 | |
Microsoft Corp. | | | 61,316 | | | | 6,227,866 | |
Paycom Software, Inc.(a) | | | 6,610 | | | | 809,394 | |
salesforce.com, Inc.(a) | | | 1,453 | | | | 199,017 | |
| | | | | | | | |
| | | | | | | 9,448,627 | |
| | | | | | | | |
Technology Hardware, Storage & Peripherals – 2.4% | | | | | | | | |
Apple, Inc. | | | 20,946 | | | | 3,304,022 | |
| | | | | | | | |
| | | | | | | 34,058,053 | |
| | | | | | | | |
Health Care – 22.4% | | | | | | | | |
Biotechnology – 6.4% | | | | | | | | |
Biogen, Inc.(a) | | | 12,097 | | | | 3,640,229 | |
Regeneron Pharmaceuticals, Inc.(a) | | | 7,683 | | | | 2,869,601 | |
Vertex Pharmaceuticals, Inc.(a) | | | 13,573 | | | | 2,249,182 | |
| | | | | | | | |
| | | | | | | 8,759,012 | |
| | | | | | | | |
Health Care Equipment & Supplies – 8.0% | | | | | | | | |
Edwards Lifesciences Corp.(a) | | | 26,257 | | | | 4,021,785 | |
Intuitive Surgical, Inc.(a) | | | 9,657 | | | | 4,624,930 | |
Stryker Corp. | | | 14,694 | | | | 2,303,285 | |
| | | | | | | | |
| | | | | | | 10,950,000 | |
| | | | | | | | |
Health Care Providers & Services – 4.2% | | | | | | | | |
UnitedHealth Group, Inc. | | | 23,124 | | | | 5,760,651 | |
| | | | | | | | |
| | |
| |
| 12 | AB FLEXFEE LARGE CAP GROWTH PORTFOLIO | | abfunds.com |
PORTFOLIO OF INVESTMENTS(continued)
| | | | | | | | |
| Company | | Shares | | | U.S. $ Value | |
| |
Health Care Technology – 0.2% | | | | | | | | |
Veeva Systems, Inc. – Class A(a) | | | 3,094 | | | $ | 276,356 | |
| | | | | | | | |
| | |
Life Sciences Tools & Services – 0.7% | | | | | | | | |
Mettler-Toledo International, Inc.(a) | | | 1,661 | | | | 939,428 | |
| | | | | | | | |
| | |
Pharmaceuticals – 2.9% | | | | | | | | |
Zoetis, Inc. | | | 46,752 | | | | 3,999,166 | |
| | | | | | | | |
| | | | | | | 30,684,613 | |
| | | | | | | | |
Consumer Discretionary – 14.9% | | | | | | | | |
Internet & Direct Marketing Retail – 2.9% | | | | | | | | |
Booking Holdings, Inc.(a) | | | 2,332 | | | | 4,016,683 | |
| | | | | | | | |
| | |
Multiline Retail – 0.4% | | | | | | | | |
Dollar Tree, Inc.(a) | | | 6,523 | | | | 589,157 | |
| | | | | | | | |
| | |
Specialty Retail – 8.1% | | | | | | | | |
Burlington Stores, Inc.(a) | | | 7,074 | | | | 1,150,728 | |
Home Depot, Inc. (The) | | | 31,924 | | | | 5,485,182 | |
TJX Cos., Inc. (The) | | | 41,868 | | | | 1,873,174 | |
Ulta Salon Cosmetics & Fragrance, Inc.(a) | | | 10,659 | | | | 2,609,749 | |
| | | | | | | | |
| | | | | | | 11,118,833 | |
| | | | | | | | |
Textiles, Apparel & Luxury Goods – 3.5% | | | | | | | | |
NIKE, Inc. – Class B | | | 63,404 | | | | 4,700,773 | |
| | | | | | | | |
| | | | | | | 20,425,446 | |
| | | | | | | | |
Communication Services – 12.7% | | | | | | | | |
Entertainment – 2.0% | | | | | | | | |
Activision Blizzard, Inc. | | | 26,108 | | | | 1,215,850 | |
Electronic Arts, Inc.(a) | | | 19,230 | | | | 1,517,439 | |
| | | | | | | | |
| | | | | | | 2,733,289 | |
| | | | | | | | |
Interactive Media & Services – 10.7% | | | | | | | | |
Alphabet, Inc. – Class C(a) | | | 10,406 | | | | 10,776,558 | |
Facebook, Inc. – Class A(a) | | | 29,213 | | | | 3,829,532 | |
| | | | | | | | |
| | | | | | | 14,606,090 | |
| | | | | | | | |
| | | | | | | 17,339,379 | |
| | | | | | | | |
Consumer Staples – 8.6% | | | | | | | | |
Beverages – 5.6% | | | | | | | | |
Constellation Brands, Inc. – Class A | | | 13,997 | | | | 2,250,998 | |
Monster Beverage Corp.(a) | | | 110,875 | | | | 5,457,267 | |
| | | | | | | | |
| | | | | | | 7,708,265 | |
| | | | | | | | |
Food & Staples Retailing – 3.0% | | | | | | | | |
Costco Wholesale Corp. | | | 19,930 | | | | 4,059,940 | |
| | | | | | | | |
| | | | | | | 11,768,205 | |
| | | | | | | | |
Industrials – 7.7% | | | | | | | | |
Building Products – 3.1% | | | | | | | | |
Allegion PLC | | | 29,504 | | | | 2,351,764 | |
AO Smith Corp. | | | 24,890 | | | | 1,062,803 | |
| | |
| |
| abfunds.com | | AB FLEXFEE LARGE CAP GROWTH PORTFOLIO | 13 |
PORTFOLIO OF INVESTMENTS(continued)
| | | | | | | | |
| Company | | Shares | | | U.S. $ Value | |
| |
Lennox International, Inc. | | | 3,814 | | | $ | 834,732 | |
| | | | | | | | |
| | | | | | | 4,249,299 | |
| | | | | | | | |
Commercial Services & Supplies – 1.5% | | | | | | | | |
Copart, Inc.(a) | | | 42,880 | | | | 2,048,806 | |
| | | | | | | | |
| | |
Electrical Equipment – 0.5% | | | | | | | | |
AMETEK, Inc. | | | 9,590 | | | | 649,243 | |
| | | | | | | | |
| | |
Industrial Conglomerates – 1.5% | | | | | | | | |
Roper Technologies, Inc. | | | 7,689 | | | | 2,049,272 | |
| | | | | | | | |
| | |
Machinery – 0.6% | | | | | | | | |
IDEX Corp. | | | 6,322 | | | | 798,216 | |
| | | | | | | | |
| | |
Trading Companies & Distributors – 0.5% | | | | | | | | |
Fastenal Co. | | | 13,805 | | | | 721,864 | |
| | | | | | | | |
| | | | | | | 10,516,700 | |
| | | | | | | | |
Materials – 2.4% | | | | | | | | |
Chemicals – 2.4% | | | | | | | | |
Sherwin-Williams Co. (The) | | | 8,164 | | | | 3,212,207 | |
| | | | | | | | |
| | |
Financials – 1.3% | | | | | | | | |
Capital Markets – 1.3% | | | | | | | | |
MarketAxess Holdings, Inc. | | | 3,830 | | | | 809,317 | |
S&P Global, Inc. | | | 5,578 | | | | 947,926 | |
| | | | | | | | |
| | | | | | | 1,757,243 | |
| | | | | | | | |
Total Common Stocks
(cost $135,263,757) | | | | | | | 129,761,846 | |
| | | | | | | | |
| | | | | | | | |
SHORT-TERM INVESTMENTS – 5.6% | | | | | | | | |
Investment Companies – 5.6% | | | | | | | | |
AB Fixed Income Shares, Inc. – Government Money Market Portfolio – Class AB, 2.31%(b)(c)(d)
(cost $7,716,554) | | | 7,716,554 | | | | 7,716,554 | |
| | | | | | | | |
| | |
Total Investments – 100.5%
(cost $142,980,311) | | | | | | | 137,478,400 | |
Other assets less liabilities – (0.5)% | | | | | | | (732,458 | ) |
| | | | | | | | |
| | |
Net Assets – 100.0% | | | | | | $ | 136,745,942 | |
| | | | | | | | |
| (a) | Non-income producing security. |
| (b) | To obtain a copy of the fund’s shareholder report, please go to the Securities and Exchange Commission’s website at www.sec.gov, or call AB at
(800)227-4618. |
| (c) | The rate shown represents the7-day yield as of period end. |
| (d) | Affiliated investments. |
Glossary:
ADR – American Depositary Receipt
See notes to financial statements.
| | |
| |
| 14 | AB FLEXFEE LARGE CAP GROWTH PORTFOLIO | | abfunds.com |
STATEMENT OF ASSETS & LIABILITIES
December 31, 2018
| | | | |
| Assets | | | | |
Investments in securities, at value | | | | |
Unaffiliated issuers (cost $135,263,757) | | $ | 129,761,846 | |
Affiliated issuers (cost $7,716,554) | | | 7,716,554 | |
Receivable for capital stock sold | | | 5,273,335 | |
Unaffiliated dividends receivable | | | 23,627 | |
Affiliated dividends receivable | | | 20,756 | |
| | | | |
Total assets | | | 142,796,118 | |
| | | | |
| Liabilities | | | | |
Payable for investment securities purchased | | | 4,334,377 | |
Payable for capital stock redeemed | | | 1,147,066 | |
Advisory fee payable | | | 458,265 | |
Transfer Agent fee payable | | | 3,000 | |
Dividends payable | | | 1,305 | |
Accrued expenses and other liabilities | | | 106,163 | |
| | | | |
Total liabilities | | | 6,050,176 | |
| | | | |
Net Assets | | $ | 136,745,942 | |
| | | | |
| Composition of Net Assets | | | | |
Capital stock, at par | | $ | 1,190 | |
Additionalpaid-in capital | | | 143,270,826 | |
Accumulated loss | | | (6,526,074 | ) |
| | | | |
| | $ | 136,745,942 | |
| | | | |
Net Asset Value Per Share—11 billion shares of capital stock authorized, $.0001 par value
| | | | | | | | | | | | |
| Class | | Net Assets | | | Shares
Outstanding | | | Net Asset
Value | |
| |
| Advisor | | $ | 136,745,942 | | | | 11,895,996 | | | $ | 11.50 | |
| |
See notes to financial statements.
| | |
| |
| abfunds.com | | AB FLEXFEE LARGE CAP GROWTH PORTFOLIO | 15 |
STATEMENT OF OPERATIONS
Year Ended December 31, 2018
| | | | | | | | |
| Investment Income | | | | | | | | |
Dividends | | | | | | | | |
Unaffiliated issuers | | $ | 447,904 | | | | | |
Affiliated issuers | | | 132,038 | | | $ | 579,942 | |
| | | | | | | | |
| Expenses | | | | | | | | |
Advisory fee (see Note B) | | | 765,264 | | | | | |
Transfer agency—Advisor Class | | | 59,320 | | | | | |
Administrative | | | 71,040 | | | | | |
Registration fees | | | 53,185 | | | | | |
Audit and tax | | | 51,952 | | | | | |
Legal | | | 40,709 | | | | | |
Amortization of offering expenses | | | 33,390 | | | | | |
Custodian | | | 33,371 | | | | | |
Directors’ fees | | | 25,326 | | | | | |
Printing | | | 23,573 | | | | | |
Miscellaneous | | | 36,578 | | | | | |
| | | | | | | | |
Total expenses | | | 1,193,708 | | | | | |
Less: expenses waived and reimbursed by the Adviser (see Note B) | | | (401,511 | ) | | | | |
| | | | | | | | |
Net expenses | | | | | | | 792,197 | |
| | | | | | | | |
Net investment loss | | | | | | | (212,255 | ) |
| | | | | | | | |
| Realized and Unrealized Loss on Investment and Foreign Currency Transactions | | | | | | | | |
Net realized loss on: | | | | | | | | |
Investment transactions | | | | | | | (1,022,788 | ) |
Net change in unrealized appreciation/depreciation on: | | | | | | | | |
Investments | | | | | | | (5,621,244 | ) |
| | | | | | | | |
Net loss on investments | | | | | | | (6,644,032 | ) |
| | | | | | | | |
Net Decrease in Net Assets from Operations | | | | | | $ | (6,856,287 | ) |
| | | | | | | | |
See notes to financial statements.
| | |
| |
| 16 | AB FLEXFEE LARGE CAP GROWTH PORTFOLIO | | abfunds.com |
STATEMENT OF CHANGES IN NET ASSETS
| | | | | | | | |
| | | Year Ended
December 31,
2018 | | | June 28, 2017(a)
to
December 31, 2017 | |
| Increase (Decrease) in Net Assets from Operations | | | | | | | | |
Net investment income (loss) | | $ | (212,255 | ) | | $ | 3,686 | |
Net realized gain (loss) on investment transactions | | | (1,022,788 | ) | | | 6,844 | |
Net change in unrealized appreciation/depreciation on investments | | | (5,621,244 | ) | | | 119,333 | |
| | | | | | | | |
Net increase (decrease) in net assets from operations | | | (6,856,287 | ) | | | 129,863 | |
| Distributions to Shareholders* | | | | | | | | |
Advisor Class | | | (7,127 | ) | | | (6,163 | ) |
| Capital Stock Transactions | | | | | | | | |
Net increase | | | 142,334,900 | | | | 1,150,756 | |
| | | | | | | | |
Total increase | | | 135,471,486 | | | | 1,274,456 | |
| Net Assets | | | | | | | | |
Beginning of period | | | 1,274,456 | | | | – 0 | – |
| | | | | | | | |
End of period | | $ | 136,745,942 | | | $ | 1,274,456 | |
| | | | | | | | |
| (a) | Commencement of operations. |
| * | The prior year’s amounts have been reclassified to conform with the current year’s presentation. See Note G, Recent Accounting Pronouncements, in the Notes to Financial Statements for more information. |
See notes to financial statements.
| | |
| |
| abfunds.com | | AB FLEXFEE LARGE CAP GROWTH PORTFOLIO | 17 |
NOTES TO FINANCIAL STATEMENTS
December 31, 2018
NOTE A
Significant Accounting Policies
AB Cap Fund, Inc. (the “Company”), which is a Maryland corporation, is registered under the Investment Company Act of 1940 as anopen-end management investment company. The Company operates as a series company comprised of 29 portfolios currently in operation. Each portfolio is considered to be a separate entity for financial reporting and tax purposes. This report relates only to the AB FlexFee Large Cap Growth Portfolio (the “Fund”), a diversified portfolio. The Fund commenced operations on June 28, 2017. The Fund has authorized issuance of Class A, Class B, Class C, Advisor Class, Class R, Class K, Class I, Class Z, Class T, Class 1, and Class 2 shares. Class A, Class B, Class C, Class R, Class K, Class I, Class Z, Class T, Class 1, and Class 2 shares have not been issued. Advisor Class shares are sold without an initial or contingent deferred sales charge and are not subject to ongoing distribution expenses. All eleven classes of shares have identical voting, dividend, liquidation and other rights, except that the classes bear different distribution and transfer agency expenses. Each class has exclusive voting rights with respect to its distribution plan. The financial statements have been prepared in conformity with U.S. generally accepted accounting principles (“U.S. GAAP”), which require management to make certain estimates and assumptions that affect the reported amounts of assets and liabilities in the financial statements and amounts of income and expenses during the reporting period. Actual results could differ from those estimates. The Fund is an investment company under U.S. GAAP and follows the accounting and reporting guidance applicable to investment companies. The following is a summary of significant accounting policies followed by the Fund.
1. Security Valuation
Portfolio securities are valued at their current market value determined on the basis of market quotations or, if market quotations are not readily available or are deemed unreliable, at “fair value” as determined in accordance with procedures established by and under the general supervision of the Fund’s Board of Directors (the “Board”).
In general, the market values of securities which are readily available and deemed reliable are determined as follows: securities listed on a national securities exchange (other than securities listed on the NASDAQ Stock Market, Inc. (“NASDAQ”)) or on a foreign securities exchange are valued at the last sale price at the close of the exchange or foreign securities exchange. If there has been no sale on such day, the securities are valued at the last traded price from the previous day. Securities listed on more than one exchange are valued by reference to the principal exchange on
| | |
| |
| 18 | AB FLEXFEE LARGE CAP GROWTH PORTFOLIO | | abfunds.com |
NOTES TO FINANCIAL STATEMENTS(continued)
which the securities are traded; securities listed only on NASDAQ are valued in accordance with the NASDAQ Official Closing Price; listed or over the counter (“OTC”) market put or call options are valued at the mid level between the current bid and ask prices. If either a current bid or current ask price is unavailable, the Adviser will have discretion to determine the best valuation (e.g., last trade price in the case of listed options); open futures are valued using the closing settlement price or, in the absence of such a price, the most recent quoted bid price. If there are no quotations available for the day of valuation, the last available closing settlement price is used; U.S. Government securities and any other debt instruments having 60 days or less remaining until maturity are generally valued at market by an independent pricing vendor, if a market price is available. If a market price is not available, the securities are valued at amortized cost. This methodology is commonly used for short term securities that have an original maturity of 60 days or less, as well as short term securities that had an original term to maturity that exceeded 60 days. In instances when amortized cost is utilized, the Valuation Committee (the “Committee”) must reasonably conclude that the utilization of amortized cost is approximately the same as the fair value of the security. Such factors the Committee will consider include, but are not limited to, an impairment of the creditworthiness of the issuer or material changes in interest rates. Fixed-income securities, including mortgage-backed and asset-backed securities, may be valued on the basis of prices provided by a pricing service or at a price obtained from one or more of the major broker-dealers. In cases where broker-dealer quotes are obtained, the Adviser may establish procedures whereby changes in market yields or spreads are used to adjust, on a daily basis, a recently obtained quoted price on a security. Swaps and other derivatives are valued daily, primarily using independent pricing services, independent pricing models using market inputs, as well as third party broker-dealers or counterparties. Open end mutual funds are valued at the closing net asset value per share, while exchange traded funds are valued at the closing market price per share.
Securities for which market quotations are not readily available (including restricted securities) or are deemed unreliable are valued at fair value as deemed appropriate by the Adviser. Factors considered in making this determination may include, but are not limited to, information obtained by contacting the issuer, analysts, analysis of the issuer’s financial statements or other available documents. In addition, the Fund may use fair value pricing for securities primarily traded innon-U.S. markets because most foreign markets close well before the Fund values its securities at 4:00 p.m., Eastern Time. The earlier close of these foreign markets gives rise to the possibility that significant events, including broad market moves, may have occurred in the interim and may materially affect the value of those securities. To account for this, the Fund generally values
| | |
| |
| abfunds.com | | AB FLEXFEE LARGE CAP GROWTH PORTFOLIO | 19 |
NOTES TO FINANCIAL STATEMENTS(continued)
many of its foreign equity securities using fair value prices based on third party vendor modeling tools to the extent available.
2. Fair Value Measurements
In accordance with U.S. GAAP regarding fair value measurements, fair value is defined as the price that the Fund would receive to sell an asset or pay to transfer a liability in an orderly transaction between market participants at the measurement date. U.S. GAAP establishes a framework for measuring fair value, and a three-level hierarchy for fair value measurements based upon the transparency of inputs to the valuation of an asset or liability (including those valued based on their market values as described in Note A.1 above). Inputs may be observable or unobservable and refer broadly to the assumptions that market participants would use in pricing the asset or liability. Observable inputs reflect the assumptions market participants would use in pricing the asset or liability based on market data obtained from sources independent of the Fund. Unobservable inputs reflect the Fund’s own assumptions about the assumptions that market participants would use in pricing the asset or liability based on the best information available in the circumstances. Each investment is assigned a level based upon the observability of the inputs which are significant to the overall valuation. The three-tier hierarchy of inputs is summarized below.
| | • | | Level 1—quoted prices in active markets for identical investments |
| | • | | Level 2—other significant observable inputs (including quoted prices for similar investments, interest rates, prepayment speeds, credit risk, etc.) |
| | • | | Level 3—significant unobservable inputs (including the Fund’s own assumptions in determining the fair value of investments) |
Where readily available market prices or relevant bid prices are not available for certain equity investments, such investments may be valued based on similar publicly traded investments, movements in relevant indices since last available prices or based upon underlying company fundamentals and comparable company data (such as multiples to earnings or other multiples to equity). Where an investment is valued using an observable input, such as another publicly traded security, the investment will be classified as Level 2. If management determines that an adjustment is appropriate based on restrictions on resale, illiquidity or uncertainty, and such adjustment is a significant component of the valuation, the investment will be classified as Level 3. An investment will also be classified as Level 3 where management uses company fundamentals and other significant inputs to determine the valuation.
| | |
| |
| 20 | AB FLEXFEE LARGE CAP GROWTH PORTFOLIO | | abfunds.com |
NOTES TO FINANCIAL STATEMENTS(continued)
The following table summarizes the valuation of the Fund’s investments by the above fair value hierarchy levels as of December 31, 2018:
| | | | | | | | | | | | | | | | |
Investments in
Securities | | Level 1 | | | Level 2 | | | Level 3 | | | Total | |
Assets: | | | | | | | | | | | | | | | | |
Common Stocks^ | | $ | 129,761,846 | | | $ | – 0 | – | | $ | – 0 | – | | $ | 129,761,846 | |
Short-Term Investments: | | | | | | | | | | | | | | | | |
Investment Companies | | | 7,716,554 | | | | – 0 | – | | | – 0 | – | | | 7,716,554 | |
| | | | | | | | | | | | | | | | |
Total Investments in Securities | | | 137,478,400 | | | | – 0 | – | | | – 0 | – | | | 137,478,400 | |
Other Financial Instruments* | | | – 0 | – | | | – 0 | – | | | – 0 | – | | | – 0 | – |
| | | | | | | | | | | | | | | | |
Total** | | $ | 137,478,400 | | | $ | – 0 | – | | $ | – 0 | – | | $ | 137,478,400 | |
| | | | | | | | | | | | | | | | |
| ^ | See Portfolio of Investments for sector classifications. |
| * | Other financial instruments are derivative instruments, such as futures, forwards and swaps, which are valued at the unrealized appreciation/(depreciation) on the instrument. Other financial instruments may also include swaps with upfront premiums, options written and swaptions written which are valued at market value. |
| ** | There were no transfers between any levels during the reporting period. |
The Fund recognizes all transfers between levels of the fair value hierarchy assuming the financial instrument was transferred at the beginning of the reporting period.
The Adviser established the Committee to oversee the pricing and valuation of all securities held in the Fund. The Committee operates under pricing and valuation policies and procedures established by the Adviser and approved by the Board, including pricing policies which set forth the mechanisms and processes to be employed on a daily basis to implement these policies and procedures. In particular, the pricing policies describe how to determine market quotations for securities and other instruments. The Committee’s responsibilities include: 1) fair value and liquidity determinations (and oversight of any third parties to whom any responsibility for fair value and liquidity determinations is delegated), and 2) regular monitoring of the Adviser’s pricing and valuation policies and procedures and modification or enhancement of these policies and procedures (or recommendation of the modification of these policies and procedures) as the Committee believes appropriate.
The Committee is also responsible for monitoring the implementation of the pricing policies by the Adviser’s Pricing Group (the “Pricing Group”) and any third party which performs certain pricing functions in accordance with the pricing policies. The Pricing Group is responsible for the oversight of the third party on aday-to-day basis. The Committee and the Pricing Group perform a series of activities to provide reasonable assurance of the
| | |
| |
| abfunds.com | | AB FLEXFEE LARGE CAP GROWTH PORTFOLIO | 21 |
NOTES TO FINANCIAL STATEMENTS(continued)
accuracy of prices including: 1) periodic vendor due diligence meetings, review of methodologies, new developments and process at vendors, 2) daily comparison of security valuation versus prior day for all securities that exceeded established thresholds, and 3) daily review of unpriced, stale, and variance reports with exceptions reviewed by senior management and the Committee.
In addition, several processes outside of the pricing process are used to monitor valuation issues including: 1) performance and performance attribution reports are monitored for anomalous impacts based upon benchmark performance, and 2) portfolio managers review all portfolios for performance and analytics (which are generated using the Adviser’s prices).
3. Currency Translation
Assets and liabilities denominated in foreign currencies and commitments under forward currency exchange contracts are translated into U.S. dollars at the mean of the quoted bid and ask prices of such currencies against the U.S. dollar. Purchases and sales of portfolio securities are translated into U.S. dollars at the rates of exchange prevailing when such securities were acquired or sold. Income and expenses are translated into U.S. dollars at the rates of exchange prevailing when accrued.
Net realized gain or loss on foreign currency transactions represents foreign exchange gains and losses from sales and maturities of foreign fixed income investments, holding of foreign currencies, currency gains or losses realized between the trade and settlement dates on foreign investment transactions, and the difference between the amounts of dividends, interest and foreign withholding taxes recorded on the Fund’s books and the U.S. dollar equivalent amounts actually received or paid. Net unrealized currency gains and losses from valuing foreign currency denominated assets and liabilities at period end exchange rates are reflected as a component of net unrealized appreciation and depreciation of foreign currency denominated assets and liabilities.
4. Taxes
It is the Fund’s policy to meet the requirements of the Internal Revenue Code applicable to regulated investment companies and to distribute all of its investment company taxable income and net realized gains, if any, to shareholders. Therefore, no provisions for federal income or excise taxes are required. The Fund may be subject to taxes imposed by countries in which it invests. Such taxes are generally based on income and/or capital gains earned or repatriated. Taxes are accrued and applied to net investment income, net realized gains and net unrealized appreciation/depreciation as such income and/or gains are earned.
| | |
| |
| 22 | AB FLEXFEE LARGE CAP GROWTH PORTFOLIO | | abfunds.com |
NOTES TO FINANCIAL STATEMENTS(continued)
In accordance with U.S. GAAP requirements regarding accounting for uncertainties in income taxes, management has analyzed the Fund’s tax positions taken or expected to be taken on federal and state income tax returns for all open tax years (all years since inception of the Fund), and has concluded that no provision for income tax is required in the Fund’s financial statements.
5. Investment Income and Investment Transactions
Dividend income is recorded on theex-dividend date or as soon as the Fund is informed of the dividend. Interest income is accrued daily. Investment transactions are accounted for on the date securities are purchased or sold. Investment gains or losses are determined on the identified cost basis. The Fund amortizes premiums and accretes discounts as adjustments to interest income.
6. Expense Allocations
Expenses of the Company are charged proportionately to each portfolio or based on other appropriate methods.
7. Dividends and Distributions
Dividends and distributions to shareholders, if any, are recorded on theex-dividend date. Income dividends and capital gains distributions are determined in accordance with federal tax regulations and may differ from those determined in accordance with U.S. GAAP. To the extent these differences are permanent, such amounts are reclassified within the capital accounts based on their federal tax basis treatment; temporary differences do not require such reclassification.
8. Offering Expenses
Offering expenses of $68,085 were deferred and amortized on a straight line basis over a one year period starting from June 28, 2017 (commencement of operations).
NOTE B
Advisory Fee and Other Transactions with Affiliates
Under the terms of the investment advisory agreement, the Fund pays the Adviser an advisory fee at an annual rate of .55% of the Fund’s average daily net assets (“Base Fee”). The advisory fee is increased or decreased from the Base Fee by a performance adjustment (“Performance Adjustment”) that depends on whether, and to what extent, the investment performance of the Advisor Class shares of the Fund (“Measuring Class”) exceeds, or is exceeded by, the performance of the Russell 1000 Growth Index (“Index”) plus 1.40% (“Index Hurdle”) over the Performance Period (as defined below). The Performance Adjustment is calculated and accrued daily, according to a schedule that adds or subtracts .00357% of the Fund’s average daily net assets for each .01% of absolute performance by which the performance of the Measuring Class exceeds or lags
| | |
| |
| abfunds.com | | AB FLEXFEE LARGE CAP GROWTH PORTFOLIO | 23 |
NOTES TO FINANCIAL STATEMENTS(continued)
the Index Hurdle for the period from the beginning of the Performance Period through the current business day. The maximum Performance Adjustment (positive or negative) will not exceed an annualized rate of +/-.50% (“Maximum Performance Adjustment”) of the Fund’s average daily net assets, which would occur when the performance of the Measuring Class exceeds, or is exceeded by, the Index Hurdle by 1.40% or more for the Performance Period. On a monthly basis, the Fund will pay the Adviser the minimum fee rate of .05% on an annualized basis (Base Fee minus the Maximum Performance Adjustment) applied to the average daily net assets for the month. At the end of the Performance Period, the Fund will pay to the Adviser the total advisory fee, less the amount of any minimum fees paid during the Performance Period and any waivers described below. The period over which performance is measured (“Performance Period”) was initially from the commencement of operations to December 31, 2018 and thereafter is each12-month period beginning on the first day in the month of January through December 31 of the same year. In addition, the Adviser has agreed to waive its advisory fee by limiting the Fund’s accrual of the advisory fee (Base Fee plus Performance Adjustment) on any day to the amount corresponding to the maximum fee rate multiplied by the Fund’s current net assets if such amount is less than the amount that would have been accrued based on the Fund’s average daily net assets for the Performance Period. For the year ended December 31, 2018, the Fund accrued advisory fees of $765,264, as reflected in the statement of operations, at an annual effective rate (excluding the impact from any expense waivers in effect) of 1.06% of the Fund’s average net assets, which reflected a .51% Performance Adjustment of $367,394. For the Performance Period from June 28, 2017 to December 31, 2018, the Fund accrued advisory fees of $765,548 at an annual effective rate (excluding the impact from any expense waivers in effect) of 1.05% of the Fund’s average net assets, which reflected a .50% Performance Adjustment of $364,547. The advisory fee accrued during the financial reporting period may be higher than the Base Fee plus the Maximum Performance Adjustment (or lower than the Base Fee minus the Maximum Performance Adjustment) because the actual fee is calculated based on performance over a longer time period for the initial Performance Period.
The Adviser has agreed to waive its fees and bear certain expenses through April 30, 2019 to the extent necessary to limit total expenses (other than the advisory fee, acquired fund fees and expenses other than the advisory fees of any AB mutual funds in which the Fund may invest, interest expense, taxes, extraordinary expenses, and brokerage commissions and other transaction costs) on an annual basis from exceeding .05% of average daily net assets. For the year ended December 31, 2018, the reimbursements/waivers amounted to $321,117. Any fees waived and expenses borne by the Adviser through December 31, 2018 are subject to repayment by the Fund until the end of the third fiscal year after the fiscal
| | |
| |
| 24 | AB FLEXFEE LARGE CAP GROWTH PORTFOLIO | | abfunds.com |
NOTES TO FINANCIAL STATEMENTS(continued)
period in which the fees were waived or the expenses were borne; such waivers/expenses borne that are subject to repayment amount to $173,083 for the fiscal period ended December 31, 2017 and $321,117 for the year ended December 31, 2018. In any case, no repayment will be made that would cause the Fund’s total annual expenses (subject to the exclusions set forth above) to exceed .05%.
During 2017, AXA S.A. (“AXA”), a French holding company for the AXA Group, a worldwide leader in life, property and casualty and health insurance and asset management, announced its intention to pursue the sale of a minority stake in its subsidiary, AXA Equitable Holdings, Inc. (“AXA Equitable”), the holding company for a diversified financial services organization, through an initial public offering (“IPO”). AXA Equitable is the holding company for a diverse group of financial services companies, including AllianceBernstein L.P., the investment adviser to the Funds (“the Adviser”). During the second quarter of 2018, AXA Equitable completed the IPO, and, as a result, AXA held approximately 72.2% of the outstanding common stock of AXA Equitable as of September 30, 2018. Contemporaneously with the IPO, AXA sold $862.5 million aggregate principal amount of its 7.25% mandatorily exchangeable notes (the “MxB Notes”) due May 15, 2021 and exchangeable into up to 43,125,000 shares of common stock (or approximately 7% of the outstanding shares of common stock of AXA Equitable). AXA retains ownership (including voting rights) of such shares of common stock until the MxB Notes are exchanged, which may be on a date that is earlier than the maturity date at AXA’s option upon the occurrence of certain events.
In March 2018, AXA announced its intention to sell its entire interest in AXA Equitable over time, subject to market conditions and other factors (the “Plan”). It is anticipated that one or more of the transactions contemplated by the Plan may ultimately result in the indirect transfer of a “controlling block” of voting securities of the Adviser (a “Change of Control Event”) and therefore may be deemed an “assignment” causing a termination of each Fund’s current investment advisory agreement. In order to ensure that the existing investment advisory services could continue uninterrupted, at meetings held in late July through early August 2018, the Boards of Directors/Trustees (each a “Board” and collectively, the “Boards”) approved new investment advisory agreements with the Adviser, in connection with the Plan. The Boards also agreed to call and hold a joint meeting of shareholders on October 11, 2018 for shareholders of each Fund to (1) approve the new investment advisory agreement with the Adviser that would be effective after the first Change of Control Event and (2) approve any future advisory agreement approved by the Board and that has terms not materially different from the current agreement, in the event there are subsequent Change of Control Events arising from completion of the Plan
| | |
| |
| abfunds.com | | AB FLEXFEE LARGE CAP GROWTH PORTFOLIO | 25 |
NOTES TO FINANCIAL STATEMENTS(continued)
that terminate the advisory agreement after the first Change of Control Event. Approval of a future advisory agreement means that shareholders may not have another opportunity to vote on a new agreement with the Adviser even upon a change of control, as long as no single person or group of persons acting together gains “control” (as defined in the 1940 Act) of AXA Equitable.
At the October 11, 2018 meeting, shareholders approved the new and future investment advisory agreements.
On November 20, 2018, AXA completed a public offering of 60,000,000 shares of AXA Equitable’s common stock and simultaneously sold 30,000,000 of such shares to AXA Equitable pursuant to a separate agreement with it. As a result AXA currently owns approximately 59.2% of the shares of common stock of AXA Equitable.
Pursuant to the investment advisory agreement, the Fund may reimburse the Adviser for certain legal and accounting services provided to the Fund by the Adviser. For the year ended December 31, 2018, the Adviser voluntarily agreed to waive such fees in the amount of $71,040.
The Fund compensates AllianceBernstein Investor Services, Inc. (“ABIS”), a wholly-owned subsidiary of the Adviser, under a Transfer Agency Agreement for providing personnel and facilities to perform transfer agency services for the Fund. ABIS may make payments to intermediaries that provide omnibus account services,sub-accounting services and/or networking services. The compensation retained by ABIS amounted to $23,149 for the year ended December 31, 2018.
The Fund may invest in AB Government Money Market Portfolio (the “Government Money Market Portfolio”) which has a contractual annual advisory fee rate of ..20% of the portfolio’s average daily net assets and bears its own expenses. Effective August 1, 2018, the Adviser has contractually agreed to waive .10% of the advisory fee of Government Money Market Portfolio until August 31, 2019. In connection with the investment by the Fund in Government Money Market Portfolio, the Adviser has contractually agreed to waive its advisory fee from the Fund in an amount equal to the Fund’s pro rata share of the effective advisory fee of Government Money Market Portfolio, as borne indirectly by the Fund as an acquired fund fee and expense. For year ended December 31, 2018, such waiver amounted to $9,354.
| | |
| |
| 26 | AB FLEXFEE LARGE CAP GROWTH PORTFOLIO | | abfunds.com |
NOTES TO FINANCIAL STATEMENTS(continued)
A summary of the Fund’s transactions in AB mutual funds for the year ended December 31, 2018 is as follows:
| | | | | | | | | | | | | | | | | | | | |
Fund | | Market Value
12/31/17
(000) | | | Purchases
at Cost
(000) | | | Sales
Proceeds
(000) | | | Market Value
12/31/18
(000) | | | Dividend
Income
(000) | |
Government Money Market Portfolio | | $ | 117 | | | $ | 101,106 | | | $ | 93,506 | | | $ | 7,717 | | | $ | 132 | |
Brokerage commissions paid on investment transactions for the year ended December 31, 2018 amounted to $17,128, of which $96 and $0, respectively, was paid to Sanford C. Bernstein & Co. LLC and Sanford C. Bernstein Limited, affiliates of the Adviser.
NOTE C
Investment Transactions
Purchases and sales of investment securities (excluding short-term investments) for the year ended December 31, 2018, were as follows:
| | | | | | | | |
| | | Purchases | | | Sales | |
Investment securities (excluding U.S. government securities) | | $ | 160,388,967 | | | $ | 25,147,320 | |
U.S. government securities | | | – 0 | – | | | – 0 | – |
The cost of investments for federal income tax purposes, gross unrealized appreciation and unrealized depreciation are as follows:
| | | | |
Cost | | $ | 143,659,653 | |
| | | | |
Gross unrealized appreciation | | $ | 2,005,284 | |
Gross unrealized depreciation | | | (8,186,537 | ) |
| | | | |
Net unrealized depreciation | | $ | (6,181,253 | ) |
| | | | |
1. Derivative Financial Instruments
The Fund may use derivatives in an effort to earn income and enhance returns, to replace more traditional direct investments, to obtain exposure to otherwise inaccessible markets (collectively, “investment purposes”), or to hedge or adjust the risk profile of its portfolio.
The Fund did not engage in derivative transactions for the year ended December 31, 2018.
2. Currency Transactions
The Fund may invest innon-U.S. Dollar-denominated securities on a currency hedged or unhedged basis. The Fund may seek investment opportunities by taking long or short positions in currencies through the use of
| | |
| |
| abfunds.com | | AB FLEXFEE LARGE CAP GROWTH PORTFOLIO | 27 |
NOTES TO FINANCIAL STATEMENTS(continued)
currency-related derivatives, including forward currency exchange contracts, futures and options on futures, swaps, and other options. The Fund may enter into transactions for investment opportunities when it anticipates that a foreign currency will appreciate or depreciate in value but securities denominated in that currency are not held by the Fund and do not present attractive investment opportunities. Such transactions may also be used when the Adviser believes that it may be more efficient than a direct investment in a foreign currency-denominated security. The Fund may also conduct currency exchange contracts on a spot basis (i.e., for cash at the spot rate prevailing in the currency exchange market for buying or selling currencies).
NOTE D
Capital Stock
Each class consists of 1,000,000,000 authorized shares. Transactions in capital shares for each class were as follows:
| | | | | | | | | | | | | | | | | | | | | | | | |
| | | | | | | | | | | | | | | | | | | | | | | | |
| | | Shares | | | | | | Amount | | | | |
| | | Year Ended
December 31,
2018 | | | June 28, 2017* to
December 31,
2017 | | | | | | Year Ended
December 31,
2018 | | | June 28, 2017* to
December 31,
2017 | | | | |
| | | | | | | | |
| Advisor Class | | | | | | | | | | | | | | | | | | | | | | | | |
Shares sold | | | 14,410,203 | | | | 113,928 | | | | | | | $ | 173,478,632 | | | $ | 1,150,003 | | | | | |
| | | | | |
Shares issued in reinvestment of dividends and distributions | | | 463 | | | | 67 | | | | | | | | 5,327 | | | | 753 | | | | | |
| | | | | |
Shares redeemed | | | (2,628,665 | ) | | | – 0 | – | | | | | | | (31,149,059 | ) | | | – 0 | – | | | | |
| | | | | |
Net increase | | | 11,782,001 | | | | 113,995 | | | | | | | $ | 142,334,900 | | | $ | 1,150,756 | | | | | |
| | | | | |
| * | Commencement of operations. |
NOTE E
Risks Involved in Investing in the Fund
Foreign(Non-U.S.) Risk—Investments in securities ofnon-U.S. issuers may involve more risk than those of U.S. issuers. These securities may fluctuate more widely in price and may be less liquid due to adverse market, economic, political, regulatory or other factors.
Derivatives Risk—The Fund may enter into derivative transactions such as forwards, options, futures and swaps. Derivatives may be illiquid, difficult to price, and leveraged so that small changes may produce disproportionate losses for the Fund, and subject to counterparty risk to a greater degree than more traditional investments. Derivatives may result in significant losses, including losses that are far greater than the value of the derivatives reflected on the statement of assets and liabilities.
| | |
| |
| 28 | AB FLEXFEE LARGE CAP GROWTH PORTFOLIO | | abfunds.com |
NOTES TO FINANCIAL STATEMENTS(continued)
Indemnification Risk—In the ordinary course of business, the Fund enters into contracts that contain a variety of indemnifications. The Fund’s maximum exposure under these arrangements is unknown. However, the Fund has not had prior claims or losses pursuant to these indemnification provisions and expects the risk of loss thereunder to be remote. Therefore, the Fund has not accrued any liability in connection with these indemnification provisions.
NOTE F
Distributions to Shareholders
The tax character of distributions paid during the fiscal year ended December 31, 2018 and fiscal period ended December 31, 2017 were as follows:
| | | | | | | | |
| | | 2018 | | | 2017 | |
Distributions paid from: | | | | | | | | |
Ordinary income | | $ | 7,127 | | | $ | 6,163 | |
| | | | | | | | |
Total taxable distributions paid | | $ | 7,127 | | | $ | 6,163 | |
| | | | | | | | |
As of December 31, 2018, the components of accumulated earnings/(deficit) on a tax basis were as follows:
| | | | |
Accumulated capital and other losses | | $ | (344,821 | )(a) |
Unrealized appreciation/(depreciation) | | | (6,181,253 | )(b) |
| | | | |
Total accumulated earnings/(deficit) | | $ | (6,526,074 | ) |
| | | | |
| (a) | As of December 31, 2018, the Fund had a net capital loss carryforward of $344,821. |
| (b) | The difference between book-basis and tax-basis unrealized appreciation/(depreciation) is attributable primarily to the tax deferral of losses on wash sales. |
For tax purposes, net realized capital losses may be carried over to offset future capital gains, if any. Funds are permitted to carry forward capital losses for an indefinite period, and such losses will retain their character as either short-term or long-term capital losses. As of December 31, 2018, the Fund had a net short-term capital loss carryforward of $342,049 and a net long-term capital loss carryforward of $2,772, which may be carried forward for an indefinite period.
During the current fiscal year, permanent differences primarily due to the tax treatment of offering costs and the disallowance of a net operating loss resulted in a net decrease in accumulated loss and a net decrease in additional paid-in capital. These reclassifications had no effect on net assets.
NOTE G
Recent Accounting Pronouncements
In August 2018, the Financial Accounting Standards Board issued an Accounting Standards Update, ASU2018-13, Fair Value Measurement
| | |
| |
| abfunds.com | | AB FLEXFEE LARGE CAP GROWTH PORTFOLIO | 29 |
NOTES TO FINANCIAL STATEMENTS(continued)
(Topic 820), Disclosure Framework-Changes to the Disclosure Requirements for Fair Value Measurement which removes, modifies and adds disclosures to Topic 820. The amendments in this ASU2018-13 apply to all entities that are required, under existing U.S. GAAP, to make disclosures about recurring or nonrecurring fair value measurements. The amendments in this ASU2018-13 are effective for all entities for fiscal years, and interim periods within those fiscal years, beginning after December 15, 2019. At this time, management is evaluating the implications of these changes on the financial statements.
In October 2018, the U.S. Securities and Exchange Commission adopted amendments to certain disclosure requirements included in RegulationS-X that had become “redundant, duplicative, overlapping, outdated or superseded, in light of the other Commission disclosure requirements, GAAP or changes in the information environment.” The compliance date for the amendments to RegulationS-X was November 5, 2018 (for reporting period end dates of September 30, 2018 or after). Management has adopted the amendments which simplified certain disclosure requirements on the financial statements.
NOTE H
Subsequent Events
Management has evaluated subsequent events for possible recognition or disclosure in the financial statements through the date the financial statements are issued. Management has determined that there are no material events that would require disclosure in the Fund’s financial statements through this date.
| | |
| |
| 30 | AB FLEXFEE LARGE CAP GROWTH PORTFOLIO | | abfunds.com |
FINANCIAL HIGHLIGHTS
Selected Data For A Share Of Capital Stock Outstanding Throughout Each Period
| | | | | | | | |
| | | Advisor Class | |
| | | Year Ended
December 31,
2018 | | | June 28,
2017(a) to
December 31,
2017 | |
| | | | | | | | |
| | | | |
Net asset value, beginning of period | | | $ 11.18 | | | | $ 10.00 | |
| | | | |
Income From Investment Operations | | | | | | | | |
| | |
Net investment income (loss)(b)(c) | | | (.04 | ) | | | .04 | |
| | |
Net realized and unrealized gain on investment and foreign currency transactions | | | .36 | | | | 1.19 | |
| | | | |
Net increase in net asset value from operations | | | .32 | | | | 1.23 | |
| | | | |
Less: Dividends and Distributions | | | | | | | | |
| | |
Dividends from net investment income | | | (.00 | )(d) | | | (.02 | ) |
| | |
Distributions from net realized gain on investment | | | (.00 | )(d) | | | (.03 | ) |
| | | | |
Total dividends and distributions | | | (.00 | )(d) | | | (.05 | ) |
| | | | |
Net asset value, end of period | | | $ 11.50 | | | | $ 11.18 | |
| | | | |
Total Return | | | | | | | | |
| | |
Total investment return based on net asset value(e) | | | 2.87 | % | | | 12.34 | % |
| | |
Ratios/Supplemental Data | | | | | | | | |
| | |
Net assets, end of period (000’s omitted) | | | $136,746 | | | | $1,274 | |
| | |
Ratio to average net assets of: | | | | | | | | |
| | |
Expenses, net of waivers/reimbursements(f)† | | | 1.10 | %(g) | | | .08 | %(h) |
| | |
Expenses, before waivers/reimbursements(f)† | | | 1.65 | %(g) | | | 37.04 | %(h) |
| | |
Net investment income (loss)(c) | | | (.29 | )% | | | .65 | %(h) |
| | |
Portfolio turnover rate | | | 38 | % | | | 25 | % |
| | | | | | | | |
| |
† Expense ratios exclude the estimated acquired fund fees of affiliated/unaffiliated underlying | |
portfolios | | | .01 | % | | | .02 | % |
| (a) | Commencement of operations. |
| (b) | Based on average shares outstanding. |
| (c) | Net of expenses waived/reimbursed by the Adviser. |
| (d) | Amount is less than $0.005. |
| (e) | Total investment return is calculated assuming an initial investment made at the net asset value at the beginning of the period, reinvestment of all dividends and distributions at net asset value during the period, and redemption on the last day of the period. Total investment return does not reflect the deduction of taxes that a shareholder would pay on fund distributions or the redemption of fund shares. Total investment return for a period of less than one year is not annualized. |
| (f) | In connection with the Fund’s investments in affiliated underlying portfolios, the Fund incurs no direct expenses but bears proportionate shares of the acquired fund fees and expenses (i.e. operating, administrative and investment advisory fees) of the affiliated underlying portfolios. The Adviser has contractually agreed to waive its fees from the Fund in an amount equal to the Fund’s pro rata share of certain acquired fund fees and expenses, and for the year ended December 31, 2018 and the period ended December 31, 2017, such waiver amounted to .01% and .02% (annualized), respectively. |
| (g) | The advisory fee reflected in the Fund’s expense ratio may be higher or lower than the Base Fee plus Performance Adjustment due to the different time periods over which the fee is calculated (i.e., the financial reporting period vs. the Performance Period). |
See notes to financial statements.
| | |
| |
| abfunds.com | | AB FLEXFEE LARGE CAP GROWTH PORTFOLIO | 31 |
REPORT OF INDEPENDENT REGISTERED
PUBLIC ACCOUNTING FIRM
To the Shareholders and the Board of Directors of
AB FlexFee Large Cap Growth Portfolio:
Opinion on the Financial Statements
We have audited the accompanying statement of assets and liabilities of AB FlexFee Large Cap Growth Portfolio (the “Fund”) (one of the portfolios constituting AB Cap Fund, Inc. (the “Company”)), including the portfolio of investments, as of December 31, 2018, and the related statement of operations for the year then ended and the statements of changes in net assets and the financial highlights for the year then ended and the period June 28, 2017 (commencement of operations) to December 31, 2017 and the related notes (collectively referred to as the “financial statements”). In our opinion, the financial statements present fairly, in all material respects, the financial position of the Fund (one of the portfolios constituting AB Cap Fund, Inc.) at December 31, 2018, the results of its operations for the year then ended and the changes in its net assets and its financial highlights for the year then ended and the period June 28, 2017 (commencement of operations) to December 31, 2017, in conformity with U.S. generally accepted accounting principles.
Basis for Opinion
These financial statements are the responsibility of the Company’s management. Our responsibility is to express an opinion on the Fund’s financial statements based on our audits. We are a public accounting firm registered with the Public Company Accounting Oversight Board (United States) (“PCAOB”) and are required to be independent with respect to the Company in accordance with the U.S. federal securities laws and the applicable rules and regulations of the Securities and Exchange Commission and the PCAOB.
We conducted our audits in accordance with the standards of the PCAOB. Those standards require that we plan and perform the audit to obtain reasonable assurance about whether the financial statements are free of material misstatement, whether due to error or fraud. The Company is not required to have, nor were we engaged to perform, an audit of the Company’s internal control over financial reporting. As part of our audits, we are required to obtain an understanding of internal control over financial reporting, but not for the purpose of expressing an opinion on the effectiveness of the Company’s internal control over financial reporting. Accordingly, we express no such opinion.
Our audits included performing procedures to assess the risks of material misstatement of the financial statements, whether due to error or fraud, and performing procedures that respond to those risks. Such procedures included examining, on a test basis, evidence regarding the amounts and
| | |
| |
| 32 | AB FLEXFEE LARGE CAP GROWTH PORTFOLIO | | abfunds.com |
REPORT OF INDEPENDENT REGISTERED
PUBLIC ACCOUNTING FIRM(continued)
disclosures in the financial statements. Our procedures included confirmation of securities owned as of December 31, 2018, by correspondence with the custodian and others or by other appropriate auditing procedures where replies from others were not received. Our audits also included evaluating the accounting principles used and significant estimates made by management, as well as evaluating the overall presentation of the financial statements. We believe that our audits provide a reasonable basis for our opinion.

We have served as the auditor of one or more of the AB investment companies since 1968.
New York, New York
February 26, 2019
| | |
| |
| abfunds.com | | AB FLEXFEE LARGE CAP GROWTH PORTFOLIO | 33 |
2018 FEDERAL TAX INFORMATION
(unaudited)
For Federal income tax purposes, the following information is furnished with respect to the distributions paid by the Fund for the taxable period ended December 31, 2018. For corporate shareholders 23.42% of dividends paid qualify for the dividends received deduction.
For individual shareholders, the Fund designates 100% of dividends paid as qualified dividend income.
| | |
| |
| 34 | AB FLEXFEE LARGE CAP GROWTH PORTFOLIO | | abfunds.com |
RESULTS OF STOCKHOLDER MEETING
(unaudited)
A Special Meeting of Stockholders of the AB Cap Fund, Inc. (the “Company”)—AB FlexFee Large Cap Growth Portfolio (the “Fund”) was held on October 11, 2018. A description of the proposals and number of shares voted at the Meeting are as follows (the proposal number shown below corresponds to the proposal number in the Fund’s proxy statement):
| 1. | To approve and vote upon the election of Directors for the Company, each such Director to serve for a term of indefinite duration and until his or her successor is duly elected and qualifies. |
| | | | | | | | |
Director: | | Voted
For: | | | Authority
Withheld: | |
Michael J. Downey | | | 153,531,217 | | | | 1,117,868 | |
William H. Foulk, Jr.* | | | 153,385,034 | | | | 1,264,050 | |
Nancy P. Jacklin | | | 153,607,746 | | | | 1,041,339 | |
Robert M. Keith | | | 153,546,025 | | | | 1,103,060 | |
Carol C. McMullen | | | 153,649,415 | | | | 999,670 | |
Gary L. Moody | | | 153,545,113 | | | | 1,103,972 | |
Marshall C. Turner, Jr. | | | 153,507,495 | | | | 1,141,590 | |
Earl D. Weiner | | | 153,514,727 | | | | 1,134,358 | |
| 2. | To vote upon the approval of new advisory agreements for the Fund with AllianceBernstein L.P. |
| | | | | | | | | | | | | | |
Voted
For: | | | Voted
Against: | | | Abstain: | | | Broker
Non-Votes: | |
| | 5,781,720 | | | | – 0 | – | | | 10,593 | | | | 1,204,435 | |
| * | Mr. Foulk retired on December 31, 2018. |
| | |
| |
| abfunds.com | | AB FLEXFEE LARGE CAP GROWTH PORTFOLIO | 35 |
BOARD OF DIRECTORS
| | |
Marshall C. Turner, Jr(1), Chairman Michael J. Downey(1) Nancy P. Jacklin(1) | | Robert M. Keith,President and Chief Executive Officer Carol C. McMullen(1) Garry L. Moody(1) Earl D. Weiner(1) |
OFFICERS
| | |
Frank V. Caruso(2), Vice President John H. Fogarty(2), Vice President Vinay Thapar(2),Vice President Emilie D. Wrapp,Secretary Michael B. Reyes,Senior Analyst | | Joseph J. Mantineo,Treasurer and Chief Financial Officer Phyllis J. Clarke,Controller Vincent S. Noto,Chief Compliance Officer |
| | |
Custodian and Accounting Agent Brown Brothers Harriman & Co. 50 Post Office Square Boston, MA 02110 Principal Underwriter AllianceBernstein Investments, Inc. 1345 Avenue of the Americas New York, NY 10105 Transfer Agent AllianceBernstein Investor Services, Inc. P.O. Box 786003 San Antonio, TX 78278-6003 Toll-Free (800)221-6003 | | Independent Registered Public Accounting Firm Ernst & Young LLP 5 Times Square New York, NY 10036 Legal Counsel Seward & Kissel LLP One Battery Park Plaza New York, NY 10004 |
| 1 | Member of the Audit Committee, the Governance and Nominating Committee and the Independent Directors Committee. |
| 2 | Theday-to-day management of, and investment decisions for, the Fund’s portfolio are made by the Adviser’s U.S. Large Cap Growth Investment Team. Messrs. Caruso, Fogarty and Thapar are the investment professionals with the most significant responsibility for theday-to-day management of the Fund’s portfolio. |
| | |
| |
| 36 | AB FLEXFEE LARGE CAP GROWTH PORTFOLIO | | abfunds.com |
MANAGEMENT OF THE FUND
Board of Directors Information
The business and affairs of the Fund are managed under the direction of the Board of Directors. Certain information concerning the Fund’s Directors is set forth below.
| | | | | | | | |
NAME,
ADDRESS*, AGE,
(YEAR FIRST ELECTED**) | | PRINCIPAL
OCCUPATION(S)
DURING PAST FIVE YEARS
AND OTHER INFORMATION*** | | PORTFOLIOS
IN AB FUND
COMPLEX
OVERSEEN BY
DIRECTOR | | | OTHER PUBLIC
COMPANY
DIRECTORSHIPS
CURRENTLY HELD
BY DIRECTOR |
| INTERESTED DIRECTOR | | | | | | |
| | | |
Robert M. Keith,# 1345 Avenue of the Americas New York, NY 10105 58 (2015) | | Senior Vice President of AllianceBernstein L.P. (the “Adviser”) and the head of AllianceBernstein Investments, Inc. (“ABI”) since July 2008; Director of ABI and President of the AB Mutual Funds. Previously, he served as Executive Managing Director of ABI from December 2006 to June 2008. Prior to joining ABI in 2006, Executive Managing Director of Bernstein Global Wealth Management, and prior thereto, Senior Managing Director and Global Head of Client Service and Sales of the Adviser’s institutional investment management business since 2004. Prior thereto, he was Managing Director and Head of North American Client Service and Sales in the Adviser’s institutional investment management business, with which he had been associated since prior to 2004. | | | 95 | | | None |
| | | | | | | | |
| | |
| |
| abfunds.com | | AB FLEXFEE LARGE CAP GROWTH PORTFOLIO | 37 |
MANAGEMENT OF THE FUND(continued)
| | | | | | | | |
NAME,
ADDRESS*, AGE,
(YEAR FIRST ELECTED**) | | PRINCIPAL
OCCUPATION(S)
DURING PAST FIVE YEARS
AND OTHER INFORMATION*** | | PORTFOLIOS
IN AB FUND
COMPLEX
OVERSEEN BY
DIRECTOR | | | OTHER PUBLIC
COMPANY
DIRECTORSHIPS
CURRENTLY HELD
BY DIRECTOR |
DISINTERESTED DIRECTORS
| | | | | | |
| | | |
Marshall C. Turner, Jr.,## Chairman of the Board 77 (2015) | | Private Investor since prior to 2014. Former Chairman and CEO of Dupont Photomasks, Inc. (components of semi-conductor manufacturing). He has extensive operating leadership, and venture capital investing experience, including five interim or full-time CEO roles, and prior service as general partner of institutional venture capital partnerships. He also has extensive non-profit board leadership experience, and currently serves on the boards of two education and science-related non-profit organizations. He has served as a director of one AB Fund since 1992, and director or trustee of multiple AB funds since 2005. He has been Chairman of the AB Funds since January 2014, and the Chairman of the Independent Directors Committees of such AB Funds since February 2014. | | | 95 | | | Xilinx, Inc. (programmable logicsemi-conductors) since 2007 |
| | | | | | | | |
| | | |
Michael J. Downey,## 75 (2015) | | Private Investor since prior to 2014. Formerly, managing partner of Lexington Capital, LLC (investment advisory firm) from December 1997 until December 2003. He also served as a Director of Prospect Acquisition Corp. (financial services) from 2007 until 2009. From 1987 until 1993, Chairman and CEO of Prudential Mutual Fund Management, director of the Prudential mutual funds, and member of the Executive Committee of Prudential Securities Inc. He has served as a director or trustee of the AB Funds since 2005 and is a director and Chairman of one other registered investment company. | | | 95 | | | The Asia Pacific Fund, Inc. (registered investment company) since prior to 2014 |
| | |
| |
| 38 | AB FLEXFEE LARGE CAP GROWTH PORTFOLIO | | abfunds.com |
MANAGEMENT OF THE FUND(continued)
| | | | | | | | |
NAME,
ADDRESS*, AGE,
(YEAR FIRST ELECTED**) | | PRINCIPAL
OCCUPATION(S)
DURING PAST FIVE YEARS
AND OTHER INFORMATION*** | | PORTFOLIOS
IN AB FUND
COMPLEX
OVERSEEN BY
DIRECTOR | | | OTHER PUBLIC
COMPANY
DIRECTORSHIPS
CURRENTLY HELD
BY DIRECTOR |
DISINTERESTED DIRECTORS
(continued) | | | | | | |
| | | |
Nancy P. Jacklin,## 70 (2015) | | Private Investor since prior to 2014. Professorial Lecturer at the Johns Hopkins School of Advanced International Studies (2008-2015). U.S. Executive Director of the International Monetary Fund (which is responsible for ensuring the stability of the international monetary system), (December 2002-May 2006); Partner, Clifford Chance (1992-2002); Sector Counsel, International Banking and Finance, and Associate General Counsel, Citicorp (1985-1992); Assistant General Counsel (International), Federal Reserve Board of Governors (1982-1985); and Attorney Advisor, U.S. Department of the Treasury (1973-1982). Member of the Bar of the District of Columbia and of New York; and member of the Council on Foreign Relations. She has served as a director or trustee of the AB Funds since 2006 and has been Chair of the Governance and Nominating Committees of the AB Funds since August 2014. | | | 95 | | | None |
| | |
| |
| abfunds.com | | AB FLEXFEE LARGE CAP GROWTH PORTFOLIO | 39 |
MANAGEMENT OF THE FUND(continued)
| | | | | | | | |
NAME,
ADDRESS*, AGE,
(YEAR FIRST ELECTED**) | | PRINCIPAL
OCCUPATION(S)
DURING PAST FIVE YEARS
AND OTHER INFORMATION*** | | PORTFOLIOS
IN AB FUND
COMPLEX
OVERSEEN BY
DIRECTOR | | | OTHER PUBLIC
COMPANY
DIRECTORSHIPS
CURRENTLY HELD
BY DIRECTOR |
DISINTERESTED DIRECTORS
(continued) | | | | | | |
| | | |
Carol C. McMullen,## 63 (2016) | | Managing Director of Slalom Consulting (consulting) since 2014 and private investor and member of the Partners Healthcare Investment Committee. Formerly, Director of Norfolk & Dedham Group (mutual property and casualty insurance) from 2011 until November 2016; Director of Partners Community Physicians Organization (healthcare) from 2014 until December 2016; and Managing Director of The Crossland Group (consulting) from 2012 until 2013. She has held a number of senior positions in the asset and wealth management industries, including at Eastern Bank (where her roles included President of Eastern Wealth Management), Thomson Financial (Global Head of Sales for Investment Management), and Putnam Investments (where her roles included Head of Global Investment Research). She has served on a number of private company and non-profit boards, and as a director or trustee of the AB Funds since June 2016. | | | 95 | | | None |
| | | | | | | | |
| | |
| |
| 40 | AB FLEXFEE LARGE CAP GROWTH PORTFOLIO | | abfunds.com |
MANAGEMENT OF THE FUND(continued)
| | | | | | | | |
NAME,
ADDRESS*, AGE,
(YEAR FIRST ELECTED**) | | PRINCIPAL
OCCUPATION(S)
DURING PAST FIVE YEARS
AND OTHER INFORMATION*** | | PORTFOLIOS
IN AB FUND
COMPLEX
OVERSEEN BY
DIRECTOR | | | OTHER PUBLIC
COMPANY
DIRECTORSHIPS
CURRENTLY HELD
BY DIRECTOR |
DISINTERESTED DIRECTORS
(continued) | | | | | | |
| | | |
Garry L. Moody,## 66 (2015) | | Independent Consultant. Formerly, Partner, Deloitte & Touche LLP (1995-2008) where he held a number of senior positions, including Vice Chairman, and U.S. and Global Investment Management Practice Managing Partner; President, Fidelity Accounting and Custody Services Company (1993-1995), where he was responsible for the accounting, pricing, custody and reporting for the Fidelity mutual funds; and Partner, Ernst & Young LLP (1975-1993), where he served as the National Director of Mutual Fund Tax Services and Managing Partner of its Chicago Office Tax department. He is a member of the Trustee Advisory Board of BoardIQ, a biweekly publication focused on issues and news affecting directors of mutual funds. He has served as a director or trustee and as Chairman of the Audit Committees of the AB Funds since 2008. | | | 95 | | | None |
| | | | | | | | |
| | | |
Earl D. Weiner,## 79 (2015) | | Of Counsel, and Partner prior to January 2007, of the law firm Sullivan & Cromwell LLP and is a former member of the ABA Federal Regulation of Securities Committee Task Force to draft editions of the Fund Director’s Guidebook. He also serves as a director or trustee of various non-profit organizations and has served as Chairman or Vice Chairman of a number of them. He has served as a director or trustee of the AB Funds since 2007 and served as Chairman of the Governance and Nominating Committees of the AB Funds from 2007 until August 2014. | | | 95 | | | None |
| | |
| |
| abfunds.com | | AB FLEXFEE LARGE CAP GROWTH PORTFOLIO | 41 |
MANAGEMENT OF THE FUND(continued)
| * | The address for each of the Fund’s disinterested Directors is c/o AllianceBernstein L.P., Attention: Legal & Compliance Department—Mutual Fund Legal, 1345 Avenue of the Americas, New York, NY 10105. |
| ** | There is no stated term of office for the Fund’s Directors. |
| *** | The information above includes each Director’s principal occupation during the last five years and other information relating to the experience, attributes and skills relevant to each Director’s qualifications to serve as a Director, which led to the conclusion that each Director should serve as a Director for the Fund. |
| # | Mr. Keith is an “interested person” of the Fund, as defined in the 1940 Act, due to his position as a Senior Vice President of the Adviser. |
| ## | Member of the Audit Committee, the Governance and Nominating Committee and the Independent Directors Committee. |
| | |
| |
| 42 | AB FLEXFEE LARGE CAP GROWTH PORTFOLIO | | abfunds.com |
MANAGEMENT OF THE FUND(continued)
Officer Information
| | | | |
NAME, ADDRESS*
AND AGE | | POSITION(S)
HELD WITH FUND | | PRINCIPAL OCCUPATION
DURING PAST 5 YEARS |
Robert M. Keith,
58 | | President and Chief Executive Officer | | See biography above. |
| | | | |
Frank V. Caruso,
62 | | Vice President | | Senior Vice President of the Adviser**, with which he has been associated since prior to 2014. He is Chief Investment Officer of US Growth Equities. |
| | | | |
John H. Fogarty,
49 | | Vice President | | Senior Vice President of the Adviser**, with which he has been associated since prior to 2014. |
| | | | |
Vinay Thapar 40 | | Vice President | | Senior Vice President of the Adviser**, with which he has been associated since prior to 2014. |
| | | | |
Emilie D. Wrapp,
63 | | Secretary | | Senior Vice President, Assistant General Counsel and Assistant Secretary of ABI**, with which she has been associated since prior to 2014. |
| | | | |
Michael B. Reyes, 42 | | Senior Analyst | | Vice President of the Adviser**, with which he has been associated since prior to 2014. |
| | | | |
Joseph J. Mantineo,
59 | | Treasurer and Chief Financial Officer | | Senior Vice President of AllianceBernstein Investor Services (“ABIS”)**, with which he has been associated since prior to 2014. |
| | | | |
Phyllis J. Clarke,
58 | | Controller | | Vice President of ABIS**, with which she has been associated since prior to 2014. |
| | | | |
Vince S. Noto,
54 | | Chief Compliance Officer | | Senior Vice President since 2015 and Mutual Fund Chief Compliance Officer of the Adviser** since 2014. Prior thereto, he was Vice President and Director of Mutual Fund Compliance of the Adviser** since 2012. |
| * | The address for each of the Fund’s Officers is 1345 Avenue of the Americas, New York, NY 10105. |
| ** | The Adviser, ABI and ABIS are affiliates of the Fund. |
The Fund’s Statement of Additional Information (“SAI”) has additional information about the Fund’s Directors and Officers and is available without charge upon request. Contact your financial representative or AB at(800) 227-4618, or visit www.abfunds.com, for a free prospectus or SAI.
| | |
| |
| abfunds.com | | AB FLEXFEE LARGE CAP GROWTH PORTFOLIO | 43 |
Information Regarding the Review and Approval of the Fund’s Advisory Agreement
As described in more detail in the Proxy Statement for the AB Funds dated August 20, 2018, the Boards of the AB Funds, at a meeting held onJuly 31-August 2, 2018, approved new advisory agreements with the Adviser (the “Proposed Agreements”) for the AB Funds, including AB Cap Fund, Inc. in respect of AB FlexFeeTM Large Cap Growth Portfolio (the “Fund”), in connection with the planned disposition by AXA S.A. of its remaining shares of AXA Equitable Holdings, Inc. (the indirect holder of a majority of the partnership interests in the Adviser and the indirect parent of AllianceBernstein Corporation, the general partner of the Adviser) in one or more transactions and the related potential for one or more “assignments” (within the meaning of section 2(a)(4) of the Investment Company Act) of the advisory agreements for the AB Funds, including the Fund’s Advisory Agreement, resulting in the automatic termination of such advisory agreements.
At the same meeting, the AB Boards also considered and approved interim advisory agreements with the Adviser (the “Interim Advisory Agreements”) for the AB Funds, including the Fund, to be effective only in the event that stockholder approval of a Proposed Agreement had not been obtained as of the date of one or more transactions resulting in an “assignment” of the Adviser’s advisory agreements, resulting in the automatic termination of such advisory agreements.
The shareholders of the Fund subsequently approved the Proposed Agreements at an annual meeting of shareholders called for the purpose of electing Directors and voting on the Proposed Agreements.
A discussion regarding the basis for the Boards’ approvals at a meeting held onJuly 31-August 2, 2018 is set forth below.
Information Regarding the Review and Approval of the Fund’s Proposed New Advisory Agreement and Interim Advisory Agreement in the Context of Potential Assignments
At a meeting of the AB Boards held on July31-August 2, 2018, the Adviser presented its recommendation that the Boards consider and approve the Proposed Agreements. Section 15(c) of the 1940 Act provides that, after an initial period, a Fund’s Current Agreement and currentsub-advisory agreement, as applicable, will remain in effect only if the Board, including a majority of the Independent Directors, annually reviews and approves them. Each of the Current Agreements had been approved by a Board within theone-year period prior to approval of its related Proposed Agreement, except that the Current Agreements for certain FlexFee funds were approved in February 2017. In connection with their approval of the Proposed Agreements, the Boards considered their conclusions in connection with their most recent approvals of the Current Agreements, in particular in cases where the last approval of a Current Agreement was relatively recent,
| | |
| |
| 44 | AB FLEXFEE LARGE CAP GROWTH PORTFOLIO | | abfunds.com |
including the Boards’ general satisfaction with the nature and quality of services being provided and, as applicable, in the case of certain Funds, actions taken or to be taken in an effort to improve investment performance or reduce expense ratios. The Directors also reviewed updated information provided by the Adviser in respect of each Fund. Also in connection with their approval of the Proposed Agreements, the Boards considered a representation made to them at that time by the Adviser that there were no additional developments not already disclosed to the Boards since their most recent approvals of the Current Agreements that would be a material consideration to the Boards in connection with their consideration of the Proposed Agreements, except for matters disclosed to the Boards by the Adviser. The Directors considered the fact that each Proposed Agreement would have corresponding terms and conditions identical to those of the corresponding Current Agreement with the exception of the effective date and initial term under the Proposed Agreement.
The Directors considered their knowledge of the nature and quality of the services provided by the Adviser to each Fund gained from their experience as directors or trustees of registered investment companies advised by the Adviser, their overall confidence in the Adviser’s integrity and competence they have gained from that experience, the Adviser’s initiative in identifying and raising potential issues with the Directors and its responsiveness, frankness and attention to concerns raised by the Directors in the past, including the Adviser’s willingness to consider and implement organizational and operational changes designed to improve investment results and the services provided to the Funds. The Directors noted that they have four regular meetings each year, at each of which they review extensive materials and information from the Adviser, including information on the investment performance of each Fund.
The Directors also considered all factors they believed relevant, including the specific matters discussed below. During the course of their deliberations, the Directors evaluated, among other things, the reasonableness of the management fees of the Funds they oversee. The Directors did not identify any particular information that wasall-important or controlling, and different Directors may have attributed different weights to the various factors. The Directors determined that the selection of the Adviser to manage the Funds, and the overall arrangements between the Funds and the Adviser, as provided in the Proposed Agreements, including the management fees, were fair and reasonable in light of the services performed under the Current Agreements and to be performed under the Proposed Agreements, expenses incurred and to be incurred and such other matters as the Directors considered relevant in the exercise of their business judgment. The material factors and conclusions that formed the basis for the Directors’ determinations included the following:
Nature, Extent and Quality of Services Provided
The Directors considered the scope and quality of services to be provided by the Adviser under the Proposed Agreements, including the quality of
| | |
| |
| abfunds.com | | AB FLEXFEE LARGE CAP GROWTH PORTFOLIO | 45 |
the investment research capabilities of the Adviser and the other resources it has dedicated to performing services for the Funds. They also considered the information that had been provided to them by the Adviser concerning the anticipated implementation of the Plan and the Adviser’s representation that it did not anticipate that such implementation would affect the management or structure of the Adviser, have a material adverse effect on the Adviser, or adversely affect the quality of the services provided to the Funds by the Adviser and its affiliates. The Directors noted that the Adviser from time to time reviews each Fund’s investment strategies and from time to time proposes changes intended to improve the Fund’s relative or absolute performance for the Directors’ consideration. They also noted the professional experience and qualifications of each Fund’s portfolio management team and other senior personnel of the Adviser. The Directors also considered that certain Proposed Agreements, similar to the corresponding Current Agreements, provide that the Funds will reimburse the Adviser for the cost to it of providing certain clerical, accounting, administrative and other services to the Funds by employees of the Adviser or its affiliates. Requests for these reimbursements are made on a quarterly basis and subject to approval by the Directors. The Directors noted that the Adviser did not request any reimbursements from certain Funds in the Fund’s latest fiscal year reviewed. The Directors noted that the methodology to be used to determine the reimbursement amounts had been reviewed by an independent consultant retained by the Funds’ former Senior Officer/Independent Compliance Officer. The quality of administrative and other services, including the Adviser’s role in coordinating the activities of the Funds’ other service providers, also was considered. The Directors of each Fund concluded that, overall, they were satisfied with the nature, extent and quality of services to be provided to the Funds under the Proposed Agreement for the Fund.
Costs of Services to be Provided and Profitability
The Directors reviewed a schedule of the revenues and expenses and related notes indicating the profitability of each Fund to the Adviser for calendar years 2016 and 2017, as applicable, that had been prepared with an expense allocation methodology arrived at in consultation with an independent consultant retained by the Funds’ former Senior Officer/Independent Compliance Officer. The Directors noted the assumptions and methods of allocation used by the Adviser in preparing fund-specific profitability data and understood that there are a number of potentially acceptable allocation methodologies for information of this type. The Directors noted that the profitability information reflected all revenues and expenses of the Adviser’s relationship with a Fund, including those relating to its subsidiaries that provide transfer agency, distribution and brokerage services to the Fund, as applicable. The Directors recognized that it is difficult to make comparisons of the profitability of the Proposed Agreements with the profitability of fund advisory contracts for unaffiliated funds because comparative information is not generally publicly available and is
| | |
| |
| 46 | AB FLEXFEE LARGE CAP GROWTH PORTFOLIO | | abfunds.com |
affected by numerous factors. The Directors focused on the profitability of the Adviser’s relationship with each Fund before taxes and distribution expenses, as applicable. The Directors noted that certain Funds were not profitable to the Adviser in one or more periods reviewed. The Directors concluded that the Adviser’s level of profitability from its relationship with the other Funds was not unreasonable. The Directors were unable to consider historical information about the profitability of certain Funds that had recently commenced operations and for which historical profitability information was not available. The Adviser agreed to provide the Directors with profitability information in connection with future proposed continuances of the Proposed Agreements.
Fall-Out Benefits
The Directors considered the other benefits to the Adviser and its affiliates from their relationships with the Funds, including, but not limited to, as applicable, benefits relating to soft dollar arrangements (whereby investment advisers receive brokerage and research services from brokers that execute agency transactions for their clients) in the case of certain Funds;12b-1 fees and sales charges received by the principal underwriter (which is a wholly owned subsidiary of the Adviser) in respect of certain classes of the shares of most of the Funds; brokerage commissions paid by certain Funds to brokers affiliated with the Adviser; and transfer agency fees paid by most of the Funds to a wholly owned subsidiary of the Adviser. The Directors recognized that the Adviser’s profitability would be somewhat lower, and that a Fund’s unprofitability to the Adviser would be exacerbated, without these benefits. The Directors understood that the Adviser also might derive reputational and other benefits from its association with the Funds.
Investment Results
In addition to the information reviewed by the Directors in connection with the Board meeting at which the Proposed Agreements were approved, the Directors receive detailed performance information for the Funds at each regular Board meeting during the year.
The Boards’ consideration of each Proposed Agreement was informed by their most recent approval of the related Current Agreement, and, in the case of certain Funds, their discussion with the Adviser of the reasons for those Funds’ underperformance in certain periods. The Directors also reviewed updated performance information and, in some cases, discussed with the Adviser the reasons for changes in performance or continued underperformance. On the basis of this review, the Directors concluded that each Fund’s investment performance was acceptable.
Management Fees and Other Expenses
The Directors considered the management fee rate payable by each Fund to the Adviser and information prepared by an independent service provider
| | |
| |
| abfunds.com | | AB FLEXFEE LARGE CAP GROWTH PORTFOLIO | 47 |
(the “15(c) provider”) concerning management fee rates payable by other funds in the same category as the Fund. The Directors recognized that it is difficult to make comparisons of management fees because there are variations in the services that are included in the fees paid by other funds. The Directors compared each Fund’s contractual management fee rate with a peer group median, and where applicable, took into account the impact on the management fee rate of the administrative expense reimbursement paid to the Adviser in the latest fiscal year. In the case of the ACS Funds, the Directors noted that the management fee rate is zero but also were cognizant that the Adviser is indirectly compensated by the wrap fee program sponsors that use the ACS Funds as an investment vehicle for their clients.
The Directors also considered the Adviser’s fee schedule for other clients pursuing a similar investment style to each Fund. For this purpose, they reviewed the relevant advisory fee information from the Adviser’s Form ADV and in a report from the Funds’ Senior Analyst and noted the differences between a Fund’s fee schedule, on the one hand, and the Adviser’s institutional fee schedule and the schedule of fees charged by the Adviser to any offshore funds and for services to anysub-advised funds pursuing a similar investment strategy as the Fund, on the other, as applicable. The Directors noted that the Adviser may, in some cases, agree to fee rates with large institutional clients that are lower than those reviewed by the Directors and that they had previously discussed with the Adviser its policies in respect of such arrangements. The Adviser also informed the Directors that, in the case of certain Funds, there were no institutional products managed by the Adviser that have a substantially similar investment style. The Directors also discussed these matters with their independent fee consultant.
The Adviser reviewed with the Directors the significantly greater scope of the services it provides to each Fund relative to institutional, offshore fund andsub-advised fund clients, as applicable. In this regard, the Adviser noted, among other things, that, compared to institutional and offshore orsub-advisory accounts, each Fund, as applicable, (i) demands considerably more portfolio management, research and trading resources due to significantly higher daily cash flows (in the case ofopen-end Funds); (ii) has more tax and regulatory restrictions and compliance obligations; (iii) must prepare and file or distribute regulatory and other communications about fund operations; and (iv) must provide shareholder servicing to retail investors. The Adviser also reviewed the greater legal risks presented by the large and changing population of Fund shareholders who may assert claims against the Adviser in individual or class actions, and the greater entrepreneurial risk in offering new fund products, which require substantial investment to launch, may not succeed, and generally must be priced to compete with larger, more established funds resulting in lack of profitability to the Adviser until a new fund achieves scale. In light of the substantial differences in services rendered by the Adviser to institutional,
| | |
| |
| 48 | AB FLEXFEE LARGE CAP GROWTH PORTFOLIO | | abfunds.com |
offshore fund andsub-advised fund clients as compared to the Funds, and the different risk profile, the Directors considered these fee comparisons inapt and did not place significant weight on them in their deliberations.
The Directors noted that many of the Funds may invest in shares of exchange-traded funds (“ETFs”), subject to the restrictions and limitations of the 1940 Act as these may be varied as a result of exemptive orders issued by the SEC. The Directors also noted that ETFs pay advisory fees pursuant to their advisory contracts. The Directors concluded, based on the Adviser’s explanation of how it uses ETFs when they are the most cost-effective way to obtain desired exposures, in some cases pending purchases of underlying securities, that each Fund’s management fee would be for services that would be in addition to, rather than duplicative of, the services provided under the advisory contracts of the ETFs.
With respect to each Fund’s management fee, the Directors considered the total expense ratio of the Fund in comparison to a peer group and peer universe selected by the 15(c) service provider. The Directors also considered the Adviser’s expense caps for certain Funds. The Directors view expense ratio information as relevant to their evaluation of the Adviser’s services because the Adviser is responsible for coordinating services provided to a Fund by others.
The Boards’ consideration of each Proposed Agreement was informed by their most recent approval of the related Current Agreement, and, in the case of certain Funds, their discussion with the Adviser of the reasons for those Funds’ expense ratios in certain periods. The Directors also reviewed updated expense ratio information and, in some cases, discussed with the Adviser the reasons for the expense ratios of certain Funds. On the basis of this review, the Directors concluded that each Fund’s expense ratio was acceptable.
The Directors did not consider comparative expense information for the ACS Funds because those Funds do not bear ordinary expenses.
Economies of Scale
The Directors noted that the management fee schedules for certain Funds do not contain breakpoints and that they had discussed their strong preference for breakpoints in advisory contracts with the Adviser. The Directors took into consideration prior presentations by an independent consultant on economies of scale in the mutual fund industry and for the Funds, and by the Adviser concerning certain of its views on economies of scale. The Directors also had requested and received from the Adviser certain updates on economies of scale in advance of the Board meeting. The Directors believe that economies of scale may be realized (if at all) by the Adviser across a variety of products and services, and not only in respect of a single fund. The Directors noted that there is no established methodology for setting breakpoints that give effect to the fund-specific
| | |
| |
| abfunds.com | | AB FLEXFEE LARGE CAP GROWTH PORTFOLIO | 49 |
services provided by a fund’s adviser and to the economies of scale that an adviser may realize in its overall mutual fund business or those components of it which directly or indirectly affect a fund’s operations. The Directors observed that in the mutual fund industry as a whole, as well as among funds similar to each Fund, there is no uniformity or pattern in the fees and asset levels at which breakpoints (if any) apply. The Directors also noted that the advisory agreements for many funds do not have breakpoints at all. The Directors informed the Adviser that they would monitor the asset levels of the Funds without breakpoints and their profitability to the Adviser and anticipated revisiting the question of breakpoints in the future if circumstances warrant doing so.
The Directors did not consider the extent to which fee levels in the Advisory Agreement for the ACS Funds reflect economies of scale because that Advisory Agreement does not provide for any compensation to be paid to the Adviser by the ACS Funds and the expense ratio of each of those Funds is zero.
Interim Advisory Agreements
In approving the Interim Advisory Agreements, the Boards, with the assistance of independent counsel, considered similar factors to those considered in approving the Proposed Agreements. The Interim Advisory Agreements approved by the Boards are identical to the Proposed Agreements, as well as the Current Agreements, in all material respects except for their proposed effective and termination dates and provisions intended to comply with the requirements of the relevant SEC rule, such as provisions requiring escrow of advisory fees. Under the Interim Advisory Agreements, the Adviser would continue to manage a Fund pursuant to an Interim Advisory Agreement until a new advisory agreement was approved by stockholders or until the end of the150-day period, whichever would occur earlier. All fees earned by the Adviser under an Interim Advisory Agreement would be held in escrow pending shareholder approval of the Proposed Agreement. Upon approval of a new advisory agreement by stockholders, the escrowed management fees would be paid to the Adviser, and the Interim Advisory Agreement would terminate.
| | |
| |
| 50 | AB FLEXFEE LARGE CAP GROWTH PORTFOLIO | | abfunds.com |
This page is not part of the Shareholder Report or the Financial Statements.
AB FAMILY OF FUNDS
US EQUITY
US CORE
Core Opportunities Fund
FlexFee™ US Thematic Portfolio
Select US Equity Portfolio
US GROWTH
Concentrated Growth Fund
Discovery Growth Fund
FlexFee™ Large Cap Growth Portfolio
Growth Fund
Large Cap Growth Fund
Small Cap Growth Portfolio
US VALUE
Discovery Value Fund
Equity Income Fund
Relative Value Fund
Small Cap Value Portfolio
Value Fund
INTERNATIONAL/ GLOBAL EQUITY
INTERNATIONAL/ GLOBAL CORE
FlexFee™ International Strategic Core Portfolio
Global Core Equity Portfolio
International Portfolio
International Strategic Core Portfolio
Sustainable Global Thematic Fund
Tax-Managed International Portfolio
Tax-Managed Wealth Appreciation Strategy
Wealth Appreciation Strategy
INTERNATIONAL/ GLOBAL GROWTH
Concentrated International Growth Portfolio
FlexFee™ Emerging Markets Growth Portfolio
INTERNATIONAL/ GLOBAL EQUITY(continued)
Sustainable International Thematic Fund
INTERNATIONAL/ GLOBAL VALUE
All China Equity Portfolio
International Value Fund
FIXED INCOME
MUNICIPAL
High Income Municipal Portfolio
Intermediate California Municipal Portfolio
Intermediate Diversified Municipal Portfolio
Intermediate New York Municipal Portfolio
Municipal Bond Inflation Strategy
Tax-Aware Fixed Income Portfolio
National Portfolio
Arizona Portfolio
California Portfolio
Massachusetts Portfolio
Minnesota Portfolio
New Jersey Portfolio
New York Portfolio
Ohio Portfolio
Pennsylvania Portfolio
Virginia Portfolio
TAXABLE
Bond Inflation Strategy
FlexFee™ High Yield Portfolio1
FlexFee™ International Bond Portfolio
Global Bond Fund
High Income Fund
Income Fund
Intermediate Bond Portfolio
Limited Duration High Income Portfolio
Short Duration Portfolio
ALTERNATIVES
All Market Real Return Portfolio
Global Real Estate Investment Fund
Select US Long/Short Portfolio
Unconstrained Bond Fund
MULTI-ASSET
All Market Income Portfolio
All Market Total Return Portfolio
Conservative Wealth Strategy
Emerging Markets Multi-Asset Portfolio
Global Risk Allocation Fund
Tax-Managed All Market Income Portfolio
TARGET-DATE
Multi-Manager Select Retirement Allocation Fund
Multi-Manager Select 2010 Fund
Multi-Manager Select 2015 Fund
Multi-Manager Select 2020 Fund
Multi-Manager Select 2025 Fund
Multi-Manager Select 2030 Fund
Multi-Manager Select 2035 Fund
Multi-Manager Select 2040 Fund
Multi-Manager Select 2045 Fund
Multi-Manager Select 2050 Fund
Multi-Manager Select 2055 Fund
Multi-Manager Select 2060 Fund
CLOSED-END FUNDS
Alliance California Municipal Income Fund
AllianceBernstein Global High Income Fund
AllianceBernstein National Municipal Income Fund
We also offer Government Money Market Portfolio, which serves as the money market fund exchange vehicle for the AB mutual funds. You could lose money by investing in the Fund. Although the Fund seeks to preserve the value of your investment at $1.00 per share, it cannot guarantee it will do so. The Fund may impose a fee upon sale of your shares or may temporarily suspend your ability to sell shares if the Fund’s liquidity falls below required minimums because of market conditions or other factors. An investment in the Fund is not insured or guaranteed by the Federal Deposit Insurance Corporation or any other government agency. The Fund’s sponsor has no legal obligation to provide financial support to the Fund, and you should not expect that the sponsor will provide financial support to the Fund at any time.
Investors should consider the investment objectives, risks, charges and expenses of the Fund carefully before investing. For copies of our prospectus or summary prospectus, which contain this and other information, visit us online at www.abfunds.com or contact your AB representative. Please read the prospectus and/or summary prospectus carefully before investing.
| 1 | Prior to February 23, 2018, FlexFee High Yield Portfolio was named High Yield Portfolio. |
| | |
| |
| abfunds.com | | AB FLEXFEE LARGE CAP GROWTH PORTFOLIO | 51 |
NOTES
| | |
| |
| 52 | AB FLEXFEE LARGE CAP GROWTH PORTFOLIO | | abfunds.com |
AB FLEXFEE LARGE CAP GROWTH PORTFOLIO
1345 Avenue of the Americas
New York, NY 10105
800 221 5672
FFLCG-0151-1218 
DEC 12.31.18

ANNUAL REPORT
AB FLEXFEETM US THEMATIC PORTFOLIO

Beginning January 1, 2021, as permitted by new regulations adopted by the Securities and Exchange Commission, the Fund’s annual and semi-annual shareholder reports will no longer be sent by mail, unless you specifically request paper copies of the reports. Instead, the reports will be made available on a website, and you will be notified by mail each time a report is posted and provided with a website address to access the report.
If you already elected to receive shareholder reports electronically, you will not be affected by this change and you need not take any action. You may elect to receive shareholder reports and other communications from the Fund electronically at any time by contacting your financial intermediary (such as a broker-dealer or bank) or, if you are a direct investor, by calling the Fund at (800) 221 5672.
You may elect to receive all future reports in paper form free of charge. If you invest through a financial intermediary, you can contact your financial intermediary to request that you continue to receive paper copies of your shareholder reports; if you invest directly with the Fund, you can call the Fund at (800) 221 5672. Your election to receive reports in paper form will apply to all funds held in your account with your financial intermediary or, if you invest directly, to all AB Mutual Funds you hold.
| | |
| |
| Investment Products Offered | | • Are Not FDIC Insured• May Lose Value• Are Not Bank Guaranteed |
Investors should consider the investment objectives, risks, charges and expenses of the Fund carefully before investing. For copies of our prospectus or summary prospectus, which contain this and other information, visit us online at www.abfunds.com or contact your AB representative. Please read the prospectus and/or summary prospectus carefully before investing.
This shareholder report must be preceded or accompanied by the Fund’s prospectus for individuals who are not current shareholders of the Fund.
You may obtain a description of the Fund’s proxy voting policies and procedures, and information regarding how the Fund voted proxies relating to portfolio securities during the most recent12-month period ended June 30, without charge. Simply visit AB’s website at www.abfunds.com, or go to the Securities and Exchange Commission’s (the “Commission”) website at www.sec.gov, or call AB at (800) 227 4618.
The Fund files its complete schedule of portfolio holdings with the Commission for the first and third quarters of each fiscal year. The Fund’s portfolio holdings reports are available on the Commission’s website at www.sec.gov. The Fund’s portfolio holdings reports may also be reviewed and copied at the Commission’s Public Reference Room in Washington, DC; information on the operation of the Public Reference Room may be obtained by calling (800) SEC 0330. AB publishes full portfolio holdings for the Fund monthly at www.abfunds.com.
AllianceBernstein Investments, Inc. (ABI) is the distributor of the AB family of mutual funds. ABI is a member of FINRA and is an affiliate of AllianceBernstein L.P., the Adviser of the funds.
The [A/B] logo is a registered service mark of AllianceBernstein and AllianceBernstein® is a registered service mark used by permission of the owner, AllianceBernstein L.P.
| | |
| FROM THE PRESIDENT | |  |
Dear Shareholder,
We are pleased to provide this report for AB FlexFee US Thematic Portfolio (the “Fund”). Please review the discussion of Fund performance, the market conditions during the reporting period and the Fund’s investment strategy.
As always, AB strives to keep clients ahead of what’s next by:
| + | | Transforming uncommon insights into uncommon knowledge with a global research scope |
| + | | Navigating markets with seasoned investment experience and sophisticated solutions |
| + | | Providing thoughtful investment insights and actionable ideas |
Whether you’re an individual investor or a multi-billion-dollar institution, we put knowledge and experience to work for you.
AB’s global research organization connects and collaborates across platforms and teams to deliver impactful insights and innovative products. Better insights lead to better opportunities—anywhere in the world.
For additional information about AB’s range of products and shareholder resources, please log on to www.abfunds.com.
Thank you for your investment in the AB Mutual Funds.
Sincerely,

Robert M. Keith
President and Chief Executive Officer, AB Mutual Funds
| | |
| |
| abfunds.com | | AB FLEXFEE US THEMATIC PORTFOLIO | 1 |
ANNUAL REPORT
February 19, 2019
This report provides management’s discussion of fund performance for AB FlexFee US Thematic Portfolio for the annual reporting period ended December 31, 2018.
The Fund’s investment objective is long-term growth of capital.
NAV RETURNS AS OF DECEMBER 31, 2018(unaudited)
| | | | | | | | |
| | |
| | | 6 Months | | | 12 Months | |
| | |
| AB FLEXFEE US THEMATIC PORTFOLIO | | | | | | | | |
| | |
| Advisor Class Shares | | | -7.56% | | | | -4.15% | |
| | |
| S&P 500 Index | | | -6.85% | | | | -4.38% | |
INVESTMENT RESULTS
The table above shows the Fund’s performance compared to its benchmark, the Standard and Poor’s (“S&P”) 500 Index, for thesix- and12-month periods ended December 31, 2018.
The Fund underperformed the benchmark for thesix-month period, and outperformed for the12-month period. The Fund’s performance-based advisory fee was accrued between its minimum- andmid-point rates for the performance period from June 28, 2017 through December 31, 2018.
For both periods, holdings in the Sustainable Planet theme, which focuses on companies applying innovative solutions to the world’s greatest environmental challenges including water, waste and energy generation, detracted from absolute returns. Holdings in ConsumerCare, which invests in companies leveraging digital medical data to achieve better health outcomes in the face of constrained consumer and government budgets, contributed. For the12-month period, security selection in the technology and consumer-discretionary sectors detracted, relative to the benchmark, while holdings in financials and industrials contributed. For thesix-month period, stock selection in the technology and consumer-discretionary sectors were the biggest detractors from performance. Stock selection in industrials contributed.
The Fund did not utilize derivatives during either period.
MARKET REVIEW AND INVESTMENT STRATEGY
Global equities ended 2018 in negative territory, marking one of the worst years for the stock market in a decade. Despite a relatively strong start to the year and US stock indices reaching record highs, volatility spiked toward the end of the reporting period. Investors worried about the outlook
| | |
| |
| 2 | AB FLEXFEE US THEMATIC PORTFOLIO | | abfunds.com |
for corporate earnings growth amid a more challenging global growth environment and as the benefits of tax reform roll off. The US Federal Reserve raised rates four times during 2018 as expected, but softened its tone in December, and signaled that it might slow its pace of rate hikes in 2019. An upsurge in geopolitical uncertainty regarding Brexit and budget discussions between Italy and its European Union partners sparked a flight to quality in the region. Slowing Chinese growth and continuingUS-China trade tensions dampened investor sentiment in China toward the end of the period. In the US, growth stocks outperformed value stocks, in terms of style, andlarge-cap stocks outperformed theirsmall-cap peers.
The Fund’s Senior Investment Management Team (the “Team”) continues to maintain a balanced exposure to long-term secular investment themes. The Team’stop-down approach is complemented by attractivebottom-up fundamentals, with a focus on strong organic sales and earnings growth, along with high returns on invested capital. The Team believes that this combination will continue to drive long-term performance versus the benchmark, in the face of cyclical shifts in the market.
INVESTMENT POLICIES
The Fund pursues opportunistic growth by investing primarily in a portfolio of US companies. Under normal conditions, the Fund invests at least 80% of its net assets in equity securities of US companies and related derivatives.
The Adviser employs a combination of“top-down” and“bottom-up” investment processes with the goal of identifying the most attractive US securities, fitting into broader themes, which are developments that have broad effects across industries and companies. Drawing on its fundamental research capabilities, the Adviser seeks to identify long-term secular growth trends (often resulting from innovation) that will affect multiple industries. The Adviser will assess the effects of these trends on entire industries and on individual companies. Through this process, the Adviser intends to identify key investment themes, which will be the focus of the Fund’s investments and which are expected to change over time based on the Adviser’s research.
In addition to this“top-down” thematic approach, the Adviser will also use a“bottom-up” analysis of individual companies that focuses on prospective earnings growth, valuation and quality of company management. The Adviser normally considers a universe of primarily USmid- to large-capitalization companies for investment.
The Adviser expects that normally the Fund’s portfolio will emphasize investments in securities issued by US companies, although it may invest in foreign securities.
| | |
| |
| abfunds.com | | AB FLEXFEE US THEMATIC PORTFOLIO | 3 |
DISCLOSURES AND RISKS
Benchmark Disclosure
The S&P 500® Index is unmanaged and does not reflect fees and expenses associated with the active management of a mutual fund portfolio. The S&P 500 Index includes 500 US stocks and is a common representation of the performance of the overall US stock market. An investor cannot invest directly in an index, and its results are not indicative of the performance for any specific investment, including the Fund.
A Word About Risk
Market Risk: The value of the Fund’s assets will fluctuate as the stock or bond market fluctuates. The value of its investments may decline, sometimes rapidly and unpredictably, simply because of economic changes or other events that affect large portions of the market. It includes the risk that a particular style of investing, such as the Fund’s growth approach, may underperform the market generally.
Foreign(Non-US) Risk: Investments in securities of non-US issuers may involve more risk than those of US issuers. These securities may fluctuate more widely in price and may be less liquid due to adverse market, economic, political, regulatory or other factors.
Capitalization Risk: Investments inmid-capitalization companies may be more volatile than investments in large-capitalization companies. Investments inmid-capitalization companies may have additional risks because these companies may have limited product lines, markets or financial resources.
Management Risk: The Fund is subject to management risk because it is an actively managed investment fund. The Adviser will apply its investment techniques and risk analyses in making investment decisions for the Fund, but there is no guarantee that its techniques will produce the intended results.
These risks are fully discussed in the Fund’s prospectus. As with all investments, you may lose money by investing in the Fund.
An Important Note About Historical Performance
The investment return and principal value of an investment in the Fund will fluctuate, so that shares, when redeemed, may be worth more or less than their original cost. Performance shown in this report represents past performance and does not guarantee future results. Current performance may be lower or higher than the performance information shown. You may obtain performance information current to the most recentmonth-end by visiting www.abfunds.com. The Fund has been in operation only for a short period of time, and therefore has a very limited historical performance period. This limited performance period is unlikely to be representative of the performance the Fund will achieve over a longer period.
| | |
| |
| 4 | AB FLEXFEE US THEMATIC PORTFOLIO | | abfunds.com |
DISCLOSURES AND RISKS(continued)
All fees and expenses related to the operation of the Fund have been deducted. Net asset value (“NAV”) returns do not reflect sales charges; if sales charges were reflected, the Fund’s quoted performance would be lower. SEC returns reflect the applicable sales charges for each share class. Returns for the different share classes will vary due to different expenses associated with each class. Performance assumes reinvestment of distributions and does not account for taxes.
| | |
| |
| abfunds.com | | AB FLEXFEE US THEMATIC PORTFOLIO | 5 |
HISTORICAL PERFORMANCE
GROWTH OF A $10,000 INVESTMENT IN THE FUND(unaudited)
6/28/20171 TO 12/31/2018
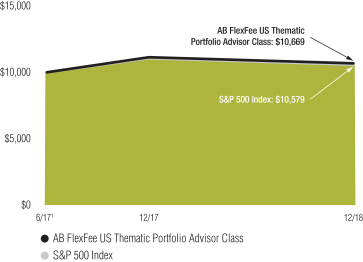
This chart illustrates the total value of an assumed $10,000 investment in AB FlexFee US Thematic Portfolio Advisor Class shares (from 6/28/20171 to 12/31/2018) as compared to the performance of the Fund’s benchmark.
| 1 | Inception date: 6/28/2017. |
| | |
| |
| 6 | AB FLEXFEE US THEMATIC PORTFOLIO | | abfunds.com |
HISTORICAL PERFORMANCE(continued)
AVERAGE ANNUAL RETURNS AS OF DECEMBER 31, 2018(unaudited)
| | | | | | | | |
| | |
| | | NAV Returns | | | SEC Returns
(reflects applicable
sales charges) | |
| | |
| ADVISOR CLASS SHARES1 | | | | | | | | |
| | |
| 1 Year | | | -4.15% | | | | -4.15% | |
| | |
| Since Inception2 | | | 4.39% | | | | 4.39% | |
SEC AVERAGE ANNUAL RETURNS
AS OF THE MOST RECENT CALENDARQUARTER-END
DECEMBER 31, 2018(unaudited)
| | | | |
| |
| | | SEC Returns
(reflects applicable
sales charges) | |
| |
| ADVISOR CLASS SHARES | | | | |
| |
| 1 Year | | | -4.15% | |
| |
| Since Inception2 | | | 4.39% | |
The Fund’s current prospectus fee table shows the Fund’s total annual operating expense ratio as 34.48% for Advisor Class shares, gross of any fee waivers or expense reimbursements. Contractual fee waivers and/or expense reimbursements limit the Fund’s annual operating expense ratio exclusive of the Fund’s advisory fees, acquired fund fees and expenses other than the advisory fees of any AB mutual funds in which the Fund may invest, interest expense, taxes, extraordinary expenses, and brokerage commissions and other transaction costs to 0.05% for Advisor Class shares. These waivers/reimbursements may not be terminated before April 30, 2019. Any fees waived and expenses borne by the Adviser through December 31, 2018, may be reimbursed by the Fund until the end of the third fiscal year after the fiscal period in which the fee was waived or the expense was borne, provided that no reimbursement payment will be made that would cause the Fund’s total other expenses to exceed the expense limitation. Absent reimbursements or waivers, performance would have been lower. The Financial Highlights section of this report sets forth expense ratio data for the current reporting period; the expense ratio shown above may differ from the expense ratio in the Financial Highlights section since they are based on different time periods.
| 1 | This share class is offered at NAV to eligible investors and the SEC returns are the same as the NAV returns. |
| 2 | Inception date: 6/28/2017. |
| | |
| |
| abfunds.com | | AB FLEXFEE US THEMATIC PORTFOLIO | 7 |
EXPENSE EXAMPLE
(unaudited)
As a shareholder of the Fund, you incur two types of costs: (1) transaction costs, including sales charges (loads) on purchase payments, contingent deferred sales charges on redemptions and (2) ongoing costs, including advisory fees; distribution (12b-1) fees; and other Fund expenses. This example is intended to help you understand your ongoing costs (in dollars) of investing in the Fund and to compare these costs with the ongoing costs of investing in other mutual funds.
The Example is based on an investment of $1,000 invested at the beginning of the period and held for the entire period as indicated below.
Actual Expenses
The table below provides information about actual account values and actual expenses. You may use the information, together with the amount you invested, to estimate the expenses that you paid over the period. Simply divide your account value by $1,000 (for example, an $8,600 account value divided by $1,000 = 8.6), then multiply the result by the number under the heading entitled “Expenses Paid During Period” to estimate the expenses you paid on your account during this period.
Hypothetical Example for Comparison Purposes
The table below also provides information about hypothetical account values and hypothetical expenses based on the Fund’s actual expense ratio and an assumed annual rate of return of 5% before expenses, which is not the Fund’s actual return. The hypothetical account values and expenses may not be used to estimate the actual ending account balance or expenses you paid for the period. You may use this information to compare the ongoing costs of investing in the Fund and other funds by comparing this 5% hypothetical example with the 5% hypothetical examples that appear in the shareholder reports of other funds.
Please note that the expenses shown in the table are meant to highlight your ongoing costs only and do not reflect any transactional costs, such as sales charges (loads), or contingent deferred sales charges on redemptions. Therefore, the hypothetical example is useful in comparing ongoing costs only, and will not help you determine the relative total costs of owning different funds. In addition, if these transactional costs were included, your costs would have been higher.
| | |
| |
| 8 | AB FLEXFEE US THEMATIC PORTFOLIO | | abfunds.com |
EXPENSE EXAMPLE(continued)
| | | | | | | | | | | | | | | | |
| | | Beginning
Account Value
7/1/2018 | | | Ending
Account Value
12/31/2018 | | | Expenses Paid
During Period* | | | Annualized
Expense Ratio* | |
| Advisor Class | | | | | | | | | | | | | | | | |
Actual | | $ | 1,000 | | | $ | 924.40 | | | $ | 0.92 | | | | 0.19 | % |
Hypothetical** | | $ | 1,000 | | | $ | 1,024.25 | | | $ | 0.97 | | | | 0.19 | % |
| * | Expenses are equal to the classes’ annualized expense ratios multiplied by the average account value over the period, multiplied by 184/365 (to reflect the one-half year period). |
| ** | Assumes 5% annual return before expenses. |
| | |
| |
| abfunds.com | | AB FLEXFEE US THEMATIC PORTFOLIO | 9 |
PORTFOLIO SUMMARY
December 31, 2018(unaudited)
PORTFOLIO STATISTICS
Net Assets ($mil): $65.2
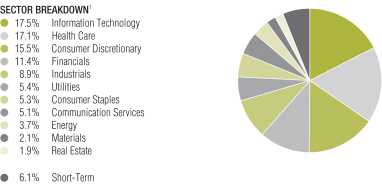
TEN LARGEST HOLDINGS2
| | | | | | | | |
| | |
| Company | | U.S. $ Value | | | Percent of
Net Assets | |
| | |
| Visa, Inc. – Class A | | $ | 2,045,466 | | | | 3.1 | % |
| | |
| MSCI, Inc. – Class A | | | 1,867,938 | | | | 2.9 | |
| | |
| Danaher Corp. | | | 1,829,246 | | | | 2.8 | |
| | |
| Amazon.com, Inc. | | | 1,818,886 | | | | 2.8 | |
| | |
| Xylem, Inc./NY | | | 1,807,111 | | | | 2.8 | |
| | |
| Alphabet, Inc. – Class C | | | 1,760,537 | | | | 2.7 | |
| | |
| Bright Horizons Family Solutions, Inc. | | | 1,679,328 | | | | 2.6 | |
| | |
| Vestas Wind Systems A/S (Sponsored ADR) | | | 1,596,815 | | | | 2.4 | |
| | |
| Microsoft Corp. | | | 1,584,797 | | | | 2.4 | |
| | |
| Walt Disney Co. (The) | | | 1,580,385 | | | | 2.4 | |
| | |
| | $ | 17,570,509 | | | | 26.9 | % |
| 1 | All data are as of December 31, 2018. The Fund’s sector breakdown is expressed as a percentage of total investments (excluding security lending collateral) and may vary over time. |
Please note: The sector classifications presented herein are based on the Global Industry Classification Standard (GICS) which was developed by Morgan Stanley Capital International and Standard & Poor’s. The components are divided into sector, industry group, and industrysub-indices as classified by the GICS for each of the market capitalization indices in the broad market. These sector classifications are broadly defined. The “Portfolio of Investments” section of the report reflects more specific industry information and is consistent with the investment restrictions discussed in the Fund’s prospectus.
| | |
| |
| 10 | AB FLEXFEE US THEMATIC PORTFOLIO | | abfunds.com |
PORTFOLIO OF INVESTMENTS
December 31, 2018
| | | | | | | | |
| Company | | Shares | | | U.S. $ Value | |
| |
COMMON STOCKS – 93.8% | | | | | | | | |
Information Technology – 17.5% | | | | | | | | |
IT Services – 3.2% | | | | | | | | |
Visa, Inc. – Class A | | | 15,503 | | | $ | 2,045,466 | |
| | | | | | | | |
| | |
Semiconductors & Semiconductor Equipment – 4.7% | | | | | | | | |
KLA-Tencor Corp. | | | 9,456 | | | | 846,218 | |
Monolithic Power Systems, Inc. | | | 12,789 | | | | 1,486,721 | |
NVIDIA Corp. | | | 5,620 | | | | 750,270 | |
| | | | | | | | |
| | | | | | | 3,083,209 | |
| | | | | | | | |
Software – 7.6% | | | | | | | | |
Microsoft Corp. | | | 15,603 | | | | 1,584,797 | |
New Relic, Inc.(a) | | | 12,386 | | | | 1,002,894 | |
SailPoint Technologies Holding, Inc.(a) | | | 38,308 | | | | 899,855 | |
salesforce.com, Inc.(a) | | | 10,855 | | | | 1,486,809 | |
| | | | | | | | |
| | | | | | | 4,974,355 | |
| | | | | | | | |
Technology Hardware, Storage & Peripherals – 2.0% | | | | | | | | |
Apple, Inc. | | | 8,048 | | | | 1,269,491 | |
| | | | | | | | |
| | | | | | | 11,372,521 | |
| | | | | | | | |
Health Care – 17.1% | | | | | | | | |
Health Care Equipment & Supplies – 6.6% | | | | | | | | |
Abbott Laboratories | | | 18,976 | | | | 1,372,534 | |
Danaher Corp. | | | 17,739 | | | | 1,829,246 | |
West Pharmaceutical Services, Inc. | | | 11,043 | | | | 1,082,545 | |
| | | | | | | | |
| | | | | | | 4,284,325 | |
| | | | | | | | |
Health Care Providers & Services – 2.0% | | | | | | | | |
UnitedHealth Group, Inc. | | | 5,268 | | | | 1,312,364 | |
| | | | | | | | |
| | |
Health Care Technology – 1.8% | | | | | | | | |
Medidata Solutions, Inc.(a) | | | 17,657 | | | | 1,190,435 | |
| | | | | | | | |
| | |
Life Sciences Tools & Services – 5.2% | | | | | | | | |
Bio-Rad Laboratories, Inc. – Class A(a) | | | 4,816 | | | | 1,118,371 | |
Bruker Corp. | | | 44,075 | | | | 1,312,113 | |
ICON PLC(a) | | | 7,443 | | | | 961,710 | |
| | | | | | | | |
| | | | | | | 3,392,194 | |
| | | | | | | | |
Pharmaceuticals – 1.5% | | | | | | | | |
Johnson & Johnson | | | 7,452 | | | | 961,681 | |
| | | | | | | | |
| | | | | | | 11,140,999 | |
| | | | | | | | |
Consumer Discretionary – 15.5% | | | | | | | | |
Auto Components – 2.1% | | | | | | | | |
Aptiv PLC | | | 22,041 | | | | 1,357,064 | |
| | | | | | | | |
| | |
Diversified Consumer Services – 2.6% | | | | | | | | |
Bright Horizons Family Solutions, Inc.(a) | | | 15,068 | | | | 1,679,328 | |
| | | | | | | | |
| | |
| |
| abfunds.com | | AB FLEXFEE US THEMATIC PORTFOLIO | 11 |
PORTFOLIO OF INVESTMENTS(continued)
| | | | | | | | |
| Company | | Shares | | | U.S. $ Value | |
| |
Internet & Direct Marketing Retail – 5.5% | | | | | | | | |
Alibaba Group Holding Ltd. (Sponsored ADR)(a) | | | 6,700 | | | $ | 918,369 | |
Amazon.com, Inc.(a) | | | 1,211 | | | | 1,818,886 | |
Etsy, Inc.(a) | | | 18,790 | | | | 893,840 | |
| | | | | | | | |
| | | | | | | 3,631,095 | |
| | | | | | | | |
Specialty Retail – 3.4% | | | | | | | | |
Home Depot, Inc. (The) | | | 6,886 | | | | 1,183,153 | |
Ulta Salon Cosmetics & Fragrance, Inc.(a) | | | 4,174 | | | | 1,021,962 | |
| | | | | | | | |
| | | | | | | 2,205,115 | |
| | | | | | | | |
Textiles, Apparel & Luxury Goods – 1.9% | | | | | | | | |
VF Corp. | | | 17,267 | | | | 1,231,828 | |
| | | | | | | | |
| | | | | | | 10,104,430 | |
| | | | | | | | |
Financials – 11.4% | | | | | | | | |
Banks – 1.6% | | | | | | | | |
Credicorp Ltd. | | | 4,765 | | | | 1,056,258 | |
| | | | | | | | |
| | |
Capital Markets – 7.7% | | | | | | | | |
Charles Schwab Corp. (The) | | | 37,698 | | | | 1,565,598 | |
Intercontinental Exchange, Inc. | | | 20,828 | | | | 1,568,973 | |
MSCI, Inc. – Class A | | | 12,670 | | | | 1,867,938 | |
| | | | | | | | |
| | | | | | | 5,002,509 | |
| | | | | | | | |
Insurance – 2.1% | | | | | | | | |
Aflac, Inc. | | | 30,191 | | | | 1,375,502 | |
| | | | | | | | |
| | | | | | | 7,434,269 | |
| | | | | | | | |
Industrials – 8.9% | | | | | | | | |
Aerospace & Defense – 2.2% | | | | | | | | |
Hexcel Corp. | | | 24,765 | | | | 1,420,025 | |
| | | | | | | | |
| | |
Electrical Equipment – 3.9% | | | | | | | | |
Rockwell Automation, Inc. | | | 6,457 | | | | 971,650 | |
Vestas Wind Systems A/S (Sponsored ADR)(b) | | | 63,416 | | | | 1,596,815 | |
| | | | | | | | |
| | | | | | | 2,568,465 | |
| | | | | | | | |
Machinery – 2.8% | | | | | | | | |
Xylem, Inc./NY | | | 27,085 | | | | 1,807,111 | |
| | | | | | | | |
| | | | | | | 5,795,601 | |
| | | | | | | | |
Utilities – 5.4% | | | | | | | | |
Electric Utilities – 2.2% | | | | | | | | |
NextEra Energy, Inc. | | | 8,297 | | | | 1,442,185 | |
| | | | | | | | |
| | |
Water Utilities – 3.2% | | | | | | | | |
American Water Works Co., Inc. | | | 14,854 | | | | 1,348,297 | |
Aqua America, Inc. | | | 20,309 | | | | 694,365 | |
| | | | | | | | |
| | | | | | | 2,042,662 | |
| | | | | | | | |
| | | | | | | 3,484,847 | |
| | | | | | | | |
Consumer Staples – 5.3% | | | | | | | | |
Food Products – 2.2% | | | | | | | | |
Nestle SA (Sponsored ADR) | | | 18,230 | | | | 1,475,901 | |
| | | | | | | | |
| | |
| |
| 12 | AB FLEXFEE US THEMATIC PORTFOLIO | | abfunds.com |
PORTFOLIO OF INVESTMENTS(continued)
| | | | | | | | |
| Company | | Shares | | | U.S. $ Value | |
| |
Household Products – 1.5% | | | | | | | | |
Procter & Gamble Co. (The) | | | 10,586 | | | $ | 973,065 | |
| | | | | | | | |
| | |
Personal Products – 1.6% | | | | | | | | |
Unilever PLC (Sponsored ADR) | | | 19,560 | | | | 1,022,010 | |
| | | | | | | | |
| | | | | | | 3,470,976 | |
| | | | | | | | |
Communication Services – 5.1% | | | | | | | | |
Entertainment – 2.4% | | | | | | | | |
Walt Disney Co. (The) | | | 14,413 | | | | 1,580,385 | |
| | | | | | | | |
| | |
Interactive Media & Services – 2.7% | | | | | | | | |
Alphabet, Inc. – Class C(a) | | | 1,700 | | | | 1,760,537 | |
| | | | | | | | |
| | | | | | | 3,340,922 | |
| | | | | | | | |
Energy – 3.6% | | | | | | | | |
Oil, Gas & Consumable Fuels – 3.6% | | | | | | | | |
Concho Resources, Inc.(a) | | | 12,112 | | | | 1,244,993 | |
EOG Resources, Inc. | | | 12,943 | | | | 1,128,759 | |
| | | | | | | | |
| | | | | | | 2,373,752 | |
| | | | | | | | |
Materials – 2.1% | | | | | | | | |
Chemicals – 2.1% | | | | | | | | |
Ecolab, Inc. | | | 9,463 | | | | 1,394,373 | |
| | | | | | | | |
| | |
Real Estate – 1.9% | | | | | | | | |
Equity Real Estate Investment Trusts (REITs) – 1.9% | | | | | | | | |
SBA Communications Corp.(a) | | | 7,618 | | | | 1,233,278 | |
| | | | | | | | |
| | |
Total Common Stocks
(cost $63,253,189) | | | | | | | 61,145,968 | |
| | | | | | | | |
| | | | | | | | |
SHORT-TERM INVESTMENTS – 6.1% | | | | | | | | |
Investment Companies – 6.1% | | | | | | | | |
AB Fixed Income Shares, Inc. – Government Money Market Portfolio – Class AB, 2.31%(c)(d)(e)
(cost $4,002,151) | | | 4,002,151 | | | | 4,002,151 | |
| | | | | | | | |
| | |
Total Investments Before Security Lending Collateral for Securities Loaned – 99.9%
(cost $67,255,340) | | | | | | | 65,148,119 | |
| | | | | | | | |
| | | | | | | | |
INVESTMENTS OF CASH COLLATERAL FOR SECURITIES LOANED – 1.7% | | | | | | | | |
Investment Companies – 1.7% | | | | | | | | |
AB Fixed Income Shares, Inc. – Government Money Market Portfolio – Class AB, 2.31%(c)(d)(e)
(cost $1,117,745) | | | 1,117,745 | | | | 1,117,745 | |
| | | | | | | | |
| | |
Total Investments – 101.6%
(cost $68,373,085) | | | | | | | 66,265,864 | |
Other assets less liabilities – (1.6)% | | | | | | | (1,057,609 | ) |
| | | | | | | | |
| | |
Net Assets – 100.0% | | | | | | $ | 65,208,255 | |
| | | | | | | | |
| | |
| |
| abfunds.com | | AB FLEXFEE US THEMATIC PORTFOLIO | 13 |
PORTFOLIO OF INVESTMENTS(continued)
| (a) | Non-income producing security. |
| (b) | Represents entire or partial securities out on loan. See Note D for securities lending information. |
| (c) | To obtain a copy of the fund’s shareholder report, please go to the Securities and Exchange Commission’s website at www.sec.gov, or call AB at(800) 227-4618. |
| (d) | The rate shown represents the7-day yield as of period end. |
| (e) | Affiliated investments. |
Glossary:
ADR – American Depositary Receipt
See notes to financial statements.
| | |
| |
| 14 | AB FLEXFEE US THEMATIC PORTFOLIO | | abfunds.com |
STATEMENT OF ASSETS & LIABILITIES
December 31, 2018
| | | | |
| Assets | | | | |
Investments in securities, at value | | | | |
Unaffiliated issuers (cost $63,253,189) | | $ | 61,145,968 | (a) |
Affiliated issuers (cost $5,119,896—including investment of cash collateral for securities loaned of $1,117,745) | | | 5,119,896 | |
Cash | | | 279,785 | |
Receivable for capital stock sold | | | 560,778 | |
Receivable from Adviser | | | 65,569 | |
Unaffiliated dividends receivable | | | 24,101 | |
Affiliated dividends receivable | | | 10,765 | |
| | | | |
Total assets | | | 67,206,862 | |
| | | | |
| Liabilities | | | | |
Payable for collateral received on securities loaned | | | 1,117,745 | |
Dividends payable | | | 291,662 | |
Payable for investment securities purchased | | | 279,785 | |
Payable for capital stock redeemed | | | 217,466 | |
Transfer Agent fee payable | | | 3,000 | |
Accrued expenses and other liabilities | | | 88,949 | |
| | | | |
Total liabilities | | | 1,998,607 | |
| | | | |
Net Assets | | $ | 65,208,255 | |
| | | | |
| Composition of Net Assets | | | | |
Capital stock, at par | | $ | 616 | |
Additionalpaid-in capital | | | 69,949,063 | |
Accumulated loss | | | (4,741,424 | ) |
| | | | |
| | $ | 65,208,255 | |
| | | | |
Net Asset Value Per Share—11 billion shares of capital stock authorized, $.0001 par value
| | | | | | | | | | | | |
| Class | | Net Assets | | | Shares
Outstanding | | | Net Asset
Value | |
| |
| Advisor | | $ | 65,208,255 | | | | 6,159,327 | | | $ | 10.59 | |
| |
| (a) | Includes securities on loan with a value of $1,095,330 (See Note D). |
See notes to financial statements.
| | |
| |
| abfunds.com | | AB FLEXFEE US THEMATIC PORTFOLIO | 15 |
STATEMENT OF OPERATIONS
Year Ended December 31, 2018
| | | | | | | | |
| Investment Income | | | | | | | | |
Dividends | | | | | | | | |
Unaffiliated issuers (net of foreign taxes withheld of $6,615) | | $ | 488,607 | | | | | |
Affiliated issuers | | | 61,777 | | | | | |
Securities lending income | | | 4,599 | | | $ | 554,983 | |
| | | | | | | | |
| Expenses | | | | | | | | |
Advisory fee (see Note B) | | | 183,851 | | | | | |
Transfer agency—Advisor Class | | | 28,600 | | | | | |
Administrative | | | 67,359 | | | | | |
Audit and tax | | | 52,121 | | | | | |
Amortization of offering expenses | | | 33,390 | | | | | |
Legal | | | 30,646 | | | | | |
Registration fees | | | 26,292 | | | | | |
Directors’ fees | | | 24,778 | | | | | |
Custodian | | | 17,213 | | | | | |
Printing | | | 12,757 | | | | | |
Miscellaneous | | | 32,232 | | | | | |
| | | | | | | | |
Total expenses | | | 509,239 | | | | | |
Less: expenses waived and reimbursed by the Adviser (see Note B and Note D) | | | (305,992 | ) | | | | |
| | | | | | | | |
Net expenses | | | | | | | 203,247 | |
| | | | | | | | |
Net investment income | | | | | | | 351,736 | |
| | | | | | | | |
| Realized and Unrealized Loss on Investments | | | | | | | | |
Net realized loss on: | | | | | | | | |
Investment transactions | | | | | | | (2,645,677 | ) |
Net change in unrealized appreciation/depreciation on: | | | | | | | | |
Investments | | | | | | | (2,214,524 | ) |
| | | | | | | | |
Net loss on investments | | | | | | | (4,860,201 | ) |
| | | | | | | | |
Net Decrease in Net Assets from Operations | | | | | | $ | (4,508,465 | ) |
| | | | | | | | |
See notes to financial statements.
| | |
| |
| 16 | AB FLEXFEE US THEMATIC PORTFOLIO | | abfunds.com |
STATEMENT OF CHANGES IN NET ASSETS
| | | | | | | | |
| | | Year Ended
December 31,
2018 | | | June 28, 2017(a) to
December 31,
2017 | |
| Increase (Decrease) in Net Assets from Operations | | | | | | | | |
Net investment income | | $ | 351,736 | | | $ | 3,526 | |
Net realized gain (loss) on investments | | | (2,645,677 | ) | | | 2,251 | |
Net change in unrealized appreciation/depreciation on investments | | | (2,214,524 | ) | | | 107,303 | |
| | | | | | | | |
Net increase (decrease) in net assets from operations | | | (4,508,465 | ) | | | 113,080 | |
| Distributions to Shareholders | | | | | | | | |
Advisor Class | | | (359,924 | ) | | | (2,170 | ) |
| Capital Stock Transactions | | | | | | | | |
Net increase | | | 68,965,731 | | | | 1,000,003 | |
| | | | | | | | |
Total increase | | | 64,097,342 | | | | 1,110,913 | |
| Net Assets | | | | | | | | |
Beginning of period | | | 1,110,913 | | | | – 0 | – |
| | | | | | | | |
End of period | | $ | 65,208,255 | | | $ | 1,110,913 | |
| | | | | | | | |
| (a) | Commencement of operations. |
See notes to financial statements.
| | |
| |
| abfunds.com | | AB FLEXFEE US THEMATIC PORTFOLIO | 17 |
NOTES TO FINANCIAL STATEMENTS
December 31, 2018
NOTE A
Significant Accounting Policies
AB Cap Fund, Inc. (the “Company”), which is a Maryland corporation, is registered under the Investment Company Act of 1940 as anopen-end management investment company. The Company operates as a series company comprised of 29 portfolios currently in operation. Each portfolio is considered to be a separate entity for financial reporting and tax purposes. This report relates only to the AB FlexFee US Thematic Portfolio (the “Fund”), a diversified portfolio. The Fund commenced operations on June 28, 2017. The Fund has authorized issuance of Class A, Class B, Class C, Advisor Class, Class R, Class K, Class I, Class Z, Class T, Class 1, and Class 2 shares. Class A, Class B, Class C, Class R, Class K, Class I, Class Z, Class T, Class 1, and Class 2 shares have not been issued. Advisor Class shares are sold without an initial or contingent deferred sales charge and are not subject to ongoing distribution expenses. All eleven classes of shares have identical voting, dividend, liquidation and other rights, except that the classes bear different distribution and transfer agency expenses. Each class has exclusive voting rights with respect to its distribution plan. The financial statements have been prepared in conformity with U.S. generally accepted accounting principles (“U.S. GAAP”), which require management to make certain estimates and assumptions that affect the reported amounts of assets and liabilities in the financial statements and amounts of income and expenses during the reporting period. Actual results could differ from those estimates. The Fund is an investment company under U.S. GAAP and follows the accounting and reporting guidance applicable to investment companies. The following is a summary of significant accounting policies followed by the Fund.
1. Security Valuation
Portfolio securities are valued at their current market value determined on the basis of market quotations or, if market quotations are not readily available or are deemed unreliable, at “fair value” as determined in accordance with procedures established by and under the general supervision of the Fund’s Board of Directors (the “Board”).
In general, the market values of securities which are readily available and deemed reliable are determined as follows: securities listed on a national securities exchange (other than securities listed on the NASDAQ Stock Market, Inc. (“NASDAQ”)) or on a foreign securities exchange are valued at the last sale price at the close of the exchange or foreign securities exchange. If there has been no sale on such day, the securities are valued at the last traded price from the previous day. Securities listed on more than one exchange are valued by reference to the principal exchange on
| | |
| |
| 18 | AB FLEXFEE US THEMATIC PORTFOLIO | | abfunds.com |
NOTES TO FINANCIAL STATEMENTS(continued)
which the securities are traded; securities listed only on NASDAQ are valued in accordance with the NASDAQ Official Closing Price; listed or over the counter (“OTC”) market put or call options are valued at the mid level between the current bid and ask prices. If either a current bid or current ask price is unavailable, the Adviser will have discretion to determine the best valuation (e.g., last trade price in the case of listed options); open futures are valued using the closing settlement price or, in the absence of such a price, the most recent quoted bid price. If there are no quotations available for the day of valuation, the last available closing settlement price is used; U.S. Government securities and any other debt instruments having 60 days or less remaining until maturity are generally valued at market by an independent pricing vendor, if a market price is available. If a market price is not available, the securities are valued at amortized cost. This methodology is commonly used for short term securities that have an original maturity of 60 days or less, as well as short term securities that had an original term to maturity that exceeded 60 days. In instances when amortized cost is utilized, the Valuation Committee (the “Committee”) must reasonably conclude that the utilization of amortized cost is approximately the same as the fair value of the security. Such factors the Committee will consider include, but are not limited to, an impairment of the creditworthiness of the issuer or material changes in interest rates. Fixed-income securities, including mortgage-backed and asset-backed securities, may be valued on the basis of prices provided by a pricing service or at a price obtained from one or more of the major broker-dealers. In cases where broker-dealer quotes are obtained, the Adviser may establish procedures whereby changes in market yields or spreads are used to adjust, on a daily basis, a recently obtained quoted price on a security. Swaps and other derivatives are valued daily, primarily using independent pricing services, independent pricing models using market inputs, as well as third party broker-dealers or counterparties. Open end mutual funds are valued at the closing net asset value per share, while exchange traded funds are valued at the closing market price per share.
Securities for which market quotations are not readily available (including restricted securities) or are deemed unreliable are valued at fair value as deemed appropriate by the Adviser. Factors considered in making this determination may include, but are not limited to, information obtained by contacting the issuer, analysts, analysis of the issuer’s financial statements or other available documents. In addition, the Fund may use fair value pricing for securities primarily traded innon-U.S. markets because most foreign markets close well before the Fund values its securities at 4:00 p.m., Eastern Time. The earlier close of these foreign markets gives rise to the possibility that significant events, including broad market moves, may have occurred in the interim and may materially affect the value of those securities. To account for
| | |
| |
| abfunds.com | | AB FLEXFEE US THEMATIC PORTFOLIO | 19 |
NOTES TO FINANCIAL STATEMENTS(continued)
this, the Fund generally values many of its foreign equity securities using fair value prices based on third party vendor modeling tools to the extent available.
2. Fair Value Measurements
In accordance with U.S. GAAP regarding fair value measurements, fair value is defined as the price that the Fund would receive to sell an asset or pay to transfer a liability in an orderly transaction between market participants at the measurement date. U.S. GAAP establishes a framework for measuring fair value, and a three-level hierarchy for fair value measurements based upon the transparency of inputs to the valuation of an asset or liability (including those valued based on their market values as described in Note A.1 above). Inputs may be observable or unobservable and refer broadly to the assumptions that market participants would use in pricing the asset or liability. Observable inputs reflect the assumptions market participants would use in pricing the asset or liability based on market data obtained from sources independent of the Fund. Unobservable inputs reflect the Fund’s own assumptions about the assumptions that market participants would use in pricing the asset or liability based on the best information available in the circumstances. Each investment is assigned a level based upon the observability of the inputs which are significant to the overall valuation. The three-tier hierarchy of inputs is summarized below.
| | • | | Level 1—quoted prices in active markets for identical investments |
| | • | | Level 2—other significant observable inputs (including quoted prices for similar investments, interest rates, prepayment speeds, credit risk, etc.) |
| | • | | Level 3—significant unobservable inputs (including the Fund’s own assumptions in determining the fair value of investments) |
Where readily available market prices or relevant bid prices are not available for certain equity investments, such investments may be valued based on similar publicly traded investments, movements in relevant indices since last available prices or based upon underlying company fundamentals and comparable company data (such as multiples to earnings or other multiples to equity). Where an investment is valued using an observable input, such as another publicly traded security, the investment will be classified as Level 2. If management determines that an adjustment is appropriate based on restrictions on resale, illiquidity or uncertainty, and such adjustment is a significant component of the valuation, the investment will be classified as Level 3. An investment will also be classified as Level 3 where management uses company fundamentals and other significant inputs to determine the valuation.
| | |
| |
| 20 | AB FLEXFEE US THEMATIC PORTFOLIO | | abfunds.com |
NOTES TO FINANCIAL STATEMENTS(continued)
The following table summarizes the valuation of the Fund’s investments by the above fair value hierarchy levels as of December 31, 2018:
| | | | | | | | | | | | | | | | |
Investments in Securities | | Level 1 | | | Level 2 | | | Level 3 | | | Total | |
Assets: | | | | | | | | | | | | | | | | |
Common Stocks^ | | $ | 61,145,968 | | | $ | – 0 | – | | $ | – 0 | – | | $ | 61,145,968 | |
Short-Term Investments: | | | | | | | | | | | | | | | | |
Investment Companies | | | 4,002,151 | | | | – 0 | – | | | – 0 | – | | | 4,002,151 | |
Investments of Cash Collateral for Securities Loaned in Affiliated Money Market Fund | | | 1,117,745 | | | | – 0 | – | | | – 0 | – | | | 1,117,745 | |
| | | | | | | | | | | | | | | | |
Total Investments in Securities | | | 66,265,864 | | | | – 0 | – | | | – 0 | – | | | 66,265,864 | |
Other Financial Instruments* | | | – 0 | – | | | – 0 | – | | | – 0 | – | | | – 0 | – |
| | | | | | | | | | | | | | | | |
Total** | | $ | 66,265,864 | | | $ | – 0 | – | | $ | – 0 | – | | $ | 66,265,864 | |
| | | | | | | | | | | | | | | | |
| ^ | See Portfolio of Investments for sector classifications. |
| * | Other financial instruments are derivative instruments, such as futures, forwards and swaps, which are valued at the unrealized appreciation/(depreciation) on the instrument. Other financial instruments may also include swaps with upfront premiums, options written and swaptions written which are valued at market value. |
| ** | There were no transfers between any levels during the reporting period. |
The Fund recognizes all transfers between levels of the fair value hierarchy assuming the financial instrument was transferred at the beginning of the reporting period.
The Adviser established the Committee to oversee the pricing and valuation of all securities held in the Fund. The Committee operates under pricing and valuation policies and procedures established by the Adviser and approved by the Board, including pricing policies which set forth the mechanisms and processes to be employed on a daily basis to implement these policies and procedures. In particular, the pricing policies describe how to determine market quotations for securities and other instruments. The Committee’s responsibilities include: 1) fair value and liquidity determinations (and oversight of any third parties to whom any responsibility for fair value and liquidity determinations is delegated), and 2) regular monitoring of the Adviser’s pricing and valuation policies and procedures and modification or enhancement of these policies and procedures (or recommendation of the modification of these policies and procedures) as the Committee believes appropriate.
The Committee is also responsible for monitoring the implementation of the pricing policies by the Adviser’s Pricing Group (the “Pricing Group”) and any third party which performs certain pricing functions in accordance with the pricing policies. The Pricing Group is responsible for the oversight of the third party on aday-to-day basis. The Committee and the Pricing Group perform a series of activities to provide reasonable assurance of the
| | |
| |
| abfunds.com | | AB FLEXFEE US THEMATIC PORTFOLIO | 21 |
NOTES TO FINANCIAL STATEMENTS(continued)
accuracy of prices including: 1) periodic vendor due diligence meetings, review of methodologies, new developments and process at vendors, 2) daily comparison of security valuation versus prior day for all securities that exceeded established thresholds, and 3) daily review of unpriced, stale, and variance reports with exceptions reviewed by senior management and the Committee.
In addition, several processes outside of the pricing process are used to monitor valuation issues including: 1) performance and performance attribution reports are monitored for anomalous impacts based upon benchmark performance, and 2) portfolio managers review all portfolios for performance and analytics (which are generated using the Adviser’s prices).
3. Currency Translation
Assets and liabilities denominated in foreign currencies and commitments under forward currency exchange contracts are translated into U.S. dollars at the mean of the quoted bid and ask prices of such currencies against the U.S. dollar. Purchases and sales of portfolio securities are translated into U.S. dollars at the rates of exchange prevailing when such securities were acquired or sold. Income and expenses are translated into U.S. dollars at the rates of exchange prevailing when accrued.
Net realized gain or loss on foreign currency transactions represents foreign exchange gains and losses from sales and maturities of foreign fixed income investments, holding of foreign currencies, currency gains or losses realized between the trade and settlement dates on foreign investment transactions, and the difference between the amounts of dividends, interest and foreign withholding taxes recorded on the Fund’s books and the U.S. dollar equivalent amounts actually received or paid. Net unrealized currency gains and losses from valuing foreign currency denominated assets and liabilities at period end exchange rates are reflected as a component of net unrealized appreciation and depreciation of foreign currency denominated assets and liabilities.
4. Taxes
It is the Fund’s policy to meet the requirements of the Internal Revenue Code applicable to regulated investment companies and to distribute all of its investment company taxable income and net realized gains, if any, to shareholders. Therefore, no provisions for federal income or excise taxes are required. The Fund may be subject to taxes imposed by countries in which it invests. Such taxes are generally based on income and/or capital gains earned or repatriated. Taxes are accrued and applied to net investment income, net realized gains and net unrealized appreciation/depreciation as such income and/or gains are earned.
| | |
| |
| 22 | AB FLEXFEE US THEMATIC PORTFOLIO | | abfunds.com |
NOTES TO FINANCIAL STATEMENTS(continued)
In accordance with U.S. GAAP requirements regarding accounting for uncertainties in income taxes, management has analyzed the Fund’s tax positions taken or expected to be taken on federal and state income tax returns for all open tax years (all years since inception of the Fund), and has concluded that no provision for income tax is required in the Fund’s financial statements.
5. Investment Income and Investment Transactions
Dividend income is recorded on theex-dividend date or as soon as the Fund is informed of the dividend. Interest income is accrued daily. Investment transactions are accounted for on the date securities are purchased or sold. Investment gains or losses are determined on the identified cost basis. The Fund amortizes premiums and accretes discounts as adjustments to interest income.
6. Expense Allocations
Expenses of the Company are charged proportionately to each portfolio or based on other appropriate methods.
7. Dividends and Distributions
Dividends and distributions to shareholders, if any, are recorded on theex-dividend date. Income dividends and capital gains distributions are determined in accordance with federal tax regulations and may differ from those determined in accordance with U.S. GAAP. To the extent these differences are permanent, such amounts are reclassified within the capital accounts based on their federal tax basis treatment; temporary differences do not require such reclassification.
8. Offering Expenses
Offering expenses of $68,085 were deferred and amortized on a straight line basis over a one year period starting from June 28, 2017 (commencement of operations).
NOTE B
Advisory Fee and Other Transactions with Affiliates
Under the terms of the investment advisory agreement, the Fund pays the Adviser an advisory fee at an annual rate of .55% of the Fund’s average daily net assets (“Base Fee”). The advisory fee is increased or decreased from the Base Fee by a performance adjustment (“Performance Adjustment”) that depends on whether, and to what extent, the investment performance of the Advisor Class shares of the Fund (“Measuring Class”) exceeds, or is exceeded by, the performance of the S&P 500 Index (“Index”) plus 1.40% (“Index Hurdle”) over the Performance Period (as defined below). The Performance Adjustment is calculated and accrued daily, according to a schedule that adds or subtracts .00357% of the Fund’s average daily net assets for each .01% of absolute performance by
| | |
| |
| abfunds.com | | AB FLEXFEE US THEMATIC PORTFOLIO | 23 |
NOTES TO FINANCIAL STATEMENTS(continued)
which the performance of the Measuring Class exceeds or lags the Index Hurdle for the period from the beginning of the Performance Period through the current business day. The maximum Performance Adjustment (positive or negative) will not exceed an annualized rate of +/- .50% (“Maximum Performance Adjustment”) of the Fund’s average daily net assets, which would occur when the performance of the Measuring Class exceeds, or is exceeded by, the Index Hurdle by 1.40% or more for the Performance Period. On a monthly basis, the Fund will pay the Adviser the minimum fee rate of .05% on an annualized basis (Base Fee minus the Maximum Performance Adjustment) applied to the average daily net assets for the month. At the end of the Performance Period, the Fund will pay to the Adviser the total advisory fee, less the amount of any minimum fees paid during the Performance Period and any waivers described below. The period over which performance is measured (“Performance Period”) was initially from the commencement of operations to December 31, 2018 and thereafter is each12-month period beginning on the first day in the month of January through December 31 of the same year. In addition, the Adviser has agreed to waive its advisory fee by limiting the Fund’s accrual of the advisory fee (Base Fee plus Performance Adjustment) on any day to the amount corresponding to the maximum fee rate multiplied by the Fund’s current net assets if such amount is less than the amount that would have been accrued based on the Fund’s average daily net assets for the Performance Period. For the year ended December 31, 2018, the Fund accrued advisory fees of $183,851, as reflected in the statement of operations, at an annual effective rate (excluding the impact from any expense waivers in effect) of .38% of the Fund’s average net assets, which reflected a (.17)% Performance Adjustment of $(82,558). For the Performance Period from June 28, 2017 to December 31, 2018, the Fund accrued advisory fees of $185,401, at an annual effective rate (excluding the impact from any expense waivers in effect) of .38% of the Fund’s average net assets, which reflected a (.17)% Performance Adjustment of $(83,955).
The Adviser has agreed to waive its fees and bear certain expenses through April 30, 2019 to the extent necessary to limit total expenses (other than the advisory fee, acquired fund fees and expenses other than the advisory fees of any AB mutual funds in which the Fund may invest, interest expense, taxes, extraordinary expenses, and brokerage commissions and other transaction costs) on an annual basis from exceeding .05% of average daily net assets. For the year ended December 31, 2018, the reimbursement waivers amounted to $233,614. Any fees waived and expenses borne by the Adviser through December 31, 2018 are subject to repayment by the Fund until the end of the third fiscal year after the fiscal period in which the fees were waived or the expenses were borne; such waivers/expenses borne that are subject to repayment amount to $171,634 for the fiscal period ended December 31, 2017 and $233,614
| | |
| |
| 24 | AB FLEXFEE US THEMATIC PORTFOLIO | | abfunds.com |
NOTES TO FINANCIAL STATEMENTS(continued)
for the year ended December 31, 2018. In any case, no repayment will be made that would cause the Fund’s total annual expenses (subject to the exclusions set forth above) to exceed .05%.
During 2017, AXA S.A. (“AXA”), a French holding company for the AXA Group, a worldwide leader in life, property and casualty and health insurance and asset management, announced its intention to pursue the sale of a minority stake in its subsidiary, AXA Equitable Holdings, Inc. (“AXA Equitable”), the holding company for a diversified financial services organization, through an initial public offering (“IPO”). AXA Equitable is the holding company for a diverse group of financial services companies, including AllianceBernstein L.P., the investment adviser to the Funds (“the Adviser”). During the second quarter of 2018, AXA Equitable completed the IPO, and, as a result, AXA held approximately 72.2% of the outstanding common stock of AXA Equitable as of September 30, 2018. Contemporaneously with the IPO, AXA sold $862.5 million aggregate principal amount of its 7.25% mandatorily exchangeable notes (the “MxB Notes”) due May 15, 2021 and exchangeable into up to 43,125,000 shares of common stock (or approximately 7% of the outstanding shares of common stock of AXA Equitable). AXA retains ownership (including voting rights) of such shares of common stock until the MxB Notes are exchanged, which may be on a date that is earlier than the maturity date at AXA’s option upon the occurrence of certain events.
In March 2018, AXA announced its intention to sell its entire interest in AXA Equitable over time, subject to market conditions and other factors (the “Plan”). It is anticipated that one or more of the transactions contemplated by the Plan may ultimately result in the indirect transfer of a “controlling block” of voting securities of the Adviser (a “Change of Control Event”) and therefore may be deemed an “assignment” causing a termination of each Fund’s current investment advisory agreement. In order to ensure that the existing investment advisory services could continue uninterrupted, at meetings held in late July through early August 2018, the Boards of Directors/Trustees (each a “Board” and collectively, the “Boards”) approved new investment advisory agreements with the Adviser, in connection with the Plan. The Boards also agreed to call and hold a joint meeting of shareholders on October 11, 2018 for shareholders of each Fund to (1) approve the new investment advisory agreement with the Adviser that would be effective after the first Change of Control Event and (2) approve any future advisory agreement approved by the Board and that has terms not materially different from the current agreement, in the event there are subsequent Change of Control Events arising from completion of the Plan that terminate the advisory agreement after the first Change of Control Event. Approval of a future advisory agreement means that shareholders may not have another opportunity to vote on a new agreement with the Adviser even upon a change of control, as long as no single person or group of persons acting together gains “control” (as defined in the 1940 Act) of AXA Equitable.
| | |
| |
| abfunds.com | | AB FLEXFEE US THEMATIC PORTFOLIO | 25 |
NOTES TO FINANCIAL STATEMENTS(continued)
At the October 11, 2018 meeting, shareholders approved the new and future investment advisory agreements.
On November 20, 2018, AXA completed a public offering of 60,000,000 shares of AXA Equitable’s common stock and simultaneously sold 30,000,000 of such shares to AXA Equitable pursuant to a separate agreement with it. As a result AXA currently owns approximately 59.2% of the shares of common stock of AXA Equitable.
Pursuant to the investment advisory agreement, the Fund may reimburse the Adviser for certain legal and accounting services provided to the Fund by the Adviser. For the year ended December 31, 2018, the Adviser voluntarily agreed to waive such fees in the amount of $67,359.
The Fund compensates AllianceBernstein Investor Services, Inc. (“ABIS”), a wholly-owned subsidiary of the Adviser, under a Transfer Agency Agreement for providing personnel and facilities to perform transfer agency services for the Fund. ABIS may make payments to intermediaries that provide omnibus account services,sub-accounting services and/or networking services. The compensation retained by ABIS amounted to $18,365 for the year ended December 31, 2018.
The Fund may invest in AB Government Money Market Portfolio (the “Government Money Market Portfolio”) which has a contractual annual advisory fee rate of ..20% of the portfolio’s average daily net assets and bears its own expenses. Effective August 1, 2018, the Adviser has contractually agreed to waive .10% of the advisory fee of Government Money Market Portfolio until August 31, 2019. In connection with the investment by the Fund in Government Money Market Portfolio, the Adviser has contractually agreed to waive its advisory fee from the Fund in an amount equal to the Fund’s pro rata share of the effective advisory fees of Government Money Market Portfolio, as borne indirectly by the Fund as an acquired fund fee and expense. For the year ended December 31, 2018, such waiver amounted to $5,001.
A summary of the Fund’s transactions in AB mutual funds for the year ended December 31, 2018 is as follows:
| | | | | | | | | | | | | | | | | | | | |
Fund | | Market Value
12/31/17
(000) | | | Purchases
at Cost
(000) | | | Sales
Proceeds
(000) | | | Market Value
12/31/18
(000) | | | Dividend
Income
(000) | |
Government Money Market Portfolio | | $ | 73 | | | $ | 62,786 | | | $ | 58,857 | | | $ | 4,002 | | | $ | 60 | |
Government Money Market Portfolio* | | | – 0 | – | | | 2,128 | | | | 1,010 | | | | 1,118 | | | | 2 | |
| | | | | | | | | | | | | | | | | | | | |
| | | | | | | | | | | | | | $ | 5,120 | | | $ | 62 | |
| | | | | | | | | | | | | | | | | | | | |
| * | Investment of cash collateral for securities lending transactions (see Note D). |
| | |
| |
| 26 | AB FLEXFEE US THEMATIC PORTFOLIO | | abfunds.com |
NOTES TO FINANCIAL STATEMENTS(continued)
Brokerage commissions paid on investment transactions for the year ended December 31, 2018 amounted to $16,679, of which $0 and $0, respectively, was paid to Sanford C. Bernstein & Co. LLC and Sanford C. Bernstein Limited, affiliates of the Adviser.
NOTE C
Investment Transactions
Purchases and sales of investment securities (excluding short-term investments) for the year ended December 31, 2018, were as follows:
| | | | | | | | |
| | | Purchases | | | Sales | |
Investment securities (excluding U.S. government securities) | | $ | 78,887,908 | | | $ | 13,923,012 | |
U.S. government securities | | | – 0 | – | | | – 0 | – |
The cost of investments for federal income tax purposes, gross unrealized appreciation and unrealized depreciation are as follows:
| | | | |
Cost | | $ | 68,538,241 | |
| | | | |
Gross unrealized appreciation | | $ | 1,808,947 | |
Gross unrealized depreciation | | | (4,081,324 | ) |
| | | | |
Net unrealized depreciation | | $ | (2,272,377 | ) |
| | | | |
1. Derivative Financial Instruments
The Fund may use derivatives in an effort to earn income and enhance returns, to replace more traditional direct investments, to obtain exposure to otherwise inaccessible markets (collectively, “investment purposes”), or to hedge or adjust the risk profile of its portfolio.
The Fund did not engage in derivative transactions during the year ended December 31, 2018.
2. Currency Transactions
The Fund may invest innon-U.S. Dollar-denominated securities on a currency hedged or unhedged basis. The Fund may seek investment opportunities by taking long or short positions in currencies through the use of currency-related derivatives, including forward currency exchange contracts, futures and options on futures, swaps, and other options. The Fund may enter into transactions for investment opportunities when it anticipates that a foreign currency will appreciate or depreciate in value but securities denominated in that currency are not held by the Fund and do not present attractive investment opportunities. Such transactions may also be used when the Adviser believes that it may be more efficient than a direct investment in a foreign currency-denominated security. The Fund may also conduct currency exchange contracts on a spot basis (i.e., for cash at the spot rate prevailing in the currency exchange market for buying or selling currencies).
| | |
| |
| abfunds.com | | AB FLEXFEE US THEMATIC PORTFOLIO | 27 |
NOTES TO FINANCIAL STATEMENTS(continued)
NOTE D
Securities Lending
The Fund may enter into securities lending transactions. Under the Fund’s securities lending program, all loans of securities will be collateralized continually by cash. The Fund will be compensated for the loan from a portion of the net return from the income earned on cash collateral after a rebate is paid to the borrower (in some cases, this rebate may be a “negative rebate” or fee paid by the borrower to the Fund in connection with the loan), and payments are made for fees of the securities lending agent and for certain other administrative expenses. It is the policy of the Fund to receive collateral consisting of cash in an amount exceeding the value of the securities loaned. A Fund will have the right to call a loan and obtain the securities loaned at any time on notice to the borrower within the normal and customary settlement time for the securities. While the securities are on loan, the borrower is obligated to pay the Fund amounts equal to any income or other distributions from the securities. The Fund will not be able to exercise voting rights with respect to any securities during the existence of a loan, but will have the right to regain ownership of loaned securities in order to exercise voting or other ownership rights. The lending agent has agreed to indemnify the Fund in the case of default of any securities borrower. Collateral received and securities loaned are marked to market daily to ensure that the securities loaned are secured by collateral. The lending agent currently invests the cash collateral received in Government Money Market Portfolio, an eligible money market vehicle, in accordance with the investment restrictions of the Fund, and as approved by the Board. The collateral received on securities loaned is recorded as an asset as well as a corresponding liability in the statement of assets and liabilities. When the Fund lends securities, its investment performance will continue to reflect changes in the value of the securities loaned. At December 31, 2018, Fund had securities on loan with a value of $1,095,330 and had received cash collateral which has been invested into Government Money Market Portfolio of $1,117,745. The cash collateral will be adjusted on the next business day to maintain the required collateral amount. The Fund earned securities lending income of $4,599 and $2,431 from the borrowers and Government Money Market Portfolio, respectively, for the year ended December 31, 2018; these amounts are reflected in the statement of operations. In connection with the cash collateral investment by the Fund in the Government Money Market Portfolio, the Adviser has agreed to waive a portion of the Fund’s share of the advisory fees of Government Money Market Portfolio, as borne indirectly by the Fund as an acquired fund fee and expense. For the year ended December 31, 2018, such waiver amounted to $18. A principal risk of lending portfolio securities is that the borrower will fail to return the loaned securities upon termination of the loan and that the collateral will not be sufficient to replace the loaned securities.
| | |
| |
| 28 | AB FLEXFEE US THEMATIC PORTFOLIO | | abfunds.com |
NOTES TO FINANCIAL STATEMENTS(continued)
NOTE E
Capital Stock
Each class consists of 1,000,000,000 authorized shares. Transactions in capital shares for each class were as follows:
| | | | | | | | | | | | | | | | | | | | | | | | |
| | | | | | | | | | | | | | | | | | | | | | | | |
| | | Shares | | | | | | Amount | | | | |
| | | Year Ended
December 31,
2018 | | | June 28, 2017*
to December 31,
2017 | | | | | | Year Ended
December 31,
2018 | | | June 28, 2017*
to December 31,
2017 | | | | |
| | | | | | | | |
| Advisor Class | | | | | | | | | | | | | | | | | | | | | | | | |
Shares sold | | | 6,307,763 | | | | 100,000 | | | | | | | $ | 71,764,101 | | | $ | 1,000,003 | | | | | |
| | | | | |
Shares issued in reinvestment of dividends and distributions | | | 12,998 | | | | – 0 | – | | | | | | | 137,647 | | | | – 0 | – | | | | |
| | | | | |
Shares redeemed | | | (261,434 | ) | | | – 0 | – | | | | | | | (2,936,017 | ) | | | – 0 | – | | | | |
| | | | | |
Net increase | | | 6,059,327 | | | | 100,000 | | | | | | | $ | 68,965,731 | | | $ | 1,000,003 | | | | | |
| | | | | |
| * | Commencement of operations. |
At December 31, 2018, the Adviser owned 57% of the Fund’s outstanding shares. Significant transactions by such shareholder, if any, may impact the Fund’s performance.
NOTE F
Risks Involved in Investing in the Fund
Foreign(Non-U.S.) Risk—Investments in securities ofnon-U.S. issuers may involve more risk than those of U.S. issuers. These securities may fluctuate more widely in price and may be less liquid due to adverse market, economic, political, regulatory or other factors.
Capitalization Risk—Investments inmid-capitalization companies may be more volatile than investments in large-capitalization companies. Investments inmid-capitalization companies may have additional risks because these companies have limited product lines, markets or financial resources.
Indemnification Risk—In the ordinary course of business, the Fund enters into contracts that contain a variety of indemnifications. The Fund’s maximum exposure under these arrangements is unknown. However, the Fund has not had prior claims or losses pursuant to these indemnification provisions and expects the risk of loss thereunder to be remote. Therefore, the Fund has not accrued any liability in connection with these indemnification provisions.
| | |
| |
| abfunds.com | | AB FLEXFEE US THEMATIC PORTFOLIO | 29 |
NOTES TO FINANCIAL STATEMENTS(continued)
NOTE G
Distributions to Shareholders
The tax character of distributions paid during the fiscal year ended December 31, 2018 and fiscal period ended December 31, 2017 were as follows:
| | | | | | | | |
| | | 2018 | | | 2017 | |
Distributions paid from: | | | | | | | | |
Ordinary income | | $ | 359,924 | | | $ | 2,170 | |
| | | | | | | | |
Total taxable distributions paid | | $ | 359,924 | | | $ | 2,170 | |
| | | | | | | | |
As of December 31, 2018, the components of accumulated earnings/(deficit) on a tax basis were as follows:
| | | | |
Undistributed ordinary income | | $ | 11,474 | |
Accumulated capital and other losses | | | (2,480,521 | )(a) |
Unrealized appreciation/(depreciation) | | | (2,272,377 | )(b) |
| | | | |
Total accumulated earnings/(deficit) | | $ | (4,741,424 | ) |
| | | | |
| (a) | As of December 31, 2018, the Fund had a net capital loss carryforward of $2,480,521. |
| (b) | The difference between book-basis and tax-basis unrealized appreciation/(depreciation) is attributable primarily to the tax deferral of losses on wash sales. |
For tax purposes, net realized capital losses may be carried over to offset future capital gains, if any. Funds are permitted to carry forward capital losses for an indefinite period, and such losses will retain their character as either short-term or long-term capital losses. As of December 31, 2018, the Fund had a net short-term capital loss carryforward of $2,458,794 and a net long-term capital loss carryforward of $21,727, which may be carried forward for an indefinite period.
During the current fiscal year, permanent differences primarily due to the tax treatment of offering costs resulted in a net decrease in accumulated loss and a net decrease in additional paid-in capital. These reclassifications had no effect on net assets.
NOTE H
Recent Accounting Pronouncements
In August 2018, the Financial Accounting Standards Board issued an Accounting Standards Update, ASU2018-13, Fair Value Measurement (Topic 820), Disclosure Framework-Changes to the Disclosure Requirements for Fair Value Measurement which removes, modifies and adds disclosures to Topic 820. The amendments in this ASU2018-13 apply to all entities that are required, under existing U.S. GAAP, to make disclosures about recurring or nonrecurring fair value measurements. The amendments in this ASU2018-13 are effective for all entities for fiscal years, and interim periods within those fiscal years, beginning after December 15, 2019. At this time, management is evaluating the implications of these changes on the financial statements.
| | |
| |
| 30 | AB FLEXFEE US THEMATIC PORTFOLIO | | abfunds.com |
NOTES TO FINANCIAL STATEMENTS(continued)
In October 2018, the U.S. Securities and Exchange Commission adopted amendments to certain disclosure requirements included in RegulationS-X that had become “redundant, duplicative, overlapping, outdated or superseded, in light of the other Commission disclosure requirements, GAAP or changes in the information environment.” The compliance date for the amendments to RegulationS-X was November 5, 2018 (for reporting period end dates of September 30, 2018 or after). Management has adopted the amendments which simplified certain disclosure requirements on the financial statements.
NOTE I
Subsequent Events
Management has evaluated subsequent events for possible recognition or disclosure in the financial statements through the date the financial statements are issued. Management has determined that there are no material events that would require disclosure in the Fund’s financial statements through this date.
| | |
| |
| abfunds.com | | AB FLEXFEE US THEMATIC PORTFOLIO | 31 |
FINANCIAL HIGHLIGHTS
Selected Data For A Share Of Capital Stock Outstanding Throughout Each Period
| | | | | | | | |
| | | Advisor Class | |
| | | Year Ended
December 31,
2018 | | | June 28,
2017(a) to
December 31,
2017 | |
| | | | |
Net asset value, beginning of period | | | $ 11.11 | | | | $ 10.00 | |
| | | | |
Income From Investment Operations | | | | | | | | |
| | |
Net investment income(b)(c) | | | .08 | | | | .04 | |
| | |
Net realized and unrealized gain (loss) on investment | | | (.54 | ) | | | 1.09 | |
| | | | |
Net increase (decrease) in net asset value from operations | | | (.46 | ) | | | 1.13 | |
| | | | |
Less: Dividends and Distributions | | | | | | | | |
| | |
Dividends from net investment income | | | (.06 | ) | | | (.02 | ) |
| | |
Distributions from net realized gain on investment | | | (.00 | )(d) | | | – 0 | – |
| | | | |
Total dividends and distributions | | | (.06 | ) | | | (.02 | ) |
| | | | |
Net asset value, end of period | | | $ 10.59 | | | | $ 11.11 | |
| | | | |
| | |
Total Return | | | | | | | | |
| | |
Total investment return based on net asset value(e) | | | (4.15 | )% | | | 11.32 | % |
| | |
Ratios/Supplemental Data | | | | | | | | |
| | |
Net assets, end of period (000’s omitted) | | | $65,208 | | | | $1,111 | |
| | |
Ratio to average net assets of: | | | | | | | | |
| | |
Expenses, net of waivers/reimbursements(f)† | | | .42 | %(g) | | | .33 | %(h) |
| | |
Expenses, before waivers/reimbursements(f)† | | | 1.05 | %(g) | | | 37.77 | %(h) |
| | |
Net investment income(c) | | | .73 | % | | | .66 | %(h) |
| | |
Portfolio turnover rate | | | 31 | % | | | 22 | % |
| | | | | | | | |
| |
† Expense ratios exclude the estimated acquired fund fees of affiliated/unaffiliated underlying | |
portfolios | | | .01 | % | | | .01 | % |
| (a) | Commencement of operations. |
| (b) | Based on average shares outstanding. |
| (c) | Net of expenses waived/reimbursed by the Adviser. |
| (d) | Amount is less than $0.005. |
| (e) | Total investment return is calculated assuming an initial investment made at the net asset value at the beginning of the period, reinvestment of all dividends and distributions at net asset value during the period, and redemption on the last day of the period. Total investment return does not reflect the deduction of taxes that a shareholder would pay on fund distributions or the redemption of fund shares. Total investment return for a period of less than one year is not annualized. |
| (f) | In connection with the Fund’s investments in affiliated underlying portfolios, the Fund incurs no direct expenses but bears proportionate shares of the acquired fund fees and expenses (i.e. operating, administrative and investment advisory fees) of the affiliated underlying portfolios. The Adviser has contractually agreed to waive its fees from the Fund in an amount equal to the Fund’s pro rata share of certain acquired fund fees and expenses, and for the year ended December 31, 2018 and the period ended December 31, 2017, such waiver amounted to 0.01% and 0.01% (annualized), respectively. |
| (g) | The advisory fee reflected in the Fund’s expense ratio may be higher or lower than the Base Fee plus Performance Adjustment due to the different time periods over which the fee is calculated (i.e., the financial reporting period vs. the Performance Period). |
See notes to financial statements.
| | |
| |
| 32 | AB FLEXFEE US THEMATIC PORTFOLIO | | abfunds.com |
REPORT OF INDEPENDENT REGISTERED
PUBLIC ACCOUNTING FIRM
To the Shareholders and the Board of Directors of
AB FlexFee US Thematic Portfolio:
Opinion on the Financial Statements
We have audited the accompanying statement of assets and liabilities of AB FlexFee US Thematic Portfolio (the “Fund”) (one of the portfolios constituting AB Cap Fund, Inc. (the “Company”)), including the portfolio of investments, as of December 31, 2018, and the related statement of operations for the year then ended and the statements of changes in net assets and the financial highlights for the year then ended and the period June 28, 2017 (commencement of operations) to December 31, 2017 and the related notes (collectively referred to as the “financial statements”). In our opinion, the financial statements present fairly, in all material respects, the financial position of the Fund (one of the portfolios constituting AB Cap Fund, Inc.) at December 31, 2018, the results of its operations for the year then ended and the changes in its net assets and its financial highlights for the year then ended and the period June 28, 2017 (commencement of operations) to December 31, 2017, in conformity with U.S. generally accepted accounting principles.
Basis for Opinion
These financial statements are the responsibility of the Company’s management. Our responsibility is to express an opinion on the Fund’s financial statements based on our audits. We are a public accounting firm registered with the Public Company Accounting Oversight Board (United States) (“PCAOB”) and are required to be independent with respect to the Company in accordance with the U.S. federal securities laws and the applicable rules and regulations of the Securities and Exchange Commission and the PCAOB.
We conducted our audits in accordance with the standards of the PCAOB. Those standards require that we plan and perform the audit to obtain reasonable assurance about whether the financial statements are free of material misstatement, whether due to error or fraud. The Company is not required to have, nor were we engaged to perform, an audit of the Company’s internal control over financial reporting. As part of our audits, we are required to obtain an understanding of internal control over financial reporting, but not for the purpose of expressing an opinion on the effectiveness of the Company’s internal control over financial reporting. Accordingly, we express no such opinion.
Our audits included performing procedures to assess the risks of material misstatement of the financial statements, whether due to error or fraud, and performing procedures that respond to those risks. Such procedures included examining, on a test basis, evidence regarding the amounts and disclosures in the financial statements. Our procedures included confirmation
| | |
| |
| abfunds.com | | AB FLEXFEE US THEMATIC PORTFOLIO | 33 |
REPORT OF INDEPENDENT REGISTERED
PUBLIC ACCOUNTING FIRM(continued)
of securities owned as of December 31, 2018, by correspondence with the custodian and others or by other appropriate auditing procedures where replies from others were not received. Our audits also included evaluating the accounting principles used and significant estimates made by management, as well as evaluating the overall presentation of the financial statements. We believe that our audits provide a reasonable basis for our opinion.

We have served as the auditor of one or more of the AB investment companies since 1968.
New York, New York
February 26, 2019
| | |
| |
| 34 | AB FLEXFEE US THEMATIC PORTFOLIO | | abfunds.com |
2018 FEDERAL TAX INFORMATION
(unaudited)
For Federal income tax purposes, the following information is furnished with respect to the distributions paid by the Fund for the calander year ended December 31, 2018. For corporate shareholders 99.70% of dividends paid qualify for the dividends received deduction. For individual shareholders, the Fund designates 100.00% of dividends paid as qualified dividend income.
| | |
| |
| abfunds.com | | AB FLEXFEE US THEMATIC PORTFOLIO | 35 |
RESULTS OF STOCKHOLDER MEETING
(unaudited)
A Special Meeting of Stockholders of the AB Cap Fund, Inc. (the “Company”)—AB FlexFee US Thematic Portfolio (the “Fund”) was held on October 11, 2018. A description of the proposals and number of shares voted at the Meeting are as follows (the proposal number shown below corresponds to the proposal number in the Fund’s proxy statement):
| 1. | To approve and vote upon the election of Directors for the Company, each such Director to serve for a term of indefinite duration and until his or her successor is duly elected and qualifies. |
| | | | | | | | |
Director: | | Voted
For: | | | Authority
Withheld: | |
Michael J. Downey | | | 153,531,217 | | | | 1,117,868 | |
William H. Foulk, Jr.* | | | 153,385,034 | | | | 1,264,050 | |
Nancy P. Jacklin | | | 153,607,746 | | | | 1,041,339 | |
Robert M. Keith | | | 153,546,025 | | | | 1,103,060 | |
Carol C. McMullen | | | 153,649,415 | | | | 999,670 | |
Gary L. Moody | | | 153,545,113 | | | | 1,103,972 | |
Marshall C. Turner, Jr. | | | 153,507,495 | | | | 1,141,590 | |
Earl D. Weiner | | | 153,514,727 | | | | 1,134,358 | |
| 2. | To vote upon the approval of new advisory agreements for the Fund with AllianceBernstein L.P. |
| | | | | | | | | | | | | | |
Voted For: | | | Voted
Against: | | | Abstain: | | | Broker
Non-Votes: | |
| | 3,941,306 | | | | – 0 | – | | | – 0 | – | | | 9,006 | |
| * | Mr. Foulk retired on December 31, 2018. |
| | |
| |
| 36 | AB FLEXFEE US THEMATIC PORTFOLIO | | abfunds.com |
BOARD OF DIRECTORS
| | |
Marshall C. Turner, Jr(1),Chairman Michael J. Downey(1) Nancy P. Jacklin(1) | | Robert M. Keith,President andChief Executive Officer Carol C. McMullen(1) Garry L. Moody(1) Earl D. Weiner(1) |
OFFICERS
| | |
Daniel C. Roarty(2),Vice President Benjamin Ruegsegger(2) Emilie D. Wrapp,Secretary Michael B. Reyes,Senior Analyst | | Joseph J. Mantineo,Treasurerand Chief Financial Officer Phyllis J. Clarke, Controller Vincent S. Noto,ChiefCompliance Officer |
| | |
Custodian and Accounting Agent Brown Brothers Harriman & Co. 50 Post Office Square Boston, MA 02110 Principal Underwriter AllianceBernstein Investments, Inc. 1345 Avenue of the Americas New York, NY 10105 | | Independent Registered Public Accounting Firm Ernst & Young LLP 5 Times Square New York, NY 10036 Legal Counsel Seward & Kissel LLP One Battery Park Plaza New York, NY 10004 |
Transfer Agent
AllianceBernstein Investor Services,
Inc.
P.O. Box 786003
San Antonio, TX 78278-6003
Toll-Free (800)221-6003
| 1 | Member of the Audit Committee, the Governance and Nominating Committee and the Independent Directors Committee. |
| 2 | Theday-to-day management of, and investment decisions for, the Fund are made by the Adviser’s Global Growth and Thematic Investment Team. Messrs. Roarty and Ruegsegger are the investment professional with the most significant responsibility for theday-to-day management of the Fund on the Team. |
| | |
| |
| abfunds.com | | AB FLEXFEE US THEMATIC PORTFOLIO | 37 |
MANAGEMENT OF THE FUND
Board of Directors Information
The business and affairs of the Fund are managed under the direction of the Board of Directors. Certain information concerning the Fund’s Directors is set forth below.
| | | | | | | | |
NAME,
ADDRESS*, AGE,
(YEAR FIRST ELECTED**) | | PRINCIPAL
OCCUPATION(S)
DURING PAST FIVE YEARS
AND OTHER INFORMATION*** | | PORTFOLIOS
IN AB FUND COMPLEX
OVERSEEN BY
DIRECTOR | | | OTHER PUBLIC
COMPANY
DIRECTORSHIPS
CURRENTLY HELD
BY DIRECTOR |
| INTERESTED DIRECTOR | | | | | | |
| | | |
Robert M. Keith,# 1345 Avenue of the Americas New York, NY 10105 58 (2015) | | Senior Vice President of AllianceBernstein L.P. (the “Adviser”) and the head of AllianceBernstein Investments, Inc. (“ABI”) since July 2008; Director of ABI and President of the AB Mutual Funds. Previously, he served as Executive Managing Director of ABI from December 2006 to June 2008. Prior to joining ABI in 2006, Executive Managing Director of Bernstein Global Wealth Management, and prior thereto, Senior Managing Director and Global Head of Client Service and Sales of the Adviser’s institutional investment management business since 2004. Prior thereto, he was Managing Director and Head of North American Client Service and Sales in the Adviser’s institutional investment management business, with which he had been associated since prior to 2004. | | | 95 | | | None |
| | | | | | | | |
| | |
| |
| 38 | AB FLEXFEE US THEMATIC PORTFOLIO | | abfunds.com |
MANAGEMENT OF THE FUND(continued)
| | | | | | | | |
NAME,
ADDRESS*, AGE,
(YEAR FIRST ELECTED**) | | PRINCIPAL
OCCUPATION(S)
DURING PAST FIVE YEARS
AND OTHER INFORMATION*** | | PORTFOLIOS
IN AB FUND COMPLEX
OVERSEEN BY
DIRECTOR | | | OTHER PUBLIC
COMPANY
DIRECTORSHIPS
CURRENTLY HELD
BY DIRECTOR |
DISINTERESTED DIRECTORS
| | | | | | |
| | | |
Marshall C. Turner, Jr.,## Chairman of the Board 77 (2015) | | Private Investor since prior to 2014. Former Chairman and CEO of Dupont Photomasks, Inc. (components of semi-conductor manufacturing). He has extensive operating leadership, and venture capital investing experience, including five interim or full-time CEO roles, and prior service as general partner of institutional venture capital partnerships. He also has extensive non-profit board leadership experience, and currently serves on the boards of two education and science-related non-profit organizations. He has served as a director of one AB Fund since 1992, and director or trustee of multiple AB funds since 2005. He has been Chairman of the AB Funds since January 2014, and the Chairman of the Independent Directors Committees of such AB Funds since February 2014. | | | 95 | | | Xilinx, Inc. (programmablelogic semi- conductors) since 2007 |
| | | | | | | | |
| | | |
Michael J. Downey,## 75 (2015) | | Private Investor since prior to 2014. Formerly, managing partner of Lexington Capital, LLC (investment advisory firm) from December 1997 until December 2003. He also served as a Director of Prospect Acquisition Corp. (financial services) from 2007 until 2009. From 1987 until 1993, Chairman and CEO of Prudential Mutual Fund Management, director of the Prudential mutual funds, and member of the Executive Committee of Prudential Securities Inc. He has served as a director or trustee of the AB Funds since 2005 and is a director and Chairman of one other registered investment company. | | | 95 | | | The Asia Pacific Fund, Inc. (registered investment company) since prior to 2014 |
| | |
| |
| abfunds.com | | AB FLEXFEE US THEMATIC PORTFOLIO | 39 |
MANAGEMENT OF THE FUND(continued)
| | | | | | | | |
NAME,
ADDRESS*, AGE,
(YEAR FIRST ELECTED**) | | PRINCIPAL
OCCUPATION(S)
DURING PAST FIVE YEARS
AND OTHER INFORMATION*** | | PORTFOLIOS
IN AB FUND COMPLEX
OVERSEEN BY
DIRECTOR | | | OTHER PUBLIC
COMPANY
DIRECTORSHIPS
CURRENTLY HELD
BY DIRECTOR |
DISINTERESTED DIRECTORS
(continued) | | | | | | |
| | | |
Nancy P. Jacklin,## 70 (2015) | | Private Investor since prior to 2014. Professorial Lecturer at the Johns Hopkins School of Advanced International Studies (2008-2015). U.S. Executive Director of the International Monetary Fund (which is responsible for ensuring the stability of the international monetary system), (December 2002-May 2006); Partner, Clifford Chance (1992-2002); Sector Counsel, International Banking and Finance, and Associate General Counsel, Citicorp (1985-1992); Assistant General Counsel (International), Federal Reserve Board of Governors (1982-1985); and Attorney Advisor, U.S. Department of the Treasury (1973-1982). Member of the Bar of the District of Columbia and of New York; and member of the Council on Foreign Relations. She has served as a director or trustee of the AB Funds since 2006 and has been Chair of the Governance and Nominating Committees of the AB Funds since August 2014. | | | 95 | | | None |
| | |
| |
| 40 | AB FLEXFEE US THEMATIC PORTFOLIO | | abfunds.com |
MANAGEMENT OF THE FUND(continued)
| | | | | | | | |
NAME,
ADDRESS*, AGE,
(YEAR FIRST ELECTED**) | | PRINCIPAL
OCCUPATION(S)
DURING PAST FIVE YEARS
AND OTHER INFORMATION*** | | PORTFOLIOS
IN AB FUND COMPLEX
OVERSEEN BY
DIRECTOR | | | OTHER PUBLIC
COMPANY
DIRECTORSHIPS
CURRENTLY HELD
BY DIRECTOR |
DISINTERESTED DIRECTORS
(continued) | | | | | | |
| | | |
Carol C. McMullen,## 63 (2016) | | Managing Director of Slalom Consulting (consulting) since 2014 and private investor and member of the Partners Healthcare Investment Committee. Formerly, Director of Norfolk & Dedham Group (mutual property and casualty insurance) from 2011 until November 2016; Director of Partners Community Physicians Organization (healthcare) from 2014 until December 2016; and Managing Director of The Crossland Group (consulting) from 2012 until 2013. She has held a number of senior positions in the asset and wealth management industries, including at Eastern Bank (where her roles included President of Eastern Wealth Management), Thomson Financial (Global Head of Sales for Investment Management), and Putnam Investments (where her roles included Head of Global Investment Research). She has served on a number of private company and non-profit boards, and as a director or trustee of the AB Funds since June 2016. | | | 95 | | | None |
| | | | | | | | |
| | |
| |
| abfunds.com | | AB FLEXFEE US THEMATIC PORTFOLIO | 41 |
MANAGEMENT OF THE FUND(continued)
| | | | | | | | |
NAME,
ADDRESS*, AGE,
(YEAR FIRST ELECTED**) | | PRINCIPAL
OCCUPATION(S)
DURING PAST FIVE YEARS
AND OTHER INFORMATION*** | | PORTFOLIOS
IN AB FUND COMPLEX
OVERSEEN BY
DIRECTOR | | | OTHER PUBLIC
COMPANY
DIRECTORSHIPS
CURRENTLY HELD
BY DIRECTOR |
DISINTERESTED DIRECTORS
(continued) | | | | | | |
| | | |
Garry L. Moody,## 66 (2015) | | Independent Consultant. Formerly, Partner, Deloitte & Touche LLP (1995-2008) where he held a number of senior positions, including Vice Chairman, and U.S. and Global Investment Management Practice Managing Partner; President, Fidelity Accounting and Custody Services Company (1993-1995), where he was responsible for the accounting, pricing, custody and reporting for the Fidelity mutual funds; and Partner, Ernst & Young LLP (1975-1993), where he served as the National Director of Mutual Fund Tax Services and Managing Partner of its Chicago Office Tax department. He is a member of the Trustee Advisory Board of BoardIQ, a biweekly publication focused on issues and news affecting directors of mutual funds. He has served as a director or trustee and as Chairman of the Audit Committees of the AB Funds since 2008. | | | 95 | | | None |
| | | | | | | | |
| | | |
Earl D. Weiner,## 79 (2015) | | Of Counsel, and Partner prior to January 2007, of the law firm Sullivan & Cromwell LLP and is a former member of the ABA Federal Regulation of Securities Committee Task Force to draft editions of the Fund Director’s Guidebook. He also serves as a director or trustee of various non-profit organizations and has served as Chairman or Vice Chairman of a number of them. He has served as a director or trustee of the AB Funds since 2007 and served as Chairman of the Governance and Nominating Committees of the AB Funds from 2007 until August 2014. | | | 95 | | | None |
| | |
| |
| 42 | AB FLEXFEE US THEMATIC PORTFOLIO | | abfunds.com |
MANAGEMENT OF THE FUND(continued)
| * | The address for each of the Fund’s disinterested Directors is c/o AllianceBernstein L.P., Attention: Legal & Compliance Department—Mutual Fund Legal, 1345 Avenue of the Americas, New York, NY 10105. |
| ** | There is no stated term of office for the Fund’s Directors. |
| *** | The information above includes each Director’s principal occupation during the last five years and other information relating to the experience, attributes and skills relevant to each Director’s qualifications to serve as a Director, which led to the conclusion that each Director should serve as a Director for the Fund. |
| # | Mr. Keith is an “interested person” of the Fund, as defined in the 1940 Act, due to his position as a Senior Vice President of the Adviser. |
| ## | Member of the Audit Committee, the Governance and Nominating Committee and the Independent Directors Committee. |
| | |
| |
| abfunds.com | | AB FLEXFEE US THEMATIC PORTFOLIO | 43 |
MANAGEMENT OF THE FUND(continued)
Officer Information
| | | | |
Robert M. Keith, 58 | | President and Chief Executive Officer | | See biography above. |
| | | | |
Benjamin Ruegsegger, 39 | | Vice President | | Senior Vice President of the Adviser**, with which he has been associated since prior to 2014. |
| | | | |
Daniel C. Roarty, 47 | | Vice President | | Senior Vice President of the Adviser**, with which he has been associated since prior to 2014. He is also Chief Investment Officer of Thematic and Sustainable Equities. |
| | | | |
Emilie D. Wrapp, 63 | | Secretary | | Senior Vice President, Assistant General Counsel and Assistant Secretary of ABI**, with which she has been associated since prior to 2014. |
| | | | |
Michael B. Reyes, 42 | | Senior Analyst | | Vice President of the Adviser**, with which he has been associated since prior to 2014. |
| | | | |
Joseph J. Mantineo, 59 | | Treasurer and Chief Financial Officer | | Senior Vice President of AllianceBernstein Investor Services (“ABIS”)**, with which he has been associated since prior to 2014. |
| | | | |
Phyllis J. Clarke, 58 | | Controller | | Vice President of ABIS**, with which she has been associated since prior to 2014. |
| | | | |
Vince S. Noto, 54 | | Chief Compliance Officer | | Senior Vice President since 2015 and Mutual Fund Chief Compliance Officer of the Adviser** since 2014. Prior thereto, he was Vice President and Director of Mutual Fund Compliance of the Adviser** since 2012. |
| * | The address for each of the Fund’s Officers is 1345 Avenue of the Americas, New York, NY 10105. |
| ** | The Adviser, ABI and ABIS are affiliates of the Fund. |
The Fund’s Statement of Additional Information (“SAI”) has additional information about the Fund’s Directors and Officers and is available without charge upon request. Contact your financial representative or AB at(800) 227-4618, or visit www.abfunds.com, for a free prospectus or SAI.
| | |
| |
| 44 | AB FLEXFEE US THEMATIC PORTFOLIO | | abfunds.com |
Information Regarding the Review and Approval of the Fund’s Advisory Agreement
As described in more detail in the Proxy Statement for the AB Funds dated August 20, 2018, the Boards of the AB Funds, at a meeting held onJuly 31-August 2, 2018, approved new advisory agreements with the Adviser (the “Proposed Agreements”) for the AB Funds, including AB Cap Fund, Inc. in respect of AB FlexFeeTM US Thematic Portfolio (the “Fund”), in connection with the planned disposition by AXA S.A. of its remaining shares of AXA Equitable Holdings, Inc. (the indirect holder of a majority of the partnership interests in the Adviser and the indirect parent of AllianceBernstein Corporation, the general partner of the Adviser) in one or more transactions and the related potential for one or more “assignments” (within the meaning of section 2(a)(4) of the Investment Company Act) of the advisory agreements for the AB Funds, including the Fund’s Advisory Agreement, resulting in the automatic termination of such advisory agreements.
At the same meeting, the AB Boards also considered and approved interim advisory agreements with the Adviser (the “Interim Advisory Agreements”) for the AB Funds, including the Fund, to be effective only in the event that stockholder approval of a Proposed Agreement had not been obtained as of the date of one or more transactions resulting in an “assignment” of the Adviser’s advisory agreements, resulting in the automatic termination of such advisory agreements.
The shareholders of the Fund subsequently approved the Proposed Agreements at an annual meeting of shareholders called for the purpose of electing Directors and voting on the Proposed Agreements.
A discussion regarding the basis for the Boards’ approvals at a meeting held onJuly 31-August 2, 2018 is set forth below.
Information Regarding the Review and Approval of the Fund’s Proposed New Advisory Agreement and Interim Advisory Agreement in the Context of Potential Assignments
At a meeting of the AB Boards held on July31-August 2, 2018, the Adviser presented its recommendation that the Boards consider and approve the Proposed Agreements. Section 15(c) of the 1940 Act provides that, after an initial period, a Fund’s Current Agreement and currentsub-advisory agreement, as applicable, will remain in effect only if the Board, including a majority of the Independent Directors, annually reviews and approves them. Each of the Current Agreements had been approved by a Board within theone-year period prior to approval of its related Proposed Agreement, except that the Current Agreements for certain FlexFee funds were approved in February 2017. In connection with their approval of the Proposed Agreements, the Boards considered their conclusions in connection with their most recent approvals of the Current Agreements, in particular in cases where the last approval of a Current Agreement was relatively recent, including the Boards’ general satisfaction with the nature
| | |
| |
| abfunds.com | | AB FLEXFEE US THEMATIC PORTFOLIO | 45 |
and quality of services being provided and, as applicable, in the case of certain Funds, actions taken or to be taken in an effort to improve investment performance or reduce expense ratios. The Directors also reviewed updated information provided by the Adviser in respect of each Fund. Also in connection with their approval of the Proposed Agreements, the Boards considered a representation made to them at that time by the Adviser that there were no additional developments not already disclosed to the Boards since their most recent approvals of the Current Agreements that would be a material consideration to the Boards in connection with their consideration of the Proposed Agreements, except for matters disclosed to the Boards by the Adviser. The Directors considered the fact that each Proposed Agreement would have corresponding terms and conditions identical to those of the corresponding Current Agreement with the exception of the effective date and initial term under the Proposed Agreement.
The Directors considered their knowledge of the nature and quality of the services provided by the Adviser to each Fund gained from their experience as directors or trustees of registered investment companies advised by the Adviser, their overall confidence in the Adviser’s integrity and competence they have gained from that experience, the Adviser’s initiative in identifying and raising potential issues with the Directors and its responsiveness, frankness and attention to concerns raised by the Directors in the past, including the Adviser’s willingness to consider and implement organizational and operational changes designed to improve investment results and the services provided to the Funds. The Directors noted that they have four regular meetings each year, at each of which they review extensive materials and information from the Adviser, including information on the investment performance of each Fund.
The Directors also considered all factors they believed relevant, including the specific matters discussed below. During the course of their deliberations, the Directors evaluated, among other things, the reasonableness of the management fees of the Funds they oversee. The Directors did not identify any particular information that wasall-important or controlling, and different Directors may have attributed different weights to the various factors. The Directors determined that the selection of the Adviser to manage the Funds, and the overall arrangements between the Funds and the Adviser, as provided in the Proposed Agreements, including the management fees, were fair and reasonable in light of the services performed under the Current Agreements and to be performed under the Proposed Agreements, expenses incurred and to be incurred and such other matters as the Directors considered relevant in the exercise of their business judgment. The material factors and conclusions that formed the basis for the Directors’ determinations included the following:
Nature, Extent and Quality of Services Provided
The Directors considered the scope and quality of services to be provided by the Adviser under the Proposed Agreements, including the quality of
| | |
| |
| 46 | AB FLEXFEE US THEMATIC PORTFOLIO | | abfunds.com |
the investment research capabilities of the Adviser and the other resources it has dedicated to performing services for the Funds. They also considered the information that had been provided to them by the Adviser concerning the anticipated implementation of the Plan and the Adviser’s representation that it did not anticipate that such implementation would affect the management or structure of the Adviser, have a material adverse effect on the Adviser, or adversely affect the quality of the services provided to the Funds by the Adviser and its affiliates. The Directors noted that the Adviser from time to time reviews each Fund’s investment strategies and from time to time proposes changes intended to improve the Fund’s relative or absolute performance for the Directors’ consideration. They also noted the professional experience and qualifications of each Fund’s portfolio management team and other senior personnel of the Adviser. The Directors also considered that certain Proposed Agreements, similar to the corresponding Current Agreements, provide that the Funds will reimburse the Adviser for the cost to it of providing certain clerical, accounting, administrative and other services to the Funds by employees of the Adviser or its affiliates. Requests for these reimbursements are made on a quarterly basis and subject to approval by the Directors. The Directors noted that the Adviser did not request any reimbursements from certain Funds in the Fund’s latest fiscal year reviewed. The Directors noted that the methodology to be used to determine the reimbursement amounts had been reviewed by an independent consultant retained by the Funds’ former Senior Officer/Independent Compliance Officer. The quality of administrative and other services, including the Adviser’s role in coordinating the activities of the Funds’ other service providers, also was considered. The Directors of each Fund concluded that, overall, they were satisfied with the nature, extent and quality of services to be provided to the Funds under the Proposed Agreement for the Fund.
Costs of Services to be Provided and Profitability
The Directors reviewed a schedule of the revenues and expenses and related notes indicating the profitability of each Fund to the Adviser for calendar years 2016 and 2017, as applicable, that had been prepared with an expense allocation methodology arrived at in consultation with an independent consultant retained by the Funds’ former Senior Officer/Independent Compliance Officer. The Directors noted the assumptions and methods of allocation used by the Adviser in preparing fund-specific profitability data and understood that there are a number of potentially acceptable allocation methodologies for information of this type. The Directors noted that the profitability information reflected all revenues and expenses of the Adviser’s relationship with a Fund, including those relating to its subsidiaries that provide transfer agency, distribution and brokerage services to the Fund, as applicable. The Directors recognized that it is difficult to make comparisons of the profitability of the Proposed Agreements with the profitability of fund advisory contracts for unaffiliated funds because comparative information is not generally publicly available and is
| | |
| |
| abfunds.com | | AB FLEXFEE US THEMATIC PORTFOLIO | 47 |
affected by numerous factors. The Directors focused on the profitability of the Adviser’s relationship with each Fund before taxes and distribution expenses, as applicable. The Directors noted that certain Funds were not profitable to the Adviser in one or more periods reviewed. The Directors concluded that the Adviser’s level of profitability from its relationship with the other Funds was not unreasonable. The Directors were unable to consider historical information about the profitability of certain Funds that had recently commenced operations and for which historical profitability information was not available. The Adviser agreed to provide the Directors with profitability information in connection with future proposed continuances of the Proposed Agreements.
Fall-Out Benefits
The Directors considered the other benefits to the Adviser and its affiliates from their relationships with the Funds, including, but not limited to, as applicable, benefits relating to soft dollar arrangements (whereby investment advisers receive brokerage and research services from brokers that execute agency transactions for their clients) in the case of certain Funds;12b-1 fees and sales charges received by the principal underwriter (which is a wholly owned subsidiary of the Adviser) in respect of certain classes of the shares of most of the Funds; brokerage commissions paid by certain Funds to brokers affiliated with the Adviser; and transfer agency fees paid by most of the Funds to a wholly owned subsidiary of the Adviser. The Directors recognized that the Adviser’s profitability would be somewhat lower, and that a Fund’s unprofitability to the Adviser would be exacerbated, without these benefits. The Directors understood that the Adviser also might derive reputational and other benefits from its association with the Funds.
Investment Results
In addition to the information reviewed by the Directors in connection with the Board meeting at which the Proposed Agreements were approved, the Directors receive detailed performance information for the Funds at each regular Board meeting during the year.
The Boards’ consideration of each Proposed Agreement was informed by their most recent approval of the related Current Agreement, and, in the case of certain Funds, their discussion with the Adviser of the reasons for those Funds’ underperformance in certain periods. The Directors also reviewed updated performance information and, in some cases, discussed with the Adviser the reasons for changes in performance or continued underperformance. On the basis of this review, the Directors concluded that each Fund’s investment performance was acceptable.
Management Fees and Other Expenses
The Directors considered the management fee rate payable by each Fund to the Adviser and information prepared by an independent service provider (the ‘‘15(c) provider’’) concerning management fee rates payable by
| | |
| |
| 48 | AB FLEXFEE US THEMATIC PORTFOLIO | | abfunds.com |
other funds in the same category as the Fund. The Directors recognized that it is difficult to make comparisons of management fees because there are variations in the services that are included in the fees paid by other funds. The Directors compared each Fund’s contractual management fee rate with a peer group median, and where applicable, took into account the impact on the management fee rate of the administrative expense reimbursement paid to the Adviser in the latest fiscal year. In the case of the ACS Funds, the Directors noted that the management fee rate is zero but also were cognizant that the Adviser is indirectly compensated by the wrap fee program sponsors that use the ACS Funds as an investment vehicle for their clients.
The Directors also considered the Adviser’s fee schedule for other clients pursuing a similar investment style to each Fund. For this purpose, they reviewed the relevant advisory fee information from the Adviser’s Form ADV and in a report from the Funds’ Senior Analyst and noted the differences between a Fund’s fee schedule, on the one hand, and the Adviser’s institutional fee schedule and the schedule of fees charged by the Adviser to any offshore funds and for services to anysub-advised funds pursuing a similar investment strategy as the Fund, on the other, as applicable. The Directors noted that the Adviser may, in some cases, agree to fee rates with large institutional clients that are lower than those reviewed by the Directors and that they had previously discussed with the Adviser its policies in respect of such arrangements. The Adviser also informed the Directors that, in the case of certain Funds, there were no institutional products managed by the Adviser that have a substantially similar investment style. The Directors also discussed these matters with their independent fee consultant.
The Adviser reviewed with the Directors the significantly greater scope of the services it provides to each Fund relative to institutional, offshore fund andsub-advised fund clients, as applicable. In this regard, the Adviser noted, among other things, that, compared to institutional and offshore orsub-advisory accounts, each Fund, as applicable, (i) demands considerably more portfolio management, research and trading resources due to significantly higher daily cash flows (in the case ofopen-end Funds); (ii) has more tax and regulatory restrictions and compliance obligations; (iii) must prepare and file or distribute regulatory and other communications about fund operations; and (iv) must provide shareholder servicing to retail investors. The Adviser also reviewed the greater legal risks presented by the large and changing population of Fund shareholders who may assert claims against the Adviser in individual or class actions, and the greater entrepreneurial risk in offering new fund products, which require substantial investment to launch, may not succeed, and generally must be priced to compete with larger, more established funds resulting in lack of profitability to the Adviser until a new fund achieves scale. In light of the substantial differences in services rendered by the Adviser to institutional,
| | |
| |
| abfunds.com | | AB FLEXFEE US THEMATIC PORTFOLIO | 49 |
offshore fund andsub-advised fund clients as compared to the Funds, and the different risk profile, the Directors considered these fee comparisons inapt and did not place significant weight on them in their deliberations.
The Directors noted that many of the Funds may invest in shares of exchange-traded funds (‘‘ETFs’’), subject to the restrictions and limitations of the 1940 Act as these may be varied as a result of exemptive orders issued by the SEC. The Directors also noted that ETFs pay advisory fees pursuant to their advisory contracts. The Directors concluded, based on the Adviser’s explanation of how it uses ETFs when they are the most cost-effective way to obtain desired exposures, in some cases pending purchases of underlying securities, that each Fund’s management fee would be for services that would be in addition to, rather than duplicative of, the services provided under the advisory contracts of the ETFs.
With respect to each Fund’s management fee, the Directors considered the total expense ratio of the Fund in comparison to a peer group and peer universe selected by the 15(c) service provider. The Directors also considered the Adviser’s expense caps for certain Funds. The Directors view expense ratio information as relevant to their evaluation of the Adviser’s services because the Adviser is responsible for coordinating services provided to a Fund by others.
The Boards’ consideration of each Proposed Agreement was informed by their most recent approval of the related Current Agreement, and, in the case of certain Funds, their discussion with the Adviser of the reasons for those Funds’ expense ratios in certain periods. The Directors also reviewed updated expense ratio information and, in some cases, discussed with the Adviser the reasons for the expense ratios of certain Funds. On the basis of this review, the Directors concluded that each Fund’s expense ratio was acceptable.
The Directors did not consider comparative expense information for the ACS Funds because those Funds do not bear ordinary expenses.
Economies of Scale
The Directors noted that the management fee schedules for certain Funds do not contain breakpoints and that they had discussed their strong preference for breakpoints in advisory contracts with the Adviser. The Directors took into consideration prior presentations by an independent consultant on economies of scale in the mutual fund industry and for the Funds, and by the Adviser concerning certain of its views on economies of scale. The Directors also had requested and received from the Adviser certain updates on economies of scale in advance of the Board meeting. The Directors believe that economies of scale may be realized (if at all) by the Adviser across a variety of products and services, and not only in respect of a single fund. The Directors noted that there is no established methodology for setting breakpoints that give effect to the fund-specific
| | |
| |
| 50 | AB FLEXFEE US THEMATIC PORTFOLIO | | abfunds.com |
services provided by a fund’s adviser and to the economies of scale that an adviser may realize in its overall mutual fund business or those components of it which directly or indirectly affect a fund’s operations. The Directors observed that in the mutual fund industry as a whole, as well as among funds similar to each Fund, there is no uniformity or pattern in the fees and asset levels at which breakpoints (if any) apply. The Directors also noted that the advisory agreements for many funds do not have breakpoints at all. The Directors informed the Adviser that they would monitor the asset levels of the Funds without breakpoints and their profitability to the Adviser and anticipated revisiting the question of breakpoints in the future if circumstances warrant doing so.
The Directors did not consider the extent to which fee levels in the Advisory Agreement for the ACS Funds reflect economies of scale because that Advisory Agreement does not provide for any compensation to be paid to the Adviser by the ACS Funds and the expense ratio of each of those Funds is zero.
Interim Advisory Agreements
In approving the Interim Advisory Agreements, the Boards, with the assistance of independent counsel, considered similar factors to those considered in approving the Proposed Agreements. The Interim Advisory Agreements approved by the Boards are identical to the Proposed Agreements, as well as the Current Agreements, in all material respects except for their proposed effective and termination dates and provisions intended to comply with the requirements of the relevant SEC rule, such as provisions requiring escrow of advisory fees. Under the Interim Advisory Agreements, the Adviser would continue to manage a Fund pursuant to an Interim Advisory Agreement until a new advisory agreement was approved by stockholders or until the end of the150-day period, whichever would occur earlier. All fees earned by the Adviser under an Interim Advisory Agreement would be held in escrow pending shareholder approval of the Proposed Agreement. Upon approval of a new advisory agreement by stockholders, the escrowed management fees would be paid to the Adviser, and the Interim Advisory Agreement would terminate.
| | |
| |
| abfunds.com | | AB FLEXFEE US THEMATIC PORTFOLIO | 51 |
This page is not part of the Shareholder Report or the Financial Statements.
AB FAMILY OF FUNDS
US EQUITY
US CORE
Core Opportunities Fund
FlexFee™ US Thematic Portfolio
Select US Equity Portfolio
US GROWTH
Concentrated Growth Fund
Discovery Growth Fund
FlexFee™ Large Cap Growth Portfolio
Growth Fund
Large Cap Growth Fund
Small Cap Growth Portfolio
US VALUE
Discovery Value Fund
Equity Income Fund
Relative Value Fund
Small Cap Value Portfolio
Value Fund
INTERNATIONAL/ GLOBAL EQUITY
INTERNATIONAL/ GLOBAL CORE
FlexFee™ International Strategic Core Portfolio
Global Core Equity Portfolio
International Portfolio
International Strategic Core Portfolio
Sustainable Global Thematic Fund
Tax-Managed International Portfolio
Tax-Managed Wealth Appreciation Strategy
Wealth Appreciation Strategy
INTERNATIONAL/ GLOBAL GROWTH
Concentrated International Growth Portfolio
FlexFee™ Emerging Markets Growth Portfolio
INTERNATIONAL/ GLOBAL EQUITY(continued)
Sustainable International Thematic Fund
INTERNATIONAL/ GLOBAL VALUE
All China Equity Portfolio
International Value Fund
FIXED INCOME
MUNICIPAL
High Income Municipal Portfolio
Intermediate California Municipal Portfolio
Intermediate Diversified Municipal Portfolio
Intermediate New York Municipal Portfolio
Municipal Bond Inflation Strategy
Tax-Aware Fixed Income Portfolio
National Portfolio
Arizona Portfolio
California Portfolio
Massachusetts Portfolio
Minnesota Portfolio
New Jersey Portfolio
New York Portfolio
Ohio Portfolio
Pennsylvania Portfolio
Virginia Portfolio
TAXABLE
Bond Inflation Strategy
FlexFee™ High Yield Portfolio1
FlexFee™ International Bond Portfolio
Global Bond Fund
High Income Fund
Income Fund
Intermediate Bond Portfolio
Limited Duration High Income Portfolio
Short Duration Portfolio
ALTERNATIVES
All Market Real Return Portfolio
Global Real Estate Investment Fund
Select US Long/Short Portfolio
Unconstrained Bond Fund
MULTI-ASSET
All Market Income Portfolio
All Market Total Return Portfolio
Conservative Wealth Strategy
Emerging Markets Multi-Asset Portfolio
Global Risk Allocation Fund
Tax-Managed All Market Income Portfolio
TARGET-DATE
Multi-Manager Select Retirement Allocation Fund
Multi-Manager Select 2010 Fund
Multi-Manager Select 2015 Fund
Multi-Manager Select 2020 Fund
Multi-Manager Select 2025 Fund
Multi-Manager Select 2030 Fund
Multi-Manager Select 2035 Fund
Multi-Manager Select 2040 Fund
Multi-Manager Select 2045 Fund
Multi-Manager Select 2050 Fund
Multi-Manager Select 2055 Fund
Multi-Manager Select 2060 Fund
CLOSED-END FUNDS
Alliance California Municipal Income Fund
AllianceBernstein Global High Income Fund
AllianceBernstein National Municipal Income Fund
We also offer Government Money Market Portfolio, which serves as the money market fund exchange vehicle for the AB mutual funds. You could lose money by investing in the Fund. Although the Fund seeks to preserve the value of your investment at $1.00 per share, it cannot guarantee it will do so. The Fund may impose a fee upon sale of your shares or may temporarily suspend your ability to sell shares if the Fund’s liquidity falls below required minimums because of market conditions or other factors. An investment in the Fund is not insured or guaranteed by the Federal Deposit Insurance Corporation or any other government agency. The Fund’s sponsor has no legal obligation to provide financial support to the Fund, and you should not expect that the sponsor will provide financial support to the Fund at any time.
Investors should consider the investment objectives, risks, charges and expenses of the Fund carefully before investing. For copies of our prospectus or summary prospectus, which contain this and other information, visit us online at www.abfunds.com or contact your AB representative. Please read the prospectus and/or summary prospectus carefully before investing.
| 1 | Prior to February 23, 2018, FlexFee High Yield Portfolio was named High Yield Portfolio. |
| | |
| |
| 52 | AB FLEXFEE US THEMATIC PORTFOLIO | | abfunds.com |
AB FLEXFEE US THEMATIC PORTFOLIO
1345 Avenue of the Americas
New York, NY 10105
800 221 5672
FFUT-0151-1218 
ITEM 2. CODE OF ETHICS.
(a) The registrant has adopted a code of ethics that applies to its principal executive officer, principal financial officer and principal accounting officer. A copy of the registrant’s code of ethics is filed herewith as Exhibit 12(a)(1).
(b) During the period covered by this report, no material amendments were made to the provisions of the code of ethics adopted in 2(a) above.
(c) During the period covered by this report, no implicit or explicit waivers to the provisions of the code of ethics adopted in 2(a) above were granted.
ITEM 3. AUDIT COMMITTEE FINANCIAL EXPERT.
The registrant’s Board of Directors has determined that independent directors William H. Foulk, Jr., Garry L. Moody and Marshall C. Turner, Jr. qualify as audit committee financial experts.
ITEM 4. PRINCIPAL ACCOUNTANT FEES AND SERVICES.
(a) - (c) The following table sets forth the aggregate fees billed by the independent registered public accounting firm Ernst & Young LLP, for the Fund’s last two fiscal years for professional services rendered for: (i) the audit of the Fund’s annual financial statements included in the Fund’s annual report to stockholders; (ii) assurance and related services that are reasonably related to the performance of the audit of the Fund’s financial statements and are not reported under (i), which include advice and education related to accounting and auditing issues and quarterly press release review (for those Funds which issue press releases), and preferred stock maintenance testing (for those Funds that issue preferred stock); and (iii) tax compliance, tax advice and tax return preparation.
| | | | | | | | | | | | | | | | |
| | | | | | | | | Audit-Related | | | | |
| | | Audit Fees | | | Fees | | | Tax Fees | |
AB FlexFee Emerging Market Growth | | | 2017 | | | $ | 77,563 | | | $ | 3,000 | | | $ | 34,073 | |
| | | 2018 | | | $ | 41,926 | | | $ | — | | | $ | 15,628 | |
AB FlexFee Large Cap Growth | | | 2017 | | | $ | 28,481 | | | $ | — | | | $ | 11,196 | |
| | | 2018 | | | $ | 30,100 | | | $ | — | | | $ | 29,345 | |
AB FlexFee US Thematic Portfolio | | | 2017 | | | $ | 28,481 | | | $ | — | | | $ | 12,691 | |
| | | 2018 | | | $ | 30,100 | | | $ | — | | | $ | 32,385 | |
AB FlexFee Core Opportunities Portfolio | | | 2017 | | | $ | 28,481 | | | $ | — | | | $ | 12,691 | |
| | | 2018 | | | $ | 36,225 | | | $ | — | | | $ | 14,102 | |
AB FlexFee International Strategic Core Portfolio | | | 2017 | | | $ | 34,990 | | | $ | — | | | $ | 15,208 | |
| | | 2018 | | | $ | 44,903 | | | $ | — | | | $ | 16,898 | |
(d) Not applicable.
(e) (1) Beginning with audit andnon-audit service contracts entered into on or after May 6, 2003, the Fund’s Audit Committee policies and procedures require thepre-approval of all audit andnon-audit services provided to the Fund by the Fund’s independent registered public accounting firm. The Fund’s Audit Committee policies and procedures also requirepre-approval of all audit andnon-audit services provided to the Adviser and Service Affiliates to the extent that these services are directly related to the operations or financial reporting of the Fund.
(e) (2) All of the amounts for Audit Fees, Audit-Related Fees and Tax Fees in the table under Item 4 (a) – (c) are for servicespre-approved by the Fund’s Audit Committee.
(f) Not applicable.
(g) The following table sets forth the aggregatenon-audit services provided to the Fund, the Fund’s Adviser and entities that control, are controlled by or under common control with the Adviser that provide ongoing services to the Fund:
| | | | | | | | | | | | |
| | | All Fees for
Non-Audit Services
Provided to the
Portfolio, the Adviser
and Service Affiliates | | | Total Amount of
Foregoing Column Pre-
approved by the Audit
Committee
(Portion Comprised of
Audit Related Fees)
(Portion Comprised of
Tax Fees) | |
AB FlexFee Emerging Market Growth | | | 2017 | | | $ | 1,269,093 | | | $ | 37,073 | |
| | | | | | | | | | $ | (3,000 | ) |
| | | | | | | | | | $ | (34,073 | ) |
| | | 2018 | | | $ | 780,226 | | | $ | 15,628 | |
| | | | | | | | | | $ | — | |
| | | | | | | | | | $ | (15,628 | ) |
AB FlexFee Large Cap Growth | | | 2017 | | | $ | 734,311 | | | $ | 11,196 | |
| | | | | | | | | | $ | — | |
| | | | | | | | | | $ | (11,196 | ) |
| | | 2018 | | | $ | 793,943 | | | $ | 29,345 | |
| | | | | | | | | | $ | — | |
| | | | | | | | | | $ | (29,345 | ) |
AB FlexFee US Thematic Portfolio | | | 2017 | | | $ | 735,806 | | | $ | 12,691 | |
| | | | | | | | | | $ | — | |
| | | | | | | | | | $ | (12,691 | ) |
| | | 2018 | | | $ | 796,983 | | | $ | 32,385 | |
| | | | | | | | | | $ | — | |
| | | | | | | | | | $ | (32,385 | ) |
AB FlexFee Core Opportunities Portfolio | | | 2017 | | | $ | 735,806 | | | $ | 12,691 | |
| | | | | | | | | | | — | |
| | | | | | | | | | $ | (12,691 | ) |
| | | 2018 | | | $ | 778,700 | | | $ | 14,102 | |
| | | | | | | | | | | — | |
| | | | | | | | | | $ | (14,102 | ) |
AB FlexFee International Strategic Core Portfolio | | | 2017 | | | $ | 738,323 | | | $ | 15,208 | |
| | | | | | | | | | | — | |
| | | | | | | | | | $ | (15,208 | ) |
| | | 2018 | | | $ | 781,496 | | | $ | 16,898 | |
| | | | | | | | | | | — | |
| | | | | | | | | | $ | (16,898 | ) |
(h) The Audit Committee of the Fund has considered whether the provision of anynon-audit services notpre-approved by the Audit Committee provided by the Fund’s independent registered public accounting firm to the Adviser and Service Affiliates is compatible with maintaining the auditor’s independence.
ITEM 5. AUDIT COMMITTEE OF LISTED REGISTRANTS.
Not applicable to the registrant.
ITEM 6. SCHEDULE OF INVESTMENTS.
Please see Schedule of Investments contained in the Report to Shareholders included under Item 1 of this FormN-CSR.
ITEM 7. DISCLOSURE OF PROXY VOTING POLICIES AND PROCEDURES FORCLOSED-END MANAGEMENT INVESTMENT COMPANIES.
Not applicable to the registrant.
ITEM 8. PORTFOLIO MANAGERS OFCLOSED-END MANAGEMENT INVESTMENT COMPANIES.
Not applicable to the registrant.$ 12,691
ITEM 9. PURCHASES OF EQUITY SECURITIES BYCLOSED-END MANAGEMENT INVESTMENT COMPANY AND AFFILIATED PURCHASERS.
Not applicable to the registrant.
ITEM 10. SUBMISSION OF MATTERS TO A VOTE OF SECURITY HOLDERS.
There have been no material changes to the procedures by which shareholders may recommend nominees to the Fund’s Board of Directors since the Fund last provided disclosure in response to this item.
ITEM 11. CONTROLS AND PROCEDURES.
(a) The registrant’s principal executive officer and principal financial officer have concluded that the registrant’s disclosure controls and procedures (as defined in Rule30a-2(c) under the Investment Company Act of 1940, as amended) are effective at the reasonable assurance level based on their evaluation of these controls and procedures as of a date within 90 days of the filing date of this document.
(b) There were no changes in the registrant’s internal controls over financial reporting that occurred during the second fiscal quarter of the period that has materially affected, or is reasonably likely to materially affect, the registrant’s internal control over financial reporting.
The following exhibits are attached to this FormN-CSR:
| | | | |
| | EXHIBIT NO. | | DESCRIPTION OF EXHIBIT |
| | |
| | 12 (a) (1) | | Code of Ethics that is subject to the disclosure of Item 2 hereof |
| | |
| | 12 (b) (1) | | Certification of Principal Executive Officer Pursuant to Section 302 of the Sarbanes-Oxley Act of 2002 |
| | |
| | 12 (b) (2) | | Certification of Principal Financial Officer Pursuant to Section 302 of the Sarbanes-Oxley Act of 2002 |
| | |
| | 12 (c) | | Certification of Principal Executive Officer and Principal Financial Officer Pursuant to Section 906 of theSarbanes-Oxley Act of 2002 |
SIGNATURES
Pursuant to the requirements of the Securities Exchange Act of 1934 and the Investment Company Act of 1940, the registrant has duly caused this report to be signed on its behalf by the undersigned, thereunto duly authorized.
(Registrant): AB Cap Fund, Inc.
| | |
| By: | | /s/ Robert M. Keith |
| | Robert M. Keith |
| | President |
| |
| Date: | | February 28, 2019 |
Pursuant to the requirements of the Securities Exchange Act of 1934 and the Investment Company Act of 1940, this report has been signed below by the following persons on behalf of the registrant and in the capacities and on the dates indicated.
| | |
| By: | | /s/ Robert M. Keith |
| | Robert M. Keith |
| | President |
| |
| Date: | | February 28, 2019 |
| |
| By: | | /s/ Joseph J. Mantineo |
| | Joseph J. Mantineo |
| | Treasurer and Chief Financial Officer |
| |
| Date: | | February 28, 2019 |