UNITED STATES
SECURITIES AND EXCHANGE COMMISSION
Washington, D.C. 20549
FORM N-CSR
CERTIFIED SHAREHOLDER REPORT OF REGISTERED
MANAGEMENT INVESTMENT COMPANIES
| Investment Company Act file number | 811-05188 | |||||
| AMERICAN CENTURY VARIABLE PORTFOLIOS, INC. | ||||||
| (Exact name of registrant as specified in charter) | ||||||
| 4500 MAIN STREET, KANSAS CITY, MISSOURI | 64111 | |||||
| (Address of principal executive offices) | (Zip Code) | |||||
CHARLES A. ETHERINGTON 4500 MAIN STREET, KANSAS CITY, MISSOURI 64111 | ||||||
| (Name and address of agent for service) | ||||||
| Registrant’s telephone number, including area code: | 816-531-5575 | |||||
| Date of fiscal year end: | 12-31 | |||||
| Date of reporting period: | 12-31-2015 | |||||
ITEM 1. REPORTS TO STOCKHOLDERS.
| ANNUAL REPORT | DECEMBER 31, 2015 |


VP Balanced Fund
| Table of Contents |
| Performance | 2 | |
| Portfolio Commentary | ||
| Fund Characteristics | ||
| Shareholder Fee Example | ||
| Schedule of Investments | ||
| Statement of Assets and Liabilities | ||
| Statement of Operations | ||
| Statement of Changes in Net Assets | ||
| Notes to Financial Statements | ||
| Financial Highlights | ||
| Report of Independent Registered Public Accounting Firm | ||
| Management | ||
| Additional Information | ||
Any opinions expressed in this report reflect those of the author as of the date of the report, and do not necessarily represent the opinions of American Century Investments® or any other person in the American Century Investments organization. Any such opinions are subject to change at any time based upon market or other conditions and American Century Investments disclaims any responsibility to update such opinions. These opinions may not be relied upon as investment advice and, because investment decisions made by American Century Investments funds are based on numerous factors, may not be relied upon as an indication of trading intent on behalf of any American Century Investments fund. Security examples are used for representational purposes only and are not intended as recommendations to purchase or sell securities. Performance information for comparative indices and securities is provided to American Century Investments by third party vendors. To the best of American Century Investments’ knowledge, such information is accurate at the time of printing.
| Performance |
| Total Returns as of December 31, 2015 | ||||||
Average Annual Returns | ||||||
Ticker Symbol | 1 year | 5 years | 10 years | Since Inception | Inception Date | |
| Class I | AVBIX | -2.57%(1) | 8.15%(1) | 5.74% | 6.94% | 5/1/91 |
Blended Index(2) | — | 1.28% | 8.95% | 6.48% | 8.31%(3) | — |
| S&P 500 Index | — | 1.38% | 12.56% | 7.30% | 9.34%(3) | — |
| Barclays U.S. Aggregate Bond Index | — | 0.55% | 3.25% | 4.51% | 6.07%(3) | — |
| (1) | Returns would have been lower if a portion of the management fee had not been waived. |
| (2) | The blended index combines monthly returns of two widely known indices in proportion to the asset mix of the fund. The S&P 500 Index represents 60% of the index and the remaining 40% is represented by the Barclays U.S. Aggregate Bond Index. |
| (3) | Since April 30, 1991, the date nearest the Class I’s inception for which data are available. |
The performance information presented does not include charges and deductions imposed by the insurance company separate account under the variable annuity or variable life insurance contracts. The inclusion of such charges could significantly lower performance. Please refer to the insurance company separate account prospectus for a discussion of the charges related to insurance contracts.
Data presented reflect past performance. Past performance is no guarantee of future results. Current performance may be higher or lower than the performance shown. Investment return and principal value will fluctuate, and redemption value may be more or less than original cost. Data assumes reinvestment of dividends and capital gains, and none of the charts reflect the deduction of taxes that a shareholder would pay on fund distributions or the redemption of fund shares. To obtain performance data current to the most recent month end, please call 1-800-345-6488 or visit ipro.americancentury.com (for Investment Professionals). For additional information about the fund, please consult the prospectus.
2
| Growth of $10,000 Over 10 Years |
| $10,000 investment made December 31, 2005 |
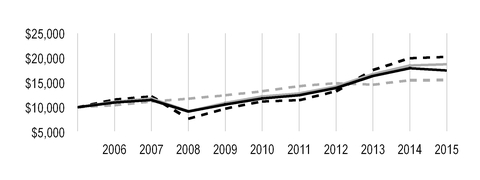
| Value on December 31, 2015 | |
| Class I — $17,485* | |
| Blended Index — $18,742 | |
S&P 500 Index — $20,242 | |
| Barclays U.S. Aggregate Bond Index — $15,552 | |
*Ending value would have been lower if a portion of the management fee had not been waived.
| Total Annual Fund Operating Expenses |
Class I 0.90% |
The total annual fund operating expenses shown is as stated in the fund’s prospectus current as of the date of this report. The prospectus may vary from the expense ratio shown elsewhere in this report because it is based on a different time period, includes acquired fund fees and expenses, and, if applicable, does not include fee waivers or expense reimbursements.
Data presented reflect past performance. Past performance is no guarantee of future results. Current performance may be higher or lower than the performance shown. Investment return and principal value will fluctuate, and redemption value may be more or less than original cost. Data assumes reinvestment of dividends and capital gains, and none of the charts reflect the deduction of taxes that a shareholder would pay on fund distributions or the redemption of fund shares. To obtain performance data current to the most recent month end, please call 1-800-345-6488 or visit ipro.americancentury.com (for Investment Professionals). For additional information about the fund, please consult the prospectus.
3
| Portfolio Commentary |
Equity Portfolio Managers: Bill Martin and Claudia Musat
Fixed-Income Portfolio Managers: Dave MacEwen, Bob Gahagan, and Brian Howell
Fixed-Income Portfolio Managers: Dave MacEwen, Bob Gahagan, and Brian Howell
Performance Summary
VP Balanced returned -2.57%* for the fiscal year ended December 31, 2015. By comparison, the fund’s benchmark (a blended index consisting of 60% S&P 500 Index and 40% Barclays U.S. Aggregate Bond Index) returned 1.28%.
Equity Portfolio: Consumer Discretionary Stocks Leading Detractors
Stock selection in the consumer discretionary sector was a main driver of underperformance, particularly positioning among internet retailers and security selection in hotels, restaurant, and leisure holdings. Leading detractors included Amazon.com, whose stock price steadily gained over the course of the year on rising revenues and earnings, driven in large part by the strength of its cloud computing business. We initiated a position in the internet retailer during the third quarter of 2015, but missed much of the stock’s appreciation during the year. A portfolio-only position in GoPro detracted as the wearable camera maker’s stock slumped together with the broad market on concerns about economic growth in China and a bleak outlook for wearable camera demand. The holding was subsequently sold.
Consumer staples holdings also pressured relative gains. Our investments in several food products manufacturers pressured results, although no single holding was a key individual detractor. Elsewhere in the sector, Wal-Mart Stores, a portfolio overweight relative to the benchmark, experienced a sharp decline in its stock price. Dollar strength and higher labor costs led to lower-than-expected earnings and revenues and downward revisions to future guidance for the global retail giant. Despite disappointing stock performance, we believe that Wal-Mart is well positioned for the fund based on its strong valuation, sentiment, and quality measures.
The information technology sector was also an area of relative weakness. QUALCOMM detracted as the wireless technology and semiconductor provider saw its share price plunge on uncertainty surrounding future sales to China, disappointing quarterly results, and management’s shift to releasing guidance only for the forthcoming quarter, rather than projecting for the full year. The company’s stock took a further beating on revelation that South Korean regulators had opened an antitrust investigation against the company. The portfolio’s position in the stock was exited prior to year-end. An underweight to Facebook impacted returns after the social networking site’s stock price rose on ongoing gains in user engagement for both its flagship brand as well as for acquired properties. Our positioning is justified given the stock’s weak valuation profile.
Positive contribution to returns on a sector level came from the energy sector, where stock selection and underweight positioning in oil, gas, and consumable fuels holdings bolstered relative results. Much of the benefit came from not owning or maintaining underweight positions in oil-related companies as oil prices sank to their lowest levels since early 2009 on widening oversupply and uncertain future demand from global economies. In this environment, not holding energy infrastructure company Kinder Morgan was particularly beneficial as its share price fell by 63% during the reporting period. The company’s unattractive profiles across growth, sentiment, and quality support our decision not to hold it. A sector exception was our overweight position in Valero Energy. The oil refiner surpassed expectations as lower oil prices and higher demand for gasoline boosted the company’s throughput margin per barrel. Strong valuation, growth, and quality insights support the portfolio’s overweight positioning.
| * | Returns would have been lower if a portion of the management fee had not been waived. |
4
Not owning Union Pacific also benefited the fund’s relative results. The railroad operator’s stock declined steadily on softer cargo volumes, particularly of coal, which has fallen in popularity due to lower natural gas prices. We maintain its positioning based on unappealing growth, sentiment, and quality factors. Health insurance and managed care provider Aetna was a key outperformer, advancing nearly 23% during the year amid merger speculation in the recent wave of health insurance industry consolidation. Strong valuation insights and above-average factor profiles across all other measures make Aetna an attractive portfolio investment. A portfolio-only position in Foot Locker enhanced results as the athletic apparel retailer delivered stronger-than-expected revenues and earnings, driven by solid same-store sales. The non-index holding shows above-average measures across sentiment, quality, and valuation.
Fixed-Income Portfolio Advanced
In the fund’s fixed-income portfolio, we continued to underweight Treasuries and government agencies relative to the benchmark in favor of spread (non-Treasury) sectors, including corporate credit and securitized. The overweight to the securitized sector aided results, while the corporate overweight detracted. Security selection within the securitized sector also lifted performance. In particular, selections among non-agency commercial mortgage-backed securities, asset-backed securities, collateralized mortgage obligations (CMOs), and traditional pass-through mortgage-backed securities broadly contributed to performance. Security selection in the corporate sector also produced positive results in a challenging investment environment.
Meanwhile, the portfolio’s out-of-benchmark allocation to non-U.S. corporate securities contributed to performance. Specifically, the portfolio held a mix of dollar-denominated European financial bonds (including positions in European banks) that benefited from falling interest rates in Europe. Late in 2014, we began focusing our non-U.S. exposure on the European financials sector to take advantage of anticipated quantitative easing (QE) in Europe. In the first quarter of 2015, the European Central Bank launched its QE program, and our European positions benefited from the resulting decline in interest rates.
Anticipating a gradual increase in interest rates, we maintained a shorter-than-benchmark duration (less price sensitivity to interest rate changes) during the first six months of the year. This strategy detracted from results as longer-maturity interest rates generally declined during this timeframe. As the timetable for U.S. interest rate normalization appeared to be extending, we gradually shifted to a neutral duration position by the third quarter, where it remained through the end of 2015.
Outlook
We believe U.S. economic growth will proceed at a moderate pace and will continue to outpace the growth rates of most other economies. We believe that divergence in monetary policy between the U.S. and much of the rest of the world will continue as the Fed seeks to "normalize" interest rates, while central banks elsewhere maintain aggressive monetary stimulus. Investor sentiment in financial markets is therefore likely to be driven by the pace and magnitude of Fed rate moves, as well as by the trajectory of global economic growth, particularly in China. However, a strong U.S. dollar, weak commodity prices, uncertainty around numerous geopolitical events, and low interest rates in Europe could mean a longer time frame for further increases in U.S. interest rates. We believe that our disciplined, objective, and systematic investment strategy, for both the equity and fixed-income components of the portfolio, is particularly beneficial during periods of volatility and we adhere to our process regardless of the market environment, allowing us to take advantage of opportunities presented by market inefficiencies.
5
| Fund Characteristics |
| DECEMBER 31, 2015 | |
| Top Ten Common Stocks | % of net assets |
| Apple, Inc. | 2.4% |
| Alphabet, Inc., Class A | 2.0% |
| Microsoft Corp. | 1.8% |
| JPMorgan Chase & Co. | 1.2% |
| Pfizer, Inc. | 1.2% |
| Amazon.com, Inc. | 1.1% |
| Citigroup, Inc. | 1.0% |
| Cisco Systems, Inc. | 1.0% |
| Gilead Sciences, Inc. | 1.0% |
| Merck & Co., Inc. | 0.9% |
| Top Five Common Stocks Industries | % of net assets |
| Biotechnology | 3.4% |
| Banks | 3.4% |
| Software | 3.3% |
| Internet Software and Services | 3.3% |
| Pharmaceuticals | 3.0% |
| Key Fixed-Income Portfolio Statistics | |
| Average Duration (effective) | 5.6 years |
| Weighted Average Life | 7.8 years |
| Types of Investments in Portfolio | % of net assets |
| Common Stocks | 59.3% |
| Corporate Bonds | 12.9% |
| U.S. Treasury Securities | 10.8% |
| U.S. Government Agency Mortgage-Backed Securities | 10.6% |
| Collateralized Mortgage Obligations | 2.1% |
| Commercial Mortgage-Backed Securities | 2.0% |
| Asset-Backed Securities | 1.8% |
| Municipal Securities | 0.6% |
| U.S. Government Agency Securities | 0.5% |
| Sovereign Governments and Agencies | 0.4% |
| Temporary Cash Investments | 1.1% |
| Other Assets and Liabilities | (2.1)% |
6
| Shareholder Fee Example |
Fund shareholders may incur two types of costs: (1) transaction costs, including sales charges (loads) on purchase payments and redemption/exchange fees; and (2) ongoing costs, including management fees; distribution and service (12b-1) fees; and other fund expenses. This example is intended to help you understand your ongoing costs (in dollars) of investing in your fund and to compare these costs with the ongoing cost of investing in other mutual funds.
The example is based on an investment of $1,000 made at the beginning of the period and held for the entire period from July 1, 2015 to December 31, 2015.
Actual Expenses
The table provides information about actual account values and actual expenses for each class. You may use the information, together with the amount you invested, to estimate the expenses that you paid over the period. First, identify the share class you own. Then simply divide your account value by $1,000 (for example, an $8,600 account value divided by $1,000 = 8.6), then multiply the result by the number under the heading “Expenses Paid During Period” to estimate the expenses you paid on your account during this period.
Hypothetical Example for Comparison Purposes
The table also provides information about hypothetical account values and hypothetical expenses based on the actual expense ratio of each class of your fund and an assumed rate of return of 5% per year before expenses, which is not the actual return of a fund’s share class. The hypothetical account values and expenses may not be used to estimate the actual ending account balance or expenses you paid for the period. You may use this information to compare the ongoing costs of investing in your fund and other funds. To do so, compare this 5% hypothetical example with the 5% hypothetical examples that appear in the shareholder reports of the other funds.
Please note that the expenses shown in the table are meant to highlight your ongoing costs only and do not reflect any transactional costs, such as sales charges (loads) or redemption/exchange fees. Therefore, the table is useful in comparing ongoing costs only, and will not help you determine the relative total costs of owning different funds. In addition, if these transactional costs were included, your costs would have been higher.
| Beginning Account Value 7/1/15 | Ending Account Value 12/31/15 | Expenses Paid During Period(1) 7/1/15 - 12/31/15 | Annualized Expense Ratio(1) | |
| Actual | ||||
| Class I (after waiver) | $1,000 | $975.60 | $4.08 | 0.82% |
| Class I (before waiver) | $1,000 | $975.60(2) | $4.48 | 0.90% |
| Hypothetical | ||||
| Class I (after waiver) | $1,000 | $1,021.07 | $4.18 | 0.82% |
| Class I (before waiver) | $1,000 | $1,020.67 | $4.58 | 0.90% |
| (1) | Expenses are equal to the class's annualized expense ratio listed in the table above, multiplied by the average account value over the period, multiplied by 184, the number of days in the most recent fiscal half-year, divided by 365, to reflect the one-half year period. |
| (2) | Ending account value assumes the return earned after waiver and would have been lower if a portion of the management fee had not been waived. |
7
| Schedule of Investments |
DECEMBER 31, 2015
| Shares/ Principal Amount | Value | |||||
| COMMON STOCKS — 59.3% | ||||||
| Aerospace and Defense — 2.5% | ||||||
| Boeing Co. (The) | 6,022 | $ | 870,721 | |||
| General Dynamics Corp. | 4,866 | 668,394 | ||||
| Honeywell International, Inc. | 8,729 | 904,063 | ||||
Spirit AeroSystems Holdings, Inc., Class A(1) | 10,262 | 513,818 | ||||
| 2,956,996 | ||||||
| Air Freight and Logistics — 0.7% | ||||||
| United Parcel Service, Inc., Class B | 8,029 | 772,631 | ||||
| Airlines — 0.9% | ||||||
| Alaska Air Group, Inc. | 1,798 | 144,757 | ||||
| Southwest Airlines Co. | 14,140 | 608,868 | ||||
United Continental Holdings, Inc.(1) | 5,030 | 288,219 | ||||
| 1,041,844 | ||||||
| Auto Components — 1.1% | ||||||
| Cooper Tire & Rubber Co. | 1,327 | 50,227 | ||||
| Delphi Automotive plc | 5,318 | 455,912 | ||||
| Goodyear Tire & Rubber Co. (The) | 16,984 | 554,867 | ||||
| Lear Corp. | 1,666 | 204,635 | ||||
| 1,265,641 | ||||||
| Automobiles — 0.6% | ||||||
| Ford Motor Co. | 52,154 | 734,850 | ||||
| Banks — 3.4% | ||||||
| Bank of America Corp. | 38,064 | 640,617 | ||||
| Citigroup, Inc. | 22,897 | 1,184,920 | ||||
| JPMorgan Chase & Co. | 21,246 | 1,402,874 | ||||
| M&T Bank Corp. | 2,279 | 276,169 | ||||
| Wells Fargo & Co. | 7,639 | 415,256 | ||||
| 3,919,836 | ||||||
| Beverages — 1.1% | ||||||
| Coca-Cola Co. (The) | 1,176 | 50,521 | ||||
| Dr Pepper Snapple Group, Inc. | 1,781 | 165,989 | ||||
| PepsiCo, Inc. | 10,721 | 1,071,242 | ||||
| 1,287,752 | ||||||
| Biotechnology — 3.4% | ||||||
| AbbVie, Inc. | 16,286 | 964,782 | ||||
| Amgen, Inc. | 6,688 | 1,085,663 | ||||
Biogen, Inc.(1) | 2,688 | 823,469 | ||||
| Gilead Sciences, Inc. | 11,346 | 1,148,102 | ||||
| 4,022,016 | ||||||
| Building Products — 0.6% | ||||||
| Owens Corning | 11,383 | 535,342 | ||||
USG Corp.(1) | 6,724 | 163,326 | ||||
| 698,668 | ||||||
| Capital Markets — 0.6% | ||||||
| Ameriprise Financial, Inc. | 1,935 | 205,923 | ||||
8
| Shares/ Principal Amount | Value | |||||
| Legg Mason, Inc. | 12,256 | $ | 480,803 | |||
| 686,726 | ||||||
| Chemicals — 2.4% | ||||||
| Air Products & Chemicals, Inc. | 4,661 | 606,443 | ||||
| Cabot Corp. | 13,089 | 535,078 | ||||
| Dow Chemical Co. (The) | 16,687 | 859,047 | ||||
| Eastman Chemical Co. | 544 | 36,725 | ||||
| LyondellBasell Industries NV, Class A | 7,857 | 682,773 | ||||
| Minerals Technologies, Inc. | 608 | 27,883 | ||||
| 2,747,949 | ||||||
| Commercial Services and Supplies — 0.3% | ||||||
| Pitney Bowes, Inc. | 15,062 | 311,030 | ||||
| Communications Equipment — 1.0% | ||||||
| Cisco Systems, Inc. | 42,332 | 1,149,525 | ||||
| Consumer Finance — 0.5% | ||||||
Synchrony Financial(1) | 19,983 | 607,683 | ||||
| Containers and Packaging — 0.2% | ||||||
| Avery Dennison Corp. | 4,649 | 291,306 | ||||
| Diversified Consumer Services — 0.4% | ||||||
| H&R Block, Inc. | 12,777 | 425,602 | ||||
| Diversified Financial Services — 0.4% | ||||||
Berkshire Hathaway, Inc., Class B(1) | 2,702 | 356,772 | ||||
| Nasdaq, Inc. | 2,859 | 166,308 | ||||
| 523,080 | ||||||
| Diversified Telecommunication Services — 0.4% | ||||||
| AT&T, Inc. | 7,598 | 261,447 | ||||
| Verizon Communications, Inc. | 5,635 | 260,450 | ||||
| 521,897 | ||||||
| Electric Utilities — 0.6% | ||||||
| NextEra Energy, Inc. | 6,945 | 721,516 | ||||
| Energy Equipment and Services — 0.3% | ||||||
| Atwood Oceanics, Inc. | 17,912 | 183,240 | ||||
Cameron International Corp.(1) | 917 | 57,954 | ||||
| Transocean Ltd. | 11,178 | 138,384 | ||||
| 379,578 | ||||||
| Food and Staples Retailing — 2.0% | ||||||
| CVS Health Corp. | 9,918 | 969,683 | ||||
| Kroger Co. (The) | 11,120 | 465,149 | ||||
| Wal-Mart Stores, Inc. | 15,470 | 948,311 | ||||
| 2,383,143 | ||||||
| Food Products — 0.9% | ||||||
| Dean Foods Co. | 23,338 | 400,247 | ||||
| Pilgrim's Pride Corp. | 12,615 | 278,665 | ||||
| Tyson Foods, Inc., Class A | 6,379 | 340,192 | ||||
| 1,019,104 | ||||||
| Health Care Equipment and Supplies — 2.1% | ||||||
| Abbott Laboratories | 17,404 | 781,614 | ||||
| C.R. Bard, Inc. | 3,201 | 606,398 | ||||
| St. Jude Medical, Inc. | 5,686 | 351,224 | ||||
| Stryker Corp. | 7,161 | 665,543 | ||||
| 2,404,779 | ||||||
9
| Shares/ Principal Amount | Value | |||||
| Health Care Providers and Services — 1.6% | ||||||
| Aetna, Inc. | 6,217 | $ | 672,182 | |||
| AmerisourceBergen Corp. | 4,293 | 445,227 | ||||
Express Scripts Holding Co.(1) | 8,123 | 710,032 | ||||
| 1,827,441 | ||||||
| Hotels, Restaurants and Leisure — 1.6% | ||||||
| Bloomin' Brands, Inc. | 15,948 | 269,362 | ||||
| Cracker Barrel Old Country Store, Inc. | 1,937 | 245,670 | ||||
| Darden Restaurants, Inc. | 8,283 | 527,130 | ||||
Diamond Resorts International, Inc.(1) | 1,769 | 45,127 | ||||
| McDonald's Corp. | 6,617 | 781,732 | ||||
| 1,869,021 | ||||||
| Household Products — 0.5% | ||||||
| Procter & Gamble Co. (The) | 7,250 | 575,723 | ||||
| Industrial Conglomerates — 0.7% | ||||||
| Carlisle Cos., Inc. | 3,223 | 285,848 | ||||
| General Electric Co. | 17,503 | 545,218 | ||||
| 831,066 | ||||||
| Insurance — 1.0% | ||||||
| Hanover Insurance Group, Inc. (The) | 6,297 | 512,198 | ||||
| Prudential Financial, Inc. | 7,968 | 648,675 | ||||
| 1,160,873 | ||||||
| Internet and Catalog Retail — 1.4% | ||||||
Amazon.com, Inc.(1) | 1,813 | 1,225,389 | ||||
Liberty Interactive Corp. QVC Group, Class A(1) | 15,761 | 430,590 | ||||
| 1,655,979 | ||||||
| Internet Software and Services — 3.3% | ||||||
Alphabet, Inc., Class A(1) | 2,932 | 2,281,126 | ||||
eBay, Inc.(1) | 25,917 | 712,199 | ||||
Facebook, Inc., Class A(1) | 8,141 | 852,037 | ||||
| 3,845,362 | ||||||
| IT Services — 2.1% | ||||||
| Accenture plc, Class A | 8,606 | 899,327 | ||||
| Amdocs Ltd. | 6,375 | 347,884 | ||||
| International Business Machines Corp. | 7,313 | 1,006,415 | ||||
PayPal Holdings, Inc.(1) | 4,389 | 158,882 | ||||
| 2,412,508 | ||||||
| Life Sciences Tools and Services — 0.4% | ||||||
| Thermo Fisher Scientific, Inc. | 3,599 | 510,518 | ||||
| Machinery — 1.1% | ||||||
| Kennametal, Inc. | 2,462 | 47,270 | ||||
| PACCAR, Inc. | 12,159 | 576,337 | ||||
| Stanley Black & Decker, Inc. | 6,383 | 681,258 | ||||
| 1,304,865 | ||||||
| Media — 2.3% | ||||||
| CBS Corp., Class B | 12,737 | 600,295 | ||||
| Scripps Networks Interactive, Inc., Class A | 3,637 | 200,799 | ||||
| Time Warner, Inc. | 10,338 | 668,558 | ||||
| Twenty-First Century Fox, Inc. | 23,717 | 644,154 | ||||
| Viacom, Inc., Class B | 12,276 | 505,280 | ||||
10
| Shares/ Principal Amount | Value | |||||
| Walt Disney Co. (The) | 248 | $ | 26,060 | |||
| 2,645,146 | ||||||
| Metals and Mining — 0.5% | ||||||
| Carpenter Technology Corp. | 1,180 | 35,718 | ||||
| Newmont Mining Corp. | 30,317 | 545,403 | ||||
| 581,121 | ||||||
| Multiline Retail — 0.6% | ||||||
| Target Corp. | 9,853 | 715,426 | ||||
| Oil, Gas and Consumable Fuels — 2.1% | ||||||
| Chevron Corp. | 334 | 30,047 | ||||
| CVR Energy, Inc. | 9,773 | 384,568 | ||||
| Exxon Mobil Corp. | 9,374 | 730,703 | ||||
| Tesoro Corp. | 5,096 | 536,965 | ||||
| Valero Energy Corp. | 10,861 | 767,981 | ||||
| 2,450,264 | ||||||
| Pharmaceuticals — 3.0% | ||||||
| Johnson & Johnson | 7,604 | 781,083 | ||||
| Merck & Co., Inc. | 20,746 | 1,095,804 | ||||
Mylan NV(1) | 3,698 | 199,951 | ||||
| Pfizer, Inc. | 43,319 | 1,398,337 | ||||
| 3,475,175 | ||||||
| Real Estate Investment Trusts (REITs) — 1.3% | ||||||
| Lamar Advertising Co., Class A | 9,904 | 594,042 | ||||
| Mid-America Apartment Communities, Inc. | 3,306 | 300,218 | ||||
| Plum Creek Timber Co., Inc. | 3,690 | 176,087 | ||||
| RLJ Lodging Trust | 4,324 | 93,528 | ||||
| Ryman Hospitality Properties, Inc. | 7,469 | 385,699 | ||||
| 1,549,574 | ||||||
| Real Estate Management and Development — 0.7% | ||||||
CBRE Group, Inc.(1) | 7,518 | 259,972 | ||||
| Jones Lang LaSalle, Inc. | 3,418 | 546,402 | ||||
RMR Group, Inc. (The), Class A(1) | 33 | 475 | ||||
| 806,849 | ||||||
| Semiconductors and Semiconductor Equipment — 1.6% | ||||||
| Analog Devices, Inc. | 10,090 | 558,179 | ||||
| Applied Materials, Inc. | 7,959 | 148,594 | ||||
| Broadcom Corp., Class A | 2,197 | 127,031 | ||||
| Intel Corp. | 29,240 | 1,007,318 | ||||
| 1,841,122 | ||||||
| Software — 3.3% | ||||||
| Activision Blizzard, Inc. | 4,021 | 155,653 | ||||
Adobe Systems, Inc.(1) | 7,703 | 723,620 | ||||
| Intuit, Inc. | 3,609 | 348,269 | ||||
| Microsoft Corp. | 37,873 | 2,101,194 | ||||
| Oracle Corp. | 4,789 | 174,942 | ||||
Synopsys, Inc.(1) | 7,964 | 363,238 | ||||
| 3,866,916 | ||||||
| Specialty Retail — 0.2% | ||||||
| Foot Locker, Inc. | 3,474 | 226,123 | ||||
11
| Shares/ Principal Amount | Value | |||||
| Technology Hardware, Storage and Peripherals — 2.5% | ||||||
| Apple, Inc. | 26,431 | $ | 2,782,127 | |||
| EMC Corp. | 7,313 | 187,798 | ||||
| 2,969,925 | ||||||
| Textiles, Apparel and Luxury Goods — 0.1% | ||||||
| NIKE, Inc., Class B | 1,424 | 89,000 | ||||
| Thrifts and Mortgage Finance — 0.3% | ||||||
Essent Group Ltd.(1) | 16,626 | 363,943 | ||||
| Tobacco — 0.7% | ||||||
| Philip Morris International, Inc. | 9,295 | 817,123 | ||||
TOTAL COMMON STOCKS (Cost $59,910,172) | 69,264,215 | |||||
| CORPORATE BONDS — 12.9% | ||||||
| Aerospace and Defense — 0.1% | ||||||
| Boeing Co. (The), 2.20%, 10/30/22 | $ | 30,000 | 29,000 | |||
| Lockheed Martin Corp., 4.25%, 11/15/19 | 30,000 | 32,219 | ||||
| Lockheed Martin Corp., 3.80%, 3/1/45 | 10,000 | 8,895 | ||||
| United Technologies Corp., 6.05%, 6/1/36 | 20,000 | 24,026 | ||||
| United Technologies Corp., 5.70%, 4/15/40 | 30,000 | 35,237 | ||||
| 129,377 | ||||||
Auto Components† | ||||||
| Tenneco, Inc., 6.875%, 12/15/20 | 10,000 | 10,400 | ||||
| Automobiles — 0.3% | ||||||
American Honda Finance Corp., 1.50%, 9/11/17(2) | 10,000 | 10,014 | ||||
| American Honda Finance Corp., 2.125%, 10/10/18 | 20,000 | 20,153 | ||||
| Ford Motor Co., 4.75%, 1/15/43 | 10,000 | 9,461 | ||||
| Ford Motor Credit Co. LLC, 5.00%, 5/15/18 | 90,000 | 94,381 | ||||
| Ford Motor Credit Co. LLC, 5.875%, 8/2/21 | 50,000 | 55,826 | ||||
| General Motors Co., 5.00%, 4/1/35 | 30,000 | 28,048 | ||||
| General Motors Financial Co., Inc., 3.25%, 5/15/18 | 60,000 | 60,333 | ||||
| General Motors Financial Co., Inc., 3.10%, 1/15/19 | 10,000 | 9,995 | ||||
Jaguar Land Rover Automotive plc, 4.125%, 12/15/18(2) | 30,000 | 30,262 | ||||
| 318,473 | ||||||
| Banks — 1.7% | ||||||
| Bank of America Corp., 6.50%, 8/1/16 | 50,000 | 51,464 | ||||
| Bank of America Corp., 5.75%, 12/1/17 | 50,000 | 53,515 | ||||
| Bank of America Corp., 5.70%, 1/24/22 | 40,000 | 45,191 | ||||
| Bank of America Corp., 4.10%, 7/24/23 | 30,000 | 31,082 | ||||
| Bank of America Corp., MTN, 4.00%, 4/1/24 | 20,000 | 20,501 | ||||
| Bank of America Corp., MTN, 4.20%, 8/26/24 | 30,000 | 30,098 | ||||
| Bank of America Corp., MTN, 4.00%, 1/22/25 | 30,000 | 29,447 | ||||
| Bank of America Corp., MTN, 5.00%, 1/21/44 | 20,000 | 20,936 | ||||
| Bank of America N.A., 5.30%, 3/15/17 | 240,000 | 249,735 | ||||
| Bank of Nova Scotia (The), 2.55%, 1/12/17 | 30,000 | 30,405 | ||||
| BB&T Corp., MTN, 2.05%, 6/19/18 | 20,000 | 20,124 | ||||
| Branch Banking & Trust Co., 3.625%, 9/16/25 | 17,000 | 17,189 | ||||
| Branch Banking & Trust Co., 3.80%, 10/30/26 | 20,000 | 20,334 | ||||
| Capital One Financial Corp., 4.20%, 10/29/25 | 50,000 | 49,492 | ||||
12
| Shares/ Principal Amount | Value | |||||
| Citigroup, Inc., 1.75%, 5/1/18 | $ | 90,000 | $ | 89,295 | ||
| Citigroup, Inc., 4.50%, 1/14/22 | 90,000 | 96,537 | ||||
| Citigroup, Inc., 4.05%, 7/30/22 | 20,000 | 20,461 | ||||
| Citigroup, Inc., 4.40%, 6/10/25 | 120,000 | 121,490 | ||||
| Citigroup, Inc., 4.45%, 9/29/27 | 10,000 | 9,963 | ||||
| Cooperatieve Centrale Raiffeisen-Boerenleenbank BA, 3.875%, 2/8/22 | 80,000 | 84,551 | ||||
| Fifth Third Bancorp, 4.30%, 1/16/24 | 20,000 | 20,523 | ||||
| HSBC Holdings plc, 5.10%, 4/5/21 | 20,000 | 22,252 | ||||
| JPMorgan Chase & Co., 6.00%, 1/15/18 | 105,000 | 113,446 | ||||
| JPMorgan Chase & Co., 4.625%, 5/10/21 | 60,000 | 64,889 | ||||
| JPMorgan Chase & Co., 3.25%, 9/23/22 | 40,000 | 40,296 | ||||
| JPMorgan Chase & Co., 3.875%, 9/10/24 | 30,000 | 29,912 | ||||
| JPMorgan Chase & Co., 3.125%, 1/23/25 | 70,000 | 68,182 | ||||
| JPMorgan Chase & Co., 4.95%, 6/1/45 | 10,000 | 10,036 | ||||
| KeyCorp, MTN, 2.30%, 12/13/18 | 40,000 | 40,086 | ||||
| KFW, 2.00%, 6/1/16 | 60,000 | 60,309 | ||||
| KFW, 2.00%, 10/4/22 | 50,000 | 49,271 | ||||
| Royal Bank of Scotland Group plc, 6.125%, 12/15/22 | 40,000 | 43,610 | ||||
| Royal Bank of Scotland plc (The), 4.375%, 3/16/16 | 30,000 | 30,197 | ||||
| U.S. Bancorp, 3.44%, 2/1/16 | 30,000 | 30,039 | ||||
| U.S. Bancorp, MTN, 3.00%, 3/15/22 | 20,000 | 20,428 | ||||
| U.S. Bancorp, MTN, 3.60%, 9/11/24 | 50,000 | 50,909 | ||||
| Wells Fargo & Co., 4.125%, 8/15/23 | 50,000 | 51,995 | ||||
| Wells Fargo & Co., MTN, 2.60%, 7/22/20 | 40,000 | 39,940 | ||||
| Wells Fargo & Co., MTN, 4.60%, 4/1/21 | 50,000 | 54,545 | ||||
| Wells Fargo & Co., MTN, 4.10%, 6/3/26 | 30,000 | 30,323 | ||||
| Wells Fargo & Co., MTN, 4.65%, 11/4/44 | 10,000 | 9,752 | ||||
| Wells Fargo & Co., MTN, 4.90%, 11/17/45 | 15,000 | 15,175 | ||||
| 1,987,925 | ||||||
| Beverages — 0.1% | ||||||
| Anheuser-Busch InBev Worldwide, Inc., 7.75%, 1/15/19 | 50,000 | 57,831 | ||||
| Anheuser-Busch InBev Worldwide, Inc., 2.50%, 7/15/22 | 50,000 | 48,171 | ||||
| Coca-Cola Co. (The), 1.80%, 9/1/16 | 40,000 | 40,260 | ||||
| 146,262 | ||||||
| Biotechnology — 0.4% | ||||||
| AbbVie, Inc., 1.75%, 11/6/17 | 60,000 | 59,914 | ||||
| AbbVie, Inc., 2.90%, 11/6/22 | 40,000 | 38,785 | ||||
| AbbVie, Inc., 3.60%, 5/14/25 | 30,000 | 29,670 | ||||
| AbbVie, Inc., 4.40%, 11/6/42 | 30,000 | 28,123 | ||||
| Amgen, Inc., 2.125%, 5/15/17 | 40,000 | 40,257 | ||||
| Amgen, Inc., 4.10%, 6/15/21 | 20,000 | 21,096 | ||||
| Amgen, Inc., 5.375%, 5/15/43 | 40,000 | 42,623 | ||||
| Biogen, Inc., 3.625%, 9/15/22 | 50,000 | 50,634 | ||||
| Celgene Corp., 3.25%, 8/15/22 | 30,000 | 29,807 | ||||
| Celgene Corp., 3.625%, 5/15/24 | 10,000 | 9,858 | ||||
| Celgene Corp., 3.875%, 8/15/25 | 30,000 | 29,964 | ||||
13
| Shares/ Principal Amount | Value | |||||
| Gilead Sciences, Inc., 4.40%, 12/1/21 | $ | 50,000 | $ | 54,049 | ||
| Gilead Sciences, Inc., 3.65%, 3/1/26 | 40,000 | 40,406 | ||||
| 475,186 | ||||||
Building Products† | ||||||
| Masco Corp., 4.45%, 4/1/25 | 20,000 | 19,650 | ||||
| Capital Markets — 0.1% | ||||||
| Ameriprise Financial, Inc., 4.00%, 10/15/23 | 20,000 | 20,799 | ||||
| Bear Stearns Cos. LLC (The), 6.40%, 10/2/17 | 100,000 | 107,724 | ||||
| Jefferies Group LLC, 5.125%, 4/13/18 | 30,000 | 31,239 | ||||
| 159,762 | ||||||
| Chemicals — 0.2% | ||||||
| Ashland, Inc., 4.75%, 8/15/22 | 30,000 | 29,288 | ||||
| Dow Chemical Co. (The), 4.25%, 11/15/20 | 13,000 | 13,644 | ||||
| Eastman Chemical Co., 2.70%, 1/15/20 | 30,000 | 29,744 | ||||
| Eastman Chemical Co., 3.60%, 8/15/22 | 30,000 | 29,913 | ||||
| Ecolab, Inc., 4.35%, 12/8/21 | 30,000 | 32,076 | ||||
| LyondellBasell Industries NV, 4.625%, 2/26/55 | 20,000 | 16,284 | ||||
| Mosaic Co. (The), 5.625%, 11/15/43 | 20,000 | 19,237 | ||||
| 170,186 | ||||||
| Commercial Services and Supplies — 0.1% | ||||||
| Clean Harbors, Inc., 5.25%, 8/1/20 | 30,000 | 30,750 | ||||
| Covanta Holding Corp., 5.875%, 3/1/24 | 30,000 | 27,300 | ||||
| Pitney Bowes, Inc., 4.625%, 3/15/24 | 20,000 | 19,635 | ||||
| Republic Services, Inc., 3.55%, 6/1/22 | 50,000 | 51,160 | ||||
| Waste Management, Inc., 4.10%, 3/1/45 | 10,000 | 9,332 | ||||
| 138,177 | ||||||
| Communications Equipment — 0.1% | ||||||
| CC Holdings GS V LLC / Crown Castle GS III Corp., 3.85%, 4/15/23 | 60,000 | 59,020 | ||||
| Cisco Systems, Inc., 5.90%, 2/15/39 | 20,000 | 24,444 | ||||
| 83,464 | ||||||
Construction Materials† | ||||||
| Owens Corning, 4.20%, 12/15/22 | 30,000 | 30,081 | ||||
| Consumer Finance — 0.3% | ||||||
| American Express Co., 1.55%, 5/22/18 | 20,000 | 19,857 | ||||
| American Express Credit Corp., 1.30%, 7/29/16 | 40,000 | 40,077 | ||||
| American Express Credit Corp., 2.60%, 9/14/20 | 15,000 | 15,052 | ||||
| CIT Group, Inc., 4.25%, 8/15/17 | 80,000 | 82,000 | ||||
| CIT Group, Inc., 5.00%, 8/15/22 | 20,000 | 20,588 | ||||
| Equifax, Inc., 3.30%, 12/15/22 | 30,000 | 29,964 | ||||
| GLP Capital LP / GLP Financing II, Inc., 4.875%, 11/1/20 | 40,000 | 39,400 | ||||
| John Deere Capital Corp., MTN, 3.15%, 10/15/21 | 20,000 | 20,372 | ||||
| PNC Bank N.A., 6.00%, 12/7/17 | 80,000 | 85,682 | ||||
| Synchrony Financial, 2.60%, 1/15/19 | 20,000 | 19,948 | ||||
| Synchrony Financial, 3.00%, 8/15/19 | 10,000 | 9,997 | ||||
| 382,937 | ||||||
| Containers and Packaging — 0.1% | ||||||
| Ball Corp., 4.00%, 11/15/23 | 30,000 | 28,762 | ||||
14
| Shares/ Principal Amount | Value | |||||
| Crown Americas LLC / Crown Americas Capital Corp. IV, 4.50%, 1/15/23 | $ | 40,000 | $ | 39,300 | ||
| WestRock RKT Co., 3.50%, 3/1/20 | 20,000 | 20,228 | ||||
| WestRock RKT Co., 4.00%, 3/1/23 | 40,000 | 40,210 | ||||
| 128,500 | ||||||
Diversified Consumer Services† | ||||||
| Catholic Health Initiatives, 2.95%, 11/1/22 | 20,000 | 19,537 | ||||
| Johns Hopkins University, 4.08%, 7/1/53 | 10,000 | 9,836 | ||||
| 29,373 | ||||||
| Diversified Financial Services — 1.1% | ||||||
| Ally Financial, Inc., 2.75%, 1/30/17 | 50,000 | 50,000 | ||||
| General Electric Capital Corp., MTN, 2.30%, 4/27/17 | 60,000 | 60,750 | ||||
| General Electric Capital Corp., MTN, 5.625%, 9/15/17 | 150,000 | 159,988 | ||||
| General Electric Capital Corp., MTN, 4.375%, 9/16/20 | 120,000 | 130,408 | ||||
| General Electric Capital Corp., MTN, 4.65%, 10/17/21 | 20,000 | 22,132 | ||||
| Goldman Sachs Group, Inc. (The), 2.375%, 1/22/18 | 40,000 | 40,368 | ||||
| Goldman Sachs Group, Inc. (The), 2.90%, 7/19/18 | 180,000 | 183,633 | ||||
| Goldman Sachs Group, Inc. (The), 5.75%, 1/24/22 | 30,000 | 34,164 | ||||
| Goldman Sachs Group, Inc. (The), 4.00%, 3/3/24 | 50,000 | 51,435 | ||||
| Goldman Sachs Group, Inc. (The), 3.50%, 1/23/25 | 40,000 | 39,419 | ||||
| Goldman Sachs Group, Inc. (The), 4.25%, 10/21/25 | 20,000 | 19,899 | ||||
| Goldman Sachs Group, Inc. (The), 6.75%, 10/1/37 | 40,000 | 46,868 | ||||
| Goldman Sachs Group, Inc. (The), 5.15%, 5/22/45 | 10,000 | 9,743 | ||||
| Goldman Sachs Group, Inc. (The), MTN, 4.80%, 7/8/44 | 10,000 | 9,971 | ||||
| Icahn Enterprises LP / Icahn Enterprises Finance Corp., 3.50%, 3/15/17 | 30,000 | 30,225 | ||||
| McGraw Hill Financial, Inc., 3.30%, 8/14/20 | 10,000 | 10,100 | ||||
| Morgan Stanley, 5.00%, 11/24/25 | 120,000 | 127,710 | ||||
| Morgan Stanley, MTN, 6.625%, 4/1/18 | 90,000 | 98,749 | ||||
| Morgan Stanley, MTN, 5.625%, 9/23/19 | 80,000 | 88,392 | ||||
| Morgan Stanley, MTN, 3.70%, 10/23/24 | 10,000 | 10,068 | ||||
| 1,224,022 | ||||||
| Diversified Telecommunication Services — 0.7% | ||||||
| AT&T, Inc., 2.625%, 12/1/22 | 50,000 | 47,508 | ||||
| AT&T, Inc., 3.40%, 5/15/25 | 50,000 | 48,156 | ||||
| AT&T, Inc., 6.55%, 2/15/39 | 42,000 | 47,325 | ||||
| AT&T, Inc., 4.30%, 12/15/42 | 40,000 | 34,303 | ||||
| British Telecommunications plc, 5.95%, 1/15/18 | 40,000 | 43,150 | ||||
| CenturyLink, Inc., Series Q, 6.15%, 9/15/19 | 30,000 | 30,750 | ||||
Deutsche Telekom International Finance BV, 2.25%, 3/6/17(2) | 20,000 | 20,131 | ||||
| Deutsche Telekom International Finance BV, 6.75%, 8/20/18 | 30,000 | 33,464 | ||||
| Frontier Communications Corp., 8.25%, 4/15/17 | 10,000 | 10,538 | ||||
| Frontier Communications Corp., 8.50%, 4/15/20 | 20,000 | 20,100 | ||||
Frontier Communications Corp., 11.00%, 9/15/25(2) | 10,000 | 9,925 | ||||
| Orange SA, 4.125%, 9/14/21 | 40,000 | 42,401 | ||||
| Telecom Italia Capital SA, 6.00%, 9/30/34 | 20,000 | 18,550 | ||||
| Verizon Communications, Inc., 3.65%, 9/14/18 | 90,000 | 94,190 | ||||
15
| Shares/ Principal Amount | Value | |||||
| Verizon Communications, Inc., 3.50%, 11/1/21 | $ | 20,000 | $ | 20,458 | ||
| Verizon Communications, Inc., 5.15%, 9/15/23 | 60,000 | 66,072 | ||||
| Verizon Communications, Inc., 5.05%, 3/15/34 | 100,000 | 99,868 | ||||
| Verizon Communications, Inc., 4.75%, 11/1/41 | 20,000 | 18,508 | ||||
| Verizon Communications, Inc., 6.55%, 9/15/43 | 23,000 | 27,400 | ||||
| Verizon Communications, Inc., 4.86%, 8/21/46 | 37,000 | 35,140 | ||||
| Verizon Communications, Inc., 5.01%, 8/21/54 | 21,000 | 19,301 | ||||
| Windstream Services LLC, 7.875%, 11/1/17 | 20,000 | 20,560 | ||||
| 807,798 | ||||||
Electrical Equipment† | ||||||
Belden, Inc., 5.25%, 7/15/24(2) | 30,000 | 27,750 | ||||
| Electronic Equipment, Instruments and Components — 0.1% | ||||||
| Jabil Circuit, Inc., 7.75%, 7/15/16 | 70,000 | 71,925 | ||||
| Energy Equipment and Services — 0.1% | ||||||
| Ensco plc, 4.70%, 3/15/21 | 40,000 | 32,257 | ||||
| Ensco plc, 5.20%, 3/15/25 | 10,000 | 7,132 | ||||
| Halliburton Co., 3.80%, 11/15/25 | 30,000 | 29,266 | ||||
| Noble Holding International Ltd., 5.95%, 4/1/25 | 10,000 | 6,912 | ||||
| Schlumberger Investment SA, 3.65%, 12/1/23 | 40,000 | 40,667 | ||||
| Transocean, Inc., 6.50%, 11/15/20 | 10,000 | 6,950 | ||||
| Weatherford International Ltd., 4.50%, 4/15/22 | 20,000 | 14,425 | ||||
| 137,609 | ||||||
| Food and Staples Retailing — 0.3% | ||||||
| CVS Health Corp., 3.50%, 7/20/22 | 40,000 | 40,780 | ||||
| CVS Health Corp., 2.75%, 12/1/22 | 35,000 | 34,158 | ||||
| CVS Health Corp., 5.125%, 7/20/45 | 10,000 | 10,575 | ||||
| Delhaize Group, 5.70%, 10/1/40 | 10,000 | 10,316 | ||||
| Dollar General Corp., 3.25%, 4/15/23 | 30,000 | 28,618 | ||||
| Dollar General Corp., 4.15%, 11/1/25 | 10,000 | 9,961 | ||||
| Kroger Co. (The), 6.40%, 8/15/17 | 50,000 | 53,714 | ||||
| Kroger Co. (The), 3.30%, 1/15/21 | 50,000 | 50,841 | ||||
| Wal-Mart Stores, Inc., 2.55%, 4/11/23 | 10,000 | 9,876 | ||||
| Wal-Mart Stores, Inc., 4.30%, 4/22/44 | 80,000 | 81,767 | ||||
| 330,606 | ||||||
| Food Products — 0.1% | ||||||
| Kraft Foods Group, Inc., 5.00%, 6/4/42 | 20,000 | 20,211 | ||||
Kraft Heinz Foods Co., 3.95%, 7/15/25(2) | 20,000 | 20,233 | ||||
Kraft Heinz Foods Co., 5.20%, 7/15/45(2) | 20,000 | 20,963 | ||||
| Mondelez International, Inc., 4.00%, 2/1/24 | 30,000 | 30,997 | ||||
| Tyson Foods, Inc., 4.50%, 6/15/22 | 30,000 | 31,995 | ||||
| 124,399 | ||||||
| Gas Utilities — 0.6% | ||||||
Columbia Pipeline Group, Inc., 4.50%, 6/1/25(2) | 30,000 | 27,242 | ||||
| Enbridge Energy Partners LP, 6.50%, 4/15/18 | 30,000 | 31,451 | ||||
| Enbridge, Inc., 4.50%, 6/10/44 | 20,000 | 13,669 | ||||
| Energy Transfer Equity LP, 7.50%, 10/15/20 | 30,000 | 27,900 | ||||
| Energy Transfer Partners LP, 4.15%, 10/1/20 | 40,000 | 36,954 | ||||
16
| Shares/ Principal Amount | Value | |||||
| Energy Transfer Partners LP, 3.60%, 2/1/23 | $ | 30,000 | $ | 24,749 | ||
| Energy Transfer Partners LP, 6.50%, 2/1/42 | 20,000 | 16,312 | ||||
| Enterprise Products Operating LLC, 6.30%, 9/15/17 | 30,000 | 31,568 | ||||
| Enterprise Products Operating LLC, 4.85%, 3/15/44 | 80,000 | 64,949 | ||||
| Enterprise Products Operating LLC, VRN, 7.03%, 1/15/18 | 20,000 | 20,350 | ||||
| Kinder Morgan Energy Partners LP, 6.50%, 4/1/20 | 30,000 | 30,639 | ||||
| Kinder Morgan Energy Partners LP, 5.30%, 9/15/20 | 20,000 | 19,823 | ||||
| Kinder Morgan Energy Partners LP, 6.50%, 9/1/39 | 50,000 | 41,344 | ||||
| Kinder Morgan, Inc., 7.25%, 6/1/18 | 20,000 | 20,778 | ||||
| Kinder Morgan, Inc., 4.30%, 6/1/25 | 10,000 | 8,661 | ||||
| Kinder Morgan, Inc., 5.55%, 6/1/45 | 10,000 | 7,834 | ||||
| Magellan Midstream Partners LP, 6.55%, 7/15/19 | 20,000 | 21,853 | ||||
MPLX LP, 4.875%, 12/1/24(2) | 20,000 | 18,050 | ||||
MPLX LP, 4.875%, 6/1/25(2) | 20,000 | 18,000 | ||||
| Plains All American Pipeline LP / PAA Finance Corp., 3.65%, 6/1/22 | 40,000 | 34,388 | ||||
| Sunoco Logistics Partners Operations LP, 3.45%, 1/15/23 | 40,000 | 33,815 | ||||
| Targa Resources Partners LP / Targa Resources Partners Finance Corp., 4.25%, 11/15/23 | 40,000 | 31,000 | ||||
| TransCanada PipeLines Ltd., 2.50%, 8/1/22 | 30,000 | 27,586 | ||||
| Williams Cos., Inc. (The), 3.70%, 1/15/23 | 20,000 | 13,835 | ||||
| Williams Cos., Inc. (The), 5.75%, 6/24/44 | 10,000 | 5,953 | ||||
| Williams Partners LP, 4.125%, 11/15/20 | 30,000 | 26,815 | ||||
| Williams Partners LP, 5.40%, 3/4/44 | 40,000 | 26,875 | ||||
| 682,393 | ||||||
| Health Care Equipment and Supplies — 0.2% | ||||||
| Becton Dickinson and Co., 3.73%, 12/15/24 | 40,000 | 40,442 | ||||
| Medtronic, Inc., 2.50%, 3/15/20 | 20,000 | 20,159 | ||||
| Medtronic, Inc., 2.75%, 4/1/23 | 20,000 | 19,556 | ||||
| Medtronic, Inc., 3.50%, 3/15/25 | 50,000 | 50,651 | ||||
| Medtronic, Inc., 4.375%, 3/15/35 | 40,000 | 40,491 | ||||
| St. Jude Medical, Inc., 2.00%, 9/15/18 | 10,000 | 9,989 | ||||
| Zimmer Biomet Holdings, Inc., 2.70%, 4/1/20 | 20,000 | 19,775 | ||||
| 201,063 | ||||||
| Health Care Providers and Services — 0.4% | ||||||
| Aetna, Inc., 2.75%, 11/15/22 | 30,000 | 29,190 | ||||
| CHS / Community Health Systems, Inc., 5.125%, 8/15/18 | 40,000 | 40,400 | ||||
| Express Scripts Holding Co., 2.65%, 2/15/17 | 90,000 | 90,914 | ||||
| Express Scripts Holding Co., 7.25%, 6/15/19 | 35,000 | 40,308 | ||||
| HCA, Inc., 3.75%, 3/15/19 | 60,000 | 60,600 | ||||
| NYU Hospitals Center, 4.43%, 7/1/42 | 20,000 | 19,054 | ||||
| UnitedHealth Group, Inc., 2.875%, 12/15/21 | 30,000 | 30,377 | ||||
| UnitedHealth Group, Inc., 2.875%, 3/15/22 | 40,000 | 39,995 | ||||
| UnitedHealth Group, Inc., 3.75%, 7/15/25 | 20,000 | 20,661 | ||||
| Universal Health Services, Inc., 7.125%, 6/30/16 | 30,000 | 30,787 | ||||
Universal Health Services, Inc., 4.75%, 8/1/22(2) | 20,000 | 20,250 | ||||
| 422,536 | ||||||
17
| Shares/ Principal Amount | Value | |||||
Hotels, Restaurants and Leisure† | ||||||
| McDonald's Corp., MTN, 4.60%, 5/26/45 | $ | 10,000 | $ | 9,653 | ||
| Royal Caribbean Cruises Ltd., 5.25%, 11/15/22 | 30,000 | 30,900 | ||||
| Wyndham Worldwide Corp., 2.95%, 3/1/17 | 10,000 | 10,064 | ||||
| 50,617 | ||||||
| Household Durables — 0.1% | ||||||
| D.R. Horton, Inc., 3.625%, 2/15/18 | 40,000 | 40,650 | ||||
| Lennar Corp., 4.75%, 12/15/17 | 30,000 | 30,975 | ||||
| Lennar Corp., 4.50%, 6/15/19 | 30,000 | 30,656 | ||||
| M.D.C. Holdings, Inc., 5.50%, 1/15/24 | 20,000 | 20,300 | ||||
| Toll Brothers Finance Corp., 6.75%, 11/1/19 | 30,000 | 33,150 | ||||
| TRI Pointe Holdings, Inc. / TRI Pointe Group, Inc., 4.375%, 6/15/19 | 10,000 | 9,825 | ||||
| 165,556 | ||||||
| Industrial Conglomerates — 0.2% | ||||||
| General Electric Co., 5.25%, 12/6/17 | 70,000 | 74,765 | ||||
| General Electric Co., 2.70%, 10/9/22 | 70,000 | 69,816 | ||||
| General Electric Co., 4.125%, 10/9/42 | 30,000 | 29,374 | ||||
| Ingersoll-Rand Luxembourg Finance SA, 3.55%, 11/1/24 | 30,000 | 29,428 | ||||
| 203,383 | ||||||
| Insurance — 0.7% | ||||||
| ACE INA Holdings, Inc., 3.15%, 3/15/25 | 40,000 | 39,603 | ||||
| ACE INA Holdings, Inc., 3.35%, 5/3/26 | 20,000 | 19,968 | ||||
| Allstate Corp. (The), VRN, 5.75%, 8/15/23 | 20,000 | 20,597 | ||||
| American International Group, Inc., 4.875%, 6/1/22 | 80,000 | 86,571 | ||||
| American International Group, Inc., 4.50%, 7/16/44 | 20,000 | 18,569 | ||||
| American International Group, Inc., MTN, 5.85%, 1/16/18 | 50,000 | 53,891 | ||||
| Berkshire Hathaway Finance Corp., 4.25%, 1/15/21 | 30,000 | 32,744 | ||||
| Berkshire Hathaway Finance Corp., 3.00%, 5/15/22 | 20,000 | 20,371 | ||||
| Berkshire Hathaway, Inc., 4.50%, 2/11/43 | 50,000 | 50,426 | ||||
| Hartford Financial Services Group, Inc. (The), 5.95%, 10/15/36 | 10,000 | 11,540 | ||||
| International Lease Finance Corp., 6.25%, 5/15/19 | 20,000 | 21,475 | ||||
Liberty Mutual Group, Inc., 4.95%, 5/1/22(2) | 20,000 | 21,229 | ||||
Liberty Mutual Group, Inc., 4.85%, 8/1/44(2) | 30,000 | 27,892 | ||||
| Lincoln National Corp., 6.25%, 2/15/20 | 40,000 | 44,989 | ||||
| Markel Corp., 4.90%, 7/1/22 | 40,000 | 42,971 | ||||
| Markel Corp., 3.625%, 3/30/23 | 10,000 | 9,883 | ||||
| MetLife, Inc., 4.125%, 8/13/42 | 20,000 | 19,008 | ||||
| MetLife, Inc., 4.875%, 11/13/43 | 20,000 | 21,041 | ||||
| Principal Financial Group, Inc., 3.30%, 9/15/22 | 10,000 | 9,997 | ||||
| Prudential Financial, Inc., MTN, 5.375%, 6/21/20 | 10,000 | 11,133 | ||||
| Prudential Financial, Inc., MTN, 5.625%, 5/12/41 | 40,000 | 44,430 | ||||
TIAA Asset Management Finance Co. LLC, 4.125%, 11/1/24(2) | 20,000 | 20,116 | ||||
| Travelers Cos., Inc. (The), 4.60%, 8/1/43 | 20,000 | 21,061 | ||||
| Travelers Cos., Inc. (The), 4.30%, 8/25/45 | 10,000 | 10,106 | ||||
| Voya Financial, Inc., 5.50%, 7/15/22 | 30,000 | 33,629 | ||||
| Voya Financial, Inc., 5.70%, 7/15/43 | 20,000 | 22,773 | ||||
| WR Berkley Corp., 4.625%, 3/15/22 | 20,000 | 21,160 | ||||
18
| Shares/ Principal Amount | Value | |||||
| WR Berkley Corp., 4.75%, 8/1/44 | $ | 10,000 | $ | 9,617 | ||
| 766,790 | ||||||
Internet Software and Services† | ||||||
| Netflix, Inc., 5.375%, 2/1/21 | 40,000 | 42,200 | ||||
| IT Services — 0.1% | ||||||
| Fidelity National Information Services, Inc., 5.00%, 3/15/22 | 20,000 | 20,799 | ||||
| Fidelity National Information Services, Inc., 4.50%, 10/15/22 | 30,000 | 30,593 | ||||
| Fidelity National Information Services, Inc., 3.50%, 4/15/23 | 20,000 | 19,128 | ||||
| Xerox Corp., 2.95%, 3/15/17 | 10,000 | 10,078 | ||||
| 80,598 | ||||||
| Life Sciences Tools and Services — 0.1% | ||||||
| Thermo Fisher Scientific, Inc., 3.60%, 8/15/21 | 25,000 | 25,423 | ||||
| Thermo Fisher Scientific, Inc., 3.30%, 2/15/22 | 9,000 | 8,996 | ||||
| Thermo Fisher Scientific, Inc., 5.30%, 2/1/44 | 30,000 | 32,146 | ||||
| 66,565 | ||||||
| Machinery — 0.1% | ||||||
| Caterpillar Financial Services Corp., MTN, 2.85%, 6/1/22 | 40,000 | 39,667 | ||||
| Oshkosh Corp., 5.375%, 3/1/22 | 50,000 | 50,250 | ||||
| 89,917 | ||||||
| Media — 0.9% | ||||||
| 21st Century Fox America, Inc., 3.00%, 9/15/22 | 30,000 | 29,609 | ||||
21st Century Fox America, Inc., 3.70%, 10/15/25(2) | 20,000 | 20,005 | ||||
| 21st Century Fox America, Inc., 6.90%, 8/15/39 | 30,000 | 35,581 | ||||
| 21st Century Fox America, Inc., 4.75%, 9/15/44 | 30,000 | 28,959 | ||||
| CBS Corp., 3.50%, 1/15/25 | 30,000 | 28,674 | ||||
| CBS Corp., 4.85%, 7/1/42 | 10,000 | 9,000 | ||||
CCO Safari II LLC, 4.91%, 7/23/25(2) | 115,000 | 115,061 | ||||
| Comcast Corp., 4.40%, 8/15/35 | 20,000 | 20,159 | ||||
| Comcast Corp., 6.40%, 5/15/38 | 70,000 | 87,053 | ||||
| Comcast Corp., 4.75%, 3/1/44 | 10,000 | 10,404 | ||||
| DIRECTV Holdings LLC / DIRECTV Financing Co., Inc., 5.00%, 3/1/21 | 40,000 | 43,199 | ||||
| DIRECTV Holdings LLC / DIRECTV Financing Co., Inc., 4.45%, 4/1/24 | 20,000 | 20,578 | ||||
| Discovery Communications LLC, 5.625%, 8/15/19 | 25,000 | 27,229 | ||||
| Discovery Communications LLC, 3.25%, 4/1/23 | 20,000 | 18,469 | ||||
| DISH DBS Corp., 7.125%, 2/1/16 | 10,000 | 10,037 | ||||
| Embarq Corp., 8.00%, 6/1/36 | 20,000 | 20,650 | ||||
| Interpublic Group of Cos., Inc. (The), 4.00%, 3/15/22 | 20,000 | 20,058 | ||||
| Lamar Media Corp., 5.375%, 1/15/24 | 30,000 | 31,050 | ||||
| NBCUniversal Media LLC, 5.15%, 4/30/20 | 20,000 | 22,353 | ||||
| NBCUniversal Media LLC, 4.375%, 4/1/21 | 60,000 | 65,248 | ||||
| NBCUniversal Media LLC, 2.875%, 1/15/23 | 20,000 | 19,881 | ||||
Nielsen Finance LLC / Nielsen Finance Co., 5.00%, 4/15/22(2) | 30,000 | 29,737 | ||||
| TEGNA, Inc., 5.125%, 7/15/20 | 57,000 | 59,280 | ||||
| Time Warner Cable, Inc., 6.75%, 7/1/18 | 20,000 | 21,838 | ||||
| Time Warner Cable, Inc., 5.50%, 9/1/41 | 10,000 | 9,066 | ||||
19
| Shares/ Principal Amount | Value | |||||
| Time Warner Cable, Inc., 4.50%, 9/15/42 | $ | 10,000 | $ | 7,875 | ||
| Time Warner, Inc., 4.70%, 1/15/21 | 30,000 | 32,332 | ||||
| Time Warner, Inc., 3.60%, 7/15/25 | 30,000 | 29,276 | ||||
| Time Warner, Inc., 7.70%, 5/1/32 | 40,000 | 50,061 | ||||
| Time Warner, Inc., 5.35%, 12/15/43 | 20,000 | 20,026 | ||||
| Viacom, Inc., 4.50%, 3/1/21 | 30,000 | 31,018 | ||||
| Viacom, Inc., 3.125%, 6/15/22 | 30,000 | 27,844 | ||||
| Walt Disney Co. (The), MTN, 2.35%, 12/1/22 | 30,000 | 29,662 | ||||
| Walt Disney Co. (The), MTN, 4.125%, 6/1/44 | 20,000 | 20,448 | ||||
| 1,051,720 | ||||||
| Metals and Mining — 0.1% | ||||||
| Barrick North America Finance LLC, 4.40%, 5/30/21 | 20,000 | 17,984 | ||||
| Barrick North America Finance LLC, 5.75%, 5/1/43 | 10,000 | 7,253 | ||||
| Freeport-McMoRan, Inc., 3.875%, 3/15/23 | 25,000 | 14,375 | ||||
Glencore Finance Canada Ltd., 4.95%, 11/15/21(2) | 20,000 | 16,119 | ||||
| Newmont Mining Corp., 6.25%, 10/1/39 | 10,000 | 8,013 | ||||
| Southern Copper Corp., 5.25%, 11/8/42 | 20,000 | 14,510 | ||||
| Steel Dynamics, Inc., 6.125%, 8/15/19 | 30,000 | 30,375 | ||||
| Vale Overseas Ltd., 5.625%, 9/15/19 | 45,000 | 40,838 | ||||
| 149,467 | ||||||
| Multi-Utilities — 0.8% | ||||||
| Berkshire Hathaway Energy Co., 3.50%, 2/1/25 | 30,000 | 29,809 | ||||
| CenterPoint Energy Houston Electric LLC, 3.55%, 8/1/42 | 10,000 | 9,008 | ||||
| CMS Energy Corp., 8.75%, 6/15/19 | 40,000 | 47,872 | ||||
| Consolidated Edison Co. of New York, Inc., 3.95%, 3/1/43 | 20,000 | 18,525 | ||||
| Constellation Energy Group, Inc., 5.15%, 12/1/20 | 32,000 | 34,794 | ||||
| Consumers Energy Co., 2.85%, 5/15/22 | 10,000 | 9,912 | ||||
| Consumers Energy Co., 3.375%, 8/15/23 | 10,000 | 10,237 | ||||
| Dominion Resources, Inc., 2.75%, 9/15/22 | 70,000 | 67,777 | ||||
| Dominion Resources, Inc., 3.625%, 12/1/24 | 30,000 | 29,780 | ||||
| Dominion Resources, Inc., 4.90%, 8/1/41 | 20,000 | 19,628 | ||||
| Dominion Resources, Inc., VRN, 7.50%, 6/30/16 | 20,000 | 16,640 | ||||
| Duke Energy Corp., 1.625%, 8/15/17 | 30,000 | 29,973 | ||||
| Duke Energy Corp., 3.55%, 9/15/21 | 20,000 | 20,456 | ||||
| Duke Energy Florida LLC, 6.35%, 9/15/37 | 20,000 | 25,542 | ||||
| Duke Energy Florida LLC, 3.85%, 11/15/42 | 20,000 | 18,743 | ||||
| Duke Energy Progress LLC, 4.15%, 12/1/44 | 20,000 | 19,581 | ||||
| Edison International, 3.75%, 9/15/17 | 40,000 | 41,283 | ||||
| Exelon Generation Co. LLC, 4.25%, 6/15/22 | 20,000 | 20,292 | ||||
| Exelon Generation Co. LLC, 5.60%, 6/15/42 | 10,000 | 9,342 | ||||
| FirstEnergy Corp., 2.75%, 3/15/18 | 20,000 | 20,101 | ||||
| FirstEnergy Corp., 4.25%, 3/15/23 | 40,000 | 40,778 | ||||
| Florida Power & Light Co., 4.125%, 2/1/42 | 20,000 | 19,952 | ||||
| Georgia Power Co., 4.30%, 3/15/42 | 10,000 | 9,257 | ||||
| IPALCO Enterprises, Inc., 5.00%, 5/1/18 | 40,000 | 42,100 | ||||
| MidAmerican Energy Co., 4.40%, 10/15/44 | 20,000 | 20,274 | ||||
| NextEra Energy Capital Holdings, Inc., VRN, 7.30%, 9/1/17 | 40,000 | 38,328 | ||||
20
| Shares/ Principal Amount | Value | |||||
| Nisource Finance Corp., 5.65%, 2/1/45 | $ | 20,000 | $ | 23,076 | ||
| PacifiCorp, 6.00%, 1/15/39 | 20,000 | 24,315 | ||||
| Potomac Electric Power Co., 3.60%, 3/15/24 | 20,000 | 20,710 | ||||
| Progress Energy, Inc., 3.15%, 4/1/22 | 20,000 | 19,668 | ||||
| Sempra Energy, 6.50%, 6/1/16 | 30,000 | 30,548 | ||||
| Sempra Energy, 2.40%, 3/15/20 | 10,000 | 9,787 | ||||
| Sempra Energy, 2.875%, 10/1/22 | 40,000 | 38,782 | ||||
| Southern Power Co., 5.15%, 9/15/41 | 10,000 | 9,285 | ||||
| Virginia Electric and Power Co., 3.45%, 2/15/24 | 30,000 | 30,631 | ||||
| Virginia Electric and Power Co., 4.45%, 2/15/44 | 10,000 | 10,308 | ||||
| Xcel Energy, Inc., 4.80%, 9/15/41 | 10,000 | 10,083 | ||||
| 897,177 | ||||||
| Multiline Retail — 0.1% | ||||||
| Macy's Retail Holdings, Inc., 2.875%, 2/15/23 | 30,000 | 27,250 | ||||
| Target Corp., 4.00%, 7/1/42 | 40,000 | 39,148 | ||||
| 66,398 | ||||||
| Oil, Gas and Consumable Fuels — 0.8% | ||||||
| AmeriGas Partners LP / AmeriGas Finance Corp., 6.25%, 8/20/19 | 20,000 | 19,250 | ||||
| Anadarko Petroleum Corp., 5.95%, 9/15/16 | 10,000 | 10,277 | ||||
| Anadarko Petroleum Corp., 6.45%, 9/15/36 | 20,000 | 19,317 | ||||
| Apache Corp., 4.75%, 4/15/43 | 20,000 | 17,243 | ||||
| BP Capital Markets plc, 4.50%, 10/1/20 | 30,000 | 32,130 | ||||
| BP Capital Markets plc, 2.75%, 5/10/23 | 20,000 | 18,806 | ||||
| California Resources Corp., 5.50%, 9/15/21 | 30,000 | 9,600 | ||||
| Chesapeake Energy Corp., 4.875%, 4/15/22 | 10,000 | 2,826 | ||||
| Chevron Corp., 2.43%, 6/24/20 | 10,000 | 10,017 | ||||
| Cimarex Energy Co., 4.375%, 6/1/24 | 30,000 | 26,671 | ||||
| CNOOC Nexen Finance 2014 ULC, 4.25%, 4/30/24 | 30,000 | 30,336 | ||||
| Concho Resources, Inc., 7.00%, 1/15/21 | 50,000 | 49,500 | ||||
| Concho Resources, Inc., 6.50%, 1/15/22 | 10,000 | 9,650 | ||||
| ConocoPhillips Holding Co., 6.95%, 4/15/29 | 10,000 | 11,479 | ||||
| Continental Resources, Inc., 5.00%, 9/15/22 | 40,000 | 29,550 | ||||
| Devon Energy Corp., 5.00%, 6/15/45 | 10,000 | 7,604 | ||||
| Ecopetrol SA, 4.125%, 1/16/25 | 10,000 | 8,025 | ||||
| EOG Resources, Inc., 5.625%, 6/1/19 | 30,000 | 32,937 | ||||
| EOG Resources, Inc., 4.10%, 2/1/21 | 20,000 | 21,113 | ||||
| Exxon Mobil Corp., 2.71%, 3/6/25 | 40,000 | 39,188 | ||||
| Hess Corp., 6.00%, 1/15/40 | 20,000 | 17,779 | ||||
| Marathon Petroleum Corp., 3.50%, 3/1/16 | 30,000 | 30,086 | ||||
| Newfield Exploration Co., 5.75%, 1/30/22 | 20,000 | 17,800 | ||||
| Noble Energy, Inc., 4.15%, 12/15/21 | 50,000 | 48,535 | ||||
| Petroleos Mexicanos, 6.00%, 3/5/20 | 40,000 | 41,660 | ||||
| Petroleos Mexicanos, 4.875%, 1/24/22 | 70,000 | 67,550 | ||||
| Petroleos Mexicanos, 3.50%, 1/30/23 | 10,000 | 8,750 | ||||
| Petroleos Mexicanos, 6.625%, 6/15/35 | 10,000 | 8,987 | ||||
| Phillips 66, 4.30%, 4/1/22 | 50,000 | 51,538 | ||||
| Phillips 66, 4.65%, 11/15/34 | 30,000 | 28,190 | ||||
21
| Shares/ Principal Amount | Value | |||||
| Shell International Finance BV, 2.375%, 8/21/22 | $ | 20,000 | $ | 19,190 | ||
| Shell International Finance BV, 3.25%, 5/11/25 | 20,000 | 19,567 | ||||
| Shell International Finance BV, 3.625%, 8/21/42 | 15,000 | 12,555 | ||||
| Statoil ASA, 2.45%, 1/17/23 | 40,000 | 37,994 | ||||
| Statoil ASA, 3.95%, 5/15/43 | 20,000 | 18,138 | ||||
| Suburban Propane Partners LP / Suburban Energy Finance Corp., 7.375%, 8/1/21 | 30,000 | 28,950 | ||||
| Talisman Energy, Inc., 7.75%, 6/1/19 | 20,000 | 21,570 | ||||
| Total Capital Canada Ltd., 2.75%, 7/15/23 | 20,000 | 19,233 | ||||
| Total Capital SA, 2.125%, 8/10/18 | 20,000 | 20,072 | ||||
| Whiting Petroleum Corp., 5.00%, 3/15/19 | 30,000 | 22,800 | ||||
| 946,463 | ||||||
| Paper and Forest Products — 0.1% | ||||||
Georgia-Pacific LLC, 2.54%, 11/15/19(2) | 40,000 | 39,819 | ||||
Georgia-Pacific LLC, 5.40%, 11/1/20(2) | 60,000 | 66,275 | ||||
| International Paper Co., 6.00%, 11/15/41 | 10,000 | 10,522 | ||||
| 116,616 | ||||||
| Pharmaceuticals — 0.3% | ||||||
| Actavis Funding SCS, 3.85%, 6/15/24 | 34,000 | 34,134 | ||||
| Actavis Funding SCS, 4.55%, 3/15/35 | 20,000 | 19,501 | ||||
| Actavis, Inc., 1.875%, 10/1/17 | 40,000 | 39,968 | ||||
| Actavis, Inc., 3.25%, 10/1/22 | 30,000 | 29,553 | ||||
| Actavis, Inc., 4.625%, 10/1/42 | 10,000 | 9,541 | ||||
Forest Laboratories LLC, 4.875%, 2/15/21(2) | 60,000 | 65,069 | ||||
| GlaxoSmithKline Capital plc, 2.85%, 5/8/22 | 35,000 | 35,318 | ||||
| Merck & Co., Inc., 2.40%, 9/15/22 | 70,000 | 68,666 | ||||
| Merck & Co., Inc., 3.70%, 2/10/45 | 10,000 | 9,322 | ||||
Roche Holdings, Inc., 3.35%, 9/30/24(2) | 20,000 | 20,503 | ||||
| Sanofi, 4.00%, 3/29/21 | 21,000 | 22,509 | ||||
| 354,084 | ||||||
| Real Estate Investment Trusts (REITs) — 0.3% | ||||||
| American Tower Corp., 5.05%, 9/1/20 | 20,000 | 21,613 | ||||
| DDR Corp., 4.75%, 4/15/18 | 50,000 | 52,340 | ||||
| DDR Corp., 3.625%, 2/1/25 | 20,000 | 18,918 | ||||
| Essex Portfolio LP, 3.625%, 8/15/22 | 30,000 | 29,990 | ||||
| Essex Portfolio LP, 3.375%, 1/15/23 | 10,000 | 9,827 | ||||
| Essex Portfolio LP, 3.25%, 5/1/23 | 10,000 | 9,718 | ||||
| Hospitality Properties Trust, 4.65%, 3/15/24 | 60,000 | 59,177 | ||||
| Hospitality Properties Trust, 4.50%, 3/15/25 | 20,000 | 19,240 | ||||
| Host Hotels & Resorts LP, 3.75%, 10/15/23 | 20,000 | 19,316 | ||||
| Kilroy Realty LP, 3.80%, 1/15/23 | 30,000 | 29,784 | ||||
| Realty Income Corp., 4.125%, 10/15/26 | 10,000 | 10,061 | ||||
| Senior Housing Properties Trust, 4.75%, 5/1/24 | 30,000 | 29,278 | ||||
| Ventas Realty LP, 4.125%, 1/15/26 | 20,000 | 19,977 | ||||
| Ventas Realty LP / Ventas Capital Corp., 4.75%, 6/1/21 | 30,000 | 31,991 | ||||
| Welltower, Inc., 2.25%, 3/15/18 | 10,000 | 9,997 | ||||
| Welltower, Inc., 3.75%, 3/15/23 | 20,000 | 19,684 | ||||
| 390,911 | ||||||
22
| Shares/ Principal Amount | Value | |||||
| Road and Rail — 0.3% | ||||||
| Burlington Northern Santa Fe LLC, 3.60%, 9/1/20 | $ | 39,000 | $ | 40,696 | ||
| Burlington Northern Santa Fe LLC, 5.05%, 3/1/41 | 10,000 | 10,384 | ||||
| Burlington Northern Santa Fe LLC, 4.45%, 3/15/43 | 50,000 | 47,729 | ||||
| Burlington Northern Santa Fe LLC, 4.15%, 4/1/45 | 10,000 | 9,101 | ||||
| CSX Corp., 4.25%, 6/1/21 | 20,000 | 21,186 | ||||
| CSX Corp., 3.40%, 8/1/24 | 30,000 | 29,898 | ||||
| Norfolk Southern Corp., 5.75%, 4/1/18 | 10,000 | 10,799 | ||||
| Norfolk Southern Corp., 3.25%, 12/1/21 | 40,000 | 39,958 | ||||
Penske Truck Leasing Co. LP / PTL Finance Corp., 2.875%, 7/17/18(2) | 10,000 | 10,071 | ||||
Penske Truck Leasing Co. LP / PTL Finance Corp., 3.375%, 2/1/22(2) | 20,000 | 19,447 | ||||
| Union Pacific Corp., 4.00%, 2/1/21 | 20,000 | 21,394 | ||||
| Union Pacific Corp., 4.75%, 9/15/41 | 30,000 | 32,141 | ||||
| 292,804 | ||||||
Semiconductors and Semiconductor Equipment† | ||||||
| Intel Corp., 3.70%, 7/29/25 | 10,000 | 10,357 | ||||
| KLA-Tencor Corp., 4.65%, 11/1/24 | 20,000 | 20,169 | ||||
| 30,526 | ||||||
| Software — 0.2% | ||||||
Activision Blizzard, Inc., 5.625%, 9/15/21(2) | 40,000 | 42,000 | ||||
| Intuit, Inc., 5.75%, 3/15/17 | 75,000 | 78,605 | ||||
| Microsoft Corp., 2.70%, 2/12/25 | 30,000 | 29,309 | ||||
| Microsoft Corp., 3.125%, 11/3/25 | 20,000 | 20,141 | ||||
| Oracle Corp., 2.50%, 10/15/22 | 25,000 | 24,440 | ||||
| Oracle Corp., 3.625%, 7/15/23 | 30,000 | 31,077 | ||||
| Oracle Corp., 3.40%, 7/8/24 | 30,000 | 30,513 | ||||
| 256,085 | ||||||
| Specialty Retail — 0.1% | ||||||
| Home Depot, Inc. (The), 2.625%, 6/1/22 | 30,000 | 29,999 | ||||
| Home Depot, Inc. (The), 3.35%, 9/15/25 | 20,000 | 20,474 | ||||
| Home Depot, Inc. (The), 5.95%, 4/1/41 | 40,000 | 49,870 | ||||
| Lowe's Cos., Inc., 3.375%, 9/15/25 | 7,000 | 7,121 | ||||
| United Rentals North America, Inc., 4.625%, 7/15/23 | 20,000 | 20,025 | ||||
| 127,489 | ||||||
| Technology Hardware, Storage and Peripherals — 0.2% | ||||||
| Apple, Inc., 1.00%, 5/3/18 | 30,000 | 29,775 | ||||
| Apple, Inc., 2.85%, 5/6/21 | 30,000 | 30,760 | ||||
| Apple, Inc., 3.45%, 5/6/24 | 40,000 | 41,486 | ||||
Hewlett Packard Enterprise Co., 3.60%, 10/15/20(2) | 50,000 | 50,174 | ||||
Hewlett Packard Enterprise Co., 4.90%, 10/15/25(2) | 20,000 | 19,679 | ||||
| HP, Inc., 4.30%, 6/1/21 | 25,000 | 24,798 | ||||
| Seagate HDD Cayman, 4.75%, 6/1/23 | 50,000 | 43,834 | ||||
| 240,506 | ||||||
| Textiles, Apparel and Luxury Goods — 0.1% | ||||||
| Hanesbrands, Inc., 6.375%, 12/15/20 | 40,000 | 41,410 | ||||
| L Brands, Inc., 6.90%, 7/15/17 | 20,000 | 21,450 | ||||
23
| Shares/ Principal Amount | Value | |||||
| PVH Corp., 4.50%, 12/15/22 | $ | 30,000 | $ | 29,475 | ||
| 92,335 | ||||||
| Tobacco — 0.1% | ||||||
| Altria Group, Inc., 2.85%, 8/9/22 | 70,000 | 68,354 | ||||
| Philip Morris International, Inc., 4.125%, 5/17/21 | 40,000 | 42,536 | ||||
| Reynolds American, Inc., 4.45%, 6/12/25 | 40,000 | 41,936 | ||||
| 152,826 | ||||||
| Wireless Telecommunication Services — 0.1% | ||||||
| Sprint Communications, Inc., 6.00%, 12/1/16 | 30,000 | 29,906 | ||||
Sprint Communications, Inc., 9.00%, 11/15/18(2) | 40,000 | 42,200 | ||||
| T-Mobile USA, Inc., 6.46%, 4/28/19 | 40,000 | 41,293 | ||||
| Vodafone Group plc, 5.625%, 2/27/17 | 50,000 | 52,219 | ||||
| 165,618 | ||||||
TOTAL CORPORATE BONDS (Cost $15,142,878) | 15,036,505 | |||||
U.S. GOVERNMENT AGENCY MORTGAGE-BACKED SECURITIES(3) — 10.6% | ||||||
| Adjustable-Rate U.S. Government Agency Mortgage-Backed Securities — 1.5% | ||||||
| FHLMC, VRN, 1.76%, 1/15/16 | 26,799 | 27,277 | ||||
| FHLMC, VRN, 1.84%, 1/15/16 | 65,147 | 66,468 | ||||
| FHLMC, VRN, 1.97%, 1/15/16 | 46,137 | 47,252 | ||||
| FHLMC, VRN, 1.97%, 1/15/16 | 32,884 | 33,614 | ||||
| FHLMC, VRN, 2.04%, 1/15/16 | 96,639 | 98,012 | ||||
| FHLMC, VRN, 2.32%, 1/15/16 | 91,660 | 92,222 | ||||
| FHLMC, VRN, 2.40%, 1/15/16 | 48,651 | 51,554 | ||||
| FHLMC, VRN, 2.49%, 1/15/16 | 111,234 | 117,343 | ||||
| FHLMC, VRN, 2.53%, 1/15/16 | 15,206 | 15,981 | ||||
| FHLMC, VRN, 2.57%, 1/15/16 | 18,455 | 19,557 | ||||
| FHLMC, VRN, 2.59%, 1/15/16 | 25,037 | 26,546 | ||||
| FHLMC, VRN, 2.63%, 1/15/16 | 18,447 | 19,580 | ||||
| FHLMC, VRN, 2.86%, 1/15/16 | 17,711 | 18,109 | ||||
| FHLMC, VRN, 2.92%, 1/15/16 | 57,148 | 60,570 | ||||
| FHLMC, VRN, 3.27%, 1/15/16 | 32,499 | 34,269 | ||||
| FHLMC, VRN, 3.74%, 1/15/16 | 23,042 | 24,056 | ||||
| FHLMC, VRN, 4.05%, 1/15/16 | 26,573 | 27,662 | ||||
| FHLMC, VRN, 4.22%, 1/15/16 | 35,908 | 37,607 | ||||
| FHLMC, VRN, 4.72%, 1/15/16 | 15,730 | 16,517 | ||||
| FHLMC, VRN, 5.12%, 1/15/16 | 11,497 | 12,072 | ||||
| FHLMC, VRN, 5.78%, 1/15/16 | 41,523 | 43,872 | ||||
| FHLMC, VRN, 5.96%, 1/15/16 | 30,381 | 32,010 | ||||
| FHLMC, VRN, 6.15%, 1/15/16 | 21,467 | 22,673 | ||||
| FNMA, VRN, 2.02%, 1/25/16 | 53,751 | 56,157 | ||||
| FNMA, VRN, 2.02%, 1/25/16 | 113,666 | 118,000 | ||||
| FNMA, VRN, 2.06%, 1/25/16 | 138,348 | 144,900 | ||||
| FNMA, VRN, 2.07%, 1/25/16 | 76,774 | 80,469 | ||||
| FNMA, VRN, 2.07%, 1/25/16 | 56,924 | 59,010 | ||||
| FNMA, VRN, 2.07%, 1/25/16 | 59,209 | 61,221 | ||||
| FNMA, VRN, 2.33%, 1/25/16 | 16,767 | 17,909 | ||||
24
| Shares/ Principal Amount | Value | |||||
| FNMA, VRN, 2.44%, 1/25/16 | $ | 19,765 | $ | 20,860 | ||
| FNMA, VRN, 2.45%, 1/25/16 | 59,179 | 62,684 | ||||
| FNMA, VRN, 2.65%, 1/25/16 | 15,381 | 16,274 | ||||
| FNMA, VRN, 2.69%, 1/25/16 | 57,464 | 58,601 | ||||
| FNMA, VRN, 3.36%, 1/25/16 | 33,533 | 34,830 | ||||
| FNMA, VRN, 3.61%, 1/25/16 | 40,386 | 42,097 | ||||
| FNMA, VRN, 3.91%, 1/25/16 | 31,957 | 33,420 | ||||
| FNMA, VRN, 5.06%, 1/25/16 | 25,262 | 26,700 | ||||
| 1,777,955 | ||||||
| Fixed-Rate U.S. Government Agency Mortgage-Backed Securities — 9.1% | ||||||
| FHLMC, 6.50%, 6/1/16 | 1,649 | 1,655 | ||||
| FHLMC, 6.50%, 6/1/16 | 1,057 | 1,064 | ||||
| FHLMC, 4.50%, 1/1/19 | 46,633 | 48,174 | ||||
| FHLMC, 6.50%, 1/1/28 | 4,387 | 5,038 | ||||
| FHLMC, 6.50%, 6/1/29 | 5,075 | 5,784 | ||||
| FHLMC, 8.00%, 7/1/30 | 4,965 | 6,207 | ||||
| FHLMC, 5.50%, 12/1/33 | 121,460 | 135,759 | ||||
| FHLMC, 5.50%, 1/1/38 | 20,924 | 23,321 | ||||
| FHLMC, 6.00%, 8/1/38 | 22,897 | 25,950 | ||||
| FHLMC, 6.50%, 7/1/47 | 2,155 | 2,374 | ||||
FNMA, 3.50%, 1/13/16(4) | 900,000 | 928,327 | ||||
FNMA, 4.00%, 1/13/16(4) | 300,000 | 317,397 | ||||
FNMA, 4.50%, 1/13/16(4) | 225,000 | 242,966 | ||||
| FNMA, 4.50%, 5/1/19 | 21,642 | 22,538 | ||||
| FNMA, 4.50%, 5/1/19 | 29,838 | 30,987 | ||||
| FNMA, 6.50%, 1/1/28 | 4,397 | 5,028 | ||||
| FNMA, 6.50%, 1/1/29 | 9,956 | 11,388 | ||||
| FNMA, 7.50%, 7/1/29 | 27,331 | 30,920 | ||||
| FNMA, 7.50%, 9/1/30 | 4,431 | 5,246 | ||||
| FNMA, 5.00%, 7/1/31 | 159,895 | 176,647 | ||||
| FNMA, 6.50%, 1/1/32 | 7,820 | 8,946 | ||||
| FNMA, 5.50%, 6/1/33 | 31,574 | 35,445 | ||||
| FNMA, 5.50%, 8/1/33 | 74,593 | 83,967 | ||||
| FNMA, 5.00%, 11/1/33 | 198,642 | 219,835 | ||||
| FNMA, 5.50%, 1/1/34 | 68,376 | 76,986 | ||||
| FNMA, 5.00%, 4/1/35 | 162,589 | 179,539 | ||||
| FNMA, 4.50%, 9/1/35 | 103,112 | 111,876 | ||||
| FNMA, 5.00%, 2/1/36 | 163,170 | 180,105 | ||||
| FNMA, 5.50%, 1/1/37 | 119,376 | 133,610 | ||||
| FNMA, 5.50%, 2/1/37 | 28,763 | 32,187 | ||||
| FNMA, 6.00%, 7/1/37 | 158,749 | 179,496 | ||||
| FNMA, 6.50%, 8/1/37 | 48,852 | 54,194 | ||||
| FNMA, 5.00%, 4/1/40 | 256,159 | 282,689 | ||||
| FNMA, 5.00%, 6/1/40 | 196,904 | 217,271 | ||||
| FNMA, 3.50%, 1/1/41 | 503,422 | 520,654 | ||||
| FNMA, 4.00%, 1/1/41 | 684,408 | 730,506 | ||||
| FNMA, 4.50%, 1/1/41 | 272,587 | 297,913 | ||||
25
| Shares/ Principal Amount | Value | |||||
| FNMA, 4.00%, 5/1/41 | $ | 171,384 | $ | 181,946 | ||
| FNMA, 5.00%, 6/1/41 | 217,581 | 240,141 | ||||
| FNMA, 4.50%, 7/1/41 | 211,135 | 229,697 | ||||
| FNMA, 4.50%, 9/1/41 | 55,399 | 59,960 | ||||
| FNMA, 4.00%, 12/1/41 | 268,921 | 286,360 | ||||
| FNMA, 4.00%, 1/1/42 | 298,206 | 316,531 | ||||
| FNMA, 4.00%, 1/1/42 | 76,188 | 80,842 | ||||
| FNMA, 3.50%, 5/1/42 | 501,308 | 518,481 | ||||
| FNMA, 3.50%, 6/1/42 | 113,485 | 117,437 | ||||
| FNMA, 3.50%, 5/1/45 | 968,590 | 1,000,880 | ||||
| FNMA, 6.50%, 8/1/47 | 6,943 | 7,720 | ||||
| FNMA, 6.50%, 8/1/47 | 2,832 | 3,151 | ||||
| FNMA, 6.50%, 9/1/47 | 12,975 | 14,449 | ||||
| FNMA, 6.50%, 9/1/47 | 717 | 798 | ||||
| FNMA, 6.50%, 9/1/47 | 4,874 | 5,425 | ||||
| FNMA, 6.50%, 9/1/47 | 7,085 | 7,889 | ||||
| FNMA, 6.50%, 9/1/47 | 1,892 | 2,105 | ||||
GNMA, 3.50%, 1/21/16(4) | 525,000 | 547,151 | ||||
GNMA, 4.00%, 1/21/16(4) | 546,000 | 579,725 | ||||
| GNMA, 7.00%, 4/20/26 | 14,799 | 17,282 | ||||
| GNMA, 7.50%, 8/15/26 | 9,335 | 11,124 | ||||
| GNMA, 7.00%, 2/15/28 | 3,781 | 3,829 | ||||
| GNMA, 7.50%, 2/15/28 | 3,769 | 3,839 | ||||
| GNMA, 6.50%, 5/15/28 | 778 | 891 | ||||
| GNMA, 6.50%, 5/15/28 | 2,041 | 2,337 | ||||
| GNMA, 7.00%, 12/15/28 | 5,660 | 5,870 | ||||
| GNMA, 7.00%, 5/15/31 | 27,745 | 33,081 | ||||
| GNMA, 5.50%, 11/15/32 | 74,705 | 84,951 | ||||
| GNMA, 4.50%, 1/15/40 | 73,875 | 79,842 | ||||
| GNMA, 4.50%, 5/20/41 | 196,786 | 214,418 | ||||
| GNMA, 4.50%, 6/15/41 | 93,783 | 102,973 | ||||
| GNMA, 4.00%, 12/15/41 | 344,717 | 365,932 | ||||
| GNMA, 3.50%, 7/20/42 | 134,279 | 140,401 | ||||
| 10,639,447 | ||||||
TOTAL U.S. GOVERNMENT AGENCY MORTGAGE-BACKED SECURITIES (Cost $12,160,101) | 12,417,402 | |||||
| U.S. TREASURY SECURITIES — 10.8% | ||||||
| U.S. Treasury Bonds, 4.75%, 2/15/37 | 140,000 | 185,342 | ||||
| U.S. Treasury Bonds, 3.50%, 2/15/39 | 480,000 | 530,106 | ||||
| U.S. Treasury Bonds, 4.375%, 11/15/39 | 510,000 | 640,311 | ||||
| U.S. Treasury Bonds, 3.125%, 11/15/41 | 50,000 | 51,568 | ||||
| U.S. Treasury Bonds, 2.75%, 11/15/42 | 650,000 | 618,652 | ||||
| U.S. Treasury Bonds, 2.875%, 5/15/43 | 450,000 | 437,991 | ||||
| U.S. Treasury Bonds, 3.125%, 8/15/44 | 270,000 | 275,476 | ||||
| U.S. Treasury Bonds, 3.00%, 11/15/44 | 180,000 | 179,051 | ||||
| U.S. Treasury Bonds, 2.50%, 2/15/45 | 80,000 | 71,653 | ||||
| U.S. Treasury Notes, 0.75%, 10/31/17 | 300,000 | 298,456 | ||||
26
| Shares/ Principal Amount | Value | |||||
| U.S. Treasury Notes, 1.00%, 2/15/18 | $ | 970,000 | $ | 967,188 | ||
| U.S. Treasury Notes, 1.00%, 3/15/18 | 500,000 | 498,376 | ||||
| U.S. Treasury Notes, 2.625%, 4/30/18 | 85,000 | 87,907 | ||||
| U.S. Treasury Notes, 1.375%, 9/30/18 | 700,000 | 702,445 | ||||
| U.S. Treasury Notes, 1.25%, 11/15/18 | 1,200,000 | 1,198,405 | ||||
| U.S. Treasury Notes, 1.625%, 7/31/19 | 250,000 | 250,956 | ||||
| U.S. Treasury Notes, 1.50%, 10/31/19 | 1,850,000 | 1,844,789 | ||||
| U.S. Treasury Notes, 1.50%, 11/30/19 | 450,000 | 448,347 | ||||
| U.S. Treasury Notes, 1.25%, 1/31/20 | 200,000 | 196,980 | ||||
| U.S. Treasury Notes, 1.375%, 2/29/20 | 150,000 | 148,324 | ||||
| U.S. Treasury Notes, 1.375%, 3/31/20 | 200,000 | 197,602 | ||||
| U.S. Treasury Notes, 1.375%, 4/30/20 | 200,000 | 197,478 | ||||
| U.S. Treasury Notes, 1.375%, 9/30/20 | 800,000 | 786,449 | ||||
| U.S. Treasury Notes, 1.375%, 10/31/20 | 700,000 | 687,874 | ||||
| U.S. Treasury Notes, 2.00%, 11/30/20 | 250,000 | 252,645 | ||||
| U.S. Treasury Notes, 2.00%, 10/31/21 | 150,000 | 150,470 | ||||
| U.S. Treasury Notes, 2.00%, 2/15/25 | 450,000 | 439,922 | ||||
| U.S. Treasury Notes, 2.00%, 8/15/25 | 250,000 | 243,775 | ||||
TOTAL U.S. TREASURY SECURITIES (Cost $12,488,940) | 12,588,538 | |||||
COLLATERALIZED MORTGAGE OBLIGATIONS(3) — 2.1% | ||||||
| Private Sponsor Collateralized Mortgage Obligations — 2.0% | ||||||
| ABN Amro Mortgage Corp., Series 2003-4, Class A4, 5.50%, 3/25/33 | 6,759 | 7,096 | ||||
| Adjustable Rate Mortgage Trust, Series 2004-4, Class 4A1, VRN, 2.76%, 1/1/16 | 61,612 | 61,649 | ||||
| Banc of America Alternative Loan Trust, Series 2007-2, Class 2A4, 5.75%, 6/25/37 | 84,627 | 68,129 | ||||
| Banc of America Mortgage Securities, Inc., Series 2003-G, Class 2A1, VRN, 2.77%, 1/1/16 | 19,576 | 19,473 | ||||
| Banc of America Mortgage Securities, Inc., Series 2004-7, Class 7A1, 5.00%, 8/25/19 | 6,474 | 6,465 | ||||
| Banc of America Mortgage Securities, Inc., Series 2004-E, Class 2A6 SEQ, VRN, 2.86%, 1/1/16 | 59,788 | 59,341 | ||||
| Banc of America Mortgage Securities, Inc., Series 2005-1, Class 1A15, 5.50%, 2/25/35 | 18,164 | 18,953 | ||||
| Citigroup Mortgage Loan Trust, Inc., Series 2004-UST1, Class A4, VRN, 2.29%, 1/1/16 | 77,271 | 76,796 | ||||
| Citigroup Mortgage Loan Trust, Inc., Series 2004-UST1, Class A5, VRN, 2.07%, 1/1/16 | 47,264 | 46,679 | ||||
| Citigroup Mortgage Loan Trust, Inc., Series 2005-4, Class A, VRN, 2.78%, 1/1/16 | 16,620 | 16,451 | ||||
| Citigroup Mortgage Loan Trust, Inc., Series 2005-6, Class A2, VRN, 2.42%, 1/1/16 | 47,577 | 47,888 | ||||
| Countrywide Home Loan Mortgage Pass-Through Trust, Series 2005-17, Class 1A11, 5.50%, 9/25/35 | 2,521 | 2,490 | ||||
| Credit Suisse First Boston Mortgage Securities Corp., Series 2003-AR28, Class 2A1, VRN, 2.60%, 1/1/16 | 86,714 | 85,596 | ||||
| First Horizon Alternative Mortgage Securities Trust, Series 2004-AA4, Class A1, VRN, 2.36%, 1/1/16 | 20,118 | 19,929 | ||||
| First Horizon Mortgage Pass-Through Trust, Series 2005-AR3, Class 4A1, VRN, 2.59%, 1/1/16 | 23,530 | 22,601 | ||||
27
| Shares/ Principal Amount | Value | |||||
| GSR Mortgage Loan Trust, Series 2004-7, Class 3A1, VRN, 2.31%, 1/1/16 | $ | 49,447 | $ | 48,222 | ||
| GSR Mortgage Loan Trust, Series 2004-AR5, Class 3A3, VRN, 2.69%, 1/1/16 | 40,246 | 40,014 | ||||
| GSR Mortgage Loan Trust, Series 2005-AR1, Class 3A1, VRN, 2.74%, 1/1/16 | 62,015 | 61,587 | ||||
| GSR Mortgage Loan Trust, Series 2005-AR6, Class 2A1, VRN, 2.81%, 1/1/16 | 90,636 | 92,959 | ||||
| GSR Mortgage Loan Trust, Series 2005-AR6, Class 4A5, VRN, 2.81%, 1/1/16 | 43,397 | 43,798 | ||||
| JPMorgan Mortgage Trust, Series 2005-A4, Class 1A1, VRN, 2.53%, 1/1/16 | 25,360 | 25,116 | ||||
| JPMorgan Mortgage Trust, Series 2005-A4, Class 2A1, VRN, 2.68%, 1/1/16 | 15,898 | 15,839 | ||||
| JPMorgan Mortgage Trust, Series 2006-A3, Class 7A1, VRN, 2.69%, 1/1/16 | 31,185 | 31,447 | ||||
JPMorgan Mortgage Trust, Series 2013-1, Class 2A2 SEQ, VRN, 2.50%, 1/1/16(2) | 55,383 | 54,934 | ||||
| MASTR Adjustable Rate Mortgages Trust, Series 2004-13, Class 3A7, VRN, 2.77%, 1/1/16 | 72,993 | 74,862 | ||||
| MASTR Asset Securitization Trust, Series 2003-10, Class 3A1, 5.50%, 11/25/33 | 13,896 | 14,337 | ||||
| Merrill Lynch Mortgage Investors Trust, Series 2005-3, Class 2A, VRN, 2.31%, 1/25/16 | 32,521 | 32,195 | ||||
| Merrill Lynch Mortgage Investors Trust, Series 2005-A2, Class A1, VRN, 2.50%, 1/1/16 | 64,626 | 63,531 | ||||
| PHHMC Mortgage Pass-Through Certificates, Series 2007-6, Class A1, VRN, 5.39%, 1/1/16 | 11,387 | 11,371 | ||||
| Sequoia Mortgage Trust, Series 2012-1, Class 1A1, VRN, 2.87%, 1/1/16 | 20,787 | 20,900 | ||||
Sequoia Mortgage Trust, Series 2013-12, Class A1 SEQ, 4.00%, 12/25/43(2) | 35,131 | 36,007 | ||||
| Structured Adjustable Rate Mortgage Loan Trust, Series 2004-6, Class 3A2, VRN, 2.54%, 1/1/16 | 20,072 | 20,111 | ||||
| Structured Adjustable Rate Mortgage Loan Trust, Series 2004-8, Class 2A1, VRN, 2.48%, 1/1/16 | 123,373 | 123,328 | ||||
| Thornburg Mortgage Securities Trust, Series 2004-3, Class A, VRN, 1.16%, 1/25/16 | 26,756 | 24,904 | ||||
| WaMu Mortgage Pass-Through Certificates, Series 2005-AR3, Class A1, VRN, 2.44%, 1/1/16 | 145,943 | 145,181 | ||||
| Wells Fargo Mortgage-Backed Securities Trust, Series 2004-K, Class 2A6, VRN, 2.74%, 1/1/16 | 9,520 | 9,617 | ||||
| Wells Fargo Mortgage-Backed Securities Trust, Series 2004-S, Class A1, VRN, 2.74%, 1/1/16 | 34,030 | 34,909 | ||||
| Wells Fargo Mortgage-Backed Securities Trust, Series 2004-Z, Class 2A2, VRN, 2.85%, 1/1/16 | 40,881 | 40,946 | ||||
| Wells Fargo Mortgage-Backed Securities Trust, Series 2005-17, Class 1A1, 5.50%, 1/25/36 | 26,964 | 27,519 | ||||
| Wells Fargo Mortgage-Backed Securities Trust, Series 2005-3, Class A12, 5.50%, 5/25/35 | 25,795 | 26,293 | ||||
| Wells Fargo Mortgage-Backed Securities Trust, Series 2005-9, Class 2A6, 5.25%, 10/25/35 | 49,006 | 51,545 | ||||
| Wells Fargo Mortgage-Backed Securities Trust, Series 2005-AR10, Class 1A1, VRN, 2.74%, 1/1/16 | 110,529 | 113,111 | ||||
| Wells Fargo Mortgage-Backed Securities Trust, Series 2005-AR10, Class 2A15, VRN, 2.74%, 1/1/16 | 35,441 | 36,499 | ||||
28
| Shares/ Principal Amount | Value | |||||
| Wells Fargo Mortgage-Backed Securities Trust, Series 2005-AR10, Class 2A17, VRN, 2.74%, 1/1/16 | $ | 68,595 | $ | 69,992 | ||
| Wells Fargo Mortgage-Backed Securities Trust, Series 2005-AR14, Class A1, VRN, 2.74%, 1/1/16 | 13,251 | 13,128 | ||||
| Wells Fargo Mortgage-Backed Securities Trust, Series 2005-AR16, Class 1A1, VRN, 2.74%, 1/1/16 | 26,173 | 26,676 | ||||
| Wells Fargo Mortgage-Backed Securities Trust, Series 2005-AR16, Class 3A2, VRN, 2.71%, 1/1/16 | 30,466 | 30,754 | ||||
| Wells Fargo Mortgage-Backed Securities Trust, Series 2005-AR2, Class 3A1, VRN, 2.64%, 1/1/16 | 20,000 | 20,242 | ||||
| Wells Fargo Mortgage-Backed Securities Trust, Series 2005-AR7, Class 1A1, VRN, 2.74%, 1/1/16 | 66,295 | 66,466 | ||||
| Wells Fargo Mortgage-Backed Securities Trust, Series 2006-10, Class A4 SEQ, 6.00%, 8/25/36 | 37,502 | 38,257 | ||||
| Wells Fargo Mortgage-Backed Securities Trust, Series 2006-13, Class A5, 6.00%, 10/25/36 | 26,939 | 27,876 | ||||
| Wells Fargo Mortgage-Backed Securities Trust, Series 2007-13, Class A1, 6.00%, 9/25/37 | 21,914 | 22,563 | ||||
| Wells Fargo Mortgage-Backed Securities Trust, Series 2007-14, Class 2A2, 5.50%, 10/25/22 | 19,586 | 20,233 | ||||
| Wells Fargo Mortgage-Backed Securities Trust, Series 2007-16, Class 1A1, 6.00%, 12/28/37 | 9,627 | 10,040 | ||||
| Wells Fargo Mortgage-Backed Securities Trust, Series 2007-AR10, Class 1A1, VRN, 6.26%, 1/1/16 | 24,354 | 24,171 | ||||
| Wells Fargo Mortgage-Backed Securities Trust, Series 2008-1, Class 4A1, 5.75%, 2/25/38 | 50,342 | 53,250 | ||||
| 2,304,266 | ||||||
| U.S. Government Agency Collateralized Mortgage Obligations — 0.1% | ||||||
| FHLMC, Series 2926, Class EW SEQ, 5.00%, 1/15/25 | 91,230 | 98,423 | ||||
| FNMA, Series 2014-M3, Class ASQ2, 0.56%, 3/25/16 | 436 | 436 | ||||
| 98,859 | ||||||
TOTAL COLLATERALIZED MORTGAGE OBLIGATIONS (Cost $2,414,557) | 2,403,125 | |||||
COMMERCIAL MORTGAGE-BACKED SECURITIES(3) — 2.0% | ||||||
Bank of America Merrill Lynch Commercial Mortgage Securities Trust, Series 2012-PARK, Class A SEQ, 2.96%, 12/10/30(2) | 150,000 | 149,560 | ||||
Bank of America Merrill Lynch Commercial Mortgage Securities Trust, Series 2014-ICTS, Class A, VRN, 1.13%, 1/15/16(2) | 125,000 | 124,517 | ||||
Bank of America Merrill Lynch Commercial Mortgage Securities Trust, Series 2015-200P, Class B, 3.49%, 4/14/33(2) | 100,000 | 98,463 | ||||
BLCP Hotel Trust, Series 2014-CLRN, Class A, VRN, 1.28%, 1/15/16(2) | 216,050 | 212,711 | ||||
Commercial Mortgage Pass-Through Certificates, Series 2014-BBG, Class A, VRN, 1.13%, 1/15/16(2) | 150,000 | 148,508 | ||||
| Commercial Mortgage Pass-Through Certificates, Series 2014-CR15, Class AM SEQ, 4.43%, 2/10/47 | 125,000 | 133,804 | ||||
| Commercial Mortgage Pass-Through Certificates, Series 2014-LC17, Class AM, VRN, 4.19%, 1/1/16 | 125,000 | 131,228 | ||||
| Commercial Mortgage Pass-Through Certificates, Series 2014-UBS5, Class AM, 4.19%, 9/10/47 | 150,000 | 156,535 | ||||
Commercial Mortgage Pass-Through Certificates, Series 2015-3BP, Class B, VRN, 3.24%, 1/1/16(2) | 50,000 | 48,714 | ||||
| Commercial Mortgage Pass-Through Certificates, Series 2015-CR22, Class AM, 3.60%, 3/10/48 | 100,000 | 99,638 | ||||
Core Industrial Trust, Series 2015-WEST, Class A SEQ, 3.29%, 2/10/37(2) | 175,000 | 172,774 | ||||
29
| Shares/ Principal Amount | Value | |||||
Irvine Core Office Trust, Series 2013-IRV, Class A2 SEQ, VRN, 3.17%, 1/10/16(2) | $ | 275,000 | $ | 274,408 | ||
| JPMBB Commercial Mortgage Securities Trust, Series 2014-C21, Class B, VRN, 4.34%, 1/1/16 | 75,000 | 76,975 | ||||
| JPMorgan Chase Commercial Mortgage Securities Trust, Series 2013-C16, Class A4, 4.17%, 12/15/46 | 50,000 | 53,339 | ||||
| JPMorgan Chase Commercial Mortgage Securities Trust, Series 2013-C16, Class AS, 4.52%, 12/15/46 | 75,000 | 80,113 | ||||
JPMorgan Chase Commercial Mortgage Securities Trust, Series 2014-CBM, Class A, VRN, 1.23%, 1/15/16(2) | 150,000 | 149,267 | ||||
Morgan Stanley Capital I Trust, Series 2014-CPT, Class A SEQ, 3.35%, 7/13/29(2) | 125,000 | 127,776 | ||||
Morgan Stanley Capital I Trust, Series 2014-CPT, Class C, VRN, 3.45%, 1/1/16(2) | 125,000 | 125,431 | ||||
TOTAL COMMERCIAL MORTGAGE-BACKED SECURITIES (Cost $2,368,162) | 2,363,761 | |||||
ASSET-BACKED SECURITIES(3) — 1.8% | ||||||
Avis Budget Rental Car Funding AESOP LLC, Series 2012-2A, Class A SEQ, 2.80%, 5/20/18(2) | 100,000 | 101,176 | ||||
Avis Budget Rental Car Funding AESOP LLC, Series 2015-2A, Class A, 2.63%, 12/20/21(2) | 100,000 | 98,865 | ||||
| Barclays Dryrock Issuance Trust, Series 2014-1, Class A, VRN, 0.69%, 1/15/16 | 125,000 | 124,912 | ||||
BMW Floorplan Master Owner Trust, Series 2015-1A, Class A, VRN, 0.83%, 1/15/16(2) | 125,000 | 124,299 | ||||
Chesapeake Funding LLC, Series 2014-1A, Class A, VRN, 0.69%, 1/7/16(2) | 114,646 | 114,275 | ||||
Dell Equipment Finance Trust, Series 2015-2, Class A2B, VRN, 1.31%, 1/22/16(2) | 100,000 | 100,035 | ||||
Enterprise Fleet Financing LLC, Series 2014-1, Class A2 SEQ, 0.87%, 9/20/19(2) | 38,210 | 38,093 | ||||
Enterprise Fleet Financing LLC, Series 2015-2, Class A2 SEQ, 1.59%, 2/22/21(2) | 150,000 | 149,064 | ||||
| Harley-Davidson Motorcycle Trust, Series 2014-1, Class A2B, VRN, 0.50%, 1/15/16 | 47,002 | 46,959 | ||||
Hertz Fleet Lease Funding LP, Series 2014-1, Class A, VRN, 0.69%, 1/11/16(2) | 120,100 | 119,819 | ||||
Hilton Grand Vacations Trust, Series 2013-A, Class A SEQ, 2.28%, 1/25/26(2) | 36,191 | 35,757 | ||||
Hilton Grand Vacations Trust, Series 2014-AA, Class A SEQ, 1.77%, 11/25/26(2) | 151,080 | 148,330 | ||||
Invitation Homes Trust, Series 2014-SFR1, Class A, VRN, 1.35%, 1/17/16(2) | 75,000 | 73,554 | ||||
Invitation Homes Trust, Series 2015-SFR1, Class A, VRN, 1.80%, 1/17/16(2) | 98,100 | 97,223 | ||||
| John Deere Owner Trust, Series 2014-A, Class A3 SEQ, 0.92%, 4/16/18 | 94,576 | 94,386 | ||||
MVW Owner Trust, Series 2014-1A, Class A, 2.25%, 9/22/31(2) | 73,826 | 73,112 | ||||
MVW Owner Trust, Series 2015-1A, Class A SEQ, 2.52%, 12/20/32(2) | 91,817 | 90,603 | ||||
Sierra Timeshare Receivables Funding LLC, Series 2014-1A, Class A SEQ, 2.07%, 3/20/30(2) | 122,987 | 122,008 | ||||
Sierra Timeshare Receivables Funding LLC, Series 2015-1A, Class A, 2.40%, 3/22/32(2) | 79,219 | 78,342 | ||||
| Toyota Auto Receivables Owner Trust, Series 2015-C, Class A2B, VRN, 0.66%, 1/15/16 | 125,000 | 124,974 | ||||
30
| Shares/ Principal Amount | Value | |||||
| US Airways Pass-Through Trust, Series 2013-1, Class A, 3.95%, 5/15/27 | $ | 18,092 | $ | 18,251 | ||
Volvo Financial Equipment LLC, Series 2015-1A, Class A2, 0.95%, 11/15/17(2) | 99,056 | 98,967 | ||||
TOTAL ASSET-BACKED SECURITIES (Cost $2,085,352) | 2,073,004 | |||||
| MUNICIPAL SECURITIES — 0.6% | ||||||
| Bay Area Toll Authority Toll Bridge Rev., Series 2010 S-1, (Building Bonds), 6.92%, 4/1/40 | 40,000 | 52,829 | ||||
| California GO, (Building Bonds), 7.55%, 4/1/39 | 20,000 | 29,149 | ||||
| California GO, (Building Bonds), 7.30%, 10/1/39 | 30,000 | 42,023 | ||||
| California GO, (Building Bonds), 7.60%, 11/1/40 | 5,000 | 7,452 | ||||
| Illinois GO, (Taxable Pension), 5.10%, 6/1/33 | 40,000 | 37,972 | ||||
| Los Angeles Community College District GO, Series 2010 D, (Election of 2008), 6.68%, 8/1/36 | 20,000 | 26,255 | ||||
| Los Angeles Department of Water & Power Rev., (Building Bonds), 5.72%, 7/1/39 | 20,000 | 24,162 | ||||
| Metropolitan Transportation Authority Rev., Series 2010 E, (Building Bonds), 6.81%, 11/15/40 | 15,000 | 19,917 | ||||
| Missouri Highways & Transportation Commission Rev., (Building Bonds), 5.45%, 5/1/33 | 40,000 | 46,914 | ||||
| New Jersey State Turnpike Authority Rev., Series 2009 F, (Building Bonds), 7.41%, 1/1/40 | 40,000 | 56,994 | ||||
| New Jersey State Turnpike Authority Rev., Series 2010 A, (Building Bonds), 7.10%, 1/1/41 | 20,000 | 27,617 | ||||
| Ohio Water Development Authority Pollution Control Rev., Series 2010 B-2, (Building Bonds), 4.88%, 12/1/34 | 30,000 | 33,711 | ||||
| Oregon State Department of Transportation Highway User Tax Rev., Series 2010 A, (Building Bonds), 5.83%, 11/15/34 | 20,000 | 25,195 | ||||
| Port Authority of New York & New Jersey Rev., (Consolidated Bonds), 4.46%, 10/1/62 | 45,000 | 43,005 | ||||
| Rutgers State University Rev., Series 2010 H, (Building Bonds), 5.67%, 5/1/40 | 40,000 | 47,669 | ||||
| Sacramento Municipal Utility District Electric Rev., Series 2010 W, (Building Bonds), 6.16%, 5/15/36 | 25,000 | 30,455 | ||||
| Salt River Agricultural Improvement & Power District Electric Rev., Series 2010 A, (Building Bonds), 4.84%, 1/1/41 | 25,000 | 28,565 | ||||
| San Francisco City & County Public Utilities Water Commission Rev., Series 2010 B, (Building Bonds), 6.00%, 11/1/40 | 25,000 | 30,483 | ||||
| San Francisco City & County Public Utilities Water Commission Rev., Series 2010 FG, (Building Bonds), 6.95%, 11/1/50 | 20,000 | 28,051 | ||||
| Santa Clara Valley Transportation Authority Sales Tax Rev., Series 2010 A, (Building Bonds), 5.88%, 4/1/32 | 30,000 | 36,049 | ||||
TOTAL MUNICIPAL SECURITIES (Cost $581,200) | 674,467 | |||||
| U.S. GOVERNMENT AGENCY SECURITIES — 0.5% | ||||||
| FNMA, 2.625%, 9/6/24 | 90,000 | 91,117 | ||||
| FNMA, 6.625%, 11/15/30 | 330,000 | 468,288 | ||||
TOTAL U.S. GOVERNMENT AGENCY SECURITIES (Cost $523,367) | 559,405 | |||||
| SOVEREIGN GOVERNMENTS AND AGENCIES — 0.4% | ||||||
Canada† | ||||||
| Province of Ontario Canada, 1.00%, 7/22/16 | 30,000 | 30,012 | ||||
31
| Shares/ Principal Amount | Value | |||||
Colombia† | ||||||
| Colombia Government International Bond, 4.375%, 7/12/21 | $ | 30,000 | $ | 30,225 | ||
Italy† | ||||||
| Italy Government International Bond, 6.875%, 9/27/23 | 30,000 | 36,969 | ||||
| Mexico — 0.2% | ||||||
| Mexico Government International Bond, MTN, 5.95%, 3/19/19 | 120,000 | 133,350 | ||||
| Mexico Government International Bond, 5.125%, 1/15/20 | 70,000 | 76,475 | ||||
| Mexico Government International Bond, MTN, 4.75%, 3/8/44 | 60,000 | 54,810 | ||||
| 264,635 | ||||||
| Peru — 0.1% | ||||||
| Peruvian Government International Bond, 6.55%, 3/14/37 | 10,000 | 11,600 | ||||
| Peruvian Government International Bond, 5.625%, 11/18/50 | 30,000 | 30,675 | ||||
| 42,275 | ||||||
| Poland — 0.1% | ||||||
| Poland Government International Bond, 5.125%, 4/21/21 | 35,000 | 39,029 | ||||
| Poland Government International Bond, 3.00%, 3/17/23 | 10,000 | 9,919 | ||||
| 48,948 | ||||||
South Korea† | ||||||
| Korea Development Bank (The), 3.25%, 3/9/16 | 20,000 | 20,082 | ||||
Uruguay† | ||||||
| Uruguay Government International Bond, 4.125%, 11/20/45 | 20,000 | 15,600 | ||||
TOTAL SOVEREIGN GOVERNMENTS AND AGENCIES (Cost $474,798) | 488,746 | |||||
| TEMPORARY CASH INVESTMENTS — 1.1% | ||||||
| SSgA U.S. Government Money Market Fund, Class N | 596,913 | 596,913 | ||||
| State Street Institutional Liquid Reserves Fund, Premier Class | 637,705 | 637,705 | ||||
TOTAL TEMPORARY CASH INVESTMENTS (Cost $1,234,618) | 1,234,618 | |||||
TOTAL INVESTMENT SECURITIES — 102.1% (Cost $109,384,145) | 119,103,786 | |||||
| OTHER ASSETS AND LIABILITIES — (2.1)% | (2,400,634) | |||||
| TOTAL NET ASSETS — 100.0% | $ | 116,703,152 | ||||
| NOTES TO SCHEDULE OF INVESTMENTS | ||
| FHLMC | - | Federal Home Loan Mortgage Corporation |
| FNMA | - | Federal National Mortgage Association |
| GNMA | - | Government National Mortgage Association |
| GO | - | General Obligation |
| MTN | - | Medium Term Note |
| SEQ | - | Sequential Payer |
| VRN | - | Variable Rate Note. Interest reset date is indicated. Rate shown is effective at the period end. |
| † | Category is less than 0.05% of total net assets. |
| (1) | Non-income producing. |
| (2) | Security was purchased pursuant to Rule 144A under the Securities Act of 1933 and may be sold in transactions exempt from registration only to qualified institutional investors. The aggregate value of these securities at the period end was $4,234,808, which represented 3.6% of total net assets. |
| (3) | Final maturity date indicated, unless otherwise noted. |
| (4) | Forward commitment. Settlement date is indicated. |
See Notes to Financial Statements.
32
| Statement of Assets and Liabilities |
| DECEMBER 31, 2015 | |||
| Assets | |||
| Investment securities, at value (cost of $109,384,145) | $ | 119,103,786 | |
| Receivable for investments sold | 23,610 | ||
| Receivable for capital shares sold | 4,437 | ||
| Dividends and interest receivable | 397,353 | ||
| 119,529,186 | |||
| Liabilities | |||
| Payable for investments purchased | 2,637,628 | ||
| Payable for capital shares redeemed | 106,404 | ||
| Accrued management fees | 82,002 | ||
| 2,826,034 | |||
| Net Assets | $ | 116,703,152 | |
| Class I Capital Shares, $0.01 Par Value | |||
| Shares authorized | 150,000,000 | ||
| Shares outstanding | 16,835,409 | ||
| Net Asset Value Per Share | $ | 6.93 | |
| Net Assets Consist of: | |||
| Capital (par value and paid-in surplus) | $ | 102,293,660 | |
| Undistributed net investment income | 87,001 | ||
| Undistributed net realized gain | 4,602,850 | ||
| Net unrealized appreciation | 9,719,641 | ||
| $ | 116,703,152 | ||
See Notes to Financial Statements.
33
| Statement of Operations |
| YEAR ENDED DECEMBER 31, 2015 | |||
| Investment Income (Loss) | |||
| Income: | |||
| Dividends (net of foreign taxes withheld of $514) | $ | 1,600,049 | |
| Interest | 1,384,377 | ||
| 2,984,426 | |||
| Expenses: | |||
| Management fees | 1,122,373 | ||
| Directors' fees and expenses | 4,531 | ||
| Other expenses | 1,318 | ||
| 1,128,222 | |||
| Fees waived | (114,770 | ) | |
| 1,013,452 | |||
| Net investment income (loss) | 1,970,974 | ||
| Realized and Unrealized Gain (Loss) | |||
| Net realized gain (loss) on: | |||
| Investment transactions | 5,158,649 | ||
| Futures contract transactions | 5,921 | ||
| 5,164,570 | |||
| Change in net unrealized appreciation (depreciation) on investments | (10,228,986 | ) | |
| Net realized and unrealized gain (loss) | (5,064,416 | ) | |
| Net Increase (Decrease) in Net Assets Resulting from Operations | $ | (3,093,442 | ) |
See Notes to Financial Statements.
34
| Statement of Changes in Net Assets |
| YEARS ENDED DECEMBER 31, 2015 AND DECEMBER 31, 2014 | ||||||
| Increase (Decrease) in Net Assets | December 31, 2015 | December 31, 2014 | ||||
| Operations | ||||||
| Net investment income (loss) | $ | 1,970,974 | $ | 1,968,998 | ||
| Net realized gain (loss) | 5,164,570 | 12,264,822 | ||||
| Change in net unrealized appreciation (depreciation) | (10,228,986 | ) | (1,561,476 | ) | ||
| Net increase (decrease) in net assets resulting from operations | (3,093,442 | ) | 12,672,344 | |||
| Distributions to Shareholders | ||||||
| From net investment income | (2,144,865 | ) | (2,050,083 | ) | ||
| From net realized gains | (11,983,170 | ) | (11,618,914 | ) | ||
| Decrease in net assets from distributions | (14,128,035 | ) | (13,668,997 | ) | ||
| Capital Share Transactions | ||||||
| Proceeds from shares sold | 14,796,078 | 17,827,282 | ||||
| Proceeds from reinvestment of distributions | 14,128,035 | 13,668,997 | ||||
| Payments for shares redeemed | (33,154,807 | ) | (25,000,225 | ) | ||
| Net increase (decrease) in net assets from capital share transactions | (4,230,694 | ) | 6,496,054 | |||
| Net increase (decrease) in net assets | (21,452,171 | ) | 5,499,401 | |||
| Net Assets | ||||||
| Beginning of period | 138,155,323 | 132,655,922 | ||||
| End of period | $ | 116,703,152 | $ | 138,155,323 | ||
| Undistributed net investment income | $ | 87,001 | $ | 142,985 | ||
| Transactions in Shares of the Fund | ||||||
| Sold | 1,990,222 | 2,296,254 | ||||
| Issued in reinvestment of distributions | 1,946,658 | 1,828,353 | ||||
| Redeemed | (4,446,554 | ) | (3,207,224 | ) | ||
| Net increase (decrease) in shares of the fund | (509,674 | ) | 917,383 | |||
See Notes to Financial Statements.
35
| Notes to Financial Statements |
DECEMBER 31, 2015
1. Organization
American Century Variable Portfolios, Inc. (the corporation) is registered under the Investment Company Act of 1940, as amended (the 1940 Act), as an open-end management investment company and is organized as a Maryland corporation. VP Balanced Fund (the fund) is one fund in a series issued by the corporation. The fund is diversified as defined under the 1940 Act. The fund’s investment objective is to seek long-term capital growth and current income by investing approximately 60% of its assets in equity securities and the remainder in bonds and other fixed-income securities.
2. Significant Accounting Policies
The following is a summary of significant accounting policies consistently followed by the fund in preparation of its financial statements. The fund is an investment company and follows accounting and reporting guidance in accordance with accounting principles generally accepted in the United States of America. This may require management to make certain estimates and assumptions at the date of the financial statements. Actual results could differ from these estimates. Management evaluated the impact of events or transactions occurring through the date the financial statements were issued that would merit recognition or disclosure.
Investment Valuations — The fund determines the fair value of its investments and computes its net asset value per share at the close of regular trading (usually 4 p.m. Eastern time) on the New York Stock Exchange (NYSE) on each day the NYSE is open. The Board of Directors has adopted valuation policies and procedures to guide the investment advisor in the fund’s investment valuation process and to provide methodologies for the oversight of the fund’s pricing function.
Equity securities that are listed or traded on a domestic securities exchange are valued at the last reported sales price or at the official closing price as provided by the exchange. Equity securities traded on foreign securities exchanges are generally valued at the closing price of such securities on the exchange where primarily traded or at the close of the NYSE, if that is earlier. If no last sales price is reported, or if local convention or regulation so provides, the mean of the latest bid and asked prices may be used. Securities traded over-the-counter are valued at the mean of the latest bid and asked prices, the last sales price, or the official closing price.
Fixed income securities are valued at the evaluated mean as provided by independent pricing services or at the mean of the most recent bid and asked prices as provided by investment dealers. Corporate bonds, U.S. Treasury and Government Agency securities, convertible bonds, municipal securities, and sovereign governments and agencies are valued using market models that consider trade data, quotations from dealers and active market makers, relevant yield curve and spread data, creditworthiness, trade data or market information on comparable securities, and other relevant security specific information. Mortgage-related and asset-backed securities are valued based on models that consider trade data, prepayment and default projections, benchmark yield and spread data and estimated cash flows of each tranche of the issuer.
Open-end management investment companies are valued at the reported net asset value per share. Exchange-traded futures contracts are valued at the settlement price as provided by the appropriate clearing corporation.
If the fund determines that the market price for an investment is not readily available or the valuation methods mentioned above do not reflect an investment’s fair value, such investment is valued as determined in good faith by the Board of Directors or its delegate, in accordance with policies and procedures adopted by the Board of Directors. In its determination of fair value, the fund may review several factors including, but not limited to, market information regarding the specific investment or comparable investments and correlation with other investment types, futures indices or general market indicators. Circumstances that may cause the fund to use these procedures to value an investment include, but are not limited to: an investment has been declared in default or is distressed; trading in a security has been suspended during the trading day or a security is not actively trading on its principal exchange; prices received from a regular pricing source are deemed unreliable; or there is a foreign market holiday and no trading occurred.
36
The fund monitors for significant events occurring after the close of an investment’s primary exchange but before the fund’s net asset value per share is determined. Significant events may include, but are not limited to: corporate announcements and transactions; governmental action and political unrest that could impact a specific investment or an investment sector; or armed conflicts, natural disasters and similar events that could affect investments in a specific country or region. The fund also monitors for significant fluctuations between domestic and foreign markets, as evidenced by the U.S. market or such other indicators that the Board of Directors, or its delegate, deems appropriate. If significant fluctuations in foreign markets are identified, the fund may apply a model-derived factor to the closing price of equity securities traded on foreign securities exchanges. The factor is based on observable market data as provided by an independent pricing service.
Security Transactions — Security transactions are accounted for as of the trade date. Net realized gains and losses are determined on the identified cost basis, which is also used for federal income tax purposes.
Investment Income — Dividend income less foreign taxes withheld, if any, is recorded as of the ex-dividend date. Distributions received on securities that represent a return of capital or long-term capital gain are recorded as a reduction of cost of investments and/or as a realized gain. The fund may estimate the components of distributions received that may be considered nontaxable distributions or long-term capital gain distributions for income tax purposes. Interest income is recorded on the accrual basis and includes paydown gain (loss) and accretion of discounts and amortization of premiums. Inflation adjustments related to inflation-linked debt securities are reflected as interest income.
Forward Commitments — The fund may engage in securities transactions on a forward commitment basis. In these transactions, the securities’ prices and yields are fixed on the date of the commitment. The fund may sell a to-be-announced (TBA) security and at the same time make a commitment to purchase the same security at a future date at a specified price. Conversely, the fund may purchase a TBA security and at the same time make a commitment to sell the same security at a future date at a specified price. These types of transactions are known as “TBA roll” transactions and are accounted for as purchases and sales. The fund will segregate cash, cash equivalents or other appropriate liquid securities on its records in amounts sufficient to meet the purchase price.
Income Tax Status — It is the fund’s policy to distribute substantially all net investment income and net realized gains to shareholders and to otherwise qualify as a regulated investment company under provisions of the Internal Revenue Code. Accordingly, no provision has been made for income taxes. The fund files U.S. federal, state, local and non-U.S. tax returns as applicable. The fund's tax returns are subject to examination by the relevant taxing authority until expiration of the applicable statute of limitations, which is generally three years from the date of filing but can be longer in certain jurisdictions. At this time, management believes there are no uncertain tax positions which, based on their technical merit, would not be sustained upon examination and for which it is reasonably possible that the total amounts of unrecognized tax benefits will significantly change in the next twelve months.
Segregated Assets — In accordance with the 1940 Act, the fund segregates assets on its books and records to cover certain types of investments, including, but not limited to, futures contracts, forward commitments, when-issued securities, swap agreements and certain forward foreign currency exchange contracts. American Century Investment Management, Inc. (ACIM) (the investment advisor) monitors, on a daily basis, the securities segregated to ensure the fund designates a sufficient amount of liquid assets, marked-to-market daily. The fund may also receive assets or be required to pledge assets at the custodian bank or with a broker for margin requirements on futures contracts, forward commitments and swap agreements.
Distributions to Shareholders — Distributions from net investment income, if any, are generally declared and paid quarterly. Distributions from net realized gains, if any, are generally declared and paid annually.
Indemnifications — Under the corporation’s organizational documents, its officers and directors are indemnified against certain liabilities arising out of the performance of their duties to the fund. In addition, in the normal course of business, the fund enters into contracts that provide general indemnifications. The maximum exposure under these arrangements is unknown as this would involve future claims that may be made against a fund. The risk of material loss from such claims is considered by management to be remote.
3. Fees and Transactions with Related Parties
Certain officers and directors of the corporation are also officers and/or directors of American Century Companies, Inc. (ACC). The corporation’s investment advisor, ACIM, the corporation's distributor, American Century Investment Services, Inc., and the corporation’s transfer agent, American Century Services, LLC, are wholly owned, directly or indirectly, by ACC.
37
Management Fees — The corporation has entered into a management agreement with ACIM, under which ACIM provides the fund with investment advisory and management services in exchange for a single, unified management fee (the fee). The agreement provides that all expenses of managing and operating the fund, except distribution fees, brokerage expenses, taxes, interest, fees and expenses of the independent directors (including legal counsel fees), and extraordinary expenses, will be paid by ACIM. The fee is computed and accrued daily based on the daily net assets of the fund and paid monthly in arrears. The rate of the fee is determined by applying a fee rate calculation formula. This formula takes into account the fund’s assets as well as certain assets, if any, of other clients of the investment advisor outside the American Century Investments family of funds (such as subadvised funds and separate accounts) that have very similar investment teams and investment strategies (strategy assets). The annual management fee schedule ranges from 0.80% to 0.90%. From January 1, 2015 through July 31, 2015, the investment advisor voluntarily agreed to waive 0.10% of the fund's management fee. Effective August 1, 2015, the investment advisor voluntarily agreed to waive 0.08% of the fund's management fee. The investment advisor expects this waiver to continue until April 30, 2017 and cannot terminate it prior to such date without the approval of the Board of Directors. The effective annual management fee before waiver for the year ended December 31, 2015 was 0.90%. The effective annual management fee after waiver for the year ended December 31, 2015 was 0.81%.
Directors' Fees and Expenses — The Board of Directors is responsible for overseeing the investment advisor’s management and operations of the fund. The directors receive detailed information about the fund and its investment advisor regularly throughout the year, and meet at least quarterly with management of the investment advisor to review reports about fund operations. The fund’s officers do not receive compensation from the fund.
4. Investment Transactions
Purchases of investment securities, excluding short-term investments, for the year ended December 31, 2015 totaled $119,066,868, of which $45,303,417 represented U.S. Treasury and Government Agency obligations.
Sales of investment securities, excluding short-term investments, for the year ended December 31, 2015 totaled $131,644,829, of which $48,168,334 represented U.S. Treasury and Government Agency obligations.
5. Fair Value Measurements
The fund’s investments valuation process is based on several considerations and may use multiple inputs to determine the fair value of the investments held by the fund. In conformity with accounting principles generally accepted in the United States of America, the inputs used to determine a valuation are classified into three broad levels.
| • | Level 1 valuation inputs consist of unadjusted quoted prices in an active market for identical investments. |
| • | Level 2 valuation inputs consist of direct or indirect observable market data (including quoted prices for comparable investments, evaluations of subsequent market events, interest rates, prepayment speeds, credit risk, etc.). These inputs also consist of quoted prices for identical investments initially expressed in local currencies that are adjusted through translation into U.S. dollars. |
| • | Level 3 valuation inputs consist of unobservable data (including a fund’s own assumptions). |
The level classification is based on the lowest level input that is significant to the fair valuation measurement. The valuation inputs are not necessarily an indication of the risks associated with investing in these securities or other financial instruments. There were no significant transfers between levels during the period.
38
The following is a summary of the level classifications as of period end. The Schedule of Investments provides additional information on the fund’s portfolio holdings.
| Level 1 | Level 2 | Level 3 | ||||||
| Assets | ||||||||
| Investment Securities | ||||||||
| Common Stocks | $ | 69,264,215 | — | — | ||||
| Corporate Bonds | — | $ | 15,036,505 | — | ||||
| U.S. Government Agency Mortgage-Backed Securities | — | 12,417,402 | — | |||||
| U.S. Treasury Securities | — | 12,588,538 | — | |||||
| Collateralized Mortgage Obligations | — | 2,403,125 | — | |||||
| Commercial Mortgage-Backed Securities | — | 2,363,761 | — | |||||
| Asset-Backed Securities | — | 2,073,004 | — | |||||
| Municipal Securities | — | 674,467 | — | |||||
| U.S. Government Agency Securities | — | 559,405 | — | |||||
| Sovereign Governments and Agencies | — | 488,746 | — | |||||
| Temporary Cash Investments | 1,234,618 | — | — | |||||
| $ | 70,498,833 | $ | 48,604,953 | — | ||||
6. Derivative Instruments
Interest Rate Risk — The fund is subject to interest rate risk in the normal course of pursuing its investment objectives. The value of bonds generally declines as interest rates rise. A fund may enter into futures contracts based on a bond index or a specific underlying security. A fund may purchase futures contracts to gain exposure to increases in market value or sell futures contracts to protect against a decline in market value. Upon entering into a futures contract, a fund will segregate cash, cash equivalents or other appropriate liquid securities on its records in amounts sufficient to meet requirements. Subsequent payments (variation margin) are made or received daily, in cash, by a fund. The variation margin is equal to the daily change in the contract value and is recorded as unrealized gains and losses. A fund recognizes a realized gain or loss when the futures contract is closed or expires. Net realized and unrealized gains or losses occurring during the holding period of futures contracts are a component of net realized gain (loss) on futures contract transactions and change in net unrealized appreciation (depreciation) on futures contracts, respectively. One of the risks of entering into futures contracts is the possibility that the change in value of the contract may not correlate with the changes in value of the underlying securities. The fund's average exposure to interest rate risk derivative instruments held during the period was 6 contracts.
At period end, the fund did not have any derivative instruments disclosed on the Statement of Assets and Liabilities. For the year ended December 31, 2015, the effect of interest rate risk derivative instruments on the Statement of Operations was $5,921 in net realized gain (loss) on futures contract transactions.
7. Federal Tax Information
The tax character of distributions paid during the years ended December 31, 2015 and December 31, 2014 were as follows:
| 2015 | 2014 | |||||
| Distributions Paid From | ||||||
| Ordinary income | $ | 4,715,244 | $ | 7,044,135 | ||
| Long-term capital gains | $ | 9,412,791 | $ | 6,624,862 | ||
The book-basis character of distributions made during the year from net investment income or net realized gains may differ from their ultimate characterization for federal income tax purposes. These differences reflect the differing character of certain income items and net realized gains and losses for financial statement and tax purposes, and may result in reclassification among certain capital accounts on the financial statements.
39
As of December 31, 2015, the federal tax cost of investments and the components of distributable earnings on a tax-basis were as follows:
| Federal tax cost of investments | $ | 109,848,521 | |
| Gross tax appreciation of investments | $ | 11,938,672 | |
| Gross tax depreciation of investments | (2,683,407 | ) | |
| Net tax appreciation (depreciation) of investments | $ | 9,255,265 | |
| Other book-to-tax adjustments | $ | (5,257 | ) |
| Undistributed ordinary income | $ | 87,001 | |
| Accumulated long-term gains | $ | 5,072,483 | |
The difference between book-basis and tax-basis unrealized appreciation (depreciation) is attributable primarily to the tax deferral of losses on wash sales. Other book-to-tax adjustments are attributable primarily to the tax deferral of losses on straddle positions.
40
| Financial Highlights |
| For a Share Outstanding Throughout the Years Ended December 31 (except as noted) | |||||||||||||||||
| Per-Share Data | Ratios and Supplemental Data | ||||||||||||||||
| Income From Investment Operations: | Distributions From: | Ratio to Average Net Assets of: | |||||||||||||||
| Net Asset Value, Beginning of Period | Net Investment Income (Loss)(1) | Net Realized and Unrealized Gain (Loss) | Total From Investment Operations | Net Investment Income | Net Realized Gains | Total Distributions | Net Asset Value, End of Period | Total Return(2) | Operating Expenses | Operating Expenses (before expense waiver) | Net Investment Income (Loss) | Net Investment Income (Loss) (before expense waiver) | Portfolio Turnover Rate | Net Assets, End of Period (in thousands) | |||
| Class I | |||||||||||||||||
| 2015 | $7.97 | 0.12 | (0.29) | (0.17) | (0.13) | (0.74) | (0.87) | $6.93 | (2.57)% | 0.81% | 0.90% | 1.58% | 1.49% | 95% | $116,703 | ||
| 2014 | $8.08 | 0.11 | 0.62 | 0.73 | (0.12) | (0.72) | (0.84) | $7.97 | 9.85% | 0.86% | 0.90% | 1.47% | 1.43% | 67% | $138,155 | ||
| 2013 | $7.13 | 0.12 | 1.10 | 1.22 | (0.12) | (0.15) | (0.27) | $8.08 | 17.43% | 0.90% | 0.90% | 1.52% | 1.52% | 75% | $132,656 | ||
| 2012 | $6.51 | 0.14 | 0.63 | 0.77 | (0.15) | — | (0.15) | $7.13 | 11.80% | 0.90% | 0.90% | 1.99% | 1.99% | 84% | $119,822 | ||
| 2011 | $6.30 | 0.12 | 0.21 | 0.33 | (0.12) | — | (0.12) | $6.51 | 5.33% | 0.90% | 0.90% | 1.91% | 1.91% | 74% | $112,910 | ||
| Notes to Financial Highlights | ||||
| (1) | Computed using average shares outstanding throughout the period. |
| (2) | Total returns are calculated based on the net asset value of the last business day. Total returns for periods less than one year are not annualized. |
See Notes to Financial Statements.
41
| Report of Independent Registered Public Accounting Firm |
To the Board of Directors and Shareholders of American Century Variable Portfolios, Inc.:
We have audited the accompanying statement of assets and liabilities, including the schedule of investments, of VP Balanced Fund (the “Fund”), one of the funds constituting American Century Variable Portfolios, Inc., as of December 31, 2015, and the related statement of operations for the year then ended, the statements of changes in net assets for each of the two years in the period then ended, and the financial highlights for each of the periods presented. These financial statements and financial highlights are the responsibility of the Fund’s management. Our responsibility is to express an opinion on these financial statements and financial highlights based on our audits.
We conducted our audits in accordance with the standards of the Public Company Accounting Oversight Board (United States). Those standards require that we plan and perform the audit to obtain reasonable assurance about whether the financial statements and financial highlights are free of material misstatement. The Fund is not required to have, nor were we engaged to perform, an audit of its internal control over financial reporting. Our audits included consideration of internal control over financial reporting as a basis for designing audit procedures that are appropriate in the circumstances, but not for the purpose of expressing an opinion on the effectiveness of the Fund’s internal control over financial reporting. Accordingly, we express no such opinion. An audit also includes examining, on a test basis, evidence supporting the amounts and disclosures in the financial statements, assessing the accounting principles used and significant estimates made by management, as well as evaluating the overall financial statement presentation. Our procedures included confirmation of securities owned as of December 31, 2015, by correspondence with the custodian and brokers; when replies were not received from brokers, we performed other auditing procedures. We believe that our audits provide a reasonable basis for our opinion.
In our opinion, the financial statements and financial highlights referred to above present fairly, in all material respects, the financial position of VP Balanced Fund of American Century Variable Portfolios, Inc. as of December 31, 2015, the results of its operations for the year then ended, the changes in its net assets for each of the two years in the period then ended, and the financial highlights for each of the periods presented, in conformity with accounting principles generally accepted in the United States of America.
DELOITTE & TOUCHE LLP
Kansas City, Missouri
February 11, 2016
42
| Management |
The Board of Directors
The individuals listed below serve as directors of the funds. Each director will continue to serve in this capacity until death, retirement, resignation or removal from office. The board has adopted a mandatory retirement age for directors who are not “interested persons,” as that term is defined in the Investment Company Act (independent directors). Independent directors shall retire by December 31 of the year in which they reach their 75th birthday.
Mr. Thomas is an “interested person” because he currently serves as President and Chief Executive Officer of American Century Companies, Inc. (ACC), the parent company of American Century Investment Management, Inc. (ACIM or the advisor). Mr. Fink is treated as an “interested person” because of his recent employment with ACC and American Century Services, LLC (ACS). The other directors (more than three-fourths of the total number) are independent. They are not employees, directors or officers of, and have no financial interest in, ACC or any of its wholly owned, direct or indirect, subsidiaries, including ACIM, American Century Investment Services, Inc. (ACIS) and ACS, and they do not have any other affiliations, positions or relationships that would cause them to be considered “interested persons” under the Investment Company Act. The directors serve in this capacity for seven (in the case of Mr. Thomas, 15) registered investment companies in the American Century Investments family of funds.
The following table presents additional information about the directors. The mailing address for each director is 4500 Main Street, Kansas City, Missouri 64111.
| Name (Year of Birth) | Position(s) Held with Funds | Length of Time Served | Principal Occupation(s) During Past 5 Years | Number of American Century Portfolios Overseen by Director | Other Directorships Held During Past 5 Years |
Independent Directors | |||||
| Andrea C. Hall (1945) | Director | Since 1997 | Retired | 80 | None |
| Jan M. Lewis (1957) | Director | Since 2011 | Retired; President and Chief Executive Officer, Catholic Charities of Northeast Kansas (human services organization) (2006 to 2013) | 80 | None |
| James A. Olson (1942) | Director and Chairman of the Board | Since 2007 (Chairman since 2014) | Member, Plaza Belmont LLC (private equity fund manager) | 80 | Saia, Inc. (2002 to 2012) and EPR Properties (2003 to 2013) |
| M. Jeannine Strandjord (1945) | Director | Since 1994 | Retired | 80 | Euronet Worldwide Inc.; MGP Ingredients, Inc.; Charming Shoppes, Inc. (2006 to 2010); and DST Systems Inc. (1996 to 2012) |
| John R. Whitten (1946) | Director | Since 2008 | Retired | 80 | Rudolph Technologies, Inc. |
43
Name (Year of Birth) | Position(s) Held with Funds | Length of Time Served | Principal Occupation(s) During Past 5 Years | Number of American Century Portfolios Overseen by Director | Other Directorships Held During Past 5 Years |
| Independent Directors | |||||
| Stephen E. Yates (1948) | Director | Since 2012 | Retired; Executive Vice President, Technology & Operations, KeyCorp. (computer services) (2004 to 2010) | 80 | Applied Industrial Technologies, Inc. (2001 to 2010) |
| Interested Directors | |||||
| Barry Fink (1955) | Director | Since 2012 | Retired; Executive Vice President, ACC (September 2007 to February 2013); President, ACS (October 2007 to February 2013); Chief Operating Officer, ACC (September 2007 to November 2012) | 80 | None |
| Jonathan S. Thomas (1963) | Director and President | Since 2007 | President and Chief Executive Officer, ACC (March 2007 to present). Also serves as Chief Executive Officer, ACS; Executive Vice President, ACIM; Director, ACC, ACIM and other ACC subsidiaries | 125 | BioMed Valley Discoveries, Inc. |
The Statement of Additional Information has additional information about the fund's directors and is available without charge, upon request, by calling 1-800-378-9878.
44
Officers
The following table presents certain information about the executive officers of the funds. Each officer serves as an officer for each of the 15 investment companies in the American Century family of funds, unless otherwise noted. No officer is compensated for his or her service as an officer of the funds. The listed officers are interested persons of the funds and are appointed or re-appointed on an annual basis. The mailing address for each officer listed below is 4500 Main Street, Kansas City, Missouri 64111.
Name (Year of Birth) | Offices with the Funds | Principal Occupation(s) During the Past Five Years |
| Jonathan S. Thomas (1963) | Director and President since 2007 | President and Chief Executive Officer, ACC (March 2007 to present). Also serves as Chief Executive Officer, ACS; Executive Vice President, ACIM; Director, ACC, ACIM and other ACC subsidiaries |
| Amy D. Shelton (1964) | Chief Compliance Officer and Vice President since 2014 | Chief Compliance Officer, American Century funds, (March 2014 to present); Chief Compliance Officer, ACIM (February 2014 to present); Chief Compliance Officer, ACIS (October 2009 to present); Vice President, Client Interactions and Marketing, ACIS (February 2013 to January 2014); Director, Client Interactions and Marketing, ACIS (June 2007 to January 2013). Also serves as Vice President, ACIS |
| Charles A. Etherington (1957) | General Counsel since 2007 and Senior Vice President since 2006 | Attorney, ACC (February 1994 to present); Vice President, ACC (November 2005 to present); General Counsel, ACC (March 2007 to present). Also serves as General Counsel, ACIM, ACS, ACIS and other ACC subsidiaries; and Senior Vice President, ACIM and ACS |
| C. Jean Wade (1964) | Vice President, Treasurer and Chief Financial Officer since 2012 | Vice President, ACS (February 2000 to present) |
| Robert J. Leach (1966) | Vice President since 2006 and Assistant Treasurer since 2012 | Vice President, ACS (February 2000 to present) |
| David H. Reinmiller (1963) | Vice President since 2000 | Attorney, ACC (January 1994 to present); Associate General Counsel, ACC (January 2001 to present). Also serves as Vice President, ACIM and ACS |
| Ward D. Stauffer (1960) | Secretary since 2005 | Attorney, ACC (June 2003 to present) |
45
| Additional Information |
Proxy Voting Policies
A description of the policies that the fund's investment advisor uses in exercising the voting rights associated with the securities purchased and/or held by the fund is available without charge, upon request, by calling 1-800-378-9878. It is also available on the "About Us" page of American Century Investments’ website at americancentury.com and on the Securities and Exchange Commission’s website at sec.gov. Information regarding how the investment advisor voted proxies relating to portfolio securities during the most recent 12-month period ended June 30 is available on the "About Us" page at americancentury.com. It is also available at sec.gov.
Quarterly Portfolio Disclosure
The fund files its complete schedule of portfolio holdings with the Securities and Exchange Commission (SEC) for the first and third quarters of each fiscal year on Form N-Q. The fund’s Forms N-Q are available on the SEC’s website at sec.gov, and may be reviewed and copied at the SEC’s Public Reference Room in Washington, DC. Information on the operation of the Public Reference Room may be obtained by calling 1-800-SEC-0330. The fund also makes its complete
schedule of portfolio holdings for the most recent quarter of its fiscal year available on its website at ipro.americancentury.com (for Investment Professionals) and, upon request, by calling 1-800-378-9878.
Other Tax Information
The following information is provided pursuant to provisions of the Internal Revenue Code.
For corporate taxpayers, the fund hereby designates $1,443,570, or up to the maximum amount allowable, of ordinary income distributions paid during the fiscal year ended December 31, 2015 as qualified for the corporate dividends received deduction.
The fund hereby designates $2,569,857 as qualified short-term capital gain distributions for purposes of Internal Revenue Code Section 871 for the fiscal year ended December 31, 2015.
The fund hereby designates $9,412,791, or up to the maximum amount allowable, as long-term capital gain distributions for the fiscal year ended December 31, 2015.
46
| Notes |
47
| Notes |
48
| ||
| Contact Us | americancentury.com | |
| Automated Information Line | 1-800-345-8765 | |
| Investment Professional Service Representatives | 1-800-345-6488 | |
| Telecommunications Relay Service for the Deaf | 711 | |
| American Century Variable Portfolios, Inc. | ||
Investment Advisor: American Century Investment Management, Inc. Kansas City, Missouri | ||
| This report and the statements it contains are submitted for the general information of our shareholders. The report is not authorized for distribution to prospective investors unless preceded or accompanied by an effective prospectus. | ||
| ©2016 American Century Proprietary Holdings, Inc. All rights reserved. CL-ANN-88142 1602 | ||
| ANNUAL REPORT | DECEMBER 31, 2015 |
VP Capital Appreciation Fund
51
52
| Table of Contents |
| Performance | 2 | |
| Portfolio Commentary | ||
| Fund Characteristics | ||
| Shareholder Fee Example | ||
| Schedule of Investments | ||
| Statement of Assets and Liabilities | ||
| Statement of Operations | ||
| Statement of Changes in Net Assets | ||
| Notes to Financial Statements | ||
| Financial Highlights | ||
| Report of Independent Registered Public Accounting Firm | ||
| Management | ||
| Additional Information | ||
Any opinions expressed in this report reflect those of the author as of the date of the report, and do not necessarily represent the opinions of American Century Investments® or any other person in the American Century Investments organization. Any such opinions are subject to change at any time based upon market or other conditions and American Century Investments disclaims any responsibility to update such opinions. These opinions may not be relied upon as investment advice and, because investment decisions made by American Century Investments funds are based on numerous factors, may not be relied upon as an indication of trading intent on behalf of any American Century Investments fund. Security examples are used for representational purposes only and are not intended as recommendations to purchase or sell securities. Performance information for comparative indices and securities is provided to American Century Investments by third party vendors. To the best of American Century Investments’ knowledge, such information is accurate at the time of printing.
| Performance |
| Total Returns as of December 31, 2015 | ||||||
Average Annual Returns | ||||||
Ticker Symbol | 1 year | 5 years | 10 years | Since Inception | Inception Date | |
| Class I | AVCIX | 1.93% | 9.37% | 9.98% | 8.55% | 11/20/87 |
Russell Midcap Growth Index | — | -0.20% | 11.53% | 8.16% | 11.20%(1) | — |
| Class II | AVCWX | 1.73% | — | — | 7.36% | 4/25/14 |
| (1) | Since November 30, 1987, the date nearest Class I’s inception for which data are available. |
The performance information presented does not include charges and deductions imposed by the insurance company separate account under the variable annuity or variable life insurance contracts. The inclusion of such charges could significantly lower performance. Please refer to the insurance company separate account prospectus for a discussion of the charges related to insurance contracts.
Data presented reflect past performance. Past performance is no guarantee of future results. Current performance may be higher or lower than the performance shown. Investment return and principal value will fluctuate, and redemption value may be more or less than original cost. Data assumes reinvestment of dividends and capital gains, and none of the charts reflect the deduction of taxes that a shareholder would pay on fund distributions or the redemption of fund shares. To obtain performance data current to the most recent month end, please call 1-800-345-6488 or visit ipro.americancentury.com (for Investment Professionals). For additional information about the fund, please consult the prospectus.
2
| Growth of $10,000 Over 10 Years |
| $10,000 investment made December 31, 2005 |
| Performance for other share classes will vary due to differences in fee structure. |

| Value on December 31, 2015 | |
| Class I — $25,908 | |
| Russell Midcap Growth Index — $21,914 | |
| Total Annual Fund Operating Expenses | |
| Class I | Class II |
| 1.00% | 1.15% |
The total annual fund operating expenses shown is as stated in the fund’s prospectus current as of the date of this report. The prospectus may vary from the expense ratio shown elsewhere in this report because it is based on a different time period, includes acquired fund fees and expenses, and, if applicable, does not include fee waivers or expense reimbursements.
Data presented reflect past performance. Past performance is no guarantee of future results. Current performance may be higher or lower than the performance shown. Investment return and principal value will fluctuate, and redemption value may be more or less than original cost. Data assumes reinvestment of dividends and capital gains, and none of the charts reflect the deduction of taxes that a shareholder would pay on fund distributions or the redemption of fund shares. To obtain performance data current to the most recent month end, please call 1-800-345-6488 or visit ipro.americancentury.com (for Investment Professionals). For additional information about the fund, please consult the prospectus.
3
| Portfolio Commentary |
Portfolio Managers: David Hollond and Greg Walsh
Performance Summary
VP Capital Appreciation returned 1.93%* for the 12 months ended December 31, 2015, outperforming its benchmark, the Russell Midcap Growth Index, which declined -0.20%.
Midcap stocks struggled during a year of volatility, ending near where they began. Within the Russell Midcap Growth Index, sector performance was mixed, with energy plunging steeply while utilities posted a narrower double-digit loss. Materials and industrials lost ground as investors worried about global growth. Consumer discretionary and telecommunication services stocks also fell. Consumer staples and health care were the strongest sectors during the year. Financials and information technology were modestly higher.
VP Capital Appreciation outpaced the Russell Midcap Growth benchmark, aided significantly by stock selection in the information technology sector. Stock decisions in the consumer discretionary, materials, and energy sectors were also helpful. Stock selection in the financials, industrials, and health care sectors detracted from relative performance.
Information Technology Stocks Led Contributors
The fund’s largest source of outperformance came from stock selection in the information technology sector, especially among semiconductor and semiconductor equipment and software companies. An overweight allocation to software also helped. Video game maker Electronic Arts was a top contributor. The company continued to execute, reporting strong results consistent with our investment thesis of improving operating margins driven by cost controls, a higher percentage of video games being delivered digitally, and a gaming console refresh cycle. Semiconductor firm Avago Technologies was another top contributor. The company makes components for smartphones and other electronic devices and continued to post accelerating revenue growth and margin improvement on strength in its wireless business, primarily from Apple and Samsung. The stock also benefited from investor enthusiasm for the company's pending acquisition of Broadcom.
Stock selection in the consumer discretionary sector aided performance, led by textiles, apparel, and luxury goods companies. Sports apparel maker Under Armour was a top contributor in the sector, despite late-year weakness as the warm early winter hurt sales of its cold-weather gear. The company is gaining market share and is being aided by strong growth outside the U.S.
Among other leading contributors, Constellation Brands, a producer and marketer of beer, wine, and spirits, performed well as the company continued to see very strong sales volume and pricing in its Corona and Modelo brands. The company added to its beer brands by acquiring San Diego-based craft brewer Ballast Point Brewing and Spirits. In the industrials sector, Acuity Brands was a top contributor. The company reported strong earnings due to trends in LED lighting as non-commercial construction rebounds.
| * | All fund returns referenced in this commentary are for Class I shares. Performance for other share classes will vary due to differences in fee structure; when Class I performance exceeds that of the fund’s benchmark, other share classes may not. See page 2 for returns for all share classes. |
4
Financials and Health Care Led Detractors
Financials detracted largely due to not owning real estate investment trusts (REITs), which are likely to falter as rates move higher. An overweight in investment management firm Affiliated Managers Group detracted. Affiliated Managers, which owns a number of asset managers, experienced outflows, especially in its international products. The firm also owns Third Avenue Management, which had to close its high-yield fund due to very high redemptions.
In health care, stock selection among pharmaceuticals and biotechnology companies hurt performance. Specialty pharmaceutical firm Horizon Pharma, which is not in the index, detracted despite reporting solid results as the stock was caught up in the late sector sell-off that was sparked by increased scrutiny of high prescription drug prices. The holding was eliminated.
Stock selection in the industrials sector detracted from relative performance, especially among road and rail companies and airlines. The rail industry has been affected by a number of factors, including oil prices, weather, and West Coast port strikes. Portfolio-only position Canadian Pacific Railway declined as oil prices weighed on its crude-by-rail business. Kansas City Southern was hurt by currency headwinds in Mexico and was eliminated. Spirit Airlines suffered from competition with Southwest Airlines, which is ramping up capacity in Dallas, a key hub for Spirit.
Outlook
The fund's investment process focuses primarily on medium-sized companies with accelerating earnings growth rates and share price momentum. The portfolio’s sector positioning is largely due to individual stock selection.
As of December 31, 2015, the largest overweight allocation relative to the benchmark was in the telecommunication services sector, due to the portfolio’s holding of SBA Communications. The portfolio was also overweight industrials, where stock decisions have led us to select machinery and road and rail companies.
The portfolio was underweight financials and materials. We continue to avoid REITs, which are likely to be negatively impacted by rising rates. The materials sector underweight reflects limited exposure to chemicals firms.
5
| Fund Characteristics |
| DECEMBER 31, 2015 | |
| Top Ten Holdings | % of net assets |
| Constellation Brands, Inc., Class A | 3.0% |
| SBA Communications Corp., Class A | 2.9% |
| Electronic Arts, Inc. | 2.9% |
| Teleflex, Inc. | 2.5% |
| Middleby Corp. (The) | 2.0% |
| Mohawk Industries, Inc. | 1.9% |
| Snap-On, Inc. | 1.9% |
| Affiliated Managers Group, Inc. | 1.8% |
| Zoetis, Inc. | 1.8% |
| Canadian Pacific Railway Ltd., New York Shares | 1.7% |
| Top Five Industries | % of net assets |
| Software | 7.1% |
| Specialty Retail | 6.2% |
| Machinery | 5.9% |
| Health Care Equipment and Supplies | 5.3% |
| Household Durables | 5.0% |
| Types of Investments in Portfolio | % of net assets |
| Common Stocks | 98.6% |
| Temporary Cash Investments | 1.4% |
| Other Assets and Liabilities | —* |
*Category is less than 0.05% of total net assets.
6
| Shareholder Fee Example |
Fund shareholders may incur two types of costs: (1) transaction costs, including sales charges (loads) on purchase payments and redemption/exchange fees; and (2) ongoing costs, including management fees; distribution and service (12b-1) fees; and other fund expenses. This example is intended to help you understand your ongoing costs (in dollars) of investing in your fund and to compare these costs with the ongoing cost of investing in other mutual funds.
The example is based on an investment of $1,000 made at the beginning of the period and held for the entire period from July 1, 2015 to December 31, 2015.
Actual Expenses
The table provides information about actual account values and actual expenses for each class. You may use the information, together with the amount you invested, to estimate the expenses that you paid over the period. First, identify the share class you own. Then simply divide your account value by $1,000 (for example, an $8,600 account value divided by $1,000 = 8.6), then multiply the result by the number under the heading “Expenses Paid During Period” to estimate the expenses you paid on your account during this period.
Hypothetical Example for Comparison Purposes
The table also provides information about hypothetical account values and hypothetical expenses based on the actual expense ratio of each class of your fund and an assumed rate of return of 5% per year before expenses, which is not the actual return of a fund’s share class. The hypothetical account values and expenses may not be used to estimate the actual ending account balance or expenses you paid for the period. You may use this information to compare the ongoing costs of investing in your fund and other funds. To do so, compare this 5% hypothetical example with the 5% hypothetical examples that appear in the shareholder reports of the other funds.
Please note that the expenses shown in the table are meant to highlight your ongoing costs only and do not reflect any transactional costs, such as sales charges (loads) or redemption/exchange fees. Therefore, the table is useful in comparing ongoing costs only, and will not help you determine the relative total costs of owning different funds. In addition, if these transactional costs were included, your costs would have been higher.
| Beginning Account Value 7/1/15 | Ending Account Value 12/31/15 | Expenses Paid During Period(1)7/1/15 - 12/31/15 | Annualized Expense Ratio(1) | |
| Actual | ||||
| Class I (after waiver) | $1,000 | $949.40 | $4.91 | 1.00% |
| Class I (before waiver) | $1,000 | $949.40(2) | $4.96 | 1.01% |
| Class II (after waiver) | $1,000 | $948.10 | $5.65 | 1.15% |
| Class II (before waiver) | $1,000 | $948.10(2) | $5.70 | 1.16% |
| Hypothetical | ||||
| Class I (after waiver) | $1,000 | $1,020.16 | $5.09 | 1.00% |
| Class I (before waiver) | $1,000 | $1,020.11 | $5.14 | 1.01% |
| Class II (after waiver) | $1,000 | $1,019.41 | $5.85 | 1.15% |
| Class II (before waiver) | $1,000 | $1,019.36 | $5.90 | 1.16% |
| (1) | Expenses are equal to the class's annualized expense ratio listed in the table above, multiplied by the average account value over the period, multiplied by 184, the number of days in the most recent fiscal half-year, divided by 365, to reflect the one-half year period. |
| (2) | Ending account value assumes the return earned after waiver and would have been lower if a portion of the management fee had not been waived. |
7
| Schedule of Investments |
DECEMBER 31, 2015
| Shares | Value | |||
| COMMON STOCKS — 98.6% | ||||
| Aerospace and Defense — 0.2% | ||||
| B/E Aerospace, Inc. | 18,549 | $ | 785,921 | |
| Airlines — 1.8% | ||||
| Alaska Air Group, Inc. | 47,568 | 3,829,700 | ||
| American Airlines Group, Inc. | 58,553 | 2,479,720 | ||
Spirit Airlines, Inc.(1) | 51,164 | 2,038,885 | ||
| 8,348,305 | ||||
| Auto Components — 1.2% | ||||
| Delphi Automotive plc | 67,426 | 5,780,431 | ||
| Automobiles — 0.4% | ||||
Tesla Motors, Inc.(1) | 8,626 | 2,070,326 | ||
| Banks — 2.2% | ||||
| BankUnited, Inc. | 81,623 | 2,943,326 | ||
Signature Bank(1) | 29,765 | 4,565,058 | ||
SVB Financial Group(1) | 21,498 | 2,556,112 | ||
| 10,064,496 | ||||
| Beverages — 3.8% | ||||
| Brown-Forman Corp., Class B | 39,412 | 3,912,823 | ||
| Constellation Brands, Inc., Class A | 97,654 | 13,909,836 | ||
| 17,822,659 | ||||
| Biotechnology — 2.8% | ||||
BioMarin Pharmaceutical, Inc.(1) | 54,598 | 5,719,686 | ||
Incyte Corp.(1) | 41,199 | 4,468,032 | ||
Vertex Pharmaceuticals, Inc.(1) | 22,179 | 2,790,784 | ||
| 12,978,502 | ||||
| Building Products — 1.1% | ||||
| Lennox International, Inc. | 40,596 | 5,070,440 | ||
| Capital Markets — 2.5% | ||||
Affiliated Managers Group, Inc.(1) | 51,389 | 8,209,907 | ||
| SEI Investments Co. | 67,184 | 3,520,441 | ||
| 11,730,348 | ||||
| Chemicals — 0.8% | ||||
Axalta Coating Systems Ltd.(1) | 142,807 | 3,805,807 | ||
| Commercial Services and Supplies — 1.1% | ||||
| KAR Auction Services, Inc. | 140,505 | 5,202,900 | ||
| Communications Equipment — 1.6% | ||||
| Motorola Solutions, Inc. | 111,525 | 7,633,886 | ||
| Consumer Finance — 1.0% | ||||
| Discover Financial Services | 85,127 | 4,564,510 | ||
| Containers and Packaging — 2.2% | ||||
| Ball Corp. | 102,299 | 7,440,206 | ||
Berry Plastics Group, Inc.(1) | 83,181 | 3,009,489 | ||
| 10,449,695 | ||||
| Distributors — 1.0% | ||||
LKQ Corp.(1) | 160,123 | 4,744,444 | ||
8
| Shares | Value | |||
| Diversified Financial Services — 1.2% | ||||
| McGraw Hill Financial, Inc. | 58,260 | $ | 5,743,271 | |
| Electrical Equipment — 1.9% | ||||
| Acuity Brands, Inc. | 18,474 | 4,319,221 | ||
| AMETEK, Inc. | 87,042 | 4,664,581 | ||
| 8,983,802 | ||||
| Electronic Equipment, Instruments and Components — 1.1% | ||||
| TE Connectivity Ltd. | 78,140 | 5,048,625 | ||
| Food and Staples Retailing — 1.3% | ||||
| Costco Wholesale Corp. | 36,538 | 5,900,887 | ||
| Food Products — 3.0% | ||||
Hain Celestial Group, Inc. (The)(1) | 65,775 | 2,656,652 | ||
| J.M. Smucker Co. (The) | 25,090 | 3,094,601 | ||
| Kellogg Co. | 61,197 | 4,422,707 | ||
TreeHouse Foods, Inc.(1) | 19,975 | 1,567,238 | ||
WhiteWave Foods Co. (The), Class A(1) | 62,049 | 2,414,327 | ||
| 14,155,525 | ||||
| Health Care Equipment and Supplies — 5.3% | ||||
| Baxter International, Inc. | 63,351 | 2,416,841 | ||
DexCom, Inc.(1) | 43,772 | 3,584,927 | ||
Hologic, Inc.(1) | 91,295 | 3,532,203 | ||
NuVasive, Inc.(1) | 65,169 | 3,526,295 | ||
| Teleflex, Inc. | 87,918 | 11,556,821 | ||
| 24,617,087 | ||||
| Health Care Providers and Services — 3.7% | ||||
| AmerisourceBergen Corp. | 61,006 | 6,326,932 | ||
| Universal Health Services, Inc., Class B | 45,636 | 5,453,046 | ||
VCA, Inc.(1) | 98,289 | 5,405,895 | ||
| 17,185,873 | ||||
| Hotels, Restaurants and Leisure — 2.2% | ||||
Buffalo Wild Wings, Inc.(1) | 9,329 | 1,489,375 | ||
Chipotle Mexican Grill, Inc.(1) | 3,451 | 1,655,962 | ||
| Hilton Worldwide Holdings, Inc. | 173,844 | 3,720,262 | ||
| Papa John's International, Inc. | 58,316 | 3,258,115 | ||
| 10,123,714 | ||||
| Household Durables — 5.0% | ||||
| Harman International Industries, Inc. | 44,402 | 4,183,112 | ||
Jarden Corp.(1) | 107,010 | 6,112,411 | ||
Mohawk Industries, Inc.(1) | 47,046 | 8,910,042 | ||
| Newell Rubbermaid, Inc. | 91,510 | 4,033,761 | ||
| 23,239,326 | ||||
| Internet and Catalog Retail — 1.7% | ||||
| Expedia, Inc. | 63,487 | 7,891,434 | ||
| Internet Software and Services — 3.0% | ||||
CoStar Group, Inc.(1) | 37,945 | 7,842,852 | ||
LinkedIn Corp., Class A(1) | 27,311 | 6,147,160 | ||
| 13,990,012 | ||||
| IT Services — 4.3% | ||||
Alliance Data Systems Corp.(1) | 28,418 | 7,859,566 | ||
| Sabre Corp. | 208,405 | 5,829,088 | ||
Vantiv, Inc., Class A(1) | 134,613 | 6,383,349 | ||
| 20,072,003 | ||||
9
| Shares | Value | |||
| Leisure Products — 0.9% | ||||
| Brunswick Corp. | 82,510 | $ | 4,167,580 | |
| Machinery — 5.9% | ||||
| Ingersoll-Rand plc | 64,361 | 3,558,520 | ||
| ITT Corp. | 64,358 | 2,337,483 | ||
Middleby Corp. (The)(1) | 87,201 | 9,406,372 | ||
| Snap-On, Inc. | 51,885 | 8,894,645 | ||
WABCO Holdings, Inc.(1) | 31,919 | 3,264,037 | ||
| 27,461,057 | ||||
| Media — 1.5% | ||||
Charter Communications, Inc., Class A(1) | 38,101 | 6,976,293 | ||
| Multiline Retail — 2.3% | ||||
Burlington Stores, Inc.(1) | 80,091 | 3,435,904 | ||
Dollar Tree, Inc.(1) | 97,701 | 7,544,471 | ||
| 10,980,375 | ||||
| Oil, Gas and Consumable Fuels — 1.2% | ||||
Concho Resources, Inc.(1) | 41,224 | 3,828,061 | ||
Gulfport Energy Corp.(1) | 63,662 | 1,564,175 | ||
| 5,392,236 | ||||
| Pharmaceuticals — 1.8% | ||||
| Zoetis, Inc. | 170,978 | 8,193,266 | ||
| Professional Services — 2.6% | ||||
| Nielsen Holdings plc | 141,842 | 6,609,837 | ||
Verisk Analytics, Inc., Class A(1) | 71,816 | 5,521,214 | ||
| 12,131,051 | ||||
| Real Estate Management and Development — 1.1% | ||||
| Jones Lang LaSalle, Inc. | 33,214 | 5,309,590 | ||
| Road and Rail — 2.4% | ||||
| Canadian Pacific Railway Ltd., New York Shares | 62,186 | 7,934,933 | ||
| J.B. Hunt Transport Services, Inc. | 46,402 | 3,404,051 | ||
| 11,338,984 | ||||
| Semiconductors and Semiconductor Equipment — 3.4% | ||||
| Avago Technologies Ltd. | 38,630 | 5,607,144 | ||
Cree, Inc.(1) | 101,159 | 2,697,911 | ||
NXP Semiconductors NV(1) | 87,982 | 7,412,483 | ||
| 15,717,538 | ||||
| Software — 7.1% | ||||
| Activision Blizzard, Inc. | 93,484 | 3,618,766 | ||
| CDK Global, Inc. | 78,502 | 3,726,490 | ||
Electronic Arts, Inc.(1) | 198,610 | 13,648,479 | ||
Guidewire Software, Inc.(1) | 10,126 | 609,180 | ||
| Intuit, Inc. | 42,406 | 4,092,179 | ||
ServiceNow, Inc.(1) | 27,760 | 2,402,906 | ||
Tyler Technologies, Inc.(1) | 28,388 | 4,948,596 | ||
| 33,046,596 | ||||
| Specialty Retail — 6.2% | ||||
AutoZone, Inc.(1) | 7,314 | 5,426,330 | ||
| L Brands, Inc. | 28,779 | 2,757,604 | ||
Restoration Hardware Holdings, Inc.(1) | 37,950 | 3,015,127 | ||
| Signet Jewelers Ltd. | 52,151 | 6,450,557 | ||
| Tractor Supply Co. | 73,926 | 6,320,673 | ||
10
| Shares | Value | |||
Ulta Salon Cosmetics & Fragrance, Inc.(1) | 27,325 | $ | 5,055,125 | |
| 29,025,416 | ||||
| Textiles, Apparel and Luxury Goods — 1.9% | ||||
lululemon athletica, Inc.(1) | 50,979 | 2,674,868 | ||
Under Armour, Inc., Class A(1) | 77,301 | 6,231,234 | ||
| 8,906,102 | ||||
| Wireless Telecommunication Services — 2.9% | ||||
SBA Communications Corp., Class A(1) | 129,984 | 13,657,419 | ||
TOTAL COMMON STOCKS (Cost $376,824,155) | 460,307,732 | |||
| TEMPORARY CASH INVESTMENTS — 1.4% | ||||
| Repurchase Agreement, Fixed Income Clearing Corp., (collateralized by various U.S. Treasury obligations, 3.00%, 5/15/45, valued at $6,474,281), at 0.08%, dated 12/31/15, due 1/4/16 (Delivery value $6,343,056) | 6,343,000 | |||
| State Street Institutional Liquid Reserves Fund, Premier Class | 229,108 | 229,108 | ||
TOTAL TEMPORARY CASH INVESTMENTS (Cost $6,572,108) | 6,572,108 | |||
TOTAL INVESTMENT SECURITIES — 100.0% (Cost $383,396,263) | 466,879,840 | |||
OTHER ASSETS AND LIABILITIES† | (86,762) | |||
| TOTAL NET ASSETS — 100.0% | $ | 466,793,078 | ||
| FORWARD FOREIGN CURRENCY EXCHANGE CONTRACTS | ||||||||
| Currency Purchased | Currency Sold | Counterparty | Settlement Date | Unrealized Appreciation (Depreciation) | ||||
| USD | 6,925,489 | CAD | 9,656,209 | JPMorgan Chase Bank N.A. | 1/29/16 | $ | (53,407 | ) |
| USD | 223,358 | CAD | 309,843 | JPMorgan Chase Bank N.A. | 1/29/16 | (577 | ) | |
| $ | (53,984 | ) | ||||||
| NOTES TO SCHEDULE OF INVESTMENTS | ||
| CAD | - | Canadian Dollar |
| USD | - | United States Dollar |
| † | Category is less than 0.05% of total net assets. |
| (1) | Non-income producing. |
See Notes to Financial Statements.
11
| Statement of Assets and Liabilities |
| DECEMBER 31, 2015 | |||
| Assets | |||
| Investment securities, at value (cost of $383,396,263) | $ | 466,879,840 | |
| Cash | 18,665 | ||
| Foreign currency holdings, at value (cost of $30,282) | 25,808 | ||
| Receivable for investments sold | 2,065,179 | ||
| Receivable for capital shares sold | 143,988 | ||
| Dividends and interest receivable | 135,479 | ||
| 469,268,959 | |||
| Liabilities | |||
| Payable for investments purchased | 1,969,153 | ||
| Payable for capital shares redeemed | 57,490 | ||
| Unrealized depreciation on forward foreign currency exchange contracts | 53,984 | ||
| Accrued management fees | 395,063 | ||
| Distribution fees payable | 191 | ||
| 2,475,881 | |||
| Net Assets | $ | 466,793,078 | |
| Net Assets Consist of: | |||
| Capital (par value and paid-in surplus) | $ | 341,109,742 | |
| Undistributed net investment income | 53,984 | ||
| Undistributed net realized gain | 42,204,224 | ||
| Net unrealized appreciation | 83,425,128 | ||
| $ | 466,793,078 | ||
| Net Assets | Shares Outstanding | Net Asset Value Per Share | ||||
| Class I, $0.01 Par Value | $465,851,237 | 31,022,282 | $15.02 | |||
| Class II, $0.01 Par Value | $941,841 | 62,866 | $14.98 | |||
See Notes to Financial Statements.
12
| Statement of Operations |
| YEAR ENDED DECEMBER 31, 2015 | |||
| Investment Income (Loss) | |||
| Income: | |||
| Dividends (net of foreign taxes withheld of $22,276) | $ | 3,005,588 | |
| Interest | 3,298 | ||
| 3,008,886 | |||
| Expenses: | |||
| Management fees | 4,888,354 | ||
| Distribution fees - Class II | 1,349 | ||
| Directors' fees and expenses | 17,481 | ||
| Other expenses | 4,411 | ||
| 4,911,595 | |||
| Fees waived | (20,188 | ) | |
| 4,891,407 | |||
| Net investment income (loss) | (1,882,521 | ) | |
| Realized and Unrealized Gain (Loss) | |||
| Net realized gain (loss) on: | |||
| Investment transactions | 43,560,158 | ||
| Foreign currency transactions | 1,401,804 | ||
| 44,961,962 | |||
| Change in net unrealized appreciation (depreciation) on: | |||
| Investments | (35,682,669 | ) | |
| Translation of assets and liabilities in foreign currencies | (51,440 | ) | |
| (35,734,109 | ) | ||
| Net realized and unrealized gain (loss) | 9,227,853 | ||
| Net Increase (Decrease) in Net Assets Resulting from Operations | $ | 7,345,332 | |
See Notes to Financial Statements.
13
| Statement of Changes in Net Assets |
| YEARS ENDED DECEMBER 31, 2015 AND DECEMBER 31, 2014 | ||||||
| Increase (Decrease) in Net Assets | December 31, 2015 | December 31, 2014 | ||||
| Operations | ||||||
| Net investment income (loss) | $ | (1,882,521 | ) | $ | (2,285,359 | ) |
| Net realized gain (loss) | 44,961,962 | 63,258,941 | ||||
| Change in net unrealized appreciation (depreciation) | (35,734,109 | ) | (24,624,580 | ) | ||
| Net increase (decrease) in net assets resulting from operations | 7,345,332 | 36,349,002 | ||||
| Distributions to Shareholders | ||||||
| From net realized gains: | ||||||
| Class I | (31,133,710 | ) | (89,909,726 | ) | ||
| Class II | (25,303 | ) | — | |||
| Decrease in net assets from distributions | (31,159,013 | ) | (89,909,726 | ) | ||
| Capital Share Transactions | ||||||
| Net increase (decrease) in net assets from capital share transactions (Note 5) | 22,180,060 | 78,399,472 | ||||
| Net increase (decrease) in net assets | (1,633,621 | ) | 24,838,748 | |||
| Net Assets | ||||||
| Beginning of period | 468,426,699 | 443,587,951 | ||||
| End of period | $ | 466,793,078 | $ | 468,426,699 | ||
| Undistributed net investment income | $ | 53,984 | $ | 4,015 | ||
See Notes to Financial Statements.
14
| Notes to Financial Statements |
DECEMBER 31, 2015
1. Organization
American Century Variable Portfolios, Inc. (the corporation) is registered under the Investment Company Act of 1940, as amended (the 1940 Act), as an open-end management investment company and is organized as a Maryland corporation. VP Capital Appreciation Fund (the fund) is one fund in a series issued by the corporation. The fund is diversified as defined under the 1940 Act. The fund’s investment objective is to seek capital growth.
The fund offers Class I and Class II. The share classes differ principally in their respective distribution and shareholder servicing expenses and arrangements. Class II is charged a lower unified management fee because it has a separate arrangement for distribution services. Sale of Class II commenced on April 25, 2014.
2. Significant Accounting Policies
The following is a summary of significant accounting policies consistently followed by the fund in preparation of its financial statements. The fund is an investment company and follows accounting and reporting guidance in accordance with accounting principles generally accepted in the United States of America. This may require management to make certain estimates and assumptions at the date of the financial statements. Actual results could differ from these estimates. Management evaluated the impact of events or transactions occurring through the date the financial statements were issued that would merit recognition or disclosure.
Investment Valuations — The fund determines the fair value of its investments and computes its net asset value per share at the close of regular trading (usually 4 p.m. Eastern time) on the New York Stock Exchange (NYSE) on each day the NYSE is open. The Board of Directors has adopted valuation policies and procedures to guide the investment advisor in the fund’s investment valuation process and to provide methodologies for the oversight of the fund’s pricing function.
Equity securities that are listed or traded on a domestic securities exchange are valued at the last reported sales price or at the official closing price as provided by the exchange. Equity securities traded on foreign securities exchanges are generally valued at the closing price of such securities on the exchange where primarily traded or at the close of the NYSE, if that is earlier. If no last sales price is reported, or if local convention or regulation so provides, the mean of the latest bid and asked prices may be used. Securities traded over-the-counter are valued at the mean of the latest bid and asked prices, the last sales price, or the official closing price. Equity securities initially expressed in local currencies are translated into U.S. dollars at the mean of the appropriate currency exchange rate at the close of the NYSE as provided by an independent pricing service.
Open-end management investment companies are valued at the reported net asset value per share. Repurchase agreements are valued at cost, which approximates fair value. Forward foreign currency exchange contracts are valued at the mean of the appropriate forward exchange rate at the close of the NYSE as provided by an independent pricing service.
If the fund determines that the market price for an investment is not readily available or the valuation methods mentioned above do not reflect an investment’s fair value, such investment is valued as determined in good faith by the Board of Directors or its delegate, in accordance with policies and procedures adopted by the Board of Directors. In its determination of fair value, the fund may review several factors including, but not limited to, market information regarding the specific investment or comparable investments and correlation with other investment types, futures indices or general market indicators. Circumstances that may cause the fund to use these procedures to value an investment include, but are not limited to: an investment has been declared in default or is distressed; trading in a security has been suspended during the trading day or a security is not actively trading on its principal exchange; prices received from a regular pricing source are deemed unreliable; or there is a foreign market holiday and no trading occurred.
The fund monitors for significant events occurring after the close of an investment’s primary exchange but before the fund’s net asset value per share is determined. Significant events may include, but are not limited to: corporate announcements and transactions; governmental action and political unrest that could impact a specific investment or an investment sector; or armed conflicts, natural disasters and similar events that could
15
affect investments in a specific country or region. The fund also monitors for significant fluctuations between domestic and foreign markets, as evidenced by the U.S. market or such other indicators that the Board of Directors, or its delegate, deems appropriate. If significant fluctuations in foreign markets are identified, the fund may apply a model-derived factor to the closing price of equity securities traded on foreign securities exchanges. The factor is based on observable market data as provided by an independent pricing service.
Security Transactions — Security transactions are accounted for as of the trade date. Net realized gains and losses are determined on the identified cost basis, which is also used for federal income tax purposes.
Investment Income — Dividend income less foreign taxes withheld, if any, is recorded as of the ex-dividend date. Distributions received on securities that represent a return of capital or long-term capital gain are recorded as a reduction of cost of investments and/or as a realized gain. The fund may estimate the components of distributions received that may be considered nontaxable distributions or long-term capital gain distributions for income tax purposes. Interest income is recorded on the accrual basis and includes accretion of discounts and amortization of premiums.
Foreign Currency Translations — All assets and liabilities initially expressed in foreign currencies are translated into U.S. dollars at prevailing exchange rates at period end. The fund may enter into spot foreign currency exchange contracts to facilitate transactions denominated in a foreign currency. Purchases and sales of investment securities, dividend and interest income, spot foreign currency exchange contracts, and expenses are translated at the rates of exchange prevailing on the respective dates of such transactions. Net realized and unrealized foreign currency exchange gains or losses related to investment securities are a component of net realized gain (loss) on investment transactions and change in net unrealized appreciation (depreciation) on investments, respectively.
Repurchase Agreements — The fund may enter into repurchase agreements with institutions that American Century Investment Management, Inc. (ACIM) (the investment advisor) has determined are creditworthy pursuant to criteria adopted by the Board of Directors. The fund requires that the collateral, represented by securities, received in a repurchase transaction be transferred to the custodian in a manner sufficient to enable the fund to obtain those securities in the event of a default under the repurchase agreement. ACIM monitors, on a daily basis, the securities transferred to ensure the value, including accrued interest, of the securities under each repurchase agreement is equal to or greater than amounts owed to the fund under each repurchase agreement.
Joint Trading Account — Pursuant to an Exemptive Order issued by the Securities and Exchange Commission, the fund, along with certain other funds in the American Century Investments family of funds, may transfer uninvested cash balances into a joint trading account. These balances are invested in one or more repurchase agreements that are collateralized by U.S. Treasury or Agency obligations.
Income Tax Status — It is the fund’s policy to distribute substantially all net investment income and net realized gains to shareholders and to otherwise qualify as a regulated investment company under provisions of the Internal Revenue Code. Accordingly, no provision has been made for income taxes. The fund files U.S. federal, state, local and non-U.S. tax returns as applicable. The fund's tax returns are subject to examination by the relevant taxing authority until expiration of the applicable statute of limitations, which is generally three years from the date of filing but can be longer in certain jurisdictions. At this time, management believes there are no uncertain tax positions which, based on their technical merit, would not be sustained upon examination and for which it is reasonably possible that the total amounts of unrecognized tax benefits will significantly change in the next twelve months.
Multiple Class — All shares of the fund represent an equal pro rata interest in the net assets of the class to which such shares belong, and have identical voting, dividend, liquidation and other rights and the same terms and conditions, except for class specific expenses and exclusive rights to vote on matters affecting only individual classes. Income, non-class specific expenses, and realized and unrealized capital gains and losses of the fund are allocated to each class of shares based on their relative net assets.
Distributions to Shareholders — Distributions from net investment income and net realized gains, if any, are generally declared and paid annually.
Indemnifications — Under the corporation’s organizational documents, its officers and directors are indemnified against certain liabilities arising out of the performance of their duties to the fund. In addition, in the normal course of business, the fund enters into contracts that provide general indemnifications. The maximum exposure under these arrangements is unknown as this would involve future claims that may be made against a fund. The risk of material loss from such claims is considered by management to be remote.
16
3. Fees and Transactions with Related Parties
Certain officers and directors of the corporation are also officers and/or directors of American Century Companies, Inc. (ACC). The corporation’s investment advisor, ACIM, the corporation's distributor, American Century Investment Services, Inc. (ACIS), and the corporation’s transfer agent, American Century Services, LLC, are wholly owned, directly or indirectly, by ACC.
Management Fees — The corporation has entered into a management agreement with ACIM, under which ACIM provides the fund with investment advisory and management services in exchange for a single, unified management fee (the fee) per class. The agreement provides that all expenses of managing and operating the fund, except distribution fees, brokerage expenses, taxes, interest, fees and expenses of the independent directors (including legal counsel fees), and extraordinary expenses, will be paid by ACIM. The fee is computed and accrued daily based on each class's daily net assets and paid monthly in arrears. The rate of the fee is determined by applying a fee rate calculation formula. This formula takes into account the fund’s assets as well as certain assets, if any, of other clients of the investment advisor outside the American Century Investments family of funds (such as subadvised funds and separate accounts) that have very similar investment teams and investment strategies (strategy assets). The annual management fee schedule ranges from 0.90% to 1.00% for Class I and from 0.80% to 0.90% for Class II. Effective August 1, 2015, the investment advisor voluntarily agreed to waive 0.01% of the fund's management fee. The investment advisor expects this waiver to continue until April 30, 2017 and cannot terminate it prior to such date without the approval of the Board of Directors. The total amount of the waiver for each class for the year ended December 31, 2015 was $20,161 and $27 for Class I and Class II, respectively. The effective annual management fee for each class for the year ended December 31, 2015 was 1.00% and 0.90% for Class I and Class II, respectively. The impact of the management fee waiver to the ratio of operating expenses to average net assets was less than 0.005% for each class for the year ended December 31, 2015.
Distribution Fees — The Board of Directors has adopted the Master Distribution Plan (the plan) for Class II, pursuant to Rule 12b-1 of the 1940 Act. The plan provides that Class II will pay ACIS an annual distribution fee equal to 0.25%. The fee is computed and accrued daily based on the Class II daily net assets and paid monthly in arrears. The distribution fee provides compensation for expenses incurred in connection with distributing shares of Class II including, but not limited to, payments to brokers, dealers, and financial institutions that have entered into sales agreements with respect to shares of the fund. Fees incurred under the plan during the year ended December 31, 2015 are detailed in the Statement of Operations.
Directors' Fees and Expenses — The Board of Directors is responsible for overseeing the investment advisor’s management and operations of the fund. The directors receive detailed information about the fund and its investment advisor regularly throughout the year, and meet at least quarterly with management of the investment advisor to review reports about fund operations. The fund’s officers do not receive compensation from the fund.
4. Investment Transactions
Purchases and sales of investment securities, excluding short-term investments, for the year ended December 31, 2015 were $345,113,091 and $351,357,179, respectively.
17
5. Capital Share Transactions
Transactions in shares of the fund were as follows:
Year ended December 31, 2015 | Year ended December 31, 2014(1) | |||||||||
| Shares | Amount | Shares | Amount | |||||||
| Class I/Shares Authorized | 150,000,000 | 150,000,000 | ||||||||
| Sold | 4,506,159 | $ | 71,991,161 | 2,331,905 | $ | 38,088,912 | ||||
Issued in connection with reorganization (Note 10) | — | — | 2,284,725 | 32,402,226 | ||||||
| Issued in reinvestment of distributions | 1,954,407 | 31,133,710 | 6,175,119 | 89,909,726 | ||||||
| Redeemed | (5,216,684 | ) | (81,532,417 | ) | (5,279,366 | ) | (82,340,566 | ) | ||
| 1,243,882 | 21,592,454 | 5,512,383 | 78,060,298 | |||||||
| Class II/Shares Authorized | 25,000,000 | 25,000,000 | ||||||||
| Sold | 46,437 | 711,610 | 8,699 | 131,694 | ||||||
Issued in connection with reorganization (Note 10) | — | — | 29,096 | 412,582 | ||||||
| Issued in reinvestment of distributions | 1,590 | 25,303 | — | — | ||||||
| Redeemed | (9,319 | ) | (149,307 | ) | (13,637 | ) | (205,102 | ) | ||
| 38,708 | 587,606 | 24,158 | 339,174 | |||||||
| Net increase (decrease) | 1,282,590 | $ | 22,180,060 | 5,536,541 | $ | 78,399,472 | ||||
(1) April 25, 2014 (commencement of sale) through December 31, 2014 for Class II.
6. Fair Value Measurements
The fund’s investments valuation process is based on several considerations and may use multiple inputs to determine the fair value of the investments held by the fund. In conformity with accounting principles generally accepted in the United States of America, the inputs used to determine a valuation are classified into three broad levels.
| • | Level 1 valuation inputs consist of unadjusted quoted prices in an active market for identical investments. |
| • | Level 2 valuation inputs consist of direct or indirect observable market data (including quoted prices for comparable investments, evaluations of subsequent market events, interest rates, prepayment speeds, credit risk, etc.). These inputs also consist of quoted prices for identical investments initially expressed in local currencies that are adjusted through translation into U.S. dollars. |
| • | Level 3 valuation inputs consist of unobservable data (including a fund’s own assumptions). |
The level classification is based on the lowest level input that is significant to the fair valuation measurement. The valuation inputs are not necessarily an indication of the risks associated with investing in these securities or other financial instruments. There were no significant transfers between levels during the period.
The following is a summary of the level classifications as of period end. The Schedule of Investments provides additional information on the fund’s portfolio holdings.
| Level 1 | Level 2 | Level 3 | ||||||
| Assets | ||||||||
| Investment Securities | ||||||||
| Common Stocks | $ | 460,307,732 | — | — | ||||
| Temporary Cash Investments | 229,108 | $ | 6,343,000 | — | ||||
| $ | 460,536,840 | $ | 6,343,000 | — | ||||
| Liabilities | ||||||||
| Other Financial Instruments | ||||||||
| Forward Foreign Currency Exchange Contracts | — | $ | 53,984 | — | ||||
18
7. Derivative Instruments
Foreign Currency Risk — The fund is subject to foreign currency exchange rate risk in the normal course of pursuing its investment objectives. The value of foreign investments held by a fund may be significantly affected by changes in foreign currency exchange rates. The dollar value of a foreign security generally decreases when the value of the dollar rises against the foreign currency in which the security is denominated and tends to increase when the value of the dollar declines against such foreign currency. A fund may enter into forward foreign currency exchange contracts to reduce a fund's exposure to foreign currency exchange rate fluctuations. The net U.S. dollar value of foreign currency underlying all contractual commitments held by a fund and the resulting unrealized appreciation or depreciation are determined daily. Realized gain or loss is recorded upon the termination of the contract. Net realized and unrealized gains or losses occurring during the holding period of forward foreign currency exchange contracts are a component of net realized gain (loss) on foreign currency transactions and change in net unrealized appreciation (depreciation) on translation of assets and liabilities in foreign currencies, respectively. A fund bears the risk of an unfavorable change in the foreign currency exchange rate underlying the forward contract. Additionally, losses, up to the fair value, may arise if the counterparties do not perform under the contract terms. The fund's average U.S. dollar exposure to foreign currency risk derivative instruments held during the period was $8,921,101.
The value of foreign currency risk derivative instruments as of December 31, 2015, is disclosed on the Statement of Assets and Liabilities as a liability of $53,984 in unrealized depreciation on forward foreign currency exchange contracts. For the year ended December 31, 2015, the effect of foreign currency risk derivative instruments on the Statement of Operations was $1,404,623 in net realized gain (loss) on foreign currency transactions and $(49,969) in change in net unrealized appreciation (depreciation) on translation of assets and liabilities in foreign currencies.
8. Risk Factors
The fund invests in common stocks of small companies. Because of this, the fund may be subject to greater risk and market fluctuations than a fund investing in larger, more established companies.
9. Federal Tax Information
The tax character of distributions paid during the years ended December 31, 2015 and December 31, 2014 were as follows:
| 2015 | 2014 | |||||
| Distributions Paid From | ||||||
| Ordinary income | — | $ | 3,798,308 | |||
| Long-term capital gains | $ | 31,159,013 | $ | 86,111,418 | ||
The book-basis character of distributions made during the year from net investment income or net realized gains may differ from their ultimate characterization for federal income tax purposes. These differences reflect the differing character of certain income items and net realized gains and losses for financial statement and tax purposes, and may result in reclassification among certain capital accounts on the financial statements.
19
As of December 31, 2015, the federal tax cost of investments and the components of distributable earnings on a tax-basis were as follows:
| Federal tax cost of investments | $ | 384,150,997 | |
| Gross tax appreciation of investments | $ | 93,430,365 | |
| Gross tax depreciation of investments | (10,701,522 | ) | |
| Net tax appreciation (depreciation) of investments | 82,728,843 | ||
Net tax appreciation (depreciation) on derivatives and translation of assets and liabilities in foreign currencies | (4,465 | ) | |
| Net tax appreciation (depreciation) | $ | 82,724,378 | |
| Undistributed ordinary income | — | ||
| Accumulated long-term gains | $ | 42,958,958 | |
The difference between book-basis and tax-basis unrealized appreciation (depreciation) is attributable primarily to the tax deferral of losses on wash sales.
10. Reorganization
On December 5, 2013, the Board of Directors approved an agreement and plan of reorganization (the reorganization), whereby the net assets of VP Vista Fund (VP Vista), one fund in a series issued by the corporation, were transferred to VP Capital Appreciation Fund (VP Capital Appreciation) in exchange for shares of VP Capital Appreciation. The purpose of the transaction was to combine two funds with similar investment objectives and strategies. The financial statements and performance history of VP Capital Appreciation survived after the reorganization. The reorganization was effective at the close of the NYSE on April 25, 2014.
The reorganization was accomplished by a tax-free exchange of shares. On April 25, 2014, VP Vista exchanged its shares for shares of VP Capital Appreciation as follows:
| Original Fund/Class | Shares Exchanged | New Fund/Class | Shares Received | |||
| VP Vista – Class I | 1,646,210 | VP Capital Appreciation – Class I | 2,284,725 | |||
| VP Vista – Class II | 21,278 | VP Capital Appreciation – Class II | 29,096 | |||
The net assets of VP Vista and VP Capital Appreciation immediately before the reorganization were $32,814,808 and $428,621,710, respectively. VP Vista’s unrealized appreciation of $6,390,760 was combined with that of VP Capital Appreciation. Immediately after the reorganization, the combined net assets were $461,436,518. VP Capital Appreciation acquired short-term capital loss carryovers of $(2,951,635) from VP Vista.
Assuming the reorganization had been completed on January 1, 2014, the beginning of the annual reporting period, the pro forma results of operations for the year ended December 31, 2014 are as follows:
| Net investment income (loss) | $ | (2,356,222 | ) |
| Net realized and unrealized gain (loss) | 37,845,892 | ||
| Net increase (decrease) in net assets resulting from operations | $ | 35,489,670 | |
Because the combined investment portfolios have been managed as a single integrated portfolio since the reorganization was completed, it is not practicable to separate the amounts of revenue and earnings of VP Vista that have been included in the fund’s Statement of Operations since April 25, 2014.
20
| Financial Highlights |
| For a Share Outstanding Throughout the Years Ended December 31 (except as noted) | |||||||||||||
| Per-Share Data | Ratios and Supplemental Data | ||||||||||||
| Income From Investment Operations: | Ratio to Average Net Assets of: | ||||||||||||
Net Asset Value, Beginning of Period | Net Investment Income (Loss)(1) | Net Realized and Unrealized Gain (Loss) | Total From Investment Operations | Distributions From Net Realized Gains | Net Asset Value, End of Period | Total Return(2) | Operating Expenses | Net Investment Income (Loss) | Portfolio Turnover Rate | Net Assets, End of Period (in thousands) | |||
| Class I | |||||||||||||
| 2015 | $15.72 | (0.06) | 0.42 | 0.36 | (1.06) | $15.02 | 1.93% | 1.00% | (0.38)% | 72% | $465,851 | ||
| 2014 | $18.28 | (0.08) | 1.27 | 1.19 | (3.75) | $15.72 | 8.14% | 1.00% | (0.50)% | 68% | $468,047 | ||
| 2013 | $14.54 | (0.08) | 4.45 | 4.37 | (0.63) | $18.28 | 30.92% | 1.00% | (0.49)% | 72% | $443,588 | ||
| 2012 | $13.22 | (0.01) | 2.15 | 2.14 | (0.82) | $14.54 | 16.00% | 1.00% | (0.04)% | 74% | $360,445 | ||
| 2011 | $14.14 | (0.05) | (0.87) | (0.92) | — | $13.22 | (6.51)% | 1.00% | (0.39)% | 98% | $313,784 | ||
| Class II | |||||||||||||
| 2015 | $15.71 | (0.08) | 0.41 | 0.33 | (1.06) | $14.98 | 1.73% | 1.15% | (0.53)% | 72% | $942 | ||
2014(3) | $14.18 | (0.06) | 1.59 | 1.53 | — | $15.71 | 10.79% | 1.15%(4) | (0.61)%(4) | 68%(5) | $379 | ||
| Notes to Financial Highlights |
| (1) | Computed using average shares outstanding throughout the period. |
| (2) | Total returns are calculated based on the net asset value of the last business day. Total returns for periods less than one year are not annualized. |
| (3) | April 25, 2014 (commencement of sale) through December 31, 2014. |
| (4) | Annualized. |
| (5) | Portfolio turnover is calculated at the fund level. Percentage indicated was calculated for the year ended December 31, 2014. |
See Notes to Financial Statements.
21
| Report of Independent Registered Public Accounting Firm |
To the Board of Directors and Shareholders of American Century Variable Portfolios, Inc.:
We have audited the accompanying statement of assets and liabilities, including the schedule of investments, of VP Capital Appreciation Fund (the “Fund”), one of the funds constituting American Century Variable Portfolios, Inc., as of December 31, 2015, and the related statement of operations for the year then ended, the statements of changes in net assets for each of the two years in the period then ended, and the financial highlights for each of the periods presented. These financial statements and financial highlights are the responsibility of the Fund’s management. Our responsibility is to express an opinion on these financial statements and financial highlights based on our audits.
We conducted our audits in accordance with the standards of the Public Company Accounting Oversight Board (United States). Those standards require that we plan and perform the audit to obtain reasonable assurance about whether the financial statements and financial highlights are free of material misstatement. The Fund is not required to have, nor were we engaged to perform, an audit of its internal control over financial reporting. Our audits included consideration of internal control over financial reporting as a basis for designing audit procedures that are appropriate in the circumstances, but not for the purpose of expressing an opinion on the effectiveness of the Fund’s internal control over financial reporting. Accordingly, we express no such opinion. An audit also includes examining, on a test basis, evidence supporting the amounts and disclosures in the financial statements, assessing the accounting principles used and significant estimates made by management, as well as evaluating the overall financial statement presentation. Our procedures included confirmation of securities owned as of December 31, 2015, by correspondence with the custodian and brokers; when replies were not received from brokers, we performed other auditing procedures. We believe that our audits provide a reasonable basis for our opinion.
In our opinion, the financial statements and financial highlights referred to above present fairly, in all material respects, the financial position of VP Capital Appreciation Fund of American Century Variable Portfolios, Inc. as of December 31, 2015, the results of its operations for the year then ended, the changes in its net assets for each of the two years in the period then ended, and the financial highlights for each of the periods presented, in conformity with accounting principles generally accepted in the United States of America.
DELOITTE & TOUCHE LLP
Kansas City, Missouri
February 11, 2016
22
| Management |
The Board of Directors
The individuals listed below serve as directors of the funds. Each director will continue to serve in this capacity until death, retirement, resignation or removal from office. The board has adopted a mandatory retirement age for directors who are not “interested persons,” as that term is defined in the Investment Company Act (independent directors). Independent directors shall retire by December 31 of the year in which they reach their 75th birthday.
Mr. Thomas is an “interested person” because he currently serves as President and Chief Executive Officer of American Century Companies, Inc. (ACC), the parent company of American Century Investment Management, Inc. (ACIM or the advisor). Mr. Fink is treated as an “interested person” because of his recent employment with ACC and American Century Services, LLC (ACS). The other directors (more than three-fourths of the total number) are independent. They are not employees, directors or officers of, and have no financial interest in, ACC or any of its wholly owned, direct or indirect, subsidiaries, including ACIM, American Century Investment Services, Inc. (ACIS) and ACS, and they do not have any other affiliations, positions or relationships that would cause them to be considered “interested persons” under the Investment Company Act. The directors serve in this capacity for seven (in the case of Mr. Thomas, 15) registered investment companies in the American Century Investments family of funds.
The following table presents additional information about the directors. The mailing address for each director is 4500 Main Street, Kansas City, Missouri 64111.
| Name (Year of Birth) | Position(s) Held with Funds | Length of Time Served | Principal Occupation(s) During Past 5 Years | Number of American Century Portfolios Overseen by Director | Other Directorships Held During Past 5 Years |
Independent Directors | |||||
| Andrea C. Hall (1945) | Director | Since 1997 | Retired | 80 | None |
| Jan M. Lewis (1957) | Director | Since 2011 | Retired; President and Chief Executive Officer, Catholic Charities of Northeast Kansas (human services organization) (2006 to 2013) | 80 | None |
| James A. Olson (1942) | Director and Chairman of the Board | Since 2007 (Chairman since 2014) | Member, Plaza Belmont LLC (private equity fund manager) | 80 | Saia, Inc. (2002 to 2012) and EPR Properties (2003 to 2013) |
| M. Jeannine Strandjord (1945) | Director | Since 1994 | Retired | 80 | Euronet Worldwide Inc.; MGP Ingredients, Inc.; Charming Shoppes, Inc. (2006 to 2010); and DST Systems Inc. (1996 to 2012) |
| John R. Whitten (1946) | Director | Since 2008 | Retired | 80 | Rudolph Technologies, Inc. |
23
Name (Year of Birth) | Position(s) Held with Funds | Length of Time Served | Principal Occupation(s) During Past 5 Years | Number of American Century Portfolios Overseen by Director | Other Directorships Held During Past 5 Years |
| Independent Directors | |||||
| Stephen E. Yates (1948) | Director | Since 2012 | Retired; Executive Vice President, Technology & Operations, KeyCorp. (computer services) (2004 to 2010) | 80 | Applied Industrial Technologies, Inc. (2001 to 2010) |
| Interested Directors | |||||
| Barry Fink (1955) | Director | Since 2012 | Retired; Executive Vice President, ACC (September 2007 to February 2013); President, ACS (October 2007 to February 2013); Chief Operating Officer, ACC (September 2007 to November 2012) | 80 | None |
| Jonathan S. Thomas (1963) | Director and President | Since 2007 | President and Chief Executive Officer, ACC (March 2007 to present). Also serves as Chief Executive Officer, ACS; Executive Vice President, ACIM; Director, ACC, ACIM and other ACC subsidiaries | 125 | BioMed Valley Discoveries, Inc. |
The Statement of Additional Information has additional information about the fund's directors and is available without charge, upon request, by calling 1-800-378-9878.
24
Officers
The following table presents certain information about the executive officers of the funds. Each officer serves as an officer for each of the 15 investment companies in the American Century family of funds, unless otherwise noted. No officer is compensated for his or her service as an officer of the funds. The listed officers are interested persons of the funds and are appointed or re-appointed on an annual basis. The mailing address for each officer listed below is 4500 Main Street, Kansas City, Missouri 64111.
Name (Year of Birth) | Offices with the Funds | Principal Occupation(s) During the Past Five Years |
| Jonathan S. Thomas (1963) | Director and President since 2007 | President and Chief Executive Officer, ACC (March 2007 to present). Also serves as Chief Executive Officer, ACS; Executive Vice President, ACIM; Director, ACC, ACIM and other ACC subsidiaries |
| Amy D. Shelton (1964) | Chief Compliance Officer and Vice President since 2014 | Chief Compliance Officer, American Century funds, (March 2014 to present); Chief Compliance Officer, ACIM (February 2014 to present); Chief Compliance Officer, ACIS (October 2009 to present); Vice President, Client Interactions and Marketing, ACIS (February 2013 to January 2014); Director, Client Interactions and Marketing, ACIS (June 2007 to January 2013). Also serves as Vice President, ACIS |
| Charles A. Etherington (1957) | General Counsel since 2007 and Senior Vice President since 2006 | Attorney, ACC (February 1994 to present); Vice President, ACC (November 2005 to present); General Counsel, ACC (March 2007 to present). Also serves as General Counsel, ACIM, ACS, ACIS and other ACC subsidiaries; and Senior Vice President, ACIM and ACS |
| C. Jean Wade (1964) | Vice President, Treasurer and Chief Financial Officer since 2012 | Vice President, ACS (February 2000 to present) |
| Robert J. Leach (1966) | Vice President since 2006 and Assistant Treasurer since 2012 | Vice President, ACS (February 2000 to present) |
| David H. Reinmiller (1963) | Vice President since 2000 | Attorney, ACC (January 1994 to present); Associate General Counsel, ACC (January 2001 to present). Also serves as Vice President, ACIM and ACS |
| Ward D. Stauffer (1960) | Secretary since 2005 | Attorney, ACC (June 2003 to present) |
25
| Additional Information |
Proxy Voting Policies
A description of the policies that the fund's investment advisor uses in exercising the voting rights associated with the securities purchased and/or held by the fund is available without charge, upon request, by calling 1-800-378-9878. It is also available on the "About Us" page of American Century Investments’ website at americancentury.com and on the Securities and Exchange Commission’s website at sec.gov. Information regarding how the investment advisor voted proxies relating to portfolio securities during the most recent 12-month period ended June 30 is available on the "About Us" page at americancentury.com. It is also available at sec.gov.
Quarterly Portfolio Disclosure
The fund files its complete schedule of portfolio holdings with the Securities and Exchange Commission (SEC) for the first and third quarters of each fiscal year on Form N-Q. The fund’s Forms N-Q are available on the SEC’s website at sec.gov, and may be reviewed and copied at the SEC’s Public Reference Room in Washington, DC. Information on the operation of the Public Reference Room may be obtained by calling 1-800-SEC-0330. The fund also makes its complete
schedule of portfolio holdings for the most recent quarter of its fiscal year available on its website at ipro.americancentury.com (for Investment Professionals) and, upon request, by calling 1-800-378-9878.
Other Tax Information
The following information is provided pursuant to provisions of the Internal Revenue Code.
The fund hereby designates $31,159,013, or up to the maximum amount allowable, as long-term capital gain distributions for the fiscal year ended December 31, 2015.
26
| Notes |
27
| Notes |
28
| ||
| Contact Us | americancentury.com | |
| Automated Information Line | 1-800-345-8765 | |
| Investment Professional Service Representatives | 1-800-345-6488 | |
| Telecommunications Relay Service for the Deaf | 711 | |
| American Century Variable Portfolios, Inc. | ||
Investment Advisor: American Century Investment Management, Inc. Kansas City, Missouri | ||
| This report and the statements it contains are submitted for the general information of our shareholders. The report is not authorized for distribution to prospective investors unless preceded or accompanied by an effective prospectus. | ||
| ©2016 American Century Proprietary Holdings, Inc. All rights reserved. CL-ANN-88145 1602 | ||
| ANNUAL REPORT | DECEMBER 31, 2015 |
VP Growth Fund
| Table of Contents |
| Performance | 2 | |
| Portfolio Commentary | ||
| Fund Characteristics | ||
| Shareholder Fee Example | ||
| Schedule of Investments | ||
| Statement of Assets and Liabilities | ||
| Statement of Operations | ||
| Statement of Changes in Net Assets | ||
| Notes to Financial Statements | ||
| Financial Highlights | ||
| Report of Independent Registered Public Accounting Firm | ||
| Management | ||
| Additional Information | ||
Any opinions expressed in this report reflect those of the author as of the date of the report, and do not necessarily represent the opinions of American Century Investments® or any other person in the American Century Investments organization. Any such opinions are subject to change at any time based upon market or other conditions and American Century Investments disclaims any responsibility to update such opinions. These opinions may not be relied upon as investment advice and, because investment decisions made by American Century Investments funds are based on numerous factors, may not be relied upon as an indication of trading intent on behalf of any American Century Investments fund. Security examples are used for representational purposes only and are not intended as recommendations to purchase or sell securities. Performance information for comparative indices and securities is provided to American Century Investments by third party vendors. To the best of American Century Investments’ knowledge, such information is accurate at the time of printing.
| Performance |
| Total Returns as of December 31, 2015 | ||||
Average Annual Returns | ||||
Ticker Symbol | 1 year | Since Inception | Inception Date | |
| Class I | AWRIX | 4.71%(1) | 10.08%(1) | 5/2/11 |
| Russell 1000 Growth Index | — | 5.67% | 12.39% | — |
| Class II | AWREX | 4.55%(1) | 9.91%(1) | 5/2/11 |
| (1) | Returns would have been lower if a portion of the management fee had not been waived. |
The performance information presented does not include charges and deductions imposed by the insurance company separate account under the variable annuity or variable life insurance contracts. The inclusion of such charges could significantly lower performance. Please refer to the insurance company separate account prospectus for a discussion of the charges related to insurance contracts.
Data presented reflect past performance. Past performance is no guarantee of future results. Current performance may be higher or lower than the performance shown. Investment return and principal value will fluctuate, and redemption value may be more or less than original cost. Data assumes reinvestment of dividends and capital gains, and none of the charts reflect the deduction of taxes that a shareholder would pay on fund distributions or the redemption of fund shares. To obtain performance data current to the most recent month end, please call 1-800-345-6488 or visit ipro.americancentury.com (for Investment Professionals). For additional information about the fund, please consult the prospectus.
2
| Growth of $10,000 Over Life of Class |
| $10,000 investment made May 2, 2011 |
| Performance for other share classes will vary due to differences in fee structure. |
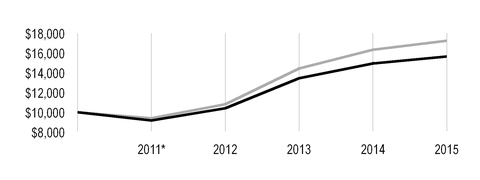
| Value on December 31, 2015 | |
| Class I — $15,655** | |
| Russell 1000 Growth Index — $17,253 | |
| * | From May 2, 2011, Class I’s inception date. Not annualized. |
| ** | Ending value would have been lower if a portion of the management fee had not been waived. |
| Total Annual Fund Operating Expenses | |
| Class I | Class II |
| 1.01% | 1.16% |
The total annual fund operating expenses shown is as stated in the fund’s prospectus current as of the date of this report. The prospectus may vary from the expense ratio shown elsewhere in this report because it is based on a different time period, includes acquired fund fees and expenses, and, if applicable, does not include fee waivers or expense reimbursements.
Data presented reflect past performance. Past performance is no guarantee of future results. Current performance may be higher or lower than the performance shown. Investment return and principal value will fluctuate, and redemption value may be more or less than original cost. Data assumes reinvestment of dividends and capital gains, and none of the charts reflect the deduction of taxes that a shareholder would pay on fund distributions or the redemption of fund shares. To obtain performance data current to the most recent month end, please call 1-800-345-6488 or visit ipro.americancentury.com (for Investment Professionals). For additional information about the fund, please consult the prospectus.
3
| Portfolio Commentary |
Portfolio Managers: Gregory Woodhams and Prescott LeGard
In Janurary 2016, portfolio manager Prescott LeGard left the VP Growth management team and portfolio manager Justin Brown joined the VP Growth management team.
Performance Summary
VP Growth returned 4.55%* for the 12 months ended December 31, 2015, lagging the 5.67% return of the portfolio’s benchmark, the Russell 1000 Growth Index.
U.S. stock indices were mixed during the reporting period as large caps posted modest gains while mid- and small caps declined. The Russell 1000 Growth Index was led by the consumer staples and consumer discretionary sectors, which posted double-digit returns. Information technology stocks also performed well. The energy sector declined sharply while utilities also suffered a significant loss. Materials and industrials declined as global economic weakness hampered stocks closely tied to growth.
The portfolio underperformed the benchmark due to stock selection, especially in the consumer discretionary and energy sectors. An overweight allocation to energy also detracted. Stock selection in information technology, industrials, and materials aided performance. An overweight allocation in information technology and an underweight in materials were also positive.
Consumer Discretionary and Energy Stocks Detracted
Stock selection in the consumer discretionary sector detracted, driven by the hotels, restaurants, and leisure and specialty retail industries. Not owning index components Starbucks, McDonald’s, and Home Depot hampered results in the sector. Starbucks reported strong results, aided by use of its rewards program and new mobile ordering app; McDonald’s benefited from its all-day breakfast and value menus; and Home Depot performed well as the housing industry strengthened.
In the energy sector, Exxon Mobil, which is not in the benchmark, was a key overall detractor as oil prices fell. The holding was eliminated midyear. Low prices hurt demand for energy equipment and services companies as well, and Halliburton led detractors in the industry. Industrials also felt the impact of lower oil prices, including Union Pacific, which declined on prospects of reduced rail volumes. Other leading detractors included baby formula maker Mead Johnson Nutrition, which was hurt by a difficult environment in Hong Kong given concerns about slowing economic growth in China. We believe this is a transitory issue and continue to have a positive view of the underlying growth rate for the company.
Information Technology Led Contributors
Stock selection in the information technology sector, especially among semiconductors and semiconductor equipment and IT services firms, led contributors. In IT services, credit card company Visa was a significant contributor, reporting strong results that beat expectations. The market is looking forward to the potential benefits from an acquisition of Visa Europe. Social media firm Facebook was a major contributor, demonstrating strong topline growth driven by Instagram and video. Video game maker Electronic Arts continued to execute, reporting strong results consistent with our investment thesis of improving operating margins.
| * | All fund returns referenced in this commentary are for Class II shares. Returns would have been lower if a portion of the management fee had not been waived. Performance for other share classes will vary due to differences in fee structure; when Class II performance exceeds that of the fund’s benchmark, other share classes may not. See page 2 for returns for all share classes. |
4
In the materials sector, stock selection in the chemicals industry aided performance. Dow Chemical reported strong results that beat expectations. Its plastics business benefited from a favorable pricing environment due to low input costs (ethane and propane), while several new restructuring initiatives should result in higher capital efficiency. A merger with DuPont that was announced in December should allow beneficial restructuring.
Other significant individual contributors included online travel agent Expedia, which continued to report very strong results with hotel room nights, bookings, and revenue growth all better than expected in both the U.S. and globally. The company benefited from its purchase of rival Orbitz, as well as from exiting its money-losing Chinese partnership. O’Reilly Automotive was a top contributor. The automotive parts retailer continues to report stronger-than-expected sales on favorable trends of higher vehicle miles driven and lower gasoline prices.
Outlook
We believe stock selection—rather than sector allocation or market timing via the use of cash—is the most efficient means of generating superior risk-adjusted returns. As a result of this approach, the portfolio’s sector and industry selection are primarily due to identifying what we believe to be superior individual securities.
As of December 31, 2015, the portfolio’s largest overweight allocation was in the health care sector. We expect medical device companies to see a better environment from higher utilization rates. Pharmaceutical and biotechnology pipelines are robust, with ample clinical trial readouts, and recently launched products are materially additive. The information technology sector was also overweight, driven by positioning in the internet software and services and IT services industries.
The portfolio remains underweight the financials sector, primarily due to a significant underweight in the real estate investment trusts (REITs) industry, which is the largest component of the financials sector in the index. Valuations for REITs appear elevated relative to history and the industry has benefited from declines in interest rates that likely are not sustainable longer term.
5
| Fund Characteristics |
| DECEMBER 31, 2015 | |
| Top Ten Holdings | % of net assets |
| Alphabet, Inc., Class A | 5.9% |
| Apple, Inc. | 5.0% |
| Visa, Inc., Class A | 4.6% |
| Amazon.com, Inc. | 3.8% |
| Facebook, Inc., Class A | 3.6% |
| PepsiCo, Inc. | 3.6% |
| Comcast Corp., Class A | 2.7% |
| Lockheed Martin Corp. | 2.5% |
| Boeing Co. (The) | 2.4% |
| O'Reilly Automotive, Inc. | 2.3% |
| Top Five Industries | % of net assets |
| Internet Software and Services | 10.5% |
| IT Services | 6.7% |
| Pharmaceuticals | 6.6% |
| Biotechnology | 6.4% |
| Internet and Catalog Retail | 6.0% |
| Types of Investments in Portfolio | % of net assets |
| Common Stocks | 97.9% |
| Exchange-Traded Funds | 1.6% |
| Total Equity Exposure | 99.5% |
| Temporary Cash Investments | 0.2% |
| Other Assets and Liabilities | 0.3% |
6
| Shareholder Fee Example |
Fund shareholders may incur two types of costs: (1) transaction costs, including sales charges (loads) on purchase payments and redemption/exchange fees; and (2) ongoing costs, including management fees; distribution and service (12b-1) fees; and other fund expenses. This example is intended to help you understand your ongoing costs (in dollars) of investing in your fund and to compare these costs with the ongoing cost of investing in other mutual funds.
The example is based on an investment of $1,000 made at the beginning of the period and held for the entire period from July 1, 2015 to December 31, 2015.
Actual Expenses
The table provides information about actual account values and actual expenses for each class. You may use the information, together with the amount you invested, to estimate the expenses that you paid over the period. First, identify the share class you own. Then simply divide your account value by $1,000 (for example, an $8,600 account value divided by $1,000 = 8.6), then multiply the result by the number under the heading “Expenses Paid During Period” to estimate the expenses you paid on your account during this period.
Hypothetical Example for Comparison Purposes
The table also provides information about hypothetical account values and hypothetical expenses based on the actual expense ratio of each class of your fund and an assumed rate of return of 5% per year before expenses, which is not the actual return of a fund’s share class. The hypothetical account values and expenses may not be used to estimate the actual ending account balance or expenses you paid for the period. You may use this information to compare the ongoing costs of investing in your fund and other funds. To do so, compare this 5% hypothetical example with the 5% hypothetical examples that appear in the shareholder reports of the other funds.
Please note that the expenses shown in the table are meant to highlight your ongoing costs only and do not reflect any transactional costs, such as sales charges (loads) or redemption/exchange fees. Therefore, the table is useful in comparing ongoing costs only, and will not help you determine the relative total costs of owning different funds. In addition, if these transactional costs were included, your costs would have been higher.
| Beginning Account Value 7/1/15 | Ending Account Value 12/31/15 | Expenses Paid During Period(1)7/1/15 - 12/31/15 | Annualized Expense Ratio(1) | |
| Actual | ||||
| Class I (after waiver) | $1,000 | $1,011.40 | $4.31 | 0.85% |
| Class I (before waiver) | $1,000 | $1,011.40(2) | $5.12 | 1.01% |
| Class II (after waiver) | $1,000 | $1,010.60 | $5.07 | 1.00% |
| Class II (before waiver) | $1,000 | $1,010.60(2) | $5.88 | 1.16% |
| Hypothetical | ||||
| Class I (after waiver) | $1,000 | $1,020.92 | $4.33 | 0.85% |
| Class I (before waiver) | $1,000 | $1,020.11 | $5.14 | 1.01% |
| Class II (after waiver) | $1,000 | $1,020.16 | $5.09 | 1.00% |
| Class II (before waiver) | $1,000 | $1,019.36 | $5.90 | 1.16% |
| (1) | Expenses are equal to the class's annualized expense ratio listed in the table above, multiplied by the average account value over the period, multiplied by 184, the number of days in the most recent fiscal half-year, divided by 365, to reflect the one-half year period. |
| (2) | Ending account value assumes the return earned after waiver and would have been lower if a portion of the management fee had not been waived. |
7
| Schedule of Investments |
DECEMBER 31, 2015
| Shares | Value | ||||
| COMMON STOCKS — 97.9% | |||||
| Aerospace and Defense — 4.9% | |||||
| Boeing Co. (The) | 893 | $ | 129,119 | ||
| Lockheed Martin Corp. | 639 | 138,759 | |||
| 267,878 | |||||
| Airlines — 1.4% | |||||
| Alaska Air Group, Inc. | 413 | 33,251 | |||
| Delta Air Lines, Inc. | 867 | 43,948 | |||
| 77,199 | |||||
| Beverages — 3.6% | |||||
| PepsiCo, Inc. | 1,942 | 194,045 | |||
| Biotechnology — 6.4% | |||||
Alexion Pharmaceuticals, Inc.(1) | 249 | 47,497 | |||
| Amgen, Inc. | 206 | 33,440 | |||
Biogen, Inc.(1) | 312 | 95,581 | |||
| Gilead Sciences, Inc. | 1,045 | 105,744 | |||
Incyte Corp.(1) | 247 | 26,787 | |||
Regeneron Pharmaceuticals, Inc.(1) | 74 | 40,172 | |||
| 349,221 | |||||
| Chemicals — 3.5% | |||||
| Dow Chemical Co. (The) | 1,207 | 62,136 | |||
| LyondellBasell Industries NV, Class A | 322 | 27,982 | |||
| PPG Industries, Inc. | 414 | 40,912 | |||
| Sherwin-Williams Co. (The) | 235 | 61,006 | |||
| 192,036 | |||||
| Communications Equipment — 0.7% | |||||
| Cisco Systems, Inc. | 1,388 | 37,691 | |||
| Energy Equipment and Services — 0.6% | |||||
| Halliburton Co. | 1,036 | 35,265 | |||
| Food and Staples Retailing — 1.3% | |||||
| Kroger Co. (The) | 1,721 | 71,989 | |||
| Food Products — 1.1% | |||||
| Mead Johnson Nutrition Co. | 745 | 58,818 | |||
| Health Care Equipment and Supplies — 2.4% | |||||
| C.R. Bard, Inc. | 179 | 33,910 | |||
| Cooper Cos., Inc. (The) | 294 | 39,455 | |||
Edwards Lifesciences Corp.(1) | 286 | 22,588 | |||
Intuitive Surgical, Inc.(1) | 61 | 33,316 | |||
| 129,269 | |||||
| Health Care Providers and Services — 3.1% | |||||
| Cardinal Health, Inc. | 815 | 72,755 | |||
Express Scripts Holding Co.(1) | 1,032 | 90,207 | |||
VCA, Inc.(1) | 86 | 4,730 | |||
| 167,692 | |||||
| Health Care Technology — 0.7% | |||||
Cerner Corp.(1) | 637 | 38,328 | |||
| Hotels, Restaurants and Leisure — 0.4% | |||||
| Las Vegas Sands Corp. | 444 | 19,465 | |||
| Household Products — 0.8% | |||||
| Church & Dwight Co., Inc. | 499 | 42,355 | |||
8
| Shares | Value | ||||
| Industrial Conglomerates — 1.7% | |||||
| 3M Co. | 611 | $ | 92,041 | ||
| Insurance — 1.5% | |||||
| Aflac, Inc. | 555 | 33,244 | |||
| American International Group, Inc. | 808 | 50,072 | |||
| 83,316 | |||||
| Internet and Catalog Retail — 6.0% | |||||
Amazon.com, Inc.(1) | 305 | 206,146 | |||
| Expedia, Inc. | 710 | 88,253 | |||
TripAdvisor, Inc.(1) | 394 | 33,589 | |||
| 327,988 | |||||
| Internet Software and Services — 10.5% | |||||
Alphabet, Inc., Class A(1) | 413 | 321,318 | |||
Facebook, Inc., Class A(1) | 1,898 | 198,645 | |||
LinkedIn Corp., Class A(1) | 174 | 39,164 | |||
Pandora Media, Inc.(1) | 1,163 | 15,596 | |||
| 574,723 | |||||
| IT Services — 6.7% | |||||
Alliance Data Systems Corp.(1) | 133 | 36,784 | |||
Cognizant Technology Solutions Corp., Class A(1) | 308 | 18,486 | |||
Fiserv, Inc.(1) | 637 | 58,260 | |||
| Visa, Inc., Class A | 3,237 | 251,029 | |||
| 364,559 | |||||
| Life Sciences Tools and Services — 0.9% | |||||
Illumina, Inc.(1) | 90 | 17,275 | |||
Mettler-Toledo International, Inc.(1) | 32 | 10,852 | |||
Waters Corp.(1) | 149 | 20,053 | |||
| 48,180 | |||||
| Machinery — 1.8% | |||||
| Parker-Hannifin Corp. | 288 | 27,930 | |||
WABCO Holdings, Inc.(1) | 329 | 33,644 | |||
| Wabtec Corp. | 533 | 37,907 | |||
| 99,481 | |||||
| Media — 5.4% | |||||
| Comcast Corp., Class A | 2,597 | 146,549 | |||
Sirius XM Holdings, Inc.(1) | 7,086 | 28,840 | |||
| Walt Disney Co. (The) | 1,128 | 118,530 | |||
| 293,919 | |||||
| Multiline Retail — 1.6% | |||||
Dollar Tree, Inc.(1) | 1,165 | 89,961 | |||
| Oil, Gas and Consumable Fuels — 0.6% | |||||
Concho Resources, Inc.(1) | 380 | 35,287 | |||
| Personal Products — 1.0% | |||||
| Estee Lauder Cos., Inc. (The), Class A | 623 | 54,861 | |||
| Pharmaceuticals — 6.6% | |||||
Allergan plc(1) | 141 | 44,062 | |||
| Bristol-Myers Squibb Co. | 1,258 | 86,538 | |||
Jazz Pharmaceuticals plc(1) | 40 | 5,622 | |||
| Johnson & Johnson | 189 | 19,414 | |||
| Perrigo Co. plc | 481 | 69,601 | |||
| Pfizer, Inc. | 1,667 | 53,811 | |||
| Teva Pharmaceutical Industries Ltd. ADR | 687 | 45,095 | |||
| Zoetis, Inc. | 698 | 33,448 | |||
| 357,591 | |||||
9
| Shares | Value | ||||
| Real Estate Investment Trusts (REITs) — 1.0% | |||||
| Simon Property Group, Inc. | 280 | $ | 54,443 | ||
| Road and Rail — 0.8% | |||||
| Union Pacific Corp. | 525 | 41,055 | |||
| Semiconductors and Semiconductor Equipment — 2.2% | |||||
| Maxim Integrated Products, Inc. | 1,159 | 44,042 | |||
| Skyworks Solutions, Inc. | 247 | 18,977 | |||
| Xilinx, Inc. | 1,178 | 55,331 | |||
| 118,350 | |||||
| Software — 5.5% | |||||
Adobe Systems, Inc.(1) | 583 | 54,767 | |||
Electronic Arts, Inc.(1) | 326 | 22,403 | |||
| Microsoft Corp. | 1,377 | 76,396 | |||
| Oracle Corp. | 2,482 | 90,668 | |||
Splunk, Inc.(1) | 561 | 32,992 | |||
| Symantec Corp. | 1,130 | 23,730 | |||
| 300,956 | |||||
| Specialty Retail — 5.3% | |||||
O'Reilly Automotive, Inc.(1) | 492 | 124,683 | |||
| Ross Stores, Inc. | 1,024 | 55,101 | |||
| TJX Cos., Inc. (The) | 1,320 | 93,601 | |||
| Williams-Sonoma, Inc. | 320 | 18,691 | |||
| 292,076 | |||||
| Technology Hardware, Storage and Peripherals — 5.0% | |||||
| Apple, Inc. | 2,610 | 274,729 | |||
| Textiles, Apparel and Luxury Goods — 0.7% | |||||
| Carter's, Inc. | 409 | 36,413 | |||
| Tobacco — 1.2% | |||||
| Philip Morris International, Inc. | 772 | 67,866 | |||
| Wireless Telecommunication Services — 1.0% | |||||
SBA Communications Corp., Class A(1) | 539 | 56,633 | |||
TOTAL COMMON STOCKS (Cost $4,394,618) | 5,345,679 | ||||
| EXCHANGE-TRADED FUNDS — 1.6% | |||||
iShares Russell 1000 Growth ETF (Cost $86,791) | 859 | 85,453 | |||
| TEMPORARY CASH INVESTMENTS — 0.2% | |||||
State Street Institutional Liquid Reserves Fund, Premier Class (Cost $11,289) | 11,289 | 11,289 | |||
TOTAL INVESTMENT SECURITIES — 99.7% (Cost $4,492,698) | 5,442,421 | ||||
| OTHER ASSETS AND LIABILITIES — 0.3% | 16,756 | ||||
| TOTAL NET ASSETS — 100.0% | $ | 5,459,177 | |||
| NOTES TO SCHEDULE OF INVESTMENTS | ||
| ADR | - | American Depositary Receipt |
| (1) | Non-income producing. |
See Notes to Financial Statements.
10
| Statement of Assets and Liabilities |
| DECEMBER 31, 2015 | |||
| Assets | |||
| Investment securities, at value (cost of $4,492,698) | $ | 5,442,421 | |
| Receivable for investments sold | 21,655 | ||
| Dividends and interest receivable | 4,623 | ||
| 5,468,699 | |||
| Liabilities | |||
| Payable for investments purchased | 4,713 | ||
| Payable for capital shares redeemed | 148 | ||
| Accrued management fees | 3,529 | ||
| Distribution fees payable | 1,132 | ||
| 9,522 | |||
| Net Assets | $ | 5,459,177 | |
| Net Assets Consist of: | |||
| Capital (par value and paid-in surplus) | $ | 4,518,271 | |
| Accumulated net realized loss | (8,817 | ) | |
| Net unrealized appreciation | 949,723 | ||
| $ | 5,459,177 | ||
| Net Assets | Shares Outstanding | Net Asset Value Per Share | ||||
| Class I, $0.01 Par Value | $183,241 | 14,355 | $12.76 | |||
| Class II, $0.01 Par Value | $5,275,936 | 413,375 | $12.76 | |||
See Notes to Financial Statements.
11
| Statement of Operations |
| YEAR ENDED DECEMBER 31, 2015 | |||
| Investment Income (Loss) | |||
| Income: | |||
| Dividends (net of foreign taxes withheld of $133) | $ | 75,612 | |
| Interest | 23 | ||
| 75,635 | |||
| Expenses: | |||
| Management fees | 53,078 | ||
| Distribution fees - Class II | 13,719 | ||
| Directors' fees and expenses | 212 | ||
| Other expenses | 42 | ||
| 67,051 | |||
| Fees waived | (9,136 | ) | |
| 57,915 | |||
| Net investment income (loss) | 17,720 | ||
| Realized and Unrealized Gain (Loss) | |||
| Net realized gain (loss) on: | |||
| Investment transactions | 236,695 | ||
| Futures contract transactions | (129 | ) | |
| 236,566 | |||
| Change in net unrealized appreciation (depreciation) on investments | 52,103 | ||
| Net realized and unrealized gain (loss) | 288,669 | ||
| Net Increase (Decrease) in Net Assets Resulting from Operations | $ | 306,389 | |
See Notes to Financial Statements.
12
| Statement of Changes in Net Assets |
| YEARS ENDED DECEMBER 31, 2015 AND DECEMBER 31, 2014 | ||||||
| Increase (Decrease) in Net Assets | December 31, 2015 | December 31, 2014 | ||||
| Operations | ||||||
| Net investment income (loss) | $ | 17,720 | $ | 14,185 | ||
| Net realized gain (loss) | 236,566 | 801,876 | ||||
| Change in net unrealized appreciation (depreciation) | 52,103 | (162,256 | ) | |||
| Net increase (decrease) in net assets resulting from operations | 306,389 | 653,805 | ||||
| Distributions to Shareholders | ||||||
| From net investment income: | ||||||
| Class I | (881 | ) | (2,742 | ) | ||
| Class II | (17,359 | ) | (11,994 | ) | ||
| From net realized gains: | ||||||
| Class I | (21,870 | ) | (86,281 | ) | ||
| Class II | (317,045 | ) | (634,284 | ) | ||
| Decrease in net assets from distributions | (357,155 | ) | (735,301 | ) | ||
| Capital Share Transactions | ||||||
| Net increase (decrease) in net assets from capital share transactions (Note 5) | (705,117 | ) | 644,418 | |||
| Net increase (decrease) in net assets | (755,883 | ) | 562,922 | |||
| Net Assets | ||||||
| Beginning of period | 6,215,060 | 5,652,138 | ||||
| End of period | $ | 5,459,177 | $ | 6,215,060 | ||
See Notes to Financial Statements.
13
| Notes to Financial Statements |
DECEMBER 31, 2015
1. Organization
American Century Variable Portfolios, Inc. (the corporation) is registered under the Investment Company Act of 1940, as amended (the 1940 Act), as an open-end management investment company and is organized as a Maryland corporation. VP Growth Fund (the fund) is one fund in a series issued by the corporation. The fund is diversified as defined under the 1940 Act. The fund’s investment objective is to seek long-term capital growth.
The fund offers Class I and Class II. The share classes differ principally in their respective distribution and shareholder servicing expenses and arrangements. Class II is charged a lower unified management fee because it has a separate arrangement for distribution services.
2. Significant Accounting Policies
The following is a summary of significant accounting policies consistently followed by the fund in preparation of its financial statements. The fund is an investment company and follows accounting and reporting guidance in accordance with accounting principles generally accepted in the United States of America. This may require management to make certain estimates and assumptions at the date of the financial statements. Actual results could differ from these estimates. Management evaluated the impact of events or transactions occurring through the date the financial statements were issued that would merit recognition or disclosure.
Investment Valuations — The fund determines the fair value of its investments and computes its net asset value per share at the close of regular trading (usually 4 p.m. Eastern time) on the New York Stock Exchange (NYSE) on each day the NYSE is open. The Board of Directors has adopted valuation policies and procedures to guide the investment advisor in the fund’s investment valuation process and to provide methodologies for the oversight of the fund’s pricing function.
Equity securities that are listed or traded on a domestic securities exchange are valued at the last reported sales price or at the official closing price as provided by the exchange. Equity securities traded on foreign securities exchanges are generally valued at the closing price of such securities on the exchange where primarily traded or at the close of the NYSE, if that is earlier. If no last sales price is reported, or if local convention or regulation so provides, the mean of the latest bid and asked prices may be used. Securities traded over-the-counter are valued at the mean of the latest bid and asked prices, the last sales price, or the official closing price.
Open-end management investment companies are valued at the reported net asset value per share. Repurchase agreements are valued at cost, which approximates fair value. Exchange-traded futures contracts are valued at the settlement price as provided by the appropriate clearing corporation.
If the fund determines that the market price for an investment is not readily available or the valuation methods mentioned above do not reflect an investment’s fair value, such investment is valued as determined in good faith by the Board of Directors or its delegate, in accordance with policies and procedures adopted by the Board of Directors. In its determination of fair value, the fund may review several factors including, but not limited to, market information regarding the specific investment or comparable investments and correlation with other investment types, futures indices or general market indicators. Circumstances that may cause the fund to use these procedures to value an investment include, but are not limited to: an investment has been declared in default or is distressed; trading in a security has been suspended during the trading day or a security is not actively trading on its principal exchange; prices received from a regular pricing source are deemed unreliable; or there is a foreign market holiday and no trading occurred.
The fund monitors for significant events occurring after the close of an investment’s primary exchange but before the fund’s net asset value per share is determined. Significant events may include, but are not limited to: corporate announcements and transactions; governmental action and political unrest that could impact a specific investment or an investment sector; or armed conflicts, natural disasters and similar events that could affect investments in a specific country or region. The fund also monitors for significant fluctuations between domestic and foreign markets, as evidenced by the U.S. market or such other indicators that the Board of Directors, or its delegate, deems appropriate. If significant fluctuations in foreign markets are identified, the
14
fund may apply a model-derived factor to the closing price of equity securities traded on foreign securities exchanges. The factor is based on observable market data as provided by an independent pricing service.
Security Transactions — Security transactions are accounted for as of the trade date. Net realized gains and losses are determined on the identified cost basis, which is also used for federal income tax purposes.
Investment Income — Dividend income less foreign taxes withheld, if any, is recorded as of the ex-dividend date. Distributions received on securities that represent a return of capital or long-term capital gain are recorded as a reduction of cost of investments and/or as a realized gain. The fund may estimate the components of distributions received that may be considered nontaxable distributions or long-term capital gain distributions for income tax purposes. Interest income is recorded on the accrual basis and includes accretion of discounts and amortization of premiums.
Repurchase Agreements — The fund may enter into repurchase agreements with institutions that American Century Investment Management, Inc. (ACIM) (the investment advisor) has determined are creditworthy pursuant to criteria adopted by the Board of Directors. The fund requires that the collateral, represented by securities, received in a repurchase transaction be transferred to the custodian in a manner sufficient to enable the fund to obtain those securities in the event of a default under the repurchase agreement. ACIM monitors, on a daily basis, the securities transferred to ensure the value, including accrued interest, of the securities under each repurchase agreement is equal to or greater than amounts owed to the fund under each repurchase agreement.
Joint Trading Account — Pursuant to an Exemptive Order issued by the Securities and Exchange Commission, the fund, along with certain other funds in the American Century Investments family of funds, may transfer uninvested cash balances into a joint trading account. These balances are invested in one or more repurchase agreements that are collateralized by U.S. Treasury or Agency obligations.
Segregated Assets — In accordance with the 1940 Act, the fund segregates assets on its books and records to cover futures contracts. ACIM monitors, on a daily basis, the securities segregated to ensure the fund designates a sufficient amount of liquid assets, marked-to-market daily. The fund may also receive assets or be required to pledge assets at the custodian bank or with a broker for margin requirements on futures contracts.
Income Tax Status — It is the fund’s policy to distribute substantially all net investment income and net realized gains to shareholders and to otherwise qualify as a regulated investment company under provisions of the Internal Revenue Code. Accordingly, no provision has been made for income taxes. The fund files U.S. federal, state, local and non-U.S. tax returns as applicable. The fund's tax returns are subject to examination by the relevant taxing authority until expiration of the applicable statute of limitations, which is generally three years from the date of filing but can be longer in certain jurisdictions. At this time, management believes there are no uncertain tax positions which, based on their technical merit, would not be sustained upon examination and for which it is reasonably possible that the total amounts of unrecognized tax benefits will significantly change in the next twelve months.
Multiple Class — All shares of the fund represent an equal pro rata interest in the net assets of the class to which such shares belong, and have identical voting, dividend, liquidation and other rights and the same terms and conditions, except for class specific expenses and exclusive rights to vote on matters affecting only individual classes. Income, non-class specific expenses, and realized and unrealized capital gains and losses of the fund are allocated to each class of shares based on their relative net assets.
Distributions to Shareholders — Distributions from net investment income and net realized gains, if any, are generally declared and paid annually. The fund may make distributions on a more frequent basis to comply with the distribution requirements of the Internal Revenue Code, in all events in a manner consistent with provisions of the 1940 Act.
Indemnifications — Under the corporation’s organizational documents, its officers and directors are indemnified against certain liabilities arising out of the performance of their duties to the fund. In addition, in the normal course of business, the fund enters into contracts that provide general indemnifications. The maximum exposure under these arrangements is unknown as this would involve future claims that may be made against a fund. The risk of material loss from such claims is considered by management to be remote.
15
3. Fees and Transactions with Related Parties
Certain officers and directors of the corporation are also officers and/or directors of American Century Companies, Inc. (ACC). The corporation’s investment advisor, ACIM, the corporation's distributor, American Century Investment Services, Inc. (ACIS), and the corporation’s transfer agent, American Century Services, LLC, are wholly owned, directly or indirectly, by ACC.
Management Fees — The corporation has entered into a management agreement with ACIM, under which ACIM provides the fund with investment advisory and management services in exchange for a single, unified management fee (the fee) per class. The agreement provides that all expenses of managing and operating the fund, except distribution fees, brokerage expenses, taxes, interest, fees and expenses of the independent directors (including legal counsel fees), and extraordinary expenses, will be paid by ACIM. The fee is computed and accrued daily based on each class's daily net assets and paid monthly in arrears. The annual management fee for each class is 1.00% and 0.90% for Class I and Class II, respectively. From January 1, 2015 through July 31, 2015, the investment advisor voluntarily agreed to waive 0.16% of the fund's management fee. Effective August 1, 2015, the investment advisor voluntarily agreed to waive 0.15% of the fund's management fee. The investment advisor expects this waiver to continue until April 30, 2017 and cannot terminate it prior to such date without the approval of the Board of Directors. The total amount of the waiver for each class for the year ended December 31, 2015 was $583 and $8,553 for Class I and Class II, respectively. The effective annual management fee after waiver for each class for the year ended December 31, 2015 was 0.85% and 0.75% for Class I and Class II, respectively.
Distribution Fees — The Board of Directors has adopted the Master Distribution Plan (the plan) for Class II, pursuant to Rule 12b-1 of the 1940 Act. The plan provides that Class II will pay ACIS an annual distribution fee equal to 0.25%. The fee is computed and accrued daily based on the Class II daily net assets and paid monthly in arrears. The distribution fee provides compensation for expenses incurred in connection with distributing shares of Class II including, but not limited to, payments to brokers, dealers, and financial institutions that have entered into sales agreements with respect to shares of the fund. Fees incurred under the plan during the year ended December 31, 2015 are detailed in the Statement of Operations.
Directors' Fees and Expenses — The Board of Directors is responsible for overseeing the investment advisor’s management and operations of the fund. The directors receive detailed information about the fund and its investment advisor regularly throughout the year, and meet at least quarterly with management of the investment advisor to review reports about fund operations. The fund’s officers do not receive compensation from the fund.
4. Investment Transactions
Purchases and sales of investment securities, excluding short-term investments, for the year ended December 31, 2015 were $3,963,598 and $5,012,504, respectively.
5. Capital Share Transactions
Transactions in shares of the fund were as follows:
| Year ended December 31, 2015 | Year ended December 31, 2014 | |||||||||
| Shares | Amount | Shares | Amount | |||||||
| Class I/Shares Authorized | 50,000,000 | 50,000,000 | ||||||||
| Issued in reinvestment of distributions | 1,728 | $ | 22,751 | 6,784 | $ | 89,023 | ||||
| Redeemed | (44,877 | ) | (600,163 | ) | — | — | ||||
| (43,149 | ) | (577,412 | ) | 6,784 | 89,023 | |||||
| Class II/Shares Authorized | 50,000,000 | 50,000,000 | ||||||||
| Sold | 61,381 | 793,395 | 195,007 | 2,685,154 | ||||||
| Issued in reinvestment of distributions | 25,679 | 334,404 | 49,244 | 646,278 | ||||||
| Redeemed | (94,339 | ) | (1,255,504 | ) | (199,410 | ) | (2,776,037 | ) | ||
| (7,279 | ) | (127,705 | ) | 44,841 | 555,395 | |||||
| Net increase (decrease) | (50,428 | ) | $ | (705,117 | ) | 51,625 | $ | 644,418 | ||
16
6. Fair Value Measurements
The fund’s investments valuation process is based on several considerations and may use multiple inputs to determine the fair value of the investments held by the fund. In conformity with accounting principles generally accepted in the United States of America, the inputs used to determine a valuation are classified into three broad levels.
| • | Level 1 valuation inputs consist of unadjusted quoted prices in an active market for identical investments. |
| • | Level 2 valuation inputs consist of direct or indirect observable market data (including quoted prices for comparable investments, evaluations of subsequent market events, interest rates, prepayment speeds, credit risk, etc.). These inputs also consist of quoted prices for identical investments initially expressed in local currencies that are adjusted through translation into U.S. dollars. |
| • | Level 3 valuation inputs consist of unobservable data (including a fund’s own assumptions). |
The level classification is based on the lowest level input that is significant to the fair valuation measurement. The valuation inputs are not necessarily an indication of the risks associated with investing in these securities or other financial instruments. There were no significant transfers between levels during the period.
As of period end, the fund’s investment securities were classified as Level 1. The Schedule of Investments provides additional information on the fund's portfolio holdings.
7. Derivative Instruments
Equity Price Risk — The fund is subject to equity price risk in the normal course of pursuing its investment objectives. A fund may enter into futures contracts based on an equity index in order to manage its exposure to changes in market conditions. A fund may purchase futures contracts to gain exposure to increases in market value or sell futures contracts to protect against a decline in market value. Upon entering into a futures contract, a fund is required to deposit either cash or securities in an amount equal to a certain percentage of the contract value (initial margin). Subsequent payments (variation margin) are made or received daily, in cash, by a fund. The variation margin is equal to the daily change in the contract value and is recorded as unrealized gains and losses. A fund recognizes a realized gain or loss when the contract is closed or expires. Net realized and unrealized gains or losses occurring during the holding period of futures contracts are a component of net realized gain (loss) on futures contract transactions and change in net unrealized appreciation (depreciation) on futures contracts, respectively. One of the risks of entering into futures contracts is the possibility that the change in value of the contract may not correlate with the changes in value of the underlying securities. During the period, the fund participated in equity price risk derivative instruments for temporary investment purposes.
At period end, the fund did not have any derivative instruments disclosed on the Statement of Assets and Liabilities. For the year ended December 31, 2015, the effect of equity price risk derivative instruments on the Statement of Operations was $(129) in net realized gain (loss) on futures contract transactions.
8. Federal Tax Information
The tax character of distributions paid during the years ended December 31, 2015 and December 31, 2014 were as follows:
| 2015 | 2014 | |||||
| Distributions Paid From | ||||||
| Ordinary income | $ | 113,876 | $ | 166,222 | ||
| Long-term capital gains | $ | 243,279 | $ | 569,079 | ||
The book-basis character of distributions made during the year from net investment income or net realized gains may differ from their ultimate characterization for federal income tax purposes. These differences reflect the differing character of certain income items and net realized gains and losses for financial statement and tax purposes, and may result in reclassification among certain capital accounts on the financial statements.
17
As of December 31, 2015, the federal tax cost of investments and the components of distributable earnings on a tax-basis were as follows:
| Federal tax cost of investments | $ | 4,520,696 | |
| Gross tax appreciation of investments | $ | 1,005,792 | |
| Gross tax depreciation of investments | (84,067 | ) | |
| Net tax appreciation (depreciation) of investments | $ | 921,725 | |
| Undistributed ordinary income | — | ||
| Accumulated long-term gains | $ | 19,181 | |
The difference between book-basis and tax-basis unrealized appreciation (depreciation) is attributable primarily to the tax deferral of losses on wash sales.
18
| Financial Highlights |
| For a Share Outstanding Throughout the Years Ended December 31 (except as noted) | |||||||||||||||||
| Per-Share Data | Ratios and Supplemental Data | ||||||||||||||||
| Income From Investment Operations: | Distributions From: | Ratio to Average Net Assets of: | |||||||||||||||
| Net Asset Value, Beginning of Period | Net Investment Income (Loss)(1) | Net Realized and Unrealized Gain (Loss) | Total From Investment Operations | Net Investment Income | Net Realized Gains | Total Distributions | Net Asset Value, End of Period | Total Return(2) | Operating Expenses | Operating Expenses (before expense waiver) | Net Investment Income (Loss) | Net Investment Income (Loss) (before expense waiver) | Portfolio Turnover Rate | Net Assets, End of Period (in thousands) | |||
| Class I | |||||||||||||||||
| 2015 | $13.00 | 0.05 | 0.56 | 0.61 | (0.06) | (0.79) | (0.85) | $12.76 | 4.71% | 0.85% | 1.00% | 0.44% | 0.29% | 69% | $183 | ||
| 2014 | $13.25 | 0.05 | 1.43 | 1.48 | (0.05) | (1.68) | (1.73) | $13.00 | 11.24% | 0.93% | 1.00% | 0.37% | 0.30% | 128% | $748 | ||
| 2013 | $10.31 | 0.06 | 2.94 | 3.00 | (0.05) | (0.01) | (0.06) | $13.25 | 29.11% | 1.01% | 1.01% | 0.49% | 0.49% | 122% | $672 | ||
| 2012 | $9.12 | 0.07 | 1.17 | 1.24 | (0.05) | — | (0.05) | $10.31 | 13.66% | 1.01% | 1.01% | 0.73% | 0.73% | 78% | $521 | ||
2011(3) | $10.00 | 0.04 | (0.88) | (0.84) | (0.04) | — | (0.04) | $9.12 | (8.41)% | 1.00%(4) | 1.00%(4) | 0.64%(4) | 0.64%(4) | 66% | $458 | ||
| Class II | |||||||||||||||||
| 2015 | $13.00 | 0.04 | 0.55 | 0.59 | (0.04) | (0.79) | (0.83) | $12.76 | 4.55% | 1.00% | 1.15% | 0.29% | 0.14% | 69% | $5,276 | ||
| 2014 | $13.25 | 0.03 | 1.43 | 1.46 | (0.03) | (1.68) | (1.71) | $13.00 | 11.07% | 1.08% | 1.15% | 0.22% | 0.15% | 128% | $5,468 | ||
| 2013 | $10.31 | 0.04 | 2.94 | 2.98 | (0.03) | (0.01) | (0.04) | $13.25 | 28.92% | 1.16% | 1.16% | 0.34% | 0.34% | 122% | $4,980 | ||
| 2012 | $9.12 | 0.06 | 1.17 | 1.23 | (0.04) | — | (0.04) | $10.31 | 13.49% | 1.16% | 1.16% | 0.58% | 0.58% | 78% | $1,318 | ||
2011(3) | $10.00 | 0.03 | (0.88) | (0.85) | (0.03) | — | (0.03) | $9.12 | (8.50)% | 1.15%(4) | 1.15%(4) | 0.49%(4) | 0.49%(4) | 66% | $458 | ||
| Notes to Financial Highlights | ||||
| (1) | Computed using average shares outstanding throughout the period. |
| (2) | Total returns are calculated based on the net asset value of the last business day. Total returns for periods less than one year are not annualized. |
| (3) | May 2, 2011 (fund inception) through December 31, 2011. |
| (4) | Annualized. |
See Notes to Financial Statements.
19
| Report of Independent Registered Public Accounting Firm |
To the Board of Directors and Shareholders of American Century Variable Portfolios, Inc.:
We have audited the accompanying statement of assets and liabilities, including the schedule of investments, of VP Growth Fund (the “Fund”), one of the funds constituting American Century Variable Portfolios, Inc., as of December 31, 2015, and the related statement of operations for the year then ended, the statements of changes in net assets for each of the two years in the period then ended, and the financial highlights for each of the periods presented. These financial statements and financial highlights are the responsibility of the Fund’s management. Our responsibility is to express an opinion on these financial statements and financial highlights based on our audits.
We conducted our audits in accordance with the standards of the Public Company Accounting Oversight Board (United States). Those standards require that we plan and perform the audit to obtain reasonable assurance about whether the financial statements and financial highlights are free of material misstatement. The Fund is not required to have, nor were we engaged to perform, an audit of its internal control over financial reporting. Our audits included consideration of internal control over financial reporting as a basis for designing audit procedures that are appropriate in the circumstances, but not for the purpose of expressing an opinion on the effectiveness of the Fund’s internal control over financial reporting. Accordingly, we express no such opinion. An audit also includes examining, on a test basis, evidence supporting the amounts and disclosures in the financial statements, assessing the accounting principles used and significant estimates made by management, as well as evaluating the overall financial statement presentation. Our procedures included confirmation of securities owned as of December 31, 2015, by correspondence with the custodian and brokers; when replies were not received from brokers, we performed other auditing procedures. We believe that our audits provide a reasonable basis for our opinion.
In our opinion, the financial statements and financial highlights referred to above present fairly, in all material respects, the financial position of VP Growth Fund of American Century Variable Portfolios, Inc. as of December 31, 2015, the results of its operations for the year then ended, the changes in its net assets for each of the two years in the period then ended, and the financial highlights for each of the periods presented, in conformity with accounting principles generally accepted in the United States of America.
DELOITTE & TOUCHE LLP
Kansas City, Missouri
February 11, 2016
20
| Management |
The Board of Directors
The individuals listed below serve as directors of the funds. Each director will continue to serve in this capacity until death, retirement, resignation or removal from office. The board has adopted a mandatory retirement age for directors who are not “interested persons,” as that term is defined in the Investment Company Act (independent directors). Independent directors shall retire by December 31 of the year in which they reach their 75th birthday.
Mr. Thomas is an “interested person” because he currently serves as President and Chief Executive Officer of American Century Companies, Inc. (ACC), the parent company of American Century Investment Management, Inc. (ACIM or the advisor). Mr. Fink is treated as an “interested person” because of his recent employment with ACC and American Century Services, LLC (ACS). The other directors (more than three-fourths of the total number) are independent. They are not employees, directors or officers of, and have no financial interest in, ACC or any of its wholly owned, direct or indirect, subsidiaries, including ACIM, American Century Investment Services, Inc. (ACIS) and ACS, and they do not have any other affiliations, positions or relationships that would cause them to be considered “interested persons” under the Investment Company Act. The directors serve in this capacity for seven (in the case of Mr. Thomas, 15) registered investment companies in the American Century Investments family of funds.
The following table presents additional information about the directors. The mailing address for each director is 4500 Main Street, Kansas City, Missouri 64111.
| Name (Year of Birth) | Position(s) Held with Funds | Length of Time Served | Principal Occupation(s) During Past 5 Years | Number of American Century Portfolios Overseen by Director | Other Directorships Held During Past 5 Years |
Independent Directors | |||||
| Andrea C. Hall (1945) | Director | Since 1997 | Retired | 80 | None |
| Jan M. Lewis (1957) | Director | Since 2011 | Retired; President and Chief Executive Officer, Catholic Charities of Northeast Kansas (human services organization) (2006 to 2013) | 80 | None |
| James A. Olson (1942) | Director and Chairman of the Board | Since 2007 (Chairman since 2014) | Member, Plaza Belmont LLC (private equity fund manager) | 80 | Saia, Inc. (2002 to 2012) and EPR Properties (2003 to 2013) |
| M. Jeannine Strandjord (1945) | Director | Since 1994 | Retired | 80 | Euronet Worldwide Inc.; MGP Ingredients, Inc.; Charming Shoppes, Inc. (2006 to 2010); and DST Systems Inc. (1996 to 2012) |
| John R. Whitten (1946) | Director | Since 2008 | Retired | 80 | Rudolph Technologies, Inc. |
21
Name (Year of Birth) | Position(s) Held with Funds | Length of Time Served | Principal Occupation(s) During Past 5 Years | Number of American Century Portfolios Overseen by Director | Other Directorships Held During Past 5 Years |
| Independent Directors | |||||
| Stephen E. Yates (1948) | Director | Since 2012 | Retired; Executive Vice President, Technology & Operations, KeyCorp. (computer services) (2004 to 2010) | 80 | Applied Industrial Technologies, Inc. (2001 to 2010) |
| Interested Directors | |||||
| Barry Fink (1955) | Director | Since 2012 | Retired; Executive Vice President, ACC (September 2007 to February 2013); President, ACS (October 2007 to February 2013); Chief Operating Officer, ACC (September 2007 to November 2012) | 80 | None |
| Jonathan S. Thomas (1963) | Director and President | Since 2007 | President and Chief Executive Officer, ACC (March 2007 to present). Also serves as Chief Executive Officer, ACS; Executive Vice President, ACIM; Director, ACC, ACIM and other ACC subsidiaries | 125 | BioMed Valley Discoveries, Inc. |
The Statement of Additional Information has additional information about the fund's directors and is available without charge, upon request, by calling 1-800-378-9878.
22
Officers
The following table presents certain information about the executive officers of the funds. Each officer serves as an officer for each of the 15 investment companies in the American Century family of funds, unless otherwise noted. No officer is compensated for his or her service as an officer of the funds. The listed officers are interested persons of the funds and are appointed or re-appointed on an annual basis. The mailing address for each officer listed below is 4500 Main Street, Kansas City, Missouri 64111.
Name (Year of Birth) | Offices with the Funds | Principal Occupation(s) During the Past Five Years |
| Jonathan S. Thomas (1963) | Director and President since 2007 | President and Chief Executive Officer, ACC (March 2007 to present). Also serves as Chief Executive Officer, ACS; Executive Vice President, ACIM; Director, ACC, ACIM and other ACC subsidiaries |
| Amy D. Shelton (1964) | Chief Compliance Officer and Vice President since 2014 | Chief Compliance Officer, American Century funds, (March 2014 to present); Chief Compliance Officer, ACIM (February 2014 to present); Chief Compliance Officer, ACIS (October 2009 to present); Vice President, Client Interactions and Marketing, ACIS (February 2013 to January 2014); Director, Client Interactions and Marketing, ACIS (June 2007 to January 2013). Also serves as Vice President, ACIS |
| Charles A. Etherington (1957) | General Counsel since 2007 and Senior Vice President since 2006 | Attorney, ACC (February 1994 to present); Vice President, ACC (November 2005 to present); General Counsel, ACC (March 2007 to present). Also serves as General Counsel, ACIM, ACS, ACIS and other ACC subsidiaries; and Senior Vice President, ACIM and ACS |
| C. Jean Wade (1964) | Vice President, Treasurer and Chief Financial Officer since 2012 | Vice President, ACS (February 2000 to present) |
| Robert J. Leach (1966) | Vice President since 2006 and Assistant Treasurer since 2012 | Vice President, ACS (February 2000 to present) |
| David H. Reinmiller (1963) | Vice President since 2000 | Attorney, ACC (January 1994 to present); Associate General Counsel, ACC (January 2001 to present). Also serves as Vice President, ACIM and ACS |
| Ward D. Stauffer (1960) | Secretary since 2005 | Attorney, ACC (June 2003 to present) |
23
| Additional Information |
Proxy Voting Policies
A description of the policies that the fund's investment advisor uses in exercising the voting rights associated with the securities purchased and/or held by the fund is available without charge, upon request, by calling 1-800-378-9878. It is also available on the "About Us" page of American Century Investments’ website at americancentury.com and on the Securities and Exchange Commission’s website at sec.gov. Information regarding how the investment advisor voted proxies relating to portfolio securities during the most recent 12-month period ended June 30 is available on the "About Us" page at americancentury.com. It is also available at sec.gov.
Quarterly Portfolio Disclosure
The fund files its complete schedule of portfolio holdings with the Securities and Exchange Commission (SEC) for the first and third quarters of each fiscal year on Form N-Q. The fund’s Forms N-Q are available on the SEC’s website at sec.gov, and may be reviewed and copied at the SEC’s Public Reference Room in Washington, DC. Information on the operation of the Public Reference Room may be obtained by calling 1-800-SEC-0330. The fund also makes its complete
schedule of portfolio holdings for the most recent quarter of its fiscal year available on its website at ipro.americancentury.com (for Investment Professionals) and, upon request, by calling 1-800-378-9878.
Other Tax Information
The following information is provided pursuant to provisions of the Internal Revenue Code.
For corporate taxpayers, the fund hereby designates $72,160, or up to the maximum amount allowable, of ordinary income distributions paid during the fiscal year ended December 31, 2015 as qualified for the corporate dividends received deduction.
The fund hereby designates $96,156 as qualified short-term capital gain distributions for purposes of Internal Revenue Code Section 871 for the fiscal year ended December 31, 2015.
The fund hereby designates $243,279, or up to the maximum amount allowable, as long-term capital gain distributions for the fiscal year ended December 31, 2015.
24
| ||
| Contact Us | americancentury.com | |
| Automated Information Line | 1-800-345-8765 | |
| Investment Professional Service Representatives | 1-800-345-6488 | |
| Telecommunications Relay Service for the Deaf | 711 | |
| American Century Variable Portfolios, Inc. | ||
Investment Advisor: American Century Investment Management, Inc. Kansas City, Missouri | ||
| This report and the statements it contains are submitted for the general information of our shareholders. The report is not authorized for distribution to prospective investors unless preceded or accompanied by an effective prospectus. | ||
| ©2016 American Century Proprietary Holdings, Inc. All rights reserved. CL-ANN-88150 1602 | ||
| ANNUAL REPORT | DECEMBER 31, 2015 |
VP Income & Growth Fund
| Table of Contents |
| Performance | 2 | |
| Portfolio Commentary | ||
| Fund Characteristics | ||
| Shareholder Fee Example | ||
| Schedule of Investments | ||
| Statement of Assets and Liabilities | ||
| Statement of Operations | ||
| Statement of Changes in Net Assets | ||
| Notes to Financial Statements | ||
| Financial Highlights | ||
| Report of Independent Registered Public Accounting Firm | ||
| Management | ||
| Additional Information | ||
Any opinions expressed in this report reflect those of the author as of the date of the report, and do not necessarily represent the opinions of American Century Investments® or any other person in the American Century Investments organization. Any such opinions are subject to change at any time based upon market or other conditions and American Century Investments disclaims any responsibility to update such opinions. These opinions may not be relied upon as investment advice and, because investment decisions made by American Century Investments funds are based on numerous factors, may not be relied upon as an indication of trading intent on behalf of any American Century Investments fund. Security examples are used for representational purposes only and are not intended as recommendations to purchase or sell securities. Performance information for comparative indices and securities is provided to American Century Investments by third party vendors. To the best of American Century Investments’ knowledge, such information is accurate at the time of printing.
| Performance |
| Total Returns as of December 31, 2015 | ||||||
| Average Annual Returns | ||||||
Ticker Symbol | 1 year | 5 years | 10 years | Since Inception | Inception Date | |
| Class I | AVGIX | -5.62% | 11.27% | 5.82% | 5.97% | 10/30/97 |
| S&P 500 Index | — | 1.38% | 12.56% | 7.30% | 6.45% | — |
| Class II | AVPGX | -5.95% | 10.99% | 5.54% | 5.79% | 5/1/02 |
The performance information presented does not include charges and deductions imposed by the insurance company separate account under the variable annuity or variable life insurance contracts. The inclusion of such charges could significantly lower performance. Please refer to the insurance company separate account prospectus for a discussion of the charges related to insurance contracts.
| Growth of $10,000 Over 10 Years |
| $10,000 investment made December 31, 2005 |
| Performance for other share classes will vary due to differences in fee structure. |
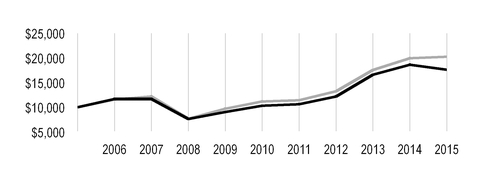
| Value on December 31, 2015 | |
| Class I — $17,605 | |
| S&P 500 Index — $20,242 | |
| Total Annual Fund Operating Expenses | |
| Class I | Class II |
| 0.70% | 0.95% |
The total annual fund operating expenses shown is as stated in the fund’s prospectus current as of the date of this report. The prospectus may vary from the expense ratio shown elsewhere in this report because it is based on a different time period, includes acquired fund fees and expenses, and, if applicable, does not include fee waivers or expense reimbursements.
Data presented reflect past performance. Past performance is no guarantee of future results. Current performance may be higher or lower than the performance shown. Investment return and principal value will fluctuate, and redemption value may be more or less than original cost. Data assumes reinvestment of dividends and capital gains, and none of the charts reflect the deduction of taxes that a shareholder would pay on fund distributions or the redemption of fund shares. To obtain performance data current to the most recent month end, please call 1-800-345-6488 or visit ipro.americancentury.com (for Investment Professionals). For additional information about the fund, please consult the prospectus.
2
| Portfolio Commentary |
Portfolio Managers: Brian Garbe and Claudia Musat
Performance Summary
VP Income & Growth returned -5.62%* for the year ended December 31, 2015, compared with the 1.38% return of its benchmark, the S&P 500 Index.
VP Income & Growth’s stock selection process incorporates factors of valuation, quality, growth, and sentiment with a valuation tilt, while striving to minimize unintended risks along industries and other risk characteristics. The fund’s valuation insights were detrimental to stock selection results during the year. On a sector basis, security selection in the information technology and consumer discretionary sectors led underperformance. Conversely, energy sector positioning was beneficial to the fund’s results.
Computers and Peripherals Drove Information Technology Underperfomance
Security selection in computers and peripherals as well as positioning in internet software and services made the information technology sector a key underperformer during the reporting period. An overweight position, relative to the benchmark, in Seagate Technology hindered performance as the electronic data storage provider declined on disappointing revenues due to slowing PC sales and concerns about the strong dollar’s effect on its sales abroad. The holding remains attractive across factors of valuation, sentiment, and quality. An underweight to Alphabet, the parent company of Google, was also detrimental. The online search giant advanced by over 45% during the year due to positive financial results generated by strong growth in advertising revenues. We remain underweight the stock given the company’s valuation and quality profiles. QUALCOMM detracted as the wireless technology and semiconductor provider saw its share price plunge on uncertainty surrounding future sales to China and on revelation that South Korean regulators had opened an antitrust investigation against the company. Compelling valuation and sentiment insights support our overweight position.
Consumer discretionary sector holdings were also main drivers of underperformance, particularly positioning among internet retailers. Leading detractors included Amazon.com, whose stock price steadily gained over the course of the year on rising revenues and earnings, driven in large part by the strength of its cloud computing business. We initiated a position in the internet retailer during the third quarter of 2015, but missed much of the stock’s appreciation during the year. Outside of the consumer sectors, results were hampered by a portfolio-only position in Potash Corp. of Saskatchewan. The fertilizer manufacturer suffered due to declining commodity prices, rising inventories, and slowing demand, particularly from China, the world’s largest potash consumer. While the current operating environment remains challenging, the holding retains strong measures of quality and valuation. Diesel engine manufacturer Cummins weakened on a slowdown in demand for its product, particularly in non-U.S. markets, and we exited our investment in the company.
* All fund returns referenced in this commentary are for Class I shares. Performance for other share classes will vary due to differences in fee structure; when Class I performance exceeds that of the fund’s benchmark, other share classes may not. See page 2 for returns for all share classes.
3
Energy Sector Outperformed
Positive contribution to returns on a sector basis came from the energy sector, where stock selection and underweight positioning in oil, gas, and consumable fuels holdings bolstered relative results. Much of the benefit came from not owning or maintaining underweight positions in oil-related companies as oil prices sank to their lowest levels since early 2009 on widening oversupply and uncertain future demand from global economies. In this environment, not holding energy infrastructure company Kinder Morgan was particularly beneficial as its share price fell by 63% during the reporting period. The company’s unattractive profiles across growth, sentiment, and quality support our decision not to hold it. Likewise, an underweight position in oil exploration and refining company Chevron was beneficial and is supported by weak factors of growth and quality. A sector exception was our overweight position in Valero Energy. The oil refiner surpassed expectations as lower oil prices and higher demand for gasoline boosted the company’s throughput margin per barrel. Strong valuation, growth, and quality insights support the portfolio’s overweight positioning.
Individual contribution came from not owning Union Pacific, as the railroad operator’s stock declined steadily on softer cargo volumes, particularly of coal, which has fallen in popularity due to lower natural gas prices. We maintain this positioning based on unappealing growth, sentiment, and quality factors. Health insurance and managed care provider Aetna was a key outperformer, advancing nearly 23% during the year amid merger speculation in the recent wave of health insurance industry consolidation. Strong valuation insights and above-average factor profiles across all other measures make Aetna an attractive portfolio investment.
A Look Ahead
We believe U.S. economic growth will proceed at a moderate pace and will continue to outpace the growth rates of most other economies. Divergence in monetary policy between the U.S. and much of the rest of the world seems likely to continue as the Federal Reserve (Fed) seeks to "normalize" interest rates, while central banks elsewhere maintain aggressive monetary stimulus. Investor sentiment in financial markets is therefore likely to be driven by the pace and magnitude of Fed rate moves, as well as by the trajectory of global economic growth, particularly in China. However, a strong U.S. dollar, weak commodity prices, uncertainty around numerous geopolitical events, and low interest rates in Europe could mean a longer time frame for further increases in U.S. interest rates. Our systematic investment strategy is designed to take advantage of opportunities at the individual company level. We believe this approach is the most powerful way to capitalize on market inefficiencies that lead to the mispricing of individual stocks. Our strategy is designed to provide broad U.S. equity market exposure with strong current income and exceptional risk management. Currently, the fund’s most significant sector overweight positions are in information technology and health care, while financials and energy represent the greatest sector underweights.
4
| Fund Characteristics |
| DECEMBER 31, 2015 | |
| Top Ten Holdings | % of net assets |
| Apple, Inc. | 4.2% |
| Microsoft Corp. | 3.3% |
| Johnson & Johnson | 2.4% |
| JPMorgan Chase & Co. | 2.0% |
| AT&T, Inc. | 2.0% |
| Verizon Communications, Inc. | 2.0% |
| Procter & Gamble Co. (The) | 2.0% |
| Pfizer, Inc. | 1.9% |
| Merck & Co., Inc. | 1.8% |
| PepsiCo, Inc. | 1.8% |
| Top Five Industries | % of net assets |
| Pharmaceuticals | 6.9% |
| Technology Hardware, Storage and Peripherals | 6.0% |
| Biotechnology | 5.9% |
| Software | 4.9% |
| Semiconductors and Semiconductor Equipment | 4.6% |
| Types of Investments in Portfolio | % of net assets |
| Common Stocks | 98.7% |
| Temporary Cash Investments | 0.7% |
| Other Assets and Liabilities | 0.6% |
5
| Shareholder Fee Example |
Fund shareholders may incur two types of costs: (1) transaction costs, including sales charges (loads) on purchase payments and redemption/exchange fees; and (2) ongoing costs, including management fees; distribution and service (12b-1) fees; and other fund expenses. This example is intended to help you understand your ongoing costs (in dollars) of investing in your fund and to compare these costs with the ongoing cost of investing in other mutual funds.
The example is based on an investment of $1,000 made at the beginning of the period and held for the entire period from July 1, 2015 to December 31, 2015.
Actual Expenses
The table provides information about actual account values and actual expenses for each class. You may use the information, together with the amount you invested, to estimate the expenses that you paid over the period. First, identify the share class you own. Then simply divide your account value by $1,000 (for example, an $8,600 account value divided by $1,000 = 8.6), then multiply the result by the number under the heading “Expenses Paid During Period” to estimate the expenses you paid on your account during this period.
Hypothetical Example for Comparison Purposes
The table also provides information about hypothetical account values and hypothetical expenses based on the actual expense ratio of each class of your fund and an assumed rate of return of 5% per year before expenses, which is not the actual return of a fund’s share class. The hypothetical account values and expenses may not be used to estimate the actual ending account balance or expenses you paid for the period. You may use this information to compare the ongoing costs of investing in your fund and other funds. To do so, compare this 5% hypothetical example with the 5% hypothetical examples that appear in the shareholder reports of the other funds.
Please note that the expenses shown in the table are meant to highlight your ongoing costs only and do not reflect any transactional costs, such as sales charges (loads) or redemption/exchange fees. Therefore, the table is useful in comparing ongoing costs only, and will not help you determine the relative total costs of owning different funds. In addition, if these transactional costs were included, your costs would have been higher.
| Beginning Account Value 7/1/15 | Ending Account Value 12/31/15 | Expenses Paid During Period(1)7/1/15 - 12/31/15 | Annualized Expense Ratio(1) | |
| Actual | ||||
| Class I | $1,000 | $961.70 | $3.46 | 0.70% |
| Class II | $1,000 | $960.40 | $4.69 | 0.95% |
| Hypothetical | ||||
| Class I | $1,000 | $1,021.68 | $3.57 | 0.70% |
| Class II | $1,000 | $1,020.42 | $4.84 | 0.95% |
| (1) | Expenses are equal to the class's annualized expense ratio listed in the table above, multiplied by the average account value over the period, multiplied by 184, the number of days in the most recent fiscal half-year, divided by 365, to reflect the one-half year period. |
6
| Schedule of Investments |
DECEMBER 31, 2015
| Shares | Value | |||
| COMMON STOCKS — 98.7% | ||||
| Aerospace and Defense — 3.6% | ||||
| Boeing Co. (The) | 18,993 | $ | 2,746,198 | |
| General Dynamics Corp. | 25,210 | 3,462,846 | ||
| Honeywell International, Inc. | 49,146 | 5,090,051 | ||
| United Technologies Corp. | 20,173 | 1,938,020 | ||
| 13,237,115 | ||||
| Air Freight and Logistics — 1.1% | ||||
| United Parcel Service, Inc., Class B | 40,793 | 3,925,510 | ||
| Automobiles — 1.3% | ||||
| Ford Motor Co. | 275,228 | 3,877,962 | ||
| General Motors Co. | 28,693 | 975,849 | ||
| 4,853,811 | ||||
| Banks — 3.5% | ||||
| Bank of America Corp. | 36,260 | 610,256 | ||
| Citigroup, Inc. | 18,626 | 963,895 | ||
| JPMorgan Chase & Co. | 112,829 | 7,450,099 | ||
| M&T Bank Corp. | 12,898 | 1,562,980 | ||
| Wells Fargo & Co. | 41,402 | 2,250,613 | ||
| 12,837,843 | ||||
| Beverages — 1.9% | ||||
| Coca-Cola Co. (The) | 6,942 | 298,228 | ||
| PepsiCo, Inc. | 65,287 | 6,523,477 | ||
| 6,821,705 | ||||
| Biotechnology — 5.9% | ||||
| AbbVie, Inc. | 87,127 | 5,161,403 | ||
| Amgen, Inc. | 33,156 | 5,382,214 | ||
| Baxalta, Inc. | 9,591 | 374,337 | ||
Biogen, Inc.(1) | 15,244 | 4,669,999 | ||
| Gilead Sciences, Inc. | 58,724 | 5,942,282 | ||
| 21,530,235 | ||||
| Capital Markets — 2.9% | ||||
| Ameriprise Financial, Inc. | 28,236 | 3,004,875 | ||
| BGC Partners, Inc., Class A | 210,066 | 2,060,748 | ||
| Legg Mason, Inc. | 66,914 | 2,625,036 | ||
| NorthStar Asset Management Group, Inc. | 167,131 | 2,028,970 | ||
| T. Rowe Price Group, Inc. | 14,797 | 1,057,838 | ||
| 10,777,467 | ||||
| Chemicals — 2.6% | ||||
| Air Products & Chemicals, Inc. | 24,021 | 3,125,372 | ||
| Cabot Corp. | 4,360 | 178,237 | ||
| Dow Chemical Co. (The) | 78,392 | 4,035,620 | ||
| Potash Corp. of Saskatchewan, Inc. | 126,675 | 2,168,676 | ||
| 9,507,905 | ||||
| Commercial Services and Supplies — 0.8% | ||||
| Pitney Bowes, Inc. | 143,949 | 2,972,547 | ||
7
| Shares | Value | |||
| Communications Equipment — 2.8% | ||||
| Cisco Systems, Inc. | 220,854 | $ | 5,997,291 | |
| QUALCOMM, Inc. | 83,655 | 4,181,495 | ||
| 10,178,786 | ||||
| Containers and Packaging — 1.4% | ||||
| Avery Dennison Corp. | 40,445 | 2,534,283 | ||
| International Paper Co. | 72,614 | 2,737,548 | ||
| 5,271,831 | ||||
| Diversified Financial Services — 0.5% | ||||
Berkshire Hathaway, Inc., Class B(1) | 14,458 | 1,909,034 | ||
| Diversified Telecommunication Services — 4.0% | ||||
| AT&T, Inc. | 209,445 | 7,207,002 | ||
| Verizon Communications, Inc. | 155,825 | 7,202,232 | ||
| 14,409,234 | ||||
| Electric Utilities — 2.0% | ||||
| NextEra Energy, Inc. | 38,456 | 3,995,194 | ||
| PPL Corp. | 92,606 | 3,160,643 | ||
| 7,155,837 | ||||
| Electrical Equipment — 0.9% | ||||
| Emerson Electric Co. | 68,997 | 3,300,126 | ||
| Electronic Equipment, Instruments and Components — 0.7% | ||||
| Corning, Inc. | 133,129 | 2,433,598 | ||
| Energy Equipment and Services — 0.7% | ||||
| Noble Corp. plc | 249,803 | 2,635,422 | ||
| Food and Staples Retailing — 1.3% | ||||
| Wal-Mart Stores, Inc. | 80,041 | 4,906,513 | ||
| Food Products — 1.2% | ||||
| ConAgra Foods, Inc. | 29,558 | 1,246,165 | ||
| General Mills, Inc. | 56,980 | 3,285,467 | ||
| 4,531,632 | ||||
| Health Care Equipment and Supplies — 3.5% | ||||
| Abbott Laboratories | 89,011 | 3,997,484 | ||
| Baxter International, Inc. | 8,316 | 317,255 | ||
| C.R. Bard, Inc. | 8,842 | 1,675,028 | ||
| St. Jude Medical, Inc. | 55,762 | 3,444,419 | ||
| Stryker Corp. | 38,423 | 3,571,034 | ||
| 13,005,220 | ||||
| Health Care Providers and Services — 2.1% | ||||
| Aetna, Inc. | 36,122 | 3,905,511 | ||
| AmerisourceBergen Corp. | 30,844 | 3,198,831 | ||
| McKesson Corp. | 3,595 | 709,042 | ||
| 7,813,384 | ||||
| Hotels, Restaurants and Leisure — 2.7% | ||||
| Carnival Corp. | 32,650 | 1,778,772 | ||
| Darden Restaurants, Inc. | 52,001 | 3,309,344 | ||
| McDonald's Corp. | 23,682 | 2,797,791 | ||
| Yum! Brands, Inc. | 26,099 | 1,906,532 | ||
| 9,792,439 | ||||
| Household Durables — 1.6% | ||||
| Garmin Ltd. | 81,543 | 3,030,953 | ||
| Tupperware Brands Corp. | 53,433 | 2,973,547 | ||
| 6,004,500 | ||||
| Household Products — 2.0% | ||||
| Procter & Gamble Co. (The) | 90,305 | 7,171,120 | ||
8
| Shares | Value | |||
| Industrial Conglomerates — 0.9% | ||||
| Carlisle Cos., Inc. | 3,710 | $ | 329,040 | |
| General Electric Co. | 100,763 | 3,138,767 | ||
| 3,467,807 | ||||
| Insurance — 0.9% | ||||
| Prudential Financial, Inc. | 40,945 | 3,333,332 | ||
| Internet and Catalog Retail — 0.5% | ||||
Amazon.com, Inc.(1) | 2,454 | 1,658,634 | ||
| Internet Software and Services — 2.3% | ||||
Alphabet, Inc., Class A(1) | 4,731 | 3,680,765 | ||
Alphabet, Inc., Class C(1) | 3,299 | 2,503,545 | ||
Facebook, Inc., Class A(1) | 19,842 | 2,076,664 | ||
| 8,260,974 | ||||
| IT Services — 3.4% | ||||
| Accenture plc, Class A | 30,713 | 3,209,508 | ||
| International Business Machines Corp. | 41,813 | 5,754,305 | ||
| Paychex, Inc. | 47,953 | 2,536,234 | ||
| Western Union Co. (The) | 55,572 | 995,295 | ||
| 12,495,342 | ||||
| Leisure Products — 0.4% | ||||
| Mattel, Inc. | 52,688 | 1,431,533 | ||
| Machinery — 2.3% | ||||
| Kennametal, Inc. | 71,919 | 1,380,845 | ||
| PACCAR, Inc. | 62,881 | 2,980,559 | ||
| Stanley Black & Decker, Inc. | 38,105 | 4,066,947 | ||
| 8,428,351 | ||||
| Media — 2.4% | ||||
| CBS Corp., Class B | 35,809 | 1,687,678 | ||
| Comcast Corp., Class A | 4,188 | 236,329 | ||
| Time Warner, Inc. | 54,964 | 3,554,522 | ||
| Viacom, Inc., Class B | 77,538 | 3,191,464 | ||
| Walt Disney Co. (The) | 1,832 | 192,507 | ||
| 8,862,500 | ||||
| Metals and Mining — 0.3% | ||||
| Carpenter Technology Corp. | 15,280 | 462,526 | ||
| Nucor Corp. | 11,544 | 465,223 | ||
| 927,749 | ||||
| Multi-Utilities — 1.1% | ||||
| Consolidated Edison, Inc. | 10,930 | 702,471 | ||
| Public Service Enterprise Group, Inc. | 85,163 | 3,294,957 | ||
| 3,997,428 | ||||
| Multiline Retail — 1.0% | ||||
| Target Corp. | 52,268 | 3,795,179 | ||
| Oil, Gas and Consumable Fuels — 2.9% | ||||
| Chevron Corp. | 6,500 | 584,740 | ||
| Exxon Mobil Corp. | 79,506 | 6,197,493 | ||
| Valero Energy Corp. | 56,173 | 3,971,993 | ||
| 10,754,226 | ||||
| Pharmaceuticals — 6.9% | ||||
| Eli Lilly & Co. | 30,213 | 2,545,747 | ||
| Johnson & Johnson | 86,637 | 8,899,353 | ||
| Merck & Co., Inc. | 126,470 | 6,680,145 | ||
| Pfizer, Inc. | 219,588 | 7,088,301 | ||
| 25,213,546 | ||||
9
| Shares | Value | |||
| Real Estate Investment Trusts (REITs) — 4.5% | ||||
| Corporate Office Properties Trust | 36,119 | $ | 788,478 | |
| Digital Realty Trust, Inc. | 22,886 | 1,730,639 | ||
| Hospitality Properties Trust | 110,854 | 2,898,832 | ||
| Liberty Property Trust | 78,549 | 2,438,946 | ||
| Mid-America Apartment Communities, Inc. | 35,953 | 3,264,892 | ||
| Plum Creek Timber Co., Inc. | 62,532 | 2,984,027 | ||
| Public Storage | 8,998 | 2,228,805 | ||
| 16,334,619 | ||||
| Semiconductors and Semiconductor Equipment — 4.6% | ||||
| Analog Devices, Inc. | 54,046 | 2,989,825 | ||
| Applied Materials, Inc. | 166,479 | 3,108,163 | ||
| Intel Corp. | 177,712 | 6,122,178 | ||
| Intersil Corp., Class A | 39,127 | 499,261 | ||
| Skyworks Solutions, Inc. | 16,740 | 1,286,134 | ||
| Teradyne, Inc. | 144,479 | 2,986,381 | ||
| 16,991,942 | ||||
| Software — 4.9% | ||||
| CA, Inc. | 108,885 | 3,109,756 | ||
| Microsoft Corp. | 216,356 | 12,003,431 | ||
| Oracle Corp. | 30,731 | 1,122,603 | ||
| Symantec Corp. | 80,404 | 1,688,484 | ||
| 17,924,274 | ||||
| Specialty Retail — 0.8% | ||||
| American Eagle Outfitters, Inc. | 138,174 | 2,141,697 | ||
| Best Buy Co., Inc. | 28,978 | 882,380 | ||
| 3,024,077 | ||||
| Technology Hardware, Storage and Peripherals — 6.0% | ||||
| Apple, Inc. | 146,195 | 15,388,486 | ||
| EMC Corp. | 117,140 | 3,008,155 | ||
| HP, Inc. | 31,444 | 372,297 | ||
| Seagate Technology plc | 84,767 | 3,107,558 | ||
| 21,876,496 | ||||
| Tobacco — 1.6% | ||||
| Philip Morris International, Inc. | 68,716 | 6,040,824 | ||
TOTAL COMMON STOCKS (Cost $319,551,318) | 361,801,647 | |||
| TEMPORARY CASH INVESTMENTS — 0.7% | ||||
| Repurchase Agreement, Fixed Income Clearing Corp., (collateralized by various U.S. Treasury obligations, 3.00%, 5/15/45, valued at $2,623,500), at 0.08%, dated 12/31/15, due 1/4/16 (Delivery value $2,571,023) | 2,571,000 | |||
| State Street Institutional Liquid Reserves Fund, Premier Class | 93,515 | 93,515 | ||
TOTAL TEMPORARY CASH INVESTMENTS (Cost $2,664,515) | 2,664,515 | |||
TOTAL INVESTMENT SECURITIES — 99.4% (Cost $322,215,833) | 364,466,162 | |||
| OTHER ASSETS AND LIABILITIES — 0.6% | 2,097,010 | |||
| TOTAL NET ASSETS — 100.0% | $ | 366,563,172 | ||
| NOTES TO SCHEDULE OF INVESTMENTS | ||
| (1) | Non-income producing. |
See Notes to Financial Statements.
10
| Statement of Assets and Liabilities |
| DECEMBER 31, 2015 | |||
| Assets | |||
| Investment securities, at value (cost of $322,215,833) | $ | 364,466,162 | |
| Cash | 14,555 | ||
| Receivable for capital shares sold | 1,777,270 | ||
| Dividends and interest receivable | 651,087 | ||
| 366,909,074 | |||
| Liabilities | |||
| Payable for capital shares redeemed | 123,541 | ||
| Accrued management fees | 218,650 | ||
| Distribution fees payable | 3,711 | ||
| 345,902 | |||
| Net Assets | $ | 366,563,172 | |
| Net Assets Consist of: | |||
| Capital (par value and paid-in surplus) | $ | 319,642,287 | |
| Undistributed net investment income | 291,632 | ||
| Undistributed net realized gain | 4,378,924 | ||
| Net unrealized appreciation | 42,250,329 | ||
| $ | 366,563,172 | ||
| Net Assets | Shares Outstanding | Net Asset Value Per Share | ||||
| Class I, $0.01 Par Value | $349,146,642 | 40,760,419 | $8.57 | |||
| Class II, $0.01 Par Value | $17,416,530 | 2,032,572 | $8.57 | |||
See Notes to Financial Statements.
11
| Statement of Operations |
| YEAR ENDED DECEMBER 31, 2015 | |||
| Investment Income (Loss) | |||
| Income: | |||
| Dividends (net of foreign taxes withheld of $18,705) | $ | 10,462,747 | |
| Interest | 1,172 | ||
| 10,463,919 | |||
| Expenses: | |||
| Management fees | 2,581,530 | ||
| Distribution fees - Class II | 47,844 | ||
| Directors' fees and expenses | 13,357 | ||
| Other expenses | 3,619 | ||
| 2,646,350 | |||
| Net investment income (loss) | 7,817,569 | ||
| Realized and Unrealized Gain (Loss) | |||
| Net realized gain (loss) on: | |||
| Investment transactions | 6,475,436 | ||
| Futures contract transactions | 4,953 | ||
| Foreign currency transactions | (85 | ) | |
| 6,480,304 | |||
| Change in net unrealized appreciation (depreciation) on: | |||
| Investments | (37,542,655 | ) | |
| Translation of assets and liabilities in foreign currencies | 18 | ||
| (37,542,637 | ) | ||
| Net realized and unrealized gain (loss) | (31,062,333 | ) | |
| Net Increase (Decrease) in Net Assets Resulting from Operations | $ | (23,244,764 | ) |
See Notes to Financial Statements.
12
| Statement of Changes in Net Assets |
| YEARS ENDED DECEMBER 31, 2015 AND DECEMBER 31, 2014 | ||||||
| Increase (Decrease) in Net Assets | December 31, 2015 | December 31, 2014 | ||||
| Operations | ||||||
| Net investment income (loss) | $ | 7,817,569 | $ | 6,997,541 | ||
| Net realized gain (loss) | 6,480,304 | 29,555,165 | ||||
| Change in net unrealized appreciation (depreciation) | (37,542,637 | ) | 1,448,962 | |||
| Net increase (decrease) in net assets resulting from operations | (23,244,764 | ) | 38,001,668 | |||
| Distributions to Shareholders | ||||||
| From net investment income: | ||||||
| Class I | (7,309,373 | ) | (6,184,296 | ) | ||
| Class II | (353,226 | ) | (333,947 | ) | ||
| Class III | (106,090 | ) | (150,110 | ) | ||
| From net realized gains: | ||||||
| Class I | (26,343,211 | ) | — | |||
| Class II | (1,694,161 | ) | — | |||
| Class III | (956,534 | ) | — | |||
| Decrease in net assets from distributions | (36,762,595 | ) | (6,668,353 | ) | ||
| Capital Share Transactions | ||||||
| Net increase (decrease) in net assets from capital share transactions (Note 5) | 50,426,946 | 48,641,599 | ||||
| Redemption Fees | ||||||
| Increase in net assets from redemption fees | 2,958 | 9,613 | ||||
| Net increase (decrease) in net assets | (9,577,455 | ) | 79,984,527 | |||
| Net Assets | ||||||
| Beginning of period | 376,140,627 | 296,156,100 | ||||
| End of period | $ | 366,563,172 | $ | 376,140,627 | ||
| Undistributed net investment income | $ | 291,632 | $ | 326,342 | ||
See Notes to Financial Statements.
13
| Notes to Financial Statements |
DECEMBER 31, 2015
1. Organization
American Century Variable Portfolios, Inc. (the corporation) is registered under the Investment Company Act of 1940, as amended (the 1940 Act), as an open-end management investment company and is organized as a Maryland corporation. VP Income & Growth Fund (the fund) is one fund in a series issued by the corporation. The fund is diversified as defined under the 1940 Act. The fund’s investment objective is to seek capital growth by investing in common stocks. Income is a secondary objective.
The fund offers Class I and Class II. The share classes differ principally in their respective distribution and shareholder servicing expenses and arrangements. On August 7, 2015, there were no outstanding Class III shares and the fund discontinued offering Class III.
2. Significant Accounting Policies
The following is a summary of significant accounting policies consistently followed by the fund in preparation of its financial statements. The fund is an investment company and follows accounting and reporting guidance in accordance with accounting principles generally accepted in the United States of America. This may require management to make certain estimates and assumptions at the date of the financial statements. Actual results could differ from these estimates. Management evaluated the impact of events or transactions occurring through the date the financial statements were issued that would merit recognition or disclosure.
Investment Valuations — The fund determines the fair value of its investments and computes its net asset value per share at the close of regular trading (usually 4 p.m. Eastern time) on the New York Stock Exchange (NYSE) on each day the NYSE is open. The Board of Directors has adopted valuation policies and procedures to guide the investment advisor in the fund’s investment valuation process and to provide methodologies for the oversight of the fund’s pricing function.
Equity securities that are listed or traded on a domestic securities exchange are valued at the last reported sales price or at the official closing price as provided by the exchange. Equity securities traded on foreign securities exchanges are generally valued at the closing price of such securities on the exchange where primarily traded or at the close of the NYSE, if that is earlier. If no last sales price is reported, or if local convention or regulation so provides, the mean of the latest bid and asked prices may be used. Securities traded over-the-counter are valued at the mean of the latest bid and asked prices, the last sales price, or the official closing price. Equity securities initially expressed in local currencies are translated into U.S. dollars at the mean of the appropriate currency exchange rate at the close of the NYSE as provided by an independent pricing service.
Open-end management investment companies are valued at the reported net asset value per share. Repurchase agreements are valued at cost, which approximates fair value. Exchange-traded futures contracts are valued at the settlement price as provided by the appropriate clearing corporation.
If the fund determines that the market price for an investment is not readily available or the valuation methods mentioned above do not reflect an investment’s fair value, such investment is valued as determined in good faith by the Board of Directors or its delegate, in accordance with policies and procedures adopted by the Board of Directors. In its determination of fair value, the fund may review several factors including, but not limited to, market information regarding the specific investment or comparable investments and correlation with other investment types, futures indices or general market indicators. Circumstances that may cause the fund to use these procedures to value an investment include, but are not limited to: an investment has been declared in default or is distressed; trading in a security has been suspended during the trading day or a security is not actively trading on its principal exchange; prices received from a regular pricing source are deemed unreliable; or there is a foreign market holiday and no trading occurred.
The fund monitors for significant events occurring after the close of an investment’s primary exchange but before the fund’s net asset value per share is determined. Significant events may include, but are not limited to: corporate announcements and transactions; governmental action and political unrest that could impact a specific investment or an investment sector; or armed conflicts, natural disasters and similar events that could affect investments in a specific country or region. The fund also monitors for significant fluctuations between
14
domestic and foreign markets, as evidenced by the U.S. market or such other indicators that the Board of Directors, or its delegate, deems appropriate. If significant fluctuations in foreign markets are identified, the fund may apply a model-derived factor to the closing price of equity securities traded on foreign securities exchanges. The factor is based on observable market data as provided by an independent pricing service.
Security Transactions — Security transactions are accounted for as of the trade date. Net realized gains and losses are determined on the identified cost basis, which is also used for federal income tax purposes.
Investment Income — Dividend income less foreign taxes withheld, if any, is recorded as of the ex-dividend date. Distributions received on securities that represent a return of capital or long-term capital gain are recorded as a reduction of cost of investments and/or as a realized gain. The fund may estimate the components of distributions received that may be considered nontaxable distributions or long-term capital gain distributions for income tax purposes. Interest income is recorded on the accrual basis and includes accretion of discounts and amortization of premiums.
Foreign Currency Translations — All assets and liabilities initially expressed in foreign currencies are translated into U.S. dollars at prevailing exchange rates at period end. The fund may enter into spot foreign currency exchange contracts to facilitate transactions denominated in a foreign currency. Purchases and sales of investment securities, dividend and interest income, spot foreign currency exchange contracts, and expenses are translated at the rates of exchange prevailing on the respective dates of such transactions. Net realized and unrealized foreign currency exchange gains or losses related to investment securities are a component of net realized gain (loss) on investment transactions and change in net unrealized appreciation (depreciation) on investments, respectively.
Repurchase Agreements — The fund may enter into repurchase agreements with institutions that American Century Investment Management, Inc. (ACIM) (the investment advisor) has determined are creditworthy pursuant to criteria adopted by the Board of Directors. The fund requires that the collateral, represented by securities, received in a repurchase transaction be transferred to the custodian in a manner sufficient to enable the fund to obtain those securities in the event of a default under the repurchase agreement. ACIM monitors, on a daily basis, the securities transferred to ensure the value, including accrued interest, of the securities under each repurchase agreement is equal to or greater than amounts owed to the fund under each repurchase agreement.
Joint Trading Account — Pursuant to an Exemptive Order issued by the Securities and Exchange Commission, the fund, along with certain other funds in the American Century Investments family of funds, may transfer uninvested cash balances into a joint trading account. These balances are invested in one or more repurchase agreements that are collateralized by U.S. Treasury or Agency obligations.
Segregated Assets — In accordance with the 1940 Act, the fund segregates assets on its books and records to cover futures contracts. ACIM monitors, on a daily basis, the securities segregated to ensure the fund designates a sufficient amount of liquid assets, marked-to-market daily. The fund may also receive assets or be required to pledge assets at the custodian bank or with a broker for margin requirements on futures contracts.
Income Tax Status — It is the fund’s policy to distribute substantially all net investment income and net realized gains to shareholders and to otherwise qualify as a regulated investment company under provisions of the Internal Revenue Code. Accordingly, no provision has been made for income taxes. The fund files U.S. federal, state, local and non-U.S. tax returns as applicable. The fund's tax returns are subject to examination by the relevant taxing authority until expiration of the applicable statute of limitations, which is generally three years from the date of filing but can be longer in certain jurisdictions. At this time, management believes there are no uncertain tax positions which, based on their technical merit, would not be sustained upon examination and for which it is reasonably possible that the total amounts of unrecognized tax benefits will significantly change in the next twelve months.
Multiple Class — All shares of the fund represent an equal pro rata interest in the net assets of the class to which such shares belong, and have identical voting, dividend, liquidation and other rights and the same terms and conditions, except for class specific expenses and exclusive rights to vote on matters affecting only individual classes. Income, non-class specific expenses, and realized and unrealized capital gains and losses of the fund are allocated to each class of shares based on their relative net assets.
Distributions to Shareholders — Distributions from net investment income, if any, are generally declared and paid quarterly. Distributions from net realized gains, if any, are generally declared and paid annually.
15
Redemption Fees — The fund may impose a 1.00% redemption fee on shares held less than 60 days. The fee may not be applicable to all classes. The redemption fee is retained by the fund and helps cover transaction costs that long-term investors may bear when the fund sells securities to meet investor redemptions.
Indemnifications — Under the corporation’s organizational documents, its officers and directors are indemnified against certain liabilities arising out of the performance of their duties to the fund. In addition, in the normal course of business, the fund enters into contracts that provide general indemnifications. The maximum exposure under these arrangements is unknown as this would involve future claims that may be made against a fund. The risk of material loss from such claims is considered by management to be remote.
3. Fees and Transactions with Related Parties
Certain officers and directors of the corporation are also officers and/or directors of American Century Companies, Inc. (ACC). The corporation’s investment advisor, ACIM, the corporation's distributor, American Century Investment Services, Inc. (ACIS), and the corporation’s transfer agent, American Century Services, LLC, are wholly owned, directly or indirectly, by ACC.
Management Fees — The corporation has entered into a management agreement with ACIM, under which ACIM provides the fund with investment advisory and management services in exchange for a single, unified management fee (the fee) per class. The agreement provides that all expenses of managing and operating the fund, except distribution fees, brokerage expenses, taxes, interest, fees and expenses of the independent directors (including legal counsel fees), and extraordinary expenses, will be paid by ACIM. The fee is computed and accrued daily based on each class’s daily net assets and paid monthly in arrears. The rate of the fee is determined by applying a fee rate calculation formula. This formula takes into account the fund’s assets as well as certain assets, if any, of other clients of the investment advisor outside the American Century Investments family of funds (such as subadvised funds and separate accounts) that have very similar investment teams and investment strategies (strategy assets). The annual management fee schedule ranges from 0.65% to 0.70% for Class I, Class II and Class III. The effective annual management fee for each class for the year ended December 31, 2015 was 0.70%.
Distribution Fees — The Board of Directors has adopted the Master Distribution Plan (the plan) for Class II, pursuant to Rule 12b-1 of the 1940 Act. The plan provides that Class II will pay ACIS an annual distribution fee equal to 0.25%. The fee is computed and accrued daily based on the Class II daily net assets and paid monthly in arrears. The distribution fee provides compensation for expenses incurred in connection with distributing shares of Class II including, but not limited to, payments to brokers, dealers, and financial institutions that have entered into sales agreements with respect to shares of the fund. Fees incurred under the plan during the year ended December 31, 2015 are detailed in the Statement of Operations.
Directors' Fees and Expenses — The Board of Directors is responsible for overseeing the investment advisor’s management and operations of the fund. The directors receive detailed information about the fund and its investment advisor regularly throughout the year, and meet at least quarterly with management of the investment advisor to review reports about fund operations. The fund’s officers do not receive compensation from the fund.
4. Investment Transactions
Purchases and sales of investment securities, excluding short-term investments, for the year ended December 31, 2015 were $342,726,229 and $320,529,287, respectively.
16
5. Capital Share Transactions
Transactions in shares of the fund were as follows:
| Year ended December 31, 2015 | Year ended December 31, 2014 | |||||||||
| Shares | Amount | Shares | Amount | |||||||
| Class I/Shares Authorized | 300,000,000 | 300,000,000 | ||||||||
| Sold | 10,384,300 | $ | 95,042,924 | 8,774,054 | $ | 85,298,634 | ||||
| Issued in reinvestment of distributions | 3,683,630 | 33,652,584 | 637,433 | 6,184,296 | ||||||
| Redeemed | (7,139,508 | ) | (66,111,803 | ) | (5,181,988 | ) | (49,657,771 | ) | ||
| 6,928,422 | 62,583,705 | 4,229,499 | 41,825,159 | |||||||
| Class II/Shares Authorized | 50,000,000 | 50,000,000 | ||||||||
| Sold | 737,478 | 6,961,390 | 751,347 | 7,238,599 | ||||||
| Issued in reinvestment of distributions | 223,332 | 2,047,387 | 34,463 | 333,947 | ||||||
| Redeemed | (1,008,171 | ) | (9,433,274 | ) | (787,997 | ) | (7,429,995 | ) | ||
| (47,361 | ) | (424,497 | ) | (2,187 | ) | 142,551 | ||||
| Class III/Shares Authorized | 50,000,000 | 50,000,000 | ||||||||
| Sold | 137,812 | 1,350,929 | 934,917 | 9,246,549 | ||||||
| Issued in reinvestment of distributions | 114,856 | 1,062,624 | 15,452 | 150,110 | ||||||
| Redeemed | (1,540,981 | ) | (14,145,815 | ) | (283,009 | ) | (2,722,770 | ) | ||
| (1,288,313 | ) | (11,732,262 | ) | 667,360 | 6,673,889 | |||||
| Net increase (decrease) | 5,592,748 | $ | 50,426,946 | 4,894,672 | $ | 48,641,599 | ||||
6. Fair Value Measurements
The fund’s investments valuation process is based on several considerations and may use multiple inputs to determine the fair value of the investments held by the fund. In conformity with accounting principles generally accepted in the United States of America, the inputs used to determine a valuation are classified into three broad levels.
| • | Level 1 valuation inputs consist of unadjusted quoted prices in an active market for identical investments. |
| • | Level 2 valuation inputs consist of direct or indirect observable market data (including quoted prices for comparable investments, evaluations of subsequent market events, interest rates, prepayment speeds, credit risk, etc.). These inputs also consist of quoted prices for identical investments initially expressed in local currencies that are adjusted through translation into U.S. dollars. |
| • | Level 3 valuation inputs consist of unobservable data (including a fund’s own assumptions). |
The level classification is based on the lowest level input that is significant to the fair valuation measurement. The valuation inputs are not necessarily an indication of the risks associated with investing in these securities or other financial instruments. There were no significant transfers between levels during the period.
The following is a summary of the level classifications as of period end. The Schedule of Investments provides additional information on the fund’s portfolio holdings.
| Level 1 | Level 2 | Level 3 | ||||||
| Assets | ||||||||
| Investment Securities | ||||||||
| Common Stocks | $ | 361,801,647 | — | — | ||||
| Temporary Cash Investments | 93,515 | $ | 2,571,000 | — | ||||
| $ | 361,895,162 | $ | 2,571,000 | — | ||||
17
7. Derivative Instruments
Equity Price Risk — The fund is subject to equity price risk in the normal course of pursuing its investment objectives. A fund may enter into futures contracts based on an equity index in order to manage its exposure to changes in market conditions. A fund may purchase futures contracts to gain exposure to increases in market value or sell futures contracts to protect against a decline in market value. Upon entering into a futures contract, a fund is required to deposit either cash or securities in an amount equal to a certain percentage of the contract value (initial margin). Subsequent payments (variation margin) are made or received daily, in cash, by a fund. The variation margin is equal to the daily change in the contract value and is recorded as unrealized gains and losses. A fund recognizes a realized gain or loss when the contract is closed or expires. Net realized and unrealized gains or losses occurring during the holding period of futures contracts are a component of net realized gain (loss) on futures contract transactions and change in net unrealized appreciation (depreciation) on futures contracts, respectively. One of the risks of entering into futures contracts is the possibility that the change in value of the contract may not correlate with the changes in value of the underlying securities. During the period, the fund participated in equity price risk derivative instruments for temporary investment purposes.
At period end, the fund did not have any derivative instruments disclosed on the Statement of Assets and Liabilities. For the year ended December 31, 2015, the effect of equity price risk derivative instruments on the Statement of Operations was $4,953 in net realized gain (loss) on futures contract transactions.
8. Federal Tax Information
The tax character of distributions paid during the years ended December 31, 2015 and December 31, 2014 were as follows:
| 2015 | 2014 | |||||
| Distributions Paid From | ||||||
| Ordinary income | $ | 16,096,094 | $ | 6,668,353 | ||
| Long-term capital gains | $ | 20,666,501 | — | |||
The book-basis character of distributions made during the year from net investment income or net realized gains may differ from their ultimate characterization for federal income tax purposes. These differences reflect the differing character of certain income items and net realized gains and losses for financial statement and tax purposes, and may result in reclassification among certain capital accounts on the financial statements.
As of December 31, 2015, the federal tax cost of investments and the components of distributable earnings on a tax-basis were as follows:
| Federal tax cost of investments | $ | 324,749,477 | |
| Gross tax appreciation of investments | $ | 54,707,229 | |
| Gross tax depreciation of investments | (14,990,544 | ) | |
| Net tax appreciation (depreciation) of investments | 39,716,685 | ||
| Undistributed ordinary income | $ | 291,632 | |
| Accumulated long-term gains | $ | 6,912,568 | |
The difference between book-basis and tax-basis unrealized appreciation (depreciation) is attributable primarily to the tax deferral of losses on wash sales.
18
| Financial Highlights |
| For a Share Outstanding Throughout the Years Ended December 31 (except as noted) | |||||||||||||||
| Per-Share Data | Ratios and Supplemental Data | ||||||||||||||
| Income From Investment Operations: | Distributions From: | Ratio to Average Net Assets of: | |||||||||||||
Net Asset Value, Beginning of Period | Net Investment Income (Loss)(1) | Net Realized and Unrealized Gain (Loss) | Total From Investment Operations | Net Investment Income | Net Realized Gains | Total Distributions | Net Asset Value, End of Period | Total Return(2) | Operating Expenses | Net Investment Income (Loss) | Portfolio Turnover Rate | Net Assets, End of Period (in thousands) | |||
| Class I | |||||||||||||||
| 2015 | $10.11 | 0.19 | (0.71) | (0.52) | (0.19) | (0.83) | (1.02) | $8.57 | (5.62)% | 0.70% | 2.14% | 88% | $349,147 | ||
| 2014 | $9.17 | 0.20 | 0.94 | 1.14 | (0.20) | — | (0.20) | $10.11 | 12.50% | 0.70% | 2.13% | 77% | $342,075 | ||
| 2013 | $6.90 | 0.18 | 2.27 | 2.45 | (0.18) | — | (0.18) | $9.17 | 35.82% | 0.70% | 2.28% | 73% | $271,368 | ||
| 2012 | $6.14 | 0.14 | 0.76 | 0.90 | (0.14) | — | (0.14) | $6.90 | 14.74% | 0.70% | 2.08% | 66% | $221,515 | ||
| 2011 | $6.05 | 0.10 | 0.09 | 0.19 | (0.10) | — | (0.10) | $6.14 | 3.11% | 0.70% | 1.61% | 54% | $217,635 | ||
| Class II | |||||||||||||||
| 2015 | $10.11 | 0.17 | (0.71) | (0.54) | (0.17) | (0.83) | (1.00) | $8.57 | (5.95)% | 0.95% | 1.89% | 88% | $17,417 | ||
| 2014 | $9.17 | 0.18 | 0.93 | 1.11 | (0.17) | — | (0.17) | $10.11 | 12.33% | 0.95% | 1.88% | 77% | $21,038 | ||
| 2013 | $6.90 | 0.17 | 2.26 | 2.43 | (0.16) | — | (0.16) | $9.17 | 35.48% | 0.95% | 2.03% | 73% | $19,095 | ||
| 2012 | $6.14 | 0.12 | 0.77 | 0.89 | (0.13) | — | (0.13) | $6.90 | 14.46% | 0.95% | 1.83% | 66% | $13,960 | ||
| 2011 | $6.05 | 0.08 | 0.09 | 0.17 | (0.08) | — | (0.08) | $6.14 | 2.86% | 0.95% | 1.36% | 54% | $13,285 | ||
| Notes to Financial Highlights | ||||
| (1) | Computed using average shares outstanding throughout the period. |
| (2) | Total returns are calculated based on the net asset value of the last business day. Total returns for periods less than one year are not annualized. |
See Notes to Financial Statements.
19
| Report of Independent Registered Public Accounting Firm |
To the Board of Directors and Shareholders of American Century Variable Portfolios, Inc.:
We have audited the accompanying statement of assets and liabilities, including the schedule of investments, of VP Income & Growth Fund (the “Fund”), one of the funds constituting American Century Variable Portfolios, Inc., as of December 31, 2015, and the related statement of operations for the year then ended, the statements of changes in net assets for each of the two years in the period then ended, and the financial highlights for each of the periods presented. These financial statements and financial highlights are the responsibility of the Fund’s management. Our responsibility is to express an opinion on these financial statements and financial highlights based on our audits.
We conducted our audits in accordance with the standards of the Public Company Accounting Oversight Board (United States). Those standards require that we plan and perform the audit to obtain reasonable assurance about whether the financial statements and financial highlights are free of material misstatement. The Fund is not required to have, nor were we engaged to perform, an audit of its internal control over financial reporting. Our audits included consideration of internal control over financial reporting as a basis for designing audit procedures that are appropriate in the circumstances, but not for the purpose of expressing an opinion on the effectiveness of the Fund’s internal control over financial reporting. Accordingly, we express no such opinion. An audit also includes examining, on a test basis, evidence supporting the amounts and disclosures in the financial statements, assessing the accounting principles used and significant estimates made by management, as well as evaluating the overall financial statement presentation. Our procedures included confirmation of securities owned as of December 31, 2015, by correspondence with the custodian and brokers; when replies were not received from brokers, we performed other auditing procedures. We believe that our audits provide a reasonable basis for our opinion.
In our opinion, the financial statements and financial highlights referred to above present fairly, in all material respects, the financial position of VP Income & Growth Fund of American Century Variable Portfolios, Inc. as of December 31, 2015, the results of its operations for the year then ended, the changes in its net assets for each of the two years in the period then ended, and the financial highlights for each of the periods presented, in conformity with accounting principles generally accepted in the United States of America.
DELOITTE & TOUCHE LLP
Kansas City, Missouri
February 11, 2016
20
| Management |
The Board of Directors
The individuals listed below serve as directors of the funds. Each director will continue to serve in this capacity until death, retirement, resignation or removal from office. The board has adopted a mandatory retirement age for directors who are not “interested persons,” as that term is defined in the Investment Company Act (independent directors). Independent directors shall retire by December 31 of the year in which they reach their 75th birthday.
Mr. Thomas is an “interested person” because he currently serves as President and Chief Executive Officer of American Century Companies, Inc. (ACC), the parent company of American Century Investment Management, Inc. (ACIM or the advisor). Mr. Fink is treated as an “interested person” because of his recent employment with ACC and American Century Services, LLC (ACS). The other directors (more than three-fourths of the total number) are independent. They are not employees, directors or officers of, and have no financial interest in, ACC or any of its wholly owned, direct or indirect, subsidiaries, including ACIM, American Century Investment Services, Inc. (ACIS) and ACS, and they do not have any other affiliations, positions or relationships that would cause them to be considered “interested persons” under the Investment Company Act. The directors serve in this capacity for seven (in the case of Mr. Thomas, 15) registered investment companies in the American Century Investments family of funds.
The following table presents additional information about the directors. The mailing address for each director is 4500 Main Street, Kansas City, Missouri 64111.
| Name (Year of Birth) | Position(s) Held with Funds | Length of Time Served | Principal Occupation(s) During Past 5 Years | Number of American Century Portfolios Overseen by Director | Other Directorships Held During Past 5 Years |
Independent Directors | |||||
| Andrea C. Hall (1945) | Director | Since 1997 | Retired | 80 | None |
| Jan M. Lewis (1957) | Director | Since 2011 | Retired; President and Chief Executive Officer, Catholic Charities of Northeast Kansas (human services organization) (2006 to 2013) | 80 | None |
| James A. Olson (1942) | Director and Chairman of the Board | Since 2007 (Chairman since 2014) | Member, Plaza Belmont LLC (private equity fund manager) | 80 | Saia, Inc. (2002 to 2012) and EPR Properties (2003 to 2013) |
| M. Jeannine Strandjord (1945) | Director | Since 1994 | Retired | 80 | Euronet Worldwide Inc.; MGP Ingredients, Inc.; Charming Shoppes, Inc. (2006 to 2010); and DST Systems Inc. (1996 to 2012) |
| John R. Whitten (1946) | Director | Since 2008 | Retired | 80 | Rudolph Technologies, Inc. |
21
Name (Year of Birth) | Position(s) Held with Funds | Length of Time Served | Principal Occupation(s) During Past 5 Years | Number of American Century Portfolios Overseen by Director | Other Directorships Held During Past 5 Years |
| Independent Directors | |||||
| Stephen E. Yates (1948) | Director | Since 2012 | Retired; Executive Vice President, Technology & Operations, KeyCorp. (computer services) (2004 to 2010) | 80 | Applied Industrial Technologies, Inc. (2001 to 2010) |
| Interested Directors | |||||
| Barry Fink (1955) | Director | Since 2012 | Retired; Executive Vice President, ACC (September 2007 to February 2013); President, ACS (October 2007 to February 2013); Chief Operating Officer, ACC (September 2007 to November 2012) | 80 | None |
| Jonathan S. Thomas (1963) | Director and President | Since 2007 | President and Chief Executive Officer, ACC (March 2007 to present). Also serves as Chief Executive Officer, ACS; Executive Vice President, ACIM; Director, ACC, ACIM and other ACC subsidiaries | 125 | BioMed Valley Discoveries, Inc. |
The Statement of Additional Information has additional information about the fund's directors and is available without charge, upon request, by calling 1-800-378-9878.
22
Officers
The following table presents certain information about the executive officers of the funds. Each officer serves as an officer for each of the 15 investment companies in the American Century family of funds, unless otherwise noted. No officer is compensated for his or her service as an officer of the funds. The listed officers are interested persons of the funds and are appointed or re-appointed on an annual basis. The mailing address for each officer listed below is 4500 Main Street, Kansas City, Missouri 64111.
Name (Year of Birth) | Offices with the Funds | Principal Occupation(s) During the Past Five Years |
| Jonathan S. Thomas (1963) | Director and President since 2007 | President and Chief Executive Officer, ACC (March 2007 to present). Also serves as Chief Executive Officer, ACS; Executive Vice President, ACIM; Director, ACC, ACIM and other ACC subsidiaries |
| Amy D. Shelton (1964) | Chief Compliance Officer and Vice President since 2014 | Chief Compliance Officer, American Century funds, (March 2014 to present); Chief Compliance Officer, ACIM (February 2014 to present); Chief Compliance Officer, ACIS (October 2009 to present); Vice President, Client Interactions and Marketing, ACIS (February 2013 to January 2014); Director, Client Interactions and Marketing, ACIS (June 2007 to January 2013). Also serves as Vice President, ACIS |
| Charles A. Etherington (1957) | General Counsel since 2007 and Senior Vice President since 2006 | Attorney, ACC (February 1994 to present); Vice President, ACC (November 2005 to present); General Counsel, ACC (March 2007 to present). Also serves as General Counsel, ACIM, ACS, ACIS and other ACC subsidiaries; and Senior Vice President, ACIM and ACS |
| C. Jean Wade (1964) | Vice President, Treasurer and Chief Financial Officer since 2012 | Vice President, ACS (February 2000 to present) |
| Robert J. Leach (1966) | Vice President since 2006 and Assistant Treasurer since 2012 | Vice President, ACS (February 2000 to present) |
| David H. Reinmiller (1963) | Vice President since 2000 | Attorney, ACC (January 1994 to present); Associate General Counsel, ACC (January 2001 to present). Also serves as Vice President, ACIM and ACS |
| Ward D. Stauffer (1960) | Secretary since 2005 | Attorney, ACC (June 2003 to present) |
23
| Additional Information |
Proxy Voting Policies
A description of the policies that the fund's investment advisor uses in exercising the voting rights associated with the securities purchased and/or held by the fund is available without charge, upon request, by calling 1-800-378-9878. It is also available on the "About Us" page of American Century Investments’ website at americancentury.com and on the Securities and Exchange Commission’s website at sec.gov. Information regarding how the investment advisor voted proxies relating to portfolio securities during the most recent 12-month period ended June 30 is available on the "About Us" page at americancentury.com. It is also available at sec.gov.
Quarterly Portfolio Disclosure
The fund files its complete schedule of portfolio holdings with the Securities and Exchange Commission (SEC) for the first and third quarters of each fiscal year on Form N-Q. The fund’s Forms N-Q are available on the SEC’s website at sec.gov, and may be reviewed and copied at the SEC’s Public Reference Room in Washington, DC. Information on the operation of the Public Reference Room may be obtained by calling 1-800-SEC-0330. The fund also makes its complete
schedule of portfolio holdings for the most recent quarter of its fiscal year available on its website at ipro.americancentury.com (for Investment Professionals) and, upon request, by calling 1-800-378-9878.
Other Tax Information
The following information is provided pursuant to provisions of the Internal Revenue Code.
For corporate taxpayers, the fund hereby designates $9,079,882, or up to the maximum amount allowable, of ordinary income distributions paid during the fiscal year ended December 31, 2015 as qualified for the corporate dividends received deduction.
The fund hereby designates $8,325,706 as qualified short-term capital gain distributions for purposes of Internal Revenue Code Section 871 for the fiscal year ended December 31, 2015.
The fund hereby designates $20,666,501, or up to the maximum amount allowable, as long-term capital gain distributions for the fiscal year ended December 31, 2015.
24
| ||
| Contact Us | americancentury.com | |
| Automated Information Line | 1-800-345-8765 | |
| Investment Professional Service Representatives | 1-800-345-6488 | |
| Telecommunications Relay Service for the Deaf | 711 | |
| American Century Variable Portfolios, Inc. | ||
Investment Advisor: American Century Investment Management, Inc. Kansas City, Missouri | ||
| This report and the statements it contains are submitted for the general information of our shareholders. The report is not authorized for distribution to prospective investors unless preceded or accompanied by an effective prospectus. | ||
| ©2016 American Century Proprietary Holdings, Inc. All rights reserved. CL-ANN-88141 1602 | ||
| ANNUAL REPORT | DECEMBER 31, 2015 |
VP International Fund
27
28
| Table of Contents |
| Performance | 2 | |
| Portfolio Commentary | ||
| Fund Characteristics | ||
| Shareholder Fee Example | ||
| Schedule of Investments | ||
| Statement of Assets and Liabilities | ||
| Statement of Operations | ||
| Statement of Changes in Net Assets | ||
| Notes to Financial Statements | ||
| Financial Highlights | ||
| Report of Independent Registered Public Accounting Firm | ||
| Management | ||
| Additional Information | ||
Any opinions expressed in this report reflect those of the author as of the date of the report, and do not necessarily represent the opinions of American Century Investments® or any other person in the American Century Investments organization. Any such opinions are subject to change at any time based upon market or other conditions and American Century Investments disclaims any responsibility to update such opinions. These opinions may not be relied upon as investment advice and, because investment decisions made by American Century Investments funds are based on numerous factors, may not be relied upon as an indication of trading intent on behalf of any American Century Investments fund. Security examples are used for representational purposes only and are not intended as recommendations to purchase or sell securities. Performance information for comparative indices and securities is provided to American Century Investments by third party vendors. To the best of American Century Investments’ knowledge, such information is accurate at the time of printing.
| Performance |
| Total Returns as of December 31, 2015 | ||||||
| Average Annual Returns | ||||||
Ticker Symbol | 1 year | 5 years | 10 years | Since Inception | Inception Date | |
| Class I | AVIIX | 0.76%(1) | 4.43%(1) | 4.36%(1) | 5.64%(1) | 5/1/94 |
| MSCI EAFE Index | — | -0.81% | 3.60% | 3.03% | 4.58%(2) | — |
| MSCI EAFE Growth Index | — | 4.09% | 4.60% | 4.03% | 3.85%(2) | — |
| Class II | ANVPX | 0.51%(1) | 4.26%(1) | 4.20%(1) | 4.11%(1) | 8/15/01 |
| (1) | Returns would have been lower if a portion of the management fee had not been waived. |
| (2) | Since April 30, 1994, the date nearest Class I’s inception for which data are available. |
The performance information presented does not include charges and deductions imposed by the insurance company separate account under the variable annuity or variable life insurance contracts. The inclusion of such charges could significantly lower performance. Please refer to the insurance company separate account prospectus for a discussion of the charges related to insurance contracts.
Data presented reflect past performance. Past performance is no guarantee of future results. Current performance may be higher or lower than the performance shown. Investment return and principal value will fluctuate, and redemption value may be more or less than original cost. Data assumes reinvestment of dividends and capital gains, and none of the charts reflect the deduction of taxes that a shareholder would pay on fund distributions or the redemption of fund shares. To obtain performance data current to the most recent month end, please call 1-800-345-6488 or visit ipro.americancentury.com (for Investment Professionals). For additional information about the fund, please consult the prospectus.
2
| Growth of $10,000 Over 10 Years |
| $10,000 investment made December 31, 2005 |
| Performance for other share classes will vary due to differences in fee structure. |
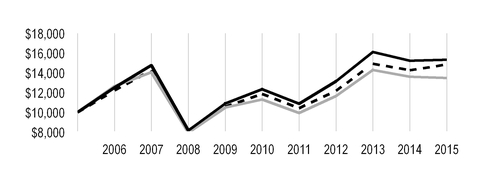
| Value on December 31, 2015 | |
| Class I — $15,330* | |
| MSCI EAFE Index — $13,479 | |
MSCI EAFE Growth Index — $14,841 | |
*Ending value would have been lower if a portion of the management fee had not been waived.
| Total Annual Fund Operating Expenses | |
| Class I | Class II |
| 1.33% | 1.48% |
The total annual fund operating expenses shown is as stated in the fund’s prospectus current as of the date of this report. The prospectus may vary from the expense ratio shown elsewhere in this report because it is based on a different time period, includes acquired fund fees and expenses, and, if applicable, does not include fee waivers or expense reimbursements.
Data presented reflect past performance. Past performance is no guarantee of future results. Current performance may be higher or lower than the performance shown. Investment return and principal value will fluctuate, and redemption value may be more or less than original cost. Data assumes reinvestment of dividends and capital gains, and none of the charts reflect the deduction of taxes that a shareholder would pay on fund distributions or the redemption of fund shares. To obtain performance data current to the most recent month end, please call 1-800-345-6488 or visit ipro.americancentury.com (for Investment Professionals). For additional information about the fund, please consult the prospectus.
3
| Portfolio Commentary |
Portfolio Manager: Raj Gandhi and James Gendelman
In February 2015, portfolio manager James Gendelman joined VP International’s management team.
Performance Summary
VP International advanced 0.76%* for the 12 months ended December 31, 2015. The portfolio’s benchmark, the MSCI EAFE Index, declined -0.81% for the same period.
Although non-U.S. equity markets largely advanced during the fourth quarter of 2015, in most cases gains were not significant enough to bolster the indices’ weak annual performance. Exceptions were Europe and Japan, which finished the year higher. A persistent theme throughout 2015 was a divergence in central bank policy. Most notable, while market expectations remained high that the U.S. Federal Reserve would raise U.S. interest rates this year—which it ultimately did in December—the European Central Bank and the Bank of Japan employed aggressive stimulus programs. In Japan, quantitative easing (QE) resulted in a rapid weakening of the yen, which helped exports early in the year but was less effective as the year progressed. However, we are encouraged by recent signs of stabilization in Japan’s economy, including improvements in wage growth. In Europe, the recovery appears broad-based and strengthening, despite concerns about an economic slowdown in China. A weaker euro, falling commodity prices, and improved access to credit were positives for local economies and led to stronger employment, consumer sentiment, and corporate profitability. Emerging markets suffered a different fate. Contagion fears, ongoing currency pressures, and anxiety over the effect of China’s slowdown on already-weak commodity prices pushed emerging markets stocks down across the board.
As the year progressed, fears of a slowdown in global growth intensified and fueled market volatility. Sharp declines in oil and commodity prices precipitated corporate earnings declines among energy and industrials companies. Certain sectors of the economy are in an earnings recession. In an environment where growth has become scarce, our focus on identifying accelerating, sustainable growth has led us toward companies whose growth is driven by strong secular trends or where improvement in growth is structural, company-specific and less dependent on economic recovery.
Overall, the fund outperformed its benchmark primarily due to stock selection in the consumer discretionary, energy, and financials sectors. An overweight position relative to the benchmark in the consumer discretionary sector and underweight positions in energy and financials also helped. Regionally, stock selection in Germany, the U.K., and Spain, along with an underweight position in Spain, also contributed to the fund’s outperformance.
Jewelry Company was a Top Contributor
Among individual holdings, an overweight position in Denmark-based Pandora was among the fund’s top overall contributors to performance. The jewelry and charm maker and retailer advanced on continued strong earnings growth and weak gold and silver prices. In addition, the company benefited from the timely release of new collections and the expansion of its retail network and online offerings.
| * | All fund returns referenced in this commentary are for Class I shares. Returns would have been lower if a portion of the management fee had not been waived. Performance for other share classes will vary due to differences in fee structure; when Class I performance exceeds that of the fund's benchmark, other share classes may not. See page 2 for returns for all share classes. |
4
In addition, an overweight position in Ono Pharmaceutical was a main contributor. The Japan-based pharmaceutical company posted strong results based on its cancer-fighting antibody treatment developed jointly with Bristol-Myers Squibb.
An overweight position in Zalando, a Germany-based online apparel company, also was a prominent contributor. The company benefited from the low penetration of e-commerce in the region’s apparel industry, a profitable business model, and favorable margins. For example, the stock rallied late in the period, after Zalando reported strong revenue growth of 42% driven by new customers and increased average ticket size. Recent investments in fulfillment and distribution centers helped accelerate revenue growth, which led to margin improvement. We believe the company’s expansion beyond its key markets of Germany, Switzerland, and Austria and its growing distribution network bodes well for future growth.
Industrials Sector was Main Laggard
Stock selection in the industrials, consumer staples, and health care sectors detracted from relative performance. Regionally, a portfolio-only position in India (which we exited by year-end), stock selection in the Netherlands, and stock selection and an overweight position in France weighed on relative results.
An overweight position in Rio Tinto was a main detractor from portfolio performance. Stock of the Australia-based commodity producer declined with the continued pressure on commodity prices and industry supply/demand imbalances. We continue to believe the company is in a strong competitive position, as it is the lowest-cost producer and can continue to grow production while competitors are forced to close.
A portfolio-only position in ICICI Bank, an India-based bank, also detracted from relative performance. The stock suffered early in the period due to weaker-than-expected first-quarter 2015 results driven by sluggish loan growth and an increase in non-performing loans. The stock experienced additional losses in the third quarter of 2015 after reporting some deterioration in the quality of its loan portfolio. We exited the position.
In addition, an overweight position in Minebea was a main detractor. The Japan-based maker of electronic components, including LED backlighting for smartphones, suffered from worries about a potential decline in smartphone sales, specifically in China. We exited the position.
Outlook
We will continue to focus on companies we believe demonstrate accelerating, sustainable earnings growth. As global growth has slowed and growth has become scarce, we have migrated the portfolio toward companies whose earnings are driven by structural or secular trends. In Europe, unemployment levels are lower, and expansion in money supply and credit growth suggest ECB policies are gaining traction. We expect weak oil prices and any additional QE from the ECB to support Europe’s recovery at the macroeconomic and company levels, but growth may remain modest. We also believe a weaker euro should continue to act as a tailwind, helping European manufacturers and exporters by making their goods more competitive in foreign markets. Similarly, QE has weakened the yen, and Japan-based manufacturers and exporters have benefited, but we expect this benefit to lessen in the future. We have begun to see improvements in the domestic economy, specifically in the consumer industries. We continue to have low exposure to emerging markets, as we believe those areas remain plagued by slowing growth and weakening currencies and commodity prices. We are searching for signs of bottoming in earnings trends.
5
| Fund Characteristics |
| DECEMBER 31, 2015 | |
| Top Ten Holdings | % of net assets |
| Roche Holding AG | 3.8% |
| Nestle SA | 2.5% |
| Pandora A/S | 2.5% |
| Reckitt Benckiser Group plc | 2.4% |
| Novartis AG | 2.3% |
| Intesa Sanpaolo SpA | 2.3% |
| AIA Group Ltd. | 2.0% |
| Zalando SE | 1.8% |
| Bayer AG | 1.6% |
| KBC Groep NV | 1.6% |
| Types of Investments in Portfolio | % of net assets |
| Common Stocks | 98.0% |
| Temporary Cash Investments | 1.7% |
| Other Assets and Liabilities | 0.3% |
| Investments by Country | % of net assets |
| United Kingdom | 23.4% |
| Japan | 18.0% |
| France | 10.3% |
| Switzerland | 9.4% |
| Germany | 8.4% |
| Belgium | 3.8% |
| Ireland | 3.7% |
| Denmark | 2.5% |
| Italy | 2.5% |
| Hong Kong | 2.1% |
| Spain | 2.0% |
| Other Countries | 11.9% |
| Cash and Equivalents* | 2.0% |
*Includes temporary cash investments and other assets and liabilities.
6
| Shareholder Fee Example |
Fund shareholders may incur two types of costs: (1) transaction costs, including sales charges (loads) on purchase payments and redemption/exchange fees; and (2) ongoing costs, including management fees; distribution and service (12b-1) fees; and other fund expenses. This example is intended to help you understand your ongoing costs (in dollars) of investing in your fund and to compare these costs with the ongoing cost of investing in other mutual funds.
The example is based on an investment of $1,000 made at the beginning of the period and held for the entire period from July 1, 2015 to December 31, 2015.
Actual Expenses
The table provides information about actual account values and actual expenses for each class. You may use the information, together with the amount you invested, to estimate the expenses that you paid over the period. First, identify the share class you own. Then simply divide your account value by $1,000 (for example, an $8,600 account value divided by $1,000 = 8.6), then multiply the result by the number under the heading “Expenses Paid During Period” to estimate the expenses you paid on your account during this period.
Hypothetical Example for Comparison Purposes
The table also provides information about hypothetical account values and hypothetical expenses based on the actual expense ratio of each class of your fund and an assumed rate of return of 5% per year before expenses, which is not the actual return of a fund’s share class. The hypothetical account values and expenses may not be used to estimate the actual ending account balance or expenses you paid for the period. You may use this information to compare the ongoing costs of investing in your fund and other funds. To do so, compare this 5% hypothetical example with the 5% hypothetical examples that appear in the shareholder reports of the other funds.
Please note that the expenses shown in the table are meant to highlight your ongoing costs only and do not reflect any transactional costs, such as sales charges (loads) or redemption/exchange fees. Therefore, the table is useful in comparing ongoing costs only, and will not help you determine the relative total costs of owning different funds. In addition, if these transactional costs were included, your costs would have been higher.
| Beginning Account Value 7/1/15 | Ending Account Value 12/31/15 | Expenses Paid During Period(1) 7/1/15 - 12/31/15 | Annualized Expense Ratio(1) | |
| Actual | ||||
| Class I (after waiver) | $1,000 | $948.90 | $5.01 | 1.02% |
| Class I (before waiver) | $1,000 | $948.90(2) | $6.53 | 1.33% |
| Class II (after waiver) | $1,000 | $947.90 | $5.74 | 1.17% |
| Class II (before waiver) | $1,000 | $947.90(2) | $7.27 | 1.48% |
| Hypothetical | ||||
| Class I (after waiver) | $1,000 | $1,020.06 | $5.19 | 1.02% |
| Class I (before waiver) | $1,000 | $1,018.50 | $6.77 | 1.33% |
| Class II (after waiver) | $1,000 | $1,019.31 | $5.96 | 1.17% |
| Class II (before waiver) | $1,000 | $1,017.75 | $7.53 | 1.48% |
| (1) | Expenses are equal to the class's annualized expense ratio listed in the table above, multiplied by the average account value over the period, multiplied by 184, the number of days in the most recent fiscal half-year, divided by 365, to reflect the one-half year period. |
| (2) | Ending account value assumes the return earned after waiver and would have been lower if a portion of the management fee had not been waived. |
7
| Schedule of Investments |
DECEMBER 31, 2015
| Shares | Value | |||
| COMMON STOCKS — 98.0% | ||||
| Australia — 0.9% | ||||
| Qantas Airways Ltd. | 698,822 | $ | 2,072,355 | |
| Austria — 1.2% | ||||
Erste Group Bank AG(1) | 85,890 | 2,684,333 | ||
| Belgium — 3.8% | ||||
| Anheuser-Busch InBev SA/NV | 22,180 | 2,739,785 | ||
| KBC Groep NV | 59,070 | 3,693,397 | ||
| UCB SA | 26,440 | 2,379,909 | ||
| 8,813,091 | ||||
| Canada — 1.0% | ||||
| Alimentation Couche-Tard, Inc., B Shares | 51,300 | 2,258,208 | ||
| China — 1.9% | ||||
Baidu, Inc. ADR(1) | 8,780 | 1,659,771 | ||
| Tencent Holdings Ltd. | 140,400 | 2,738,930 | ||
| 4,398,701 | ||||
| Denmark — 2.5% | ||||
| Pandora A/S | 45,970 | 5,800,691 | ||
| France — 10.3% | ||||
| Accor SA | 44,240 | 1,908,291 | ||
| Arkema SA | 13,790 | 964,495 | ||
| Carrefour SA | 72,870 | 2,098,389 | ||
Criteo SA ADR(1) | 29,560 | 1,170,576 | ||
| Essilor International SA | 18,722 | 2,333,809 | ||
| Iliad SA | 4,160 | 992,494 | ||
| Ingenico Group SA | 8,100 | 1,023,842 | ||
| Legrand SA | 38,690 | 2,183,696 | ||
| LVMH Moet Hennessy Louis Vuitton SE | 14,380 | 2,247,977 | ||
| Pernod-Ricard SA | 17,200 | 1,955,485 | ||
Peugeot SA(1) | 41,090 | 720,465 | ||
| TOTAL SA | 71,718 | 3,194,022 | ||
| Valeo SA | 16,660 | 2,572,051 | ||
| Veolia Environnement SA | 19,850 | 470,509 | ||
| 23,836,101 | ||||
| Germany — 8.4% | ||||
| adidas AG | 16,660 | 1,623,386 | ||
| Bayer AG | 30,080 | 3,773,876 | ||
| Continental AG | 7,382 | 1,791,726 | ||
| Fresenius Medical Care AG & Co. KGaA | 42,300 | 3,563,849 | ||
| Symrise AG | 31,730 | 2,104,855 | ||
| Wirecard AG | 48,240 | 2,434,404 | ||
Zalando SE(1) | 105,918 | 4,184,186 | ||
| 19,476,282 | ||||
| Hong Kong — 2.1% | ||||
| AIA Group Ltd. | 759,800 | 4,526,553 | ||
| Sands China Ltd. | 132,400 | 447,809 | ||
| 4,974,362 | ||||
8
| Shares | Value | |||
| Indonesia — 0.3% | ||||
| PT Bank Mandiri (Persero) Tbk | 1,128,500 | $ | 749,130 | |
| Ireland — 3.7% | ||||
Bank of Ireland(1) | 6,729,857 | 2,466,484 | ||
| CRH plc | 54,513 | 1,575,708 | ||
| Ryanair Holdings plc ADR | 31,447 | 2,718,908 | ||
| Smurfit Kappa Group plc | 71,220 | 1,817,616 | ||
| 8,578,716 | ||||
| Israel — 0.5% | ||||
Mobileye NV(1) | 27,270 | 1,152,976 | ||
| Italy — 2.5% | ||||
| Intesa Sanpaolo SpA | 1,570,970 | 5,235,409 | ||
| Luxottica Group SpA | 6,989 | 455,609 | ||
| 5,691,018 | ||||
| Japan — 18.0% | ||||
| Calbee, Inc. | 29,200 | 1,225,471 | ||
| Daito Trust Construction Co. Ltd. | 14,400 | 1,667,154 | ||
| Fuji Heavy Industries Ltd. | 78,400 | 3,222,895 | ||
| Isuzu Motors Ltd. | 112,400 | 1,209,575 | ||
| Keyence Corp. | 3,600 | 1,975,844 | ||
| Kubota Corp. | 221,000 | 3,406,732 | ||
| Mizuho Financial Group, Inc. | 915,200 | 1,826,953 | ||
| Murata Manufacturing Co. Ltd. | 24,400 | 3,502,052 | ||
| Nidec Corp. | 32,700 | 2,366,904 | ||
| Nintendo Co. Ltd. | 6,500 | 894,802 | ||
| Nitori Holdings Co. Ltd. | 28,900 | 2,428,981 | ||
| Olympus Corp. | 32,700 | 1,287,938 | ||
| Ono Pharmaceutical Co. Ltd. | 14,300 | 2,541,609 | ||
| ORIX Corp. | 202,700 | 2,843,506 | ||
| Ryohin Keikaku Co. Ltd. | 13,600 | 2,757,148 | ||
| Seven & i Holdings Co. Ltd. | 70,500 | 3,214,477 | ||
| Suntory Beverage & Food Ltd. | 17,900 | 784,825 | ||
| Suzuki Motor Corp. | 91,900 | 2,789,938 | ||
| Unicharm Corp. | 79,700 | 1,624,883 | ||
| 41,571,687 | ||||
| Netherlands — 1.8% | ||||
| Akzo Nobel NV | 28,947 | 1,933,472 | ||
NXP Semiconductors NV(1) | 26,160 | 2,203,980 | ||
| 4,137,452 | ||||
| Norway — 0.8% | ||||
| Statoil ASA | 133,750 | 1,870,667 | ||
| Portugal — 1.1% | ||||
| Jeronimo Martins SGPS SA | 205,142 | 2,665,389 | ||
| South Korea — 0.5% | ||||
| Amorepacific Corp. | 3,280 | 1,151,938 | ||
| Spain — 2.0% | ||||
| Cellnex Telecom SAU | 72,190 | 1,345,942 | ||
| Industria de Diseno Textil SA | 95,250 | 3,268,623 | ||
| 4,614,565 | ||||
| Sweden — 1.9% | ||||
| Hexagon AB, B Shares | 38,620 | 1,430,773 | ||
9
| Shares | Value | |||
Lundin Petroleum AB(1) | 71,050 | $ | 1,018,432 | |
| Svenska Cellulosa AB, B Shares | 69,168 | 2,008,702 | ||
| 4,457,907 | ||||
| Switzerland — 9.4% | ||||
| Actelion Ltd. | 8,180 | 1,125,555 | ||
| Credit Suisse Group AG | 34,326 | 741,900 | ||
| Nestle SA | 78,540 | 5,821,672 | ||
| Novartis AG | 61,470 | 5,254,246 | ||
| Roche Holding AG | 31,619 | 8,713,821 | ||
| 21,657,194 | ||||
| United Kingdom — 23.4% | ||||
| Admiral Group plc | 49,240 | 1,197,679 | ||
| ARM Holdings plc | 111,390 | 1,682,059 | ||
| Ashtead Group plc | 176,764 | 2,908,583 | ||
| Associated British Foods plc | 37,393 | 1,840,602 | ||
| Aviva plc | 286,830 | 2,167,302 | ||
| BAE Systems plc | 176,600 | 1,299,737 | ||
| Barclays plc | 680,600 | 2,202,883 | ||
| Bunzl plc | 86,180 | 2,380,619 | ||
| Carnival plc | 56,530 | 3,209,634 | ||
| Compass Group plc | 61,690 | 1,067,718 | ||
| Croda International plc | 33,680 | 1,501,184 | ||
| Inmarsat plc | 91,310 | 1,521,365 | ||
| International Consolidated Airlines Group SA | 292,521 | 2,610,706 | ||
| Johnson Matthey plc | 57,610 | 2,237,108 | ||
Liberty Global plc, Class A(1) | 46,590 | 1,973,552 | ||
| London Stock Exchange Group plc | 60,920 | 2,461,862 | ||
| Prudential plc | 125,060 | 2,799,832 | ||
| Reckitt Benckiser Group plc | 59,280 | 5,456,661 | ||
| Rio Tinto plc | 69,087 | 2,013,379 | ||
| Shire plc | 42,520 | 2,914,058 | ||
| St. James's Place plc | 187,842 | 2,770,564 | ||
| Whitbread plc | 9,895 | 639,457 | ||
| Wolseley plc | 53,130 | 2,888,086 | ||
Worldpay Group plc(1) | 549,663 | 2,492,284 | ||
| 54,236,914 | ||||
TOTAL COMMON STOCKS (Cost $204,002,614) | 226,849,677 | |||
| TEMPORARY CASH INVESTMENTS — 1.7% | ||||
| Repurchase Agreement, Fixed Income Clearing Corp., (collateralized by various U.S. Treasury obligations, 3.00%, 5/15/45, valued at $3,756,375), at 0.08%, dated 12/31/15, due 1/4/16 (Delivery value $3,682,033) | 3,682,000 | |||
| State Street Institutional Liquid Reserves Fund, Premier Class | 133,385 | 133,385 | ||
TOTAL TEMPORARY CASH INVESTMENTS (Cost $3,815,385) | 3,815,385 | |||
TOTAL INVESTMENT SECURITIES — 99.7% (Cost $207,817,999) | 230,665,062 | |||
| OTHER ASSETS AND LIABILITIES — 0.3% | 738,873 | |||
| TOTAL NET ASSETS — 100.0% | $ | 231,403,935 | ||
10
| MARKET SECTOR DIVERSIFICATION | ||
| (as a % of net assets) | ||
| Consumer Discretionary | 19.2 | % |
| Financials | 17.1 | % |
| Consumer Staples | 15.1 | % |
| Health Care | 14.7 | % |
| Industrials | 10.7 | % |
| Information Technology | 10.6 | % |
| Materials | 6.1 | % |
| Energy | 2.6 | % |
| Telecommunication Services | 1.7 | % |
| Utilities | 0.2 | % |
| Cash and Equivalents* | 2.0 | % |
*Includes temporary cash investments and other assets and liabilities.
| NOTES TO SCHEDULE OF INVESTMENTS | ||
| ADR | - | American Depositary Receipt |
| (1) | Non-income producing. |
See Notes to Financial Statements.
11
| Statement of Assets and Liabilities |
| DECEMBER 31, 2015 | |||
| Assets | |||
| Investment securities, at value (cost of $207,817,999) | $ | 230,665,062 | |
| Foreign currency holdings, at value (cost of $7,627) | 6,741 | ||
| Receivable for investments sold | 1,002,992 | ||
| Receivable for capital shares sold | 36,289 | ||
| Dividends and interest receivable | 967,641 | ||
| Other assets | 12,174 | ||
| 232,690,899 | |||
| Liabilities | |||
| Payable for investments purchased | 1,031,329 | ||
| Payable for capital shares redeemed | 47,211 | ||
| Accrued management fees | 198,160 | ||
| Distribution fees payable | 10,264 | ||
| 1,286,964 | |||
| Net Assets | $ | 231,403,935 | |
| Net Assets Consist of: | |||
| Capital (par value and paid-in surplus) | $ | 211,746,305 | |
| Undistributed net investment income | 579,737 | ||
| Accumulated net realized loss | (3,806,788 | ) | |
| Net unrealized appreciation | 22,884,681 | ||
| $ | 231,403,935 | ||
| Net Assets | Shares Outstanding | Net Asset Value Per Share | ||||
| Class I, $0.01 Par Value | $183,648,006 | 18,328,168 | $10.02 | |||
| Class II, $0.01 Par Value | $47,755,929 | 4,773,521 | $10.00 | |||
See Notes to Financial Statements.
12
| Statement of Operations |
| YEAR ENDED DECEMBER 31, 2015 | |||
| Investment Income (Loss) | |||
| Income: | |||
| Dividends (net of foreign taxes withheld of $459,119) | $ | 4,623,884 | |
| Interest | 648 | ||
| 4,624,532 | |||
| Expenses: | |||
| Management fees | 3,274,676 | ||
| Distribution fees: | |||
| Class II | 129,005 | ||
| Class IV | 1,879 | ||
| Directors' fees and expenses | 9,153 | ||
| Other expenses | 36,943 | ||
| 3,451,656 | |||
| Fees waived | (770,984 | ) | |
| 2,680,672 | |||
| Net investment income (loss) | 1,943,860 | ||
| Realized and Unrealized Gain (Loss) | |||
| Net realized gain (loss) on: | |||
| Investment transactions | 15,572,687 | ||
| Foreign currency transactions | (63,471 | ) | |
| 15,509,216 | |||
| Change in net unrealized appreciation (depreciation) on: | |||
| Investments (includes (increase) decrease in accrued foreign taxes of $2,698) | (14,753,438 | ) | |
| Translation of assets and liabilities in foreign currencies | 7,054 | ||
| (14,746,384 | ) | ||
| Net realized and unrealized gain (loss) | 762,832 | ||
| Net Increase (Decrease) in Net Assets Resulting from Operations | $ | 2,706,692 | |
See Notes to Financial Statements.
13
| Statement of Changes in Net Assets |
| YEARS ENDED DECEMBER 31, 2015 AND DECEMBER 31, 2014 | ||||||
| Increase (Decrease) in Net Assets | December 31, 2015 | December 31, 2014 | ||||
| Operations | ||||||
| Net investment income (loss) | $ | 1,943,860 | $ | 2,209,026 | ||
| Net realized gain (loss) | 15,509,216 | 15,738,564 | ||||
| Change in net unrealized appreciation (depreciation) | (14,746,384 | ) | (34,612,658 | ) | ||
| Net increase (decrease) in net assets resulting from operations | 2,706,692 | (16,665,068 | ) | |||
| Distributions to Shareholders | ||||||
| From net investment income: | ||||||
| Class I | (760,842 | ) | (3,419,114 | ) | ||
| Class II | (110,696 | ) | (900,642 | ) | ||
| Class III | (2,813 | ) | (14,501 | ) | ||
| Class IV | (2,606 | ) | (22,279 | ) | ||
| Decrease in net assets from distributions | (876,957 | ) | (4,356,536 | ) | ||
| Capital Share Transactions | ||||||
| Net increase (decrease) in net assets from capital share transactions (Note 5) | (33,774,931 | ) | 7,467,843 | |||
| Redemption Fees | ||||||
| Increase in net assets from redemption fees | 18 | 30 | ||||
| Net increase (decrease) in net assets | (31,945,178 | ) | (13,553,731 | ) | ||
| Net Assets | ||||||
| Beginning of period | 263,349,113 | 276,902,844 | ||||
| End of period | $ | 231,403,935 | $ | 263,349,113 | ||
| Undistributed (distributions in excess of) net investment income | $ | 579,737 | $ | (509,185 | ) | |
See Notes to Financial Statements.
14
| Notes to Financial Statements |
DECEMBER 31, 2015
1. Organization
American Century Variable Portfolios, Inc. (the corporation) is registered under the Investment Company Act of 1940, as amended (the 1940 Act), as an open-end management investment company and is organized as a Maryland corporation. VP International Fund (the fund) is one fund in a series issued by the corporation. The fund is diversified as defined under the 1940 Act. The fund’s investment objective is to seek capital growth.
The fund offers Class I and Class II. The share classes differ principally in their respective distribution and shareholder servicing expenses and arrangements. Class II is charged a lower unified management fee because it has a separate arrangement for distribution services. On August 7, 2015, there were no outstanding Class III and Class IV shares and the fund discontinued offering Class III and Class IV.
2. Significant Accounting Policies
The following is a summary of significant accounting policies consistently followed by the fund in preparation of its financial statements. The fund is an investment company and follows accounting and reporting guidance in accordance with accounting principles generally accepted in the United States of America. This may require management to make certain estimates and assumptions at the date of the financial statements. Actual results could differ from these estimates. Management evaluated the impact of events or transactions occurring through the date the financial statements were issued that would merit recognition or disclosure.
Investment Valuations — The fund determines the fair value of its investments and computes its net asset value per share at the close of regular trading (usually 4 p.m. Eastern time) on the New York Stock Exchange (NYSE) on each day the NYSE is open. The Board of Directors has adopted valuation policies and procedures to guide the investment advisor in the fund’s investment valuation process and to provide methodologies for the oversight of the fund’s pricing function.
Equity securities that are listed or traded on a domestic securities exchange are valued at the last reported sales price or at the official closing price as provided by the exchange. Equity securities traded on foreign securities exchanges are generally valued at the closing price of such securities on the exchange where primarily traded or at the close of the NYSE, if that is earlier. If no last sales price is reported, or if local convention or regulation so provides, the mean of the latest bid and asked prices may be used. Securities traded over-the-counter are valued at the mean of the latest bid and asked prices, the last sales price, or the official closing price. Equity securities initially expressed in local currencies are translated into U.S. dollars at the mean of the appropriate currency exchange rate at the close of the NYSE as provided by an independent pricing service.
Open-end management investment companies are valued at the reported net asset value per share. Repurchase agreements are valued at cost, which approximates fair value.
If the fund determines that the market price for an investment is not readily available or the valuation methods mentioned above do not reflect an investment’s fair value, such investment is valued as determined in good faith by the Board of Directors or its delegate, in accordance with policies and procedures adopted by the Board of Directors. In its determination of fair value, the fund may review several factors including, but not limited to, market information regarding the specific investment or comparable investments and correlation with other investment types, futures indices or general market indicators. Circumstances that may cause the fund to use these procedures to value an investment include, but are not limited to: an investment has been declared in default or is distressed; trading in a security has been suspended during the trading day or a security is not actively trading on its principal exchange; prices received from a regular pricing source are deemed unreliable; or there is a foreign market holiday and no trading occurred.
The fund monitors for significant events occurring after the close of an investment’s primary exchange but before the fund’s net asset value per share is determined. Significant events may include, but are not limited to: corporate announcements and transactions; governmental action and political unrest that could impact a specific investment or an investment sector; or armed conflicts, natural disasters and similar events that could affect investments in a specific country or region. The fund also monitors for significant fluctuations between domestic and foreign markets, as evidenced by the U.S. market or such other indicators that the Board of
15
Directors, or its delegate, deems appropriate. If significant fluctuations in foreign markets are identified, the fund may apply a model-derived factor to the closing price of equity securities traded on foreign securities exchanges. The factor is based on observable market data as provided by an independent pricing service.
Security Transactions — Security transactions are accounted for as of the trade date. Net realized gains and losses are determined on the identified cost basis, which is also used for federal income tax purposes. Certain countries impose taxes on realized gains on the sale of securities registered in their country. The fund records the foreign tax expense, if any, on an accrual basis. The foreign tax expense on realized gains and unrealized appreciation reduces the net realized gain (loss) on investment transactions and net unrealized appreciation (depreciation) on investments, respectively.
Investment Income — Dividend income less foreign taxes withheld, if any, is recorded as of the ex-dividend date. Distributions received on securities that represent a return of capital or long-term capital gain are recorded as a reduction of cost of investments and/or as a realized gain. The fund may estimate the components of distributions received that may be considered nontaxable distributions or long-term capital gain distributions for income tax purposes. Interest income is recorded on the accrual basis and includes accretion of discounts and amortization of premiums.
Foreign Currency Translations — All assets and liabilities initially expressed in foreign currencies are translated into U.S. dollars at prevailing exchange rates at period end. The fund may enter into spot foreign currency exchange contracts to facilitate transactions denominated in a foreign currency. Purchases and sales of investment securities, dividend and interest income, spot foreign currency exchange contracts, and expenses are translated at the rates of exchange prevailing on the respective dates of such transactions. Net realized and unrealized foreign currency exchange gains or losses related to investment securities are a component of net realized gain (loss) on investment transactions and change in net unrealized appreciation (depreciation) on investments, respectively.
Repurchase Agreements — The fund may enter into repurchase agreements with institutions that American Century Investment Management, Inc. (ACIM) (the investment advisor) has determined are creditworthy pursuant to criteria adopted by the Board of Directors. The fund requires that the collateral, represented by securities, received in a repurchase transaction be transferred to the custodian in a manner sufficient to enable the fund to obtain those securities in the event of a default under the repurchase agreement. ACIM monitors, on a daily basis, the securities transferred to ensure the value, including accrued interest, of the securities under each repurchase agreement is equal to or greater than amounts owed to the fund under each repurchase agreement.
Joint Trading Account — Pursuant to an Exemptive Order issued by the Securities and Exchange Commission, the fund, along with certain other funds in the American Century Investments family of funds, may transfer uninvested cash balances into a joint trading account. These balances are invested in one or more repurchase agreements that are collateralized by U.S. Treasury or Agency obligations.
Income Tax Status — It is the fund’s policy to distribute substantially all net investment income and net realized gains to shareholders and to otherwise qualify as a regulated investment company under provisions of the Internal Revenue Code. Accordingly, no provision has been made for income taxes. The fund files U.S. federal, state, local and non-U.S. tax returns as applicable. The fund's tax returns are subject to examination by the relevant taxing authority until expiration of the applicable statute of limitations, which is generally three years from the date of filing but can be longer in certain jurisdictions. At this time, management believes there are no uncertain tax positions which, based on their technical merit, would not be sustained upon examination and for which it is reasonably possible that the total amounts of unrecognized tax benefits will significantly change in the next twelve months.
Multiple Class — All shares of the fund represent an equal pro rata interest in the net assets of the class to which such shares belong, and have identical voting, dividend, liquidation and other rights and the same terms and conditions, except for class specific expenses and exclusive rights to vote on matters affecting only individual classes. Income, non-class specific expenses, and realized and unrealized capital gains and losses of the fund are allocated to each class of shares based on their relative net assets.
Distributions to Shareholders — Distributions from net investment income and net realized gains, if any, are generally declared and paid annually.
16
Redemption Fees — The fund may impose a 1.00% redemption fee on shares held less than 60 days. The fee may not be applicable to all classes. The redemption fee is retained by the fund and helps cover transaction costs that long-term investors may bear when the fund sells securities to meet investor redemptions.
Indemnifications — Under the corporation’s organizational documents, its officers and directors are indemnified against certain liabilities arising out of the performance of their duties to the fund. In addition, in the normal course of business, the fund enters into contracts that provide general indemnifications. The maximum exposure under these arrangements is unknown as this would involve future claims that may be made against a fund. The risk of material loss from such claims is considered by management to be remote.
3. Fees and Transactions with Related Parties
Certain officers and directors of the corporation are also officers and/or directors of American Century Companies, Inc. (ACC). The corporation’s investment advisor, ACIM, the corporation's distributor, American Century Investment Services, Inc. (ACIS), and the corporation’s transfer agent, American Century Services, LLC, are wholly owned, directly or indirectly, by ACC.
Management Fees — The corporation has entered into a management agreement with ACIM, under which ACIM provides the fund with investment advisory and management services in exchange for a single, unified management fee (the fee) per class. The agreement provides that all expenses of managing and operating the fund, except distribution fees, brokerage expenses, taxes, interest, fees and expenses of the independent directors (including legal counsel fees), and extraordinary expenses, will be paid by ACIM. The fee is computed and accrued daily based on each class's daily net assets and paid monthly in arrears. The rate of the fee is determined by applying a fee rate calculation formula. This formula takes into account the fund's assets as well as certain assets, if any, of other clients of the investment advisor outside the American Century Investments family of funds (such as subadvised funds and separate accounts) that have very similar investment teams and investment strategies (strategy assets). The annual management fee schedule for each class ranges from 1.00% to 1.50% for Class I and Class III and from 0.90% to 1.40% for Class II and Class IV. From January 1, 2015 through July 31, 2015, the investment advisor voluntarily agreed to waive 0.30% of the fund's management fee. Effective August 1, 2015, the investment advisor voluntarily agreed to waive 0.31% of the fund's management fee. The investment advisor expects this waiver to continue until April 30, 2017 and cannot terminate it prior to such date without the approval of the Board of Directors. The total amount of the waiver for each class for the year ended December 31, 2015 was $610,454, $156,879, $1,393 and $2,258 for Class I, Class II, Class III and Class IV, respectively. The effective annual management fee before waiver for each class for the year ended December 31, 2015 was 1.31% and 1.21%, for Class I and Class II, respectively. The effective annual management fee after waiver for each class for the year ended December 31, 2015 was 1.01% and 0.91%, for Class I and Class II, respectively.
Distribution Fees — The Board of Directors has adopted the Master Distribution Plan for Class II and a separate Master Distribution Plan for Class IV (collectively the plans), pursuant to Rule 12b-1 of the 1940 Act. The plans provide that Class II and Class IV will each pay ACIS an annual distribution fee equal to 0.25%. The fee is computed and accrued daily based on each class's daily net assets and paid monthly in arrears. The distribution fee provides compensation for expenses incurred in connection with distributing shares of the classes including, but not limited to, payments to brokers, dealers, and financial institutions that have entered into sales agreements with respect to shares of the fund. Fees incurred under the plans during the year ended December 31, 2015 are detailed in the Statement of Operations.
Directors' Fees and Expenses — The Board of Directors is responsible for overseeing the investment advisor’s management and operations of the fund. The directors receive detailed information about the fund and its investment advisor regularly throughout the year, and meet at least quarterly with management of the investment advisor to review reports about fund operations. The fund’s officers do not receive compensation from the fund.
Other Expenses — The fund’s other expenses may include interest charges, clearing exchange fees, filing fees for foreign tax reclaims and other miscellaneous expenses. The impact of other expenses to the ratio of operating expenses to average net assets was 0.02% for the year ended December 31, 2015.
4. Investment Transactions
Purchases and sales of investment securities, excluding short-term investments, for the year ended December 31, 2015 were $146,125,098 and $182,758,095, respectively.
17
5. Capital Share Transactions
Transactions in shares of the fund were as follows:
| Year ended December 31, 2015 | Year ended December 31, 2014 | |||||||||
| Shares | Amount | Shares | Amount | |||||||
| Class I/Shares Authorized | 200,000,000 | 200,000,000 | ||||||||
| Sold | 2,416,900 | $ | 25,299,667 | 4,787,250 | $ | 51,036,215 | ||||
| Issued in reinvestment of distributions | 71,307 | 760,842 | 329,712 | 3,419,114 | ||||||
| Redeemed | (5,244,041 | ) | (54,311,788 | ) | (3,864,405 | ) | (40,252,764 | ) | ||
| (2,755,834 | ) | (28,251,279 | ) | 1,252,557 | 14,202,565 | |||||
| Class II/Shares Authorized | 100,000,000 | 100,000,000 | ||||||||
| Sold | 689,725 | 7,117,085 | 397,746 | 4,165,406 | ||||||
| Issued in reinvestment of distributions | 10,374 | 110,696 | 86,851 | 900,642 | ||||||
| Redeemed | (1,021,362 | ) | (10,552,608 | ) | (1,105,166 | ) | (11,522,937 | ) | ||
| (321,263 | ) | (3,324,827 | ) | (620,569 | ) | (6,456,889 | ) | |||
| Class III/Shares Authorized | 50,000,000 | 50,000,000 | ||||||||
| Sold | 301 | 3,149 | 20,127 | 211,172 | ||||||
| Issued in reinvestment of distributions | 263 | 2,813 | 1,398 | 14,501 | ||||||
| Redeemed | (79,489 | ) | (850,050 | ) | (27,481 | ) | (273,269 | ) | ||
| (78,925 | ) | (844,088 | ) | (5,956 | ) | (47,596 | ) | |||
| Class IV/Shares Authorized | 50,000,000 | 50,000,000 | ||||||||
| Sold | 2,004 | 20,758 | 4,457 | 46,447 | ||||||
| Issued in reinvestment of distributions | 244 | 2,606 | 2,148 | 22,279 | ||||||
| Redeemed | (128,897 | ) | (1,378,101 | ) | (28,440 | ) | (298,963 | ) | ||
| (126,649 | ) | (1,354,737 | ) | (21,835 | ) | (230,237 | ) | |||
| Net increase (decrease) | (3,282,671 | ) | $ | (33,774,931 | ) | 604,197 | $ | 7,467,843 | ||
6. Fair Value Measurements
The fund’s investments valuation process is based on several considerations and may use multiple inputs to determine the fair value of the investments held by the fund. In conformity with accounting principles generally accepted in the United States of America, the inputs used to determine a valuation are classified into three broad levels.
| • | Level 1 valuation inputs consist of unadjusted quoted prices in an active market for identical investments. |
| • | Level 2 valuation inputs consist of direct or indirect observable market data (including quoted prices for comparable investments, evaluations of subsequent market events, interest rates, prepayment speeds, credit risk, etc.). These inputs also consist of quoted prices for identical investments initially expressed in local currencies that are adjusted through translation into U.S. dollars. |
| • | Level 3 valuation inputs consist of unobservable data (including a fund’s own assumptions). |
The level classification is based on the lowest level input that is significant to the fair valuation measurement. The valuation inputs are not necessarily an indication of the risks associated with investing in these securities or other financial instruments. There were no significant transfers between levels during the period.
18
The following is a summary of the level classifications as of period end. The Schedule of Investments provides additional information on the fund’s portfolio holdings.
| Level 1 | Level 2 | Level 3 | ||||||
| Assets | ||||||||
| Investment Securities | ||||||||
| Common Stocks | $ | 10,879,763 | $ | 215,969,914 | — | |||
| Temporary Cash Investments | 133,385 | 3,682,000 | — | |||||
| $ | 11,013,148 | $ | 219,651,914 | — | ||||
7. Risk Factors
There are certain risks involved in investing in foreign securities. These risks include those resulting from future adverse political, social and economic developments, fluctuations in currency exchange rates, the possible imposition of exchange controls, and other foreign laws or restrictions. Investing in emerging markets may accentuate these risks.
8. Federal Tax Information
The tax character of distributions paid during the years ended December 31, 2015 and December 31, 2014 were as follows:
| 2015 | 2014 | |||||
| Distributions Paid From | ||||||
| Ordinary income | $ | 876,957 | $ | 4,356,536 | ||
| Long-term capital gains | — | — | ||||
The book-basis character of distributions made during the year from net investment income or net realized gains may differ from their ultimate characterization for federal income tax purposes. These differences reflect the differing character of certain income items and net realized gains and losses for financial statement and tax purposes, and may result in reclassification among certain capital accounts on the financial statements.
As of December 31, 2015, the federal tax cost of investments and the components of distributable earnings on a tax-basis were as follows:
| Federal tax cost of investments | $ | 209,708,157 | |
| Gross tax appreciation of investments | $ | 30,285,429 | |
| Gross tax depreciation of investments | (9,328,524 | ) | |
| Net tax appreciation (depreciation) of investments | 20,956,905 | ||
Net tax appreciation (depreciation) on translation of assets and liabilities in foreign currencies | 38,240 | ||
| Net tax appreciation (depreciation) | $ | 20,995,145 | |
| Undistributed ordinary income | $ | 2,180,063 | |
| Accumulated short-term capital losses | $ | (2,248,497 | ) |
| Post-October capital loss deferral | $ | (1,269,081 | ) |
The difference between book-basis and tax-basis unrealized appreciation (depreciation) is attributable primarily to the realization to ordinary income for tax purposes of unrealized gains on investments in passive foreign investment companies.
Accumulated capital losses represent net capital loss carryovers that may be used to offset future realized capital gains for federal income tax purposes. Future capital loss carryover utilization in any given year may be subject to Internal Revenue Code limitations. Capital loss carryovers expire in 2017.
Loss deferrals represent certain qualified losses that the fund has elected to treat as having been incurred in the following fiscal year for federal income tax purposes.
19
| Financial Highlights |
| For a Share Outstanding Throughout the Years Ended December 31 (except as noted) | |||||||||||||||
| Per-Share Data | Ratios and Supplemental Data | ||||||||||||||
| Income From Investment Operations: | Ratio to Average Net Assets of: | ||||||||||||||
| Net Asset Value, Beginning of Period | Net Investment Income (Loss)(1) | Net Realized and Unrealized Gain (Loss) | Total From Investment Operations | Distributions From Net Investment Income | Net Asset Value, End of Period | Total Return(2) | Operating Expenses | Operating Expenses (before expense waiver) | Net Investment Income (Loss) | Net Investment Income (Loss) (before expense waiver) | Portfolio Turnover Rate | Net Assets, End of Period (in thousands) | |||
| Class I | |||||||||||||||
| 2015 | $9.98 | 0.08 | —(3) | 0.08 | (0.04) | $10.02 | 0.76% | 1.03% | 1.33% | 0.79% | 0.49% | 59% | $183,648 | ||
| 2014 | $10.74 | 0.09 | (0.67) | (0.58) | (0.18) | $9.98 | (5.51)% | 1.03% | 1.33% | 0.84% | 0.54% | 77% | $210,511 | ||
| 2013 | $8.93 | 0.10 | 1.87 | 1.97 | (0.16) | $10.74 | 22.41% | 1.07% | 1.37% | 1.01% | 0.71% | 87% | $213,085 | ||
| 2012 | $7.43 | 0.11 | 1.46 | 1.57 | (0.07) | $8.93 | 21.16% | 1.29% | 1.42% | 1.33% | 1.20% | 80% | $193,260 | ||
| 2011 | $8.56 | 0.08 | (1.09) | (1.01) | (0.12) | $7.43 | (12.04)% | 1.43% | 1.43% | 0.92% | 0.92% | 93% | $185,654 | ||
| Class II | |||||||||||||||
| 2015 | $9.97 | 0.07 | (0.02) | 0.05 | (0.02) | $10.00 | 0.51% | 1.18% | 1.48% | 0.64% | 0.34% | 59% | $47,756 | ||
| 2014 | $10.73 | 0.08 | (0.68) | (0.60) | (0.16) | $9.97 | (5.65)% | 1.18% | 1.48% | 0.69% | 0.39% | 77% | $50,788 | ||
| 2013 | $8.92 | 0.08 | 1.88 | 1.96 | (0.15) | $10.73 | 22.25% | 1.22% | 1.52% | 0.86% | 0.56% | 87% | $61,312 | ||
| 2012 | $7.42 | 0.10 | 1.45 | 1.55 | (0.05) | $8.92 | 21.01% | 1.44% | 1.57% | 1.18% | 1.05% | 80% | $57,698 | ||
| 2011 | $8.55 | 0.06 | (1.09) | (1.03) | (0.10) | $7.42 | (12.19)% | 1.58% | 1.58% | 0.77% | 0.77% | 93% | $56,514 | ||
| Notes to Financial Highlights |
| (1) | Computed using average shares outstanding throughout the period. |
| (2) | Total returns are calculated based on the net asset value of the last business day. Total returns for periods less than one year are not annualized. |
| (3) | Per-share amount was less than $0.005. |
See Notes to Financial Statements.
20
| Report of Independent Registered Public Accounting Firm |
To the Board of Directors and Shareholders of American Century Variable Portfolios, Inc.:
We have audited the accompanying statement of assets and liabilities, including the schedule of investments, of VP International Fund (the “Fund”), one of the funds constituting American Century Variable Portfolios, Inc., as of December 31, 2015, and the related statement of operations for the year then ended, the statements of changes in net assets for each of the two years in the period then ended, and the financial highlights for each of the periods presented. These financial statements and financial highlights are the responsibility of the Fund’s management. Our responsibility is to express an opinion on these financial statements and financial highlights based on our audits.
We conducted our audits in accordance with the standards of the Public Company Accounting Oversight Board (United States). Those standards require that we plan and perform the audit to obtain reasonable assurance about whether the financial statements and financial highlights are free of material misstatement. The Fund is not required to have, nor were we engaged to perform, an audit of its internal control over financial reporting. Our audits included consideration of internal control over financial reporting as a basis for designing audit procedures that are appropriate in the circumstances, but not for the purpose of expressing an opinion on the effectiveness of the Fund’s internal control over financial reporting. Accordingly, we express no such opinion. An audit also includes examining, on a test basis, evidence supporting the amounts and disclosures in the financial statements, assessing the accounting principles used and significant estimates made by management, as well as evaluating the overall financial statement presentation. Our procedures included confirmation of securities owned as of December 31, 2015, by correspondence with the custodian and brokers; when replies were not received from brokers, we performed other auditing procedures. We believe that our audits provide a reasonable basis for our opinion.
In our opinion, the financial statements and financial highlights referred to above present fairly, in all material respects, the financial position of VP International Fund of American Century Variable Portfolios, Inc. as of December 31, 2015, the results of its operations for the year then ended, the changes in its net assets for each of the two years in the period then ended, and the financial highlights for each of the periods presented, in conformity with accounting principles generally accepted in the United States of America.
DELOITTE & TOUCHE LLP
Kansas City, Missouri
February 11, 2016
21
| Management |
The Board of Directors
The individuals listed below serve as directors of the funds. Each director will continue to serve in this capacity until death, retirement, resignation or removal from office. The board has adopted a mandatory retirement age for directors who are not “interested persons,” as that term is defined in the Investment Company Act (independent directors). Independent directors shall retire by December 31 of the year in which they reach their 75th birthday.
Mr. Thomas is an “interested person” because he currently serves as President and Chief Executive Officer of American Century Companies, Inc. (ACC), the parent company of American Century Investment Management, Inc. (ACIM or the advisor). Mr. Fink is treated as an “interested person” because of his recent employment with ACC and American Century Services, LLC (ACS). The other directors (more than three-fourths of the total number) are independent. They are not employees, directors or officers of, and have no financial interest in, ACC or any of its wholly owned, direct or indirect, subsidiaries, including ACIM, American Century Investment Services, Inc. (ACIS) and ACS, and they do not have any other affiliations, positions or relationships that would cause them to be considered “interested persons” under the Investment Company Act. The directors serve in this capacity for seven (in the case of Mr. Thomas, 15) registered investment companies in the American Century Investments family of funds.
The following table presents additional information about the directors. The mailing address for each director is 4500 Main Street, Kansas City, Missouri 64111.
| Name (Year of Birth) | Position(s) Held with Funds | Length of Time Served | Principal Occupation(s) During Past 5 Years | Number of American Century Portfolios Overseen by Director | Other Directorships Held During Past 5 Years |
Independent Directors | |||||
| Andrea C. Hall (1945) | Director | Since 1997 | Retired | 80 | None |
| Jan M. Lewis (1957) | Director | Since 2011 | Retired; President and Chief Executive Officer, Catholic Charities of Northeast Kansas (human services organization) (2006 to 2013) | 80 | None |
| James A. Olson (1942) | Director and Chairman of the Board | Since 2007 (Chairman since 2014) | Member, Plaza Belmont LLC (private equity fund manager) | 80 | Saia, Inc. (2002 to 2012) and EPR Properties (2003 to 2013) |
| M. Jeannine Strandjord (1945) | Director | Since 1994 | Retired | 80 | Euronet Worldwide Inc.; MGP Ingredients, Inc.; Charming Shoppes, Inc. (2006 to 2010); and DST Systems Inc. (1996 to 2012) |
| John R. Whitten (1946) | Director | Since 2008 | Retired | 80 | Rudolph Technologies, Inc. |
22
Name (Year of Birth) | Position(s) Held with Funds | Length of Time Served | Principal Occupation(s) During Past 5 Years | Number of American Century Portfolios Overseen by Director | Other Directorships Held During Past 5 Years |
| Independent Directors | |||||
| Stephen E. Yates (1948) | Director | Since 2012 | Retired; Executive Vice President, Technology & Operations, KeyCorp. (computer services) (2004 to 2010) | 80 | Applied Industrial Technologies, Inc. (2001 to 2010) |
| Interested Directors | |||||
| Barry Fink (1955) | Director | Since 2012 | Retired; Executive Vice President, ACC (September 2007 to February 2013); President, ACS (October 2007 to February 2013); Chief Operating Officer, ACC (September 2007 to November 2012) | 80 | None |
| Jonathan S. Thomas (1963) | Director and President | Since 2007 | President and Chief Executive Officer, ACC (March 2007 to present). Also serves as Chief Executive Officer, ACS; Executive Vice President, ACIM; Director, ACC, ACIM and other ACC subsidiaries | 125 | BioMed Valley Discoveries, Inc. |
The Statement of Additional Information has additional information about the fund's directors and is available without charge, upon request, by calling 1-800-378-9878.
23
Officers
The following table presents certain information about the executive officers of the funds. Each officer serves as an officer for each of the 15 investment companies in the American Century family of funds, unless otherwise noted. No officer is compensated for his or her service as an officer of the funds. The listed officers are interested persons of the funds and are appointed or re-appointed on an annual basis. The mailing address for each officer listed below is 4500 Main Street, Kansas City, Missouri 64111.
Name (Year of Birth) | Offices with the Funds | Principal Occupation(s) During the Past Five Years |
| Jonathan S. Thomas (1963) | Director and President since 2007 | President and Chief Executive Officer, ACC (March 2007 to present). Also serves as Chief Executive Officer, ACS; Executive Vice President, ACIM; Director, ACC, ACIM and other ACC subsidiaries |
| Amy D. Shelton (1964) | Chief Compliance Officer and Vice President since 2014 | Chief Compliance Officer, American Century funds, (March 2014 to present); Chief Compliance Officer, ACIM (February 2014 to present); Chief Compliance Officer, ACIS (October 2009 to present); Vice President, Client Interactions and Marketing, ACIS (February 2013 to January 2014); Director, Client Interactions and Marketing, ACIS (June 2007 to January 2013). Also serves as Vice President, ACIS |
| Charles A. Etherington (1957) | General Counsel since 2007 and Senior Vice President since 2006 | Attorney, ACC (February 1994 to present); Vice President, ACC (November 2005 to present); General Counsel, ACC (March 2007 to present). Also serves as General Counsel, ACIM, ACS, ACIS and other ACC subsidiaries; and Senior Vice President, ACIM and ACS |
| C. Jean Wade (1964) | Vice President, Treasurer and Chief Financial Officer since 2012 | Vice President, ACS (February 2000 to present) |
| Robert J. Leach (1966) | Vice President since 2006 and Assistant Treasurer since 2012 | Vice President, ACS (February 2000 to present) |
| David H. Reinmiller (1963) | Vice President since 2000 | Attorney, ACC (January 1994 to present); Associate General Counsel, ACC (January 2001 to present). Also serves as Vice President, ACIM and ACS |
| Ward D. Stauffer (1960) | Secretary since 2005 | Attorney, ACC (June 2003 to present) |
24
| Additional Information |
Proxy Voting Policies
A description of the policies that the fund's investment advisor uses in exercising the voting rights associated with the securities purchased and/or held by the fund is available without charge, upon request, by calling 1-800-378-9878. It is also available on the "About Us" page of American Century Investments’ website at americancentury.com and on the Securities and Exchange Commission’s website at sec.gov. Information regarding how the investment advisor voted proxies relating to portfolio securities during the most recent 12-month period ended June 30 is available on the "About Us" page at americancentury.com. It is also available at sec.gov.
Quarterly Portfolio Disclosure
The fund files its complete schedule of portfolio holdings with the Securities and Exchange Commission (SEC) for the first and third quarters of each fiscal year on Form N-Q. The fund’s Forms N-Q are available on the SEC’s website at sec.gov, and may be reviewed and copied at the SEC’s Public Reference Room in Washington, DC. Information on the operation of the Public Reference Room may be obtained by calling 1-800-SEC-0330. The fund also makes its complete
schedule of portfolio holdings for the most recent quarter of its fiscal year available on its website at ipro.americancentury.com (for Investment Professionals) and, upon request, by calling 1-800-378-9878.
Other Tax Information
The following information is provided pursuant to provisions of the Internal Revenue Code.
For the fiscal year ended December 31, 2015, the fund intends to pass through to shareholders foreign source income of $5,061,282 and foreign taxes paid of $437,026, or up to the maximum amount allowable, as a foreign tax credit. Foreign source income and foreign tax expense per outstanding share on December 31, 2015 are $0.2191 and $0.0189, respectively.
25
| Notes |
26
| Notes |
27
| Notes |
28
| ||
| Contact Us | americancentury.com | |
| Automated Information Line | 1-800-345-8765 | |
| Investment Professional Service Representatives | 1-800-345-6488 | |
| Telecommunications Relay Service for the Deaf | 711 | |
| American Century Variable Portfolios, Inc. | ||
Investment Advisor: American Century Investment Management, Inc. Kansas City, Missouri | ||
| This report and the statements it contains are submitted for the general information of our shareholders. The report is not authorized for distribution to prospective investors unless preceded or accompanied by an effective prospectus. | ||
| ©2016 American Century Proprietary Holdings, Inc. All rights reserved. CL-ANN-88144 1602 | ||
| ANNUAL REPORT | DECEMBER 31, 2015 |
VP Large Company Value Fund
| Table of Contents |
| Performance | 2 | |
| Portfolio Commentary | ||
| Fund Characteristics | ||
| Shareholder Fee Example | ||
| Schedule of Investments | ||
| Statement of Assets and Liabilities | ||
| Statement of Operations | ||
| Statement of Changes in Net Assets | ||
| Notes to Financial Statements | ||
| Financial Highlights | ||
| Report of Independent Registered Public Accounting Firm | ||
| Management | ||
| Additional Information | ||
Any opinions expressed in this report reflect those of the author as of the date of the report, and do not necessarily represent the opinions of American Century Investments® or any other person in the American Century Investments organization. Any such opinions are subject to change at any time based upon market or other conditions and American Century Investments disclaims any responsibility to update such opinions. These opinions may not be relied upon as investment advice and, because investment decisions made by American Century Investments funds are based on numerous factors, may not be relied upon as an indication of trading intent on behalf of any American Century Investments fund. Security examples are used for representational purposes only and are not intended as recommendations to purchase or sell securities. Performance information for comparative indices and securities is provided to American Century Investments by third party vendors. To the best of American Century Investments’ knowledge, such information is accurate at the time of printing.
| Performance |
| Total Returns as of December 31, 2015 | ||||||
| Average Annual Returns | ||||||
Ticker Symbol | 1 year | 5 years | 10 years | Since Inception | Inception Date | |
| Class II | AVVTX | -4.05%(1) | 10.71%(1) | 5.04%(1) | 5.78%(1) | 10/29/04 |
| Russell 1000 Value Index | — | -3.83% | 11.27% | 6.15% | 6.92% | — |
| S&P 500 Index | — | 1.38% | 12.56% | 7.30% | 7.67% | — |
| Class I | AVVIX | -3.89%(1) | 10.88%(1) | 5.19%(1) | 5.34%(1) | 12/1/04 |
| (1) | Returns would have been lower if a portion of the management fee had not been reimbursed and/or waived. |
The performance information presented does not include charges and deductions imposed by the insurance company separate account under the variable annuity or variable life insurance contracts. The inclusion of such charges could significantly lower performance. Please refer to the insurance company separate account prospectus for a discussion of the charges related to insurance contracts.
Data presented reflect past performance. Past performance is no guarantee of future results. Current performance may be higher or lower than the performance shown. Investment return and principal value will fluctuate, and redemption value may be more or less than original cost. Data assumes reinvestment of dividends and capital gains, and none of the charts reflect the deduction of taxes that a shareholder would pay on fund distributions or the redemption of fund shares. To obtain performance data current to the most recent month end, please call 1-800-345-6488 or visit ipro.americancentury.com (for Investment Professionals). For additional information about the fund, please consult the prospectus.
2
| Growth of $10,000 Over 10 Years |
| $10,000 investment made December 31, 2005 |
| Performance for other share classes will vary due to differences in fee structure. |
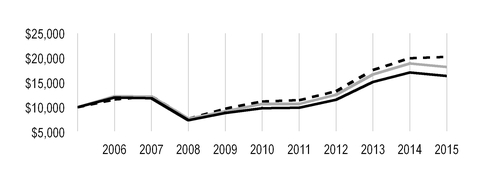
| Value on December 31, 2015 | |
| Class II — $16,349* | |
| Russell 1000 Value Index — $18,173 | |
S&P 500 Index — $20,242 | |
*Ending value would have been lower if a portion of the management fee had not been reimbursed and/or waived.
| Total Annual Fund Operating Expenses | |
| Class I | Class II |
| 0.90% | 1.05% |
The total annual fund operating expenses shown is as stated in the fund’s prospectus current as of the date of this report. The prospectus may vary from the expense ratio shown elsewhere in this report because it is based on a different time period, includes acquired fund fees and expenses, and, if applicable, does not include fee waivers or expense reimbursements.
Data presented reflect past performance. Past performance is no guarantee of future results. Current performance may be higher or lower than the performance shown. Investment return and principal value will fluctuate, and redemption value may be more or less than original cost. Data assumes reinvestment of dividends and capital gains, and none of the charts reflect the deduction of taxes that a shareholder would pay on fund distributions or the redemption of fund shares. To obtain performance data current to the most recent month end, please call 1-800-345-6488 or visit ipro.americancentury.com (for Investment Professionals). For additional information about the fund, please consult the prospectus.
3
| Portfolio Commentary |
Portfolio Managers: Brendan Healy and Matt Titus
In January 2016, portfolio manager Matt Titus left the VP Large Company Value management team and portfolio manager Brian Woglom joined the VP Large Company Value management team.
Performance Summary
VP Large Company Value returned -4.05%* for the 12 months ended December 31, 2015. The fund’s benchmark, the Russell 1000 Value Index, returned -3.83% and the S&P 500 Index returned 1.38% for the same time period. Fund returns reflect operating expenses, while the indices' returns do not.
Continued Growth in the U.S., Slowing Growth in China, Decline in Oil Drive Market Returns
The broad U.S. stock market recorded a small gain for the year, but value indices declined. During the summer, the market was roiled by concerns about slowing growth in China and other emerging markets. Oil and commodity prices dropped on worries about weak global growth, falling demand, and oversupply. Meanwhile, U.S. economic growth continued slowly. In December, the Federal Reserve (Fed) raised short-term interest rates, a move that had been anticipated by the market for most of 2015.
The large decline in the price of oil drove energy stocks down. Growth indices outperformed value indices across the market cap spectrum, as value indices have higher exposure to the energy sector. The Russell 1000 Value Index declined during the year, with seven of its ten sectors generating negative returns. The energy sector suffered the largest decline. The benchmark’s materials, consumer discretionary, information technology, utilities, consumer staples, and financials sectors also posted negative returns. Conversely, the health care, telecommunication services, and industrials sectors produced positive returns.
Security Selection in Energy and Consumer Staples Contributed to Returns
Security selection in energy was the largest positive contributor to relative returns. Lack of exposure to Kinder Morgan was especially helpful as the energy stock underperformed on deteriorating results. Additionally, the company is highly leveraged and cut its dividend by 75%.
In consumer staples, strong selection in the food and staples retailing industry helped relative returns. Overweight positions in CVS Health and Sysco and a portfolio-only position in Kroger all contributed positively to performance. In March, the portfolio sold out of its position in Kroger. The portfolio did not hold a position in Wal-Mart, which also helped relative returns. Wal-Mart’s stock price declined significantly after the company predicted a drop in next year’s annual profit.
Security Selection in Information Technology was the Largest Detractor
Security selection in the information technology sector detracted the most from relative returns. Western Digital underperformed along with several other PC-related names early in the year when earnings expectations declined amid soft PC sales, weak data from Taiwan, foreign currency headwinds, and reduced industry forecasts. Later in the period, several factors negatively impacted the company’s stock price. First, the company’s announced acquisition of SanDisk received mixed
* | All fund returns referenced in this commentary are for Class II shares. Returns would have been lower if a portion of the management fee had not been waived. Performance for other share classes will vary due to differences in fee structure; when Class II performance exceeds that of the fund's benchmark, other share classes may not. See page 2 for returns for all share classes. |
4
reviews for both price and strategy. Second, quarterly results and guidance were below expectations with weaker-than-expected margins. Estimates for industry hard drive sales also declined, and the company suspended its stock buyback program due to the pending acquisition.
The portfolio’s overweight position in Applied Materials also dampened relative performance. The semiconductor equipment segment underperformed in general due to concerns about reduced equipment demand as customer capital expenditures were lower than anticipated for 2015. Additionally, an underweight position in Microsoft over the period weighed on relative returns. Microsoft’s outperformance was driven by investor optimism as the company announced strong revenue and earnings results. The portfolio sold out of its Microsoft position in May.
On the other hand, an overweight position in Electronic Arts, an interactive entertainment software company, contributed positively to performance. The company’s revenues and margins exceeded estimates, games sold well, and its revenue mix shifted toward higher-margin digital sales. The company’s outlook remains favorable with a strong slate of upcoming releases and continued improvement in margins.
Consumer Discretionary Stocks Also Weighed on Performance
Security selection and an overweight to the consumer discretionary sector detracted from relative performance. An overweight position in Macy’s hurt relative performance as the department store retailer reported disappointing third quarter results and provided a mediocre outlook for the holiday shopping season. The portfolio sold out of its Macy's position in November. Additionally, an overweight position in Whirlpool detracted from performance.
Conversely, Delphi Automotive contributed positively to performance. The stock recovered from a late summer selloff that resulted from lower Chinese demand and the Volkswagen scandal. The company is benefiting from an increased focus on its active safety and autonomous driving technologies.
Outlook
We continue to be bottom-up investment managers, using our valuation model and fundamental analysis to identify stocks that we believe are undervalued and temporarily out of favor. As of December 31, 2015, the portfolio’s greatest overweight is to the consumer discretionary sector. The portfolio is also moderately overweight the health care sector.The portfolio is underweight in utilities and real estate investment trusts (REITs), which we believe are both susceptible to rising rates and generally overvalued.The portfolio has no holdings in telecommunication services as we continue to be concerned about competitive dynamics in the sector. Additionally, the portfolio is underweight the consumer staples sector because we believe valuations are generally high.
5
| Fund Characteristics |
| DECEMBER 31, 2015 | |
| Top Ten Holdings | % of net assets |
| JPMorgan Chase & Co. | 3.7% |
| Wells Fargo & Co. | 3.5% |
| Cisco Systems, Inc. | 2.8% |
| Chevron Corp. | 2.5% |
| Bank of America Corp. | 2.4% |
| Oracle Corp. | 2.4% |
| TOTAL SA ADR | 2.3% |
| Honeywell International, Inc. | 2.2% |
| Pfizer, Inc. | 2.2% |
| Ingersoll-Rand plc | 2.1% |
| Top Five Industries | % of net assets |
| Banks | 13.8% |
| Oil, Gas and Consumable Fuels | 12.3% |
| Pharmaceuticals | 7.3% |
| Aerospace and Defense | 5.9% |
| Insurance | 5.5% |
| Types of Investments in Portfolio | % of net assets |
| Domestic Common Stocks | 94.0% |
| Foreign Common Stocks* | 5.2% |
| Total Common Stocks | 99.2% |
| Temporary Cash Investments | 0.8% |
| Other Assets and Liabilities | —** |
*Includes depositary shares, dual-listed securities and foreign ordinary shares.
**Category is less than 0.05% of total net assets.
6
| Shareholder Fee Example |
Fund shareholders may incur two types of costs: (1) transaction costs, including sales charges (loads) on purchase payments and redemption/exchange fees; and (2) ongoing costs, including management fees; distribution and service (12b-1) fees; and other fund expenses. This example is intended to help you understand your ongoing costs (in dollars) of investing in your fund and to compare these costs with the ongoing cost of investing in other mutual funds.
The example is based on an investment of $1,000 made at the beginning of the period and held for the entire period from July 1, 2015 to December 31, 2015.
Actual Expenses
The table provides information about actual account values and actual expenses for each class. You may use the information, together with the amount you invested, to estimate the expenses that you paid over the period. First, identify the share class you own. Then simply divide your account value by $1,000 (for example, an $8,600 account value divided by $1,000 = 8.6), then multiply the result by the number under the heading “Expenses Paid During Period” to estimate the expenses you paid on your account during this period.
Hypothetical Example for Comparison Purposes
The table also provides information about hypothetical account values and hypothetical expenses based on the actual expense ratio of each class of your fund and an assumed rate of return of 5% per year before expenses, which is not the actual return of a fund’s share class. The hypothetical account values and expenses may not be used to estimate the actual ending account balance or expenses you paid for the period. You may use this information to compare the ongoing costs of investing in your fund and other funds. To do so, compare this 5% hypothetical example with the 5% hypothetical examples that appear in the shareholder reports of the other funds.
Please note that the expenses shown in the table are meant to highlight your ongoing costs only and do not reflect any transactional costs, such as sales charges (loads) or redemption/exchange fees. Therefore, the table is useful in comparing ongoing costs only, and will not help you determine the relative total costs of owning different funds. In addition, if these transactional costs were included, your costs would have been higher.
| Beginning Account Value 7/1/15 | Ending Account Value 12/31/15 | Expenses Paid During Period(1)7/1/15 - 12/31/15 | Annualized Expense Ratio(1) | |
| Actual | ||||
| Class I (after waiver) | $1,000 | $950.80 | $3.93 | 0.80% |
| Class I (before waiver) | $1,000 | $950.80(2) | $4.47 | 0.91% |
| Class II (after waiver) | $1,000 | $950.00 | $4.67 | 0.95% |
| Class II (before waiver) | $1,000 | $950.00(2) | $5.21 | 1.06% |
| Hypothetical | ||||
| Class I (after waiver) | $1,000 | $1,021.17 | $4.08 | 0.80% |
| Class I (before waiver) | $1,000 | $1,020.62 | $4.63 | 0.91% |
| Class II (after waiver) | $1,000 | $1,020.42 | $4.84 | 0.95% |
| Class II (before waiver) | $1,000 | $1,019.86 | $5.40 | 1.06% |
| (1) | Expenses are equal to the class's annualized expense ratio listed in the table above, multiplied by the average account value over the period, multiplied by 184, the number of days in the most recent fiscal half-year, divided by 365, to reflect the one-half year period. |
| (2) | Ending account value assumes the return earned after waiver and would have been lower if a portion of the management fee had not been waived. |
7
| Schedule of Investments |
DECEMBER 31, 2015
| Shares | Value | |||
| COMMON STOCKS — 99.2% | ||||
| Aerospace and Defense — 5.9% | ||||
| Honeywell International, Inc. | 3,710 | $ | 384,245 | |
| Huntington Ingalls Industries, Inc. | 1,630 | 206,765 | ||
| Raytheon Co. | 830 | 103,360 | ||
| United Technologies Corp. | 3,570 | 342,970 | ||
| 1,037,340 | ||||
| Auto Components — 2.5% | ||||
| BorgWarner, Inc. | 3,380 | 146,117 | ||
| Delphi Automotive plc | 3,360 | 288,053 | ||
| 434,170 | ||||
| Automobiles — 1.4% | ||||
| Ford Motor Co. | 9,930 | 139,914 | ||
| Harley-Davidson, Inc. | 2,460 | 111,659 | ||
| 251,573 | ||||
| Banks — 13.8% | ||||
| Bank of America Corp. | 25,460 | 428,492 | ||
| JPMorgan Chase & Co. | 9,790 | 646,433 | ||
| KeyCorp | 6,910 | 91,143 | ||
| PNC Financial Services Group, Inc. (The) | 2,680 | 255,431 | ||
| U.S. Bancorp | 8,660 | 369,522 | ||
| Wells Fargo & Co. | 11,380 | 618,617 | ||
| 2,409,638 | ||||
| Biotechnology — 0.7% | ||||
| Amgen, Inc. | 780 | 126,617 | ||
| Capital Markets — 5.4% | ||||
| Ameriprise Financial, Inc. | 2,280 | 242,638 | ||
| BlackRock, Inc. | 430 | 146,424 | ||
| Goldman Sachs Group, Inc. (The) | 1,250 | 225,287 | ||
| Invesco Ltd. | 9,880 | 330,782 | ||
| 945,131 | ||||
| Chemicals — 1.8% | ||||
| Dow Chemical Co. (The) | 3,610 | 185,843 | ||
| LyondellBasell Industries NV, Class A | 1,400 | 121,660 | ||
| 307,503 | ||||
| Communications Equipment — 2.8% | ||||
| Cisco Systems, Inc. | 17,850 | 484,717 | ||
| Consumer Finance — 2.5% | ||||
| Capital One Financial Corp. | 3,000 | 216,540 | ||
| Discover Financial Services | 4,240 | 227,349 | ||
| 443,889 | ||||
| Containers and Packaging — 0.7% | ||||
| WestRock Co. | 2,560 | 116,787 | ||
8
| Shares | Value | |||
| Diversified Financial Services — 1.0% | ||||
Berkshire Hathaway, Inc., Class B(1) | 1,360 | $ | 179,574 | |
| Electric Utilities — 2.2% | ||||
| PPL Corp. | 4,140 | 141,298 | ||
| Westar Energy, Inc. | 3,160 | 134,016 | ||
| Xcel Energy, Inc. | 3,120 | 112,039 | ||
| 387,353 | ||||
| Energy Equipment and Services — 1.2% | ||||
| Halliburton Co. | 6,270 | 213,431 | ||
| Food and Staples Retailing — 2.3% | ||||
| CVS Health Corp. | 2,900 | 283,533 | ||
| Sysco Corp. | 3,110 | 127,510 | ||
| 411,043 | ||||
| Food Products — 0.6% | ||||
| Hershey Co. (The) | 1,260 | 112,480 | ||
| Health Care Equipment and Supplies — 3.6% | ||||
| Medtronic plc | 4,760 | 366,139 | ||
| Zimmer Biomet Holdings, Inc. | 2,530 | 259,553 | ||
| 625,692 | ||||
| Health Care Providers and Services — 4.0% | ||||
| Anthem, Inc. | 1,330 | 185,455 | ||
HCA Holdings, Inc.(1) | 3,220 | 217,769 | ||
Laboratory Corp. of America Holdings(1) | 1,430 | 176,805 | ||
| McKesson Corp. | 640 | 126,227 | ||
| 706,256 | ||||
| Hotels, Restaurants and Leisure — 0.9% | ||||
| Marriott International, Inc., Class A | 2,440 | 163,578 | ||
| Household Durables — 1.2% | ||||
| Whirlpool Corp. | 1,480 | 217,368 | ||
| Insurance — 5.5% | ||||
| ACE Ltd. | 2,190 | 255,901 | ||
| American International Group, Inc. | 3,820 | 236,725 | ||
| MetLife, Inc. | 4,510 | 217,427 | ||
| Principal Financial Group, Inc. | 1,410 | 63,422 | ||
| Prudential Financial, Inc. | 2,250 | 183,173 | ||
| 956,648 | ||||
| IT Services — 0.6% | ||||
VeriFone Systems, Inc.(1) | 3,600 | 100,872 | ||
| Machinery — 3.3% | ||||
| Ingersoll-Rand plc | 6,770 | 374,313 | ||
| Stanley Black & Decker, Inc. | 1,880 | 200,653 | ||
| 574,966 | ||||
| Media — 2.3% | ||||
AMC Networks, Inc.(1) | 2,140 | 159,815 | ||
| Time Warner, Inc. | 3,720 | 240,573 | ||
| 400,388 | ||||
9
| Shares | Value | |||
| Oil, Gas and Consumable Fuels — 12.3% | ||||
| Apache Corp. | 4,190 | $ | 186,329 | |
| Chevron Corp. | 4,960 | 446,202 | ||
| Exxon Mobil Corp. | 3,350 | 261,133 | ||
| Imperial Oil Ltd. | 8,990 | 292,888 | ||
Oasis Petroleum, Inc.(1) | 7,090 | 52,253 | ||
| Occidental Petroleum Corp. | 3,470 | 234,607 | ||
| TOTAL SA ADR | 8,910 | 400,504 | ||
| Valero Energy Corp. | 3,910 | 276,476 | ||
| 2,150,392 | ||||
| Pharmaceuticals — 7.3% | ||||
Allergan plc(1) | 1,150 | 359,375 | ||
| Johnson & Johnson | 2,570 | 263,990 | ||
| Merck & Co., Inc. | 3,360 | 177,475 | ||
| Pfizer, Inc. | 11,900 | 384,132 | ||
| Teva Pharmaceutical Industries Ltd. ADR | 1,490 | 97,804 | ||
| 1,282,776 | ||||
| Real Estate Investment Trusts (REITs) — 0.9% | ||||
| Brixmor Property Group, Inc. | 5,860 | 151,305 | ||
| Road and Rail — 0.4% | ||||
| Union Pacific Corp. | 810 | 63,342 | ||
| Semiconductors and Semiconductor Equipment — 3.8% | ||||
| Applied Materials, Inc. | 14,610 | 272,769 | ||
| Microchip Technology, Inc. | 3,960 | 184,298 | ||
NXP Semiconductors NV(1) | 1,280 | 107,840 | ||
ON Semiconductor Corp.(1) | 9,470 | 92,806 | ||
| 657,713 | ||||
| Software — 3.8% | ||||
Electronic Arts, Inc.(1) | 3,680 | 252,890 | ||
| Oracle Corp. | 11,310 | 413,154 | ||
| 666,044 | ||||
| Specialty Retail — 1.4% | ||||
| Lowe's Cos., Inc. | 3,290 | 250,172 | ||
| Technology Hardware, Storage and Peripherals — 1.1% | ||||
| Western Digital Corp. | 3,090 | 185,554 | ||
| Tobacco — 2.0% | ||||
| Altria Group, Inc. | 1,660 | 96,629 | ||
| Philip Morris International, Inc. | 2,950 | 259,334 | ||
| 355,963 | ||||
TOTAL COMMON STOCKS (Cost $15,050,888) | 17,370,275 | |||
| TEMPORARY CASH INVESTMENTS — 0.8% | ||||
| Repurchase Agreement, Fixed Income Clearing Corp., (collateralized by various U.S. Treasury obligations, 3.00%, 5/15/45, valued at $139,125), at 0.08%, dated 12/31/15, due 1/4/16 (Delivery value $135,001) | 135,000 | |||
| State Street Institutional Liquid Reserves Fund, Premier Class | 5,773 | 5,773 | ||
TOTAL TEMPORARY CASH INVESTMENTS (Cost $140,773) | 140,773 | |||
TOTAL INVESTMENT SECURITIES — 100.0% (Cost $15,191,661) | 17,511,048 | |||
OTHER ASSETS AND LIABILITIES† | (2,301 | ) | ||
| TOTAL NET ASSETS — 100.0% | $ | 17,508,747 | ||
10
| FORWARD FOREIGN CURRENCY EXCHANGE CONTRACTS | ||||||||
| Currency Purchased | Currency Sold | Counterparty | Settlement Date | Unrealized Appreciation (Depreciation) | ||||
| USD | 9,345 | CAD | 12,964 | JPMorgan Chase Bank N.A. | 1/29/16 | $ | (24 | ) |
| USD | 195,926 | CAD | 273,179 | JPMorgan Chase Bank N.A. | 1/29/16 | (1,511 | ) | |
| USD | 11,453 | EUR | 10,462 | UBS AG | 1/29/16 | 77 | ||
| USD | 298,686 | EUR | 272,439 | UBS AG | 1/29/16 | 2,437 | ||
| $ | 979 | |||||||
| NOTES TO SCHEDULE OF INVESTMENTS | ||
| ADR | - | American Depositary Receipt |
| CAD | - | Canadian Dollar |
| EUR | - | Euro |
| USD | - | United States Dollar |
| † | Category is less than 0.05% of total net assets. |
| (1) | Non-income producing. |
See Notes to Financial Statements.
11
| Statement of Assets and Liabilities |
| DECEMBER 31, 2015 | |||
| Assets | |||
| Investment securities, at value (cost of $15,191,661) | $ | 17,511,048 | |
| Cash | 2,062 | ||
| Foreign currency holdings, at value (cost of $2,996) | 2,516 | ||
| Receivable for capital shares sold | 2,087 | ||
| Unrealized appreciation on forward foreign currency exchange contracts | 2,514 | ||
| Dividends and interest receivable | 29,141 | ||
| 17,549,368 | |||
| Liabilities | |||
| Payable for capital shares redeemed | 25,879 | ||
| Unrealized depreciation on forward foreign currency exchange contracts | 1,535 | ||
| Accrued management fees | 11,328 | ||
| Distribution fees payable | 1,879 | ||
| 40,621 | |||
| Net Assets | $ | 17,508,747 | |
| Net Assets Consist of: | |||
| Capital (par value and paid-in surplus) | $ | 14,333,319 | |
| Undistributed net investment income | 72,366 | ||
| Undistributed net realized gain | 783,205 | ||
| Net unrealized appreciation | 2,319,857 | ||
| $ | 17,508,747 | ||
| Net Assets | Shares Outstanding | Net Asset Value Per Share | |||
| Class I, $0.01 Par Value | $8,693,085 | 604,190 | $14.39 | ||
| Class II, $0.01 Par Value | $8,815,662 | 605,155 | $14.57 | ||
See Notes to Financial Statements.
12
| Statement of Operations |
| YEAR ENDED DECEMBER 31, 2015 | |||
| Investment Income (Loss) | |||
| Income: | |||
| Dividends (net of foreign taxes withheld of $4,322) | $ | 421,551 | |
| Interest | 75 | ||
| 421,626 | |||
| Expenses: | |||
| Management fees | 161,334 | ||
| Distribution fees - Class II | 23,047 | ||
| Directors' fees and expenses | 672 | ||
| Other expenses | 306 | ||
| 185,359 | |||
| Fees waived | (20,845 | ) | |
| 164,514 | |||
| Net investment income (loss) | 257,112 | ||
| Realized and Unrealized Gain (Loss) | |||
| Net realized gain (loss) on: | |||
| Investment transactions | 993,169 | ||
| Foreign currency transactions | 59,383 | ||
| 1,052,552 | |||
| Change in net unrealized appreciation (depreciation) on: | |||
| Investments | (2,244,361 | ) | |
| Translation of assets and liabilities in foreign currencies | (1,444 | ) | |
| (2,245,805 | ) | ||
| Net realized and unrealized gain (loss) | (1,193,253 | ) | |
| Net Increase (Decrease) in Net Assets Resulting from Operations | $ | (936,141 | ) |
See Notes to Financial Statements.
13
| Statement of Changes in Net Assets |
| YEARS ENDED DECEMBER 31, 2015 AND DECEMBER 31, 2014 | ||||||
| Increase (Decrease) in Net Assets | December 31, 2015 | December 31, 2014 | ||||
| Operations | ||||||
| Net investment income (loss) | $ | 257,112 | $ | 223,691 | ||
| Net realized gain (loss) | 1,052,552 | 1,752,545 | ||||
| Change in net unrealized appreciation (depreciation) | (2,245,805 | ) | 5,107 | |||
| Net increase (decrease) in net assets resulting from operations | (936,141 | ) | 1,981,343 | |||
| Distributions to Shareholders | ||||||
| From net investment income: | ||||||
| Class I | (144,696 | ) | (104,036 | ) | ||
| Class II | (123,961 | ) | (114,903 | ) | ||
| From net realized gains: | ||||||
| Class I | (13,866 | ) | — | |||
| Class II | (15,099 | ) | — | |||
| Decrease in net assets from distributions | (297,622 | ) | (218,939 | ) | ||
| Capital Share Transactions | ||||||
| Net increase (decrease) in net assets from capital share transactions (Note 5) | 1,680,464 | 297,850 | ||||
| Net increase (decrease) in net assets | 446,701 | 2,060,254 | ||||
| Net Assets | ||||||
| Beginning of period | 17,062,046 | 15,001,792 | ||||
| End of period | $ | 17,508,747 | $ | 17,062,046 | ||
| Undistributed net investment income | $ | 72,366 | $ | 35,490 | ||
See Notes to Financial Statements.
14
| Notes to Financial Statements |
DECEMBER 31, 2015
1. Organization
American Century Variable Portfolios, Inc. (the corporation) is registered under the Investment Company Act of 1940, as amended (the 1940 Act), as an open-end management investment company and is organized as a Maryland corporation. VP Large Company Value Fund (the fund) is one fund in a series issued by the corporation. The fund is diversified as defined under the 1940 Act. The fund’s investment objective is to seek long-term capital growth. Income is a secondary objective.
The fund offers Class I and Class II. The share classes differ principally in their respective distribution and shareholder servicing expenses and arrangements. Class II is charged a lower unified management fee because it has a separate arrangement for distribution services.
2. Significant Accounting Policies
The following is a summary of significant accounting policies consistently followed by the fund in preparation of its financial statements. The fund is an investment company and follows accounting and reporting guidance in accordance with accounting principles generally accepted in the United States of America. This may require management to make certain estimates and assumptions at the date of the financial statements. Actual results could differ from these estimates. Management evaluated the impact of events or transactions occurring through the date the financial statements were issued that would merit recognition or disclosure.
Investment Valuations — The fund determines the fair value of its investments and computes its net asset value per share at the close of regular trading (usually 4 p.m. Eastern time) on the New York Stock Exchange (NYSE) on each day the NYSE is open. The Board of Directors has adopted valuation policies and procedures to guide the investment advisor in the fund’s investment valuation process and to provide methodologies for the oversight of the fund’s pricing function.
Equity securities that are listed or traded on a domestic securities exchange are valued at the last reported sales price or at the official closing price as provided by the exchange. Equity securities traded on foreign securities exchanges are generally valued at the closing price of such securities on the exchange where primarily traded or at the close of the NYSE, if that is earlier. If no last sales price is reported, or if local convention or regulation so provides, the mean of the latest bid and asked prices may be used. Securities traded over-the-counter are valued at the mean of the latest bid and asked prices, the last sales price, or the official closing price. Equity securities initially expressed in local currencies are translated into U.S. dollars at the mean of the appropriate currency exchange rate at the close of the NYSE as provided by an independent pricing service.
Open-end management investment companies are valued at the reported net asset value per share. Repurchase agreements are valued at cost, which approximates fair value. Forward foreign currency exchange contracts are valued at the mean of the appropriate forward exchange rate at the close of the NYSE as provided by an independent pricing service.
If the fund determines that the market price for an investment is not readily available or the valuation methods mentioned above do not reflect an investment’s fair value, such investment is valued as determined in good faith by the Board of Directors or its delegate, in accordance with policies and procedures adopted by the Board of Directors. In its determination of fair value, the fund may review several factors including, but not limited to, market information regarding the specific investment or comparable investments and correlation with other investment types, futures indices or general market indicators. Circumstances that may cause the fund to use these procedures to value an investment include, but are not limited to: an investment has been declared in default or is distressed; trading in a security has been suspended during the trading day or a security is not actively trading on its principal exchange; prices received from a regular pricing source are deemed unreliable; or there is a foreign market holiday and no trading occurred.
The fund monitors for significant events occurring after the close of an investment’s primary exchange but before the fund’s net asset value per share is determined. Significant events may include, but are not limited to: corporate announcements and transactions; governmental action and political unrest that could impact a specific investment or an investment sector; or armed conflicts, natural disasters and similar events that could
15
affect investments in a specific country or region. The fund also monitors for significant fluctuations between domestic and foreign markets, as evidenced by the U.S. market or such other indicators that the Board of Directors, or its delegate, deems appropriate. If significant fluctuations in foreign markets are identified, the fund may apply a model-derived factor to the closing price of equity securities traded on foreign securities exchanges. The factor is based on observable market data as provided by an independent pricing service.
Security Transactions — Security transactions are accounted for as of the trade date. Net realized gains and losses are determined on the identified cost basis, which is also used for federal income tax purposes.
Investment Income — Dividend income less foreign taxes withheld, if any, is recorded as of the ex-dividend date. Distributions received on securities that represent a return of capital or long-term capital gain are recorded as a reduction of cost of investments and/or as a realized gain. The fund may estimate the components of distributions received that may be considered nontaxable distributions or long-term capital gain distributions for income tax purposes. Interest income is recorded on the accrual basis and includes accretion of discounts and amortization of premiums.
Foreign Currency Translations — All assets and liabilities initially expressed in foreign currencies are translated into U.S. dollars at prevailing exchange rates at period end. The fund may enter into spot foreign currency exchange contracts to facilitate transactions denominated in a foreign currency. Purchases and sales of investment securities, dividend and interest income, spot foreign currency exchange contracts, and expenses are translated at the rates of exchange prevailing on the respective dates of such transactions. Net realized and unrealized foreign currency exchange gains or losses related to investment securities are a component of net realized gain (loss) on investment transactions and change in net unrealized appreciation (depreciation) on investments, respectively.
Repurchase Agreements — The fund may enter into repurchase agreements with institutions that American Century Investment Management, Inc. (ACIM) (the investment advisor) has determined are creditworthy pursuant to criteria adopted by the Board of Directors. The fund requires that the collateral, represented by securities, received in a repurchase transaction be transferred to the custodian in a manner sufficient to enable the fund to obtain those securities in the event of a default under the repurchase agreement. ACIM monitors, on a daily basis, the securities transferred to ensure the value, including accrued interest, of the securities under each repurchase agreement is equal to or greater than amounts owed to the fund under each repurchase agreement.
Joint Trading Account — Pursuant to an Exemptive Order issued by the Securities and Exchange Commission, the fund, along with certain other funds in the American Century Investments family of funds, may transfer uninvested cash balances into a joint trading account. These balances are invested in one or more repurchase agreements that are collateralized by U.S. Treasury or Agency obligations.
Income Tax Status — It is the fund’s policy to distribute substantially all net investment income and net realized gains to shareholders and to otherwise qualify as a regulated investment company under provisions of the Internal Revenue Code. Accordingly, no provision has been made for income taxes. The fund files U.S. federal, state, local and non-U.S. tax returns as applicable. The fund's tax returns are subject to examination by the relevant taxing authority until expiration of the applicable statute of limitations, which is generally three years from the date of filing but can be longer in certain jurisdictions. At this time, management believes there are no uncertain tax positions which, based on their technical merit, would not be sustained upon examination and for which it is reasonably possible that the total amounts of unrecognized tax benefits will significantly change in the next twelve months.
Multiple Class — All shares of the fund represent an equal pro rata interest in the net assets of the class to which such shares belong, and have identical voting, dividend, liquidation and other rights and the same terms and conditions, except for class specific expenses and exclusive rights to vote on matters affecting only individual classes. Income, non-class specific expenses, and realized and unrealized capital gains and losses of the fund are allocated to each class of shares based on their relative net assets.
Distributions to Shareholders — Distributions from net investment income, if any, are generally declared and paid quarterly. Distributions from net realized gains, if any, are generally declared and paid annually.
Indemnifications — Under the corporation’s organizational documents, its officers and directors are indemnified against certain liabilities arising out of the performance of their duties to the fund. In addition, in the normal course of business, the fund enters into contracts that provide general indemnifications. The maximum exposure under these arrangements is unknown as this would involve future claims that may be made against a fund. The risk of material loss from such claims is considered by management to be remote.
16
3. Fees and Transactions with Related Parties
Certain officers and directors of the corporation are also officers and/or directors of American Century Companies, Inc. (ACC). The corporation’s investment advisor, ACIM, the corporation's distributor, American Century Investment Services, Inc. (ACIS), and the corporation’s transfer agent, American Century Services, LLC, are wholly owned, directly or indirectly, by ACC.
Management Fees — The corporation has entered into a management agreement with ACIM, under which ACIM provides the fund with investment advisory and management services in exchange for a single, unified management fee (the fee) per class. The agreement provides that all expenses of managing and operating the fund, except distribution fees, brokerage expenses, taxes, interest, fees and expenses of the independent directors (including legal counsel fees), and extraordinary expenses, will be paid by ACIM. The fee is computed and accrued daily based on each class’s daily net assets and paid monthly in arrears. The rate of the fee is determined by applying a fee rate calculation formula. This formula takes into account the fund’s assets as well as certain assets, if any, of other clients of the investment advisor outside the American Century Investments family of funds (such as subadvised funds and separate accounts) that have very similar investment teams and investment strategies (strategy assets). The annual management fee schedule ranges from 0.70% to 0.90% for Class I and from 0.60% to 0.80% for Class II. During the year ended December 31, 2015, the investment advisor voluntarily agreed to waive 0.11% of the fund's management fee. The investment advisor expects this waiver to continue until April 30, 2017, and cannot terminate it prior to such date without the approval of the Board of Directors. The total amount of the waiver for each class for the year ended December 31, 2015 was $10,705 and $10,140 for Class I and Class II, respectively. The effective annual management fee before waiver for each class for the year ended December 31, 2015 was 0.90% and 0.80% for Class I and Class II, respectively. The effective annual management fee after waiver for each class for the year ended December 31, 2015 was 0.79% and 0.69% for Class I and Class II, respectively.
Distribution Fees — The Board of Directors has adopted the Master Distribution Plan (the plan) for Class II, pursuant to Rule 12b-1 of the 1940 Act. The plan provides that Class II will pay ACIS an annual distribution fee equal to 0.25%. The fee is computed and accrued daily based on the Class II daily net assets and paid monthly in arrears. The distribution fee provides compensation for expenses incurred in connection with distributing shares of Class II including, but not limited to, payments to brokers, dealers, and financial institutions that have entered into sales agreements with respect to shares of the fund. Fees incurred under the plan during the year ended December 31, 2015 are detailed in the Statement of Operations.
Directors' Fees and Expenses — The Board of Directors is responsible for overseeing the investment advisor’s management and operations of the fund. The directors receive detailed information about the fund and its investment advisor regularly throughout the year, and meet at least quarterly with management of the investment advisor to review reports about fund operations. The fund’s officers do not receive compensation from the fund.
4. Investment Transactions
Purchases and sales of investment securities, excluding short-term investments, for the year ended December 31, 2015 were $13,300,644 and $11,655,607, respectively.
17
5. Capital Share Transactions
Transactions in shares of the fund were as follows:
| Year ended December 31, 2015 | Year ended December 31, 2014 | ||||||||
| Shares | Amount | Shares | Amount | ||||||
| Class I/Shares Authorized | 50,000,000 | 50,000,000 | |||||||
| Sold | 324,255 | $ | 4,973,581 | 130,427 | $ | 1,863,978 | |||
| Issued in reinvestment of distributions | 10,723 | 158,562 | 7,144 | 104,036 | |||||
| Redeemed | (226,277) | (3,285,759) | (138,480) | (1,993,506) | |||||
| 108,701 | 1,846,384 | (909) | (25,492) | ||||||
| Class II/Shares Authorized | 50,000,000 | 50,000,000 | |||||||
| Sold | 137,356 | 2,072,112 | 301,056 | 4,329,887 | |||||
| Issued in reinvestment of distributions | 9,271 | 139,060 | 7,793 | 114,903 | |||||
| Redeemed | (158,581) | (2,377,092) | (284,061) | (4,121,448) | |||||
| (11,954) | (165,920) | 24,788 | 323,342 | ||||||
| Net increase (decrease) | 96,747 | $ | 1,680,464 | 23,879 | $ | 297,850 | |||
6. Fair Value Measurements
The fund’s investments valuation process is based on several considerations and may use multiple inputs to determine the fair value of the investments held by the fund. In conformity with accounting principles generally accepted in the United States of America, the inputs used to determine a valuation are classified into three broad levels.
| • | Level 1 valuation inputs consist of unadjusted quoted prices in an active market for identical investments. |
| • | Level 2 valuation inputs consist of direct or indirect observable market data (including quoted prices for comparable investments, evaluations of subsequent market events, interest rates, prepayment speeds, credit risk, etc.). These inputs also consist of quoted prices for identical investments initially expressed in local currencies that are adjusted through translation into U.S. dollars. |
| • | Level 3 valuation inputs consist of unobservable data (including a fund’s own assumptions). |
The level classification is based on the lowest level input that is significant to the fair valuation measurement. The valuation inputs are not necessarily an indication of the risks associated with investing in these securities or other financial instruments. There were no significant transfers between levels during the period.
The following is a summary of the level classifications as of period end. The Schedule of Investments provides additional information on the fund’s portfolio holdings.
| Level 1 | Level 2 | Level 3 | ||||||
| Assets | ||||||||
| Investment Securities | ||||||||
| Common Stocks | $ | 17,077,387 | $ | 292,888 | — | |||
| Temporary Cash Investments | 5,773 | 135,000 | — | |||||
| $ | 17,083,160 | $ | 427,888 | — | ||||
| Other Financial Instruments | ||||||||
| Forward Foreign Currency Exchange Contracts | — | $ | 2,514 | — | ||||
| Liabilities | ||||||||
| Other Financial Instruments | ||||||||
| Forward Foreign Currency Exchange Contracts | — | $ | 1,535 | — | ||||
18
7. Derivative Instruments
Foreign Currency Risk — The fund is subject to foreign currency exchange rate risk in the normal course of pursuing its investment objectives. The value of foreign investments held by a fund may be significantly affected by changes in foreign currency exchange rates. The dollar value of a foreign security generally decreases when the value of the dollar rises against the foreign currency in which the security is denominated and tends to increase when the value of the dollar declines against such foreign currency. A fund may enter into forward foreign currency exchange contracts to reduce a fund's exposure to foreign currency exchange rate fluctuations. The net U.S. dollar value of foreign currency underlying all contractual commitments held by a fund and the resulting unrealized appreciation or depreciation are determined daily. Realized gain or loss is recorded upon the termination of the contract. Net realized and unrealized gains or losses occurring during the holding period of forward foreign currency exchange contracts are a component of net realized gain (loss) on foreign currency transactions and change in net unrealized appreciation (depreciation) on translation of assets and liabilities in foreign currencies, respectively. A fund bears the risk of an unfavorable change in the foreign currency exchange rate underlying the forward contract. Additionally, losses, up to the fair value, may arise if the counterparties do not perform under the contract terms. The fund's average U.S. dollar exposure to foreign currency risk derivative instruments held during the period was $546,690.
The value of foreign currency risk derivative instruments as of December 31, 2015, is disclosed on the Statement of Assets and Liabilities as an asset of $2,514 in unrealized appreciation on forward foreign currency exchange contracts and a liability of $1,535 in unrealized depreciation on forward foreign currency exchange contracts. For the year ended December 31, 2015, the effect of foreign currency risk derivative instruments on the Statement of Operations was $59,931 in net realized gain (loss) on foreign currency transactions and $(1,204) in change in net unrealized appreciation (depreciation) on translation of assets and liabilities in foreign currencies.
8. Risk Factors
There are certain risks involved in investing in foreign securities. These risks include those resulting from future adverse political, social and economic developments, fluctuations in currency exchange rates, the possible imposition of exchange controls, and other foreign laws or restrictions.
9. Federal Tax Information
The tax character of distributions paid during the years ended December 31, 2015 and December 31, 2014 were as follows:
| 2015 | 2014 | |||||
| Distributions Paid From | ||||||
| Ordinary income | $ | 268,657 | $ | 218,939 | ||
| Long-term capital gains | $ | 28,965 | — | |||
The book-basis character of distributions made during the year from net investment income or net realized gains may differ from their ultimate characterization for federal income tax purposes. These differences reflect the differing character of certain income items and net realized gains and losses for financial statement and tax purposes, and may result in reclassification among certain capital accounts on the financial statements.
19
As of December 31, 2015, the federal tax cost of investments and the components of distributable earnings on a tax-basis were as follows:
| Federal tax cost of investments | $ | 15,440,232 | |
| Gross tax appreciation of investments | $ | 2,801,680 | |
| Gross tax depreciation of investments | (730,864 | ) | |
| Net tax appreciation (depreciation) of investments | 2,070,816 | ||
Net tax appreciation (depreciation) on derivatives and translation of assets and liabilities in foreign currencies | (509 | ) | |
| Net tax appreciation (depreciation) | $ | 2,070,307 | |
| Undistributed ordinary income | $ | 73,345 | |
| Accumulated long-term gains | $ | 1,031,776 | |
The difference between book-basis and tax-basis unrealized appreciation (depreciation) is attributable primarily to the tax deferral of losses on wash sales.
20
| Financial Highlights |
| For a Share Outstanding Throughout the Years Ended December 31 (except as noted) | |||||||||||||||||
| Per-Share Data | Ratios and Supplemental Data | ||||||||||||||||
| Income From Investment Operations: | Distributions From: | Ratio to Average Net Assets of: | |||||||||||||||
| Net Asset Value, Beginning of Period | Net Investment Income (Loss)(1) | Net Realized and Unrealized Gain (Loss) | Total From Investment Operations | Net Investment Income | Net Realized Gains | Total Distributions | Net Asset Value, End of Period | Total Return(2) | Operating Expenses | Operating Expenses (before expense waiver) | Net Investment Income (Loss) | Net Investment Income (Loss) (before expense waiver) | Portfolio Turnover Rate | Net Assets, End of Period (in thousands) | |||
| Class I | |||||||||||||||||
| 2015 | $15.23 | 0.22 | (0.81) | (0.59) | (0.23) | (0.02) | (0.25) | $14.39 | (3.89)% | 0.80% | 0.91% | 1.43% | 1.32% | 63% | $8,693 | ||
| 2014 | $13.69 | 0.21 | 1.54 | 1.75 | (0.21) | — | (0.21) | $15.23 | 12.87% | 0.80% | 0.90% | 1.47% | 1.37% | 70% | $7,547 | ||
| 2013 | $10.58 | 0.20 | 3.10 | 3.30 | (0.19) | — | (0.19) | $13.69 | 31.33% | 0.86% | 0.91% | 1.64% | 1.59% | 61% | $6,795 | ||
| 2012 | $9.26 | 0.19 | 1.32 | 1.51 | (0.19) | — | (0.19) | $10.58 | 16.40% | 0.90% | 0.91% | 1.89% | 1.88% | 65% | $4,997 | ||
| 2011 | $9.31 | 0.16 | (0.06) | 0.10 | (0.15) | — | (0.15) | $9.26 | 1.12% | 0.91% | 0.91% | 1.69% | 1.69% | 49% | $4,825 | ||
| Class II | |||||||||||||||||
| 2015 | $15.42 | 0.19 | (0.81) | (0.62) | (0.21) | (0.02) | (0.23) | $14.57 | (4.05)% | 0.95% | 1.06% | 1.28% | 1.17% | 63% | $8,816 | ||
| 2014 | $13.86 | 0.19 | 1.56 | 1.75 | (0.19) | — | (0.19) | $15.42 | 12.77% | 0.95% | 1.05% | 1.32% | 1.22% | 70% | $9,515 | ||
| 2013 | $10.71 | 0.19 | 3.13 | 3.32 | (0.17) | — | (0.17) | $13.86 | 31.04% | 1.01% | 1.06% | 1.49% | 1.44% | 61% | $8,207 | ||
| 2012 | $9.36 | 0.18 | 1.35 | 1.53 | (0.18) | — | (0.18) | $10.71 | 16.37% | 1.05% | 1.06% | 1.74% | 1.73% | 65% | $5,275 | ||
| 2011 | $9.42 | 0.15 | (0.07) | 0.08 | (0.14) | — | (0.14) | $9.36 | 0.85% | 1.06% | 1.06% | 1.54% | 1.54% | 49% | $4,649 | ||
| Notes to Financial Highlights | ||||
| (1) | Computed using average shares outstanding throughout the period. |
| (2) | Total returns are calculated based on the net asset value of the last business day. Total returns for periods less than one year are not annualized. |
See Notes to Financial Statements.
21
| Report of Independent Registered Public Accounting Firm |
To the Board of Directors and Shareholders of American Century Variable Portfolios, Inc.:
We have audited the accompanying statement of assets and liabilities, including the schedule of investments, of VP Large Company Value Fund (the “Fund”), one of the funds constituting American Century Variable Portfolios, Inc., as of December 31, 2015, and the related statement of operations for the year then ended, the statements of changes in net assets for each of the two years in the period then ended, and the financial highlights for each of the periods presented. These financial statements and financial highlights are the responsibility of the Fund’s management. Our responsibility is to express an opinion on these financial statements and financial highlights based on our audits.
We conducted our audits in accordance with the standards of the Public Company Accounting Oversight Board (United States). Those standards require that we plan and perform the audit to obtain reasonable assurance about whether the financial statements and financial highlights are free of material misstatement. The Fund is not required to have, nor were we engaged to perform, an audit of its internal control over financial reporting. Our audits included consideration of internal control over financial reporting as a basis for designing audit procedures that are appropriate in the circumstances, but not for the purpose of expressing an opinion on the effectiveness of the Fund’s internal control over financial reporting. Accordingly, we express no such opinion. An audit also includes examining, on a test basis, evidence supporting the amounts and disclosures in the financial statements, assessing the accounting principles used and significant estimates made by management, as well as evaluating the overall financial statement presentation. Our procedures included confirmation of securities owned as of December 31, 2015, by correspondence with the custodian and brokers; when replies were not received from brokers, we performed other auditing procedures. We believe that our audits provide a reasonable basis for our opinion.
In our opinion, the financial statements and financial highlights referred to above present fairly, in all material respects, the financial position of VP Large Company Value Fund of American Century Variable Portfolios, Inc. as of December 31, 2015, the results of its operations for the year then ended, the changes in its net assets for each of the two years in the period then ended, and the financial highlights for each of the periods presented, in conformity with accounting principles generally accepted in the United States of America.
DELOITTE & TOUCHE LLP
Kansas City, Missouri
February 11, 2016
22
| Management |
The Board of Directors
The individuals listed below serve as directors of the funds. Each director will continue to serve in this capacity until death, retirement, resignation or removal from office. The board has adopted a mandatory retirement age for directors who are not “interested persons,” as that term is defined in the Investment Company Act (independent directors). Independent directors shall retire by December 31 of the year in which they reach their 75th birthday.
Mr. Thomas is an “interested person” because he currently serves as President and Chief Executive Officer of American Century Companies, Inc. (ACC), the parent company of American Century Investment Management, Inc. (ACIM or the advisor). Mr. Fink is treated as an “interested person” because of his recent employment with ACC and American Century Services, LLC (ACS). The other directors (more than three-fourths of the total number) are independent. They are not employees, directors or officers of, and have no financial interest in, ACC or any of its wholly owned, direct or indirect, subsidiaries, including ACIM, American Century Investment Services, Inc. (ACIS) and ACS, and they do not have any other affiliations, positions or relationships that would cause them to be considered “interested persons” under the Investment Company Act. The directors serve in this capacity for seven (in the case of Mr. Thomas, 15) registered investment companies in the American Century Investments family of funds.
The following table presents additional information about the directors. The mailing address for each director is 4500 Main Street, Kansas City, Missouri 64111.
| Name (Year of Birth) | Position(s) Held with Funds | Length of Time Served | Principal Occupation(s) During Past 5 Years | Number of American Century Portfolios Overseen by Director | Other Directorships Held During Past 5 Years |
Independent Directors | |||||
| Andrea C. Hall (1945) | Director | Since 1997 | Retired | 80 | None |
| Jan M. Lewis (1957) | Director | Since 2011 | Retired; President and Chief Executive Officer, Catholic Charities of Northeast Kansas (human services organization) (2006 to 2013) | 80 | None |
| James A. Olson (1942) | Director and Chairman of the Board | Since 2007 (Chairman since 2014) | Member, Plaza Belmont LLC (private equity fund manager) | 80 | Saia, Inc. (2002 to 2012) and EPR Properties (2003 to 2013) |
| M. Jeannine Strandjord (1945) | Director | Since 1994 | Retired | 80 | Euronet Worldwide Inc.; MGP Ingredients, Inc.; Charming Shoppes, Inc. (2006 to 2010); and DST Systems Inc. (1996 to 2012) |
| John R. Whitten (1946) | Director | Since 2008 | Retired | 80 | Rudolph Technologies, Inc. |
23
Name (Year of Birth) | Position(s) Held with Funds | Length of Time Served | Principal Occupation(s) During Past 5 Years | Number of American Century Portfolios Overseen by Director | Other Directorships Held During Past 5 Years |
| Independent Directors | |||||
| Stephen E. Yates (1948) | Director | Since 2012 | Retired; Executive Vice President, Technology & Operations, KeyCorp. (computer services) (2004 to 2010) | 80 | Applied Industrial Technologies, Inc. (2001 to 2010) |
| Interested Directors | |||||
| Barry Fink (1955) | Director | Since 2012 | Retired; Executive Vice President, ACC (September 2007 to February 2013); President, ACS (October 2007 to February 2013); Chief Operating Officer, ACC (September 2007 to November 2012) | 80 | None |
| Jonathan S. Thomas (1963) | Director and President | Since 2007 | President and Chief Executive Officer, ACC (March 2007 to present). Also serves as Chief Executive Officer, ACS; Executive Vice President, ACIM; Director, ACC, ACIM and other ACC subsidiaries | 125 | BioMed Valley Discoveries, Inc. |
The Statement of Additional Information has additional information about the fund's directors and is available without charge, upon request, by calling 1-800-378-9878.
24
Officers
The following table presents certain information about the executive officers of the funds. Each officer serves as an officer for each of the 15 investment companies in the American Century family of funds, unless otherwise noted. No officer is compensated for his or her service as an officer of the funds. The listed officers are interested persons of the funds and are appointed or re-appointed on an annual basis. The mailing address for each officer listed below is 4500 Main Street, Kansas City, Missouri 64111.
Name (Year of Birth) | Offices with the Funds | Principal Occupation(s) During the Past Five Years |
| Jonathan S. Thomas (1963) | Director and President since 2007 | President and Chief Executive Officer, ACC (March 2007 to present). Also serves as Chief Executive Officer, ACS; Executive Vice President, ACIM; Director, ACC, ACIM and other ACC subsidiaries |
| Amy D. Shelton (1964) | Chief Compliance Officer and Vice President since 2014 | Chief Compliance Officer, American Century funds, (March 2014 to present); Chief Compliance Officer, ACIM (February 2014 to present); Chief Compliance Officer, ACIS (October 2009 to present); Vice President, Client Interactions and Marketing, ACIS (February 2013 to January 2014); Director, Client Interactions and Marketing, ACIS (June 2007 to January 2013). Also serves as Vice President, ACIS |
| Charles A. Etherington (1957) | General Counsel since 2007 and Senior Vice President since 2006 | Attorney, ACC (February 1994 to present); Vice President, ACC (November 2005 to present); General Counsel, ACC (March 2007 to present). Also serves as General Counsel, ACIM, ACS, ACIS and other ACC subsidiaries; and Senior Vice President, ACIM and ACS |
| C. Jean Wade (1964) | Vice President, Treasurer and Chief Financial Officer since 2012 | Vice President, ACS (February 2000 to present) |
| Robert J. Leach (1966) | Vice President since 2006 and Assistant Treasurer since 2012 | Vice President, ACS (February 2000 to present) |
| David H. Reinmiller (1963) | Vice President since 2000 | Attorney, ACC (January 1994 to present); Associate General Counsel, ACC (January 2001 to present). Also serves as Vice President, ACIM and ACS |
| Ward D. Stauffer (1960) | Secretary since 2005 | Attorney, ACC (June 2003 to present) |
25
| Additional Information |
Proxy Voting Policies
A description of the policies that the fund's investment advisor uses in exercising the voting rights associated with the securities purchased and/or held by the fund is available without charge, upon request, by calling 1-800-378-9878. It is also available on the "About Us" page of American Century Investments’ website at americancentury.com and on the Securities and Exchange Commission’s website at sec.gov. Information regarding how the investment advisor voted proxies relating to portfolio securities during the most recent 12-month period ended June 30 is available on the "About Us" page at americancentury.com. It is also available at sec.gov.
Quarterly Portfolio Disclosure
The fund files its complete schedule of portfolio holdings with the Securities and Exchange Commission (SEC) for the first and third quarters of each fiscal year on Form N-Q. The fund’s Forms N-Q are available on the SEC’s website at sec.gov, and may be reviewed and copied at the SEC’s Public Reference Room in Washington, DC. Information on the operation of the Public Reference Room may be obtained by calling 1-800-SEC-0330. The fund also makes its complete
schedule of portfolio holdings for the most recent quarter of its fiscal year available on its website at ipro.americancentury.com (for Investment Professionals) and, upon request, by calling 1-800-378-9878.
Other Tax Information
The following information is provided pursuant to provisions of the Internal Revenue Code.
For corporate taxpayers, the fund hereby designates $268,657, or up to the maximum amount allowable, of ordinary income distributions paid during the fiscal year ended December 31, 2015 as qualified for the corporate dividends received deduction.
The fund hereby designates $28,965, or up to the maximum amount allowable, as long-term capital gain distributions for the fiscal year ended December 31, 2015.
26
| Notes |
27
| Notes |
28
| ||
| Contact Us | americancentury.com | |
| Automated Information Line | 1-800-345-8765 | |
| Investment Professional Service Representatives | 1-800-345-6488 | |
| Telecommunications Relay Service for the Deaf | 711 | |
| American Century Variable Portfolios, Inc. | ||
Investment Advisor: American Century Investment Management, Inc. Kansas City, Missouri | ||
| This report and the statements it contains are submitted for the general information of our shareholders. The report is not authorized for distribution to prospective investors unless preceded or accompanied by an effective prospectus. | ||
| ©2016 American Century Proprietary Holdings, Inc. All rights reserved. CL-ANN-88148 1602 | ||
| ANNUAL REPORT | DECEMBER 31, 2015 |
VP Mid Cap Value Fund
| Table of Contents |
| Performance | 2 | |
| Portfolio Commentary | ||
| Fund Characteristics | ||
| Shareholder Fee Example | ||
| Schedule of Investments | ||
| Statement of Assets and Liabilities | ||
| Statement of Operations | ||
| Statement of Changes in Net Assets | ||
| Notes to Financial Statements | ||
| Financial Highlights | ||
| Report of Independent Registered Public Accounting Firm | ||
| Management | ||
| Additional Information | ||
Any opinions expressed in this report reflect those of the author as of the date of the report, and do not necessarily represent the opinions of American Century Investments® or any other person in the American Century Investments organization. Any such opinions are subject to change at any time based upon market or other conditions and American Century Investments disclaims any responsibility to update such opinions. These opinions may not be relied upon as investment advice and, because investment decisions made by American Century Investments funds are based on numerous factors, may not be relied upon as an indication of trading intent on behalf of any American Century Investments fund. Security examples are used for representational purposes only and are not intended as recommendations to purchase or sell securities. Performance information for comparative indices and securities is provided to American Century Investments by third party vendors. To the best of American Century Investments’ knowledge, such information is accurate at the time of printing.
| Performance |
| Total Returns as of December 31, 2015 | ||||||
| Average Annual Returns | ||||||
Ticker Symbol | 1 year | 5 years | 10 years | Since Inception | Inception Date | |
| Class II | AVMTX | -1.58%(1) | 11.35%(1) | 8.88% | 9.92% | 10/29/04 |
| Russell Midcap Value Index | — | -4.78% | 11.24% | 7.60% | 8.92% | — |
| Class I | AVIPX | -1.43%(1) | 11.51%(1) | 9.04% | 9.41% | 12/1/04 |
| (1) | Returns would have been lower if a portion of the management fee had not been waived. |
The performance information presented does not include charges and deductions imposed by the insurance company separate account under the variable annuity or variable life insurance contracts. The inclusion of such charges could significantly lower performance. Please refer to the insurance company separate account prospectus for a discussion of the charges related to insurance contracts.
Data presented reflect past performance. Past performance is no guarantee of future results. Current performance may be higher or lower than the performance shown. Investment return and principal value will fluctuate, and redemption value may be more or less than original cost. Data assumes reinvestment of dividends and capital gains, and none of the charts reflect the deduction of taxes that a shareholder would pay on fund distributions or the redemption of fund shares. To obtain performance data current to the most recent month end, please call 1-800-345-6488 or visit ipro.americancentury.com (for Investment Professionals). For additional information about the fund, please consult the prospectus.
2
| Growth of $10,000 Over 10 Years |
| $10,000 investment made December 31, 2005 |
| Performance for other share classes will vary due to differences in fee structure. |
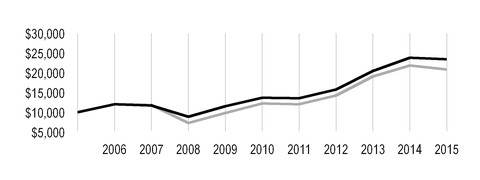
| Value on December 31, 2015 | |
| Class II — $23,423* | |
| Russell Midcap Value Index — $20,814 | |
*Ending value would have been lower if a portion of the management fee had not been waived.
| Total Annual Fund Operating Expenses | |
| Class I | Class II |
| 1.01% | 1.16% |
The total annual fund operating expenses shown is as stated in the fund’s prospectus current as of the date of this report. The prospectus may vary from the expense ratio shown elsewhere in this report because it is based on a different time period, includes acquired fund fees and expenses, and, if applicable, does not include fee waivers or expense reimbursements.
Data presented reflect past performance. Past performance is no guarantee of future results. Current performance may be higher or lower than the performance shown. Investment return and principal value will fluctuate, and redemption value may be more or less than original cost. Data assumes reinvestment of dividends and capital gains, and none of the charts reflect the deduction of taxes that a shareholder would pay on fund distributions or the redemption of fund shares. To obtain performance data current to the most recent month end, please call 1-800-345-6488 or visit ipro.americancentury.com (for Investment Professionals). For additional information about the fund, please consult the prospectus.
3
| Portfolio Commentary |
Portfolio Managers: Kevin Toney, Michael Liss, Phil Davidson and Brian Woglom
Performance Summary
VP Mid Cap Value returned -1.58%* for the 12 months ended December 31, 2015. By comparison, its benchmark, the Russell Midcap Value Index, returned -4.78%. The portfolio’s returns reflect operating expenses, while the index’s returns do not.
The broad U.S. stock market recorded a small gain for the year. During the summer, the market was roiled by concerns about slowing growth in China and other emerging markets. Oil and commodity prices dropped on worries about weak global growth, falling demand, and oversupply. Meanwhile, U.S. economic growth continued slowly. In December, the U.S. Federal Reserve (Fed) raised short-term interest rates, a move that had been anticipated by the market for most of 2015.
In this environment, VP Mid Cap Value received positive results in absolute terms in four of the 10 sectors in which it was invested. Selection among consumer staples companies, as well as an overweight position relative to the benchmark, contributed the most to relative results. The portfolio also benefited from security selection in the utilities sector. Although an overweight in energy diminished performance, the portfolio’s mix of stocks added substantially to results. Security selection in information technology detracted from relative returns. In addition, the portfolio was hampered by an underweight position and selection in the financials sector.
Consumer Staples Boosted Performance
Within consumer staples, the portfolio’s overweight position in the food product industry was advantageous. A notable contributor was snack company Mondelez International, a portfolio-only investment. The company, which topped earnings expectations and raised margins, indicated a willingness to be acquired and had an activist investor promoting the stock. Among food and staples retailers, Sysco, a large distributor of food and related products, benefited from improving restaurant sales and the addition of an activist investor to its board.
Energy Selection Added Value
Security selection in the energy sector bolstered results, as the portfolio did not own some of the sector’s steepest decliners. However, its gains were limited by its overweight position. A key contribution was made by Cameron International, a global provider of pressure control, processing, flow control, and compression systems. Its stock rose on news that oilfield-services provider Schlumberger had agreed to acquire it at a healthy premium. On the other hand, declining oil and natural gas prices weighed on a number of the portfolio’s holdings, including natural gas drilling company EQT, as well as portfolio-only investments Devon Energy, an independent natural gas and oil producer, and petroleum company Imperial Oil.
| * | All fund returns referenced in this commentary are for Class II shares. Returns would have been lower if a portion of the management fee had not been waived. Performance for other share classes will vary due to differences in fee structure; when Class II performance exceeds that of the fund’s benchmark, other share classes may not. See page 2 for returns for all share classes. |
4
Industrials Sector Source of Top Contributor
The industrials sector provided top contributor Republic Services. The waste management company recorded strong gains as it continued to execute well and has minimal exposure to emerging markets and foreign currency issues. Within the aerospace and defense industry, Exelis was acquired by competitor Harris Corp. in a cash and stock deal at approximately a 35% premium over the company’s share price at the time. Industrials was also the source of notable detractor Heartland Express. The trucking company underperformed along with other transportation stocks amid weaker volumes and increased labor costs.
Information Technology Sector Hampered Results
Security selection in the information technology sector had a negative impact on relative results, particularly in a lack of exposure to the software industry. Semiconductors and semiconductor equipment companies also detracted, including a portfolio-only position in Micron Technology, which suffered amid weakness in the PC-build segment. The company’s prices dropped faster than its costs, hurting the share price, and the portfolio exited its position.
Financials Sector Detracted
The portfolio’s substantial underweight to REITs led to relative underperformance in the financials sector.
Outlook
We will continue to follow our disciplined, bottom-up process, selecting securities one at a time for the portfolio. As of December 31, 2015, the portfolio is notably overweight consumer staples stocks, because we believe they have favorable risk-return profiles and there is opportunity for continued industry consolidation. A significant overweight was maintained in energy, with a focus on higher-quality companies across the sector that have been pressured by the steep drop in oil prices. The portfolio has smaller overweights in the industrials and health care sectors. The portfolio’s largest sector underweight is in financials, where it is significantly underweight REITs as we continue to find valuations unattractive. The portfolio is moderately underweight the materials sector, and has smaller relative underweights in the utilities and consumer discretionary sectors.
5
| Fund Characteristics |
| DECEMBER 31, 2015 | |
| Top Ten Holdings | % of net assets |
| Sysco Corp. | 3.1% |
| Northern Trust Corp. | 3.0% |
| Republic Services, Inc. | 2.4% |
| Zimmer Biomet Holdings, Inc. | 1.9% |
| Imperial Oil Ltd. | 1.8% |
| Applied Materials, Inc. | 1.7% |
| Weyerhaeuser Co. | 1.6% |
| Tyco International plc | 1.6% |
| Cameron International Corp. | 1.6% |
| PG&E Corp. | 1.5% |
| Top Five Industries | % of net assets |
| Oil, Gas and Consumable Fuels | 8.3% |
| Banks | 7.9% |
| Insurance | 6.8% |
| Commercial Services and Supplies | 5.6% |
| Capital Markets | 5.5% |
| Types of Investments in Portfolio | % of net assets |
| Common Stocks | 96.2% |
| Exchange-Traded Funds | 1.0% |
| Total Equity Exposure | 97.2% |
| Temporary Cash Investments | 3.1% |
| Other Assets and Liabilities | (0.3)% |
6
| Shareholder Fee Example |
Fund shareholders may incur two types of costs: (1) transaction costs, including sales charges (loads) on purchase payments and redemption/exchange fees; and (2) ongoing costs, including management fees; distribution and service (12b-1) fees; and other fund expenses. This example is intended to help you understand your ongoing costs (in dollars) of investing in your fund and to compare these costs with the ongoing cost of investing in other mutual funds.
The example is based on an investment of $1,000 made at the beginning of the period and held for the entire period from July 1, 2015 to December 31, 2015.
Actual Expenses
The table provides information about actual account values and actual expenses for each class. You may use the information, together with the amount you invested, to estimate the expenses that you paid over the period. First, identify the share class you own. Then simply divide your account value by $1,000 (for example, an $8,600 account value divided by $1,000 = 8.6), then multiply the result by the number under the heading “Expenses Paid During Period” to estimate the expenses you paid on your account during this period.
Hypothetical Example for Comparison Purposes
The table also provides information about hypothetical account values and hypothetical expenses based on the actual expense ratio of each class of your fund and an assumed rate of return of 5% per year before expenses, which is not the actual return of a fund’s share class. The hypothetical account values and expenses may not be used to estimate the actual ending account balance or expenses you paid for the period. You may use this information to compare the ongoing costs of investing in your fund and other funds. To do so, compare this 5% hypothetical example with the 5% hypothetical examples that appear in the shareholder reports of the other funds.
Please note that the expenses shown in the table are meant to highlight your ongoing costs only and do not reflect any transactional costs, such as sales charges (loads) or redemption/exchange fees. Therefore, the table is useful in comparing ongoing costs only, and will not help you determine the relative total costs of owning different funds. In addition, if these transactional costs were included, your costs would have been higher.
| Beginning Account Value 7/1/15 | Ending Account Value 12/31/15 | Expenses Paid During Period(1) 7/1/15 - 12/31/15 | Annualized Expense Ratio(1) | |
| Actual | ||||
| Class I (after waiver) | $1,000 | $978.40 | $4.44 | 0.89% |
| Class I (before waiver) | $1,000 | $978.40(2) | $5.04 | 1.01% |
| Class II (after waiver) | $1,000 | $977.10 | $5.18 | 1.04% |
| Class II (before waiver) | $1,000 | $977.10(2) | $5.78 | 1.16% |
| Hypothetical | ||||
| Class I (after waiver) | $1,000 | $1,020.72 | $4.53 | 0.89% |
| Class I (before waiver) | $1,000 | $1,020.11 | $5.14 | 1.01% |
| Class II (after waiver) | $1,000 | $1,019.96 | $5.30 | 1.04% |
| Class II (before waiver) | $1,000 | $1,019.36 | $5.90 | 1.16% |
| (1) | Expenses are equal to the class's annualized expense ratio listed in the table above, multiplied by the average account value over the period, multiplied by 184, the number of days in the most recent fiscal half-year, divided by 365, to reflect the one-half year period. |
| (2) | Ending account value assumes the return earned after waiver and would have been lower if a portion of the management fee had not been waived. |
7
| Schedule of Investments |
DECEMBER 31, 2015
| Shares | Value | ||||
| COMMON STOCKS — 96.2% | |||||
| Aerospace and Defense — 0.5% | |||||
| Textron, Inc. | 105,688 | $ | 4,439,953 | ||
| Automobiles — 1.3% | |||||
| Honda Motor Co., Ltd. ADR | 157,106 | 5,016,394 | |||
| Thor Industries, Inc. | 95,838 | 5,381,304 | |||
| 10,397,698 | |||||
| Banks — 7.9% | |||||
| Bank of Hawaii Corp. | 95,460 | 6,004,434 | |||
| BB&T Corp. | 178,669 | 6,755,475 | |||
| BOK Financial Corp. | 70,371 | 4,207,482 | |||
| Comerica, Inc. | 100,261 | 4,193,918 | |||
| Commerce Bancshares, Inc. | 207,107 | 8,810,332 | |||
| Cullen/Frost Bankers, Inc. | 65,127 | 3,907,620 | |||
| M&T Bank Corp. | 77,673 | 9,412,414 | |||
| PNC Financial Services Group, Inc. (The) | 80,175 | 7,641,479 | |||
| SunTrust Banks, Inc. | 109,581 | 4,694,450 | |||
| Westamerica Bancorporation | 195,980 | 9,162,065 | |||
| 64,789,669 | |||||
| Capital Markets — 5.5% | |||||
| Franklin Resources, Inc. | 149,056 | 5,488,242 | |||
| LPL Financial Holdings, Inc. | 94,072 | 4,012,171 | |||
| Northern Trust Corp. | 340,180 | 24,523,576 | |||
| State Street Corp. | 95,122 | 6,312,296 | |||
| T. Rowe Price Group, Inc. | 67,648 | 4,836,155 | |||
| 45,172,440 | |||||
| Chemicals — 0.4% | |||||
| Mosaic Co. (The) | 102,684 | 2,833,052 | |||
| Commercial Services and Supplies — 5.6% | |||||
| ADT Corp. (The) | 195,595 | 6,450,723 | |||
Clean Harbors, Inc.(1) | 160,673 | 6,692,030 | |||
| Republic Services, Inc. | 443,041 | 19,489,374 | |||
| Tyco International plc | 417,882 | 13,326,257 | |||
| 45,958,384 | |||||
| Communications Equipment — 0.4% | |||||
| Harris Corp. | 36,319 | 3,156,121 | |||
| Containers and Packaging — 2.0% | |||||
| Bemis Co., Inc. | 81,954 | 3,662,524 | |||
| Sonoco Products Co. | 175,606 | 7,177,017 | |||
| WestRock Co. | 116,817 | 5,329,192 | |||
| 16,168,733 | |||||
| Diversified Financial Services — 0.5% | |||||
Markit Ltd.(1) | 131,464 | 3,966,269 | |||
| Diversified Telecommunication Services — 1.1% | |||||
| CenturyLink, Inc. | 362,222 | 9,113,506 | |||
8
| Shares | Value | ||||
| Electric Utilities — 5.0% | |||||
| Edison International | 206,299 | $ | 12,214,964 | ||
| Great Plains Energy, Inc. | 242,404 | 6,620,053 | |||
| Westar Energy, Inc. | 277,569 | 11,771,701 | |||
| Xcel Energy, Inc. | 293,714 | 10,547,270 | |||
| 41,153,988 | |||||
| Electrical Equipment — 1.8% | |||||
| Emerson Electric Co. | 213,937 | 10,232,607 | |||
| Hubbell, Inc. | 7,358 | 743,452 | |||
| Rockwell Automation, Inc. | 38,893 | 3,990,811 | |||
| 14,966,870 | |||||
| Electronic Equipment, Instruments and Components — 2.0% | |||||
Keysight Technologies, Inc.(1) | 296,358 | 8,395,822 | |||
| TE Connectivity Ltd. | 126,795 | 8,192,225 | |||
| 16,588,047 | |||||
| Energy Equipment and Services — 3.3% | |||||
Cameron International Corp.(1) | 210,721 | 13,317,567 | |||
FMC Technologies, Inc.(1) | 233,697 | 6,779,550 | |||
| Helmerich & Payne, Inc. | 135,140 | 7,236,747 | |||
| 27,333,864 | |||||
| Food and Staples Retailing — 3.1% | |||||
| Sysco Corp. | 627,339 | 25,720,899 | |||
| Food Products — 5.0% | |||||
| ConAgra Foods, Inc. | 266,602 | 11,239,940 | |||
| General Mills, Inc. | 108,413 | 6,251,094 | |||
| J.M. Smucker Co. (The) | 66,442 | 8,194,956 | |||
| Kellogg Co. | 113,659 | 8,214,136 | |||
| Mondelez International, Inc., Class A | 155,283 | 6,962,890 | |||
| 40,863,016 | |||||
| Gas Utilities — 1.8% | |||||
| Atmos Energy Corp. | 105,503 | 6,650,909 | |||
| Laclede Group, Inc. (The) | 138,850 | 8,249,079 | |||
| 14,899,988 | |||||
| Health Care Equipment and Supplies — 5.1% | |||||
| Baxter International, Inc. | 321,552 | 12,267,209 | |||
| Becton Dickinson and Co. | 33,928 | 5,227,966 | |||
Boston Scientific Corp.(1) | 476,557 | 8,787,711 | |||
| Zimmer Biomet Holdings, Inc. | 152,982 | 15,694,423 | |||
| 41,977,309 | |||||
| Health Care Providers and Services — 2.9% | |||||
LifePoint Health, Inc.(1) | 171,119 | 12,560,135 | |||
| Quest Diagnostics, Inc. | 155,561 | 11,066,609 | |||
| 23,626,744 | |||||
| Hotels, Restaurants and Leisure — 0.5% | |||||
| Carnival Corp. | 70,792 | 3,856,748 | |||
| Household Durables — 1.1% | |||||
| PulteGroup, Inc. | 330,087 | 5,882,150 | |||
Toll Brothers, Inc.(1) | 95,993 | 3,196,567 | |||
| 9,078,717 | |||||
| Industrial Conglomerates — 1.0% | |||||
| Koninklijke Philips NV | 337,483 | 8,580,646 | |||
9
| Shares | Value | ||||
| Insurance — 6.8% | |||||
| ACE Ltd. | 103,290 | $ | 12,069,436 | ||
| Aflac, Inc. | 67,445 | 4,039,955 | |||
| Allstate Corp. (The) | 61,986 | 3,848,711 | |||
| Brown & Brown, Inc. | 178,046 | 5,715,277 | |||
| MetLife, Inc. | 88,195 | 4,251,881 | |||
| ProAssurance Corp. | 85,467 | 4,147,713 | |||
| Reinsurance Group of America, Inc. | 95,401 | 8,161,556 | |||
| Torchmark Corp. | 60,459 | 3,455,836 | |||
| Travelers Cos., Inc. (The) | 23,002 | 2,596,006 | |||
| Unum Group | 226,892 | 7,553,235 | |||
| 55,839,606 | |||||
| Leisure Products — 0.7% | |||||
| Mattel, Inc. | 218,853 | 5,946,236 | |||
| Machinery — 1.1% | |||||
| Oshkosh Corp. | 96,393 | 3,763,183 | |||
| Parker-Hannifin Corp. | 54,618 | 5,296,853 | |||
| 9,060,036 | |||||
| Metals and Mining — 1.0% | |||||
| Nucor Corp. | 192,767 | 7,768,510 | |||
| Multi-Utilities — 3.1% | |||||
| Ameren Corp. | 97,334 | 4,207,749 | |||
| Consolidated Edison, Inc. | 61,133 | 3,929,018 | |||
| NorthWestern Corp. | 80,863 | 4,386,817 | |||
| PG&E Corp. | 238,394 | 12,680,177 | |||
| 25,203,761 | |||||
| Multiline Retail — 0.4% | |||||
| Target Corp. | 42,262 | 3,068,644 | |||
| Oil, Gas and Consumable Fuels — 8.3% | |||||
| Anadarko Petroleum Corp. | 109,327 | 5,311,106 | |||
| Cimarex Energy Co. | 76,500 | 6,837,570 | |||
| Devon Energy Corp. | 219,553 | 7,025,696 | |||
| EQT Corp. | 223,186 | 11,634,686 | |||
| Imperial Oil Ltd. | 462,435 | 15,065,816 | |||
| Noble Energy, Inc. | 351,211 | 11,565,378 | |||
| Occidental Petroleum Corp. | 158,426 | 10,711,182 | |||
| 68,151,434 | |||||
| Real Estate Investment Trusts (REITs) — 4.9% | |||||
| Boston Properties, Inc. | 16,842 | 2,148,029 | |||
| Corrections Corp. of America | 322,439 | 8,541,409 | |||
| Empire State Realty Trust, Inc. | 183,485 | 3,315,574 | |||
| Host Hotels & Resorts, Inc. | 279,961 | 4,294,602 | |||
| Piedmont Office Realty Trust, Inc., Class A | 464,041 | 8,761,094 | |||
| Weyerhaeuser Co. | 450,677 | 13,511,296 | |||
| 40,572,004 | |||||
| Road and Rail — 1.4% | |||||
| CSX Corp. | 97,553 | 2,531,501 | |||
| Heartland Express, Inc. | 533,616 | 9,082,144 | |||
| 11,613,645 | |||||
10
| Shares | Value | ||||
| Semiconductors and Semiconductor Equipment — 5.4% | |||||
| Applied Materials, Inc. | 732,917 | $ | 13,683,560 | ||
| Lam Research Corp. | 72,850 | 5,785,747 | |||
| Maxim Integrated Products, Inc. | 219,834 | 8,353,692 | |||
| Microchip Technology, Inc. | 177,277 | 8,250,472 | |||
| Teradyne, Inc. | 383,117 | 7,919,028 | |||
| 43,992,499 | |||||
| Specialty Retail — 2.2% | |||||
| Advance Auto Parts, Inc. | 55,868 | 8,408,693 | |||
| CST Brands, Inc. | 198,877 | 7,784,046 | |||
| Lowe's Cos., Inc. | 27,274 | 2,073,915 | |||
| 18,266,654 | |||||
| Technology Hardware, Storage and Peripherals — 1.6% | |||||
| SanDisk Corp. | 126,265 | 9,594,877 | |||
| Western Digital Corp. | 62,915 | 3,778,046 | |||
| 13,372,923 | |||||
| Textiles, Apparel and Luxury Goods — 0.6% | |||||
| Ralph Lauren Corp. | 47,395 | 5,283,595 | |||
| Thrifts and Mortgage Finance — 0.9% | |||||
| Capitol Federal Financial, Inc. | 554,493 | 6,964,432 | |||
TOTAL COMMON STOCKS (Cost $745,581,895) | 789,746,640 | ||||
| EXCHANGE-TRADED FUNDS — 1.0% | |||||
iShares Russell Mid-Cap Value ETF (Cost $8,508,998) | 120,367 | 8,266,806 | |||
| TEMPORARY CASH INVESTMENTS — 3.1% | |||||
| Repurchase Agreement, Fixed Income Clearing Corp., (collateralized by various U.S. Treasury obligations, 2.125%, 05/15/25, valued at $25,388,550), at 0.08%, dated 12/31/15, due 1/4/16 (Delivery value $24,888,221) | 24,888,000 | ||||
| State Street Institutional Liquid Reserves Fund, Premier Class | 898,047 | 898,047 | |||
TOTAL TEMPORARY CASH INVESTMENTS (Cost $25,786,047) | 25,786,047 | ||||
TOTAL INVESTMENT SECURITIES — 100.3% (Cost $779,876,940) | 823,799,493 | ||||
| OTHER ASSETS AND LIABILITIES — (0.3)% | (2,381,620 | ) | |||
| TOTAL NET ASSETS — 100.0% | $ | 821,417,873 | |||
| FORWARD FOREIGN CURRENCY EXCHANGE CONTRACTS | ||||||||
| Currency Purchased | Currency Sold | Counterparty | Settlement Date | Unrealized Appreciation (Depreciation) | ||||
| USD | 12,237,795 | CAD | 17,063,158 | JPMorgan Chase Bank N.A. | 1/29/16 | $ | (94,373 | ) |
| USD | 583,709 | CAD | 809,724 | JPMorgan Chase Bank N.A. | 1/29/16 | (1,508 | ) | |
| USD | 7,322,918 | EUR | 6,679,422 | UBS AG | 1/29/16 | 59,741 | ||
| USD | 249,134 | EUR | 228,180 | UBS AG | 1/29/16 | 1,012 | ||
| USD | 3,021,918 | JPY | 365,132,270 | Credit Suisse AG | 1/29/16 | (17,470 | ) | |
| $ | (52,598 | ) | ||||||
11
| NOTES TO SCHEDULE OF INVESTMENTS | ||
| ADR | - | American Depositary Receipt |
| CAD | - | Canadian Dollar |
| EUR | - | Euro |
| JPY | - | Japanese Yen |
| USD | - | United States Dollar |
| (1) | Non-income producing. |
See Notes to Financial Statements.
12
| Statement of Assets and Liabilities |
| DECEMBER 31, 2015 | |||
| Assets | |||
| Investment securities, at value (cost of $779,876,940) | $ | 823,799,493 | |
| Receivable for investments sold | 1,086,784 | ||
| Receivable for capital shares sold | 398,748 | ||
| Unrealized appreciation on forward foreign currency exchange contracts | 60,753 | ||
| Dividends and interest receivable | 1,729,145 | ||
| 827,074,923 | |||
| Liabilities | |||
| Payable for investments purchased | 4,003,812 | ||
| Payable for capital shares redeemed | 857,127 | ||
| Unrealized depreciation on forward foreign currency exchange contracts | 113,351 | ||
| Accrued management fees | 565,797 | ||
| Distribution fees payable | 116,963 | ||
| 5,657,050 | |||
| Net Assets | $ | 821,417,873 | |
| Net Assets Consist of: | |||
| Capital (par value and paid-in surplus) | $ | 751,319,334 | |
| Undistributed net investment income | 3,960,071 | ||
| Undistributed net realized gain | 22,269,831 | ||
| Net unrealized appreciation | 43,868,637 | ||
| $ | 821,417,873 | ||
| Net Assets | Shares Outstanding | Net Asset Value Per Share | ||||
| Class I, $0.01 Par Value | $268,865,986 | 14,621,779 | $18.39 | |||
| Class II, $0.01 Par Value | $552,551,887 | 30,027,588 | $18.40 | |||
See Notes to Financial Statements.
13
| Statement of Operations |
| YEAR ENDED DECEMBER 31, 2015 | |||
| Investment Income (Loss) | |||
| Income: | |||
| Dividends (net of foreign taxes withheld of $53,932) | $ | 16,779,950 | |
| Interest | 6,657 | ||
| 16,786,607 | |||
| Expenses: | |||
| Management fees | 7,227,865 | ||
| Distribution fees - Class II | 1,325,844 | ||
| Directors' fees and expenses | 27,622 | ||
| Other expenses | 4,205 | ||
| 8,585,536 | |||
| Fees waived | (930,984 | ) | |
| 7,654,552 | |||
| Net investment income (loss) | 9,132,055 | ||
| Realized and Unrealized Gain (Loss) | |||
| Net realized gain (loss) on: | |||
| Investment transactions | 43,837,606 | ||
| Foreign currency transactions | 3,648,987 | ||
| 47,486,593 | |||
| Change in net unrealized appreciation (depreciation) on: | |||
| Investments | (69,425,674 | ) | |
| Translation of assets and liabilities in foreign currencies | (163,035 | ) | |
| (69,588,709 | ) | ||
| Net realized and unrealized gain (loss) | (22,102,116 | ) | |
| Net Increase (Decrease) in Net Assets Resulting from Operations | $ | (12,970,061 | ) |
See Notes to Financial Statements.
14
| Statement of Changes in Net Assets |
| YEARS ENDED DECEMBER 31, 2015 AND DECEMBER 31, 2014 | ||||||
| Increase (Decrease) in Net Assets | December 31, 2015 | December 31, 2014 | ||||
| Operations | ||||||
| Net investment income (loss) | $ | 9,132,055 | $ | 6,432,387 | ||
| Net realized gain (loss) | 47,486,593 | 41,926,646 | ||||
| Change in net unrealized appreciation (depreciation) | (69,588,709 | ) | 34,598,720 | |||
| Net increase (decrease) in net assets resulting from operations | (12,970,061 | ) | 82,957,753 | |||
| Distributions to Shareholders | ||||||
| From net investment income: | ||||||
| Class I | (4,088,037 | ) | (1,615,714 | ) | ||
| Class II | (8,024,490 | ) | (4,173,000 | ) | ||
| From net realized gains: | ||||||
| Class I | (10,379,596 | ) | (6,689,968 | ) | ||
| Class II | (23,528,578 | ) | (24,112,228 | ) | ||
| Decrease in net assets from distributions | (46,020,701 | ) | (36,590,910 | ) | ||
| Capital Share Transactions | ||||||
| Net increase (decrease) in net assets from capital share transactions (Note 5) | 173,816,195 | 216,583,746 | ||||
| Net increase (decrease) in net assets | 114,825,433 | 262,950,589 | ||||
| Net Assets | ||||||
| Beginning of period | 706,592,440 | 443,641,851 | ||||
| End of period | $ | 821,417,873 | $ | 706,592,440 | ||
| Undistributed net investment income | $ | 3,960,071 | $ | 3,605,135 | ||
See Notes to Financial Statements.
15
| Notes to Financial Statements |
DECEMBER 31, 2015
1. Organization
American Century Variable Portfolios, Inc. (the corporation) is registered under the Investment Company Act of 1940, as amended (the 1940 Act), as an open-end management investment company and is organized as a Maryland corporation. VP Mid Cap Value Fund (the fund) is one fund in a series issued by the corporation. The fund is diversified as defined under the 1940 Act. The fund’s investment objective is to seek long-term capital growth. Income is a secondary objective.
The fund offers Class I and Class II. The share classes differ principally in their respective distribution and shareholder servicing expenses and arrangements. Class II is charged a lower unified management fee because it has a separate arrangement for distribution services.
2. Significant Accounting Policies
The following is a summary of significant accounting policies consistently followed by the fund in preparation of its financial statements. The fund is an investment company and follows accounting and reporting guidance in accordance with accounting principles generally accepted in the United States of America. This may require management to make certain estimates and assumptions at the date of the financial statements. Actual results could differ from these estimates. Management evaluated the impact of events or transactions occurring through the date the financial statements were issued that would merit recognition or disclosure.
Investment Valuations — The fund determines the fair value of its investments and computes its net asset value per share at the close of regular trading (usually 4 p.m. Eastern time) on the New York Stock Exchange (NYSE) on each day the NYSE is open. The Board of Directors has adopted valuation policies and procedures to guide the investment advisor in the fund’s investment valuation process and to provide methodologies for the oversight of the fund’s pricing function.
Equity securities that are listed or traded on a domestic securities exchange are valued at the last reported sales price or at the official closing price as provided by the exchange. Equity securities traded on foreign securities exchanges are generally valued at the closing price of such securities on the exchange where primarily traded or at the close of the NYSE, if that is earlier. If no last sales price is reported, or if local convention or regulation so provides, the mean of the latest bid and asked prices may be used. Securities traded over-the-counter are valued at the mean of the latest bid and asked prices, the last sales price, or the official closing price. Equity securities initially expressed in local currencies are translated into U.S. dollars at the mean of the appropriate currency exchange rate at the close of the NYSE as provided by an independent pricing service.
Open-end management investment companies are valued at the reported net asset value per share. Repurchase agreements are valued at cost, which approximates fair value. Forward foreign currency exchange contracts are valued at the mean of the appropriate forward exchange rate at the close of the NYSE as provided by an independent pricing service.
If the fund determines that the market price for an investment is not readily available or the valuation methods mentioned above do not reflect an investment’s fair value, such investment is valued as determined in good faith by the Board of Directors or its delegate, in accordance with policies and procedures adopted by the Board of Directors. In its determination of fair value, the fund may review several factors including, but not limited to, market information regarding the specific investment or comparable investments and correlation with other investment types, futures indices or general market indicators. Circumstances that may cause the fund to use these procedures to value an investment include, but are not limited to: an investment has been declared in default or is distressed; trading in a security has been suspended during the trading day or a security is not actively trading on its principal exchange; prices received from a regular pricing source are deemed unreliable; or there is a foreign market holiday and no trading occurred.
The fund monitors for significant events occurring after the close of an investment’s primary exchange but before the fund’s net asset value per share is determined. Significant events may include, but are not limited to: corporate announcements and transactions; governmental action and political unrest that could impact a specific investment or an investment sector; or armed conflicts, natural disasters and similar events that could
16
affect investments in a specific country or region. The fund also monitors for significant fluctuations between domestic and foreign markets, as evidenced by the U.S. market or such other indicators that the Board of Directors, or its delegate, deems appropriate. If significant fluctuations in foreign markets are identified, the fund may apply a model-derived factor to the closing price of equity securities traded on foreign securities exchanges. The factor is based on observable market data as provided by an independent pricing service.
Security Transactions — Security transactions are accounted for as of the trade date. Net realized gains and losses are determined on the identified cost basis, which is also used for federal income tax purposes.
Investment Income — Dividend income less foreign taxes withheld, if any, is recorded as of the ex-dividend date. Distributions received on securities that represent a return of capital or long-term capital gain are recorded as a reduction of cost of investments and/or as a realized gain. The fund may estimate the components of distributions received that may be considered nontaxable distributions or long-term capital gain distributions for income tax purposes. Interest income is recorded on the accrual basis and includes accretion of discounts and amortization of premiums.
Foreign Currency Translations — All assets and liabilities initially expressed in foreign currencies are translated into U.S. dollars at prevailing exchange rates at period end. The fund may enter into spot foreign currency exchange contracts to facilitate transactions denominated in a foreign currency. Purchases and sales of investment securities, dividend and interest income, spot foreign currency exchange contracts, and expenses are translated at the rates of exchange prevailing on the respective dates of such transactions. Net realized and unrealized foreign currency exchange gains or losses related to investment securities are a component of net realized gain (loss) on investment transactions and change in net unrealized appreciation (depreciation) on investments, respectively.
Repurchase Agreements — The fund may enter into repurchase agreements with institutions that American Century Investment Management, Inc. (ACIM) (the investment advisor) has determined are creditworthy pursuant to criteria adopted by the Board of Directors. The fund requires that the collateral, represented by securities, received in a repurchase transaction be transferred to the custodian in a manner sufficient to enable the fund to obtain those securities in the event of a default under the repurchase agreement. ACIM monitors, on a daily basis, the securities transferred to ensure the value, including accrued interest, of the securities under each repurchase agreement is equal to or greater than amounts owed to the fund under each repurchase agreement.
Joint Trading Account — Pursuant to an Exemptive Order issued by the Securities and Exchange Commission, the fund, along with certain other funds in the American Century Investments family of funds, may transfer uninvested cash balances into a joint trading account. These balances are invested in one or more repurchase agreements that are collateralized by U.S. Treasury or Agency obligations.
Income Tax Status — It is the fund’s policy to distribute substantially all net investment income and net realized gains to shareholders and to otherwise qualify as a regulated investment company under provisions of the Internal Revenue Code. Accordingly, no provision has been made for income taxes. The fund files U.S. federal, state, local and non-U.S. tax returns as applicable. The fund's tax returns are subject to examination by the relevant taxing authority until expiration of the applicable statute of limitations, which is generally three years from the date of filing but can be longer in certain jurisdictions. At this time, management believes there are no uncertain tax positions which, based on their technical merit, would not be sustained upon examination and for which it is reasonably possible that the total amounts of unrecognized tax benefits will significantly change in the next twelve months.
Multiple Class — All shares of the fund represent an equal pro rata interest in the net assets of the class to which such shares belong, and have identical voting, dividend, liquidation and other rights and the same terms and conditions, except for class specific expenses and exclusive rights to vote on matters affecting only individual classes. Income, non-class specific expenses, and realized and unrealized capital gains and losses of the fund are allocated to each class of shares based on their relative net assets.
Distributions to Shareholders — Distributions from net investment income, if any, are generally declared and paid quarterly. Distributions from net realized gains, if any, are generally declared and paid annually.
Indemnifications — Under the corporation’s organizational documents, its officers and directors are indemnified against certain liabilities arising out of the performance of their duties to the fund. In addition, in the normal course of business, the fund enters into contracts that provide general indemnifications. The maximum exposure under these arrangements is unknown as this would involve future claims that may be made against a fund. The risk of material loss from such claims is considered by management to be remote.
17
3. Fees and Transactions with Related Parties
Certain officers and directors of the corporation are also officers and/or directors of American Century Companies, Inc. (ACC). The corporation’s investment advisor, ACIM, the corporation's distributor, American Century Investment Services, Inc. (ACIS), and the corporation’s transfer agent, American Century Services, LLC, are wholly owned, directly or indirectly, by ACC.
Management Fees — The corporation has entered into a management agreement with ACIM, under which ACIM provides the fund with investment advisory and management services in exchange for a single, unified management fee (the fee) per class. The agreement provides that all expenses of managing and operating the fund, except distribution fees, brokerage expenses, taxes, interest, fees and expenses of the independent directors (including legal counsel fees), and extraordinary expenses, will be paid by ACIM. The fee is computed and accrued daily based on each class's daily net assets and paid monthly in arrears. The annual management fee for each class is 1.00% and 0.90% for Class I and Class II, respectively. During the year ended December 31, 2015, the investment advisor voluntarily agreed to waive 0.12% of the fund's management fee. The investment advisor expects this waiver to continue until April 30, 2017 and cannot terminate it prior to such date without the approval of the Board of Directors. The total amount of the waiver for each class for the year ended December 31, 2015 was $294,579 and $636,405 for Class I and Class II, respectively. The effective annual management fee after waiver for each class for the year ended December 31, 2015 was 0.88% and 0.78% for Class I and Class II, respectively.
Distribution Fees — The Board of Directors has adopted the Master Distribution Plan (the plan) for Class II, pursuant to Rule 12b-1 of the 1940 Act. The plan provides that Class II will pay ACIS an annual distribution fee equal to 0.25%. The fee is computed and accrued daily based on the Class II daily net assets and paid monthly in arrears. The distribution fee provides compensation for expenses incurred in connection with distributing shares of Class II including, but not limited to, payments to brokers, dealers, and financial institutions that have entered into sales agreements with respect to shares of the fund. Fees incurred under the plan during the year ended December 31, 2015 are detailed in the Statement of Operations.
Directors' Fees and Expenses — The Board of Directors is responsible for overseeing the investment advisor’s management and operations of the fund. The directors receive detailed information about the fund and its investment advisor regularly throughout the year, and meet at least quarterly with management of the investment advisor to review reports about fund operations. The fund’s officers do not receive compensation from the fund.
4. Investment Transactions
Purchases and sales of investment securities, excluding short-term investments, for the year ended December 31, 2015 were $635,007,223 and $490,126,932, respectively.
5. Capital Share Transactions
Transactions in shares of the fund were as follows:
| Year ended December 31, 2015 | Year ended December 31, 2014 | |||||||
| Shares | Amount | Shares | Amount | |||||
| Class I/Shares Authorized | 100,000,000 | 100,000,000 | ||||||
| Sold | 6,281,314 | $ | 120,516,053 | 6,643,457 | $ | 124,736,920 | ||
| Issued in reinvestment of distributions | 742,672 | 14,154,729 | 464,688 | 8,293,215 | ||||
| Redeemed | (3,013,253) | (57,415,113) | (1,635,883) | (30,314,028) | ||||
| 4,010,733 | 77,255,669 | 5,472,262 | 102,716,107 | |||||
| Class II/Shares Authorized | 150,000,000 | 150,000,000 | ||||||
| Sold | 8,331,317 | 159,539,307 | 8,199,671 | 153,858,864 | ||||
| Issued in reinvestment of distributions | 1,652,793 | 31,553,068 | 1,589,781 | 28,285,228 | ||||
| Redeemed | (4,946,818) | (94,531,849) | (3,669,671) | (68,276,453) | ||||
| 5,037,292 | 96,560,526 | 6,119,781 | 113,867,639 | |||||
| Net increase (decrease) | 9,048,025 | $ | 173,816,195 | 11,592,043 | $ | 216,583,746 | ||
18
6. Fair Value Measurements
The fund’s investments valuation process is based on several considerations and may use multiple inputs to determine the fair value of the investments held by the fund. In conformity with accounting principles generally accepted in the United States of America, the inputs used to determine a valuation are classified into three broad levels.
| • | Level 1 valuation inputs consist of unadjusted quoted prices in an active market for identical investments. |
| • | Level 2 valuation inputs consist of direct or indirect observable market data (including quoted prices for comparable investments, evaluations of subsequent market events, interest rates, prepayment speeds, credit risk, etc.). These inputs also consist of quoted prices for identical investments initially expressed in local currencies that are adjusted through translation into U.S. dollars. |
| • | Level 3 valuation inputs consist of unobservable data (including a fund’s own assumptions). |
The level classification is based on the lowest level input that is significant to the fair valuation measurement. The valuation inputs are not necessarily an indication of the risks associated with investing in these securities or other financial instruments. There were no significant transfers between levels during the period.
The following is a summary of the level classifications as of period end. The Schedule of Investments provides additional information on the fund’s portfolio holdings.
| Level 1 | Level 2 | Level 3 | ||||||
| Assets | ||||||||
| Investment Securities | ||||||||
| Common Stocks | $ | 766,100,178 | $ | 23,646,462 | — | |||
| Exchange-Traded Funds | 8,266,806 | — | — | |||||
| Temporary Cash Investments | 898,047 | 24,888,000 | — | |||||
| $ | 775,265,031 | $ | 48,534,462 | — | ||||
| Other Financial Instruments | ||||||||
| Forward Foreign Currency Exchange Contracts | — | $ | 60,753 | — | ||||
| Liabilities | ||||||||
| Other Financial Instruments | ||||||||
| Forward Foreign Currency Exchange Contracts | — | $ | 113,351 | — | ||||
7. Derivative Instruments
Foreign Currency Risk — The fund is subject to foreign currency exchange rate risk in the normal course of pursuing its investment objectives. The value of foreign investments held by a fund may be significantly affected by changes in foreign currency exchange rates. The dollar value of a foreign security generally decreases when the value of the dollar rises against the foreign currency in which the security is denominated and tends to increase when the value of the dollar declines against such foreign currency. A fund may enter into forward foreign currency exchange contracts to reduce a fund's exposure to foreign currency exchange rate fluctuations. The net U.S. dollar value of foreign currency underlying all contractual commitments held by a fund and the resulting unrealized appreciation or depreciation are determined daily. Realized gain or loss is recorded upon the termination of the contract. Net realized and unrealized gains or losses occurring during the holding period of forward foreign currency exchange contracts are a component of net realized gain (loss) on foreign currency transactions and change in net unrealized appreciation (depreciation) on translation of assets and liabilities in foreign currencies, respectively. A fund bears the risk of an unfavorable change in the foreign currency exchange rate underlying the forward contract. Additionally, losses, up to the fair value, may arise if the counterparties do not perform under the contract terms. The fund's average U.S. dollar exposure to foreign currency risk derivative instruments held during the period was $27,528,218.
The value of foreign currency risk derivative instruments as of December 31, 2015, is disclosed on the Statement of Assets and Liabilities as an asset of $60,753 in unrealized appreciation on forward foreign currency exchange contracts and a liability of $113,351 in unrealized depreciation on forward foreign currency exchange contracts. For the year ended December 31, 2015, the effect of foreign currency risk derivative
19
instruments on the Statement of Operations was $3,635,777 in net realized gain (loss) on foreign currency transactions and $(162,960) in change in net unrealized appreciation (depreciation) on translation of assets and liabilities in foreign currencies.
8. Federal Tax Information
The tax character of distributions paid during the years ended December 31, 2015 and December 31, 2014 were as follows:
| 2015 | 2014 | |||||
| Distributions Paid From | ||||||
| Ordinary income | $ | 21,230,561 | $ | 15,971,907 | ||
| Long-term capital gains | $ | 24,790,140 | $ | 20,619,003 | ||
The book-basis character of distributions made during the year from net investment income or net realized gains may differ from their ultimate characterization for federal income tax purposes. These differences reflect the differing character of certain income items and net realized gains and losses for financial statement and tax purposes, and may result in reclassification among certain capital accounts on the financial statements.
As of December 31, 2015, the federal tax cost of investments and the components of distributable earnings on a tax-basis were as follows:
| Federal tax cost of investments | $ | 790,373,858 | |
| Gross tax appreciation of investments | $ | 82,633,504 | |
| Gross tax depreciation of investments | (49,207,869 | ) | |
| Net tax appreciation (depreciation) of investments | 33,425,635 | ||
Net tax appreciation (depreciation) on derivatives and translation of assets and liabilities in foreign currencies | (1,318 | ) | |
Net tax appreciation (depreciation) | $ | 33,424,317 | |
| Undistributed ordinary income | $ | 11,275,339 | |
| Accumulated long-term gains | $ | 36,301,259 | |
| Accumulated short-term capital losses | $ | (10,902,376 | ) |
The difference between book-basis and tax-basis unrealized appreciation (depreciation) is attributable primarily to the tax deferral of losses on wash sales.
Accumulated capital losses represent net capital loss carryovers that may be used to offset future realized capital gains for federal income tax purposes. As a result of a shift in ownership of the fund, the utilization of current capital loss carryovers are limited. Any remaining accumulated gains after application of this limitation will be distributed to shareholders. Future capital loss carryover utilization in any given year may be subject to Internal Revenue Code limitations. Capital loss carryovers expire in 2017.
20
| Financial Highlights |
| For a Share Outstanding Throughout the Years Ended December 31 (except as noted) | |||||||||||||||||
| Per-Share Data | Ratios and Supplemental Data | ||||||||||||||||
| Income From Investment Operations: | Distributions From: | Ratio to Average Net Assets of: | |||||||||||||||
Net Asset Value, Beginning of Period | Net Investment Income (Loss)(1) | Net Realized and Unrealized Gain (Loss) | Total From Investment Operations | Net Investment Income | Net Realized Gains | Total Distributions | Net Asset Value, End of Period | Total Return(2) | Operating Expenses | Operating Expenses (before expense waiver) | Net Investment Income (Loss) | Net Investment Income (Loss) (before expense waiver) | Portfolio Turnover Rate | Net Assets, End of Period (in thousands) | |||
| Class I | |||||||||||||||||
| 2015 | $19.84 | 0.24 | (0.49) | (0.25) | (0.32) | (0.88) | (1.20) | $18.39 | (1.43)% | 0.88% | 1.00% | 1.29% | 1.17% | 65% | $268,866 | ||
| 2014 | $18.47 | 0.25 | 2.60 | 2.85 | (0.22) | (1.26) | (1.48) | $19.84 | 16.42% | 0.94% | 1.00% | 1.31% | 1.25% | 60% | $210,494 | ||
| 2013 | $14.59 | 0.23 | 4.09 | 4.32 | (0.20) | (0.24) | (0.44) | $18.47 | 30.11% | 1.01% | 1.01% | 1.39% | 1.39% | 63% | $94,906 | ||
| 2012 | $13.50 | 0.29 | 1.86 | 2.15 | (0.28) | (0.78) | (1.06) | $14.59 | 16.33% | 1.01% | 1.01% | 2.06% | 2.06% | 78% | $60,637 | ||
| 2011 | $14.14 | 0.21 | (0.30) | (0.09) | (0.18) | (0.37) | (0.55) | $13.50 | (0.69)% | 1.01% | 1.01% | 1.52% | 1.52% | 98% | $52,242 | ||
| Class II | |||||||||||||||||
| 2015 | $19.85 | 0.21 | (0.49) | (0.28) | (0.29) | (0.88) | (1.17) | $18.40 | (1.58)% | 1.03% | 1.15% | 1.14% | 1.02% | 65% | $552,552 | ||
| 2014 | $18.48 | 0.21 | 2.62 | 2.83 | (0.20) | (1.26) | (1.46) | $19.85 | 16.24% | 1.09% | 1.15% | 1.16% | 1.10% | 60% | $496,099 | ||
| 2013 | $14.59 | 0.21 | 4.10 | 4.31 | (0.18) | (0.24) | (0.42) | $18.48 | 29.90% | 1.16% | 1.16% | 1.24% | 1.24% | 63% | $348,736 | ||
| 2012 | $13.50 | 0.27 | 1.86 | 2.13 | (0.26) | (0.78) | (1.04) | $14.59 | 16.23% | 1.16% | 1.16% | 1.91% | 1.91% | 78% | $205,208 | ||
| 2011 | $14.14 | 0.19 | (0.30) | (0.11) | (0.16) | (0.37) | (0.53) | $13.50 | (0.84)% | 1.16% | 1.16% | 1.37% | 1.37% | 98% | $154,453 | ||
| Notes to Financial Highlights |
| (1) | Computed using average shares outstanding throughout the period. |
| (2) | Total returns are calculated based on the net asset value of the last business day. Total returns for periods less than one year are not annualized. |
See Notes to Financial Statements.
21
| Report of Independent Registered Public Accounting Firm |
To the Board of Directors and Shareholders of American Century Variable Portfolios, Inc.:
We have audited the accompanying statement of assets and liabilities, including the schedule of investments, of VP Mid Cap Value Fund (the “Fund”), one of the funds constituting American Century Variable Portfolios, Inc., as of December 31, 2015, and the related statement of operations for the year then ended, the statements of changes in net assets for each of the two years in the period then ended, and the financial highlights for each of the periods presented. These financial statements and financial highlights are the responsibility of the Fund’s management. Our responsibility is to express an opinion on these financial statements and financial highlights based on our audits.
We conducted our audits in accordance with the standards of the Public Company Accounting Oversight Board (United States). Those standards require that we plan and perform the audit to obtain reasonable assurance about whether the financial statements and financial highlights are free of material misstatement. The Fund is not required to have, nor were we engaged to perform, an audit of its internal control over financial reporting. Our audits included consideration of internal control over financial reporting as a basis for designing audit procedures that are appropriate in the circumstances, but not for the purpose of expressing an opinion on the effectiveness of the Fund’s internal control over financial reporting. Accordingly, we express no such opinion. An audit also includes examining, on a test basis, evidence supporting the amounts and disclosures in the financial statements, assessing the accounting principles used and significant estimates made by management, as well as evaluating the overall financial statement presentation. Our procedures included confirmation of securities owned as of December 31, 2015, by correspondence with the custodian and brokers; when replies were not received from brokers, we performed other auditing procedures. We believe that our audits provide a reasonable basis for our opinion.
In our opinion, the financial statements and financial highlights referred to above present fairly, in all material respects, the financial position of VP Mid Cap Value Fund of American Century Variable Portfolios, Inc. as of December 31, 2015, the results of its operations for the year then ended, the changes in its net assets for each of the two years in the period then ended, and the financial highlights for each of the periods presented, in conformity with accounting principles generally accepted in the United States of America.
DELOITTE & TOUCHE LLP
Kansas City, Missouri
February 11, 2016
22
| Management |
The Board of Directors
The individuals listed below serve as directors of the funds. Each director will continue to serve in this capacity until death, retirement, resignation or removal from office. The board has adopted a mandatory retirement age for directors who are not “interested persons,” as that term is defined in the Investment Company Act (independent directors). Independent directors shall retire by December 31 of the year in which they reach their 75th birthday.
Mr. Thomas is an “interested person” because he currently serves as President and Chief Executive Officer of American Century Companies, Inc. (ACC), the parent company of American Century Investment Management, Inc. (ACIM or the advisor). Mr. Fink is treated as an “interested person” because of his recent employment with ACC and American Century Services, LLC (ACS). The other directors (more than three-fourths of the total number) are independent. They are not employees, directors or officers of, and have no financial interest in, ACC or any of its wholly owned, direct or indirect, subsidiaries, including ACIM, American Century Investment Services, Inc. (ACIS) and ACS, and they do not have any other affiliations, positions or relationships that would cause them to be considered “interested persons” under the Investment Company Act. The directors serve in this capacity for seven (in the case of Mr. Thomas, 15) registered investment companies in the American Century Investments family of funds.
The following table presents additional information about the directors. The mailing address for each director is 4500 Main Street, Kansas City, Missouri 64111.
| Name (Year of Birth) | Position(s) Held with Funds | Length of Time Served | Principal Occupation(s) During Past 5 Years | Number of American Century Portfolios Overseen by Director | Other Directorships Held During Past 5 Years |
Independent Directors | |||||
| Andrea C. Hall (1945) | Director | Since 1997 | Retired | 80 | None |
| Jan M. Lewis (1957) | Director | Since 2011 | Retired; President and Chief Executive Officer, Catholic Charities of Northeast Kansas (human services organization) (2006 to 2013) | 80 | None |
| James A. Olson (1942) | Director and Chairman of the Board | Since 2007 (Chairman since 2014) | Member, Plaza Belmont LLC (private equity fund manager) | 80 | Saia, Inc. (2002 to 2012) and EPR Properties (2003 to 2013) |
| M. Jeannine Strandjord (1945) | Director | Since 1994 | Retired | 80 | Euronet Worldwide Inc.; MGP Ingredients, Inc.; Charming Shoppes, Inc. (2006 to 2010); and DST Systems Inc. (1996 to 2012) |
| John R. Whitten (1946) | Director | Since 2008 | Retired | 80 | Rudolph Technologies, Inc. |
23
Name (Year of Birth) | Position(s) Held with Funds | Length of Time Served | Principal Occupation(s) During Past 5 Years | Number of American Century Portfolios Overseen by Director | Other Directorships Held During Past 5 Years |
| Independent Directors | |||||
| Stephen E. Yates (1948) | Director | Since 2012 | Retired; Executive Vice President, Technology & Operations, KeyCorp. (computer services) (2004 to 2010) | 80 | Applied Industrial Technologies, Inc. (2001 to 2010) |
| Interested Directors | |||||
| Barry Fink (1955) | Director | Since 2012 | Retired; Executive Vice President, ACC (September 2007 to February 2013); President, ACS (October 2007 to February 2013); Chief Operating Officer, ACC (September 2007 to November 2012) | 80 | None |
| Jonathan S. Thomas (1963) | Director and President | Since 2007 | President and Chief Executive Officer, ACC (March 2007 to present). Also serves as Chief Executive Officer, ACS; Executive Vice President, ACIM; Director, ACC, ACIM and other ACC subsidiaries | 125 | BioMed Valley Discoveries, Inc. |
The Statement of Additional Information has additional information about the fund's directors and is available without charge, upon request, by calling 1-800-378-9878.
24
Officers
The following table presents certain information about the executive officers of the funds. Each officer serves as an officer for each of the 15 investment companies in the American Century family of funds, unless otherwise noted. No officer is compensated for his or her service as an officer of the funds. The listed officers are interested persons of the funds and are appointed or re-appointed on an annual basis. The mailing address for each officer listed below is 4500 Main Street, Kansas City, Missouri 64111.
Name (Year of Birth) | Offices with the Funds | Principal Occupation(s) During the Past Five Years |
| Jonathan S. Thomas (1963) | Director and President since 2007 | President and Chief Executive Officer, ACC (March 2007 to present). Also serves as Chief Executive Officer, ACS; Executive Vice President, ACIM; Director, ACC, ACIM and other ACC subsidiaries |
| Amy D. Shelton (1964) | Chief Compliance Officer and Vice President since 2014 | Chief Compliance Officer, American Century funds, (March 2014 to present); Chief Compliance Officer, ACIM (February 2014 to present); Chief Compliance Officer, ACIS (October 2009 to present); Vice President, Client Interactions and Marketing, ACIS (February 2013 to January 2014); Director, Client Interactions and Marketing, ACIS (June 2007 to January 2013). Also serves as Vice President, ACIS |
| Charles A. Etherington (1957) | General Counsel since 2007 and Senior Vice President since 2006 | Attorney, ACC (February 1994 to present); Vice President, ACC (November 2005 to present); General Counsel, ACC (March 2007 to present). Also serves as General Counsel, ACIM, ACS, ACIS and other ACC subsidiaries; and Senior Vice President, ACIM and ACS |
| C. Jean Wade (1964) | Vice President, Treasurer and Chief Financial Officer since 2012 | Vice President, ACS (February 2000 to present) |
| Robert J. Leach (1966) | Vice President since 2006 and Assistant Treasurer since 2012 | Vice President, ACS (February 2000 to present) |
| David H. Reinmiller (1963) | Vice President since 2000 | Attorney, ACC (January 1994 to present); Associate General Counsel, ACC (January 2001 to present). Also serves as Vice President, ACIM and ACS |
| Ward D. Stauffer (1960) | Secretary since 2005 | Attorney, ACC (June 2003 to present) |
25
| Additional Information |
Proxy Voting Policies
A description of the policies that the fund's investment advisor uses in exercising the voting rights associated with the securities purchased and/or held by the fund is available without charge, upon request, by calling 1-800-378-9878. It is also available on the "About Us" page of American Century Investments’ website at americancentury.com and on the Securities and Exchange Commission’s website at sec.gov. Information regarding how the investment advisor voted proxies relating to portfolio securities during the most recent 12-month period ended June 30 is available on the "About Us" page at americancentury.com. It is also available at sec.gov.
Quarterly Portfolio Disclosure
The fund files its complete schedule of portfolio holdings with the Securities and Exchange Commission (SEC) for the first and third quarters of each fiscal year on Form N-Q. The fund’s Forms N-Q are available on the SEC’s website at sec.gov, and may be reviewed and copied at the SEC’s Public Reference Room in Washington, DC. Information on the operation of the Public Reference Room may be obtained by calling 1-800-SEC-0330. The fund also makes its complete
schedule of portfolio holdings for the most recent quarter of its fiscal year available on its website at ipro.americancentury.com (for Investment Professionals) and, upon request, by calling 1-800-378-9878.
Other Tax Information
The following information is provided pursuant to provisions of the Internal Revenue Code.
For corporate taxpayers, the fund hereby designates $10,511,122, or up to the maximum amount allowable, of ordinary income distributions paid during the fiscal year ended December 31, 2015 as qualified for the corporate dividends received deduction.
The fund hereby designates $9,118,034 as qualified short-term capital gain distributions for purposes of Internal Revenue Code Section 871 for the fiscal year ended December 31, 2015.
The fund hereby designates $24,790,140, or up to the maximum amount allowable, as long-term capital gain distributions for the fiscal year ended December 31, 2015.
26
| Notes |
27
| Notes |
28
| ||
| Contact Us | americancentury.com | |
| Automated Information Line | 1-800-345-8765 | |
| Investment Professional Service Representatives | 1-800-345-6488 | |
| Telecommunications Relay Service for the Deaf | 711 | |
| American Century Variable Portfolios, Inc. | ||
Investment Advisor: American Century Investment Management, Inc. Kansas City, Missouri | ||
| This report and the statements it contains are submitted for the general information of our shareholders. The report is not authorized for distribution to prospective investors unless preceded or accompanied by an effective prospectus. | ||
| ©2016 American Century Proprietary Holdings, Inc. All rights reserved. CL-ANN-88149 1602 | ||
| ANNUAL REPORT | DECEMBER 31, 2015 |
VP Ultra® Fund
31
32
| Table of Contents |
| Performance | 2 | |
| Portfolio Commentary | ||
| Fund Characteristics | ||
| Shareholder Fee Example | ||
| Schedule of Investments | ||
| Statement of Assets and Liabilities | ||
| Statement of Operations | ||
| Statement of Changes in Net Assets | ||
| Notes to Financial Statements | ||
| Financial Highlights | ||
| Report of Independent Registered Public Accounting Firm | ||
| Management | ||
| Additional Information | ||
Any opinions expressed in this report reflect those of the author as of the date of the report, and do not necessarily represent the opinions of American Century Investments® or any other person in the American Century Investments organization. Any such opinions are subject to change at any time based upon market or other conditions and American Century Investments disclaims any responsibility to update such opinions. These opinions may not be relied upon as investment advice and, because investment decisions made by American Century Investments funds are based on numerous factors, may not be relied upon as an indication of trading intent on behalf of any American Century Investments fund. Security examples are used for representational purposes only and are not intended as recommendations to purchase or sell securities. Performance information for comparative indices and securities is provided to American Century Investments by third party vendors. To the best of American Century Investments’ knowledge, such information is accurate at the time of printing.
| Performance |
| Total Returns as of December 31, 2015 | ||||||
| Average Annual Returns | ||||||
Ticker Symbol | 1 year | 5 years | 10 years | Since Inception | Inception Date | |
| Class I | AVPUX | 6.27%(1) | 13.02%(1) | 7.03%(1) | 5.02%(1) | 5/1/01 |
Russell 1000 Growth Index | — | 5.67% | 13.53% | 8.53% | 5.25% | — |
| S&P 500 Index | — | 1.38% | 12.56% | 7.30% | 5.48% | — |
| Class II | AVPSX | 6.05%(1) | 12.84%(1) | 6.86%(1) | 5.91%(1) | 5/1/02 |
| (1) | Returns would have been lower if a portion of the management fee had not been waived. |
The performance information presented does not include charges and deductions imposed by the insurance company separate account under the variable annuity or variable life insurance contracts. The inclusion of such charges could significantly lower performance. Please refer to the insurance company separate account prospectus for a discussion of the charges related to insurance contracts.
Data presented reflect past performance. Past performance is no guarantee of future results. Current performance may be higher or lower than the performance shown. Investment return and principal value will fluctuate, and redemption value may be more or less than original cost. Data assumes reinvestment of dividends and capital gains, and none of the charts reflect the deduction of taxes that a shareholder would pay on fund distributions or the redemption of fund shares. To obtain performance data current to the most recent month end, please call 1-800-345-6488 or visit ipro.americancentury.com (for Investment Professionals). For additional information about the fund, please consult the prospectus.
2
| Growth of $10,000 Over 10 Years |
| $10,000 investment made December 31, 2005 |
| Performance for other share classes will vary due to differences in fee structure. |
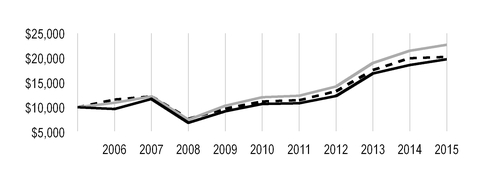
| Value on December 31, 2015 | |
| Class I — $19,728* | |
| Russell 1000 Growth Index — $22,681 | |
S&P 500 Index — $20,242 | |
*Ending value would have been lower if a portion of the management fee had not been waived.
| Total Annual Fund Operating Expenses | |
| Class I | Class II |
| 1.00% | 1.15% |
The total annual fund operating expenses shown is as stated in the fund’s prospectus current as of the date of this report. The prospectus may vary from the expense ratio shown elsewhere in this report because it is based on a different time period, includes acquired fund fees and expenses, and, if applicable, does not include fee waivers or expense reimbursements.
Data presented reflect past performance. Past performance is no guarantee of future results. Current performance may be higher or lower than the performance shown. Investment return and principal value will fluctuate, and redemption value may be more or less than original cost. Data assumes reinvestment of dividends and capital gains, and none of the charts reflect the deduction of taxes that a shareholder would pay on fund distributions or the redemption of fund shares. To obtain performance data current to the most recent month end, please call 1-800-345-6488 or visit ipro.americancentury.com (for Investment Professionals). For additional information about the fund, please consult the prospectus.
3
| Portfolio Commentary |
Portfolio Managers: Keith Lee, Michael Li, and Jeffrey Bourke
Performance Summary
VP Ultra returned 6.05%* for the 12 months ended December 31, 2015, outperforming the 5.67% return of the portfolio’s benchmark, the Russell 1000 Growth Index.
U.S. stock indices were mixed during the reporting period as large caps posted modest gains while mid- and small caps declined. The Russell 1000 Growth Index was led by the consumer staples and consumer discretionary sectors, which posted double-digit returns. Information technology stocks also performed well. The energy sector declined sharply while utilities also suffered a significant loss. Materials and industrials declined as global economic weakness hampered stocks closely tied to growth.
VP Ultra outpaced its Russell 1000 Growth benchmark due to stock selection, especially in the consumer discretionary, industrials, and health care sectors. Stock decisions in the financials and information technology sectors detracted, although an overweight position in information technology was positive.
Consumer Discretionary Led Contributors
Stock selection in the consumer discretionary sector was the largest source of outperformance relative to the Russell 1000 Growth Index. Amazon.com helped performance. The internet retailer reported strong revenue growth, aided by its Prime membership program. Margins are improving through efficiency gains, and profitability from its cloud hosting services has been higher than expected. Starbucks was a major contributor in the sector as the coffee retailer is benefiting from its Starbucks Rewards program. The rollout of its mobile ordering application has exceeded expectations as well.
Stock selection in the industrials sector was positive. Acuity Brands was a top contributor. The company reported strong earnings due to trends in LED lighting as non-commercial construction rebounds. Underweighting road and rail companies also helped as the industry suffered from concerns about declining rail volumes due to weakness in the energy sector. Not owning index component Union Pacific was a significant contributor to relative performance.
In health care, stock decisions aided performance, especially among health care providers and services companies. UnitedHealth Group benefited from its announcement of a large acquisition of a competitor, which enables the company to gain market share.
Other key contributors included Constellation Brands, a producer and marketer of beer, wine, and spirits, which continued to see very strong sales volume and pricing in its Corona and Modelo brands. Alphabet (formerly Google) was a top contributor, reporting revenue and earnings above expectations driven by its mobile business and growth in its YouTube video site. The company is also demonstrating better capital allocation under its new CFO and announced a $5 billion share repurchase program.
| * | All fund returns referenced in this commentary are for Class II shares. Returns would have been lower if a portion of the management fee had not been waived. Performance for other share classes will vary due to differences in fee structure; when Class II performance exceeds that of the fund’s benchmark, other share classes may not. See page 2 for returns for all share classes. |
4
Financials and Information Technology Detracted
In financials, not owning real estate investment trusts (REITs) hampered results as the industry performed better than expected due to the Federal Reserve’s caution in raising interest rates. REITs are likely to falter as rates rise. Asset manager Franklin Resources detracted as assets under management and fund flows deteriorated.
Stock selection in the information technology sector, especially among software and communications equipment companies, hampered relative performance. Overweight positions in QUALCOMM and VMware were key detractors in the sector. VMware was eliminated. Not owning index component Microsoft was a major detractor. The company reported strong earnings driven by Azure, its cloud services, and the rollout of its new operating system.
Other leading detractors included baby formula maker Mead Johnson Nutrition, which was hurt by a difficult environment in Hong Kong due to concerns about slowing economic growth in China. We believe this is a transitory issue and continue to have a positive view of the underlying growth rate for the company. Media firm Time Warner detracted as subscriber numbers were weaker than expected and the company has had to increase spending on content. Chipotle Mexican Grill hampered performance as the fast-casual restaurant chain suffered from a series of food-safety issues that the company expects to hurt same-store sales.
Outlook
We remain confident in our belief that stocks that exhibit high-quality, accelerating fundamentals, positive relative strength, and attractive valuations will outperform in the long term. Our portfolio positioning reflects where we are seeing opportunities as a result of the application of that philosophy and process. As of December 31, 2015, the portfolio’s largest overweight positions relative to the Russell 1000 Growth Index were in information technology and health care. Telecommunication services and consumer staples represented the largest underweights.
5
| Fund Characteristics |
| DECEMBER 31, 2015 | |
| Top Ten Holdings | % of net assets |
| Apple, Inc. | 8.0% |
| Alphabet, Inc.* | 6.0% |
| Amazon.com, Inc. | 4.7% |
| Starbucks Corp. | 3.6% |
| Facebook, Inc., Class A | 3.3% |
| Celgene Corp. | 3.1% |
| Gilead Sciences, Inc. | 3.0% |
| Visa, Inc., Class A | 3.0% |
| UnitedHealth Group, Inc. | 2.8% |
| MasterCard, Inc., Class A | 2.8% |
| *Includes all classes of the issuer held by the fund. | |
| Top Five Industries | % of net assets |
| Internet Software and Services | 11.8% |
| Biotechnology | 9.2% |
| Technology Hardware, Storage and Peripherals | 8.0% |
| IT Services | 5.9% |
| Media | 4.8% |
| Types of Investments in Portfolio | % of net assets |
| Common Stocks | 99.4% |
| Exchange-Traded Funds | 0.4% |
| Total Equity Exposure | 99.8% |
| Temporary Cash Investments | 0.7% |
| Other Assets and Liabilities | (0.5)% |
6
| Shareholder Fee Example |
Fund shareholders may incur two types of costs: (1) transaction costs, including sales charges (loads) on purchase payments and redemption/exchange fees; and (2) ongoing costs, including management fees; distribution and service (12b-1) fees; and other fund expenses. This example is intended to help you understand your ongoing costs (in dollars) of investing in your fund and to compare these costs with the ongoing cost of investing in other mutual funds.
The example is based on an investment of $1,000 made at the beginning of the period and held for the entire period from July 1, 2015 to December 31, 2015.
Actual Expenses
The table provides information about actual account values and actual expenses for each class. You may use the information, together with the amount you invested, to estimate the expenses that you paid over the period. First, identify the share class you own. Then simply divide your account value by $1,000 (for example, an $8,600 account value divided by $1,000 = 8.6), then multiply the result by the number under the heading “Expenses Paid During Period” to estimate the expenses you paid on your account during this period.
Hypothetical Example for Comparison Purposes
The table also provides information about hypothetical account values and hypothetical expenses based on the actual expense ratio of each class of your fund and an assumed rate of return of 5% per year before expenses, which is not the actual return of a fund’s share class. The hypothetical account values and expenses may not be used to estimate the actual ending account balance or expenses you paid for the period. You may use this information to compare the ongoing costs of investing in your fund and other funds. To do so, compare this 5% hypothetical example with the 5% hypothetical examples that appear in the shareholder reports of the other funds.
Please note that the expenses shown in the table are meant to highlight your ongoing costs only and do not reflect any transactional costs, such as sales charges (loads) or redemption/exchange fees. Therefore, the table is useful in comparing ongoing costs only, and will not help you determine the relative total costs of owning different funds. In addition, if these transactional costs were included, your costs would have been higher.
| Beginning Account Value 7/1/15 | Ending Account Value 12/31/15 | Expenses Paid During Period(1) 7/1/15 - 12/31/15 | Annualized Expense Ratio(1) | |
| Actual | ||||
| Class I (after waiver) | $1,000 | $1,005.20 | $4.30 | 0.85% |
| Class I (before waiver) | $1,000 | $1,005.20(2) | $5.10 | 1.01% |
| Class II (after waiver) | $1,000 | $1,004.00 | $5.05 | 1.00% |
| Class II (before waiver) | $1,000 | $1,004.00(2) | $5.86 | 1.16% |
| Hypothetical | ||||
| Class I (after waiver) | $1,000 | $1,020.92 | $4.33 | 0.85% |
| Class I (before waiver) | $1,000 | $1,020.11 | $5.14 | 1.01% |
| Class II (after waiver) | $1,000 | $1,020.16 | $5.09 | 1.00% |
| Class II (before waiver) | $1,000 | $1,019.36 | $5.90 | 1.16% |
| (1) | Expenses are equal to the class's annualized expense ratio listed in the table above, multiplied by the average account value over the period, multiplied by 184, the number of days in the most recent fiscal half-year, divided by 365, to reflect the one-half year period. |
| (2) | Ending account value assumes the return earned after waiver and would have been lower if a portion of the management fee had not been waived. |
7
| Schedule of Investments |
DECEMBER 31, 2015
| Shares | Value | ||||
| COMMON STOCKS — 99.4% | |||||
| Aerospace and Defense — 3.8% | |||||
| Boeing Co. (The) | 29,380 | $ | 4,248,054 | ||
| Rockwell Collins, Inc. | 17,110 | 1,579,253 | |||
| United Technologies Corp. | 15,140 | 1,454,500 | |||
| 7,281,807 | |||||
| Automobiles — 1.2% | |||||
Tesla Motors, Inc.(1) | 9,540 | 2,289,695 | |||
| Banks — 1.7% | |||||
| JPMorgan Chase & Co. | 35,790 | 2,363,214 | |||
| U.S. Bancorp | 21,140 | 902,044 | |||
| 3,265,258 | |||||
| Beverages — 2.6% | |||||
Boston Beer Co., Inc. (The), Class A(1) | 6,610 | 1,334,625 | |||
| Constellation Brands, Inc., Class A | 25,850 | 3,682,074 | |||
| 5,016,699 | |||||
| Biotechnology — 9.2% | |||||
Agios Pharmaceuticals, Inc.(1) | 1,780 | 115,558 | |||
Alexion Pharmaceuticals, Inc.(1) | 4,380 | 835,485 | |||
Celgene Corp.(1) | 49,460 | 5,923,329 | |||
| Gilead Sciences, Inc. | 57,520 | 5,820,449 | |||
Ionis Pharmaceuticals, Inc.(1) | 10,620 | 657,696 | |||
Kite Pharma, Inc.(1) | 5,590 | 344,456 | |||
Regeneron Pharmaceuticals, Inc.(1) | 6,590 | 3,577,513 | |||
Spark Therapeutics, Inc.(1) | 8,260 | 374,261 | |||
| 17,648,747 | |||||
| Capital Markets — 1.2% | |||||
| Franklin Resources, Inc. | 19,290 | 710,258 | |||
| T. Rowe Price Group, Inc. | 21,470 | 1,534,890 | |||
| 2,245,148 | |||||
| Chemicals — 2.3% | |||||
| Ecolab, Inc. | 5,940 | 679,417 | |||
| Monsanto Co. | 22,630 | 2,229,508 | |||
| Valspar Corp. (The) | 18,510 | 1,535,404 | |||
| 4,444,329 | |||||
| Commercial Services and Supplies — 0.3% | |||||
Stericycle, Inc.(1) | 5,020 | 605,412 | |||
| Communications Equipment — 0.4% | |||||
| QUALCOMM, Inc. | 15,550 | 777,267 | |||
| Consumer Finance — 0.7% | |||||
| American Express Co. | 18,360 | 1,276,938 | |||
| Electrical Equipment — 1.7% | |||||
| Acuity Brands, Inc. | 12,910 | 3,018,358 | |||
| Eaton Corp. plc | 4,040 | 210,242 | |||
| 3,228,600 | |||||
| Energy Equipment and Services — 0.5% | |||||
| Core Laboratories NV | 8,670 | 942,776 | |||
8
| Shares | Value | ||||
| Food and Staples Retailing — 2.7% | |||||
| Costco Wholesale Corp. | 32,350 | $ | 5,224,525 | ||
| Food Products — 1.3% | |||||
| Mead Johnson Nutrition Co. | 24,020 | 1,896,379 | |||
| Nestle SA | 9,380 | 695,280 | |||
| 2,591,659 | |||||
| Health Care Equipment and Supplies — 2.6% | |||||
Intuitive Surgical, Inc.(1) | 6,810 | 3,719,350 | |||
| St. Jude Medical, Inc. | 21,650 | 1,337,320 | |||
| 5,056,670 | |||||
| Health Care Providers and Services — 4.4% | |||||
| Cigna Corp. | 10,980 | 1,606,703 | |||
Express Scripts Holding Co.(1) | 16,530 | 1,444,887 | |||
| UnitedHealth Group, Inc. | 45,670 | 5,372,619 | |||
| 8,424,209 | |||||
| Health Care Technology — 1.0% | |||||
Cerner Corp.(1) | 31,130 | 1,873,092 | |||
| Hotels, Restaurants and Leisure — 4.1% | |||||
Chipotle Mexican Grill, Inc.(1) | 2,010 | 964,499 | |||
| Starbucks Corp. | 115,600 | 6,939,468 | |||
| 7,903,967 | |||||
| Insurance — 1.2% | |||||
| MetLife, Inc. | 46,600 | 2,246,586 | |||
| Internet and Catalog Retail — 4.7% | |||||
Amazon.com, Inc.(1) | 13,360 | 9,029,890 | |||
| Internet Software and Services — 11.8% | |||||
Alphabet, Inc., Class A(1) | 7,460 | 5,803,954 | |||
Alphabet, Inc., Class C(1) | 7,460 | 5,661,245 | |||
Baidu, Inc. ADR(1) | 7,290 | 1,378,102 | |||
Facebook, Inc., Class A(1) | 60,430 | 6,324,604 | |||
LinkedIn Corp., Class A(1) | 8,990 | 2,023,469 | |||
| Tencent Holdings Ltd. | 73,600 | 1,435,792 | |||
| 22,627,166 | |||||
| IT Services — 5.9% | |||||
| MasterCard, Inc., Class A | 54,890 | 5,344,090 | |||
Square, Inc.(1) | 11,283 | 147,694 | |||
| Visa, Inc., Class A | 74,550 | 5,781,353 | |||
| 11,273,137 | |||||
| Machinery — 3.1% | |||||
| Cummins, Inc. | 18,300 | 1,610,583 | |||
| Donaldson Co., Inc. | 13,420 | 384,617 | |||
| Flowserve Corp. | 24,810 | 1,044,005 | |||
WABCO Holdings, Inc.(1) | 12,750 | 1,303,815 | |||
| Wabtec Corp. | 22,980 | 1,634,338 | |||
| 5,977,358 | |||||
| Media — 4.8% | |||||
| Scripps Networks Interactive, Inc., Class A | 12,360 | 682,396 | |||
| Time Warner, Inc. | 55,520 | 3,590,478 | |||
| Walt Disney Co. (The) | 46,980 | 4,936,658 | |||
| 9,209,532 | |||||
9
| Shares | Value | ||||
| Oil, Gas and Consumable Fuels — 0.8% | |||||
Concho Resources, Inc.(1) | 6,350 | $ | 589,661 | ||
| EOG Resources, Inc. | 12,580 | 890,538 | |||
| 1,480,199 | |||||
| Personal Products — 1.7% | |||||
| Estee Lauder Cos., Inc. (The), Class A | 38,020 | 3,348,041 | |||
| Pharmaceuticals — 1.1% | |||||
| Pfizer, Inc. | 64,860 | 2,093,681 | |||
| Professional Services — 1.0% | |||||
| Nielsen Holdings plc | 41,940 | 1,954,404 | |||
| Road and Rail — 0.6% | |||||
| J.B. Hunt Transport Services, Inc. | 15,760 | 1,156,154 | |||
| Semiconductors and Semiconductor Equipment — 1.2% | |||||
| ARM Holdings plc | 61,940 | 935,333 | |||
| Linear Technology Corp. | 30,980 | 1,315,721 | |||
| 2,251,054 | |||||
| Software — 3.2% | |||||
NetSuite, Inc.(1) | 12,640 | 1,069,597 | |||
| Oracle Corp. | 38,480 | 1,405,674 | |||
salesforce.com, inc.(1) | 23,600 | 1,850,240 | |||
Splunk, Inc.(1) | 13,450 | 790,995 | |||
Tableau Software, Inc., Class A(1) | 10,510 | 990,252 | |||
| 6,106,758 | |||||
| Specialty Retail — 3.3% | |||||
O'Reilly Automotive, Inc.(1) | 9,860 | 2,498,721 | |||
| TJX Cos., Inc. (The) | 54,940 | 3,895,796 | |||
| 6,394,517 | |||||
| Technology Hardware, Storage and Peripherals — 8.0% | |||||
| Apple, Inc. | 146,030 | 15,371,118 | |||
| Textiles, Apparel and Luxury Goods — 3.7% | |||||
| Burberry Group plc | 39,920 | 702,149 | |||
| NIKE, Inc., Class B | 72,600 | 4,537,500 | |||
Under Armour, Inc., Class A(1) | 22,930 | 1,848,387 | |||
| 7,088,036 | |||||
| Tobacco — 1.6% | |||||
| Philip Morris International, Inc. | 36,290 | 3,190,254 | |||
TOTAL COMMON STOCKS (Cost $93,875,738) | 190,894,683 | ||||
| EXCHANGE-TRADED FUNDS — 0.4% | |||||
iShares Russell 1000 Growth ETF (Cost $730,111) | 7,250 | 721,230 | |||
| TEMPORARY CASH INVESTMENTS — 0.7% | |||||
| Repurchase Agreement, Fixed Income Clearing Corp., (collateralized by various U.S. Treasury obligations, 3.00%, 5/15/45, valued at $1,356,469), at 0.08%, dated 12/31/15, due 1/4/16 (Delivery value $1,329,012) | 1,329,000 | ||||
| State Street Institutional Liquid Reserves Fund, Premier Class | 48,888 | 48,888 | |||
TOTAL TEMPORARY CASH INVESTMENTS (Cost $1,377,888) | 1,377,888 | ||||
TOTAL INVESTMENT SECURITIES — 100.5% (Cost $95,983,737) | 192,993,801 | ||||
| OTHER ASSETS AND LIABILITIES — (0.5)% | (1,011,601 | ) | |||
| TOTAL NET ASSETS — 100.0% | $ | 191,982,200 | |||
10
| FORWARD FOREIGN CURRENCY EXCHANGE CONTRACTS | ||||||||
| Currency Purchased | Currency Sold | Counterparty | Settlement Date | Unrealized Appreciation (Depreciation) | ||||
| CHF | 16,743 | USD | 16,890 | Credit Suisse AG | 1/29/16 | $ | (157 | ) |
| USD | 592,206 | CHF | 586,414 | Credit Suisse AG | 1/29/16 | 6,132 | ||
| USD | 15,362 | CHF | 15,149 | Credit Suisse AG | 1/29/16 | 222 | ||
| USD | 14,506 | CHF | 14,351 | Credit Suisse AG | 1/29/16 | 164 | ||
| USD | 1,423,603 | GBP | 955,073 | Credit Suisse AG | 1/29/16 | 15,538 | ||
| $ | 21,899 | |||||||
| NOTES TO SCHEDULE OF INVESTMENTS | ||
| ADR | - | American Depositary Receipt |
| CHF | - | Swiss Franc |
| GBP | - | British Pound |
| USD | - | United States Dollar |
| (1) | Non-income producing. |
See Notes to Financial Statements.
11
| Statement of Assets and Liabilities |
| DECEMBER 31, 2015 | |||
| Assets | |||
| Investment securities, at value (cost of $95,983,737) | $ | 192,993,801 | |
| Receivable for investments sold | 252,870 | ||
| Receivable for capital shares sold | 11,574 | ||
| Unrealized appreciation on forward foreign currency exchange contracts | 22,056 | ||
| Dividends and interest receivable | 131,202 | ||
| 193,411,503 | |||
| Liabilities | |||
| Payable for investments purchased | 145,670 | ||
| Payable for capital shares redeemed | 1,122,806 | ||
| Unrealized depreciation on forward foreign currency exchange contracts | 157 | ||
| Accrued management fees | 128,129 | ||
| Distribution fees payable | 32,541 | ||
| 1,429,303 | |||
| Net Assets | $ | 191,982,200 | |
| Net Assets Consist of: | |||
| Capital (par value and paid-in surplus) | $ | 88,450,523 | |
| Undistributed net investment income | 413,589 | ||
| Undistributed net realized gain | 6,087,904 | ||
| Net unrealized appreciation | 97,030,184 | ||
| $ | 191,982,200 | ||
| Net Assets | Shares Outstanding | Net Asset Value Per Share | ||||
| Class I, $0.01 Par Value | $41,489,640 | 2,682,381 | $15.47 | |||
| Class II, $0.01 Par Value | $150,492,560 | 9,877,292 | $15.24 | |||
See Notes to Financial Statements.
12
| Statement of Operations |
| YEAR ENDED DECEMBER 31, 2015 | |||
| Investment Income (Loss) | |||
| Income: | |||
| Dividends (net of foreign taxes withheld of $9,991) | $ | 2,278,430 | |
| Interest | 508 | ||
| 2,278,938 | |||
| Expenses: | |||
| Management fees | 1,792,217 | ||
| Distribution fees - Class II | 381,585 | ||
| Directors' fees and expenses | 6,987 | ||
| Other expenses | 2,610 | ||
| 2,183,399 | |||
| Fees waived | (303,111 | ) | |
| 1,880,288 | |||
| Net investment income (loss) | 398,650 | ||
| Realized and Unrealized Gain (Loss) | |||
| Net realized gain (loss) on: | |||
| Investment transactions | 7,768,857 | ||
| Foreign currency transactions | 30,359 | ||
| 7,799,216 | |||
| Change in net unrealized appreciation (depreciation) on: | |||
| Investments | 2,870,089 | ||
| Translation of assets and liabilities in foreign currencies | 7,827 | ||
| 2,877,916 | |||
| Net realized and unrealized gain (loss) | 10,677,132 | ||
| Net Increase (Decrease) in Net Assets Resulting from Operations | $ | 11,075,782 | |
See Notes to Financial Statements.
13
| Statement of Changes in Net Assets |
| YEARS ENDED DECEMBER 31, 2015 AND DECEMBER 31, 2014 | ||||||
| Increase (Decrease) in Net Assets | December 31, 2015 | December 31, 2014 | ||||
| Operations | ||||||
| Net investment income (loss) | $ | 398,650 | $ | 488,615 | ||
| Net realized gain (loss) | 7,799,216 | 56,559,486 | ||||
| Change in net unrealized appreciation (depreciation) | 2,877,916 | (41,831,930 | ) | |||
| Net increase (decrease) in net assets resulting from operations | 11,075,782 | 15,216,171 | ||||
| Distributions to Shareholders | ||||||
| From net investment income: | ||||||
| Class I | (176,231 | ) | (144,152 | ) | ||
| Class II | (456,362 | ) | (489,713 | ) | ||
| Class III | (4,977 | ) | (4,183 | ) | ||
| From net realized gains: | ||||||
| Class I | (3,795,185 | ) | — | |||
| Class II | (15,069,468 | ) | — | |||
| Class III | (107,179 | ) | — | |||
| Decrease in net assets from distributions | (19,609,402 | ) | (638,048 | ) | ||
| Capital Share Transactions | ||||||
| Net increase (decrease) in net assets from capital share transactions (Note 5) | 10,288,861 | (82,710,082 | ) | |||
| Redemption Fees | ||||||
| Increase in net assets from redemption fees | — | 70 | ||||
| Net increase (decrease) in net assets | 1,755,241 | (68,131,889 | ) | |||
| Net Assets | ||||||
| Beginning of period | 190,226,959 | 258,358,848 | ||||
| End of period | $ | 191,982,200 | $ | 190,226,959 | ||
| Undistributed net investment income | $ | 413,589 | $ | 673,746 | ||
See Notes to Financial Statements.
14
| Notes to Financial Statements |
DECEMBER 31, 2015
1. Organization
American Century Variable Portfolios, Inc. (the corporation) is registered under the Investment Company Act of 1940, as amended (the 1940 Act), as an open-end management investment company and is organized as a Maryland corporation. VP Ultra Fund (the fund) is one fund in a series issued by the corporation. The fund is diversified as defined under the 1940 Act. The fund’s investment objective is to seek long-term capital growth.
The fund offers Class I and Class II. The share classes differ principally in their respective distribution and shareholder servicing expenses and arrangements. Class II is charged a lower unified management fee because it has a separate arrangement for distribution services. On August 7, 2015, there were no outstanding Class III shares and the fund discontinued offering Class III.
2. Significant Accounting Policies
The following is a summary of significant accounting policies consistently followed by the fund in preparation of its financial statements. The fund is an investment company and follows accounting and reporting guidance in accordance with accounting principles generally accepted in the United States of America. This may require management to make certain estimates and assumptions at the date of the financial statements. Actual results could differ from these estimates. Management evaluated the impact of events or transactions occurring through the date the financial statements were issued that would merit recognition or disclosure.
Investment Valuations — The fund determines the fair value of its investments and computes its net asset value per share at the close of regular trading (usually 4 p.m. Eastern time) on the New York Stock Exchange (NYSE) on each day the NYSE is open. The Board of Directors has adopted valuation policies and procedures to guide the investment advisor in the fund’s investment valuation process and to provide methodologies for the oversight of the fund’s pricing function.
Equity securities that are listed or traded on a domestic securities exchange are valued at the last reported sales price or at the official closing price as provided by the exchange. Equity securities traded on foreign securities exchanges are generally valued at the closing price of such securities on the exchange where primarily traded or at the close of the NYSE, if that is earlier. If no last sales price is reported, or if local convention or regulation so provides, the mean of the latest bid and asked prices may be used. Securities traded over-the-counter are valued at the mean of the latest bid and asked prices, the last sales price, or the official closing price. Equity securities initially expressed in local currencies are translated into U.S. dollars at the mean of the appropriate currency exchange rate at the close of the NYSE as provided by an independent pricing service.
Open-end management investment companies are valued at the reported net asset value per share. Repurchase agreements are valued at cost, which approximates fair value. Forward foreign currency exchange contracts are valued at the mean of the appropriate forward exchange rate at the close of the NYSE as provided by an independent pricing service.
If the fund determines that the market price for an investment is not readily available or the valuation methods mentioned above do not reflect an investment’s fair value, such investment is valued as determined in good faith by the Board of Directors or its delegate, in accordance with policies and procedures adopted by the Board of Directors. In its determination of fair value, the fund may review several factors including, but not limited to, market information regarding the specific investment or comparable investments and correlation with other investment types, futures indices or general market indicators. Circumstances that may cause the fund to use these procedures to value an investment include, but are not limited to: an investment has been declared in default or is distressed; trading in a security has been suspended during the trading day or a security is not actively trading on its principal exchange; prices received from a regular pricing source are deemed unreliable; or there is a foreign market holiday and no trading occurred.
The fund monitors for significant events occurring after the close of an investment’s primary exchange but before the fund’s net asset value per share is determined. Significant events may include, but are not limited to: corporate announcements and transactions; governmental action and political unrest that could impact a specific investment or an investment sector; or armed conflicts, natural disasters and similar events that could
15
affect investments in a specific country or region. The fund also monitors for significant fluctuations between domestic and foreign markets, as evidenced by the U.S. market or such other indicators that the Board of Directors, or its delegate, deems appropriate. If significant fluctuations in foreign markets are identified, the fund may apply a model-derived factor to the closing price of equity securities traded on foreign securities exchanges. The factor is based on observable market data as provided by an independent pricing service.
Security Transactions — Security transactions are accounted for as of the trade date. Net realized gains and losses are determined on the identified cost basis, which is also used for federal income tax purposes.
Investment Income — Dividend income less foreign taxes withheld, if any, is recorded as of the ex-dividend date. Distributions received on securities that represent a return of capital or long-term capital gain are recorded as a reduction of cost of investments and/or as a realized gain. The fund may estimate the components of distributions received that may be considered nontaxable distributions or long-term capital gain distributions for income tax purposes. Interest income is recorded on the accrual basis and includes accretion of discounts and amortization of premiums.
Foreign Currency Translations — All assets and liabilities initially expressed in foreign currencies are translated into U.S. dollars at prevailing exchange rates at period end. The fund may enter into spot foreign currency exchange contracts to facilitate transactions denominated in a foreign currency. Purchases and sales of investment securities, dividend and interest income, spot foreign currency exchange contracts, and expenses are translated at the rates of exchange prevailing on the respective dates of such transactions. Net realized and unrealized foreign currency exchange gains or losses related to investment securities are a component of net realized gain (loss) on investment transactions and change in net unrealized appreciation (depreciation) on investments, respectively.
Repurchase Agreements — The fund may enter into repurchase agreements with institutions that American Century Investment Management, Inc. (ACIM) (the investment advisor) has determined are creditworthy pursuant to criteria adopted by the Board of Directors. The fund requires that the collateral, represented by securities, received in a repurchase transaction be transferred to the custodian in a manner sufficient to enable the fund to obtain those securities in the event of a default under the repurchase agreement. ACIM monitors, on a daily basis, the securities transferred to ensure the value, including accrued interest, of the securities under each repurchase agreement is equal to or greater than amounts owed to the fund under each repurchase agreement.
Joint Trading Account — Pursuant to an Exemptive Order issued by the Securities and Exchange Commission, the fund, along with certain other funds in the American Century Investments family of funds, may transfer uninvested cash balances into a joint trading account. These balances are invested in one or more repurchase agreements that are collateralized by U.S. Treasury or Agency obligations.
Income Tax Status — It is the fund’s policy to distribute substantially all net investment income and net realized gains to shareholders and to otherwise qualify as a regulated investment company under provisions of the Internal Revenue Code. Accordingly, no provision has been made for income taxes. The fund files U.S. federal, state, local and non-U.S. tax returns as applicable. The fund's tax returns are subject to examination by the relevant taxing authority until expiration of the applicable statute of limitations, which is generally three years from the date of filing but can be longer in certain jurisdictions. At this time, management believes there are no uncertain tax positions which, based on their technical merit, would not be sustained upon examination and for which it is reasonably possible that the total amounts of unrecognized tax benefits will significantly change in the next twelve months.
Multiple Class — All shares of the fund represent an equal pro rata interest in the net assets of the class to which such shares belong, and have identical voting, dividend, liquidation and other rights and the same terms and conditions, except for class specific expenses and exclusive rights to vote on matters affecting only individual classes. Income, non-class specific expenses, and realized and unrealized capital gains and losses of the fund are allocated to each class of shares based on their relative net assets.
Distributions to Shareholders — Distributions from net investment income and net realized gains, if any, are generally declared and paid annually.
Redemption Fees — The fund may impose a 1.00% redemption fee on shares held less than 60 days. The fee may not be applicable to all classes. The redemption fee is retained by the fund and helps cover transaction costs that long-term investors may bear when the fund sells securities to meet investor redemptions.
16
Indemnifications — Under the corporation’s organizational documents, its officers and directors are indemnified against certain liabilities arising out of the performance of their duties to the fund. In addition, in the normal course of business, the fund enters into contracts that provide general indemnifications. The maximum exposure under these arrangements is unknown as this would involve future claims that may be made against a fund. The risk of material loss from such claims is considered by management to be remote.
3. Fees and Transactions with Related Parties
Certain officers and directors of the corporation are also officers and/or directors of American Century Companies, Inc. (ACC). The corporation’s investment advisor, ACIM, the corporation's distributor, American Century Investment Services, Inc. (ACIS), and the corporation’s transfer agent, American Century Services, LLC, are wholly owned, directly or indirectly, by ACC.
Management Fees — The corporation has entered into a management agreement with ACIM, under which ACIM provides the fund with investment advisory and management services in exchange for a single, unified management fee (the fee) per class. The agreement provides that all expenses of managing and operating the fund, except distribution fees, brokerage expenses, taxes, interest, fees and expenses of the independent directors (including legal counsel fees), and extraordinary expenses, will be paid by ACIM. The fee is computed and accrued daily based on each class’s daily net assets and paid monthly in arrears. The rate of the fee is determined by applying a fee rate calculation formula. This formula takes into account the fund’s assets as well as certain assets, if any, of other clients of the investment advisor outside the American Century Investments family of funds (such as subadvised funds and separate accounts) that have very similar investment teams and investment strategies (strategy assets). The annual management fee schedule ranges from 0.900% to 1.000% for Class I and Class III and from 0.800% to 0.900% for Class II. From January 1, 2015 through July 31, 2015, the investment advisor voluntarily agreed to waive 0.16% of the fund's management fee. Effective August 1, 2015, the investment advisor voluntarily agreed to waive 0.15% of the fund's management fee. The investment advisor expects this waiver to continue until April 30, 2017 and cannot terminate it prior to such date without the approval of the Board of Directors. The total amount of the waiver for each class for the year ended December 31, 2015 was $64,096, $237,919 and $1,096 for Class I, Class II and Class III, respectively. The effective annual management fee before waiver for each class for the year ended December 31, 2015 was 1.00% and 0.90% for Class I and Class II, respectively. The effective annual management fee after waiver for each class for the year ended December 31, 2015 was 0.84% and 0.74% for Class I and Class II, respectively.
Distribution Fees — The Board of Directors has adopted the Master Distribution Plan (the plan) for Class II, pursuant to Rule 12b-1 of the 1940 Act. The plan provides that Class II will pay ACIS an annual distribution fee equal to 0.25%. The fee is computed and accrued daily based on the Class II daily net assets and paid monthly in arrears. The distribution fee provides compensation for expenses incurred in connection with distributing shares of Class II including, but not limited to, payments to brokers, dealers, and financial institutions that have entered into sales agreements with respect to shares of the fund. Fees incurred under the plan during the year ended December 31, 2015 are detailed in the Statement of Operations.
Directors' Fees and Expenses — The Board of Directors is responsible for overseeing the investment advisor’s management and operations of the fund. The directors receive detailed information about the fund and its investment advisor regularly throughout the year, and meet at least quarterly with management of the investment advisor to review reports about fund operations. The fund’s officers do not receive compensation from the fund.
4. Investment Transactions
Purchases and sales of investment securities, excluding short-term investments, for the year ended December 31, 2015 were $66,574,354 and $75,843,249, respectively.
17
5. Capital Share Transactions
Transactions in shares of the fund were as follows:
| Year ended December 31, 2015 | Year ended December 31, 2014 | |||||||||
| Shares | Amount | Shares | Amount | |||||||
| Class I/Shares Authorized | 100,000,000 | 100,000,000 | ||||||||
| Sold | 1,069,413 | $ | 16,939,681 | 426,606 | $ | 6,512,886 | ||||
| Issued in reinvestment of distributions | 258,724 | 3,971,416 | 9,826 | 144,152 | ||||||
| Redeemed | (1,048,855 | ) | (16,218,729 | ) | (710,325 | ) | (10,716,298 | ) | ||
| 279,282 | 4,692,368 | (273,893 | ) | (4,059,260 | ) | |||||
| Class II/Shares Authorized | 150,000,000 | 150,000,000 | ||||||||
| Sold | 2,151,734 | 33,465,730 | 2,580,110 | 39,668,969 | ||||||
| Issued in reinvestment of distributions | 1,025,484 | 15,525,830 | 33,797 | 489,713 | ||||||
| Redeemed | (2,750,761 | ) | (42,273,059 | ) | (8,212,152 | ) | (119,350,987 | ) | ||
| 426,457 | 6,718,501 | (5,598,245 | ) | (79,192,305 | ) | |||||
| Class III/Shares Authorized | 50,000,000 | 50,000,000 | ||||||||
| Sold | 3,176 | 53,334 | 49,098 | 732,260 | ||||||
| Issued in reinvestment of distributions | 7,316 | 112,156 | 286 | 4,183 | ||||||
| Redeemed | (81,420 | ) | (1,287,498 | ) | (12,889 | ) | (194,960 | ) | ||
| (70,928 | ) | (1,122,008 | ) | 36,495 | 541,483 | |||||
| Net increase (decrease) | 634,811 | $ | 10,288,861 | (5,835,643 | ) | $ | (82,710,082 | ) | ||
6. Fair Value Measurements
The fund’s investments valuation process is based on several considerations and may use multiple inputs to determine the fair value of the investments held by the fund. In conformity with accounting principles generally accepted in the United States of America, the inputs used to determine a valuation are classified into three broad levels.
| • | Level 1 valuation inputs consist of unadjusted quoted prices in an active market for identical investments. |
| • | Level 2 valuation inputs consist of direct or indirect observable market data (including quoted prices for comparable investments, evaluations of subsequent market events, interest rates, prepayment speeds, credit risk, etc.). These inputs also consist of quoted prices for identical investments initially expressed in local currencies that are adjusted through translation into U.S. dollars. |
| • | Level 3 valuation inputs consist of unobservable data (including a fund’s own assumptions). |
The level classification is based on the lowest level input that is significant to the fair valuation measurement. The valuation inputs are not necessarily an indication of the risks associated with investing in these securities or other financial instruments. There were no significant transfers between levels during the period.
18
The following is a summary of the level classifications as of period end. The Schedule of Investments provides additional information on the fund’s portfolio holdings.
| Level 1 | Level 2 | Level 3 | ||||||
| Assets | ||||||||
| Investment Securities | ||||||||
| Common Stocks | $ | 187,126,129 | $ | 3,768,554 | — | |||
| Exchange-Traded Funds | 721,230 | — | — | |||||
| Temporary Cash Investments | 48,888 | 1,329,000 | — | |||||
| $ | 187,896,247 | $ | 5,097,554 | — | ||||
| Other Financial Instruments | ||||||||
| Forward Foreign Currency Exchange Contracts | — | $ | 22,056 | — | ||||
| Liabilities | ||||||||
| Other Financial Instruments | ||||||||
| Forward Foreign Currency Exchange Contracts | — | $ | 157 | — | ||||
7. Derivative Instruments
Foreign Currency Risk — The fund is subject to foreign currency exchange rate risk in the normal course of pursuing its investment objectives. The value of foreign investments held by a fund may be significantly affected by changes in foreign currency exchange rates. The dollar value of a foreign security generally decreases when the value of the dollar rises against the foreign currency in which the security is denominated and tends to increase when the value of the dollar declines against such foreign currency. A fund may enter into forward foreign currency exchange contracts to reduce a fund's exposure to foreign currency exchange rate fluctuations. The net U.S. dollar value of foreign currency underlying all contractual commitments held by a fund and the resulting unrealized appreciation or depreciation are determined daily. Realized gain or loss is recorded upon the termination of the contract. Net realized and unrealized gains or losses occurring during the holding period of forward foreign currency exchange contracts are a component of net realized gain (loss) on foreign currency transactions and change in net unrealized appreciation (depreciation) on translation of assets and liabilities in foreign currencies, respectively. A fund bears the risk of an unfavorable change in the foreign currency exchange rate underlying the forward contract. Additionally, losses, up to the fair value, may arise if the counterparties do not perform under the contract terms. The fund's average U.S. dollar exposure to foreign currency risk derivative instruments held during the period was $2,412,202.
The value of foreign currency risk derivative instruments as of December 31, 2015, is disclosed on the Statement of Assets and Liabilities as an asset of $22,056 in unrealized appreciation on forward foreign currency exchange contracts and a liability of $157 in unrealized depreciation on forward foreign currency exchange contracts. For the year ended December 31, 2015, the effect of foreign currency risk derivative instruments on the Statement of Operations was $30,158 in net realized gain (loss) on foreign currency transactions and $7,270 in change in net unrealized appreciation (depreciation) on translation of assets and liabilities in foreign currencies.
8. Federal Tax Information
The tax character of distributions paid during the years ended December 31, 2015 and December 31, 2014 were as follows:
| 2015 | 2014 | |||||
| Distributions Paid From | ||||||
| Ordinary income | $ | 637,570 | $ | 638,048 | ||
| Long-term capital gains | $ | 18,971,832 | — | |||
The book-basis character of distributions made during the year from net investment income or net realized gains may differ from their ultimate characterization for federal income tax purposes. These differences reflect the differing character of certain income items and net realized gains and losses for financial statement and tax purposes, and may result in reclassification among certain capital accounts on the financial statements.
19
As of December 31, 2015, the federal tax cost of investments and the components of distributable earnings on a tax-basis were as follows:
| Federal tax cost of investments | $ | 97,552,626 | |
| Gross tax appreciation of investments | $ | 96,492,706 | |
| Gross tax depreciation of investments | (1,051,531 | ) | |
| Net tax appreciation (depreciation) of investments | 95,441,175 | ||
Net tax appreciation (depreciation) on derivatives and translation of assets and liabilities in foreign currencies | (1,779 | ) | |
| Net tax appreciation (depreciation) | $ | 95,439,396 | |
| Undistributed ordinary income | $ | 435,488 | |
| Accumulated long-term gains | $ | 7,656,793 | |
The difference between book-basis and tax-basis unrealized appreciation (depreciation) is attributable primarily to the tax deferral of losses on wash sales.
20
| Financial Highlights |
| For a Share Outstanding Throughout the Years Ended December 31 (except as noted) | |||||||||||||||||
| Per-Share Data | Ratios and Supplemental Data | ||||||||||||||||
| Income From Investment Operations: | Distributions From: | Ratio to Average Net Assets of: | |||||||||||||||
| Net Asset Value, Beginning of Period | Net Investment Income (Loss)(1) | Net Realized and Unrealized Gain (Loss) | Total From Investment Operations | Net Investment Income | Net Realized Gains | Total Distributions | Net Asset Value, End of Period | Total Return(2) | Operating Expenses | Operating Expenses (before expense waiver) | Net Investment Income (Loss) | Net Investment Income (Loss) (before expense waiver) | Portfolio Turnover Rate | Net Assets, End of Period (in thousands) | |||
| Class I | |||||||||||||||||
| 2015 | $16.13 | 0.05 | 0.95 | 1.00 | (0.07) | (1.59) | (1.66) | $15.47 | 6.27% | 0.85% | 1.01% | 0.32% | 0.16% | 35% | $41,490 | ||
| 2014 | $14.72 | 0.06 | 1.41 | 1.47 | (0.06) | — | (0.06) | $16.13 | 9.99% | 0.88% | 1.00% | 0.36% | 0.24% | 35% | $38,754 | ||
| 2013 | $10.80 | 0.05 | 3.94 | 3.99 | (0.07) | — | (0.07) | $14.72 | 37.07% | 0.91% | 1.01% | 0.42% | 0.32% | 34% | $39,393 | ||
| 2012 | $9.48 | 0.06 | 1.26 | 1.32 | — | — | — | $10.80 | 13.92% | 0.97% | 1.01% | 0.57% | 0.53% | 20% | $32,105 | ||
| 2011 | $9.38 | 0.02 | 0.08 | 0.10 | — | — | — | $9.48 | 1.07% | 1.01% | 1.01% | 0.16% | 0.16% | 13% | $30,743 | ||
| Class II | |||||||||||||||||
| 2015 | $15.91 | 0.03 | 0.94 | 0.97 | (0.05) | (1.59) | (1.64) | $15.24 | 6.05% | 1.00% | 1.16% | 0.17% | 0.01% | 35% | $150,493 | ||
| 2014 | $14.52 | 0.03 | 1.39 | 1.42 | (0.03) | — | (0.03) | $15.91 | 9.83% | 1.03% | 1.15% | 0.21% | 0.09% | 35% | $150,331 | ||
| 2013 | $10.65 | 0.03 | 3.89 | 3.92 | (0.05) | — | (0.05) | $14.52 | 36.92% | 1.06% | 1.16% | 0.27% | 0.17% | 34% | $218,460 | ||
| 2012 | $9.36 | 0.04 | 1.25 | 1.29 | — | — | — | $10.65 | 13.78% | 1.12% | 1.16% | 0.42% | 0.38% | 20% | $200,635 | ||
| 2011 | $9.28 | —(3) | 0.08 | 0.08 | — | — | — | $9.36 | 0.86% | 1.16% | 1.16% | 0.01% | 0.01% | 13% | $192,751 | ||
| Notes to Financial Highlights |
| (1) | Computed using average shares outstanding throughout the period. |
| (2) | Total returns are calculated based on the net asset value of the last business day. Total returns for periods less than one year are not annualized. |
| (3) | Per-share amount was less than $0.005. |
See Notes to Financial Statements.
21
| Report of Independent Registered Public Accounting Firm |
To the Board of Directors and Shareholders of American Century Variable Portfolios, Inc.:
We have audited the accompanying statement of assets and liabilities, including the schedule of investments, of VP Ultra Fund (the “Fund”), one of the funds constituting American Century Variable Portfolios, Inc., as of December 31, 2015, and the related statement of operations for the year then ended, the statements of changes in net assets for each of the two years in the period then ended, and the financial highlights for each of the periods presented. These financial statements and financial highlights are the responsibility of the Fund’s management. Our responsibility is to express an opinion on these financial statements and financial highlights based on our audits.
We conducted our audits in accordance with the standards of the Public Company Accounting Oversight Board (United States). Those standards require that we plan and perform the audit to obtain reasonable assurance about whether the financial statements and financial highlights are free of material misstatement. The Fund is not required to have, nor were we engaged to perform, an audit of its internal control over financial reporting. Our audits included consideration of internal control over financial reporting as a basis for designing audit procedures that are appropriate in the circumstances, but not for the purpose of expressing an opinion on the effectiveness of the Fund’s internal control over financial reporting. Accordingly, we express no such opinion. An audit also includes examining, on a test basis, evidence supporting the amounts and disclosures in the financial statements, assessing the accounting principles used and significant estimates made by management, as well as evaluating the overall financial statement presentation. Our procedures included confirmation of securities owned as of December 31, 2015, by correspondence with the custodian and brokers; when replies were not received from brokers, we performed other auditing procedures. We believe that our audits provide a reasonable basis for our opinion.
In our opinion, the financial statements and financial highlights referred to above present fairly, in all material respects, the financial position of VP Ultra Fund of American Century Variable Portfolios, Inc. as of December 31, 2015, the results of its operations for the year then ended, the changes in its net assets for each of the two years in the period then ended, and the financial highlights for each of the periods presented, in conformity with accounting principles generally accepted in the United States of America.
DELOITTE & TOUCHE LLP
Kansas City, Missouri
February 11, 2016
22
| Management |
The Board of Directors
The individuals listed below serve as directors of the funds. Each director will continue to serve in this capacity until death, retirement, resignation or removal from office. The board has adopted a mandatory retirement age for directors who are not “interested persons,” as that term is defined in the Investment Company Act (independent directors). Independent directors shall retire by December 31 of the year in which they reach their 75th birthday.
Mr. Thomas is an “interested person” because he currently serves as President and Chief Executive Officer of American Century Companies, Inc. (ACC), the parent company of American Century Investment Management, Inc. (ACIM or the advisor). Mr. Fink is treated as an “interested person” because of his recent employment with ACC and American Century Services, LLC (ACS). The other directors (more than three-fourths of the total number) are independent. They are not employees, directors or officers of, and have no financial interest in, ACC or any of its wholly owned, direct or indirect, subsidiaries, including ACIM, American Century Investment Services, Inc. (ACIS) and ACS, and they do not have any other affiliations, positions or relationships that would cause them to be considered “interested persons” under the Investment Company Act. The directors serve in this capacity for seven (in the case of Mr. Thomas, 15) registered investment companies in the American Century Investments family of funds.
The following table presents additional information about the directors. The mailing address for each director is 4500 Main Street, Kansas City, Missouri 64111.
| Name (Year of Birth) | Position(s) Held with Funds | Length of Time Served | Principal Occupation(s) During Past 5 Years | Number of American Century Portfolios Overseen by Director | Other Directorships Held During Past 5 Years |
Independent Directors | |||||
| Andrea C. Hall (1945) | Director | Since 1997 | Retired | 80 | None |
| Jan M. Lewis (1957) | Director | Since 2011 | Retired; President and Chief Executive Officer, Catholic Charities of Northeast Kansas (human services organization) (2006 to 2013) | 80 | None |
| James A. Olson (1942) | Director and Chairman of the Board | Since 2007 (Chairman since 2014) | Member, Plaza Belmont LLC (private equity fund manager) | 80 | Saia, Inc. (2002 to 2012) and EPR Properties (2003 to 2013) |
| M. Jeannine Strandjord (1945) | Director | Since 1994 | Retired | 80 | Euronet Worldwide Inc.; MGP Ingredients, Inc.; Charming Shoppes, Inc. (2006 to 2010); and DST Systems Inc. (1996 to 2012) |
| John R. Whitten (1946) | Director | Since 2008 | Retired | 80 | Rudolph Technologies, Inc. |
23
Name (Year of Birth) | Position(s) Held with Funds | Length of Time Served | Principal Occupation(s) During Past 5 Years | Number of American Century Portfolios Overseen by Director | Other Directorships Held During Past 5 Years |
| Independent Directors | |||||
| Stephen E. Yates (1948) | Director | Since 2012 | Retired; Executive Vice President, Technology & Operations, KeyCorp. (computer services) (2004 to 2010) | 80 | Applied Industrial Technologies, Inc. (2001 to 2010) |
| Interested Directors | |||||
| Barry Fink (1955) | Director | Since 2012 | Retired; Executive Vice President, ACC (September 2007 to February 2013); President, ACS (October 2007 to February 2013); Chief Operating Officer, ACC (September 2007 to November 2012) | 80 | None |
| Jonathan S. Thomas (1963) | Director and President | Since 2007 | President and Chief Executive Officer, ACC (March 2007 to present). Also serves as Chief Executive Officer, ACS; Executive Vice President, ACIM; Director, ACC, ACIM and other ACC subsidiaries | 125 | BioMed Valley Discoveries, Inc. |
The Statement of Additional Information has additional information about the fund's directors and is available without charge, upon request, by calling 1-800-378-9878.
24
Officers
The following table presents certain information about the executive officers of the funds. Each officer serves as an officer for each of the 15 investment companies in the American Century family of funds, unless otherwise noted. No officer is compensated for his or her service as an officer of the funds. The listed officers are interested persons of the funds and are appointed or re-appointed on an annual basis. The mailing address for each officer listed below is 4500 Main Street, Kansas City, Missouri 64111.
Name (Year of Birth) | Offices with the Funds | Principal Occupation(s) During the Past Five Years |
| Jonathan S. Thomas (1963) | Director and President since 2007 | President and Chief Executive Officer, ACC (March 2007 to present). Also serves as Chief Executive Officer, ACS; Executive Vice President, ACIM; Director, ACC, ACIM and other ACC subsidiaries |
| Amy D. Shelton (1964) | Chief Compliance Officer and Vice President since 2014 | Chief Compliance Officer, American Century funds, (March 2014 to present); Chief Compliance Officer, ACIM (February 2014 to present); Chief Compliance Officer, ACIS (October 2009 to present); Vice President, Client Interactions and Marketing, ACIS (February 2013 to January 2014); Director, Client Interactions and Marketing, ACIS (June 2007 to January 2013). Also serves as Vice President, ACIS |
| Charles A. Etherington (1957) | General Counsel since 2007 and Senior Vice President since 2006 | Attorney, ACC (February 1994 to present); Vice President, ACC (November 2005 to present); General Counsel, ACC (March 2007 to present). Also serves as General Counsel, ACIM, ACS, ACIS and other ACC subsidiaries; and Senior Vice President, ACIM and ACS |
| C. Jean Wade (1964) | Vice President, Treasurer and Chief Financial Officer since 2012 | Vice President, ACS (February 2000 to present) |
| Robert J. Leach (1966) | Vice President since 2006 and Assistant Treasurer since 2012 | Vice President, ACS (February 2000 to present) |
| David H. Reinmiller (1963) | Vice President since 2000 | Attorney, ACC (January 1994 to present); Associate General Counsel, ACC (January 2001 to present). Also serves as Vice President, ACIM and ACS |
| Ward D. Stauffer (1960) | Secretary since 2005 | Attorney, ACC (June 2003 to present) |
25
| Additional Information |
Proxy Voting Policies
A description of the policies that the fund's investment advisor uses in exercising the voting rights associated with the securities purchased and/or held by the fund is available without charge, upon request, by calling 1-800-378-9878. It is also available on the "About Us" page of American Century Investments’ website at americancentury.com and on the Securities and Exchange Commission’s website at sec.gov. Information regarding how the investment advisor voted proxies relating to portfolio securities during the most recent 12-month period ended June 30 is available on the "About Us" page at americancentury.com. It is also available at sec.gov.
Quarterly Portfolio Disclosure
The fund files its complete schedule of portfolio holdings with the Securities and Exchange Commission (SEC) for the first and third quarters of each fiscal year on Form N-Q. The fund’s Forms N-Q are available on the SEC’s website at sec.gov, and may be reviewed and copied at the SEC’s Public Reference Room in Washington, DC. Information on the operation of the Public Reference Room may be obtained by calling 1-800-SEC-0330. The fund also makes its complete
schedule of portfolio holdings for the most recent quarter of its fiscal year available on its website at ipro.americancentury.com (for Investment Professionals) and, upon request, by calling 1-800-378-9878.
Other Tax Information
The following information is provided pursuant to provisions of the Internal Revenue Code.
For corporate taxpayers, the fund hereby designates $637,570, or up to the maximum amount allowable, of ordinary income distributions paid during the fiscal year ended December 31, 2015 as qualified for the corporate dividends received deduction.
The fund hereby designates $18,971,832, or up to the maximum amount allowable, as long-term capital gain distributions for the fiscal year ended December 31, 2015.
26
| Notes |
27
| Notes |
28
| ||
| Contact Us | americancentury.com | |
| Automated Information Line | 1-800-345-8765 | |
| Investment Professional Service Representatives | 1-800-345-6488 | |
| Telecommunications Relay Service for the Deaf | 711 | |
| American Century Variable Portfolios, Inc. | ||
Investment Advisor: American Century Investment Management, Inc. Kansas City, Missouri | ||
| This report and the statements it contains are submitted for the general information of our shareholders. The report is not authorized for distribution to prospective investors unless preceded or accompanied by an effective prospectus. | ||
| ©2016 American Century Proprietary Holdings, Inc. All rights reserved. CL-ANN-88146 1602 | ||
| ANNUAL REPORT | DECEMBER 31, 2015 |
VP Value Fund
31
32
| Table of Contents |
| Performance | 2 | |
| Portfolio Commentary | ||
| Fund Characteristics | ||
| Shareholder Fee Example | ||
| Schedule of Investments | ||
| Statement of Assets and Liabilities | ||
| Statement of Operations | ||
| Statement of Changes in Net Assets | ||
| Notes to Financial Statements | ||
| Financial Highlights | ||
| Report of Independent Registered Public Accounting Firm | ||
| Management | ||
| Additional Information | ||
Any opinions expressed in this report reflect those of the author as of the date of the report, and do not necessarily represent the opinions of American Century Investments® or any other person in the American Century Investments organization. Any such opinions are subject to change at any time based upon market or other conditions and American Century Investments disclaims any responsibility to update such opinions. These opinions may not be relied upon as investment advice and, because investment decisions made by American Century Investments funds are based on numerous factors, may not be relied upon as an indication of trading intent on behalf of any American Century Investments fund. Security examples are used for representational purposes only and are not intended as recommendations to purchase or sell securities. Performance information for comparative indices and securities is provided to American Century Investments by third party vendors. To the best of American Century Investments’ knowledge, such information is accurate at the time of printing.
| Performance |
| Total Returns as of December 31, 2015 | ||||||
| Average Annual Returns | ||||||
Ticker Symbol | 1 year | 5 years | 10 years | Since Inception | Inception Date | |
| Class I | AVPIX | -3.88%(1) | 10.62%(1) | 6.38%(1) | 8.44% | 5/1/96 |
| Russell 1000 Value Index | — | -3.83% | 11.27% | 6.15% | 8.34% | — |
| S&P 500 Index | — | 1.38% | 12.56% | 7.30% | 7.96% | — |
| Class II | AVPVX | -4.02%(1) | 10.48%(1) | 6.22%(1) | 6.71%(1) | 8/14/01 |
| (1) | Returns would have been lower if a portion of the management fee had not been waived. |
The performance information presented does not include charges and deductions imposed by the insurance company separate account under the variable annuity or variable life insurance contracts. The inclusion of such charges could significantly lower performance. Please refer to the insurance company separate account prospectus for a discussion of the charges related to insurance contracts.
Data presented reflect past performance. Past performance is no guarantee of future results. Current performance may be higher or lower than the performance shown. Investment return and principal value will fluctuate, and redemption value may be more or less than original cost. Data assumes reinvestment of dividends and capital gains, and none of the charts reflect the deduction of taxes that a shareholder would pay on fund distributions or the redemption of fund shares. To obtain performance data current to the most recent month end, please call 1-800-345-6488 or visit ipro.americancentury.com (for Investment Professionals). For additional information about the fund, please consult the prospectus.
2
| Growth of $10,000 Over 10 Years |
| $10,000 investment made December 31, 2005 |
| Performance for other share classes will vary due to differences in fee structure. |
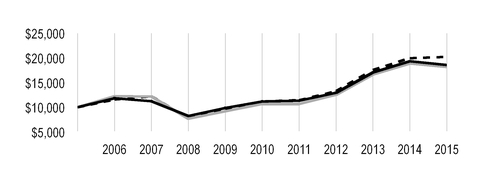
| Value on December 31, 2015 | |
| Class I — $18,567* | |
| Russell 1000 Value Index — $18,173 | |
S&P 500 Index — $20,242 | |
*Ending value would have been lower if a portion of the management fee had not been waived.
| Total Annual Fund Operating Expenses | |
| Class I | Class II |
| 0.96% | 1.11% |
The total annual fund operating expenses shown is as stated in the fund’s prospectus current as of the date of this report. The prospectus may vary from the expense ratio shown elsewhere in this report because it is based on a different time period, includes acquired fund fees and expenses, and, if applicable, does not include fee waivers or expense reimbursements.
Data presented reflect past performance. Past performance is no guarantee of future results. Current performance may be higher or lower than the performance shown. Investment return and principal value will fluctuate, and redemption value may be more or less than original cost. Data assumes reinvestment of dividends and capital gains, and none of the charts reflect the deduction of taxes that a shareholder would pay on fund distributions or the redemption of fund shares. To obtain performance data current to the most recent month end, please call 1-800-345-6488 or visit ipro.americancentury.com (for Investment Professionals). For additional information about the fund, please consult the prospectus.
3
| Portfolio Commentary |
Portfolio Managers: Michael Liss, Kevin Toney, Phil Davidson, Brian Woglom and Dan Gruemmer
Performance Summary
VP Value returned -3.88%* for the 12 months ended December 31, 2015. By comparison, its benchmark, the Russell 1000 Value Index, returned -3.83%. The broader market, as measured by the S&P 500 Index, returned 1.38%. The portfolio’s return reflects operating expenses, while the indices’ returns do not.
The broad U.S. stock market recorded a small gain for the year. During the summer, the market was roiled by concerns about slowing growth in China and other emerging markets. Oil and commodity prices dropped on worries about weak global growth, falling demand, and oversupply. Meanwhile, U.S. economic growth continued slowly. In December, the U.S. Federal Reserve (Fed) raised short-term interest rates, a move that had been anticipated by the market for most of 2015.
VP Value’s investment approach, which emphasizes higher-quality businesses with sound balance sheets, provided positive absolute results in five of the 10 sectors in which it was invested. On a relative basis, it performed roughly in line with its benchmark. The portfolio’s stance in the energy, information technology, and materials sectors detracted from relative results. Investments in the industrials, consumer discretionary, utilities, and financials sectors contributed positively.
Security Selection in Industrials Added Value
Within the industrials sector, the portfolio benefited from its positioning in the machinery industry. Elsewhere in the sector, a leading contributor was waste management company Republic Services, which recorded strong gains as it continued to execute well and has minimal exposure to emerging markets and foreign currency issues. An overweight relative to the benchmark for industrial conglomerate General Electric also bolstered returns. General Electric advanced, as it continued to exit its finance segment, completed the spinoff of Synchrony Financial, acquired Alston’s energy business, and an activist investor took a position in the stock. The company’s margins in its oil and gas business also held up better than expected.
Financials Holdings Contributed
Key contributions were made by some of the portfolio’s financials holdings. Shares of HCC Insurance Holdings appreciated on news the company would be acquired by Tokio Marine Holdings at a significant premium to its price at the time of the announcement. The acquisition was completed by year end. In the capital markets industry, an overweight in Northern Trust added to returns, as the company benefited from continued success in its cost-cutting efforts and the likelihood of higher interest rates.
| * | All fund returns referenced in this commentary are for Class I shares. Returns would have been lower if a portion of the management fee had not been waived. Performance for other share classes will vary due to differences in fee structure; when Class I performance exceeds that of the fund’s benchmark, other share classes may not. See page 2 for returns for all share classes. |
4
Energy Sector Had Mixed Results
Security selection in the energy sector bolstered results, as the portfolio did not own some of the sector’s steepest decliners. However, it was hurt by its overweight position. A major contribution was made by Cameron International, a global provider of pressure control, processing, flow control, and compression systems. Its stock rose on news that oilfield-services provider Schlumberger had agreed to acquire it at a healthy premium, and the portfolio exited its position. On the other hand, declining oil and natural gas prices weighed on a number of the portfolio’s holdings, including EQT, Devon Energy, Peabody Energy, Imperial Oil, and Ultra Petroleum. The portfolio exited its positions in Peabody Energy and Ultra Petroleum during the period.
Outlook
We will continue to follow our disciplined, bottom-up process, selecting securities one at a time for the portfolio. As of December 31, 2015, the portfolio had a significant overweight in the energy sector, with a focus on higher-quality companies across the sector that have been pressured by the steep drop in oil prices. We took advantage of weakness in oil prices to establish a stake in Schlumberger, the leading company in the oilfield services industry. The portfolio also established a position in natural gas producer EQT, which had underperformed as warm weather caused weak natural gas consumption and drove commodity prices to decade lows. In addition, we initiated a stake in Anadarko Petroleum after investors reacted negatively to the company’s proposed all-stock acquisition of Apache.
The portfolio’s largest sector underweight is in financials, where it is significantly underweight real estate investment trusts (REITs) as we continue to find valuations unattractive. The portfolio is also underweight the utilities and materials sectors.
5
| Fund Characteristics |
| DECEMBER 31, 2015 | |
| Top Ten Holdings | % of net assets |
| Exxon Mobil Corp. | 3.4% |
| General Electric Co. | 3.3% |
| JPMorgan Chase & Co. | 2.8% |
| Pfizer, Inc. | 2.8% |
| Procter & Gamble Co. (The) | 2.6% |
| Johnson & Johnson | 2.5% |
| Chevron Corp. | 2.5% |
| Wells Fargo & Co. | 2.5% |
| AT&T, Inc. | 2.0% |
| Merck & Co., Inc. | 2.0% |
| Top Five Industries | % of net assets |
| Oil, Gas and Consumable Fuels | 16.2% |
| Banks | 13.1% |
| Pharmaceuticals | 7.9% |
| Industrial Conglomerates | 4.0% |
| Insurance | 3.9% |
| Types of Investments in Portfolio | % of net assets |
| Common Stocks | 97.8% |
| Temporary Cash Investments | 1.9% |
| Other Assets and Liabilities | 0.3% |
6
| Shareholder Fee Example |
Fund shareholders may incur two types of costs: (1) transaction costs, including sales charges (loads) on purchase payments and redemption/exchange fees; and (2) ongoing costs, including management fees; distribution and service (12b-1) fees; and other fund expenses. This example is intended to help you understand your ongoing costs (in dollars) of investing in your fund and to compare these costs with the ongoing cost of investing in other mutual funds.
The example is based on an investment of $1,000 made at the beginning of the period and held for the entire period from July 1, 2015 to December 31, 2015.
Actual Expenses
The table provides information about actual account values and actual expenses for each class. You may use the information, together with the amount you invested, to estimate the expenses that you paid over the period. First, identify the share class you own. Then simply divide your account value by $1,000 (for example, an $8,600 account value divided by $1,000 = 8.6), then multiply the result by the number under the heading “Expenses Paid During Period” to estimate the expenses you paid on your account during this period.
Hypothetical Example for Comparison Purposes
The table also provides information about hypothetical account values and hypothetical expenses based on the actual expense ratio of each class of your fund and an assumed rate of return of 5% per year before expenses, which is not the actual return of a fund’s share class. The hypothetical account values and expenses may not be used to estimate the actual ending account balance or expenses you paid for the period. You may use this information to compare the ongoing costs of investing in your fund and other funds. To do so, compare this 5% hypothetical example with the 5% hypothetical examples that appear in the shareholder reports of the other funds.
Please note that the expenses shown in the table are meant to highlight your ongoing costs only and do not reflect any transactional costs, such as sales charges (loads) or redemption/exchange fees. Therefore, the table is useful in comparing ongoing costs only, and will not help you determine the relative total costs of owning different funds. In addition, if these transactional costs were included, your costs would have been higher.
| Beginning Account Value 7/1/15 | Ending Account Value 12/31/15 | Expenses Paid During Period(1) 7/1/15 - 12/31/15 | Annualized Expense Ratio(1) | |
| Actual | ||||
| Class I (after waiver) | $1,000 | $968.20 | $3.97 | 0.80% |
| Class I (before waiver) | $1,000 | $968.20(2) | $4.86 | 0.98% |
| Class II (after waiver) | $1,000 | $967.40 | $4.71 | 0.95% |
| Class II (before waiver) | $1,000 | $967.40(2) | $5.60 | 1.13% |
| Hypothetical | ||||
| Class I (after waiver) | $1,000 | $1,021.17 | $4.08 | 0.80% |
| Class I (before waiver) | $1,000 | $1,020.27 | $4.99 | 0.98% |
| Class II (after waiver) | $1,000 | $1,020.42 | $4.84 | 0.95% |
| Class II (before waiver) | $1,000 | $1,019.51 | $5.75 | 1.13% |
| (1) | Expenses are equal to the class's annualized expense ratio listed in the table above, multiplied by the average account value over the period, multiplied by 184, the number of days in the most recent fiscal half-year, divided by 365, to reflect the one-half year period. |
| (2) | Ending account value assumes the return earned after waiver and would have been lower if a portion of the management fee had not been waived. |
7
| Schedule of Investments |
DECEMBER 31, 2015
| Shares | Value | ||||
| COMMON STOCKS — 97.8% | |||||
| Aerospace and Defense — 0.2% | |||||
| Textron, Inc. | 44,965 | $ | 1,888,980 | ||
| Automobiles — 1.1% | |||||
| General Motors Co. | 159,561 | 5,426,669 | |||
| Honda Motor Co., Ltd. | 116,300 | 3,726,431 | |||
| 9,153,100 | |||||
| Banks — 13.1% | |||||
| Bank of America Corp. | 750,780 | 12,635,627 | |||
| BB&T Corp. | 148,520 | 5,615,541 | |||
| BOK Financial Corp. | 89,160 | 5,330,876 | |||
| Comerica, Inc. | 84,177 | 3,521,124 | |||
| Commerce Bancshares, Inc. | 89,673 | 3,814,690 | |||
| Cullen/Frost Bankers, Inc. | 81,412 | 4,884,720 | |||
| JPMorgan Chase & Co. | 346,749 | 22,895,837 | |||
| M&T Bank Corp. | 34,914 | 4,230,879 | |||
| PNC Financial Services Group, Inc. (The) | 105,972 | 10,100,191 | |||
| U.S. Bancorp | 327,292 | 13,965,550 | |||
| Wells Fargo & Co. | 369,862 | 20,105,698 | |||
| 107,100,733 | |||||
| Beverages — 0.2% | |||||
| PepsiCo, Inc. | 16,631 | 1,661,769 | |||
| Biotechnology — 0.4% | |||||
| AbbVie, Inc. | 55,690 | 3,299,076 | |||
| Capital Markets — 3.8% | |||||
| Franklin Resources, Inc. | 117,625 | 4,330,952 | |||
| Goldman Sachs Group, Inc. (The) | 27,036 | 4,872,698 | |||
| LPL Financial Holdings, Inc. | 100,510 | 4,286,752 | |||
| Northern Trust Corp. | 178,077 | 12,837,571 | |||
| State Street Corp. | 74,130 | 4,919,267 | |||
| 31,247,240 | |||||
| Commercial Services and Supplies — 2.9% | |||||
| ADT Corp. (The) | 220,231 | 7,263,218 | |||
| Republic Services, Inc. | 235,140 | 10,343,809 | |||
| Tyco International plc | 202,907 | 6,470,704 | |||
| 24,077,731 | |||||
| Communications Equipment — 2.7% | |||||
| Cisco Systems, Inc. | 599,273 | 16,273,258 | |||
| QUALCOMM, Inc. | 112,640 | 5,630,311 | |||
| 21,903,569 | |||||
| Containers and Packaging — 0.3% | |||||
| Sonoco Products Co. | 50,001 | 2,043,541 | |||
| Diversified Financial Services — 1.8% | |||||
Berkshire Hathaway, Inc., Class A(1) | 50 | 9,890,000 | |||
Berkshire Hathaway, Inc., Class B(1) | 34,364 | 4,537,423 | |||
| 14,427,423 | |||||
8
| Shares | Value | ||||
| Diversified Telecommunication Services — 2.7% | |||||
| AT&T, Inc. | 477,704 | $ | 16,437,795 | ||
| CenturyLink, Inc. | 212,038 | 5,334,876 | |||
| 21,772,671 | |||||
| Electric Utilities — 2.2% | |||||
| Edison International | 91,268 | 5,403,978 | |||
| Great Plains Energy, Inc. | 236,228 | 6,451,387 | |||
| Westar Energy, Inc. | 148,727 | 6,307,512 | |||
| 18,162,877 | |||||
| Electrical Equipment — 1.5% | |||||
| Eaton Corp. plc | 78,720 | 4,096,589 | |||
| Emerson Electric Co. | 170,430 | 8,151,667 | |||
| 12,248,256 | |||||
| Electronic Equipment, Instruments and Components — 1.0% | |||||
Keysight Technologies, Inc.(1) | 180,990 | 5,127,447 | |||
| TE Connectivity Ltd. | 48,225 | 3,115,817 | |||
| 8,243,264 | |||||
| Energy Equipment and Services — 3.2% | |||||
FMC Technologies, Inc.(1) | 113,860 | 3,303,079 | |||
| Halliburton Co. | 222,644 | 7,578,802 | |||
| Helmerich & Payne, Inc. | 116,990 | 6,264,814 | |||
| Schlumberger Ltd. | 135,120 | 9,424,620 | |||
| 26,571,315 | |||||
| Food and Staples Retailing — 2.6% | |||||
| Sysco Corp. | 226,016 | 9,266,656 | |||
| Wal-Mart Stores, Inc. | 190,978 | 11,706,951 | |||
| 20,973,607 | |||||
| Food Products — 2.1% | |||||
| ConAgra Foods, Inc. | 69,764 | 2,941,250 | |||
| General Mills, Inc. | 33,942 | 1,957,096 | |||
| Kellogg Co. | 85,367 | 6,169,473 | |||
| Mondelez International, Inc., Class A | 139,766 | 6,267,107 | |||
| 17,334,926 | |||||
| Health Care Equipment and Supplies — 3.4% | |||||
| Baxter International, Inc. | 64,600 | 2,464,490 | |||
| Becton Dickinson and Co. | 15,730 | 2,423,836 | |||
Boston Scientific Corp.(1) | 169,676 | 3,128,825 | |||
| Medtronic plc | 141,377 | 10,874,719 | |||
| Zimmer Biomet Holdings, Inc. | 89,488 | 9,180,574 | |||
| 28,072,444 | |||||
| Health Care Providers and Services — 1.2% | |||||
| Cigna Corp. | 19,720 | 2,885,627 | |||
Express Scripts Holding Co.(1) | 34,697 | 3,032,865 | |||
LifePoint Health, Inc.(1) | 56,122 | 4,119,355 | |||
| 10,037,847 | |||||
| Hotels, Restaurants and Leisure — 0.5% | |||||
| Carnival Corp. | 46,090 | 2,510,983 | |||
| International Speedway Corp., Class A | 50,304 | 1,696,251 | |||
| 4,207,234 | |||||
| Household Durables — 0.1% | |||||
| Tupperware Brands Corp. | 14,080 | 783,552 | |||
9
| Shares | Value | ||||
| Household Products — 2.6% | |||||
| Procter & Gamble Co. (The) | 272,326 | $ | 21,625,408 | ||
| Industrial Conglomerates — 4.0% | |||||
| General Electric Co. | 877,054 | 27,320,232 | |||
| Koninklijke Philips NV | 213,786 | 5,435,598 | |||
| 32,755,830 | |||||
| Insurance — 3.9% | |||||
| ACE Ltd. | 43,648 | 5,100,269 | |||
| Aflac, Inc. | 76,375 | 4,574,862 | |||
| Brown & Brown, Inc. | 44,809 | 1,438,369 | |||
| Chubb Corp. (The) | 41,638 | 5,522,864 | |||
| MetLife, Inc. | 148,829 | 7,175,046 | |||
| Reinsurance Group of America, Inc. | 49,032 | 4,194,688 | |||
| Unum Group | 123,640 | 4,115,976 | |||
| 32,122,074 | |||||
| Leisure Products — 0.3% | |||||
| Mattel, Inc. | 81,609 | 2,217,316 | |||
| Machinery — 0.2% | |||||
| Oshkosh Corp. | 39,691 | 1,549,537 | |||
| Media — 0.2% | |||||
Discovery Communications, Inc., Class A(1) | 62,325 | 1,662,831 | |||
| Metals and Mining — 1.0% | |||||
| BHP Billiton Ltd. | 155,830 | 2,024,280 | |||
| Newmont Mining Corp. | 104,950 | 1,888,050 | |||
| Nucor Corp. | 96,590 | 3,892,577 | |||
| 7,804,907 | |||||
| Multi-Utilities — 1.1% | |||||
| Ameren Corp. | 29,490 | 1,274,853 | |||
| PG&E Corp. | 140,059 | 7,449,738 | |||
| 8,724,591 | |||||
| Multiline Retail — 0.6% | |||||
| Target Corp. | 66,777 | 4,848,678 | |||
| Oil, Gas and Consumable Fuels — 16.2% | |||||
| Anadarko Petroleum Corp. | 167,140 | 8,119,661 | |||
| Apache Corp. | 139,028 | 6,182,575 | |||
| Chevron Corp. | 228,120 | 20,521,675 | |||
| Cimarex Energy Co. | 59,320 | 5,302,022 | |||
| Devon Energy Corp. | 313,044 | 10,017,408 | |||
| EOG Resources, Inc. | 62,312 | 4,411,067 | |||
| EQT Corp. | 168,740 | 8,796,416 | |||
| Exxon Mobil Corp. | 352,638 | 27,488,132 | |||
| Imperial Oil Ltd. | 199,219 | 6,490,419 | |||
| Noble Energy, Inc. | 221,055 | 7,279,341 | |||
| Occidental Petroleum Corp. | 204,058 | 13,796,361 | |||
Southwestern Energy Co.(1) | 172,792 | 1,228,551 | |||
| TOTAL SA | 286,695 | 12,768,203 | |||
| 132,401,831 | |||||
| Pharmaceuticals — 7.9% | |||||
Allergan plc(1) | 15,300 | 4,781,250 | |||
| Johnson & Johnson | 202,971 | 20,849,181 | |||
| Merck & Co., Inc. | 310,392 | 16,394,905 | |||
10
| Shares | Value | ||||
| Pfizer, Inc. | 698,449 | $ | 22,545,934 | ||
| 64,571,270 | |||||
| Real Estate Investment Trusts (REITs) — 2.0% | |||||
| Annaly Capital Management, Inc. | 433,614 | 4,067,300 | |||
| Capstead Mortgage Corp. | 239,262 | 2,091,150 | |||
| Corrections Corp. of America | 194,035 | 5,139,987 | |||
| Piedmont Office Realty Trust, Inc., Class A | 75,458 | 1,424,647 | |||
| Weyerhaeuser Co. | 107,290 | 3,216,554 | |||
| 15,939,638 | |||||
| Road and Rail — 0.8% | |||||
| CSX Corp. | 79,540 | 2,064,063 | |||
| Heartland Express, Inc. | 275,644 | 4,691,461 | |||
| 6,755,524 | |||||
| Semiconductors and Semiconductor Equipment — 2.8% | |||||
| Applied Materials, Inc. | 318,054 | 5,938,068 | |||
| Broadcom Corp., Class A | 33,980 | 1,964,724 | |||
| Intel Corp. | 400,457 | 13,795,744 | |||
| Teradyne, Inc. | 54,738 | 1,131,434 | |||
| 22,829,970 | |||||
| Software — 1.9% | |||||
| Microsoft Corp. | 150,531 | 8,351,460 | |||
| Oracle Corp. | 202,263 | 7,388,667 | |||
| 15,740,127 | |||||
| Specialty Retail — 1.5% | |||||
| Advance Auto Parts, Inc. | 35,315 | 5,315,261 | |||
| CST Brands, Inc. | 117,688 | 4,606,308 | |||
| Lowe's Cos., Inc. | 32,148 | 2,444,534 | |||
| 12,366,103 | |||||
| Technology Hardware, Storage and Peripherals — 3.0% | |||||
| Apple, Inc. | 24,318 | 2,559,713 | |||
| EMC Corp. | 444,848 | 11,423,697 | |||
| Hewlett Packard Enterprise Co. | 128,657 | 1,955,586 | |||
| HP, Inc. | 128,657 | 1,523,299 | |||
| SanDisk Corp. | 59,468 | 4,518,973 | |||
| Western Digital Corp. | 46,136 | 2,770,467 | |||
| 24,751,735 | |||||
| Textiles, Apparel and Luxury Goods — 0.8% | |||||
| Coach, Inc. | 114,610 | 3,751,185 | |||
| Ralph Lauren Corp. | 25,750 | 2,870,610 | |||
| 6,621,795 | |||||
TOTAL COMMON STOCKS (Cost $748,227,161) | 800,500,320 | ||||
| TEMPORARY CASH INVESTMENTS — 1.9% | |||||
| Repurchase Agreement, Fixed Income Clearing Corp., (collateralized by various U.S. Treasury obligations, 3.00%, 5/15/45, valued at $15,204,375), at 0.08%, dated 12/31/15, due 1/4/16 (Delivery value $14,905,132) | 14,905,000 | ||||
| State Street Institutional Liquid Reserves Fund, Premier Class | 538,121 | 538,121 | |||
TOTAL TEMPORARY CASH INVESTMENTS (Cost $15,443,121) | 15,443,121 | ||||
TOTAL INVESTMENT SECURITIES — 99.7% (Cost $763,670,282) | 815,943,441 | ||||
| OTHER ASSETS AND LIABILITIES — 0.3% | 2,374,570 | ||||
| TOTAL NET ASSETS — 100.0% | $ | 818,318,011 | |||
11
| FORWARD FOREIGN CURRENCY EXCHANGE CONTRACTS | ||||||||||
| Currency Purchased | Currency Sold | Counterparty | Settlement Date | Unrealized Appreciation (Depreciation) | ||||||
| USD | 1,427,747 | AUD | 1,989,170 | Credit Suisse AG | 1/29/16 | $ | (20,058 | ) | ||
| USD | 111,699 | AUD | 154,272 | Credit Suisse AG | 1/29/16 | (587 | ) | |||
| USD | 4,734,934 | CAD | 6,601,918 | JPMorgan Chase Bank N.A. | 1/29/16 | (36,514 | ) | |||
| USD | 147,927 | CAD | 205,048 | JPMorgan Chase Bank N.A. | 1/29/16 | (269 | ) | |||
| USD | 184,767 | CAD | 256,310 | JPMorgan Chase Bank N.A. | 1/29/16 | (477 | ) | |||
| USD | 13,676,856 | EUR | 12,475,013 | UBS AG | 1/29/16 | 111,577 | ||||
| USD | 420,229 | EUR | 383,859 | UBS AG | 1/29/16 | 2,821 | ||||
| JPY | 9,856,425 | USD | 81,581 | Credit Suisse AG | 1/29/16 | 465 | ||||
| USD | 2,882,522 | JPY | 348,289,425 | Credit Suisse AG | 1/29/16 | (16,664 | ) | |||
| $ | 40,294 | |||||||||
| NOTES TO SCHEDULE OF INVESTMENTS | ||
| AUD | - | Australian Dollar |
| CAD | - | Canadian Dollar |
| EUR | - | Euro |
| JPY | - | Japanese Yen |
| USD | - | United States Dollar |
| (1) | Non-income producing. |
See Notes to Financial Statements.
12
| Statement of Assets and Liabilities |
| DECEMBER 31, 2015 | |||
| Assets | |||
| Investment securities, at value (cost of $763,670,282) | $ | 815,943,441 | |
| Foreign currency holdings, at value (cost of $168,504) | 156,149 | ||
| Receivable for investments sold | 8,039,912 | ||
| Receivable for capital shares sold | 349,219 | ||
| Unrealized appreciation on forward foreign currency exchange contracts | 114,863 | ||
| Dividends and interest receivable | 1,959,567 | ||
| 826,563,151 | |||
| Liabilities | |||
| Payable for investments purchased | 6,760,950 | ||
| Payable for capital shares redeemed | 801,409 | ||
| Unrealized depreciation on forward foreign currency exchange contracts | 74,569 | ||
| Accrued management fees | 520,131 | ||
| Distribution fees payable | 88,081 | ||
| 8,245,140 | |||
| Net Assets | $ | 818,318,011 | |
| Net Assets Consist of: | |||
| Capital (par value and paid-in surplus) | $ | 893,532,203 | |
| Undistributed net investment income | 280,531 | ||
| Accumulated net realized loss | (127,794,537 | ) | |
| Net unrealized appreciation | 52,299,814 | ||
| $ | 818,318,011 | ||
| Net Assets | Shares Outstanding | Net Asset Value Per Share | ||||
| Class I, $0.01 Par Value | $407,397,555 | 46,049,102 | $8.85 | |||
| Class II, $0.01 Par Value | $410,920,456 | 46,398,015 | $8.86 | |||
See Notes to Financial Statements.
13
| Statement of Operations |
| YEAR ENDED DECEMBER 31, 2015 | |||
| Investment Income (Loss) | |||
| Income: | |||
| Dividends (net of foreign taxes withheld of $147,093) | $ | 24,220,295 | |
| Interest | 6,029 | ||
| 24,226,324 | |||
| Expenses: | |||
| Management fees | 8,082,051 | ||
| Distribution fees - Class II | 1,094,224 | ||
| Directors' fees and expenses | 31,777 | ||
| Other expenses | 2,480 | ||
| 9,210,532 | |||
| Fees waived | (1,530,623 | ) | |
| 7,679,909 | |||
| Net investment income (loss) | 16,546,415 | ||
| Realized and Unrealized Gain (Loss) | |||
| Net realized gain (loss) on: | |||
| Investment transactions | 115,040,950 | ||
| Foreign currency transactions | 3,419,499 | ||
| 118,460,449 | |||
| Change in net unrealized appreciation (depreciation) on: | |||
| Investments | (170,049,798 | ) | |
| Translation of assets and liabilities in foreign currencies | (158,599 | ) | |
| (170,208,397 | ) | ||
| Net realized and unrealized gain (loss) | (51,747,948 | ) | |
| Net Increase (Decrease) in Net Assets Resulting from Operations | $ | (35,201,533 | ) |
See Notes to Financial Statements.
14
| Statement of Changes in Net Assets |
| YEARS ENDED DECEMBER 31, 2015 AND DECEMBER 31, 2014 | ||||||
| Increase (Decrease) in Net Assets | December 31, 2015 | December 31, 2014 | ||||
| Operations | ||||||
| Net investment income (loss) | $ | 16,546,415 | $ | 14,341,972 | ||
| Net realized gain (loss) | 118,460,449 | 109,235,467 | ||||
| Change in net unrealized appreciation (depreciation) | (170,208,397 | ) | (12,561,723 | ) | ||
| Net increase (decrease) in net assets resulting from operations | (35,201,533 | ) | 111,015,716 | |||
| Distributions to Shareholders | ||||||
| From net investment income: | ||||||
| Class I | (9,220,306 | ) | (6,707,258 | ) | ||
| Class II | (8,671,895 | ) | (6,390,044 | ) | ||
| Class III | (159,675 | ) | (160,064 | ) | ||
| Decrease in net assets from distributions | (18,051,876 | ) | (13,257,366 | ) | ||
| Capital Share Transactions | ||||||
| Net increase (decrease) in net assets from capital share transactions (Note 5) | (48,837,226 | ) | (127,098,072 | ) | ||
| Redemption Fees | ||||||
| Increase in net assets from redemption fees | 10,008 | 1,027 | ||||
| Net increase (decrease) in net assets | (102,080,627 | ) | (29,338,695 | ) | ||
| Net Assets | ||||||
| Beginning of period | 920,398,638 | 949,737,333 | ||||
| End of period | $ | 818,318,011 | $ | 920,398,638 | ||
| Undistributed net investment income | $ | 280,531 | $ | 2,544,227 | ||
See Notes to Financial Statements.
15
| Notes to Financial Statements |
DECEMBER 31, 2015
1. Organization
American Century Variable Portfolios, Inc. (the corporation) is registered under the Investment Company Act of 1940, as amended (the 1940 Act), as an open-end management investment company and is organized as a Maryland corporation. VP Value Fund (the fund) is one fund in a series issued by the corporation. The fund is diversified as defined under the 1940 Act. The fund's investment objective is to seek long-term capital growth. Income is a secondary objective.
The fund offers Class I and Class II. The share classes differ principally in their respective distribution and shareholder servicing expenses and arrangements. Class II is charged a lower unified management fee because it has a separate arrangement for distribution services. On August 7, 2015, there were no outstanding Class III shares and the fund discontinued offering Class III.
2. Significant Accounting Policies
The following is a summary of significant accounting policies consistently followed by the fund in preparation of its financial statements. The fund is an investment company and follows accounting and reporting guidance in accordance with accounting principles generally accepted in the United States of America. This may require management to make certain estimates and assumptions at the date of the financial statements. Actual results could differ from these estimates. Management evaluated the impact of events or transactions occurring through the date the financial statements were issued that would merit recognition or disclosure.
Investment Valuations — The fund determines the fair value of its investments and computes its net asset value per share at the close of regular trading (usually 4 p.m. Eastern time) on the New York Stock Exchange (NYSE) on each day the NYSE is open. The Board of Directors has adopted valuation policies and procedures to guide the investment advisor in the fund’s investment valuation process and to provide methodologies for the oversight of the fund’s pricing function.
Equity securities that are listed or traded on a domestic securities exchange are valued at the last reported sales price or at the official closing price as provided by the exchange. Equity securities traded on foreign securities exchanges are generally valued at the closing price of such securities on the exchange where primarily traded or at the close of the NYSE, if that is earlier. If no last sales price is reported, or if local convention or regulation so provides, the mean of the latest bid and asked prices may be used. Securities traded over-the-counter are valued at the mean of the latest bid and asked prices, the last sales price, or the official closing price. Equity securities initially expressed in local currencies are translated into U.S. dollars at the mean of the appropriate currency exchange rate at the close of the NYSE as provided by an independent pricing service.
Open-end management investment companies are valued at the reported net asset value per share. Repurchase agreements are valued at cost, which approximates fair value. Forward foreign currency exchange contracts are valued at the mean of the appropriate forward exchange rate at the close of the NYSE as provided by an independent pricing service.
If the fund determines that the market price for an investment is not readily available or the valuation methods mentioned above do not reflect an investment’s fair value, such investment is valued as determined in good faith by the Board of Directors or its delegate, in accordance with policies and procedures adopted by the Board of Directors. In its determination of fair value, the fund may review several factors including, but not limited to, market information regarding the specific investment or comparable investments and correlation with other investment types, futures indices or general market indicators. Circumstances that may cause the fund to use these procedures to value an investment include, but are not limited to: an investment has been declared in default or is distressed; trading in a security has been suspended during the trading day or a security is not actively trading on its principal exchange; prices received from a regular pricing source are deemed unreliable; or there is a foreign market holiday and no trading occurred.
The fund monitors for significant events occurring after the close of an investment’s primary exchange but before the fund’s net asset value per share is determined. Significant events may include, but are not limited to: corporate announcements and transactions; governmental action and political unrest that could impact a
16
specific investment or an investment sector; or armed conflicts, natural disasters and similar events that could affect investments in a specific country or region. The fund also monitors for significant fluctuations between domestic and foreign markets, as evidenced by the U.S. market or such other indicators that the Board of Directors, or its delegate, deems appropriate. If significant fluctuations in foreign markets are identified, the fund may apply a model-derived factor to the closing price of equity securities traded on foreign securities exchanges. The factor is based on observable market data as provided by an independent pricing service.
Security Transactions — Security transactions are accounted for as of the trade date. Net realized gains and losses are determined on the identified cost basis, which is also used for federal income tax purposes.
Investment Income — Dividend income less foreign taxes withheld, if any, is recorded as of the ex-dividend date. Distributions received on securities that represent a return of capital or long-term capital gain are recorded as a reduction of cost of investments and/or as a realized gain. The fund may estimate the components of distributions received that may be considered nontaxable distributions or long-term capital gain distributions for income tax purposes. Interest income is recorded on the accrual basis and includes accretion of discounts and amortization of premiums.
Foreign Currency Translations — All assets and liabilities initially expressed in foreign currencies are translated into U.S. dollars at prevailing exchange rates at period end. The fund may enter into spot foreign currency exchange contracts to facilitate transactions denominated in a foreign currency. Purchases and sales of investment securities, dividend and interest income, spot foreign currency exchange contracts, and expenses are translated at the rates of exchange prevailing on the respective dates of such transactions. Net realized and unrealized foreign currency exchange gains or losses related to investment securities are a component of net realized gain (loss) on investment transactions and change in net unrealized appreciation (depreciation) on investments, respectively.
Repurchase Agreements — The fund may enter into repurchase agreements with institutions that American Century Investment Management, Inc. (ACIM) (the investment advisor) has determined are creditworthy pursuant to criteria adopted by the Board of Directors. The fund requires that the collateral, represented by securities, received in a repurchase transaction be transferred to the custodian in a manner sufficient to enable the fund to obtain those securities in the event of a default under the repurchase agreement. ACIM monitors, on a daily basis, the securities transferred to ensure the value, including accrued interest, of the securities under each repurchase agreement is equal to or greater than amounts owed to the fund under each repurchase agreement.
Joint Trading Account — Pursuant to an Exemptive Order issued by the Securities and Exchange Commission, the fund, along with certain other funds in the American Century Investments family of funds, may transfer uninvested cash balances into a joint trading account. These balances are invested in one or more repurchase agreements that are collateralized by U.S. Treasury or Agency obligations.
Income Tax Status — It is the fund’s policy to distribute substantially all net investment income and net realized gains to shareholders and to otherwise qualify as a regulated investment company under provisions of the Internal Revenue Code. Accordingly, no provision has been made for income taxes. The fund files U.S. federal, state, local and non-U.S. tax returns as applicable. The fund's tax returns are subject to examination by the relevant taxing authority until expiration of the applicable statute of limitations, which is generally three years from the date of filing but can be longer in certain jurisdictions. At this time, management believes there are no uncertain tax positions which, based on their technical merit, would not be sustained upon examination and for which it is reasonably possible that the total amounts of unrecognized tax benefits will significantly change in the next twelve months.
Multiple Class — All shares of the fund represent an equal pro rata interest in the net assets of the class to which such shares belong, and have identical voting, dividend, liquidation and other rights and the same terms and conditions, except for class specific expenses and exclusive rights to vote on matters affecting only individual classes. Income, non-class specific expenses, and realized and unrealized capital gains and losses of the fund are allocated to each class of shares based on their relative net assets.
Distributions to Shareholders — Distributions from net investment income, if any, are generally declared and paid quarterly. Distributions from net realized gains, if any, are generally declared and paid annually.
Redemption Fees — The fund may impose a 1.00% redemption fee on shares held less than 60 days. The fee may not be applicable to all classes. The redemption fee is retained by the fund and helps cover transaction costs that long-term investors may bear when the fund sells securities to meet investor redemptions.
17
Indemnifications — Under the corporation’s organizational documents, its officers and directors are indemnified against certain liabilities arising out of the performance of their duties to the fund. In addition, in the normal course of business, the fund enters into contracts that provide general indemnifications. The maximum exposure under these arrangements is unknown as this would involve future claims that may be made against a fund. The risk of material loss from such claims is considered by management to be remote.
3. Fees and Transactions with Related Parties
Certain officers and directors of the corporation are also officers and/or directors of American Century Companies, Inc. (ACC). The corporation’s investment advisor, ACIM, the corporation's distributor, American Century Investment Services, Inc. (ACIS), and the corporation’s transfer agent, American Century Services, LLC, are wholly owned, directly or indirectly, by ACC.
Management Fees — The corporation has entered into a management agreement with ACIM, under which ACIM provides the fund with investment advisory and management services in exchange for a single, unified management fee (the fee) per class. The agreement provides that all expenses of managing and operating the fund, except distribution fees, brokerage expenses, taxes, interest, fees and expenses of the independent directors (including legal counsel fees), and extraordinary expenses, will be paid by ACIM. The fee is computed and accrued daily based on each class’s daily net assets and paid monthly in arrears. The rate of the fee is determined by applying a fee rate calculation formula. This formula takes into account the fund’s assets as well as certain assets, if any, of other clients of the investment advisor outside the American Century Investments family of funds (such as subadvised funds and separate accounts) that have very similar investment teams and investment strategies (strategy assets). The annual management fee schedule ranges from 0.90% to 1.00% for Class I and Class III and from 0.80% to 0.90% for Class II. From January 1, 2015 through July 31, 2015, the investment advisor voluntarily agreed to waive 0.17% of the fund's management fee. Effective August 1, 2015, the investment advisor voluntarily agreed to waive 0.18% of the fund's management fee. The investment advisor expects this waiver to continue until April 30, 2017 and cannot terminate it prior to such date without the approval of the Board of Directors. The total amount of the waiver for each class for the year ended December 31, 2015 was $755,346, $761,611 and $13,666 for Class I, Class II and Class III, respectively. The effective annual management fee before waiver for each class for the year ended December 31, 2015 was 0.97% and 0.87% for Class I and Class II, respectively. The effective annual management fee after waiver for each class for the year ended December 31, 2015 was 0.80% and 0.70% for Class I and Class II, respectively.
Distribution Fees — The Board of Directors has adopted the Master Distribution Plan (the plan) for Class II, pursuant to Rule 12b-1 of the 1940 Act. The plan provides that Class II will pay ACIS an annual distribution fee equal to 0.25%. The fee is computed and accrued daily based on the Class II daily net assets and paid monthly in arrears. The distribution fee provides compensation for expenses incurred in connection with distributing shares of Class II including, but not limited to, payments to brokers, dealers, and financial institutions that have entered into sales agreements with respect to shares of the fund. Fees incurred under the plan during the year ended December 31, 2015 are detailed in the Statement of Operations.
Directors' Fees and Expenses — The Board of Directors is responsible for overseeing the investment advisor’s management and operations of the fund. The directors receive detailed information about the fund and its investment advisor regularly throughout the year, and meet at least quarterly with management of the investment advisor to review reports about fund operations. The fund’s officers do not receive compensation from the fund.
4. Investment Transactions
Purchases and sales of investment securities, excluding short-term investments, for the year ended December 31, 2015 were $400,134,026 and $423,121,579, respectively.
18
5. Capital Share Transactions
Transactions in shares of the fund were as follows:
| Year ended December 31, 2015 | Year ended December 31, 2014 | |||||||||
| Shares | Amount | Shares | Amount | |||||||
| Class I/Shares Authorized | 650,000,000 | 650,000,000 | ||||||||
| Sold | 8,988,954 | $ | 82,756,006 | 6,643,650 | $ | 59,752,310 | ||||
| Issued in reinvestment of distributions | 1,000,492 | 9,032,325 | 747,712 | 6,690,160 | ||||||
| Redeemed | (12,109,013 | ) | (111,684,861 | ) | (10,169,151 | ) | (90,424,490 | ) | ||
| (2,119,567 | ) | (19,896,530 | ) | (2,777,789 | ) | (23,982,020 | ) | |||
| Class II/Shares Authorized | 350,000,000 | 350,000,000 | ||||||||
| Sold | 5,009,077 | 46,360,967 | 5,530,025 | 49,219,802 | ||||||
| Issued in reinvestment of distributions | 959,450 | 8,671,895 | 716,336 | 6,390,044 | ||||||
| Redeemed | (7,316,278 | ) | (67,257,892 | ) | (18,662,385 | ) | (164,069,177 | ) | ||
| (1,347,751 | ) | (12,225,030 | ) | (12,416,024 | ) | (108,459,331 | ) | |||
| Class III/Shares Authorized | 50,000,000 | 50,000,000 | ||||||||
| Sold | 187,559 | 1,740,327 | 923,789 | 8,498,047 | ||||||
| Issued in reinvestment of distributions | 16,965 | 159,675 | 17,797 | 160,064 | ||||||
| Redeemed | (2,019,139 | ) | (18,615,668 | ) | (380,366 | ) | (3,314,832 | ) | ||
| (1,814,615 | ) | (16,715,666 | ) | 561,220 | 5,343,279 | |||||
| Net increase (decrease) | (5,281,933 | ) | $ | (48,837,226 | ) | (14,632,593 | ) | $ | (127,098,072 | ) |
6. Fair Value Measurements
The fund’s investments valuation process is based on several considerations and may use multiple inputs to determine the fair value of the investments held by the fund. In conformity with accounting principles generally accepted in the United States of America, the inputs used to determine a valuation are classified into three broad levels.
| • | Level 1 valuation inputs consist of unadjusted quoted prices in an active market for identical investments. |
| • | Level 2 valuation inputs consist of direct or indirect observable market data (including quoted prices for comparable investments, evaluations of subsequent market events, interest rates, prepayment speeds, credit risk, etc.). These inputs also consist of quoted prices for identical investments initially expressed in local currencies that are adjusted through translation into U.S. dollars. |
| • | Level 3 valuation inputs consist of unobservable data (including a fund’s own assumptions). |
The level classification is based on the lowest level input that is significant to the fair valuation measurement. The valuation inputs are not necessarily an indication of the risks associated with investing in these securities or other financial instruments. There were no significant transfers between levels during the period.
19
The following is a summary of the level classifications as of period end. The Schedule of Investments provides additional information on the fund’s portfolio holdings.
| Level 1 | Level 2 | Level 3 | ||||||
| Assets | ||||||||
| Investment Securities | ||||||||
| Common Stocks | $ | 770,055,389 | $ | 30,444,931 | — | |||
| Temporary Cash Investments | 538,121 | 14,905,000 | — | |||||
| $ | 770,593,510 | $ | 45,349,931 | — | ||||
| Other Financial Instruments | ||||||||
| Forward Foreign Currency Exchange Contracts | — | $ | 114,863 | — | ||||
| Liabilities | ||||||||
| Other Financial Instruments | ||||||||
| Forward Foreign Currency Exchange Contracts | — | $ | 74,569 | — | ||||
7. Derivative Instruments
Foreign Currency Risk — The fund is subject to foreign currency exchange rate risk in the normal course of pursuing its investment objectives. The value of foreign investments held by a fund may be significantly affected by changes in foreign currency exchange rates. The dollar value of a foreign security generally decreases when the value of the dollar rises against the foreign currency in which the security is denominated and tends to increase when the value of the dollar declines against such foreign currency. A fund may enter into forward foreign currency exchange contracts to reduce a fund's exposure to foreign currency exchange rate fluctuations. The net U.S. dollar value of foreign currency underlying all contractual commitments held by a fund and the resulting unrealized appreciation or depreciation are determined daily. Realized gain or loss is recorded upon the termination of the contract. Net realized and unrealized gains or losses occurring during the holding period of forward foreign currency exchange contracts are a component of net realized gain (loss) on foreign currency transactions and change in net unrealized appreciation (depreciation) on translation of assets and liabilities in foreign currencies, respectively. A fund bears the risk of an unfavorable change in the foreign currency exchange rate underlying the forward contract. Additionally, losses, up to the fair value, may arise if the counterparties do not perform under the contract terms. The fund's average U.S. dollar exposure to foreign currency risk derivative instruments held during the period was $28,690,356.
The value of foreign currency risk derivative instruments as of December 31, 2015, is disclosed on the Statement of Assets and Liabilities as an asset of $114,863 in unrealized appreciation on forward foreign currency exchange contracts and a liability of $74,569 in unrealized depreciation on forward foreign currency exchange contracts. For the year ended December 31, 2015, the effect of foreign currency risk derivative instruments on the Statement of Operations was $3,435,213 in net realized gain (loss) on foreign currency transactions and $(155,299) in change in net unrealized appreciation (depreciation) on translation of assets and liabilities in foreign currencies.
8. Federal Tax Information
The tax character of distributions paid during the years ended December 31, 2015 and December 31, 2014 were as follows:
| 2015 | 2014 | |||||
| Distributions Paid From | ||||||
| Ordinary income | $ | 18,051,876 | $ | 13,257,366 | ||
| Long-term capital gains | — | — | ||||
The book-basis character of distributions made during the year from net investment income or net realized gains may differ from their ultimate characterization for federal income tax purposes. These differences reflect the differing character of certain income items and net realized gains and losses for financial statement and tax purposes, and may result in reclassification among certain capital accounts on the financial statements.
20
As of December 31, 2015, the federal tax cost of investments and the components of distributable earnings on a tax-basis were as follows:
| Federal tax cost of investments | $ | 772,750,072 | |
| Gross tax appreciation of investments | $ | 103,707,565 | |
| Gross tax depreciation of investments | (60,514,196 | ) | |
| Net tax appreciation (depreciation) of investments | 43,193,369 | ||
Net tax appreciation (depreciation) on derivatives and translation of assets and liabilities in foreign currencies | (13,699 | ) | |
Net tax appreciation (depreciation) | $ | 43,179,670 | |
| Undistributed ordinary income | $ | 280,591 | |
| Accumulated short-term capital losses | $ | (118,674,453 | ) |
The difference between book-basis and tax-basis unrealized appreciation (depreciation) is attributable primarily to the tax deferral of losses on wash sales.
Accumulated capital losses represent net capital loss carryovers that may be used to offset future realized capital gains for federal income tax purposes. Future capital loss carryover utilization in any given year may be subject to Internal Revenue Code limitations. Capital loss carryovers expire in 2017.
21
| Financial Highlights |
| For a Share Outstanding Throughout the Years Ended December 31 (except as noted) | |||||||||||||||
| Per-Share Data | Ratios and Supplemental Data | ||||||||||||||
| Income From Investment Operations: | Ratio to Average Net Assets of: | ||||||||||||||
Net Asset Value, Beginning of Period | Net Investment Income (Loss)(1) | Net Realized and Unrealized Gain (Loss) | Total From Investment Operations | Distributions From Net Investment Income | Net Asset Value, End of Period | Total Return(2) | Operating Expenses | Operating Expenses (before expense waiver) | Net Investment Income (Loss) | Net Investment Income (Loss) (before expense waiver) | Portfolio Turnover Rate | Net Assets, End of Period (in thousands) | |||
| Class I | |||||||||||||||
| 2015 | $9.41 | 0.18 | (0.54) | (0.36) | (0.20) | $8.85 | (3.88)% | 0.80% | 0.97% | 1.96% | 1.79% | 47% | $407,398 | ||
| 2014 | $8.45 | 0.15 | 0.95 | 1.10 | (0.14) | $9.41 | 13.08% | 0.84% | 0.96% | 1.66% | 1.54% | 44% | $453,412 | ||
| 2013 | $6.52 | 0.14 | 1.92 | 2.06 | (0.13) | $8.45 | 31.73% | 0.88% | 0.97% | 1.79% | 1.70% | 51% | $430,392 | ||
| 2012 | $5.80 | 0.11 | 0.73 | 0.84 | (0.12) | $6.52 | 14.58% | 0.94% | 0.98% | 1.74% | 1.70% | 47% | $354,809 | ||
| 2011 | $5.86 | 0.10 | (0.04) | 0.06 | (0.12) | $5.80 | 1.01% | 0.98% | 0.98% | 1.74% | 1.74% | 67% | $362,221 | ||
| Class II | |||||||||||||||
| 2015 | $9.42 | 0.17 | (0.55) | (0.38) | (0.18) | $8.86 | (4.02)% | 0.95% | 1.12% | 1.81% | 1.64% | 47% | $410,920 | ||
| 2014 | $8.46 | 0.13 | 0.95 | 1.08 | (0.12) | $9.42 | 12.89% | 0.99% | 1.11% | 1.51% | 1.39% | 44% | $449,906 | ||
| 2013 | $6.53 | 0.12 | 1.92 | 2.04 | (0.11) | $8.46 | 31.48% | 1.03% | 1.12% | 1.64% | 1.55% | 51% | $508,757 | ||
| 2012 | $5.80 | 0.10 | 0.74 | 0.84 | (0.11) | $6.53 | 14.58% | 1.09% | 1.13% | 1.59% | 1.55% | 47% | $408,104 | ||
| 2011 | $5.86 | 0.09 | (0.04) | 0.05 | (0.11) | $5.80 | 0.86% | 1.13% | 1.13% | 1.59% | 1.59% | 67% | $383,192 | ||
| Notes to Financial Highlights |
| (1) | Computed using average shares outstanding throughout the period. |
| (2) | Total returns are calculated based on the net asset value of the last business day. Total returns for periods less than one year are not annualized. |
See Notes to Financial Statements.
22
| Report of Independent Registered Public Accounting Firm |
To the Board of Directors and Shareholders of American Century Variable Portfolios, Inc.:
We have audited the accompanying statement of assets and liabilities, including the schedule of investments, of VP Value Fund (the “Fund”), one of the funds constituting American Century Variable Portfolios, Inc., as of December 31, 2015, and the related statement of operations for the year then ended, the statements of changes in net assets for each of the two years in the period then ended, and the financial highlights for each of the periods presented. These financial statements and financial highlights are the responsibility of the Fund’s management. Our responsibility is to express an opinion on these financial statements and financial highlights based on our audits.
We conducted our audits in accordance with the standards of the Public Company Accounting Oversight Board (United States). Those standards require that we plan and perform the audit to obtain reasonable assurance about whether the financial statements and financial highlights are free of material misstatement. The Fund is not required to have, nor were we engaged to perform, an audit of its internal control over financial reporting. Our audits included consideration of internal control over financial reporting as a basis for designing audit procedures that are appropriate in the circumstances, but not for the purpose of expressing an opinion on the effectiveness of the Fund’s internal control over financial reporting. Accordingly, we express no such opinion. An audit also includes examining, on a test basis, evidence supporting the amounts and disclosures in the financial statements, assessing the accounting principles used and significant estimates made by management, as well as evaluating the overall financial statement presentation. Our procedures included confirmation of securities owned as of December 31, 2015, by correspondence with the custodian and brokers; when replies were not received from brokers, we performed other auditing procedures. We believe that our audits provide a reasonable basis for our opinion.
In our opinion, the financial statements and financial highlights referred to above present fairly, in all material respects, the financial position of VP Value Fund of American Century Variable Portfolios, Inc. as of December 31, 2015, the results of its operations for the year then ended, the changes in its net assets for each of the two years in the period then ended, and the financial highlights for each of the periods presented, in conformity with accounting principles generally accepted in the United States of America.
DELOITTE & TOUCHE LLP
Kansas City, Missouri
February 11, 2016
23
| Management |
The Board of Directors
The individuals listed below serve as directors of the funds. Each director will continue to serve in this capacity until death, retirement, resignation or removal from office. The board has adopted a mandatory retirement age for directors who are not “interested persons,” as that term is defined in the Investment Company Act (independent directors). Independent directors shall retire by December 31 of the year in which they reach their 75th birthday.
Mr. Thomas is an “interested person” because he currently serves as President and Chief Executive Officer of American Century Companies, Inc. (ACC), the parent company of American Century Investment Management, Inc. (ACIM or the advisor). Mr. Fink is treated as an “interested person” because of his recent employment with ACC and American Century Services, LLC (ACS). The other directors (more than three-fourths of the total number) are independent. They are not employees, directors or officers of, and have no financial interest in, ACC or any of its wholly owned, direct or indirect, subsidiaries, including ACIM, American Century Investment Services, Inc. (ACIS) and ACS, and they do not have any other affiliations, positions or relationships that would cause them to be considered “interested persons” under the Investment Company Act. The directors serve in this capacity for seven (in the case of Mr. Thomas, 15) registered investment companies in the American Century Investments family of funds.
The following table presents additional information about the directors. The mailing address for each director is 4500 Main Street, Kansas City, Missouri 64111.
| Name (Year of Birth) | Position(s) Held with Funds | Length of Time Served | Principal Occupation(s) During Past 5 Years | Number of American Century Portfolios Overseen by Director | Other Directorships Held During Past 5 Years |
Independent Directors | |||||
| Andrea C. Hall (1945) | Director | Since 1997 | Retired | 80 | None |
| Jan M. Lewis (1957) | Director | Since 2011 | Retired; President and Chief Executive Officer, Catholic Charities of Northeast Kansas (human services organization) (2006 to 2013) | 80 | None |
| James A. Olson (1942) | Director and Chairman of the Board | Since 2007 (Chairman since 2014) | Member, Plaza Belmont LLC (private equity fund manager) | 80 | Saia, Inc. (2002 to 2012) and EPR Properties (2003 to 2013) |
| M. Jeannine Strandjord (1945) | Director | Since 1994 | Retired | 80 | Euronet Worldwide Inc.; MGP Ingredients, Inc.; Charming Shoppes, Inc. (2006 to 2010); and DST Systems Inc. (1996 to 2012) |
| John R. Whitten (1946) | Director | Since 2008 | Retired | 80 | Rudolph Technologies, Inc. |
24
Name (Year of Birth) | Position(s) Held with Funds | Length of Time Served | Principal Occupation(s) During Past 5 Years | Number of American Century Portfolios Overseen by Director | Other Directorships Held During Past 5 Years |
| Independent Directors | |||||
| Stephen E. Yates (1948) | Director | Since 2012 | Retired; Executive Vice President, Technology & Operations, KeyCorp. (computer services) (2004 to 2010) | 80 | Applied Industrial Technologies, Inc. (2001 to 2010) |
| Interested Directors | |||||
| Barry Fink (1955) | Director | Since 2012 | Retired; Executive Vice President, ACC (September 2007 to February 2013); President, ACS (October 2007 to February 2013); Chief Operating Officer, ACC (September 2007 to November 2012) | 80 | None |
| Jonathan S. Thomas (1963) | Director and President | Since 2007 | President and Chief Executive Officer, ACC (March 2007 to present). Also serves as Chief Executive Officer, ACS; Executive Vice President, ACIM; Director, ACC, ACIM and other ACC subsidiaries | 125 | BioMed Valley Discoveries, Inc. |
The Statement of Additional Information has additional information about the fund's directors and is available without charge, upon request, by calling 1-800-378-9878.
25
Officers
The following table presents certain information about the executive officers of the funds. Each officer serves as an officer for each of the 15 investment companies in the American Century family of funds, unless otherwise noted. No officer is compensated for his or her service as an officer of the funds. The listed officers are interested persons of the funds and are appointed or re-appointed on an annual basis. The mailing address for each officer listed below is 4500 Main Street, Kansas City, Missouri 64111.
Name (Year of Birth) | Offices with the Funds | Principal Occupation(s) During the Past Five Years |
| Jonathan S. Thomas (1963) | Director and President since 2007 | President and Chief Executive Officer, ACC (March 2007 to present). Also serves as Chief Executive Officer, ACS; Executive Vice President, ACIM; Director, ACC, ACIM and other ACC subsidiaries |
| Amy D. Shelton (1964) | Chief Compliance Officer and Vice President since 2014 | Chief Compliance Officer, American Century funds, (March 2014 to present); Chief Compliance Officer, ACIM (February 2014 to present); Chief Compliance Officer, ACIS (October 2009 to present); Vice President, Client Interactions and Marketing, ACIS (February 2013 to January 2014); Director, Client Interactions and Marketing, ACIS (June 2007 to January 2013). Also serves as Vice President, ACIS |
| Charles A. Etherington (1957) | General Counsel since 2007 and Senior Vice President since 2006 | Attorney, ACC (February 1994 to present); Vice President, ACC (November 2005 to present); General Counsel, ACC (March 2007 to present). Also serves as General Counsel, ACIM, ACS, ACIS and other ACC subsidiaries; and Senior Vice President, ACIM and ACS |
| C. Jean Wade (1964) | Vice President, Treasurer and Chief Financial Officer since 2012 | Vice President, ACS (February 2000 to present) |
| Robert J. Leach (1966) | Vice President since 2006 and Assistant Treasurer since 2012 | Vice President, ACS (February 2000 to present) |
| David H. Reinmiller (1963) | Vice President since 2000 | Attorney, ACC (January 1994 to present); Associate General Counsel, ACC (January 2001 to present). Also serves as Vice President, ACIM and ACS |
| Ward D. Stauffer (1960) | Secretary since 2005 | Attorney, ACC (June 2003 to present) |
26
| Additional Information |
Proxy Voting Policies
A description of the policies that the fund's investment advisor uses in exercising the voting rights associated with the securities purchased and/or held by the fund is available without charge, upon request, by calling 1-800-378-9878. It is also available on the "About Us" page of American Century Investments’ website at americancentury.com and on the Securities and Exchange Commission’s website at sec.gov. Information regarding how the investment advisor voted proxies relating to portfolio securities during the most recent 12-month period ended June 30 is available on the "About Us" page at americancentury.com. It is also available at sec.gov.
Quarterly Portfolio Disclosure
The fund files its complete schedule of portfolio holdings with the Securities and Exchange Commission (SEC) for the first and third quarters of each fiscal year on Form N-Q. The fund’s Forms N-Q are available on the SEC’s website at sec.gov, and may be reviewed and copied at the SEC’s Public Reference Room in Washington, DC. Information on the operation of the Public Reference Room may be obtained by calling 1-800-SEC-0330. The fund also makes its complete
schedule of portfolio holdings for the most recent quarter of its fiscal year available on its website at ipro.americancentury.com (for Investment Professionals) and, upon request, by calling 1-800-378-9878.
Other Tax Information
The following information is provided pursuant to provisions of the Internal Revenue Code.
For corporate taxpayers, the fund hereby designates $18,051,876, or up to the maximum amount allowable, of ordinary income distributions paid during the fiscal year ended December 31, 2015 as qualified for the corporate dividends received deduction.
27
| Notes |
28
| ||
| Contact Us | americancentury.com | |
| Automated Information Line | 1-800-345-8765 | |
| Investment Professional Service Representatives | 1-800-345-6488 | |
| Telecommunications Relay Service for the Deaf | 711 | |
| American Century Variable Portfolios, Inc. | ||
Investment Advisor: American Century Investment Management, Inc. Kansas City, Missouri | ||
| This report and the statements it contains are submitted for the general information of our shareholders. The report is not authorized for distribution to prospective investors unless preceded or accompanied by an effective prospectus. | ||
| ©2016 American Century Proprietary Holdings, Inc. All rights reserved. CL-ANN-88143 1602 | ||
ITEM 2. CODE OF ETHICS.
| (a) | The registrant has adopted a Code of Ethics for Senior Financial Officers that applies to the registrant’s principal executive officer, principal financial officer, principal accounting officer, and persons performing similar functions. |
| (b) | No response required. |
| (c) | None. |
| (d) | None. |
| (e) | Not applicable. |
| (f) | The registrant’s Code of Ethics for Senior Financial Officers was filed as Exhibit 12 (a)(1) to American Century Asset Allocation Portfolios, Inc.’s Annual Certified Shareholder Report on Form N-CSR, File No. 811-21591, on September 29, 2005, and is incorporated herein by reference. |
ITEM 3. AUDIT COMMITTEE FINANCIAL EXPERT.
| (a)(1) | The registrant’s board has determined that the registrant has at least one audit committee financial expert serving on its audit committee. |
| (a)(2) | M. Jeannine Strandjord, Stephen E. Yates and John R. Whitten are the registrant’s designated audit committee financial experts. They are “independent” as defined in Item 3 of Form N-CSR. |
| (a)(3) | Not applicable. |
| (b) | No response required. |
| (c) | No response required. |
| (d) | No response required. |
ITEM 4. PRINCIPAL ACCOUNTANT FEES AND SERVICES.
| (a) | Audit Fees. |
The aggregate fees billed for each of the last two fiscal years for professional services rendered by the principal accountant for the audit of the registrant’s annual financial statements or services that are normally provided by the accountant in connection with statutory and regulatory filings or engagements for those fiscal years were as follows:
FY 2014: $194,700
FY 2015: $199,183
| (b) | Audit-Related Fees. |
The aggregate fees billed in each of the last two fiscal years for assurance and related services by the principal accountant that are reasonably related to the performance of the audit of the registrant’s financial statements and are not reported under paragraph (a) of this Item were as follows:
For services rendered to the registrant:
FY 2014: $0
FY 2015: $0
Fees required to be approved pursuant to paragraph (c)(7)(ii) of Rule 2-01 of Regulation S-X (relating to certain engagements for non-audit services with the registrant’s investment adviser and its affiliates):
FY 2014: $0
FY 2015: $0
| (c) | Tax Fees. |
The aggregate fees billed in each of the last two fiscal years for professional services rendered by the principal accountant for tax compliance, tax advice, and tax planning were as follows:
For services rendered to the registrant:
FY 2014: $0
FY 2015: $0
Fees required to be approved pursuant to paragraph (c)(7)(ii) of Rule 2-01 of Regulation S-X (relating to certain engagements for non-audit services with the registrant’s investment adviser and its affiliates):
FY 2014: $0
FY 2015: $0
| (d) | All Other Fees. |
The aggregate fees billed in each of the last two fiscal years for products and services provided by the principal accountant, other than the services reported in paragraphs (a) through (c) of this Item were as follows:
For services rendered to the registrant:
FY 2014: $0
FY 2015: $0
Fees required to be approved pursuant to paragraph (c)(7)(ii) of Rule 2-01 of Regulation S-X (relating to certain engagements for non-audit services with the registrant’s investment adviser and its affiliates):
FY 2014: $0
FY 2015: $0
| (e)(1) | In accordance with paragraph (c)(7)(i)(A) of Rule 2-01 of Regulation S-X, before the accountant is engaged by the registrant to render audit or non-audit services, the engagement is approved by the registrant’s audit committee. Pursuant to paragraph (c)(7)(ii) of Rule 2-01 of Regulation S-X, the registrant’s audit committee also pre-approves its accountant’s engagements for non-audit services with the registrant’s investment adviser, its parent company, and any entity controlled by, or under common control with the investment adviser that provides ongoing services to the registrant, if the engagement relates directly to the operations and financial reporting of the registrant. |
| (e)(2) | All services described in each of paragraphs (b) through (d) of this Item were pre-approved before the engagement by the registrant’s audit committee pursuant to paragraph (c)(7)(i)(A) of Rule 2-01 of Regulation S-X. Consequently, none of such services were required to be approved by the audit committee pursuant to paragraph (c)(7)(i)(C). |
| (f) | The percentage of hours expended on the principal accountant’s engagement to audit the registrant’s financial statements for the most recent fiscal year that were attributed to work performed by persons other than the principal accountant’s full-time, permanent employees was less than 50%. |
| (g) | The aggregate non-audit fees billed by the registrant’s accountant for services rendered to the registrant, and rendered to the registrant’s investment adviser (not including any sub-adviser whose role is primarily portfolio management and is subcontracted with or overseen by another investment adviser), and any entity controlling, controlled by, or under common control with the adviser that provides ongoing services to the registrant for each of the last two fiscal years of the registrant were as follows: |
FY 2014: $91,808
FY 2015: $86,000
| (h) | The registrant’s investment adviser and accountant have notified the registrant’s audit committee of all non-audit services that were rendered by the registrant’s accountant to the registrant’s investment adviser, its parent company, and any entity controlled by, or under common control with the investment adviser that provides services to the registrant, which services were not required to be pre-approved pursuant to paragraph (c)(7)(ii) of Rule 2-01 of Regulation S-X. The notification provided to the registrant’s audit committee included sufficient details regarding such services to allow the registrant’s audit committee to consider the continuing independence of its principal accountant. |
ITEM 5. AUDIT COMMITTEE OF LISTED REGISTRANTS.
Not applicable.
ITEM 6. INVESTMENTS.
| (a) | The schedule of investments is included as part of the report to stockholders filed under Item 1 of this Form. |
| (b) | Not applicable. |
ITEM 7. DISCLOSURE OF PROXY VOTING POLICIES AND PROCEDURES FOR CLOSED-END MANAGEMENT INVESTMENT COMPANIES.
Not applicable.
ITEM 8. PORTFOLIO MANAGERS OF CLOSED-END MANAGEMENT INVESTMENT COMPANIES.
Not applicable.
ITEM 9. PURCHASES OF EQUITY SECURITIES BY CLOSED-END MANAGEMENT INVESTMENT COMPANY AND AFFILIATED PURCHASERS.
Not applicable.
ITEM 10. SUBMISSION OF MATTERS TO A VOTE OF SECURITY HOLDERS.
During the reporting period, there were no material changes to the procedures by which shareholders may recommend nominees to the registrant’s board.
ITEM 11. CONTROLS AND PROCEDURES.
| (a) | The registrant's principal executive officer and principal financial officer have concluded that the registrant's disclosure controls and procedures (as defined in Rule 30a-3(c) under the Investment Company Act of 1940) are effective based on their evaluation of these controls and procedures as of a date within 90 days of the filing date of this report. |
| (b) | There were no changes in the registrant's internal control over financial reporting (as defined in Rule 30a-3(d) under the Investment Company Act of 1940) that occurred during the registrant's second fiscal quarter of the period covered by this report that have materially affected, or are reasonably likely to materially affect, the registrant's internal control over financial reporting. |
ITEM 12. EXHIBITS.
| (a)(1) | Registrant’s Code of Ethics for Senior Financial Officers, which is the subject of the disclosure required by Item 2 of Form N-CSR, was filed as Exhibit 12(a)(1) to American Century Asset Allocation Portfolios, Inc.’s Certified Shareholder Report on Form N-CSR, File No. 811-21591, on September 29, 2005. |
| (a)(2) | Separate certifications by the registrant’s principal executive officer and principal financial officer, pursuant to Section 302 of the Sarbanes-Oxley Act of 2002 and Rule 30a-2(a) under the Investment Company Act of 1940, are filed and attached hereto as EX-99.CERT. |
| (a)(3) | Not applicable. |
| (b) | A certification by the registrant’s chief executive officer and chief financial officer, pursuant to Section 906 of the Sarbanes-Oxley Act of 2002, is furnished and attached hereto as EX-99.906CERT. |
SIGNATURES
Pursuant to the requirements of the Securities Exchange Act of 1934 and the Investment Company Act of 1940, the registrant has duly caused this report to be signed on its behalf by the undersigned, thereunto duly authorized.
| Registrant: | American Century Variable Portfolios, Inc. | |||
| By: | /s/ Jonathan S. Thomas | |||
| Name: | Jonathan S. Thomas | |||
| Title: | President | |||
| Date: | February 23, 2016 | |||
Pursuant to the requirements of the Securities Exchange Act of 1934 and the Investment Company Act of 1940, this report has been signed below by the following persons on behalf of the registrant and in the capacities and on the dates indicated.
| By: | /s/ Jonathan S. Thomas | ||
| Name: | Jonathan S. Thomas | ||
| Title: | President | ||
| (principal executive officer) | |||
| Date: | February 23, 2016 | ||
| By: | /s/ C. Jean Wade | ||
| Name: | C. Jean Wade | ||
| Title: | Vice President, Treasurer, and | ||
| Chief Financial Officer | |||
| (principal financial officer) | |||
| Date: | February 23, 2016 | ||