UNITED STATES
SECURITIES AND EXCHANGE COMMISSION
Washington, D.C. 20549
FORM N-CSR
CERTIFIED SHAREHOLDER REPORT OF REGISTERED
MANAGEMENT INVESTMENT COMPANIES
|
| | | | | | |
| Investment Company Act file number | 811-05188 |
| | |
| AMERICAN CENTURY VARIABLE PORTFOLIOS, INC. |
| (Exact name of registrant as specified in charter) |
| | |
| 4500 MAIN STREET, KANSAS CITY, MISSOURI | 64111 |
| (Address of principal executive offices) | (Zip Code) |
| | |
CHARLES A. ETHERINGTON 4500 MAIN STREET, KANSAS CITY, MISSOURI 64111 |
| (Name and address of agent for service) |
| | |
| Registrant’s telephone number, including area code: | 816-531-5575 |
| | |
| Date of fiscal year end: | 12-31 |
| | |
| Date of reporting period: | 12-31-2016 |
ITEM 1. REPORTS TO STOCKHOLDERS.
|
| |
| | |
| | Annual Report |
| | |
| | December 31, 2016 |
| | |
| | VP Balanced Fund |
|
| | |
| Performance | 2 |
|
| Portfolio Commentary | |
|
| Fund Characteristics | |
|
| Shareholder Fee Example | |
|
| Schedule of Investments | |
|
| Statement of Assets and Liabilities | |
|
| Statement of Operations | |
|
| Statement of Changes in Net Assets | |
|
| Notes to Financial Statements | |
|
| Financial Highlights | |
|
| Report of Independent Registered Public Accounting Firm | |
|
| Management | |
|
| Additional Information | |
|
Any opinions expressed in this report reflect those of the author as of the date of the report, and do not necessarily represent the opinions of American Century Investments® or any other person in the American Century Investments organization. Any such opinions are subject to change at any time based upon market or other conditions and American Century Investments disclaims any responsibility to update such opinions. These opinions may not be relied upon as investment advice and, because investment decisions made by American Century Investments funds are based on numerous factors, may not be relied upon as an indication of trading intent on behalf of any American Century Investments fund. Security examples are used for representational purposes only and are not intended as recommendations to purchase or sell securities. Performance information for comparative indices and securities is provided to American Century Investments by third party vendors. To the best of American Century Investments’ knowledge, such information is accurate at the time of printing.
|
| | | | | | |
| Total Returns as of December 31, 2016 |
| | | | Average Annual Returns | |
| | Ticker Symbol | 1 year | 5 years | 10 years | Since Inception | Inception Date |
| Class I | AVBIX | 6.99% | 8.49% | 5.49% | — | 5/1/91 |
| Blended Index | — | 8.31% | 9.69% | 6.21% | — | — |
| S&P 500 Index | — | 11.96% | 14.64% | 6.94% | — | — |
| Bloomberg Barclays U.S. Aggregate Bond Index | — | 2.65% | 2.23% | 4.34% | — | — |
| Class II | AVBTX | — | — | — | 4.67% | 5/2/16 |
Average annual returns since inception are presented when ten years of performance history is not available.
Fund returns would have been lower if a portion of the fees had not been waived. The blended index combines monthly returns of two widely known indices in proportion to the asset mix of the fund. The S&P 500 Index represents 60% of the index and the remaining 40% is represented by the Bloomberg Barclays U.S. Aggregate Bond Index.
The performance information presented does not include charges and deductions imposed by the insurance company separate account under the variable annuity or variable life insurance contracts. The inclusion of such charges could significantly lower performance. Please refer to the insurance company separate account prospectus for a discussion of the charges related to insurance contracts.
Data presented reflect past performance. Past performance is no guarantee of future results. Current performance may be higher or lower than the performance shown. Total returns for periods less than one year are not annualized. Investment return and principal value will fluctuate, and redemption value may be more or less than original cost. Data assumes reinvestment of dividends and capital gains, and none of the charts reflect the deduction of taxes that a shareholder would pay on fund distributions or the redemption of fund shares. To obtain performance data current to the most recent month end, please call 1-800-345-6488 or visit ipro.americancentury.com (for Investment Professionals). For additional information about the fund, please consult the prospectus.
|
|
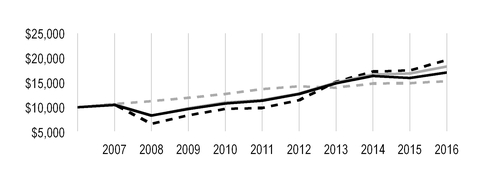
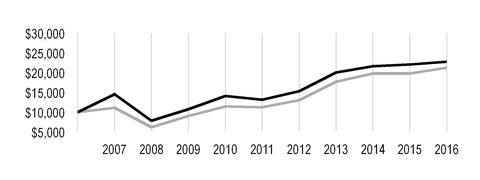
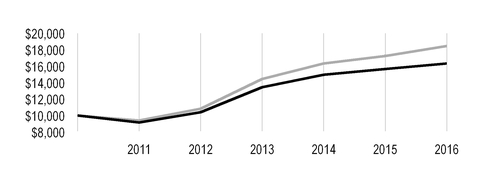
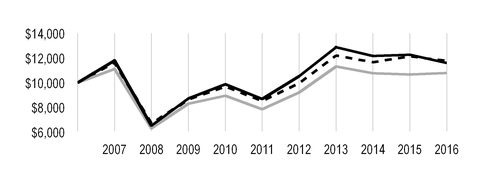
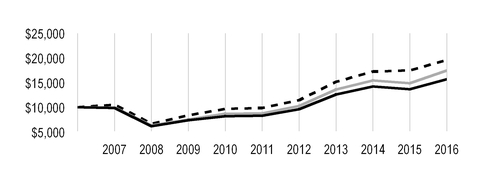
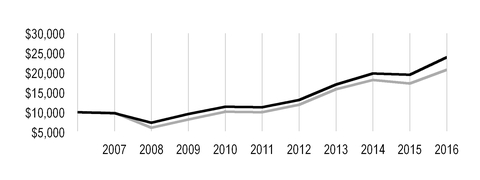
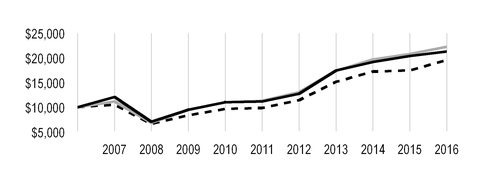
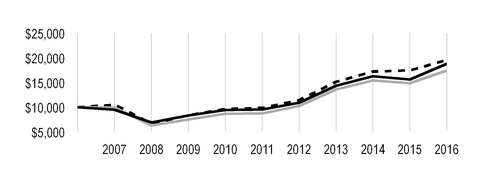
| Growth of $10,000 Over 10 Years |
| $10,000 investment made December 31, 2006 |
| Performance for other share classes will vary due to differences in fee structure. |
|
| |
| Value on December 31, 2016 |
| | Class I — $17,066 |
| |
| | Blended Index — $18,268 |
| |
| | S&P 500 Index — $19,572 |
| |
| | Bloomberg Barclays U.S. Aggregate Bond Index — $15,300 |
| |
Ending value of Class I would have been lower if a portion of the fees had not been waived.
|
| |
| Total Annual Fund Operating Expenses |
| Class I | Class II |
| 0.91% | 1.16% |
The total annual fund operating expenses shown is as stated in the fund’s prospectus current as of the date of this report. The prospectus may vary from the expense ratio shown elsewhere in this report because it is based on a different time period, includes acquired fund fees and expenses, and, if applicable, does not include fee waivers or expense reimbursements.
Data presented reflect past performance. Past performance is no guarantee of future results. Current performance may be higher or lower than the performance shown. Total returns for periods less than one year are not annualized. Investment return and principal value will fluctuate, and redemption value may be more or less than original cost. Data assumes reinvestment of dividends and capital gains, and none of the charts reflect the deduction of taxes that a shareholder would pay on fund distributions or the redemption of fund shares. To obtain performance data current to the most recent month end, please call 1-800-345-6488 or visit ipro.americancentury.com (for Investment Professionals). For additional information about the fund, please consult the prospectus.
Equity Portfolio Managers: Claudia Musat and Steven Rossi
Fixed-Income Portfolio Managers: Dave MacEwen, Bob Gahagan, and Brian Howell
In May 2016, portfolio manager Bill Martin left the fund's management team, as an equity portfolio manager. In November 2016, Steven Rossi joined the fund's management team, as an equity portfolio manager.
Performance Summary
VP Balanced returned 6.99%* for the fiscal year ended December 31, 2016. By comparison, the fund’s benchmark (a blended index consisting of 60% S&P 500 Index and 40% Bloomberg Barclays U.S. Aggregate Bond Index) returned 8.31%. The equity portion of VP Balanced underperformed its benchmark, while the fixed-income component slightly outperformed the broad bond market (11.96% return of the S&P 500 Index, and 2.65% return of the Bloomberg Barclays U.S. Aggregate Bond Index).
Energy Stocks Leading Equity Detractors
Investments in the energy sector were a main driver of underperformance, particularly choices among oil, gas, and consumable fuels holdings. Leading detractors included CVR Energy, a portfolio-only investment, which fell on overall sector declines as the price of oil trended downward during the first three months of the fiscal year. The petroleum refiner and nitrogen fertilizer manufacturer’s stock price came under further pressure following a larger-than-predicted loss in the fourth-quarter of 2015, which was reported in 2016’s first quarter. An overweight position, relative to the benchmark, in Tesoro, another oil refiner, also weighed on sector results. The company’s low refining margins, which were attributed to unplanned downtime at its Los Angeles refinery, led to a fourth-quarter 2015 earnings miss, which was reported in January 2016. We eliminated our holding of CVR Energy as it no longer met the fund’s investment criteria. We also no longer hold Tesoro as its growth and quality scores declined significantly.
Financials holdings also pressured relative gains. Our underweight in banks was the key factor driving underperformance in the sector. For example, the portfolio was underweight Bank of America and JPMorgan Chase. The results of November’s presidential election caused bank stocks to soar, reflecting the sharp post-election rise in interest rates and Trump’s vow to deregulate banking and cut taxes. Our positioning is justified given that the growth, quality, and sentiment profile of both companies remains weak.
The real estate sector was also an area of relative weakness, especially positioning in real estate management and development companies. Our portfolio-only allocation to commercial real estate services firm Jones Lang LaSalle was a leading detractor. Concerns that the commercial real estate business is near another peak weighed on the shares. In addition, the company’s earnings for 2015’s fourth quarter fell short of expectations, largely due to foreign currency headwinds, as more than half the company’s revenues are sourced outside the U.S. We subsequently exited the position as the company’s growth, sentiment, and quality factors weakened considerably.
Information Technology Stocks Led Relative Equity Contributors
The leading contribution to relative results came from the information technology sector, thanks to positioning in the semiconductor industry and stock selection among software and IT services
*All fund returns referenced in this commentary are for Class I shares. Fund returns would have been lower if a portion of the fees had not been waived. Performance for other share classes will vary due to differences in fee structure; when Class I performance exceeds that of the fund's benchmark, other share classes may not. See page 2 for returns for all share classes.
firms. An overweight position in Applied Materials benefited results. The semiconductor maker beat earnings-per-share estimates in its second and third fiscal quarters. Management also provided an upbeat outlook. A portfolio-only position in VMware, a provider of virtualization infrastructure solutions, also added value. The shares rallied after the company’s earnings and revenues repeatedly exceeded analyst estimates. Management also raised its full-year guidance. We continue to favor both stocks based on their attractive measures across all profiles.
Investments in the materials sector also benefited relative performance. In metals and mining, Newmont Mining was a top contributor. The gold and silver miner benefited from rising precious metals prices. We maintain our positioning in Newmont due to its strong quality, sentiment, and growth scores.
Strong stock selection in consumer discretionary also aided results, particularly among specialty retailers. An overweight in consumer electronics chain Best Buy was a leading contributor. The shares rallied strongly in August and November driven by better-than-forecast earnings and revenues in its second and third fiscal quarters. Management’s earnings guidance throughout the year was also positive. We maintain our position in Best Buy based on its strong scores across all profiles.
Fixed-Income Portion Advanced
In fixed income, 2016 provided a favorable environment for U.S. bonds for the first nine months, starting with the stock and oil market volatility during the first six weeks of the year and extending after Brexit (the U.K.’s vote to leave the European Union). Expectations that the Federal Reserve (the Fed) would follow its interest rate hike in December 2015 with more rate hikes in 2016 were quickly replaced with uncertainty about when the Fed would move again. Meanwhile, other major central banks in Europe and Japan continued to apply monetary stimulus to their stagnant economies, pushing their interest rates into negative territory and keeping an effective lid on global rates. The resulting very low non-U.S. yields drove demand for relatively higher U.S. yields, boosting U.S. bond performance for much of the year. That began to change in October, as Fed rate hike expectations returned on signs of global economic stabilization and as the U.S. exhibited signs of stronger growth and higher inflation. U.S. government bonds later sold off sharply following the election of Donald Trump, whose policy proposals further raised growth and inflation expectations, but the sell-off wasn’t enough to completely erase earlier U.S. bond index gains for the year. The fixed income portfolio largely tracked its benchmark index, and benefited in particular from a non-index overweight in BB-rated corporate bonds, which outperformed the broad market.
Outlook
Growth expectations have improved in the U.S., the U.K., and the eurozone, which has been reflected in recent market performance. However, post-election risks remain. The U.K.’s exit from the European Union has been delayed and most of Trump’s proposals are still being processed and debated. How they, and other changes from populist movements, actually play out remains to be seen. It is possible that increased government spending and tax cuts in an economy that already features a tightening labor market and significant monetary stimulus could push growth higher. The global impact of a stronger dollar and higher tariffs could offset other U.S. economic benefits from Trump’s proposals. The prospect of rising interest rates also creates economic risks. Higher rates could impact consumer and corporate borrowing and spending behavior. For example, there are signs the housing market may have peaked for this cycle. We believe that our disciplined, objective, and systematic investment strategy, for both the equity and fixed-income components of the portfolio, is particularly beneficial during periods of volatility. We adhere to our process regardless of the market environment, allowing us to take advantage of opportunities presented by market inefficiencies.
|
| |
| DECEMBER 31, 2016 |
| Top Ten Common Stocks | % of net assets |
| Apple, Inc. | 2.0% |
| Alphabet, Inc., Class A | 2.0% |
| Microsoft Corp. | 1.9% |
| Amazon.com, Inc. | 1.4% |
| Facebook, Inc., Class A | 1.2% |
| Citigroup, Inc. | 1.1% |
| Exxon Mobil Corp. | 1.1% |
| Intel Corp. | 1.0% |
| PepsiCo, Inc. | 1.0% |
| Merck & Co., Inc. | 1.0% |
| | |
| Top Five Common Stocks Industries | % of net assets |
| Software | 3.8% |
| Internet Software and Services | 3.2% |
| Biotechnology | 3.1% |
| Semiconductors and Semiconductor Equipment | 2.9% |
| Health Care Equipment and Supplies | 2.8% |
| | |
| Key Fixed-Income Portfolio Statistics |
| Average Duration (effective) | 5.9 years |
| Weighted Average Life | 7.9 years |
| | |
| Types of Investments in Portfolio | % of net assets |
| Common Stocks | 58.3% |
| Exchange-Traded Funds | 0.6% |
| Total Equity Exposure | 58.9% |
| U.S. Treasury Securities | 14.1% |
| Corporate Bonds | 12.2% |
| U.S. Government Agency Mortgage-Backed Securities | 10.3% |
| Collateralized Mortgage Obligations | 1.9% |
| Commercial Mortgage-Backed Securities | 1.8% |
| Asset-Backed Securities | 1.3% |
| U.S. Government Agency Securities | 0.5% |
| Municipal Securities | 0.5% |
| Sovereign Governments and Agencies | 0.5% |
| Temporary Cash Investments | 3.0% |
| Other Assets and Liabilities | (5.0)%* |
*Amount relates primarily to payable for investments purchased, but not settled, at period end.
Fund shareholders may incur two types of costs: (1) transaction costs, including sales charges (loads) on purchase payments and redemption/exchange fees; and (2) ongoing costs, including management fees; distribution and service (12b-1) fees; and other fund expenses. This example is intended to help you understand your ongoing costs (in dollars) of investing in your fund and to compare these costs with the ongoing cost of investing in other mutual funds.
The example is based on an investment of $1,000 made at the beginning of the period and held for the entire period from July 1, 2016 to December 31, 2016.
Actual Expenses
The table provides information about actual account values and actual expenses for each class. You may use the information, together with the amount you invested, to estimate the expenses that you paid over the period. First, identify the share class you own. Then simply divide your account value by $1,000 (for example, an $8,600 account value divided by $1,000 = 8.6), then multiply the result by the number under the heading “Expenses Paid During Period” to estimate the expenses you paid on your account during this period.
Hypothetical Example for Comparison Purposes
The table also provides information about hypothetical account values and hypothetical expenses based on the actual expense ratio of each class of your fund and an assumed rate of return of 5% per year before expenses, which is not the actual return of a fund’s share class. The hypothetical account values and expenses may not be used to estimate the actual ending account balance or expenses you paid for the period. You may use this information to compare the ongoing costs of investing in your fund and other funds. To do so, compare this 5% hypothetical example with the 5% hypothetical examples that appear in the shareholder reports of the other funds.
Please note that the expenses shown in the table are meant to highlight your ongoing costs only and do not reflect any transactional costs, such as sales charges (loads) or redemption/exchange fees. Therefore, the table is useful in comparing ongoing costs only, and will not help you determine the relative total costs of owning different funds. In addition, if these transactional costs were included, your costs would have been higher.
|
| | | | |
| | Beginning
Account Value
7/1/16 | Ending
Account Value
12/31/16 | Expenses Paid
During Period(1)
7/1/16 - 12/31/16 | Annualized
Expense Ratio(1) |
| Actual |
| Class I (after waiver) | $1,000 | $1,038.00 | $4.15 | 0.81% |
| Class I (before waiver) | $1,000 | $1,038.00(2) | $4.61 | 0.90% |
| Class II (after waiver) | $1,000 | $1,036.70 | $5.43 | 1.06% |
| Class II (before waiver) | $1,000 | $1,036.70(2) | $5.89 | 1.15% |
| Hypothetical | | | | |
| Class I (after waiver) | $1,000 | $1,021.06 | $4.12 | 0.81% |
| Class I (before waiver) | $1,000 | $1,020.61 | $4.57 | 0.90% |
| Class II (after waiver) | $1,000 | $1,019.81 | $5.38 | 1.06% |
| Class II (before waiver) | $1,000 | $1,019.36 | $5.84 | 1.15% |
| |
| (1) | Expenses are equal to the class's annualized expense ratio listed in the table above, multiplied by the average account value over the period, multiplied by 184, the number of days in the most recent fiscal half-year, divided by 366, to reflect the one-half year period. |
| |
| (2) | Ending account value assumes the return earned after waiver and would have been lower if a portion of the fees had not been waived. |
DECEMBER 31, 2016
|
| | | | | | | |
| | | Shares/
Principal Amount | Value |
| COMMON STOCKS — 58.3% | | | |
| Aerospace and Defense — 1.5% | | | |
| Boeing Co. (The) | | 6,881 |
| $ | 1,071,234 |
|
| United Technologies Corp. | | 8,727 |
| 956,654 |
|
| | | | 2,027,888 |
|
| Airlines — 1.2% | | | |
Hawaiian Holdings, Inc.(1) | | 5,706 |
| 325,242 |
|
JetBlue Airways Corp.(1) | | 22,998 |
| 515,615 |
|
United Continental Holdings, Inc.(1) | | 11,552 |
| 841,910 |
|
| | | | 1,682,767 |
|
| Auto Components — 0.6% | | | |
| LCI Industries | | 633 |
| 68,206 |
|
| Lear Corp. | | 5,330 |
| 705,532 |
|
| | | | 773,738 |
|
| Automobiles — 0.4% | | | |
| Ford Motor Co. | | 50,169 |
| 608,550 |
|
| Banks — 2.5% | | | |
| Bank of America Corp. | | 10,775 |
| 238,128 |
|
| BB&T Corp. | | 16,866 |
| 793,039 |
|
| Citigroup, Inc. | | 25,594 |
| 1,521,051 |
|
| East West Bancorp, Inc. | | 916 |
| 46,560 |
|
| JPMorgan Chase & Co. | | 5,815 |
| 501,776 |
|
| Wells Fargo & Co. | | 5,859 |
| 322,890 |
|
| | | | 3,423,444 |
|
| Beverages — 1.0% | | | |
| Coca-Cola Co. (The) | | 1,794 |
| 74,379 |
|
| PepsiCo, Inc. | | 12,968 |
| 1,356,842 |
|
| | | | 1,431,221 |
|
| Biotechnology — 3.1% | | | |
| AbbVie, Inc. | | 17,351 |
| 1,086,520 |
|
| Amgen, Inc. | | 8,064 |
| 1,179,037 |
|
Biogen, Inc.(1) | | 3,322 |
| 942,053 |
|
Celgene Corp.(1) | | 3,703 |
| 428,622 |
|
| Gilead Sciences, Inc. | | 8,640 |
| 618,710 |
|
| | | | 4,254,942 |
|
| Building Products — 0.7% | | | |
| Owens Corning | | 14,371 |
| 740,969 |
|
USG Corp.(1) | | 8,398 |
| 242,534 |
|
| | | | 983,503 |
|
| Capital Markets — 1.8% | | | |
| Eaton Vance Corp. | | 14,050 |
| 588,414 |
|
| Evercore Partners, Inc., Class A | | 4,265 |
| 293,006 |
|
| Franklin Resources, Inc. | | 9,254 |
| 366,273 |
|
|
| | | | | | | |
| | | Shares/
Principal Amount | Value |
| Goldman Sachs Group, Inc. (The) | | 4,544 |
| $ | 1,088,061 |
|
| State Street Corp. | | 2,893 |
| 224,844 |
|
| | | | 2,560,598 |
|
| Chemicals — 2.0% | | | |
| Air Products & Chemicals, Inc. | | 6,037 |
| 868,241 |
|
| Cabot Corp. | | 13,129 |
| 663,540 |
|
| Celanese Corp. | | 1,533 |
| 120,709 |
|
| Dow Chemical Co. (The) | | 12,941 |
| 740,484 |
|
| E.I. du Pont de Nemours & Co. | | 3,751 |
| 275,323 |
|
| Monsanto Co. | | 1,170 |
| 123,096 |
|
| | | | 2,791,393 |
|
| Communications Equipment — 0.5% | | | |
| Cisco Systems, Inc. | | 24,292 |
| 734,104 |
|
| Construction and Engineering — 0.1% | | | |
AECOM(1) | | 4,466 |
| 162,384 |
|
| Diversified Financial Services — 0.4% | | | |
Berkshire Hathaway, Inc., Class B(1) | | 3,422 |
| 557,718 |
|
| Diversified Telecommunication Services — 0.6% | | | |
| AT&T, Inc. | | 14,707 |
| 625,489 |
|
| Verizon Communications, Inc. | | 4,614 |
| 246,295 |
|
| | | | 871,784 |
|
| Electric Utilities — 0.3% | | | |
| PPL Corp. | | 11,407 |
| 388,408 |
|
| Electrical Equipment — 0.4% | | | |
| Eaton Corp. plc | | 7,892 |
| 529,474 |
|
| Energy Equipment and Services — 1.4% | | | |
| Baker Hughes, Inc. | | 11,488 |
| 746,375 |
|
Dril-Quip, Inc.(1) | | 5,681 |
| 341,144 |
|
FMC Technologies, Inc.(1) | | 22,120 |
| 785,924 |
|
| Rowan Cos. plc | | 4,811 |
| 90,880 |
|
| | | | 1,964,323 |
|
| Equity Real Estate Investment Trusts (REITs) — 0.9% | | | |
| American Tower Corp. | | 7,575 |
| 800,526 |
|
| Lamar Advertising Co., Class A | | 1,051 |
| 70,669 |
|
| WP Carey, Inc. | | 5,521 |
| 326,236 |
|
| | | | 1,197,431 |
|
| Food and Staples Retailing — 1.2% | | | |
| CVS Health Corp. | | 3,854 |
| 304,119 |
|
| Wal-Mart Stores, Inc. | | 16,581 |
| 1,146,079 |
|
| Walgreens Boots Alliance, Inc. | | 1,829 |
| 151,368 |
|
| | | | 1,601,566 |
|
| Food Products — 1.5% | | | |
| General Mills, Inc. | | 2,055 |
| 126,937 |
|
| Hormel Foods Corp. | | 18,851 |
| 656,203 |
|
| Ingredion, Inc. | | 4,533 |
| 566,444 |
|
| J.M. Smucker Co. (The) | | 562 |
| 71,970 |
|
|
| | | | | | | |
| | | Shares/
Principal Amount | Value |
| Tyson Foods, Inc., Class A | | 11,217 |
| $ | 691,865 |
|
| | | | 2,113,419 |
|
| Gas Utilities — 0.4% | | | |
| ONE Gas, Inc. | | 4,098 |
| 262,108 |
|
| Southwest Gas Corp. | | 2,984 |
| 228,634 |
|
| | | | 490,742 |
|
| Health Care Equipment and Supplies — 2.8% | | | |
| Becton Dickinson and Co. | | 4,511 |
| 746,796 |
|
Boston Scientific Corp.(1) | | 19,487 |
| 421,504 |
|
| C.R. Bard, Inc. | | 1,606 |
| 360,804 |
|
| Danaher Corp. | | 8,801 |
| 685,070 |
|
Hologic, Inc.(1) | | 6,712 |
| 269,285 |
|
| Medtronic plc | | 14,108 |
| 1,004,913 |
|
| Zimmer Biomet Holdings, Inc. | | 4,224 |
| 435,917 |
|
| | | | 3,924,289 |
|
| Health Care Providers and Services — 0.8% | | | |
| UnitedHealth Group, Inc. | | 7,111 |
| 1,138,044 |
|
| Health Care Technology — 0.3% | | | |
Cerner Corp.(1) | | 9,381 |
| 444,378 |
|
| Hotels, Restaurants and Leisure — 0.9% | | | |
| Carnival Corp. | | 7,229 |
| 376,342 |
|
| Darden Restaurants, Inc. | | 10,992 |
| 799,338 |
|
| | | | 1,175,680 |
|
| Household Products — 2.1% | | | |
| Church & Dwight Co., Inc. | | 10,074 |
| 445,170 |
|
| Kimberly-Clark Corp. | | 6,509 |
| 742,807 |
|
| Procter & Gamble Co. (The) | | 15,726 |
| 1,322,242 |
|
| Spectrum Brands Holdings, Inc. | | 3,876 |
| 474,151 |
|
| | | | 2,984,370 |
|
| Industrial Conglomerates — 1.4% | | | |
| 3M Co. | | 4,194 |
| 748,923 |
|
| Carlisle Cos., Inc. | | 6,115 |
| 674,423 |
|
| General Electric Co. | | 17,877 |
| 564,913 |
|
| | | | 1,988,259 |
|
| Insurance — 2.0% | | | |
| Aflac, Inc. | | 10,303 |
| 717,089 |
|
| Allied World Assurance Co. Holdings AG | | 1,301 |
| 69,877 |
|
| Aon plc | | 966 |
| 107,738 |
|
| Aspen Insurance Holdings Ltd. | | 1,181 |
| 64,955 |
|
| Everest Re Group Ltd. | | 747 |
| 161,651 |
|
| MetLife, Inc. | | 4,259 |
| 229,518 |
|
| Primerica, Inc. | | 2,043 |
| 141,273 |
|
| Principal Financial Group, Inc. | | 2,805 |
| 162,297 |
|
| Prudential Financial, Inc. | | 700 |
| 72,842 |
|
| Reinsurance Group of America, Inc. | | 5,357 |
| 674,071 |
|
| Validus Holdings Ltd. | | 7,626 |
| 419,506 |
|
| | | | 2,820,817 |
|
|
| | | | | | | |
| | | Shares/
Principal Amount | Value |
| Internet and Direct Marketing Retail — 1.4% | | | |
Amazon.com, Inc.(1) | | 2,521 |
| $ | 1,890,422 |
|
| Internet Software and Services — 3.2% | | | |
Alphabet, Inc., Class A(1) | | 3,435 |
| 2,722,066 |
|
Facebook, Inc., Class A(1) | | 15,232 |
| 1,752,441 |
|
| | | | 4,474,507 |
|
| IT Services — 1.0% | | | |
| International Business Machines Corp. | | 7,941 |
| 1,318,127 |
|
| Leisure Products — 0.6% | | | |
| Brunswick Corp. | | 8,929 |
| 486,988 |
|
| Hasbro, Inc. | | 5,135 |
| 399,451 |
|
| | | | 886,439 |
|
| Life Sciences Tools and Services — 0.3% | | | |
| Thermo Fisher Scientific, Inc. | | 3,118 |
| 439,950 |
|
| Machinery — 2.2% | | | |
| Cummins, Inc. | | 3,725 |
| 509,096 |
|
| Fortive Corp. | | 1,696 |
| 90,957 |
|
| Ingersoll-Rand plc | | 10,699 |
| 802,853 |
|
| Oshkosh Corp. | | 2,711 |
| 175,158 |
|
| Parker-Hannifin Corp. | | 725 |
| 101,500 |
|
| Snap-on, Inc. | | 2,726 |
| 466,882 |
|
| Stanley Black & Decker, Inc. | | 1,628 |
| 186,715 |
|
| Timken Co. (The) | | 2,756 |
| 109,413 |
|
| Toro Co. (The) | | 11,851 |
| 663,063 |
|
| | | | 3,105,637 |
|
| Media — 0.8% | | | |
| Omnicom Group, Inc. | | 4,612 |
| 392,527 |
|
| Time Warner, Inc. | | 3,446 |
| 332,642 |
|
| Twenty-First Century Fox, Inc., Class A | | 14,414 |
| 404,169 |
|
| | | | 1,129,338 |
|
| Metals and Mining — 1.1% | | | |
| Barrick Gold Corp. | | 39,207 |
| 626,528 |
|
| Newmont Mining Corp. | | 2,083 |
| 70,968 |
|
| Nucor Corp. | | 11,503 |
| 684,658 |
|
| Reliance Steel & Aluminum Co. | | 2,579 |
| 205,134 |
|
| | | | 1,587,288 |
|
| Mortgage Real Estate Investment Trusts (REITs) — 0.1% | | | |
| Blackstone Mortgage Trust, Inc., Class A | | 2,766 |
| 83,174 |
|
Multi-Utilities† | | | |
| CenterPoint Energy, Inc. | | 1,750 |
| 43,120 |
|
| Multiline Retail — 0.5% | | | |
| Target Corp. | | 10,182 |
| 735,446 |
|
| Oil, Gas and Consumable Fuels — 2.6% | | | |
| Chevron Corp. | | 8,011 |
| 942,895 |
|
| Exxon Mobil Corp. | | 16,390 |
| 1,479,361 |
|
| Kinder Morgan, Inc. | | 24,113 |
| 499,380 |
|
| Williams Cos., Inc. (The) | | 9,547 |
| 297,294 |
|
|
| | | | | | | |
| | | Shares/
Principal Amount | Value |
| World Fuel Services Corp. | | 8,619 |
| $ | 395,698 |
|
| | | | 3,614,628 |
|
Personal Products† | | | |
| Nu Skin Enterprises, Inc., Class A | | 891 |
| 42,572 |
|
| Pharmaceuticals — 1.7% | | | |
| Johnson & Johnson | | 6,417 |
| 739,303 |
|
| Merck & Co., Inc. | | 22,788 |
| 1,341,529 |
|
| Pfizer, Inc. | | 7,632 |
| 247,887 |
|
| | | | 2,328,719 |
|
Professional Services† | | | |
FTI Consulting, Inc.(1) | | 1,222 |
| 55,088 |
|
| Real Estate Management and Development — 0.1% | | | |
| Realogy Holdings Corp. | | 6,212 |
| 159,835 |
|
| Semiconductors and Semiconductor Equipment — 2.9% | | | |
| Applied Materials, Inc. | | 24,325 |
| 784,968 |
|
| Broadcom Ltd. | | 545 |
| 96,340 |
|
| Intel Corp. | | 38,402 |
| 1,392,840 |
|
| Lam Research Corp. | | 576 |
| 60,900 |
|
| NVIDIA Corp. | | 3,889 |
| 415,112 |
|
| QUALCOMM, Inc. | | 15,654 |
| 1,020,641 |
|
| Texas Instruments, Inc. | | 3,933 |
| 286,991 |
|
| | | | 4,057,792 |
|
| Software — 3.8% | | | |
Adobe Systems, Inc.(1) | | 6,739 |
| 693,780 |
|
| Microsoft Corp. | | 42,693 |
| 2,652,943 |
|
| Oracle Corp. | | 28,769 |
| 1,106,168 |
|
Synopsys, Inc.(1) | | 1,593 |
| 93,764 |
|
VMware, Inc., Class A(1) | | 9,511 |
| 748,801 |
|
| | | | 5,295,456 |
|
| Specialty Retail — 0.5% | | | |
| Best Buy Co., Inc. | | 14,550 |
| 620,849 |
|
Urban Outfitters, Inc.(1) | | 4,319 |
| 123,005 |
|
| | | | 743,854 |
|
| Technology Hardware, Storage and Peripherals — 2.2% | | | |
| Apple, Inc. | | 23,780 |
| 2,754,200 |
|
| HP, Inc. | | 18,091 |
| 268,470 |
|
| | | | 3,022,670 |
|
| Thrifts and Mortgage Finance — 0.5% | | | |
Essent Group Ltd.(1) | | 20,933 |
| 677,601 |
|
TOTAL COMMON STOCKS
(Cost $67,659,426) | | | 81,316,897 |
|
| U.S. TREASURY SECURITIES — 14.1% | | | |
| U.S. Treasury Bonds, 3.50%, 2/15/39 | | $ | 350,000 |
| 382,178 |
|
| U.S. Treasury Bonds, 4.375%, 11/15/39 | | 310,000 |
| 382,108 |
|
| U.S. Treasury Bonds, 3.125%, 11/15/41 | | 50,000 |
| 50,657 |
|
| U.S. Treasury Bonds, 2.75%, 11/15/42 | | 650,000 |
| 612,791 |
|
| U.S. Treasury Bonds, 2.875%, 5/15/43 | | 450,000 |
| 433,844 |
|
|
| | | | | | | |
| | | Shares/
Principal Amount | Value |
| U.S. Treasury Bonds, 3.125%, 8/15/44 | | $ | 270,000 |
| $ | 272,728 |
|
| U.S. Treasury Bonds, 3.00%, 11/15/44 | | 180,000 |
| 177,458 |
|
| U.S. Treasury Bonds, 2.50%, 2/15/45 | | 1,360,000 |
| 1,208,899 |
|
| U.S. Treasury Inflation Indexed Notes, 0.125%, 7/15/26 | | 302,508 |
| 292,652 |
|
| U.S. Treasury Notes, 0.75%, 10/31/17 | | 550,000 |
| 549,563 |
|
| U.S. Treasury Notes, 1.00%, 2/15/18 | | 470,000 |
| 470,211 |
|
| U.S. Treasury Notes, 1.00%, 3/15/18 | | 1,950,000 |
| 1,951,109 |
|
| U.S. Treasury Notes, 2.625%, 4/30/18 | | 85,000 |
| 86,812 |
|
| U.S. Treasury Notes, 1.375%, 7/31/18 | | 1,200,000 |
| 1,205,364 |
|
| U.S. Treasury Notes, 1.375%, 9/30/18 | | 1,100,000 |
| 1,104,115 |
|
| U.S. Treasury Notes, 1.25%, 11/15/18 | | 400,000 |
| 400,593 |
|
| U.S. Treasury Notes, 1.00%, 11/30/18 | | 1,000,000 |
| 996,708 |
|
U.S. Treasury Notes, 1.125%, 12/31/18(2) | | 1,100,000 |
| 1,100,976 |
|
| U.S. Treasury Notes, 1.625%, 7/31/19 | | 1,550,000 |
| 1,560,507 |
|
U.S. Treasury Notes, 1.50%, 10/31/19(3) | | 150,000 |
| 150,316 |
|
| U.S. Treasury Notes, 1.50%, 11/30/19 | | 450,000 |
| 450,751 |
|
| U.S. Treasury Notes, 1.25%, 1/31/20 | | 200,000 |
| 198,453 |
|
| U.S. Treasury Notes, 1.375%, 2/29/20 | | 150,000 |
| 149,226 |
|
| U.S. Treasury Notes, 1.375%, 3/31/20 | | 200,000 |
| 198,866 |
|
| U.S. Treasury Notes, 1.375%, 4/30/20 | | 200,000 |
| 198,619 |
|
| U.S. Treasury Notes, 1.125%, 8/31/21 | | 250,000 |
| 241,354 |
|
| U.S. Treasury Notes, 2.00%, 10/31/21 | | 1,730,000 |
| 1,733,605 |
|
| U.S. Treasury Notes, 1.50%, 2/28/23 | | 400,000 |
| 384,338 |
|
| U.S. Treasury Notes, 1.375%, 6/30/23 | | 1,840,000 |
| 1,746,024 |
|
| U.S. Treasury Notes, 1.25%, 7/31/23 | | 640,000 |
| 601,862 |
|
| U.S. Treasury Notes, 2.00%, 11/15/26 | | 350,000 |
| 336,254 |
|
TOTAL U.S. TREASURY SECURITIES
(Cost $19,883,536) | | | 19,628,941 |
|
| CORPORATE BONDS — 12.2% | | | |
| Aerospace and Defense — 0.1% | | | |
| Boeing Co. (The), 2.20%, 10/30/22 | | 30,000 |
| 29,379 |
|
| Lockheed Martin Corp., 4.25%, 11/15/19 | | 30,000 |
| 31,957 |
|
| Lockheed Martin Corp., 3.80%, 3/1/45 | | 20,000 |
| 18,981 |
|
| United Technologies Corp., 6.05%, 6/1/36 | | 20,000 |
| 25,059 |
|
| United Technologies Corp., 5.70%, 4/15/40 | | 20,000 |
| 24,456 |
|
| United Technologies Corp., 3.75%, 11/1/46 | | 20,000 |
| 19,042 |
|
| | | | 148,874 |
|
| Automobiles — 0.3% | | | |
American Honda Finance Corp., 1.50%, 9/11/17(4) | | 10,000 |
| 10,026 |
|
| American Honda Finance Corp., 2.125%, 10/10/18 | | 20,000 |
| 20,158 |
|
| Ford Motor Credit Co. LLC, 5.875%, 8/2/21 | | 50,000 |
| 55,226 |
|
| General Motors Co., 5.00%, 4/1/35 | | 30,000 |
| 29,297 |
|
| General Motors Financial Co., Inc., 3.25%, 5/15/18 | | 60,000 |
| 60,797 |
|
| General Motors Financial Co., Inc., 3.10%, 1/15/19 | | 10,000 |
| 10,108 |
|
| General Motors Financial Co., Inc., 3.20%, 7/6/21 | | 20,000 |
| 19,836 |
|
| General Motors Financial Co., Inc., 5.25%, 3/1/26 | | 125,000 |
| 131,696 |
|
|
| | | | | | | |
| | | Shares/
Principal Amount | Value |
Jaguar Land Rover Automotive plc, 4.125%, 12/15/18(4) | | $ | 30,000 |
| $ | 30,937 |
|
| | | | 368,081 |
|
| Banks — 1.9% | | | |
| Bank of America Corp., 5.75%, 12/1/17 | | 50,000 |
| 51,801 |
|
| Bank of America Corp., 5.70%, 1/24/22 | | 40,000 |
| 44,937 |
|
| Bank of America Corp., 4.10%, 7/24/23 | | 30,000 |
| 31,350 |
|
| Bank of America Corp., MTN, 4.00%, 4/1/24 | | 70,000 |
| 72,224 |
|
| Bank of America Corp., MTN, 4.20%, 8/26/24 | | 30,000 |
| 30,574 |
|
| Bank of America Corp., MTN, 4.00%, 1/22/25 | | 80,000 |
| 80,137 |
|
| Bank of America Corp., MTN, 5.00%, 1/21/44 | | 20,000 |
| 21,944 |
|
| Bank of America N.A., 5.30%, 3/15/17 | | 240,000 |
| 241,870 |
|
| Barclays plc, MTN, VRN, 2.625%, 11/11/20 | EUR | 100,000 |
| 104,612 |
|
| Branch Banking & Trust Co., 3.625%, 9/16/25 | | $ | 17,000 |
| 17,280 |
|
| Branch Banking & Trust Co., 3.80%, 10/30/26 | | 20,000 |
| 20,547 |
|
| Capital One Financial Corp., 4.20%, 10/29/25 | | 200,000 |
| 200,765 |
|
| Citigroup, Inc., 1.75%, 5/1/18 | | 90,000 |
| 89,825 |
|
| Citigroup, Inc., 4.50%, 1/14/22 | | 90,000 |
| 95,971 |
|
| Citigroup, Inc., 4.05%, 7/30/22 | | 20,000 |
| 20,703 |
|
| Citigroup, Inc., 3.20%, 10/21/26 | | 125,000 |
| 119,595 |
|
| Citigroup, Inc., 4.45%, 9/29/27 | | 130,000 |
| 132,448 |
|
| Cooperatieve Rabobank UA, 3.875%, 2/8/22 | | 80,000 |
| 84,440 |
|
| Fifth Third Bancorp, 4.30%, 1/16/24 | | 95,000 |
| 97,818 |
|
| Huntington Bancshares, Inc., 2.30%, 1/14/22 | | 40,000 |
| 38,802 |
|
| JPMorgan Chase & Co., 2.55%, 3/1/21 | | 60,000 |
| 59,789 |
|
| JPMorgan Chase & Co., 4.625%, 5/10/21 | | 160,000 |
| 172,233 |
|
| JPMorgan Chase & Co., 3.25%, 9/23/22 | | 40,000 |
| 40,438 |
|
| JPMorgan Chase & Co., 3.875%, 9/10/24 | | 70,000 |
| 70,860 |
|
| JPMorgan Chase & Co., 3.125%, 1/23/25 | | 70,000 |
| 68,413 |
|
| JPMorgan Chase & Co., 4.95%, 6/1/45 | | 20,000 |
| 21,335 |
|
| KeyCorp, MTN, 2.30%, 12/13/18 | | 40,000 |
| 40,249 |
|
| Kreditanstalt fuer Wiederaufbau, 2.00%, 10/4/22 | | 50,000 |
| 49,047 |
|
| Santander Issuances SAU, MTN, 2.50%, 3/18/25 | EUR | 100,000 |
| 103,743 |
|
| U.S. Bancorp, MTN, 3.00%, 3/15/22 | | $ | 20,000 |
| 20,385 |
|
| U.S. Bancorp, MTN, 3.60%, 9/11/24 | | 50,000 |
| 50,943 |
|
| Wells Fargo & Co., 4.125%, 8/15/23 | | 50,000 |
| 51,726 |
|
| Wells Fargo & Co., 3.00%, 4/22/26 | | 50,000 |
| 47,702 |
|
| Wells Fargo & Co., MTN, 2.60%, 7/22/20 | | 40,000 |
| 40,222 |
|
| Wells Fargo & Co., MTN, 4.10%, 6/3/26 | | 80,000 |
| 81,035 |
|
| Wells Fargo & Co., MTN, 4.65%, 11/4/44 | | 25,000 |
| 24,616 |
|
| Wells Fargo & Co., MTN, 4.75%, 12/7/46 | | 30,000 |
| 30,353 |
|
| | | | 2,570,732 |
|
| Beverages — 0.3% | | | |
| Anheuser-Busch InBev Finance, Inc., 3.30%, 2/1/23 | | 155,000 |
| 157,797 |
|
| Anheuser-Busch InBev Finance, Inc., 3.65%, 2/1/26 | | 30,000 |
| 30,466 |
|
| Anheuser-Busch InBev Finance, Inc., 4.90%, 2/1/46 | | 60,000 |
| 64,679 |
|
| Anheuser-Busch InBev Worldwide, Inc., 7.75%, 1/15/19 | | 40,000 |
| 44,561 |
|
| Anheuser-Busch InBev Worldwide, Inc., 2.50%, 7/15/22 | | 50,000 |
| 49,219 |
|
|
| | | | | | | |
| | | Shares/
Principal Amount | Value |
| Molson Coors Brewing Co., 3.00%, 7/15/26 | | $ | 65,000 |
| $ | 61,479 |
|
| | | | 408,201 |
|
| Biotechnology — 0.4% | | | |
| AbbVie, Inc., 2.90%, 11/6/22 | | 40,000 |
| 39,517 |
|
| AbbVie, Inc., 3.60%, 5/14/25 | | 30,000 |
| 29,729 |
|
| AbbVie, Inc., 4.40%, 11/6/42 | | 30,000 |
| 28,276 |
|
| AbbVie, Inc., 4.45%, 5/14/46 | | 10,000 |
| 9,595 |
|
| Amgen, Inc., 1.85%, 8/19/21 | | 50,000 |
| 48,181 |
|
Amgen, Inc., 4.66%, 6/15/51(4) | | 46,000 |
| 44,516 |
|
| Biogen, Inc., 3.625%, 9/15/22 | | 50,000 |
| 51,333 |
|
| Celgene Corp., 3.25%, 8/15/22 | | 30,000 |
| 30,273 |
|
| Celgene Corp., 3.625%, 5/15/24 | | 60,000 |
| 60,319 |
|
| Celgene Corp., 3.875%, 8/15/25 | | 70,000 |
| 71,036 |
|
| Gilead Sciences, Inc., 4.40%, 12/1/21 | | 50,000 |
| 53,777 |
|
| Gilead Sciences, Inc., 3.65%, 3/1/26 | | 110,000 |
| 111,505 |
|
| | | | 578,057 |
|
Building Products† | | | |
| Masco Corp., 4.45%, 4/1/25 | | 20,000 |
| 20,400 |
|
| Chemicals — 0.1% | | | |
| Ashland LLC, 4.75%, 8/15/22 | | 30,000 |
| 31,237 |
|
| Dow Chemical Co. (The), 4.25%, 11/15/20 | | 13,000 |
| 13,770 |
|
| Eastman Chemical Co., 3.60%, 8/15/22 | | 15,000 |
| 15,384 |
|
| Ecolab, Inc., 4.35%, 12/8/21 | | 30,000 |
| 32,425 |
|
| LyondellBasell Industries NV, 4.625%, 2/26/55 | | 20,000 |
| 18,599 |
|
| Mosaic Co. (The), 5.625%, 11/15/43 | | 20,000 |
| 19,307 |
|
| | | | 130,722 |
|
| Commercial Services and Supplies — 0.1% | | | |
| Covanta Holding Corp., 5.875%, 3/1/24 | | 30,000 |
| 28,950 |
|
| Republic Services, Inc., 3.55%, 6/1/22 | | 50,000 |
| 51,949 |
|
| Waste Management, Inc., 4.10%, 3/1/45 | | 70,000 |
| 69,421 |
|
| | | | 150,320 |
|
Communications Equipment† | | | |
| Cisco Systems, Inc., 5.90%, 2/15/39 | | 20,000 |
| 25,408 |
|
Construction Materials† | | | |
| Owens Corning, 4.20%, 12/15/22 | | 30,000 |
| 31,162 |
|
| Consumer Finance — 0.3% | | | |
| American Express Co., 1.55%, 5/22/18 | | 20,000 |
| 19,965 |
|
| American Express Credit Corp., 2.60%, 9/14/20 | | 65,000 |
| 65,529 |
|
| American Express Credit Corp., MTN, 2.25%, 5/5/21 | | 40,000 |
| 39,515 |
|
| CIT Group, Inc., 4.25%, 8/15/17 | | 80,000 |
| 81,100 |
|
| CIT Group, Inc., 5.00%, 8/15/22 | | 20,000 |
| 20,900 |
|
| Equifax, Inc., 3.30%, 12/15/22 | | 30,000 |
| 30,506 |
|
| GLP Capital LP / GLP Financing II, Inc., 4.875%, 11/1/20 | | 20,000 |
| 21,100 |
|
| PNC Bank N.A., 6.00%, 12/7/17 | | 80,000 |
| 83,117 |
|
| Synchrony Financial, 2.60%, 1/15/19 | | 20,000 |
| 20,104 |
|
| Synchrony Financial, 3.00%, 8/15/19 | | 10,000 |
| 10,131 |
|
| | | | 391,967 |
|
|
| | | | | | | |
| | | Shares/
Principal Amount | Value |
| Containers and Packaging — 0.1% | | | |
| Ball Corp., 4.00%, 11/15/23 | | $ | 30,000 |
| $ | 29,512 |
|
| Crown Americas LLC / Crown Americas Capital Corp. IV, 4.50%, 1/15/23 | | 50,000 |
| 51,250 |
|
| WestRock RKT Co., 3.50%, 3/1/20 | | 20,000 |
| 20,507 |
|
| WestRock RKT Co., 4.00%, 3/1/23 | | 40,000 |
| 41,320 |
|
| | | | 142,589 |
|
Diversified Consumer Services† | | | |
| Catholic Health Initiatives, 2.95%, 11/1/22 | | 20,000 |
| 19,462 |
|
| George Washington University (The), 3.55%, 9/15/46 | | 15,000 |
| 12,812 |
|
| | | | 32,274 |
|
| Diversified Financial Services — 1.2% | | | |
| Ally Financial, Inc., 2.75%, 1/30/17 | | 50,000 |
| 50,019 |
|
| Ally Financial, Inc., 3.50%, 1/27/19 | | 20,000 |
| 20,150 |
|
| BNP Paribas SA, MTN, 2.375%, 2/17/25 | EUR | 100,000 |
| 106,882 |
|
| Citigroup, Inc., 2.90%, 12/8/21 | | $ | 30,000 |
| 29,924 |
|
| GE Capital International Funding Co. Unlimited Co., 2.34%, 11/15/20 | | 200,000 |
| 199,651 |
|
| Goldman Sachs Group, Inc. (The), 2.30%, 12/13/19 | | 220,000 |
| 219,950 |
|
| Goldman Sachs Group, Inc. (The), 5.75%, 1/24/22 | | 30,000 |
| 33,732 |
|
| Goldman Sachs Group, Inc. (The), 4.00%, 3/3/24 | | 50,000 |
| 51,893 |
|
| Goldman Sachs Group, Inc. (The), 3.50%, 1/23/25 | | 140,000 |
| 138,202 |
|
| Goldman Sachs Group, Inc. (The), 4.25%, 10/21/25 | | 20,000 |
| 20,327 |
|
| Goldman Sachs Group, Inc. (The), 3.50%, 11/16/26 | | 30,000 |
| 29,446 |
|
| Goldman Sachs Group, Inc. (The), 5.15%, 5/22/45 | | 10,000 |
| 10,537 |
|
| Goldman Sachs Group, Inc. (The), MTN, 4.80%, 7/8/44 | | 40,000 |
| 42,074 |
|
| HSBC Holdings plc, 2.95%, 5/25/21 | | 200,000 |
| 199,872 |
|
| Morgan Stanley, 5.00%, 11/24/25 | | 140,000 |
| 149,633 |
|
| Morgan Stanley, MTN, 6.625%, 4/1/18 | | 90,000 |
| 95,193 |
|
| Morgan Stanley, MTN, 5.625%, 9/23/19 | | 80,000 |
| 86,732 |
|
| Morgan Stanley, MTN, 2.50%, 4/21/21 | | 180,000 |
| 178,069 |
|
| Morgan Stanley, MTN, 3.70%, 10/23/24 | | 40,000 |
| 40,495 |
|
| S&P Global, Inc., 3.30%, 8/14/20 | | 10,000 |
| 10,197 |
|
| | | | 1,712,978 |
|
| Diversified Telecommunication Services — 0.6% | | | |
| AT&T, Inc., 5.00%, 3/1/21 | | 40,000 |
| 43,026 |
|
| AT&T, Inc., 3.60%, 2/17/23 | | 30,000 |
| 30,265 |
|
| AT&T, Inc., 4.45%, 4/1/24 | | 20,000 |
| 20,857 |
|
| AT&T, Inc., 3.40%, 5/15/25 | | 100,000 |
| 96,429 |
|
| AT&T, Inc., 6.55%, 2/15/39 | | 42,000 |
| 48,700 |
|
| AT&T, Inc., 4.30%, 12/15/42 | | 40,000 |
| 35,874 |
|
| British Telecommunications plc, 5.95%, 1/15/18 | | 40,000 |
| 41,694 |
|
| CenturyLink, Inc., Series Q, 6.15%, 9/15/19 | | 30,000 |
| 32,250 |
|
Deutsche Telekom International Finance BV, 2.25%, 3/6/17(4) | | 20,000 |
| 20,029 |
|
| Deutsche Telekom International Finance BV, 6.75%, 8/20/18 | | 30,000 |
| 32,357 |
|
| Frontier Communications Corp., 8.50%, 4/15/20 | | 20,000 |
| 21,075 |
|
| Orange SA, 4.125%, 9/14/21 | | 40,000 |
| 42,243 |
|
|
| | | | | | | |
| | | Shares/
Principal Amount | Value |
| Verizon Communications, Inc., 2.45%, 11/1/22 | | $ | 40,000 |
| $ | 38,644 |
|
| Verizon Communications, Inc., 5.15%, 9/15/23 | | 60,000 |
| 66,370 |
|
| Verizon Communications, Inc., 2.625%, 8/15/26 | | 20,000 |
| 18,422 |
|
| Verizon Communications, Inc., 5.05%, 3/15/34 | | 130,000 |
| 137,093 |
|
| Verizon Communications, Inc., 4.86%, 8/21/46 | | 37,000 |
| 37,566 |
|
| Verizon Communications, Inc., 5.01%, 8/21/54 | | 21,000 |
| 21,005 |
|
| | | | 783,899 |
|
Energy Equipment and Services† | | | |
| Halliburton Co., 3.80%, 11/15/25 | | 30,000 |
| 30,492 |
|
| Equity Real Estate Investment Trusts (REITs) — 0.4% | | | |
| American Tower Corp., 5.05%, 9/1/20 | | 20,000 |
| 21,465 |
|
| American Tower Corp., 3.375%, 10/15/26 | | 50,000 |
| 47,361 |
|
| AvalonBay Communities, Inc., MTN, 2.90%, 10/15/26 | | 20,000 |
| 18,922 |
|
| Boston Properties LP, 3.65%, 2/1/26 | | 10,000 |
| 9,880 |
|
| Crown Castle International Corp., 5.25%, 1/15/23 | | 30,000 |
| 32,400 |
|
| Crown Castle International Corp., 4.45%, 2/15/26 | | 60,000 |
| 62,106 |
|
| DDR Corp., 4.75%, 4/15/18 | | 50,000 |
| 51,432 |
|
| DDR Corp., 3.625%, 2/1/25 | | 20,000 |
| 19,356 |
|
| Essex Portfolio LP, 3.625%, 8/15/22 | | 30,000 |
| 30,704 |
|
| Essex Portfolio LP, 3.25%, 5/1/23 | | 10,000 |
| 9,967 |
|
| Hospitality Properties Trust, 4.65%, 3/15/24 | | 70,000 |
| 69,796 |
|
| Host Hotels & Resorts LP, 3.75%, 10/15/23 | | 20,000 |
| 19,642 |
|
| Kilroy Realty LP, 3.80%, 1/15/23 | | 30,000 |
| 30,222 |
|
| Kimco Realty Corp., 2.80%, 10/1/26 | | 40,000 |
| 37,248 |
|
| Simon Property Group LP, 3.25%, 11/30/26 | | 20,000 |
| 19,622 |
|
| Ventas Realty LP, 4.125%, 1/15/26 | | 20,000 |
| 20,456 |
|
| VEREIT Operating Partnership LP, 4.125%, 6/1/21 | | 40,000 |
| 40,800 |
|
| Welltower, Inc., 3.75%, 3/15/23 | | 20,000 |
| 20,410 |
|
| | | | 561,789 |
|
| Food and Staples Retailing — 0.2% | | | |
| CVS Health Corp., 3.50%, 7/20/22 | | 40,000 |
| 41,107 |
|
| CVS Health Corp., 2.75%, 12/1/22 | | 35,000 |
| 34,486 |
|
| CVS Health Corp., 5.125%, 7/20/45 | | 20,000 |
| 22,332 |
|
| Dollar General Corp., 3.25%, 4/15/23 | | 40,000 |
| 39,486 |
|
| Kroger Co. (The), 3.30%, 1/15/21 | | 50,000 |
| 51,383 |
|
| Kroger Co. (The), 3.875%, 10/15/46 | | 20,000 |
| 18,246 |
|
| Sysco Corp., 3.30%, 7/15/26 | | 10,000 |
| 9,819 |
|
| Target Corp., 2.50%, 4/15/26 | | 30,000 |
| 28,614 |
|
| Wal-Mart Stores, Inc., 4.30%, 4/22/44 | | 80,000 |
| 84,457 |
|
| | | | 329,930 |
|
| Food Products — 0.1% | | | |
| Kraft Heinz Foods Co., 3.95%, 7/15/25 | | 30,000 |
| 30,405 |
|
| Kraft Heinz Foods Co., 5.20%, 7/15/45 | | 20,000 |
| 20,976 |
|
| Kraft Heinz Foods Co., 4.375%, 6/1/46 | | 20,000 |
| 18,858 |
|
| | | | 70,239 |
|
| Gas Utilities — 0.5% | | | |
| Enbridge Energy Partners LP, 6.50%, 4/15/18 | | 30,000 |
| 31,574 |
|
|
| | | | | | | |
| | | Shares/
Principal Amount | Value |
| Enbridge, Inc., 4.00%, 10/1/23 | | $ | 20,000 |
| $ | 20,312 |
|
| Enbridge, Inc., 4.50%, 6/10/44 | | 20,000 |
| 18,629 |
|
| Energy Transfer Equity LP, 7.50%, 10/15/20 | | 30,000 |
| 33,600 |
|
| Energy Transfer Partners LP, 4.15%, 10/1/20 | | 40,000 |
| 41,427 |
|
| Energy Transfer Partners LP, 3.60%, 2/1/23 | | 30,000 |
| 29,516 |
|
| Energy Transfer Partners LP, 4.90%, 3/15/35 | | 10,000 |
| 9,359 |
|
| Energy Transfer Partners LP, 6.50%, 2/1/42 | | 20,000 |
| 21,642 |
|
| Enterprise Products Operating LLC, 4.85%, 3/15/44 | | 80,000 |
| 80,920 |
|
| Enterprise Products Operating LLC, VRN, 7.03%, 1/15/18 | | 20,000 |
| 20,517 |
|
| Kinder Morgan Energy Partners LP, 6.50%, 4/1/20 | | 30,000 |
| 33,210 |
|
| Kinder Morgan Energy Partners LP, 5.30%, 9/15/20 | | 20,000 |
| 21,485 |
|
| Kinder Morgan Energy Partners LP, 6.50%, 9/1/39 | | 50,000 |
| 54,982 |
|
| Kinder Morgan, Inc., 5.55%, 6/1/45 | | 10,000 |
| 10,537 |
|
| Magellan Midstream Partners LP, 6.55%, 7/15/19 | | 20,000 |
| 22,137 |
|
| MPLX LP, 4.875%, 12/1/24 | | 20,000 |
| 20,603 |
|
| MPLX LP, 4.875%, 6/1/25 | | 50,000 |
| 51,430 |
|
| Plains All American Pipeline LP / PAA Finance Corp., 3.65%, 6/1/22 | | 40,000 |
| 40,228 |
|
| Sunoco Logistics Partners Operations LP, 3.45%, 1/15/23 | | 40,000 |
| 39,089 |
|
| Sunoco Logistics Partners Operations LP, 3.90%, 7/15/26 | | 10,000 |
| 9,684 |
|
| Williams Cos., Inc. (The), 3.70%, 1/15/23 | | 20,000 |
| 19,400 |
|
| Williams Cos., Inc. (The), 5.75%, 6/24/44 | | 10,000 |
| 9,750 |
|
| Williams Partners LP, 4.125%, 11/15/20 | | 30,000 |
| 31,193 |
|
| Williams Partners LP, 5.40%, 3/4/44 | | 40,000 |
| 38,834 |
|
| | | | 710,058 |
|
| Health Care Equipment and Supplies — 0.3% | | | |
| Abbott Laboratories, 3.75%, 11/30/26 | | 80,000 |
| 79,567 |
|
| Becton Dickinson and Co., 3.73%, 12/15/24 | | 70,000 |
| 71,641 |
|
| Medtronic, Inc., 2.50%, 3/15/20 | | 20,000 |
| 20,222 |
|
| Medtronic, Inc., 3.50%, 3/15/25 | | 90,000 |
| 92,653 |
|
| Medtronic, Inc., 4.375%, 3/15/35 | | 40,000 |
| 42,331 |
|
| St. Jude Medical, Inc., 2.00%, 9/15/18 | | 10,000 |
| 10,016 |
|
| Thermo Fisher Scientific, Inc., 3.60%, 8/15/21 | | 25,000 |
| 25,842 |
|
| Thermo Fisher Scientific, Inc., 3.30%, 2/15/22 | | 9,000 |
| 9,145 |
|
| Thermo Fisher Scientific, Inc., 2.95%, 9/19/26 | | 20,000 |
| 18,873 |
|
| Thermo Fisher Scientific, Inc., 5.30%, 2/1/44 | | 20,000 |
| 22,419 |
|
| Zimmer Biomet Holdings, Inc., 2.70%, 4/1/20 | | 20,000 |
| 20,005 |
|
| | | | 412,714 |
|
| Health Care Providers and Services — 0.3% | | | |
| Aetna, Inc., 2.75%, 11/15/22 | | 30,000 |
| 29,478 |
|
| Aetna, Inc., 4.375%, 6/15/46 | | 20,000 |
| 20,124 |
|
| Ascension Health, 3.95%, 11/15/46 | | 10,000 |
| 9,552 |
|
| CHS / Community Health Systems, Inc., 5.125%, 8/15/18 | | 9,000 |
| 8,843 |
|
| Express Scripts Holding Co., 4.50%, 2/25/26 | | 40,000 |
| 41,199 |
|
| Express Scripts Holding Co., 3.40%, 3/1/27 | | 50,000 |
| 46,872 |
|
| HCA, Inc., 3.75%, 3/15/19 | | 60,000 |
| 61,800 |
|
| Johns Hopkins Health System Corp. (The), 3.84%, 5/15/46 | | 15,000 |
| 14,230 |
|
|
| | | | | | | |
| | | Shares/
Principal Amount | Value |
Mylan NV, 3.95%, 6/15/26(4) | | $ | 20,000 |
| $ | 18,727 |
|
| NYU Hospitals Center, 4.43%, 7/1/42 | | 20,000 |
| 19,125 |
|
| UnitedHealth Group, Inc., 2.875%, 12/15/21 | | 30,000 |
| 30,401 |
|
| UnitedHealth Group, Inc., 2.875%, 3/15/22 | | 40,000 |
| 40,500 |
|
| UnitedHealth Group, Inc., 3.75%, 7/15/25 | | 40,000 |
| 41,400 |
|
Universal Health Services, Inc., 4.75%, 8/1/22(4) | | 20,000 |
| 20,350 |
|
| | | | 402,601 |
|
| Hotels, Restaurants and Leisure — 0.1% | | | |
Hilton Domestic Operating Co., Inc., 4.25%, 9/1/24(4) | | 25,000 |
| 24,375 |
|
| Royal Caribbean Cruises Ltd., 5.25%, 11/15/22 | | 30,000 |
| 32,213 |
|
| Wyndham Worldwide Corp., 2.95%, 3/1/17 | | 10,000 |
| 10,010 |
|
| | | | 66,598 |
|
| Household Durables — 0.2% | | | |
| D.R. Horton, Inc., 3.625%, 2/15/18 | | 40,000 |
| 40,500 |
|
| Lennar Corp., 4.75%, 12/15/17 | | 30,000 |
| 30,600 |
|
| Lennar Corp., 4.75%, 4/1/21 | | 30,000 |
| 31,125 |
|
| Lennar Corp., 4.75%, 5/30/25 | | 10,000 |
| 9,800 |
|
| M.D.C. Holdings, Inc., 5.50%, 1/15/24 | | 20,000 |
| 20,750 |
|
| Newell Brands, Inc., 4.20%, 4/1/26 | | 20,000 |
| 20,871 |
|
| Newell Brands, Inc., 5.50%, 4/1/46 | | 40,000 |
| 45,939 |
|
| Toll Brothers Finance Corp., 6.75%, 11/1/19 | | 30,000 |
| 32,962 |
|
| TRI Pointe Group, Inc. / TRI Pointe Homes, Inc., 4.375%, 6/15/19 | | 10,000 |
| 10,225 |
|
| | | | 242,772 |
|
| Industrial Conglomerates — 0.2% | | | |
| General Electric Co., 2.70%, 10/9/22 | | 70,000 |
| 69,963 |
|
| General Electric Co., 4.125%, 10/9/42 | | 30,000 |
| 30,428 |
|
| General Electric Co., MTN, 2.30%, 4/27/17 | | 60,000 |
| 60,231 |
|
| General Electric Co., MTN, 4.65%, 10/17/21 | | 20,000 |
| 21,933 |
|
| Ingersoll-Rand Luxembourg Finance SA, 3.55%, 11/1/24 | | 30,000 |
| 30,456 |
|
| | | | 213,011 |
|
| Insurance — 0.7% | | | |
| Allianz Finance II BV, MTN, VRN, 5.75%, 7/8/21 | EUR | 100,000 |
| 122,684 |
|
| Allstate Corp. (The), 4.20%, 12/15/46 | | $ | 10,000 |
| 10,227 |
|
| Allstate Corp. (The), VRN, 5.75%, 8/15/23 | | 20,000 |
| 20,716 |
|
| American International Group, Inc., 4.125%, 2/15/24 | | 105,000 |
| 109,296 |
|
| American International Group, Inc., 4.50%, 7/16/44 | | 20,000 |
| 19,760 |
|
| Berkshire Hathaway Finance Corp., 4.25%, 1/15/21 | | 30,000 |
| 32,324 |
|
| Berkshire Hathaway Finance Corp., 3.00%, 5/15/22 | | 20,000 |
| 20,372 |
|
| Berkshire Hathaway, Inc., 4.50%, 2/11/43 | | 50,000 |
| 53,187 |
|
| Chubb INA Holdings, Inc., 3.15%, 3/15/25 | | 40,000 |
| 39,847 |
|
| Chubb INA Holdings, Inc., 3.35%, 5/3/26 | | 20,000 |
| 20,253 |
|
| Hartford Financial Services Group, Inc. (The), 5.95%, 10/15/36 | | 10,000 |
| 11,444 |
|
| International Lease Finance Corp., 6.25%, 5/15/19 | | 120,000 |
| 129,300 |
|
Liberty Mutual Group, Inc., 4.95%, 5/1/22(4) | | 20,000 |
| 21,826 |
|
Liberty Mutual Group, Inc., 4.85%, 8/1/44(4) | | 20,000 |
| 19,828 |
|
|
| | | | | | | |
| | | Shares/
Principal Amount | Value |
| Lincoln National Corp., 6.25%, 2/15/20 | | $ | 10,000 |
| $ | 11,045 |
|
| Markel Corp., 4.90%, 7/1/22 | | 40,000 |
| 43,158 |
|
| Markel Corp., 3.625%, 3/30/23 | | 10,000 |
| 10,030 |
|
| MetLife, Inc., 4.125%, 8/13/42 | | 20,000 |
| 19,691 |
|
| MetLife, Inc., 4.875%, 11/13/43 | | 20,000 |
| 21,662 |
|
| Principal Financial Group, Inc., 3.30%, 9/15/22 | | 10,000 |
| 10,122 |
|
| Prudential Financial, Inc., 5.625%, 5/12/41 | | 40,000 |
| 46,206 |
|
| Prudential Financial, Inc., MTN, 5.375%, 6/21/20 | | 60,000 |
| 65,729 |
|
TIAA Asset Management Finance Co. LLC, 4.125%, 11/1/24(4) | | 20,000 |
| 20,210 |
|
| Travelers Cos., Inc. (The), 4.30%, 8/25/45 | | 10,000 |
| 10,363 |
|
| Voya Financial, Inc., 5.70%, 7/15/43 | | 20,000 |
| 21,858 |
|
| WR Berkley Corp., 4.625%, 3/15/22 | | 20,000 |
| 21,396 |
|
| WR Berkley Corp., 4.75%, 8/1/44 | | 10,000 |
| 9,796 |
|
| | | | 942,330 |
|
| IT Services — 0.1% | | | |
| Fidelity National Information Services, Inc., 3.50%, 4/15/23 | | 30,000 |
| 30,396 |
|
| Fidelity National Information Services, Inc., 3.00%, 8/15/26 | | 55,000 |
| 51,751 |
|
| Hewlett Packard Enterprise Co., 3.60%, 10/15/20 | | 60,000 |
| 61,046 |
|
| Hewlett Packard Enterprise Co., 4.90%, 10/15/25 | | 20,000 |
| 20,586 |
|
| Xerox Corp., 2.95%, 3/15/17 | | 10,000 |
| 10,030 |
|
| | | | 173,809 |
|
Machinery† | | | |
| Oshkosh Corp., 5.375%, 3/1/22 | | 50,000 |
| 52,125 |
|
| Media — 0.7% | | | |
| 21st Century Fox America, Inc., 3.70%, 10/15/25 | | 20,000 |
| 20,253 |
|
| 21st Century Fox America, Inc., 6.90%, 8/15/39 | | 20,000 |
| 25,155 |
|
| 21st Century Fox America, Inc., 4.75%, 9/15/44 | | 10,000 |
| 10,015 |
|
| CBS Corp., 3.50%, 1/15/25 | | 20,000 |
| 19,820 |
|
| CBS Corp., 4.85%, 7/1/42 | | 10,000 |
| 9,807 |
|
| Charter Communications Operating LLC / Charter Communications Operating Capital, 4.91%, 7/23/25 | | 185,000 |
| 195,067 |
|
| Charter Communications Operating LLC / Charter Communications Operating Capital, 6.48%, 10/23/45 | | 10,000 |
| 11,581 |
|
| Comcast Corp., 6.40%, 5/15/38 | | 70,000 |
| 89,665 |
|
| Discovery Communications LLC, 5.625%, 8/15/19 | | 25,000 |
| 27,013 |
|
| Discovery Communications LLC, 3.25%, 4/1/23 | | 30,000 |
| 29,258 |
|
| Discovery Communications LLC, 4.90%, 3/11/26 | | 20,000 |
| 21,071 |
|
| Interpublic Group of Cos., Inc. (The), 4.00%, 3/15/22 | | 20,000 |
| 20,692 |
|
| Lamar Media Corp., 5.375%, 1/15/24 | | 30,000 |
| 31,200 |
|
| NBCUniversal Media LLC, 4.375%, 4/1/21 | | 60,000 |
| 64,803 |
|
| NBCUniversal Media LLC, 2.875%, 1/15/23 | | 55,000 |
| 54,858 |
|
Nielsen Finance LLC / Nielsen Finance Co., 5.00%, 4/15/22(4) | | 30,000 |
| 30,637 |
|
| Omnicom Group, Inc., 3.60%, 4/15/26 | | 40,000 |
| 39,608 |
|
| TEGNA, Inc., 5.125%, 7/15/20 | | 57,000 |
| 59,209 |
|
| Time Warner Cable LLC, 6.75%, 7/1/18 | | 20,000 |
| 21,357 |
|
| Time Warner Cable LLC, 5.50%, 9/1/41 | | 10,000 |
| 10,183 |
|
|
| | | | | | | |
| | | Shares/
Principal Amount | Value |
| Time Warner Cable LLC, 4.50%, 9/15/42 | | $ | 10,000 |
| $ | 9,073 |
|
| Time Warner, Inc., 4.70%, 1/15/21 | | 30,000 |
| 32,070 |
|
| Time Warner, Inc., 3.60%, 7/15/25 | | 30,000 |
| 29,847 |
|
| Time Warner, Inc., 3.80%, 2/15/27 | | 30,000 |
| 29,798 |
|
| Time Warner, Inc., 5.35%, 12/15/43 | | 20,000 |
| 21,191 |
|
| Viacom, Inc., 3.125%, 6/15/22 | | 30,000 |
| 29,094 |
|
| Viacom, Inc., 4.25%, 9/1/23 | | 30,000 |
| 30,034 |
|
| Walt Disney Co. (The), MTN, 1.85%, 7/30/26 | | 30,000 |
| 27,027 |
|
| Walt Disney Co. (The), MTN, 4.125%, 6/1/44 | | 20,000 |
| 20,686 |
|
| | | | 1,020,072 |
|
| Metals and Mining — 0.1% | | | |
| Barrick North America Finance LLC, 5.75%, 5/1/43 | | 10,000 |
| 10,530 |
|
Glencore Finance Canada Ltd., 4.95%, 11/15/21(4) | | 20,000 |
| 21,423 |
|
| Southern Copper Corp., 5.25%, 11/8/42 | | 20,000 |
| 18,392 |
|
Steel Dynamics, Inc., 5.00%, 12/15/26(4) | | 50,000 |
| 49,937 |
|
| Vale Overseas Ltd., 5.625%, 9/15/19 | | 25,000 |
| 26,475 |
|
| | | | 126,757 |
|
| Multi-Utilities — 0.7% | | | |
| AmeriGas Partners LP / AmeriGas Finance Corp., 5.625%, 5/20/24 | | 30,000 |
| 30,825 |
|
| Berkshire Hathaway Energy Co., 3.50%, 2/1/25 | | 30,000 |
| 30,608 |
|
| CenterPoint Energy Houston Electric LLC, 3.55%, 8/1/42 | | 10,000 |
| 9,411 |
|
| CMS Energy Corp., 8.75%, 6/15/19 | | 40,000 |
| 46,196 |
|
| Consolidated Edison Co. of New York, Inc., 3.95%, 3/1/43 | | 20,000 |
| 19,365 |
|
| Constellation Energy Group, Inc., 5.15%, 12/1/20 | | 32,000 |
| 34,598 |
|
| Dominion Resources, Inc., 2.75%, 9/15/22 | | 70,000 |
| 68,898 |
|
| Dominion Resources, Inc., 3.625%, 12/1/24 | | 30,000 |
| 30,201 |
|
| Dominion Resources, Inc., 4.90%, 8/1/41 | | 20,000 |
| 21,034 |
|
| Duke Energy Corp., 3.55%, 9/15/21 | | 20,000 |
| 20,706 |
|
| Duke Energy Corp., 2.65%, 9/1/26 | | 70,000 |
| 65,370 |
|
| Duke Energy Florida LLC, 6.35%, 9/15/37 | | 20,000 |
| 25,780 |
|
| Duke Energy Florida LLC, 3.85%, 11/15/42 | | 20,000 |
| 19,186 |
|
| Duke Energy Progress LLC, 4.15%, 12/1/44 | | 20,000 |
| 19,879 |
|
| Edison International, 3.75%, 9/15/17 | | 40,000 |
| 40,629 |
|
| Exelon Corp., 4.45%, 4/15/46 | | 20,000 |
| 19,618 |
|
| Exelon Generation Co. LLC, 4.25%, 6/15/22 | | 20,000 |
| 20,705 |
|
| Exelon Generation Co. LLC, 5.60%, 6/15/42 | | 10,000 |
| 9,274 |
|
| FirstEnergy Corp., 2.75%, 3/15/18 | | 20,000 |
| 20,185 |
|
| FirstEnergy Corp., 4.25%, 3/15/23 | | 30,000 |
| 31,025 |
|
| Florida Power & Light Co., 4.125%, 2/1/42 | | 20,000 |
| 20,522 |
|
| Georgia Power Co., 4.30%, 3/15/42 | | 10,000 |
| 10,212 |
|
| IPALCO Enterprises, Inc., 5.00%, 5/1/18 | | 40,000 |
| 41,500 |
|
| MidAmerican Energy Co., 4.40%, 10/15/44 | | 60,000 |
| 63,759 |
|
| NextEra Energy Capital Holdings, Inc., VRN, 7.30%, 9/1/17 | | 40,000 |
| 40,060 |
|
| NiSource Finance Corp., 5.65%, 2/1/45 | | 20,000 |
| 23,363 |
|
| Pacific Gas & Electric Co., 4.00%, 12/1/46 | | 20,000 |
| 19,767 |
|
| Potomac Electric Power Co., 3.60%, 3/15/24 | | 20,000 |
| 20,675 |
|
|
| | | | | | | |
| | | Shares/
Principal Amount | Value |
| Progress Energy, Inc., 3.15%, 4/1/22 | | $ | 20,000 |
| $ | 20,184 |
|
| Sempra Energy, 2.875%, 10/1/22 | | 40,000 |
| 39,625 |
|
| Southern Co. Gas Capital Corp., 3.95%, 10/1/46 | | 10,000 |
| 9,273 |
|
| Southern Power Co., 5.15%, 9/15/41 | | 10,000 |
| 10,089 |
|
| Virginia Electric & Power Co., 3.45%, 2/15/24 | | 30,000 |
| 30,842 |
|
| Virginia Electric & Power Co., 4.45%, 2/15/44 | | 10,000 |
| 10,519 |
|
| Xcel Energy, Inc., 3.35%, 12/1/26 | | 20,000 |
| 20,029 |
|
| Xcel Energy, Inc., 4.80%, 9/15/41 | | 10,000 |
| 10,674 |
|
| | | | 974,586 |
|
Multiline Retail† | | | |
| Macy's Retail Holdings, Inc., 2.875%, 2/15/23 | | 30,000 |
| 28,562 |
|
| Oil, Gas and Consumable Fuels — 0.8% | | | |
| Anadarko Petroleum Corp., 5.55%, 3/15/26 | | 40,000 |
| 44,792 |
|
| Anadarko Petroleum Corp., 6.45%, 9/15/36 | | 20,000 |
| 23,839 |
|
Antero Resources Corp., 5.00%, 3/1/25(4) | | 50,000 |
| 49,150 |
|
| Apache Corp., 4.75%, 4/15/43 | | 40,000 |
| 41,279 |
|
| BP Capital Markets plc, 4.50%, 10/1/20 | | 30,000 |
| 32,185 |
|
| BP Capital Markets plc, 2.75%, 5/10/23 | | 20,000 |
| 19,631 |
|
| Chevron Corp., 2.10%, 5/16/21 | | 40,000 |
| 39,647 |
|
| Cimarex Energy Co., 4.375%, 6/1/24 | | 30,000 |
| 31,211 |
|
| CNOOC Nexen Finance 2014 ULC, 4.25%, 4/30/24 | | 30,000 |
| 30,744 |
|
| Concho Resources, Inc., 6.50%, 1/15/22 | | 10,000 |
| 10,348 |
|
| Concho Resources, Inc., 5.50%, 4/1/23 | | 50,000 |
| 52,065 |
|
| Concho Resources, Inc., 4.375%, 1/15/25 | | 30,000 |
| 30,090 |
|
| ConocoPhillips Holding Co., 6.95%, 4/15/29 | | 10,000 |
| 12,583 |
|
| Ecopetrol SA, 4.125%, 1/16/25 | | 10,000 |
| 9,390 |
|
| Encana Corp., 6.50%, 2/1/38 | | 20,000 |
| 21,665 |
|
| EOG Resources, Inc., 5.625%, 6/1/19 | | 30,000 |
| 32,424 |
|
| EOG Resources, Inc., 4.10%, 2/1/21 | | 20,000 |
| 21,080 |
|
| Exxon Mobil Corp., 2.71%, 3/6/25 | | 40,000 |
| 38,929 |
|
| Exxon Mobil Corp., 3.04%, 3/1/26 | | 50,000 |
| 49,919 |
|
| Hess Corp., 6.00%, 1/15/40 | | 30,000 |
| 30,997 |
|
| Marathon Oil Corp., 3.85%, 6/1/25 | | 30,000 |
| 29,106 |
|
| Newfield Exploration Co., 5.75%, 1/30/22 | | 20,000 |
| 21,175 |
|
| Noble Energy, Inc., 4.15%, 12/15/21 | | 50,000 |
| 52,131 |
|
| Petroleos Mexicanos, 6.00%, 3/5/20 | | 40,000 |
| 42,290 |
|
| Petroleos Mexicanos, 4.875%, 1/24/22 | | 70,000 |
| 70,385 |
|
| Petroleos Mexicanos, 3.50%, 1/30/23 | | 10,000 |
| 9,205 |
|
| Petroleos Mexicanos, 6.625%, 6/15/35 | | 10,000 |
| 9,900 |
|
| Phillips 66, 4.30%, 4/1/22 | | 50,000 |
| 53,695 |
|
| Shell International Finance BV, 2.375%, 8/21/22 | | 20,000 |
| 19,635 |
|
| Shell International Finance BV, 3.25%, 5/11/25 | | 20,000 |
| 19,979 |
|
| Shell International Finance BV, 3.625%, 8/21/42 | | 40,000 |
| 36,178 |
|
| Statoil ASA, 2.45%, 1/17/23 | | 40,000 |
| 39,038 |
|
| Statoil ASA, 3.95%, 5/15/43 | | 20,000 |
| 19,085 |
|
| Suburban Propane Partners LP / Suburban Energy Finance Corp., 7.375%, 8/1/21 | | 30,000 |
| 31,125 |
|
|
| | | | | | | |
| | | Shares/
Principal Amount | Value |
| Total Capital Canada Ltd., 2.75%, 7/15/23 | | $ | 20,000 |
| $ | 19,788 |
|
| Total Capital SA, 2.125%, 8/10/18 | | 20,000 |
| 20,154 |
|
| | | | 1,114,837 |
|
| Paper and Forest Products — 0.1% | | | |
Georgia-Pacific LLC, 2.54%, 11/15/19(4) | | 40,000 |
| 40,358 |
|
Georgia-Pacific LLC, 5.40%, 11/1/20(4) | | 60,000 |
| 65,971 |
|
| International Paper Co., 6.00%, 11/15/41 | | 10,000 |
| 11,249 |
|
| International Paper Co., 4.40%, 8/15/47 | | 30,000 |
| 28,409 |
|
| | | | 145,987 |
|
| Pharmaceuticals — 0.3% | | | |
| Actavis Funding SCS, 3.85%, 6/15/24 | | 34,000 |
| 34,318 |
|
| Actavis Funding SCS, 4.55%, 3/15/35 | | 20,000 |
| 19,826 |
|
| Actavis, Inc., 1.875%, 10/1/17 | | 40,000 |
| 40,082 |
|
| Actavis, Inc., 3.25%, 10/1/22 | | 30,000 |
| 29,883 |
|
| Actavis, Inc., 4.625%, 10/1/42 | | 10,000 |
| 9,702 |
|
Forest Laboratories LLC, 4.875%, 2/15/21(4) | | 60,000 |
| 64,466 |
|
| GlaxoSmithKline Capital plc, 2.85%, 5/8/22 | | 35,000 |
| 35,270 |
|
| Merck & Co., Inc., 2.40%, 9/15/22 | | 70,000 |
| 68,597 |
|
| Merck & Co., Inc., 3.70%, 2/10/45 | | 10,000 |
| 9,540 |
|
Roche Holdings, Inc., 3.35%, 9/30/24(4) | | 20,000 |
| 20,468 |
|
| Shire Acquisitions Investments Ireland DAC, 2.40%, 9/23/21 | | 130,000 |
| 125,598 |
|
| | | | 457,750 |
|
| Road and Rail — 0.2% | | | |
| Burlington Northern Santa Fe LLC, 3.60%, 9/1/20 | | 39,000 |
| 40,838 |
|
| Burlington Northern Santa Fe LLC, 4.45%, 3/15/43 | | 50,000 |
| 52,421 |
|
| Burlington Northern Santa Fe LLC, 4.15%, 4/1/45 | | 10,000 |
| 10,145 |
|
| CSX Corp., 3.40%, 8/1/24 | | 30,000 |
| 30,572 |
|
| CSX Corp., 3.80%, 11/1/46 | | 20,000 |
| 18,582 |
|
| Norfolk Southern Corp., 5.75%, 4/1/18 | | 10,000 |
| 10,502 |
|
| Norfolk Southern Corp., 3.25%, 12/1/21 | | 40,000 |
| 41,087 |
|
Penske Truck Leasing Co. LP / PTL Finance Corp., 2.875%, 7/17/18(4) | | 10,000 |
| 10,131 |
|
| Union Pacific Corp., 4.00%, 2/1/21 | | 20,000 |
| 21,189 |
|
| Union Pacific Corp., 4.75%, 9/15/41 | | 10,000 |
| 10,872 |
|
| Union Pacific Corp., 3.35%, 8/15/46 | | 10,000 |
| 8,962 |
|
| | | | 255,301 |
|
Semiconductors and Semiconductor Equipment† | | | |
| Lam Research Corp., 2.80%, 6/15/21 | | 50,000 |
| 49,738 |
|
| Software — 0.3% | | | |
Activision Blizzard, Inc., 2.30%, 9/15/21(4) | | 30,000 |
| 29,280 |
|
| Intuit, Inc., 5.75%, 3/15/17 | | 75,000 |
| 75,668 |
|
| Microsoft Corp., 2.70%, 2/12/25 | | 70,000 |
| 68,572 |
|
| Microsoft Corp., 3.125%, 11/3/25 | | 20,000 |
| 20,219 |
|
| Microsoft Corp., 3.45%, 8/8/36 | | 50,000 |
| 47,535 |
|
| Oracle Corp., 2.50%, 10/15/22 | | 25,000 |
| 24,724 |
|
| Oracle Corp., 3.625%, 7/15/23 | | 30,000 |
| 31,435 |
|
| Oracle Corp., 2.65%, 7/15/26 | | 80,000 |
| 75,916 |
|
|
| | | | | | | |
| | | Shares/
Principal Amount | Value |
| Oracle Corp., 4.30%, 7/8/34 | | $ | 20,000 |
| $ | 20,686 |
|
| Oracle Corp., 4.00%, 7/15/46 | | 20,000 |
| 19,138 |
|
| | | | 413,173 |
|
| Specialty Retail — 0.1% | | | |
| Home Depot, Inc. (The), 2.625%, 6/1/22 | | 30,000 |
| 30,135 |
|
| Home Depot, Inc. (The), 3.35%, 9/15/25 | | 20,000 |
| 20,513 |
|
| Home Depot, Inc. (The), 3.00%, 4/1/26 | | 40,000 |
| 39,913 |
|
| Home Depot, Inc. (The), 5.95%, 4/1/41 | | 40,000 |
| 50,869 |
|
| United Rentals North America, Inc., 4.625%, 7/15/23 | | 20,000 |
| 20,475 |
|
| | | | 161,905 |
|
| Technology Hardware, Storage and Peripherals — 0.2% | | | |
| Apple, Inc., 1.00%, 5/3/18 | | 30,000 |
| 29,889 |
|
| Apple, Inc., 2.85%, 5/6/21 | | 30,000 |
| 30,695 |
|
| Apple, Inc., 2.50%, 2/9/25 | | 110,000 |
| 105,675 |
|
| Apple, Inc., 4.65%, 2/23/46 | | 20,000 |
| 21,606 |
|
Diamond 1 Finance Corp. / Diamond 2 Finance Corp., 6.02%, 6/15/26(4) | | 70,000 |
| 75,867 |
|
| Seagate HDD Cayman, 4.75%, 6/1/23 | | 40,000 |
| 39,675 |
|
| | | | 303,407 |
|
Textiles, Apparel and Luxury Goods† | | | |
| PVH Corp., 4.50%, 12/15/22 | | 30,000 |
| 30,600 |
|
| Tobacco — 0.1% | | | |
| Altria Group, Inc., 2.85%, 8/9/22 | | 40,000 |
| 40,056 |
|
| Philip Morris International, Inc., 4.125%, 5/17/21 | | 40,000 |
| 42,708 |
|
| Reynolds American, Inc., 4.45%, 6/12/25 | | 20,000 |
| 21,126 |
|
| | | | 103,890 |
|
| Wireless Telecommunication Services — 0.1% | | | |
Sprint Communications, Inc., 9.00%, 11/15/18(4) | | 40,000 |
| 44,200 |
|
| T-Mobile USA, Inc., 6.46%, 4/28/19 | | 40,000 |
| 40,750 |
|
| | | | 84,950 |
|
TOTAL CORPORATE BONDS
(Cost $16,867,866) | | | 16,975,647 |
|
U.S. GOVERNMENT AGENCY MORTGAGE-BACKED SECURITIES(5) — 10.3% | |
| Adjustable-Rate U.S. Government Agency Mortgage-Backed Securities — 1.2% | |
| FHLMC, VRN, 1.81%, 1/15/17 | | 21,026 |
| 21,681 |
|
| FHLMC, VRN, 1.91%, 1/15/17 | | 31,145 |
| 32,036 |
|
| FHLMC, VRN, 1.99%, 1/15/17 | | 25,753 |
| 26,617 |
|
| FHLMC, VRN, 2.31%, 1/15/17 | | 76,932 |
| 77,551 |
|
| FHLMC, VRN, 2.39%, 1/15/17 | | 210,163 |
| 212,990 |
|
| FHLMC, VRN, 2.51%, 1/15/17 | | 96,526 |
| 99,164 |
|
| FHLMC, VRN, 2.59%, 1/15/17 | | 116,108 |
| 118,244 |
|
| FHLMC, VRN, 2.68%, 1/15/17 | | 41,314 |
| 43,662 |
|
| FHLMC, VRN, 2.78%, 1/15/17 | | 90,505 |
| 95,687 |
|
| FHLMC, VRN, 2.81%, 1/15/17 | | 43,137 |
| 45,526 |
|
| FHLMC, VRN, 2.84%, 1/15/17 | | 21,120 |
| 22,375 |
|
| FHLMC, VRN, 2.87%, 1/15/17 | | 51,756 |
| 53,185 |
|
| FHLMC, VRN, 3.01%, 1/15/17 | | 7,332 |
| 7,769 |
|
|
| | | | | | | |
| | | Shares/
Principal Amount | Value |
| FHLMC, VRN, 3.09%, 1/15/17 | | $ | 14,780 |
| $ | 15,635 |
|
| FHLMC, VRN, 3.14%, 1/15/17 | | 21,866 |
| 23,049 |
|
| FHLMC, VRN, 3.67%, 1/15/17 | | 16,422 |
| 16,970 |
|
| FHLMC, VRN, 4.07%, 1/15/17 | | 23,503 |
| 24,304 |
|
| FHLMC, VRN, 4.24%, 1/15/17 | | 28,507 |
| 29,669 |
|
| FHLMC, VRN, 4.71%, 1/15/17 | | 12,246 |
| 12,755 |
|
| FHLMC, VRN, 5.14%, 1/15/17 | | 7,722 |
| 8,000 |
|
| FHLMC, VRN, 5.47%, 1/15/17 | | 29,230 |
| 30,576 |
|
| FHLMC, VRN, 5.98%, 1/15/17 | | 22,158 |
| 22,969 |
|
| FNMA, VRN, 2.06%, 1/25/17 | | 34,212 |
| 35,629 |
|
| FNMA, VRN, 2.61%, 1/25/17 | | 12,636 |
| 13,354 |
|
| FNMA, VRN, 2.62%, 1/25/17 | | 91,032 |
| 92,503 |
|
| FNMA, VRN, 2.74%, 1/25/17 | | 36,815 |
| 38,717 |
|
| FNMA, VRN, 2.77%, 1/25/17 | | 48,018 |
| 50,830 |
|
| FNMA, VRN, 2.81%, 1/25/17 | | 55,896 |
| 58,282 |
|
| FNMA, VRN, 2.81%, 1/25/17 | | 88,089 |
| 91,710 |
|
| FNMA, VRN, 2.81%, 1/25/17 | | 43,676 |
| 45,553 |
|
| FNMA, VRN, 2.81%, 1/25/17 | | 40,501 |
| 42,211 |
|
| FNMA, VRN, 2.95%, 1/25/17 | | 16,221 |
| 17,134 |
|
| FNMA, VRN, 3.30%, 1/25/17 | | 14,096 |
| 14,889 |
|
| FNMA, VRN, 3.33%, 1/25/17 | | 27,034 |
| 27,999 |
|
| FNMA, VRN, 3.60%, 1/25/17 | | 34,381 |
| 35,846 |
|
| FNMA, VRN, 3.93%, 1/25/17 | | 24,692 |
| 25,584 |
|
| FNMA, VRN, 4.77%, 1/25/17 | | 17,845 |
| 18,873 |
|
| | | | 1,649,528 |
|
| Fixed-Rate U.S. Government Agency Mortgage-Backed Securities — 9.1% | |
| FHLMC, 4.50%, 1/1/19 | | 23,051 |
| 23,658 |
|
| FHLMC, 6.50%, 1/1/28 | | 3,500 |
| 3,981 |
|
| FHLMC, 6.50%, 6/1/29 | | 3,674 |
| 4,153 |
|
| FHLMC, 8.00%, 7/1/30 | | 4,337 |
| 5,354 |
|
| FHLMC, 5.50%, 12/1/33 | | 97,083 |
| 110,170 |
|
| FHLMC, 5.50%, 1/1/38 | | 14,648 |
| 16,372 |
|
| FHLMC, 6.00%, 8/1/38 | | 18,923 |
| 21,529 |
|
| FHLMC, 3.00%, 2/1/43 | | 345,231 |
| 344,970 |
|
| FHLMC, 6.50%, 7/1/47 | | 2,135 |
| 2,334 |
|
FNMA, 3.00%, 1/18/17(6) | | 1,500,000 |
| 1,489,167 |
|
FNMA, 3.50%, 1/18/17(6) | | 1,525,000 |
| 1,562,177 |
|
FNMA, 4.00%, 1/18/17(6) | | 846,000 |
| 889,043 |
|
FNMA, 4.50%, 1/18/17(6) | | 725,000 |
| 779,633 |
|
| FNMA, 4.50%, 5/1/19 | | 12,115 |
| 12,455 |
|
| FNMA, 4.50%, 5/1/19 | | 16,043 |
| 16,521 |
|
| FNMA, 6.50%, 1/1/28 | | 3,915 |
| 4,430 |
|
| FNMA, 6.50%, 1/1/29 | | 8,338 |
| 9,441 |
|
| FNMA, 7.50%, 7/1/29 | | 18,571 |
| 20,751 |
|
| FNMA, 7.50%, 9/1/30 | | 3,797 |
| 4,570 |
|
| FNMA, 5.00%, 7/1/31 | | 126,290 |
| 138,157 |
|
| FNMA, 6.50%, 1/1/32 | | 6,335 |
| 7,174 |
|
|
| | | | | | | |
| | | Shares/
Principal Amount | Value |
| FNMA, 5.50%, 6/1/33 | | $ | 26,805 |
| $ | 30,145 |
|
| FNMA, 5.50%, 8/1/33 | | 55,063 |
| 61,638 |
|
| FNMA, 5.00%, 11/1/33 | | 155,153 |
| 170,473 |
|
| FNMA, 5.50%, 1/1/34 | | 55,655 |
| 62,405 |
|
| FNMA, 5.00%, 4/1/35 | | 126,093 |
| 138,023 |
|
| FNMA, 4.50%, 9/1/35 | | 75,088 |
| 80,937 |
|
| FNMA, 5.00%, 2/1/36 | | 123,568 |
| 134,982 |
|
| FNMA, 5.50%, 1/1/37 | | 89,042 |
| 99,590 |
|
| FNMA, 5.50%, 2/1/37 | | 21,837 |
| 24,416 |
|
| FNMA, 6.00%, 7/1/37 | | 134,633 |
| 153,836 |
|
| FNMA, 6.50%, 8/1/37 | | 48,773 |
| 53,942 |
|
| FNMA, 5.00%, 4/1/40 | | 208,491 |
| 227,759 |
|
| FNMA, 5.00%, 6/1/40 | | 154,375 |
| 168,822 |
|
| FNMA, 3.50%, 1/1/41 | | 379,203 |
| 390,943 |
|
| FNMA, 4.00%, 1/1/41 | | 630,581 |
| 668,502 |
|
| FNMA, 4.00%, 5/1/41 | | 135,861 |
| 143,385 |
|
| FNMA, 5.00%, 6/1/41 | | 171,928 |
| 188,147 |
|
| FNMA, 4.50%, 7/1/41 | | 172,949 |
| 187,059 |
|
| FNMA, 4.50%, 9/1/41 | | 42,143 |
| 45,466 |
|
| FNMA, 4.00%, 12/1/41 | | 219,237 |
| 232,099 |
|
| FNMA, 4.00%, 1/1/42 | | 62,826 |
| 66,353 |
|
| FNMA, 4.00%, 1/1/42 | | 238,077 |
| 250,732 |
|
| FNMA, 3.50%, 5/1/42 | | 425,552 |
| 438,803 |
|
| FNMA, 3.50%, 6/1/42 | | 98,228 |
| 101,289 |
|
| FNMA, 3.50%, 5/1/45 | | 813,682 |
| 835,336 |
|
| FNMA, 6.50%, 8/1/47 | | 5,108 |
| 5,627 |
|
| FNMA, 6.50%, 9/1/47 | | 9,527 |
| 10,479 |
|
| FNMA, 6.50%, 9/1/47 | | 641 |
| 706 |
|
| FNMA, 6.50%, 9/1/47 | | 7,025 |
| 7,719 |
|
| FNMA, 6.50%, 9/1/47 | | 1,875 |
| 2,056 |
|
GNMA, 3.00%, 1/24/17(6) | | 500,000 |
| 505,939 |
|
GNMA, 3.50%, 1/24/17(6) | | 525,000 |
| 545,411 |
|
| GNMA, 7.00%, 4/20/26 | | 11,800 |
| 13,653 |
|
| GNMA, 7.50%, 8/15/26 | | 7,741 |
| 8,959 |
|
| GNMA, 7.00%, 2/15/28 | | 3,331 |
| 3,362 |
|
| GNMA, 7.50%, 2/15/28 | | 3,262 |
| 3,305 |
|
| GNMA, 6.50%, 5/15/28 | | 528 |
| 603 |
|
| GNMA, 6.50%, 5/15/28 | | 1,774 |
| 2,028 |
|
| GNMA, 7.00%, 12/15/28 | | 2,875 |
| 2,875 |
|
| GNMA, 7.00%, 5/15/31 | | 23,189 |
| 27,186 |
|
| GNMA, 5.50%, 11/15/32 | | 54,440 |
| 61,467 |
|
| GNMA, 4.50%, 1/15/40 | | 53,364 |
| 57,771 |
|
| GNMA, 4.50%, 5/20/41 | | 147,185 |
| 158,645 |
|
| GNMA, 4.50%, 6/15/41 | | 77,690 |
| 85,610 |
|
| GNMA, 4.00%, 12/15/41 | | 279,629 |
| 297,914 |
|
| GNMA, 3.50%, 7/20/42 | | 105,206 |
| 109,788 |
|
| GNMA, 2.50%, 7/20/46 | | 220,716 |
| 214,359 |
|
|
| | | | | | | |
| | | Shares/
Principal Amount | Value |
| GNMA, 2.50%, 8/20/46 | | $ | 147,902 |
| $ | 143,643 |
|
| | | | 12,690,227 |
|
TOTAL U.S. GOVERNMENT AGENCY MORTGAGE-BACKED SECURITIES
(Cost $14,191,565) | 14,339,755 |
|
COLLATERALIZED MORTGAGE OBLIGATIONS(5) — 1.9% | | | |
| Private Sponsor Collateralized Mortgage Obligations — 1.6% | | |
| ABN Amro Mortgage Corp., Series 2003-4, Class A4, 5.50%, 3/25/33 | | 4,852 |
| 4,932 |
|
| Adjustable Rate Mortgage Trust, Series 2004-4, Class 4A1, VRN, 3.20%, 1/1/17 | | 50,184 |
| 49,915 |
|
Agate Bay Mortgage Loan Trust, Series 2014-2, Class A14, VRN, 3.75%, 1/1/17(4) | | 61,006 |
| 62,766 |
|
Agate Bay Mortgage Loan Trust, Series 2016-3, Class A3, VRN, 3.50%, 1/1/17(4) | | 135,232 |
| 135,512 |
|
| Banc of America Mortgage Securities, Inc., Series 2003-G, Class 2A1, VRN, 3.27%, 1/1/17 | | 15,011 |
| 14,940 |
|
| Banc of America Mortgage Securities, Inc., Series 2004-E, Class 2A6 SEQ, VRN, 3.34%, 1/1/17 | | 47,401 |
| 46,945 |
|
| Banc of America Mortgage Securities, Inc., Series 2005-1, Class 1A15, 5.50%, 2/25/35 | | 13,548 |
| 13,946 |
|
| Citigroup Mortgage Loan Trust, Inc., Series 2004-UST1, Class A4, VRN, 2.75%, 1/1/17 | | 52,400 |
| 50,778 |
|
| Citigroup Mortgage Loan Trust, Inc., Series 2004-UST1, Class A5, VRN, 2.60%, 1/1/17 | | 38,192 |
| 37,662 |
|
| Citigroup Mortgage Loan Trust, Inc., Series 2005-4, Class A, VRN, 3.04%, 1/1/17 | | 12,560 |
| 12,369 |
|
| Citigroup Mortgage Loan Trust, Inc., Series 2005-6, Class A2, VRN, 2.76%, 1/1/17 | | 33,472 |
| 34,640 |
|
| Countrywide Home Loan Mortgage Pass-Through Trust, Series 2005-17, Class 1A11, 5.50%, 9/25/35 | | 1,950 |
| 1,942 |
|
| First Horizon Alternative Mortgage Securities Trust, Series 2004-AA4, Class A1, VRN, 2.84%, 1/1/17 | | 15,595 |
| 15,325 |
|
| First Horizon Mortgage Pass-Through Trust, Series 2005-AR3, Class 4A1, VRN, 2.87%, 1/1/17 | | 18,112 |
| 17,543 |
|
| GSR Mortgage Loan Trust, Series 2004-7, Class 3A1, VRN, 2.71%, 1/1/17 | | 35,153 |
| 34,158 |
|
| GSR Mortgage Loan Trust, Series 2004-AR5, Class 3A3, VRN, 3.06%, 1/1/17 | | 36,100 |
| 35,886 |
|
| GSR Mortgage Loan Trust, Series 2005-AR1, Class 3A1, VRN, 3.15%, 1/1/17 | | 52,488 |
| 52,000 |
|
| GSR Mortgage Loan Trust, Series 2005-AR6, Class 2A1, VRN, 3.01%, 1/1/17 | | 125,691 |
| 130,522 |
|
| GSR Mortgage Loan Trust, Series 2005-AR6, Class 4A5, VRN, 3.08%, 1/1/17 | | 31,880 |
| 31,988 |
|
| JPMorgan Mortgage Trust, Series 2005-A4, Class 1A1, VRN, 3.09%, 1/1/17 | | 21,548 |
| 21,468 |
|
| JPMorgan Mortgage Trust, Series 2005-A4, Class 2A1, VRN, 3.16%, 1/1/17 | | 11,928 |
| 11,868 |
|
| JPMorgan Mortgage Trust, Series 2006-A3, Class 7A1, VRN, 3.11%, 1/1/17 | | 22,739 |
| 22,872 |
|
JPMorgan Mortgage Trust, Series 2013-1, Class 2A2 SEQ, VRN, 2.50%, 1/1/17(4) | | 43,095 |
| 42,550 |
|
| MASTR Adjustable Rate Mortgages Trust, Series 2004-13, Class 3A7, VRN, 3.04%, 1/1/17 | | 149,031 |
| 152,523 |
|
| Merrill Lynch Mortgage Investors Trust, Series 2005-3, Class 2A, VRN, 2.94%, 1/25/17 | | 101,508 |
| 99,843 |
|
|
| | | | | | | |
| | | Shares/
Principal Amount | Value |
| Merrill Lynch Mortgage Investors Trust, Series 2005-A2, Class A1, VRN, 2.69%, 1/1/17 | | $ | 50,562 |
| $ | 49,792 |
|
| PHHMC Mortgage Pass-Through Certificates, Series 2007-6, Class A1, VRN, 5.63%, 1/1/17 | | 6,690 |
| 6,899 |
|
| Sequoia Mortgage Trust, Series 2012-1, Class 1A1, VRN, 2.87%, 1/1/17 | | 11,662 |
| 11,764 |
|
Sequoia Mortgage Trust, Series 2013-12, Class A1 SEQ, 4.00%, 12/25/43(4) | | 24,107 |
| 25,002 |
|
Sofi Mortgage Trust 2016-1, Series 2016-1A, Class 1A4 SEQ, VRN, 3.00%, 1/1/17(4) | | 50,000 |
| 47,695 |
|
| Structured Adjustable Rate Mortgage Loan Trust, Series 2004-6, Class 3A2, VRN, 3.15%, 1/1/17 | | 16,705 |
| 17,377 |
|
| Structured Adjustable Rate Mortgage Loan Trust, Series 2004-8, Class 2A1, VRN, 3.04%, 1/1/17 | | 93,007 |
| 92,678 |
|
| Thornburg Mortgage Securities Trust, Series 2004-3, Class A, VRN, 1.50%, 1/25/17 | | 70,032 |
| 64,408 |
|
Towd Point Mortgage Trust, Series 2016-1, Class A1, VRN, 3.50%, 1/1/17(4) | | 78,757 |
| 80,573 |
|
| WaMu Mortgage Pass-Through Certificates, Series 2005-AR3, Class A1, VRN, 2.80%, 1/1/17 | | 123,172 |
| 120,459 |
|
| Wells Fargo Mortgage-Backed Securities Trust, Series 2004-S, Class A1, VRN, 3.04%, 1/1/17 | | 26,003 |
| 26,511 |
|
| Wells Fargo Mortgage-Backed Securities Trust, Series 2004-Z, Class 2A2, VRN, 3.00%, 1/1/17 | | 29,605 |
| 29,955 |
|
| Wells Fargo Mortgage-Backed Securities Trust, Series 2005-17, Class 1A1, 5.50%, 1/25/36 | | 16,917 |
| 16,613 |
|
| Wells Fargo Mortgage-Backed Securities Trust, Series 2005-9, Class 2A6, 5.25%, 10/25/35 | | 37,197 |
| 38,296 |
|
| Wells Fargo Mortgage-Backed Securities Trust, Series 2005-AR10, Class 1A1, VRN, 3.02%, 1/1/17 | | 85,604 |
| 89,049 |
|
| Wells Fargo Mortgage-Backed Securities Trust, Series 2005-AR10, Class 2A15, VRN, 3.01%, 1/1/17 | | 27,802 |
| 28,695 |
|
| Wells Fargo Mortgage-Backed Securities Trust, Series 2005-AR10, Class 2A17, VRN, 3.01%, 1/1/17 | | 53,810 |
| 55,597 |
|
| Wells Fargo Mortgage-Backed Securities Trust, Series 2005-AR16, Class 3A2, VRN, 3.08%, 1/1/17 | | 22,566 |
| 22,672 |
|
| Wells Fargo Mortgage-Backed Securities Trust, Series 2005-AR7, Class 1A1, VRN, 3.09%, 1/1/17 | | 46,210 |
| 46,110 |
|
| Wells Fargo Mortgage-Backed Securities Trust, Series 2006-10, Class A4 SEQ, 6.00%, 8/25/36 | | 28,035 |
| 28,004 |
|
| Wells Fargo Mortgage-Backed Securities Trust, Series 2006-13, Class A5, 6.00%, 10/25/36 | | 20,094 |
| 20,280 |
|
| Wells Fargo Mortgage-Backed Securities Trust, Series 2007-13, Class A1, 6.00%, 9/25/37 | | 17,307 |
| 17,469 |
|
| Wells Fargo Mortgage-Backed Securities Trust, Series 2007-14, Class 2A2, 5.50%, 10/25/22 | | 11,465 |
| 11,774 |
|
| Wells Fargo Mortgage-Backed Securities Trust, Series 2007-16, Class 1A1, 6.00%, 12/28/37 | | 6,738 |
| 7,005 |
|
| Wells Fargo Mortgage-Backed Securities Trust, Series 2007-AR10, Class 1A1, VRN, 6.31%, 1/1/17 | | 21,517 |
| 20,905 |
|
| Wells Fargo Mortgage-Backed Securities Trust, Series 2008-1, Class 4A1, 5.75%, 2/25/38 | | 41,122 |
| 43,261 |
|
| | | | 2,153,736 |
|
| U.S. Government Agency Collateralized Mortgage Obligations — 0.3% | |
| FHLMC, Series 2016-DNA4, Class M2, VRN, 2.06%, 1/25/17 | | 75,000 |
| 74,895 |
|
| FHLMC, Series 2016-HQA3, Class M2, VRN, 2.11%, 1/25/17 | | 75,000 |
| 74,853 |
|
|
| | | | | | | |
| | | Shares/
Principal Amount | Value |
| FHLMC, Series 2926, Class EW SEQ, 5.00%, 1/15/25 | | $ | 70,188 |
| $ | 75,365 |
|
| FNMA, Series 2016-C04, Class 1M1, VRN, 2.21%, 1/25/17 | | 136,657 |
| 137,564 |
|
| FNMA, Series 2016-C05, Class 2M1, VRN, 2.11%, 1/25/17 | | 97,191 |
| 97,435 |
|
| | | | 460,112 |
|
TOTAL COLLATERALIZED MORTGAGE OBLIGATIONS
(Cost $2,613,220) | | | 2,613,848 |
|
COMMERCIAL MORTGAGE-BACKED SECURITIES(5) — 1.8% | | |
Bank of America Merrill Lynch Commercial Mortgage Securities Trust, Series 2014-ICTS, Class A, VRN, 1.50%, 1/15/17(4) | | 125,000 |
| 125,012 |
|
Bank of America Merrill Lynch Commercial Mortgage Securities Trust, Series 2015-200P, Class B, 3.49%, 4/14/33(4) | | 100,000 |
| 100,362 |
|
BLCP Hotel Trust, Series 2014-CLRN, Class A, VRN, 1.65%, 1/15/17(4) | | 216,050 |
| 215,918 |
|
Commercial Mortgage Pass-Through Certificates, Series 2014-BBG, Class A, VRN, 1.50%, 1/15/17(4) | | 150,000 |
| 149,365 |
|
| Commercial Mortgage Pass-Through Certificates, Series 2014-CR15, Class AM SEQ, VRN, 4.43%, 1/1/17 | | 125,000 |
| 133,415 |
|
| Commercial Mortgage Pass-Through Certificates, Series 2014-LC17, Class AM, VRN, 4.19%, 1/1/17 | | 125,000 |
| 130,462 |
|
| Commercial Mortgage Pass-Through Certificates, Series 2014-UBS5, Class AM, VRN, 4.19%, 1/1/17 | | 125,000 |
| 129,406 |
|
| Commercial Mortgage Pass-Through Certificates, Series 2015-CR22, Class AM, VRN, 3.60%, 1/1/17 | | 100,000 |
| 100,632 |
|
| Commercial Mortgage Trust, Series 2016-CD1, Class AM, 2.93%, 8/10/49 | | 50,000 |
| 48,029 |
|
| Commercial Mortgage Trust, Series 2016-CD2, Class A4, VRN, 3.53%, 1/1/17 | | 150,000 |
| 154,473 |
|
Core Industrial Trust, Series 2015-WEST, Class A SEQ, 3.29%, 2/10/37(4) | | 150,000 |
| 150,396 |
|
Hudson Yards Mortgage Trust, Series 2016-10HY, Class A SEQ, 2.84%, 8/10/38(4) | | 250,000 |
| 241,259 |
|
Irvine Core Office Trust, Series 2013-IRV, Class A2 SEQ, VRN, 3.17%, 1/10/17(4) | | 200,000 |
| 202,712 |
|
| JPMBB Commercial Mortgage Securities Trust, Series 2014-C21, Class B, VRN, 4.34%, 1/1/17 | | 75,000 |
| 78,377 |
|
| JPMorgan Chase Commercial Mortgage Securities Trust, Series 2013-C16, Class A4, 4.17%, 12/15/46 | | 50,000 |
| 53,752 |
|
| JPMorgan Chase Commercial Mortgage Securities Trust, Series 2013-C16, Class AS, 4.52%, 12/15/46 | | 75,000 |
| 80,834 |
|
JPMorgan Chase Commercial Mortgage Securities Trust, Series 2014-CBM, Class A, VRN, 1.60%, 1/15/17(4) | | 150,000 |
| 148,882 |
|
| JPMorgan Chase Commercial Mortgage Securities Trust, Series 2016-JP2, Class A4, 2.82%, 8/15/49 | | 100,000 |
| 97,080 |
|
Morgan Stanley Capital I Trust, Series 2014-CPT, Class C, VRN, 3.45%, 1/1/17(4) | | 125,000 |
| 125,828 |
|
TOTAL COMMERCIAL MORTGAGE-BACKED SECURITIES
(Cost $2,479,100) | 2,466,194 |
|
ASSET-BACKED SECURITIES(5) — 1.3% | | | |
American Homes 4 Rent, Series 2014-SFR1, Class A, VRN, 1.74%, 1/17/17(4) | | 227,097 |
| 226,428 |
|
Avis Budget Rental Car Funding AESOP LLC, Series 2012-2A, Class A SEQ, 2.80%, 5/20/18(4) | | 83,333 |
| 83,576 |
|
| Barclays Dryrock Issuance Trust, Series 2014-1, Class A, VRN, 1.06%, 1/17/17 | | 125,000 |
| 125,004 |
|
|
| | | | | | | |
| | | Shares/
Principal Amount | Value |
Chesapeake Funding LLC, Series 2014-1A, Class A, VRN, 1.07%, 1/9/17(4) | | $ | 68,616 |
| $ | 68,398 |
|
Colony Starwood Homes, Series 2016-2A, Class A, VRN, 1.99%, 1/17/17(4) | | 209,520 |
| 209,955 |
|
Dell Equipment Finance Trust, Series 2015-2, Class A2B, VRN, 1.65%, 1/22/17(4) | | 52,259 |
| 52,332 |
|
Enterprise Fleet Financing LLC, Series 2014-1, Class A2 SEQ, 0.87%, 9/20/19(4) | | 3,337 |
| 3,334 |
|
Enterprise Fleet Financing LLC, Series 2015-2, Class A2 SEQ, 1.59%, 2/22/21(4) | | 102,647 |
| 102,604 |
|
Enterprise Fleet Financing LLC, Series 2016-1, Class A2 SEQ, 1.83%, 9/20/21(4) | | 96,676 |
| 96,739 |
|
Hertz Fleet Lease Funding LP, Series 2014-1, Class A, VRN, 1.06%, 1/1/17(4) | | 51,100 |
| 51,079 |
|
Hilton Grand Vacations Trust, Series 2013-A, Class A SEQ, 2.28%, 1/25/26(4) | | 25,044 |
| 24,845 |
|
Hilton Grand Vacations Trust, Series 2014-AA, Class A SEQ, 1.77%, 11/25/26(4) | | 104,726 |
| 102,807 |
|
Invitation Homes Trust, Series 2014-SFR1, Class A, VRN, 1.74%, 1/17/17(4) | | 72,819 |
| 72,600 |
|
MVW Owner Trust, Series 2014-1A, Class A, 2.25%, 9/22/31(4) | | 54,812 |
| 54,154 |
|
MVW Owner Trust, Series 2015-1A, Class A SEQ, 2.52%, 12/20/32(4) | | 66,518 |
| 66,172 |
|
MVW Owner Trust, Series 2016-1A, Class A SEQ, 2.25%, 12/20/33(4) | | 94,591 |
| 92,745 |
|
Progress Residential Trust, Series 2016-SFR2, Class A, VRN, 1.94%, 1/17/17(4) | | 75,000 |
| 75,257 |
|
Sierra Timeshare Receivables Funding LLC, Series 2014-1A, Class A SEQ, 2.07%, 3/20/30(4) | | 74,593 |
| 74,104 |
|
Sierra Timeshare Receivables Funding LLC, Series 2015-1A, Class A, 2.40%, 3/22/32(4) | | 46,278 |
| 46,072 |
|
| Toyota Auto Receivables Owner Trust, Series 2015-C, Class A2B, VRN, 1.03%, 1/17/17 | | 31,690 |
| 31,700 |
|
| US Airways Pass-Through Trust, Series 2013-1, Class A, 3.95%, 5/15/27 | | 16,781 |
| 17,224 |
|
Volvo Financial Equipment LLC, Series 2015-1A, Class A2, 0.95%, 11/15/17(4) | | 6,120 |
| 6,119 |
|
VSE VOI Mortgage LLC, Series 2016-A, Class A SEQ, 2.54%, 7/20/33(4) | | 184,043 |
| 182,061 |
|
TOTAL ASSET-BACKED SECURITIES
(Cost $1,871,742) | | | 1,865,309 |
|
| EXCHANGE-TRADED FUNDS — 0.6% | | | |
SPDR S&P Bank ETF
(Cost $826,327) | | 19,092 |
| 829,929 |
|
| U.S. GOVERNMENT AGENCY SECURITIES — 0.5% | | | |
| FNMA, 2.125%, 4/24/26 | | $ | 40,000 |
| 37,817 |
|
| FNMA, 6.625%, 11/15/30 | | 500,000 |
| 695,319 |
|
TOTAL U.S. GOVERNMENT AGENCY SECURITIES
(Cost $716,709) | | | 733,136 |
|
| MUNICIPAL SECURITIES — 0.5% | | | |
| Bay Area Toll Authority Rev., 6.92%, 4/1/40 | | 20,000 |
| 27,070 |
|
| California GO, (Building Bonds),, 7.60%, 11/1/40 | | 20,000 |
| 30,177 |
|
| Dallas Area Rapid Transit Rev., 6.00%, 12/1/44 | | 25,000 |
| 32,701 |
|
| Los Angeles Community College District GO, 6.68%, 8/1/36 | | 20,000 |
| 26,470 |
|
|
| | | | | | | |
| | | Shares/
Principal Amount | Value |
| Los Angeles Department of Airports Rev., 6.58%, 5/15/39 | | $ | 25,000 |
| $ | 32,105 |
|
| Los Angeles Department of Water & Power Rev., 5.72%, 7/1/39 | | 20,000 |
| 24,487 |
|
| Metropolitan Transportation Authority Rev., 6.81%, 11/15/40 | | 15,000 |
| 20,057 |
|
| Missouri Highway & Transportation Commission Rev., 5.45%, 5/1/33 | | 20,000 |
| 23,786 |
|
| New Jersey State Turnpike Auth. Rev., Series 2009 F, (Building Bonds), 7.41%, 1/1/40 | | 65,000 |
| 93,862 |
|
| Ohio Water Development Authority Water Pollution Control Loan Fund Rev., 4.88%, 12/1/34 | | 30,000 |
| 33,860 |
|
| Oregon State Department of Transportation Highway User Tax Rev., Series 2010 A, (Building Bonds), 5.83%, 11/15/34 | | 20,000 |
| 25,248 |
|
| Port Authority of New York & New Jersey Rev., 4.46%, 10/1/62 | | 45,000 |
| 45,307 |
|
| Rutgers State University of New Jersey Rev., 5.67%, 5/1/40 | | 40,000 |
| 47,080 |
|
| Sacramento Municipal Utility District Electric Rev., Series 2010 W, (Building Bonds), 6.16%, 5/15/36 | | 25,000 |
| 30,579 |
|
| Salt River Project Agricultural Improvement & Power District Rev., 4.84%, 1/1/41 | | 25,000 |
| 28,689 |
|
| San Francisco Public Utilities Commission Water Rev., 6.95%, 11/1/50 | | 20,000 |
| 28,087 |
|
| Santa Clara Valley Transportation Authority Rev., 5.88%, 4/1/32 | | 30,000 |
| 36,360 |
|
| State of California GO, 7.55%, 4/1/39 | | 20,000 |
| 29,776 |
|
| State of California GO, 7.30%, 10/1/39 | | 30,000 |
| 42,477 |
|
| State of Illinois GO, 5.10%, 6/1/33 | | 40,000 |
| 35,866 |
|
TOTAL MUNICIPAL SECURITIES
(Cost $621,280) | | | 694,044 |
|
| SOVEREIGN GOVERNMENTS AND AGENCIES — 0.5% | | | |
Colombia† | | | |
| Colombia Government International Bond, 4.375%, 7/12/21 | | 30,000 |
| 31,500 |
|
Italy† | | | |
| Republic of Italy Government International Bond, 6.875%, 9/27/23 | | 30,000 |
| 35,123 |
|
| Mexico — 0.2% | �� | | |
| Mexico Government International Bond, MTN, 5.95%, 3/19/19 | | 120,000 |
| 129,810 |
|
| Mexico Government International Bond, 5.125%, 1/15/20 | | 70,000 |
| 75,320 |
|
| Mexico Government International Bond, MTN, 4.75%, 3/8/44 | | 60,000 |
| 54,690 |
|
| | | | 259,820 |
|
Peru† | | | |
| Peruvian Government International Bond, 6.55%, 3/14/37 | | 10,000 |
| 12,605 |
|
| Peruvian Government International Bond, 5.625%, 11/18/50 | | 30,000 |
| 34,050 |
|
| | | | 46,655 |
|
| Poland — 0.1% | | | |
| Republic of Poland Government International Bond, 5.125%, 4/21/21 | | 35,000 |
| 38,232 |
|
| Republic of Poland Government International Bond, 3.00%, 3/17/23 | | 10,000 |
| 9,820 |
|
| | | | 48,052 |
|
| Portugal — 0.2% | | | |
Portugal Obrigacoes do Tesouro OT, 2.875%, 10/15/25(4) | EUR | 200,000 |
| 200,086 |
|
|
| | | | | | | |
| | | Shares/
Principal Amount | Value |
Uruguay† | | | |
| Uruguay Government International Bond, 4.125%, 11/20/45 | | $ | 20,000 |
| $ | 16,570 |
|
TOTAL SOVEREIGN GOVERNMENTS AND AGENCIES
(Cost $647,428) | | | 637,806 |
|
| TEMPORARY CASH INVESTMENTS — 3.0% | | | |
State Street Institutional U.S. Government Money Market Fund, Premier Class
(Cost $4,247,161) | 4,247,161 |
| 4,247,161 |
|
TOTAL INVESTMENT SECURITIES — 105.0%
(Cost $132,625,360) | | | 146,348,667 |
|
OTHER ASSETS AND LIABILITIES(7) — (5.0)% | | | (6,947,812 | ) |
| TOTAL NET ASSETS — 100.0% | | | $ | 139,400,855 |
|
|
| | | | | | | | |
| FORWARD FOREIGN CURRENCY EXCHANGE CONTRACTS |
| Currency Purchased | Currency Sold | Counterparty | Settlement Date | Unrealized Appreciation
(Depreciation) |
| USD | 622,701 | EUR | 596,492 | JPMorgan Chase Bank N.A. | 3/15/17 | $ | (7,383 | ) |
|
| | | | | | | | |
| FUTURES CONTRACTS |
| Contracts Purchased | Expiration Date | Underlying Face
Amount at Value | Unrealized Appreciation
(Depreciation) |
| 12 | U.S. Treasury 2-Year Notes | March 2017 | $ | 2,600,250 |
| $ | 1,239 |
|
| 4 | U.S. Treasury 5-Year Notes | March 2017 | 470,656 |
| 741 |
|
| | | | $ | 3,070,906 |
| $ | 1,980 |
|
| | | | | |
| Contracts Sold | Expiration Date | Underlying Face
Amount at Value | Unrealized Appreciation
(Depreciation) |
| 4 | U.S. Treasury 10-Year Ultra Notes | March 2017 | $ | 536,250 |
| $ | (2,447 | ) |
|
| | | | | | | | | | | | | |
| SWAP AGREEMENTS |
| |
| CENTRALLY CLEARED CREDIT DEFAULT |
| Reference Entity | Notional
Amount | Buy/Sell*
Protection | Interest
Rate | Termination
Date | Implied Credit
Spread** | Unrealized Appreciation
(Depreciation) | Value |
| CDX North America Investment Grade 27 Index | $ | 1,000,000 |
| Sell | 1.00% | 12/20/21 | 0.68% | $ | 5,276 |
| $ | 15,463 |
|
|
| | | | | | | | | | |
| TOTAL RETURN |
| Counterparty | Notional
Amount | Floating Rate Referenced Index | Pay/Receive
Total Return of Referenced Index | Fixed Rate | Termination
Date | Value |
| Bank of America N.A. | $ | 500,000 |
| U.S. CPI Urban Consumers NSA Index | Receive | 2.26% | 11/15/26 | $ | 2,427 |
|
| Bank of America N.A. | 500,000 |
| U.S. CPI Urban Consumers NSA Index | Receive | 2.29% | 11/16/26 | 1,130 |
|
| Bank of America N.A. | 500,000 |
| U.S. CPI Urban Consumers NSA Index | Receive | 2.28% | 11/21/26 | 1,676 |
|
| | | | | | | $ | 5,233 |
|
| |
| * | The maximum potential amount the fund could be required to deliver as a seller of credit protection if a credit event occurs as defined under the terms of the agreement is the notional amount. The maximum potential amount may be partially offset by any recovery values of the reference entities and upfront payments received upon entering into the agreement. |
**Implied credit spreads for centrally cleared credit default swap agreements are linked to the weighted average spread across the underlying reference entities included in a particular index. Implied credit spreads serve as an indication of the seller's performance risk related to the likelihood of a credit event occurring as defined in the agreement. Implied credit spreads are used to determine the value of swap agreements and reflect the cost of buying/selling protection, which may include upfront payments made/received upon entering the agreement. Therefore, higher spreads would indicate a greater likelihood that a seller will be obligated to perform under the contract terms. Increasing values, in absolute terms and relative to notional amounts, are also indicative of greater performance risk.
|
| | |
| NOTES TO SCHEDULE OF INVESTMENTS |
| CDX | - | Credit Derivatives Indexes |
| CPI | - | Consumer Price Index |
| EUR | - | Euro |
| FHLMC | - | Federal Home Loan Mortgage Corporation |
| FNMA | - | Federal National Mortgage Association |
| GNMA | - | Government National Mortgage Association |
| GO | - | General Obligation |
| MTN | - | Medium Term Note |
| NSA | - | Not Seasonally Adjusted |
| SEQ | - | Sequential Payer |
| USD | - | United States Dollar |
| VRN | - | Variable Rate Note. Interest reset date is indicated. Rate shown is effective at the period end. |
| |
| † | Category is less than 0.05% of total net assets. |
| |
| (2) | When-issued security. The issue price and yield are fixed on the date of the commitment, but payment and delivery are scheduled for a future date. |
| |
| (3) | Security, or a portion thereof, has been pledged at the custodian bank or with a broker for margin requirements on futures contracts and/or swap agreements. At the period end, the aggregate value of securities pledged was $45,196. |
| |
| (4) | Security was purchased pursuant to Rule 144A under the Securities Act of 1933 and may be sold in transactions exempt from registration, normally to qualified institutional investors. The aggregate value of these securities at the period end was $4,478,011, which represented 3.2% of total net assets. |
| |
| (5) | Final maturity date indicated, unless otherwise noted. |
| |
| (6) | Forward commitment. Settlement date is indicated. |
| |
| (7) | Amount relates primarily to payable for investments purchased, but not settled, at period end. |
See Notes to Financial Statements.
|
|
| Statement of Assets and Liabilities |
|
| | | |
| DECEMBER 31, 2016 | |
| Assets | |
| Investment securities, at value (cost of $132,625,360) | $ | 146,348,667 |
|
| Cash | 4,173 |
|
| Foreign currency holdings, at value (cost of $13,762) | 13,158 |
|
| Receivable for investments sold | 15,792 |
|
| Receivable for capital shares sold | 5,523 |
|
| Receivable for variation margin on swap agreements | 216 |
|
| Swap agreements, at value | 5,233 |
|
| Dividends and interest receivable | 440,237 |
|
| | 146,832,999 |
|
| | |
| Liabilities | |
| Payable for investments purchased | 7,130,087 |
|
| Payable for capital shares redeemed | 195,426 |
|
| Payable for variation margin on futures contracts | 889 |
|
| Unrealized depreciation on forward foreign currency exchange contracts | 7,383 |
|
| Accrued management fees | 94,526 |
|
| Distribution fees payable | 3,833 |
|
| | 7,432,144 |
|
| | |
| Net Assets | $ | 139,400,855 |
|
| | |
| Net Assets Consist of: | |
| Capital (par value and paid-in surplus) | $ | 124,189,407 |
|
| Undistributed net investment income | 127,652 |
|
| Undistributed net realized gain | 1,358,812 |
|
| Net unrealized appreciation | 13,724,984 |
|
| | $ | 139,400,855 |
|
|
| | | | | | |
| | Net Assets | Shares Outstanding | Net Asset Value Per Share |
| Class I, $0.01 Par Value |
| $119,723,590 |
| 17,185,792 |
| $6.97 |
| Class II, $0.01 Par Value |
| $19,677,265 |
| 2,824,210 |
| $6.97 |
See Notes to Financial Statements.
|
| | | |
| YEAR ENDED DECEMBER 31, 2016 | |
| Investment Income (Loss) | |
| Income: | |
| Dividends (net of foreign taxes withheld of $215) | $ | 1,510,932 |
|
| Interest | 1,312,066 |
|
| | 2,822,998 |
|
| | |
| Expenses: | |
| Management fees | 1,083,542 |
|
| Distribution fees - Class II | 13,311 |
|
| Directors' fees and expenses | 3,945 |
|
| Other expenses | 190 |
|
| | 1,100,988 |
|
| Fees waived | (101,717 | ) |
| | 999,271 |
|
| | |
| Net investment income (loss) | 1,823,727 |
|
| | |
| Realized and Unrealized Gain (Loss) | |
| Net realized gain (loss) on: | |
| Investment transactions | 1,956,076 |
|
| Futures contract transactions | (21,881 | ) |
| Swap agreement transactions | 1,008 |
|
| Foreign currency transactions | 29,439 |
|
| | 1,964,642 |
|
| | |
| Change in net unrealized appreciation (depreciation) on: | |
| Investments | 4,003,666 |
|
| Futures contracts | (467 | ) |
| Swap agreements | 10,509 |
|
| Translation of assets and liabilities in foreign currencies | (8,365 | ) |
| | 4,005,343 |
|
| | |
| Net realized and unrealized gain (loss) | 5,969,985 |
|
| | |
| Net Increase (Decrease) in Net Assets Resulting from Operations | $ | 7,793,712 |
|
See Notes to Financial Statements.
|
|
| Statement of Changes in Net Assets |
|
| | | | | | |
| YEARS ENDED DECEMBER 31, 2016 AND DECEMBER 31, 2015 |
| Increase (Decrease) in Net Assets | December 31, 2016 | December 31, 2015 |
| Operations | | |
| Net investment income (loss) | $ | 1,823,727 |
| $ | 1,970,974 |
|
| Net realized gain (loss) | 1,964,642 |
| 5,164,570 |
|
| Change in net unrealized appreciation (depreciation) | 4,005,343 |
| (10,228,986 | ) |
| Net increase (decrease) in net assets resulting from operations | 7,793,712 |
| (3,093,442 | ) |
| | | |
| Distributions to Shareholders | | |
| From net investment income: | | |
| Class I | (1,827,502 | ) | (2,144,865 | ) |
| Class II | (82,398 | ) | — |
|
| From net realized gains: | | |
| Class I | (5,081,856 | ) | (11,983,170 | ) |
| Decrease in net assets from distributions | (6,991,756 | ) | (14,128,035 | ) |
| | | |
| Capital Share Transactions | | |
| Net increase (decrease) in net assets from capital share transactions (Note 5) | 21,895,747 |
| (4,230,694 | ) |
| | | |
| Net increase (decrease) in net assets | 22,697,703 |
| (21,452,171 | ) |
| | | |
| Net Assets | | |
| Beginning of period | 116,703,152 |
| 138,155,323 |
|
| End of period | $ | 139,400,855 |
| $ | 116,703,152 |
|
| | | |
| Undistributed net investment income | $ | 127,652 |
| $ | 87,001 |
|
See Notes to Financial Statements.
|
|
| Notes to Financial Statements |
DECEMBER 31, 2016
1. Organization
American Century Variable Portfolios, Inc. (the corporation) is registered under the Investment Company Act of 1940, as amended (the 1940 Act), as an open-end management investment company and is organized as a Maryland corporation. VP Balanced Fund (the fund) is one fund in a series issued by the corporation. The fund’s investment objective is to seek long-term capital growth and current income by investing approximately 60% of its assets in equity securities and the remainder in bonds and other fixed-income securities.
The fund offers Class I and Class II. The share classes differ principally in their respective distribution and shareholder servicing expenses and arrangements. Sale of Class II commenced on May 2, 2016.
2. Significant Accounting Policies
The following is a summary of significant accounting policies consistently followed by the fund in preparation of its financial statements. The fund is an investment company and follows accounting and reporting guidance in accordance with accounting principles generally accepted in the United States of America. This may require management to make certain estimates and assumptions at the date of the financial statements. Actual results could differ from these estimates. Management evaluated the impact of events or transactions occurring through the date the financial statements were issued that would merit recognition or disclosure.
Investment Valuations — The fund determines the fair value of its investments and computes its net asset value per share at the close of regular trading (usually 4 p.m. Eastern time) on the New York Stock Exchange (NYSE) on each day the NYSE is open. The Board of Directors has adopted valuation policies and procedures to guide the investment advisor in the fund’s investment valuation process and to provide methodologies for the oversight of the fund’s pricing function.
Equity securities that are listed or traded on a domestic securities exchange are valued at the last reported sales price or at the official closing price as provided by the exchange. Equity securities traded on foreign securities exchanges are generally valued at the closing price of such securities on the exchange where primarily traded or at the close of the NYSE, if that is earlier. If no last sales price is reported, or if local convention or regulation so provides, the mean of the latest bid and asked prices may be used. Securities traded over-the-counter are valued at the mean of the latest bid and asked prices, the last sales price, or the official closing price. Equity securities initially expressed in local currencies are translated into U.S. dollars at the mean of the appropriate currency exchange rate at the close of the NYSE as provided by an independent pricing service.
Fixed income securities are valued at the evaluated mean as provided by independent pricing services or at the mean of the most recent bid and asked prices as provided by investment dealers. Corporate bonds, U.S. Treasury and Government Agency securities, convertible bonds, municipal securities, and sovereign governments and agencies are valued using market models that consider trade data, quotations from dealers and active market makers, relevant yield curve and spread data, creditworthiness, trade data or market information on comparable securities, and other relevant security specific information. Mortgage-related and asset-backed securities are valued based on models that consider trade data, prepayment and default projections, benchmark yield and spread data and estimated cash flows of each tranche of the issuer. Fixed income securities initially expressed in local currencies are translated into U.S. dollars at the mean of the appropriate currency exchange rate at the close of the NYSE as provided by an independent pricing service.
Open-end management investment companies are valued at the reported net asset value per share. Exchange-traded futures contracts are valued at the settlement price as provided by the appropriate clearing corporation. Swap agreements are valued at an evaluated mean as provided by independent pricing services or independent brokers. Forward foreign currency exchange contracts are valued at the mean of the appropriate forward exchange rate at the close of the NYSE as provided by an independent pricing service.
If the fund determines that the market price for an investment is not readily available or the valuation methods mentioned above do not reflect an investment’s fair value, such investment is valued as determined in good faith by the Board of Directors or its delegate, in accordance with policies and procedures adopted by the Board of Directors. In its determination of fair value, the fund may review several factors including, but not
limited to, market information regarding the specific investment or comparable investments and correlation with other investment types, futures indices or general market indicators. Circumstances that may cause the fund to use these procedures to value an investment include, but are not limited to: an investment has been declared in default or is distressed; trading in a security has been suspended during the trading day or a security is not actively trading on its principal exchange; prices received from a regular pricing source are deemed unreliable; or there is a foreign market holiday and no trading occurred.
The fund monitors for significant events occurring after the close of an investment’s primary exchange but before the fund’s net asset value per share is determined. Significant events may include, but are not limited to: corporate announcements and transactions; governmental action and political unrest that could impact a specific investment or an investment sector; or armed conflicts, natural disasters and similar events that could affect investments in a specific country or region. The fund also monitors for significant fluctuations between domestic and foreign markets, as evidenced by the U.S. market or such other indicators that the Board of Directors, or its delegate, deems appropriate. If significant fluctuations in foreign markets are identified, the fund may apply a model-derived factor to the closing price of equity securities traded on foreign securities exchanges. The factor is based on observable market data as provided by an independent pricing service.
Security Transactions — Security transactions are accounted for as of the trade date. Net realized gains and losses are determined on the identified cost basis, which is also used for federal income tax purposes.
Investment Income — Dividend income less foreign taxes withheld, if any, is recorded as of the ex-dividend date. Distributions received on securities that represent a return of capital or long-term capital gain are recorded as a reduction of cost of investments and/or as a realized gain. The fund may estimate the components of distributions received that may be considered nontaxable distributions or long-term capital gain distributions for income tax purposes. Interest income is recorded on the accrual basis and includes paydown gain (loss) and accretion of discounts and amortization of premiums. Inflation adjustments related to inflation-linked debt securities are reflected as interest income.
Foreign Currency Translations — All assets and liabilities initially expressed in foreign currencies are translated into U.S. dollars at prevailing exchange rates at period end. The fund may enter into spot foreign currency exchange contracts to facilitate transactions denominated in a foreign currency. Purchases and sales of investment securities, dividend and interest income, spot foreign currency exchange contracts, and expenses are translated at the rates of exchange prevailing on the respective dates of such transactions. Net realized and unrealized foreign currency exchange gains or losses related to investment securities are a component of net realized gain (loss) on investment transactions and change in net unrealized appreciation (depreciation) on investments, respectively.
Forward Commitments — The fund may engage in securities transactions on a forward commitment basis. In these transactions, the securities’ prices and yields are fixed on the date of the commitment. The fund may sell a to-be-announced (TBA) security and at the same time make a commitment to purchase the same security at a future date at a specified price. Conversely, the fund may purchase a TBA security and at the same time make a commitment to sell the same security at a future date at a specified price. These types of transactions are known as “TBA roll” transactions and are accounted for as purchases and sales. The fund will segregate cash, cash equivalents or other appropriate liquid securities on its records in amounts sufficient to meet the purchase price.
Income Tax Status — It is the fund’s policy to distribute substantially all net investment income and net realized gains to shareholders and to otherwise qualify as a regulated investment company under provisions of the Internal Revenue Code. Accordingly, no provision has been made for income taxes. The fund files U.S. federal, state, local and non-U.S. tax returns as applicable. The fund's tax returns are subject to examination by the relevant taxing authority until expiration of the applicable statute of limitations, which is generally three years from the date of filing but can be longer in certain jurisdictions. At this time, management believes there are no uncertain tax positions which, based on their technical merit, would not be sustained upon examination and for which it is reasonably possible that the total amounts of unrecognized tax benefits will significantly change in the next twelve months.
Multiple Class — All shares of the fund represent an equal pro rata interest in the net assets of the class to which such shares belong, and have identical voting, dividend, liquidation and other rights and the same terms and conditions, except for class specific expenses and exclusive rights to vote on matters affecting only individual classes. Income, non-class specific expenses, and realized and unrealized capital gains and losses of the fund are allocated to each class of shares based on their relative net assets.
Segregated Assets — In accordance with the 1940 Act, the fund segregates assets on its books and records to cover certain types of investments, including, but not limited to, futures contracts, forward commitments, when-issued securities, swap agreements and certain forward foreign currency exchange contracts. American Century Investment Management, Inc. (ACIM) (the investment advisor) monitors, on a daily basis, the securities segregated to ensure the fund designates a sufficient amount of liquid assets, marked-to-market daily. The fund may also receive assets or be required to pledge assets at the custodian bank or with a broker for margin requirements on futures contracts, forward commitments and swap agreements.
Distributions to Shareholders — Distributions from net investment income, if any, are generally declared and paid quarterly. Distributions from net realized gains, if any, are generally declared and paid annually.
Indemnifications — Under the corporation’s organizational documents, its officers and directors are indemnified against certain liabilities arising out of the performance of their duties to the fund. In addition, in the normal course of business, the fund enters into contracts that provide general indemnifications. The maximum exposure under these arrangements is unknown as this would involve future claims that may be made against a fund. The risk of material loss from such claims is considered by management to be remote.
3. Fees and Transactions with Related Parties
Certain officers and directors of the corporation are also officers and/or directors of American Century Companies, Inc. (ACC). The corporation’s investment advisor, ACIM, the corporation's distributor, American Century Investment Services, Inc. (ACIS), and the corporation’s transfer agent, American Century Services, LLC, are wholly owned, directly or indirectly, by ACC.
Management Fees — The corporation has entered into a management agreement with ACIM, under which ACIM provides the fund with investment advisory and management services in exchange for a single, unified management fee (the fee) per class. The agreement provides that all expenses of managing and operating the fund, except distribution fees, brokerage expenses, taxes, interest, fees and expenses of the independent directors (including legal counsel fees), and extraordinary expenses, will be paid by ACIM. The fee is computed and accrued daily based on each class's daily net assets and paid monthly in arrears. The rate of the fee is determined by applying a fee rate calculation formula. This formula takes into account the fund’s assets as well as certain assets, if any, of other clients of the investment advisor outside the American Century Investments family of funds (such as subadvised funds and separate accounts) that have very similar investment teams and investment strategies (strategy assets). The annual management fee schedule ranges from 0.80% to 0.90% for Class I and Class II. From January 1, 2016 through July 31, 2016, the investment advisor agreed to waive 0.08% of the fund's management fee. Effective August 1, 2016, the investment advisor agreed to waive 0.09% of the fund's management fee. The investment advisor expects this waiver to continue until July 31, 2017 and cannot terminate it prior to such date without the approval of the Board of Directors. The total amount of the waiver for each class for the year ended December 31, 2016 was $96,954 and $4,763 for Class I and Class II, respectively. The effective annual management fee before waiver for each class for the year ended December 31, 2016 was 0.90%. The effective annual management fee after waiver for each class for the year ended December 31, 2016 was 0.82% for Class I and 0.81% for Class II.
Distribution Fees — The Board of Directors has adopted the Master Distribution Plan (the plan) for Class II, pursuant to Rule 12b-1 of the 1940 Act. The plan provides that Class II will pay ACIS an annual distribution fee equal to 0.25%. The fee is computed and accrued daily based on the Class II daily net assets and paid monthly in arrears. The distribution fee provides compensation for expenses incurred in connection with distributing shares of Class II including, but not limited to, payments to brokers, dealers, and financial institutions that have entered into sales agreements with respect to shares of the fund. Fees incurred under the plan during the year ended December 31, 2016 are detailed in the Statement of Operations.
Directors' Fees and Expenses — The Board of Directors is responsible for overseeing the investment advisor’s management and operations of the fund. The directors receive detailed information about the fund and its investment advisor regularly throughout the year, and meet at least quarterly with management of the investment advisor to review reports about fund operations. The fund’s officers do not receive compensation from the fund.
Interfund Transactions — The fund may enter into security transactions with other American Century Investments funds and other client accounts of the investment advisor, in accordance with the 1940 Act rules and procedures adopted by the Board of Directors. The rules and procedures require, among other things, that these transactions be effected at the independent current market price of the security. During the period, the interfund purchases and sales were $970,002 and $503,959, respectively. The effect of interfund transactions on the Statement of Operations was $91,945 in net realized gain (loss) on investment transactions.
4. Investment Transactions
Purchases of investment securities, excluding short-term investments, for the year ended December 31, 2016 totaled $141,798,662, of which $59,786,420 represented U.S. Treasury and Government Agency obligations.
Sales of investment securities, excluding short-term investments, for the year ended December 31, 2016 totaled $123,133,217, of which $49,914,358 represented U.S. Treasury and Government Agency obligations.
5. Capital Share Transactions
Transactions in shares of the fund were as follows:
|
| | | | | | | | | | |
| | Year ended
December 31, 2016(1) | Year ended
December 31, 2015 |
| | Shares | Amount | Shares | Amount |
| Class I/Shares Authorized | 150,000,000 |
| | 150,000,000 |
| |
| Sold | 2,291,393 |
| $ | 15,761,264 |
| 1,990,222 |
| $ | 14,796,078 |
|
| Issued in reinvestment of distributions | 1,035,110 |
| 6,909,358 |
| 1,946,658 |
| 14,128,035 |
|
| Redeemed | (2,976,120 | ) | (20,317,476 | ) | (4,446,554 | ) | (33,154,807 | ) |
| | 350,383 |
| 2,353,146 |
| (509,674 | ) | (4,230,694 | ) |
| Class II/Shares Authorized | 75,000,000 |
| | N/A |
| |
| Sold | 2,978,190 |
| 20,602,114 |
| | |
| Issued in reinvestment of distributions | 11,826 |
| 82,398 |
| | |
| Redeemed | (165,806 | ) | (1,141,911 | ) | | |
| | 2,824,210 |
| 19,542,601 |
| | |
| Net increase (decrease) | 3,174,593 |
| $ | 21,895,747 |
| (509,674 | ) | $ | (4,230,694 | ) |
| |
| (1) | May 2, 2016 (commencement of sale) through December 31, 2016 for Class II. |
6. Fair Value Measurements
The fund’s investments valuation process is based on several considerations and may use multiple inputs to determine the fair value of the investments held by the fund. In conformity with accounting principles generally accepted in the United States of America, the inputs used to determine a valuation are classified into three broad levels.
| |
| • | Level 1 valuation inputs consist of unadjusted quoted prices in an active market for identical investments. |
| |
| • | Level 2 valuation inputs consist of direct or indirect observable market data (including quoted prices for comparable investments, evaluations of subsequent market events, interest rates, prepayment speeds, credit risk, etc.). These inputs also consist of quoted prices for identical investments initially expressed in local currencies that are adjusted through translation into U.S. dollars. |
| |
| • | Level 3 valuation inputs consist of unobservable data (including a fund’s own assumptions). |
The level classification is based on the lowest level input that is significant to the fair valuation measurement. The valuation inputs are not necessarily an indication of the risks associated with investing in these securities or other financial instruments. There were no significant transfers between levels during the period.
The following is a summary of the level classifications as of period end. The Schedule of Investments provides additional information on the fund’s portfolio holdings.
|
| | | | | | | | |
| | Level 1 | Level 2 | Level 3 |
| Assets | | | |
| Investment Securities | | | |
| Common Stocks | $ | 81,316,897 |
| — |
| — |
|
| U.S. Treasury Securities | — |
| $ | 19,628,941 |
| — |
|
| Corporate Bonds | — |
| 16,975,647 |
| — |
|
| U.S. Government Agency Mortgage-Backed Securities | — |
| 14,339,755 |
| — |
|
| Collateralized Mortgage Obligations | — |
| 2,613,848 |
| — |
|
| Commercial Mortgage-Backed Securities | — |
| 2,466,194 |
| — |
|
| Asset-Backed Securities | — |
| 1,865,309 |
| — |
|
| Exchange-Traded Funds | 829,929 |
| — |
| — |
|
| U.S. Government Agency Securities | — |
| 733,136 |
| — |
|
| Municipal Securities | — |
| 694,044 |
| — |
|
| Sovereign Governments and Agencies | — |
| 637,806 |
| — |
|
| Temporary Cash Investments | 4,247,161 |
| — |
| — |
|
| | $ | 86,393,987 |
| $ | 59,954,680 |
| — |
|
| Other Financial Instruments | | | |
| Futures Contracts | $ | 1,980 |
| — |
| — |
|
| Swap Agreements | — |
| $ | 20,696 |
| — |
|
| | $ | 1,980 |
| $ | 20,696 |
| — |
|
| | | | |
| Liabilities |
| Other Financial Instruments | | | |
| Futures Contracts | $ | 2,447 |
| — |
| — |
|
| Forward Foreign Currency Exchange Contracts | — |
| $ | 7,383 |
| — |
|
| | $ | 2,447 |
| $ | 7,383 |
| — |
|
7. Derivative Instruments
Credit Risk — The fund is subject to credit risk in the normal course of pursuing its investment objectives. The value of a bond generally declines as the credit quality of its issuer declines. Credit default swap agreements enable a fund to buy/sell protection against a credit event of a specific issuer or index. A fund may attempt to enhance returns by selling protection or attempt to mitigate credit risk by buying protection. Upon entering into a centrally cleared swap, a fund is required to deposit cash or securities (initial margin) with a financial intermediary in an amount equal to a certain percentage of the notional amount. Subsequent payments (variation margin) are made or received daily, in cash, by a fund. The variation margin is equal to the daily change in the value and is a component of unrealized gains and losses. Realized gain or loss is recorded upon receipt or payment of a periodic settlement or termination of swap agreements. Net realized and unrealized gains or losses occurring during the holding period of swap agreements are a component of net realized gain (loss) on swap agreement transactions and change in net unrealized appreciation (depreciation) on swap agreements, respectively. The risks of entering into swap agreements include the possible lack of liquidity, failure of the counterparty to meet its obligations, and that there may be unfavorable changes in the underlying investments or instruments. The fund's average notional amount held during the period was $1,000,000.
Equity Price Risk — The fund is subject to equity price risk in the normal course of pursuing its investment objectives. A fund may enter into futures contracts based on an equity index in order to manage its exposure to changes in market conditions. A fund may purchase futures contracts to gain exposure to increases in market value or sell futures contracts to protect against a decline in market value. Upon entering into a futures contract, a fund is required to deposit either cash or securities in an amount equal to a certain percentage of the contract value (initial margin). Subsequent payments (variation margin) are made or received daily, in cash, by a fund. The variation margin is equal to the daily change in the contract value and is recorded as unrealized gains and losses. A fund recognizes a realized gain or loss when the contract is closed or expires. Net realized and unrealized gains or losses occurring during the holding period of futures contracts are a component of net realized gain (loss) on futures contract transactions and change in net unrealized
appreciation (depreciation) on futures contracts, respectively. One of the risks of entering into futures contracts is the possibility that the change in value of the contract may not correlate with the changes in value of the underlying securities. During the period, the fund participated in equity price risk derivative instruments for temporary investment purposes.
Foreign Currency Risk — The fund is subject to foreign currency exchange rate risk in the normal course of pursuing its investment objectives. The value of foreign investments held by a fund may be significantly affected by changes in foreign currency exchange rates. The dollar value of a foreign security generally decreases when the value of the dollar rises against the foreign currency in which the security is denominated and tends to increase when the value of the dollar declines against such foreign currency. A fund may enter into forward foreign currency exchange contracts to reduce a fund's exposure to foreign currency exchange rate fluctuations. The net U.S. dollar value of foreign currency underlying all contractual commitments held by a fund and the resulting unrealized appreciation or depreciation are determined daily. Realized gain or loss is recorded upon the termination of the contract. Net realized and unrealized gains or losses occurring during the holding period of forward foreign currency exchange contracts are a component of net realized gain (loss) on foreign currency transactions and change in net unrealized appreciation (depreciation) on translation of assets and liabilities in foreign currencies, respectively. A fund bears the risk of an unfavorable change in the foreign currency exchange rate underlying the forward contract. Additionally, losses, up to the fair value, may arise if the counterparties do not perform under the contract terms. The fund's average U.S. dollar exposure to foreign currency risk derivative instruments held during the period was $3,057,440.
Interest Rate Risk — The fund is subject to interest rate risk in the normal course of pursuing its investment objectives. The value of bonds generally declines as interest rates rise. A fund may enter into futures contracts based on a bond index or a specific underlying security. A fund may purchase futures contracts to gain exposure to increases in market value or sell futures contracts to protect against a decline in market value. Upon entering into a futures contract, a fund will segregate cash, cash equivalents or other appropriate liquid securities on its records in amounts sufficient to meet requirements. Subsequent payments (variation margin) are made or received daily, in cash, by a fund. The variation margin is equal to the daily change in the contract value and is recorded as unrealized gains and losses. A fund recognizes a realized gain or loss when the futures contract is closed or expires. Net realized and unrealized gains or losses occurring during the holding period of futures contracts are a component of net realized gain (loss) on futures contract transactions and change in net unrealized appreciation (depreciation) on futures contracts, respectively. One of the risks of entering into futures contracts is the possibility that the change in value of the contract may not correlate with the changes in value of the underlying securities. The fund's average exposure to interest rate risk derivative instruments held during the period was 12 contracts.
Other Contracts — A fund may enter into total return swap agreements in order to attempt to obtain or preserve a particular return or spread at a lower cost than obtaining a return or spread through purchases and/or sales of instruments in other markets or gain exposure to certain markets in the most economical way possible. A fund will segregate cash, cash equivalents or other appropriate liquid securities on its records in amounts sufficient to meet requirements. Changes in value, including the periodic amounts of interest to be paid or received on swap agreements, are recorded as unrealized appreciation (depreciation) on swap agreements. Realized gain or loss is recorded upon receipt or payment of a periodic settlement or termination of swap agreements. Net realized and unrealized gains or losses occurring during the holding period of swap agreements are a component of net realized gain (loss) on swap agreement transactions and change in net unrealized appreciation (depreciation) on swap agreements, respectively. The risks of entering into swap agreements include the possible lack of liquidity, failure of the counterparty to meet its obligations, and that there may be unfavorable changes in the underlying investments or instruments, including inflationary risk. The fund's average notional amount held during the period was $1,500,000.
Value of Derivative Instruments as of December 31, 2016
|
| | | | | | | | |
| | Asset Derivatives | | Liability Derivatives |
| Type of Risk Exposure | Location on Statement of Assets and Liabilities | Value | Location on Statement of Assets and Liabilities | Value |
| Credit Risk | Receivable for variation margin on swap agreements* | $ | 216 |
| Payable for variation margin on swap agreements* | — |
|
| Foreign Currency Risk | Unrealized appreciation on forward foreign currency exchange contracts | — |
| Unrealized depreciation on forward foreign currency exchange contracts | $ | 7,383 |
|
| Interest Rate Risk | Receivable for variation margin on futures contracts* | — |
| Payable for variation margin on futures contracts* | 889 |
|
| Other Contracts | Swap agreements | 5,233 |
| Swap agreements | — |
|
| | | $ | 5,449 |
| | $ | 8,272 |
|
| |
| * | Included in the unrealized appreciation (depreciation) on centrally cleared credit default swap agreements or futures contracts, as applicable, as reported in the Schedule of Investments. |
Effect of Derivative Instruments on the Statement of Operations for the Year Ended December 31, 2016
|
| | | | | | | | |
| | Net Realized Gain (Loss) | Change in Net Unrealized Appreciation (Depreciation) |
| Type of Risk Exposure | Location on Statement of Operations | Value | Location on Statement of Operations | Value |
| Credit Risk | Net realized gain (loss) on swap agreement transactions | $ | 1,008 |
| Change in net unrealized appreciation (depreciation) on swap agreements | $ | 5,276 |
|
| Equity Price Risk | Net realized gain (loss) on futures contract transactions | 747 |
| Change in net unrealized appreciation (depreciation) on futures contracts | — |
|
| Foreign Currency Risk | Net realized gain (loss) on foreign currency transactions | 13,174 |
| Change in net unrealized appreciation (depreciation) on translation of assets and liabilities in foreign currencies | (7,383 | ) |
| Interest Rate Risk | Net realized gain (loss) on futures contract transactions | (22,628 | ) | Change in net unrealized appreciation (depreciation) on futures contracts | (467 | ) |
| Other Contracts | Net realized gain (loss) on swap agreement transactions | — |
| Change in net unrealized appreciation (depreciation) on swap agreements | 5,233 |
|
| | | $ | (7,699 | ) | | $ | 2,659 |
|
8. Risk Factors
There are certain risks involved in investing in foreign securities. These risks include those resulting from future adverse political, social and economic developments, fluctuations in currency exchange rates, the possible imposition of exchange controls, and other foreign laws or restrictions.
The fund’s investment process may result in high portfolio turnover, which could mean high transaction costs, affecting both performance and capital gains tax liabilities to investors.
9. Federal Tax Information
The tax character of distributions paid during the years ended December 31, 2016 and December 31, 2015 were as follows:
|
| | | | | | |
| | 2016 | 2015 |
| Distributions Paid From | | |
| Ordinary income | $ | 1,909,900 |
| $ | 4,715,244 |
|
| Long-term capital gains | $ | 5,081,856 |
| $ | 9,412,791 |
|
The book-basis character of distributions made during the year from net investment income or net realized gains may differ from their ultimate characterization for federal income tax purposes. These differences reflect the differing character of certain income items and net realized gains and losses for financial statement and tax purposes, and may result in reclassification among certain capital accounts on the financial statements.
As of December 31, 2016, the federal tax cost of investments and the components of distributable earnings on a tax-basis were as follows:
|
| | | |
| Federal tax cost of investments | $ | 133,094,558 |
|
| Gross tax appreciation of investments | $ | 15,500,579 |
|
| Gross tax depreciation of investments | (2,246,470 | ) |
| Net tax appreciation (depreciation) of investments | 13,254,109 |
|
| Net tax appreciation (depreciation) on derivatives and translation of assets and liabilities in foreign currencies | 9,193 |
|
| Net tax appreciation (depreciation) | $ | 13,263,302 |
|
| Other book-to-tax adjustments | $ | (4,337 | ) |
| Undistributed ordinary income | $ | 120,603 |
|
| Accumulated long-term gains | $ | 1,831,880 |
|
The difference between book-basis and tax-basis unrealized appreciation (depreciation) is attributable primarily to the tax deferral of losses on wash sales. Other book-to-tax adjustments are attributable primarily to the tax deferral of losses on straddle positions.
10. Recently Issued Accounting Guidance
In October 2016, the Securities and Exchange Commission adopted new rules and forms as well as amendments to its rules and forms to modernize the reporting and disclosure of information by registered investment companies. The amendments to Regulation S-X will require standardized, enhanced disclosure about derivatives in investment company financial statements, as well as other provisions. Compliance with the amendments is effective on August 1, 2017. Management is currently evaluating the impact that adopting the amendments will have on the financial statement disclosures.
|
| | | | | | | | | | | | | | | | | |
| For a Share Outstanding Throughout the Years Ended December 31 (except as noted) |
| Per-Share Data | | | | | | Ratios and Supplemental Data | |
| | | Income From Investment Operations: | Distributions From: | | | Ratio to Average Net Assets of: | | |
| | Net Asset
Value,
Beginning
of Period | Net
Investment
Income
(Loss)(1) | Net
Realized
and
Unrealized
Gain (Loss) | Total From
Investment
Operations | Net
Investment
Income | Net
Realized
Gains | Total
Distributions | Net Asset
Value,
End
of Period | Total
Return(2) | Operating
Expenses | Operating
Expenses
(before
expense
waiver) | Net
Investment
Income
(Loss) | Net
Investment
Income (Loss)
(before expense
waiver) | Portfolio
Turnover
Rate | Net
Assets,
End of
Period (in thousands) |
| Class I | | | | | | | | | | | | | | |
| 2016 | $6.93 | 0.10 | 0.36 | 0.46 | (0.11) | (0.31) | (0.42) | $6.97 | 6.99% | 0.82% | 0.90% | 1.53% | 1.45% | 101% |
| $119,724 |
|
| 2015 | $7.97 | 0.12 | (0.29) | (0.17) | (0.13) | (0.74) | (0.87) | $6.93 | (2.57)% | 0.81% | 0.90% | 1.58% | 1.49% | 95% |
| $116,703 |
|
| 2014 | $8.08 | 0.11 | 0.62 | 0.73 | (0.12) | (0.72) | (0.84) | $7.97 | 9.85% | 0.86% | 0.90% | 1.47% | 1.43% | 67% |
| $138,155 |
|
| 2013 | $7.13 | 0.12 | 1.10 | 1.22 | (0.12) | (0.15) | (0.27) | $8.08 | 17.43% | 0.90% | 0.90% | 1.52% | 1.52% | 75% |
| $132,656 |
|
| 2012 | $6.51 | 0.14 | 0.63 | 0.77 | (0.15) | — | (0.15) | $7.13 | 11.80% | 0.90% | 0.90% | 1.99% | 1.99% | 84% |
| $119,822 |
|
| Class II | | | | | | | | | | | | | | |
2016(3) | $6.72 | 0.05 | 0.26 | 0.31 | (0.06) | — | (0.06) | $6.97 | 4.67% | 1.06%(4) | 1.15%(4) | 1.13%(4) | 1.04%(4) | 101%(5) |
| $19,677 |
|
|
| | | | |
| Notes to Financial Highlights | | |
| |
| (1) | Computed using average shares outstanding throughout the period. |
| |
| (2) | Total returns are calculated based on the net asset value of the last business day. Total returns for periods less than one year are not annualized. |
| |
| (3) | May 2, 2016 (commencement of sale) through December 31, 2016. |
| |
| (5) | Portfolio turnover is calculated at the fund level. Percentage indicated was calculated for the year ended December 31, 2016. |
See Notes to Financial Statements.
|
|
| Report of Independent Registered Public Accounting Firm |
To the Board of Directors and Shareholders of American Century Variable Portfolios, Inc.:
We have audited the accompanying statement of assets and liabilities, including the schedule of investments, of VP Balanced Fund (the “Fund”), one of the funds constituting American Century Variable Portfolios, Inc., as of December 31, 2016, and the related statement of operations for the year then ended, the statements of changes in net assets for each of the two years in the period then ended, and the financial highlights for each of the periods presented. These financial statements and financial highlights are the responsibility of the Fund’s management. Our responsibility is to express an opinion on these financial statements and financial highlights based on our audits.
We conducted our audits in accordance with the standards of the Public Company Accounting Oversight Board (United States). Those standards require that we plan and perform the audit to obtain reasonable assurance about whether the financial statements and financial highlights are free of material misstatement. The Fund is not required to have, nor were we engaged to perform, an audit of its internal control over financial reporting. Our audits included consideration of internal control over financial reporting as a basis for designing audit procedures that are appropriate in the circumstances, but not for the purpose of expressing an opinion on the effectiveness of the Fund’s internal control over financial reporting. Accordingly, we express no such opinion. An audit also includes examining, on a test basis, evidence supporting the amounts and disclosures in the financial statements, assessing the accounting principles used and significant estimates made by management, as well as evaluating the overall financial statement presentation. Our procedures included confirmation of securities owned as of December 31, 2016, by correspondence with the custodian and brokers; when replies were not received from brokers, we performed other auditing procedures. We believe that our audits provide a reasonable basis for our opinion.
In our opinion, the financial statements and financial highlights referred to above present fairly, in all material respects, the financial position of VP Balanced Fund of American Century Variable Portfolios, Inc. as of December 31, 2016, the results of its operations for the year then ended, the changes in its net assets for each of the two years in the period then ended, and the financial highlights for each of the periods presented, in conformity with accounting principles generally accepted in the United States of America.
DELOITTE & TOUCHE LLP
Kansas City, Missouri
February 10, 2017
The Board of Directors
The individuals listed below serve as directors of the funds. Each director will continue to serve in this capacity until death, retirement, resignation or removal from office. The board has adopted a mandatory retirement age for directors who are not “interested persons,” as that term is defined in the Investment Company Act (independent directors). Independent directors shall retire by December 31 of the year in which they reach their 75th birthday.
Mr. Thomas is an “interested person” because he currently serves as President and Chief Executive Officer of American Century Companies, Inc. (ACC), the parent company of American Century Investment Management, Inc. (ACIM or the advisor). The other directors (more than three-fourths of the total number) are independent. They are not employees, directors or officers of, and have no financial interest in, ACC or any of its wholly owned, direct or indirect, subsidiaries, including ACIM, American Century Investment Services, Inc. (ACIS) and American Century Services, LLC (ACS), and they do not have any other affiliations, positions or relationships that would cause them to be considered “interested persons” under the Investment Company Act. The directors serve in this capacity for seven (in the case of Mr. Thomas, 15) registered investment companies in the American Century Investments family of funds.
The following table presents additional information about the directors. The mailing address for each director is 4500 Main Street, Kansas City, Missouri 64111.
|
| | | | | |
Name
(Year of Birth) | Position(s) Held with Funds | Length of Time Served | Principal Occupation(s) During Past 5 Years | Number of American Century Portfolios Overseen by Director | Other Directorships Held During Past 5 Years |
| Independent Directors |
|
|
Barry Fink
(1955) | Director | Since 2012 (independent since 2016) | Retired; Executive Vice President, ACC (2007 to 2013); President, ACS (2007 to 2013); Chief Operating Officer, ACC (2007 to 2012) | 81 | None |
Andrea C. Hall
(1945) | Director | Since 1997 | Retired | 81 | None |
Jan M. Lewis
(1957) | Director | Since 2011 | Retired; President and Chief Executive Officer, Catholic Charities of Northeast Kansas (human services organization) (2006 to 2013) | 81 | None |
James A. Olson
(1942) | Director and Chairman of the Board | Since 2007 (Chairman since 2014) | Member, Plaza Belmont LLC (private equity fund manager) (1999 to present) | 81 | Saia, Inc. (2002 to 2012) and EPR Properties (2003 to 2013) |
M. Jeannine Strandjord
(1945) | Director | Since 1994 | Retired | 81 | Euronet Worldwide Inc.; MGP Ingredients, Inc.; and DST Systems Inc. (1996 to 2012) |
|
| | | | | |
Name
(Year of Birth) | Position(s) Held with Funds | Length of Time Served | Principal Occupation(s) During Past 5 Years | Number of American Century Portfolios Overseen by Director | Other Directorships Held During Past 5 Years |
| Independent Directors |
|
|
John R. Whitten
(1946) | Director | Since 2008 | Retired | 81 | Rudolph Technologies, Inc. |
Stephen E. Yates
(1948) | Director | Since 2012 | Retired | 81 | None |
| Interested Director |
|
|
Jonathan S. Thomas
(1963) | Director and President | Since 2007 | President and Chief Executive Officer, ACC (2007 to present). Also serves as Chief Executive Officer, ACS; Executive Vice President, ACIM; Director, ACC, ACIM and other ACC subsidiaries | 126 | BioMed Valley Discoveries, Inc. |
The Statement of Additional Information has additional information about the fund's directors and is available without charge, upon request, by calling 1-800-378-9878.
Officers
The following table presents certain information about the executive officers of the funds. Each officer serves as an officer for each of the 15 investment companies in the American Century family of funds, unless otherwise noted. No officer is compensated for his or her service as an officer of the funds. The listed officers are interested persons of the funds and are appointed or re-appointed on an annual basis. The mailing address for each officer listed below is 4500 Main Street, Kansas City, Missouri 64111.
|
| | |
Name
(Year of Birth) | Offices with the Funds | Principal Occupation(s) During the Past Five Years |
Jonathan S. Thomas
(1963) | Director and President since 2007 | President and Chief Executive Officer, ACC (2007 to present). Also serves as Chief Executive Officer, ACS; Executive Vice President, ACIM; Director, ACC, ACIM and other ACC subsidiaries |
Amy D. Shelton
(1964) | Chief Compliance Officer and Vice President since 2014 | Chief Compliance Officer, American Century funds, (2014 to present); Chief Compliance Officer, ACIM (2014 to present); Chief Compliance Officer, ACIS (2009 to present); Vice President, Client Interactions and Marketing, ACIS (2013 to 2014); Director, Client Interactions and Marketing, ACIS (2007 to 2013). Also serves as Vice President, ACIS |
Charles A. Etherington
(1957) | General Counsel since 2007 and Senior Vice President since 2006 | Attorney, ACC (1994 to present); Vice President, ACC (2005 to present); General Counsel, ACC (2007 to present). Also serves as General Counsel, ACIM, ACS, ACIS and other ACC subsidiaries; and Senior Vice President, ACIM and ACS |
C. Jean Wade
(1964) | Vice President,Treasurer and Chief Financial Officer since 2012 | Vice President, ACS (2000 to present) |
Robert J. Leach
(1966) | Vice President since 2006 and Assistant Treasurer since 2012 | Vice President, ACS (2000 to present) |
David H. Reinmiller
(1963) | Vice President since 2000 | Attorney, ACC (1994 to present); Associate General Counsel, ACC (2001 to present). Also serves as Vice President, ACIM and ACS |
Ward D. Stauffer
(1960) | Secretary since 2005 | Attorney, ACC (2003 to present) |
Proxy Voting Policies
A description of the policies that the fund's investment advisor uses in exercising the voting rights associated with the securities purchased and/or held by the fund is available without charge, upon request, by calling 1-800-378-9878. It is also available on the "About Us" page of American Century Investments’ website at americancentury.com and on the Securities and Exchange Commission’s website at sec.gov. Information regarding how the investment advisor voted proxies relating to portfolio securities during the most recent 12-month period ended June 30 is available on the "About Us" page at americancentury.com. It is also available at sec.gov.
Quarterly Portfolio Disclosure
The fund files its complete schedule of portfolio holdings with the Securities and Exchange Commission (SEC) for the first and third quarters of each fiscal year on Form N-Q. The fund’s Forms N-Q are available on the SEC’s website at sec.gov, and may be reviewed and copied at the SEC’s Public Reference Room in Washington, DC. Information on the operation of the Public Reference Room may be obtained by calling 1-800-SEC-0330. The fund also makes its complete schedule of portfolio holdings for the most recent quarter of its fiscal year available on its website at ipro.americancentury.com (for Investment Professionals) and, upon request, by calling 1-800-378-9878.
Other Tax Information
The following information is provided pursuant to provisions of the Internal Revenue Code.
For corporate taxpayers, the fund hereby designates $1,386,738, or up to the maximum amount allowable, of ordinary income distributions paid during the fiscal year ended December 31, 2016 as qualified for the corporate dividends received deduction.
The fund hereby designates $5,081,856, or up to the maximum amount allowable, as long-term capital gain distributions (20% rate gain distributions) for the fiscal year ended December 31, 2016.
|
| | |
| |
| | | |
| Contact Us | americancentury.com | |
| Automated Information Line | 1-800-345-8765 | |
| Investment Professional Service Representatives | 1-800-345-6488 | |
| Telecommunications Relay Service for the Deaf | 711 | |
| | | |
| American Century Variable Portfolios, Inc. | |
| | | |
Investment Advisor: American Century Investment Management, Inc. Kansas City, Missouri | |
| | | |
| This report and the statements it contains are submitted for the general information of our shareholders. The report is not authorized for distribution to prospective investors unless preceded or accompanied by an effective prospectus. | |
| | | |
©2017 American Century Proprietary Holdings, Inc. All rights reserved.
CL-ANN-91439 1702 | |
|
| |
| | |
| | Annual Report |
| | |
| | December 31, 2016 |
| | |
| | VP Capital Appreciation Fund |
|
| | |
| Performance | 2 |
|
| Portfolio Commentary | |
|
| Fund Characteristics | |
|
| Shareholder Fee Example | |
|
| Schedule of Investments | |
|
| Statement of Assets and Liabilities | |
|
| Statement of Operations | |
|
| Statement of Changes in Net Assets | |
|
| Notes to Financial Statements | |
|
| Financial Highlights | |
|
| Report of Independent Registered Public Accounting Firm | |
|
| Management | |
|
| Additional Information | |
|
Any opinions expressed in this report reflect those of the author as of the date of the report, and do not necessarily represent the opinions of American Century Investments® or any other person in the American Century Investments organization. Any such opinions are subject to change at any time based upon market or other conditions and American Century Investments disclaims any responsibility to update such opinions. These opinions may not be relied upon as investment advice and, because investment decisions made by American Century Investments funds are based on numerous factors, may not be relied upon as an indication of trading intent on behalf of any American Century Investments fund. Security examples are used for representational purposes only and are not intended as recommendations to purchase or sell securities. Performance information for comparative indices and securities is provided to American Century Investments by third party vendors. To the best of American Century Investments’ knowledge, such information is accurate at the time of printing.
|
| | | | | | |
| Total Returns as of December 31, 2016 |
| | | | Average Annual Returns | |
| | Ticker Symbol | 1 year | 5 years | 10 years | Since Inception | Inception Date |
| Class I | AVCIX | 3.23% | 11.55% | 8.59% | — | 11/20/87 |
Russell Midcap Growth Index | — | 7.33% | 13.49% | 7.83% | — | — |
| Class II | AVCWX | 3.08% | — | — | 5.74% | 4/25/14 |
Average annual returns since inception are presented when ten years of performance history is not available.
Fund returns would have been lower if a portion of the fees had not been waived.
The performance information presented does not include charges and deductions imposed by the insurance company separate account under the variable annuity or variable life insurance contracts. The inclusion of such charges could significantly lower performance. Please refer to the insurance company separate account prospectus for a discussion of the charges related to insurance contracts.
Data presented reflect past performance. Past performance is no guarantee of future results. Current performance may be higher or lower than the performance shown. Total returns for periods less than one year are not annualized. Investment return and principal value will fluctuate, and redemption value may be more or less than original cost. Data assumes reinvestment of dividends and capital gains, and none of the charts reflect the deduction of taxes that a shareholder would pay on fund distributions or the redemption of fund shares. To obtain performance data current to the most recent month end, please call 1-800-345-6488 or visit ipro.americancentury.com (for Investment Professionals). For additional information about the fund, please consult the prospectus.
|
|
| Growth of $10,000 Over 10 Years |
| $10,000 investment made December 31, 2006 |
| Performance for other share classes will vary due to differences in fee structure. |
|
| |
| Value on December 31, 2016 |
| | Class I — $22,816 |
| |
| | Russell Midcap Growth Index — $21,255 |
| |
Ending value of Class I would have been lower if a portion of the fees had not been waived.
|
| |
| Total Annual Fund Operating Expenses |
| Class I | Class II |
| 1.00% | 1.15% |
The total annual fund operating expenses shown is as stated in the fund’s prospectus current as of the date of this report. The prospectus may vary from the expense ratio shown elsewhere in this report because it is based on a different time period, includes acquired fund fees and expenses, and, if applicable, does not include fee waivers or expense reimbursements.
Data presented reflect past performance. Past performance is no guarantee of future results. Current performance may be higher or lower than the performance shown. Total returns for periods less than one year are not annualized. Investment return and principal value will fluctuate, and redemption value may be more or less than original cost. Data assumes reinvestment of dividends and capital gains, and none of the charts reflect the deduction of taxes that a shareholder would pay on fund distributions or the redemption of fund shares. To obtain performance data current to the most recent month end, please call 1-800-345-6488 or visit ipro.americancentury.com (for Investment Professionals). For additional information about the fund, please consult the prospectus.
Portfolio Managers: David Hollond, Greg Walsh, and Nalin Yogasundram
Nalin Yogasundram, senior investment analyst for the fund, was promoted to portfolio manager in March 2016. David Hollond has announced his intention to retire effective February 2017 and will no longer manage the fund.
Performance Summary
VP Capital Appreciation returned 3.23%* for the 12 months ended December 31, 2016, lagging the 7.33% return of the portfolio’s benchmark, the Russell Midcap Growth Index.
U.S. stock indices delivered positive returns during the reporting period. Value stocks outperformed growth stocks by a wide margin across the capitalization spectrum, however, creating a headwind for our investment style. Within the Russell Midcap Growth Index, energy posted by far the largest gains as oil prices rose and OPEC announced production cuts. Materials, financials, information technology, industrials, and utilities also recorded double-digit gains. Health care was the only sector to decline for the year. Stocks in the sector were hampered by concerns about the sustainability of high prescription drug prices and, following the presidential election, worries that a repeal of the Affordable Care Act (ACA) would curtail spending by hospitals.
The fund’s underperformance relative to the benchmark was driven by stock selection in the information technology and consumer discretionary sectors. Stock choices in real estate and industrials also detracted. Stock selection in the health care sector aided relative performance, as did an overweight allocation to financials.
Information Technology Stocks Led Detractors
Stock decisions in the internet software and services and semiconductors and semiconductor equipment industries detracted significantly. Employment social media site LinkedIn hampered results. Although we were underweight on average relative to the benchmark during the period, we were overweight the stock in February when the company offered weaker-than-expected guidance. The stock rose after Microsoft announced it would acquire LinkedIn, but the portfolio’s position size was smaller and less impactful at that time. As a result of the buyout offer, LinkedIn was eliminated. Private-label credit card company Alliance Data Systems fell on worries about credit trends and foreign exchange weakness because of its Canadian exposure.
In the consumer discretionary sector, an out-of-benchmark holding in high-end furniture retailer Restoration Hardware detracted. The company missed earnings expectations due to delays in getting orders delivered for its new RH Modern line. Investors also questioned the company’s sales strategy as it moves from a promotional to customer-loyalty approach. The holding was eliminated. Signet Jewelers suffered along with most mall retailers due to poor traffic during the cool spring. The company offered somewhat weak guidance as well. Investors also worried about the company’s credit book. We sold the holding.
* All fund returns referenced in this commentary are for Class I shares. Fund returns would have been lower if
a portion of the fees had not been waived. Performance for other share classes will vary due to differences in
fee structure; when Class I performance exceeds that of the fund’s benchmark, other share classes may not.
See page 2 for returns for all share classes.
Stock selection in the real estate sector detracted, as did an underweight to equity real estate investment trusts (REITs). REITs continued to benefit from low interest rates, but we remain underweight the industry, because we believe valuations for REITs are elevated relative to history, and the group has benefited from declines in interest rates that likely are not sustainable longer term. The U.S. Federal Reserve raised rates in December and suggested further rate hikes in 2017. Commercial real estate investment manager Jones Lang LaSalle underperformed and was eliminated after reporting lower revenues and offering weaker guidance in regards to its investment management business.
Health Care Benefited Performance
The top contributor in the health care sector was Teleflex, which makes medical devices used in critical care and surgery. The company reported results that beat expectations and gave guidance that was strong relative to the industry. Teleflex’s revenues are accelerating, and it moved to phase two of a restructuring in its manufacturing processes, which should help long-term profitability. Not owning several benchmark components in the pharmaceuticals, health care technology, and health care providers and services industries was beneficial, as many of these stocks fell sharply on concerns about the sustainability of prescription drug prices and the possibility that the ACA would be repealed.
The financials sector performed well following the election on anticipated stronger economic growth, higher interest rates, and deregulation. Asset-sensitive financials such as key contributor Discover Financial Services, a non-benchmark holding, are expected to benefit from a decreased regulatory burden, which would free up capital.
Other significant relative contributors included Burlington Stores. The off-price retailer reported positive results and offered better-than-expected guidance for same-store sales, driven by strong traffic and sales across multiple categories. Margins are improving at an increasing rate, and earnings per share came in well above guidance. Energy exploration firm Concho Resources—which is not in the benchmark—was a key contributor, benefiting from a relatively healthy balance sheet and a rebound in energy markets as production is curtailed. Concho also provided better-than-expected earnings guidance.
Applied Materials, which supplies equipment and services to the semiconductor industry, benefited from increasing demand for organic light-emitting diodes (OLEDs), which allow for thinner, flexible screens for smartphones and televisions, higher-end memory for smartphones, and a rebound in some of its other end markets. The stock was eliminated on valuation concerns as the stock had outperformed. Marketing analytics and ratings service Nielsen Holdings was a top contributor as the stock benefited from the market’s defensive sentiment. We eliminated the position on valuation concerns and because our investment thesis, which was tied to the company’s new digital product, had played out.
Outlook
VP Capital Appreciation’s investment process focuses on medium-sized and smaller companies with improving business fundamentals. The fund’s positioning remains largely stock specific.
As of December 31, 2016, the largest overweight allocations relative to the benchmark were in industrials, information technology, and financials. The largest underweight sectors were real estate, consumer discretionary, and health care.
|
| |
| DECEMBER 31, 2016 |
| Top Ten Holdings | % of net assets |
| Newell Brands, Inc. | 2.8% |
| Zoetis, Inc. | 2.2% |
| Ball Corp. | 1.9% |
| Electronic Arts, Inc. | 1.8% |
| Middleby Corp. (The) | 1.8% |
| Kellogg Co. | 1.7% |
| Equinix, Inc. | 1.6% |
| Fidelity National Information Services, Inc. | 1.5% |
| Broadcom Ltd. | 1.5% |
| Vulcan Materials Co. | 1.5% |
| | |
| Top Five Industries | % of net assets |
| Software | 7.0% |
| IT Services | 6.9% |
| Machinery | 6.4% |
| Specialty Retail | 6.4% |
| Health Care Equipment and Supplies | 5.7% |
| | |
| Types of Investments in Portfolio | % of net assets |
| Common Stocks | 99.5% |
| Temporary Cash Investments | 0.4% |
| Other Assets and Liabilities | 0.1% |
Fund shareholders may incur two types of costs: (1) transaction costs, including sales charges (loads) on purchase payments and redemption/exchange fees; and (2) ongoing costs, including management fees; distribution and service (12b-1) fees; and other fund expenses. This example is intended to help you understand your ongoing costs (in dollars) of investing in your fund and to compare these costs with the ongoing cost of investing in other mutual funds.
The example is based on an investment of $1,000 made at the beginning of the period and held for the entire period from July 1, 2016 to December 31, 2016.
Actual Expenses
The table provides information about actual account values and actual expenses for each class. You may use the information, together with the amount you invested, to estimate the expenses that you paid over the period. First, identify the share class you own. Then simply divide your account value by $1,000 (for example, an $8,600 account value divided by $1,000 = 8.6), then multiply the result by the number under the heading “Expenses Paid During Period” to estimate the expenses you paid on your account during this period.
Hypothetical Example for Comparison Purposes
The table also provides information about hypothetical account values and hypothetical expenses based on the actual expense ratio of each class of your fund and an assumed rate of return of 5% per year before expenses, which is not the actual return of a fund’s share class. The hypothetical account values and expenses may not be used to estimate the actual ending account balance or expenses you paid for the period. You may use this information to compare the ongoing costs of investing in your fund and other funds. To do so, compare this 5% hypothetical example with the 5% hypothetical examples that appear in the shareholder reports of the other funds.
Please note that the expenses shown in the table are meant to highlight your ongoing costs only and do not reflect any transactional costs, such as sales charges (loads) or redemption/exchange fees. Therefore, the table is useful in comparing ongoing costs only, and will not help you determine the relative total costs of owning different funds. In addition, if these transactional costs were included, your costs would have been higher.
|
| | | | |
| | Beginning
Account Value
7/1/16 | Ending
Account Value
12/31/16 | Expenses Paid
During Period(1)
7/1/16 - 12/31/16 | Annualized Expense Ratio(1) |
| Actual | | | | |
| Class I (after waiver) | $1,000 | $1,026.40 | $5.04 | 0.99% |
| Class I (before waiver) | $1,000 | $1,026.40(2) | $5.09 | 1.00% |
| Class II (after waiver) | $1,000 | $1,025.00 | $5.80 | 1.14% |
| Class II (before waiver) | $1,000 | $1,025.00(2) | $5.85 | 1.15% |
| Hypothetical | | | | |
| Class I (after waiver) | $1,000 | $1,020.16 | $5.03 | 0.99% |
| Class I (before waiver) | $1,000 | $1,020.11 | $5.08 | 1.00% |
| Class II (after waiver) | $1,000 | $1,019.41 | $5.79 | 1.14% |
| Class II (before waiver) | $1,000 | $1,019.36 | $5.84 | 1.15% |
| |
| (1) | Expenses are equal to the class's annualized expense ratio listed in the table above, multiplied by the average account value over the period, multiplied by 184, the number of days in the most recent fiscal half-year, divided by 366, to reflect the one-half year period. |
| |
| (2) | Ending account value assumes the return earned after waiver and would have been lower if a portion of the fees had not been waived. |
DECEMBER 31, 2016
|
| | | | | |
| | Shares | Value |
| COMMON STOCKS — 99.5% | | |
| Aerospace and Defense — 0.6% | | |
| L3 Technologies, Inc. | 18,391 |
| $ | 2,797,455 |
|
| Airlines — 1.0% | | |
Spirit Airlines, Inc.(1) | 78,044 |
| 4,515,626 |
|
| Auto Components — 0.9% | | |
| Delphi Automotive plc | 63,848 |
| 4,300,163 |
|
| Banks — 2.1% | | |
| BankUnited, Inc. | 76,413 |
| 2,880,006 |
|
SVB Financial Group(1) | 25,235 |
| 4,331,840 |
|
| Zions Bancorp | 61,110 |
| 2,630,174 |
|
| | | 9,842,020 |
|
| Beverages — 3.0% | | |
| Constellation Brands, Inc., Class A | 34,960 |
| 5,359,718 |
|
| Molson Coors Brewing Co., Class B | 47,393 |
| 4,611,813 |
|
Monster Beverage Corp.(1) | 88,130 |
| 3,907,684 |
|
| | | 13,879,215 |
|
| Biotechnology — 3.1% | | |
Alexion Pharmaceuticals, Inc.(1) | 21,433 |
| 2,622,328 |
|
Alkermes plc(1) | 23,859 |
| 1,326,083 |
|
BioMarin Pharmaceutical, Inc.(1) | 29,305 |
| 2,427,626 |
|
Incyte Corp.(1) | 55,076 |
| 5,522,470 |
|
Neurocrine Biosciences, Inc.(1) | 19,936 |
| 771,523 |
|
Puma Biotechnology, Inc.(1) | 52,281 |
| 1,605,027 |
|
| | | 14,275,057 |
|
| Building Products — 1.5% | | |
| Fortune Brands Home & Security, Inc. | 68,508 |
| 3,662,438 |
|
| Lennox International, Inc. | 19,767 |
| 3,027,711 |
|
| | | 6,690,149 |
|
| Capital Markets — 3.3% | | |
Affiliated Managers Group, Inc.(1) | 37,796 |
| 5,491,759 |
|
| S&P Global, Inc. | 39,702 |
| 4,269,553 |
|
| SEI Investments Co. | 111,096 |
| 5,483,698 |
|
| | | 15,245,010 |
|
| Chemicals — 1.8% | | |
Axalta Coating Systems Ltd.(1) | 88,411 |
| 2,404,779 |
|
Ingevity Corp.(1) | 50,158 |
| 2,751,668 |
|
| Scotts Miracle-Gro Co. (The), Class A | 31,864 |
| 3,044,605 |
|
| | | 8,201,052 |
|
| Commercial Services and Supplies — 0.9% | | |
| KAR Auction Services, Inc. | 78,561 |
| 3,348,270 |
|
| Ritchie Bros Auctioneers, Inc. | 17,689 |
| 601,426 |
|
| | | 3,949,696 |
|
| Communications Equipment — 0.6% | | |
ARRIS International plc(1) | 93,058 |
| 2,803,838 |
|
| Construction Materials — 1.5% | | |
| Vulcan Materials Co. | 55,904 |
| 6,996,386 |
|
|
| | | | | |
| | Shares | Value |
| Consumer Finance — 1.2% | | |
| Discover Financial Services | 79,955 |
| $ | 5,763,956 |
|
| Containers and Packaging — 1.9% | | |
| Ball Corp. | 116,799 |
| 8,768,101 |
|
| Distributors — 1.3% | | |
LKQ Corp.(1) | 191,692 |
| 5,875,360 |
|
| Diversified Telecommunication Services — 1.2% | | |
SBA Communications Corp., Class A(1) | 52,745 |
| 5,446,449 |
|
| Electrical Equipment — 1.4% | | |
| Acuity Brands, Inc. | 13,759 |
| 3,176,402 |
|
| AMETEK, Inc. | 67,298 |
| 3,270,683 |
|
| | | 6,447,085 |
|
| Electronic Equipment, Instruments and Components — 2.5% | | |
| CDW Corp. | 82,293 |
| 4,286,642 |
|
| Dolby Laboratories, Inc., Class A | 63,776 |
| 2,882,038 |
|
Trimble, Inc.(1) | 141,582 |
| 4,268,697 |
|
| | | 11,437,377 |
|
| Equity Real Estate Investment Trusts (REITs) — 2.5% | | |
| Crown Castle International Corp. | 47,362 |
| 4,109,601 |
|
| Equinix, Inc. | 20,646 |
| 7,379,087 |
|
| | | 11,488,688 |
|
| Food and Staples Retailing — 0.8% | | |
| Costco Wholesale Corp. | 21,964 |
| 3,516,656 |
|
| Food Products — 3.1% | | |
Blue Buffalo Pet Products, Inc.(1) | 122,237 |
| 2,938,578 |
|
| Kellogg Co. | 103,320 |
| 7,615,717 |
|
TreeHouse Foods, Inc.(1) | 51,390 |
| 3,709,844 |
|
| | | 14,264,139 |
|
| Health Care Equipment and Supplies — 5.7% | | |
| Baxter International, Inc. | 138,357 |
| 6,134,749 |
|
Edwards Lifesciences Corp.(1) | 23,489 |
| 2,200,919 |
|
Nevro Corp.(1) | 40,436 |
| 2,938,080 |
|
NuVasive, Inc.(1) | 62,903 |
| 4,237,146 |
|
| Teleflex, Inc. | 42,837 |
| 6,903,183 |
|
| West Pharmaceutical Services, Inc. | 46,291 |
| 3,926,866 |
|
| | | 26,340,943 |
|
| Health Care Providers and Services — 1.7% | | |
Amedisys, Inc.(1) | 17,034 |
| 726,159 |
|
| Humana, Inc. | 16,582 |
| 3,383,226 |
|
| Universal Health Services, Inc., Class B | 19,887 |
| 2,115,579 |
|
VCA, Inc.(1) | 25,655 |
| 1,761,216 |
|
| | | 7,986,180 |
|
| Hotels, Restaurants and Leisure — 4.9% | | |
Chipotle Mexican Grill, Inc.(1) | 6,040 |
| 2,279,013 |
|
| Hilton Worldwide Holdings, Inc. | 119,263 |
| 3,243,954 |
|
| Las Vegas Sands Corp. | 57,344 |
| 3,062,743 |
|
MGM Resorts International(1) | 171,195 |
| 4,935,552 |
|
Panera Bread Co., Class A(1) | 16,084 |
| 3,298,667 |
|
| Papa John's International, Inc. | 30,069 |
| 2,573,305 |
|
| Vail Resorts, Inc. | 20,898 |
| 3,371,056 |
|
| | | 22,764,290 |
|
|
| | | | | |
| | Shares | Value |
| Household Durables — 2.8% | | |
| Newell Brands, Inc. | 289,659 |
| $ | 12,933,274 |
|
| Internet and Direct Marketing Retail — 1.1% | | |
Duluth Holdings, Inc., Class B(1) | 16,714 |
| 424,536 |
|
| Expedia, Inc. | 39,269 |
| 4,448,392 |
|
| | | 4,872,928 |
|
| Internet Software and Services — 1.9% | | |
CoStar Group, Inc.(1) | 24,096 |
| 4,541,855 |
|
eBay, Inc.(1) | 138,728 |
| 4,118,834 |
|
| | | 8,660,689 |
|
| IT Services — 6.9% | | |
| Alliance Data Systems Corp. | 24,456 |
| 5,588,196 |
|
| Booz Allen Hamilton Holding Corp. | 157,910 |
| 5,695,814 |
|
| Computer Sciences Corp. | 67,354 |
| 4,002,174 |
|
| Fidelity National Information Services, Inc. | 93,314 |
| 7,058,271 |
|
| Sabre Corp. | 132,105 |
| 3,296,020 |
|
Vantiv, Inc., Class A(1) | 106,227 |
| 6,333,254 |
|
| | | 31,973,729 |
|
| Machinery — 6.4% | | |
| Ingersoll-Rand plc | 49,531 |
| 3,716,806 |
|
| John Bean Technologies Corp. | 32,251 |
| 2,771,973 |
|
| Kennametal, Inc. | 31,773 |
| 993,224 |
|
Middleby Corp. (The)(1) | 62,649 |
| 8,069,818 |
|
| Parker-Hannifin Corp. | 17,071 |
| 2,389,940 |
|
| Snap-on, Inc. | 34,243 |
| 5,864,799 |
|
WABCO Holdings, Inc.(1) | 27,339 |
| 2,902,035 |
|
| Xylem Inc | 56,577 |
| 2,801,693 |
|
| | | 29,510,288 |
|
| Media — 0.9% | | |
Charter Communications, Inc., Class A(1) | 14,887 |
| 4,286,265 |
|
| Multiline Retail — 2.0% | | |
| Dollar General Corp. | 52,034 |
| 3,854,159 |
|
Dollar Tree, Inc.(1) | 69,335 |
| 5,351,275 |
|
| | | 9,205,434 |
|
| Oil, Gas and Consumable Fuels — 2.0% | | |
Concho Resources, Inc.(1) | 42,592 |
| 5,647,699 |
|
Gulfport Energy Corp.(1) | 84,541 |
| 1,829,467 |
|
Newfield Exploration Co.(1) | 41,979 |
| 1,700,150 |
|
| | | 9,177,316 |
|
| Pharmaceuticals — 3.0% | | |
Catalent, Inc.(1) | 130,606 |
| 3,521,138 |
|
| Zoetis, Inc. | 190,830 |
| 10,215,130 |
|
| | | 13,736,268 |
|
| Professional Services — 2.9% | | |
| Equifax, Inc. | 57,049 |
| 6,744,903 |
|
Verisk Analytics, Inc., Class A(1) | 82,860 |
| 6,725,746 |
|
| | | 13,470,649 |
|
| Road and Rail — 2.2% | | |
| Canadian Pacific Railway Ltd. (New York) | 31,869 |
| 4,549,937 |
|
| Norfolk Southern Corp. | 52,739 |
| 5,699,504 |
|
| | | 10,249,441 |
|
|
| | | | | |
| | Shares | Value |
| Semiconductors and Semiconductor Equipment — 4.3% | | |
| Broadcom Ltd. | 39,710 |
| $ | 7,019,537 |
|
Cavium, Inc.(1) | 51,280 |
| 3,201,923 |
|
| KLA-Tencor Corp. | 59,578 |
| 4,687,597 |
|
| NVIDIA Corp. | 44,425 |
| 4,741,924 |
|
| | | 19,650,981 |
|
| Software — 7.0% | | |
| CDK Global, Inc. | 71,243 |
| 4,252,495 |
|
Electronic Arts, Inc.(1) | 106,644 |
| 8,399,281 |
|
Guidewire Software, Inc.(1) | 60,403 |
| 2,979,680 |
|
ServiceNow, Inc.(1) | 57,741 |
| 4,292,466 |
|
Splunk, Inc.(1) | 65,201 |
| 3,335,031 |
|
| Symantec Corp. | 154,682 |
| 3,695,353 |
|
Tyler Technologies, Inc.(1) | 36,425 |
| 5,200,397 |
|
| | | 32,154,703 |
|
| Specialty Retail — 6.4% | | |
AutoZone, Inc.(1) | 6,252 |
| 4,937,767 |
|
Burlington Stores, Inc.(1) | 48,107 |
| 4,077,068 |
|
Michaels Cos., Inc. (The)(1) | 96,206 |
| 1,967,413 |
|
O'Reilly Automotive, Inc.(1) | 19,639 |
| 5,467,694 |
|
| Ross Stores, Inc. | 100,800 |
| 6,612,480 |
|
Ulta Salon, Cosmetics & Fragrance, Inc.(1) | 17,416 |
| 4,440,035 |
|
| Williams-Sonoma, Inc. | 41,239 |
| 1,995,555 |
|
| | | 29,498,012 |
|
| Textiles, Apparel and Luxury Goods — 1.2% | | |
| Coach, Inc. | 69,498 |
| 2,433,820 |
|
Under Armour, Inc., Class A(1) | 38,602 |
| 1,121,388 |
|
Under Armour, Inc., Class C(1) | 78,907 |
| 1,986,089 |
|
| | | 5,541,297 |
|
TOTAL COMMON STOCKS
(Cost $383,262,997) | | 458,516,165 |
|
| TEMPORARY CASH INVESTMENTS — 0.4% | | |
| Repurchase Agreement, Fixed Income Clearing Corp., (collateralized by various U.S. Treasury obligations, 3.75%, 11/15/43, valued at $1,205,502), at 0.10%, dated 12/30/16, due 1/3/17 (Delivery value $1,177,013) | | 1,177,000 |
|
| State Street Institutional U.S. Government Money Market Fund, Premier Class | 849,784 |
| 849,784 |
|
TOTAL TEMPORARY CASH INVESTMENTS
(Cost $2,026,784) | | 2,026,784 |
|
TOTAL INVESTMENT SECURITIES — 99.9%
(Cost $385,289,781) | | 460,542,949 |
|
| OTHER ASSETS AND LIABILITIES — 0.1% | | 250,235 |
|
| TOTAL NET ASSETS — 100.0% | | $ | 460,793,184 |
|
|
| | | | | | | | |
| FORWARD FOREIGN CURRENCY EXCHANGE CONTRACTS |
| Currency Purchased | Currency Sold | Counterparty | Settlement Date | Unrealized Appreciation
(Depreciation) |
| CAD | 549,535 | USD | 412,201 | Morgan Stanley | 3/31/17 | $ | (2,480 | ) |
| USD | 4,820,253 | CAD | 6,447,667 | Morgan Stanley | 3/31/17 | 13,011 |
|
| USD | 159,116 | CAD | 214,476 | Morgan Stanley | 3/31/17 | (793 | ) |
| USD | 165,068 | CAD | 223,583 | Morgan Stanley | 3/31/17 | (1,630 | ) |
| | | | | | | $ | 8,108 |
|
|
| | |
| NOTES TO SCHEDULE OF INVESTMENTS |
| CAD | - | Canadian Dollar |
| USD | - | United States Dollar |
See Notes to Financial Statements.
|
|
| Statement of Assets and Liabilities |
|
| | | |
| DECEMBER 31, 2016 | |
| Assets |
| Investment securities, at value (cost of $385,289,781) | $ | 460,542,949 |
|
| Cash | 20,786 |
|
| Foreign currency holdings, at value (cost of $30,451) | 25,354 |
|
| Receivable for investments sold | 1,049,131 |
|
| Receivable for capital shares sold | 111,620 |
|
| Unrealized appreciation on forward foreign currency exchange contracts | 13,011 |
|
| Dividends and interest receivable | 160,985 |
|
| | 461,923,836 |
|
| | |
| Liabilities | |
| Payable for investments purchased | 581,948 |
|
| Payable for capital shares redeemed | 151,602 |
|
| Unrealized depreciation on forward foreign currency exchange contracts | 4,903 |
|
| Accrued management fees | 391,912 |
|
| Distribution fees payable | 287 |
|
| | 1,130,652 |
|
| | |
| Net Assets | $ | 460,793,184 |
|
| | |
| Net Assets Consist of: | |
| Capital (par value and paid-in surplus) | $ | 362,887,734 |
|
| Accumulated net investment loss | (29,994 | ) |
| Undistributed net realized gain | 22,679,155 |
|
| Net unrealized appreciation | 75,256,289 |
|
| | $ | 460,793,184 |
|
|
| | | | | | |
| | Net Assets | Shares Outstanding | Net Asset Value Per Share |
| Class I, $0.01 Par Value |
| $459,443,320 |
| 32,868,163 |
| $13.98 |
| Class II, $0.01 Par Value |
| $1,349,864 |
| 96,959 |
| $13.92 |
See Notes to Financial Statements.
|
| | | |
| YEAR ENDED DECEMBER 31, 2016 |
| Investment Income (Loss) |
| Income: | |
| Dividends (net of foreign taxes withheld of $8,752) | $ | 3,827,052 |
|
| Interest | 5,351 |
|
| | 3,832,403 |
|
| | |
| Expenses: | |
| Management fees | 4,532,541 |
|
| Distribution fees - Class II | 2,897 |
|
| Directors' fees and expenses | 15,171 |
|
| Other expenses | 70 |
|
| | 4,550,679 |
|
| Fees waived | (45,337 | ) |
| | 4,505,342 |
|
| | |
| Net investment income (loss) | (672,939 | ) |
| | |
| Realized and Unrealized Gain (Loss) | |
| Net realized gain (loss) on: | |
| Investment transactions | 23,256,663 |
|
| Foreign currency transactions | (318,975 | ) |
| | 22,937,688 |
|
| | |
| Change in net unrealized appreciation (depreciation) on: | |
| Investments | (8,230,409 | ) |
| Translation of assets and liabilities in foreign currencies | 61,570 |
|
| | (8,168,839 | ) |
| | |
| Net realized and unrealized gain (loss) | 14,768,849 |
|
| | |
| Net Increase (Decrease) in Net Assets Resulting from Operations | $ | 14,095,910 |
|
See Notes to Financial Statements.
|
|
| Statement of Changes in Net Assets |
|
| | | | | | |
| YEARS ENDED DECEMBER 31, 2016 AND DECEMBER 31, 2015 |
| Increase (Decrease) in Net Assets | December 31, 2016 | December 31, 2015 |
| Operations | | |
| Net investment income (loss) | $ | (672,939 | ) | $ | (1,882,521 | ) |
| Net realized gain (loss) | 22,937,688 |
| 44,961,962 |
|
| Change in net unrealized appreciation (depreciation) | (8,168,839 | ) | (35,734,109 | ) |
| Net increase (decrease) in net assets resulting from operations | 14,095,910 |
| 7,345,332 |
|
| | | |
| Distributions to Shareholders | | |
| From net realized gains: | | |
| Class I | (42,862,441 | ) | (31,133,710 | ) |
| Class II | (96,788 | ) | (25,303 | ) |
| Decrease in net assets from distributions | (42,959,229 | ) | (31,159,013 | ) |
| | | |
| Capital Share Transactions | | |
| Net increase (decrease) in net assets from capital share transactions (Note 5) | 22,863,425 |
| 22,180,060 |
|
| | | |
| Net increase (decrease) in net assets | (5,999,894 | ) | (1,633,621 | ) |
| | | |
| Net Assets | | |
| Beginning of period | 466,793,078 |
| 468,426,699 |
|
| End of period | $ | 460,793,184 |
| $ | 466,793,078 |
|
| | | |
| Accumulated undistributed net investment income (loss) | $ | (29,994 | ) | $ | 53,984 |
|
See Notes to Financial Statements.
|
|
| Notes to Financial Statements |
DECEMBER 31, 2016
1. Organization
American Century Variable Portfolios, Inc. (the corporation) is registered under the Investment Company Act of 1940, as amended (the 1940 Act), as an open-end management investment company and is organized as a Maryland corporation. VP Capital Appreciation Fund (the fund) is one fund in a series issued by the corporation. The fund’s investment objective is to seek capital growth.
The fund offers Class I and Class II. The share classes differ principally in their respective distribution and shareholder servicing expenses and arrangements. Class II is charged a lower unified management fee because it has a separate arrangement for distribution services.
2. Significant Accounting Policies
The following is a summary of significant accounting policies consistently followed by the fund in preparation of its financial statements. The fund is an investment company and follows accounting and reporting guidance in accordance with accounting principles generally accepted in the United States of America. This may require management to make certain estimates and assumptions at the date of the financial statements. Actual results could differ from these estimates. Management evaluated the impact of events or transactions occurring through the date the financial statements were issued that would merit recognition or disclosure.
Investment Valuations — The fund determines the fair value of its investments and computes its net asset value per share at the close of regular trading (usually 4 p.m. Eastern time) on the New York Stock Exchange (NYSE) on each day the NYSE is open. The Board of Directors has adopted valuation policies and procedures to guide the investment advisor in the fund’s investment valuation process and to provide methodologies for the oversight of the fund’s pricing function.
Equity securities that are listed or traded on a domestic securities exchange are valued at the last reported sales price or at the official closing price as provided by the exchange. Equity securities traded on foreign securities exchanges are generally valued at the closing price of such securities on the exchange where primarily traded or at the close of the NYSE, if that is earlier. If no last sales price is reported, or if local convention or regulation so provides, the mean of the latest bid and asked prices may be used. Securities traded over-the-counter are valued at the mean of the latest bid and asked prices, the last sales price, or the official closing price. Equity securities initially expressed in local currencies are translated into U.S. dollars at the mean of the appropriate currency exchange rate at the close of the NYSE as provided by an independent pricing service.
Open-end management investment companies are valued at the reported net asset value per share. Repurchase agreements are valued at cost, which approximates fair value. Forward foreign currency exchange contracts are valued at the mean of the appropriate forward exchange rate at the close of the NYSE as provided by an independent pricing service.
If the fund determines that the market price for an investment is not readily available or the valuation methods mentioned above do not reflect an investment’s fair value, such investment is valued as determined in good faith by the Board of Directors or its delegate, in accordance with policies and procedures adopted by the Board of Directors. In its determination of fair value, the fund may review several factors including, but not limited to, market information regarding the specific investment or comparable investments and correlation with other investment types, futures indices or general market indicators. Circumstances that may cause the fund to use these procedures to value an investment include, but are not limited to: an investment has been declared in default or is distressed; trading in a security has been suspended during the trading day or a security is not actively trading on its principal exchange; prices received from a regular pricing source are deemed unreliable; or there is a foreign market holiday and no trading occurred.
The fund monitors for significant events occurring after the close of an investment’s primary exchange but before the fund’s net asset value per share is determined. Significant events may include, but are not limited to: corporate announcements and transactions; governmental action and political unrest that could impact a specific investment or an investment sector; or armed conflicts, natural disasters and similar events that could affect investments in a specific country or region. The fund also monitors for significant fluctuations between
domestic and foreign markets, as evidenced by the U.S. market or such other indicators that the Board of Directors, or its delegate, deems appropriate. If significant fluctuations in foreign markets are identified, the fund may apply a model-derived factor to the closing price of equity securities traded on foreign securities exchanges. The factor is based on observable market data as provided by an independent pricing service.
Security Transactions — Security transactions are accounted for as of the trade date. Net realized gains and losses are determined on the identified cost basis, which is also used for federal income tax purposes.
Investment Income — Dividend income less foreign taxes withheld, if any, is recorded as of the ex-dividend date. Distributions received on securities that represent a return of capital or long-term capital gain are recorded as a reduction of cost of investments and/or as a realized gain. The fund may estimate the components of distributions received that may be considered nontaxable distributions or long-term capital gain distributions for income tax purposes. Interest income is recorded on the accrual basis and includes accretion of discounts and amortization of premiums.
Foreign Currency Translations — All assets and liabilities initially expressed in foreign currencies are translated into U.S. dollars at prevailing exchange rates at period end. The fund may enter into spot foreign currency exchange contracts to facilitate transactions denominated in a foreign currency. Purchases and sales of investment securities, dividend and interest income, spot foreign currency exchange contracts, and expenses are translated at the rates of exchange prevailing on the respective dates of such transactions. Net realized and unrealized foreign currency exchange gains or losses related to investment securities are a component of net realized gain (loss) on investment transactions and change in net unrealized appreciation (depreciation) on investments, respectively.
Repurchase Agreements — The fund may enter into repurchase agreements with institutions that American Century Investment Management, Inc. (ACIM) (the investment advisor) has determined are creditworthy pursuant to criteria adopted by the Board of Directors. The fund requires that the collateral, represented by securities, received in a repurchase transaction be transferred to the custodian in a manner sufficient to enable the fund to obtain those securities in the event of a default under the repurchase agreement. ACIM monitors, on a daily basis, the securities transferred to ensure the value, including accrued interest, of the securities under each repurchase agreement is equal to or greater than amounts owed to the fund under each repurchase agreement.
Joint Trading Account — Pursuant to an Exemptive Order issued by the Securities and Exchange Commission, the fund, along with certain other funds in the American Century Investments family of funds, may transfer uninvested cash balances into a joint trading account. These balances are invested in one or more repurchase agreements that are collateralized by U.S. Treasury or Agency obligations.
Income Tax Status — It is the fund’s policy to distribute substantially all net investment income and net realized gains to shareholders and to otherwise qualify as a regulated investment company under provisions of the Internal Revenue Code. Accordingly, no provision has been made for income taxes. The fund files U.S. federal, state, local and non-U.S. tax returns as applicable. The fund's tax returns are subject to examination by the relevant taxing authority until expiration of the applicable statute of limitations, which is generally three years from the date of filing but can be longer in certain jurisdictions. At this time, management believes there are no uncertain tax positions which, based on their technical merit, would not be sustained upon examination and for which it is reasonably possible that the total amounts of unrecognized tax benefits will significantly change in the next twelve months.
Multiple Class — All shares of the fund represent an equal pro rata interest in the net assets of the class to which such shares belong, and have identical voting, dividend, liquidation and other rights and the same terms and conditions, except for class specific expenses and exclusive rights to vote on matters affecting only individual classes. Income, non-class specific expenses, and realized and unrealized capital gains and losses of the fund are allocated to each class of shares based on their relative net assets.
Distributions to Shareholders — Distributions from net investment income and net realized gains, if any, are generally declared and paid annually.
Indemnifications — Under the corporation’s organizational documents, its officers and directors are indemnified against certain liabilities arising out of the performance of their duties to the fund. In addition, in the normal course of business, the fund enters into contracts that provide general indemnifications. The maximum exposure under these arrangements is unknown as this would involve future claims that may be made against a fund. The risk of material loss from such claims is considered by management to be remote.
3. Fees and Transactions with Related Parties
Certain officers and directors of the corporation are also officers and/or directors of American Century Companies, Inc. (ACC). The corporation’s investment advisor, ACIM, the corporation's distributor, American Century Investment Services, Inc. (ACIS), and the corporation’s transfer agent, American Century Services, LLC, are wholly owned, directly or indirectly, by ACC.
Management Fees — The corporation has entered into a management agreement with ACIM, under which ACIM provides the fund with investment advisory and management services in exchange for a single, unified management fee (the fee) per class. The agreement provides that all expenses of managing and operating the fund, except distribution fees, brokerage expenses, taxes, interest, fees and expenses of the independent directors (including legal counsel fees), and extraordinary expenses, will be paid by ACIM. The fee is computed and accrued daily based on each class's daily net assets and paid monthly in arrears. The rate of the fee is determined by applying a fee rate calculation formula. This formula takes into account the fund’s assets as well as certain assets, if any, of other clients of the investment advisor outside the American Century Investments family of funds (such as subadvised funds and separate accounts) that have very similar investment teams and investment strategies (strategy assets). The annual management fee schedule ranges from 0.90% to 1.00% for Class I and from 0.80% to 0.90% for Class II. During the year ended December 31, 2016, the investment advisor agreed to waive 0.01% of the fund's management fee. The investment advisor expects this waiver to continue until July 31, 2017 and cannot terminate it prior to such date without the approval of the Board of Directors. The total amount of the waiver for each class for the year ended December 31, 2016 was $45,221 and $116 for Class I and Class II, respectively. The effective annual management fee before waiver for each class for the year ended December 31, 2016 was 1.00% and 0.90% for Class I and Class II, respectively. The effective annual management fee after waiver for each class for the year ended December 31, 2016 was 0.99% and 0.89% for Class I and Class II, respectively.
Distribution Fees — The Board of Directors has adopted the Master Distribution Plan (the plan) for Class II, pursuant to Rule 12b-1 of the 1940 Act. The plan provides that Class II will pay ACIS an annual distribution fee equal to 0.25%. The fee is computed and accrued daily based on the Class II daily net assets and paid monthly in arrears. The distribution fee provides compensation for expenses incurred in connection with distributing shares of Class II including, but not limited to, payments to brokers, dealers, and financial institutions that have entered into sales agreements with respect to shares of the fund. Fees incurred under the plan during the year ended December 31, 2016 are detailed in the Statement of Operations.
Directors' Fees and Expenses — The Board of Directors is responsible for overseeing the investment advisor’s management and operations of the fund. The directors receive detailed information about the fund and its investment advisor regularly throughout the year, and meet at least quarterly with management of the investment advisor to review reports about fund operations. The fund’s officers do not receive compensation from the fund.
Interfund Transactions — The fund may enter into security transactions with other American Century Investments funds and other client accounts of the investment advisor, in accordance with the 1940 Act rules and procedures adopted by the Board of Directors. The rules and procedures require, among other things, that these transactions be effected at the independent current market price of the security. During the period, the interfund purchases and sales were $1,888,496 and $4,045,123, respectively. The effect of interfund transactions on the Statement of Operations was $280,564 in net realized gain (loss) on investment transactions.
4. Investment Transactions
Purchases and sales of investment securities, excluding short-term investments, for the year ended December 31, 2016 were $307,168,911 and $322,589,310, respectively.
5. Capital Share Transactions
Transactions in shares of the fund were as follows:
|
| | | | | | | | | | |
| | Year ended
December 31, 2016 | Year ended
December 31, 2015 |
| | Shares | Amount | Shares | Amount |
| Class I/Shares Authorized | 150,000,000 |
| | 150,000,000 |
| |
| Sold | 4,507,328 |
| $ | 61,567,642 |
| 4,506,159 |
| $ | 71,991,161 |
|
| Issued in reinvestment of distributions | 3,289,520 |
| 42,862,441 |
| 1,954,407 |
| 31,133,710 |
|
| Redeemed | (5,950,967 | ) | (82,024,919 | ) | (5,216,684 | ) | (81,532,417 | ) |
| | 1,845,881 |
| 22,405,164 |
| 1,243,882 |
| 21,592,454 |
|
| Class II/Shares Authorized | 25,000,000 |
| | 25,000,000 |
| |
| Sold | 44,961 |
| 610,985 |
| 46,437 |
| 711,610 |
|
| Issued in reinvestment of distributions | 7,445 |
| 96,788 |
| 1,590 |
| 25,303 |
|
| Redeemed | (18,313 | ) | (249,512 | ) | (9,319 | ) | (149,307 | ) |
| | 34,093 |
| 458,261 |
| 38,708 |
| 587,606 |
|
| Net increase (decrease) | 1,879,974 |
| $ | 22,863,425 |
| 1,282,590 |
| $ | 22,180,060 |
|
6. Fair Value Measurements
The fund’s investments valuation process is based on several considerations and may use multiple inputs to determine the fair value of the investments held by the fund. In conformity with accounting principles generally accepted in the United States of America, the inputs used to determine a valuation are classified into three broad levels.
| |
| • | Level 1 valuation inputs consist of unadjusted quoted prices in an active market for identical investments. |
| |
| • | Level 2 valuation inputs consist of direct or indirect observable market data (including quoted prices for comparable investments, evaluations of subsequent market events, interest rates, prepayment speeds, credit risk, etc.). These inputs also consist of quoted prices for identical investments initially expressed in local currencies that are adjusted through translation into U.S. dollars. |
| |
| • | Level 3 valuation inputs consist of unobservable data (including a fund’s own assumptions). |
The level classification is based on the lowest level input that is significant to the fair valuation measurement. The valuation inputs are not necessarily an indication of the risks associated with investing in these securities or other financial instruments. There were no significant transfers between levels during the period.
The following is a summary of the level classifications as of period end. The Schedule of Investments provides additional information on the fund’s portfolio holdings. |
| | | | | | | | |
| | Level 1 | Level 2 | Level 3 |
| Assets | | | |
| Investment Securities | | | |
| Common Stocks | $ | 458,516,165 |
| — |
| — |
|
| Temporary Cash Investments | 849,784 |
| $ | 1,177,000 |
| — |
|
| | $ | 459,365,949 |
| $ | 1,177,000 |
| — |
|
| Other Financial Instruments | | | |
| Forward Foreign Currency Exchange Contracts | — |
| $ | 13,011 |
| — |
|
| | | | |
| Liabilities | | | |
| Other Financial Instruments | | | |
| Forward Foreign Currency Exchange Contracts | — |
| $ | 4,903 |
| — |
|
7. Derivative Instruments
Foreign Currency Risk — The fund is subject to foreign currency exchange rate risk in the normal course of pursuing its investment objectives. The value of foreign investments held by a fund may be significantly affected by changes in foreign currency exchange rates. The dollar value of a foreign security generally decreases when the value of the dollar rises against the foreign currency in which the security is denominated and tends to increase when the value of the dollar declines against such foreign currency. A fund may enter into forward foreign currency exchange contracts to reduce a fund's exposure to foreign currency exchange rate fluctuations. The net U.S. dollar value of foreign currency underlying all contractual commitments held by a fund and the resulting unrealized appreciation or depreciation are determined daily. Realized gain or loss is recorded upon the termination of the contract. Net realized and unrealized gains or losses occurring during the holding period of forward foreign currency exchange contracts are a component of net realized gain (loss) on foreign currency transactions and change in net unrealized appreciation (depreciation) on translation of assets and liabilities in foreign currencies, respectively. A fund bears the risk of an unfavorable change in the foreign currency exchange rate underlying the forward contract. Additionally, losses, up to the fair value, may arise if the counterparties do not perform under the contract terms. The fund's average U.S. dollar exposure to foreign currency risk derivative instruments held during the period was $6,775,291.
The value of foreign currency risk derivative instruments as of December 31, 2016, is disclosed on the Statement of Assets and Liabilities as an asset of $13,011 in unrealized appreciation on forward foreign currency exchange contracts and a liability of $4,903 in unrealized depreciation on forward foreign currency exchange contracts. For the year ended December 31, 2016, the effect of foreign currency risk derivative instruments on the Statement of Operations was $(318,652) in net realized gain (loss) on foreign currency transactions and $62,092 in change in net unrealized appreciation (depreciation) on translation of assets and liabilities in foreign currencies.
8. Risk Factors
The fund invests in common stocks of small companies. Because of this, the fund may be subject to greater risk and market fluctuations than a fund investing in larger, more established companies.
9. Federal Tax Information
The tax character of distributions paid during the years ended December 31, 2016 and December 31, 2015 were as follows:
|
| | | | | | |
| | 2016 | 2015 |
| Distributions Paid From | | |
| Ordinary income | — |
| — |
|
| Long-term capital gains | $ | 42,959,229 |
| $ | 31,159,013 |
|
The book-basis character of distributions made during the year from net investment income or net realized gains may differ from their ultimate characterization for federal income tax purposes. These differences reflect the differing character of certain income items and net realized gains and losses for financial statement and tax purposes, and may result in reclassification among certain capital accounts on the financial statements.
As of December 31, 2016, the federal tax cost of investments and the components of distributable earnings on a tax-basis were as follows:
|
| | | |
| Federal tax cost of investments | $ | 386,349,924 |
|
| Gross tax appreciation of investments | $ | 85,034,359 |
|
| Gross tax depreciation of investments | (10,841,334 | ) |
| Net tax appreciation (depreciation) of investments | 74,193,025 |
|
Net tax appreciation (depreciation) on derivatives and translation of assets and liabilities in foreign currencies | (4,987 | ) |
| Net tax appreciation (depreciation) | $ | 74,188,038 |
|
| Undistributed ordinary income | — |
|
| Accumulated long-term gains | $ | 23,739,298 |
|
| Late-year ordinary loss deferral | $ | (21,886 | ) |
The difference between book-basis and tax-basis unrealized appreciation (depreciation) is attributable primarily to the tax deferral of losses on wash sales.
Loss deferrals represent certain qualified losses that the fund has elected to treat as having been incurred in the following fiscal year for federal income tax purposes.
10. Recently Issued Accounting Guidance
In October 2016, the Securities and Exchange Commission adopted new rules and forms as well as amendments to its rules and forms to modernize the reporting and disclosure of information by registered investment companies. The amendments to Regulation S-X will require standardized, enhanced disclosure about derivatives in investment company financial statements, as well as other provisions. Compliance with the amendments is effective on August 1, 2017. Management is currently evaluating the impact that adopting the amendments will have on the financial statement disclosures.
|
| | | | | | | | | | | | | | | |
| For a Share Outstanding Throughout the Years Ended December 31 (except as noted) | | | | | | | |
| Per-Share Data | | | | | Ratios and Supplemental Data |
| | | Income From Investment Operations: | | | | Ratio to Average Net Assets of: | | |
| | Net Asset Value, Beginning of Period | Net Investment Income (Loss)(1) | Net Realized and Unrealized Gain (Loss) | Total From Investment Operations | Distributions From Net Realized Gains | Net Asset Value, End of Period | Total Return(2) | Operating Expenses | Operating
Expenses
(before
expense
waiver) | Net
Investment
Income
(Loss) | Net
Investment
Income
(Loss)
(before
expense
waiver) | Portfolio Turnover Rate | Net Assets, End of Period (in thousands) |
| Class I | | | | | | | | | | | | | |
| 2016 | $15.02 | (0.02) | 0.40 | 0.38 | (1.42) | $13.98 | 3.23% | 0.99% | 1.00% | (0.14)% | (0.15)% | 68% |
| $459,443 |
|
| 2015 | $15.72 | (0.06) | 0.42 | 0.36 | (1.06) | $15.02 | 1.93% | 1.00% | 1.00% | (0.38)% | (0.38)% | 72% |
| $465,851 |
|
| 2014 | $18.28 | (0.08) | 1.27 | 1.19 | (3.75) | $15.72 | 8.14% | 1.00% | 1.00% | (0.50)% | (0.50)% | 68% |
| $468,047 |
|
| 2013 | $14.54 | (0.08) | 4.45 | 4.37 | (0.63) | $18.28 | 30.92% | 1.00% | 1.00% | (0.49)% | (0.49)% | 72% |
| $443,588 |
|
| 2012 | $13.22 | (0.01) | 2.15 | 2.14 | (0.82) | $14.54 | 16.00% | 1.00% | 1.00% | (0.04)% | (0.04)% | 74% |
| $360,445 |
|
| Class II | | | | | | | | | | | | | |
| 2016 | $14.98 | (0.04) | 0.40 | 0.36 | (1.42) | $13.92 | 3.08% | 1.14% | 1.15% | (0.29)% | (0.30)% | 68% |
| $1,350 |
|
| 2015 | $15.71 | (0.08) | 0.41 | 0.33 | (1.06) | $14.98 | 1.73% | 1.15% | 1.15% | (0.53)% | (0.53)% | 72% |
| $942 |
|
2014(3) | $14.18 | (0.06) | 1.59 | 1.53 | — | $15.71 | 10.79% | 1.15%(4) | 1.15%(4) | (0.61)%(4) | (0.61)%(4) | 68%(5) |
| $379 |
|
|
|
| Notes to Financial Highlights |
| |
| (1) | Computed using average shares outstanding throughout the period. |
| |
| (2) | Total returns are calculated based on the net asset value of the last business day. Total returns for periods less than one year are not annualized. |
| |
| (3) | April 25, 2014 (commencement of sale) through December 31, 2014. |
| |
| (5) | Portfolio turnover is calculated at the fund level. Percentage indicated was calculated for the year ended December 31, 2014. |
See Notes to Financial Statements.
|
|
| Report of Independent Registered Public Accounting Firm |
To the Board of Directors and Shareholders of American Century Variable Portfolios, Inc.:
We have audited the accompanying statement of assets and liabilities, including the schedule of investments, of VP Capital Appreciation Fund (the “Fund”), one of the funds constituting American Century Variable Portfolios, Inc., as of December 31, 2016, and the related statement of operations for the year then ended, the statements of changes in net assets for each of the two years in the period then ended, and the financial highlights for each of the periods presented. These financial statements and financial highlights are the responsibility of the Fund’s management. Our responsibility is to express an opinion on these financial statements and financial highlights based on our audits.
We conducted our audits in accordance with the standards of the Public Company Accounting Oversight Board (United States). Those standards require that we plan and perform the audit to obtain reasonable assurance about whether the financial statements and financial highlights are free of material misstatement. The Fund is not required to have, nor were we engaged to perform, an audit of its internal control over financial reporting. Our audits included consideration of internal control over financial reporting as a basis for designing audit procedures that are appropriate in the circumstances, but not for the purpose of expressing an opinion on the effectiveness of the Fund’s internal control over financial reporting. Accordingly, we express no such opinion. An audit also includes examining, on a test basis, evidence supporting the amounts and disclosures in the financial statements, assessing the accounting principles used and significant estimates made by management, as well as evaluating the overall financial statement presentation. Our procedures included confirmation of securities owned as of December 31, 2016, by correspondence with the custodian and brokers; when replies were not received from brokers, we performed other auditing procedures. We believe that our audits provide a reasonable basis for our opinion.
In our opinion, the financial statements and financial highlights referred to above present fairly, in all material respects, the financial position of VP Capital Appreciation Fund of American Century Variable Portfolios, Inc. as of December 31, 2016, the results of its operations for the year then ended, the changes in its net assets for each of the two years in the period then ended, and the financial highlights for each of the periods presented, in conformity with accounting principles generally accepted in the United States of America.
DELOITTE & TOUCHE LLP
Kansas City, Missouri
February 10, 2017
The Board of Directors
The individuals listed below serve as directors of the funds. Each director will continue to serve in this capacity until death, retirement, resignation or removal from office. The board has adopted a mandatory retirement age for directors who are not “interested persons,” as that term is defined in the Investment Company Act (independent directors). Independent directors shall retire by December 31 of the year in which they reach their 75th birthday.
Mr. Thomas is an “interested person” because he currently serves as President and Chief Executive Officer of American Century Companies, Inc. (ACC), the parent company of American Century Investment Management, Inc. (ACIM or the advisor). The other directors (more than three-fourths of the total number) are independent. They are not employees, directors or officers of, and have no financial interest in, ACC or any of its wholly owned, direct or indirect, subsidiaries, including ACIM, American Century Investment Services, Inc. (ACIS) and American Century Services, LLC (ACS), and they do not have any other affiliations, positions or relationships that would cause them to be considered “interested persons” under the Investment Company Act. The directors serve in this capacity for seven (in the case of Mr. Thomas, 15) registered investment companies in the American Century Investments family of funds.
The following table presents additional information about the directors. The mailing address for each director is 4500 Main Street, Kansas City, Missouri 64111.
|
| | | | | |
Name
(Year of Birth) | Position(s) Held with Funds | Length of Time Served | Principal Occupation(s) During Past 5 Years | Number of American Century Portfolios Overseen by Director | Other Directorships Held During Past 5 Years |
| Independent Directors |
|
|
Barry Fink
(1955) | Director | Since 2012 (independent since 2016) | Retired; Executive Vice President, ACC (2007 to 2013); President, ACS (2007 to 2013); Chief Operating Officer, ACC (2007 to 2012) | 81 | None |
Andrea C. Hall
(1945) | Director | Since 1997 | Retired | 81 | None |
Jan M. Lewis
(1957) | Director | Since 2011 | Retired; President and Chief Executive Officer, Catholic Charities of Northeast Kansas (human services organization) (2006 to 2013) | 81 | None |
James A. Olson
(1942) | Director and Chairman of the Board | Since 2007 (Chairman since 2014) | Member, Plaza Belmont LLC (private equity fund manager) (1999 to present) | 81 | Saia, Inc. (2002 to 2012) and EPR Properties (2003 to 2013) |
M. Jeannine Strandjord
(1945) | Director | Since 1994 | Retired | 81 | Euronet Worldwide Inc.; MGP Ingredients, Inc.; and DST Systems Inc. (1996 to 2012) |
|
| | | | | |
Name
(Year of Birth) | Position(s) Held with Funds | Length of Time Served | Principal Occupation(s) During Past 5 Years | Number of American Century Portfolios Overseen by Director | Other Directorships Held During Past 5 Years |
| Independent Directors |
|
|
John R. Whitten
(1946) | Director | Since 2008 | Retired | 81 | Rudolph Technologies, Inc. |
Stephen E. Yates
(1948) | Director | Since 2012 | Retired | 81 | None |
| Interested Director |
|
|
Jonathan S. Thomas
(1963) | Director and President | Since 2007 | President and Chief Executive Officer, ACC (2007 to present). Also serves as Chief Executive Officer, ACS; Executive Vice President, ACIM; Director, ACC, ACIM and other ACC subsidiaries | 126 | BioMed Valley Discoveries, Inc. |
The Statement of Additional Information has additional information about the fund's directors and is available without charge, upon request, by calling 1-800-378-9878.
Officers
The following table presents certain information about the executive officers of the funds. Each officer serves as an officer for each of the 15 investment companies in the American Century family of funds, unless otherwise noted. No officer is compensated for his or her service as an officer of the funds. The listed officers are interested persons of the funds and are appointed or re-appointed on an annual basis. The mailing address for each officer listed below is 4500 Main Street, Kansas City, Missouri 64111.
|
| | |
Name
(Year of Birth) | Offices with the Funds | Principal Occupation(s) During the Past Five Years |
Jonathan S. Thomas
(1963) | Director and President since 2007 | President and Chief Executive Officer, ACC (2007 to present). Also serves as Chief Executive Officer, ACS; Executive Vice President, ACIM; Director, ACC, ACIM and other ACC subsidiaries |
Amy D. Shelton
(1964) | Chief Compliance Officer and Vice President since 2014 | Chief Compliance Officer, American Century funds, (2014 to present); Chief Compliance Officer, ACIM (2014 to present); Chief Compliance Officer, ACIS (2009 to present); Vice President, Client Interactions and Marketing, ACIS (2013 to 2014); Director, Client Interactions and Marketing, ACIS (2007 to 2013). Also serves as Vice President, ACIS |
Charles A. Etherington
(1957) | General Counsel since 2007 and Senior Vice President since 2006 | Attorney, ACC (1994 to present); Vice President, ACC (2005 to present); General Counsel, ACC (2007 to present). Also serves as General Counsel, ACIM, ACS, ACIS and other ACC subsidiaries; and Senior Vice President, ACIM and ACS |
C. Jean Wade
(1964) | Vice President,Treasurer and Chief Financial Officer since 2012 | Vice President, ACS (2000 to present) |
Robert J. Leach
(1966) | Vice President since 2006 and Assistant Treasurer since 2012 | Vice President, ACS (2000 to present) |
David H. Reinmiller
(1963) | Vice President since 2000 | Attorney, ACC (1994 to present); Associate General Counsel, ACC (2001 to present). Also serves as Vice President, ACIM and ACS |
Ward D. Stauffer
(1960) | Secretary since 2005 | Attorney, ACC (2003 to present) |
Proxy Voting Policies
A description of the policies that the fund's investment advisor uses in exercising the voting rights associated with the securities purchased and/or held by the fund is available without charge, upon request, by calling 1-800-378-9878. It is also available on the "About Us" page of American Century Investments’ website at americancentury.com and on the Securities and Exchange Commission’s website at sec.gov. Information regarding how the investment advisor voted proxies relating to portfolio securities during the most recent 12-month period ended June 30 is available on the "About Us" page at americancentury.com. It is also available at sec.gov.
Quarterly Portfolio Disclosure
The fund files its complete schedule of portfolio holdings with the Securities and Exchange Commission (SEC) for the first and third quarters of each fiscal year on Form N-Q. The fund’s Forms N-Q are available on the SEC’s website at sec.gov, and may be reviewed and copied at the SEC’s Public Reference Room in Washington, DC. Information on the operation of the Public Reference Room may be obtained by calling 1-800-SEC-0330. The fund also makes its complete schedule of portfolio holdings for the most recent quarter of its fiscal year available on its website at ipro.americancentury.com (for Investment Professionals) and, upon request, by calling 1-800-378-9878.
Other Tax Information
The following information is provided pursuant to provisions of the Internal Revenue Code.
The fund hereby designates $42,959,229, or up to the maximum amount allowable, as long-term capital gain distributions (20% rate gain distributions) for the fiscal year ended December 31, 2016.
|
| | |
| |
| | | |
| Contact Us | americancentury.com | |
| Automated Information Line | 1-800-345-8765 | |
| Investment Professional Service Representatives | 1-800-345-6488 | |
| Telecommunications Relay Service for the Deaf | 711 | |
| | | |
| American Century Variable Portfolios, Inc. | |
| | | |
Investment Advisor: American Century Investment Management, Inc. Kansas City, Missouri | |
| | | |
| This report and the statements it contains are submitted for the general information of our shareholders. The report is not authorized for distribution to prospective investors unless preceded or accompanied by an effective prospectus. | |
| | | |
©2017 American Century Proprietary Holdings, Inc. All rights reserved.
CL-ANN-91442 1702 | |
|
| |
| | |
| | Annual Report |
| | |
| | December 31, 2016 |
| | |
| | VP Growth Fund |
|
| | |
| Performance | 2 |
|
| Portfolio Commentary | |
|
| Fund Characteristics | |
|
| Shareholder Fee Example | |
|
| Schedule of Investments | |
|
| Statement of Assets and Liabilities | |
|
| Statement of Operations | |
|
| Statement of Changes in Net Assets | |
|
| Notes to Financial Statements | |
|
| Financial Highlights | |
|
| Report of Independent Registered Public Accounting Firm | |
|
| Management | |
|
| Additional Information | |
|
Any opinions expressed in this report reflect those of the author as of the date of the report, and do not necessarily represent the opinions of American Century Investments® or any other person in the American Century Investments organization. Any such opinions are subject to change at any time based upon market or other conditions and American Century Investments disclaims any responsibility to update such opinions. These opinions may not be relied upon as investment advice and, because investment decisions made by American Century Investments funds are based on numerous factors, may not be relied upon as an indication of trading intent on behalf of any American Century Investments fund. Security examples are used for representational purposes only and are not intended as recommendations to purchase or sell securities. Performance information for comparative indices and securities is provided to American Century Investments by third party vendors. To the best of American Century Investments’ knowledge, such information is accurate at the time of printing.
|
| | | | | |
| Total Returns as of December 31, 2016 |
| | | | Average Annual Returns | |
| | Ticker Symbol | 1 year | 5 years | Since Inception | Inception Date |
| Class I | AWRIX | 4.35% | 12.25% | 9.04% | 5/2/11 |
| Russell 1000 Growth Index | — | 7.08% | 14.48% | 11.43% | — |
| Class II | AWREX | 4.20% | 12.09% | 8.88% | 5/2/11 |
Fund returns would have been lower if a portion of the fees had not been waived.
The performance information presented does not include charges and deductions imposed by the insurance company separate account under the variable annuity or variable life insurance contracts. The inclusion of such charges could significantly lower performance. Please refer to the insurance company separate account prospectus for a discussion of the charges related to insurance contracts.
Data presented reflect past performance. Past performance is no guarantee of future results. Current performance may be higher or lower than the performance shown. Total returns for periods less than one year are not annualized. Investment return and principal value will fluctuate, and redemption value may be more or less than original cost. Data assumes reinvestment of dividends and capital gains, and none of the charts reflect the deduction of taxes that a shareholder would pay on fund distributions or the redemption of fund shares. To obtain performance data current to the most recent month end, please call 1-800-345-6488 or visit ipro.americancentury.com (for Investment Professionals). For additional information about the fund, please consult the prospectus.
|
|
| Growth of $10,000 Over Life of Class |
| $10,000 investment made May 2, 2011 |
| Performance for other share classes will vary due to differences in fee structure. |
|
| |
| Value on December 31, 2016 |
| | Class I — $16,337 |
| |
| | Russell 1000 Growth Index — $18,474 |
| |
Ending value of Class I would have been lower if a portion of the fees had not been waived.
|
| |
| Total Annual Fund Operating Expenses |
| Class I | Class II |
| 1.01% | 1.16% |
The total annual fund operating expenses shown is as stated in the fund’s prospectus current as of the date of this report. The prospectus may vary from the expense ratio shown elsewhere in this report because it is based on a different time period, includes acquired fund fees and expenses, and, if applicable, does not include fee waivers or expense reimbursements.
Data presented reflect past performance. Past performance is no guarantee of future results. Current performance may be higher or lower than the performance shown. Total returns for periods less than one year are not annualized. Investment return and principal value will fluctuate, and redemption value may be more or less than original cost. Data assumes reinvestment of dividends and capital gains, and none of the charts reflect the deduction of taxes that a shareholder would pay on fund distributions or the redemption of fund shares. To obtain performance data current to the most recent month end, please call 1-800-345-6488 or visit ipro.americancentury.com (for Investment Professionals). For additional information about the fund, please consult the prospectus.
Portfolio Managers: Gregory Woodhams and Justin Brown
Senior analyst Justin Brown was promoted to portfolio manager in January 2016. Portfolio manager Prescott LeGard left the fund in March 2016.
Performance Summary
VP Growth returned 4.20%* for the 12 months ended December 31, 2016, lagging the 7.08% return of the portfolio’s benchmark, the Russell 1000 Growth Index.
U.S. stock indices posted solid gains during the reporting period, with small caps outperforming large and mid caps. Value-oriented stocks outperformed growth stocks by a wide margin across the capitalization spectrum, creating a headwind for the fund.
All sectors within the Russell 1000 Growth Index rose except for health care, which was hurt by concerns about the sustainability of high prescription drug prices and, following the presidential election, worries that a repeal of the Affordable Care Act (ACA) would curtail spending by hospitals. Defensive sectors like telecommunication services and utilities that pay sizable dividends were two of the top three gainers, especially in the first half of the year. Energy, industrials, financials, information technology, and materials also posted double-digit gains.
The portfolio underperformed the benchmark due to stock selection, especially in the health care and telecommunication services sectors. Stock choices in information technology also detracted, as did stock selection and an underweight allocation in consumer staples. Stock decisions in the energy, financials, and industrials sectors benefited relative performance. An overweight allocation to energy was also beneficial.
Health Care Stocks Were Key Detractors
Concerns about the sustainability of price increases weighed on drug and biotechnology companies, and stock selection among pharmaceutical companies was a significant source of underperformance relative to the benchmark. Pharmaceutical firm Perrigo has not done well at integrating its acquisition of a European over-the-counter products company, and the CEO left the company. We eliminated the position. Pharmacy benefit manager Express Scripts Holding underperformed amid worries about rapidly rising costs for some drugs and pressure on reimbursements for patients under Medicare and the ACA. Nevertheless, the company continues to benefit from an increasing number of patients covered by Medicare Part D and greater availability of both generic substitutes and new, specialty pharmaceuticals.
Stock selection among diversified telecommunication services companies hampered performance as investors sought higher dividend paying stocks that do not fit our growth criteria. SBA Communications fell on concerns about debt, exposure to Latin America, and a slowing revenue growth rate.
* All fund returns referenced in this commentary are for Class II shares. Fund returns would have been lower if a portion of the fees had not been waived. Performance for other share classes will vary due to differences in fee structure; when Class II performance exceeds that of the fund’s benchmark, other share classes may not. See page 2 for returns for all share classes.
The largest individual detractor for the year was online travel company TripAdvisor. The company’s transition from collecting referral fees to booking hotels directly on its website has not gone as smoothly as it had planned, and in the fourth quarter management unexpectedly offered guidance that included higher expenses to drive consumers to its website. The greater spending will pressure margins in 2017.
Energy Holdings Led Contributors
Stock decisions among oil, gas, and consumable fuels firms were positive. Energy equipment company Halliburton and exploration firm Concho Resources—which are not benchmark components—were key contributors, benefiting from relatively healthy balance sheets and a rebound in energy markets as production is curtailed. In addition, Concho provided better-than-expected guidance, and Halliburton rallied after the deal to combine with Baker Hughes was called off on regulatory concerns, which relieved the market of uncertainty.
In information technology, cyber security firm Symantec reported strong results driven by strength in its enterprise security software and improving margins. The company also closed on its acquisition of Blue Coat sooner than expected and should see revenue synergies and cross-selling opportunities as a result of the merger. The acquisition gave Symantec better security technology and brought in a new management team, which has investors optimistic.
Aerospace and defense company Lockheed Martin performed well after reporting better-than-expected results. The company is benefiting from better sales and margins in its aeronautics division with the integration of its Sikorsky acquisition. Among financial stocks, broker Charles Schwab performed well, especially after the U.S. election, helped by rising equity markets, higher interest rates, and prospects for lower tax rates. Schwab is well positioned to capture flows from advisors using its platform.
Outlook
We believe stock selection—rather than sector allocation or market timing via the use of cash—is the most efficient means of generating superior risk-adjusted returns. As a result of this approach, the portfolio’s sector and industry selection are primarily due to identifying what we believe to be superior individual securities.
As of December 31, 2016, the portfolio’s largest sector overweight was in information technology, reflecting positioning in the software and internet software and services industries. Companies in these industry segments continue to benefit from secular trends around advertising and consumer spending shifting from traditional media/retail to online and mobile, a shift to cloud computing/hardware-light technology solutions, mobile computing, and unstructured data growth.
At the other end of the spectrum, the portfolio maintains a sizable underweight position in the real estate sector. Valuations for real estate investment trusts appear elevated relative to history, and the industry has benefited from declines in interest rates that are unlikely to be sustainable.
|
| |
| DECEMBER 31, 2016 |
| Top Ten Holdings | % of net assets |
| Alphabet, Inc., Class A | 6.5% |
| Apple, Inc. | 5.1% |
| Amazon.com, Inc. | 4.1% |
| Microsoft Corp. | 3.5% |
| Comcast Corp., Class A | 3.2% |
| Visa, Inc., Class A | 2.9% |
| O'Reilly Automotive, Inc. | 2.5% |
| PepsiCo, Inc. | 2.3% |
| Amgen, Inc. | 2.0% |
| Delta Air Lines, Inc. | 1.7% |
| | |
| Top Five Industries | % of net assets |
| Internet Software and Services | 9.5% |
| Software | 9.4% |
| IT Services | 6.0% |
| Specialty Retail | 5.6% |
| Biotechnology | 5.4% |
| | |
| Types of Investments in Portfolio | % of net assets |
| Common Stocks | 99.2% |
| Exchange-Traded Funds | 0.2% |
| Total Equity Exposure | 99.4% |
| Temporary Cash Investments | 0.2% |
| Other Assets and Liabilities | 0.4% |
Fund shareholders may incur two types of costs: (1) transaction costs, including sales charges (loads) on purchase payments and redemption/exchange fees; and (2) ongoing costs, including management fees; distribution and service (12b-1) fees; and other fund expenses. This example is intended to help you understand your ongoing costs (in dollars) of investing in your fund and to compare these costs with the ongoing cost of investing in other mutual funds.
The example is based on an investment of $1,000 made at the beginning of the period and held for the entire period from July 1, 2016 to December 31, 2016.
Actual Expenses
The table provides information about actual account values and actual expenses for each class. You may use the information, together with the amount you invested, to estimate the expenses that you paid over the period. First, identify the share class you own. Then simply divide your account value by $1,000 (for example, an $8,600 account value divided by $1,000 = 8.6), then multiply the result by the number under the heading “Expenses Paid During Period” to estimate the expenses you paid on your account during this period.
Hypothetical Example for Comparison Purposes
The table also provides information about hypothetical account values and hypothetical expenses based on the actual expense ratio of each class of your fund and an assumed rate of return of 5% per year before expenses, which is not the actual return of a fund’s share class. The hypothetical account values and expenses may not be used to estimate the actual ending account balance or expenses you paid for the period. You may use this information to compare the ongoing costs of investing in your fund and other funds. To do so, compare this 5% hypothetical example with the 5% hypothetical examples that appear in the shareholder reports of the other funds.
Please note that the expenses shown in the table are meant to highlight your ongoing costs only and do not reflect any transactional costs, such as sales charges (loads) or redemption/exchange fees. Therefore, the table is useful in comparing ongoing costs only, and will not help you determine the relative total costs of owning different funds. In addition, if these transactional costs were included, your costs would have been higher.
|
| | | | |
| | Beginning
Account Value
7/1/16 | Ending
Account Value
12/31/16 | Expenses Paid
During Period(1)
7/1/16 - 12/31/16 | Annualized
Expense Ratio(1) |
| Actual | | | | |
| Class I (after waiver) | $1,000 | $1,048.20 | $4.38 | 0.85% |
| Class I (before waiver) | $1,000 | $1,048.20(2) | $5.20 | 1.01% |
| Class II (after waiver) | $1,000 | $1,048.30 | $5.15 | 1.00% |
| Class II (before waiver) | $1,000 | $1,048.30(2) | $5.97 | 1.16% |
| Hypothetical | | | | |
| Class I (after waiver) | $1,000 | $1,020.86 | $4.32 | 0.85% |
| Class I (before waiver) | $1,000 | $1,020.06 | $5.13 | 1.01% |
| Class II (after waiver) | $1,000 | $1,020.11 | $5.08 | 1.00% |
| Class II (before waiver) | $1,000 | $1,019.31 | $5.89 | 1.16% |
| |
| (1) | Expenses are equal to the class's annualized expense ratio listed in the table above, multiplied by the average account value over the period, multiplied by 184, the number of days in the most recent fiscal half-year, divided by 366, to reflect the one-half year period. |
| |
| (2) | Ending account value assumes the return earned after waiver and would have been lower if a portion of the fees had not been waived. |
DECEMBER 31, 2016
|
| | | | | |
| | Shares | Value |
| COMMON STOCKS — 99.2% | | |
| Aerospace and Defense — 2.0% | | |
| Boeing Co. (The) | 129 |
| $ | 20,083 |
|
| Lockheed Martin Corp. | 346 |
| 86,479 |
|
| | | 106,562 |
|
| Airlines — 1.7% | | |
| Delta Air Lines, Inc. | 1,760 |
| 86,574 |
|
| Banks — 0.9% | | |
| Citizens Financial Group, Inc. | 699 |
| 24,906 |
|
| Regions Financial Corp. | 1,484 |
| 21,310 |
|
| | | 46,216 |
|
| Beverages — 3.3% | | |
| Dr Pepper Snapple Group, Inc. | 572 |
| 51,863 |
|
| PepsiCo, Inc. | 1,140 |
| 119,278 |
|
| | | 171,141 |
|
| Biotechnology — 5.4% | | |
| Amgen, Inc. | 719 |
| 105,125 |
|
Biogen, Inc.(1) | 217 |
| 61,537 |
|
| Gilead Sciences, Inc. | 849 |
| 60,797 |
|
Incyte Corp.(1) | 229 |
| 22,962 |
|
Regeneron Pharmaceuticals, Inc.(1) | 91 |
| 33,405 |
|
| | | 283,826 |
|
| Capital Markets — 1.1% | | |
| Charles Schwab Corp. (The) | 1,485 |
| 58,613 |
|
| Chemicals — 2.5% | | |
| Dow Chemical Co. (The) | 1,397 |
| 79,936 |
|
| LyondellBasell Industries NV, Class A | 578 |
| 49,581 |
|
| | | 129,517 |
|
| Consumer Finance — 0.9% | | |
| American Express Co. | 663 |
| 49,115 |
|
| Diversified Telecommunication Services — 0.3% | | |
SBA Communications Corp., Class A(1) | 154 |
| 15,902 |
|
| Electronic Equipment, Instruments and Components — 0.6% | | |
| CDW Corp. | 570 |
| 29,691 |
|
| Energy Equipment and Services — 0.7% | | |
| Halliburton Co. | 689 |
| 37,268 |
|
| Equity Real Estate Investment Trusts (REITs) — 1.0% | | |
| Simon Property Group, Inc. | 295 |
| 52,413 |
|
| Food and Staples Retailing — 2.4% | | |
| Kroger Co. (The) | 1,869 |
| 64,499 |
|
| Wal-Mart Stores, Inc. | 852 |
| 58,890 |
|
| | | 123,389 |
|
| Food Products — 0.8% | | |
| Hormel Foods Corp. | 859 |
| 29,902 |
|
| Mead Johnson Nutrition Co. | 155 |
| 10,968 |
|
| | | 40,870 |
|
|
| | | | | |
| | Shares | Value |
| Health Care Equipment and Supplies — 3.2% | | |
| C.R. Bard, Inc. | 175 |
| $ | 39,316 |
|
Edwards Lifesciences Corp.(1) | 717 |
| 67,183 |
|
Intuitive Surgical, Inc.(1) | 95 |
| 60,246 |
|
| | | 166,745 |
|
| Health Care Providers and Services — 3.1% | | |
| Cardinal Health, Inc. | 816 |
| 58,728 |
|
Express Scripts Holding Co.(1) | 738 |
| 50,767 |
|
| Quest Diagnostics, Inc. | 217 |
| 19,942 |
|
VCA, Inc.(1) | 452 |
| 31,030 |
|
| | | 160,467 |
|
| Health Care Technology — 0.7% | | |
Cerner Corp.(1) | 790 |
| 37,422 |
|
| Hotels, Restaurants and Leisure — 1.4% | | |
Chipotle Mexican Grill, Inc.(1) | 91 |
| 34,336 |
|
| Las Vegas Sands Corp. | 690 |
| 36,853 |
|
| | | 71,189 |
|
| Household Products — 1.3% | | |
| Church & Dwight Co., Inc. | 902 |
| 39,859 |
|
| Procter & Gamble Co. (The) | 312 |
| 26,233 |
|
| | | 66,092 |
|
| Industrial Conglomerates — 1.6% | | |
| 3M Co. | 467 |
| 83,392 |
|
| Insurance — 0.6% | | |
| American International Group, Inc. | 452 |
| 29,520 |
|
| Internet and Direct Marketing Retail — 5.0% | | |
Amazon.com, Inc.(1) | 285 |
| 213,713 |
|
| Expedia, Inc. | 240 |
| 27,187 |
|
TripAdvisor, Inc.(1) | 417 |
| 19,336 |
|
| | | 260,236 |
|
| Internet Software and Services — 9.5% | | |
Alphabet, Inc., Class A(1) | 426 |
| 337,584 |
|
eBay, Inc.(1) | 1,445 |
| 42,902 |
|
Facebook, Inc., Class A(1) | 668 |
| 76,853 |
|
VeriSign, Inc.(1) | 466 |
| 35,449 |
|
| | | 492,788 |
|
| IT Services — 6.0% | | |
| Computer Sciences Corp. | 370 |
| 21,985 |
|
Fiserv, Inc.(1) | 753 |
| 80,029 |
|
| Global Payments, Inc. | 866 |
| 60,109 |
|
| Visa, Inc., Class A | 1,948 |
| 151,983 |
|
| | | 314,106 |
|
| Life Sciences Tools and Services — 1.2% | | |
| Agilent Technologies, Inc. | 857 |
| 39,045 |
|
Illumina, Inc.(1) | 79 |
| 10,115 |
|
Waters Corp.(1) | 109 |
| 14,649 |
|
| | | 63,809 |
|
| Machinery — 3.8% | | |
| Caterpillar, Inc. | 518 |
| 48,039 |
|
| Parker-Hannifin Corp. | 224 |
| 31,360 |
|
WABCO Holdings, Inc.(1) | 549 |
| 58,277 |
|
|
| | | | | |
| | Shares | Value |
| Wabtec Corp. | 745 |
| $ | 61,850 |
|
| | | 199,526 |
|
| Media — 4.7% | | |
| Comcast Corp., Class A | 2,415 |
| 166,756 |
|
| Sirius XM Holdings, Inc. | 5,477 |
| 24,373 |
|
| Walt Disney Co. (The) | 543 |
| 56,591 |
|
| | | 247,720 |
|
| Multiline Retail — 1.3% | | |
Dollar Tree, Inc.(1) | 901 |
| 69,539 |
|
| Oil, Gas and Consumable Fuels — 0.8% | | |
Concho Resources, Inc.(1) | 320 |
| 42,432 |
|
| Personal Products — 1.0% | | |
| Estee Lauder Cos., Inc. (The), Class A | 705 |
| 53,926 |
|
| Pharmaceuticals — 2.2% | | |
| Bristol-Myers Squibb Co. | 1,414 |
| 82,634 |
|
| Johnson & Johnson | 271 |
| 31,222 |
|
| | | 113,856 |
|
| Road and Rail — 0.9% | | |
| Union Pacific Corp. | 433 |
| 44,893 |
|
| Semiconductors and Semiconductor Equipment — 3.3% | | |
| ASML Holding NV | 420 |
| 47,058 |
|
| Broadcom Ltd. | 356 |
| 62,930 |
|
| Marvell Technology Group Ltd. | 2,018 |
| 27,990 |
|
| Maxim Integrated Products, Inc. | 896 |
| 34,559 |
|
| | | 172,537 |
|
| Software — 9.4% | | |
| Activision Blizzard, Inc. | 1,511 |
| 54,562 |
|
Citrix Systems, Inc.(1) | 259 |
| 23,131 |
|
Electronic Arts, Inc.(1) | 625 |
| 49,225 |
|
| Microsoft Corp. | 2,941 |
| 182,754 |
|
| Oracle Corp. | 1,171 |
| 45,025 |
|
salesforce.com, Inc.(1) | 710 |
| 48,607 |
|
Splunk, Inc.(1) | 748 |
| 38,260 |
|
| Symantec Corp. | 1,091 |
| 26,064 |
|
VMware, Inc., Class A(1) | 284 |
| 22,359 |
|
| | | 489,987 |
|
| Specialty Retail — 5.6% | | |
| Home Depot, Inc. (The) | 239 |
| 32,045 |
|
O'Reilly Automotive, Inc.(1) | 464 |
| 129,182 |
|
| Ross Stores, Inc. | 558 |
| 36,605 |
|
| TJX Cos., Inc. (The) | 997 |
| 74,905 |
|
| Williams-Sonoma, Inc. | 359 |
| 17,372 |
|
| | | 290,109 |
|
| Technology Hardware, Storage and Peripherals — 5.2% | | |
| Apple, Inc. | 2,297 |
| 266,038 |
|
| Hewlett Packard Enterprise Co. | 190 |
| 4,397 |
|
| | | 270,435 |
|
| Textiles, Apparel and Luxury Goods — 1.3% | | |
| Carter's, Inc. | 408 |
| 35,247 |
|
| Coach, Inc. | 942 |
| 32,989 |
|
| | | 68,236 |
|
|
| | | | | |
| | Shares | Value |
| Tobacco — 2.0% | | |
| Altria Group, Inc. | 821 |
| $ | 55,516 |
|
| Philip Morris International, Inc. | 530 |
| 48,490 |
|
| | | 104,006 |
|
| Trading Companies and Distributors — 0.5% | | |
United Rentals, Inc.(1) | 238 |
| 25,128 |
|
TOTAL COMMON STOCKS
(Cost $4,210,850) | | 5,169,193 |
|
| EXCHANGE-TRADED FUNDS — 0.2% | | |
iShares Russell 2000 ETF
(Cost $12,117) | 93 |
| 12,541 |
|
| TEMPORARY CASH INVESTMENTS — 0.2% | | |
State Street Institutional U.S. Government Money Market Fund, Premier Class
(Cost $9,194) | 9,194 |
| 9,194 |
|
TOTAL INVESTMENT SECURITIES — 99.6%
(Cost $4,232,161) | | 5,190,928 |
|
| OTHER ASSETS AND LIABILITIES — 0.4% | | 18,698 |
|
| TOTAL NET ASSETS — 100.0% | | $ | 5,209,626 |
|
|
| | | | | | | | |
| FORWARD FOREIGN CURRENCY EXCHANGE CONTRACTS |
| Currency Purchased | Currency Sold | Counterparty | Settlement Date | Unrealized Appreciation
(Depreciation) |
| USD | 36,484 | EUR | 34,986 | UBS AG | 3/31/17 | $ | (508 | ) |
| USD | 1,143 | EUR | 1,089 | UBS AG | 3/31/17 | (8 | ) |
| USD | 1,604 | EUR | 1,535 | UBS AG | 3/31/17 | (20 | ) |
| | | | | | | $ | (536 | ) |
|
| | |
| NOTES TO SCHEDULE OF INVESTMENTS |
| EUR | - | Euro |
| USD | - | United States Dollar |
See Notes to Financial Statements.
|
|
| Statement of Assets and Liabilities |
|
| | | |
| DECEMBER 31, 2016 | |
| Assets |
| Investment securities, at value (cost of $4,232,161) | $ | 5,190,928 |
|
| Receivable for investments sold | 35,550 |
|
| Dividends and interest receivable | 5,530 |
|
| | 5,232,008 |
|
| | |
| Liabilities | |
| Payable for investments purchased | 4,132 |
|
| Payable for capital shares redeemed | 13,267 |
|
| Unrealized depreciation on forward foreign currency exchange contracts | 536 |
|
| Accrued management fees | 3,359 |
|
| Distribution fees payable | 1,088 |
|
| | 22,382 |
|
| | |
| Net Assets | $ | 5,209,626 |
|
| | |
| Net Assets Consist of: | |
| Capital (par value and paid-in surplus) | $ | 4,013,062 |
|
| Undistributed net investment income | 37,641 |
|
| Undistributed net realized gain | 200,692 |
|
| Net unrealized appreciation | 958,231 |
|
| | $ | 5,209,626 |
|
|
| | | | | | |
| | Net Assets | Shares Outstanding | Net Asset Value Per Share |
| Class I, $0.01 Par Value |
| $191,205 |
| 14,405 |
| $13.27 |
| Class II, $0.01 Par Value |
| $5,018,421 |
| 378,678 |
| $13.25 |
See Notes to Financial Statements.
|
| | | |
| YEAR ENDED DECEMBER 31, 2016 |
| Investment Income (Loss) |
| Income: | |
| Dividends (net of foreign taxes withheld of $140) | $ | 91,012 |
|
| Interest | 109 |
|
| | 91,121 |
|
| | |
| Expenses: | |
| Management fees | 51,238 |
|
| Distribution fees - Class II | 13,722 |
|
| Directors' fees and expenses | 188 |
|
| Other expenses | 232 |
|
| | 65,380 |
|
| Fees waived | (8,740 | ) |
| | 56,640 |
|
| | |
| Net investment income (loss) | 34,481 |
|
| | |
| Realized and Unrealized Gain (Loss) | |
| Net realized gain (loss) on: | |
| Investment transactions | 230,089 |
|
| Foreign currency transactions | 3,279 |
|
| | 233,368 |
|
| | |
| Change in net unrealized appreciation (depreciation) on: | |
| Investments | 9,044 |
|
| Translation of assets and liabilities in foreign currencies | (536 | ) |
| | 8,508 |
|
| | |
| Net realized and unrealized gain (loss) | 241,876 |
|
| | |
| Net Increase (Decrease) in Net Assets Resulting from Operations | $ | 276,357 |
|
See Notes to Financial Statements.
|
|
| Statement of Changes in Net Assets |
|
| | | | | | |
| YEARS ENDED DECEMBER 31, 2016 AND DECEMBER 31, 2015 |
| Increase (Decrease) in Net Assets | December 31, 2016 | December 31, 2015 |
| Operations |
| Net investment income (loss) | $ | 34,481 |
| $ | 17,720 |
|
| Net realized gain (loss) | 233,368 |
| 236,566 |
|
| Change in net unrealized appreciation (depreciation) | 8,508 |
| 52,103 |
|
| Net increase (decrease) in net assets resulting from operations | 276,357 |
| 306,389 |
|
| | | |
| Distributions to Shareholders |
| From net investment income: | | |
| Class I | — |
| (881 | ) |
| Class II | — |
| (17,359 | ) |
| From net realized gains: | | |
| Class I | (614 | ) | (21,870 | ) |
| Class II | (20,085 | ) | (317,045 | ) |
| Decrease in net assets from distributions | (20,699 | ) | (357,155 | ) |
| | | |
| Capital Share Transactions |
| Net increase (decrease) in net assets from capital share transactions (Note 5) | (505,209 | ) | (705,117 | ) |
| | | |
| Net increase (decrease) in net assets | (249,551 | ) | (755,883 | ) |
| | | |
| Net Assets |
| Beginning of period | 5,459,177 |
| 6,215,060 |
|
| End of period | $ | 5,209,626 |
| $ | 5,459,177 |
|
| | | |
| Undistributed net investment income | $ | 37,641 |
| $ | — |
|
See Notes to Financial Statements.
|
|
| Notes to Financial Statements |
DECEMBER 31, 2016
1. Organization
American Century Variable Portfolios, Inc. (the corporation) is registered under the Investment Company Act of 1940, as amended (the 1940 Act), as an open-end management investment company and is organized as a Maryland corporation. VP Growth Fund (the fund) is one fund in a series issued by the corporation. The fund’s investment objective is to seek long-term capital growth.
The fund offers Class I and Class II. The share classes differ principally in their respective distribution and shareholder servicing expenses and arrangements. Class II is charged a lower unified management fee because it has a separate arrangement for distribution services.
2. Significant Accounting Policies
The following is a summary of significant accounting policies consistently followed by the fund in preparation of its financial statements. The fund is an investment company and follows accounting and reporting guidance in accordance with accounting principles generally accepted in the United States of America. This may require management to make certain estimates and assumptions at the date of the financial statements. Actual results could differ from these estimates. Management evaluated the impact of events or transactions occurring through the date the financial statements were issued that would merit recognition or disclosure.
Investment Valuations — The fund determines the fair value of its investments and computes its net asset value per share at the close of regular trading (usually 4 p.m. Eastern time) on the New York Stock Exchange (NYSE) on each day the NYSE is open. The Board of Directors has adopted valuation policies and procedures to guide the investment advisor in the fund’s investment valuation process and to provide methodologies for the oversight of the fund’s pricing function.
Equity securities that are listed or traded on a domestic securities exchange are valued at the last reported sales price or at the official closing price as provided by the exchange. Equity securities traded on foreign securities exchanges are generally valued at the closing price of such securities on the exchange where primarily traded or at the close of the NYSE, if that is earlier. If no last sales price is reported, or if local convention or regulation so provides, the mean of the latest bid and asked prices may be used. Securities traded over-the-counter are valued at the mean of the latest bid and asked prices, the last sales price, or the official closing price. Equity securities initially expressed in local currencies are translated into U.S. dollars at the mean of the appropriate currency exchange rate at the close of the NYSE as provided by an independent pricing service.
Open-end management investment companies are valued at the reported net asset value per share. Repurchase agreements are valued at cost, which approximates fair value. Forward foreign currency exchange contracts are valued at the mean of the appropriate forward exchange rate at the close of the NYSE as provided by an independent pricing service.
If the fund determines that the market price for an investment is not readily available or the valuation methods mentioned above do not reflect an investment’s fair value, such investment is valued as determined in good faith by the Board of Directors or its delegate, in accordance with policies and procedures adopted by the Board of Directors. In its determination of fair value, the fund may review several factors including, but not limited to, market information regarding the specific investment or comparable investments and correlation with other investment types, futures indices or general market indicators. Circumstances that may cause the fund to use these procedures to value an investment include, but are not limited to: an investment has been declared in default or is distressed; trading in a security has been suspended during the trading day or a security is not actively trading on its principal exchange; prices received from a regular pricing source are deemed unreliable; or there is a foreign market holiday and no trading occurred.
The fund monitors for significant events occurring after the close of an investment’s primary exchange but before the fund’s net asset value per share is determined. Significant events may include, but are not limited to: corporate announcements and transactions; governmental action and political unrest that could impact a specific investment or an investment sector; or armed conflicts, natural disasters and similar events that could affect investments in a specific country or region. The fund also monitors for significant fluctuations between
domestic and foreign markets, as evidenced by the U.S. market or such other indicators that the Board of Directors, or its delegate, deems appropriate. If significant fluctuations in foreign markets are identified, the fund may apply a model-derived factor to the closing price of equity securities traded on foreign securities exchanges. The factor is based on observable market data as provided by an independent pricing service.
Security Transactions — Security transactions are accounted for as of the trade date. Net realized gains and losses are determined on the identified cost basis, which is also used for federal income tax purposes.
Investment Income — Dividend income less foreign taxes withheld, if any, is recorded as of the ex-dividend date. Distributions received on securities that represent a return of capital or long-term capital gain are recorded as a reduction of cost of investments and/or as a realized gain. The fund may estimate the components of distributions received that may be considered nontaxable distributions or long-term capital gain distributions for income tax purposes. Interest income is recorded on the accrual basis and includes accretion of discounts and amortization of premiums.
Repurchase Agreements — The fund may enter into repurchase agreements with institutions that American Century Investment Management, Inc. (ACIM) (the investment advisor) has determined are creditworthy pursuant to criteria adopted by the Board of Directors. The fund requires that the collateral, represented by securities, received in a repurchase transaction be transferred to the custodian in a manner sufficient to enable the fund to obtain those securities in the event of a default under the repurchase agreement. ACIM monitors, on a daily basis, the securities transferred to ensure the value, including accrued interest, of the securities under each repurchase agreement is equal to or greater than amounts owed to the fund under each repurchase agreement.
Joint Trading Account — Pursuant to an Exemptive Order issued by the Securities and Exchange Commission, the fund, along with certain other funds in the American Century Investments family of funds, may transfer uninvested cash balances into a joint trading account. These balances are invested in one or more repurchase agreements that are collateralized by U.S. Treasury or Agency obligations.
Foreign Currency Translations — All assets and liabilities initially expressed in foreign currencies are translated into U.S. dollars at prevailing exchange rates at period end. The fund may enter into spot foreign currency exchange contracts to facilitate transactions denominated in a foreign currency. Purchases and sales of investment securities, dividend and interest income, spot foreign currency exchange contracts, and expenses are translated at the rates of exchange prevailing on the respective dates of such transactions. Net realized and unrealized foreign currency exchange gains or losses related to investment securities are a component of net realized gain (loss) on investment transactions and change in net unrealized appreciation (depreciation) on investments, respectively.
Income Tax Status — It is the fund’s policy to distribute substantially all net investment income and net realized gains to shareholders and to otherwise qualify as a regulated investment company under provisions of the Internal Revenue Code. Accordingly, no provision has been made for income taxes. The fund files U.S. federal, state, local and non-U.S. tax returns as applicable. The fund's tax returns are subject to examination by the relevant taxing authority until expiration of the applicable statute of limitations, which is generally three years from the date of filing but can be longer in certain jurisdictions. At this time, management believes there are no uncertain tax positions which, based on their technical merit, would not be sustained upon examination and for which it is reasonably possible that the total amounts of unrecognized tax benefits will significantly change in the next twelve months.
Multiple Class — All shares of the fund represent an equal pro rata interest in the net assets of the class to which such shares belong, and have identical voting, dividend, liquidation and other rights and the same terms and conditions, except for class specific expenses and exclusive rights to vote on matters affecting only individual classes. Income, non-class specific expenses, and realized and unrealized capital gains and losses of the fund are allocated to each class of shares based on their relative net assets.
Distributions to Shareholders — Distributions from net investment income and net realized gains, if any, are generally declared and paid annually.
Indemnifications — Under the corporation’s organizational documents, its officers and directors are indemnified against certain liabilities arising out of the performance of their duties to the fund. In addition, in the normal course of business, the fund enters into contracts that provide general indemnifications. The maximum exposure under these arrangements is unknown as this would involve future claims that may be made against a fund. The risk of material loss from such claims is considered by management to be remote.
3. Fees and Transactions with Related Parties
Certain officers and directors of the corporation are also officers and/or directors of American Century Companies, Inc. (ACC). The corporation’s investment advisor, ACIM, the corporation's distributor, American Century Investment Services, Inc. (ACIS), and the corporation’s transfer agent, American Century Services, LLC, are wholly owned, directly or indirectly, by ACC.
Management Fees — The corporation has entered into a management agreement with ACIM, under which ACIM provides the fund with investment advisory and management services in exchange for a single, unified management fee (the fee) per class. The agreement provides that all expenses of managing and operating the fund, except distribution fees, brokerage expenses, taxes, interest, fees and expenses of the independent directors (including legal counsel fees), and extraordinary expenses, will be paid by ACIM. The fee is computed and accrued daily based on each class's daily net assets and paid monthly in arrears. The annual management fee for each class is 1.00% and 0.90% for Class I and Class II, respectively. From January 1, 2016 through July 31, 2016, the investment advisor agreed to waive 0.15% of the fund's management fee. Effective August 1, 2016, the investment advisor agreed to waive 0.16% of the fund’s management fee. The investment advisor expects this waiver to continue until July 31, 2017 and cannot terminate it prior to such date without the approval of the Board of Directors. The total amount of the waiver for each class for the year ended December 31, 2016 was $284 and $8,456 for Class I and Class II, respectively. The effective annual management fee after waiver for each class for the year ended December 31, 2016 was 0.84% and 0.74% for Class I and Class II, respectively.
Distribution Fees — The Board of Directors has adopted the Master Distribution Plan (the plan) for Class II, pursuant to Rule 12b-1 of the 1940 Act. The plan provides that Class II will pay ACIS an annual distribution fee equal to 0.25%. The fee is computed and accrued daily based on the Class II daily net assets and paid monthly in arrears. The distribution fee provides compensation for expenses incurred in connection with distributing shares of Class II including, but not limited to, payments to brokers, dealers, and financial institutions that have entered into sales agreements with respect to shares of the fund. Fees incurred under the plan during the year ended December 31, 2016 are detailed in the Statement of Operations.
Directors' Fees and Expenses — The Board of Directors is responsible for overseeing the investment advisor’s management and operations of the fund. The directors receive detailed information about the fund and its investment advisor regularly throughout the year, and meet at least quarterly with management of the investment advisor to review reports about fund operations. The fund’s officers do not receive compensation from the fund.
Interfund Transactions — The fund may enter into security transactions with other American Century Investments funds and other client accounts of the investment advisor, in accordance with the 1940 Act rules and procedures adopted by the Board of Directors. The rules and procedures require, among other things, that these transactions be effected at the independent current market price of the security. During the period, the interfund purchases and sales were $69,585 and $81,614, respectively. The effect of interfund transactions on the Statement of Operations was $358 in net realized gain (loss) on investment transactions.
4. Investment Transactions
Purchases and sales of investment securities, excluding short-term investments, for the year ended December 31, 2016 were $3,870,987 and $4,359,518, respectively.
5. Capital Share Transactions
Transactions in shares of the fund were as follows:
|
| | | | | | | | | | |
| | Year ended
December 31, 2016 | Year ended
December 31, 2015 |
| | Shares | Amount | Shares | Amount |
| Class I/Shares Authorized | 50,000,000 |
| | 50,000,000 |
| |
| Issued in reinvestment of distributions | 50 |
| $ | 614 |
| 1,728 |
| $ | 22,751 |
|
| Redeemed | — |
| — |
| (44,877 | ) | (600,163 | ) |
| | 50 |
| 614 |
| (43,149 | ) | (577,412 | ) |
| Class II/Shares Authorized | 50,000,000 |
| | 50,000,000 |
| |
| Sold | 99,772 |
| 1,217,416 |
| 61,381 |
| 793,395 |
|
| Issued in reinvestment of distributions | 1,615 |
| 20,085 |
| 25,679 |
| 334,404 |
|
| Redeemed | (136,084 | ) | (1,743,324 | ) | (94,339 | ) | (1,255,504 | ) |
| | (34,697 | ) | (505,823 | ) | (7,279 | ) | (127,705 | ) |
| Net increase (decrease) | (34,647 | ) | $ | (505,209 | ) | (50,428 | ) | $ | (705,117 | ) |
6. Fair Value Measurements
The fund’s investments valuation process is based on several considerations and may use multiple inputs to determine the fair value of the investments held by the fund. In conformity with accounting principles generally accepted in the United States of America, the inputs used to determine a valuation are classified into three broad levels.
| |
| • | Level 1 valuation inputs consist of unadjusted quoted prices in an active market for identical investments. |
| |
| • | Level 2 valuation inputs consist of direct or indirect observable market data (including quoted prices for comparable investments, evaluations of subsequent market events, interest rates, prepayment speeds, credit risk, etc.). These inputs also consist of quoted prices for identical investments initially expressed in local currencies that are adjusted through translation into U.S. dollars. |
| |
| • | Level 3 valuation inputs consist of unobservable data (including a fund’s own assumptions). |
The level classification is based on the lowest level input that is significant to the fair valuation measurement. The valuation inputs are not necessarily an indication of the risks associated with investing in these securities or other financial instruments. There were no significant transfers between levels during the period.
The following is a summary of the level classifications as of period end. The Schedule of Investments provides additional information on the fund’s portfolio holdings.
|
| | | | | | | | |
| | Level 1 | Level 2 | Level 3 |
| Assets | | | |
| Investment Securities | | | |
| Common Stocks | $ | 5,122,135 |
| $ | 47,058 |
| — |
|
| Exchange-Traded Funds | 12,541 |
| — |
| — |
|
| Temporary Cash Investments | 9,194 |
| — |
| — |
|
| | $ | 5,143,870 |
| $ | 47,058 |
| — |
|
| | | | |
| Liabilities | | | |
| Other Financial Instruments | | | |
| Forward Foreign Currency Exchange Contracts | — |
| $ | 536 |
| — |
|
7. Derivative Instruments
Foreign Currency Risk — The fund is subject to foreign currency exchange rate risk in the normal course of pursuing its investment objectives. The value of foreign investments held by a fund may be significantly affected by changes in foreign currency exchange rates. The dollar value of a foreign security generally decreases when the value of the dollar rises against the foreign currency in which the security is denominated and tends to increase when the value of the dollar declines against such foreign currency. A fund may enter into forward foreign currency exchange contracts to reduce a fund's exposure to foreign currency exchange rate fluctuations. The net U.S. dollar value of foreign currency underlying all contractual commitments held by a fund and the resulting unrealized appreciation or depreciation are determined daily. Realized gain or loss is recorded upon the termination of the contract. Net realized and unrealized gains or losses occurring during the holding period of forward foreign currency exchange contracts are a component of net realized gain (loss) on foreign currency transactions and change in net unrealized appreciation (depreciation) on translation of assets and liabilities in foreign currencies, respectively. A fund bears the risk of an unfavorable change in the foreign currency exchange rate underlying the forward contract. Additionally, losses, up to the fair value, may arise if the counterparties do not perform under the contract terms. The fund's average U.S. dollar exposure to foreign currency risk derivative instruments held during the period was $38,417.
The value of foreign currency risk derivative instruments as of December 31, 2016, is disclosed on the Statement of Assets and Liabilities as a liability of $536 in unrealized depreciation on forward foreign currency exchange contracts. For the year ended December 31, 2016, the effect of foreign currency risk derivative instruments on the Statement of Operations was $3,334 in net realized gain (loss) on foreign currency transactions and $(536) in change in net unrealized appreciation (depreciation) on translation of assets and liabilities in foreign currencies.
8. Federal Tax Information
The tax character of distributions paid during the years ended December 31, 2016 and December 31, 2015 were as follows:
|
| | | | | | |
| | 2016 | 2015 |
| Distributions Paid From | | |
| Ordinary income | — |
| $ | 113,876 |
|
| Long-term capital gains | $ | 20,699 |
| $ | 243,279 |
|
The book-basis character of distributions made during the year from net investment income or net realized gains may differ from their ultimate characterization for federal income tax purposes. These differences reflect the differing character of certain income items and net realized gains and losses for financial statement and tax purposes, and may result in reclassification among certain capital accounts on the financial statements.
As of December 31, 2016, the federal tax cost of investments and the components of distributable earnings on a tax-basis were as follows:
|
| | | |
| Federal tax cost of investments | $ | 4,278,144 |
|
| Gross tax appreciation of investments | $ | 982,883 |
|
| Gross tax depreciation of investments | (70,099 | ) |
| Net tax appreciation (depreciation) of investments | 912,784 |
|
| Undistributed ordinary income | $ | 37,105 |
|
| Accumulated long-term gains | $ | 246,675 |
|
The difference between book-basis and tax-basis unrealized appreciation (depreciation) is attributable primarily to the tax deferral of losses on wash sales.
9. Recently Issued Accounting Guidance
In October 2016, the Securities and Exchange Commission adopted new rules and forms as well as amendments to its rules and forms to modernize the reporting and disclosure of information by registered investment companies. The amendments to Regulation S-X will require standardized, enhanced disclosure about derivatives in investment company financial statements, as well as other provisions. Compliance with the amendments is effective on August 1, 2017. Management is currently evaluating the impact that adopting the amendments will have on the financial statement disclosures.
|
| | | | | | | | | | | | | | | | | |
| For a Share Outstanding Throughout the Years Ended December 31 (except as noted) | | | |
| Per-Share Data | | | Ratios and Supplemental Data |
| | | Income From Investment Operations: | Distributions From: | | | Ratio to Average Net Assets of: | | |
| | Net Asset
Value,
Beginning
of Period | Net
Investment
Income
(Loss)(1) | Net
Realized
and
Unrealized
Gain (Loss) | Total From
Investment
Operations | Net
Investment
Income | Net
Realized
Gains | Total
Distributions | Net Asset
Value,
End
of Period | Total
Return(2) | Operating
Expenses | Operating
Expenses
(before
expense
waiver) | Net
Investment
Income
(Loss) | Net
Investment
Income
(Loss)
(before
expense
waiver) | Portfolio
Turnover
Rate | Net
Assets,
End of
Period
(in thousands) |
| Class I |
| 2016 | $12.76 | 0.09 | 0.46 | 0.55 | — | (0.04) | (0.04) | $13.27 | 4.35% | 0.85% | 1.01% | 0.76% | 0.60% | 69% |
| $191 |
|
| 2015 | $13.00 | 0.05 | 0.56 | 0.61 | (0.06) | (0.79) | (0.85) | $12.76 | 4.71% | 0.85% | 1.00% | 0.44% | 0.29% | 69% |
| $183 |
|
| 2014 | $13.25 | 0.05 | 1.43 | 1.48 | (0.05) | (1.68) | (1.73) | $13.00 | 11.24% | 0.93% | 1.00% | 0.37% | 0.30% | 128% |
| $748 |
|
| 2013 | $10.31 | 0.06 | 2.94 | 3.00 | (0.05) | (0.01) | (0.06) | $13.25 | 29.11% | 1.01% | 1.01% | 0.49% | 0.49% | 122% |
| $672 |
|
| 2012 | $9.12 | 0.07 | 1.17 | 1.24 | (0.05) | — | (0.05) | $10.31 | 13.66% | 1.01% | 1.01% | 0.73% | 0.73% | 78% |
| $521 |
|
| Class II |
| 2016 | $12.76 | 0.08 | 0.45 | 0.53 | — | (0.04) | (0.04) | $13.25 | 4.20% | 1.00% | 1.16% | 0.61% | 0.45% | 69% |
| $5,018 |
|
| 2015 | $13.00 | 0.04 | 0.55 | 0.59 | (0.04) | (0.79) | (0.83) | $12.76 | 4.55% | 1.00% | 1.15% | 0.29% | 0.14% | 69% |
| $5,276 |
|
| 2014 | $13.25 | 0.03 | 1.43 | 1.46 | (0.03) | (1.68) | (1.71) | $13.00 | 11.07% | 1.08% | 1.15% | 0.22% | 0.15% | 128% |
| $5,468 |
|
| 2013 | $10.31 | 0.04 | 2.94 | 2.98 | (0.03) | (0.01) | (0.04) | $13.25 | 28.92% | 1.16% | 1.16% | 0.34% | 0.34% | 122% |
| $4,980 |
|
| 2012 | $9.12 | 0.06 | 1.17 | 1.23 | (0.04) | — | (0.04) | $10.31 | 13.49% | 1.16% | 1.16% | 0.58% | 0.58% | 78% |
| $1,318 |
|
|
| | | | |
| Notes to Financial Highlights | | |
| |
| (1) | Computed using average shares outstanding throughout the period. |
| |
| (2) | Total returns are calculated based on the net asset value of the last business day. Total returns for periods less than one year are not annualized. |
See Notes to Financial Statements.
|
|
| Report of Independent Registered Public Accounting Firm |
To the Board of Directors and Shareholders of American Century Variable Portfolios, Inc.:
We have audited the accompanying statement of assets and liabilities, including the schedule of investments, of VP Growth Fund (the “Fund”), one of the funds constituting American Century Variable Portfolios, Inc., as of December 31, 2016, and the related statement of operations for the year then ended, the statements of changes in net assets for each of the two years in the period then ended, and the financial highlights for each of the five years in the period then ended. These financial statements and financial highlights are the responsibility of the Fund’s management. Our responsibility is to express an opinion on these financial statements and financial highlights based on our audits.
We conducted our audits in accordance with the standards of the Public Company Accounting Oversight Board (United States). Those standards require that we plan and perform the audit to obtain reasonable assurance about whether the financial statements and financial highlights are free of material misstatement. The Fund is not required to have, nor were we engaged to perform, an audit of its internal control over financial reporting. Our audits included consideration of internal control over financial reporting as a basis for designing audit procedures that are appropriate in the circumstances, but not for the purpose of expressing an opinion on the effectiveness of the Fund’s internal control over financial reporting. Accordingly, we express no such opinion. An audit also includes examining, on a test basis, evidence supporting the amounts and disclosures in the financial statements, assessing the accounting principles used and significant estimates made by management, as well as evaluating the overall financial statement presentation. Our procedures included confirmation of securities owned as of December 31, 2016, by correspondence with the custodian and brokers; when replies were not received from brokers, we performed other auditing procedures. We believe that our audits provide a reasonable basis for our opinion.
In our opinion, the financial statements and financial highlights referred to above present fairly, in all material respects, the financial position of VP Growth Fund of American Century Variable Portfolios, Inc. as of December 31, 2016, the results of its operations for the year then ended, the changes in its net assets for each of the two years in the period then ended, and the financial highlights for each of the five years in the period then ended, in conformity with accounting principles generally accepted in the United States of America.
DELOITTE & TOUCHE LLP
Kansas City, Missouri
February 10, 2017
The Board of Directors
The individuals listed below serve as directors of the funds. Each director will continue to serve in this capacity until death, retirement, resignation or removal from office. The board has adopted a mandatory retirement age for directors who are not “interested persons,” as that term is defined in the Investment Company Act (independent directors). Independent directors shall retire by December 31 of the year in which they reach their 75th birthday.
Mr. Thomas is an “interested person” because he currently serves as President and Chief Executive Officer of American Century Companies, Inc. (ACC), the parent company of American Century Investment Management, Inc. (ACIM or the advisor). The other directors (more than three-fourths of the total number) are independent. They are not employees, directors or officers of, and have no financial interest in, ACC or any of its wholly owned, direct or indirect, subsidiaries, including ACIM, American Century Investment Services, Inc. (ACIS) and American Century Services, LLC (ACS), and they do not have any other affiliations, positions or relationships that would cause them to be considered “interested persons” under the Investment Company Act. The directors serve in this capacity for seven (in the case of Mr. Thomas, 15) registered investment companies in the American Century Investments family of funds.
The following table presents additional information about the directors. The mailing address for each director is 4500 Main Street, Kansas City, Missouri 64111.
|
| | | | | |
Name
(Year of Birth) | Position(s) Held with Funds | Length of Time Served | Principal Occupation(s) During Past 5 Years | Number of American Century Portfolios Overseen by Director | Other Directorships Held During Past 5 Years |
| Independent Directors |
|
|
Barry Fink
(1955) | Director | Since 2012 (independent since 2016) | Retired; Executive Vice President, ACC (2007 to 2013); President, ACS (2007 to 2013); Chief Operating Officer, ACC (2007 to 2012) | 81 | None |
Andrea C. Hall
(1945) | Director | Since 1997 | Retired | 81 | None |
Jan M. Lewis
(1957) | Director | Since 2011 | Retired; President and Chief Executive Officer, Catholic Charities of Northeast Kansas (human services organization) (2006 to 2013) | 81 | None |
James A. Olson
(1942) | Director and Chairman of the Board | Since 2007 (Chairman since 2014) | Member, Plaza Belmont LLC (private equity fund manager) (1999 to present) | 81 | Saia, Inc. (2002 to 2012) and EPR Properties (2003 to 2013) |
M. Jeannine Strandjord
(1945) | Director | Since 1994 | Retired | 81 | Euronet Worldwide Inc.; MGP Ingredients, Inc.; and DST Systems Inc. (1996 to 2012) |
|
| | | | | |
Name
(Year of Birth) | Position(s) Held with Funds | Length of Time Served | Principal Occupation(s) During Past 5 Years | Number of American Century Portfolios Overseen by Director | Other Directorships Held During Past 5 Years |
| Independent Directors |
|
|
John R. Whitten
(1946) | Director | Since 2008 | Retired | 81 | Rudolph Technologies, Inc. |
Stephen E. Yates
(1948) | Director | Since 2012 | Retired | 81 | None |
| Interested Director |
|
|
Jonathan S. Thomas
(1963) | Director and President | Since 2007 | President and Chief Executive Officer, ACC (2007 to present). Also serves as Chief Executive Officer, ACS; Executive Vice President, ACIM; Director, ACC, ACIM and other ACC subsidiaries | 126 | BioMed Valley Discoveries, Inc. |
The Statement of Additional Information has additional information about the fund's directors and is available without charge, upon request, by calling 1-800-378-9878.
Officers
The following table presents certain information about the executive officers of the funds. Each officer serves as an officer for each of the 15 investment companies in the American Century family of funds, unless otherwise noted. No officer is compensated for his or her service as an officer of the funds. The listed officers are interested persons of the funds and are appointed or re-appointed on an annual basis. The mailing address for each officer listed below is 4500 Main Street, Kansas City, Missouri 64111.
|
| | |
Name
(Year of Birth) | Offices with the Funds | Principal Occupation(s) During the Past Five Years |
Jonathan S. Thomas
(1963) | Director and President since 2007 | President and Chief Executive Officer, ACC (2007 to present). Also serves as Chief Executive Officer, ACS; Executive Vice President, ACIM; Director, ACC, ACIM and other ACC subsidiaries |
Amy D. Shelton
(1964) | Chief Compliance Officer and Vice President since 2014 | Chief Compliance Officer, American Century funds, (2014 to present); Chief Compliance Officer, ACIM (2014 to present); Chief Compliance Officer, ACIS (2009 to present); Vice President, Client Interactions and Marketing, ACIS (2013 to 2014); Director, Client Interactions and Marketing, ACIS (2007 to 2013). Also serves as Vice President, ACIS |
Charles A. Etherington
(1957) | General Counsel since 2007 and Senior Vice President since 2006 | Attorney, ACC (1994 to present); Vice President, ACC (2005 to present); General Counsel, ACC (2007 to present). Also serves as General Counsel, ACIM, ACS, ACIS and other ACC subsidiaries; and Senior Vice President, ACIM and ACS |
C. Jean Wade
(1964) | Vice President,Treasurer and Chief Financial Officer since 2012 | Vice President, ACS (2000 to present) |
Robert J. Leach
(1966) | Vice President since 2006 and Assistant Treasurer since 2012 | Vice President, ACS (2000 to present) |
David H. Reinmiller
(1963) | Vice President since 2000 | Attorney, ACC (1994 to present); Associate General Counsel, ACC (2001 to present). Also serves as Vice President, ACIM and ACS |
Ward D. Stauffer
(1960) | Secretary since 2005 | Attorney, ACC (2003 to present) |
Proxy Voting Policies
A description of the policies that the fund's investment advisor uses in exercising the voting rights associated with the securities purchased and/or held by the fund is available without charge, upon request, by calling 1-800-378-9878. It is also available on the "About Us" page of American Century Investments’ website at americancentury.com and on the Securities and Exchange Commission’s website at sec.gov. Information regarding how the investment advisor voted proxies relating to portfolio securities during the most recent 12-month period ended June 30 is available on the "About Us" page at americancentury.com. It is also available at sec.gov.
Quarterly Portfolio Disclosure
The fund files its complete schedule of portfolio holdings with the Securities and Exchange Commission (SEC) for the first and third quarters of each fiscal year on Form N-Q. The fund’s Forms N-Q are available on the SEC’s website at sec.gov, and may be reviewed and copied at the SEC’s Public Reference Room in Washington, DC. Information on the operation of the Public Reference Room may be obtained by calling 1-800-SEC-0330. The fund also makes its complete schedule of portfolio holdings for the most recent quarter of its fiscal year available on its website at ipro.americancentury.com (for Investment Professionals) and, upon request, by calling 1-800-378-9878.
Other Tax Information
The following information is provided pursuant to provisions of the Internal Revenue Code.
The fund hereby designates $20,699, or up to the maximum amount allowable, as long-term capital gain distributions (20% rate gain distributions) for the fiscal year ended December 31, 2016.
|
| | |
| |
| | | |
| Contact Us | americancentury.com | |
| Automated Information Line | 1-800-345-8765 | |
| Investment Professional Service Representatives | 1-800-345-6488 | |
| Telecommunications Relay Service for the Deaf | 711 | |
| | | |
| American Century Variable Portfolios, Inc. | |
| | | |
Investment Advisor: American Century Investment Management, Inc. Kansas City, Missouri | |
| | | |
| This report and the statements it contains are submitted for the general information of our shareholders. The report is not authorized for distribution to prospective investors unless preceded or accompanied by an effective prospectus. | |
| | | |
©2017 American Century Proprietary Holdings, Inc. All rights reserved.
CL-ANN-91447 1702 | |
|
| |
| | |
| | Annual Report |
| | |
| | December 31, 2016 |
| | |
| | VP Income & Growth Fund |
|
| | |
| Performance | 2 |
|
| Portfolio Commentary | |
|
| Fund Characteristics | |
|
| Shareholder Fee Example | |
|
| Schedule of Investments | |
|
| Statement of Assets and Liabilities | |
|
| Statement of Operations | |
|
| Statement of Changes in Net Assets | |
|
| Notes to Financial Statements | |
|
| Financial Highlights | |
|
| Report of Independent Registered Public Accounting Firm | |
|
| Management | |
|
| Additional Information | |
|
Any opinions expressed in this report reflect those of the author as of the date of the report, and do not necessarily represent the opinions of American Century Investments® or any other person in the American Century Investments organization. Any such opinions are subject to change at any time based upon market or other conditions and American Century Investments disclaims any responsibility to update such opinions. These opinions may not be relied upon as investment advice and, because investment decisions made by American Century Investments funds are based on numerous factors, may not be relied upon as an indication of trading intent on behalf of any American Century Investments fund. Security examples are used for representational purposes only and are not intended as recommendations to purchase or sell securities. Performance information for comparative indices and securities is provided to American Century Investments by third party vendors. To the best of American Century Investments’ knowledge, such information is accurate at the time of printing.
|
| | | | | |
| Total Returns as of December 31, 2016 |
| | | | Average Annual Returns | |
| | Ticker Symbol | 1 year | 5 years | 10 years | Inception Date |
| Class I | AVGIX | 13.48% | 13.42% | 5.48% | 10/30/97 |
| S&P 500 Index | — | 11.96% | 14.64% | 6.94% | — |
| Class II | AVPGX | 13.20% | 13.13% | 5.21% | 5/1/02 |
The performance information presented does not include charges and deductions imposed by the insurance company separate account under the variable annuity or variable life insurance contracts. The inclusion of such charges could significantly lower performance. Please refer to the insurance company separate account prospectus for a discussion of the charges related to insurance contracts.
|
|
| Growth of $10,000 Over 10 Years |
| $10,000 investment made December 31, 2006 |
| Performance for other share classes will vary due to differences in fee structure. |
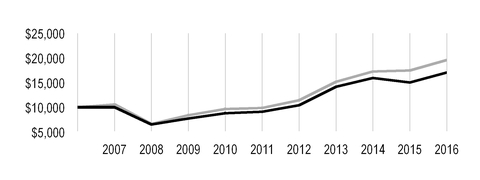
|
| |
| Value on December 31, 2016 |
| | Class I — $17,063 |
| |
| | S&P 500 Index — $19,572 |
| |
|
| |
| Total Annual Fund Operating Expenses |
| Class I | Class II |
| 0.70% | 0.95% |
The total annual fund operating expenses shown is as stated in the fund’s prospectus current as of the date of this report. The prospectus may vary from the expense ratio shown elsewhere in this report because it is based on a different time period, includes acquired fund fees and expenses, and, if applicable, does not include fee waivers or expense reimbursements.
Data presented reflect past performance. Past performance is no guarantee of future results. Current performance may be higher or lower than the performance shown. Total returns for periods less than one year are not annualized. Investment return and principal value will fluctuate, and redemption value may be more or less than original cost. Data assumes reinvestment of dividends and capital gains, and none of the charts reflect the deduction of taxes that a shareholder would pay on fund distributions or the redemption of fund shares. To obtain performance data current to the most recent month end, please call 1-800-345-6488 or visit ipro.americancentury.com (for Investment Professionals). For additional information about the fund, please consult the prospectus.
Portfolio Managers: Brian Garbe and Claudia Musat
Performance Summary
VP Income & Growth returned 13.48%* for the year ended December 31, 2016, compared with the 11.96% return of its benchmark, the S&P 500 Index.
VP Income & Growth’s stock selection process incorporates factors of valuation, quality, growth, and sentiment while striving to minimize unintended risks along industries and other risk characteristics. The fund’s outperformance was due to successful stock selection results, which were enhanced by strong performance of its valuation factors. Holdings across a number of sectors aided the fund’s returns, most notably in information technology, real estate, and consumer discretionary. Conversely, investments in the energy sector and positioning among financials detracted from the fund’s results.
Semiconductors and Services Drove Information Technology Results
Overweight positions, relative to the benchmark, in a number of semiconductors and semiconductor equipment companies led the information technology sector’s relative results during the reporting period. An overweight position in Applied Materials was beneficial as the semiconductor maker beat earnings expectations in each of its quarterly reports during the year and captured market share in the chip-building arena. An overweight position in QUALCOMM also enhanced returns as the mobile chip manufacturer surpassed third-quarter estimates, ending a streak of revenue declines. The company’s stock also advanced on news of its potential acquisition of NXP Semiconductors. Strength across all factors supports our positioning in both holdings.
In the real estate sector, key contribution came from Weyerhaeuser, a real estate investment company specializing in timber and wood products, which advanced on its acquisition of an industry peer to create the largest timber company in the U.S. The company has also been selling off other assets outside of its core focus on timber products. A strong growth profile and above-average sentiment ranking make this an attractive investment. Garmin was a key driver of outperformance in the consumer discretionary sector. The GPS and wearables fitness device maker gained on several quarters of strong earnings results as demand for its wearable devices grew. We maintain our overweight position based on the holding’s strong sentiment and growth measures and above-average quality and valuation factors. Elsewhere, the fund benefited from not owning shares of specialty pharmaceutical manufacturer Allergan, which declined substantially on disappointing results and uncertainty surrounding a proposed acquisition by Pfizer. The stock’s low sentiment score continues to make it an unattractive candidate for inclusion in the portfolio.
Energy Sector Led Detractors
Underperformance in the energy sector was driven by security selection as well as by underweight positioning among oil, gas and consumable fuels companies, which generally advanced during the reporting period. The sector’s leading detractor was Noble Corp., a portfolio-only holding. The drilling contractor suffered as offshore oil-field producers continued to cut spending in response to the declining price of oil. We ultimately exited the fund’s stake in the company.
* All fund returns referenced in this commentary are for Class I shares. Performance for other share classes will vary due to differences in fee structure; when Class I performance exceeds that of the fund's benchmark, other share classes may not. See page 2 for returns for all share classes.
Positioning in the financials sector also pressured the fund’s gains. Most notably, an underweight position in JPMorgan Chase was detrimental after the bank stock advanced sharply at the end of 2016. Bank stocks soared after November's presidential election, likely reflecting President-elect Trump’s vow to deregulate banking and cut taxes. Our positioning is justified by weakness across the holding’s growth, quality, and sentiment profiles.
A number of leading individual detractors came from the health sector, including Gilead Sciences and AmerisourceBergen. An overweight in Gilead Sciences hindered returns as the biotechnology company’s shares moved steadily lower throughout much of the year on concerns about pricing practices at pharmaceutical and biotechnology companies. The share price decline was particularly acute when the company’s first-quarter earnings fell short of expectations. Nevertheless, we believe the company remains attractive due to its strong valuation, quality and growth profiles. AmerisourceBergen’s decline was driven by lower pricing power for the pharmaceutical sourcing and distribution services company, particularly in the generic drug segment. We subsequently sold our stake in the investment.
A Look Ahead
Our systematic investment strategy is designed to take advantage of opportunities at the individual company level. We believe this approach is the most powerful way to capitalize on market inefficiencies that lead to the mispricing of individual stocks. Our strategy is designed to provide broad U.S. equity market exposure with strong current income and exceptional risk management. As of December 31, 2016, we are overweight in the information technology sector, where we find attractive opportunities among software and services and semiconductor companies. These information technology stocks generally offer compelling earnings growth, healthy balance sheets, and positive sentiment, particularly for semiconductor firms. Materials, also a sector overweight, are benefiting from positive sentiment and quality earnings growth. The rebound in prices for precious and non-ferrous metals is driving earnings growth and share price momentum for metals and mining companies. Although underweight to the benchmark, we maintain substantial exposure to industrials, as we are able to find capital goods companies demonstrating strength across virtually all of the indicators we evaluate. The fund’s leading underweights are in financials, consumer discretionary, and utilities, which we think are challenged. Diversified financials and banks generally appear poor on both growth and sentiment measures, and have unfavorable earnings sustainability and profitability. The consumer discretionary sector sees challenges to media and retailing companies. Generally speaking, these stocks are characterized by negative sentiment and disappointing growth. Utilities continue to carry negative quality and growth readings.
|
| |
| DECEMBER 31, 2016 |
| Top Ten Holdings | % of net assets |
| Microsoft Corp. | 3.4% |
| Apple, Inc. | 3.3% |
| Alphabet, Inc.* | 2.9% |
| Johnson & Johnson | 2.4% |
| AT&T, Inc. | 2.2% |
| Procter & Gamble Co. (The) | 2.0% |
| Verizon Communications, Inc. | 1.9% |
| Pfizer, Inc. | 1.7% |
| International Business Machines Corp. | 1.7% |
| Intel Corp. | 1.7% |
| * Includes all classes of the issuer held by the fund. | |
| | |
| Top Five Industries | % of net assets |
| Pharmaceuticals | 6.2% |
| Semiconductors and Semiconductor Equipment | 5.8% |
| Technology Hardware, Storage and Peripherals | 5.3% |
| Software | 5.2% |
| Equity Real Estate Investment Trusts (REITs) | 4.3% |
| | |
| Types of Investments in Portfolio | % of net assets |
| Common Stocks | 99.1% |
| Temporary Cash Investments | 0.8% |
| Other Assets and Liabilities | 0.1% |
Fund shareholders may incur two types of costs: (1) transaction costs, including sales charges (loads) on purchase payments and redemption/exchange fees; and (2) ongoing costs, including management fees; distribution and service (12b-1) fees; and other fund expenses. This example is intended to help you understand your ongoing costs (in dollars) of investing in your fund and to compare these costs with the ongoing cost of investing in other mutual funds.
The example is based on an investment of $1,000 made at the beginning of the period and held for the entire period from July 1, 2016 to December 31, 2016.
Actual Expenses
The table provides information about actual account values and actual expenses for each class. You may use the information, together with the amount you invested, to estimate the expenses that you paid over the period. First, identify the share class you own. Then simply divide your account value by $1,000 (for example, an $8,600 account value divided by $1,000 = 8.6), then multiply the result by the number under the heading “Expenses Paid During Period” to estimate the expenses you paid on your account during this period.
Hypothetical Example for Comparison Purposes
The table also provides information about hypothetical account values and hypothetical expenses based on the actual expense ratio of each class of your fund and an assumed rate of return of 5% per year before expenses, which is not the actual return of a fund’s share class. The hypothetical account values and expenses may not be used to estimate the actual ending account balance or expenses you paid for the period. You may use this information to compare the ongoing costs of investing in your fund and other funds. To do so, compare this 5% hypothetical example with the 5% hypothetical examples that appear in the shareholder reports of the other funds.
Please note that the expenses shown in the table are meant to highlight your ongoing costs only and do not reflect any transactional costs, such as sales charges (loads) or redemption/exchange fees. Therefore, the table is useful in comparing ongoing costs only, and will not help you determine the relative total costs of owning different funds. In addition, if these transactional costs were included, your costs would have been higher.
|
| | | | |
| | Beginning
Account Value
7/1/16 | Ending
Account Value
12/31/16 | Expenses Paid
During Period(1)
7/1/16 - 12/31/16 | Annualized
Expense Ratio(1) |
| Actual |
| Class I | $1,000 | $1,080.90 | $3.66 | 0.70% |
| Class II | $1,000 | $1,079.60 | $4.97 | 0.95% |
| Hypothetical |
| Class I | $1,000 | $1,021.62 | $3.56 | 0.70% |
| Class II | $1,000 | $1,020.36 | $4.82 | 0.95% |
| |
| (1) | Expenses are equal to the class's annualized expense ratio listed in the table above, multiplied by the average account value over the period, multiplied by 184, the number of days in the most recent fiscal half-year, divided by 366, to reflect the one-half year period. |
DECEMBER 31, 2016
|
| | | | | |
| | Shares | Value |
| COMMON STOCKS — 99.1% | | |
| Aerospace and Defense — 3.3% | | |
| Boeing Co. (The) | 34,341 |
| $ | 5,346,207 |
|
| Raytheon Co. | 17,750 |
| 2,520,500 |
|
| United Technologies Corp. | 41,669 |
| 4,567,756 |
|
| | | 12,434,463 |
|
| Automobiles — 1.0% | | |
| Ford Motor Co. | 312,852 |
| 3,794,895 |
|
| Banks — 4.2% | | |
| Bank of America Corp. | 57,225 |
| 1,264,672 |
|
| BB&T Corp. | 94,597 |
| 4,447,951 |
|
| Citigroup, Inc. | 106,938 |
| 6,355,325 |
|
| JPMorgan Chase & Co. | 27,403 |
| 2,364,605 |
|
| U.S. Bancorp | 3,329 |
| 171,011 |
|
| Wells Fargo & Co. | 26,341 |
| 1,451,653 |
|
| | | 16,055,217 |
|
| Beverages — 1.6% | | |
| Coca-Cola Co. (The) | 7,240 |
| 300,170 |
|
| PepsiCo, Inc. | 56,400 |
| 5,901,132 |
|
| | | 6,201,302 |
|
| Biotechnology — 3.8% | | |
| AbbVie, Inc. | 85,020 |
| 5,323,952 |
|
| Amgen, Inc. | 35,493 |
| 5,189,432 |
|
| Gilead Sciences, Inc. | 57,685 |
| 4,130,823 |
|
| | | 14,644,207 |
|
| Capital Markets — 2.1% | | |
| Eaton Vance Corp. | 63,995 |
| 2,680,111 |
|
| Franklin Resources, Inc. | 10,581 |
| 418,796 |
|
| Morgan Stanley | 42,167 |
| 1,781,556 |
|
| State Street Corp. | 21,972 |
| 1,707,664 |
|
| Thomson Reuters Corp. | 29,030 |
| 1,270,933 |
|
| | | 7,859,060 |
|
| Chemicals — 3.3% | | |
| Air Products & Chemicals, Inc. | 25,093 |
| 3,608,875 |
|
| Cabot Corp. | 16,997 |
| 859,029 |
|
| Dow Chemical Co. (The) | 74,759 |
| 4,277,710 |
|
| Eastman Chemical Co. | 46,277 |
| 3,480,493 |
|
| Monsanto Co. | 4,186 |
| 440,409 |
|
| | | 12,666,516 |
|
| Commercial Services and Supplies — 0.2% | | |
| Pitney Bowes, Inc. | 51,594 |
| 783,713 |
|
| Communications Equipment — 1.7% | | |
| Cisco Systems, Inc. | 212,295 |
| 6,415,555 |
|
| Diversified Financial Services — 0.6% | | |
Berkshire Hathaway, Inc., Class B(1) | 14,894 |
| 2,427,424 |
|
| Diversified Telecommunication Services — 4.1% | | |
| AT&T, Inc. | 194,196 |
| 8,259,156 |
|
|
| | | | | |
| | Shares | Value |
| Verizon Communications, Inc. | 135,438 |
| $ | 7,229,680 |
|
| | | 15,488,836 |
|
| Electric Utilities — 1.0% | | |
| Great Plains Energy, Inc. | 24,927 |
| 681,753 |
|
| PPL Corp. | 94,491 |
| 3,217,419 |
|
| | | 3,899,172 |
|
| Electrical Equipment — 0.5% | | |
| Emerson Electric Co. | 36,019 |
| 2,008,059 |
|
| Electronic Equipment, Instruments and Components — 0.9% | | |
| TE Connectivity Ltd. | 51,534 |
| 3,570,275 |
|
| Energy Equipment and Services — 2.5% | | |
| Baker Hughes, Inc. | 65,278 |
| 4,241,112 |
|
| Helmerich & Payne, Inc. | 38,703 |
| 2,995,612 |
|
| Oceaneering International, Inc. | 80,412 |
| 2,268,422 |
|
| | | 9,505,146 |
|
| Equity Real Estate Investment Trusts (REITs) — 4.3% | | |
| Apple Hospitality REIT, Inc. | 24,008 |
| 479,680 |
|
| CBL & Associates Properties, Inc. | 34,620 |
| 398,130 |
|
| Columbia Property Trust, Inc. | 5,697 |
| 123,055 |
|
| Hospitality Properties Trust | 77,136 |
| 2,448,297 |
|
| Lexington Realty Trust | 49,073 |
| 529,988 |
|
| Omega Healthcare Investors, Inc. | 83,320 |
| 2,604,583 |
|
| Select Income REIT | 112,138 |
| 2,825,878 |
|
| Senior Housing Properties Trust | 53,086 |
| 1,004,918 |
|
| Spirit Realty Capital, Inc. | 259,031 |
| 2,813,077 |
|
| Weyerhaeuser Co. | 15,920 |
| 479,033 |
|
| WP Carey, Inc. | 49,538 |
| 2,927,200 |
|
| | | 16,633,839 |
|
| Food and Staples Retailing — 1.6% | | |
| Sysco Corp. | 12,396 |
| 686,367 |
|
| Wal-Mart Stores, Inc. | 78,317 |
| 5,413,271 |
|
| | | 6,099,638 |
|
| Food Products — 2.3% | | |
| Campbell Soup Co. | 20,833 |
| 1,259,771 |
|
| General Mills, Inc. | 27,260 |
| 1,683,850 |
|
| Hormel Foods Corp. | 84,356 |
| 2,936,432 |
|
| J.M. Smucker Co. (The) | 8,948 |
| 1,145,881 |
|
| Kellogg Co. | 23,412 |
| 1,725,699 |
|
| | | 8,751,633 |
|
| Health Care Equipment and Supplies — 2.8% | | |
| Becton Dickinson and Co. | 20,365 |
| 3,371,426 |
|
| Medtronic plc | 67,826 |
| 4,831,246 |
|
| ResMed, Inc. | 35,661 |
| 2,212,765 |
|
| Zimmer Biomet Holdings, Inc. | 3,872 |
| 399,590 |
|
| | | 10,815,027 |
|
| Health Care Providers and Services — 0.7% | | |
| UnitedHealth Group, Inc. | 17,375 |
| 2,780,695 |
|
| Hotels, Restaurants and Leisure — 1.9% | | |
| Carnival Corp. | 69,679 |
| 3,627,489 |
|
| Darden Restaurants, Inc. | 50,800 |
| 3,694,176 |
|
| | | 7,321,665 |
|
|
| | | | | |
| | Shares | Value |
| Household Durables — 1.5% | | |
| Garmin Ltd. | 59,656 |
| $ | 2,892,719 |
|
| Tupperware Brands Corp. | 51,345 |
| 2,701,774 |
|
| | | 5,594,493 |
|
| Household Products — 2.9% | | |
| Kimberly-Clark Corp. | 32,359 |
| 3,692,809 |
|
| Procter & Gamble Co. (The) | 88,954 |
| 7,479,252 |
|
| | | 11,172,061 |
|
| Industrial Conglomerates — 2.0% | | |
| 3M Co. | 27,666 |
| 4,940,318 |
|
| General Electric Co. | 82,031 |
| 2,592,179 |
|
| | | 7,532,497 |
|
| Insurance — 4.0% | | |
| Aflac, Inc. | 50,054 |
| 3,483,758 |
|
| MetLife, Inc. | 40,414 |
| 2,177,911 |
|
| Principal Financial Group, Inc. | 61,398 |
| 3,552,488 |
|
| Prudential Financial, Inc. | 38,542 |
| 4,010,681 |
|
| Reinsurance Group of America, Inc. | 15,974 |
| 2,010,008 |
|
| | | 15,234,846 |
|
| Internet and Direct Marketing Retail — 0.9% | | |
Amazon.com, Inc.(1) | 4,348 |
| 3,260,435 |
|
| Internet Software and Services — 3.5% | | |
Alphabet, Inc., Class A(1) | 11,415 |
| 9,045,817 |
|
Alphabet, Inc., Class C(1) | 2,776 |
| 2,142,572 |
|
Facebook, Inc., Class A(1) | 19,336 |
| 2,224,607 |
|
| | | 13,412,996 |
|
| IT Services — 2.3% | | |
| International Business Machines Corp. | 39,637 |
| 6,579,346 |
|
| Western Union Co. (The) | 93,698 |
| 2,035,120 |
|
| | | 8,614,466 |
|
Leisure Products† | | |
| Mattel, Inc. | 3,394 |
| 93,505 |
|
| Machinery — 3.3% | | |
| Cummins, Inc. | 26,127 |
| 3,570,777 |
|
| Ingersoll-Rand plc | 41,821 |
| 3,138,248 |
|
| Parker-Hannifin Corp. | 19,620 |
| 2,746,800 |
|
| Timken Co. (The) | 77,733 |
| 3,086,000 |
|
| | | 12,541,825 |
|
| Media — 0.9% | | |
| Comcast Corp., Class A | 675 |
| 46,609 |
|
| Omnicom Group, Inc. | 26,685 |
| 2,271,160 |
|
| Twenty-First Century Fox, Inc., Class A | 36,708 |
| 1,029,292 |
|
| | | 3,347,061 |
|
| Metals and Mining — 1.6% | | |
| Nucor Corp. | 52,379 |
| 3,117,598 |
|
| Reliance Steel & Aluminum Co. | 35,505 |
| 2,824,068 |
|
| | | 5,941,666 |
|
| Multi-Utilities — 0.8% | | |
| CenterPoint Energy, Inc. | 129,309 |
| 3,186,174 |
|
| Multiline Retail — 1.7% | | |
| Kohl's Corp. | 57,803 |
| 2,854,312 |
|
|
| | | | | |
| | Shares | Value |
| Target Corp. | 52,251 |
| $ | 3,774,090 |
|
| | | 6,628,402 |
|
| Oil, Gas and Consumable Fuels — 4.1% | | |
| Apache Corp. | 12,229 |
| 776,174 |
|
| Chevron Corp. | 26,487 |
| 3,117,520 |
|
| Exxon Mobil Corp. | 47,557 |
| 4,292,495 |
|
| Kinder Morgan, Inc. | 176,766 |
| 3,660,824 |
|
| Occidental Petroleum Corp. | 53,690 |
| 3,824,339 |
|
| | | 15,671,352 |
|
| Pharmaceuticals — 6.2% | | |
| Eli Lilly & Co. | 22,235 |
| 1,635,384 |
|
| Johnson & Johnson | 80,893 |
| 9,319,682 |
|
| Merck & Co., Inc. | 104,903 |
| 6,175,640 |
|
| Pfizer, Inc. | 204,662 |
| 6,647,422 |
|
| | | 23,778,128 |
|
| Semiconductors and Semiconductor Equipment — 5.8% | | |
| Analog Devices, Inc. | 38,962 |
| 2,829,420 |
|
| Applied Materials, Inc. | 130,372 |
| 4,207,105 |
|
| Intel Corp. | 179,026 |
| 6,493,273 |
|
| KLA-Tencor Corp. | 3,101 |
| 243,987 |
|
| Maxim Integrated Products, Inc. | 14,493 |
| 558,995 |
|
| QUALCOMM, Inc. | 70,616 |
| 4,604,163 |
|
| Texas Instruments, Inc. | 42,973 |
| 3,135,740 |
|
| | | 22,072,683 |
|
| Software — 5.2% | | |
| CA, Inc. | 80,525 |
| 2,558,279 |
|
| Microsoft Corp. | 206,855 |
| 12,853,970 |
|
| Oracle Corp. | 116,376 |
| 4,474,657 |
|
| | | 19,886,906 |
|
| Specialty Retail — 1.3% | | |
| American Eagle Outfitters, Inc. | 98,756 |
| 1,498,129 |
|
| Best Buy Co., Inc. | 79,324 |
| 3,384,755 |
|
| | | 4,882,884 |
|
| Technology Hardware, Storage and Peripherals — 5.3% | | |
| Apple, Inc. | 107,786 |
| 12,483,775 |
|
| HP, Inc. | 245,822 |
| 3,647,998 |
|
| NetApp, Inc. | 54,870 |
| 1,935,265 |
|
| Seagate Technology plc | 59,765 |
| 2,281,230 |
|
| | | 20,348,268 |
|
| Tobacco — 1.4% | | |
| Philip Morris International, Inc. | 57,210 |
| 5,234,143 |
|
TOTAL COMMON STOCKS
(Cost $307,157,892) | | 378,591,128 |
|
| TEMPORARY CASH INVESTMENTS — 0.8% | | |
| Repurchase Agreement, Fixed Income Clearing Corp., (collateralized by various U.S. Treasury obligations, 3.75%, 11/15/43, valued at $1,862,020), at 0.10%, dated 12/30/16, due 1/3/17 (Delivery value $1,820,020) | | 1,820,000 |
|
|
| | | | | |
| | Shares | Value |
| State Street Institutional U.S. Government Money Market Fund, Premier Class | 1,314,275 |
| $ | 1,314,275 |
|
TOTAL TEMPORARY CASH INVESTMENTS
(Cost $3,134,275) | | 3,134,275 |
|
TOTAL INVESTMENT SECURITIES — 99.9%
(Cost $310,292,167) | | 381,725,403 |
|
| OTHER ASSETS AND LIABILITIES — 0.1% | | 385,711 |
|
| TOTAL NET ASSETS — 100.0% | | $ | 382,111,114 |
|
|
| | |
| NOTES TO SCHEDULE OF INVESTMENTS |
| |
| † | Category is less than 0.05% of total net assets. |
See Notes to Financial Statements.
|
|
| Statement of Assets and Liabilities |
|
| | | |
| DECEMBER 31, 2016 | |
| Assets |
| Investment securities, at value (cost of $310,292,167) | $ | 381,725,403 |
|
| Cash | 20,719 |
|
| Receivable for capital shares sold | 152,158 |
|
| Dividends and interest receivable | 685,224 |
|
| | 382,583,504 |
|
| | |
| Liabilities |
| Payable for capital shares redeemed | 239,075 |
|
| Accrued management fees | 228,404 |
|
| Distribution fees payable | 4,911 |
|
| | 472,390 |
|
| | |
| Net Assets | $ | 382,111,114 |
|
| | |
| Net Assets Consist of: |
| Capital (par value and paid-in surplus) | $ | 303,792,409 |
|
| Undistributed net investment income | 216,027 |
|
| Undistributed net realized gain | 6,669,442 |
|
| Net unrealized appreciation | 71,433,236 |
|
| | $ | 382,111,114 |
|
|
| | | | | | |
| | Net Assets | Shares Outstanding | Net Asset Value Per Share |
| Class I, $0.01 Par Value |
| $358,600,174 |
| 38,476,397 |
| $9.32 |
| Class II, $0.01 Par Value |
| $23,510,940 |
| 2,521,778 |
| $9.32 |
See Notes to Financial Statements.
|
| | | |
| YEAR ENDED DECEMBER 31, 2016 |
| Investment Income (Loss) |
| Income: | |
| Dividends (net of foreign taxes withheld of $12,732) | $ | 11,361,802 |
|
| Interest | 3,993 |
|
| | 11,365,795 |
|
| | |
| Expenses: | |
| Management fees | 2,586,347 |
|
| Distribution fees - Class II | 48,703 |
|
| Directors' fees and expenses | 12,233 |
|
| Other expenses | 165 |
|
| | 2,647,448 |
|
| | |
| Net investment income (loss) | 8,718,347 |
|
| | |
| Realized and Unrealized Gain (Loss) |
| Net realized gain (loss) on: | |
| Investment transactions | 9,159,287 |
|
| Foreign currency transactions | (148 | ) |
| | 9,159,139 |
|
| | |
| Change in net unrealized appreciation (depreciation) on investments | 29,182,907 |
|
| | |
| Net realized and unrealized gain (loss) | 38,342,046 |
|
| | |
| Net Increase (Decrease) in Net Assets Resulting from Operations | $ | 47,060,393 |
|
See Notes to Financial Statements.
|
|
| Statement of Changes in Net Assets |
|
| | | | | | |
| YEARS ENDED DECEMBER 31, 2016 AND DECEMBER 31, 2015 |
| Increase (Decrease) in Net Assets | December 31, 2016 | December 31, 2015 |
| Operations |
| Net investment income (loss) | $ | 8,718,347 |
| $ | 7,817,569 |
|
| Net realized gain (loss) | 9,159,139 |
| 6,480,304 |
|
| Change in net unrealized appreciation (depreciation) | 29,182,907 |
| (37,542,637 | ) |
| Net increase (decrease) in net assets resulting from operations | 47,060,393 |
| (23,244,764 | ) |
| | | |
| Distributions to Shareholders |
| From net investment income: | | |
| Class I | (8,297,569 | ) | (7,309,373 | ) |
| Class II | (422,859 | ) | (353,226 | ) |
| Class III | — |
| (106,090 | ) |
| From net realized gains: | | |
| Class I | (6,606,145 | ) | (26,343,211 | ) |
| Class II | (336,000 | ) | (1,694,161 | ) |
| Class III | — |
| (956,534 | ) |
| Decrease in net assets from distributions | (15,662,573 | ) | (36,762,595 | ) |
| | | |
| Capital Share Transactions |
| Net increase (decrease) in net assets from capital share transactions (Note 5) | (15,849,878 | ) | 50,426,946 |
|
| | | |
| Redemption Fees |
| Increase in net assets from redemption fees | — |
| 2,958 |
|
| | | |
| Net increase (decrease) in net assets | 15,547,942 |
| (9,577,455 | ) |
| | | |
| Net Assets |
| Beginning of period | 366,563,172 |
| 376,140,627 |
|
| End of period | $ | 382,111,114 |
| $ | 366,563,172 |
|
| | | |
| Undistributed net investment income | $ | 216,027 |
| $ | 291,632 |
|
See Notes to Financial Statements.
|
|
| Notes to Financial Statements |
DECEMBER 31, 2016
1. Organization
American Century Variable Portfolios, Inc. (the corporation) is registered under the Investment Company Act of 1940, as amended (the 1940 Act), as an open-end management investment company and is organized as a Maryland corporation. VP Income & Growth Fund (the fund) is one fund in a series issued by the corporation. The fund’s investment objective is to seek capital growth by investing in common stocks. Income is a secondary objective.
The fund offers Class I and Class II. The share classes differ principally in their respective distribution and shareholder servicing expenses and arrangements. On August 7, 2015, there were no outstanding Class III shares and the fund discontinued offering Class III.
2. Significant Accounting Policies
The following is a summary of significant accounting policies consistently followed by the fund in preparation of its financial statements. The fund is an investment company and follows accounting and reporting guidance in accordance with accounting principles generally accepted in the United States of America. This may require management to make certain estimates and assumptions at the date of the financial statements. Actual results could differ from these estimates. Management evaluated the impact of events or transactions occurring through the date the financial statements were issued that would merit recognition or disclosure.
Investment Valuations — The fund determines the fair value of its investments and computes its net asset value per share at the close of regular trading (usually 4 p.m. Eastern time) on the New York Stock Exchange (NYSE) on each day the NYSE is open. The Board of Directors has adopted valuation policies and procedures to guide the investment advisor in the fund’s investment valuation process and to provide methodologies for the oversight of the fund’s pricing function.
Equity securities that are listed or traded on a domestic securities exchange are valued at the last reported sales price or at the official closing price as provided by the exchange. Equity securities traded on foreign securities exchanges are generally valued at the closing price of such securities on the exchange where primarily traded or at the close of the NYSE, if that is earlier. If no last sales price is reported, or if local convention or regulation so provides, the mean of the latest bid and asked prices may be used. Securities traded over-the-counter are valued at the mean of the latest bid and asked prices, the last sales price, or the official closing price. Equity securities initially expressed in local currencies are translated into U.S. dollars at the mean of the appropriate currency exchange rate at the close of the NYSE as provided by an independent pricing service.
Open-end management investment companies are valued at the reported net asset value per share. Repurchase agreements are valued at cost, which approximates fair value.
If the fund determines that the market price for an investment is not readily available or the valuation methods mentioned above do not reflect an investment’s fair value, such investment is valued as determined in good faith by the Board of Directors or its delegate, in accordance with policies and procedures adopted by the Board of Directors. In its determination of fair value, the fund may review several factors including, but not limited to, market information regarding the specific investment or comparable investments and correlation with other investment types, futures indices or general market indicators. Circumstances that may cause the fund to use these procedures to value an investment include, but are not limited to: an investment has been declared in default or is distressed; trading in a security has been suspended during the trading day or a security is not actively trading on its principal exchange; prices received from a regular pricing source are deemed unreliable; or there is a foreign market holiday and no trading occurred.
The fund monitors for significant events occurring after the close of an investment’s primary exchange but before the fund’s net asset value per share is determined. Significant events may include, but are not limited to: corporate announcements and transactions; governmental action and political unrest that could impact a specific investment or an investment sector; or armed conflicts, natural disasters and similar events that could affect investments in a specific country or region. The fund also monitors for significant fluctuations between domestic and foreign markets, as evidenced by the U.S. market or such other indicators that the Board of Directors, or its delegate, deems appropriate. If significant fluctuations in foreign markets are identified, the
fund may apply a model-derived factor to the closing price of equity securities traded on foreign securities exchanges. The factor is based on observable market data as provided by an independent pricing service.
Security Transactions — Security transactions are accounted for as of the trade date. Net realized gains and losses are determined on the identified cost basis, which is also used for federal income tax purposes.
Investment Income — Dividend income less foreign taxes withheld, if any, is recorded as of the ex-dividend date. Distributions received on securities that represent a return of capital or long-term capital gain are recorded as a reduction of cost of investments and/or as a realized gain. The fund may estimate the components of distributions received that may be considered nontaxable distributions or long-term capital gain distributions for income tax purposes. Interest income is recorded on the accrual basis and includes accretion of discounts and amortization of premiums.
Foreign Currency Translations — All assets and liabilities initially expressed in foreign currencies are translated into U.S. dollars at prevailing exchange rates at period end. The fund may enter into spot foreign currency exchange contracts to facilitate transactions denominated in a foreign currency. Purchases and sales of investment securities, dividend and interest income, spot foreign currency exchange contracts, and expenses are translated at the rates of exchange prevailing on the respective dates of such transactions. Net realized and unrealized foreign currency exchange gains or losses related to investment securities are a component of net realized gain (loss) on investment transactions and change in net unrealized appreciation (depreciation) on investments, respectively.
Repurchase Agreements — The fund may enter into repurchase agreements with institutions that American Century Investment Management, Inc. (ACIM) (the investment advisor) has determined are creditworthy pursuant to criteria adopted by the Board of Directors. The fund requires that the collateral, represented by securities, received in a repurchase transaction be transferred to the custodian in a manner sufficient to enable the fund to obtain those securities in the event of a default under the repurchase agreement. ACIM monitors, on a daily basis, the securities transferred to ensure the value, including accrued interest, of the securities under each repurchase agreement is equal to or greater than amounts owed to the fund under each repurchase agreement.
Joint Trading Account — Pursuant to an Exemptive Order issued by the Securities and Exchange Commission, the fund, along with certain other funds in the American Century Investments family of funds, may transfer uninvested cash balances into a joint trading account. These balances are invested in one or more repurchase agreements that are collateralized by U.S. Treasury or Agency obligations.
Income Tax Status — It is the fund’s policy to distribute substantially all net investment income and net realized gains to shareholders and to otherwise qualify as a regulated investment company under provisions of the Internal Revenue Code. Accordingly, no provision has been made for income taxes. The fund files U.S. federal, state, local and non-U.S. tax returns as applicable. The fund's tax returns are subject to examination by the relevant taxing authority until expiration of the applicable statute of limitations, which is generally three years from the date of filing but can be longer in certain jurisdictions. At this time, management believes there are no uncertain tax positions which, based on their technical merit, would not be sustained upon examination and for which it is reasonably possible that the total amounts of unrecognized tax benefits will significantly change in the next twelve months.
Multiple Class — All shares of the fund represent an equal pro rata interest in the net assets of the class to which such shares belong, and have identical voting, dividend, liquidation and other rights and the same terms and conditions, except for class specific expenses and exclusive rights to vote on matters affecting only individual classes. Income, non-class specific expenses, and realized and unrealized capital gains and losses of the fund are allocated to each class of shares based on their relative net assets.
Distributions to Shareholders — Distributions from net investment income, if any, are generally declared and paid quarterly. Distributions from net realized gains, if any, are generally declared and paid annually.
Redemption Fees — Prior to August 7, 2015, the fund may have imposed a 1.00% redemption fee on shares held less than 60 days. The fee was not applicable to all classes. The redemption fee was retained by the fund to help cover transaction costs that long-term investors may bear when the fund sells securities to meet investor redemptions.
Indemnifications — Under the corporation’s organizational documents, its officers and directors are indemnified against certain liabilities arising out of the performance of their duties to the fund. In addition, in the normal course of business, the fund enters into contracts that provide general indemnifications. The
maximum exposure under these arrangements is unknown as this would involve future claims that may be made against a fund. The risk of material loss from such claims is considered by management to be remote.
3. Fees and Transactions with Related Parties
Certain officers and directors of the corporation are also officers and/or directors of American Century Companies, Inc. (ACC). The corporation’s investment advisor, ACIM, the corporation's distributor, American Century Investment Services, Inc. (ACIS), and the corporation’s transfer agent, American Century Services, LLC, are wholly owned, directly or indirectly, by ACC.
Management Fees — The corporation has entered into a management agreement with ACIM, under which ACIM provides the fund with investment advisory and management services in exchange for a single, unified management fee (the fee) per class. The agreement provides that all expenses of managing and operating the fund, except distribution fees, brokerage expenses, taxes, interest, fees and expenses of the independent directors (including legal counsel fees), and extraordinary expenses, will be paid by ACIM. The fee is computed and accrued daily based on each class’s daily net assets and paid monthly in arrears. The rate of the fee is determined by applying a fee rate calculation formula. This formula takes into account the fund’s assets as well as certain assets, if any, of other clients of the investment advisor outside the American Century Investments family of funds (such as subadvised funds and separate accounts) that have very similar investment teams and investment strategies (strategy assets). The annual management fee schedule ranges from 0.65% to 0.70% for Class I and Class II. The effective annual management fee for each class for the year ended December 31, 2016 was 0.70%.
Distribution Fees — The Board of Directors has adopted the Master Distribution Plan (the plan) for Class II, pursuant to Rule 12b-1 of the 1940 Act. The plan provides that Class II will pay ACIS an annual distribution fee equal to 0.25%. The fee is computed and accrued daily based on the Class II daily net assets and paid monthly in arrears. The distribution fee provides compensation for expenses incurred in connection with distributing shares of Class II including, but not limited to, payments to brokers, dealers, and financial institutions that have entered into sales agreements with respect to shares of the fund. Fees incurred under the plan during the year ended December 31, 2016 are detailed in the Statement of Operations.
Directors' Fees and Expenses — The Board of Directors is responsible for overseeing the investment advisor’s management and operations of the fund. The directors receive detailed information about the fund and its investment advisor regularly throughout the year, and meet at least quarterly with management of the investment advisor to review reports about fund operations. The fund’s officers do not receive compensation from the fund.
Interfund Transactions — The fund may enter into security transactions with other American Century Investments funds and other client accounts of the investment advisor, in accordance with the 1940 Act rules and procedures adopted by the Board of Directors. The rules and procedures require, among other things, that these transactions be effected at the independent current market price of the security. During the period, the interfund purchases and sales were $894,851 and $531,652, respectively. The effect of interfund transactions on the Statement of Operations was $55,200 in net realized gain (loss) on investment transactions.
4. Investment Transactions
Purchases and sales of investment securities, excluding short-term investments, for the year ended December 31, 2016 were $286,939,126 and $305,246,770, respectively.
5. Capital Share Transactions
Transactions in shares of the fund were as follows:
|
| | | | | | | | | | |
| | Year ended
December 31, 2016 | Year ended
December 31, 2015 |
| | Shares | Amount | Shares | Amount |
| Class I/Shares Authorized | 300,000,000 |
| | 300,000,000 |
| |
| Sold | 3,094,078 |
| $ | 27,090,177 |
| 10,384,300 |
| $ | 95,042,924 |
|
| Issued in reinvestment of distributions | 1,712,530 |
| 14,903,714 |
| 3,683,630 |
| 33,652,584 |
|
| Redeemed | (7,090,630 | ) | (62,319,983 | ) | (7,139,508 | ) | (66,111,803 | ) |
| | (2,284,022 | ) | (20,326,092 | ) | 6,928,422 |
| 62,583,705 |
|
| Class II/Shares Authorized | 50,000,000 |
| | 50,000,000 |
| |
| Sold | 1,215,900 |
| 10,853,376 |
| 737,478 |
| 6,961,390 |
|
| Issued in reinvestment of distributions | 87,018 |
| 758,859 |
| 223,332 |
| 2,047,387 |
|
| Redeemed | (813,712 | ) | (7,136,021 | ) | (1,008,171 | ) | (9,433,274 | ) |
| | 489,206 |
| 4,476,214 |
| (47,361 | ) | (424,497 | ) |
| Class III/Shares Authorized | 50,000,000 |
| | 50,000,000 |
| |
| Sold | | | 137,812 |
| 1,350,929 |
|
| Issued in reinvestment of distributions | | | 114,856 |
| 1,062,624 |
|
| Redeemed | | | (1,540,981 | ) | (14,145,815 | ) |
| | | | (1,288,313 | ) | (11,732,262 | ) |
| Net increase (decrease) | (1,794,816 | ) | $ | (15,849,878 | ) | 5,592,748 |
| $ | 50,426,946 |
|
6. Fair Value Measurements
The fund’s investments valuation process is based on several considerations and may use multiple inputs to determine the fair value of the investments held by the fund. In conformity with accounting principles generally accepted in the United States of America, the inputs used to determine a valuation are classified into three broad levels.
| |
| • | Level 1 valuation inputs consist of unadjusted quoted prices in an active market for identical investments. |
| |
| • | Level 2 valuation inputs consist of direct or indirect observable market data (including quoted prices for comparable investments, evaluations of subsequent market events, interest rates, prepayment speeds, credit risk, etc.). These inputs also consist of quoted prices for identical investments initially expressed in local currencies that are adjusted through translation into U.S. dollars. |
| |
| • | Level 3 valuation inputs consist of unobservable data (including a fund’s own assumptions). |
The level classification is based on the lowest level input that is significant to the fair valuation measurement. The valuation inputs are not necessarily an indication of the risks associated with investing in these securities or other financial instruments. There were no significant transfers between levels during the period.
The following is a summary of the level classifications as of period end. The Schedule of Investments provides additional information on the fund’s portfolio holdings.
|
| | | | | | | | |
| | Level 1 | Level 2 | Level 3 |
| Assets |
| Investment Securities |
| Common Stocks | $ | 378,591,128 |
| — |
| — |
|
| Temporary Cash Investments | 1,314,275 |
| $ | 1,820,000 |
| — |
|
| | $ | 379,905,403 |
| $ | 1,820,000 |
| — |
|
7. Federal Tax Information
The tax character of distributions paid during the years ended December 31, 2016 and December 31, 2015 were as follows:
|
| | | | | | |
| | 2016 | 2015 |
| Distributions Paid From | | |
| Ordinary income | $ | 8,720,428 |
| $ | 16,096,094 |
|
| Long-term capital gains | $ | 6,942,145 |
| $ | 20,666,501 |
|
The book-basis character of distributions made during the year from net investment income or net realized gains may differ from their ultimate characterization for federal income tax purposes. These differences reflect the differing character of certain income items and net realized gains and losses for financial statement and tax purposes, and may result in reclassification among certain capital accounts on the financial statements.
As of December 31, 2016, the federal tax cost of investments and the components of distributable earnings on a tax-basis were as follows:
|
| | | |
| Federal tax cost of investments | $ | 312,549,975 |
|
| Gross tax appreciation of investments | $ | 76,931,577 |
|
| Gross tax depreciation of investments | (7,756,149 | ) |
| Net tax appreciation (depreciation) of investments | $ | 69,175,428 |
|
| Undistributed ordinary income | $ | 2,487,200 |
|
| Accumulated long-term gains | $ | 6,656,077 |
|
The difference between book-basis and tax-basis unrealized appreciation (depreciation) is attributable primarily to the tax deferral of losses on wash sales.
8. Recently Issued Accounting Guidance
In October 2016, the Securities and Exchange Commission adopted new rules and forms as well as amendments to its rules and forms to modernize the reporting and disclosure of information by registered investment companies. The amendments to Regulation S-X will require standardized, enhanced disclosure about derivatives in investment company financial statements, as well as other provisions. Compliance with the amendments is effective on August 1, 2017. Management is currently evaluating the impact that adopting the amendments will have on the financial statement disclosures.
|
| | | | | | | | | | | | | | | |
| For a Share Outstanding Throughout the Years Ended December 31 (except as noted) |
| Per-Share Data | Ratios and Supplemental Data |
| | | Income From Investment Operations: | Distributions From: | | | Ratio to Average Net Assets of: | | |
| | Net Asset Value, Beginning of Period | Net Investment Income (Loss)(1) | Net Realized and Unrealized Gain (Loss) | Total From Investment Operations | Net
Investment
Income | Net
Realized
Gains | Total
Distributions | Net Asset Value, End of Period | Total Return(2) | Operating Expenses | Net Investment Income (Loss) | Portfolio Turnover Rate | Net Assets, End of Period (in thousands) |
| Class I |
| 2016 | $8.57 | 0.21 | 0.91 | 1.12 | (0.21) | (0.16) | (0.37) | $9.32 | 13.48% | 0.70% | 2.38% | 78% |
| $358,600 |
|
| 2015 | $10.11 | 0.19 | (0.71) | (0.52) | (0.19) | (0.83) | (1.02) | $8.57 | (5.62)% | 0.70% | 2.14% | 88% |
| $349,147 |
|
| 2014 | $9.17 | 0.20 | 0.94 | 1.14 | (0.20) | — | (0.20) | $10.11 | 12.50% | 0.70% | 2.13% | 77% |
| $342,075 |
|
| 2013 | $6.90 | 0.18 | 2.27 | 2.45 | (0.18) | — | (0.18) | $9.17 | 35.82% | 0.70% | 2.28% | 73% |
| $271,368 |
|
| 2012 | $6.14 | 0.14 | 0.76 | 0.90 | (0.14) | — | (0.14) | $6.90 | 14.74% | 0.70% | 2.08% | 66% |
| $221,515 |
|
| Class II |
| 2016 | $8.57 | 0.18 | 0.92 | 1.10 | (0.19) | (0.16) | (0.35) | $9.32 | 13.20% | 0.95% | 2.13% | 78% |
| $23,511 |
|
| 2015 | $10.11 | 0.17 | (0.71) | (0.54) | (0.17) | (0.83) | (1.00) | $8.57 | (5.95)% | 0.95% | 1.89% | 88% |
| $17,417 |
|
| 2014 | $9.17 | 0.18 | 0.93 | 1.11 | (0.17) | — | (0.17) | $10.11 | 12.33% | 0.95% | 1.88% | 77% |
| $21,038 |
|
| 2013 | $6.90 | 0.17 | 2.26 | 2.43 | (0.16) | — | (0.16) | $9.17 | 35.48% | 0.95% | 2.03% | 73% |
| $19,095 |
|
| 2012 | $6.14 | 0.12 | 0.77 | 0.89 | (0.13) | — | (0.13) | $6.90 | 14.46% | 0.95% | 1.83% | 66% |
| $13,960 |
|
|
| | | | |
| Notes to Financial Highlights | | |
| |
| (1) | Computed using average shares outstanding throughout the period. |
| |
| (2) | Total returns are calculated based on the net asset value of the last business day. Total returns for periods less than one year are not annualized. |
See Notes to Financial Statements.
|
|
| Report of Independent Registered Public Accounting Firm |
To the Board of Directors and Shareholders of American Century Variable Portfolios, Inc.:
We have audited the accompanying statement of assets and liabilities, including the schedule of investments, of VP Income & Growth Fund (the “Fund”), one of the funds constituting American Century Variable Portfolios, Inc., as of December 31, 2016, and the related statement of operations for the year then ended, the statements of changes in net assets for each of the two years in the period then ended, and the financial highlights for each of the five years in the period then ended. These financial statements and financial highlights are the responsibility of the Fund’s management. Our responsibility is to express an opinion on these financial statements and financial highlights based on our audits.
We conducted our audits in accordance with the standards of the Public Company Accounting Oversight Board (United States). Those standards require that we plan and perform the audit to obtain reasonable assurance about whether the financial statements and financial highlights are free of material misstatement. The Fund is not required to have, nor were we engaged to perform, an audit of its internal control over financial reporting. Our audits included consideration of internal control over financial reporting as a basis for designing audit procedures that are appropriate in the circumstances, but not for the purpose of expressing an opinion on the effectiveness of the Fund’s internal control over financial reporting. Accordingly, we express no such opinion. An audit also includes examining, on a test basis, evidence supporting the amounts and disclosures in the financial statements, assessing the accounting principles used and significant estimates made by management, as well as evaluating the overall financial statement presentation. Our procedures included confirmation of securities owned as of December 31, 2016, by correspondence with the custodian and brokers; when replies were not received from brokers, we performed other auditing procedures. We believe that our audits provide a reasonable basis for our opinion.
In our opinion, the financial statements and financial highlights referred to above present fairly, in all material respects, the financial position of VP Income & Growth Fund of American Century Variable Portfolios, Inc. as of December 31, 2016, the results of its operations for the year then ended, the changes in its net assets for each of the two years in the period then ended, and the financial highlights for each of the five years in the period then ended, in conformity with accounting principles generally accepted in the United States of America.
DELOITTE & TOUCHE LLP
Kansas City, Missouri
February 10, 2017
The Board of Directors
The individuals listed below serve as directors of the funds. Each director will continue to serve in this capacity until death, retirement, resignation or removal from office. The board has adopted a mandatory retirement age for directors who are not “interested persons,” as that term is defined in the Investment Company Act (independent directors). Independent directors shall retire by December 31 of the year in which they reach their 75th birthday.
Mr. Thomas is an “interested person” because he currently serves as President and Chief Executive Officer of American Century Companies, Inc. (ACC), the parent company of American Century Investment Management, Inc. (ACIM or the advisor). The other directors (more than three-fourths of the total number) are independent. They are not employees, directors or officers of, and have no financial interest in, ACC or any of its wholly owned, direct or indirect, subsidiaries, including ACIM, American Century Investment Services, Inc. (ACIS) and American Century Services, LLC (ACS), and they do not have any other affiliations, positions or relationships that would cause them to be considered “interested persons” under the Investment Company Act. The directors serve in this capacity for seven (in the case of Mr. Thomas, 15) registered investment companies in the American Century Investments family of funds.
The following table presents additional information about the directors. The mailing address for each director is 4500 Main Street, Kansas City, Missouri 64111.
|
| | | | | |
Name
(Year of Birth) | Position(s) Held with Funds | Length of Time Served | Principal Occupation(s) During Past 5 Years | Number of American Century Portfolios Overseen by Director | Other Directorships Held During Past 5 Years |
| Independent Directors |
|
|
Barry Fink
(1955) | Director | Since 2012 (independent since 2016) | Retired; Executive Vice President, ACC (2007 to 2013); President, ACS (2007 to 2013); Chief Operating Officer, ACC (2007 to 2012) | 81 | None |
Andrea C. Hall
(1945) | Director | Since 1997 | Retired | 81 | None |
Jan M. Lewis
(1957) | Director | Since 2011 | Retired; President and Chief Executive Officer, Catholic Charities of Northeast Kansas (human services organization) (2006 to 2013) | 81 | None |
James A. Olson
(1942) | Director and Chairman of the Board | Since 2007 (Chairman since 2014) | Member, Plaza Belmont LLC (private equity fund manager) (1999 to present) | 81 | Saia, Inc. (2002 to 2012) and EPR Properties (2003 to 2013) |
M. Jeannine Strandjord
(1945) | Director | Since 1994 | Retired | 81 | Euronet Worldwide Inc.; MGP Ingredients, Inc.; and DST Systems Inc. (1996 to 2012) |
|
| | | | | |
Name
(Year of Birth) | Position(s) Held with Funds | Length of Time Served | Principal Occupation(s) During Past 5 Years | Number of American Century Portfolios Overseen by Director | Other Directorships Held During Past 5 Years |
| Independent Directors |
|
|
John R. Whitten
(1946) | Director | Since 2008 | Retired | 81 | Rudolph Technologies, Inc. |
Stephen E. Yates
(1948) | Director | Since 2012 | Retired | 81 | None |
| Interested Director |
|
|
Jonathan S. Thomas
(1963) | Director and President | Since 2007 | President and Chief Executive Officer, ACC (2007 to present). Also serves as Chief Executive Officer, ACS; Executive Vice President, ACIM; Director, ACC, ACIM and other ACC subsidiaries | 126 | BioMed Valley Discoveries, Inc. |
The Statement of Additional Information has additional information about the fund's directors and is available without charge, upon request, by calling 1-800-378-9878.
Officers
The following table presents certain information about the executive officers of the funds. Each officer serves as an officer for each of the 15 investment companies in the American Century family of funds, unless otherwise noted. No officer is compensated for his or her service as an officer of the funds. The listed officers are interested persons of the funds and are appointed or re-appointed on an annual basis. The mailing address for each officer listed below is 4500 Main Street, Kansas City, Missouri 64111.
|
| | |
Name
(Year of Birth) | Offices with the Funds | Principal Occupation(s) During the Past Five Years |
Jonathan S. Thomas
(1963) | Director and President since 2007 | President and Chief Executive Officer, ACC (2007 to present). Also serves as Chief Executive Officer, ACS; Executive Vice President, ACIM; Director, ACC, ACIM and other ACC subsidiaries |
Amy D. Shelton
(1964) | Chief Compliance Officer and Vice President since 2014 | Chief Compliance Officer, American Century funds, (2014 to present); Chief Compliance Officer, ACIM (2014 to present); Chief Compliance Officer, ACIS (2009 to present); Vice President, Client Interactions and Marketing, ACIS (2013 to 2014); Director, Client Interactions and Marketing, ACIS (2007 to 2013). Also serves as Vice President, ACIS |
Charles A. Etherington
(1957) | General Counsel since 2007 and Senior Vice President since 2006 | Attorney, ACC (1994 to present); Vice President, ACC (2005 to present); General Counsel, ACC (2007 to present). Also serves as General Counsel, ACIM, ACS, ACIS and other ACC subsidiaries; and Senior Vice President, ACIM and ACS |
C. Jean Wade
(1964) | Vice President,Treasurer and Chief Financial Officer since 2012 | Vice President, ACS (2000 to present) |
Robert J. Leach
(1966) | Vice President since 2006 and Assistant Treasurer since 2012 | Vice President, ACS (2000 to present) |
David H. Reinmiller
(1963) | Vice President since 2000 | Attorney, ACC (1994 to present); Associate General Counsel, ACC (2001 to present). Also serves as Vice President, ACIM and ACS |
Ward D. Stauffer
(1960) | Secretary since 2005 | Attorney, ACC (2003 to present) |
Proxy Voting Policies
A description of the policies that the fund's investment advisor uses in exercising the voting rights associated with the securities purchased and/or held by the fund is available without charge, upon request, by calling 1-800-378-9878. It is also available on the "About Us" page of American Century Investments’ website at americancentury.com and on the Securities and Exchange Commission’s website at sec.gov. Information regarding how the investment advisor voted proxies relating to portfolio securities during the most recent 12-month period ended June 30 is available on the "About Us" page at americancentury.com. It is also available at sec.gov.
Quarterly Portfolio Disclosure
The fund files its complete schedule of portfolio holdings with the Securities and Exchange Commission (SEC) for the first and third quarters of each fiscal year on Form N-Q. The fund’s Forms N-Q are available on the SEC’s website at sec.gov, and may be reviewed and copied at the SEC’s Public Reference Room in Washington, DC. Information on the operation of the Public Reference Room may be obtained by calling 1-800-SEC-0330. The fund also makes its complete schedule of portfolio holdings for the most recent quarter of its fiscal year available on its website at ipro.americancentury.com (for Investment Professionals) and, upon request, by calling 1-800-378-9878.
Other Tax Information
The following information is provided pursuant to provisions of the Internal Revenue Code.
For corporate taxpayers, the fund hereby designates $8,720,428, or up to the maximum amount allowable, of ordinary income distributions paid during the fiscal year ended December 31, 2016 as qualified for the corporate dividends received deduction.
The fund hereby designates $6,942,145, or up to the maximum amount allowable, as long-term capital gain distributions (20% rate gain distributions) for the fiscal year ended December 31, 2016.
|
| | |
| |
| | | |
| Contact Us | americancentury.com | |
| Automated Information Line | 1-800-345-8765 | |
| Investment Professional Service Representatives | 1-800-345-6488 | |
| Telecommunications Relay Service for the Deaf | 711 | |
| | | |
| American Century Variable Portfolios, Inc. | |
| | | |
Investment Advisor: American Century Investment Management, Inc. Kansas City, Missouri | |
| | | |
| This report and the statements it contains are submitted for the general information of our shareholders. The report is not authorized for distribution to prospective investors unless preceded or accompanied by an effective prospectus. | |
| | | |
©2017 American Century Proprietary Holdings, Inc. All rights reserved.
CL-ANN-91438 1702 | |
|
| |
| | |
| | Annual Report |
| | |
| | December 31, 2016 |
| | |
| | VP International Fund |
|
| | |
| Performance | 2 |
|
| Portfolio Commentary | |
|
| Fund Characteristics | |
|
| Shareholder Fee Example | |
|
| Schedule of Investments | |
|
| Statement of Assets and Liabilities | |
|
| Statement of Operations | |
|
| Statement of Changes in Net Assets | |
|
| Notes to Financial Statements | |
|
| Financial Highlights | |
|
| Report of Independent Registered Public Accounting Firm | |
|
| Management | |
|
| Additional Information | |
|
Any opinions expressed in this report reflect those of the author as of the date of the report, and do not necessarily represent the opinions of American Century Investments® or any other person in the American Century Investments organization. Any such opinions are subject to change at any time based upon market or other conditions and American Century Investments disclaims any responsibility to update such opinions. These opinions may not be relied upon as investment advice and, because investment decisions made by American Century Investments funds are based on numerous factors, may not be relied upon as an indication of trading intent on behalf of any American Century Investments fund. Security examples are used for representational purposes only and are not intended as recommendations to purchase or sell securities. Performance information for comparative indices and securities is provided to American Century Investments by third party vendors. To the best of American Century Investments’ knowledge, such information is accurate at the time of printing.
|
| | | | | |
| Total Returns as of December 31, 2016 | |
| | | | Average Annual Returns | |
| | Ticker Symbol | 1 year | 5 years | 10 years | Inception Date |
| Class I | AVIIX | -5.50% | 5.93% | 1.48% | 5/1/94 |
| MSCI EAFE Index | — | 1.00% | 6.53% | 0.75% | — |
| MSCI EAFE Growth Index | — | -3.04% | 6.67% | 1.64% | — |
| Class II | ANVPX | -5.55% | 5.78% | 1.34% | 8/15/01 |
Fund returns would have been lower if a portion of the fees had not been waived.
The performance information presented does not include charges and deductions imposed by the insurance company separate account under the variable annuity or variable life insurance contracts. The inclusion of such charges could significantly lower performance. Please refer to the insurance company separate account prospectus for a discussion of the charges related to insurance contracts.
Data presented reflect past performance. Past performance is no guarantee of future results. Current performance may be higher or lower than the performance shown. Total returns for periods less than one year are not annualized. Investment return and principal value will fluctuate, and redemption value may be more or less than original cost. Data assumes reinvestment of dividends and capital gains, and none of the charts reflect the deduction of taxes that a shareholder would pay on fund distributions or the redemption of fund shares. To obtain performance data current to the most recent month end, please call 1-800-345-6488 or visit ipro.americancentury.com (for Investment Professionals). For additional information about the fund, please consult the prospectus.
|
|
| Growth of $10,000 Over 10 Years |
| $10,000 investment made December 31, 2006 |
| Performance for other share classes will vary due to differences in fee structure. |
|
| |
| Value on December 31, 2016 |
| | Class I — $11,587 |
| |
| | MSCI EAFE Index — $10,775 |
| |
| | MSCI EAFE Growth Index — $11,763 |
| |
Ending value of Class I would have been lower if a portion of the fees had not been waived.
|
| |
| Total Annual Fund Operating Expenses |
| Class I | Class II |
| 1.33% | 1.48% |
The total annual fund operating expenses shown is as stated in the fund’s prospectus current as of the date of this report. The prospectus may vary from the expense ratio shown elsewhere in this report because it is based on a different time period, includes acquired fund fees and expenses, and, if applicable, does not include fee waivers or expense reimbursements.
Data presented reflect past performance. Past performance is no guarantee of future results. Current performance may be higher or lower than the performance shown. Total returns for periods less than one year are not annualized. Investment return and principal value will fluctuate, and redemption value may be more or less than original cost. Data assumes reinvestment of dividends and capital gains, and none of the charts reflect the deduction of taxes that a shareholder would pay on fund distributions or the redemption of fund shares. To obtain performance data current to the most recent month end, please call 1-800-345-6488 or visit ipro.americancentury.com (for Investment Professionals). For additional information about the fund, please consult the prospectus.
Portfolio Manager: Raj Gandhi and James Gendelman
Performance Summary
VP International declined -5.50%* for the 12 months ended December 31, 2016. The portfolio’s benchmark, the MSCI EAFE Index, gained 1.00% for the same period.
Non-U.S. developed market stocks delivered slight increases during the 12-month period, sharply lagging returns provided by U.S.-based equities. Among non-U.S. developed stock markets, Japan fared the best, delivering a modest gain; equities based in Europe posted slight losses; and those based in the Far East lagged.
In 2016, the market was dominated by an unprecedented number of exogenous events, including abrupt changes to Federal Reserve (Fed) policy, terrorist events, Brexit, the U.S. presidential election, and the Italian referendum. Reversing a performance trend spanning several years, value dramatically outperformed growth in 2016. This was a significant challenge, as secular growth companies with higher earnings multiples were punished even though their fundamentals were unchanged. The scarcity of growth around the globe led to a continuation of central bank policy characterized by abnormally low interest rates, which drove uncertainty and volatility for stocks and helped more defensive securities outperform. The degree of intra-stock correlation increased. As a result, the market has not been differentiating among securities based on earnings or fundamentals. Currency volatility was high, causing currency effects to have a larger-than-normal impact on relative returns. These forces created spikes in volatility, major shifts in sentiment, and sector rotation.
In addition, the uncertainty associated with the U.K.’s late-June Brexit vote triggered a sharp market correction that spilled into the beginning of the third quarter, with most equity markets continuing to decline. Subsequently, a combination of better-than-expected earnings and the realization that the aftermath of Brexit would not be as bad as originally feared, led to a rerating of stocks and a market turnaround. The surprise U.S. election outcome was also particularly impactful, producing abrupt changes in direction and severe sector rotation as investors sought out potential beneficiaries of Donald Trump’s goals of cutting corporate taxes, increasing infrastructure spending, and reducing government regulation.
Overall, the fund lagged its benchmark, primarily due to stock selection in the financials, consumer staples, and information technology sectors. Regionally, stock selection in the U.K. and Japan contributed to the fund’s underperformance.
Italian Bank Was a Top Detractor
Among individual detractors to performance in financials was Italy-based bank Intesa Sanpaolo, which declined due to concerns over weakness in the Italian banking sector and the fear that regulators would continue to force them to contribute to a fund to help save the lower-quality banks. Ongoing concerns about the negative interest rate environment in Europe on net interest margins also weighed heavily on the stock. Although we continue to view Intesa Sanpaolo as one of the highest-quality banks in Italy, with a strong capital ratio and continued strong loan growth, persistent pressure on the stock due to worries over Italian banks in general convinced us to sell the position.
*All fund returns referenced in this commentary are for Class I shares. Fund returns would have been lower if a portion of the fees had not been waived. Performance for other share classes will vary due to differences in fee structure; when Class I performance exceeds that of the fund's benchmark, other share classes may not. See page 2 for returns for all share classes.
In information technology, shares of Worldpay Group, a U.K.-based payment processor, were weak as due to concerns about Brexit and the weakness of the British pound. The company continues to post strong results, and consumer spending trends in the U.S. and the U.K., where the company has its biggest presence, continue to be strong. Another laggard was found in consumer staples where shares of Japan-based snack foods company Calbee underperformed due to the negative impact of the potato shortage in Japan on potato chip sales. Concerns related to the delay of its U.S. manufacturing plant also hurt returns.
Consumer Discretionary Sector Was Main Contributor
Strong stock selection in consumer discretionary benefited performance. Regionally, stock selection in Sweden and Norway and portfolio-only positions in China aided results. Germany-based Adidas added value, as the shares delivered strong returns in the second and third quarters. Resurgent strength in the Adidas brand in both sports and fashion contributed to better-than-expected financial results in May. The athletic shoe and apparel manufacturer is seeing positive results from restructuring efforts put in place by its new CEO. In particular, margins have improved. The company is also benefiting from soccer’s increased popularity.
Another standout performer was Tencent Holdings, a social media and online gaming company headquartered in China. A continued shift in global advertising spending away from traditional media, such as television and newspapers, to online and mobile has boosted Tencent’s advertising revenues and enabled it to deliver consistently strong financial results. The company has more than 1.5 billion active users and continues to attract more. Another positive trend for Tencent is the transition of games from PC to mobile.
Outlook
Portfolio positioning remains a function of bottom-up stock selection. Selection of stocks exhibiting improving and strong, sustainable growth that, based on inflecting earnings, is not well represented in either consensus or the stock price helps us identify market trends. In consumer discretionary, we continue to find opportunities in companies that have positioned themselves to profit from the ongoing shift in consumer behavior from offline to online commerce. Similarly, in information technology, we also favor those companies that are benefiting from the proliferation of smartphones and the subsequent expansion of content-driven applications and digital advertising development. We maintain the portfolio’s underweight position, relative to the benchmark, in the financials sector, but have added slightly to our positions in the sector as we believe the steepening of the yield curve should lead to improved net interest margins. Our process has identified improvement in the materials sector driven by stabilization of the supply/demand balance, better pricing, and a stronger outlook for residential construction in both Europe and the U.S.
|
| |
| DECEMBER 31, 2016 |
| Top Ten Holdings | % of net assets |
| Roche Holding AG | 2.3% |
| AIA Group Ltd. | 1.9% |
| Shire plc | 1.8% |
| CRH plc | 1.8% |
| British American Tobacco plc | 1.7% |
| TOTAL SA | 1.7% |
| Rio Tinto plc | 1.6% |
| BNP Paribas SA | 1.6% |
| Kering | 1.6% |
| SAP SE | 1.6% |
| | |
| Types of Investments in Portfolio | % of net assets |
| Common Stocks | 98.2% |
| Temporary Cash Investments | 1.5% |
| Other Assets and Liabilities | 0.3% |
| | |
| Investments by Country | % of net assets |
| United Kingdom | 20.8% |
| France | 15.8% |
| Japan | 14.7% |
| Germany | 8.2% |
| Switzerland | 4.5% |
| Ireland | 3.0% |
| China | 2.9% |
| Hong Kong | 2.8% |
| Denmark | 2.7% |
| Sweden | 2.6% |
| Australia | 2.5% |
| Netherlands | 2.3% |
| Belgium | 2.2% |
| Other Countries | 13.2% |
| Cash and Equivalents* | 1.8% |
*Includes temporary cash investments and other assets and liabilities.
Fund shareholders may incur two types of costs: (1) transaction costs, including sales charges (loads) on purchase payments and redemption/exchange fees; and (2) ongoing costs, including management fees; distribution and service (12b-1) fees; and other fund expenses. This example is intended to help you understand your ongoing costs (in dollars) of investing in your fund and to compare these costs with the ongoing cost of investing in other mutual funds.
The example is based on an investment of $1,000 made at the beginning of the period and held for the entire period from July 1, 2016 to December 31, 2016.
Actual Expenses
The table provides information about actual account values and actual expenses for each class. You may use the information, together with the amount you invested, to estimate the expenses that you paid over the period. First, identify the share class you own. Then simply divide your account value by $1,000 (for example, an $8,600 account value divided by $1,000 = 8.6), then multiply the result by the number under the heading “Expenses Paid During Period” to estimate the expenses you paid on your account during this period.
Hypothetical Example for Comparison Purposes
The table also provides information about hypothetical account values and hypothetical expenses based on the actual expense ratio of each class of your fund and an assumed rate of return of 5% per year before expenses, which is not the actual return of a fund’s share class. The hypothetical account values and expenses may not be used to estimate the actual ending account balance or expenses you paid for the period. You may use this information to compare the ongoing costs of investing in your fund and other funds. To do so, compare this 5% hypothetical example with the 5% hypothetical examples that appear in the shareholder reports of the other funds.
Please note that the expenses shown in the table are meant to highlight your ongoing costs only and do not reflect any transactional costs, such as sales charges (loads) or redemption/exchange fees. Therefore, the table is useful in comparing ongoing costs only, and will not help you determine the relative total costs of owning different funds. In addition, if these transactional costs were included, your costs would have been higher.
|
| | | | |
| | Beginning
Account Value
7/1/16 | Ending
Account Value
12/31/16 | Expenses Paid
During Period(1)
7/1/16 - 12/31/16 | Annualized
Expense Ratio(1) |
| Actual | | | | |
| Class I (after waiver) | $1,000 | $1,000.00 | $5.68 | 1.13% |
| Class I (before waiver) | $1,000 | $1,000.00(2) | $6.84 | 1.36% |
| Class II (after waiver) | $1,000 | $1,000.00 | $6.43 | 1.28% |
| Class II (before waiver) | $1,000 | $1,000.00(2) | $7.59 | 1.51% |
| Hypothetical | | | | |
| Class I (after waiver) | $1,000 | $1,019.46 | $5.74 | 1.13% |
| Class I (before waiver) | $1,000 | $1,018.30 | $6.90 | 1.36% |
| Class II (after waiver) | $1,000 | $1,018.70 | $6.50 | 1.28% |
| Class II (before waiver) | $1,000 | $1,017.55 | $7.66 | 1.51% |
| |
| (1) | Expenses are equal to the class's annualized expense ratio listed in the table above, multiplied by the average account value over the period, multiplied by 184, the number of days in the most recent fiscal half-year, divided by 366, to reflect the one-half year period. |
| |
| (2) | Ending account value assumes the return earned after waiver and would have been lower if a portion of the fees had not been waived. |
DECEMBER 31, 2016
|
| | | | | |
| | Shares | Value |
| COMMON STOCKS — 98.2% | | |
| Australia — 2.5% | | |
| CSL Ltd. | 15,040 |
| $ | 1,086,491 |
|
| Fortescue Metals Group Ltd. | 529,510 |
| 2,236,002 |
|
| Treasury Wine Estates Ltd. | 212,880 |
| 1,638,015 |
|
| | | 4,960,508 |
|
| Austria — 1.0% | | |
| Erste Group Bank AG | 68,060 |
| 1,992,706 |
|
| Belgium — 2.2% | | |
| KBC Group NV | 48,260 |
| 2,987,216 |
|
| UCB SA | 20,920 |
| 1,339,047 |
|
| | | 4,326,263 |
|
| Canada — 1.1% | | |
| Alimentation Couche-Tard, Inc., B Shares | 46,450 |
| 2,106,190 |
|
| China — 2.9% | | |
Alibaba Group Holding Ltd. ADR(1) | 30,490 |
| 2,677,327 |
|
| Tencent Holdings Ltd. | 125,500 |
| 3,045,907 |
|
| | | 5,723,234 |
|
| Denmark — 2.7% | | |
| AP Moeller - Maersk A/S, B Shares | 540 |
| 859,201 |
|
| DSV A/S | 46,020 |
| 2,047,361 |
|
| Pandora A/S | 18,480 |
| 2,413,711 |
|
| | | 5,320,273 |
|
| France — 15.8% | | |
ArcelorMittal(1) | 346,020 |
| 2,551,109 |
|
| Arkema SA | 22,110 |
| 2,160,008 |
|
| BNP Paribas SA | 50,000 |
| 3,185,070 |
|
Criteo SA ADR(1) | 35,640 |
| 1,464,091 |
|
| Danone SA | 19,100 |
| 1,208,941 |
|
| Essilor International SA | 21,442 |
| 2,422,418 |
|
| Kering | 13,890 |
| 3,113,927 |
|
| L'Oreal SA | 8,080 |
| 1,472,957 |
|
| Publicis Groupe SA | 30,080 |
| 2,075,086 |
|
| Rexel SA | 90,720 |
| 1,490,286 |
|
| Thales SA | 25,270 |
| 2,448,508 |
|
| TOTAL SA | 64,905 |
| 3,313,253 |
|
| Valeo SA | 40,400 |
| 2,321,368 |
|
| Vivendi SA | 119,280 |
| 2,266,027 |
|
| | | 31,493,049 |
|
| Germany — 8.2% | | |
| adidas AG | 16,500 |
| 2,607,673 |
|
Deutsche Boerse AG(1) | 21,940 |
| 1,787,412 |
|
| Fresenius Medical Care AG & Co. KGaA | 22,660 |
| 1,921,183 |
|
| HeidelbergCement AG | 28,550 |
| 2,663,559 |
|
| Infineon Technologies AG | 85,600 |
| 1,483,606 |
|
| SAP SE | 35,510 |
| 3,103,401 |
|
|
| | | | | |
| | Shares | Value |
Zalando SE(1) | 72,472 |
| $ | 2,768,364 |
|
| | | 16,335,198 |
|
| Hong Kong — 2.8% | | |
| AIA Group Ltd. | 680,800 |
| 3,809,937 |
|
| Sands China Ltd. | 396,000 |
| 1,703,107 |
|
| | | 5,513,044 |
|
| India — 1.4% | | |
| HDFC Bank Ltd. | 43,050 |
| 839,422 |
|
| Tata Motors Ltd. | 288,490 |
| 2,004,019 |
|
| | | 2,843,441 |
|
| Indonesia — 1.9% | | |
| Astra International Tbk PT | 3,370,000 |
| 2,060,916 |
|
| Bank Mandiri Persero Tbk PT | 2,014,500 |
| 1,722,587 |
|
| | | 3,783,503 |
|
| Ireland — 3.0% | | |
Bank of Ireland(1) | 882,972 |
| 217,152 |
|
| CRH plc | 101,610 |
| 3,511,868 |
|
Ryanair Holdings plc ADR(1) | 26,027 |
| 2,167,008 |
|
| | | 5,896,028 |
|
| Israel — 0.7% | | |
Mobileye NV(1) | 38,370 |
| 1,462,664 |
|
| Italy — 0.5% | | |
| Azimut Holding SpA | 62,597 |
| 1,042,593 |
|
| Japan — 14.7% | | |
| Calbee, Inc. | 66,600 |
| 2,083,590 |
|
| CyberAgent, Inc. | 29,000 |
| 715,620 |
|
| Daikin Industries Ltd. | 24,700 |
| 2,262,020 |
|
| Daito Trust Construction Co. Ltd. | 14,800 |
| 2,222,827 |
|
| FANUC Corp. | 7,300 |
| 1,234,435 |
|
| Fast Retailing Co. Ltd. | 4,500 |
| 1,605,495 |
|
| Fuji Heavy Industries Ltd. | 21,200 |
| 862,337 |
|
| Isuzu Motors Ltd. | 40,900 |
| 516,330 |
|
| Keyence Corp. | 3,100 |
| 2,124,054 |
|
| Komatsu Ltd. | 92,400 |
| 2,085,577 |
|
LINE Corp.(1) | 21,900 |
| 746,792 |
|
| Nitori Holdings Co. Ltd. | 20,100 |
| 2,296,917 |
|
| NTT DOCOMO, Inc. | 65,700 |
| 1,494,068 |
|
| Omron Corp. | 17,200 |
| 658,273 |
|
| ORIX Corp. | 167,000 |
| 2,587,251 |
|
| Rohm Co. Ltd. | 5,100 |
| 292,684 |
|
| Ryohin Keikaku Co. Ltd. | 8,900 |
| 1,740,255 |
|
| Shin-Etsu Chemical Co. Ltd. | 15,300 |
| 1,179,179 |
|
| Start Today Co. Ltd. | 89,300 |
| 1,532,112 |
|
| Sysmex Corp. | 19,700 |
| 1,138,721 |
|
| | | 29,378,537 |
|
| Mexico — 1.2% | | |
Cemex SAB de CV ADR(1) | 241,922 |
| 1,942,634 |
|
| Fomento Economico Mexicano SAB de CV ADR | 6,960 |
| 530,421 |
|
| | | 2,473,055 |
|
| Netherlands — 2.3% | | |
| ASML Holding NV | 15,620 |
| 1,750,122 |
|
|
| | | | | |
| | Shares | Value |
| Koninklijke DSM NV | 25,070 |
| $ | 1,500,849 |
|
| Koninklijke Vopak NV | 28,480 |
| 1,343,529 |
|
| | | 4,594,500 |
|
| Norway — 1.8% | | |
| DNB ASA | 108,800 |
| 1,618,049 |
|
| Statoil ASA | 108,210 |
| 1,971,729 |
|
| | | 3,589,778 |
|
| Portugal — 0.9% | | |
| Jeronimo Martins SGPS SA | 120,502 |
| 1,869,182 |
|
| Russia — 0.5% | | |
| Magnit PJSC GDR | 23,970 |
| 1,056,253 |
|
| South Korea — 0.7% | | |
| Amorepacific Corp. | 2,640 |
| 701,939 |
|
| BGF retail Co. Ltd. | 9,880 |
| 666,964 |
|
| | | 1,368,903 |
|
| Spain — 1.5% | | |
| Industria de Diseno Textil SA | 85,150 |
| 2,905,787 |
|
| Sweden — 2.6% | | |
| Hexagon AB, B Shares | 60,810 |
| 2,168,562 |
|
Lundin Petroleum AB(1) | 102,290 |
| 2,217,433 |
|
| Sandvik AB | 67,880 |
| 837,983 |
|
| | | 5,223,978 |
|
| Switzerland — 4.5% | | |
| Cie Financiere Richemont SA | 14,830 |
| 981,921 |
|
| Julius Baer Group Ltd. | 53,900 |
| 2,393,029 |
|
| Roche Holding AG | 20,059 |
| 4,570,508 |
|
| Zurich Insurance Group AG | 4,060 |
| 1,115,126 |
|
| | | 9,060,584 |
|
| United Kingdom — 20.8% | | |
| Ashtead Group plc | 140,784 |
| 2,727,493 |
|
ASOS plc(1) | 32,332 |
| 1,967,796 |
|
| Auto Trader Group plc | 196,957 |
| 991,700 |
|
| Aviva plc | 484,496 |
| 2,891,039 |
|
| British American Tobacco plc | 60,080 |
| 3,411,277 |
|
| Bunzl plc | 57,520 |
| 1,488,478 |
|
| Compass Group plc | 84,740 |
| 1,561,955 |
|
| HSBC Holdings plc | 132,400 |
| 1,063,630 |
|
| London Stock Exchange Group plc | 62,570 |
| 2,248,091 |
|
| Reckitt Benckiser Group plc | 34,520 |
| 2,918,124 |
|
| RELX plc | 48,610 |
| 864,485 |
|
| Rio Tinto plc | 85,667 |
| 3,262,253 |
|
| Royal Dutch Shell plc, Class A | 78,005 |
| 2,120,321 |
|
| Shire plc | 62,540 |
| 3,543,902 |
|
| St. James's Place plc | 142,932 |
| 1,777,836 |
|
Tullow Oil plc(1) | 294,710 |
| 1,129,532 |
|
| Weir Group plc (The) | 125,020 |
| 2,896,577 |
|
| Wolseley plc | 44,730 |
| 2,732,743 |
|
| Worldpay Group plc | 565,253 |
| 1,874,602 |
|
| | | 41,471,834 |
|
TOTAL COMMON STOCKS
(Cost $186,554,445) | | 195,791,085 |
|
|
| | | | | |
| | Shares | Value |
| TEMPORARY CASH INVESTMENTS — 1.5% | | |
| Repurchase Agreement, Fixed Income Clearing Corp., (collateralized by various U.S. Treasury obligations, 3.75%, 11/15/43, valued at $1,833,722), at 0.10%, dated 12/30/16, due 1/3/17 (Delivery value $1,793,020) | | $ | 1,793,000 |
|
| State Street Institutional U.S. Government Money Market Fund, Premier Class | 1,293,938 |
| 1,293,938 |
|
TOTAL TEMPORARY CASH INVESTMENTS
(Cost $3,086,938) | | 3,086,938 |
|
TOTAL INVESTMENT SECURITIES — 99.7%
(Cost $189,641,383) | | 198,878,023 |
|
| OTHER ASSETS AND LIABILITIES — 0.3% | | 535,828 |
|
| TOTAL NET ASSETS — 100.0% | | $ | 199,413,851 |
|
|
| | |
| MARKET SECTOR DIVERSIFICATION | |
| (as a % of net assets) | |
| Consumer Discretionary | 20.3 | % |
| Financials | 16.5 | % |
| Industrials | 13.1 | % |
| Information Technology | 11.9 | % |
| Materials | 10.5 | % |
| Consumer Staples | 9.7 | % |
| Health Care | 8.2 | % |
| Energy | 6.2 | % |
| Real Estate | 1.1 | % |
| Telecommunication Services | 0.7 | % |
| Cash and Equivalents* | 1.8 | % |
*Includes temporary cash investments and other assets and liabilities.
|
| | |
| NOTES TO SCHEDULE OF INVESTMENTS |
| ADR | - | American Depositary Receipt |
| GDR | - | Global Depositary Receipt |
See Notes to Financial Statements.
|
|
| Statement of Assets and Liabilities |
|
| | | |
| DECEMBER 31, 2016 | |
| Assets | |
| Investment securities, at value (cost of $189,641,383) | $ | 198,878,023 |
|
| Foreign currency holdings, at value (cost of $47,607) | 45,867 |
|
| Receivable for investments sold | 149,878 |
|
| Receivable for capital shares sold | 67,422 |
|
| Dividends and interest receivable | 906,566 |
|
| Other assets | 11,858 |
|
| | 200,059,614 |
|
| | |
| Liabilities | |
| Payable for investments purchased | 347,988 |
|
| Payable for capital shares redeemed | 98,567 |
|
| Accrued management fees | 189,022 |
|
| Distribution fees payable | 8,180 |
|
| Accrued foreign taxes | 2,006 |
|
| | 645,763 |
|
| | |
| Net Assets | $ | 199,413,851 |
|
| | |
| Net Assets Consist of: | |
| Capital (par value and paid-in surplus) | $ | 194,754,462 |
|
| Undistributed net investment income | 440,245 |
|
| Accumulated net realized loss | (5,051,866 | ) |
| Net unrealized appreciation | 9,271,010 |
|
| | $ | 199,413,851 |
|
|
| | | | | | |
| | Net Assets | Shares Outstanding | Net Asset Value Per Share |
| Class I, $0.01 Par Value |
| $160,667,999 |
| 17,146,237 |
| $9.37 |
| Class II, $0.01 Par Value |
| $38,745,852 |
| 4,141,333 |
| $9.36 |
See Notes to Financial Statements.
|
| | | |
| YEAR ENDED DECEMBER 31, 2016 | |
| Investment Income (Loss) | |
| Income: | |
| Dividends (net of foreign taxes withheld of $432,956) | $ | 4,138,572 |
|
| Interest | 975 |
|
| | 4,139,547 |
|
| | |
| Expenses: | |
| Management fees | 2,795,696 |
|
| Distribution fees - Class II | 105,197 |
|
| Directors' fees and expenses | 7,057 |
|
| Other expenses | 27,381 |
|
| | 2,935,331 |
|
| Fees waived | (564,708 | ) |
| | 2,370,623 |
|
| | |
| Net investment income (loss) | 1,768,924 |
|
| | |
| Realized and Unrealized Gain (Loss) | |
| Net realized gain (loss) on: | |
| Investment transactions | (913,083 | ) |
| Foreign currency transactions | (58,360 | ) |
| | (971,443 | ) |
| | |
| Change in net unrealized appreciation (depreciation) on: | |
| Investments (includes (increase) decrease in accrued foreign taxes of $(2,006)) | (13,612,429 | ) |
| Translation of assets and liabilities in foreign currencies | (1,242 | ) |
| | (13,613,671 | ) |
| | |
| Net realized and unrealized gain (loss) | (14,585,114 | ) |
| | |
| Net Increase (Decrease) in Net Assets Resulting from Operations | $ | (12,816,190 | ) |
See Notes to Financial Statements.
|
|
| Statement of Changes in Net Assets |
|
| | | | | | |
| YEARS ENDED DECEMBER 31, 2016 AND DECEMBER 31, 2015 |
| Increase (Decrease) in Net Assets | December 31, 2016 | December 31, 2015 |
| Operations | | |
| Net investment income (loss) | $ | 1,768,924 |
| $ | 1,943,860 |
|
| Net realized gain (loss) | (971,443 | ) | 15,509,216 |
|
| Change in net unrealized appreciation (depreciation) | (13,613,671 | ) | (14,746,384 | ) |
| Net increase (decrease) in net assets resulting from operations | (12,816,190 | ) | 2,706,692 |
|
| | | |
| Distributions to Shareholders | | |
| From net investment income: | | |
| Class I | (1,786,018 | ) | (760,842 | ) |
| Class II | (396,033 | ) | (110,696 | ) |
| Class III | — |
| (2,813 | ) |
| Class IV | — |
| (2,606 | ) |
| Decrease in net assets from distributions | (2,182,051 | ) | (876,957 | ) |
| | | |
| Capital Share Transactions | | |
| Net increase (decrease) in net assets from capital share transactions (Note 5) | (16,991,843 | ) | (33,774,931 | ) |
| | | |
| Redemption Fees | | |
| Increase in net assets from redemption fees | — |
| 18 |
|
| | | |
| Net increase (decrease) in net assets | (31,990,084 | ) | (31,945,178 | ) |
| | | |
| Net Assets | | |
| Beginning of period | 231,403,935 |
| 263,349,113 |
|
| End of period | $ | 199,413,851 |
| $ | 231,403,935 |
|
| | | |
| Undistributed net investment income | $ | 440,245 |
| $ | 579,737 |
|
See Notes to Financial Statements.
|
|
| Notes to Financial Statements |
DECEMBER 31, 2016
1. Organization
American Century Variable Portfolios, Inc. (the corporation) is registered under the Investment Company Act of 1940, as amended (the 1940 Act), as an open-end management investment company and is organized as a Maryland corporation. VP International Fund (the fund) is one fund in a series issued by the corporation. The fund’s investment objective is to seek capital growth.
The fund offers Class I and Class II. The share classes differ principally in their respective distribution and shareholder servicing expenses and arrangements. Class II is charged a lower unified management fee because it has a separate arrangement for distribution services. On August 7, 2015, there were no outstanding Class III and Class IV shares and the fund discontinued offering Class III and Class IV.
2. Significant Accounting Policies
The following is a summary of significant accounting policies consistently followed by the fund in preparation of its financial statements. The fund is an investment company and follows accounting and reporting guidance in accordance with accounting principles generally accepted in the United States of America. This may require management to make certain estimates and assumptions at the date of the financial statements. Actual results could differ from these estimates. Management evaluated the impact of events or transactions occurring through the date the financial statements were issued that would merit recognition or disclosure.
Investment Valuations — The fund determines the fair value of its investments and computes its net asset value per share at the close of regular trading (usually 4 p.m. Eastern time) on the New York Stock Exchange (NYSE) on each day the NYSE is open. The Board of Directors has adopted valuation policies and procedures to guide the investment advisor in the fund’s investment valuation process and to provide methodologies for the oversight of the fund’s pricing function.
Equity securities that are listed or traded on a domestic securities exchange are valued at the last reported sales price or at the official closing price as provided by the exchange. Equity securities traded on foreign securities exchanges are generally valued at the closing price of such securities on the exchange where primarily traded or at the close of the NYSE, if that is earlier. If no last sales price is reported, or if local convention or regulation so provides, the mean of the latest bid and asked prices may be used. Securities traded over-the-counter are valued at the mean of the latest bid and asked prices, the last sales price, or the official closing price. Equity securities initially expressed in local currencies are translated into U.S. dollars at the mean of the appropriate currency exchange rate at the close of the NYSE as provided by an independent pricing service.
Open-end management investment companies are valued at the reported net asset value per share. Repurchase agreements are valued at cost, which approximates fair value.
If the fund determines that the market price for an investment is not readily available or the valuation methods mentioned above do not reflect an investment’s fair value, such investment is valued as determined in good faith by the Board of Directors or its delegate, in accordance with policies and procedures adopted by the Board of Directors. In its determination of fair value, the fund may review several factors including, but not limited to, market information regarding the specific investment or comparable investments and correlation with other investment types, futures indices or general market indicators. Circumstances that may cause the fund to use these procedures to value an investment include, but are not limited to: an investment has been declared in default or is distressed; trading in a security has been suspended during the trading day or a security is not actively trading on its principal exchange; prices received from a regular pricing source are deemed unreliable; or there is a foreign market holiday and no trading occurred.
The fund monitors for significant events occurring after the close of an investment’s primary exchange but before the fund’s net asset value per share is determined. Significant events may include, but are not limited to: corporate announcements and transactions; governmental action and political unrest that could impact a specific investment or an investment sector; or armed conflicts, natural disasters and similar events that could affect investments in a specific country or region. The fund also monitors for significant fluctuations between domestic and foreign markets, as evidenced by the U.S. market or such other indicators that the Board of
Directors, or its delegate, deems appropriate. If significant fluctuations in foreign markets are identified, the fund may apply a model-derived factor to the closing price of equity securities traded on foreign securities exchanges. The factor is based on observable market data as provided by an independent pricing service.
Security Transactions — Security transactions are accounted for as of the trade date. Net realized gains and losses are determined on the identified cost basis, which is also used for federal income tax purposes. Certain countries impose taxes on realized gains on the sale of securities registered in their country. The fund records the foreign tax expense, if any, on an accrual basis. The foreign tax expense on realized gains and unrealized appreciation reduces the net realized gain (loss) on investment transactions and net unrealized appreciation (depreciation) on investments, respectively.
Investment Income — Dividend income less foreign taxes withheld, if any, is recorded as of the ex-dividend date. Distributions received on securities that represent a return of capital or long-term capital gain are recorded as a reduction of cost of investments and/or as a realized gain. The fund may estimate the components of distributions received that may be considered nontaxable distributions or long-term capital gain distributions for income tax purposes. Interest income is recorded on the accrual basis and includes accretion of discounts and amortization of premiums.
Foreign Currency Translations — All assets and liabilities initially expressed in foreign currencies are translated into U.S. dollars at prevailing exchange rates at period end. The fund may enter into spot foreign currency exchange contracts to facilitate transactions denominated in a foreign currency. Purchases and sales of investment securities, dividend and interest income, spot foreign currency exchange contracts, and expenses are translated at the rates of exchange prevailing on the respective dates of such transactions. Net realized and unrealized foreign currency exchange gains or losses related to investment securities are a component of net realized gain (loss) on investment transactions and change in net unrealized appreciation (depreciation) on investments, respectively.
Repurchase Agreements — The fund may enter into repurchase agreements with institutions that American Century Investment Management, Inc. (ACIM) (the investment advisor) has determined are creditworthy pursuant to criteria adopted by the Board of Directors. The fund requires that the collateral, represented by securities, received in a repurchase transaction be transferred to the custodian in a manner sufficient to enable the fund to obtain those securities in the event of a default under the repurchase agreement. ACIM monitors, on a daily basis, the securities transferred to ensure the value, including accrued interest, of the securities under each repurchase agreement is equal to or greater than amounts owed to the fund under each repurchase agreement.
Joint Trading Account — Pursuant to an Exemptive Order issued by the Securities and Exchange Commission, the fund, along with certain other funds in the American Century Investments family of funds, may transfer uninvested cash balances into a joint trading account. These balances are invested in one or more repurchase agreements that are collateralized by U.S. Treasury or Agency obligations.
Income Tax Status — It is the fund’s policy to distribute substantially all net investment income and net realized gains to shareholders and to otherwise qualify as a regulated investment company under provisions of the Internal Revenue Code. Accordingly, no provision has been made for income taxes. The fund files U.S. federal, state, local and non-U.S. tax returns as applicable. The fund's tax returns are subject to examination by the relevant taxing authority until expiration of the applicable statute of limitations, which is generally three years from the date of filing but can be longer in certain jurisdictions. At this time, management believes there are no uncertain tax positions which, based on their technical merit, would not be sustained upon examination and for which it is reasonably possible that the total amounts of unrecognized tax benefits will significantly change in the next twelve months.
Multiple Class — All shares of the fund represent an equal pro rata interest in the net assets of the class to which such shares belong, and have identical voting, dividend, liquidation and other rights and the same terms and conditions, except for class specific expenses and exclusive rights to vote on matters affecting only individual classes. Income, non-class specific expenses, and realized and unrealized capital gains and losses of the fund are allocated to each class of shares based on their relative net assets.
Distributions to Shareholders — Distributions from net investment income and net realized gains, if any, are generally declared and paid annually.
Redemption Fees — Prior to August 7, 2015, the fund may have imposed a 1.00% redemption fee on shares held less than 60 days. The fee was not applicable to all classes. The redemption fee was retained by the fund to help cover transaction costs that long-term investors may bear when the fund sells securities to meet investor redemptions.
Indemnifications — Under the corporation’s organizational documents, its officers and directors are indemnified against certain liabilities arising out of the performance of their duties to the fund. In addition, in the normal course of business, the fund enters into contracts that provide general indemnifications. The maximum exposure under these arrangements is unknown as this would involve future claims that may be made against a fund. The risk of material loss from such claims is considered by management to be remote.
3. Fees and Transactions with Related Parties
Certain officers and directors of the corporation are also officers and/or directors of American Century Companies, Inc. (ACC). The corporation’s investment advisor, ACIM, the corporation's distributor, American Century Investment Services, Inc. (ACIS), and the corporation’s transfer agent, American Century Services, LLC, are wholly owned, directly or indirectly, by ACC.
Management Fees — The corporation has entered into a management agreement with ACIM, under which ACIM provides the fund with investment advisory and management services in exchange for a single, unified management fee (the fee) per class. The agreement provides that all expenses of managing and operating the fund, except distribution fees, brokerage expenses, taxes, interest, fees and expenses of the independent directors (including legal counsel fees), and extraordinary expenses, will be paid by ACIM. The fee is computed and accrued daily based on each class's daily net assets and paid monthly in arrears. The rate of the fee is determined by applying a fee rate calculation formula. This formula takes into account the fund's assets as well as certain assets, if any, of other clients of the investment advisor outside the American Century Investments family of funds (such as subadvised funds and separate accounts) that have very similar investment teams and investment strategies (strategy assets). The annual management fee schedule ranges from 1.00% to 1.50% for Class I and from 0.90% to 1.40% for Class II. From January 1, 2016 through July 31, 2016, the investment advisor agreed to waive 0.31% of the fund's management fee. Effective August 1, 2016, the investment advisor agreed to waive 0.21% of the fund’s management fee. The investment advisor expects this waiver to continue until July 31, 2017 and cannot terminate it prior to such date without the approval of the Board of Directors. The total amount of the waiver for each class for the year ended December 31, 2016 was $451,287 and $113,421 for Class I and Class II, respectively. The effective annual management fee before waiver for each class for the year ended December 31, 2016 was 1.35% and 1.25%, for Class I and Class II, respectively. The effective annual management fee after waiver for each class for the year ended December 31, 2016 was 1.08% and 0.98%, for Class I and Class II, respectively.
Distribution Fees — The Board of Directors has adopted the Master Distribution Plan (the plan) for Class II, pursuant to Rule 12b-1 of the 1940 Act. The plan provides that Class II will pay ACIS an annual distribution fee equal to 0.25%. The fee is computed and accrued daily based on the Class II daily net assets and paid monthly in arrears. The distribution fee provides compensation for expenses incurred in connection with distributing shares of Class II including, but not limited to, payments to brokers, dealers, and financial institutions that have entered into sales agreements with respect to shares of the fund. Fees incurred under the plan during the year ended December 31, 2016 are detailed in the Statement of Operations.
Directors' Fees and Expenses — The Board of Directors is responsible for overseeing the investment advisor’s management and operations of the fund. The directors receive detailed information about the fund and its investment advisor regularly throughout the year, and meet at least quarterly with management of the investment advisor to review reports about fund operations. The fund’s officers do not receive compensation from the fund.
Interfund Transactions — The fund may enter into security transactions with other American Century Investments funds and other client accounts of the investment advisor, in accordance with the 1940 Act rules and procedures adopted by the Board of Directors. The rules and procedures require, among other things, that these transactions be effected at the independent current market price of the security. During the period, the interfund purchases and sales were $72,451 and $18,139, respectively. The effect of interfund transactions on the Statement of Operations was $(2,804) in net realized gain (loss) on investment transactions.
4. Investment Transactions
Purchases and sales of investment securities, excluding short-term investments, for the year ended December 31, 2016 were $148,407,342 and $164,942,781, respectively.
5. Capital Share Transactions
Transactions in shares of the fund were as follows:
|
| | | | | | | | | | |
| | Year ended
December 31, 2016 | Year ended
December 31, 2015 |
| | Shares | Amount | Shares | Amount |
| Class I/Shares Authorized | 200,000,000 |
| | 200,000,000 |
| |
| Sold | 2,510,736 |
| $ | 23,844,001 |
| 2,416,900 |
| $ | 25,299,667 |
|
| Issued in reinvestment of distributions | 189,397 |
| 1,786,018 |
| 71,307 |
| 760,842 |
|
| Redeemed | (3,882,064 | ) | (36,627,329 | ) | (5,244,041 | ) | (54,311,788 | ) |
| | (1,181,931 | ) | (10,997,310 | ) | (2,755,834 | ) | (28,251,279 | ) |
| Class II/Shares Authorized | 100,000,000 |
| | 100,000,000 |
| |
| Sold | 257,370 |
| 2,449,533 |
| 689,725 |
| 7,117,085 |
|
| Issued in reinvestment of distributions | 41,997 |
| 396,033 |
| 10,374 |
| 110,696 |
|
| Redeemed | (931,555 | ) | (8,840,099 | ) | (1,021,362 | ) | (10,552,608 | ) |
| | (632,188 | ) | (5,994,533 | ) | (321,263 | ) | (3,324,827 | ) |
| Class III/Shares Authorized | 50,000,000 |
| | 50,000,000 |
| |
| Sold | | | 301 |
| 3,149 |
|
| Issued in reinvestment of distributions | | | 263 |
| 2,813 |
|
| Redeemed | | | (79,489 | ) | (850,050 | ) |
| | | | (78,925 | ) | (844,088 | ) |
| Class IV/Shares Authorized | 50,000,000 |
| | 50,000,000 |
| |
| Sold | | | 2,004 |
| 20,758 |
|
| Issued in reinvestment of distributions | | | 244 |
| 2,606 |
|
| Redeemed | | | (128,897 | ) | (1,378,101 | ) |
| | | | (126,649 | ) | (1,354,737 | ) |
| Net increase (decrease) | (1,814,119 | ) | $ | (16,991,843 | ) | (3,282,671 | ) | $ | (33,774,931 | ) |
6. Fair Value Measurements
The fund’s investments valuation process is based on several considerations and may use multiple inputs to determine the fair value of the investments held by the fund. In conformity with accounting principles generally accepted in the United States of America, the inputs used to determine a valuation are classified into three broad levels.
| |
| • | Level 1 valuation inputs consist of unadjusted quoted prices in an active market for identical investments. |
| |
| • | Level 2 valuation inputs consist of direct or indirect observable market data (including quoted prices for comparable investments, evaluations of subsequent market events, interest rates, prepayment speeds, credit risk, etc.). These inputs also consist of quoted prices for identical investments initially expressed in local currencies that are adjusted through translation into U.S. dollars. |
| |
| • | Level 3 valuation inputs consist of unobservable data (including a fund’s own assumptions). |
The level classification is based on the lowest level input that is significant to the fair valuation measurement. The valuation inputs are not necessarily an indication of the risks associated with investing in these securities or other financial instruments. There were no significant transfers between levels during the period.
The following is a summary of the level classifications as of period end. The Schedule of Investments provides additional information on the fund’s portfolio holdings.
|
| | | | | | | | |
| | Level 1 | Level 2 | Level 3 |
| Assets | | | |
| Investment Securities | | | |
| Common Stocks | | | |
| China | $ | 2,677,327 |
| $ | 3,045,907 |
| — |
|
| France | 1,464,091 |
| 30,028,958 |
| — |
|
| Ireland | 2,167,008 |
| 3,729,020 |
| — |
|
| Israel | 1,462,664 |
| — |
| — |
|
| Mexico | 2,473,055 |
| — |
| — |
|
| Other Countries | — |
| 148,743,055 |
| — |
|
| Temporary Cash Investments | 1,293,938 |
| 1,793,000 |
| — |
|
| | $ | 11,538,083 |
| $ | 187,339,940 |
| — |
|
7. Risk Factors
There are certain risks involved in investing in foreign securities. These risks include those resulting from future adverse political, social and economic developments, fluctuations in currency exchange rates, the possible imposition of exchange controls, and other foreign laws or restrictions. Investing in emerging markets may accentuate these risks.
8. Federal Tax Information
The tax character of distributions paid during the years ended December 31, 2016 and December 31, 2015 were as follows:
|
| | | | | | |
| | 2016 | 2015 |
| Distributions Paid From | | |
| Ordinary income | $ | 2,182,051 |
| $ | 876,957 |
|
| Long-term capital gains | — |
| — |
|
The book-basis character of distributions made during the year from net investment income or net realized gains may differ from their ultimate characterization for federal income tax purposes. These differences reflect the differing character of certain income items and net realized gains and losses for financial statement and tax purposes, and may result in reclassification among certain capital accounts on the financial statements.
As of December 31, 2016, the federal tax cost of investments and the components of distributable earnings on a tax-basis were as follows:
|
| | | |
| Federal tax cost of investments | $ | 191,247,546 |
|
| Gross tax appreciation of investments | $ | 16,674,949 |
|
| Gross tax depreciation of investments | (9,044,472 | ) |
| Net tax appreciation (depreciation) of investments | 7,630,477 |
|
Net tax appreciation (depreciation) on translation of assets and liabilities in foreign currencies | 34,212 |
|
| Net tax appreciation (depreciation) | $ | 7,664,689 |
|
| Undistributed ordinary income | $ | 1,858,845 |
|
Accumulated short-term capital losses
| $ | (4,864,145 | ) |
The difference between book-basis and tax-basis unrealized appreciation (depreciation) is attributable primarily to the realization to ordinary income for tax purposes of unrealized gains on investments in passive foreign investment companies.
Accumulated capital losses represent net capital loss carryovers that may be used to offset future realized capital gains for federal income tax purposes. Any unlimited losses will be required to be utilized prior to the losses which carry an expiration date. Future capital loss carryover utilization in any given year may be subject to Internal Revenue Code limitations. Capital loss carryovers of $(2,196,796) expire in 2017 and the remaining losses are unlimited.
9. Recently Issued Accounting Guidance
In October 2016, the Securities and Exchange Commission adopted new rules and forms as well as amendments to its rules and forms to modernize the reporting and disclosure of information by registered investment companies. The amendments to Regulation S-X will require standardized, enhanced disclosure about derivatives in investment company financial statements, as well as other provisions. Compliance with the amendments is effective on August 1, 2017. Management is currently evaluating the impact that adopting the amendments will have on the financial statement disclosures.
|
| | | | | | | | | | | | | | | |
| For a Share Outstanding Throughout the Years Ended December 31 (except as noted) |
| Per-Share Data | | | | Ratios and Supplemental Data | |
| | | Income From Investment Operations: | | | | Ratio to Average Net Assets of: | |
| | Net Asset
Value,
Beginning
of Period | Net
Investment
Income
(Loss)(1) | Net
Realized
and
Unrealized
Gain (Loss) | Total From
Investment
Operations | Distributions From Net
Investment
Income | Net Asset
Value,
End
of Period | Total
Return(2) | Operating
Expenses | Operating
Expenses
(before
expense
waiver) | Net
Investment
Income
(Loss) | Net
Investment
Income
(Loss) (before
expense
waiver) | Portfolio
Turnover
Rate | Net
Assets,
End of
Period
(in thousands) |
| Class I | | | | | | | | | | | | | |
| 2016 | $10.02 | 0.08 | (0.63) | (0.55) | (0.10) | $9.37 | (5.50)% | 1.10% | 1.37% | 0.87% | 0.60% | 71% |
| $160,668 |
|
| 2015 | $9.98 | 0.08 | —(3) | 0.08 | (0.04) | $10.02 | 0.76% | 1.03% | 1.33% | 0.79% | 0.49% | 59% |
| $183,648 |
|
| 2014 | $10.74 | 0.09 | (0.67) | (0.58) | (0.18) | $9.98 | (5.51)% | 1.03% | 1.33% | 0.84% | 0.54% | 77% |
| $210,511 |
|
| 2013 | $8.93 | 0.10 | 1.87 | 1.97 | (0.16) | $10.74 | 22.41% | 1.07% | 1.37% | 1.01% | 0.71% | 87% |
| $213,085 |
|
| 2012 | $7.43 | 0.11 | 1.46 | 1.57 | (0.07) | $8.93 | 21.16% | 1.29% | 1.42% | 1.33% | 1.20% | 80% |
| $193,260 |
|
| Class II | | | | | | | | | | | | | |
| 2016 | $10.00 | 0.07 | (0.62) | (0.55) | (0.09) | $9.36 | (5.55)% | 1.25% | 1.52% | 0.72% | 0.45% | 71% |
| $38,746 |
|
| 2015 | $9.97 | 0.07 | (0.02) | 0.05 | (0.02) | $10.00 | 0.51% | 1.18% | 1.48% | 0.64% | 0.34% | 59% |
| $47,756 |
|
| 2014 | $10.73 | 0.08 | (0.68) | (0.60) | (0.16) | $9.97 | (5.65)% | 1.18% | 1.48% | 0.69% | 0.39% | 77% |
| $50,788 |
|
| 2013 | $8.92 | 0.08 | 1.88 | 1.96 | (0.15) | $10.73 | 22.25% | 1.22% | 1.52% | 0.86% | 0.56% | 87% |
| $61,312 |
|
| 2012 | $7.42 | 0.10 | 1.45 | 1.55 | (0.05) | $8.92 | 21.01% | 1.44% | 1.57% | 1.18% | 1.05% | 80% |
| $57,698 |
|
|
|
| Notes to Financial Highlights |
| |
| (1) | Computed using average shares outstanding throughout the period. |
| |
| (2) | Total returns are calculated based on the net asset value of the last business day. Total returns for periods less than one year are not annualized. |
| |
| (3) | Per-share amount was less than $0.005. |
See Notes to Financial Statements.
|
|
| Report of Independent Registered Public Accounting Firm |
To the Board of Directors and Shareholders of American Century Variable Portfolios, Inc.:
We have audited the accompanying statement of assets and liabilities, including the schedule of investments, of VP International Fund (the “Fund”), one of the funds constituting American Century Variable Portfolios, Inc., as of December 31, 2016, and the related statement of operations for the year then ended, the statements of changes in net assets for each of the two years in the period then ended, and the financial highlights for each of the five years in the period then ended. These financial statements and financial highlights are the responsibility of the Fund’s management. Our responsibility is to express an opinion on these financial statements and financial highlights based on our audits.
We conducted our audits in accordance with the standards of the Public Company Accounting Oversight Board (United States). Those standards require that we plan and perform the audit to obtain reasonable assurance about whether the financial statements and financial highlights are free of material misstatement. The Fund is not required to have, nor were we engaged to perform, an audit of its internal control over financial reporting. Our audits included consideration of internal control over financial reporting as a basis for designing audit procedures that are appropriate in the circumstances, but not for the purpose of expressing an opinion on the effectiveness of the Fund’s internal control over financial reporting. Accordingly, we express no such opinion. An audit also includes examining, on a test basis, evidence supporting the amounts and disclosures in the financial statements, assessing the accounting principles used and significant estimates made by management, as well as evaluating the overall financial statement presentation. Our procedures included confirmation of securities owned as of December 31, 2016, by correspondence with the custodian and brokers; when replies were not received from brokers, we performed other auditing procedures. We believe that our audits provide a reasonable basis for our opinion.
In our opinion, the financial statements and financial highlights referred to above present fairly, in all material respects, the financial position of VP International Fund of American Century Variable Portfolios, Inc. as of December 31, 2016, the results of its operations for the year then ended, the changes in its net assets for each of the two years in the period then ended, and the financial highlights for each of the five years in the period then ended, in conformity with accounting principles generally accepted in the United States of America.
DELOITTE & TOUCHE LLP
Kansas City, Missouri
February 10, 2017
The Board of Directors
The individuals listed below serve as directors of the funds. Each director will continue to serve in this capacity until death, retirement, resignation or removal from office. The board has adopted a mandatory retirement age for directors who are not “interested persons,” as that term is defined in the Investment Company Act (independent directors). Independent directors shall retire by December 31 of the year in which they reach their 75th birthday.
Mr. Thomas is an “interested person” because he currently serves as President and Chief Executive Officer of American Century Companies, Inc. (ACC), the parent company of American Century Investment Management, Inc. (ACIM or the advisor). The other directors (more than three-fourths of the total number) are independent. They are not employees, directors or officers of, and have no financial interest in, ACC or any of its wholly owned, direct or indirect, subsidiaries, including ACIM, American Century Investment Services, Inc. (ACIS) and American Century Services, LLC (ACS), and they do not have any other affiliations, positions or relationships that would cause them to be considered “interested persons” under the Investment Company Act. The directors serve in this capacity for seven (in the case of Mr. Thomas, 15) registered investment companies in the American Century Investments family of funds.
The following table presents additional information about the directors. The mailing address for each director is 4500 Main Street, Kansas City, Missouri 64111.
|
| | | | | |
Name
(Year of Birth) | Position(s) Held with Funds | Length of Time Served | Principal Occupation(s) During Past 5 Years | Number of American Century Portfolios Overseen by Director | Other Directorships Held During Past 5 Years |
| Independent Directors |
|
|
Barry Fink
(1955) | Director | Since 2012 (independent since 2016) | Retired; Executive Vice President, ACC (2007 to 2013); President, ACS (2007 to 2013); Chief Operating Officer, ACC (2007 to 2012) | 81 | None |
Andrea C. Hall
(1945) | Director | Since 1997 | Retired | 81 | None |
Jan M. Lewis
(1957) | Director | Since 2011 | Retired; President and Chief Executive Officer, Catholic Charities of Northeast Kansas (human services organization) (2006 to 2013) | 81 | None |
James A. Olson
(1942) | Director and Chairman of the Board | Since 2007 (Chairman since 2014) | Member, Plaza Belmont LLC (private equity fund manager) (1999 to present) | 81 | Saia, Inc. (2002 to 2012) and EPR Properties (2003 to 2013) |
M. Jeannine Strandjord
(1945) | Director | Since 1994 | Retired | 81 | Euronet Worldwide Inc.; MGP Ingredients, Inc.; and DST Systems Inc. (1996 to 2012) |
|
| | | | | |
Name
(Year of Birth) | Position(s) Held with Funds | Length of Time Served | Principal Occupation(s) During Past 5 Years | Number of American Century Portfolios Overseen by Director | Other Directorships Held During Past 5 Years |
| Independent Directors |
|
|
John R. Whitten
(1946) | Director | Since 2008 | Retired | 81 | Rudolph Technologies, Inc. |
Stephen E. Yates
(1948) | Director | Since 2012 | Retired | 81 | None |
| Interested Director |
|
|
Jonathan S. Thomas
(1963) | Director and President | Since 2007 | President and Chief Executive Officer, ACC (2007 to present). Also serves as Chief Executive Officer, ACS; Executive Vice President, ACIM; Director, ACC, ACIM and other ACC subsidiaries | 126 | BioMed Valley Discoveries, Inc. |
The Statement of Additional Information has additional information about the fund's directors and is available without charge, upon request, by calling 1-800-378-9878.
Officers
The following table presents certain information about the executive officers of the funds. Each officer serves as an officer for each of the 15 investment companies in the American Century family of funds, unless otherwise noted. No officer is compensated for his or her service as an officer of the funds. The listed officers are interested persons of the funds and are appointed or re-appointed on an annual basis. The mailing address for each officer listed below is 4500 Main Street, Kansas City, Missouri 64111.
|
| | |
Name
(Year of Birth) | Offices with the Funds | Principal Occupation(s) During the Past Five Years |
Jonathan S. Thomas
(1963) | Director and President since 2007 | President and Chief Executive Officer, ACC (2007 to present). Also serves as Chief Executive Officer, ACS; Executive Vice President, ACIM; Director, ACC, ACIM and other ACC subsidiaries |
Amy D. Shelton
(1964) | Chief Compliance Officer and Vice President since 2014 | Chief Compliance Officer, American Century funds, (2014 to present); Chief Compliance Officer, ACIM (2014 to present); Chief Compliance Officer, ACIS (2009 to present); Vice President, Client Interactions and Marketing, ACIS (2013 to 2014); Director, Client Interactions and Marketing, ACIS (2007 to 2013). Also serves as Vice President, ACIS |
Charles A. Etherington
(1957) | General Counsel since 2007 and Senior Vice President since 2006 | Attorney, ACC (1994 to present); Vice President, ACC (2005 to present); General Counsel, ACC (2007 to present). Also serves as General Counsel, ACIM, ACS, ACIS and other ACC subsidiaries; and Senior Vice President, ACIM and ACS |
C. Jean Wade
(1964) | Vice President,Treasurer and Chief Financial Officer since 2012 | Vice President, ACS (2000 to present) |
Robert J. Leach
(1966) | Vice President since 2006 and Assistant Treasurer since 2012 | Vice President, ACS (2000 to present) |
David H. Reinmiller
(1963) | Vice President since 2000 | Attorney, ACC (1994 to present); Associate General Counsel, ACC (2001 to present). Also serves as Vice President, ACIM and ACS |
Ward D. Stauffer
(1960) | Secretary since 2005 | Attorney, ACC (2003 to present) |
Proxy Voting Policies
A description of the policies that the fund's investment advisor uses in exercising the voting rights associated with the securities purchased and/or held by the fund is available without charge, upon request, by calling 1-800-378-9878. It is also available on the "About Us" page of American Century Investments’ website at americancentury.com and on the Securities and Exchange Commission’s website at sec.gov. Information regarding how the investment advisor voted proxies relating to portfolio securities during the most recent 12-month period ended June 30 is available on the "About Us" page at americancentury.com. It is also available at sec.gov.
Quarterly Portfolio Disclosure
The fund files its complete schedule of portfolio holdings with the Securities and Exchange Commission (SEC) for the first and third quarters of each fiscal year on Form N-Q. The fund’s Forms N-Q are available on the SEC’s website at sec.gov, and may be reviewed and copied at the SEC’s Public Reference Room in Washington, DC. Information on the operation of the Public Reference Room may be obtained by calling 1-800-SEC-0330. The fund also makes its complete schedule of portfolio holdings for the most recent quarter of its fiscal year available on its website at ipro.americancentury.com (for Investment Professionals) and, upon request, by calling 1-800-378-9878.
Other Tax Information
The following information is provided pursuant to provisions of the Internal Revenue Code.
For the fiscal year ended December 31, 2016, the fund intends to pass through to shareholders foreign source income of $4,543,385 and foreign taxes paid of $404,814, or up to the maximum amount allowable, as a foreign tax credit. Foreign source income and foreign tax expense per outstanding share on December 31, 2016 are $0.2134 and $0.0190, respectively.
|
| | |
| |
| | | |
| Contact Us | americancentury.com | |
| Automated Information Line | 1-800-345-8765 | |
| Investment Professional Service Representatives | 1-800-345-6488 | |
| Telecommunications Relay Service for the Deaf | 711 | |
| | | |
| American Century Variable Portfolios, Inc. | |
| | | |
Investment Advisor: American Century Investment Management, Inc. Kansas City, Missouri | |
| | | |
| This report and the statements it contains are submitted for the general information of our shareholders. The report is not authorized for distribution to prospective investors unless preceded or accompanied by an effective prospectus. | |
| | | |
©2017 American Century Proprietary Holdings, Inc. All rights reserved.
CL-ANN-91441 1702 | |
|
| |
| | |
| | Annual Report |
| | |
| | December 31, 2016 |
| | |
| | VP Large Company Value Fund |
|
| | |
| Performance | 2 |
|
| Portfolio Commentary | |
|
| Fund Characteristics | |
|
| Shareholder Fee Example | |
|
| Schedule of Investments | |
|
| Statement of Assets and Liabilities | |
|
| Statement of Operations | |
|
| Statement of Changes in Net Assets | |
|
| Notes to Financial Statements | |
|
| Financial Highlights | |
|
| Report of Independent Registered Public Accounting Firm | |
|
| Management | |
|
| Additional Information | |
|
Any opinions expressed in this report reflect those of the author as of the date of the report, and do not necessarily represent the opinions of American Century Investments® or any other person in the American Century Investments organization. Any such opinions are subject to change at any time based upon market or other conditions and American Century Investments disclaims any responsibility to update such opinions. These opinions may not be relied upon as investment advice and, because investment decisions made by American Century Investments funds are based on numerous factors, may not be relied upon as an indication of trading intent on behalf of any American Century Investments fund. Security examples are used for representational purposes only and are not intended as recommendations to purchase or sell securities. Performance information for comparative indices and securities is provided to American Century Investments by third party vendors. To the best of American Century Investments’ knowledge, such information is accurate at the time of printing.
|
| | | | | |
| Total Returns as of December 31, 2016 |
| | | | Average Annual Returns | |
| | Ticker Symbol | 1 year | 5 years | 10 years | Inception Date |
| Class II | AVVTX | 15.02% | 13.66% | 4.61% | 10/29/04 |
| Russell 1000 Value Index | — | 17.34% | 14.78% | 5.72% | — |
| S&P 500 Index | — | 11.96% | 14.64% | 6.94% | — |
| Class I | AVVIX | 15.25% | 13.81% | 4.77% | 12/1/04 |
Fund returns would have been lower if a portion of the fees had not been waived.
The performance information presented does not include charges and deductions imposed by the insurance company separate account under the variable annuity or variable life insurance contracts. The inclusion of such charges could significantly lower performance. Please refer to the insurance company separate account prospectus for a discussion of the charges related to insurance contracts.
Data presented reflect past performance. Past performance is no guarantee of future results. Current performance may be higher or lower than the performance shown. Total returns for periods less than one year are not annualized. Investment return and principal value will fluctuate, and redemption value may be more or less than original cost. Data assumes reinvestment of dividends and capital gains, and none of the charts reflect the deduction of taxes that a shareholder would pay on fund distributions or the redemption of fund shares. To obtain performance data current to the most recent month end, please call 1-800-345-6488 or visit ipro.americancentury.com (for Investment Professionals). For additional information about the fund, please consult the prospectus.
|
|
| Growth of $10,000 Over 10 Years |
| $10,000 investment made December 31, 2006 |
| Performance for other share classes will vary due to differences in fee structure. |
|
| |
| Value on December 31, 2016 |
| | Class II — $15,699 |
| |
| | Russell 1000 Value Index — $17,444 |
| |
| | S&P 500 Index — $19,572 |
| |
Ending value of Class II would have been lower if a portion of the fees had not been waived.
|
| |
| Total Annual Fund Operating Expenses |
| Class I | Class II |
| 0.91% | 1.06% |
The total annual fund operating expenses shown is as stated in the fund’s prospectus current as of the date of this report. The prospectus may vary from the expense ratio shown elsewhere in this report because it is based on a different time period, includes acquired fund fees and expenses, and, if applicable, does not include fee waivers or expense reimbursements.
Data presented reflect past performance. Past performance is no guarantee of future results. Current performance may be higher or lower than the performance shown. Total returns for periods less than one year are not annualized. Investment return and principal value will fluctuate, and redemption value may be more or less than original cost. Data assumes reinvestment of dividends and capital gains, and none of the charts reflect the deduction of taxes that a shareholder would pay on fund distributions or the redemption of fund shares. To obtain performance data current to the most recent month end, please call 1-800-345-6488 or visit ipro.americancentury.com (for Investment Professionals). For additional information about the fund, please consult the prospectus.
Portfolio Managers: Brendan Healy and Brian Woglom
Performance Summary
VP Large Company Value returned 15.02%* for the 12 months ended December 31, 2016. By comparison, its benchmark, the Russell 1000 Value Index, returned 17.34%. The broader market, as measured by the S&P 500 Index, returned 11.96%. The fund’s return reflects operating expenses, while the indices' returns do not.
After a tumultuous first quarter, U.S. stocks delivered solid returns in 2016. This was attributable to positive U.S. economic news, healthy corporate earnings performance, and a pickup in mergers and acquisitions. The energy market stabilized after a sell-off early in the year. Similarly, other commodity prices stabilized due to reduced concerns over global economic growth, which led to strong returns in the materials sector. In the fourth quarter, the market staged a strong rally after Donald Trump’s election raised expectations for corporate tax cuts and regulation rollbacks. The Federal Reserve raised its target rate by 25 basis points in mid-December and hinted at additional rate hikes in 2017. As a result, the yield curve steepened, which was a boon for banks.
In this environment, VP Large Company Value provided positive absolute results in every sector in which it was invested, except for real estate. Energy, industrials, and financials holdings were the best contributors. The portfolio’s performance relative to the Russell 1000 Value Index was hampered by stock selection and positioning in the health care sector, as the sector was pressured by political rhetoric about prescription drug pricing and concerns following the election that the Affordable Care Act might be repealed. Stock selection in industrials was the largest relative contributor. Stock choices among information technology companies and a significant underweight to real estate were also beneficial.
Top Detractors
CVS Health, a retail pharmacy and health care company, declined after the company provided much lighter-than-expected 2016 fiscal year guidance as a result of two lost contracts, which will have a larger impact on margins and earnings than the consensus was anticipating. We view this as a transitory issue.
Non-benchmark holding Teva Pharmaceutical Industries declined due to generic drug pricing worries and negative sentiment surrounding pharmaceutical stocks. Worries about Teva’s biggest specialty drug, Copaxone, and when its patent will expire have also weighed on the stock. We believe that the worst of the generic pricing headwind has passed and that the worst-case scenario for Copaxone is priced into the stock. Allergan also detracted, largely due to pharmaceutical industry pricing worries.
Although the portfolio was overweight in JPMorgan Chase on average during the year, our underweight position in the fourth quarter hurt relative performance. Like other banks, JPMorgan Chase rose due to higher interest rates, a steeper yield curve, the potential for lower corporate tax rates, optimism for economic growth and better credit, and the potential for an easing regulatory burden for financial companies.
*All fund returns referenced in this commentary are for Class II shares. Fund returns would have been lower if a portion of the fees had not been waived. Performance for other share classes will vary due to differences in fee structure; when Class II performance exceeds that of the fund's benchmark, other share classes may not. See page 2 for returns for all share classes.
Elsewhere, portfolio-only holding Delphi Automotive detracted. The automobile components manufacturer fell early in the year on concerns that auto sales may have peaked, weakening the outlook for auto parts suppliers. The stock also underperformed following the U.K.’s vote to leave the European Union on worries about the potential impact on the company’s European business. The stock rebounded somewhat later in the year, and we continue to have a favorable view of the secular opportunities for automation, safety, fuel efficiency, and connectivity.
Top Contributors
In the industrials sector, an overweight position in Ingersoll-Rand helped relative performance. The company’s exposure to the commercial heating, ventilation, and air conditioning industry and productivity/self-help initiatives helped offset industrial weakness to bolster its stock price. Before the election, the stock was benefiting from the recovery in nonresidential construction. Since the election, the stock rose due to potential infrastructure spending and the potential for a stronger economy. General Electric was a top contributor due to the portfolio’s underweight allocation, as the stock underperformed other industrials following strong outperformance in 2015.
In the information technology sector, Applied Materials rose after the company experienced order strength for its equipment to manufacture semiconductors. The company also held an analyst day in mid-September that showed improvement in market share.
The portfolio’s energy stocks benefited from rising oil prices. Equity markets rewarded Anadarko Petroleum, an energy exploration and production company with global operations (both onshore and offshore). The company was a significant contributor as it executed asset sales that strengthened its balance sheet and made a valuable acquisition at a heavily discounted price.
As noted earlier, financials in general registered strong gains in the wake of the U.S. presidential election. Several of the portfolio’s top contributors were financial stocks, including BB&T and Bank of New York Mellon.
Outlook
We continue to be bottom-up investment managers, evaluating each company individually and building the portfolio one stock at a time. Health care is by far the largest overweight in the portfolio. Political rhetoric around health care pressured health care stocks, and the threat of mandated lower drug pricing pressured pharmaceutical companies. This created the opportunity to add stocks of those companies we believe will fare well in the future.
The portfolio’s largest underweights are in real estate, telecommunication services, and utilities. We believe that real estate has generally been overvalued for some time, leading to the portfolio’s continued underweight. In the telecommunication services and utilities sectors, we believe that valuations are overextended after the sectors outperformed due to heavy interest from yield-seeking investors.
|
| |
| DECEMBER 31, 2016 |
| Top Ten Holdings | % of net assets |
| Wells Fargo & Co. | 3.5% |
| Pfizer, Inc. | 3.2% |
| Schlumberger Ltd. | 3.0% |
| TOTAL SA ADR | 2.8% |
| Procter & Gamble Co. (The) | 2.7% |
| Chevron Corp. | 2.6% |
| Bank of America Corp. | 2.5% |
| Johnson Controls International plc | 2.4% |
| Oracle Corp. | 2.4% |
| U.S. Bancorp | 2.4% |
| | |
| Top Five Industries | % of net assets |
| Banks | 15.2% |
| Oil, Gas and Consumable Fuels | 11.8% |
| Pharmaceuticals | 8.1% |
| Capital Markets | 5.2% |
| Health Care Equipment and Supplies | 4.6% |
| | |
| Types of Investments in Portfolio | % of net assets |
| Domestic Common Stocks | 92.7% |
| Foreign Common Stocks* | 5.8% |
| Exchange-Traded Funds | 0.6% |
| Total Equity Exposure | 99.1% |
| Temporary Cash Investments | 0.9% |
| Other Assets and Liabilities | —** |
*Includes depositary shares, dual listed securities and foreign ordinary shares.
**Category is less than 0.05% of total net assets.
Fund shareholders may incur two types of costs: (1) transaction costs, including sales charges (loads) on purchase payments and redemption/exchange fees; and (2) ongoing costs, including management fees; distribution and service (12b-1) fees; and other fund expenses. This example is intended to help you understand your ongoing costs (in dollars) of investing in your fund and to compare these costs with the ongoing cost of investing in other mutual funds.
The example is based on an investment of $1,000 made at the beginning of the period and held for the entire period from July 1, 2016 to December 31, 2016.
Actual Expenses
The table provides information about actual account values and actual expenses for each class. You may use the information, together with the amount you invested, to estimate the expenses that you paid over the period. First, identify the share class you own. Then simply divide your account value by $1,000 (for example, an $8,600 account value divided by $1,000 = 8.6), then multiply the result by the number under the heading “Expenses Paid During Period” to estimate the expenses you paid on your account during this period.
Hypothetical Example for Comparison Purposes
The table also provides information about hypothetical account values and hypothetical expenses based on the actual expense ratio of each class of your fund and an assumed rate of return of 5% per year before expenses, which is not the actual return of a fund’s share class. The hypothetical account values and expenses may not be used to estimate the actual ending account balance or expenses you paid for the period. You may use this information to compare the ongoing costs of investing in your fund and other funds. To do so, compare this 5% hypothetical example with the 5% hypothetical examples that appear in the shareholder reports of the other funds.
Please note that the expenses shown in the table are meant to highlight your ongoing costs only and do not reflect any transactional costs, such as sales charges (loads) or redemption/exchange fees. Therefore, the table is useful in comparing ongoing costs only, and will not help you determine the relative total costs of owning different funds. In addition, if these transactional costs were included, your costs would have been higher.
|
| | | | |
| | Beginning
Account Value
7/1/16 | Ending
Account Value
12/31/16 | Expenses Paid
During Period(1)
7/1/16 - 12/31/16 |
Annualized
Expense Ratio(1) |
| Actual | | | | |
| Class I (after waiver) | $1,000 | $1,110.00 | $4.19 | 0.79% |
| Class I (before waiver) | $1,000 | $1,110.00(2) | $4.77 | 0.90% |
| Class II (after waiver) | $1,000 | $1,108.40 | $4.98 | 0.94% |
| Class II (before waiver) | $1,000 | $1,108.40(2) | $5.56 | 1.05% |
| Hypothetical | | | | |
| Class I (after waiver) | $1,000 | $1,021.17 | $4.01 | 0.79% |
| Class I (before waiver) | $1,000 | $1,020.61 | $4.57 | 0.90% |
| Class II (after waiver) | $1,000 | $1,020.41 | $4.77 | 0.94% |
| Class II (before waiver) | $1,000 | $1,019.86 | $5.33 | 1.05% |
| |
| (1) | Expenses are equal to the class's annualized expense ratio listed in the table above, multiplied by the average account value over the period, multiplied by 184, the number of days in the most recent fiscal half-year, divided by 366, to reflect the one-half year period. |
| |
| (2) | Ending account value assumes the return earned after waiver and would have been lower if a portion of the fees had not been waived. |
DECEMBER 31, 2016
|
| | | | | |
| | Shares | Value |
| COMMON STOCKS — 98.5% | | |
| Aerospace and Defense — 3.6% | | |
| Boeing Co. (The) | 620 |
| $ | 96,522 |
|
| Textron, Inc. | 3,860 |
| 187,441 |
|
| United Technologies Corp. | 3,840 |
| 420,941 |
|
| | | 704,904 |
|
| Auto Components — 1.5% | | |
| BorgWarner, Inc. | 1,640 |
| 64,682 |
|
| Delphi Automotive plc | 3,420 |
| 230,337 |
|
| | | 295,019 |
|
| Automobiles — 0.4% | | |
| Ford Motor Co. | 6,920 |
| 83,940 |
|
| Banks — 15.2% | | |
| Bank of America Corp. | 22,030 |
| 486,863 |
|
| BB&T Corp. | 8,430 |
| 396,378 |
|
| JPMorgan Chase & Co. | 4,700 |
| 405,563 |
|
| M&T Bank Corp. | 1,710 |
| 267,495 |
|
| PNC Financial Services Group, Inc. (The) | 2,520 |
| 294,739 |
|
| U.S. Bancorp | 9,010 |
| 462,844 |
|
| Wells Fargo & Co. | 12,380 |
| 682,262 |
|
| | | 2,996,144 |
|
| Beverages — 0.7% | | |
| PepsiCo, Inc. | 1,380 |
| 144,389 |
|
| Biotechnology — 0.7% | | |
| AbbVie, Inc. | 2,320 |
| 145,278 |
|
| Building Products — 2.4% | | |
| Johnson Controls International plc | 11,650 |
| 479,863 |
|
| Capital Markets — 5.2% | | |
| Ameriprise Financial, Inc. | 1,100 |
| 122,034 |
|
| Bank of New York Mellon Corp. (The) | 8,420 |
| 398,940 |
|
| BlackRock, Inc. | 660 |
| 251,156 |
|
| Invesco Ltd. | 8,090 |
| 245,451 |
|
| | | 1,017,581 |
|
| Chemicals — 1.1% | | |
| Dow Chemical Co. (The) | 3,710 |
| 212,286 |
|
| Communications Equipment — 2.2% | | |
| Cisco Systems, Inc. | 14,160 |
| 427,915 |
|
| Containers and Packaging — 0.5% | | |
| WestRock Co. | 1,870 |
| 94,940 |
|
| Diversified Telecommunication Services — 1.4% | | |
| Verizon Communications, Inc. | 5,190 |
| 277,042 |
|
| Electric Utilities — 3.7% | | |
| Edison International | 3,340 |
| 240,447 |
|
| PG&E Corp. | 2,100 |
| 127,617 |
|
| PPL Corp. | 3,560 |
| 121,218 |
|
| Xcel Energy, Inc. | 5,700 |
| 231,990 |
|
| | | 721,272 |
|
|
| | | | | |
| | Shares | Value |
| Electrical Equipment — 0.7% | | |
| Rockwell Automation, Inc. | 990 |
| $ | 133,056 |
|
| Electronic Equipment, Instruments and Components — 1.2% | | |
| TE Connectivity Ltd. | 3,470 |
| 240,402 |
|
| Energy Equipment and Services — 4.0% | | |
| Baker Hughes, Inc. | 3,050 |
| 198,159 |
|
| Schlumberger Ltd. | 6,990 |
| 586,810 |
|
| | | 784,969 |
|
| Equity Real Estate Investment Trusts (REITs) — 0.7% | | |
| Boston Properties, Inc. | 1,140 |
| 143,389 |
|
| Food and Staples Retailing — 3.6% | | |
| CVS Health Corp. | 3,890 |
| 306,960 |
|
| Wal-Mart Stores, Inc. | 5,790 |
| 400,205 |
|
| | | 707,165 |
|
| Food Products — 1.0% | | |
| Mondelez International, Inc., Class A | 4,320 |
| 191,506 |
|
| Health Care Equipment and Supplies — 4.6% | | |
| Abbott Laboratories | 6,640 |
| 255,043 |
|
| Baxter International, Inc. | 1,780 |
| 78,925 |
|
| Medtronic plc | 4,240 |
| 302,015 |
|
| Zimmer Biomet Holdings, Inc. | 2,550 |
| 263,160 |
|
| | | 899,143 |
|
| Health Care Providers and Services — 2.4% | | |
| Anthem, Inc. | 1,070 |
| 153,834 |
|
HCA Holdings, Inc.(1) | 2,370 |
| 175,427 |
|
| McKesson Corp. | 980 |
| 137,641 |
|
| | | 466,902 |
|
| Hotels, Restaurants and Leisure — 0.8% | | |
| Carnival Corp. | 1,860 |
| 96,831 |
|
| Marriott International, Inc., Class A | 810 |
| 66,971 |
|
| | | 163,802 |
|
| Household Products — 2.7% | | |
| Procter & Gamble Co. (The) | 6,310 |
| 530,545 |
|
| Industrial Conglomerates — 1.7% | | |
| General Electric Co. | 7,220 |
| 228,152 |
|
| Honeywell International, Inc. | 940 |
| 108,899 |
|
| | | 337,051 |
|
| Insurance — 4.5% | | |
| Aflac, Inc. | 1,450 |
| 100,920 |
|
| Allstate Corp. (The) | 2,060 |
| 152,687 |
|
| Chubb Ltd. | 3,330 |
| 439,960 |
|
| MetLife, Inc. | 3,650 |
| 196,698 |
|
| | | 890,265 |
|
| Machinery — 1.6% | | |
| Ingersoll-Rand plc | 4,090 |
| 306,914 |
|
| Media — 0.5% | | |
| Walt Disney Co. (The) | 1,030 |
| 107,347 |
|
| Multiline Retail — 0.8% | | |
| Target Corp. | 2,090 |
| 150,961 |
|
| Oil, Gas and Consumable Fuels — 11.8% | | |
| Anadarko Petroleum Corp. | 2,620 |
| 182,693 |
|
|
| | | | | |
| | Shares | Value |
| Chevron Corp. | 4,340 |
| $ | 510,818 |
|
| Exxon Mobil Corp. | 2,010 |
| 181,423 |
|
| Imperial Oil Ltd. | 9,480 |
| 329,803 |
|
| Occidental Petroleum Corp. | 5,870 |
| 418,120 |
|
| Royal Dutch Shell plc ADR | 2,590 |
| 150,142 |
|
| TOTAL SA ADR | 10,890 |
| 555,063 |
|
| | | 2,328,062 |
|
| Pharmaceuticals — 8.1% | | |
Allergan plc(1) | 800 |
| 168,008 |
|
| Johnson & Johnson | 2,340 |
| 269,591 |
|
| Merck & Co., Inc. | 7,110 |
| 418,566 |
|
| Pfizer, Inc. | 19,640 |
| 637,907 |
|
| Teva Pharmaceutical Industries Ltd. ADR | 2,780 |
| 100,775 |
|
| | | 1,594,847 |
|
| Road and Rail — 1.1% | | |
| Union Pacific Corp. | 2,010 |
| 208,397 |
|
| Semiconductors and Semiconductor Equipment — 3.1% | | |
| Applied Materials, Inc. | 9,000 |
| 290,430 |
|
| Intel Corp. | 4,310 |
| 156,324 |
|
| Lam Research Corp. | 1,530 |
| 161,767 |
|
| | | 608,521 |
|
| Software — 2.4% | | |
| Oracle Corp. | 12,190 |
| 468,705 |
|
| Specialty Retail — 1.3% | | |
| Advance Auto Parts, Inc. | 1,010 |
| 170,811 |
|
| Lowe's Cos., Inc. | 1,050 |
| 74,676 |
|
| | | 245,487 |
|
| Technology Hardware, Storage and Peripherals — 1.3% | | |
| Apple, Inc. | 2,160 |
| 250,171 |
|
TOTAL COMMON STOCKS
(Cost $15,854,817) | | 19,358,180 |
|
| EXCHANGE-TRADED FUNDS — 0.6% | | |
iShares Russell 1000 Value ETF
(Cost $118,818) | 1,050 |
| 117,632 |
|
| TEMPORARY CASH INVESTMENTS — 0.9% | | |
| Repurchase Agreement, Fixed Income Clearing Corp., (collateralized by various U.S. Treasury obligations, 3.75%, 11/15/43, valued at $107,533), at 0.10%, dated 12/30/16, due 1/3/17 (Delivery value $103,001) | | 103,000 |
|
| State Street Institutional U.S. Government Money Market Fund, Premier Class | 75,813 |
| 75,813 |
|
TOTAL TEMPORARY CASH INVESTMENTS
(Cost $178,813) | | 178,813 |
|
TOTAL INVESTMENT SECURITIES — 100.0%
(Cost $16,152,448) | | 19,654,625 |
|
OTHER ASSETS AND LIABILITIES† | | 5,398 |
|
| TOTAL NET ASSETS — 100.0% | | $ | 19,660,023 |
|
|
| | | | | | | | |
| FORWARD FOREIGN CURRENCY EXCHANGE CONTRACTS |
| Currency Purchased | Currency Sold | Counterparty | Settlement Date | Unrealized Appreciation
(Depreciation) |
| CAD | 13,231 | USD | 9,769 | Morgan Stanley | 3/31/17 | $ | 97 |
|
| USD | 295,074 | CAD | 394,697 | Morgan Stanley | 3/31/17 | 796 |
|
| EUR | 10,982 | USD | 11,522 | UBS AG | 3/31/17 | 89 |
|
| EUR | 13,968 | USD | 14,787 | UBS AG | 3/31/17 | (18 | ) |
| USD | 492,106 | EUR | 471,904 | UBS AG | 3/31/17 | (6,858 | ) |
| GBP | 4,331 | USD | 5,339 | Credit Suisse AG | 3/31/17 | 10 |
|
| USD | 130,065 | GBP | 104,767 | Credit Suisse AG | 3/31/17 | 667 |
|
| USD | 3,587 | GBP | 2,897 | Credit Suisse AG | 3/31/17 | 9 |
|
| | | | | | | $ | (5,208 | ) |
|
| | |
| NOTES TO SCHEDULE OF INVESTMENTS |
| ADR | - | American Depositary Receipt |
| CAD | - | Canadian Dollar |
| EUR | - | Euro |
| GBP | - | British Pound |
| USD | - | United States Dollar |
| |
| † | Category is less than 0.05% of total net assets. |
See Notes to Financial Statements.
|
|
| Statement of Assets and Liabilities |
|
| | | |
| DECEMBER 31, 2016 | |
| Assets | |
| Investment securities, at value (cost of $16,152,448) | $ | 19,654,625 |
|
| Cash | 1,652 |
|
| Foreign currency holdings, at value (cost of $3,308) | 2,781 |
|
| Receivable for investments sold | 36,347 |
|
| Receivable for capital shares sold | 906 |
|
| Unrealized appreciation on forward foreign currency exchange contracts | 1,668 |
|
| Dividends and interest receivable | 47,491 |
|
| | 19,745,470 |
|
| | |
| Liabilities | |
| Payable for investments purchased | 39,163 |
|
| Payable for capital shares redeemed | 24,908 |
|
| Unrealized depreciation on forward foreign currency exchange contracts | 6,876 |
|
| Accrued management fees | 12,422 |
|
| Distribution fees payable | 2,078 |
|
| | 85,447 |
|
| | |
| Net Assets | $ | 19,660,023 |
|
| | |
| Net Assets Consist of: | |
| Capital (par value and paid-in surplus) | $ | 15,296,806 |
|
| Undistributed net investment income | 61,175 |
|
| Undistributed net realized gain | 805,599 |
|
| Net unrealized appreciation | 3,496,443 |
|
| | $ | 19,660,023 |
|
|
| | | | | |
| | Net Assets | Shares Outstanding | Net Asset Value Per Share |
| Class I, $0.01 Par Value |
| $9,984,476 |
| 654,854 | $15.25 |
| Class II, $0.01 Par Value |
| $9,675,547 |
| 626,112 | $15.45 |
See Notes to Financial Statements.
|
| | | |
| YEAR ENDED DECEMBER 31, 2016 |
| Investment Income (Loss) |
| Income: | |
| Dividends (net of foreign taxes withheld of $5,175) | $ | 508,182 |
|
| Interest | 260 |
|
| | 508,442 |
|
| | |
| Expenses: | |
| Management fees | 153,571 |
|
| Distribution fees - Class II | 22,084 |
|
| Directors' fees and expenses | 593 |
|
| Other expenses | 268 |
|
| | 176,516 |
|
| Fees waived | (19,849 | ) |
| | 156,667 |
|
| | |
| Net investment income (loss) | 351,775 |
|
| | |
| Realized and Unrealized Gain (Loss) | |
| Net realized gain (loss) on: | |
| Investment transactions | 1,053,748 |
|
| Foreign currency transactions | 30,358 |
|
| | 1,084,106 |
|
| | |
| Change in net unrealized appreciation (depreciation) on: | |
| Investments | 1,182,790 |
|
| Translation of assets and liabilities in foreign currencies | (6,204 | ) |
| | 1,176,586 |
|
| | |
| Net realized and unrealized gain (loss) | 2,260,692 |
|
| | |
| Net Increase (Decrease) in Net Assets Resulting from Operations | $ | 2,612,467 |
|
See Notes to Financial Statements.
|
|
| Statement of Changes in Net Assets |
|
| | | | | | |
| YEARS ENDED DECEMBER 31, 2016 AND DECEMBER 31, 2015 |
| Increase (Decrease) in Net Assets | December 31, 2016 | December 31, 2015 |
| Operations | | |
| Net investment income (loss) | $ | 351,775 |
| $ | 257,112 |
|
| Net realized gain (loss) | 1,084,106 |
| 1,052,552 |
|
| Change in net unrealized appreciation (depreciation) | 1,176,586 |
| (2,245,805 | ) |
| Net increase (decrease) in net assets resulting from operations | 2,612,467 |
| (936,141 | ) |
| | | |
| Distributions to Shareholders | | |
| From net investment income: | | |
| Class I | (198,522 | ) | (144,696 | ) |
| Class II | (175,520 | ) | (123,961 | ) |
| From net realized gains: | | |
| Class I | (536,170 | ) | (13,866 | ) |
| Class II | (514,466 | ) | (15,099 | ) |
| Decrease in net assets from distributions | (1,424,678 | ) | (297,622 | ) |
| | | |
| Capital Share Transactions | | |
| Net increase (decrease) in net assets from capital share transactions (Note 5) | 963,487 |
| 1,680,464 |
|
| | | |
| Net increase (decrease) in net assets | 2,151,276 |
| 446,701 |
|
| | | |
| Net Assets | | |
| Beginning of period | 17,508,747 |
| 17,062,046 |
|
| End of period | $ | 19,660,023 |
| $ | 17,508,747 |
|
| | | |
| Undistributed net investment income | $ | 61,175 |
| $ | 72,366 |
|
See Notes to Financial Statements.
|
|
| Notes to Financial Statements |
DECEMBER 31, 2016
1. Organization
American Century Variable Portfolios, Inc. (the corporation) is registered under the Investment Company Act of 1940, as amended (the 1940 Act), as an open-end management investment company and is organized as a Maryland corporation. VP Large Company Value Fund (the fund) is one fund in a series issued by the corporation. The fund’s investment objective is to seek long-term capital growth. Income is a secondary objective.
The fund offers Class I and Class II. The share classes differ principally in their respective distribution and shareholder servicing expenses and arrangements. Class II is charged a lower unified management fee because it has a separate arrangement for distribution services.
2. Significant Accounting Policies
The following is a summary of significant accounting policies consistently followed by the fund in preparation of its financial statements. The fund is an investment company and follows accounting and reporting guidance in accordance with accounting principles generally accepted in the United States of America. This may require management to make certain estimates and assumptions at the date of the financial statements. Actual results could differ from these estimates. Management evaluated the impact of events or transactions occurring through the date the financial statements were issued that would merit recognition or disclosure.
Investment Valuations — The fund determines the fair value of its investments and computes its net asset value per share at the close of regular trading (usually 4 p.m. Eastern time) on the New York Stock Exchange (NYSE) on each day the NYSE is open. The Board of Directors has adopted valuation policies and procedures to guide the investment advisor in the fund’s investment valuation process and to provide methodologies for the oversight of the fund’s pricing function.
Equity securities that are listed or traded on a domestic securities exchange are valued at the last reported sales price or at the official closing price as provided by the exchange. Equity securities traded on foreign securities exchanges are generally valued at the closing price of such securities on the exchange where primarily traded or at the close of the NYSE, if that is earlier. If no last sales price is reported, or if local convention or regulation so provides, the mean of the latest bid and asked prices may be used. Securities traded over-the-counter are valued at the mean of the latest bid and asked prices, the last sales price, or the official closing price. Equity securities initially expressed in local currencies are translated into U.S. dollars at the mean of the appropriate currency exchange rate at the close of the NYSE as provided by an independent pricing service.
Open-end management investment companies are valued at the reported net asset value per share. Repurchase agreements are valued at cost, which approximates fair value. Forward foreign currency exchange contracts are valued at the mean of the appropriate forward exchange rate at the close of the NYSE as provided by an independent pricing service.
If the fund determines that the market price for an investment is not readily available or the valuation methods mentioned above do not reflect an investment’s fair value, such investment is valued as determined in good faith by the Board of Directors or its delegate, in accordance with policies and procedures adopted by the Board of Directors. In its determination of fair value, the fund may review several factors including, but not limited to, market information regarding the specific investment or comparable investments and correlation with other investment types, futures indices or general market indicators. Circumstances that may cause the fund to use these procedures to value an investment include, but are not limited to: an investment has been declared in default or is distressed; trading in a security has been suspended during the trading day or a security is not actively trading on its principal exchange; prices received from a regular pricing source are deemed unreliable; or there is a foreign market holiday and no trading occurred.
The fund monitors for significant events occurring after the close of an investment’s primary exchange but before the fund’s net asset value per share is determined. Significant events may include, but are not limited to: corporate announcements and transactions; governmental action and political unrest that could impact a specific investment or an investment sector; or armed conflicts, natural disasters and similar events that could
affect investments in a specific country or region. The fund also monitors for significant fluctuations between domestic and foreign markets, as evidenced by the U.S. market or such other indicators that the Board of Directors, or its delegate, deems appropriate. If significant fluctuations in foreign markets are identified, the fund may apply a model-derived factor to the closing price of equity securities traded on foreign securities exchanges. The factor is based on observable market data as provided by an independent pricing service.
Security Transactions — Security transactions are accounted for as of the trade date. Net realized gains and losses are determined on the identified cost basis, which is also used for federal income tax purposes.
Investment Income — Dividend income less foreign taxes withheld, if any, is recorded as of the ex-dividend date. Distributions received on securities that represent a return of capital or long-term capital gain are recorded as a reduction of cost of investments and/or as a realized gain. The fund may estimate the components of distributions received that may be considered nontaxable distributions or long-term capital gain distributions for income tax purposes. Interest income is recorded on the accrual basis and includes accretion of discounts and amortization of premiums.
Foreign Currency Translations — All assets and liabilities initially expressed in foreign currencies are translated into U.S. dollars at prevailing exchange rates at period end. The fund may enter into spot foreign currency exchange contracts to facilitate transactions denominated in a foreign currency. Purchases and sales of investment securities, dividend and interest income, spot foreign currency exchange contracts, and expenses are translated at the rates of exchange prevailing on the respective dates of such transactions. Net realized and unrealized foreign currency exchange gains or losses related to investment securities are a component of net realized gain (loss) on investment transactions and change in net unrealized appreciation (depreciation) on investments, respectively.
Repurchase Agreements — The fund may enter into repurchase agreements with institutions that American Century Investment Management, Inc. (ACIM) (the investment advisor) has determined are creditworthy pursuant to criteria adopted by the Board of Directors. The fund requires that the collateral, represented by securities, received in a repurchase transaction be transferred to the custodian in a manner sufficient to enable the fund to obtain those securities in the event of a default under the repurchase agreement. ACIM monitors, on a daily basis, the securities transferred to ensure the value, including accrued interest, of the securities under each repurchase agreement is equal to or greater than amounts owed to the fund under each repurchase agreement.
Joint Trading Account — Pursuant to an Exemptive Order issued by the Securities and Exchange Commission, the fund, along with certain other funds in the American Century Investments family of funds, may transfer uninvested cash balances into a joint trading account. These balances are invested in one or more repurchase agreements that are collateralized by U.S. Treasury or Agency obligations.
Income Tax Status — It is the fund’s policy to distribute substantially all net investment income and net realized gains to shareholders and to otherwise qualify as a regulated investment company under provisions of the Internal Revenue Code. Accordingly, no provision has been made for income taxes. The fund files U.S. federal, state, local and non-U.S. tax returns as applicable. The fund's tax returns are subject to examination by the relevant taxing authority until expiration of the applicable statute of limitations, which is generally three years from the date of filing but can be longer in certain jurisdictions. At this time, management believes there are no uncertain tax positions which, based on their technical merit, would not be sustained upon examination and for which it is reasonably possible that the total amounts of unrecognized tax benefits will significantly change in the next twelve months.
Multiple Class — All shares of the fund represent an equal pro rata interest in the net assets of the class to which such shares belong, and have identical voting, dividend, liquidation and other rights and the same terms and conditions, except for class specific expenses and exclusive rights to vote on matters affecting only individual classes. Income, non-class specific expenses, and realized and unrealized capital gains and losses of the fund are allocated to each class of shares based on their relative net assets.
Distributions to Shareholders — Distributions from net investment income, if any, are generally declared and paid quarterly. Distributions from net realized gains, if any, are generally declared and paid annually.
Indemnifications — Under the corporation’s organizational documents, its officers and directors are indemnified against certain liabilities arising out of the performance of their duties to the fund. In addition, in the normal course of business, the fund enters into contracts that provide general indemnifications. The maximum exposure under these arrangements is unknown as this would involve future claims that may be made against a fund. The risk of material loss from such claims is considered by management to be remote.
3. Fees and Transactions with Related Parties
Certain officers and directors of the corporation are also officers and/or directors of American Century Companies, Inc. (ACC). The corporation’s investment advisor, ACIM, the corporation's distributor, American Century Investment Services, Inc. (ACIS), and the corporation’s transfer agent, American Century Services, LLC, are wholly owned, directly or indirectly, by ACC.
Management Fees — The corporation has entered into a management agreement with ACIM, under which ACIM provides the fund with investment advisory and management services in exchange for a single, unified management fee (the fee) per class. The agreement provides that all expenses of managing and operating the fund, except distribution fees, brokerage expenses, taxes, interest, fees and expenses of the independent directors (including legal counsel fees), and extraordinary expenses, will be paid by ACIM. The fee is computed and accrued daily based on each class’s daily net assets and paid monthly in arrears. The rate of the fee is determined by applying a fee rate calculation formula. This formula takes into account the fund’s assets as well as certain assets, if any, of other clients of the investment advisor outside the American Century Investments family of funds (such as subadvised funds and separate accounts) that have very similar investment teams and investment strategies (strategy assets). The annual management fee schedule ranges from 0.70% to 0.90% for Class I and from 0.60% to 0.80% for Class II. During the year ended December 31, 2016, the investment advisor agreed to waive 0.11% of the fund's management fee. The investment advisor expects this waiver to continue until July 31, 2017, and cannot terminate it prior to such date without the approval of the Board of Directors. The total amount of the waiver for each class for the year ended December 31, 2016 was $10,132 and $9,717 for Class I and Class II, respectively. The effective annual management fee before waiver for each class for the year ended December 31, 2016 was 0.90% and 0.80% for Class I and Class II, respectively. The effective annual management fee after waiver for each class for the year ended December 31, 2016 was 0.79% and 0.69% for Class I and Class II, respectively.
Distribution Fees — The Board of Directors has adopted the Master Distribution Plan (the plan) for Class II, pursuant to Rule 12b-1 of the 1940 Act. The plan provides that Class II will pay ACIS an annual distribution fee equal to 0.25%. The fee is computed and accrued daily based on the Class II daily net assets and paid monthly in arrears. The distribution fee provides compensation for expenses incurred in connection with distributing shares of Class II including, but not limited to, payments to brokers, dealers, and financial institutions that have entered into sales agreements with respect to shares of the fund. Fees incurred under the plan during the year ended December 31, 2016 are detailed in the Statement of Operations.
Directors' Fees and Expenses — The Board of Directors is responsible for overseeing the investment advisor’s management and operations of the fund. The directors receive detailed information about the fund and its investment advisor regularly throughout the year, and meet at least quarterly with management of the investment advisor to review reports about fund operations. The fund’s officers do not receive compensation from the fund.
Interfund Transactions — The fund may enter into security transactions with other American Century Investments funds and other client accounts of the investment advisor, in accordance with the 1940 Act rules and procedures adopted by the Board of Directors. The rules and procedures require, among other things, that these transactions be effected at the independent current market price of the security. During the period, the interfund purchases and sales were $208,097 and $93,693, respectively. The effect of interfund transactions on the Statement of Operations was $(5,063) in net realized gain (loss) on investment transactions.
4. Investment Transactions
Purchases and sales of investment securities, excluding short-term investments, for the year ended December 31, 2016 were $13,767,870 and $13,947,768, respectively.
5. Capital Share Transactions
Transactions in shares of the fund were as follows:
|
| | | | | | | | | |
| | Year ended
December 31, 2016 | Year ended December 31, 2015 |
| | Shares | Amount | Shares | Amount |
| Class I/Shares Authorized | 50,000,000 | | 50,000,000 |
| |
| Sold | 87,113 | $ | 1,228,987 |
| 324,255 |
| $ | 4,973,581 |
|
| Issued in reinvestment of distributions | 53,925 | 734,692 |
| 10,723 |
| 158,562 |
|
| Redeemed | (90,374) | (1,289,270) |
| (226,277) |
| (3,285,759) |
|
| | 50,664 | 674,409 |
| 108,701 |
| 1,846,384 |
|
| Class II/Shares Authorized | 50,000,000 | | 50,000,000 |
| |
| Sold | 162,594 | 2,358,352 |
| 137,356 |
| 2,072,112 |
|
| Issued in reinvestment of distributions | 50,007 | 689,986 |
| 9,271 |
| 139,060 |
|
| Redeemed | (191,644) | (2,759,260) |
| (158,581) |
| (2,377,092) |
|
| | 20,957 | 289,078 |
| (11,954 | ) | (165,920 | ) |
| Net increase (decrease) | 71,621 | $ | 963,487 |
| 96,747 |
| $ | 1,680,464 |
|
6. Fair Value Measurements
The fund’s investments valuation process is based on several considerations and may use multiple inputs to determine the fair value of the investments held by the fund. In conformity with accounting principles generally accepted in the United States of America, the inputs used to determine a valuation are classified into three broad levels.
| |
| • | Level 1 valuation inputs consist of unadjusted quoted prices in an active market for identical investments. |
| |
| • | Level 2 valuation inputs consist of direct or indirect observable market data (including quoted prices for comparable investments, evaluations of subsequent market events, interest rates, prepayment speeds, credit risk, etc.). These inputs also consist of quoted prices for identical investments initially expressed in local currencies that are adjusted through translation into U.S. dollars. |
| |
| • | Level 3 valuation inputs consist of unobservable data (including a fund’s own assumptions). |
The level classification is based on the lowest level input that is significant to the fair valuation measurement. The valuation inputs are not necessarily an indication of the risks associated with investing in these securities or other financial instruments. There were no significant transfers between levels during the period.
The following is a summary of the level classifications as of period end. The Schedule of Investments provides additional information on the fund’s portfolio holdings.
|
| | | | | | | | |
| | Level 1 | Level 2 | Level 3 |
| Assets | | | |
| Investment Securities | | | |
| Common Stocks | $ | 19,028,377 |
| $ | 329,803 |
| — |
|
| Exchange-Traded Funds | 117,632 |
| — |
| — |
|
| Temporary Cash Investments | 75,813 |
| 103,000 |
| — |
|
| | $ | 19,221,822 |
| $ | 432,803 |
| — |
|
| Other Financial Instruments | | | |
| Forward Foreign Currency Exchange Contracts | — |
| $ | 1,668 |
| — |
|
| | | | |
| Liabilities | | | |
| Other Financial Instruments | | | |
| Forward Foreign Currency Exchange Contracts | — |
| $ | 6,876 |
| — |
|
7. Derivative Instruments
Foreign Currency Risk — The fund is subject to foreign currency exchange rate risk in the normal course of pursuing its investment objectives. The value of foreign investments held by a fund may be significantly affected by changes in foreign currency exchange rates. The dollar value of a foreign security generally decreases when the value of the dollar rises against the foreign currency in which the security is denominated and tends to increase when the value of the dollar declines against such foreign currency. A fund may enter into forward foreign currency exchange contracts to reduce a fund's exposure to foreign currency exchange rate fluctuations. The net U.S. dollar value of foreign currency underlying all contractual commitments held by a fund and the resulting unrealized appreciation or depreciation are determined daily. Realized gain or loss is recorded upon the termination of the contract. Net realized and unrealized gains or losses occurring during the holding period of forward foreign currency exchange contracts are a component of net realized gain (loss) on foreign currency transactions and change in net unrealized appreciation (depreciation) on translation of assets and liabilities in foreign currencies, respectively. A fund bears the risk of an unfavorable change in the foreign currency exchange rate underlying the forward contract. Additionally, losses, up to the fair value, may arise if the counterparties do not perform under the contract terms. The fund's average U.S. dollar exposure to foreign currency risk derivative instruments held during the period was $834,302.
The value of foreign currency risk derivative instruments as of December 31, 2016, is disclosed on the Statement of Assets and Liabilities as an asset of $1,668 in unrealized appreciation on forward foreign currency exchange contracts and a liability of $6,876 in unrealized depreciation on forward foreign currency exchange contracts. For the year ended December 31, 2016, the effect of foreign currency risk derivative instruments on the Statement of Operations was $30,372 in net realized gain (loss) on foreign currency transactions and $(6,187) in change in net unrealized appreciation (depreciation) on translation of assets and liabilities in foreign currencies.
8. Risk Factors
There are certain risks involved in investing in foreign securities. These risks include those resulting from future adverse political, social and economic developments, fluctuations in currency exchange rates, the possible imposition of exchange controls, and other foreign laws or restrictions.
9. Federal Tax Information
The tax character of distributions paid during the years ended December 31, 2016 and December 31, 2015 were as follows:
|
| | | | | | |
| | 2016 | 2015 |
| Distributions Paid From | | |
| Ordinary income | $ | 374,042 |
| $ | 268,657 |
|
| Long-term capital gains | $ | 1,050,636 |
| $ | 28,965 |
|
The book-basis character of distributions made during the year from net investment income or net realized gains may differ from their ultimate characterization for federal income tax purposes. These differences reflect the differing character of certain income items and net realized gains and losses for financial statement and tax purposes, and may result in reclassification among certain capital accounts on the financial statements.
As of December 31, 2016, the federal tax cost of investments and the components of distributable earnings on a tax-basis were as follows: |
| | | |
| Federal tax cost of investments | $ | 16,429,448 |
|
| Gross tax appreciation of investments | $ | 3,420,488 |
|
| Gross tax depreciation of investments | (195,311 | ) |
| Net tax appreciation (depreciation) of investments | 3,225,177 |
|
Net tax appreciation (depreciation) on derivatives and translation of assets and liabilities in foreign currencies | (526 | ) |
| Net tax appreciation (depreciation) | $ | 3,224,651 |
|
| Undistributed ordinary income | $ | 55,967 |
|
| Accumulated long-term gains | $ | 1,082,599 |
|
The difference between book-basis and tax-basis unrealized appreciation (depreciation) is attributable primarily to the tax deferral of losses on wash sales.
10. Recently Issued Accounting Guidance
In October 2016, the Securities and Exchange Commission adopted new rules and forms as well as amendments to its rules and forms to modernize the reporting and disclosure of information by registered investment companies. The amendments to Regulation S-X will require standardized, enhanced disclosure about derivatives in investment company financial statements, as well as other provisions. Compliance with the amendments is effective on August 1, 2017. Management is currently evaluating the impact that adopting the amendments will have on the financial statement disclosures.
|
| | | | | | | | | | | | | | | | | |
| For a Share Outstanding Throughout the Years Ended December 31 (except as noted) | |
| Per-Share Data | | | | | | Ratios and Supplemental Data | |
| | | Income From Investment Operations: | Distributions From: | | | Ratio to Average Net Assets of: | |
| | Net Asset
Value,
Beginning
of Period | Net
Investment
Income
(Loss)(1) | Net
Realized
and
Unrealized
Gain (Loss) | Total From
Investment
Operations | Net
Investment
Income | Net
Realized
Gains | Total
Distributions | Net Asset
Value,
End
of Period | Total
Return(2) | Operating
Expenses | Operating
Expenses
(before
expense
waiver) | Net
Investment
Income
(Loss) | Net Investment
Income (Loss)
(before expense waiver) | Portfolio
Turnover
Rate | Net
Assets,
End of
Period
(in thousands) |
| Class I | | | | | | | | | | | | | | |
| 2016 | $14.39 | 0.29 | 1.75 | 2.04 | (0.31) | (0.87) | (1.18) | $15.25 | 15.25% | 0.79% | 0.90% | 2.03% | 1.92% | 77% |
| $9,984 |
|
| 2015 | $15.23 | 0.22 | (0.81) | (0.59) | (0.23) | (0.02) | (0.25) | $14.39 | (3.89)% | 0.80% | 0.91% | 1.43% | 1.32% | 63% |
| $8,693 |
|
| 2014 | $13.69 | 0.21 | 1.54 | 1.75 | (0.21) | — | (0.21) | $15.23 | 12.87% | 0.80% | 0.90% | 1.47% | 1.37% | 70% |
| $7,547 |
|
| 2013 | $10.58 | 0.20 | 3.10 | 3.30 | (0.19) | — | (0.19) | $13.69 | 31.33% | 0.86% | 0.91% | 1.64% | 1.59% | 61% |
| $6,795 |
|
| 2012 | $9.26 | 0.19 | 1.32 | 1.51 | (0.19) | — | (0.19) | $10.58 | 16.40% | 0.90% | 0.91% | 1.89% | 1.88% | 65% |
| $4,997 |
|
| Class II | | | | | | | | | | | | | | |
| 2016 | $14.57 | 0.27 | 1.77 | 2.04 | (0.29) | (0.87) | (1.16) | $15.45 | 15.02% | 0.94% | 1.05% | 1.88% | 1.77% | 77% |
| $9,676 |
|
| 2015 | $15.42 | 0.19 | (0.81) | (0.62) | (0.21) | (0.02) | (0.23) | $14.57 | (4.05)% | 0.95% | 1.06% | 1.28% | 1.17% | 63% |
| $8,816 |
|
| 2014 | $13.86 | 0.19 | 1.56 | 1.75 | (0.19) | — | (0.19) | $15.42 | 12.77% | 0.95% | 1.05% | 1.32% | 1.22% | 70% |
| $9,515 |
|
| 2013 | $10.71 | 0.19 | 3.13 | 3.32 | (0.17) | — | (0.17) | $13.86 | 31.04% | 1.01% | 1.06% | 1.49% | 1.44% | 61% |
| $8,207 |
|
| 2012 | $9.36 | 0.18 | 1.35 | 1.53 | (0.18) | — | (0.18) | $10.71 | 16.37% | 1.05% | 1.06% | 1.74% | 1.73% | 65% |
| $5,275 |
|
|
| | | | |
| Notes to Financial Highlights | | |
| |
| (1) | Computed using average shares outstanding throughout the period. |
| |
| (2) | Total returns are calculated based on the net asset value of the last business day. Total returns for periods less than one year are not annualized. |
See Notes to Financial Statements.
|
|
| Report of Independent Registered Public Accounting Firm |
To the Board of Directors and Shareholders of American Century Variable Portfolios, Inc.:
We have audited the accompanying statement of assets and liabilities, including the schedule of investments, of VP Large Company Value Fund (the “Fund”), one of the funds constituting American Century Variable Portfolios, Inc., as of December 31, 2016, and the related statement of operations for the year then ended, the statements of changes in net assets for each of the two years in the period then ended, and the financial highlights for each of the five years in the period then ended. These financial statements and financial highlights are the responsibility of the Fund’s management. Our responsibility is to express an opinion on these financial statements and financial highlights based on our audits.
We conducted our audits in accordance with the standards of the Public Company Accounting Oversight Board (United States). Those standards require that we plan and perform the audit to obtain reasonable assurance about whether the financial statements and financial highlights are free of material misstatement. The Fund is not required to have, nor were we engaged to perform, an audit of its internal control over financial reporting. Our audits included consideration of internal control over financial reporting as a basis for designing audit procedures that are appropriate in the circumstances, but not for the purpose of expressing an opinion on the effectiveness of the Fund’s internal control over financial reporting. Accordingly, we express no such opinion. An audit also includes examining, on a test basis, evidence supporting the amounts and disclosures in the financial statements, assessing the accounting principles used and significant estimates made by management, as well as evaluating the overall financial statement presentation. Our procedures included confirmation of securities owned as of December 31, 2016, by correspondence with the custodian and brokers; when replies were not received from brokers, we performed other auditing procedures. We believe that our audits provide a reasonable basis for our opinion.
In our opinion, the financial statements and financial highlights referred to above present fairly, in all material respects, the financial position of VP Large Company Value Fund of American Century Variable Portfolios, Inc. as of December 31, 2016, the results of its operations for the year then ended, the changes in its net assets for each of the two years in the period then ended, and the financial highlights for each of the five years in the period then ended, in conformity with accounting principles generally accepted in the United States of America.
DELOITTE & TOUCHE LLP
Kansas City, Missouri
February 10, 2017
The Board of Directors
The individuals listed below serve as directors of the funds. Each director will continue to serve in this capacity until death, retirement, resignation or removal from office. The board has adopted a mandatory retirement age for directors who are not “interested persons,” as that term is defined in the Investment Company Act (independent directors). Independent directors shall retire by December 31 of the year in which they reach their 75th birthday.
Mr. Thomas is an “interested person” because he currently serves as President and Chief Executive Officer of American Century Companies, Inc. (ACC), the parent company of American Century Investment Management, Inc. (ACIM or the advisor). The other directors (more than three-fourths of the total number) are independent. They are not employees, directors or officers of, and have no financial interest in, ACC or any of its wholly owned, direct or indirect, subsidiaries, including ACIM, American Century Investment Services, Inc. (ACIS) and American Century Services, LLC (ACS), and they do not have any other affiliations, positions or relationships that would cause them to be considered “interested persons” under the Investment Company Act. The directors serve in this capacity for seven (in the case of Mr. Thomas, 15) registered investment companies in the American Century Investments family of funds.
The following table presents additional information about the directors. The mailing address for each director is 4500 Main Street, Kansas City, Missouri 64111.
|
| | | | | |
Name
(Year of Birth) | Position(s) Held with Funds | Length of Time Served | Principal Occupation(s) During Past 5 Years | Number of American Century Portfolios Overseen by Director | Other Directorships Held During Past 5 Years |
| Independent Directors |
|
|
Barry Fink
(1955) | Director | Since 2012 (independent since 2016) | Retired; Executive Vice President, ACC (2007 to 2013); President, ACS (2007 to 2013); Chief Operating Officer, ACC (2007 to 2012) | 81 | None |
Andrea C. Hall
(1945) | Director | Since 1997 | Retired | 81 | None |
Jan M. Lewis
(1957) | Director | Since 2011 | Retired; President and Chief Executive Officer, Catholic Charities of Northeast Kansas (human services organization) (2006 to 2013) | 81 | None |
James A. Olson
(1942) | Director and Chairman of the Board | Since 2007 (Chairman since 2014) | Member, Plaza Belmont LLC (private equity fund manager) (1999 to present) | 81 | Saia, Inc. (2002 to 2012) and EPR Properties (2003 to 2013) |
M. Jeannine Strandjord
(1945) | Director | Since 1994 | Retired | 81 | Euronet Worldwide Inc.; MGP Ingredients, Inc.; and DST Systems Inc. (1996 to 2012) |
|
| | | | | |
Name
(Year of Birth) | Position(s) Held with Funds | Length of Time Served | Principal Occupation(s) During Past 5 Years | Number of American Century Portfolios Overseen by Director | Other Directorships Held During Past 5 Years |
| Independent Directors |
|
|
John R. Whitten
(1946) | Director | Since 2008 | Retired | 81 | Rudolph Technologies, Inc. |
Stephen E. Yates
(1948) | Director | Since 2012 | Retired | 81 | None |
| Interested Director |
|
|
Jonathan S. Thomas
(1963) | Director and President | Since 2007 | President and Chief Executive Officer, ACC (2007 to present). Also serves as Chief Executive Officer, ACS; Executive Vice President, ACIM; Director, ACC, ACIM and other ACC subsidiaries | 126 | BioMed Valley Discoveries, Inc. |
The Statement of Additional Information has additional information about the fund's directors and is available without charge, upon request, by calling 1-800-378-9878.
Officers
The following table presents certain information about the executive officers of the funds. Each officer serves as an officer for each of the 15 investment companies in the American Century family of funds, unless otherwise noted. No officer is compensated for his or her service as an officer of the funds. The listed officers are interested persons of the funds and are appointed or re-appointed on an annual basis. The mailing address for each officer listed below is 4500 Main Street, Kansas City, Missouri 64111.
|
| | |
Name
(Year of Birth) | Offices with the Funds | Principal Occupation(s) During the Past Five Years |
Jonathan S. Thomas
(1963) | Director and President since 2007 | President and Chief Executive Officer, ACC (2007 to present). Also serves as Chief Executive Officer, ACS; Executive Vice President, ACIM; Director, ACC, ACIM and other ACC subsidiaries |
Amy D. Shelton
(1964) | Chief Compliance Officer and Vice President since 2014 | Chief Compliance Officer, American Century funds, (2014 to present); Chief Compliance Officer, ACIM (2014 to present); Chief Compliance Officer, ACIS (2009 to present); Vice President, Client Interactions and Marketing, ACIS (2013 to 2014); Director, Client Interactions and Marketing, ACIS (2007 to 2013). Also serves as Vice President, ACIS |
Charles A. Etherington
(1957) | General Counsel since 2007 and Senior Vice President since 2006 | Attorney, ACC (1994 to present); Vice President, ACC (2005 to present); General Counsel, ACC (2007 to present). Also serves as General Counsel, ACIM, ACS, ACIS and other ACC subsidiaries; and Senior Vice President, ACIM and ACS |
C. Jean Wade
(1964) | Vice President,Treasurer and Chief Financial Officer since 2012 | Vice President, ACS (2000 to present) |
Robert J. Leach
(1966) | Vice President since 2006 and Assistant Treasurer since 2012 | Vice President, ACS (2000 to present) |
David H. Reinmiller
(1963) | Vice President since 2000 | Attorney, ACC (1994 to present); Associate General Counsel, ACC (2001 to present). Also serves as Vice President, ACIM and ACS |
Ward D. Stauffer
(1960) | Secretary since 2005 | Attorney, ACC (2003 to present) |
Proxy Voting Policies
A description of the policies that the fund's investment advisor uses in exercising the voting rights associated with the securities purchased and/or held by the fund is available without charge, upon request, by calling 1-800-378-9878. It is also available on the "About Us" page of American Century Investments’ website at americancentury.com and on the Securities and Exchange Commission’s website at sec.gov. Information regarding how the investment advisor voted proxies relating to portfolio securities during the most recent 12-month period ended June 30 is available on the "About Us" page at americancentury.com. It is also available at sec.gov.
Quarterly Portfolio Disclosure
The fund files its complete schedule of portfolio holdings with the Securities and Exchange Commission (SEC) for the first and third quarters of each fiscal year on Form N-Q. The fund’s Forms N-Q are available on the SEC’s website at sec.gov, and may be reviewed and copied at the SEC’s Public Reference Room in Washington, DC. Information on the operation of the Public Reference Room may be obtained by calling 1-800-SEC-0330. The fund also makes its complete schedule of portfolio holdings for the most recent quarter of its fiscal year available on its website at ipro.americancentury.com (for Investment Professionals) and, upon request, by calling 1-800-378-9878.
Other Tax Information
The following information is provided pursuant to provisions of the Internal Revenue Code.
For corporate taxpayers, the fund hereby designates $374,042, or up to the maximum amount allowable, of ordinary income distributions paid during the fiscal year ended December 31, 2016 as qualified for the corporate dividends received deduction.
The fund hereby designates $1,050,636, or up to the maximum amount allowable, as long-term capital gain distributions (20% rate gain distributions) for the fiscal year ended December 31, 2016.
|
| | |
| |
| | | |
| Contact Us | americancentury.com | |
| Automated Information Line | 1-800-345-8765 | |
| Investment Professional Service Representatives | 1-800-345-6488 | |
| Telecommunications Relay Service for the Deaf | 711 | |
| | | |
| American Century Variable Portfolios, Inc. | |
| | | |
Investment Advisor: American Century Investment Management, Inc. Kansas City, Missouri | |
| | | |
| This report and the statements it contains are submitted for the general information of our shareholders. The report is not authorized for distribution to prospective investors unless preceded or accompanied by an effective prospectus. | |
| | | |
©2017 American Century Proprietary Holdings, Inc. All rights reserved.
CL-ANN-91445 1702 | |
|
| |
| | |
| | Annual Report |
| | |
| | December 31, 2016 |
| | |
| | VP Mid Cap Value Fund |
|
| | |
| Performance | 2 |
|
| Portfolio Commentary | |
|
| Fund Characteristics | |
|
| Shareholder Fee Example | |
|
| Schedule of Investments | |
|
| Statement of Assets and Liabilities | |
|
| Statement of Operations | |
|
| Statement of Changes in Net Assets | |
|
| Notes to Financial Statements | |
|
| Financial Highlights | |
|
| Report of Independent Registered Public Accounting Firm | |
|
| Management | |
|
| Additional Information | |
|
Any opinions expressed in this report reflect those of the author as of the date of the report, and do not necessarily represent the opinions of American Century Investments® or any other person in the American Century Investments organization. Any such opinions are subject to change at any time based upon market or other conditions and American Century Investments disclaims any responsibility to update such opinions. These opinions may not be relied upon as investment advice and, because investment decisions made by American Century Investments funds are based on numerous factors, may not be relied upon as an indication of trading intent on behalf of any American Century Investments fund. Security examples are used for representational purposes only and are not intended as recommendations to purchase or sell securities. Performance information for comparative indices and securities is provided to American Century Investments by third party vendors. To the best of American Century Investments’ knowledge, such information is accurate at the time of printing.
|
| | | | | |
| Total Returns as of December 31, 2016 |
| | | | Average Annual Returns | |
| | Ticker Symbol | 1 year | 5 years | 10 years | Inception Date |
| Class II | AVMTX | 22.72% | 16.19% | 9.10% | 10/29/04 |
| Russell Midcap Value Index | — | 20.00% | 15.69% | 7.58% | — |
| Class I | AVIPX | 22.85% | 16.35% | 9.26% | 12/1/04 |
Fund returns would have been lower if a portion of the fees had not been waived.
The performance information presented does not include charges and deductions imposed by the insurance company separate account under the variable annuity or variable life insurance contracts. The inclusion of such charges could significantly lower performance. Please refer to the insurance company separate account prospectus for a discussion of the charges related to insurance contracts.
Data presented reflect past performance. Past performance is no guarantee of future results. Current performance may be higher or lower than the performance shown. Total returns for periods less than one year are not annualized. Investment return and principal value will fluctuate, and redemption value may be more or less than original cost. Data assumes reinvestment of dividends and capital gains, and none of the charts reflect the deduction of taxes that a shareholder would pay on fund distributions or the redemption of fund shares. To obtain performance data current to the most recent month end, please call 1-800-345-6488 or visit ipro.americancentury.com (for Investment Professionals). For additional information about the fund, please consult the prospectus.
|
|
| Growth of $10,000 Over 10 Years |
| $10,000 investment made December 31, 2006 |
| Performance for other share classes will vary due to differences in fee structure. |
|
| |
| Value on December 31, 2016 |
| | Class II — $23,909 |
| |
| | Russell Midcap Value Index — $20,776 |
| |
Ending value of Class II would have been lower if a portion of the fees had not been waived.
|
| |
| Total Annual Fund Operating Expenses |
| Class I | Class II |
| 1.01% | 1.16% |
The total annual fund operating expenses shown is as stated in the fund’s prospectus current as of the date of this report. The prospectus may vary from the expense ratio shown elsewhere in this report because it is based on a different time period, includes acquired fund fees and expenses, and, if applicable, does not include fee waivers or expense reimbursements.
Data presented reflect past performance. Past performance is no guarantee of future results. Current performance may be higher or lower than the performance shown. Total returns for periods less than one year are not annualized. Investment return and principal value will fluctuate, and redemption value may be more or less than original cost. Data assumes reinvestment of dividends and capital gains, and none of the charts reflect the deduction of taxes that a shareholder would pay on fund distributions or the redemption of fund shares. To obtain performance data current to the most recent month end, please call 1-800-345-6488 or visit ipro.americancentury.com (for Investment Professionals). For additional information about the fund, please consult the prospectus.
Portfolio Managers: Kevin Toney, Michael Liss, Phil Davidson, and Brian Woglom
Performance Summary
VP Mid Cap Value returned 22.72%* for the 12 months ended December 31, 2016. By comparison, its benchmark, the Russell Midcap Value Index, returned 20.00%. The portfolio’s returns reflect operating expenses, while the index’s returns do not.
After a tumultuous first quarter, U.S. stocks delivered solid returns in 2016. The year was not without periods of volatility. At the start of the year, international economic weakness, falling oil prices, and political uncertainty around the globe weighed on market sentiment. Markets later rose in the face of improving growth trends and stabilizing commodity prices. In the fourth quarter, the market staged a strong rally after Trump’s election raised expectations for corporate tax cuts and regulation rollbacks. In November, the OPEC nations announced plans to reduce oil production, boosting oil prices and energy stocks. The Federal Reserve raised its target rate by 25 basis points in mid-December and hinted at additional rate hikes in 2017. As a result, the yield curve steepened in the fourth quarter, which was a boon for banks.
Against this backdrop, mid-cap stocks underperformed small caps, but outperformed large caps. Value stocks outperformed growth stocks, and higher-quality stocks (B+ or better) slightly outperformed lower-quality (B or worse) stocks. Ten of the 11 sectors in the Russell Midcap Value Index generated positive returns, with notable strength in materials and energy. These sectors benefited from rising commodity prices. Health care was the only sector with negative returns for the year.
Financials Boosted Performance
Security selection and an overweight in financials contributed positively to relative performance. Within the sector, stock choices in insurance and an overweight in the banking industry were particularly helpful. Banks suffered early in the year as interest rates fell, creating earnings visibility pressure. In the second half of the year, the improving economic growth outlook boosted yields, and bank profits benefited. Other catalysts for strong performance in the sector include the potential for lower corporate tax rates, optimism for economic growth and better credit, and the potential for an easing regulatory burden.
Industrials Added Value
Security selection and an overweight in industrials also helped returns, driven by several overweighted stocks in the building products and commercial services and supplies industries. Merger activity, post-election expectations, and improved economic growth prospects were drivers. One top contributor was the portfolio’s exposure in Tyco International, an Ireland-based security systems company, which merged with Johnson Controls International, a U.S.-based automotive and HVAC parts maker, effective September 2016. Prior to the merger, Tyco rose after Tyco and Johnson Controls both outlined over $1 billion in merger synergies in addition to ongoing productivity initiatives.
*All fund returns referenced in this commentary are for Class II shares. Fund returns would have been lower if a portion of the fees had not been waived. Performance for other share classes will vary due to differences in fee structure; when Class II performance exceeds that of the fund's benchmark, other share classes may not. See page 2 for returns for all share classes.
Underweight in Real Estate Enhanced Returns
An underweight in the real estate sector helped performance. The sector was hurt by rising interest rates. The portfolio’s underweight in real estate was driven by the team’s belief that REITs are generally overvalued.
Underweight in Materials Detracted
The portfolio’s underweight in the materials sector weighed on returns in the year. The materials sector outperformed on rising commodity prices and increased expectations for infrastructure spending following the election. The metals and mining industry generated especially strong returns. The portfolio had minimal exposure to the industry, as metals and mining companies are typically lower-quality stocks. The investment team has had valuation concerns on those stocks in the industry that meet their quality criteria.
Energy Sector Weighed on Returns
Stock selection in the energy sector also pressured portfolio performance, led by holdings in the oil, gas, and consumable fuels industry. The team added exposure to higher-quality, attractively valued names during the first-quarter energy sell-off. When the sector rallied later in the year, the portfolio’s higher-quality names had strong returns, but did not rally as significantly as the broad energy sector.
Outlook
As of December 31, 2016, the portfolio's largest overweights are in the financials, health care, and consumer staples sectors. In the financials sector, the portfolio is overweight in banks, though the team reduced its overweight on relative strength. Within health care, fourth-quarter volatility related to the potential repeal of the Affordable Care Act and pricing pressure in pharmaceuticals gave the team an opportunity to add to higher-quality stocks. In consumer staples, the investment team has identified many stocks that fit their investment criteria well.
The portfolio’s largest sector underweights are in the real estate, materials, and utilities sectors. The team believes that real estate has generally been overvalued for some time. In materials, the portfolio holds a few names in the containers and packaging industry and has very limited exposure to the metals and mining industry, where most stocks don’t meet the team’s quality criteria. In utilities, the team believes that valuations are overextended after utilities previously outperformed due to heavy interest from yield-seeking investors.
|
| |
| DECEMBER 31, 2016 |
| Top Ten Holdings | % of net assets |
| Northern Trust Corp. | 3.1% |
| iShares Russell Mid-Cap Value ETF | 2.7% |
| Johnson Controls International plc | 2.7% |
| Zimmer Biomet Holdings, Inc. | 1.8% |
| Imperial Oil Ltd. | 1.8% |
| Applied Materials, Inc. | 1.6% |
| EQT Corp. | 1.6% |
| Baker Hughes, Inc. | 1.6% |
| Noble Energy, Inc. | 1.5% |
| Weyerhaeuser Co. | 1.5% |
| | |
| Top Five Industries | % of net assets |
| Oil, Gas and Consumable Fuels | 9.0% |
| Banks | 8.7% |
| Insurance | 6.9% |
| Capital Markets | 6.6% |
| Food Products | 5.7% |
| | |
| Types of Investments in Portfolio | % of net assets |
| Common Stocks | 94.2% |
| Exchange-Traded Funds | 2.7% |
| Total Equity Exposure | 96.9% |
| Temporary Cash Investments | 3.2% |
| Other Assets and Liabilities | (0.1)% |
Fund shareholders may incur two types of costs: (1) transaction costs, including sales charges (loads) on purchase payments and redemption/exchange fees; and (2) ongoing costs, including management fees; distribution and service (12b-1) fees; and other fund expenses. This example is intended to help you understand your ongoing costs (in dollars) of investing in your fund and to compare these costs with the ongoing cost of investing in other mutual funds.
The example is based on an investment of $1,000 made at the beginning of the period and held for the entire period from July 1, 2016 to December 31, 2016.
Actual Expenses
The table provides information about actual account values and actual expenses for each class. You may use the information, together with the amount you invested, to estimate the expenses that you paid over the period. First, identify the share class you own. Then simply divide your account value by $1,000 (for example, an $8,600 account value divided by $1,000 = 8.6), then multiply the result by the number under the heading “Expenses Paid During Period” to estimate the expenses you paid on your account during this period.
Hypothetical Example for Comparison Purposes
The table also provides information about hypothetical account values and hypothetical expenses based on the actual expense ratio of each class of your fund and an assumed rate of return of 5% per year before expenses, which is not the actual return of a fund’s share class. The hypothetical account values and expenses may not be used to estimate the actual ending account balance or expenses you paid for the period. You may use this information to compare the ongoing costs of investing in your fund and other funds. To do so, compare this 5% hypothetical example with the 5% hypothetical examples that appear in the shareholder reports of the other funds.
Please note that the expenses shown in the table are meant to highlight your ongoing costs only and do not reflect any transactional costs, such as sales charges (loads) or redemption/exchange fees. Therefore, the table is useful in comparing ongoing costs only, and will not help you determine the relative total costs of owning different funds. In addition, if these transactional costs were included, your costs would have been higher.
|
| | | | |
| | Beginning
Account Value
7/1/16 | Ending
Account Value
12/31/16 | Expenses Paid
During Period(1)
7/1/16 - 12/31/16 | Annualized
Expense Ratio(1) |
| Actual | | | | |
| Class I (after waiver) | $1,000 | $1,110.10 | $4.61 | 0.87% |
| Class I (before waiver) | $1,000 | $1,110.10(2) | $5.30 | 1.00% |
| Class II (after waiver) | $1,000 | $1,109.80 | $5.41 | 1.02% |
| Class II (before waiver) | $1,000 | $1,109.80(2) | $6.10 | 1.15% |
| Hypothetical | | | | |
| Class I (after waiver) | $1,000 | $1,020.76 | $4.42 | 0.87% |
| Class I (before waiver) | $1,000 | $1,020.11 | $5.08 | 1.00% |
| Class II (after waiver) | $1,000 | $1,020.01 | $5.18 | 1.02% |
| Class II (before waiver) | $1,000 | $1,019.36 | $5.84 | 1.15% |
| |
| (1) | Expenses are equal to the class's annualized expense ratio listed in the table above, multiplied by the average account value over the period, multiplied by 184, the number of days in the most recent fiscal half-year, divided by 366, to reflect the one-half year period. |
| |
| (2) | Ending account value assumes the return earned after waiver and would have been lower if a portion of the fees had not been waived. |
DECEMBER 31, 2016
|
| | | | | |
| | Shares | Value |
| COMMON STOCKS — 94.2% | | |
| Aerospace and Defense — 1.2% | | |
| Textron, Inc. | 292,924 |
| $ | 14,224,390 |
|
| Auto Components — 1.0% | | |
| Delphi Automotive plc | 178,681 |
| 12,034,165 |
|
| Automobiles — 0.9% | | |
| Honda Motor Co. Ltd. ADR | 354,202 |
| 10,339,156 |
|
| Banks — 8.7% | | |
| Bank of Hawaii Corp. | 93,955 |
| 8,332,869 |
|
| BB&T Corp. | 333,294 |
| 15,671,484 |
|
| Comerica, Inc. | 134,718 |
| 9,175,643 |
|
| Commerce Bancshares, Inc. | 227,969 |
| 13,178,888 |
|
| M&T Bank Corp. | 85,903 |
| 13,437,806 |
|
| PNC Financial Services Group, Inc. (The) | 136,153 |
| 15,924,455 |
|
| SunTrust Banks, Inc. | 163,390 |
| 8,961,941 |
|
| UMB Financial Corp. | 97,131 |
| 7,490,743 |
|
| Westamerica Bancorporation | 186,769 |
| 11,753,373 |
|
| | | 103,927,202 |
|
| Building Products — 2.7% | | |
| Johnson Controls International plc | 789,117 |
| 32,503,729 |
|
| Capital Markets — 6.6% | | |
| Ameriprise Financial, Inc. | 95,026 |
| 10,542,184 |
|
| Invesco Ltd. | 425,340 |
| 12,904,816 |
|
| Northern Trust Corp. | 424,347 |
| 37,788,100 |
|
| State Street Corp. | 125,312 |
| 9,739,249 |
|
| T. Rowe Price Group, Inc. | 113,078 |
| 8,510,250 |
|
| | | 79,484,599 |
|
| Commercial Services and Supplies — 1.5% | | |
Clean Harbors, Inc.(1) | 55,078 |
| 3,065,091 |
|
| Republic Services, Inc. | 263,163 |
| 15,013,449 |
|
| | | 18,078,540 |
|
| Containers and Packaging — 2.3% | | |
| Bemis Co., Inc. | 98,290 |
| 4,700,228 |
|
| Sonoco Products Co. | 144,534 |
| 7,616,942 |
|
| WestRock Co. | 311,516 |
| 15,815,667 |
|
| | | 28,132,837 |
|
| Diversified Telecommunication Services — 0.7% | | |
Level 3 Communications, Inc.(1) | 157,207 |
| 8,860,187 |
|
| Electric Utilities — 4.5% | | |
| Edison International | 241,707 |
| 17,400,487 |
|
| Eversource Energy | 90,280 |
| 4,986,164 |
|
| PG&E Corp. | 271,523 |
| 16,500,453 |
|
| Xcel Energy, Inc. | 382,824 |
| 15,580,937 |
|
| | | 54,468,041 |
|
| Electrical Equipment — 2.4% | | |
| Emerson Electric Co. | 154,749 |
| 8,627,257 |
|
| Hubbell, Inc. | 124,250 |
| 14,499,975 |
|
|
| | | | | |
| | Shares | Value |
| Rockwell Automation, Inc. | 45,171 |
| $ | 6,070,982 |
|
| | | 29,198,214 |
|
| Electronic Equipment, Instruments and Components — 2.1% | | |
Keysight Technologies, Inc.(1) | 381,151 |
| 13,938,692 |
|
| TE Connectivity Ltd. | 168,063 |
| 11,643,405 |
|
| | | 25,582,097 |
|
| Energy Equipment and Services — 3.9% | | |
| Baker Hughes, Inc. | 290,120 |
| 18,849,096 |
|
FMC Technologies, Inc.(1) | 74,776 |
| 2,656,791 |
|
| Frank's International NV | 418,083 |
| 5,146,602 |
|
| Halliburton Co. | 176,704 |
| 9,557,919 |
|
| National Oilwell Varco, Inc. | 283,974 |
| 10,631,987 |
|
| | | 46,842,395 |
|
| Equity Real Estate Investment Trusts (REITs) — 4.1% | | |
| Boston Properties, Inc. | 7,390 |
| 929,514 |
|
| Empire State Realty Trust, Inc. | 237,115 |
| 4,787,352 |
|
| Host Hotels & Resorts, Inc. | 418,512 |
| 7,884,766 |
|
| MGM Growth Properties LLC, Class A | 254,775 |
| 6,448,355 |
|
| Piedmont Office Realty Trust, Inc., Class A | 467,518 |
| 9,775,801 |
|
| Welltower, Inc. | 15,590 |
| 1,043,439 |
|
| Weyerhaeuser Co. | 610,416 |
| 18,367,418 |
|
| | | 49,236,645 |
|
| Food and Staples Retailing — 0.8% | | |
| Sysco Corp. | 179,669 |
| 9,948,273 |
|
| Food Products — 5.7% | | |
| Conagra Brands, Inc. | 414,500 |
| 16,393,475 |
|
| General Mills, Inc. | 148,646 |
| 9,181,864 |
|
| J.M. Smucker Co. (The) | 59,970 |
| 7,679,758 |
|
| Kellogg Co. | 134,395 |
| 9,906,256 |
|
Lamb Weston Holdings, Inc.(1) | 114,484 |
| 4,333,219 |
|
| Mead Johnson Nutrition Co. | 89,861 |
| 6,358,564 |
|
| Mondelez International, Inc., Class A | 335,345 |
| 14,865,844 |
|
| | | 68,718,980 |
|
| Gas Utilities — 1.3% | | |
| Atmos Energy Corp. | 94,349 |
| 6,995,978 |
|
| Spire, Inc. | 137,554 |
| 8,879,111 |
|
| | | 15,875,089 |
|
| Health Care Equipment and Supplies — 3.7% | | |
| Abbott Laboratories | 185,907 |
| 7,140,688 |
|
| Baxter International, Inc. | 178,474 |
| 7,913,537 |
|
| STERIS plc | 117,972 |
| 7,950,133 |
|
| Zimmer Biomet Holdings, Inc. | 210,401 |
| 21,713,383 |
|
| | | 44,717,741 |
|
| Health Care Providers and Services — 4.5% | | |
| Cardinal Health, Inc. | 121,640 |
| 8,754,431 |
|
Express Scripts Holding Co.(1) | 89,238 |
| 6,138,682 |
|
HCA Holdings, Inc.(1) | 49,139 |
| 3,637,269 |
|
LifePoint Health, Inc.(1) | 322,382 |
| 18,311,298 |
|
| McKesson Corp. | 47,147 |
| 6,621,796 |
|
| Quest Diagnostics, Inc. | 109,206 |
| 10,036,031 |
|
| | | 53,499,507 |
|
|
| | | | | |
| | Shares | Value |
| Hotels, Restaurants and Leisure — 0.7% | | |
| Carnival Corp. | 162,146 |
| $ | 8,441,321 |
|
| Household Durables — 0.7% | | |
| PulteGroup, Inc. | 461,271 |
| 8,478,161 |
|
| Industrial Conglomerates — 1.1% | | |
| Koninklijke Philips NV | 436,981 |
| 13,319,623 |
|
| Insurance — 6.9% | | |
| Aflac, Inc. | 80,373 |
| 5,593,961 |
|
| Allstate Corp. (The) | 64,096 |
| 4,750,795 |
|
| Brown & Brown, Inc. | 227,315 |
| 10,197,351 |
|
| Chubb Ltd. | 129,592 |
| 17,121,695 |
|
| MetLife, Inc. | 162,792 |
| 8,772,861 |
|
| ProAssurance Corp. | 108,821 |
| 6,115,740 |
|
| Reinsurance Group of America, Inc. | 108,392 |
| 13,638,965 |
|
| Torchmark Corp. | 56,755 |
| 4,186,249 |
|
| Unum Group | 275,916 |
| 12,120,990 |
|
| | | 82,498,607 |
|
| Leisure Products — 0.4% | | |
| Mattel, Inc. | 156,148 |
| 4,301,877 |
|
| Machinery — 3.0% | | |
| Cummins, Inc. | 72,831 |
| 9,953,813 |
|
| Ingersoll-Rand plc | 197,628 |
| 14,830,005 |
|
| ITT, Inc. | 71,090 |
| 2,741,941 |
|
| Oshkosh Corp. | 34,302 |
| 2,216,252 |
|
| Parker-Hannifin Corp. | 46,022 |
| 6,443,080 |
|
| | | 36,185,091 |
|
| Metals and Mining — 0.2% | | |
| Nucor Corp. | 36,872 |
| 2,194,622 |
|
| Multi-Utilities — 1.9% | | |
| Ameren Corp. | 162,016 |
| 8,499,359 |
|
| Consolidated Edison, Inc. | 96,170 |
| 7,085,806 |
|
| NorthWestern Corp. | 124,839 |
| 7,099,594 |
|
| | | 22,684,759 |
|
| Multiline Retail — 0.9% | | |
| Target Corp. | 157,391 |
| 11,368,352 |
|
| Oil, Gas and Consumable Fuels — 9.0% | | |
| Anadarko Petroleum Corp. | 224,341 |
| 15,643,298 |
|
| Cimarex Energy Co. | 33,696 |
| 4,579,286 |
|
| Devon Energy Corp. | 249,903 |
| 11,413,070 |
|
| EQT Corp. | 294,851 |
| 19,283,255 |
|
| Imperial Oil Ltd. | 607,457 |
| 21,133,070 |
|
| Noble Energy, Inc. | 484,208 |
| 18,428,957 |
|
| Occidental Petroleum Corp. | 200,675 |
| 14,294,080 |
|
| Spectra Energy Partners LP | 64,726 |
| 2,967,040 |
|
| | | 107,742,056 |
|
| Road and Rail — 2.0% | | |
| CSX Corp. | 301,590 |
| 10,836,129 |
|
| Heartland Express, Inc. | 625,924 |
| 12,743,812 |
|
| | | 23,579,941 |
|
| Semiconductors and Semiconductor Equipment — 4.9% | | |
| Applied Materials, Inc. | 604,543 |
| 19,508,603 |
|
|
| | | | | |
| | Shares | Value |
| Lam Research Corp. | 112,038 |
| $ | 11,845,778 |
|
| Maxim Integrated Products, Inc. | 378,320 |
| 14,591,802 |
|
| Teradyne, Inc. | 484,069 |
| 12,295,352 |
|
| | | 58,241,535 |
|
| Specialty Retail — 1.9% | | |
| Advance Auto Parts, Inc. | 76,958 |
| 13,015,137 |
|
| CST Brands, Inc. | 204,151 |
| 9,829,871 |
|
| | | 22,845,008 |
|
| Technology Hardware, Storage and Peripherals — 0.5% | | |
| NetApp, Inc. | 182,508 |
| 6,437,057 |
|
| Textiles, Apparel and Luxury Goods — 0.5% | | |
| Ralph Lauren Corp. | 66,286 |
| 5,986,952 |
|
| Thrifts and Mortgage Finance — 1.0% | | |
| Capitol Federal Financial, Inc. | 736,524 |
| 12,123,185 |
|
TOTAL COMMON STOCKS
(Cost $932,135,705) | | 1,132,099,934 |
|
| EXCHANGE-TRADED FUNDS — 2.7% | | |
iShares Russell Mid-Cap Value ETF
(Cost $27,901,398) | 406,381 |
| 32,685,224 |
|
| TEMPORARY CASH INVESTMENTS — 3.2% | | |
| Repurchase Agreement, Fixed Income Clearing Corp., (collateralized by various U.S. Treasury obligations, 1.625%, 5/15/26, valued at $22,466,422), at 0.10%, dated 12/30/16, due 1/3/17 (Delivery value $22,025,245) | | 22,025,000 |
|
| State Street Institutional U.S. Government Money Market Fund, Premier Class | 15,887,807 |
| 15,887,807 |
|
TOTAL TEMPORARY CASH INVESTMENTS
(Cost $37,912,807) | | 37,912,807 |
|
TOTAL INVESTMENT SECURITIES — 100.1%
(Cost $997,949,910) | | 1,202,697,965 |
|
| OTHER ASSETS AND LIABILITIES — (0.1)% | | (1,567,113 | ) |
| TOTAL NET ASSETS — 100.0% | | $ | 1,201,130,852 |
|
|
| | | | | | | | |
| FORWARD FOREIGN CURRENCY EXCHANGE CONTRACTS |
| Currency Purchased | Currency Sold | Counterparty | Settlement Date | Unrealized Appreciation
(Depreciation) |
| CAD | 699,182 | USD | 516,196 | Morgan Stanley | 3/31/17 | $ | 5,099 |
|
| USD | 18,981,319 | CAD | 25,389,792 | Morgan Stanley | 3/31/17 | 51,235 |
|
| USD | 10,882,175 | EUR | 10,435,434 | UBS AG | 3/31/17 | (151,663 | ) |
| USD | 268,900 | EUR | 256,289 | UBS AG | 3/31/17 | (2,086 | ) |
| USD | 5,867,705 | JPY | 691,168,654 | Credit Suisse AG | 3/31/17 | (71,808 | ) |
| USD | 224,485 | JPY | 26,415,147 | Credit Suisse AG | 3/31/17 | (2,512 | ) |
| | | | | | | $ | (171,735 | ) |
|
| | |
| NOTES TO SCHEDULE OF INVESTMENTS |
| ADR | - | American Depositary Receipt |
| CAD | - | Canadian Dollar |
| EUR | - | Euro |
| JPY | - | Japanese Yen |
| USD | - | United States Dollar |
See Notes to Financial Statements.
|
|
| Statement of Assets and Liabilities |
|
| | | |
| DECEMBER 31, 2016 | |
| Assets |
| Investment securities, at value (cost of $997,949,910) | $ | 1,202,697,965 |
|
| Cash | 77,752 |
|
| Receivable for investments sold | 1,969,825 |
|
| Receivable for capital shares sold | 1,418,463 |
|
| Unrealized appreciation on forward foreign currency exchange contracts | 56,334 |
|
| Dividends and interest receivable | 2,574,632 |
|
| | 1,208,794,971 |
|
| | |
| Liabilities |
| Payable for investments purchased | 5,509,026 |
|
| Payable for capital shares redeemed | 947,581 |
|
| Unrealized depreciation on forward foreign currency exchange contracts | 228,069 |
|
| Accrued management fees | 801,591 |
|
| Distribution fees payable | 177,852 |
|
| | 7,664,119 |
|
| | |
| Net Assets | $ | 1,201,130,852 |
|
| | |
| Net Assets Consist of: | |
| Capital (par value and paid-in surplus) | $ | 985,775,138 |
|
| Undistributed net investment income | 3,302,752 |
|
| Undistributed net realized gain | 7,475,282 |
|
| Net unrealized appreciation | 204,577,680 |
|
| | $ | 1,201,130,852 |
|
|
| | | | | | |
| | Net Assets | Shares Outstanding | Net Asset Value Per Share |
| Class I, $0.01 Par Value |
| $359,605,951 |
| 17,030,746 |
| $21.12 |
| Class II, $0.01 Par Value |
| $841,524,901 |
| 39,824,009 |
| $21.13 |
See Notes to Financial Statements.
|
| | | |
| YEAR ENDED DECEMBER 31, 2016 |
| Investment Income (Loss) |
| Income: | |
| Dividends (net of foreign taxes withheld of $76,384) | $ | 23,880,539 |
|
| Interest | 36,155 |
|
| | 23,916,694 |
|
| | |
| Expenses: | |
| Management fees | 9,066,981 |
|
| Distribution fees - Class II | 1,674,750 |
|
| Directors' fees and expenses | 31,491 |
|
| Other expenses | 235 |
|
| | 10,773,457 |
|
| Fees waived | (1,259,446 | ) |
| | 9,514,011 |
|
| | |
| Net investment income (loss) | 14,402,683 |
|
| | |
| Realized and Unrealized Gain (Loss) |
| Net realized gain (loss) on: | |
| Investment transactions | 28,731,857 |
|
| Foreign currency transactions | 913,216 |
|
| | 29,645,073 |
|
| | |
| Change in net unrealized appreciation (depreciation) on: | |
| Investments | 160,825,502 |
|
| Translation of assets and liabilities in foreign currencies | (116,459 | ) |
| | 160,709,043 |
|
| | |
| Net realized and unrealized gain (loss) | 190,354,116 |
|
| | |
| Net Increase (Decrease) in Net Assets Resulting from Operations | $ | 204,756,799 |
|
See Notes to Financial Statements.
|
|
| Statement of Changes in Net Assets |
|
| | | | | | |
| YEARS ENDED DECEMBER 31, 2016 AND DECEMBER 31, 2015 |
| Increase (Decrease) in Net Assets | December 31, 2016 | December 31, 2015 |
| Operations |
| Net investment income (loss) | $ | 14,402,683 |
| $ | 9,132,055 |
|
| Net realized gain (loss) | 29,645,073 |
| 47,486,593 |
|
| Change in net unrealized appreciation (depreciation) | 160,709,043 |
| (69,588,709 | ) |
| Net increase (decrease) in net assets resulting from operations | 204,756,799 |
| (12,970,061 | ) |
| | | |
| Distributions to Shareholders |
| From net investment income: | | |
| Class I | (5,293,528 | ) | (4,088,037 | ) |
| Class II | (10,583,850 | ) | (8,024,490 | ) |
| From net realized gains: | | |
| Class I | (14,296,702 | ) | (10,379,596 | ) |
| Class II | (29,325,977 | ) | (23,528,578 | ) |
| Decrease in net assets from distributions | (59,500,057 | ) | (46,020,701 | ) |
| | | |
| Capital Share Transactions |
| Net increase (decrease) in net assets from capital share transactions (Note 5) | 234,456,237 |
| 173,816,195 |
|
| | | |
| Net increase (decrease) in net assets | 379,712,979 |
| 114,825,433 |
|
| | | |
| Net Assets |
| Beginning of period | 821,417,873 |
| 706,592,440 |
|
| End of period | $ | 1,201,130,852 |
| $ | 821,417,873 |
|
| | | |
| Undistributed net investment income | $ | 3,302,752 |
| $ | 3,960,071 |
|
See Notes to Financial Statements.
|
|
| Notes to Financial Statements |
DECEMBER 31, 2016
1. Organization
American Century Variable Portfolios, Inc. (the corporation) is registered under the Investment Company Act of 1940, as amended (the 1940 Act), as an open-end management investment company and is organized as a Maryland corporation. VP Mid Cap Value Fund (the fund) is one fund in a series issued by the corporation. The fund’s investment objective is to seek long-term capital growth. Income is a secondary objective.
The fund offers Class I and Class II. The share classes differ principally in their respective distribution and shareholder servicing expenses and arrangements. Class II is charged a lower unified management fee because it has a separate arrangement for distribution services.
2. Significant Accounting Policies
The following is a summary of significant accounting policies consistently followed by the fund in preparation of its financial statements. The fund is an investment company and follows accounting and reporting guidance in accordance with accounting principles generally accepted in the United States of America. This may require management to make certain estimates and assumptions at the date of the financial statements. Actual results could differ from these estimates. Management evaluated the impact of events or transactions occurring through the date the financial statements were issued that would merit recognition or disclosure.
Investment Valuations — The fund determines the fair value of its investments and computes its net asset value per share at the close of regular trading (usually 4 p.m. Eastern time) on the New York Stock Exchange (NYSE) on each day the NYSE is open. The Board of Directors has adopted valuation policies and procedures to guide the investment advisor in the fund’s investment valuation process and to provide methodologies for the oversight of the fund’s pricing function.
Equity securities that are listed or traded on a domestic securities exchange are valued at the last reported sales price or at the official closing price as provided by the exchange. Equity securities traded on foreign securities exchanges are generally valued at the closing price of such securities on the exchange where primarily traded or at the close of the NYSE, if that is earlier. If no last sales price is reported, or if local convention or regulation so provides, the mean of the latest bid and asked prices may be used. Securities traded over-the-counter are valued at the mean of the latest bid and asked prices, the last sales price, or the official closing price. Equity securities initially expressed in local currencies are translated into U.S. dollars at the mean of the appropriate currency exchange rate at the close of the NYSE as provided by an independent pricing service.
Open-end management investment companies are valued at the reported net asset value per share. Repurchase agreements are valued at cost, which approximates fair value. Forward foreign currency exchange contracts are valued at the mean of the appropriate forward exchange rate at the close of the NYSE as provided by an independent pricing service.
If the fund determines that the market price for an investment is not readily available or the valuation methods mentioned above do not reflect an investment’s fair value, such investment is valued as determined in good faith by the Board of Directors or its delegate, in accordance with policies and procedures adopted by the Board of Directors. In its determination of fair value, the fund may review several factors including, but not limited to, market information regarding the specific investment or comparable investments and correlation with other investment types, futures indices or general market indicators. Circumstances that may cause the fund to use these procedures to value an investment include, but are not limited to: an investment has been declared in default or is distressed; trading in a security has been suspended during the trading day or a security is not actively trading on its principal exchange; prices received from a regular pricing source are deemed unreliable; or there is a foreign market holiday and no trading occurred.
The fund monitors for significant events occurring after the close of an investment’s primary exchange but before the fund’s net asset value per share is determined. Significant events may include, but are not limited to: corporate announcements and transactions; governmental action and political unrest that could impact a specific investment or an investment sector; or armed conflicts, natural disasters and similar events that could affect investments in a specific country or region. The fund also monitors for significant fluctuations between
domestic and foreign markets, as evidenced by the U.S. market or such other indicators that the Board of Directors, or its delegate, deems appropriate. If significant fluctuations in foreign markets are identified, the fund may apply a model-derived factor to the closing price of equity securities traded on foreign securities exchanges. The factor is based on observable market data as provided by an independent pricing service.
Security Transactions — Security transactions are accounted for as of the trade date. Net realized gains and losses are determined on the identified cost basis, which is also used for federal income tax purposes.
Investment Income — Dividend income less foreign taxes withheld, if any, is recorded as of the ex-dividend date. Distributions received on securities that represent a return of capital or long-term capital gain are recorded as a reduction of cost of investments and/or as a realized gain. The fund may estimate the components of distributions received that may be considered nontaxable distributions or long-term capital gain distributions for income tax purposes. Interest income is recorded on the accrual basis and includes accretion of discounts and amortization of premiums.
Foreign Currency Translations — All assets and liabilities initially expressed in foreign currencies are translated into U.S. dollars at prevailing exchange rates at period end. The fund may enter into spot foreign currency exchange contracts to facilitate transactions denominated in a foreign currency. Purchases and sales of investment securities, dividend and interest income, spot foreign currency exchange contracts, and expenses are translated at the rates of exchange prevailing on the respective dates of such transactions. Net realized and unrealized foreign currency exchange gains or losses related to investment securities are a component of net realized gain (loss) on investment transactions and change in net unrealized appreciation (depreciation) on investments, respectively.
Repurchase Agreements — The fund may enter into repurchase agreements with institutions that American Century Investment Management, Inc. (ACIM) (the investment advisor) has determined are creditworthy pursuant to criteria adopted by the Board of Directors. The fund requires that the collateral, represented by securities, received in a repurchase transaction be transferred to the custodian in a manner sufficient to enable the fund to obtain those securities in the event of a default under the repurchase agreement. ACIM monitors, on a daily basis, the securities transferred to ensure the value, including accrued interest, of the securities under each repurchase agreement is equal to or greater than amounts owed to the fund under each repurchase agreement.
Joint Trading Account — Pursuant to an Exemptive Order issued by the Securities and Exchange Commission, the fund, along with certain other funds in the American Century Investments family of funds, may transfer uninvested cash balances into a joint trading account. These balances are invested in one or more repurchase agreements that are collateralized by U.S. Treasury or Agency obligations.
Income Tax Status — It is the fund’s policy to distribute substantially all net investment income and net realized gains to shareholders and to otherwise qualify as a regulated investment company under provisions of the Internal Revenue Code. Accordingly, no provision has been made for income taxes. The fund files U.S. federal, state, local and non-U.S. tax returns as applicable. The fund's tax returns are subject to examination by the relevant taxing authority until expiration of the applicable statute of limitations, which is generally three years from the date of filing but can be longer in certain jurisdictions. At this time, management believes there are no uncertain tax positions which, based on their technical merit, would not be sustained upon examination and for which it is reasonably possible that the total amounts of unrecognized tax benefits will significantly change in the next twelve months.
Multiple Class — All shares of the fund represent an equal pro rata interest in the net assets of the class to which such shares belong, and have identical voting, dividend, liquidation and other rights and the same terms and conditions, except for class specific expenses and exclusive rights to vote on matters affecting only individual classes. Income, non-class specific expenses, and realized and unrealized capital gains and losses of the fund are allocated to each class of shares based on their relative net assets.
Distributions to Shareholders — Distributions from net investment income, if any, are generally declared and paid quarterly. Distributions from net realized gains, if any, are generally declared and paid annually.
Indemnifications — Under the corporation’s organizational documents, its officers and directors are indemnified against certain liabilities arising out of the performance of their duties to the fund. In addition, in the normal course of business, the fund enters into contracts that provide general indemnifications. The maximum exposure under these arrangements is unknown as this would involve future claims that may be made against a fund. The risk of material loss from such claims is considered by management to be remote.
3. Fees and Transactions with Related Parties
Certain officers and directors of the corporation are also officers and/or directors of American Century Companies, Inc. (ACC). The corporation’s investment advisor, ACIM, the corporation's distributor, American Century Investment Services, Inc. (ACIS), and the corporation’s transfer agent, American Century Services, LLC, are wholly owned, directly or indirectly, by ACC.
Management Fees — The corporation has entered into a management agreement with ACIM, under which ACIM provides the fund with investment advisory and management services in exchange for a single, unified management fee (the fee) per class. The agreement provides that all expenses of managing and operating the fund, except distribution fees, brokerage expenses, taxes, interest, fees and expenses of the independent directors (including legal counsel fees), and extraordinary expenses, will be paid by ACIM. The fee is computed and accrued daily based on each class's daily net assets and paid monthly in arrears. The annual management fee for each class is 1.00% and 0.90% for Class I and Class II, respectively. From January 1, 2016 through July 31, 2016, the investment advisor agreed to waive 0.12% of the fund’s management fee. Effective August 1, 2016, the investment advisor agreed to waive 0.14% of the fund's management fee. The investment advisor expects this waiver to continue until July 31, 2017 and cannot terminate it prior to such date without the approval of the Board of Directors. The total amount of the waiver for each class for the year ended December 31, 2016 was $391,927 and $867,519 for Class I and Class II, respectively. The effective annual management fee after waiver for each class for the year ended December 31, 2016 was 0.87% and 0.77% for Class I and Class II, respectively.
Distribution Fees — The Board of Directors has adopted the Master Distribution Plan (the plan) for Class II, pursuant to Rule 12b-1 of the 1940 Act. The plan provides that Class II will pay ACIS an annual distribution fee equal to 0.25%. The fee is computed and accrued daily based on the Class II daily net assets and paid monthly in arrears. The distribution fee provides compensation for expenses incurred in connection with distributing shares of Class II including, but not limited to, payments to brokers, dealers, and financial institutions that have entered into sales agreements with respect to shares of the fund. Fees incurred under the plan during the year ended December 31, 2016 are detailed in the Statement of Operations.
Directors' Fees and Expenses — The Board of Directors is responsible for overseeing the investment advisor’s management and operations of the fund. The directors receive detailed information about the fund and its investment advisor regularly throughout the year, and meet at least quarterly with management of the investment advisor to review reports about fund operations. The fund’s officers do not receive compensation from the fund.
Acquired Fund Fees and Expenses — The fund may invest in mutual funds, exchange-traded funds, and
business development companies (the acquired funds). The fund will indirectly realize its pro rata share of the
fees and expenses of the acquired funds in which it invests. These indirect fees and expenses are not paid
out of the fund's assets but are reflected in the return realized by the fund on its investment in the acquired
funds.
Interfund Transactions — The fund may enter into security transactions with other American Century Investments funds and other client accounts of the investment advisor, in accordance with the 1940 Act rules and procedures adopted by the Board of Directors. The rules and procedures require, among other things, that these transactions be effected at the independent current market price of the security. During the period, the interfund purchases and sales were $4,989,749 and $2,955,434, respectively. The effect of interfund transactions on the Statement of Operations was $297,313 in net realized gain (loss) on investment transactions.
4. Investment Transactions
Purchases and sales of investment securities, excluding short-term investments, for the year ended December 31, 2016 were $642,851,767 and $467,125,735, respectively.
5. Capital Share Transactions
Transactions in shares of the fund were as follows:
|
| | | | | | | | |
| | Year ended
December 31, 2016 | Year ended
December 31, 2015 |
| | Shares | Amount | Shares | Amount |
| Class I/Shares Authorized | 100,000,000 | | 100,000,000 | |
| Sold | 5,668,978 | $ | 109,004,537 |
| 6,281,314 | $ | 120,516,053 |
|
| Issued in reinvestment of distributions | 1,037,897 | 19,126,326 |
| 742,672 | 14,154,729 |
|
| Redeemed | (4,297,908) | (81,951,583) |
| (3,013,253) | (57,415,113) |
|
| | 2,408,967 | 46,179,280 |
| 4,010,733 | 77,255,669 |
|
| Class II/Shares Authorized | 150,000,000 | | 150,000,000 | |
| Sold | 11,555,388 | 223,558,078 |
| 8,331,317 | 159,539,307 |
|
| Issued in reinvestment of distributions | 2,163,482 | 39,909,827 |
| 1,652,793 | 31,553,068 |
|
| Redeemed | (3,922,449) | (75,190,948) |
| (4,946,818) | (94,531,849) |
|
| | 9,796,421 | 188,276,957 |
| 5,037,292 | 96,560,526 |
|
| Net increase (decrease) | 12,205,388 | $ | 234,456,237 |
| 9,048,025 | $ | 173,816,195 |
|
6. Fair Value Measurements
The fund’s investments valuation process is based on several considerations and may use multiple inputs to determine the fair value of the investments held by the fund. In conformity with accounting principles generally accepted in the United States of America, the inputs used to determine a valuation are classified into three broad levels.
| |
| • | Level 1 valuation inputs consist of unadjusted quoted prices in an active market for identical investments. |
| |
| • | Level 2 valuation inputs consist of direct or indirect observable market data (including quoted prices for comparable investments, evaluations of subsequent market events, interest rates, prepayment speeds, credit risk, etc.). These inputs also consist of quoted prices for identical investments initially expressed in local currencies that are adjusted through translation into U.S. dollars. |
| |
| • | Level 3 valuation inputs consist of unobservable data (including a fund’s own assumptions). |
The level classification is based on the lowest level input that is significant to the fair valuation measurement. The valuation inputs are not necessarily an indication of the risks associated with investing in these securities or other financial instruments. There were no significant transfers between levels during the period.
The following is a summary of the level classifications as of period end. The Schedule of Investments provides additional information on the fund’s portfolio holdings.
|
| | | | | | | | |
| | Level 1 | Level 2 | Level 3 |
| Assets | | | |
| Investment Securities | | | |
| Common Stocks | $ | 1,097,647,241 |
| $ | 34,452,693 |
| — |
|
| Exchange-Traded Funds | 32,685,224 |
| — |
| — |
|
| Temporary Cash Investments | 15,887,807 |
| 22,025,000 |
| — |
|
| | $ | 1,146,220,272 |
| $ | 56,477,693 |
| — |
|
| Other Financial Instruments | | | |
| Forward Foreign Currency Exchange Contracts | — |
| $ | 56,334 |
| — |
|
| | | | |
| Liabilities | | | |
| Other Financial Instruments | | | |
| Forward Foreign Currency Exchange Contracts | — |
| $ | 228,069 |
| — |
|
7. Derivative Instruments
Foreign Currency Risk — The fund is subject to foreign currency exchange rate risk in the normal course of pursuing its investment objectives. The value of foreign investments held by a fund may be significantly affected by changes in foreign currency exchange rates. The dollar value of a foreign security generally decreases when the value of the dollar rises against the foreign currency in which the security is denominated and tends to increase when the value of the dollar declines against such foreign currency. A fund may enter into forward foreign currency exchange contracts to reduce a fund's exposure to foreign currency exchange rate fluctuations. The net U.S. dollar value of foreign currency underlying all contractual commitments held by a fund and the resulting unrealized appreciation or depreciation are determined daily. Realized gain or loss is recorded upon the termination of the contract. Net realized and unrealized gains or losses occurring during the holding period of forward foreign currency exchange contracts are a component of net realized gain (loss) on foreign currency transactions and change in net unrealized appreciation (depreciation) on translation of assets and liabilities in foreign currencies, respectively. A fund bears the risk of an unfavorable change in the foreign currency exchange rate underlying the forward contract. Additionally, losses, up to the fair value, may arise if the counterparties do not perform under the contract terms. The fund's average U.S. dollar exposure to foreign currency risk derivative instruments held during the period was $34,597,621.
The value of foreign currency risk derivative instruments as of December 31, 2016, is disclosed on the Statement of Assets and Liabilities as an asset of $56,334 in unrealized appreciation on forward foreign currency exchange contracts and a liability of $228,069 in unrealized depreciation on forward foreign currency exchange contracts. For the year ended December 31, 2016, the effect of foreign currency risk derivative instruments on the Statement of Operations was $912,786 in net realized gain (loss) on foreign currency transactions and $(119,137) in change in net unrealized appreciation (depreciation) on translation of assets and liabilities in foreign currencies.
8. Federal Tax Information
The tax character of distributions paid during the years ended December 31, 2016 and December 31, 2015 were as follows:
|
| | | | | | |
| | 2016 | 2015 |
| Distributions Paid From | | |
| Ordinary income | $ | 23,205,181 |
| $ | 21,230,561 |
|
| Long-term capital gains | $ | 36,294,876 |
| $ | 24,790,140 |
|
The book-basis character of distributions made during the year from net investment income or net realized gains may differ from their ultimate characterization for federal income tax purposes. These differences reflect the differing character of certain income items and net realized gains and losses for financial statement and tax purposes, and may result in reclassification among certain capital accounts on the financial statements.
As of December 31, 2016, the federal tax cost of investments and the components of distributable earnings on a tax-basis were as follows:
|
| | | |
| Federal tax cost of investments | $ | 1,010,558,567 |
|
| Gross tax appreciation of investments | $ | 201,462,458 |
|
| Gross tax depreciation of investments | (9,323,060 | ) |
| Net tax appreciation (depreciation) of investments | 192,139,398 |
|
Net tax appreciation (depreciation) on derivatives and translation of assets and liabilities in foreign currencies | 1,360 |
|
| Net tax appreciation (depreciation) | $ | 192,140,758 |
|
| Undistributed ordinary income | $ | 3,131,017 |
|
| Accumulated long-term gains | $ | 25,535,127 |
|
| Accumulated short-term capital losses | $ | (5,451,188 | ) |
The difference between book-basis and tax-basis unrealized appreciation (depreciation) is attributable primarily to the tax deferral of losses on wash sales.
Accumulated capital losses represent net capital loss carryovers that may be used to offset future realized capital gains for federal income tax purposes. As a result of a shift in ownership of the fund, the utilization of current capital loss carryovers are limited. Any remaining accumulated gains after application of this limitation will be distributed to shareholders. Future capital loss carryover utilization in any given year may be subject to Internal Revenue Code limitations. Capital loss carryovers expire in 2017.
9. Recently Issued Accounting Guidance
In October 2016, the Securities and Exchange Commission adopted new rules and forms as well as amendments to its rules and forms to modernize the reporting and disclosure of information by registered investment companies. The amendments to Regulation S-X will require standardized, enhanced disclosure about derivatives in investment company financial statements, as well as other provisions. Compliance with the amendments is effective on August 1, 2017. Management is currently evaluating the impact that adopting the amendments will have on the financial statement disclosures.
|
| | | | | | | | | | | | | | | | | |
| For a Share Outstanding Throughout the Years Ended December 31 (except as noted) |
| Per-Share Data | Ratios and Supplemental Data |
| | | Income From Investment Operations: | Distributions From: | | | Ratio to Average Net Assets of: | | |
| | Net Asset Value, Beginning of Period | Net Investment Income (Loss)(1) | Net Realized and Unrealized Gain (Loss) | Total From Investment Operations | Net Investment Income | Net Realized Gains | Total Distributions | Net Asset Value, End of Period | Total Return(2) | Operating Expenses | Operating
Expenses
(before
expense
waiver) | Net
Investment
Income
(Loss) | Net
Investment
Income (Loss)
(before expense waiver) | Portfolio Turnover Rate | Net Assets, End of Period (in thousands) |
| Class I | | | | | | | | | | | | | | |
| 2016 | $18.39 | 0.30 | 3.71 | 4.01 | (0.33) | (0.95) | (1.28) | $21.12 | 22.85% | 0.87% | 1.00% | 1.59% | 1.46% | 49% |
| $359,606 |
|
| 2015 | $19.84 | 0.24 | (0.49) | (0.25) | (0.32) | (0.88) | (1.20) | $18.39 | (1.43)% | 0.88% | 1.00% | 1.29% | 1.17% | 65% |
| $268,866 |
|
| 2014 | $18.47 | 0.25 | 2.60 | 2.85 | (0.22) | (1.26) | (1.48) | $19.84 | 16.42% | 0.94% | 1.00% | 1.31% | 1.25% | 60% |
| $210,494 |
|
| 2013 | $14.59 | 0.23 | 4.09 | 4.32 | (0.20) | (0.24) | (0.44) | $18.47 | 30.11% | 1.01% | 1.01% | 1.39% | 1.39% | 63% |
| $94,906 |
|
| 2012 | $13.50 | 0.29 | 1.86 | 2.15 | (0.28) | (0.78) | (1.06) | $14.59 | 16.33% | 1.01% | 1.01% | 2.06% | 2.06% | 78% |
| $60,637 |
|
| Class II | | | | | | | | | | | | | | |
| 2016 | $18.40 | 0.28 | 3.70 | 3.98 | (0.30) | (0.95) | (1.25) | $21.13 | 22.72% | 1.02% | 1.15% | 1.44% | 1.31% | 49% |
| $841,525 |
|
| 2015 | $19.85 | 0.21 | (0.49) | (0.28) | (0.29) | (0.88) | (1.17) | $18.40 | (1.58)% | 1.03% | 1.15% | 1.14% | 1.02% | 65% |
| $552,552 |
|
| 2014 | $18.48 | 0.21 | 2.62 | 2.83 | (0.20) | (1.26) | (1.46) | $19.85 | 16.24% | 1.09% | 1.15% | 1.16% | 1.10% | 60% |
| $496,099 |
|
| 2013 | $14.59 | 0.21 | 4.10 | 4.31 | (0.18) | (0.24) | (0.42) | $18.48 | 29.90% | 1.16% | 1.16% | 1.24% | 1.24% | 63% |
| $348,736 |
|
| 2012 | $13.50 | 0.27 | 1.86 | 2.13 | (0.26) | (0.78) | (1.04) | $14.59 | 16.23% | 1.16% | 1.16% | 1.91% | 1.91% | 78% |
| $205,208 |
|
|
|
| Notes to Financial Highlights |
| |
| (1) | Computed using average shares outstanding throughout the period. |
| |
| (2) | Total returns are calculated based on the net asset value of the last business day. Total returns for periods less than one year are not annualized. |
See Notes to Financial Statements.
|
|
| Report of Independent Registered Public Accounting Firm |
To the Board of Directors and Shareholders of American Century Variable Portfolios, Inc.:
We have audited the accompanying statement of assets and liabilities, including the schedule of investments, of VP Mid Cap Value Fund (the “Fund”), one of the funds constituting American Century Variable Portfolios, Inc., as of December 31, 2016, and the related statement of operations for the year then ended, the statements of changes in net assets for each of the two years in the period then ended, and the financial highlights for each of the five years in the period then ended. These financial statements and financial highlights are the responsibility of the Fund’s management. Our responsibility is to express an opinion on these financial statements and financial highlights based on our audits.
We conducted our audits in accordance with the standards of the Public Company Accounting Oversight Board (United States). Those standards require that we plan and perform the audit to obtain reasonable assurance about whether the financial statements and financial highlights are free of material misstatement. The Fund is not required to have, nor were we engaged to perform, an audit of its internal control over financial reporting. Our audits included consideration of internal control over financial reporting as a basis for designing audit procedures that are appropriate in the circumstances, but not for the purpose of expressing an opinion on the effectiveness of the Fund’s internal control over financial reporting. Accordingly, we express no such opinion. An audit also includes examining, on a test basis, evidence supporting the amounts and disclosures in the financial statements, assessing the accounting principles used and significant estimates made by management, as well as evaluating the overall financial statement presentation. Our procedures included confirmation of securities owned as of December 31, 2016, by correspondence with the custodian and brokers; when replies were not received from brokers, we performed other auditing procedures. We believe that our audits provide a reasonable basis for our opinion.
In our opinion, the financial statements and financial highlights referred to above present fairly, in all material respects, the financial position of VP Mid Cap Value Fund of American Century Variable Portfolios, Inc. as of December 31, 2016, the results of its operations for the year then ended, the changes in its net assets for each of the two years in the period then ended, and the financial highlights for each of the five years in the period then ended, in conformity with accounting principles generally accepted in the United States of America.
DELOITTE & TOUCHE LLP
Kansas City, Missouri
February 10, 2017
The Board of Directors
The individuals listed below serve as directors of the funds. Each director will continue to serve in this capacity until death, retirement, resignation or removal from office. The board has adopted a mandatory retirement age for directors who are not “interested persons,” as that term is defined in the Investment Company Act (independent directors). Independent directors shall retire by December 31 of the year in which they reach their 75th birthday.
Mr. Thomas is an “interested person” because he currently serves as President and Chief Executive Officer of American Century Companies, Inc. (ACC), the parent company of American Century Investment Management, Inc. (ACIM or the advisor). The other directors (more than three-fourths of the total number) are independent. They are not employees, directors or officers of, and have no financial interest in, ACC or any of its wholly owned, direct or indirect, subsidiaries, including ACIM, American Century Investment Services, Inc. (ACIS) and American Century Services, LLC (ACS), and they do not have any other affiliations, positions or relationships that would cause them to be considered “interested persons” under the Investment Company Act. The directors serve in this capacity for seven (in the case of Mr. Thomas, 15) registered investment companies in the American Century Investments family of funds.
The following table presents additional information about the directors. The mailing address for each director is 4500 Main Street, Kansas City, Missouri 64111.
|
| | | | | |
Name
(Year of Birth) | Position(s) Held with Funds | Length of Time Served | Principal Occupation(s) During Past 5 Years | Number of American Century Portfolios Overseen by Director | Other Directorships Held During Past 5 Years |
| Independent Directors |
|
|
Barry Fink
(1955) | Director | Since 2012 (independent since 2016) | Retired; Executive Vice President, ACC (2007 to 2013); President, ACS (2007 to 2013); Chief Operating Officer, ACC (2007 to 2012) | 81 | None |
Andrea C. Hall
(1945) | Director | Since 1997 | Retired | 81 | None |
Jan M. Lewis
(1957) | Director | Since 2011 | Retired; President and Chief Executive Officer, Catholic Charities of Northeast Kansas (human services organization) (2006 to 2013) | 81 | None |
James A. Olson
(1942) | Director and Chairman of the Board | Since 2007 (Chairman since 2014) | Member, Plaza Belmont LLC (private equity fund manager) (1999 to present) | 81 | Saia, Inc. (2002 to 2012) and EPR Properties (2003 to 2013) |
M. Jeannine Strandjord
(1945) | Director | Since 1994 | Retired | 81 | Euronet Worldwide Inc.; MGP Ingredients, Inc.; and DST Systems Inc. (1996 to 2012) |
|
| | | | | |
Name
(Year of Birth) | Position(s) Held with Funds | Length of Time Served | Principal Occupation(s) During Past 5 Years | Number of American Century Portfolios Overseen by Director | Other Directorships Held During Past 5 Years |
| Independent Directors |
|
|
John R. Whitten
(1946) | Director | Since 2008 | Retired | 81 | Rudolph Technologies, Inc. |
Stephen E. Yates
(1948) | Director | Since 2012 | Retired | 81 | None |
| Interested Director |
|
|
Jonathan S. Thomas
(1963) | Director and President | Since 2007 | President and Chief Executive Officer, ACC (2007 to present). Also serves as Chief Executive Officer, ACS; Executive Vice President, ACIM; Director, ACC, ACIM and other ACC subsidiaries | 126 | BioMed Valley Discoveries, Inc. |
The Statement of Additional Information has additional information about the fund's directors and is available without charge, upon request, by calling 1-800-378-9878.
Officers
The following table presents certain information about the executive officers of the funds. Each officer serves as an officer for each of the 15 investment companies in the American Century family of funds, unless otherwise noted. No officer is compensated for his or her service as an officer of the funds. The listed officers are interested persons of the funds and are appointed or re-appointed on an annual basis. The mailing address for each officer listed below is 4500 Main Street, Kansas City, Missouri 64111.
|
| | |
Name
(Year of Birth) | Offices with the Funds | Principal Occupation(s) During the Past Five Years |
Jonathan S. Thomas
(1963) | Director and President since 2007 | President and Chief Executive Officer, ACC (2007 to present). Also serves as Chief Executive Officer, ACS; Executive Vice President, ACIM; Director, ACC, ACIM and other ACC subsidiaries |
Amy D. Shelton
(1964) | Chief Compliance Officer and Vice President since 2014 | Chief Compliance Officer, American Century funds, (2014 to present); Chief Compliance Officer, ACIM (2014 to present); Chief Compliance Officer, ACIS (2009 to present); Vice President, Client Interactions and Marketing, ACIS (2013 to 2014); Director, Client Interactions and Marketing, ACIS (2007 to 2013). Also serves as Vice President, ACIS |
Charles A. Etherington
(1957) | General Counsel since 2007 and Senior Vice President since 2006 | Attorney, ACC (1994 to present); Vice President, ACC (2005 to present); General Counsel, ACC (2007 to present). Also serves as General Counsel, ACIM, ACS, ACIS and other ACC subsidiaries; and Senior Vice President, ACIM and ACS |
C. Jean Wade
(1964) | Vice President,Treasurer and Chief Financial Officer since 2012 | Vice President, ACS (2000 to present) |
Robert J. Leach
(1966) | Vice President since 2006 and Assistant Treasurer since 2012 | Vice President, ACS (2000 to present) |
David H. Reinmiller
(1963) | Vice President since 2000 | Attorney, ACC (1994 to present); Associate General Counsel, ACC (2001 to present). Also serves as Vice President, ACIM and ACS |
Ward D. Stauffer
(1960) | Secretary since 2005 | Attorney, ACC (2003 to present) |
Proxy Voting Policies
A description of the policies that the fund's investment advisor uses in exercising the voting rights associated with the securities purchased and/or held by the fund is available without charge, upon request, by calling 1-800-378-9878. It is also available on the "About Us" page of American Century Investments’ website at americancentury.com and on the Securities and Exchange Commission’s website at sec.gov. Information regarding how the investment advisor voted proxies relating to portfolio securities during the most recent 12-month period ended June 30 is available on the "About Us" page at americancentury.com. It is also available at sec.gov.
Quarterly Portfolio Disclosure
The fund files its complete schedule of portfolio holdings with the Securities and Exchange Commission (SEC) for the first and third quarters of each fiscal year on Form N-Q. The fund’s Forms N-Q are available on the SEC’s website at sec.gov, and may be reviewed and copied at the SEC’s Public Reference Room in Washington, DC. Information on the operation of the Public Reference Room may be obtained by calling 1-800-SEC-0330. The fund also makes its complete schedule of portfolio holdings for the most recent quarter of its fiscal year available on its website at ipro.americancentury.com (for Investment Professionals) and, upon request, by calling 1-800-378-9878.
Other Tax Information
The following information is provided pursuant to provisions of the Internal Revenue Code.
For corporate taxpayers, the fund hereby designates $18,084,551, or up to the maximum amount allowable, of ordinary income distributions paid during the fiscal year ended December 31, 2016 as qualified for the corporate dividends received deduction.
The fund hereby designates $7,323,833 as qualified short-term capital gain distributions for purposes of Internal Revenue Code Section 871 for the fiscal year ended December 31, 2016.
The fund hereby designates $36,294,876, or up to the maximum amount allowable, as long-term capital gain distributions (20% rate gain distributions) for the fiscal year ended December 31, 2016.
|
| | |
| |
| | | |
| Contact Us | americancentury.com | |
| Automated Information Line | 1-800-345-8765 | |
| Investment Professional Service Representatives | 1-800-345-6488 | |
| Telecommunications Relay Service for the Deaf | 711 | |
| | | |
| American Century Variable Portfolios, Inc. | |
| | | |
Investment Advisor: American Century Investment Management, Inc. Kansas City, Missouri | |
| | | |
| This report and the statements it contains are submitted for the general information of our shareholders. The report is not authorized for distribution to prospective investors unless preceded or accompanied by an effective prospectus. | |
| | | |
©2017 American Century Proprietary Holdings, Inc. All rights reserved.
CL-ANN-91446 1702 | |
|
| |
| | |
| | Annual Report |
| | |
| | December 31, 2016 |
| | |
| | VP Ultra® Fund |
|
| | |
| Performance | 2 |
|
| Portfolio Commentary | |
|
| Fund Characteristics | |
|
| Shareholder Fee Example | |
|
| Schedule of Investments | |
|
| Statement of Assets and Liabilities | |
|
| Statement of Operations | |
|
| Statement of Changes in Net Assets | |
|
| Notes to Financial Statements | |
|
| Financial Highlights | |
|
| Report of Independent Registered Public Accounting Firm | |
|
| Management | |
|
| Additional Information | |
|
Any opinions expressed in this report reflect those of the author as of the date of the report, and do not necessarily represent the opinions of American Century Investments® or any other person in the American Century Investments organization. Any such opinions are subject to change at any time based upon market or other conditions and American Century Investments disclaims any responsibility to update such opinions. These opinions may not be relied upon as investment advice and, because investment decisions made by American Century Investments funds are based on numerous factors, may not be relied upon as an indication of trading intent on behalf of any American Century Investments fund. Security examples are used for representational purposes only and are not intended as recommendations to purchase or sell securities. Performance information for comparative indices and securities is provided to American Century Investments by third party vendors. To the best of American Century Investments’ knowledge, such information is accurate at the time of printing.
|
| | | | | |
| Total Returns as of December 31, 2016 | |
| | | | Average Annual Returns | |
| | Ticker Symbol | 1 year | 5 years | 10 years | Inception Date |
| Class I | AVPUX | 4.45% | 13.76% | 7.85% | 5/1/01 |
| Russell 1000 Growth Index | — | 7.08% | 14.48% | 8.33% | — |
| S&P 500 Index | — | 11.96% | 14.64% | 6.94% | — |
| Class II | AVPSX | 4.35% | 13.60% | 7.69% | 5/1/02 |
Fund returns would have been lower if a portion of the fees had not been waived.
The performance information presented does not include charges and deductions imposed by the insurance company separate account under the variable annuity or variable life insurance contracts. The inclusion of such charges could significantly lower performance. Please refer to the insurance company separate account prospectus for a discussion of the charges related to insurance contracts.
Data presented reflect past performance. Past performance is no guarantee of future results. Current performance may be higher or lower than the performance shown. Total returns for periods less than one year are not annualized. Investment return and principal value will fluctuate, and redemption value may be more or less than original cost. Data assumes reinvestment of dividends and capital gains, and none of the charts reflect the deduction of taxes that a shareholder would pay on fund distributions or the redemption of fund shares. To obtain performance data current to the most recent month end, please call 1-800-345-6488 or visit ipro.americancentury.com (for Investment Professionals). For additional information about the fund, please consult the prospectus.
|
|
| Growth of $10,000 Over 10 Years |
| $10,000 investment made December 31, 2006 |
| Performance for other share classes will vary due to differences in fee structure. |
|
| |
| Value on December 31, 2016 |
| | Class I — $21,302 |
| |
| | Russell 1000 Growth Index — $22,266 |
| |
| | S&P 500 Index — $19,572 |
| |
Ending value of Class I would have been lower if a portion of the fees had not been waived.
|
| |
| Total Annual Fund Operating Expenses |
| Class I | Class II |
| 1.01% | 1.16% |
The total annual fund operating expenses shown is as stated in the fund’s prospectus current as of the date of this report. The prospectus may vary from the expense ratio shown elsewhere in this report because it is based on a different time period, includes acquired fund fees and expenses, and, if applicable, does not include fee waivers or expense reimbursements.
Data presented reflect past performance. Past performance is no guarantee of future results. Current performance may be higher or lower than the performance shown. Total returns for periods less than one year are not annualized. Investment return and principal value will fluctuate, and redemption value may be more or less than original cost. Data assumes reinvestment of dividends and capital gains, and none of the charts reflect the deduction of taxes that a shareholder would pay on fund distributions or the redemption of fund shares. To obtain performance data current to the most recent month end, please call 1-800-345-6488 or visit ipro.americancentury.com (for Investment Professionals). For additional information about the fund, please consult the prospectus.
Portfolio Managers: Keith Lee, Michael Li, and Jeff Bourke
Performance Summary
VP Ultra returned 4.35%* for the 12 months ended December 31, 2016, lagging the 7.08% return of the portfolio’s benchmark, the Russell 1000 Growth Index.
U.S. stock indices posted solid gains during the reporting period, with small caps outperforming large and mid caps. Value-oriented stocks outperformed growth stocks by a wide margin across the capitalization spectrum, creating a headwind for the fund.
All sectors within the Russell 1000 Growth Index rose except for health care, which was hurt by concerns about the sustainability of high prescription drug prices and, following the presidential election, worries that a repeal of the Affordable Care Act (ACA) would curtail spending by hospitals. Defensive sectors like telecommunication services and utilities that pay sizable dividends were two of the top three gainers, especially in the first half of the year. Energy, industrials, financials, information technology, and materials also posted double-digit gains.
In the information technology, consumer discretionary, and consumer staples sectors, stock selection was a major source of underperformance relative to the benchmark. Not owning stocks in the telecommunication services sector also hampered performance. Stock decisions in the health care and financials sectors benefited performance. Stock selection and an overweight to energy were also positive as rising oil prices and OPEC’s agreement to curtail production lifted the sector.
Information Technology and Consumer Discretionary Stocks Led Detractors
Customer relationship management software maker salesforce.com underperformed amid speculation that it was preparing a takeover bid for Twitter and because the company reported slowing results in the U.S. Tableau Software, which provides data analytics software, was a key detractor as it suffered from slower license sales growth and lower guidance. Tableau Software was eliminated.
In the consumer discretionary sector, stock selection in the hotels, restaurants, and leisure and textiles, apparel, and luxury goods industries drove underperformance relative to the benchmark. Athletic shoe and apparel companies Under Armour and NIKE declined. Under Armour was affected by the bankruptcy of a long-time distributor and more aggressive competition. NIKE reported flat sales in North America, and saw the benefit of sizable gains in sales overseas offset by currency volatility. Coffee retailer Starbucks detracted as investors worried about slowing growth in same-store sales.
In the consumer staples sector, cosmetics firm Estee Lauder fell after posting weaker-than-expected earnings. Investors are also skeptical of the company’s ability to meet future targets.
* All fund returns referenced in this commentary are for Class II shares. Fund returns would have been lower if a portion of the fees had not been waived. Performance for other share classes will vary due to differences in fee structure; when Class II performance exceeds that of the fund’s benchmark, other share classes may not. See page 2 for returns for all share classes.
Although stock selection in health care was favorable for the fund, some holdings were major detractors. Pharmaceutical and biotechnology companies suffered from concerns that prescription drug prices could come under greater regulatory scrutiny. Additionally, Regeneron Pharmaceuticals declined on concerns that growth would slow due to competition and the pace of new drug releases, and Gilead Sciences underperformed on concerns about slowing growth in its key hepatitis C franchise.
Health Care and Financials Led Contributors
In the health care sector, UnitedHealth Group was a top relative contributor as the company raised guidance and was seen as a beneficiary of Trump administration policies. We consider UnitedHealth to be one of the strongest health care franchises. The company is performing well with its traditional insurance business but also in its provider and health care information technology business. The portfolio also benefited from not owning several pharmaceuticals stocks that are included in the benchmark.
Financials stocks surged as investors perceived the sector to be a beneficiary of higher interest rates, improved growth, and increased lending. The Trump victory could also lead to a better regulatory environment for financials, which saw increased regulation following the financial crisis. Portfolio-only holdings JPMorgan Chase and U.S. Bancorp were top contributors in the sector.
Among other key contributors, media company Time Warner announced a merger with AT&T, and the market appeared to have a growing conviction that the deal would be completed. Power equipment and generation manufacturer Cummins reported sales above expectations and offered future guidance that affirmed continued growth. Linear Technology was another takeover story, as the company announced Analog Devices would acquire it.
Outlook
We remain confident in our belief that stocks that exhibit high-quality, accelerating fundamentals, positive relative strength, and attractive valuations will outperform in the long term. Our portfolio positioning reflects where we are seeing opportunities as a result of the application of that philosophy and process.
As of December 31, 2016, this process pointed the portfolio toward overweight positions relative to the Russell 1000 Growth Index in the information technology, consumer discretionary, energy, and financials sectors. The real estate and telecommunication services sectors represented the portfolio's largest underweights.
The information technology overweight reflects positioning in the internet software and services and technology hardware, storage and peripherals industries. Companies in these industries continue to benefit from secular trends around e-commerce, digital advertising, and a shift to cloud computing and mobile computing. The telecommunications sector underweight is due to competition among wireless carriers, which is likely to lead to higher capital spending, lower free cash flow, lower valuations, and lower margins. Financials had been a significant underweight for the fund for some time as we have avoided real estate investment trusts (REITs), which are likely to suffer once interest rates start to rise. REITs are now included in a separate real estate sector.
|
| |
| DECEMBER 31, 2016 |
| Top Ten Holdings | % of net assets |
| Apple, Inc. | 8.8% |
| Alphabet, Inc.* | 6.3% |
| Amazon.com, Inc. | 4.6% |
| Facebook, Inc., Class A | 3.8% |
| UnitedHealth Group, Inc. | 3.6% |
| Visa, Inc., Class A | 3.6% |
| Mastercard, Inc., Class A | 2.9% |
| Celgene Corp. | 2.8% |
| Starbucks Corp. | 2.8% |
| Time Warner, Inc. | 2.7% |
| *Includes all classes of the issuer held by the fund. | |
| | |
| Top Five Industries | % of net assets |
| Internet Software and Services | 11.7% |
| Technology Hardware, Storage and Peripherals | 8.8% |
| Biotechnology | 7.5% |
| IT Services | 6.5% |
| Media | 5.7% |
| | |
| Types of Investments in Portfolio | % of net assets |
| Common Stocks | 98.9% |
| Exchange-Traded Funds | 0.5% |
| Total Equity Exposure | 99.4% |
| Temporary Cash Investments | 0.4% |
| Other Assets and Liabilities | 0.2% |
Fund shareholders may incur two types of costs: (1) transaction costs, including sales charges (loads) on purchase payments and redemption/exchange fees; and (2) ongoing costs, including management fees; distribution and service (12b-1) fees; and other fund expenses. This example is intended to help you understand your ongoing costs (in dollars) of investing in your fund and to compare these costs with the ongoing cost of investing in other mutual funds.
The example is based on an investment of $1,000 made at the beginning of the period and held for the entire period from July 1, 2016 to December 31, 2016.
Actual Expenses
The table provides information about actual account values and actual expenses for each class. You may use the information, together with the amount you invested, to estimate the expenses that you paid over the period. First, identify the share class you own. Then simply divide your account value by $1,000 (for example, an $8,600 account value divided by $1,000 = 8.6), then multiply the result by the number under the heading “Expenses Paid During Period” to estimate the expenses you paid on your account during this period.
Hypothetical Example for Comparison Purposes
The table also provides information about hypothetical account values and hypothetical expenses based on the actual expense ratio of each class of your fund and an assumed rate of return of 5% per year before expenses, which is not the actual return of a fund’s share class. The hypothetical account values and expenses may not be used to estimate the actual ending account balance or expenses you paid for the period. You may use this information to compare the ongoing costs of investing in your fund and other funds. To do so, compare this 5% hypothetical example with the 5% hypothetical examples that appear in the shareholder reports of the other funds.
Please note that the expenses shown in the table are meant to highlight your ongoing costs only and do not reflect any transactional costs, such as sales charges (loads) or redemption/exchange fees. Therefore, the table is useful in comparing ongoing costs only, and will not help you determine the relative total costs of owning different funds. In addition, if these transactional costs were included, your costs would have been higher.
|
| | | | |
| | Beginning
Account Value
7/1/16 | Ending
Account Value
12/31/16 | Expenses Paid
During Period(1)
7/1/16 - 12/31/16 | Annualized Expense Ratio(1) |
| Actual | | | | |
| Class I (after waiver) | $1,000 | $1,064.00 | $4.36 | 0.84% |
| Class I (before waiver) | $1,000 | $1,064.00(2) | $5.19 | 1.00% |
| Class II (after waiver) | $1,000 | $1,063.60 | $5.14 | 0.99% |
| Class II (before waiver) | $1,000 | $1,063.60(2) | $5.97 | 1.15% |
| Hypothetical | | | | |
| Class I (after waiver) | $1,000 | $1,020.91 | $4.27 | 0.84% |
| Class I (before waiver) | $1,000 | $1,020.11 | $5.08 | 1.00% |
| Class II (after waiver) | $1,000 | $1,020.16 | $5.03 | 0.99% |
| Class II (before waiver) | $1,000 | $1,019.36 | $5.84 | 1.15% |
| |
| (1) | Expenses are equal to the class's annualized expense ratio listed in the table above, multiplied by the average account value over the period, multiplied by 184, the number of days in the most recent fiscal half-year, divided by 366, to reflect the one-half year period. |
| |
| (2) | Ending account value assumes the return earned after waiver and would have been lower if a portion of the fees had not been waived. |
DECEMBER 31, 2016
|
| | | | | |
| | Shares | Value |
| COMMON STOCKS — 98.9% | | |
| Aerospace and Defense — 3.0% | | |
| Boeing Co. (The) | 24,040 |
| $ | 3,742,547 |
|
| United Technologies Corp. | 13,960 |
| 1,530,295 |
|
| | | 5,272,842 |
|
| Automobiles — 1.3% | | |
Tesla Motors, Inc.(1) | 10,940 |
| 2,337,769 |
|
| Banks — 2.9% | | |
| JPMorgan Chase & Co. | 38,330 |
| 3,307,496 |
|
| U.S. Bancorp | 37,230 |
| 1,912,505 |
|
| | | 5,220,001 |
|
| Beverages — 2.1% | | |
Boston Beer Co., Inc. (The), Class A(1) | 6,850 |
| 1,163,473 |
|
| Constellation Brands, Inc., Class A | 17,220 |
| 2,639,998 |
|
| | | 3,803,471 |
|
| Biotechnology — 7.5% | | |
Celgene Corp.(1) | 42,730 |
| 4,945,998 |
|
| Gilead Sciences, Inc. | 47,300 |
| 3,387,153 |
|
Ionis Pharmaceuticals, Inc.(1) | 12,820 |
| 613,181 |
|
Kite Pharma, Inc.(1) | 10,160 |
| 455,574 |
|
Regeneron Pharmaceuticals, Inc.(1) | 9,390 |
| 3,446,975 |
|
Spark Therapeutics, Inc.(1) | 8,350 |
| 416,665 |
|
| | | 13,265,546 |
|
| Chemicals — 2.4% | | |
| Ecolab, Inc. | 20,030 |
| 2,347,916 |
|
| Monsanto Co. | 18,570 |
| 1,953,750 |
|
| | | 4,301,666 |
|
| Electrical Equipment — 1.5% | | |
| Acuity Brands, Inc. | 11,520 |
| 2,659,507 |
|
| Energy Equipment and Services — 0.7% | | |
| Core Laboratories NV | 10,890 |
| 1,307,236 |
|
| Food and Staples Retailing — 1.9% | | |
| Costco Wholesale Corp. | 21,540 |
| 3,448,769 |
|
| Food Products — 1.1% | | |
| Hershey Co. (The) | 1,800 |
| 186,174 |
|
| Mead Johnson Nutrition Co. | 24,760 |
| 1,752,018 |
|
| | | 1,938,192 |
|
| Health Care Equipment and Supplies — 2.8% | | |
ABIOMED, Inc.(1) | 1,780 |
| 200,571 |
|
Edwards Lifesciences Corp.(1) | 4,300 |
| 402,910 |
|
IDEXX Laboratories, Inc.(1) | 2,390 |
| 280,275 |
|
Intuitive Surgical, Inc.(1) | 6,360 |
| 4,033,321 |
|
| | | 4,917,077 |
|
| Health Care Providers and Services — 4.1% | | |
| Cigna Corp. | 7,050 |
| 940,400 |
|
| UnitedHealth Group, Inc. | 39,460 |
| 6,315,178 |
|
| | | 7,255,578 |
|
|
| | | | | |
| | Shares | Value |
| Health Care Technology — 0.4% | | |
Cerner Corp.(1) | 15,740 |
| $ | 745,604 |
|
| Hotels, Restaurants and Leisure — 3.1% | | |
| Starbucks Corp. | 88,100 |
| 4,891,312 |
|
| Wynn Resorts Ltd. | 7,270 |
| 628,928 |
|
| | | 5,520,240 |
|
| Insurance — 1.2% | | |
| MetLife, Inc. | 38,550 |
| 2,077,459 |
|
| Internet and Direct Marketing Retail — 5.7% | | |
Amazon.com, Inc.(1) | 10,850 |
| 8,136,089 |
|
Netflix, Inc.(1) | 15,920 |
| 1,970,896 |
|
| | | 10,106,985 |
|
| Internet Software and Services — 11.7% | | |
Alphabet, Inc., Class A(1) | 6,810 |
| 5,396,585 |
|
Alphabet, Inc., Class C(1) | 7,540 |
| 5,819,523 |
|
Baidu, Inc. ADR(1) | 6,640 |
| 1,091,682 |
|
Facebook, Inc., Class A(1) | 58,990 |
| 6,786,799 |
|
| Tencent Holdings Ltd. | 65,800 |
| 1,596,978 |
|
| | | 20,691,567 |
|
| IT Services — 6.5% | | |
| Mastercard, Inc., Class A | 50,110 |
| 5,173,857 |
|
| Visa, Inc., Class A | 80,880 |
| 6,310,258 |
|
| | | 11,484,115 |
|
| Machinery — 4.1% | | |
| Cummins, Inc. | 13,290 |
| 1,816,344 |
|
| Donaldson Co., Inc. | 16,150 |
| 679,592 |
|
WABCO Holdings, Inc.(1) | 18,110 |
| 1,922,377 |
|
| Wabtec Corp. | 34,490 |
| 2,863,360 |
|
| | | 7,281,673 |
|
| Media — 5.7% | | |
| Scripps Networks Interactive, Inc., Class A | 24,790 |
| 1,769,262 |
|
| Time Warner, Inc. | 48,650 |
| 4,696,184 |
|
| Walt Disney Co. (The) | 35,130 |
| 3,661,249 |
|
| | | 10,126,695 |
|
| Oil, Gas and Consumable Fuels — 1.2% | | |
Concho Resources, Inc.(1) | 6,310 |
| 836,706 |
|
| EOG Resources, Inc. | 12,980 |
| 1,312,278 |
|
| | | 2,148,984 |
|
| Personal Products — 1.7% | | |
| Estee Lauder Cos., Inc. (The), Class A | 38,590 |
| 2,951,749 |
|
| Pharmaceuticals — 1.6% | | |
| Eli Lilly & Co. | 18,250 |
| 1,342,287 |
|
| Pfizer, Inc. | 44,460 |
| 1,444,061 |
|
| | | 2,786,348 |
|
| Professional Services — 0.5% | | |
| Nielsen Holdings plc | 19,410 |
| 814,250 |
|
| Road and Rail — 0.9% | | |
| J.B. Hunt Transport Services, Inc. | 15,550 |
| 1,509,438 |
|
| Semiconductors and Semiconductor Equipment — 2.0% | | |
| Linear Technology Corp. | 30,690 |
| 1,913,521 |
|
|
| | | | | |
| | Shares | Value |
| Xilinx, Inc. | 28,440 |
| $ | 1,716,923 |
|
| | | 3,630,444 |
|
| Software — 4.6% | | |
Adobe Systems, Inc.(1) | 3,790 |
| 390,180 |
|
| Microsoft Corp. | 65,940 |
| 4,097,512 |
|
salesforce.com, Inc.(1) | 44,580 |
| 3,051,947 |
|
Splunk, Inc.(1) | 12,310 |
| 629,656 |
|
| | | 8,169,295 |
|
| Specialty Retail — 3.9% | | |
O'Reilly Automotive, Inc.(1) | 9,990 |
| 2,781,316 |
|
| Ross Stores, Inc. | 6,580 |
| 431,648 |
|
| TJX Cos., Inc. (The) | 49,450 |
| 3,715,178 |
|
| | | 6,928,142 |
|
| Technology Hardware, Storage and Peripherals — 8.8% | | |
| Apple, Inc. | 134,630 |
| 15,592,847 |
|
| Textiles, Apparel and Luxury Goods — 2.5% | | |
| NIKE, Inc., Class B | 53,130 |
| 2,700,598 |
|
Under Armour, Inc., Class A(1) | 20,740 |
| 602,497 |
|
Under Armour, Inc., Class C(1) | 42,680 |
| 1,074,255 |
|
| | | 4,377,350 |
|
| Tobacco — 1.5% | | |
| Philip Morris International, Inc. | 28,240 |
| 2,583,678 |
|
TOTAL COMMON STOCKS
(Cost $80,572,744) | | 175,254,517 |
|
| EXCHANGE-TRADED FUNDS — 0.5% | | |
iShares Russell 1000 Growth ETF
(Cost $902,447) | 8,470 |
| 888,503 |
|
| TEMPORARY CASH INVESTMENTS — 0.4% | | |
| Repurchase Agreement, Fixed Income Clearing Corp., (collateralized by various U.S. Treasury obligations, 2.75%, 11/15/42, valued at $381,555), at 0.10%, dated 12/30/16, due 1/3/17 (Delivery value $372,004) | | 372,000 |
|
| State Street Institutional U.S. Government Money Market Fund, Premier Class | 269,607 |
| 269,607 |
|
TOTAL TEMPORARY CASH INVESTMENTS
(Cost $641,607) | | 641,607 |
|
TOTAL INVESTMENT SECURITIES — 99.8%
(Cost $82,116,798) | | 176,784,627 |
|
| OTHER ASSETS AND LIABILITIES — 0.2% | | 327,742 |
|
| TOTAL NET ASSETS — 100.0% | | $ | 177,112,369 |
|
|
| | |
| NOTES TO SCHEDULE OF INVESTMENTS |
| ADR | - | American Depositary Receipt |
See Notes to Financial Statements.
|
|
| Statement of Assets and Liabilities |
|
| | | |
| DECEMBER 31, 2016 | |
| Assets | |
| Investment securities, at value (cost of $82,116,798) | $ | 176,784,627 |
|
| Foreign currency holdings, at value (cost of $5,105) | 4,354 |
|
| Receivable for investments sold | 382,079 |
|
| Receivable for capital shares sold | 38,395 |
|
| Dividends and interest receivable | 98,914 |
|
| | 177,308,369 |
|
| | |
| Liabilities | |
| Payable for capital shares redeemed | 50,588 |
|
| Accrued management fees | 115,785 |
|
| Distribution fees payable | 29,627 |
|
| | 196,000 |
|
| | |
| Net Assets | $ | 177,112,369 |
|
| | |
| Net Assets Consist of: | |
| Capital (par value and paid-in surplus) | $ | 73,788,340 |
|
| Undistributed net investment income | 529,043 |
|
| Undistributed net realized gain | 8,128,191 |
|
| Net unrealized appreciation | 94,666,795 |
|
| | $ | 177,112,369 |
|
|
| | | | | | |
| | Net Assets | Shares Outstanding | Net Asset Value Per Share |
| Class I, $0.01 Par Value |
| $38,701,056 |
| 2,504,015 |
| $15.46 |
| Class II, $0.01 Par Value |
| $138,411,313 |
| 9,096,647 |
| $15.22 |
See Notes to Financial Statements.
|
| | | |
| YEAR ENDED DECEMBER 31, 2016 | |
| Investment Income (Loss) | |
| Income: | |
| Dividends (net of foreign taxes withheld of $2,559) | $ | 2,166,011 |
|
| Interest | 1,996 |
|
| | 2,168,007 |
|
| | |
| Expenses: | |
| Management fees | 1,683,485 |
|
| Distribution fees - Class II | 358,320 |
|
| Directors' fees and expenses | 6,120 |
|
| Other expenses | 410 |
|
| | 2,048,335 |
|
| Fees waived | (281,598 | ) |
| | 1,766,737 |
|
| | |
| Net investment income (loss) | 401,270 |
|
| | |
| Realized and Unrealized Gain (Loss) | |
| Net realized gain (loss) on: | |
| Investment transactions | 9,699,305 |
|
| Foreign currency transactions | 149,841 |
|
| | 9,849,146 |
|
| | |
| Change in net unrealized appreciation (depreciation) on: | |
| Investments | (2,342,235 | ) |
| Translation of assets and liabilities in foreign currencies | (21,154 | ) |
| | (2,363,389 | ) |
| | |
| Net realized and unrealized gain (loss) | 7,485,757 |
|
| | |
| Net Increase (Decrease) in Net Assets Resulting from Operations | $ | 7,887,027 |
|
See Notes to Financial Statements.
|
|
| Statement of Changes in Net Assets |
|
| | | | | | |
| YEARS ENDED DECEMBER 31, 2016 AND DECEMBER 31, 2015 |
| Increase (Decrease) in Net Assets | December 31, 2016 | December 31, 2015 |
| Operations | | |
| Net investment income (loss) | $ | 401,270 |
| $ | 398,650 |
|
| Net realized gain (loss) | 9,849,146 |
| 7,799,216 |
|
| Change in net unrealized appreciation (depreciation) | (2,363,389 | ) | 2,877,916 |
|
| Net increase (decrease) in net assets resulting from operations | 7,887,027 |
| 11,075,782 |
|
| | | |
| Distributions to Shareholders | | |
| From net investment income: | | |
| Class I | (134,735 | ) | (176,231 | ) |
| Class II | (287,644 | ) | (456,362 | ) |
| Class III | — |
| (4,977 | ) |
| From net realized gains: | | |
| Class I | (1,596,937 | ) | (3,795,185 | ) |
| Class II | (6,075,359 | ) | (15,069,468 | ) |
| Class III | — |
| (107,179 | ) |
| Decrease in net assets from distributions | (8,094,675 | ) | (19,609,402 | ) |
| | | |
| Capital Share Transactions | | |
| Net increase (decrease) in net assets from capital share transactions (Note 5) | (14,662,183 | ) | 10,288,861 |
|
| | | |
| Net increase (decrease) in net assets | (14,869,831 | ) | 1,755,241 |
|
| | | |
| Net Assets | | |
| Beginning of period | 191,982,200 |
| 190,226,959 |
|
| End of period | $ | 177,112,369 |
| $ | 191,982,200 |
|
| | | |
| Undistributed net investment income | $ | 529,043 |
| $ | 413,589 |
|
See Notes to Financial Statements.
|
|
| Notes to Financial Statements |
DECEMBER 31, 2016
1. Organization
American Century Variable Portfolios, Inc. (the corporation) is registered under the Investment Company Act of 1940, as amended (the 1940 Act), as an open-end management investment company and is organized as a Maryland corporation. VP Ultra Fund (the fund) is one fund in a series issued by the corporation. The fund’s investment objective is to seek long-term capital growth.
The fund offers Class I and Class II. The share classes differ principally in their respective distribution and shareholder servicing expenses and arrangements. Class II is charged a lower unified management fee because it has a separate arrangement for distribution services. On August 7, 2015, there were no outstanding Class III shares and the fund discontinued offering Class III.
2. Significant Accounting Policies
The following is a summary of significant accounting policies consistently followed by the fund in preparation of its financial statements. The fund is an investment company and follows accounting and reporting guidance in accordance with accounting principles generally accepted in the United States of America. This may require management to make certain estimates and assumptions at the date of the financial statements. Actual results could differ from these estimates. Management evaluated the impact of events or transactions occurring through the date the financial statements were issued that would merit recognition or disclosure.
Investment Valuations — The fund determines the fair value of its investments and computes its net asset value per share at the close of regular trading (usually 4 p.m. Eastern time) on the New York Stock Exchange (NYSE) on each day the NYSE is open. The Board of Directors has adopted valuation policies and procedures to guide the investment advisor in the fund’s investment valuation process and to provide methodologies for the oversight of the fund’s pricing function.
Equity securities that are listed or traded on a domestic securities exchange are valued at the last reported sales price or at the official closing price as provided by the exchange. Equity securities traded on foreign securities exchanges are generally valued at the closing price of such securities on the exchange where primarily traded or at the close of the NYSE, if that is earlier. If no last sales price is reported, or if local convention or regulation so provides, the mean of the latest bid and asked prices may be used. Securities traded over-the-counter are valued at the mean of the latest bid and asked prices, the last sales price, or the official closing price. Equity securities initially expressed in local currencies are translated into U.S. dollars at the mean of the appropriate currency exchange rate at the close of the NYSE as provided by an independent pricing service.
Open-end management investment companies are valued at the reported net asset value per share. Repurchase agreements are valued at cost, which approximates fair value. Forward foreign currency exchange contracts are valued at the mean of the appropriate forward exchange rate at the close of the NYSE as provided by an independent pricing service.
If the fund determines that the market price for an investment is not readily available or the valuation methods mentioned above do not reflect an investment’s fair value, such investment is valued as determined in good faith by the Board of Directors or its delegate, in accordance with policies and procedures adopted by the Board of Directors. In its determination of fair value, the fund may review several factors including, but not limited to, market information regarding the specific investment or comparable investments and correlation with other investment types, futures indices or general market indicators. Circumstances that may cause the fund to use these procedures to value an investment include, but are not limited to: an investment has been declared in default or is distressed; trading in a security has been suspended during the trading day or a security is not actively trading on its principal exchange; prices received from a regular pricing source are deemed unreliable; or there is a foreign market holiday and no trading occurred.
The fund monitors for significant events occurring after the close of an investment’s primary exchange but before the fund’s net asset value per share is determined. Significant events may include, but are not limited to: corporate announcements and transactions; governmental action and political unrest that could impact a specific investment or an investment sector; or armed conflicts, natural disasters and similar events that could
affect investments in a specific country or region. The fund also monitors for significant fluctuations between domestic and foreign markets, as evidenced by the U.S. market or such other indicators that the Board of Directors, or its delegate, deems appropriate. If significant fluctuations in foreign markets are identified, the fund may apply a model-derived factor to the closing price of equity securities traded on foreign securities exchanges. The factor is based on observable market data as provided by an independent pricing service.
Security Transactions — Security transactions are accounted for as of the trade date. Net realized gains and losses are determined on the identified cost basis, which is also used for federal income tax purposes.
Investment Income — Dividend income less foreign taxes withheld, if any, is recorded as of the ex-dividend date. Distributions received on securities that represent a return of capital or long-term capital gain are recorded as a reduction of cost of investments and/or as a realized gain. The fund may estimate the components of distributions received that may be considered nontaxable distributions or long-term capital gain distributions for income tax purposes. Interest income is recorded on the accrual basis and includes accretion of discounts and amortization of premiums.
Foreign Currency Translations — All assets and liabilities initially expressed in foreign currencies are translated into U.S. dollars at prevailing exchange rates at period end. The fund may enter into spot foreign currency exchange contracts to facilitate transactions denominated in a foreign currency. Purchases and sales of investment securities, dividend and interest income, spot foreign currency exchange contracts, and expenses are translated at the rates of exchange prevailing on the respective dates of such transactions. Net realized and unrealized foreign currency exchange gains or losses related to investment securities are a component of net realized gain (loss) on investment transactions and change in net unrealized appreciation (depreciation) on investments, respectively.
Repurchase Agreements — The fund may enter into repurchase agreements with institutions that American Century Investment Management, Inc. (ACIM) (the investment advisor) has determined are creditworthy pursuant to criteria adopted by the Board of Directors. The fund requires that the collateral, represented by securities, received in a repurchase transaction be transferred to the custodian in a manner sufficient to enable the fund to obtain those securities in the event of a default under the repurchase agreement. ACIM monitors, on a daily basis, the securities transferred to ensure the value, including accrued interest, of the securities under each repurchase agreement is equal to or greater than amounts owed to the fund under each repurchase agreement.
Joint Trading Account — Pursuant to an Exemptive Order issued by the Securities and Exchange Commission, the fund, along with certain other funds in the American Century Investments family of funds, may transfer uninvested cash balances into a joint trading account. These balances are invested in one or more repurchase agreements that are collateralized by U.S. Treasury or Agency obligations.
Income Tax Status — It is the fund’s policy to distribute substantially all net investment income and net realized gains to shareholders and to otherwise qualify as a regulated investment company under provisions of the Internal Revenue Code. Accordingly, no provision has been made for income taxes. The fund files U.S. federal, state, local and non-U.S. tax returns as applicable. The fund's tax returns are subject to examination by the relevant taxing authority until expiration of the applicable statute of limitations, which is generally three years from the date of filing but can be longer in certain jurisdictions. At this time, management believes there are no uncertain tax positions which, based on their technical merit, would not be sustained upon examination and for which it is reasonably possible that the total amounts of unrecognized tax benefits will significantly change in the next twelve months.
Multiple Class — All shares of the fund represent an equal pro rata interest in the net assets of the class to which such shares belong, and have identical voting, dividend, liquidation and other rights and the same terms and conditions, except for class specific expenses and exclusive rights to vote on matters affecting only individual classes. Income, non-class specific expenses, and realized and unrealized capital gains and losses of the fund are allocated to each class of shares based on their relative net assets.
Distributions to Shareholders — Distributions from net investment income and net realized gains, if any, are generally declared and paid annually.
Indemnifications — Under the corporation’s organizational documents, its officers and directors are indemnified against certain liabilities arising out of the performance of their duties to the fund. In addition, in the normal course of business, the fund enters into contracts that provide general indemnifications. The maximum exposure under these arrangements is unknown as this would involve future claims that may be made against a fund. The risk of material loss from such claims is considered by management to be remote.
3. Fees and Transactions with Related Parties
Certain officers and directors of the corporation are also officers and/or directors of American Century Companies, Inc. (ACC). The corporation’s investment advisor, ACIM, the corporation's distributor, American Century Investment Services, Inc. (ACIS), and the corporation’s transfer agent, American Century Services, LLC, are wholly owned, directly or indirectly, by ACC.
Management Fees — The corporation has entered into a management agreement with ACIM, under which ACIM provides the fund with investment advisory and management services in exchange for a single, unified management fee (the fee) per class. The agreement provides that all expenses of managing and operating the fund, except distribution fees, brokerage expenses, taxes, interest, fees and expenses of the independent directors (including legal counsel fees), and extraordinary expenses, will be paid by ACIM. The fee is computed and accrued daily based on each class’s daily net assets and paid monthly in arrears. The rate of the fee is determined by applying a fee rate calculation formula. This formula takes into account the fund’s assets as well as certain assets, if any, of other clients of the investment advisor outside the American Century Investments family of funds (such as subadvised funds and separate accounts) that have very similar investment teams and investment strategies (strategy assets). The annual management fee schedule ranges from 0.900% to 1.000% for Class I and from 0.800% to 0.900% for Class II. From January 1, 2016 through July 31, 2016, the investment advisor agreed to waive 0.15% of the fund’s management fee. Effective August 1, 2016, the investment advisor agreed to waive 0.16% of the fund's management fee. The investment advisor expects this waiver to continue until July 31, 2017 and cannot terminate it prior to such date without the approval of the Board of Directors. The total amount of the waiver for each class for the year ended December 31, 2016 was $60,682 and $220,916 for Class I and Class II, respectively. The effective annual management fee before waiver for each class for the year ended December 31, 2016 was 1.00% and 0.90% for Class I and Class II, respectively. The effective annual management fee after waiver for each class for the year ended December 31, 2016 was 0.85% and 0.75% for Class I and Class II, respectively.
Distribution Fees — The Board of Directors has adopted the Master Distribution Plan (the plan) for Class II, pursuant to Rule 12b-1 of the 1940 Act. The plan provides that Class II will pay ACIS an annual distribution fee equal to 0.25%. The fee is computed and accrued daily based on the Class II daily net assets and paid monthly in arrears. The distribution fee provides compensation for expenses incurred in connection with distributing shares of Class II including, but not limited to, payments to brokers, dealers, and financial institutions that have entered into sales agreements with respect to shares of the fund. Fees incurred under the plan during the year ended December 31, 2016 are detailed in the Statement of Operations.
Directors' Fees and Expenses — The Board of Directors is responsible for overseeing the investment advisor’s management and operations of the fund. The directors receive detailed information about the fund and its investment advisor regularly throughout the year, and meet at least quarterly with management of the investment advisor to review reports about fund operations. The fund’s officers do not receive compensation from the fund.
Interfund Transactions — The fund may enter into security transactions with other American Century Investments funds and other client accounts of the investment advisor, in accordance with the 1940 Act rules and procedures adopted by the Board of Directors. The rules and procedures require, among other things, that these transactions be effected at the independent current market price of the security. During the period, the interfund purchases and sales were $603,788 and $701,044, respectively. The effect of interfund transactions on the Statement of Operations was $8,934 in net realized gain (loss) on investment transactions.
4. Investment Transactions
Purchases and sales of investment securities, excluding short-term investments, for the year ended December 31, 2016 were $55,333,632 and $78,161,088, respectively.
5. Capital Share Transactions
Transactions in shares of the fund were as follows:
|
| | | | | | | | | | |
| | Year ended
December 31, 2016 | Year ended
December 31, 2015 |
| | Shares | Amount | Shares | Amount |
| Class I/Shares Authorized | 100,000,000 |
| | 100,000,000 |
| |
| Sold | 600,643 |
| $ | 8,892,656 |
| 1,069,413 |
| $ | 16,939,681 |
|
| Issued in reinvestment of distributions | 119,839 |
| 1,731,672 |
| 258,724 |
| 3,971,416 |
|
| Redeemed | (898,848 | ) | (13,397,108 | ) | (1,048,855 | ) | (16,218,729 | ) |
| | (178,366 | ) | (2,772,780 | ) | 279,282 |
| 4,692,368 |
|
| Class II/Shares Authorized | 150,000,000 |
| | 150,000,000 |
| |
| Sold | 1,505,491 |
| 21,839,312 |
| 2,151,734 |
| 33,465,730 |
|
| Issued in reinvestment of distributions | 446,840 |
| 6,363,003 |
| 1,025,484 |
| 15,525,830 |
|
| Redeemed | (2,732,976 | ) | (40,091,718 | ) | (2,750,761 | ) | (42,273,059 | ) |
| | (780,645 | ) | (11,889,403 | ) | 426,457 |
| 6,718,501 |
|
| Class III/Shares Authorized | 50,000,000 |
| | 50,000,000 |
| |
| Sold | | | 3,176 |
| 53,334 |
|
| Issued in reinvestment of distributions | | | 7,316 |
| 112,156 |
|
| Redeemed | | | (81,420 | ) | (1,287,498 | ) |
| | | | (70,928 | ) | (1,122,008 | ) |
| Net increase (decrease) | (959,011 | ) | $ | (14,662,183 | ) | 634,811 |
| $ | 10,288,861 |
|
6. Fair Value Measurements
The fund’s investments valuation process is based on several considerations and may use multiple inputs to determine the fair value of the investments held by the fund. In conformity with accounting principles generally accepted in the United States of America, the inputs used to determine a valuation are classified into three broad levels.
| |
| • | Level 1 valuation inputs consist of unadjusted quoted prices in an active market for identical investments. |
| |
| • | Level 2 valuation inputs consist of direct or indirect observable market data (including quoted prices for comparable investments, evaluations of subsequent market events, interest rates, prepayment speeds, credit risk, etc.). These inputs also consist of quoted prices for identical investments initially expressed in local currencies that are adjusted through translation into U.S. dollars. |
| |
| • | Level 3 valuation inputs consist of unobservable data (including a fund’s own assumptions). |
The level classification is based on the lowest level input that is significant to the fair valuation measurement. The valuation inputs are not necessarily an indication of the risks associated with investing in these securities or other financial instruments. There were no significant transfers between levels during the period.
The following is a summary of the level classifications as of period end. The Schedule of Investments provides additional information on the fund’s portfolio holdings.
|
| | | | | | | | |
| | Level 1 | Level 2 | Level 3 |
| Assets | | | |
| Investment Securities | | | |
| Common Stocks | $ | 173,657,539 |
| $ | 1,596,978 |
| — |
|
| Exchange-Traded Funds | 888,503 |
| — |
| — |
|
| Temporary Cash Investments | 269,607 |
| 372,000 |
| — |
|
| | $ | 174,815,649 |
| $ | 1,968,978 |
| — |
|
7. Derivative Instruments
Foreign Currency Risk — The fund is subject to foreign currency exchange rate risk in the normal course of pursuing its investment objectives. The value of foreign investments held by a fund may be significantly affected by changes in foreign currency exchange rates. The dollar value of a foreign security generally decreases when the value of the dollar rises against the foreign currency in which the security is denominated and tends to increase when the value of the dollar declines against such foreign currency. A fund may enter into forward foreign currency exchange contracts to reduce a fund's exposure to foreign currency exchange rate fluctuations. The net U.S. dollar value of foreign currency underlying all contractual commitments held by a fund and the resulting unrealized appreciation or depreciation are determined daily. Realized gain or loss is recorded upon the termination of the contract. Net realized and unrealized gains or losses occurring during the holding period of forward foreign currency exchange contracts are a component of net realized gain (loss) on foreign currency transactions and change in net unrealized appreciation (depreciation) on translation of assets and liabilities in foreign currencies, respectively. A fund bears the risk of an unfavorable change in the foreign currency exchange rate underlying the forward contract. Additionally, losses, up to the fair value, may arise if the counterparties do not perform under the contract terms. The fund's average U.S. dollar exposure to foreign currency risk derivative instruments held during the period was $1,800,797.
At period end, the fund did not have any derivative instruments disclosed on the Statement of Assets and Liabilities. For the year ended December 31, 2016, the effect of foreign currency risk derivative instruments on the Statement of Operations was $152,131 in net realized gain (loss) on foreign currency transactions and $(21,899) in change in net unrealized appreciation (depreciation) on translation of assets and liabilities in foreign currencies.
8. Federal Tax Information
The tax character of distributions paid during the years ended December 31, 2016 and December 31, 2015 were as follows:
|
| | | | | | |
| | 2016 | 2015 |
| Distributions Paid From | | |
| Ordinary income | $ | 422,379 |
| $ | 637,570 |
|
| Long-term capital gains | $ | 7,672,296 |
| $ | 18,971,832 |
|
The book-basis character of distributions made during the year from net investment income or net realized gains may differ from their ultimate characterization for federal income tax purposes. These differences reflect the differing character of certain income items and net realized gains and losses for financial statement and tax purposes, and may result in reclassification among certain capital accounts on the financial statements.
As of December 31, 2016, the federal tax cost of investments and the components of distributable earnings on a tax-basis were as follows: |
| | | |
| Federal tax cost of investments | $ | 83,497,122 |
|
| Gross tax appreciation of investments | $ | 93,830,770 |
|
| Gross tax depreciation of investments | (543,265 | ) |
| Net tax appreciation (depreciation) of investments | 93,287,505 |
|
Net tax appreciation (depreciation) on derivatives and translation of assets and liabilities in foreign currencies | (1,034 | ) |
| Net tax appreciation (depreciation) | $ | 93,286,471 |
|
| Undistributed ordinary income | $ | 529,043 |
|
| Accumulated long-term gains | $ | 9,508,515 |
|
The difference between book-basis and tax-basis unrealized appreciation (depreciation) is attributable primarily to the tax deferral of losses on wash sales.
9. Recently Issued Accounting Guidance
In October 2016, the Securities and Exchange Commission adopted new rules and forms as well as amendments to its rules and forms to modernize the reporting and disclosure of information by registered investment companies. The amendments to Regulation S-X will require standardized, enhanced disclosure about derivatives in investment company financial statements, as well as other provisions. Compliance with the amendments is effective on August 1, 2017. Management is currently evaluating the impact that adopting the amendments will have on the financial statement disclosures.
|
| | | | | | | | | | | | | | | | | |
| For a Share Outstanding Throughout the Years Ended December 31 (except as noted) | |
| Per-Share Data | | | | | | Ratios and Supplemental Data | |
| | | Income From Investment Operations: | Distributions From: | | | Ratio to Average Net Assets of: | |
| | Net Asset
Value,
Beginning
of Period | Net
Investment
Income
(Loss)(1) | Net
Realized
and
Unrealized
Gain (Loss) | Total From
Investment
Operations | Net
Investment
Income | Net
Realized
Gains | Total
Distributions | Net Asset
Value,
End
of Period | Total
Return(2) | Operating
Expenses | Operating
Expenses
(before
expense
waiver) | Net
Investment
Income
(Loss) | Net Investment
Income (Loss)
(before expense waiver) | Portfolio
Turnover
Rate | Net
Assets,
End of
Period
(in thousands) |
| Class I | | | | | | | | | | | | | | | |
| 2016 | $15.47 | 0.05 | 0.60 | 0.65 | (0.05) | (0.61) | (0.66) | $15.46 | 4.45% | 0.85% | 1.00% | 0.34% | 0.19% | 30% |
| $38,701 |
|
| 2015 | $16.13 | 0.05 | 0.95 | 1.00 | (0.07) | (1.59) | (1.66) | $15.47 | 6.27% | 0.85% | 1.01% | 0.32% | 0.16% | 35% |
| $41,490 |
|
| 2014 | $14.72 | 0.06 | 1.41 | 1.47 | (0.06) | — | (0.06) | $16.13 | 9.99% | 0.88% | 1.00% | 0.36% | 0.24% | 35% |
| $38,754 |
|
| 2013 | $10.80 | 0.05 | 3.94 | 3.99 | (0.07) | — | (0.07) | $14.72 | 37.07% | 0.91% | 1.01% | 0.42% | 0.32% | 34% |
| $39,393 |
|
| 2012 | $9.48 | 0.06 | 1.26 | 1.32 | — | — | — | $10.80 | 13.92% | 0.97% | 1.01% | 0.57% | 0.53% | 20% |
| $32,105 |
|
| Class II | | | | | | | | | | | | | | | |
| 2016 | $15.24 | 0.03 | 0.59 | 0.62 | (0.03) | (0.61) | (0.64) | $15.22 | 4.35% | 1.00% | 1.15% | 0.19% | 0.04% | 30% |
| $138,411 |
|
| 2015 | $15.91 | 0.03 | 0.94 | 0.97 | (0.05) | (1.59) | (1.64) | $15.24 | 6.05% | 1.00% | 1.16% | 0.17% | 0.01% | 35% |
| $150,493 |
|
| 2014 | $14.52 | 0.03 | 1.39 | 1.42 | (0.03) | — | (0.03) | $15.91 | 9.83% | 1.03% | 1.15% | 0.21% | 0.09% | 35% |
| $150,331 |
|
| 2013 | $10.65 | 0.03 | 3.89 | 3.92 | (0.05) | — | (0.05) | $14.52 | 36.92% | 1.06% | 1.16% | 0.27% | 0.17% | 34% |
| $218,460 |
|
| 2012 | $9.36 | 0.04 | 1.25 | 1.29 | — | — | — | $10.65 | 13.78% | 1.12% | 1.16% | 0.42% | 0.38% | 20% |
| $200,635 |
|
|
|
| Notes to Financial Highlights |
| |
| (1) | Computed using average shares outstanding throughout the period. |
| |
| (2) | Total returns are calculated based on the net asset value of the last business day. Total returns for periods less than one year are not annualized. |
See Notes to Financial Statements.
|
|
| Report of Independent Registered Public Accounting Firm |
To the Board of Directors and Shareholders of American Century Variable Portfolios, Inc.:
We have audited the accompanying statement of assets and liabilities, including the schedule of investments, of VP Ultra Fund (the “Fund”), one of the funds constituting American Century Variable Portfolios, Inc., as of December 31, 2016, and the related statement of operations for the year then ended, the statements of changes in net assets for each of the two years in the period then ended, and the financial highlights for each of the five years in the period then ended. These financial statements and financial highlights are the responsibility of the Fund’s management. Our responsibility is to express an opinion on these financial statements and financial highlights based on our audits.
We conducted our audits in accordance with the standards of the Public Company Accounting Oversight Board (United States). Those standards require that we plan and perform the audit to obtain reasonable assurance about whether the financial statements and financial highlights are free of material misstatement. The Fund is not required to have, nor were we engaged to perform, an audit of its internal control over financial reporting. Our audits included consideration of internal control over financial reporting as a basis for designing audit procedures that are appropriate in the circumstances, but not for the purpose of expressing an opinion on the effectiveness of the Fund’s internal control over financial reporting. Accordingly, we express no such opinion. An audit also includes examining, on a test basis, evidence supporting the amounts and disclosures in the financial statements, assessing the accounting principles used and significant estimates made by management, as well as evaluating the overall financial statement presentation. Our procedures included confirmation of securities owned as of December 31, 2016, by correspondence with the custodian and brokers; when replies were not received from brokers, we performed other auditing procedures. We believe that our audits provide a reasonable basis for our opinion.
In our opinion, the financial statements and financial highlights referred to above present fairly, in all material respects, the financial position of VP Ultra Fund of American Century Variable Portfolios, Inc. as of December 31, 2016, the results of its operations for the year then ended, the changes in its net assets for each of the two years in the period then ended, and the financial highlights for each of the five years in the period then ended, in conformity with accounting principles generally accepted in the United States of America.
DELOITTE & TOUCHE LLP
Kansas City, Missouri
February 10, 2017
The Board of Directors
The individuals listed below serve as directors of the funds. Each director will continue to serve in this capacity until death, retirement, resignation or removal from office. The board has adopted a mandatory retirement age for directors who are not “interested persons,” as that term is defined in the Investment Company Act (independent directors). Independent directors shall retire by December 31 of the year in which they reach their 75th birthday.
Mr. Thomas is an “interested person” because he currently serves as President and Chief Executive Officer of American Century Companies, Inc. (ACC), the parent company of American Century Investment Management, Inc. (ACIM or the advisor). The other directors (more than three-fourths of the total number) are independent. They are not employees, directors or officers of, and have no financial interest in, ACC or any of its wholly owned, direct or indirect, subsidiaries, including ACIM, American Century Investment Services, Inc. (ACIS) and American Century Services, LLC (ACS), and they do not have any other affiliations, positions or relationships that would cause them to be considered “interested persons” under the Investment Company Act. The directors serve in this capacity for seven (in the case of Mr. Thomas, 15) registered investment companies in the American Century Investments family of funds.
The following table presents additional information about the directors. The mailing address for each director is 4500 Main Street, Kansas City, Missouri 64111.
|
| | | | | |
Name
(Year of Birth) | Position(s) Held with Funds | Length of Time Served | Principal Occupation(s) During Past 5 Years | Number of American Century Portfolios Overseen by Director | Other Directorships Held During Past 5 Years |
| Independent Directors |
|
|
Barry Fink
(1955) | Director | Since 2012 (independent since 2016) | Retired; Executive Vice President, ACC (2007 to 2013); President, ACS (2007 to 2013); Chief Operating Officer, ACC (2007 to 2012) | 81 | None |
Andrea C. Hall
(1945) | Director | Since 1997 | Retired | 81 | None |
Jan M. Lewis
(1957) | Director | Since 2011 | Retired; President and Chief Executive Officer, Catholic Charities of Northeast Kansas (human services organization) (2006 to 2013) | 81 | None |
James A. Olson
(1942) | Director and Chairman of the Board | Since 2007 (Chairman since 2014) | Member, Plaza Belmont LLC (private equity fund manager) (1999 to present) | 81 | Saia, Inc. (2002 to 2012) and EPR Properties (2003 to 2013) |
M. Jeannine Strandjord
(1945) | Director | Since 1994 | Retired | 81 | Euronet Worldwide Inc.; MGP Ingredients, Inc.; and DST Systems Inc. (1996 to 2012) |
|
| | | | | |
Name
(Year of Birth) | Position(s) Held with Funds | Length of Time Served | Principal Occupation(s) During Past 5 Years | Number of American Century Portfolios Overseen by Director | Other Directorships Held During Past 5 Years |
| Independent Directors |
|
|
John R. Whitten
(1946) | Director | Since 2008 | Retired | 81 | Rudolph Technologies, Inc. |
Stephen E. Yates
(1948) | Director | Since 2012 | Retired | 81 | None |
| Interested Director |
|
|
Jonathan S. Thomas
(1963) | Director and President | Since 2007 | President and Chief Executive Officer, ACC (2007 to present). Also serves as Chief Executive Officer, ACS; Executive Vice President, ACIM; Director, ACC, ACIM and other ACC subsidiaries | 126 | BioMed Valley Discoveries, Inc. |
The Statement of Additional Information has additional information about the fund's directors and is available without charge, upon request, by calling 1-800-378-9878.
Officers
The following table presents certain information about the executive officers of the funds. Each officer serves as an officer for each of the 15 investment companies in the American Century family of funds, unless otherwise noted. No officer is compensated for his or her service as an officer of the funds. The listed officers are interested persons of the funds and are appointed or re-appointed on an annual basis. The mailing address for each officer listed below is 4500 Main Street, Kansas City, Missouri 64111.
|
| | |
Name
(Year of Birth) | Offices with the Funds | Principal Occupation(s) During the Past Five Years |
Jonathan S. Thomas
(1963) | Director and President since 2007 | President and Chief Executive Officer, ACC (2007 to present). Also serves as Chief Executive Officer, ACS; Executive Vice President, ACIM; Director, ACC, ACIM and other ACC subsidiaries |
Amy D. Shelton
(1964) | Chief Compliance Officer and Vice President since 2014 | Chief Compliance Officer, American Century funds, (2014 to present); Chief Compliance Officer, ACIM (2014 to present); Chief Compliance Officer, ACIS (2009 to present); Vice President, Client Interactions and Marketing, ACIS (2013 to 2014); Director, Client Interactions and Marketing, ACIS (2007 to 2013). Also serves as Vice President, ACIS |
Charles A. Etherington
(1957) | General Counsel since 2007 and Senior Vice President since 2006 | Attorney, ACC (1994 to present); Vice President, ACC (2005 to present); General Counsel, ACC (2007 to present). Also serves as General Counsel, ACIM, ACS, ACIS and other ACC subsidiaries; and Senior Vice President, ACIM and ACS |
C. Jean Wade
(1964) | Vice President,Treasurer and Chief Financial Officer since 2012 | Vice President, ACS (2000 to present) |
Robert J. Leach
(1966) | Vice President since 2006 and Assistant Treasurer since 2012 | Vice President, ACS (2000 to present) |
David H. Reinmiller
(1963) | Vice President since 2000 | Attorney, ACC (1994 to present); Associate General Counsel, ACC (2001 to present). Also serves as Vice President, ACIM and ACS |
Ward D. Stauffer
(1960) | Secretary since 2005 | Attorney, ACC (2003 to present) |
Proxy Voting Policies
A description of the policies that the fund's investment advisor uses in exercising the voting rights associated with the securities purchased and/or held by the fund is available without charge, upon request, by calling 1-800-378-9878. It is also available on the "About Us" page of American Century Investments’ website at americancentury.com and on the Securities and Exchange Commission’s website at sec.gov. Information regarding how the investment advisor voted proxies relating to portfolio securities during the most recent 12-month period ended June 30 is available on the "About Us" page at americancentury.com. It is also available at sec.gov.
Quarterly Portfolio Disclosure
The fund files its complete schedule of portfolio holdings with the Securities and Exchange Commission (SEC) for the first and third quarters of each fiscal year on Form N-Q. The fund’s Forms N-Q are available on the SEC’s website at sec.gov, and may be reviewed and copied at the SEC’s Public Reference Room in Washington, DC. Information on the operation of the Public Reference Room may be obtained by calling 1-800-SEC-0330. The fund also makes its complete schedule of portfolio holdings for the most recent quarter of its fiscal year available on its website at ipro.americancentury.com (for Investment Professionals) and, upon request, by calling 1-800-378-9878.
Other Tax Information
The following information is provided pursuant to provisions of the Internal Revenue Code.
For corporate taxpayers, the fund hereby designates $422,379, or up to the maximum amount allowable, of ordinary income distributions paid during the fiscal year ended December 31, 2016 as qualified for the corporate dividends received deduction.
The fund hereby designates $7,672,296, or up to the maximum amount allowable, as long-term capital gain distributions (20% rate gain distributions) for the fiscal year ended December 31, 2016.
|
| | |
| |
| | | |
| Contact Us | americancentury.com | |
| Automated Information Line | 1-800-345-8765 | |
| Investment Professional Service Representatives | 1-800-345-6488 | |
| Telecommunications Relay Service for the Deaf | 711 | |
| | | |
| American Century Variable Portfolios, Inc. | |
| | | |
Investment Advisor: American Century Investment Management, Inc. Kansas City, Missouri | |
| | | |
| This report and the statements it contains are submitted for the general information of our shareholders. The report is not authorized for distribution to prospective investors unless preceded or accompanied by an effective prospectus. | |
| | | |
©2017 American Century Proprietary Holdings, Inc. All rights reserved.
CL-ANN-91443 1702 | |
|
| |
| | |
| | Annual Report |
| | |
| | December 31, 2016 |
| | |
| | VP Value Fund |
|
| | |
| Performance | 2 |
|
| Portfolio Commentary | |
|
| Fund Characteristics | |
|
| Shareholder Fee Example | |
|
| Schedule of Investments | |
|
| Statement of Assets and Liabilities | |
|
| Statement of Operations | |
|
| Statement of Changes in Net Assets | |
|
| Notes to Financial Statements | |
|
| Financial Highlights | |
|
| Report of Independent Registered Public Accounting Firm | |
|
| Management | |
|
| Additional Information | |
|
Any opinions expressed in this report reflect those of the author as of the date of the report, and do not necessarily represent the opinions of American Century Investments® or any other person in the American Century Investments organization. Any such opinions are subject to change at any time based upon market or other conditions and American Century Investments disclaims any responsibility to update such opinions. These opinions may not be relied upon as investment advice and, because investment decisions made by American Century Investments funds are based on numerous factors, may not be relied upon as an indication of trading intent on behalf of any American Century Investments fund. Security examples are used for representational purposes only and are not intended as recommendations to purchase or sell securities. Performance information for comparative indices and securities is provided to American Century Investments by third party vendors. To the best of American Century Investments’ knowledge, such information is accurate at the time of printing.
|
| | | | | |
| Total Returns as of December 31, 2016 | | | |
| | | | Average Annual Returns | |
| | Ticker Symbol | 1 year | 5 years | 10 years | Inception Date |
| Class I | AVPIX | 20.48% | 14.58% | 6.54% | 5/1/96 |
| Russell 1000 Value Index | — | 17.34% | 14.78% | 5.72% | — |
| S&P 500 Index | — | 11.96% | 14.64% | 6.94% | — |
| Class II | AVPVX | 20.28% | 14.43% | 6.38% | 8/14/01 |
Fund returns would have been lower if a portion of the fees had not been waived.
The performance information presented does not include charges and deductions imposed by the insurance company separate account under the variable annuity or variable life insurance contracts. The inclusion of such charges could significantly lower performance. Please refer to the insurance company separate account prospectus for a discussion of the charges related to insurance contracts.
Data presented reflect past performance. Past performance is no guarantee of future results. Current performance may be higher or lower than the performance shown. Total returns for periods less than one year are not annualized. Investment return and principal value will fluctuate, and redemption value may be more or less than original cost. Data assumes reinvestment of dividends and capital gains, and none of the charts reflect the deduction of taxes that a shareholder would pay on fund distributions or the redemption of fund shares. To obtain performance data current to the most recent month end, please call 1-800-345-6488 or visit ipro.americancentury.com (for Investment Professionals). For additional information about the fund, please consult the prospectus.
|
|
| Growth of $10,000 Over 10 Years |
| $10,000 investment made December 31, 2006 |
| Performance for other share classes will vary due to differences in fee structure. |
|
| |
| Value on December 31, 2016 |
| | Class I — $18,853 |
| |
| | Russell 1000 Value Index — $17,444 |
| |
| | S&P 500 Index — $19,572 |
| |
Ending value of Class I would have been lower if a portion of the fees had not been waived.
|
| |
| Total Annual Fund Operating Expenses |
| Class I | Class II |
| 0.97% | 1.12% |
The total annual fund operating expenses shown is as stated in the fund’s prospectus current as of the date of this report. The prospectus may vary from the expense ratio shown elsewhere in this report because it is based on a different time period, includes acquired fund fees and expenses, and, if applicable, does not include fee waivers or expense reimbursements.
Data presented reflect past performance. Past performance is no guarantee of future results. Current performance may be higher or lower than the performance shown. Total returns for periods less than one year are not annualized. Investment return and principal value will fluctuate, and redemption value may be more or less than original cost. Data assumes reinvestment of dividends and capital gains, and none of the charts reflect the deduction of taxes that a shareholder would pay on fund distributions or the redemption of fund shares. To obtain performance data current to the most recent month end, please call 1-800-345-6488 or visit ipro.americancentury.com (for Investment Professionals). For additional information about the fund, please consult the prospectus.
Portfolio Managers: Michael Liss, Kevin Toney, Phil Davidson, Brian Woglom, and Dan Gruemmer
Performance Summary
VP Value returned 20.48%* for the 12 months ended December 31, 2016. By comparison, its benchmark, the Russell 1000 Value Index, returned 17.34%. The broader market, as measured by the S&P 500 Index, returned 11.96%. The fund’s return reflects operating expenses, while the indices' returns do not.
After a tumultuous first quarter, U.S. stocks delivered solid returns in 2016. This was attributable to positive U.S. economic news, healthy corporate earnings performance, and a pickup in mergers and acquisitions. The energy market stabilized after a sell-off early in the year. Similarly, other commodity prices stabilized due to reduced concerns over global economic growth, which led to strong returns in the materials sector. In the fourth quarter, the market staged a strong rally after Donald Trump’s election raised expectations for corporate tax cuts and regulation rollbacks. The Federal Reserve raised its target rate by 25 basis points in mid-December and hinted at additional rate hikes in 2017. As a result, the yield curve steepened, which was a boon for banks.
In this environment, VP Value’s investment approach, which emphasizes higher-quality businesses with sound balance sheets, provided positive absolute results in every sector in which it was invested, led by energy and financials holdings. The portfolio’s outperformance relative to the Russell 1000 Value Index was aided by stock selection and positioning in the energy sector. Stock selection in the financials and consumer staples sectors was also favorable. Positioning in health care weighed on relative performance, primarily due to overweight allocations in the pharmaceuticals and health care equipment and supplies industries. Positioning in materials also hampered relative performance owing to an underweight allocation to companies in the metals and mining industry.
Top Contributors
Equity markets rewarded Cimarex Energy, as the company continued to post excellent results in its holdings in the Permian and Anadarko basins. Anadarko Petroleum is an energy exploration and production company with global operations (both onshore and offshore). The company was a significant contributor as it executed asset sales that strengthened its balance sheet and made a valuable acquisition at a heavily discounted price.
Although there were no top-10 individual contributors in the sector, financials in general registered strong gains in the wake of the U.S. presidential election on optimism about economic growth, higher interest rates, and a more benign regulatory environment.
Elsewhere, semiconductor equipment company Applied Materials rose after reporting order strength. Also, the company held an analyst day in mid-September that showed improvement in market share. Microsoft added to performance. The company has experienced better-than-expected strength in PC demand, and cloud adoption by Microsoft’s customers continues to grow at a high pace. In the utilities sector, Westar Energy surged on the announcement of its acquisition by Great Plains Energy. The stock was eliminated from the portfolio as a result. Great Plains was also eliminated due to potential execution risks for the deal.
*All fund returns referenced in this commentary are for Class I shares. Fund returns would have been lower if a portion of the fees had not been waived. Performance for other share classes will vary due to differences in fee structure; when Class I performance exceeds that of the fund's benchmark, other share classes may not. See page 2 for returns for all share classes.
Top Detractors
LifePoint Health, a hospital company with facilities in rural and non-urban communities, was a top detractor from returns. LifePoint fell on concerns over the possibility of decelerating growth rates. There were also concerns over the end of the benefit in volumes from the Affordable Care Act (ACA). Non-benchmark holding Teva Pharmaceutical Industries declined due to generic pricing worries and negative sentiment surrounding pharmaceutical stocks. Worries about Teva’s biggest specialty drug, Copaxone, and when its patent will expire have also weighed on the stock. We believe that the worst of the generic pricing headwind has passed and that the worst-case scenario for Copaxone is priced into the stock.
Allergan hurt returns, largely due to pharmaceutical industry pricing worries. Political rhetoric around health care, including the ACA and drug prices, pressured Express Scripts Holding. News of the potential loss of its biggest customer and a report issued by a short seller also pushed the stock price down.
Elsewhere, LPL Financial Holdings declined after missing fourth-quarter 2015 consensus estimates and due to lower interest rate expectations at that time. Lower equity markets also reduced the company's forward estimates and valuation multiples. The holding was eliminated.
Outlook
As of December 31, 2016, the portfolio had large overweights in the health care and energy sectors. Political rhetoric around health care, including the ACA, pressured health care stocks. Additionally, the threat of mandated lower drug pricing pressured pharmaceutical companies. This created the opportunity to add stocks of those companies we believe will fare well in the future. In the energy sector, we like well-managed, higher-quality companies, including integrated oil companies with strong balance sheets, exploration and production companies with good assets and strong balance sheets, and higher-quality energy equipment and services companies.
The portfolio’s largest sector underweights were in the real estate and utilities sectors. We believe that real estate has generally been overvalued for some time. In utilities, valuations appear overextended after the sector outperformed due to heavy interest from yield-seeking investors.
|
| |
| DECEMBER 31, 2016 |
| Top Ten Holdings | % of net assets |
| General Electric Co. | 3.2% |
| JPMorgan Chase & Co. | 3.1% |
| Procter & Gamble Co. (The) | 2.7% |
| Wells Fargo & Co. | 2.6% |
| Pfizer, Inc. | 2.5% |
| Johnson & Johnson | 2.4% |
| Chevron Corp. | 2.1% |
| AT&T, Inc. | 2.1% |
| Bank of America Corp. | 2.1% |
| Merck & Co., Inc. | 2.1% |
| | |
| Top Five Industries | % of net assets |
| Oil, Gas and Consumable Fuels | 13.7% |
| Banks | 13.5% |
| Pharmaceuticals | 8.5% |
| Health Care Equipment and Supplies | 4.4% |
| Capital Markets | 3.8% |
| | |
| Types of Investments in Portfolio | % of net assets |
| Common Stocks | 97.1% |
| Temporary Cash Investments | 3.0% |
| Other Assets and Liabilities | (0.1)% |
Fund shareholders may incur two types of costs: (1) transaction costs, including sales charges (loads) on purchase payments and redemption/exchange fees; and (2) ongoing costs, including management fees; distribution and service (12b-1) fees; and other fund expenses. This example is intended to help you understand your ongoing costs (in dollars) of investing in your fund and to compare these costs with the ongoing cost of investing in other mutual funds.
The example is based on an investment of $1,000 made at the beginning of the period and held for the entire period from July 1, 2016 to December 31, 2016.
Actual Expenses
The table provides information about actual account values and actual expenses for each class. You may use the information, together with the amount you invested, to estimate the expenses that you paid over the period. First, identify the share class you own. Then simply divide your account value by $1,000 (for example, an $8,600 account value divided by $1,000 = 8.6), then multiply the result by the number under the heading “Expenses Paid During Period” to estimate the expenses you paid on your account during this period.
Hypothetical Example for Comparison Purposes
The table also provides information about hypothetical account values and hypothetical expenses based on the actual expense ratio of each class of your fund and an assumed rate of return of 5% per year before expenses, which is not the actual return of a fund’s share class. The hypothetical account values and expenses may not be used to estimate the actual ending account balance or expenses you paid for the period. You may use this information to compare the ongoing costs of investing in your fund and other funds. To do so, compare this 5% hypothetical example with the 5% hypothetical examples that appear in the shareholder reports of the other funds.
Please note that the expenses shown in the table are meant to highlight your ongoing costs only and do not reflect any transactional costs, such as sales charges (loads) or redemption/exchange fees. Therefore, the table is useful in comparing ongoing costs only, and will not help you determine the relative total costs of owning different funds. In addition, if these transactional costs were included, your costs would have been higher.
|
| | | | |
| | Beginning
Account Value
7/1/16 | Ending
Account Value
12/31/16 | Expenses Paid
During Period(1)
7/1/16 - 12/31/16 |
Annualized
Expense Ratio(1) |
| Actual | | | | |
| Class I (after waiver) | $1,000 | $1,115.20 | $4.31 | 0.81% |
| Class I (before waiver) | $1,000 | $1,115.20(2) | $5.16 | 0.97% |
| Class II (after waiver) | $1,000 | $1,114.20 | $5.10 | 0.96% |
| Class II (before waiver) | $1,000 | $1,114.20(2) | $5.95 | 1.12% |
| Hypothetical | | | | |
| Class I (after waiver) | $1,000 | $1,021.06 | $4.12 | 0.81% |
| Class I (before waiver) | $1,000 | $1,020.26 | $4.93 | 0.97% |
| Class II (after waiver) | $1,000 | $1,020.31 | $4.88 | 0.96% |
| Class II (before waiver) | $1,000 | $1,019.51 | $5.69 | 1.12% |
| |
| (1) | Expenses are equal to the class's annualized expense ratio listed in the table above, multiplied by the average account value over the period, multiplied by 184, the number of days in the most recent fiscal half-year, divided by 366, to reflect the one-half year period. |
| |
| (2) | Ending account value assumes the return earned after waiver and would have been lower if a portion of the fees had not been waived. |
DECEMBER 31, 2016
|
| | | | | |
| | Shares | Value |
| COMMON STOCKS — 97.1% | | |
| Aerospace and Defense — 1.2% | | |
| Textron, Inc. | 118,001 |
| $ | 5,730,129 |
|
| United Technologies Corp. | 50,220 |
| 5,505,116 |
|
| | | 11,235,245 |
|
| Automobiles — 1.1% | | |
| General Motors Co. | 197,814 |
| 6,891,840 |
|
| Honda Motor Co. Ltd. | 136,100 |
| 3,962,300 |
|
| | | 10,854,140 |
|
| Banks — 13.5% | | |
| Bank of America Corp. | 895,110 |
| 19,781,931 |
|
| BB&T Corp. | 184,400 |
| 8,670,488 |
|
| BOK Financial Corp. | 32,110 |
| 2,666,414 |
|
| Comerica, Inc. | 52,640 |
| 3,585,310 |
|
| Commerce Bancshares, Inc. | 14,025 |
| 810,785 |
|
| Cullen/Frost Bankers, Inc. | 29,990 |
| 2,646,018 |
|
| JPMorgan Chase & Co. | 340,159 |
| 29,352,320 |
|
| M&T Bank Corp. | 34,914 |
| 5,461,597 |
|
| PNC Financial Services Group, Inc. (The) | 107,982 |
| 12,629,575 |
|
| U.S. Bancorp | 348,012 |
| 17,877,377 |
|
| Wells Fargo & Co. | 448,562 |
| 24,720,252 |
|
| | | 128,202,067 |
|
| Beverages — 0.3% | | |
| PepsiCo, Inc. | 28,011 |
| 2,930,791 |
|
| Biotechnology — 0.3% | | |
| AbbVie, Inc. | 50,330 |
| 3,151,665 |
|
| Building Products — 0.9% | | |
| Johnson Controls International plc | 209,461 |
| 8,627,699 |
|
| Capital Markets — 3.8% | | |
| Franklin Resources, Inc. | 79,765 |
| 3,157,099 |
|
| Goldman Sachs Group, Inc. (The) | 44,976 |
| 10,769,503 |
|
| Invesco Ltd. | 122,960 |
| 3,730,606 |
|
| Northern Trust Corp. | 103,067 |
| 9,178,116 |
|
| State Street Corp. | 117,490 |
| 9,131,323 |
|
| | | 35,966,647 |
|
| Commercial Services and Supplies — 0.5% | | |
| Republic Services, Inc. | 83,732 |
| 4,776,911 |
|
| Communications Equipment — 1.7% | | |
| Cisco Systems, Inc. | 549,993 |
| 16,620,788 |
|
| Diversified Financial Services — 1.9% | | |
Berkshire Hathaway, Inc., Class A(1) | 50 |
| 12,206,050 |
|
Berkshire Hathaway, Inc., Class B(1) | 34,364 |
| 5,600,645 |
|
| | | 17,806,695 |
|
| Diversified Telecommunication Services — 3.5% | | |
| AT&T, Inc. | 465,954 |
| 19,817,024 |
|
| CenturyLink, Inc. | 90,758 |
| 2,158,225 |
|
Level 3 Communications, Inc.(1) | 52,710 |
| 2,970,735 |
|
|
| | | | | |
| | Shares | Value |
| Verizon Communications, Inc. | 147,110 |
| $ | 7,852,732 |
|
| | | 32,798,716 |
|
| Electric Utilities — 2.0% | | |
| Edison International | 127,838 |
| 9,203,058 |
|
| PG&E Corp. | 162,789 |
| 9,892,687 |
|
| | | 19,095,745 |
|
| Electrical Equipment — 1.2% | | |
| Emerson Electric Co. | 162,230 |
| 9,044,323 |
|
| Hubbell, Inc. | 23,160 |
| 2,702,772 |
|
| | | 11,747,095 |
|
| Electronic Equipment, Instruments and Components — 1.7% | | |
Keysight Technologies, Inc.(1) | 190,838 |
| 6,978,946 |
|
| TE Connectivity Ltd. | 131,390 |
| 9,102,699 |
|
| | | 16,081,645 |
|
| Energy Equipment and Services — 3.4% | | |
| Baker Hughes, Inc. | 70,484 |
| 4,579,346 |
|
FMC Technologies, Inc.(1) | 85,840 |
| 3,049,895 |
|
| Halliburton Co. | 76,906 |
| 4,159,846 |
|
| Helmerich & Payne, Inc. | 28,371 |
| 2,195,915 |
|
| National Oilwell Varco, Inc. | 89,780 |
| 3,361,363 |
|
| Schlumberger Ltd. | 181,240 |
| 15,215,098 |
|
| | | 32,561,463 |
|
| Equity Real Estate Investment Trusts (REITs) — 0.7% | | |
| CoreCivic, Inc. | 112,065 |
| 2,741,110 |
|
| Weyerhaeuser Co. | 118,460 |
| 3,564,461 |
|
| | | 6,305,571 |
|
| Food and Staples Retailing — 2.2% | | |
| CVS Health Corp. | 49,390 |
| 3,897,365 |
|
| Sysco Corp. | 72,256 |
| 4,000,815 |
|
| Wal-Mart Stores, Inc. | 194,178 |
| 13,421,583 |
|
| | | 21,319,763 |
|
| Food Products — 2.5% | | |
| Conagra Brands, Inc. | 135,853 |
| 5,372,986 |
|
| Kellogg Co. | 72,497 |
| 5,343,754 |
|
| Mondelez International, Inc., Class A | 283,276 |
| 12,557,625 |
|
| | | 23,274,365 |
|
| Health Care Equipment and Supplies — 4.4% | | |
| Abbott Laboratories | 215,880 |
| 8,291,951 |
|
Boston Scientific Corp.(1) | 204,226 |
| 4,417,408 |
|
| Medtronic plc | 173,757 |
| 12,376,711 |
|
| STERIS plc | 62,712 |
| 4,226,162 |
|
| Zimmer Biomet Holdings, Inc. | 117,874 |
| 12,164,597 |
|
| | | 41,476,829 |
|
| Health Care Providers and Services — 2.8% | | |
| Cardinal Health, Inc. | 45,540 |
| 3,277,514 |
|
| Cigna Corp. | 24,950 |
| 3,328,080 |
|
Express Scripts Holding Co.(1) | 68,547 |
| 4,715,348 |
|
HCA Holdings, Inc.(1) | 16,920 |
| 1,252,418 |
|
| Humana, Inc. | 11,590 |
| 2,364,708 |
|
LifePoint Health, Inc.(1) | 166,263 |
| 9,443,738 |
|
|
| | | | | |
| | Shares | Value |
| McKesson Corp. | 18,510 |
| $ | 2,599,730 |
|
| | | 26,981,536 |
|
| Hotels, Restaurants and Leisure — 0.5% | | |
| Carnival Corp. | 91,574 |
| 4,767,342 |
|
| Household Products — 2.7% | | |
| Procter & Gamble Co. (The) | 303,156 |
| 25,489,357 |
|
| Industrial Conglomerates — 3.6% | | |
| General Electric Co. | 956,594 |
| 30,228,371 |
|
| Koninklijke Philips NV | 119,285 |
| 3,635,927 |
|
| | | 33,864,298 |
|
| Insurance — 3.4% | | |
| Aflac, Inc. | 63,595 |
| 4,426,212 |
|
| Chubb Ltd. | 65,239 |
| 8,619,377 |
|
| MetLife, Inc. | 153,889 |
| 8,293,078 |
|
| Reinsurance Group of America, Inc. | 57,076 |
| 7,181,873 |
|
| Unum Group | 87,770 |
| 3,855,736 |
|
| | | 32,376,276 |
|
| Leisure Products — 0.4% | | |
| Mattel, Inc. | 126,569 |
| 3,486,976 |
|
| Machinery — 0.3% | | |
| Cummins, Inc. | 19,890 |
| 2,718,366 |
|
| Media — 0.3% | | |
Discovery Communications, Inc., Class A(1) | 115,315 |
| 3,160,784 |
|
| Metals and Mining — 0.4% | | |
| BHP Billiton Ltd. | 216,030 |
| 3,856,127 |
|
| Mortgage Real Estate Investment Trusts (REITs) — 0.3% | | |
| Annaly Capital Management, Inc. | 250,984 |
| 2,502,310 |
|
| Multi-Utilities — 0.6% | | |
| Ameren Corp. | 106,930 |
| 5,609,548 |
|
| Multiline Retail — 0.7% | | |
| Target Corp. | 94,947 |
| 6,858,022 |
|
| Oil, Gas and Consumable Fuels — 13.7% | | |
| Anadarko Petroleum Corp. | 119,256 |
| 8,315,721 |
|
| Apache Corp. | 31,518 |
| 2,000,447 |
|
| Chevron Corp. | 171,730 |
| 20,212,621 |
|
| Cimarex Energy Co. | 31,493 |
| 4,279,899 |
|
| ConocoPhillips | 178,330 |
| 8,941,466 |
|
| Devon Energy Corp. | 140,219 |
| 6,403,802 |
|
| EOG Resources, Inc. | 62,852 |
| 6,354,337 |
|
| EQT Corp. | 144,899 |
| 9,476,395 |
|
| Exxon Mobil Corp. | 193,048 |
| 17,424,512 |
|
| Imperial Oil Ltd. | 79,113 |
| 2,752,295 |
|
| Noble Energy, Inc. | 274,925 |
| 10,463,645 |
|
| Occidental Petroleum Corp. | 199,668 |
| 14,222,352 |
|
| Royal Dutch Shell plc, B Shares | 126,120 |
| 3,598,937 |
|
| TOTAL SA | 316,001 |
| 16,131,133 |
|
| | | 130,577,562 |
|
| Pharmaceuticals — 8.5% | | |
Allergan plc(1) | 39,580 |
| 8,312,196 |
|
| Johnson & Johnson | 194,201 |
| 22,373,897 |
|
| Merck & Co., Inc. | 335,112 |
| 19,728,043 |
|
|
| | | | | |
| | Shares | Value |
| Pfizer, Inc. | 717,349 |
| $ | 23,299,496 |
|
| Teva Pharmaceutical Industries Ltd. ADR | 197,645 |
| 7,164,631 |
|
| | | 80,878,263 |
|
| Road and Rail — 1.9% | | |
| CSX Corp. | 70,685 |
| 2,539,712 |
|
| Heartland Express, Inc. | 382,548 |
| 7,788,677 |
|
| Norfolk Southern Corp. | 30,360 |
| 3,281,005 |
|
| Werner Enterprises, Inc. | 163,430 |
| 4,404,439 |
|
| | | 18,013,833 |
|
| Semiconductors and Semiconductor Equipment — 3.3% | | |
| Applied Materials, Inc. | 168,844 |
| 5,448,596 |
|
| Intel Corp. | 432,387 |
| 15,682,677 |
|
| QUALCOMM, Inc. | 118,460 |
| 7,723,592 |
|
| Teradyne, Inc. | 109,508 |
| 2,781,503 |
|
| | | 31,636,368 |
|
| Software — 2.6% | | |
Dell Technologies, Inc., Class V(1) | 46,203 |
| 2,539,779 |
|
| Microsoft Corp. | 143,251 |
| 8,901,617 |
|
| Oracle Corp. | 348,213 |
| 13,388,790 |
|
| | | 24,830,186 |
|
| Specialty Retail — 2.4% | | |
| Advance Auto Parts, Inc. | 50,795 |
| 8,590,450 |
|
| CST Brands, Inc. | 212,471 |
| 10,230,479 |
|
| Lowe's Cos., Inc. | 60,558 |
| 4,306,885 |
|
| | | 23,127,814 |
|
| Technology Hardware, Storage and Peripherals — 0.9% | | |
| Apple, Inc. | 29,938 |
| 3,467,419 |
|
| Hewlett Packard Enterprise Co. | 128,657 |
| 2,977,123 |
|
| HP, Inc. | 128,657 |
| 1,909,270 |
|
| | | 8,353,812 |
|
| Textiles, Apparel and Luxury Goods — 1.0% | | |
| Coach, Inc. | 150,830 |
| 5,282,066 |
|
| Ralph Lauren Corp. | 47,230 |
| 4,265,814 |
|
| | | 9,547,880 |
|
TOTAL COMMON STOCKS
(Cost $786,040,434) | | 923,470,500 |
|
| TEMPORARY CASH INVESTMENTS — 3.0% | | |
| Repurchase Agreement, Fixed Income Clearing Corp., (collateralized by various U.S. Treasury obligations, 2.75%, 11/15/42, valued at $16,755,444), at 0.10%, dated 12/30/16, due 1/3/17 (Delivery value $16,423,182) | | 16,423,000 |
|
| State Street Institutional U.S. Government Money Market Fund, Premier Class | 11,847,065 |
| 11,847,065 |
|
TOTAL TEMPORARY CASH INVESTMENTS
(Cost $28,270,065) | | 28,270,065 |
|
TOTAL INVESTMENT SECURITIES — 100.1%
(Cost $814,310,499) | | 951,740,565 |
|
| OTHER ASSETS AND LIABILITIES — (0.1)% | | (1,128,950 | ) |
| TOTAL NET ASSETS — 100.0% | | $ | 950,611,615 |
|
|
| | | | | | | | |
| FORWARD FOREIGN CURRENCY EXCHANGE CONTRACTS |
| Currency Purchased | Currency Sold | Counterparty | Settlement Date | Unrealized Appreciation
(Depreciation) |
| AUD | 129,618 | USD | 93,898 | Credit Suisse AG | 3/31/17 | $ | (554 | ) |
| USD | 3,062,275 | AUD | 4,180,181 | Credit Suisse AG | 3/31/17 | 51,927 |
|
| USD | 2,086,621 | CAD | 2,791,107 | Morgan Stanley | 3/31/17 | 5,632 |
|
| USD | 14,659,497 | EUR | 14,057,688 | UBS AG | 3/31/17 | (204,307 | ) |
| USD | 2,628,694 | GBP | 2,117,397 | Credit Suisse AG | 3/31/17 | 13,483 |
|
| USD | 77,312 | GBP | 62,429 | Credit Suisse AG | 3/31/17 | 205 |
|
| USD | 3,013,063 | JPY | 354,914,775 | Credit Suisse AG | 3/31/17 | (36,873 | ) |
| | | | | | | $ | (170,487 | ) |
|
| | |
| NOTES TO SCHEDULE OF INVESTMENTS |
| ADR | - | American Depositary Receipt |
| AUD | - | Australian Dollar |
| CAD | - | Canadian Dollar |
| EUR | - | Euro |
| GBP | - | British Pound |
| JPY | - | Japanese Yen |
| USD | - | United States Dollar |
See Notes to Financial Statements.
|
|
| Statement of Assets and Liabilities |
|
| | | |
| DECEMBER 31, 2016 | |
| Assets |
| Investment securities, at value (cost of $814,310,499) | $ | 951,740,565 |
|
| Foreign currency holdings, at value (cost of $194,626) | 189,717 |
|
| Receivable for investments sold | 394,401 |
|
| Receivable for capital shares sold | 116,937 |
|
| Unrealized appreciation on forward foreign currency exchange contracts | 71,247 |
|
| Dividends and interest receivable | 1,835,490 |
|
| | 954,348,357 |
|
| | |
| Liabilities | |
| Payable for investments purchased | 2,177,816 |
|
| Payable for capital shares redeemed | 600,455 |
|
| Unrealized depreciation on forward foreign currency exchange contracts | 241,734 |
|
| Accrued management fees | 613,270 |
|
| Distribution fees payable | 103,467 |
|
| | 3,736,742 |
|
| | |
| Net Assets | $ | 950,611,615 |
|
| | |
| Net Assets Consist of: | |
| Capital (par value and paid-in surplus) | $ | 880,754,583 |
|
| Undistributed net investment income | 713,133 |
|
| Accumulated net realized loss | (68,112,280 | ) |
| Net unrealized appreciation | 137,256,179 |
|
| | $ | 950,611,615 |
|
|
| | | | | | |
| | Net Assets | Shares Outstanding | Net Asset Value Per Share |
| Class I, $0.01 Par Value |
| $461,585,635 |
| 44,047,563 |
| $10.48 |
| Class II, $0.01 Par Value |
| $489,025,980 |
| 46,618,287 |
| $10.49 |
See Notes to Financial Statements.
|
| | | |
| YEAR ENDED DECEMBER 31, 2016 |
| Investment Income (Loss) |
| Income: | |
| Dividends (net of foreign taxes withheld of $164,209) | $ | 21,896,824 |
|
| Interest | 24,902 |
|
| | 21,921,726 |
|
| | |
| Expenses: | |
| Management fees | 7,786,418 |
|
| Distribution fees - Class II | 1,077,764 |
|
| Directors' fees and expenses | 27,892 |
|
| Other expenses | 4,609 |
|
| | 8,896,683 |
|
| Fees waived | (1,414,368 | ) |
| | 7,482,315 |
|
| | |
| Net investment income (loss) | 14,439,411 |
|
| | |
| Realized and Unrealized Gain (Loss) | |
| Net realized gain (loss) on: | |
| Investment transactions | 58,874,293 |
|
| Foreign currency transactions | 980,272 |
|
| | 59,854,565 |
|
| | |
| Change in net unrealized appreciation (depreciation) on: | |
| Investments | 85,156,907 |
|
| Translation of assets and liabilities in foreign currencies | (200,542 | ) |
| | 84,956,365 |
|
| | |
| Net realized and unrealized gain (loss) | 144,810,930 |
|
| | |
| Net Increase (Decrease) in Net Assets Resulting from Operations | $ | 159,250,341 |
|
See Notes to Financial Statements.
|
|
| Statement of Changes in Net Assets |
|
| | | | | | |
| YEARS ENDED DECEMBER 31, 2016 AND DECEMBER 31, 2015 |
| Increase (Decrease) in Net Assets | December 31, 2016 | December 31, 2015 |
| Operations | | |
| Net investment income (loss) | $ | 14,439,411 |
| $ | 16,546,415 |
|
| Net realized gain (loss) | 59,854,565 |
| 118,460,449 |
|
| Change in net unrealized appreciation (depreciation) | 84,956,365 |
| (170,208,397 | ) |
| Net increase (decrease) in net assets resulting from operations | 159,250,341 |
| (35,201,533 | ) |
| | | |
| Distributions to Shareholders | | |
| From net investment income: | | |
| Class I | (7,288,433 | ) | (9,220,306 | ) |
| Class II | (6,891,085 | ) | (8,671,895 | ) |
| Class III | — |
| (159,675 | ) |
| Decrease in net assets from distributions | (14,179,518 | ) | (18,051,876 | ) |
| | | |
| Capital Share Transactions | | |
| Net increase (decrease) in net assets from capital share transactions (Note 5) | (12,777,219 | ) | (48,837,226 | ) |
| | | |
| Redemption Fees | | |
| Increase in net assets from redemption fees | — |
| 10,008 |
|
| | | |
| Net increase (decrease) in net assets | 132,293,604 |
| (102,080,627 | ) |
| | | |
| Net Assets | | |
| Beginning of period | 818,318,011 |
| 920,398,638 |
|
| End of period | $ | 950,611,615 |
| $ | 818,318,011 |
|
| | | |
| Undistributed net investment income | $ | 713,133 |
| $ | 280,531 |
|
See Notes to Financial Statements.
|
|
| Notes to Financial Statements |
DECEMBER 31, 2016
1. Organization
American Century Variable Portfolios, Inc. (the corporation) is registered under the Investment Company Act of 1940, as amended (the 1940 Act), as an open-end management investment company and is organized as a Maryland corporation. VP Value Fund (the fund) is one fund in a series issued by the corporation. The fund's investment objective is to seek long-term capital growth. Income is a secondary objective.
The fund offers Class I and Class II. The share classes differ principally in their respective distribution and shareholder servicing expenses and arrangements. Class II is charged a lower unified management fee because it has a separate arrangement for distribution services. On August 7, 2015, there were no outstanding Class III shares and the fund discontinued offering Class III.
2. Significant Accounting Policies
The following is a summary of significant accounting policies consistently followed by the fund in preparation of its financial statements. The fund is an investment company and follows accounting and reporting guidance in accordance with accounting principles generally accepted in the United States of America. This may require management to make certain estimates and assumptions at the date of the financial statements. Actual results could differ from these estimates. Management evaluated the impact of events or transactions occurring through the date the financial statements were issued that would merit recognition or disclosure.
Investment Valuations — The fund determines the fair value of its investments and computes its net asset value per share at the close of regular trading (usually 4 p.m. Eastern time) on the New York Stock Exchange (NYSE) on each day the NYSE is open. The Board of Directors has adopted valuation policies and procedures to guide the investment advisor in the fund’s investment valuation process and to provide methodologies for the oversight of the fund’s pricing function.
Equity securities that are listed or traded on a domestic securities exchange are valued at the last reported sales price or at the official closing price as provided by the exchange. Equity securities traded on foreign securities exchanges are generally valued at the closing price of such securities on the exchange where primarily traded or at the close of the NYSE, if that is earlier. If no last sales price is reported, or if local convention or regulation so provides, the mean of the latest bid and asked prices may be used. Securities traded over-the-counter are valued at the mean of the latest bid and asked prices, the last sales price, or the official closing price. Equity securities initially expressed in local currencies are translated into U.S. dollars at the mean of the appropriate currency exchange rate at the close of the NYSE as provided by an independent pricing service.
Open-end management investment companies are valued at the reported net asset value per share. Repurchase agreements are valued at cost, which approximates fair value. Forward foreign currency exchange contracts are valued at the mean of the appropriate forward exchange rate at the close of the NYSE as provided by an independent pricing service.
If the fund determines that the market price for an investment is not readily available or the valuation methods mentioned above do not reflect an investment’s fair value, such investment is valued as determined in good faith by the Board of Directors or its delegate, in accordance with policies and procedures adopted by the Board of Directors. In its determination of fair value, the fund may review several factors including, but not limited to, market information regarding the specific investment or comparable investments and correlation with other investment types, futures indices or general market indicators. Circumstances that may cause the fund to use these procedures to value an investment include, but are not limited to: an investment has been declared in default or is distressed; trading in a security has been suspended during the trading day or a security is not actively trading on its principal exchange; prices received from a regular pricing source are deemed unreliable; or there is a foreign market holiday and no trading occurred.
The fund monitors for significant events occurring after the close of an investment’s primary exchange but before the fund’s net asset value per share is determined. Significant events may include, but are not limited to: corporate announcements and transactions; governmental action and political unrest that could impact a specific investment or an investment sector; or armed conflicts, natural disasters and similar events that could
affect investments in a specific country or region. The fund also monitors for significant fluctuations between domestic and foreign markets, as evidenced by the U.S. market or such other indicators that the Board of Directors, or its delegate, deems appropriate. If significant fluctuations in foreign markets are identified, the fund may apply a model-derived factor to the closing price of equity securities traded on foreign securities exchanges. The factor is based on observable market data as provided by an independent pricing service.
Security Transactions — Security transactions are accounted for as of the trade date. Net realized gains and losses are determined on the identified cost basis, which is also used for federal income tax purposes.
Investment Income — Dividend income less foreign taxes withheld, if any, is recorded as of the ex-dividend date. Distributions received on securities that represent a return of capital or long-term capital gain are recorded as a reduction of cost of investments and/or as a realized gain. The fund may estimate the components of distributions received that may be considered nontaxable distributions or long-term capital gain distributions for income tax purposes. Interest income is recorded on the accrual basis and includes accretion of discounts and amortization of premiums.
Foreign Currency Translations — All assets and liabilities initially expressed in foreign currencies are translated into U.S. dollars at prevailing exchange rates at period end. The fund may enter into spot foreign currency exchange contracts to facilitate transactions denominated in a foreign currency. Purchases and sales of investment securities, dividend and interest income, spot foreign currency exchange contracts, and expenses are translated at the rates of exchange prevailing on the respective dates of such transactions. Net realized and unrealized foreign currency exchange gains or losses related to investment securities are a component of net realized gain (loss) on investment transactions and change in net unrealized appreciation (depreciation) on investments, respectively.
Repurchase Agreements — The fund may enter into repurchase agreements with institutions that American Century Investment Management, Inc. (ACIM) (the investment advisor) has determined are creditworthy pursuant to criteria adopted by the Board of Directors. The fund requires that the collateral, represented by securities, received in a repurchase transaction be transferred to the custodian in a manner sufficient to enable the fund to obtain those securities in the event of a default under the repurchase agreement. ACIM monitors, on a daily basis, the securities transferred to ensure the value, including accrued interest, of the securities under each repurchase agreement is equal to or greater than amounts owed to the fund under each repurchase agreement.
Joint Trading Account — Pursuant to an Exemptive Order issued by the Securities and Exchange Commission, the fund, along with certain other funds in the American Century Investments family of funds, may transfer uninvested cash balances into a joint trading account. These balances are invested in one or more repurchase agreements that are collateralized by U.S. Treasury or Agency obligations.
Income Tax Status — It is the fund’s policy to distribute substantially all net investment income and net realized gains to shareholders and to otherwise qualify as a regulated investment company under provisions of the Internal Revenue Code. Accordingly, no provision has been made for income taxes. The fund files U.S. federal, state, local and non-U.S. tax returns as applicable. The fund's tax returns are subject to examination by the relevant taxing authority until expiration of the applicable statute of limitations, which is generally three years from the date of filing but can be longer in certain jurisdictions. At this time, management believes there are no uncertain tax positions which, based on their technical merit, would not be sustained upon examination and for which it is reasonably possible that the total amounts of unrecognized tax benefits will significantly change in the next twelve months.
Multiple Class — All shares of the fund represent an equal pro rata interest in the net assets of the class to which such shares belong, and have identical voting, dividend, liquidation and other rights and the same terms and conditions, except for class specific expenses and exclusive rights to vote on matters affecting only individual classes. Income, non-class specific expenses, and realized and unrealized capital gains and losses of the fund are allocated to each class of shares based on their relative net assets.
Distributions to Shareholders — Distributions from net investment income, if any, are generally declared and paid quarterly. Distributions from net realized gains, if any, are generally declared and paid annually.
Redemption Fees — Prior to August 7, 2015, the fund may have imposed a 1.00% redemption fee on shares held less than 60 days. The fee was not applicable to all classes. The redemption fee was retained by the fund to help cover transaction costs that long-term investors may bear when the fund sells securities to meet investor redemptions.
Indemnifications — Under the corporation’s organizational documents, its officers and directors are indemnified against certain liabilities arising out of the performance of their duties to the fund. In addition, in the normal course of business, the fund enters into contracts that provide general indemnifications. The maximum exposure under these arrangements is unknown as this would involve future claims that may be made against a fund. The risk of material loss from such claims is considered by management to be remote.
3. Fees and Transactions with Related Parties
Certain officers and directors of the corporation are also officers and/or directors of American Century Companies, Inc. (ACC). The corporation’s investment advisor, ACIM, the corporation's distributor, American Century Investment Services, Inc. (ACIS), and the corporation’s transfer agent, American Century Services, LLC, are wholly owned, directly or indirectly, by ACC.
Management Fees — The corporation has entered into a management agreement with ACIM, under which ACIM provides the fund with investment advisory and management services in exchange for a single, unified management fee (the fee) per class. The agreement provides that all expenses of managing and operating the fund, except distribution fees, brokerage expenses, taxes, interest, fees and expenses of the independent directors (including legal counsel fees), and extraordinary expenses, will be paid by ACIM. The fee is computed and accrued daily based on each class’s daily net assets and paid monthly in arrears. The rate of the fee is determined by applying a fee rate calculation formula. This formula takes into account the fund’s assets as well as certain assets, if any, of other clients of the investment advisor outside the American Century Investments family of funds (such as subadvised funds and separate accounts) that have very similar investment teams and investment strategies (strategy assets). The annual management fee schedule ranges from 0.90% to 1.00% for Class I and from 0.80% to 0.90% for Class II. From January 1, 2016 to July 31, 2016, the investment advisor agreed to waive 0.18% of the fund’s management fee. Effective August 1, 2016, the investment advisor agreed to waive 0.15% of the fund’s management fee. The investment advisor expects this waiver to continue until July 31, 2017 and cannot terminate it prior to such date without the approval of the Board of Directors. The total amount of the waiver for each class for the year ended December 31, 2016 was $695,804 and $718,564 for Class I and Class II, respectively. The effective annual management fee before waiver for each class for the year ended December 31, 2016 was 0.97% and 0.87% for Class I and Class II, respectively. The effective annual management fee after waiver for each class for the year ended December 31, 2016 was 0.80% and 0.70% for Class I and Class II, respectively.
Distribution Fees — The Board of Directors has adopted the Master Distribution Plan (the plan) for Class II, pursuant to Rule 12b-1 of the 1940 Act. The plan provides that Class II will pay ACIS an annual distribution fee equal to 0.25%. The fee is computed and accrued daily based on the Class II daily net assets and paid monthly in arrears. The distribution fee provides compensation for expenses incurred in connection with distributing shares of Class II including, but not limited to, payments to brokers, dealers, and financial institutions that have entered into sales agreements with respect to shares of the fund. Fees incurred under the plan during the year ended December 31, 2016 are detailed in the Statement of Operations.
Directors' Fees and Expenses — The Board of Directors is responsible for overseeing the investment advisor’s management and operations of the fund. The directors receive detailed information about the fund and its investment advisor regularly throughout the year, and meet at least quarterly with management of the investment advisor to review reports about fund operations. The fund’s officers do not receive compensation from the fund.
Interfund Transactions — The fund may enter into security transactions with other American Century Investments funds and other client accounts of the investment advisor, in accordance with the 1940 Act rules and procedures adopted by the Board of Directors. The rules and procedures require, among other things, that these transactions be effected at the independent current market price of the security. During the period, the interfund purchases and sales were $3,055,337 and $6,325,274, respectively. The effect of interfund transactions on the Statement of Operations was $1,125,159 in net realized gain (loss) on investment transactions.
4. Investment Transactions
Purchases and sales of investment securities, excluding short-term investments, for the year ended December 31, 2016 were $386,277,815 and $390,198,296, respectively.
5. Capital Share Transactions
Transactions in shares of the fund were as follows:
|
| | | | | | | | | | |
| | Year ended
December 31, 2016 | Year ended
December 31, 2015 |
| | Shares | Amount | Shares | Amount |
| Class I/Shares Authorized | 650,000,000 |
| | 650,000,000 |
| |
| Sold | 7,363,485 |
| $ | 70,891,775 |
| 8,988,954 |
| $ | 82,756,006 |
|
| Issued in reinvestment of distributions | 746,092 |
| 7,111,636 |
| 1,000,492 |
| 9,032,325 |
|
| Redeemed | (10,111,116 | ) | (94,684,983 | ) | (12,109,013 | ) | (111,684,861 | ) |
| | (2,001,539 | ) | (16,681,572 | ) | (2,119,567 | ) | (19,896,530 | ) |
| Class II/Shares Authorized | 350,000,000 |
| | 350,000,000 |
| |
| Sold | 5,753,610 |
| 55,002,784 |
| 5,009,077 |
| 46,360,967 |
|
| Issued in reinvestment of distributions | 722,088 |
| 6,891,085 |
| 959,450 |
| 8,671,895 |
|
| Redeemed | (6,255,426 | ) | (57,989,516 | ) | (7,316,278 | ) | (67,257,892 | ) |
| | 220,272 |
| 3,904,353 |
| (1,347,751 | ) | (12,225,030 | ) |
| Class III/Shares Authorized | 50,000,000 |
| | 50,000,000 |
| |
| Sold | | | 187,559 |
| 1,740,327 |
|
| Issued in reinvestment of distributions | | | 16,965 |
| 159,675 |
|
| Redeemed | | | (2,019,139 | ) | (18,615,668 | ) |
| | | | (1,814,615 | ) | (16,715,666 | ) |
| Net increase (decrease) | (1,781,267 | ) | $ | (12,777,219 | ) | (5,281,933 | ) | $ | (48,837,226 | ) |
6. Fair Value Measurements
The fund’s investments valuation process is based on several considerations and may use multiple inputs to determine the fair value of the investments held by the fund. In conformity with accounting principles generally accepted in the United States of America, the inputs used to determine a valuation are classified into three broad levels.
| |
| • | Level 1 valuation inputs consist of unadjusted quoted prices in an active market for identical investments. |
| |
| • | Level 2 valuation inputs consist of direct or indirect observable market data (including quoted prices for comparable investments, evaluations of subsequent market events, interest rates, prepayment speeds, credit risk, etc.). These inputs also consist of quoted prices for identical investments initially expressed in local currencies that are adjusted through translation into U.S. dollars. |
| |
| • | Level 3 valuation inputs consist of unobservable data (including a fund’s own assumptions). |
The level classification is based on the lowest level input that is significant to the fair valuation measurement. The valuation inputs are not necessarily an indication of the risks associated with investing in these securities or other financial instruments. There were no significant transfers between levels during the period.
The following is a summary of the level classifications as of period end. The Schedule of Investments provides additional information on the fund’s portfolio holdings. |
| | | | | | | | |
| | Level 1 | Level 2 | Level 3 |
| Assets | | | |
| Investment Securities | | | |
| Common Stocks | $ | 889,533,781 |
| $ | 33,936,719 |
| — |
|
| Temporary Cash Investments | 11,847,065 |
| 16,423,000 |
| — |
|
| | $ | 901,380,846 |
| $ | 50,359,719 |
| — |
|
| Other Financial Instruments | | | |
| Forward Foreign Currency Exchange Contracts | — |
| $ | 71,247 |
| — |
|
| | | | |
| Liabilities | | | |
| Other Financial Instruments | | | |
| Forward Foreign Currency Exchange Contracts | — |
| $ | 241,734 |
| — |
|
7. Derivative Instruments
Foreign Currency Risk — The fund is subject to foreign currency exchange rate risk in the normal course of pursuing its investment objectives. The value of foreign investments held by a fund may be significantly affected by changes in foreign currency exchange rates. The dollar value of a foreign security generally decreases when the value of the dollar rises against the foreign currency in which the security is denominated and tends to increase when the value of the dollar declines against such foreign currency. A fund may enter into forward foreign currency exchange contracts to reduce a fund's exposure to foreign currency exchange rate fluctuations. The net U.S. dollar value of foreign currency underlying all contractual commitments held by a fund and the resulting unrealized appreciation or depreciation are determined daily. Realized gain or loss is recorded upon the termination of the contract. Net realized and unrealized gains or losses occurring during the holding period of forward foreign currency exchange contracts are a component of net realized gain (loss) on foreign currency transactions and change in net unrealized appreciation (depreciation) on translation of assets and liabilities in foreign currencies, respectively. A fund bears the risk of an unfavorable change in the foreign currency exchange rate underlying the forward contract. Additionally, losses, up to the fair value, may arise if the counterparties do not perform under the contract terms. The fund's average U.S. dollar exposure to foreign currency risk derivative instruments held during the period was $25,597,082.
The value of foreign currency risk derivative instruments as of December 31, 2016, is disclosed on the Statement of Assets and Liabilities as an asset of $71,247 in unrealized appreciation on forward foreign currency exchange contracts and a liability of $241,734 in unrealized depreciation on forward foreign currency exchange contracts. For the year ended December 31, 2016, the effect of foreign currency risk derivative instruments on the Statement of Operations was $996,331 in net realized gain (loss) on foreign currency transactions and $(210,781) in change in net unrealized appreciation (depreciation) on translation of assets and liabilities in foreign currencies.
8. Federal Tax Information
The tax character of distributions paid during the years ended December 31, 2016 and December 31, 2015 were as follows:
|
| | | | | | |
| | 2016 | 2015 |
| Distributions Paid From | | |
| Ordinary income | $ | 14,179,518 |
| $ | 18,051,876 |
|
| Long-term capital gains | — |
| — |
|
The book-basis character of distributions made during the year from net investment income or net realized gains may differ from their ultimate characterization for federal income tax purposes. These differences reflect the differing character of certain income items and net realized gains and losses for financial statement and tax purposes, and may result in reclassification among certain capital accounts on the financial statements.
As of December 31, 2016, the federal tax cost of investments and the components of distributable earnings on a tax-basis were as follows:
|
| | | |
| Federal tax cost of investments | $ | 820,180,447 |
|
| Gross tax appreciation of investments | $ | 155,823,595 |
|
| Gross tax depreciation of investments | (24,263,477 | ) |
| Net tax appreciation (depreciation) of investments | 131,560,118 |
|
Net tax appreciation (depreciation) on derivatives and translation of assets and liabilities in foreign currencies
| (3,400 | ) |
Net tax appreciation (depreciation)
| $ | 131,556,718 |
|
| Undistributed ordinary income | $ | 713,133 |
|
| Accumulated short-term capital losses | $ | (62,412,819 | ) |
The difference between book-basis and tax-basis unrealized appreciation (depreciation) is attributable primarily to the tax deferral of losses on wash sales.
Accumulated capital losses represent net capital loss carryovers that may be used to offset future realized capital gains for federal income tax purposes. Future capital loss carryover utilization in any given year may be subject to Internal Revenue Code limitations. Capital loss carryovers expire in 2017.
9. Recently Issued Accounting Guidance
In October 2016, the Securities and Exchange Commission adopted new rules and forms as well as amendments to its rules and forms to modernize the reporting and disclosure of information by registered investment companies. The amendments to Regulation S-X will require standardized, enhanced disclosure about derivatives in investment company financial statements, as well as other provisions. Compliance with the amendments is effective on August 1, 2017. Management is currently evaluating the impact that adopting the amendments will have on the financial statement disclosures.
|
| | | | | | | | | | | | | | | |
| For a Share Outstanding Throughout the Years Ended December 31 (except as noted) |
| Per-Share Data | | | Ratios and Supplemental Data |
| | | Income From Investment Operations: | | | | Ratio to Average Net Assets of: | | |
| | Net Asset Value, Beginning of Period | Net Investment Income (Loss)(1) | Net Realized and Unrealized Gain (Loss) | Total From Investment Operations | Distributions From Net Investment Income | Net Asset Value, End of Period | Total Return(2) | Operating Expenses | Operating Expenses (before expense waiver) | Net Investment Income (Loss) | Net Investment Income (Loss) (before expense waiver) | Portfolio Turnover Rate | Net Assets, End of Period (in thousands) |
| Class I | | | | | | | | | | |
| 2016 | $8.85 | 0.17 | 1.62 | 1.79 | (0.16) | $10.48 | 20.48% | 0.81% | 0.98% | 1.77% | 1.60% | 46% |
| $461,586 |
|
| 2015 | $9.41 | 0.18 | (0.54) | (0.36) | (0.20) | $8.85 | (3.88)% | 0.80% | 0.97% | 1.96% | 1.79% | 47% |
| $407,398 |
|
| 2014 | $8.45 | 0.15 | 0.95 | 1.10 | (0.14) | $9.41 | 13.08% | 0.84% | 0.96% | 1.66% | 1.54% | 44% |
| $453,412 |
|
| 2013 | $6.52 | 0.14 | 1.92 | 2.06 | (0.13) | $8.45 | 31.73% | 0.88% | 0.97% | 1.79% | 1.70% | 51% |
| $430,392 |
|
| 2012 | $5.80 | 0.11 | 0.73 | 0.84 | (0.12) | $6.52 | 14.58% | 0.94% | 0.98% | 1.74% | 1.70% | 47% |
| $354,809 |
|
| Class II | | | | | | | | | | |
| 2016 | $8.86 | 0.15 | 1.63 | 1.78 | (0.15) | $10.49 | 20.28% | 0.96% | 1.13% | 1.62% | 1.45% | 46% |
| $489,026 |
|
| 2015 | $9.42 | 0.17 | (0.55) | (0.38) | (0.18) | $8.86 | (4.02)% | 0.95% | 1.12% | 1.81% | 1.64% | 47% |
| $410,920 |
|
| 2014 | $8.46 | 0.13 | 0.95 | 1.08 | (0.12) | $9.42 | 12.89% | 0.99% | 1.11% | 1.51% | 1.39% | 44% |
| $449,906 |
|
| 2013 | $6.53 | 0.12 | 1.92 | 2.04 | (0.11) | $8.46 | 31.48% | 1.03% | 1.12% | 1.64% | 1.55% | 51% |
| $508,757 |
|
| 2012 | $5.80 | 0.10 | 0.74 | 0.84 | (0.11) | $6.53 | 14.58% | 1.09% | 1.13% | 1.59% | 1.55% | 47% |
| $408,104 |
|
|
|
| Notes to Financial Highlights |
| |
| (1) | Computed using average shares outstanding throughout the period. |
| |
| (2) | Total returns are calculated based on the net asset value of the last business day. Total returns for periods less than one year are not annualized. |
See Notes to Financial Statements.
|
|
| Report of Independent Registered Public Accounting Firm |
To the Board of Directors and Shareholders of American Century Variable Portfolios, Inc.:
We have audited the accompanying statement of assets and liabilities, including the schedule of investments, of VP Value Fund (the “Fund”), one of the funds constituting American Century Variable Portfolios, Inc., as of December 31, 2016, and the related statement of operations for the year then ended, the statements of changes in net assets for each of the two years in the period then ended, and the financial highlights for each of the five years in the period then ended. These financial statements and financial highlights are the responsibility of the Fund’s management. Our responsibility is to express an opinion on these financial statements and financial highlights based on our audits.
We conducted our audits in accordance with the standards of the Public Company Accounting Oversight Board (United States). Those standards require that we plan and perform the audit to obtain reasonable assurance about whether the financial statements and financial highlights are free of material misstatement. The Fund is not required to have, nor were we engaged to perform, an audit of its internal control over financial reporting. Our audits included consideration of internal control over financial reporting as a basis for designing audit procedures that are appropriate in the circumstances, but not for the purpose of expressing an opinion on the effectiveness of the Fund’s internal control over financial reporting. Accordingly, we express no such opinion. An audit also includes examining, on a test basis, evidence supporting the amounts and disclosures in the financial statements, assessing the accounting principles used and significant estimates made by management, as well as evaluating the overall financial statement presentation. Our procedures included confirmation of securities owned as of December 31, 2016, by correspondence with the custodian and brokers; when replies were not received from brokers, we performed other auditing procedures. We believe that our audits provide a reasonable basis for our opinion.
In our opinion, the financial statements and financial highlights referred to above present fairly, in all material respects, the financial position of VP Value Fund of American Century Variable Portfolios, Inc. as of December 31, 2016, the results of its operations for the year then ended, the changes in its net assets for each of the two years in the period then ended, and the financial highlights for each of the five years in the period then ended, in conformity with accounting principles generally accepted in the United States of America.
DELOITTE & TOUCHE LLP
Kansas City, Missouri
February 10, 2017
The Board of Directors
The individuals listed below serve as directors of the funds. Each director will continue to serve in this capacity until death, retirement, resignation or removal from office. The board has adopted a mandatory retirement age for directors who are not “interested persons,” as that term is defined in the Investment Company Act (independent directors). Independent directors shall retire by December 31 of the year in which they reach their 75th birthday.
Mr. Thomas is an “interested person” because he currently serves as President and Chief Executive Officer of American Century Companies, Inc. (ACC), the parent company of American Century Investment Management, Inc. (ACIM or the advisor). The other directors (more than three-fourths of the total number) are independent. They are not employees, directors or officers of, and have no financial interest in, ACC or any of its wholly owned, direct or indirect, subsidiaries, including ACIM, American Century Investment Services, Inc. (ACIS) and American Century Services, LLC (ACS), and they do not have any other affiliations, positions or relationships that would cause them to be considered “interested persons” under the Investment Company Act. The directors serve in this capacity for seven (in the case of Mr. Thomas, 15) registered investment companies in the American Century Investments family of funds.
The following table presents additional information about the directors. The mailing address for each director is 4500 Main Street, Kansas City, Missouri 64111.
|
| | | | | |
Name
(Year of Birth) | Position(s) Held with Funds | Length of Time Served | Principal Occupation(s) During Past 5 Years | Number of American Century Portfolios Overseen by Director | Other Directorships Held During Past 5 Years |
| Independent Directors |
|
|
Barry Fink
(1955) | Director | Since 2012 (independent since 2016) | Retired; Executive Vice President, ACC (2007 to 2013); President, ACS (2007 to 2013); Chief Operating Officer, ACC (2007 to 2012) | 81 | None |
Andrea C. Hall
(1945) | Director | Since 1997 | Retired | 81 | None |
Jan M. Lewis
(1957) | Director | Since 2011 | Retired; President and Chief Executive Officer, Catholic Charities of Northeast Kansas (human services organization) (2006 to 2013) | 81 | None |
James A. Olson
(1942) | Director and Chairman of the Board | Since 2007 (Chairman since 2014) | Member, Plaza Belmont LLC (private equity fund manager) (1999 to present) | 81 | Saia, Inc. (2002 to 2012) and EPR Properties (2003 to 2013) |
M. Jeannine Strandjord
(1945) | Director | Since 1994 | Retired | 81 | Euronet Worldwide Inc.; MGP Ingredients, Inc.; and DST Systems Inc. (1996 to 2012) |
|
| | | | | |
Name
(Year of Birth) | Position(s) Held with Funds | Length of Time Served | Principal Occupation(s) During Past 5 Years | Number of American Century Portfolios Overseen by Director | Other Directorships Held During Past 5 Years |
| Independent Directors |
|
|
John R. Whitten
(1946) | Director | Since 2008 | Retired | 81 | Rudolph Technologies, Inc. |
Stephen E. Yates
(1948) | Director | Since 2012 | Retired | 81 | None |
| Interested Director |
|
|
Jonathan S. Thomas
(1963) | Director and President | Since 2007 | President and Chief Executive Officer, ACC (2007 to present). Also serves as Chief Executive Officer, ACS; Executive Vice President, ACIM; Director, ACC, ACIM and other ACC subsidiaries | 126 | BioMed Valley Discoveries, Inc. |
The Statement of Additional Information has additional information about the fund's directors and is available without charge, upon request, by calling 1-800-378-9878.
Officers
The following table presents certain information about the executive officers of the funds. Each officer serves as an officer for each of the 15 investment companies in the American Century family of funds, unless otherwise noted. No officer is compensated for his or her service as an officer of the funds. The listed officers are interested persons of the funds and are appointed or re-appointed on an annual basis. The mailing address for each officer listed below is 4500 Main Street, Kansas City, Missouri 64111.
|
| | |
Name
(Year of Birth) | Offices with the Funds | Principal Occupation(s) During the Past Five Years |
Jonathan S. Thomas
(1963) | Director and President since 2007 | President and Chief Executive Officer, ACC (2007 to present). Also serves as Chief Executive Officer, ACS; Executive Vice President, ACIM; Director, ACC, ACIM and other ACC subsidiaries |
Amy D. Shelton
(1964) | Chief Compliance Officer and Vice President since 2014 | Chief Compliance Officer, American Century funds, (2014 to present); Chief Compliance Officer, ACIM (2014 to present); Chief Compliance Officer, ACIS (2009 to present); Vice President, Client Interactions and Marketing, ACIS (2013 to 2014); Director, Client Interactions and Marketing, ACIS (2007 to 2013). Also serves as Vice President, ACIS |
Charles A. Etherington
(1957) | General Counsel since 2007 and Senior Vice President since 2006 | Attorney, ACC (1994 to present); Vice President, ACC (2005 to present); General Counsel, ACC (2007 to present). Also serves as General Counsel, ACIM, ACS, ACIS and other ACC subsidiaries; and Senior Vice President, ACIM and ACS |
C. Jean Wade
(1964) | Vice President,Treasurer and Chief Financial Officer since 2012 | Vice President, ACS (2000 to present) |
Robert J. Leach
(1966) | Vice President since 2006 and Assistant Treasurer since 2012 | Vice President, ACS (2000 to present) |
David H. Reinmiller
(1963) | Vice President since 2000 | Attorney, ACC (1994 to present); Associate General Counsel, ACC (2001 to present). Also serves as Vice President, ACIM and ACS |
Ward D. Stauffer
(1960) | Secretary since 2005 | Attorney, ACC (2003 to present) |
Proxy Voting Policies
A description of the policies that the fund's investment advisor uses in exercising the voting rights associated with the securities purchased and/or held by the fund is available without charge, upon request, by calling 1-800-378-9878. It is also available on the "About Us" page of American Century Investments’ website at americancentury.com and on the Securities and Exchange Commission’s website at sec.gov. Information regarding how the investment advisor voted proxies relating to portfolio securities during the most recent 12-month period ended June 30 is available on the "About Us" page at americancentury.com. It is also available at sec.gov.
Quarterly Portfolio Disclosure
The fund files its complete schedule of portfolio holdings with the Securities and Exchange Commission (SEC) for the first and third quarters of each fiscal year on Form N-Q. The fund’s Forms N-Q are available on the SEC’s website at sec.gov, and may be reviewed and copied at the SEC’s Public Reference Room in Washington, DC. Information on the operation of the Public Reference Room may be obtained by calling 1-800-SEC-0330. The fund also makes its complete schedule of portfolio holdings for the most recent quarter of its fiscal year available on its website at ipro.americancentury.com (for Investment Professionals) and, upon request, by calling 1-800-378-9878.
Other Tax Information
The following information is provided pursuant to provisions of the Internal Revenue Code.
For corporate taxpayers, the fund hereby designates $14,179,518, or up to the maximum amount allowable, of ordinary income distributions paid during the fiscal year ended December 31, 2016 as qualified for the corporate dividends received deduction.
|
| | |
| |
| | | |
| Contact Us | americancentury.com | |
| Automated Information Line | 1-800-345-8765 | |
| Investment Professional Service Representatives | 1-800-345-6488 | |
| Telecommunications Relay Service for the Deaf | 711 | |
| | | |
| American Century Variable Portfolios, Inc. | |
| | | |
Investment Advisor: American Century Investment Management, Inc. Kansas City, Missouri | |
| | | |
| This report and the statements it contains are submitted for the general information of our shareholders. The report is not authorized for distribution to prospective investors unless preceded or accompanied by an effective prospectus. | |
| | | |
©2017 American Century Proprietary Holdings, Inc. All rights reserved.
CL-ANN-91440 1702 | |
ITEM 2. CODE OF ETHICS.
| |
| (a) | The registrant has adopted a Code of Ethics for Senior Financial Officers that applies to the registrant’s principal executive officer, principal financial officer, principal accounting officer, and persons performing similar functions. |
| |
| (f) | The registrant’s Code of Ethics for Senior Financial Officers was filed as Exhibit 12 (a)(1) to American Century Asset Allocation Portfolios, Inc.’s Annual Certified Shareholder Report on Form N-CSR, File No. 811-21591, on September 29, 2005, and is incorporated herein by reference. |
ITEM 3. AUDIT COMMITTEE FINANCIAL EXPERT.
| |
| (a)(1) | The registrant’s board has determined that the registrant has at least one audit committee financial expert serving on its audit committee. |
| |
| (a)(2) | John R. Whitten is the registrant’s designated audit committee financial expert. He is “independent” as defined in Item 3 of Form N-CSR. |
ITEM 4. PRINCIPAL ACCOUNTANT FEES AND SERVICES.
The aggregate fees billed for each of the last two fiscal years for professional services rendered by the principal accountant for the audit of the registrant’s annual financial statements or services that are normally provided by the accountant in connection with statutory and regulatory filings or engagements for those fiscal years were as follows:
FY 2015: $199,183
FY 2016: $199,800
The aggregate fees billed in each of the last two fiscal years for assurance and related services by the principal accountant that are reasonably related to the performance of the audit of the registrant’s financial statements and are not reported under paragraph (a) of this Item were as follows:
For services rendered to the registrant:
FY 2015: $0
FY 2016: $0
Fees required to be approved pursuant to paragraph (c)(7)(ii) of Rule 2-01 of Regulation S-X (relating to certain engagements for non-audit services with the registrant’s investment adviser and its affiliates):
FY 2015: $0
FY 2016: $0
The aggregate fees billed in each of the last two fiscal years for professional services rendered by the principal accountant for tax compliance, tax advice, and tax planning were as follows:
For services rendered to the registrant:
FY 2015: $0
FY 2016: $0
Fees required to be approved pursuant to paragraph (c)(7)(ii) of Rule 2-01 of Regulation S-X (relating to certain engagements for non-audit services with the registrant’s investment adviser and its affiliates):
FY 2015: $0
FY 2016: $0
The aggregate fees billed in each of the last two fiscal years for products and services provided by the principal accountant, other than the services reported in paragraphs (a) through (c) of this Item were as follows:
For services rendered to the registrant:
FY 2015: $0
FY 2016: $0
Fees required to be approved pursuant to paragraph (c)(7)(ii) of Rule 2-01 of Regulation S-X (relating to certain engagements for non-audit services with the registrant’s investment adviser and its affiliates):
FY 2015: $0
FY 2016: $0
| |
| (e)(1) | In accordance with paragraph (c)(7)(i)(A) of Rule 2-01 of Regulation S-X, before the accountant is engaged by the registrant to render audit or non-audit services, the engagement is approved by the registrant’s audit committee. Pursuant to paragraph (c)(7)(ii) of Rule 2-01 of Regulation S-X, the registrant’s audit committee also pre-approves its accountant’s engagements for non-audit services with the registrant’s investment adviser, its parent company, and any entity controlled by, or under common control with the investment adviser that provides ongoing services to the registrant, if the engagement relates directly to the operations and financial reporting of the registrant. |
| |
| (e)(2) | All services described in each of paragraphs (b) through (d) of this Item were pre-approved before the engagement by the registrant’s audit committee pursuant to paragraph (c)(7)(i)(A) of Rule 2-01 of Regulation S-X. Consequently, none of such services were required to be approved by the audit committee pursuant to paragraph (c)(7)(i)(C). |
| |
| (f) | The percentage of hours expended on the principal accountant’s engagement to audit the registrant’s financial statements for the most recent fiscal year that were attributed to work performed by persons other than the principal accountant’s full-time, permanent employees was less than 50%. |
| |
| (g) | The aggregate non-audit fees billed by the registrant’s accountant for services rendered to the registrant, and rendered to the registrant’s investment adviser (not including any sub-adviser whose role is primarily portfolio management and is subcontracted with or overseen by another investment adviser), and any entity controlling, controlled by, or under common control with the adviser that provides ongoing services to the registrant for each of the last two fiscal years of the registrant were as follows: |
FY 2015: $86,000
FY 2016: $829,350
| |
| (h) | The registrant’s investment adviser and accountant have notified the registrant’s audit committee of all non-audit services that were rendered by the registrant’s accountant to the registrant’s investment adviser, its parent company, and any entity controlled by, or under common control with the investment adviser that provides services to the registrant, which services were not required to be pre-approved pursuant to paragraph (c)(7)(ii) of Rule 2-01 of Regulation S-X. The notification provided to the registrant’s audit committee included sufficient details regarding such services to allow the registrant’s audit committee to consider the continuing independence of its principal accountant. |
ITEM 5. AUDIT COMMITTEE OF LISTED REGISTRANTS.
Not applicable.
ITEM 6. INVESTMENTS.
| |
| (a) | The schedule of investments is included as part of the report to stockholders filed under Item 1 of this Form. |
ITEM 7. DISCLOSURE OF PROXY VOTING POLICIES AND PROCEDURES FOR CLOSED-END MANAGEMENT INVESTMENT COMPANIES.
Not applicable.
ITEM 8. PORTFOLIO MANAGERS OF CLOSED-END MANAGEMENT INVESTMENT COMPANIES.
Not applicable.
ITEM 9. PURCHASES OF EQUITY SECURITIES BY CLOSED-END MANAGEMENT INVESTMENT COMPANY AND AFFILIATED PURCHASERS.
Not applicable.
ITEM 10. SUBMISSION OF MATTERS TO A VOTE OF SECURITY HOLDERS.
During the reporting period, there were no material changes to the procedures by which shareholders may recommend nominees to the registrant’s board.
ITEM 11. CONTROLS AND PROCEDURES.
| |
| (a) | The registrant's principal executive officer and principal financial officer have concluded that the registrant's disclosure controls and procedures (as defined in Rule 30a-3(c) under the Investment Company Act of 1940) are effective based on their evaluation of these controls and procedures as of a date within 90 days of the filing date of this report. |
| |
| (b) | There were no changes in the registrant's internal control over financial reporting (as defined in Rule 30a-3(d) under the Investment Company Act of 1940) that occurred during the registrant's second fiscal quarter of the period covered by this report that have materially affected, or are reasonably likely to materially affect, the registrant's internal control over financial reporting. |
ITEM 12. EXHIBITS.
| |
| (a)(1) | Registrant’s Code of Ethics for Senior Financial Officers, which is the subject of the disclosure required by Item 2 of Form N-CSR, was filed as Exhibit 12(a)(1) to American Century Asset Allocation Portfolios, Inc.’s Certified Shareholder Report on Form N-CSR, File No. 811-21591, on September 29, 2005. |
| |
| (a)(2) | Separate certifications by the registrant’s principal executive officer and principal financial officer, pursuant to Section 302 of the Sarbanes-Oxley Act of 2002 and Rule 30a-2(a) under the Investment Company Act of 1940, are filed and attached hereto as EX-99.CERT. |
| |
| (b) | A certification by the registrant’s chief executive officer and chief financial officer, pursuant to Section 906 of the Sarbanes-Oxley Act of 2002, is furnished and attached hereto as EX-99.906CERT. |
SIGNATURES
Pursuant to the requirements of the Securities Exchange Act of 1934 and the Investment Company Act of 1940, the registrant has duly caused this report to be signed on its behalf by the undersigned, thereunto duly authorized.
|
| | | | |
| Registrant: | American Century Variable Portfolios, Inc. | |
| | | | |
| By: | /s/ Jonathan S. Thomas | |
| | Name: | Jonathan S. Thomas | |
| | Title: | President | |
| | | | |
| Date: | February 23, 2017 | |
Pursuant to the requirements of the Securities Exchange Act of 1934 and the Investment Company Act of 1940, this report has been signed below by the following persons on behalf of the registrant and in the capacities and on the dates indicated.
|
| | | |
| By: | /s/ Jonathan S. Thomas | |
| | Name: | Jonathan S. Thomas | |
| | Title: | President | |
| | | (principal executive officer) | |
| | | | |
| Date: | February 23, 2017 | |
|
| | | |
| By: | /s/ C. Jean Wade | |
| | Name: | C. Jean Wade | |
| | Title: | Vice President, Treasurer, and | |
| | | Chief Financial Officer | |
| | | (principal financial officer) | |
| | | | |
| Date: | February 23, 2017 | |