UNITED STATES
SECURITIES AND EXCHANGE COMMISSION
Washington, D.C. 20549
FORM N-CSR
CERTIFIED SHAREHOLDER REPORT OF REGISTERED
MANAGEMENT INVESTMENT COMPANIES
|
| | | | | | |
| Investment Company Act file number | 811-05188 |
| | |
| AMERICAN CENTURY VARIABLE PORTFOLIOS, INC. |
| (Exact name of registrant as specified in charter) |
| | |
| 4500 MAIN STREET, KANSAS CITY, MISSOURI | 64111 |
| (Address of principal executive offices) | (Zip Code) |
| | |
CHARLES A. ETHERINGTON 4500 MAIN STREET, KANSAS CITY, MISSOURI 64111 |
| (Name and address of agent for service) |
| | |
| Registrant’s telephone number, including area code: | 816-531-5575 |
| | |
| Date of fiscal year end: | 12-31 |
| | |
| Date of reporting period: | 12-31-2019 |
ITEM 1. REPORTS TO STOCKHOLDERS.
|
| |
| | |
| | Annual Report |
| | |
| | December 31, 2019 |
| | |
| | VP Balanced Fund |
| | Class I (AVBIX) |
| | Class II (AVBTX) |
Beginning on January 1, 2021, as permitted by regulations adopted by the Securities and Exchange Commission, paper copies of the fund’s shareholder reports like this one will no longer be sent by mail from the insurance company that offers your contract, unless you specifically request paper copies of the reports from the insurance company or from your financial intermediary. Instead, the reports will be made available on a website, and you will be notified by mail each time a report is posted and provided with a website link to access the report.
If you already elected to receive shareholder reports electronically, you will not be affected by this change and you need not take any action. You may elect to receive shareholder reports and other communications from the insurance company or your financial intermediary electronically by contacting the insurance company.
You may elect to receive all future reports in paper free of charge. You can inform the insurance company or your financial intermediary that you wish to continue receiving paper copies of your shareholder reports by contacting the insurance company. Your election to receive reports in paper will apply to all variable portfolios available under your contract.
|
| |
| Performance | |
| Portfolio Commentary | |
| Fund Characteristics | |
| Shareholder Fee Example | |
| Schedule of Investments | |
| Statement of Assets and Liabilities | |
| Statement of Operations | |
| Statement of Changes in Net Assets | |
| Notes to Financial Statements | |
| Financial Highlights | |
| Report of Independent Registered Public Accounting Firm | |
| Management | |
| Additional Information | |
Any opinions expressed in this report reflect those of the author as of the date of the report, and do not necessarily represent the opinions of American Century Investments® or any other person in the American Century Investments organization. Any such opinions are subject to change at any time based upon market or other conditions and American Century Investments disclaims any responsibility to update such opinions. These opinions may not be relied upon as investment advice and, because investment decisions made by American Century Investments funds are based on numerous factors, may not be relied upon as an indication of trading intent on behalf of any American Century Investments fund. Security examples are used for representational purposes only and are not intended as recommendations to purchase or sell securities. Performance information for comparative indices and securities is provided to American Century Investments by third party vendors. To the best of American Century Investments’ knowledge, such information is accurate at the time of printing.
|
| | | | | | |
| Total Returns as of December 31, 2019 |
| | | | Average Annual Returns | |
| | Ticker Symbol | 1 year | 5 years | 10 years | Since Inception | Inception Date |
| Class I | AVBIX | 19.85% | 6.47% | 8.78% | — | 5/1/91 |
| S&P 500 Index | — | 31.49% | 11.69% | 13.55% | — | — |
| Bloomberg Barclays U.S. Aggregate Bond Index | — | 8.72% | 3.05% | 3.74% | — | — |
| Blended Index | — | 22.18% | 8.37% | 9.77% | — | — |
| Class II | AVBTX | 19.39% | — | — | 8.84% | 5/2/16 |
Average annual returns since inception are presented when ten years of performance history is not available.
Fund returns would have been lower if a portion of the fees had not been waived. The blended index combines monthly returns of two widely known indices in proportion to the asset mix of the fund. The S&P 500 Index represents 60% of the index and the remaining 40% is represented by the Bloomberg Barclays U.S. Aggregate Bond Index.
The performance information presented does not include the fees and charges assessed with investments in variable insurance products, those charges are disclosed in the separate account prospectus. The inclusion of such fees and charges would lower performance.
Data presented reflect past performance. Past performance is no guarantee of future results. Current performance may be higher or lower than the performance shown. Total returns for periods less than one year are not annualized. Investment return and principal value will fluctuate, and redemption value may be more or less than original cost. Data assumes reinvestment of dividends and capital gains, and none of the charts reflect the deduction of taxes that a shareholder would pay on fund distributions or the redemption of fund shares. To obtain performance data current to the most recent month end, please call 1-800-345-6488 or visit ipro.americancentury.com (for Investment Professionals). For additional information about the fund, please consult the prospectus.
|
|
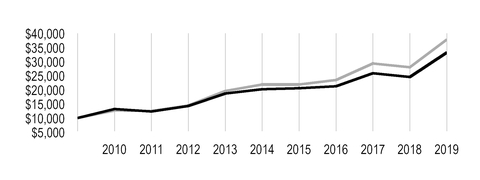
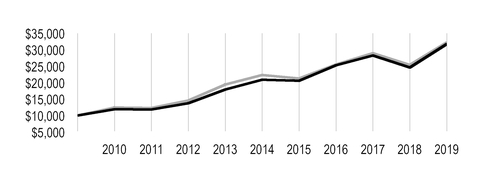
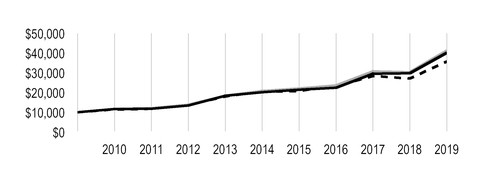
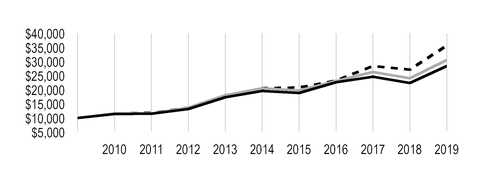
| Growth of $10,000 Over 10 Years |
| $10,000 investment made December 31, 2009 |
| Performance for other share classes will vary due to differences in fee structure. |
|
| |
| Value on December 31, 2019 |
| | Class I — $23,209 |
| |
| | S&P 500 Index — $35,666 |
| |
| | Bloomberg Barclays U.S. Aggregate Bond Index — $14,445 |
| |
| | Blended Index — $25,398 |
| |
Ending value of Class I would have been lower if a portion of the fees had not been waived.
|
| |
| Total Annual Fund Operating Expenses |
| Class I | Class II |
| 0.91% | 1.16% |
The total annual fund operating expenses shown is as stated in the fund’s prospectus current as of the date of this report. The prospectus may vary from the expense ratio shown elsewhere in this report because it is based on a different time period, includes acquired fund fees and expenses, and, if applicable, does not include fee waivers or expense reimbursements.
Data presented reflect past performance. Past performance is no guarantee of future results. Current performance may be higher or lower than the performance shown. Total returns for periods less than one year are not annualized. Investment return and principal value will fluctuate, and redemption value may be more or less than original cost. Data assumes reinvestment of dividends and capital gains, and none of the charts reflect the deduction of taxes that a shareholder would pay on fund distributions or the redemption of fund shares. To obtain performance data current to the most recent month end, please call 1-800-345-6488 or visit ipro.americancentury.com (for Investment Professionals). For additional information about the fund, please consult the prospectus.
Equity Portfolio Managers: Claudia Musat and Steven Rossi
Fixed-Income Portfolio Managers: Bob Gahagan, Brian Howell and Charles Tan
Performance Summary
VP Balanced returned 19.85%* for the year ended December 31, 2019. By comparison, a blended index consisting of 60% S&P 500 Index and 40% Bloomberg Barclays U.S. Aggregate Bond Index returned 22.18%. Because the vast majority of the portfolio’s risk and return come from its stock allocation, we will begin by discussing the performance of the equity portion of VP Balanced.
Consumer Discretionary Leading Detractor
Investments in the consumer discretionary sector drove underperformance, led by stock selection in the multiline retail; textiles, apparel and luxury goods; and hotels, restaurants and leisure industries. An overweight to Kohl’s was among the top individual detractors from sector and total portfolio performance. The department store chain has struggled with decreased foot traffic and falling sales. We have exited the stock. Within textiles, apparel and luxury goods, an overweight to accessories manufacturer Tapestry provided a strong headwind to results. The stock fell during the period due in part to disappointing sales. We have since closed the position.
Fund results were also constrained by stock selection in the materials sector. Three of the top-10 detracting positions were from this sector. In the metals and mining industry, Steel Dynamics weighed on returns. The stock came under pressure during the period due to decreased demand for the company’s products amid slowing non-U.S. growth. Trade rhetoric also affected the stock at various points during the year. Paper and forest products company Domtar was also among the leading detractors, as was chemicals company Ecolab. We have closed our position in Domtar.
Financials and Energy Decisions Bolster Results
In the financials sector, stock selection within the capital markets industry was a primary driver of results. A position in TD Ameritrade Holding was among the top contributors to sector and overall portfolio returns. The stock gained on the back of strong revenues and several rounds of earnings that were in line with or beat expectations. Despite its benefit to the portfolio, the stock experienced periodic bouts of volatility during the period, due in part to the merger with The Charles Schwab Corp. We have since closed the position. In the diversified financial services industry, an underweight to Berkshire Hathaway was also among the top-contributing positions.
Positioning within energy also provided a tailwind to portfolio returns. Reduced exposure to several drilling and exploration and refining companies, which suffered during the period, was beneficial to performance. Concerns about excess oil supply helped to provide downward pressure on the price during the year and worry about the pace of global growth and future demand for crude oil worked to further depress sentiment. An underweight position in Exxon Mobil was among the top contributors to sector and portfolio performance.
*All fund returns referenced in this commentary are for Class I shares. Fund returns would have been lower if a portion of the fees had not been waived. Performance for other share classes will vary due to differences in fee structure; when Class I performance exceeds that of the index, other share classes may not. See page 2 for returns for all share classes.
Elsewhere in the markets, an overweight to consumer electronics giant Apple was among the top overall contributors for the year. Apple stock displayed considerable gains for the period, backed by strong demand for its products. Business services provider CoStar Group was also among the top contributors. We have since exited our position in CoStar.
The use of hedging instruments or derivatives had no material impact on performance during the period.
Bonds Gain in a Falling Rate Environment
In fixed income, markets began the year by recovering from severe volatility and spread widening, which occurred in December 2018. (When yield spreads widen, higher-yielding credit-sensitive bonds typically underperform Treasuries, and vice versa.) In January 2019, the U.S. Federal Reserve (Fed) pivoted to a more dovish stance and other global central banks followed suit, stating their willingness to support growth rates. Spreads began to tighten, and yields began a downward trend that lasted throughout much of the period. Corporate bonds outperformed the broader market and most spread sectors outpaced like-duration Treasuries during much of the 12 months. U.S. interest rates generally fell during the year, pressured by concerns over slowing global growth and periodically escalating trade rhetoric. Bond prices rose in the falling rate environment. In an effort to support the growth rate of the U.S. economy, the Fed cut its short-term interest rate three times during the latter half of the year, each time by 25 basis points. In November and December, yields on longer-dated U.S. Treasuries reversed course and began to increase, causing the yield curve to steepen and stalling gains on the previously strong performing, longer-dated debt. The Bloomberg Barclays U.S. Aggregate Bond Index rose 8.72% during the period.
A Look Ahead
While we believe the risk of a U.S. recession next year is fading, we think it’s possible that growth may decelerate in the near term. Weaker capital spending and trade policy uncertainty may keep downward pressure on U.S. gross domestic product. However, we anticipate the U.S. economy may remain stronger than other developed markets economies. We expect Europe’s economic slowdown has stabilized, although we do not necessarily foresee increased growth rates in 2020 due to continued weak global demand. We expect global inflation rates to remain low and for global central banks to continue their accommodative policies, keeping interest rates near current levels. Longer-dated sovereign yields have started to increase, although shorter-term yields remain relatively low.
Though we believe these monetary and geopolitical shifts give the global economy room to improve, 2020 remains uncertain. Our investment teams continue to think defensively. We are paying attention to how our portfolios may behave in unexpected downturns. Given this, we recommend our clients maintain a balanced approach with a keen eye toward managing downside risk. We believe investors may benefit from having exposure to proven equity and fixed-income strategies designed to help insulate them from short-term volatility.
|
| |
| DECEMBER 31, 2019 |
| Top Ten Common Stocks | % of net assets |
| Apple, Inc. | 3.4% |
| Microsoft Corp. | 2.5% |
| Amazon.com, Inc. | 2.0% |
| Alphabet, Inc., Class A | 1.9% |
| Facebook, Inc., Class A | 1.5% |
| JPMorgan Chase & Co. | 1.1% |
| Broadcom, Inc. | 0.9% |
| Bank of America Corp. | 0.7% |
| Visa, Inc., Class A | 0.7% |
| Biogen, Inc. | 0.7% |
| | |
| Top Five Common Stocks Industries | % of net assets |
| Software | 4.8% |
| Interactive Media and Services | 3.4% |
| Technology Hardware, Storage and Peripherals | 3.4% |
| Banks | 3.0% |
| Internet and Direct Marketing Retail | 2.9% |
| | |
| Key Fixed-Income Portfolio Statistics |
| Average Duration (effective) | 5.7 years |
| Weighted Average Life to Maturity | 7.8 years |
| | |
| Types of Investments in Portfolio | % of net assets |
| Common Stocks | 57.2% |
| U.S. Treasury Securities | 15.5% |
| Corporate Bonds | 10.0% |
| U.S. Government Agency Mortgage-Backed Securities | 9.1% |
| Asset-Backed Securities | 2.4% |
| Collateralized Mortgage Obligations | 1.1% |
| Collateralized Loan Obligations | 1.0% |
| Commercial Mortgage-Backed Securities | 0.9% |
| Municipal Securities | 0.5% |
| U.S. Government Agency Securities | 0.1% |
| Sovereign Governments and Agencies | 0.1% |
| Bank Loan Obligations | —* |
| Preferred Stocks | —* |
| Temporary Cash Investments | 3.9% |
| Other Assets and Liabilities | (1.8)% |
*Category is less than 0.05% of total net assets.
Fund shareholders may incur two types of costs: (1) transaction costs, including sales charges (loads) on purchase payments and redemption/exchange fees; and (2) ongoing costs, including management fees; distribution and service (12b-1) fees; and other fund expenses. This example is intended to help you understand your ongoing costs (in dollars) of investing in your fund and to compare these costs with the ongoing cost of investing in other mutual funds.
The example is based on an investment of $1,000 made at the beginning of the period and held for the entire period from July 1, 2019 to December 31, 2019.
Actual Expenses
The table provides information about actual account values and actual expenses for each class. You may use the information, together with the amount you invested, to estimate the expenses that you paid over the period. First, identify the share class you own. Then simply divide your account value by $1,000 (for example, an $8,600 account value divided by $1,000 = 8.6), then multiply the result by the number under the heading “Expenses Paid During Period” to estimate the expenses you paid on your account during this period.
Hypothetical Example for Comparison Purposes
The table also provides information about hypothetical account values and hypothetical expenses based on the actual expense ratio of each class of your fund and an assumed rate of return of 5% per year before expenses, which is not the actual return of a fund’s share class. The hypothetical account values and expenses may not be used to estimate the actual ending account balance or expenses you paid for the period. You may use this information to compare the ongoing costs of investing in your fund and other funds. To do so, compare this 5% hypothetical example with the 5% hypothetical examples that appear in the shareholder reports of the other funds.
Please note that the expenses shown in the table are meant to highlight your ongoing costs only and do not reflect any transactional costs, such as sales charges (loads) or redemption/exchange fees. Therefore, the table is useful in comparing ongoing costs only, and will not help you determine the relative total costs of owning different funds. In addition, if these transactional costs were included, your costs would have been higher.
|
| | | | |
| | Beginning
Account Value
7/1/19 | Ending
Account Value
12/31/19 | Expenses Paid
During Period(1)
7/1/19 - 12/31/19 |
Annualized
Expense Ratio(1) |
| Actual |
| Class I | $1,000 | $1,058.00 | $4.31 | 0.83% |
| Class II | $1,000 | $1,056.60 | $5.60 | 1.08% |
| Hypothetical | | | | |
| Class I | $1,000 | $1,021.02 | $4.23 | 0.83% |
| Class II | $1,000 | $1,019.76 | $5.50 | 1.08% |
| |
| (1) | Expenses are equal to the class's annualized expense ratio listed in the table above, multiplied by the average account value over the period, multiplied by 184, the number of days in the most recent fiscal half-year, divided by 365, to reflect the one-half year period. Annualized expense ratio reflects actual expenses, including any applicable fee waivers or expense reimbursements and excluding any acquired fund fees and expenses. |
DECEMBER 31, 2019
|
| | | | | | |
| | Shares/
Principal Amount | Value |
| COMMON STOCKS — 57.2% | | |
| Aerospace and Defense — 0.9% | | |
| HEICO Corp. | 5,098 |
| $ | 581,937 |
|
| Hexcel Corp. | 5,290 |
| 387,810 |
|
| Lockheed Martin Corp. | 1,911 |
| 744,105 |
|
Mercury Systems, Inc.(1) | 1,145 |
| 79,131 |
|
| Northrop Grumman Corp. | 777 |
| 267,265 |
|
| Raytheon Co. | 1,903 |
| 418,165 |
|
| | | 2,478,413 |
|
| Air Freight and Logistics — 0.1% | | |
| CH Robinson Worldwide, Inc. | 5,184 |
| 405,389 |
|
| Airlines — 0.1% | | |
| Delta Air Lines, Inc. | 5,107 |
| 298,657 |
|
| Auto Components — 0.5% | | |
| BorgWarner, Inc. | 17,853 |
| 774,463 |
|
| Gentex Corp. | 23,297 |
| 675,147 |
|
| | | 1,449,610 |
|
| Banks — 3.0% | | |
| Bank of America Corp. | 60,086 |
| 2,116,229 |
|
| Comerica, Inc. | 10,260 |
| 736,155 |
|
| JPMorgan Chase & Co. | 22,264 |
| 3,103,602 |
|
| M&T Bank Corp. | 3,606 |
| 612,118 |
|
| Signature Bank | 3,297 |
| 450,403 |
|
SVB Financial Group(1) | 1,695 |
| 425,513 |
|
| Wells Fargo & Co. | 24,381 |
| 1,311,698 |
|
| | | 8,755,718 |
|
| Beverages — 0.8% | | |
| Coca-Cola Co. (The) | 12,774 |
| 707,041 |
|
Monster Beverage Corp.(1) | 15,164 |
| 963,672 |
|
| PepsiCo, Inc. | 5,356 |
| 732,005 |
|
| | | 2,402,718 |
|
| Biotechnology — 1.8% | | |
| AbbVie, Inc. | 6,392 |
| 565,948 |
|
Alexion Pharmaceuticals, Inc.(1) | 5,907 |
| 638,842 |
|
| Amgen, Inc. | 3,489 |
| 841,093 |
|
Biogen, Inc.(1) | 6,729 |
| 1,996,696 |
|
| Gilead Sciences, Inc. | 3,311 |
| 215,149 |
|
Incyte Corp.(1) | 10,622 |
| 927,513 |
|
| | | 5,185,241 |
|
| Building Products — 1.0% | | |
Builders FirstSource, Inc.(1) | 19,947 |
| 506,853 |
|
| Fortune Brands Home & Security, Inc. | 10,218 |
| 667,644 |
|
| Johnson Controls International plc | 9,810 |
| 399,365 |
|
|
| | | | | | |
| | Shares/
Principal Amount | Value |
| Masco Corp. | 24,928 |
| $ | 1,196,295 |
|
| | | 2,770,157 |
|
| Capital Markets — 0.9% | | |
| Artisan Partners Asset Management, Inc., Class A | 13,631 |
| 440,554 |
|
| FactSet Research Systems, Inc. | 1,843 |
| 494,477 |
|
| Moody's Corp. | 3,326 |
| 789,626 |
|
| MSCI, Inc. | 2,931 |
| 756,725 |
|
| | | 2,481,382 |
|
| Chemicals — 0.7% | | |
| CF Industries Holdings, Inc. | 2,697 |
| 128,755 |
|
| Ecolab, Inc. | 4,090 |
| 789,329 |
|
| NewMarket Corp. | 1,295 |
| 630,043 |
|
| Valvoline, Inc. | 16,256 |
| 348,041 |
|
| | | 1,896,168 |
|
| Commercial Services and Supplies — 0.9% | | |
| Republic Services, Inc. | 8,530 |
| 764,544 |
|
| Tetra Tech, Inc. | 6,188 |
| 533,158 |
|
| UniFirst Corp. | 1,066 |
| 215,310 |
|
| Waste Management, Inc. | 10,405 |
| 1,185,754 |
|
| | | 2,698,766 |
|
| Communications Equipment — 0.7% | | |
| Cisco Systems, Inc. | 19,734 |
| 946,443 |
|
| Juniper Networks, Inc. | 11,116 |
| 273,787 |
|
| Motorola Solutions, Inc. | 4,304 |
| 693,546 |
|
| | | 1,913,776 |
|
| Construction and Engineering — 0.2% | | |
MasTec, Inc.(1) | 9,345 |
| 599,575 |
|
| Consumer Finance — 1.3% | | |
| American Express Co. | 6,084 |
| 757,397 |
|
| Discover Financial Services | 17,646 |
| 1,496,734 |
|
| Synchrony Financial | 44,441 |
| 1,600,320 |
|
| | | 3,854,451 |
|
| Diversified Financial Services — 0.5% | | |
Berkshire Hathaway, Inc., Class B(1) | 6,997 |
| 1,584,821 |
|
| Diversified Telecommunication Services — 1.1% | | |
| AT&T, Inc. | 27,245 |
| 1,064,735 |
|
| CenturyLink, Inc. | 36,625 |
| 483,816 |
|
| Verizon Communications, Inc. | 28,538 |
| 1,752,233 |
|
| | | 3,300,784 |
|
| Electric Utilities — 0.4% | | |
| IDACORP, Inc. | 4,509 |
| 481,561 |
|
| NextEra Energy, Inc. | 2,372 |
| 574,404 |
|
| | | 1,055,965 |
|
| Electrical Equipment — 0.2% | | |
| Acuity Brands, Inc. | 3,419 |
| 471,822 |
|
| Electronic Equipment, Instruments and Components — 0.6% | | |
| CDW Corp. | 5,522 |
| 788,762 |
|
|
| | | | | | |
| | Shares/
Principal Amount | Value |
Keysight Technologies, Inc.(1) | 8,295 |
| $ | 851,316 |
|
| | | 1,640,078 |
|
| Entertainment — 1.6% | | |
| Activision Blizzard, Inc. | 28,435 |
| 1,689,608 |
|
Electronic Arts, Inc.(1) | 17,593 |
| 1,891,423 |
|
Take-Two Interactive Software, Inc.(1) | 6,377 |
| 780,736 |
|
| Walt Disney Co. (The) | 2,554 |
| 369,385 |
|
| | | 4,731,152 |
|
| Equity Real Estate Investment Trusts (REITs) — 1.1% | | |
| Alexander & Baldwin, Inc. | 4,114 |
| 86,229 |
|
| American Tower Corp. | 2,098 |
| 482,162 |
|
| GEO Group, Inc. (The) | 5,216 |
| 86,638 |
|
| Life Storage, Inc. | 5,975 |
| 646,973 |
|
| PS Business Parks, Inc. | 2,008 |
| 331,059 |
|
| Public Storage | 2,762 |
| 588,196 |
|
| SBA Communications Corp. | 2,036 |
| 490,656 |
|
| Weingarten Realty Investors | 14,729 |
| 460,134 |
|
| | | 3,172,047 |
|
| Food and Staples Retailing — 0.4% | | |
| Casey's General Stores, Inc. | 2,131 |
| 338,808 |
|
| Walgreens Boots Alliance, Inc. | 13,059 |
| 769,958 |
|
| | | 1,108,766 |
|
| Food Products — 1.9% | | |
| Campbell Soup Co. | 36,106 |
| 1,784,358 |
|
| General Mills, Inc. | 30,793 |
| 1,649,273 |
|
| Hershey Co. (The) | 9,560 |
| 1,405,129 |
|
| Kellogg Co. | 7,125 |
| 492,765 |
|
| | | 5,331,525 |
|
| Health Care Equipment and Supplies — 2.2% | | |
| Abbott Laboratories | 13,298 |
| 1,155,064 |
|
| Baxter International, Inc. | 13,613 |
| 1,138,319 |
|
| Danaher Corp. | 2,050 |
| 314,634 |
|
| DENTSPLY SIRONA, Inc. | 9,278 |
| 525,042 |
|
Edwards Lifesciences Corp.(1) | 4,064 |
| 948,091 |
|
Hologic, Inc.(1) | 20,281 |
| 1,058,871 |
|
Integer Holdings Corp.(1) | 2,547 |
| 204,855 |
|
| Stryker Corp. | 4,620 |
| 969,923 |
|
| | | 6,314,799 |
|
| Health Care Providers and Services — 0.8% | | |
Amedisys, Inc.(1) | 4,692 |
| 783,189 |
|
| Chemed Corp. | 467 |
| 205,134 |
|
| McKesson Corp. | 3,173 |
| 438,889 |
|
| UnitedHealth Group, Inc. | 2,510 |
| 737,890 |
|
| | | 2,165,102 |
|
| Health Care Technology — 0.4% | | |
| Cerner Corp. | 7,632 |
| 560,112 |
|
|
| | | | | | |
| | Shares/
Principal Amount | Value |
Veeva Systems, Inc., Class A(1) | 4,486 |
| $ | 631,001 |
|
| | | 1,191,113 |
|
| Hotels, Restaurants and Leisure — 0.8% | | |
| Darden Restaurants, Inc. | 4,311 |
| 469,942 |
|
| Starbucks Corp. | 19,225 |
| 1,690,262 |
|
| | | 2,160,204 |
|
| Household Durables — 0.2% | | |
| PulteGroup, Inc. | 14,184 |
| 550,339 |
|
| Household Products — 1.2% | | |
| Colgate-Palmolive Co. | 17,828 |
| 1,227,280 |
|
| Kimberly-Clark Corp. | 7,087 |
| 974,817 |
|
| Procter & Gamble Co. (The) | 9,096 |
| 1,136,090 |
|
| | | 3,338,187 |
|
| Industrial Conglomerates — 0.2% | | |
| Carlisle Cos., Inc. | 3,471 |
| 561,747 |
|
| Insurance — 1.6% | | |
| American Financial Group, Inc. | 4,500 |
| 493,425 |
|
Arch Capital Group Ltd.(1) | 15,400 |
| 660,506 |
|
| Marsh & McLennan Cos., Inc. | 5,524 |
| 615,429 |
|
| Mercury General Corp. | 11,892 |
| 579,497 |
|
| Progressive Corp. (The) | 22,703 |
| 1,643,470 |
|
| RenaissanceRe Holdings Ltd. | 2,408 |
| 472,016 |
|
| | | 4,464,343 |
|
| Interactive Media and Services — 3.4% | | |
Alphabet, Inc., Class A(1) | 4,132 |
| 5,534,359 |
|
Facebook, Inc., Class A(1) | 21,262 |
| 4,364,026 |
|
| | | 9,898,385 |
|
| Internet and Direct Marketing Retail — 2.9% | | |
Amazon.com, Inc.(1) | 3,061 |
| 5,656,238 |
|
Booking Holdings, Inc.(1) | 376 |
| 772,203 |
|
| eBay, Inc. | 40,387 |
| 1,458,375 |
|
| Expedia Group, Inc. | 5,138 |
| 555,623 |
|
| | | 8,442,439 |
|
| IT Services — 2.7% | | |
| Accenture plc, Class A | 2,878 |
| 606,021 |
|
Akamai Technologies, Inc.(1) | 6,026 |
| 520,526 |
|
| Amdocs Ltd. | 5,633 |
| 406,646 |
|
| EVERTEC, Inc. | 8,401 |
| 285,970 |
|
| International Business Machines Corp. | 8,278 |
| 1,109,583 |
|
| Mastercard, Inc., Class A | 4,178 |
| 1,247,509 |
|
PayPal Holdings, Inc.(1) | 7,588 |
| 820,794 |
|
| Visa, Inc., Class A | 10,934 |
| 2,054,499 |
|
| Western Union Co. (The) | 24,981 |
| 668,991 |
|
| | | 7,720,539 |
|
| Life Sciences Tools and Services — 1.2% | | |
| Agilent Technologies, Inc. | 19,399 |
| 1,654,929 |
|
Bio-Rad Laboratories, Inc., Class A(1) | 1,928 |
| 713,418 |
|
|
| | | | | | |
| | Shares/
Principal Amount | Value |
Illumina, Inc.(1) | 1,253 |
| $ | 415,670 |
|
| Thermo Fisher Scientific, Inc. | 1,723 |
| 559,751 |
|
| | | 3,343,768 |
|
| Machinery — 1.3% | | |
| Allison Transmission Holdings, Inc. | 29,279 |
| 1,414,761 |
|
| Cummins, Inc. | 7,705 |
| 1,378,887 |
|
| Snap-on, Inc. | 5,995 |
| 1,015,553 |
|
| | | 3,809,201 |
|
| Media — 0.3% | | |
Discovery, Inc., Class C(1) | 14,805 |
| 451,405 |
|
| Sirius XM Holdings, Inc. | 67,262 |
| 480,923 |
|
| | | 932,328 |
|
| Metals and Mining — 0.4% | | |
| Reliance Steel & Aluminum Co. | 3,531 |
| 422,873 |
|
| Royal Gold, Inc. | 3,345 |
| 408,926 |
|
| Steel Dynamics, Inc. | 7,667 |
| 260,985 |
|
| | | 1,092,784 |
|
| Multiline Retail — 0.5% | | |
| Target Corp. | 10,256 |
| 1,314,922 |
|
| Oil, Gas and Consumable Fuels — 1.2% | | |
| Chevron Corp. | 11,903 |
| 1,434,431 |
|
| Exxon Mobil Corp. | 9,936 |
| 693,334 |
|
| HollyFrontier Corp. | 25,358 |
| 1,285,904 |
|
| | | 3,413,669 |
|
| Personal Products — 0.2% | | |
| Estee Lauder Cos., Inc. (The), Class A | 2,977 |
| 614,870 |
|
| Pharmaceuticals — 2.0% | | |
| Bristol-Myers Squibb Co. | 17,403 |
| 1,117,098 |
|
Jazz Pharmaceuticals plc(1) | 3,238 |
| 483,369 |
|
| Johnson & Johnson | 8,456 |
| 1,233,477 |
|
| Merck & Co., Inc. | 19,316 |
| 1,756,790 |
|
| Pfizer, Inc. | 3,550 |
| 139,089 |
|
| Zoetis, Inc. | 6,965 |
| 921,818 |
|
| | | 5,651,641 |
|
| Professional Services — 0.3% | | |
IHS Markit Ltd.(1) | 4,503 |
| 339,301 |
|
| Verisk Analytics, Inc. | 3,910 |
| 583,919 |
|
| | | 923,220 |
|
| Semiconductors and Semiconductor Equipment — 2.7% | | |
| Applied Materials, Inc. | 23,054 |
| 1,407,216 |
|
| Broadcom, Inc. | 8,254 |
| 2,608,429 |
|
| Intel Corp. | 15,112 |
| 904,453 |
|
| KLA Corp. | 4,857 |
| 865,372 |
|
| Lam Research Corp. | 2,590 |
| 757,316 |
|
Micron Technology, Inc.(1) | 12,549 |
| 674,885 |
|
| Texas Instruments, Inc. | 4,700 |
| 602,963 |
|
| | | 7,820,634 |
|
|
| | | | | | |
| | Shares/
Principal Amount | Value |
| Software — 4.8% | | |
Adobe, Inc.(1) | 5,528 |
| $ | 1,823,190 |
|
Cadence Design Systems, Inc.(1) | 13,192 |
| 914,997 |
|
| Intuit, Inc. | 4,305 |
| 1,127,609 |
|
| Microsoft Corp. | 45,560 |
| 7,184,812 |
|
| Oracle Corp. (New York) | 27,271 |
| 1,444,817 |
|
salesforce.com, Inc.(1) | 6,024 |
| 979,743 |
|
VMware, Inc., Class A(1) | 2,934 |
| 445,352 |
|
| | | 13,920,520 |
|
| Specialty Retail — 1.2% | | |
AutoZone, Inc.(1) | 1,477 |
| 1,759,565 |
|
| Home Depot, Inc. (The) | 2,519 |
| 550,099 |
|
Murphy USA, Inc.(1) | 5,042 |
| 589,914 |
|
O'Reilly Automotive, Inc.(1) | 1,272 |
| 557,467 |
|
| | | 3,457,045 |
|
| Technology Hardware, Storage and Peripherals — 3.4% | | |
| Apple, Inc. | 33,070 |
| 9,711,006 |
|
| Textiles, Apparel and Luxury Goods — 0.2% | | |
| NIKE, Inc., Class B | 4,914 |
| 497,837 |
|
| Thrifts and Mortgage Finance — 0.2% | | |
| Essent Group Ltd. | 11,663 |
| 606,359 |
|
| Trading Companies and Distributors — 0.2% | | |
| W.W. Grainger, Inc. | 1,429 |
| 483,745 |
|
TOTAL COMMON STOCKS
(Cost $126,573,248) | | 163,987,727 |
|
| U.S. TREASURY SECURITIES — 15.5% | | |
| U.S. Treasury Bonds, 5.00%, 5/15/37 | $ | 100,000 |
| 141,454 |
|
| U.S. Treasury Bonds, 3.50%, 2/15/39 | 600,000 |
| 718,561 |
|
| U.S. Treasury Bonds, 4.625%, 2/15/40 | 600,000 |
| 828,938 |
|
| U.S. Treasury Bonds, 3.125%, 11/15/41 | 200,000 |
| 226,683 |
|
| U.S. Treasury Bonds, 3.00%, 5/15/42 | 1,700,000 |
| 1,889,788 |
|
| U.S. Treasury Bonds, 2.75%, 11/15/42 | 550,000 |
| 586,467 |
|
| U.S. Treasury Bonds, 2.875%, 5/15/43 | 300,000 |
| 326,576 |
|
| U.S. Treasury Bonds, 2.50%, 2/15/45 | 1,710,000 |
| 1,743,305 |
|
| U.S. Treasury Bonds, 3.00%, 5/15/45 | 200,000 |
| 223,087 |
|
| U.S. Treasury Bonds, 3.00%, 11/15/45 | 400,000 |
| 447,099 |
|
| U.S. Treasury Bonds, 3.375%, 11/15/48 | 1,160,000 |
| 1,398,509 |
|
| U.S. Treasury Bonds, 2.25%, 8/15/49 | 1,850,000 |
| 1,793,088 |
|
| U.S. Treasury Bonds, 2.375%, 11/15/49 | 350,000 |
| 348,522 |
|
| U.S. Treasury Inflation Indexed Notes, 0.25%, 7/15/29 | 704,235 |
| 711,327 |
|
U.S. Treasury Notes, 1.875%, 12/15/20(2) | 200,000 |
| 200,441 |
|
| U.S. Treasury Notes, 1.50%, 11/30/21 | 600,000 |
| 599,107 |
|
| U.S. Treasury Notes, 2.625%, 12/15/21 | 1,800,000 |
| 1,835,559 |
|
| U.S. Treasury Notes, 1.875%, 1/31/22 | 3,400,000 |
| 3,419,515 |
|
| U.S. Treasury Notes, 2.375%, 3/15/22 | 1,500,000 |
| 1,525,690 |
|
| U.S. Treasury Notes, 1.875%, 3/31/22 | 1,300,000 |
| 1,308,069 |
|
| U.S. Treasury Notes, 1.75%, 6/15/22 | 1,000,000 |
| 1,003,806 |
|
|
| | | | | | |
| | Shares/
Principal Amount | Value |
| U.S. Treasury Notes, 1.50%, 9/15/22 | $ | 800,000 |
| $ | 797,875 |
|
| U.S. Treasury Notes, 1.625%, 11/15/22 | 2,700,000 |
| 2,700,875 |
|
| U.S. Treasury Notes, 2.00%, 11/30/22 | 3,100,000 |
| 3,133,922 |
|
| U.S. Treasury Notes, 2.875%, 11/30/23 | 3,400,000 |
| 3,554,242 |
|
| U.S. Treasury Notes, 2.375%, 2/29/24 | 400,000 |
| 411,132 |
|
| U.S. Treasury Notes, 1.25%, 8/31/24 | 3,900,000 |
| 3,822,508 |
|
| U.S. Treasury Notes, 1.50%, 11/30/24 | 300,000 |
| 297,327 |
|
| U.S. Treasury Notes, 2.625%, 12/31/25 | 900,000 |
| 943,098 |
|
| U.S. Treasury Notes, 1.375%, 8/31/26 | 500,000 |
| 485,907 |
|
| U.S. Treasury Notes, 1.625%, 9/30/26 | 600,000 |
| 592,257 |
|
| U.S. Treasury Notes, 1.625%, 10/31/26 | 3,000,000 |
| 2,959,563 |
|
| U.S. Treasury Notes, 1.625%, 11/30/26 | 200,000 |
| 197,264 |
|
| U.S. Treasury Notes, 3.125%, 11/15/28 | 2,100,000 |
| 2,307,916 |
|
| U.S. Treasury Notes, 1.625%, 8/15/29 | 700,000 |
| 681,531 |
|
| U.S. Treasury Notes, 1.75%, 11/15/29 | 300,000 |
| 295,277 |
|
TOTAL U.S. TREASURY SECURITIES
(Cost $43,511,002) | | 44,456,285 |
|
| CORPORATE BONDS — 10.0% | | |
Aerospace and Defense† | | |
| Lockheed Martin Corp., 3.80%, 3/1/45 | 20,000 |
| 22,279 |
|
| United Technologies Corp., 6.05%, 6/1/36 | 35,000 |
| 47,680 |
|
| United Technologies Corp., 5.70%, 4/15/40 | 20,000 |
| 26,916 |
|
| | | 96,875 |
|
Air Freight and Logistics† | | |
| United Parcel Service, Inc., 2.80%, 11/15/24 | 60,000 |
| 62,128 |
|
| Automobiles — 0.2% | | |
| Ford Motor Credit Co. LLC, 2.68%, 1/9/20 | 200,000 |
| 200,016 |
|
| Ford Motor Credit Co. LLC, 5.875%, 8/2/21 | 50,000 |
| 52,346 |
|
| General Motors Co., 5.15%, 4/1/38 | 50,000 |
| 51,124 |
|
| General Motors Financial Co., Inc., 3.20%, 7/6/21 | 120,000 |
| 121,659 |
|
| General Motors Financial Co., Inc., 5.25%, 3/1/26 | 100,000 |
| 111,056 |
|
| | | 536,201 |
|
| Banks — 2.4% | | |
| Bank of America Corp., 4.10%, 7/24/23 | 130,000 |
| 138,738 |
|
| Bank of America Corp., MTN, 4.20%, 8/26/24 | 46,000 |
| 49,406 |
|
| Bank of America Corp., MTN, 4.00%, 1/22/25 | 505,000 |
| 538,746 |
|
| Bank of America Corp., MTN, 5.00%, 1/21/44 | 50,000 |
| 65,069 |
|
| Bank of America Corp., MTN, VRN, 4.44%, 1/20/48 | 20,000 |
| 24,306 |
|
| Bank of America Corp., VRN, 3.00%, 12/20/23 | 211,000 |
| 216,189 |
|
| Bank of Montreal, MTN, 3.30%, 2/5/24 | 111,000 |
| 115,685 |
|
| Barclays Bank plc, 5.14%, 10/14/20 | 200,000 |
| 204,201 |
|
BNP Paribas SA, VRN, 2.82%, 11/19/25(3) | 250,000 |
| 252,903 |
|
| Citigroup, Inc., 2.90%, 12/8/21 | 280,000 |
| 284,621 |
|
| Citigroup, Inc., 2.75%, 4/25/22 | 165,000 |
| 167,570 |
|
| Citigroup, Inc., 4.05%, 7/30/22 | 20,000 |
| 20,902 |
|
| Citigroup, Inc., 3.20%, 10/21/26 | 340,000 |
| 352,701 |
|
| Citigroup, Inc., VRN, 3.52%, 10/27/28 | 50,000 |
| 52,622 |
|
|
| | | | | | |
| | Shares/
Principal Amount | Value |
| Discover Bank, 3.45%, 7/27/26 | $ | 250,000 |
| $ | 259,611 |
|
| Fifth Third BanCorp., 4.30%, 1/16/24 | 95,000 |
| 102,088 |
|
| Fifth Third BanCorp., 2.375%, 1/28/25 | 200,000 |
| 200,271 |
|
| HSBC Holdings plc, 2.95%, 5/25/21 | 200,000 |
| 202,545 |
|
| HSBC Holdings plc, 4.30%, 3/8/26 | 200,000 |
| 217,766 |
|
| HSBC Holdings plc, 4.375%, 11/23/26 | 200,000 |
| 216,658 |
|
| HSBC Holdings plc, VRN, 2.63%, 11/7/25 | 200,000 |
| 200,745 |
|
| Huntington Bancshares, Inc., 2.30%, 1/14/22 | 40,000 |
| 40,216 |
|
| JPMorgan Chase & Co., 2.55%, 3/1/21 | 60,000 |
| 60,466 |
|
| JPMorgan Chase & Co., 4.625%, 5/10/21 | 160,000 |
| 165,596 |
|
| JPMorgan Chase & Co., 3.875%, 9/10/24 | 105,000 |
| 112,397 |
|
| JPMorgan Chase & Co., 3.125%, 1/23/25 | 420,000 |
| 438,450 |
|
| JPMorgan Chase & Co., VRN, 4.02%, 12/5/24 | 140,000 |
| 149,289 |
|
| JPMorgan Chase & Co., VRN, 3.54%, 5/1/28 | 20,000 |
| 21,242 |
|
| JPMorgan Chase & Co., VRN, 3.70%, 5/6/30 | 70,000 |
| 75,370 |
|
| JPMorgan Chase & Co., VRN, 3.88%, 7/24/38 | 60,000 |
| 66,357 |
|
| JPMorgan Chase & Co., VRN, 3.96%, 11/15/48 | 20,000 |
| 22,668 |
|
| JPMorgan Chase & Co., VRN, 3.90%, 1/23/49 | 20,000 |
| 22,471 |
|
| PNC Bank N.A., 3.80%, 7/25/23 | 250,000 |
| 262,647 |
|
| PNC Bank N.A., 2.70%, 10/22/29 | 250,000 |
| 249,810 |
|
| PNC Bank N.A., VRN, 2.03%, 12/9/22 | 250,000 |
| 250,337 |
|
| Regions Financial Corp., 2.75%, 8/14/22 | 60,000 |
| 61,074 |
|
| Regions Financial Corp., 3.80%, 8/14/23 | 70,000 |
| 74,099 |
|
| Royal Bank of Canada, 2.15%, 10/26/20 | 100,000 |
| 100,199 |
|
| Royal Bank of Canada, MTN, 2.125%, 3/2/20 | 90,000 |
| 90,038 |
|
| U.S. Bancorp, MTN, 3.60%, 9/11/24 | 50,000 |
| 53,135 |
|
| Wells Fargo & Co., 3.07%, 1/24/23 | 40,000 |
| 40,838 |
|
| Wells Fargo & Co., 4.125%, 8/15/23 | 180,000 |
| 191,186 |
|
| Wells Fargo & Co., 3.00%, 4/22/26 | 40,000 |
| 41,122 |
|
| Wells Fargo & Co., 5.61%, 1/15/44 | 120,000 |
| 157,904 |
|
| Wells Fargo & Co., MTN, 3.55%, 9/29/25 | 150,000 |
| 158,845 |
|
| Wells Fargo & Co., MTN, 4.65%, 11/4/44 | 25,000 |
| 29,361 |
|
| Wells Fargo & Co., MTN, 4.75%, 12/7/46 | 10,000 |
| 11,990 |
|
| Wells Fargo & Co., MTN, VRN, 3.58%, 5/22/28 | 50,000 |
| 53,138 |
|
| Wells Fargo & Co., MTN, VRN, 2.88%, 10/30/30 | 140,000 |
| 140,939 |
|
| | | 7,024,527 |
|
| Beverages — 0.1% | | |
| Anheuser-Busch Cos. LLC / Anheuser-Busch InBev Worldwide, Inc., 4.90%, 2/1/46 | 115,000 |
| 136,214 |
|
| Anheuser-Busch InBev Worldwide, Inc., 4.75%, 1/23/29 | 220,000 |
| 254,880 |
|
| | | 391,094 |
|
| Biotechnology — 0.5% | | |
| AbbVie, Inc., 2.90%, 11/6/22 | 190,000 |
| 193,927 |
|
| AbbVie, Inc., 3.60%, 5/14/25 | 30,000 |
| 31,663 |
|
AbbVie, Inc., 3.20%, 11/21/29(3) | 290,000 |
| 295,201 |
|
| AbbVie, Inc., 4.40%, 11/6/42 | 80,000 |
| 86,511 |
|
AbbVie, Inc., 4.25%, 11/21/49(3) | 100,000 |
| 105,694 |
|
|
| | | | | | |
| | Shares/
Principal Amount | Value |
| Amgen, Inc., 2.65%, 5/11/22 | $ | 200,000 |
| $ | 203,033 |
|
| Amgen, Inc., 4.66%, 6/15/51 | 46,000 |
| 54,106 |
|
| Biogen, Inc., 3.625%, 9/15/22 | 70,000 |
| 72,844 |
|
| Gilead Sciences, Inc., 4.40%, 12/1/21 | 100,000 |
| 104,347 |
|
| Gilead Sciences, Inc., 3.65%, 3/1/26 | 250,000 |
| 269,039 |
|
| | | 1,416,365 |
|
| Capital Markets — 0.8% | | |
| Goldman Sachs Group, Inc. (The), 3.50%, 1/23/25 | 290,000 |
| 304,234 |
|
| Goldman Sachs Group, Inc. (The), 3.50%, 11/16/26 | 270,000 |
| 283,980 |
|
| Goldman Sachs Group, Inc. (The), 5.15%, 5/22/45 | 10,000 |
| 12,276 |
|
| Goldman Sachs Group, Inc. (The), MTN, 5.375%, 3/15/20 | 325,000 |
| 327,274 |
|
| Goldman Sachs Group, Inc. (The), VRN, 3.81%, 4/23/29 | 40,000 |
| 42,879 |
|
| Morgan Stanley, 2.75%, 5/19/22 | 310,000 |
| 315,680 |
|
| Morgan Stanley, 5.00%, 11/24/25 | 120,000 |
| 135,159 |
|
| Morgan Stanley, 4.375%, 1/22/47 | 20,000 |
| 23,920 |
|
| Morgan Stanley, MTN, 3.70%, 10/23/24 | 190,000 |
| 201,847 |
|
| Morgan Stanley, MTN, 4.00%, 7/23/25 | 220,000 |
| 238,058 |
|
| Morgan Stanley, MTN, VRN, 3.77%, 1/24/29 | 60,000 |
| 64,556 |
|
UBS Group AG, 3.49%, 5/23/23(3) | 200,000 |
| 205,822 |
|
| | | 2,155,685 |
|
| Chemicals — 0.1% | | |
CF Industries, Inc., 4.50%, 12/1/26(3) | 90,000 |
| 97,976 |
|
| CF Industries, Inc., 5.15%, 3/15/34 | 70,000 |
| 78,355 |
|
| | | 176,331 |
|
| Commercial Services and Supplies — 0.1% | | |
| Republic Services, Inc., 3.55%, 6/1/22 | 50,000 |
| 51,650 |
|
| Waste Connections, Inc., 3.50%, 5/1/29 | 80,000 |
| 84,720 |
|
| Waste Management, Inc., 4.15%, 7/15/49 | 60,000 |
| 68,546 |
|
| | | 204,916 |
|
Communications Equipment† | | |
| Cisco Systems, Inc., 5.90%, 2/15/39 | 20,000 |
| 28,008 |
|
| Consumer Finance — 0.2% | | |
| Ally Financial, Inc., 3.875%, 5/21/24 | 60,000 |
| 62,975 |
|
| American Express Co., 3.00%, 10/30/24 | 30,000 |
| 31,009 |
|
| American Express Credit Corp., MTN, 2.20%, 3/3/20 | 175,000 |
| 175,007 |
|
| American Express Credit Corp., MTN, 2.25%, 5/5/21 | 40,000 |
| 40,193 |
|
| Capital One Financial Corp., 3.80%, 1/31/28 | 220,000 |
| 236,468 |
|
| Synchrony Financial, 2.85%, 7/25/22 | 90,000 |
| 91,101 |
|
| | | 636,753 |
|
Diversified Consumer Services† | | |
| George Washington University (The), 3.55%, 9/15/46 | 15,000 |
| 15,469 |
|
| Diversified Financial Services — 0.2% | | |
| Berkshire Hathaway, Inc., 2.75%, 3/15/23 | 80,000 |
| 82,032 |
|
| Credit Suisse Group Funding Guernsey Ltd., 3.125%, 12/10/20 | 250,000 |
| 252,269 |
|
| GE Capital International Funding Co. Unlimited Co., 2.34%, 11/15/20 | 200,000 |
| 200,193 |
|
|
| | | | | | |
| | Shares/
Principal Amount | Value |
| Voya Financial, Inc., 5.70%, 7/15/43 | $ | 45,000 |
| $ | 56,310 |
|
| | | 590,804 |
|
| Diversified Telecommunication Services — 0.5% | | |
| AT&T, Inc., 3.875%, 8/15/21 | 150,000 |
| 154,552 |
|
| AT&T, Inc., 3.40%, 5/15/25 | 100,000 |
| 104,821 |
|
| AT&T, Inc., 2.95%, 7/15/26 | 80,000 |
| 81,588 |
|
| AT&T, Inc., 3.80%, 2/15/27 | 100,000 |
| 106,650 |
|
| AT&T, Inc., 4.10%, 2/15/28 | 30,000 |
| 32,632 |
|
| AT&T, Inc., 5.15%, 11/15/46 | 162,000 |
| 193,737 |
|
Deutsche Telekom International Finance BV, 2.23%, 1/17/20(3) | 150,000 |
| 150,010 |
|
Deutsche Telekom International Finance BV, 3.60%, 1/19/27(3) | 150,000 |
| 157,932 |
|
| Orange SA, 4.125%, 9/14/21 | 40,000 |
| 41,454 |
|
| Telefonica Emisiones SA, 5.46%, 2/16/21 | 55,000 |
| 57,087 |
|
| Verizon Communications, Inc., 2.625%, 8/15/26 | 135,000 |
| 137,070 |
|
| Verizon Communications, Inc., 4.75%, 11/1/41 | 50,000 |
| 60,457 |
|
| Verizon Communications, Inc., 5.01%, 8/21/54 | 95,000 |
| 122,304 |
|
| | | 1,400,294 |
|
| Electric Utilities — 0.4% | | |
| AEP Transmission Co. LLC, 3.75%, 12/1/47 | 20,000 |
| 21,492 |
|
| American Electric Power Co., Inc., 3.20%, 11/13/27 | 20,000 |
| 20,632 |
|
| Berkshire Hathaway Energy Co., 3.50%, 2/1/25 | 170,000 |
| 180,458 |
|
| Berkshire Hathaway Energy Co., 3.80%, 7/15/48 | 30,000 |
| 32,234 |
|
| Commonwealth Edison Co., 3.20%, 11/15/49 | 30,000 |
| 29,860 |
|
| Duke Energy Corp., 3.55%, 9/15/21 | 20,000 |
| 20,432 |
|
| Duke Energy Corp., 2.65%, 9/1/26 | 70,000 |
| 70,323 |
|
| Duke Energy Florida LLC, 6.35%, 9/15/37 | 20,000 |
| 27,994 |
|
| Duke Energy Florida LLC, 3.85%, 11/15/42 | 30,000 |
| 32,561 |
|
| Duke Energy Progress LLC, 4.15%, 12/1/44 | 20,000 |
| 22,574 |
|
| Exelon Corp., 5.15%, 12/1/20 | 32,000 |
| 32,644 |
|
| Exelon Corp., 4.45%, 4/15/46 | 50,000 |
| 56,131 |
|
| Exelon Generation Co. LLC, 4.25%, 6/15/22 | 20,000 |
| 20,917 |
|
| Exelon Generation Co. LLC, 5.60%, 6/15/42 | 10,000 |
| 11,448 |
|
| FirstEnergy Corp., 4.25%, 3/15/23 | 30,000 |
| 31,628 |
|
| FirstEnergy Corp., 4.85%, 7/15/47 | 20,000 |
| 23,755 |
|
FirstEnergy Transmission LLC, 4.55%, 4/1/49(3) | 50,000 |
| 57,227 |
|
| Florida Power & Light Co., 4.125%, 2/1/42 | 40,000 |
| 45,838 |
|
| Florida Power & Light Co., 3.95%, 3/1/48 | 30,000 |
| 34,172 |
|
| Florida Power & Light Co., 3.15%, 10/1/49 | 50,000 |
| 50,539 |
|
| Georgia Power Co., 4.30%, 3/15/42 | 10,000 |
| 10,963 |
|
| MidAmerican Energy Co., 4.40%, 10/15/44 | 60,000 |
| 70,694 |
|
| NextEra Energy Capital Holdings, Inc., 3.55%, 5/1/27 | 50,000 |
| 53,109 |
|
NextEra Energy Operating Partners LP, 4.50%, 9/15/27(3) | 20,000 |
| 20,896 |
|
| Oncor Electric Delivery Co. LLC, 3.10%, 9/15/49 | 50,000 |
| 49,572 |
|
| Potomac Electric Power Co., 3.60%, 3/15/24 | 60,000 |
| 63,218 |
|
| Progress Energy, Inc., 3.15%, 4/1/22 | 20,000 |
| 20,388 |
|
| Southern Co. Gas Capital Corp., 3.95%, 10/1/46 | 25,000 |
| 25,827 |
|
| Southwestern Public Service Co., 3.70%, 8/15/47 | 60,000 |
| 63,106 |
|
|
| | | | | | |
| | Shares/
Principal Amount | Value |
| Xcel Energy, Inc., 3.35%, 12/1/26 | $ | 20,000 |
| $ | 20,987 |
|
| | | 1,221,619 |
|
Energy Equipment and Services† | | |
| Baker Hughes a GE Co. LLC / Baker Hughes Co-Obligor, Inc., 3.14%, 11/7/29 | 71,000 |
| 72,949 |
|
Entertainment† | | |
| Activision Blizzard, Inc., 2.30%, 9/15/21 | 30,000 |
| 30,155 |
|
| Equity Real Estate Investment Trusts (REITs) — 0.3% | | |
| American Tower Corp., 3.375%, 10/15/26 | 40,000 |
| 41,581 |
|
| AvalonBay Communities, Inc., MTN, 3.20%, 1/15/28 | 30,000 |
| 31,314 |
|
| Boston Properties LP, 3.65%, 2/1/26 | 100,000 |
| 105,944 |
|
| Crown Castle International Corp., 5.25%, 1/15/23 | 49,000 |
| 53,235 |
|
| Essex Portfolio LP, 3.625%, 8/15/22 | 30,000 |
| 31,033 |
|
| Essex Portfolio LP, 3.25%, 5/1/23 | 40,000 |
| 41,098 |
|
| Essex Portfolio LP, 3.00%, 1/15/30 | 40,000 |
| 40,474 |
|
| GLP Capital LP / GLP Financing II, Inc., 5.75%, 6/1/28 | 30,000 |
| 34,132 |
|
| Kilroy Realty LP, 3.80%, 1/15/23 | 50,000 |
| 51,821 |
|
| Kimco Realty Corp., 2.80%, 10/1/26 | 160,000 |
| 160,788 |
|
| Public Storage, 3.39%, 5/1/29 | 60,000 |
| 63,713 |
|
| Service Properties Trust, 4.65%, 3/15/24 | 40,000 |
| 41,667 |
|
| Simon Property Group LP, 2.45%, 9/13/29 | 80,000 |
| 78,736 |
|
| Ventas Realty LP, 4.125%, 1/15/26 | 20,000 |
| 21,421 |
|
| | | 796,957 |
|
| Food and Staples Retailing — 0.1% | | |
| Kroger Co. (The), 3.30%, 1/15/21 | 50,000 |
| 50,650 |
|
| Kroger Co. (The), 3.875%, 10/15/46 | 20,000 |
| 19,570 |
|
| Walmart, Inc., 4.05%, 6/29/48 | 110,000 |
| 130,139 |
|
| | | 200,359 |
|
| Gas Utilities — 0.1% | | |
| Dominion Energy Gas Holdings LLC, 3.00%, 11/15/29 | 150,000 |
| 149,586 |
|
| Health Care Equipment and Supplies — 0.1% | | |
| Becton Dickinson and Co., 3.73%, 12/15/24 | 100,000 |
| 105,987 |
|
| Becton Dickinson and Co., 3.70%, 6/6/27 | 14,000 |
| 14,916 |
|
| DH Europe Finance II Sarl, 3.40%, 11/15/49 | 70,000 |
| 71,404 |
|
| Medtronic, Inc., 3.50%, 3/15/25 | 63,000 |
| 67,510 |
|
| Medtronic, Inc., 4.375%, 3/15/35 | 29,000 |
| 34,339 |
|
| | | 294,156 |
|
| Health Care Providers and Services — 0.4% | | |
| Aetna, Inc., 2.75%, 11/15/22 | 30,000 |
| 30,490 |
|
| Anthem, Inc., 3.65%, 12/1/27 | 30,000 |
| 31,758 |
|
| Anthem, Inc., 4.65%, 1/15/43 | 40,000 |
| 45,094 |
|
| CommonSpirit Health, 2.95%, 11/1/22 | 20,000 |
| 20,374 |
|
| CVS Health Corp., 3.50%, 7/20/22 | 110,000 |
| 113,548 |
|
| CVS Health Corp., 2.75%, 12/1/22 | 35,000 |
| 35,570 |
|
| CVS Health Corp., 4.30%, 3/25/28 | 230,000 |
| 251,189 |
|
| CVS Health Corp., 4.78%, 3/25/38 | 30,000 |
| 34,058 |
|
| CVS Health Corp., 5.05%, 3/25/48 | 40,000 |
| 47,335 |
|
|
| | | | | | |
| | Shares/
Principal Amount | Value |
| Duke University Health System, Inc., 3.92%, 6/1/47 | $ | 30,000 |
| $ | 33,444 |
|
| HCA, Inc., 4.125%, 6/15/29 | 190,000 |
| 201,716 |
|
| Johns Hopkins Health System Corp. (The), 3.84%, 5/15/46 | 15,000 |
| 16,305 |
|
| Northwell Healthcare, Inc., 4.26%, 11/1/47 | 20,000 |
| 21,481 |
|
| Stanford Health Care, 3.80%, 11/15/48 | 20,000 |
| 21,634 |
|
| UnitedHealth Group, Inc., 2.875%, 12/15/21 | 30,000 |
| 30,600 |
|
| UnitedHealth Group, Inc., 2.875%, 3/15/22 | 75,000 |
| 76,456 |
|
| UnitedHealth Group, Inc., 3.75%, 7/15/25 | 65,000 |
| 70,197 |
|
| UnitedHealth Group, Inc., 4.75%, 7/15/45 | 30,000 |
| 36,883 |
|
Universal Health Services, Inc., 4.75%, 8/1/22(3) | 20,000 |
| 20,250 |
|
| | | 1,138,382 |
|
| Hotels, Restaurants and Leisure — 0.1% | | |
| McDonald's Corp., MTN, 3.375%, 5/26/25 | 40,000 |
| 42,313 |
|
| McDonald's Corp., MTN, 4.45%, 3/1/47 | 60,000 |
| 68,870 |
|
| McDonald's Corp., MTN, 3.625%, 9/1/49 | 50,000 |
| 50,918 |
|
| Royal Caribbean Cruises Ltd., 5.25%, 11/15/22 | 30,000 |
| 32,486 |
|
| | | 194,587 |
|
| Household Durables — 0.1% | | |
| D.R. Horton, Inc., 5.75%, 8/15/23 | 35,000 |
| 38,686 |
|
| D.R. Horton, Inc., 2.50%, 10/15/24 | 90,000 |
| 90,083 |
|
| Lennar Corp., 4.75%, 4/1/21 | 80,000 |
| 81,946 |
|
| Toll Brothers Finance Corp., 4.35%, 2/15/28 | 90,000 |
| 94,081 |
|
| | | 304,796 |
|
| Insurance — 0.3% | | |
| American International Group, Inc., 4.125%, 2/15/24 | 230,000 |
| 246,966 |
|
| Berkshire Hathaway Finance Corp., 3.00%, 5/15/22 | 50,000 |
| 51,364 |
|
| Berkshire Hathaway Finance Corp., 4.20%, 8/15/48 | 90,000 |
| 106,361 |
|
| Chubb INA Holdings, Inc., 3.15%, 3/15/25 | 40,000 |
| 42,083 |
|
| Chubb INA Holdings, Inc., 3.35%, 5/3/26 | 20,000 |
| 21,266 |
|
| Hartford Financial Services Group, Inc. (The), 5.95%, 10/15/36 | 50,000 |
| 65,346 |
|
| Hartford Financial Services Group, Inc. (The), 3.60%, 8/19/49 | 62,000 |
| 63,904 |
|
Liberty Mutual Group, Inc., 4.50%, 6/15/49(3) | 40,000 |
| 44,716 |
|
| Markel Corp., 4.90%, 7/1/22 | 70,000 |
| 74,463 |
|
| Markel Corp., 3.50%, 11/1/27 | 30,000 |
| 31,067 |
|
| MetLife, Inc., 4.125%, 8/13/42 | 40,000 |
| 45,578 |
|
| MetLife, Inc., 4.875%, 11/13/43 | 45,000 |
| 55,720 |
|
| Prudential Financial, Inc., 3.94%, 12/7/49 | 55,000 |
| 59,943 |
|
| WR Berkley Corp., 4.625%, 3/15/22 | 20,000 |
| 21,090 |
|
| | | 929,867 |
|
Internet and Direct Marketing Retail† | | |
| eBay, Inc., 2.15%, 6/5/20 | 40,000 |
| 40,031 |
|
| IT Services — 0.2% | | |
| Fidelity National Information Services, Inc., 3.00%, 8/15/26 | 110,000 |
| 113,800 |
|
| Fiserv, Inc., 3.50%, 7/1/29 | 47,000 |
| 49,429 |
|
| Global Payments, Inc., 3.20%, 8/15/29 | 100,000 |
| 102,195 |
|
| Mastercard, Inc., 3.65%, 6/1/49 | 50,000 |
| 55,454 |
|
|
| | | | | | |
| | Shares/
Principal Amount | Value |
| Western Union Co. (The), 2.85%, 1/10/25 | $ | 120,000 |
| $ | 120,428 |
|
| | | 441,306 |
|
Life Sciences Tools and Services† | | |
| Thermo Fisher Scientific, Inc., 2.95%, 9/19/26 | 20,000 |
| 20,563 |
|
| Media — 0.3% | | |
| Charter Communications Operating LLC / Charter Communications Operating Capital, 4.91%, 7/23/25 | 135,000 |
| 148,711 |
|
| Charter Communications Operating LLC / Charter Communications Operating Capital, 4.20%, 3/15/28 | 30,000 |
| 31,970 |
|
| Charter Communications Operating LLC / Charter Communications Operating Capital, 6.48%, 10/23/45 | 105,000 |
| 131,132 |
|
| Charter Communications Operating LLC / Charter Communications Operating Capital, 4.80%, 3/1/50 | 20,000 |
| 21,052 |
|
| Comcast Corp., 4.40%, 8/15/35 | 20,000 |
| 23,437 |
|
| Comcast Corp., 6.40%, 5/15/38 | 50,000 |
| 70,406 |
|
| Comcast Corp., 4.60%, 10/15/38 | 110,000 |
| 131,057 |
|
| Comcast Corp., 4.75%, 3/1/44 | 150,000 |
| 182,488 |
|
| Interpublic Group of Cos., Inc. (The), 4.00%, 3/15/22 | 20,000 |
| 20,740 |
|
| TEGNA, Inc., 5.125%, 7/15/20 | 29,000 |
| 29,102 |
|
| ViacomCBS, Inc., 3.125%, 6/15/22 | 30,000 |
| 30,632 |
|
| ViacomCBS, Inc., 4.25%, 9/1/23 | 30,000 |
| 31,949 |
|
| ViacomCBS, Inc., 4.85%, 7/1/42 | 10,000 |
| 11,183 |
|
| ViacomCBS, Inc., 4.375%, 3/15/43 | 50,000 |
| 52,991 |
|
| | | 916,850 |
|
Metals and Mining† | | |
| Steel Dynamics, Inc., 3.45%, 4/15/30 | 70,000 |
| 70,874 |
|
| Multi-Utilities — 0.1% | | |
| CenterPoint Energy, Inc., 4.25%, 11/1/28 | 80,000 |
| 86,832 |
|
| Consolidated Edison Co. of New York, Inc., 3.95%, 3/1/43 | 35,000 |
| 37,888 |
|
| Dominion Energy, Inc., 4.90%, 8/1/41 | 50,000 |
| 58,622 |
|
| NiSource, Inc., 5.65%, 2/1/45 | 35,000 |
| 44,658 |
|
| Sempra Energy, 2.875%, 10/1/22 | 40,000 |
| 40,752 |
|
| Sempra Energy, 3.25%, 6/15/27 | 30,000 |
| 30,888 |
|
| Sempra Energy, 3.80%, 2/1/38 | 20,000 |
| 20,878 |
|
| Sempra Energy, 4.00%, 2/1/48 | 20,000 |
| 21,057 |
|
| | | 341,575 |
|
| Oil, Gas and Consumable Fuels — 1.2% | | |
| BP Capital Markets America, Inc., 4.50%, 10/1/20 | 30,000 |
| 30,572 |
|
| Cimarex Energy Co., 4.375%, 6/1/24 | 75,000 |
| 79,212 |
|
| CNOOC Nexen Finance 2014 ULC, 4.25%, 4/30/24 | 30,000 |
| 32,101 |
|
| Concho Resources, Inc., 4.375%, 1/15/25 | 75,000 |
| 77,469 |
|
| Continental Resources, Inc., 4.375%, 1/15/28 | 80,000 |
| 85,111 |
|
| Diamondback Energy, Inc., 3.50%, 12/1/29 | 180,000 |
| 183,501 |
|
| Ecopetrol SA, 5.875%, 5/28/45 | 10,000 |
| 11,822 |
|
| Enbridge, Inc., 4.00%, 10/1/23 | 55,000 |
| 58,108 |
|
| Enbridge, Inc., 3.125%, 11/15/29 | 130,000 |
| 131,694 |
|
| Encana Corp., 6.50%, 2/1/38 | 70,000 |
| 82,634 |
|
| Energy Transfer Operating LP, 4.15%, 10/1/20 | 40,000 |
| 40,429 |
|
|
| | | | | | |
| | Shares/
Principal Amount | Value |
| Energy Transfer Operating LP, 7.50%, 10/15/20 | $ | 30,000 |
| $ | 31,181 |
|
| Energy Transfer Operating LP, 3.60%, 2/1/23 | 30,000 |
| 30,729 |
|
| Energy Transfer Operating LP, 4.25%, 3/15/23 | 110,000 |
| 114,910 |
|
| Energy Transfer Operating LP, 5.25%, 4/15/29 | 100,000 |
| 112,315 |
|
| Energy Transfer Operating LP, 4.90%, 3/15/35 | 55,000 |
| 57,757 |
|
| Energy Transfer Operating LP, 6.50%, 2/1/42 | 20,000 |
| 23,776 |
|
| Energy Transfer Operating LP, 6.00%, 6/15/48 | 50,000 |
| 58,267 |
|
| Enterprise Products Operating LLC, 5.20%, 9/1/20 | 120,000 |
| 122,506 |
|
| Enterprise Products Operating LLC, 4.85%, 3/15/44 | 100,000 |
| 116,159 |
|
| EOG Resources, Inc., 4.10%, 2/1/21 | 20,000 |
| 20,486 |
|
| Equinor ASA, 3.25%, 11/18/49 | 70,000 |
| 70,531 |
|
| Exxon Mobil Corp., 2.71%, 3/6/25 | 40,000 |
| 41,342 |
|
| Exxon Mobil Corp., 3.04%, 3/1/26 | 50,000 |
| 52,447 |
|
| Hess Corp., 6.00%, 1/15/40 | 40,000 |
| 47,241 |
|
| Kinder Morgan Energy Partners LP, 5.30%, 9/15/20 | 45,000 |
| 46,027 |
|
| Kinder Morgan Energy Partners LP, 6.50%, 9/1/39 | 165,000 |
| 209,503 |
|
MPLX LP, 5.25%, 1/15/25(3) | 50,000 |
| 52,485 |
|
| MPLX LP, 4.875%, 6/1/25 | 95,000 |
| 103,757 |
|
| MPLX LP, 4.50%, 4/15/38 | 70,000 |
| 71,184 |
|
| MPLX LP, 5.20%, 3/1/47 | 40,000 |
| 43,195 |
|
| Newfield Exploration Co., 5.75%, 1/30/22 | 50,000 |
| 53,169 |
|
| Newfield Exploration Co., 5.375%, 1/1/26 | 40,000 |
| 43,400 |
|
| ONEOK, Inc., 3.40%, 9/1/29 | 80,000 |
| 81,338 |
|
| Petroleos Mexicanos, 6.00%, 3/5/20 | 26,000 |
| 26,211 |
|
| Petroleos Mexicanos, 4.875%, 1/24/22 | 70,000 |
| 72,577 |
|
| Petroleos Mexicanos, 3.50%, 1/30/23 | 10,000 |
| 10,079 |
|
| Phillips 66, 4.30%, 4/1/22 | 50,000 |
| 52,480 |
|
| Plains All American Pipeline LP / PAA Finance Corp., 3.65%, 6/1/22 | 65,000 |
| 66,694 |
|
| Sabine Pass Liquefaction LLC, 5.625%, 3/1/25 | 230,000 |
| 258,964 |
|
| Shell International Finance BV, 2.375%, 8/21/22 | 20,000 |
| 20,267 |
|
| Shell International Finance BV, 3.25%, 5/11/25 | 40,000 |
| 42,329 |
|
| Sunoco Logistics Partners Operations LP, 3.45%, 1/15/23 | 40,000 |
| 40,682 |
|
| Sunoco Logistics Partners Operations LP, 4.00%, 10/1/27 | 70,000 |
| 72,400 |
|
| Total Capital Canada Ltd., 2.75%, 7/15/23 | 20,000 |
| 20,514 |
|
| Williams Cos., Inc. (The), 4.125%, 11/15/20 | 80,000 |
| 80,961 |
|
| Williams Cos., Inc. (The), 4.55%, 6/24/24 | 60,000 |
| 64,765 |
|
| Williams Cos., Inc. (The), 5.10%, 9/15/45 | 60,000 |
| 66,820 |
|
| | | 3,312,101 |
|
Paper and Forest Products† | | |
Georgia-Pacific LLC, 5.40%, 11/1/20(3) | 60,000 |
| 61,670 |
|
| Pharmaceuticals — 0.3% | | |
| Allergan Finance LLC, 3.25%, 10/1/22 | 130,000 |
| 132,848 |
|
| Allergan Funding SCS, 3.85%, 6/15/24 | 89,000 |
| 93,470 |
|
| Allergan Funding SCS, 4.55%, 3/15/35 | 10,000 |
| 10,925 |
|
Bristol-Myers Squibb Co., 3.25%, 8/15/22(3) | 155,000 |
| 160,145 |
|
Bristol-Myers Squibb Co., 3.625%, 5/15/24(3) | 60,000 |
| 63,399 |
|
Bristol-Myers Squibb Co., 3.875%, 8/15/25(3) | 120,000 |
| 129,817 |
|
|
| | | | | | |
| | Shares/
Principal Amount | Value |
Bristol-Myers Squibb Co., 4.25%, 10/26/49(3) | $ | 30,000 |
| $ | 35,553 |
|
| Shire Acquisitions Investments Ireland DAC, 2.40%, 9/23/21 | 180,000 |
| 181,023 |
|
| | | 807,180 |
|
| Road and Rail — 0.3% | | |
Ashtead Capital, Inc., 4.125%, 8/15/25(3) | 200,000 |
| 206,083 |
|
| Burlington Northern Santa Fe LLC, 3.60%, 9/1/20 | 189,000 |
| 190,443 |
|
| Burlington Northern Santa Fe LLC, 4.45%, 3/15/43 | 60,000 |
| 70,231 |
|
| Burlington Northern Santa Fe LLC, 4.15%, 4/1/45 | 75,000 |
| 85,004 |
|
| CSX Corp., 3.25%, 6/1/27 | 100,000 |
| 105,096 |
|
| Union Pacific Corp., 3.60%, 9/15/37 | 50,000 |
| 52,126 |
|
Union Pacific Corp., 3.84%, 3/20/60(3) | 50,000 |
| 50,796 |
|
| Union Pacific Corp., MTN, 3.55%, 8/15/39 | 40,000 |
| 41,603 |
|
| | | 801,382 |
|
| Software — 0.2% | | |
| Microsoft Corp., 2.70%, 2/12/25 | 220,000 |
| 227,370 |
|
| Microsoft Corp., 3.45%, 8/8/36 | 60,000 |
| 65,693 |
|
| Microsoft Corp., 4.25%, 2/6/47 | 70,000 |
| 85,737 |
|
| Oracle Corp., 2.50%, 10/15/22 | 25,000 |
| 25,460 |
|
| Oracle Corp., 3.625%, 7/15/23 | 30,000 |
| 31,722 |
|
| Oracle Corp., 2.65%, 7/15/26 | 125,000 |
| 127,841 |
|
| | | 563,823 |
|
| Specialty Retail — 0.1% | | |
| Home Depot, Inc. (The), 3.75%, 2/15/24 | 40,000 |
| 42,704 |
|
| Home Depot, Inc. (The), 3.00%, 4/1/26 | 40,000 |
| 41,805 |
|
| Home Depot, Inc. (The), 5.95%, 4/1/41 | 50,000 |
| 70,570 |
|
| | | 155,079 |
|
| Technology Hardware, Storage and Peripherals — 0.3% | | |
| Apple, Inc., 2.75%, 1/13/25 | 30,000 |
| 30,991 |
|
| Apple, Inc., 2.50%, 2/9/25 | 140,000 |
| 142,565 |
|
| Apple, Inc., 2.45%, 8/4/26 | 60,000 |
| 60,842 |
|
| Apple, Inc., 3.20%, 5/11/27 | 60,000 |
| 63,293 |
|
| Apple, Inc., 2.90%, 9/12/27 | 150,000 |
| 156,203 |
|
Dell International LLC / EMC Corp., 5.45%, 6/15/23(3) | 160,000 |
| 173,546 |
|
Dell International LLC / EMC Corp., 6.02%, 6/15/26(3) | 310,000 |
| 356,800 |
|
| | | 984,240 |
|
Trading Companies and Distributors† | | |
| International Lease Finance Corp., 5.875%, 8/15/22 | 120,000 |
| 130,717 |
|
Wireless Telecommunication Services† | | |
| Rogers Communications, Inc., 3.70%, 11/15/49 | 50,000 |
| 50,531 |
|
TOTAL CORPORATE BONDS
(Cost $27,358,191) | | 28,766,785 |
|
| U.S. GOVERNMENT AGENCY MORTGAGE-BACKED SECURITIES — 9.1% | |
| Adjustable-Rate U.S. Government Agency Mortgage-Backed Securities — 0.3% | |
| FHLMC, VRN, 4.50%, (12-month LIBOR plus 1.86%), 7/1/36 | 6,466 |
| 6,807 |
|
| FHLMC, VRN, 4.18%, (1-year H15T1Y plus 2.14%), 10/1/36 | 17,640 |
| 18,658 |
|
| FHLMC, VRN, 4.71%, (1-year H15T1Y plus 2.25%), 4/1/37 | 21,509 |
| 22,736 |
|
| FHLMC, VRN, 4.44%, (12-month LIBOR plus 1.80%), 2/1/38 | 7,811 |
| 8,230 |
|
|
| | | | | | |
| | Shares/
Principal Amount | Value |
| FHLMC, VRN, 4.89%, (12-month LIBOR plus 1.84%), 6/1/38 | $ | 7,395 |
| $ | 7,797 |
|
| FHLMC, VRN, 3.89%, (12-month LIBOR plus 1.78%), 9/1/40 | 8,762 |
| 9,201 |
|
| FHLMC, VRN, 4.77%, (12-month LIBOR plus 1.88%), 5/1/41 | 3,566 |
| 3,742 |
|
| FHLMC, VRN, 3.69%, (12-month LIBOR plus 1.89%), 7/1/41 | 10,277 |
| 10,591 |
|
| FHLMC, VRN, 4.04%, (12-month LIBOR plus 1.87%), 7/1/41 | 13,169 |
| 13,886 |
|
| FHLMC, VRN, 4.73%, (12-month LIBOR plus 1.64%), 2/1/43 | 4,587 |
| 4,729 |
|
| FHLMC, VRN, 4.43%, (12-month LIBOR plus 1.65%), 6/1/43 | 3,650 |
| 3,773 |
|
| FHLMC, VRN, 4.50%, (12-month LIBOR plus 1.62%), 6/1/43 | 97 |
| 100 |
|
| FHLMC, VRN, 2.84%, (12-month LIBOR plus 1.63%), 1/1/44 | 30,393 |
| 30,810 |
|
| FHLMC, VRN, 4.11%, (12-month LIBOR plus 1.60%), 10/1/44 | 14,825 |
| 15,246 |
|
| FHLMC, VRN, 2.57%, (12-month LIBOR plus 1.60%), 6/1/45 | 63,808 |
| 64,578 |
|
| FHLMC, VRN, 2.35%, (12-month LIBOR plus 1.63%), 8/1/46 | 167,808 |
| 169,838 |
|
| FHLMC, VRN, 3.06%, (12-month LIBOR plus 1.64%), 9/1/47 | 144,602 |
| 146,857 |
|
| FNMA, VRN, 3.82%, (6-month LIBOR plus 1.57%), 6/1/35 | 15,789 |
| 16,361 |
|
| FNMA, VRN, 3.93%, (6-month LIBOR plus 1.57%), 6/1/35 | 12,991 |
| 13,454 |
|
| FNMA, VRN, 4.37%, (1-year H15T1Y plus 2.16%), 3/1/38 | 19,663 |
| 20,733 |
|
| FNMA, VRN, 4.82%, (12-month LIBOR plus 1.69%), 1/1/40 | 2,451 |
| 2,586 |
|
| FNMA, VRN, 4.22%, (12-month LIBOR plus 1.81%), 3/1/40 | 5,882 |
| 6,197 |
|
| FNMA, VRN, 3.87%, (12-month LIBOR plus 1.77%), 10/1/40 | 13,759 |
| 14,417 |
|
| FNMA, VRN, 4.54%, (12-month LIBOR plus 1.55%), 3/1/43 | 5,109 |
| 5,279 |
|
| FNMA, VRN, 3.18%, (12-month LIBOR plus 1.61%), 3/1/47 | 113,158 |
| 115,351 |
|
| FNMA, VRN, 2.89%, (12-month LIBOR plus 1.61%), 10/1/47 | 50,935 |
| 51,703 |
|
| | | 783,660 |
|
| Fixed-Rate U.S. Government Agency Mortgage-Backed Securities — 8.8% | |
| FHLMC, 6.50%, 1/1/28 | 1,739 |
| 1,933 |
|
| FHLMC, 6.50%, 6/1/29 | 2,259 |
| 2,511 |
|
| FHLMC, 8.00%, 7/1/30 | 1,792 |
| 2,117 |
|
| FHLMC, 5.50%, 12/1/33 | 48,364 |
| 53,233 |
|
| FHLMC, 5.50%, 1/1/38 | 7,179 |
| 7,927 |
|
| FHLMC, 6.00%, 8/1/38 | 10,462 |
| 11,685 |
|
| FHLMC, 3.00%, 2/1/43 | 233,750 |
| 240,778 |
|
| FHLMC, 3.50%, 12/1/47 | 187,631 |
| 195,113 |
|
| FHLMC, 3.00%, 10/1/49 | 2,176,759 |
| 2,208,713 |
|
| FNMA, 6.50%, 1/1/29 | 4,741 |
| 5,296 |
|
| FNMA, 7.50%, 7/1/29 | 6,174 |
| 6,353 |
|
| FNMA, 7.50%, 9/1/30 | 2,105 |
| 2,438 |
|
| FNMA, 5.00%, 7/1/31 | 58,104 |
| 62,563 |
|
| FNMA, 6.50%, 1/1/32 | 3,415 |
| 3,794 |
|
| FNMA, 5.50%, 6/1/33 | 15,628 |
| 17,394 |
|
| FNMA, 5.50%, 8/1/33 | 33,535 |
| 37,711 |
|
| FNMA, 5.00%, 11/1/33 | 85,044 |
| 93,798 |
|
| FNMA, 5.50%, 1/1/34 | 29,909 |
| 33,631 |
|
| FNMA, 3.50%, 3/1/34 | 48,487 |
| 50,231 |
|
| FNMA, 5.00%, 4/1/35 | 67,643 |
| 74,569 |
|
| FNMA, 4.50%, 9/1/35 | 40,967 |
| 44,415 |
|
| FNMA, 5.00%, 2/1/36 | 65,724 |
| 72,493 |
|
| FNMA, 5.50%, 1/1/37 | 48,749 |
| 54,893 |
|
|
| | | | | | |
| | Shares/
Principal Amount | Value |
| FNMA, 5.50%, 2/1/37 | $ | 11,314 |
| $ | 12,691 |
|
| FNMA, 6.00%, 7/1/37 | 75,490 |
| 86,421 |
|
| FNMA, 6.50%, 8/1/37 | 6,523 |
| 7,221 |
|
| FNMA, 5.00%, 4/1/40 | 113,574 |
| 125,391 |
|
| FNMA, 5.00%, 6/1/40 | 78,375 |
| 86,376 |
|
| FNMA, 3.50%, 1/1/41 | 272,571 |
| 287,217 |
|
| FNMA, 4.00%, 1/1/41 | 356,013 |
| 382,478 |
|
| FNMA, 4.00%, 5/1/41 | 84,911 |
| 91,098 |
|
| FNMA, 5.00%, 6/1/41 | 91,426 |
| 100,864 |
|
| FNMA, 4.50%, 7/1/41 | 105,364 |
| 114,465 |
|
| FNMA, 4.50%, 9/1/41 | 27,752 |
| 30,150 |
|
| FNMA, 4.00%, 12/1/41 | 137,715 |
| 147,778 |
|
| FNMA, 4.00%, 1/1/42 | 148,614 |
| 159,380 |
|
| FNMA, 3.50%, 5/1/42 | 278,762 |
| 293,778 |
|
| FNMA, 3.50%, 6/1/42 | 65,523 |
| 69,310 |
|
| FNMA, 3.50%, 5/1/45 | 497,210 |
| 521,250 |
|
| FNMA, 3.00%, 11/1/46 | 745,310 |
| 763,073 |
|
| FNMA, 3.50%, 2/1/47 | 1,826,656 |
| 1,914,810 |
|
| FNMA, 6.50%, 8/1/47 | 2,329 |
| 2,498 |
|
| FNMA, 6.50%, 9/1/47 | 4,715 |
| 5,042 |
|
| FNMA, 6.50%, 9/1/47 | 227 |
| 243 |
|
| FNMA, 6.50%, 9/1/47 | 2,479 |
| 2,650 |
|
| FNMA, 3.50%, 10/1/47 | 1,208,675 |
| 1,256,510 |
|
| FNMA, 3.50%, 3/1/48 | 1,265,377 |
| 1,314,803 |
|
| FNMA, 3.00%, 4/1/48 | 585,690 |
| 601,178 |
|
| FNMA, 4.00%, 6/1/48 | 643,789 |
| 672,109 |
|
| FNMA, 4.50%, 7/1/48 | 1,962,681 |
| 2,078,255 |
|
| FNMA, 4.00%, 8/1/48 | 1,430,476 |
| 1,491,918 |
|
| FNMA, 3.50%, 4/1/49 | 529,827 |
| 546,936 |
|
| FNMA, 3.50%, 4/1/49 | 1,137,331 |
| 1,170,532 |
|
| FNMA, 3.50%, 5/1/49 | 396,985 |
| 409,041 |
|
| FNMA, 3.50%, 9/1/49 | 810,930 |
| 834,917 |
|
| GNMA, 2.50%, TBA | 1,000,000 |
| 1,004,336 |
|
| GNMA, 3.00%, TBA | 2,000,000 |
| 2,053,194 |
|
| GNMA, 7.00%, 4/20/26 | 6,516 |
| 7,236 |
|
| GNMA, 7.50%, 8/15/26 | 4,179 |
| 4,634 |
|
| GNMA, 7.00%, 2/15/28 | 1,749 |
| 1,752 |
|
| GNMA, 7.50%, 2/15/28 | 1,347 |
| 1,350 |
|
| GNMA, 6.50%, 5/15/28 | 284 |
| 313 |
|
| GNMA, 6.50%, 5/15/28 | 1,017 |
| 1,122 |
|
| GNMA, 7.00%, 12/15/28 | 1,865 |
| 1,868 |
|
| GNMA, 7.00%, 5/15/31 | 14,447 |
| 16,605 |
|
| GNMA, 5.50%, 11/15/32 | 30,420 |
| 33,638 |
|
| GNMA, 4.50%, 1/15/40 | 26,429 |
| 28,749 |
|
| GNMA, 4.50%, 5/20/41 | 78,675 |
| 85,021 |
|
| GNMA, 4.50%, 6/15/41 | 46,440 |
| 50,834 |
|
| GNMA, 3.50%, 7/20/42 | 60,552 |
| 63,986 |
|
|
| | | | | | |
| | Shares/
Principal Amount | Value |
| GNMA, 3.50%, 3/15/46 | $ | 489,090 |
| $ | 510,680 |
|
| GNMA, 2.50%, 8/20/46 | 104,197 |
| 104,687 |
|
| UMBS, 3.50%, TBA | 1,525,000 |
| 1,568,049 |
|
| UMBS, 4.00%, TBA | 1,000,000 |
| 1,039,929 |
|
| | | 25,441,955 |
|
TOTAL U.S. GOVERNMENT AGENCY MORTGAGE-BACKED SECURITIES
(Cost $25,804,297) | 26,225,615 |
|
| ASSET-BACKED SECURITIES — 2.4% | | |
BRE Grand Islander Timeshare Issuer LLC, Series 2017-1A, Class A SEQ, 2.94%, 5/25/29(3) | 112,437 |
| 112,576 |
|
BRE Grand Islander Timeshare Issuer LLC, Series 2019-A, Class A SEQ, 3.28%, 9/26/33(3) | 431,035 |
| 439,948 |
|
Goodgreen, Series 2018-1A, Class A, VRN, 3.93%, 10/15/53(3) | 147,027 |
| 153,519 |
|
Hilton Grand Vacations Trust, Series 2014-AA, Class A SEQ, 1.77%, 11/25/26(3) | 29,428 |
| 29,351 |
|
Hilton Grand Vacations Trust, Series 2018-AA, Class B, 3.70%, 2/25/32(3) | 314,921 |
| 322,832 |
|
Invitation Homes Trust, Series 2018-SFR1, Class A, VRN, 2.44%, (1-month LIBOR plus 0.70%), 3/17/37(3) | 370,897 |
| 368,286 |
|
Invitation Homes Trust, Series 2018-SFR1, Class C, VRN, 2.99%, (1-month LIBOR plus 1.25%), 3/17/37(3) | 400,000 |
| 399,588 |
|
Invitation Homes Trust, Series 2018-SFR2, Class B, VRN, 2.82%, (1-month LIBOR plus 1.08%), 6/17/37(3) | 275,000 |
| 273,725 |
|
Invitation Homes Trust, Series 2018-SFR3, Class A, VRN, 2.74%, (1-month LIBOR plus 1.00%), 7/17/37(3) | 402,128 |
| 402,830 |
|
Invitation Homes Trust, Series 2018-SFR4, Class B, VRN, 2.99%, (1-month LIBOR plus 1.25%), 1/17/38(3) | 550,000 |
| 550,791 |
|
Mill City Mortgage Loan Trust, Series 2017-2, Class A1, VRN, 2.75%, 7/25/59(3) | 153,307 |
| 154,086 |
|
MVW Owner Trust, Series 2014-1A, Class A SEQ, 2.25%, 9/22/31(3) | 18,634 |
| 18,613 |
|
MVW Owner Trust, Series 2015-1A, Class A SEQ, 2.52%, 12/20/32(3) | 19,175 |
| 19,168 |
|
MVW Owner Trust, Series 2016-1A, Class A SEQ, 2.25%, 12/20/33(3) | 29,262 |
| 29,079 |
|
MVW Owner Trust, Series 2017-1A, Class A SEQ, 2.42%, 12/20/34(3) | 100,335 |
| 100,567 |
|
MVW Owner Trust, Series 2018-1A, Class A SEQ, 3.45%, 1/21/36(3) | 204,707 |
| 210,460 |
|
Progress Residential Trust, Series 2018-SFR1, Class A SEQ, 3.26%, 3/17/35(3) | 224,727 |
| 225,952 |
|
Progress Residential Trust, Series 2018-SFR3, Class A SEQ, 3.88%, 10/17/35(3) | 349,780 |
| 356,733 |
|
Progress Residential Trust, Series 2018-SFR3, Class B, 4.08%, 10/17/35(3) | 625,000 |
| 634,301 |
|
Progress Residential Trust, Series 2019-SFR3, Class A SEQ, 2.27%, 9/17/36(3) | 350,000 |
| 342,813 |
|
Sierra Timeshare Conduit Receivables Funding LLC, Series 2017-1A, Class A SEQ, 2.91%, 3/20/34(3) | 22,967 |
| 23,155 |
|
Sierra Timeshare Receivables Funding LLC, Series 2018-2A, Class A SEQ, 3.50%, 6/20/35(3) | 143,858 |
| 146,160 |
|
Sierra Timeshare Receivables Funding LLC, Series 2018-2A, Class B, 3.65%, 6/20/35(3) | 155,846 |
| 158,343 |
|
Sierra Timeshare Receivables Funding LLC, Series 2019-2A, Class A SEQ, 2.59%, 5/20/36(3) | 239,593 |
| 239,886 |
|
Towd Point Mortgage Trust, Series 2016-1, Class A1, VRN, 3.50%, 2/25/55(3) | 27,028 |
| 27,340 |
|
|
| | | | | | |
| | Shares/
Principal Amount | Value |
Towd Point Mortgage Trust, Series 2017-2, Class A1, VRN, 2.75%, 4/25/57(3) | $ | 65,297 |
| $ | 65,796 |
|
Towd Point Mortgage Trust, Series 2017-6, Class A1, VRN, 2.75%, 10/25/57(3) | 193,429 |
| 194,653 |
|
Towd Point Mortgage Trust, Series 2018-1, Class A1 SEQ, VRN, 3.00%, 1/25/58(3) | 70,153 |
| 71,047 |
|
Towd Point Mortgage Trust, Series 2018-4, Class A1, VRN, 3.00%, 6/25/58(3) | 85,979 |
| 87,453 |
|
| US Airways Pass-Through Trust, Series 2013-1, Class A, 3.95%, 5/15/27 | 13,047 |
| 13,733 |
|
VSE VOI Mortgage LLC, Series 2016-A, Class A SEQ, 2.54%, 7/20/33(3) | 305,578 |
| 304,970 |
|
VSE VOI Mortgage LLC, Series 2017-A, Class A SEQ, 2.33%, 3/20/35(3) | 113,524 |
| 113,531 |
|
VSE VOI Mortgage LLC, Series 2018-A, Class B, 3.72%, 2/20/36(3) | 137,820 |
| 141,657 |
|
TOTAL ASSET-BACKED SECURITIES
(Cost $6,669,380) | | 6,732,942 |
|
| COLLATERALIZED MORTGAGE OBLIGATIONS — 1.1% | | |
| Private Sponsor Collateralized Mortgage Obligations — 0.8% | | |
| ABN Amro Mortgage Corp., Series 2003-4, Class A4, 5.50%, 3/25/33 | 3,014 |
| 3,180 |
|
| Adjustable Rate Mortgage Trust, Series 2004-4, Class 4A1, VRN, 4.05%, 3/25/35 | 26,200 |
| 26,770 |
|
Agate Bay Mortgage Loan Trust, Series 2016-3, Class A3, VRN, 3.50%, 8/25/46(3) | 91,850 |
| 93,543 |
|
| Banc of America Mortgage Trust, Series 2004-E, Class 2A6 SEQ, VRN, 4.78%, 6/25/34 | 19,692 |
| 19,873 |
|
| Citigroup Mortgage Loan Trust, Inc., Series 2004-UST1, Class A4, VRN, 4.15%, 8/25/34 | 16,223 |
| 15,894 |
|
| Citigroup Mortgage Loan Trust, Inc., Series 2004-UST1, Class A5, VRN, 3.88%, 8/25/34 | 15,568 |
| 15,746 |
|
| Citigroup Mortgage Loan Trust, Inc., Series 2005-4, Class A, VRN, 4.61%, 8/25/35 | 4,917 |
| 5,057 |
|
| Citigroup Mortgage Loan Trust, Inc., Series 2005-6, Class A2, VRN, 4.55%, (1-year H15T1Y plus 2.15%), 9/25/35 | 12,915 |
| 12,995 |
|
| Countrywide Home Loan Mortgage Pass-Through Trust, Series 2005-17, Class 1A11, 5.50%, 9/25/35 | 836 |
| 825 |
|
Credit Suisse Mortgage Trust, Series 2017-HL2, Class A3 SEQ, VRN, 3.50%, 10/25/47(3) | 205,706 |
| 209,281 |
|
| First Horizon Alternative Mortgage Securities Trust, Series 2004-AA4, Class A1, VRN, 3.97%, 10/25/34 | 5,771 |
| 5,808 |
|
| First Horizon Mortgage Pass-Through Trust, Series 2005-AR3, Class 4A1, VRN, 5.01%, 8/25/35 | 7,387 |
| 7,729 |
|
| GSR Mortgage Loan Trust, Series 2004-7, Class 3A1, VRN, 4.04%, 6/25/34 | 11,028 |
| 11,021 |
|
| GSR Mortgage Loan Trust, Series 2004-AR5, Class 3A3, VRN, 4.69%, 5/25/34 | 14,263 |
| 14,695 |
|
| GSR Mortgage Loan Trust, Series 2005-AR1, Class 3A1, VRN, 4.02%, 1/25/35 | 17,458 |
| 17,665 |
|
| GSR Mortgage Loan Trust, Series 2005-AR6, Class 2A1, VRN, 4.27%, 9/25/35 | 42,469 |
| 43,718 |
|
| GSR Mortgage Loan Trust, Series 2005-AR6, Class 4A5, VRN, 4.52%, 9/25/35 | 9,923 |
| 10,169 |
|
| JPMorgan Mortgage Trust, Series 2005-A4, Class 1A1, VRN, 4.11%, 7/25/35 | 7,025 |
| 7,123 |
|
| JPMorgan Mortgage Trust, Series 2005-A4, Class 2A1, VRN, 4.29%, 7/25/35 | 4,430 |
| 4,459 |
|
|
| | | | | | |
| | Shares/
Principal Amount | Value |
| JPMorgan Mortgage Trust, Series 2006-A3, Class 7A1, VRN, 4.45%, 4/25/35 | $ | 8,298 |
| $ | 8,501 |
|
JPMorgan Mortgage Trust, Series 2013-1, Class 2A2 SEQ, VRN, 2.50%, 3/25/43(3) | 18,138 |
| 18,151 |
|
JPMorgan Mortgage Trust, Series 2017-1, Class A2, VRN, 3.50%, 1/25/47(3) | 151,087 |
| 154,343 |
|
JPMorgan Mortgage Trust, Series 2018-6, Class 1A4 SEQ, VRN, 3.50%, 12/25/48(3) | 88,801 |
| 89,487 |
|
| MASTR Adjustable Rate Mortgages Trust, Series 2004-13, Class 3A7, VRN, 4.70%, 11/21/34 | 53,818 |
| 55,331 |
|
| Merrill Lynch Mortgage Investors Trust, Series 2005-3, Class 2A, VRN, 3.93%, 11/25/35 | 42,701 |
| 43,233 |
|
| Merrill Lynch Mortgage Investors Trust, Series 2005-A2, Class A1, VRN, 4.36%, 2/25/35 | 21,710 |
| 22,049 |
|
New Residential Mortgage Loan Trust, Series 2017-1A, Class A1, VRN, 4.00%, 2/25/57(3) | 208,151 |
| 217,266 |
|
New Residential Mortgage Loan Trust, Series 2017-2A, Class A3, VRN, 4.00%, 3/25/57(3) | 133,100 |
| 139,642 |
|
New Residential Mortgage Loan Trust, Series 2017-5A, Class A1, VRN, 3.29%, (1-month LIBOR plus 1.50%), 6/25/57(3) | 72,050 |
| 73,146 |
|
Sequoia Mortgage Trust, Series 2017-7, Class A4 SEQ, VRN, 3.50%, 10/25/47(3) | 143,928 |
| 147,117 |
|
Sequoia Mortgage Trust, Series 2017-CH1, Class A1, VRN, 4.00%, 8/25/47(3) | 329,897 |
| 338,959 |
|
Sequoia Mortgage Trust, Series 2017-CH2, Class A10 SEQ, VRN, 4.00%, 12/25/47(3) | 122,790 |
| 123,788 |
|
Sequoia Mortgage Trust, Series 2018-CH2, Class A12 SEQ, VRN, 4.00%, 6/25/48(3) | 161,116 |
| 162,587 |
|
Sofi Mortgage Trust, Series 2016-1A, Class 1A4 SEQ, VRN, 3.00%, 11/25/46(3) | 38,741 |
| 38,582 |
|
| Structured Adjustable Rate Mortgage Loan Trust, Series 2004-8, Class 2A1, VRN, 4.16%, 7/25/34 | 33,615 |
| 34,170 |
|
| Thornburg Mortgage Securities Trust, Series 2004-3, Class A, VRN, 2.53%, (1-month LIBOR plus 0.74%), 9/25/34 | 39,696 |
| 39,335 |
|
| WaMu Mortgage Pass-Through Certificates, Series 2005-AR3, Class A1, VRN, 4.42%, 3/25/35 | 52,807 |
| 52,504 |
|
| Wells Fargo Mortgage-Backed Securities Trust, Series 2005-AR7, Class 1A1, VRN, 5.08%, 5/25/35 | 16,213 |
| 16,236 |
|
| Wells Fargo Mortgage-Backed Securities Trust, Series 2007-AR10, Class 1A1, VRN, 4.26%, 1/25/38 | 9,762 |
| 9,607 |
|
| | | 2,309,585 |
|
| U.S. Government Agency Collateralized Mortgage Obligations — 0.3% | |
| FHLMC, Series 2016-DNA4, Class M2, VRN, 3.09%, (1-month LIBOR plus 1.30%), 3/25/29 | 64,089 |
| 64,231 |
|
| FHLMC, Series 2018-DNA1, Class M1, VRN, 2.24%, (1-month LIBOR plus 0.45%), 7/25/30 | 75,648 |
| 75,593 |
|
FHLMC, Series 2019-DNA3, Class M2, VRN, 3.84%, (1-month LIBOR plus 2.05%), 7/25/49(3) | 250,000 |
| 251,400 |
|
| FNMA, Series 2014-C02, Class 1M2, VRN, 4.39%, (1-month LIBOR plus 2.60%), 5/25/24 | 78,229 |
| 81,520 |
|
| FNMA, Series 2014-C02, Class 2M2, VRN, 4.39%, (1-month LIBOR plus 2.60%), 5/25/24 | 85,216 |
| 88,375 |
|
| FNMA, Series 2016-C04, Class 1M1, VRN, 3.24%, (1-month LIBOR plus 1.45%), 1/25/29 | 199 |
| 199 |
|
| | | |
|
| | | | | | |
| | Shares/
Principal Amount | Value |
| FNMA, Series 2018-C01, Class 1M1, VRN, 2.39%, (1-month LIBOR plus 0.60%), 7/25/30 | $ | 231,512 |
| $ | 231,502 |
|
| | | 792,820 |
|
TOTAL COLLATERALIZED MORTGAGE OBLIGATIONS
(Cost $3,066,299) | | 3,102,405 |
|
| COLLATERALIZED LOAN OBLIGATIONS — 1.0% | | |
Anchorage Credit Opportunities CLO 1 Ltd., Series 2019-1A, Class A1, VRN, 1.95%, (3-month LIBOR plus 1.95%), 1/20/32(3)(4) | 200,000 |
| 200,000 |
|
Bean Creek CLO Ltd., Series 2015-1A, Class AR, VRN, 2.99%, (3-month LIBOR plus 1.02%), 4/20/31(3) | 200,000 |
| 197,523 |
|
CBAM Ltd., Series 2019-9A, Class A, VRN, 3.28%, (3-month LIBOR plus 1.28%), 2/12/30(3) | 200,000 |
| 200,069 |
|
CIFC Funding Ltd., Series 2013-3RA, Class A1, VRN, 2.92%, (3-month LIBOR plus 0.98%), 4/24/31(3) | 100,000 |
| 99,121 |
|
CIFC Funding Ltd., Series 2015-1A, Class ARR, VRN, 3.06%, (3-month LIBOR plus 1.11%), 1/22/31(3) | 74,000 |
| 73,801 |
|
Dryden 64 CLO Ltd., Series 2018-64A, Class A, VRN, 2.97%, (3-month LIBOR plus 0.97%), 4/18/31(3) | 150,000 |
| 148,688 |
|
Goldentree Loan Opportunities X Ltd., Series 2015-10A, Class AR, VRN, 3.09%, (3-month LIBOR plus 1.12%), 7/20/31(3) | 175,000 |
| 174,421 |
|
KKR CLO Ltd., Series 2022A, Class A, VRN, 3.12%, (3-month LIBOR plus 1.15%), 7/20/31(3) | 175,000 |
| 173,727 |
|
LCM XIV LP, Series 2014A, Class AR, VRN, 3.01%, (3-month LIBOR plus 1.04%), 7/20/31(3) | 100,000 |
| 99,323 |
|
Magnetite VIII Ltd., Series 2014-8A, Class AR2, VRN, 2.98%, (3-month LIBOR plus 0.98%), 4/15/31(3) | 225,000 |
| 223,689 |
|
Octagon Investment Partners 45 Ltd., Series 2019-1A, Class A, VRN, 3.16%, (3-month LIBOR plus 1.33%), 10/15/32(3) | 550,000 |
| 550,416 |
|
Sounds Point CLO IV-R Ltd., Series 2013-3RA, Class A, VRN, 3.15%, (3-month LIBOR plus 1.15%), 4/18/31(3) | 275,000 |
| 272,744 |
|
Treman Park CLO Ltd., Series 2015-1A, Class ARR, VRN, 3.04%, (3-month LIBOR plus 1.07%), 10/20/28(3) | 225,000 |
| 225,086 |
|
Voya CLO Ltd., Series 2013-2A, Class A1R, VRN, 2.91%, (3-month LIBOR plus 0.97%), 4/25/31(3) | 250,000 |
| 247,246 |
|
Voya CLO Ltd., Series 2013-3A, Class A1RR, VRN, 3.15%, (3-month LIBOR plus 1.15%), 10/18/31(3) | 100,000 |
| 99,757 |
|
TOTAL COLLATERALIZED LOAN OBLIGATIONS
(Cost $2,995,664) | | 2,985,611 |
|
| COMMERCIAL MORTGAGE-BACKED SECURITIES — 0.9% | | |
BB-UBS Trust, Series 2012-SHOW, Class A SEQ, 3.43%, 11/5/36(3) | 200,000 |
| 207,678 |
|
| Benchmark Mortgage Trust, Series 2018-B6, Class AS, 4.44%, 10/10/51 | 375,000 |
| 419,171 |
|
BX Trust, Series 2018-MCSF, Class A, VRN, 2.32%, (1-month LIBOR plus 0.58%), 4/15/35(3) | 200,000 |
| 199,031 |
|
| Commercial Mortgage Pass-Through Certificates, Series 2014-CR15, Class AM, VRN, 4.43%, 2/10/47 | 125,000 |
| 134,123 |
|
| Commercial Mortgage Pass-Through Certificates, Series 2014-LC17, Class AM, VRN, 4.19%, 10/10/47 | 125,000 |
| 133,206 |
|
| Commercial Mortgage Pass-Through Certificates, Series 2014-UBS5, Class AM, VRN, 4.19%, 9/10/47 | 125,000 |
| 132,005 |
|
| Commercial Mortgage Pass-Through Certificates, Series 2015-CR22, Class AM, VRN, 3.60%, 3/10/48 | 100,000 |
| 104,353 |
|
| Commercial Mortgage Trust, Series 2016-CD2, Class A4 SEQ, VRN, 3.53%, 11/10/49 | 150,000 |
| 159,739 |
|
Commercial Mortgage Trust, Series 2017-PANW, Class A SEQ, 3.24%, 10/10/29(3) | 375,000 |
| 386,611 |
|
|
| | | | | | |
| | Shares/
Principal Amount | Value |
Hudson Yards Mortgage Trust, Series 2016-10HY, Class A SEQ, 2.84%, 8/10/38(3) | $ | 250,000 |
| $ | 251,923 |
|
| JPMDB Commercial Mortgage Securities Trust, Series 2017-C5, Class A4 SEQ, 3.41%, 3/15/50 | 170,000 |
| 178,896 |
|
| JPMorgan Chase Commercial Mortgage Securities Trust, Series 2013-C16, Class A4 SEQ, 4.17%, 12/15/46 | 50,000 |
| 53,406 |
|
| JPMorgan Chase Commercial Mortgage Securities Trust, Series 2016-JP2, Class A4 SEQ, 2.82%, 8/15/49 | 100,000 |
| 101,967 |
|
Morgan Stanley Capital I Trust, Series 2014-CPT, Class C, VRN, 3.45%, 7/13/29(3) | 125,000 |
| 126,254 |
|
TOTAL COMMERCIAL MORTGAGE-BACKED SECURITIES
(Cost $2,514,209) | | 2,588,363 |
|
| MUNICIPAL SECURITIES — 0.5% | | |
| Bay Area Toll Authority Rev., 6.92%, 4/1/40 | 70,000 |
| 102,607 |
|
| Dallas Area Rapid Transit Rev., 6.00%, 12/1/44 | 25,000 |
| 35,671 |
|
| Foothill-Eastern Transportation Corridor Agency Rev., 4.09%, 1/15/49 | 85,000 |
| 85,000 |
|
| Houston GO, 3.96%, 3/1/47 | 25,000 |
| 27,683 |
|
| Los Angeles Community College District GO, 6.68%, 8/1/36 | 20,000 |
| 29,028 |
|
| Los Angeles Department of Airports Rev., 6.58%, 5/15/39 | 25,000 |
| 33,202 |
|
| Metropolitan Transportation Authority Rev., 6.81%, 11/15/40 | 15,000 |
| 21,325 |
|
| Metropolitan Water Reclamation District of Greater Chicago GO, 5.72%, 12/1/38 | 200,000 |
| 261,968 |
|
| Missouri Highway & Transportation Commission Rev., 5.45%, 5/1/33 | 20,000 |
| 24,476 |
|
| New Jersey Turnpike Authority Rev., 7.41%, 1/1/40 | 65,000 |
| 102,084 |
|
| New Jersey Turnpike Authority Rev., 7.10%, 1/1/41 | 85,000 |
| 129,784 |
|
| New York City Water & Sewer System Rev., 5.95%, 6/15/42 | 45,000 |
| 64,983 |
|
| Ohio Water Development Authority Water Pollution Control Loan Fund Rev., 4.88%, 12/1/34 | 30,000 |
| 35,037 |
|
| Port Authority of New York & New Jersey Rev., 4.93%, 10/1/51 | 40,000 |
| 51,908 |
|
| Port Authority of New York & New Jersey Rev., 4.46%, 10/1/62 | 45,000 |
| 55,263 |
|
| Rutgers The State University of New Jersey Rev., 5.67%, 5/1/40 | 45,000 |
| 58,747 |
|
| Sacramento Municipal Utility District Rev., 6.16%, 5/15/36 | 25,000 |
| 33,439 |
|
| Salt River Project Agricultural Improvement & Power District Rev., 4.84%, 1/1/41 | 25,000 |
| 31,140 |
|
| San Francisco Public Utilities Commission Water Rev., 6.95%, 11/1/50 | 20,000 |
| 30,448 |
|
| Santa Clara Valley Transportation Authority Rev., 5.88%, 4/1/32 | 30,000 |
| 36,715 |
|
| State of California GO, 4.60%, 4/1/38 | 120,000 |
| 133,051 |
|
| State of California GO, 7.55%, 4/1/39 | 20,000 |
| 32,119 |
|
| State of California GO, 7.30%, 10/1/39 | 15,000 |
| 22,931 |
|
| State of California GO, 7.60%, 11/1/40 | 20,000 |
| 33,056 |
|
| State of Illinois GO, 5.10%, 6/1/33 | 45,000 |
| 48,549 |
|
| State of Oregon Department of Transportation Rev., 5.83%, 11/15/34 | 20,000 |
| 26,677 |
|
TOTAL MUNICIPAL SECURITIES
(Cost $1,363,524) | | 1,546,891 |
|
| U.S. GOVERNMENT AGENCY SECURITIES — 0.1% | | |
| FNMA, 2.125%, 4/24/26 | 40,000 |
| 40,587 |
|
| FNMA, 6.625%, 11/15/30 | 100,000 |
| 142,463 |
|
TOTAL U.S. GOVERNMENT AGENCY SECURITIES
(Cost $163,002) | | 183,050 |
|
|
| | | | | | |
| | Shares/
Principal Amount | Value |
| SOVEREIGN GOVERNMENTS AND AGENCIES — 0.1% | | |
Colombia† | | |
| Colombia Government International Bond, 4.375%, 7/12/21 | $ | 30,000 |
| $ | 30,990 |
|
Peru† | | |
| Peruvian Government International Bond, 5.625%, 11/18/50 | 30,000 |
| 43,941 |
|
| Poland — 0.1% | | |
| Republic of Poland Government International Bond, 5.125%, 4/21/21 | 35,000 |
| 36,507 |
|
| Republic of Poland Government International Bond, 3.00%, 3/17/23 | 10,000 |
| 10,319 |
|
| | | 46,826 |
|
Uruguay† | | |
| Uruguay Government International Bond, 4.125%, 11/20/45 | 20,000 |
| 21,569 |
|
TOTAL SOVEREIGN GOVERNMENTS AND AGENCIES
(Cost $126,744) | | 143,326 |
|
BANK LOAN OBLIGATIONS(5)† | | |
Diversified Telecommunications Services† | | |
Zayo Group, LLC, 2017 Incremental Term Loan, 4.05%, (1-month LIBOR plus 2.25%), 1/19/24
(Cost $100,436) | 100,000 |
| 100,455 |
|
PREFERRED STOCKS† | | |
Capital Markets† | | |
Goldman Sachs Group, Inc. (The), 4.95%
(Cost $90,000) | 90,000 |
| 93,409 |
|
| TEMPORARY CASH INVESTMENTS — 3.9% | | |
State Street Institutional U.S. Government Money Market Fund, Premier Class
(Cost $11,182,958) | 11,182,958 |
| 11,182,958 |
|
TOTAL INVESTMENT SECURITIES — 101.8%
(Cost $251,518,954) | | 292,095,822 |
|
| OTHER ASSETS AND LIABILITIES — (1.8)% | | (5,163,799 | ) |
| TOTAL NET ASSETS — 100.0% | | $ | 286,932,023 |
|
|
| | | | | | | | | | | |
| FUTURES CONTRACTS PURCHASED |
| Reference Entity | Contracts | Expiration
Date | Notional
Amount | Underlying
Contract
Value | Unrealized
Appreciation
(Depreciation) |
| S&P 500 E-Mini | 44 | March 2020 | $ | 2,200 |
| $ | 7,108,420 |
| $ | 132,260 |
|
| U.S. Treasury 10-Year Notes | 2 | March 2020 | $ | 200,000 |
| 256,844 |
| (2,457 | ) |
| U.S. Treasury 2-Year Notes | 1 | March 2020 | $ | 200,000 |
| 215,500 |
| (143 | ) |
| U.S. Treasury 5-Year Notes | 1 | March 2020 | $ | 100,000 |
| 118,609 |
| (651 | ) |
| U.S. Treasury Long Bonds | 1 | March 2020 | $ | 100,000 |
| 155,906 |
| (3,502 | ) |
| | | | | $ | 7,855,279 |
| $ | 125,507 |
|
|
| | | | | | | | | | | | | | | |
| CENTRALLY CLEARED TOTAL RETURN SWAP AGREEMENTS |
| Floating Rate Index | Pay/Receive Floating Rate Index at Termination | Fixed Rate | Termination
Date | Notional
Amount | Premiums Paid (Received) | Unrealized
Appreciation
(Depreciation) | Value |
| CPURNSA | Receive | 1.78% | 8/5/24 | $ | 1,000,000 |
| $ | (467 | ) | $ | 4,034 |
| $ | 3,567 |
|
|
| | |
| NOTES TO SCHEDULE OF INVESTMENTS |
| CPURNSA | - | U.S. Consumer Price Index Urban Consumers Not Seasonally Adjusted Index |
| FHLMC | - | Federal Home Loan Mortgage Corporation |
| FNMA | - | Federal National Mortgage Association |
| GNMA | - | Government National Mortgage Association |
| GO | - | General Obligation |
| H15T1Y | - | Constant Maturity U.S. Treasury Note Yield Curve Rate Index |
| LIBOR | - | London Interbank Offered Rate |
| MTN | - | Medium Term Note |
| SEQ | - | Sequential Payer |
| TBA | - | To-Be-Announced. Security was purchased on a forward commitment basis with an approximate principal amount and maturity date. Actual principal amount and maturity date will be determined upon settlement. |
| UMBS | - | Uniform Mortgage-Backed Securities |
| VRN | - | Variable Rate Note. The rate adjusts periodically based upon the terms set forth in the security’s offering documents. The rate shown is effective at the period end and the reference rate and spread, if any, is indicated. |
| |
| † | Category is less than 0.05% of total net assets. |
| |
| (2) | Security, or a portion thereof, has been pledged at the custodian bank or with a broker for collateral requirements on forward commitments, futures contracts and/or swap agreements. At the period end, the aggregate value of securities pledged was $75,229. |
| |
| (3) | Security was purchased pursuant to Rule 144A under the Securities Act of 1933 and may be sold in transactions exempt from registration, normally to qualified institutional investors. The aggregate value of these securities at the period end was $15,632,530, which represented 5.4% of total net assets. |
| |
| (4) | When-issued security. The issue price and yield are fixed on the date of the commitment, but payment and delivery are scheduled for a future date. |
| |
| (5) | The interest rate on a bank loan obligation adjusts periodically based on a predetermined schedule. Rate shown is effective at period end. The maturity date on a bank loan obligation may be less than indicated as a result of contractual or optional prepayments. These prepayments cannot be predicted with certainty. |
See Notes to Financial Statements.
|
|
| Statement of Assets and Liabilities |
|
| | | |
| DECEMBER 31, 2019 | |
| Assets | |
| Investment securities, at value (cost of $251,518,954) | $ | 292,095,822 |
|
| Deposits with broker for futures contracts | 277,200 |
|
| Receivable for investments sold | 46,174 |
|
| Receivable for capital shares sold | 464,340 |
|
| Receivable for variation margin on futures contracts | 16,940 |
|
| Receivable for variation margin on swap agreements | 993 |
|
| Interest and dividends receivable | 680,664 |
|
| | 293,582,133 |
|
| | |
| Liabilities | |
| Payable for investments purchased | 6,318,492 |
|
| Payable for capital shares redeemed | 105,331 |
|
| Payable for variation margin on futures contracts | 539 |
|
| Accrued management fees | 202,748 |
|
| Distribution fees payable | 23,000 |
|
| | 6,650,110 |
|
| | |
| Net Assets | $ | 286,932,023 |
|
| | |
| Net Assets Consist of: | |
| Capital (par value and paid-in surplus) | $ | 236,813,742 |
|
| Distributable earnings | 50,118,281 |
|
| | $ | 286,932,023 |
|
|
| | | | | | |
| | Net Assets | Shares Outstanding | Net Asset Value Per Share |
| Class I, $0.01 Par Value |
| $177,510,162 |
| 21,695,674 |
| $8.18 |
| Class II, $0.01 Par Value |
| $109,421,861 |
| 13,370,875 |
| $8.18 |
See Notes to Financial Statements.
|
| | | |
| YEAR ENDED DECEMBER 31, 2019 | |
| Investment Income (Loss) | |
| Income: | |
| Interest | $ | 3,210,395 |
|
| Dividends | 2,565,140 |
|
| | 5,775,535 |
|
| | |
| Expenses: | |
| Management fees | 2,288,721 |
|
| Distribution fees - Class II | 234,662 |
|
| Directors' fees and expenses | 8,010 |
|
| Other expenses | 1,099 |
|
| | 2,532,492 |
|
Fees waived(1) | (282,937 | ) |
| | 2,249,555 |
|
| | |
| Net investment income (loss) | 3,525,980 |
|
| | |
| Realized and Unrealized Gain (Loss) | |
| Net realized gain (loss) on: | |
| Investment transactions | 9,063,889 |
|
| Futures contract transactions | 859,615 |
|
| Swap agreement transactions | 15,270 |
|
| | 9,938,774 |
|
| | |
| Change in net unrealized appreciation (depreciation) on: | |
| Investments | 30,945,992 |
|
| Futures contracts | 58,475 |
|
| Swap agreements | 2,085 |
|
| | 31,006,552 |
|
| | |
| Net realized and unrealized gain (loss) | 40,945,326 |
|
| | |
| Net Increase (Decrease) in Net Assets Resulting from Operations | $ | 44,471,306 |
|
| |
| (1) | Amount consists of $180,017 and $102,920 for Class I and Class II, respectively. |
See Notes to Financial Statements.
|
|
| Statement of Changes in Net Assets |
|
| | | | | | |
| YEARS ENDED DECEMBER 31, 2019 AND DECEMBER 31, 2018 |
| Increase (Decrease) in Net Assets | December 31, 2019 | December 31, 2018 |
| Operations | | |
| Net investment income (loss) | $ | 3,525,980 |
| $ | 3,000,971 |
|
| Net realized gain (loss) | 9,938,774 |
| 5,297,481 |
|
| Change in net unrealized appreciation (depreciation) | 31,006,552 |
| (17,053,585 | ) |
| Net increase (decrease) in net assets resulting from operations | 44,471,306 |
| (8,755,133 | ) |
| | | |
| Distributions to Shareholders | | |
| From earnings: | | |
| Class I | (5,998,157 | ) | (2,936,712 | ) |
| Class II | (3,150,744 | ) | (1,144,936 | ) |
| Decrease in net assets from distributions | (9,148,901 | ) | (4,081,648 | ) |
| | | |
| Capital Share Transactions | | |
| Net increase (decrease) in net assets from capital share transactions (Note 5) | 34,086,553 |
| 39,003,554 |
|
| | | |
| Net increase (decrease) in net assets | 69,408,958 |
| 26,166,773 |
|
| | | |
| Net Assets | | |
| Beginning of period | 217,523,065 |
| 191,356,292 |
|
| End of period | $ | 286,932,023 |
| $ | 217,523,065 |
|
See Notes to Financial Statements.
|
|
| Notes to Financial Statements |
DECEMBER 31, 2019
1. Organization
American Century Variable Portfolios, Inc. (the corporation) is registered under the Investment Company Act of 1940, as amended (the 1940 Act), as an open-end management investment company and is organized as a Maryland corporation. VP Balanced Fund (the fund) is one fund in a series issued by the corporation. The fund’s investment objective is to seek long-term capital growth and current income by investing approximately 60% of its assets in equity securities and the remainder in bonds and other fixed-income securities. The fund offers Class I and Class II.
2. Significant Accounting Policies
The following is a summary of significant accounting policies consistently followed by the fund in preparation of its financial statements. The fund is an investment company and follows accounting and reporting guidance in accordance with accounting principles generally accepted in the United States of America. This may require management to make certain estimates and assumptions at the date of the financial statements. Actual results could differ from these estimates. Management evaluated the impact of events or transactions occurring through the date the financial statements were issued that would merit recognition or disclosure.
Investment Valuations — The fund determines the fair value of its investments and computes its net asset value per share at the close of regular trading (usually 4 p.m. Eastern time) on the New York Stock Exchange (NYSE) on each day the NYSE is open. The Board of Directors has adopted valuation policies and procedures to guide the investment advisor in the fund’s investment valuation process and to provide methodologies for the oversight of the fund’s pricing function.
Equity securities that are listed or traded on a domestic securities exchange are valued at the last reported sales price or at the official closing price as provided by the exchange. Equity securities traded on foreign securities exchanges are generally valued at the closing price of such securities on the exchange where primarily traded or at the close of the NYSE, if that is earlier. If no last sales price is reported, or if local convention or regulation so provides, the mean of the latest bid and asked prices may be used. Securities traded over-the-counter are valued at the mean of the latest bid and asked prices, the last sales price, or the official closing price.
Fixed income securities are valued at the evaluated mean as provided by independent pricing services or at the mean of the most recent bid and asked prices as provided by investment dealers. Corporate bonds, U.S. Treasury and Government Agency securities, convertible bonds, bank loan obligations, municipal securities, and sovereign governments and agencies are valued using market models that consider trade data, quotations from dealers and active market makers, relevant yield curve and spread data, creditworthiness, trade data or market information on comparable securities, and other relevant security specific information. Mortgage-related and asset-backed securities are valued based on models that consider trade data, prepayment and default projections, benchmark yield and spread data and estimated cash flows of each tranche of the issuer. Collateralized loan obligations are valued based on discounted cash flow models that consider trade and economic data, prepayment assumptions and default projections.
Hybrid securities are valued at the evaluated mean as provided by independent pricing services or at the mean of the most recent bid and asked prices as provided by investment dealers. Preferred stocks and convertible preferred stocks with perpetual maturities are valued using market models that consider trade data, quotations from dealers and active market makers, relevant yield curve and spread data, creditworthiness, trade data or market information on comparable securities, and other relevant security specific information.
Open-end management investment companies are valued at the reported net asset value per share. Exchange-traded futures contracts are valued at the settlement price as provided by the appropriate exchange. Swap agreements are valued at an evaluated mean as provided by independent pricing services or independent brokers.
If the fund determines that the market price for an investment is not readily available or the valuation methods mentioned above do not reflect an investment’s fair value, such investment is valued as determined in good faith by the Board of Directors or its delegate, in accordance with policies and procedures adopted by the Board of Directors. In its determination of fair value, the fund may review several factors including, but not limited to, market information regarding the specific investment or comparable investments and correlation with other investment types, futures indices or general market indicators. Circumstances that may cause the fund to use these procedures to value an investment include, but are not limited to: an investment has been declared in default or is distressed; trading in a security has been suspended during the trading day or a security is not actively trading on its principal exchange; prices received from a regular pricing source are deemed unreliable; or there is a foreign market holiday and no trading occurred.
The fund monitors for significant events occurring after the close of an investment’s primary exchange but before the fund’s net asset value per share is determined. Significant events may include, but are not limited to: corporate announcements and transactions; governmental action and political unrest that could impact a specific investment or an investment sector; or armed conflicts, natural disasters and similar events that could affect investments in a specific country or region. The fund also monitors for significant fluctuations between domestic and foreign markets, as evidenced by the U.S. market or such other indicators that the Board of Directors, or its delegate, deems appropriate. The fund may apply a model-derived factor to the closing price of equity securities traded on foreign securities exchanges. The factor is based on observable market data as provided by an independent pricing service.
Security Transactions — Security transactions are accounted for as of the trade date. Net realized gains and losses are determined on the identified cost basis, which is also used for federal income tax purposes.
Investment Income — Interest income is recorded on the accrual basis and includes paydown gain (loss) and accretion of discounts and amortization of premiums. Inflation adjustments related to inflation-linked debt securities are reflected as interest income. Dividend income less foreign taxes withheld, if any, is recorded as of the ex-dividend date. Distributions received on securities that represent a return of capital or long-term capital gain are recorded as a reduction of cost of investments and/or as a realized gain. The fund may estimate the components of distributions received that may be considered nontaxable distributions or long-term capital gain distributions for income tax purposes.
Forward Commitments — The fund may engage in securities transactions on a forward commitment basis. In these transactions, the securities’ prices and yields are fixed on the date of the commitment. The fund may sell a to-be-announced (TBA) security and at the same time make a commitment to purchase the same security at a future date at a specified price. Conversely, the fund may purchase a TBA security and at the same time make a commitment to sell the same security at a future date at a specified price. These types of transactions are known as “TBA roll” transactions and are accounted for as purchases and sales. The fund will segregate cash, cash equivalents or other appropriate liquid securities on its records in amounts sufficient to meet the purchase price.
Income Tax Status — It is the fund’s policy to distribute substantially all net investment income and net realized gains to shareholders and to otherwise qualify as a regulated investment company under provisions of the Internal Revenue Code. Accordingly, no provision has been made for income taxes. The fund files U.S. federal, state, local and non-U.S. tax returns as applicable. The fund's tax returns are subject to examination by the relevant taxing authority until expiration of the applicable statute of limitations, which is generally three years from the date of filing but can be longer in certain jurisdictions. At this time, management believes there are no uncertain tax positions which, based on their technical merit, would not be sustained upon examination and for which it is reasonably possible that the total amounts of unrecognized tax benefits will significantly change in the next twelve months.
Multiple Class — All shares of the fund represent an equal pro rata interest in the net assets of the class to which such shares belong, and have identical voting, dividend, liquidation and other rights and the same terms and conditions, except for class specific expenses and exclusive rights to vote on matters affecting only individual classes. Income, non-class specific expenses, and realized and unrealized capital gains and losses of the fund are allocated to each class of shares based on their relative net assets.
Segregated Assets — In accordance with the 1940 Act, the fund segregates assets on its books and records to cover certain types of investment securities and other financial instruments. American Century Investment Management, Inc. (ACIM) (the investment advisor) monitors, on a daily basis, the securities segregated to ensure the fund designates a sufficient amount of liquid assets, marked-to-market daily. The fund may also receive assets or be required to pledge assets at the custodian bank or with a broker for collateral requirements.
Distributions to Shareholders — Distributions from net investment income, if any, are generally declared and paid quarterly. Distributions from net realized gains, if any, are generally declared and paid annually.
Indemnifications — Under the corporation’s organizational documents, its officers and directors are indemnified against certain liabilities arising out of the performance of their duties to the fund. In addition, in the normal course of business, the fund enters into contracts that provide general indemnifications. The maximum exposure under these arrangements is unknown as this would involve future claims that may be made against a fund. The risk of material loss from such claims is considered by management to be remote.
3. Fees and Transactions with Related Parties
Certain officers and directors of the corporation are also officers and/or directors of American Century Companies, Inc. (ACC). The corporation’s investment advisor, ACIM, the corporation's distributor, American Century Investment Services, Inc. (ACIS), and the corporation’s transfer agent, American Century Services, LLC, are wholly owned, directly or indirectly, by ACC.
Management Fees — The corporation has entered into a management agreement with ACIM, under which ACIM provides the fund with investment advisory and management services in exchange for a single, unified management fee (the fee) per class. The agreement provides that all expenses of managing and operating the fund, except distribution fees, brokerage expenses, taxes, interest, fees and expenses of the independent directors (including legal counsel fees), and extraordinary expenses, will be paid by ACIM. The fee is computed and accrued daily based on each class's daily net assets and paid monthly in arrears. The rate of the fee is determined by applying a fee rate calculation formula. This formula takes into account the fund's assets as well as certain assets, if any, of other clients of the investment advisor outside the American Century Investments family of funds (such as subadvised funds and separate accounts) that use very similar investment teams and strategies (strategy assets). The management fee schedule ranges from 0.80% to 0.90% for each class. From January 1, 2019 through July 31, 2019, the investment advisor agreed to waive 0.16% of the fund’s management fee. Effective August 1, 2019, the investment advisor agreed to waive 0.05% of the fund's management fee. The investment advisor expects this waiver to continue until July 31, 2020 and cannot terminate it prior to such date without the approval of the Board of Directors. The effective annual management fee for each class for the period ended December 31, 2019 was 0.90% before waiver and 0.79% after waiver.
Distribution Fees — The Board of Directors has adopted the Master Distribution Plan (the plan) for Class II, pursuant to Rule 12b-1 of the 1940 Act. The plan provides that Class II will pay ACIS an annual distribution fee equal to 0.25%. The fee is computed and accrued daily based on the Class II daily net assets and paid monthly in arrears. The distribution fee provides compensation for expenses incurred in connection with distributing shares of Class II including, but not limited to, payments to brokers, dealers, and financial institutions that have entered into sales agreements with respect to shares of the fund. Fees incurred under the plan during the period ended December 31, 2019 are detailed in the Statement of Operations.
Directors' Fees and Expenses — The Board of Directors is responsible for overseeing the investment advisor’s management and operations of the fund. The directors receive detailed information about the fund and its investment advisor regularly throughout the year, and meet at least quarterly with management of the investment advisor to review reports about fund operations. The fund’s officers do not receive compensation from the fund.
Interfund Transactions — The fund may enter into security transactions with other American Century Investments funds and other client accounts of the investment advisor, in accordance with the 1940 Act rules and procedures adopted by the Board of Directors. The rules and procedures require, among other things, that these transactions be effected at the independent current market price of the security. During the period, the interfund purchases and sales were $12,336,586 and $2,607,114, respectively. The effect of interfund transactions on the Statement of Operations was $1,675 in net realized gain (loss) on investment transactions.
4. Investment Transactions
Purchases of investment securities, excluding short-term investments, for the period ended December 31, 2019 totaled $311,723,210, of which $130,799,199 represented U.S. Treasury and Government Agency obligations.
Sales of investment securities, excluding short-term investments, for the period ended December 31, 2019 totaled $287,909,426, of which $105,195,679 represented U.S. Treasury and Government Agency obligations.
5. Capital Share Transactions
Transactions in shares of the fund were as follows:
|
| | | | | | | | | | |
| | Year ended December 31, 2019 | Year ended
December 31, 2018 |
| | Shares | Amount | Shares | Amount |
| Class I/Shares Authorized | 150,000,000 |
| | 150,000,000 |
| |
| Sold | 3,635,122 |
| $ | 28,304,175 |
| 4,009,055 |
| $ | 29,736,681 |
|
| Issued in reinvestment of distributions | 786,269 |
| 5,998,157 |
| 395,917 |
| 2,936,712 |
|
| Redeemed | (2,827,853 | ) | (21,907,528 | ) | (2,490,692 | ) | (18,912,568 | ) |
| | 1,593,538 |
| 12,394,804 |
| 1,914,280 |
| 13,760,825 |
|
| Class II/Shares Authorized | 75,000,000 |
| | 75,000,000 |
| |
| Sold | 3,905,124 |
| 30,133,600 |
| 4,509,288 |
| 34,154,599 |
|
| Issued in reinvestment of distributions | 413,460 |
| 3,150,744 |
| 154,377 |
| 1,144,936 |
|
| Redeemed | (1,508,223 | ) | (11,592,595 | ) | (1,319,387 | ) | (10,056,806 | ) |
| | 2,810,361 |
| 21,691,749 |
| 3,344,278 |
| 25,242,729 |
|
| Net increase (decrease) | 4,403,899 |
| $ | 34,086,553 |
| 5,258,558 |
| $ | 39,003,554 |
|
6. Fair Value Measurements
The fund’s investments valuation process is based on several considerations and may use multiple inputs to determine the fair value of the investments held by the fund. In conformity with accounting principles generally accepted in the United States of America, the inputs used to determine a valuation are classified into three broad levels.
| |
| • | Level 1 valuation inputs consist of unadjusted quoted prices in an active market for identical investments. |
| |
| • | Level 2 valuation inputs consist of direct or indirect observable market data (including quoted prices for comparable investments, evaluations of subsequent market events, interest rates, prepayment speeds, credit risk, etc.). These inputs also consist of quoted prices for identical investments initially expressed in local currencies that are adjusted through translation into U.S. dollars. |
| |
| • | Level 3 valuation inputs consist of unobservable data (including a fund’s own assumptions). |
The level classification is based on the lowest level input that is significant to the fair valuation measurement. The valuation inputs are not necessarily an indication of the risks associated with investing in these securities or other financial instruments.
The following is a summary of the level classifications as of period end. The Schedule of Investments provides additional information on the fund’s portfolio holdings.
|
| | | | | | | | |
| | Level 1 | Level 2 | Level 3 |
| Assets | | | |
| Investment Securities | | | |
| Common Stocks | $ | 163,987,727 |
| — |
| — |
|
| U.S. Treasury Securities | — |
| $ | 44,456,285 |
| — |
|
| Corporate Bonds | — |
| 28,766,785 |
| — |
|
| U.S. Government Agency Mortgage-Backed Securities | — |
| 26,225,615 |
| — |
|
| Asset-Backed Securities | — |
| 6,732,942 |
| — |
|
| Collateralized Mortgage Obligations | — |
| 3,102,405 |
| — |
|
| Collateralized Loan Obligations | — |
| 2,985,611 |
| — |
|
| Commercial Mortgage-Backed Securities | — |
| 2,588,363 |
| — |
|
| Municipal Securities | — |
| 1,546,891 |
| — |
|
| U.S. Government Agency Securities | — |
| 183,050 |
| — |
|
| Sovereign Governments and Agencies | — |
| 143,326 |
| — |
|
| Bank Loan Obligations | — |
| 100,455 |
| — |
|
| Preferred Stocks | — |
| 93,409 |
| — |
|
| Temporary Cash Investments | 11,182,958 |
| — |
| — |
|
| | $ | 175,170,685 |
| $ | 116,925,137 |
| — |
|
| Other Financial Instruments | | | |
| Futures Contracts | $ | 132,260 |
| — |
| — |
|
| Swap Agreements | — |
| $ | 3,567 |
| — |
|
| | $ | 132,260 |
| $ | 3,567 |
| — |
|
| | | | |
| Liabilities | | | |
| Other Financial Instruments | | | |
| Futures Contracts | $ | 6,753 |
| — |
| — |
|
7. Derivative Instruments
Credit Risk — The fund is subject to credit risk in the normal course of pursuing its investment objectives. The value of a bond generally declines as the credit quality of its issuer declines. Credit default swap agreements enable a fund to buy/sell protection against a credit event of a specific issuer or index. A fund may attempt to enhance returns by selling protection or attempt to mitigate credit risk by buying protection. The buyer/seller of credit protection against a security or basket of securities may pay/receive an up-front or periodic payment to compensate for/against potential default events. Changes in value, including the periodic amounts of interest to be paid or received on swap agreements, are recorded as unrealized appreciation (depreciation) on swap agreements. Upon entering into a centrally cleared swap, a fund is required to deposit cash or securities (initial margin) with a financial intermediary in an amount equal to a certain percentage of the notional amount. Subsequent payments (variation margin) are made or received daily, in cash, by a fund. The variation margin is equal to the daily change in the value and is a component of unrealized gains and losses. Realized gain or loss is recorded upon receipt or payment of a periodic settlement or termination of swap agreements. Net realized and unrealized gains or losses occurring during the holding period of swap agreements are a component of net realized gain (loss) on swap agreement transactions and change in net unrealized appreciation (depreciation) on swap agreements, respectively. The risks of entering into swap agreements include the possible lack of liquidity, failure of the counterparty to meet its obligations, and that there may be unfavorable changes in the underlying investments or instruments. The fund's average notional amount held during the period was $2,200,000.
Equity Price Risk — The fund is subject to equity price risk in the normal course of pursuing its investment objectives. A fund may enter into futures contracts based on an equity index in order to manage its exposure to changes in market conditions. A fund may purchase futures contracts to gain exposure to increases in market value or sell futures contracts to protect against a decline in market value. Upon entering into a futures contract, a fund is required to deposit either cash or securities in an amount equal to a certain percentage of the contract value (initial margin). Subsequent payments (variation margin) are made or received daily, in cash, by a fund. The variation margin is equal to the daily change in the contract value and is recorded as unrealized gains and losses. A fund recognizes a realized gain or loss when the contract is closed or expires. Net realized and unrealized gains or losses occurring during the holding period of futures contracts are a component of net realized gain (loss) on futures contract transactions and change in net unrealized appreciation (depreciation) on futures contracts, respectively. One of the risks of entering into futures contracts is the possibility that the change in value of the contract may not correlate with the changes in value of the underlying securities. The fund's average notional exposure to equity price risk derivative instruments held during the period was $1,469 futures contracts purchased.
Interest Rate Risk — The fund is subject to interest rate risk in the normal course of pursuing its investment objectives. The value of bonds generally declines as interest rates rise. A fund may enter into futures contracts based on a bond index or a specific underlying security. A fund may purchase futures contracts to gain exposure to increases in market value or sell futures contracts to protect against a decline in market value. Upon entering into a futures contract, a fund will segregate cash, cash equivalents or other appropriate liquid securities on its records in amounts sufficient to meet requirements. Subsequent payments (variation margin) are made or received daily, in cash, by a fund. The variation margin is equal to the daily change in the contract value and is recorded as unrealized gains and losses. A fund recognizes a realized gain or loss when the futures contract is closed or expires. Net realized and unrealized gains or losses occurring during the holding period of futures contracts are a component of net realized gain (loss) on futures contract transactions and change in net unrealized appreciation (depreciation) on futures contracts, respectively. One of the risks of entering into futures contracts is the possibility that the change in value of the contract may not correlate with the changes in value of the underlying securities. The fund's average notional exposure to interest rate risk derivative instruments held during the period was $9,391,667 futures contracts purchased and $1,100,000 futures contracts sold.
Other Contracts — A fund may enter into total return swap agreements in order to attempt to obtain or preserve a particular return or spread at a lower cost than obtaining a return or spread through purchases and/or sales of instruments in other markets or gain exposure to certain markets in the most economical way possible. A fund will segregate cash, cash equivalents or other appropriate liquid securities on its records in amounts sufficient to meet requirements. Changes in value, including the periodic amounts of interest to be paid or received on swap agreements, are recorded as unrealized appreciation (depreciation) on swap agreements. Upon entering into a centrally cleared swap, a fund is required to deposit cash or securities (initial margin) with a financial intermediary in an amount equal to a certain percentage of the notional amount. Subsequent payments (variation margin) are made or received daily, in cash, by a fund. The variation margin is equal to the daily change in the value and is a component of unrealized gains and losses. Realized gain or loss is recorded upon receipt or payment of a periodic settlement or termination of swap agreements. Net realized and unrealized gains or losses occurring during the holding period of swap agreements are a component of net realized gain (loss) on swap agreement transactions and change in net unrealized appreciation (depreciation) on swap agreements, respectively. The risks of entering into swap agreements include the possible lack of liquidity, failure of the counterparty to meet its obligations, and that there may be unfavorable changes in the underlying investments or instruments, including inflationary risk. The fund's average notional amount held during the period was $1,000,000.
Value of Derivative Instruments as of December 31, 2019
|
| | | | | | | | |
| | Asset Derivatives | | Liability Derivatives |
| Type of Risk Exposure | Location on Statement of Assets and Liabilities | Value | Location on Statement of Assets and Liabilities | Value |
| Equity Price Risk | Receivable for variation margin on futures contracts* | $ | 16,940 |
| Payable for variation margin on futures contracts* | — |
|
| Interest Rate Risk | Receivable for variation margin on futures contracts* | — |
| Payable for variation margin on futures contracts* | $ | 539 |
|
| Other Contracts | Receivable for variation margin on swap agreements* | 993 |
| Payable for variation margin on swap agreements* | — |
|
| | | $ | 17,933 |
| | $ | 539 |
|
| |
| * | Included in the unrealized appreciation (depreciation) on futures contracts or centrally cleared swap agreements, as applicable, as reported in the Schedule of Investments. |
Effect of Derivative Instruments on the Statement of Operations for the Year Ended December 31, 2019
|
| | | | | | | | |
| | Net Realized Gain (Loss) | Change in Net Unrealized Appreciation (Depreciation) |
| Type of Risk Exposure | Location on Statement of Operations | Value | Location on Statement of Operations | Value |
| Credit Risk | Net realized gain (loss) on swap agreement transactions | $ | 15,270 |
| Change in net unrealized appreciation (depreciation) on swap agreements | $ | (1,949 | ) |
| Equity Price Risk | Net realized gain (loss) on futures contract transactions | 492,783 |
| Change in net unrealized appreciation (depreciation) on futures contracts | 132,260 |
|
| Interest Rate Risk | Net realized gain (loss) on futures contract transactions | 366,832 |
| Change in net unrealized appreciation (depreciation) on futures contracts | (73,785 | ) |
| Other Contracts | Net realized gain (loss) on swap agreement transactions | — |
| Change in net unrealized appreciation (depreciation) on swap agreements | 4,034 |
|
| | | $ | 874,885 |
| | $ | 60,560 |
|
8. Risk Factors
The fund’s investment process may result in high portfolio turnover, which could mean high transaction costs, affecting both performance and capital gains tax liabilities to investors.
9. Federal Tax Information
The tax character of distributions paid during the years ended December 31, 2019 and December 31, 2018 were as follows:
|
| | | | | | |
| | 2019 | 2018 |
| Distributions Paid From | | |
| Ordinary income | $ | 4,051,460 |
| $ | 3,392,733 |
|
| Long-term capital gains | $ | 5,097,441 |
| $ | 688,915 |
|
The book-basis character of distributions made during the year from net investment income or net realized gains may differ from their ultimate characterization for federal income tax purposes. These differences reflect the differing character of certain income items and net realized gains and losses for financial statement and tax purposes, and may result in reclassification among certain capital accounts on the financial statements.
As of period end, the federal tax cost of investments and the components of distributable earnings on a tax-basis were as follows:
|
| | | |
| Federal tax cost of investments | $ | 251,974,585 |
|
| Gross tax appreciation of investments | $ | 40,987,735 |
|
| Gross tax depreciation of investments | (866,498 | ) |
| Net tax appreciation (depreciation) of investments | 40,121,237 |
|
| Net tax appreciation (depreciation) on derivatives | 4,034 |
|
| Net tax appreciation (depreciation) | $ | 40,125,271 |
|
| Other book-to-tax adjustments | $ | (22,150 | ) |
| Undistributed ordinary income | $ | 2,922,558 |
|
Accumulated long-term gains
| $ | 7,092,602 |
|
The difference between book-basis and tax-basis unrealized appreciation (depreciation) is attributable primarily to the tax deferral of losses on wash sales. Other book-to-tax adjustments are attributable primarily to the tax deferral of losses on straddle positions.
10. Recently Issued Accounting Standards
In March 2017, the Financial Accounting Standards Board (FASB) issued Accounting Standards Update No. 2017-08, “Receivables - Nonrefundable Fees and Other Costs (Subtopic 310-20), Premium Amortization on Purchased Callable Debt Securities” (ASU 2017-08). ASU 2017-08 amends the amortization period for certain purchased callable debt securities held at a premium, shortening such period to the earliest call date. The amendments are effective for fiscal years, and interim periods within those fiscal years, beginning after December 15, 2018. The adoption of ASU 2017-08 did not materially impact the financial statements.
|
| | | | | | | | | | | | | | | | | |
| For a Share Outstanding Throughout the Years Ended December 31 (except as noted) |
| Per-Share Data | | | | | | Ratios and Supplemental Data | |
| | | Income From Investment Operations: | Distributions From: | | | Ratio to Average Net Assets of: | | |
| | Net Asset
Value,
Beginning
of Period | Net
Investment
Income
(Loss)(1) | Net
Realized
and
Unrealized
Gain (Loss) | Total From
Investment
Operations | Net
Investment
Income | Net
Realized
Gains | Total
Distributions | Net Asset
Value,
End
of Period | Total
Return(2) | Operating
Expenses | Operating
Expenses
(before
expense
waiver) | Net
Investment
Income
(Loss) | Net
Investment
Income (Loss) (before expense waiver) | Portfolio
Turnover
Rate | Net
Assets,
End of
Period (in thousands) |
| Class I | | | | | | | | | | | | | | |
| 2019 | $7.09 | 0.11 | 1.27 | 1.38 | (0.12) | (0.17) | (0.29) | $8.18 | 19.85% | 0.79% | 0.90% | 1.48% | 1.37% | 115% |
| $177,510 |
|
| 2018 | $7.53 | 0.12 | (0.40) | (0.28) | (0.11) | (0.05) | (0.16) | $7.09 | (3.83)% | 0.76% | 0.90% | 1.55% | 1.41% | 120% |
| $142,595 |
|
| 2017 | $6.97 | 0.11 | 0.84 | 0.95 | (0.11) | (0.28) | (0.39) | $7.53 | 13.91% | 0.80% | 0.91% | 1.52% | 1.41% | 114% |
| $136,993 |
|
| 2016 | $6.93 | 0.10 | 0.36 | 0.46 | (0.11) | (0.31) | (0.42) | $6.97 | 6.99% | 0.82% | 0.90% | 1.53% | 1.45% | 101% |
| $119,724 |
|
| 2015 | $7.97 | 0.12 | (0.29) | (0.17) | (0.13) | (0.74) | (0.87) | $6.93 | (2.57)% | 0.81% | 0.90% | 1.58% | 1.49% | 95% |
| $116,703 |
|
| Class II | | | | | | | | | | | | | | |
| 2019 | $7.10 | 0.09 | 1.26 | 1.35 | (0.10) | (0.17) | (0.27) | $8.18 | 19.39% | 1.04% | 1.15% | 1.23% | 1.12% | 115% |
| $109,422 |
|
| 2018 | $7.53 | 0.10 | (0.39) | (0.29) | (0.09) | (0.05) | (0.14) | $7.10 | (3.93)% | 1.01% | 1.15% | 1.30% | 1.16% | 120% |
| $74,928 |
|
| 2017 | $6.97 | 0.09 | 0.85 | 0.94 | (0.10) | (0.28) | (0.38) | $7.53 | 13.63% | 1.05% | 1.16% | 1.27% | 1.16% | 114% |
| $54,363 |
|
2016(3) | $6.72 | 0.05 | 0.26 | 0.31 | (0.06) | — | (0.06) | $6.97 | 4.67% | 1.06%(4) | 1.15%(4) | 1.13%(4) | 1.04%(4) | 101%(5) |
| $19,677 |
|
|
| | | | |
| Notes to Financial Highlights | | |
| |
| (1) | Computed using average shares outstanding throughout the period. |
| |
| (2) | Total returns are calculated based on the net asset value of the last business day. Total returns for periods less than one year are not annualized. The total returns presented do not include the fees and charges assessed with investments in variable insurance products, those charges are disclosed in the separate account prospectus. The inclusion of such fees and charges would lower total return. |
| |
| (3) | May 2, 2016 (commencement of sale) through December 31, 2016. |
| |
| (5) | Portfolio turnover is calculated at the fund level. Percentage indicated was calculated for the year ended December 31, 2016. |
See Notes to Financial Statements.
|
|
| Report of Independent Registered Public Accounting Firm |
To the Shareholders and the Board of Directors of American Century Variable Portfolios, Inc.:
Opinion on the Financial Statements and Financial Highlights
We have audited the accompanying statement of assets and liabilities, including the schedule of investments, of VP Balanced Fund, one of the funds constituting the American Century Variable Portfolios, Inc. (the "Fund"), as of December 31, 2019, the related statement of operations for the year then ended, the statements of changes in net assets for each of the two years in the period then ended, the financial highlights for each of the five years in the period then ended, and the related notes. In our opinion, the financial statements and financial highlights present fairly, in all material respects, the financial position of VP Balanced Fund of the American Century Variable Portfolios, Inc. as of December 31, 2019, the results of its operations for the year then ended, the changes in its net assets for each of the two years in the period then ended, and the financial highlights for each of the five years in the period then ended, in conformity with accounting principles generally accepted in the United States of America.
Basis for Opinion
These financial statements and financial highlights are the responsibility of the Fund's management. Our responsibility is to express an opinion on the Fund’s financial statements and financial highlights based on our audits. We are a public accounting firm registered with the Public Company Accounting Oversight Board (United States) (PCAOB) and are required to be independent with respect to the Fund in accordance with the U.S. federal securities laws and the applicable rules and regulations of the Securities and Exchange Commission and the PCAOB.
We conducted our audits in accordance with the standards of the PCAOB. Those standards require that we plan and perform the audit to obtain reasonable assurance about whether the financial statements and financial highlights are free of material misstatement, whether due to error or fraud. The Fund is not required to have, nor were we engaged to perform, an audit of its internal control over financial reporting. As part of our audits we are required to obtain an understanding of internal control over financial reporting but not for the purpose of expressing an opinion on the effectiveness of the Fund’s internal control over financial reporting. Accordingly, we express no such opinion.
Our audits included performing procedures to assess the risks of material misstatement of the financial statements and financial highlights, whether due to error or fraud, and performing procedures that respond to those risks. Such procedures included examining, on a test basis, evidence regarding the amounts and disclosures in the financial statements and financial highlights. Our audits also included evaluating the accounting principles used and significant estimates made by management, as well as evaluating the overall presentation of the financial statements and financial highlights. Our procedures included confirmation of securities owned as of December 31, 2019, by correspondence with the custodian, brokers and agent banks; when replies were not received from brokers, we performed other auditing procedures. We believe that our audits provide a reasonable basis for our opinion.
DELOITTE & TOUCHE LLP
Kansas City, Missouri
February 13, 2020
We have served as the auditor of one or more American Century investment companies since 1997.
The Board of Directors
The individuals listed below serve as directors of the funds. Each director will continue to serve in this capacity until death, retirement, resignation or removal from office. The board has adopted a mandatory retirement age for directors who are not “interested persons,” as that term is defined in the Investment Company Act (independent directors). Independent directors shall retire by December 31 of the year in which they reach their 75th birthday.
Mr. Thomas is an “interested person” because he currently serves as President and Chief Executive Officer of American Century Companies, Inc. (ACC), the parent company of American Century Investment Management, Inc. (ACIM or the advisor). The other directors (more than three-fourths of the total number) are independent. They are not employees, directors or officers of, and have no financial interest in, ACC or any of its wholly owned, direct or indirect, subsidiaries, including ACIM, American Century Investment Services, Inc. (ACIS) and American Century Services, LLC (ACS), and they do not have any other affiliations, positions or relationships that would cause them to be considered “interested persons” under the Investment Company Act. The directors serve in this capacity for seven (in the case of Jonathan S. Thomas, 16; and Stephen E. Yates, 8) registered investment companies in the American Century Investments family of funds.
The following table presents additional information about the directors. The mailing address for each director is 4500 Main Street, Kansas City, Missouri 64111.
|
| | | | | |
Name
(Year of Birth) | Position(s) Held with Funds | Length of Time Served | Principal Occupation(s) During Past 5 Years | Number of American Century Portfolios Overseen by Director | Other Directorships Held During Past 5 Years |
| Independent Directors |
|
|
| Thomas W. Bunn (1953) | Director | Since 2017 | Retired | 64 | SquareTwo Financial; Barings (formerly Babson Capital Funds Trust) (2013 to 2016) |
Chris H. Cheesman
(1962)
| Director | Since 2019
| Retired. Senior Vice President & Chief Audit Executive, AllianceBernstein (1999 to 2018)
| 64 | None |
Barry Fink
(1955) | Director | Since 2012 (independent since 2016) | Retired | 64 | None |
Rajesh K. Gupta
(1960)
| Director | Since 2019
| Partner Emeritus, SeaCrest Investment Management and SeaCrest Wealth Management (2019 to Present); Chief Executive Officer and Chief Investment Officer, SeaCrest Investment Management (2006 to 2019); Chief Executive Officer and Chief Investment Officer, SeaCrest Wealth Management (2008 to 2019)
| 64 | None |
|
| | | | | |
Name
(Year of Birth) | Position(s) Held with Funds | Length of Time Served | Principal Occupation(s) During Past 5 Years | Number of American Century Portfolios Overseen by Director | Other Directorships Held During Past 5 Years |
| Independent Directors |
|
|
Lynn Jenkins
(1963)
| Director | Since 2019
| Consultant, LJ Strategies (2019 to present); United States Representative, U.S. House of Representatives (2009 to 2018) | 64 | MGP Ingredients, Inc. |
Jan M. Lewis
(1957) | Director | Since 2011 | Retired | 64 | None |
John R. Whitten
(1946) | Director | Since 2008 | Retired | 64 | Onto Innovation Inc.; Rudolph Technologies, Inc. (2006 to 2019) |
Stephen E. Yates
(1948) | Director and Chairman of the Board | Since 2012 (Chairman since 2018) | Retired | 79 | None |
| Interested Director |
|
Jonathan S. Thomas
(1963) | Director | Since 2007 | President and Chief Executive Officer, ACC (2007 to present). Also serves as Chief Executive Officer, ACS; Executive Vice President, ACIM; Director, ACC, ACIM and other ACC subsidiaries | 120 | None |
The Statement of Additional Information has additional information about the fund's directors and is available without charge, upon request, by calling 1-800-378-9878.
Officers
The following table presents certain information about the executive officers of the funds. Each officer serves as an officer for 16 (in the case of Robert J. Leach, 15) investment companies in the American Century family of funds. No officer is compensated for his or her service as an officer of the funds. The listed officers are interested persons of the funds and are appointed or re-appointed on an annual basis. The mailing address for each officer listed below is 4500 Main Street, Kansas City, Missouri 64111.
|
| | |
Name
(Year of Birth) | Offices with the Funds | Principal Occupation(s) During the Past Five Years |
Patrick Bannigan
(1965) | President since 2019 | Executive Vice President and Director, ACC (2012 to present); Chief Financial Officer, Chief Accounting Officer and Treasurer, ACC (2015 to present); Chief Operating Officer, ACC (2012-2015). Also serves as President, ACS; Vice President, ACIM; Chief Financial Officer, Chief Accounting Officer and/or Director, ACIM, ACS and other ACC subsidiaries |
R. Wes Campbell
(1974) | Chief Financial Officer and Treasurer since 2018 | Investment Operations and Investment Accounting, ACS (2000 to present) |
Amy D. Shelton
(1964) | Chief Compliance Officer and Vice President since 2014 | Chief Compliance Officer, American Century funds, (2014 to present); Chief Compliance Officer, ACIM (2014 to present); Chief Compliance Officer, ACIS (2009 to present). Also serves as Vice President, ACIS |
Charles A. Etherington
(1957) | General Counsel since 2007 and Senior Vice President since 2006 | Attorney, ACC (1994 to present); Vice President, ACC (2005 to present); General Counsel, ACC (2007 to present). Also serves as General Counsel, ACIM, ACS, ACIS and other ACC subsidiaries; and Senior Vice President, ACIM and ACS |
C. Jean Wade
(1964) | Vice President since 2012 | Senior Vice President, ACS (2017 to present); Vice President, ACS (2000 to 2017)
|
Robert J. Leach
(1966) | Vice President since 2006 | Vice President, ACS (2000 to present) |
David H. Reinmiller
(1963) | Vice President since 2000 | Attorney, ACC (1994 to present). Also serves as Vice President, ACIM and ACS |
Ward D. Stauffer
(1960) | Secretary since 2005 | Attorney, ACC (2003 to present) |
Proxy Voting Policies
A description of the policies that the fund's investment advisor uses in exercising the voting rights associated with the securities purchased and/or held by the fund is available without charge, upon request, by calling 1-800-378-9878. It is also available on American Century Investments’ website at americancentury.com/proxy and on the Securities and Exchange Commission’s website at sec.gov. Information regarding how the investment advisor voted proxies relating to portfolio securities during the most recent 12-month period ended June 30 is available on americancentury.com/proxy. It is also available at sec.gov.
Quarterly Portfolio Disclosure
The fund files its complete schedule of portfolio holdings with the Securities and Exchange Commission (SEC) for the first and third quarters of each fiscal year on Form N-Q or as an exhibit to its reports on Form N-PORT. The fund’s Forms N-Q and Form N-PORT reports are available on the SEC’s website at sec.gov. The fund also makes its complete schedule of portfolio holdings for the most recent quarter of its fiscal year available on its website at ipro.americancentury.com (for Investment Professionals) and, upon request, by calling 1-800-378-9878.
Other Tax Information
The following information is provided pursuant to provisions of the Internal Revenue Code.
For corporate taxpayers, the fund hereby designates $2,318,323, or up to the maximum amount allowable, of ordinary income distributions paid during the fiscal year ended December 31, 2019 as qualified for the corporate dividends received deduction.
The fund hereby designates $5,097,441, or up to the maximum amount allowable, as long-term capital gain distributions (20% rate gain distributions) for the fiscal year ended December 31, 2019.
The fund hereby designates $319,569 as qualified short-term capital gain distributions for purposes of Internal Revenue Code Section 871 for the fiscal year ended December 31, 2019.
|
| | |
| |
| | | |
| Contact Us | americancentury.com | |
| Automated Information Line | 1-800-345-8765 | |
| Investment Professional Service Representatives | 1-800-345-6488 | |
| Telecommunications Relay Service for the Deaf | 711 | |
| | | |
| American Century Variable Portfolios, Inc. | |
| | | |
Investment Advisor: American Century Investment Management, Inc. Kansas City, Missouri | |
| | | |
| This report and the statements it contains are submitted for the general information of our shareholders. The report is not authorized for distribution to prospective investors unless preceded or accompanied by an effective prospectus. | |
| | | |
©2020 American Century Proprietary Holdings, Inc. All rights reserved.
CL-ANN-91439 2002 | |
|
| |
| | |
| | Annual Report |
| | |
| | December 31, 2019 |
| | |
| | VP Capital Appreciation Fund |
| | Class I (AVCIX) |
| | Class II (AVCWX) |
| | Class Y (AVCYX) |
Beginning on January 1, 2021, as permitted by regulations adopted by the Securities and Exchange Commission, paper copies of the fund’s shareholder reports like this one will no longer be sent by mail from the insurance company that offers your contract, unless you specifically request paper copies of the reports from the insurance company or from your financial intermediary. Instead, the reports will be made available on a website, and you will be notified by mail each time a report is posted and provided with a website link to access the report.
If you already elected to receive shareholder reports electronically, you will not be affected by this change and you need not take any action. You may elect to receive shareholder reports and other communications from the insurance company or your financial intermediary electronically by contacting the insurance company.
You may elect to receive all future reports in paper free of charge. You can inform the insurance company or your financial intermediary that you wish to continue receiving paper copies of your shareholder reports by contacting the insurance company. Your election to receive reports in paper will apply to all variable portfolios available under your contract.
|
| |
| Performance | |
| Portfolio Commentary | |
| Fund Characteristics | |
| Shareholder Fee Example | |
| Schedule of Investments | |
| Statement of Assets and Liabilities | |
| Statement of Operations | |
| Statement of Changes in Net Assets | |
| Notes to Financial Statements | |
| Financial Highlights | |
| Report of Independent Registered Public Accounting Firm | |
| Management | |
| Additional Information | |
Any opinions expressed in this report reflect those of the author as of the date of the report, and do not necessarily represent the opinions of American Century Investments® or any other person in the American Century Investments organization. Any such opinions are subject to change at any time based upon market or other conditions and American Century Investments disclaims any responsibility to update such opinions. These opinions may not be relied upon as investment advice and, because investment decisions made by American Century Investments funds are based on numerous factors, may not be relied upon as an indication of trading intent on behalf of any American Century Investments fund. Security examples are used for representational purposes only and are not intended as recommendations to purchase or sell securities. Performance information for comparative indices and securities is provided to American Century Investments by third party vendors. To the best of American Century Investments’ knowledge, such information is accurate at the time of printing.
|
| | | | | | |
| Total Returns as of December 31, 2019 |
| | | | Average Annual Returns | |
| | Ticker Symbol | 1 year | 5 years | 10 years | Since Inception | Inception Date |
| Class I | AVCIX | 35.56% | 10.49% | 12.74% | — | 11/20/87 |
Russell Midcap Growth Index | — | 35.47% | 11.60% | 14.23% | — | — |
| Class II | AVCWX | 35.32% | 10.31% | — | 11.00% | 4/25/14 |
| Class Y | AVCYX | 36.02% | — | — | 15.25% | 9/22/17 |
Average annual returns since inception are presented when ten years of performance history is not available.
Fund returns would have been lower if a portion of the fees had not been waived. Extraordinary performance is attributable in part to unusually favorable market conditions and may not be repeated or consistently achieved in the future.
The performance information presented does not include the fees and charges assessed with investments in variable insurance products, those charges are disclosed in the separate account prospectus. The inclusion of such fees and charges would lower performance.
Data presented reflect past performance. Past performance is no guarantee of future results. Current performance may be higher or lower than the performance shown. Total returns for periods less than one year are not annualized. Investment return and principal value will fluctuate, and redemption value may be more or less than original cost. Data assumes reinvestment of dividends and capital gains, and none of the charts reflect the deduction of taxes that a shareholder would pay on fund distributions or the redemption of fund shares. To obtain performance data current to the most recent month end, please call 1-800-345-6488 or visit ipro.americancentury.com (for Investment Professionals). For additional information about the fund, please consult the prospectus.
|
|
| Growth of $10,000 Over 10 Years |
| $10,000 investment made December 31, 2009 |
| Performance for other share classes will vary due to differences in fee structure. |
|
| |
| Value on December 31, 2019 |
| | Class I — $33,203 |
| |
| | Russell Midcap Growth Index — $37,856 |
| |
Ending value of Class I would have been lower if a portion of the fees had not been waived.
|
| | |
| Total Annual Fund Operating Expenses | |
| Class I | Class II | Class Y |
| 1.00% | 1.15% | 0.65% |
The total annual fund operating expenses shown is as stated in the fund’s prospectus current as of the date of this report. The prospectus may vary from the expense ratio shown elsewhere in this report because it is based on a different time period, includes acquired fund fees and expenses, and, if applicable, does not include fee waivers or expense reimbursements.
Data presented reflect past performance. Past performance is no guarantee of future results. Current performance may be higher or lower than the performance shown. Total returns for periods less than one year are not annualized. Investment return and principal value will fluctuate, and redemption value may be more or less than original cost. Data assumes reinvestment of dividends and capital gains, and none of the charts reflect the deduction of taxes that a shareholder would pay on fund distributions or the redemption of fund shares. To obtain performance data current to the most recent month end, please call 1-800-345-6488 or visit ipro.americancentury.com (for Investment Professionals). For additional information about the fund, please consult the prospectus.
Portfolio Managers: Rob Brookby and Nalin Yogasundram
Performance Summary
VP Capital Appreciation returned 35.56%* for the 12 months ended December 31, 2019, in line with the 35.47% return of the portfolio’s benchmark, the Russell Midcap Growth Index.
U.S. stocks delivered strong returns during the reporting period. Growth stocks outperformed value stocks by a wide margin across the capitalization spectrum. Within the Russell Midcap Growth Index, every sector but energy posted double-digit returns, led by information technology, real estate and financials.
Stock selection in the industrials sector was the top contributor to the fund’s performance relative to the benchmark. Stock choices in the financials and information technology sectors also benefited relative performance. Stock selection in the communication services and energy sectors detracted.
Industrials Holdings Were Top Contributors
Stock selection in the machinery industry led relative outperformance in the industrials sector. Stock choices in the construction and engineering industry were also positive.
In the financials sector, stock selection among capital markets firms led outperformance. A key contributor in the sector was LPL Financial Holdings, the largest independent broker-dealer in the country with over 16,000 financial advisors and over $700 billion in assets under administration. It offers technology, tools, research and custody services to financial advisors across the country.
Other top contributors included Array BioPharma, a commercial-stage biotechnology company focused on developing targeted therapies to treat cancer. The company reported positive phase 3 results for a form of colorectal cancer and subsequently agreed to be acquired by Pfizer. The stock was eliminated from the portfolio as a result of the transaction.
Fiserv was a significant contributor. This provider of technology to financial firms outperformed after reporting better-than-expected earnings and revenue. The company benefited from the secular trend of banks outsourcing certain functions. Its acquisition of First Data, which offers payments services, provides synergies that we think can drive future outperformance. Semiconductor company Advanced Micro Devices outperformed. The company has improved its chipmaking processes and has been taking market share from its bigger competitors. Applied Materials reported quarterly earnings that were much better than expected. The company makes equipment for the manufacture of semiconductor chips, and it benefited from a rebound in spending.
Communication Services Hampered Performance
Stock selection in the interactive media and services industry hurt relative performance in the communication services sector. The stock price of social media firm Twitter fell sharply after it reported weaker-than-expected quarterly earnings. Although Twitter’s user base is strong, it has had difficulty monetizing it. We continue to hold the stock because Twitter’s user base is still growing, and we believe there will be improvement over the next year.
*All fund returns referenced in this commentary are for Class I shares. Fund returns would have been lower if a portion of the fees had not been waived. Performance for other share classes will vary due to differences in fee structure; when Class I performance exceeds that of the fund’s benchmark, other share classes may not. See page 2 for returns for all share classes.
In the energy sector, Concho Resources was a significant detractor. The oil and natural gas company reported poor earnings amid lower oil prices. Concho was eliminated.
Other major detractors include Covetrus. The animal health distribution company reported quarterly results and an outlook that came in modestly below expectations. The holding was eliminated. PTC, a software provider to industrial companies, was a significant detractor. Our thesis was that its software gave the company increasing exposure to the internet of things for industrials. However, PTC’s core business has been slowing because the management team lost sight of core cash flow. We eliminated our holding to invest in more attractive software companies. Online travel site Expedia Group reported disappointing earnings, largely due to higher costs for traffic driven by search engines, especially Google. Expedia is also facing increased competition including from Google, which is having success with its own travel site. We eliminated our position.
Outlook
Our process uses a combined top-down, bottom-up fundamental framework aimed at identifying mid-cap companies producing attractive, sustainable growth. We seek to reduce unintended, nonfundamental risks and align the portfolio with fundamental, company-specific risks that we believe will be rewarded over time. As a result of this approach, our sector and industry allocations reflect where we are finding opportunities at a given time.
Financials ended the period as the portfolio’s largest overweight due to market appreciation and because we added to some positions. Health care ended the period modestly overweight. The sector has been under pressure from political rhetoric around health care generally and increased scrutiny of drug pricing, although that pressure has eased somewhat. One theme we are following is using technology and/or data and analytics to improve the delivery of care or the quality of care.
Consumer discretionary ended the period underweight. The tailwinds that have boosted the sector—tax cuts, falling interest rates and gasoline prices, for example—are receding and being replaced by headwinds, especially in retail, where wage pressures are building.
|
| |
| DECEMBER 31, 2019 |
| Top Ten Holdings | % of net assets |
| Fiserv, Inc. | 5.6% |
| SBA Communications Corp. | 2.9% |
| AMETEK, Inc. | 2.4% |
| Encompass Health Corp. | 2.4% |
| Teleflex, Inc. | 2.3% |
| Applied Materials, Inc. | 2.3% |
| LPL Financial Holdings, Inc. | 2.3% |
| Twitter, Inc. | 2.2% |
| Advanced Micro Devices, Inc. | 2.2% |
| Burlington Stores, Inc. | 2.0% |
| | |
| Top Five Industries | % of net assets |
| Software | 10.7% |
| IT Services | 9.3% |
| Semiconductors and Semiconductor Equipment | 6.9% |
| Capital Markets | 6.1% |
| Health Care Equipment and Supplies | 5.9% |
| | |
| Types of Investments in Portfolio | % of net assets |
| Common Stocks | 98.5% |
| Exchange-Traded Funds | 0.9% |
| Total Equity Exposure | 99.4% |
| Temporary Cash Investments | 0.8% |
| Other Assets and Liabilities | (0.2)% |
Fund shareholders may incur two types of costs: (1) transaction costs, including sales charges (loads) on purchase payments and redemption/exchange fees; and (2) ongoing costs, including management fees; distribution and service (12b-1) fees; and other fund expenses. This example is intended to help you understand your ongoing costs (in dollars) of investing in your fund and to compare these costs with the ongoing cost of investing in other mutual funds.
The example is based on an investment of $1,000 made at the beginning of the period and held for the entire period from July 1, 2019 to December 31, 2019.
Actual Expenses
The table provides information about actual account values and actual expenses for each class. You may use the information, together with the amount you invested, to estimate the expenses that you paid over the period. First, identify the share class you own. Then simply divide your account value by $1,000 (for example, an $8,600 account value divided by $1,000 = 8.6), then multiply the result by the number under the heading “Expenses Paid During Period” to estimate the expenses you paid on your account during this period.
Hypothetical Example for Comparison Purposes
The table also provides information about hypothetical account values and hypothetical expenses based on the actual expense ratio of each class of your fund and an assumed rate of return of 5% per year before expenses, which is not the actual return of a fund’s share class. The hypothetical account values and expenses may not be used to estimate the actual ending account balance or expenses you paid for the period. You may use this information to compare the ongoing costs of investing in your fund and other funds. To do so, compare this 5% hypothetical example with the 5% hypothetical examples that appear in the shareholder reports of the other funds.
Please note that the expenses shown in the table are meant to highlight your ongoing costs only and do not reflect any transactional costs, such as sales charges (loads) or redemption/exchange fees. Therefore, the table is useful in comparing ongoing costs only, and will not help you determine the relative total costs of owning different funds. In addition, if these transactional costs were included, your costs would have been higher.
|
| | | | |
| | Beginning
Account Value
7/1/19 | Ending
Account Value
12/31/19 | Expenses Paid
During Period(1)
7/1/19 - 12/31/19 |
Annualized
Expense Ratio(1) |
| Actual | | | | |
| Class I | $1,000 | $1,058.40 | $4.51 | 0.87% |
| Class II | $1,000 | $1,056.90 | $5.29 | 1.02% |
| Class Y | $1,000 | $1,059.90 | $2.70 | 0.52% |
| Hypothetical | | | | |
| Class I | $1,000 | $1,020.82 | $4.43 | 0.87% |
| Class II | $1,000 | $1,020.06 | $5.19 | 1.02% |
| Class Y | $1,000 | $1,022.58 | $2.65 | 0.52% |
| |
| (1) | Expenses are equal to the class's annualized expense ratio listed in the table above, multiplied by the average account value over the period, multiplied by 184, the number of days in the most recent fiscal half-year, divided by 365, to reflect the one-half year period. Annualized expense ratio reflects actual expenses, including any applicable fee waivers or expense reimbursements and excluding any acquired fund fees and expenses. |
DECEMBER 31, 2019
|
| | | | |
| | Shares | Value |
| COMMON STOCKS — 98.5% | | |
| Aerospace and Defense — 1.2% | | |
| TransDigm Group, Inc. | 11,095 | $ | 6,213,200 |
|
| Auto Components — 1.2% | | |
| Aptiv plc | 65,420 | 6,212,937 |
|
| Beverages — 1.9% | | |
| Brown-Forman Corp., Class B | 41,901 | 2,832,508 |
|
| Constellation Brands, Inc., Class A | 37,892 | 7,190,007 |
|
| | | 10,022,515 |
|
| Biotechnology — 2.9% | | |
Argenx SE ADR(1) | 13,090 | 2,101,207 |
|
Exact Sciences Corp.(1) | 64,242 | 5,941,100 |
|
Immunomedics, Inc.(1) | 190,118 | 4,022,897 |
|
Sage Therapeutics, Inc.(1) | 15,260 | 1,101,619 |
|
Turning Point Therapeutice, Inc.(1) | 30,535 | 1,902,025 |
|
| | | 15,068,848 |
|
| Building Products — 1.0% | | |
| Fortune Brands Home & Security, Inc. | 77,945 | 5,092,926 |
|
| Capital Markets — 6.1% | | |
| LPL Financial Holdings, Inc. | 126,751 | 11,692,780 |
|
| MSCI, Inc. | 30,032 | 7,753,662 |
|
| S&P Global, Inc. | 33,366 | 9,110,586 |
|
| Tradeweb Markets, Inc., Class A | 67,538 | 3,130,386 |
|
| | | 31,687,414 |
|
| Commercial Services and Supplies — 1.0% | | |
| Waste Management, Inc. | 43,764 | 4,987,345 |
|
| Communications Equipment — 2.4% | | |
Arista Networks, Inc.(1) | 30,419 | 6,187,224 |
|
F5 Networks, Inc.(1) | 44,535 | 6,219,313 |
|
| | | 12,406,537 |
|
| Construction Materials — 1.5% | | |
| Vulcan Materials Co. | 54,846 | 7,897,275 |
|
| Containers and Packaging — 1.0% | | |
| Ball Corp. | 76,876 | 4,971,571 |
|
| Distributors — 1.6% | | |
LKQ Corp.(1) | 235,071 | 8,392,035 |
|
| Diversified Consumer Services — 1.1% | | |
Bright Horizons Family Solutions, Inc.(1) | 37,718 | 5,668,638 |
|
| Electrical Equipment — 3.5% | | |
| AMETEK, Inc. | 123,875 | 12,355,293 |
|
| nVent Electric plc | 53,676 | 1,373,032 |
|
Sensata Technologies Holding plc(1) | 83,384 | 4,491,896 |
|
| | | 18,220,221 |
|
|
| | | | |
| | Shares | Value |
| Electronic Equipment, Instruments and Components — 3.7% | | |
| CDW Corp. | 51,899 | $ | 7,413,253 |
|
| Cognex Corp. | 66,092 | 3,703,796 |
|
Keysight Technologies, Inc.(1) | 79,403 | 8,149,130 |
|
| | | 19,266,179 |
|
| Entertainment — 2.6% | | |
Live Nation Entertainment, Inc.(1) | 103,965 | 7,430,379 |
|
Take-Two Interactive Software, Inc.(1) | 51,147 | 6,261,927 |
|
| | | 13,692,306 |
|
| Equity Real Estate Investment Trusts (REITs) — 2.9% | | |
| SBA Communications Corp. | 63,034 | 15,190,564 |
|
| Health Care Equipment and Supplies — 5.9% | | |
DexCom, Inc.(1) | 15,078 | 3,298,162 |
|
Masimo Corp.(1) | 37,341 | 5,902,119 |
|
| ResMed, Inc. | 39,828 | 6,172,145 |
|
| Teleflex, Inc. | 31,741 | 11,948,582 |
|
Varian Medical Systems, Inc.(1) | 22,640 | 3,215,106 |
|
| | | 30,536,114 |
|
| Health Care Providers and Services — 4.1% | | |
Centene Corp.(1) | 146,375 | 9,202,596 |
|
| Encompass Health Corp. | 176,331 | 12,214,449 |
|
| | | 21,417,045 |
|
| Hotels, Restaurants and Leisure — 3.8% | | |
Chipotle Mexican Grill, Inc.(1) | 9,482 | 7,937,477 |
|
| Hilton Worldwide Holdings, Inc. | 42,875 | 4,755,266 |
|
Planet Fitness, Inc., Class A(1) | 95,024 | 7,096,393 |
|
| | | 19,789,136 |
|
| Interactive Media and Services — 2.2% | | |
Twitter, Inc.(1) | 359,377 | 11,518,033 |
|
| IT Services — 9.3% | | |
Fiserv, Inc.(1) | 253,208 | 29,278,441 |
|
FleetCor Technologies, Inc.(1) | 35,322 | 10,162,846 |
|
Square, Inc., Class A(1) | 143,218 | 8,959,718 |
|
| | | 48,401,005 |
|
| Life Sciences Tools and Services — 2.4% | | |
| Bruker Corp. | 143,891 | 7,334,124 |
|
Mettler-Toledo International, Inc.(1) | 6,403 | 5,079,372 |
|
| | | 12,413,496 |
|
| Machinery — 4.1% | | |
| Graco, Inc. | 53,231 | 2,768,012 |
|
| Ingersoll-Rand plc | 68,725 | 9,134,927 |
|
| Parker-Hannifin Corp. | 44,442 | 9,147,052 |
|
| | | 21,049,991 |
|
| Personal Products — 0.8% | | |
| Shiseido Co. Ltd. | 60,600 | 4,333,165 |
|
| Pharmaceuticals — 0.8% | | |
Catalent, Inc.(1) | 71,187 | 4,007,828 |
|
|
| | | | |
| | Shares | Value |
| Professional Services — 3.3% | | |
CoStar Group, Inc.(1) | 4,268 | $ | 2,553,545 |
|
IHS Markit Ltd.(1) | 92,680 | 6,983,438 |
|
| Verisk Analytics, Inc. | 52,236 | 7,800,924 |
|
| | | 17,337,907 |
|
| Road and Rail — 1.4% | | |
| J.B. Hunt Transport Services, Inc. | 60,517 | 7,067,175 |
|
| Semiconductors and Semiconductor Equipment — 6.9% | | |
Advanced Micro Devices, Inc.(1) | 247,063 | 11,330,309 |
|
| Applied Materials, Inc. | 192,175 | 11,730,362 |
|
| Marvell Technology Group Ltd. | 194,832 | 5,174,738 |
|
Micron Technology, Inc.(1) | 97,366 | 5,236,343 |
|
| Xilinx, Inc. | 21,270 | 2,079,568 |
|
| | | 35,551,320 |
|
| Software — 10.7% | | |
Atlassian Corp. plc, Class A(1) | 53,320 | 6,416,529 |
|
Cadence Design Systems, Inc.(1) | 127,467 | 8,841,111 |
|
Coupa Software, Inc.(1) | 40,139 | 5,870,329 |
|
Palo Alto Networks, Inc.(1) | 19,831 | 4,585,919 |
|
Paycom Software, Inc.(1) | 26,901 | 7,122,309 |
|
Proofpoint, Inc.(1) | 50,575 | 5,804,998 |
|
RingCentral, Inc., Class A(1) | 44,673 | 7,534,995 |
|
Splunk, Inc.(1) | 62,337 | 9,336,212 |
|
| | | 55,512,402 |
|
| Specialty Retail — 5.4% | | |
Burlington Stores, Inc.(1) | 44,709 | 10,194,993 |
|
Five Below, Inc.(1) | 51,286 | 6,557,428 |
|
Floor & Decor Holdings, Inc., Class A(1) | 100,346 | 5,098,580 |
|
| Tractor Supply Co. | 62,729 | 5,861,398 |
|
| | | 27,712,399 |
|
| Textiles, Apparel and Luxury Goods — 1.1% | | |
Lululemon Athletica, Inc.(1) | 24,875 | 5,762,791 |
|
| Trading Companies and Distributors — 0.7% | | |
Univar Solutions, Inc.(1) | 156,353 | 3,789,997 |
|
TOTAL COMMON STOCKS
(Cost $407,968,657) | | 511,190,315 |
|
| EXCHANGE-TRADED FUNDS — 0.9% | | |
SPDR S&P Oil & Gas Exploration & Production ETF
(Cost $5,439,917) | 193,530 | 4,586,661 |
|
| TEMPORARY CASH INVESTMENTS — 0.8% | | |
| Repurchase Agreement, BMO Capital Markets Corp., (collateralized by various U.S. Treasury obligations, 2.75% - 3.75%, 9/15/21 - 11/15/43, valued at $3,351,897), in a joint trading account at 1.35%, dated 12/31/19, due 1/2/20 (Delivery value $3,281,454) | | 3,281,208 |
|
| Repurchase Agreement, Fixed Income Clearing Corp., (collateralized by various U.S. Treasury obligations, 1.625%, 12/15/22, valued at $746,103), at 0.65%, dated 12/31/19, due 1/2/20 (Delivery value $730,026) | | 730,000 |
|
|
| | | | |
| | Shares | Value |
| State Street Institutional U.S. Government Money Market Fund, Premier Class | 46,900 | $ | 46,900 |
|
TOTAL TEMPORARY CASH INVESTMENTS
(Cost $4,058,108) | | 4,058,108 |
|
TOTAL INVESTMENT SECURITIES — 100.2%
(Cost $417,466,682) | | 519,835,084 |
|
| OTHER ASSETS AND LIABILITIES — (0.2)% | | (1,206,206 | ) |
| TOTAL NET ASSETS — 100.0% | | $ | 518,628,878 |
|
|
| | | | | | | | | | |
| FORWARD FOREIGN CURRENCY EXCHANGE CONTRACTS | | |
| Currency Purchased | Currency Sold | Counterparty | Settlement Date | Unrealized Appreciation
(Depreciation) |
| USD | 3,925,512 |
| JPY | 427,048,200 |
| Bank of America N.A. | 3/31/20 | $ | (23,475 | ) |
|
| | |
| NOTES TO SCHEDULE OF INVESTMENTS |
| ADR | - | American Depositary Receipt |
| JPY | - | Japanese Yen |
| USD | - | United States Dollar |
See Notes to Financial Statements.
|
|
| Statement of Assets and Liabilities |
|
| | | |
| DECEMBER 31, 2019 | |
| Assets |
| Investment securities, at value (cost of $417,466,682) | $ | 519,835,084 |
|
| Receivable for investments sold | 518,659 |
|
| Receivable for capital shares sold | 280,114 |
|
| Dividends and interest receivable | 444,158 |
|
| Securities lending receivable | 489 |
|
| | 521,078,504 |
|
| | |
| Liabilities | |
| Payable for investments purchased | 2,119,477 |
|
| Payable for capital shares redeemed | 54,628 |
|
| Unrealized depreciation on forward foreign currency exchange contracts | 23,475 |
|
| Accrued management fees | 251,753 |
|
| Distribution fees payable | 293 |
|
| | 2,449,626 |
|
| | |
| Net Assets | $ | 518,628,878 |
|
| | |
| Net Assets Consist of: | |
| Capital (par value and paid-in surplus) | $ | 360,508,483 |
|
| Distributable earnings | 158,120,395 |
|
| | $ | 518,628,878 |
|
|
| | | | | | |
| | Net Assets | Shares Outstanding | Net Asset Value Per Share |
| Class I, $0.01 Par Value |
| $90,134,391 |
| 5,648,762 |
| $15.96 |
| Class II, $0.01 Par Value |
| $1,411,261 |
| 89,418 |
| $15.78 |
| Class Y, $0.01 Par Value |
| $427,083,226 |
| 26,539,677 |
| $16.09 |
See Notes to Financial Statements.
|
| | | |
| YEAR ENDED DECEMBER 31, 2019 |
| Investment Income (Loss) |
| Income: | |
| Dividends (net of foreign taxes withheld of $1,659) | $ | 3,233,391 |
|
| Securities lending, net | 183,426 |
|
| Interest | 155,806 |
|
| | 3,572,623 |
|
| | |
| Expenses: | |
| Management fees | 3,713,410 |
|
| Distribution fees - Class II | 3,247 |
|
| Directors' fees and expenses | 16,305 |
|
| Other expenses | 901 |
|
| | 3,733,863 |
|
Fees waived(1) | (606,137 | ) |
| | 3,127,726 |
|
| | |
| Net investment income (loss) | 444,897 |
|
| | |
| Realized and Unrealized Gain (Loss) | |
| Net realized gain (loss) on: | |
| Investment transactions (Note 4) | 72,068,311 |
|
| Forward foreign currency exchange contract transactions | 129,763 |
|
| Foreign currency translation transactions | 3,290 |
|
| | 72,201,364 |
|
| | |
| Change in net unrealized appreciation (depreciation) on: | |
| Investments | 85,855,344 |
|
| Forward foreign currency exchange contracts | (39,015 | ) |
| Translation of assets and liabilities in foreign currencies | 128 |
|
| | 85,816,457 |
|
| | |
| Net realized and unrealized gain (loss) | 158,017,821 |
|
| | |
| Net Increase (Decrease) in Net Assets Resulting from Operations | $ | 158,462,718 |
|
| |
| (1) | Amount consists of $133,433, $1,542 and $471,162 for Class I, Class II and Class Y, respectively. |
See Notes to Financial Statements.
|
|
| Statement of Changes in Net Assets |
|
| | | | | | |
| YEARS ENDED DECEMBER 31, 2019 AND DECEMBER 31, 2018 |
| Increase (Decrease) in Net Assets | December 31, 2019 | December 31, 2018 |
| Operations | | |
| Net investment income (loss) | $ | 444,897 |
| $ | (274,335 | ) |
| Net realized gain (loss) | 72,201,364 |
| 92,422,459 |
|
| Change in net unrealized appreciation (depreciation) | 85,816,457 |
| (115,373,029 | ) |
| Net increase (decrease) in net assets resulting from operations | 158,462,718 |
| (23,224,905 | ) |
| | | |
| Distributions to Shareholders | | |
| From earnings: | | |
| Class I | (28,318,582 | ) | (861,013 | ) |
| Class II | (209,486 | ) | (9,408 | ) |
| Class Y | (63,495,599 | ) | (2,009,887 | ) |
| Decrease in net assets from distributions | (92,023,667 | ) | (2,880,308 | ) |
| | | |
| Capital Share Transactions | | |
| Net increase (decrease) in net assets from capital share transactions (Note 5) | (13,066,511 | ) | (34,590,725 | ) |
| | | |
| Net increase (decrease) in net assets | 53,372,540 |
| (60,695,938 | ) |
| | | |
| Net Assets | | |
| Beginning of period | 465,256,338 |
| 525,952,276 |
|
| End of period | $ | 518,628,878 |
| $ | 465,256,338 |
|
See Notes to Financial Statements.
|
|
| Notes to Financial Statements |
DECEMBER 31, 2019
1. Organization
American Century Variable Portfolios, Inc. (the corporation) is registered under the Investment Company Act of 1940, as amended (the 1940 Act), as an open-end management investment company and is organized as a Maryland corporation. VP Capital Appreciation Fund (the fund) is one fund in a series issued by the corporation. The fund’s investment objective is to seek capital growth. The fund offers Class I, Class II and Class Y.
2. Significant Accounting Policies
The following is a summary of significant accounting policies consistently followed by the fund in preparation of its financial statements. The fund is an investment company and follows accounting and reporting guidance in accordance with accounting principles generally accepted in the United States of America. This may require management to make certain estimates and assumptions at the date of the financial statements. Actual results could differ from these estimates. Management evaluated the impact of events or transactions occurring through the date the financial statements were issued that would merit recognition or disclosure.
Investment Valuations — The fund determines the fair value of its investments and computes its net asset value per share at the close of regular trading (usually 4 p.m. Eastern time) on the New York Stock Exchange (NYSE) on each day the NYSE is open. The Board of Directors has adopted valuation policies and procedures to guide the investment advisor in the fund’s investment valuation process and to provide methodologies for the oversight of the fund’s pricing function.
Equity securities that are listed or traded on a domestic securities exchange are valued at the last reported sales price or at the official closing price as provided by the exchange. Equity securities traded on foreign securities exchanges are generally valued at the closing price of such securities on the exchange where primarily traded or at the close of the NYSE, if that is earlier. If no last sales price is reported, or if local convention or regulation so provides, the mean of the latest bid and asked prices may be used. Securities traded over-the-counter are valued at the mean of the latest bid and asked prices, the last sales price, or the official closing price. Equity securities initially expressed in local currencies are translated into U.S. dollars at the mean of the appropriate currency exchange rate at the close of the NYSE as provided by an independent pricing service.
Open-end management investment companies are valued at the reported net asset value per share. Repurchase agreements are valued at cost, which approximates fair value. Forward foreign currency exchange contracts are valued at the mean of the appropriate forward exchange rate at the close of the NYSE as provided by an independent pricing service.
If the fund determines that the market price for an investment is not readily available or the valuation methods mentioned above do not reflect an investment’s fair value, such investment is valued as determined in good faith by the Board of Directors or its delegate, in accordance with policies and procedures adopted by the Board of Directors. In its determination of fair value, the fund may review several factors including, but not limited to, market information regarding the specific investment or comparable investments and correlation with other investment types, futures indices or general market indicators. Circumstances that may cause the fund to use these procedures to value an investment include, but are not limited to: an investment has been declared in default or is distressed; trading in a security has been suspended during the trading day or a security is not actively trading on its principal exchange; prices received from a regular pricing source are deemed unreliable; or there is a foreign market holiday and no trading occurred.
The fund monitors for significant events occurring after the close of an investment’s primary exchange but before the fund’s net asset value per share is determined. Significant events may include, but are not limited to: corporate announcements and transactions; governmental action and political unrest that could impact a specific investment or an investment sector; or armed conflicts, natural disasters and similar events that could affect investments in a specific country or region. The fund also monitors for significant fluctuations between domestic and foreign markets, as evidenced by the U.S. market or such other indicators that the Board of Directors, or its delegate, deems appropriate. The fund may apply a model-derived factor to the closing price of equity securities traded on foreign securities exchanges. The factor is based on observable market data as provided by an independent pricing service.
Security Transactions — Security transactions are accounted for as of the trade date. Net realized gains and losses are determined on the identified cost basis, which is also used for federal income tax purposes.
Investment Income — Dividend income less foreign taxes withheld, if any, is recorded as of the ex-dividend date. Distributions received on securities that represent a return of capital or long-term capital gain are recorded as a reduction of cost of investments and/or as a realized gain. The fund may estimate the components of distributions received that may be considered nontaxable distributions or long-term capital gain distributions for income tax purposes. Interest income is recorded on the accrual basis and includes accretion of discounts and amortization of premiums. Securities lending income is net of fees and rebates earned by the lending agent for its services.
Foreign Currency Translations — All assets and liabilities initially expressed in foreign currencies are translated into U.S. dollars at prevailing exchange rates at period end. The fund may enter into spot foreign currency exchange contracts to facilitate transactions denominated in a foreign currency. Purchases and sales of investment securities, dividend and interest income, spot foreign currency exchange contracts, and expenses are translated at the rates of exchange prevailing on the respective dates of such transactions. Net realized and unrealized foreign currency exchange gains or losses related to investment securities are a component of net realized gain (loss) on investment transactions and change in net unrealized appreciation (depreciation) on investments, respectively.
Repurchase Agreements — The fund may enter into repurchase agreements with institutions that American Century Investment Management, Inc. (ACIM) (the investment advisor) has determined are creditworthy pursuant to criteria adopted by the Board of Directors. The fund requires that the collateral, represented by securities, received in a repurchase transaction be transferred to the custodian in a manner sufficient to enable the fund to obtain those securities in the event of a default under the repurchase agreement. ACIM monitors, on a daily basis, the securities transferred to ensure the value, including accrued interest, of the securities under each repurchase agreement is equal to or greater than amounts owed to the fund under each repurchase agreement.
Joint Trading Account — Pursuant to an Exemptive Order issued by the Securities and Exchange Commission, the fund, along with certain other funds in the American Century Investments family of funds, may transfer uninvested cash balances into a joint trading account. These balances are invested in one or more repurchase agreements that are collateralized by U.S. Treasury or Agency obligations.
Segregated Assets — In accordance with the 1940 Act, the fund segregates assets on its books and records to cover certain types of investment securities and other financial instruments. ACIM monitors, on a daily basis, the securities segregated to ensure the fund designates a sufficient amount of liquid assets, marked-to-market daily. The fund may also receive assets or be required to pledge assets at the custodian bank or with a broker for collateral requirements.
Income Tax Status — It is the fund’s policy to distribute substantially all net investment income and net realized gains to shareholders and to otherwise qualify as a regulated investment company under provisions of the Internal Revenue Code. Accordingly, no provision has been made for income taxes. The fund files U.S. federal, state, local and non-U.S. tax returns as applicable. The fund's tax returns are subject to examination by the relevant taxing authority until expiration of the applicable statute of limitations, which is generally three years from the date of filing but can be longer in certain jurisdictions. At this time, management believes there are no uncertain tax positions which, based on their technical merit, would not be sustained upon examination and for which it is reasonably possible that the total amounts of unrecognized tax benefits will significantly change in the next twelve months.
Multiple Class — All shares of the fund represent an equal pro rata interest in the net assets of the class to which such shares belong, and have identical voting, dividend, liquidation and other rights and the same terms and conditions, except for class specific expenses and exclusive rights to vote on matters affecting only individual classes. Income, non-class specific expenses, and realized and unrealized capital gains and losses of the fund are allocated to each class of shares based on their relative net assets.
Distributions to Shareholders — Distributions from net investment income and net realized gains, if any, are generally declared and paid annually.
Indemnifications — Under the corporation’s organizational documents, its officers and directors are indemnified against certain liabilities arising out of the performance of their duties to the fund. In addition, in the normal course of business, the fund enters into contracts that provide general indemnifications. The maximum exposure under these arrangements is unknown as this would involve future claims that may be made against a fund. The risk of material loss from such claims is considered by management to be remote.
Securities Lending — Securities are lent to qualified financial institutions and brokers. State Street Bank & Trust Co. serves as securities lending agent to the fund pursuant to a Securities Lending Agreement. The lending of securities exposes the fund to risks such as: the borrowers may fail to return the loaned securities, the borrowers may not be able to provide additional collateral, the fund may experience delays in recovery of the loaned securities or delays in access to collateral, or the fund may experience losses related to the investment collateral. To minimize certain risks, loan counterparties pledge collateral in the form of cash and/or securities. The lending agent has agreed to indemnify the fund in the case of default of any securities borrowed. Cash collateral received is invested in the State Street Navigator Securities Lending Government Money Market Portfolio, a money market mutual fund registered under the 1940 Act. The loans may also be secured by U.S. government securities in an amount at least equal to the market value of the securities loaned, plus accrued interest and dividends, determined on a daily basis and adjusted accordingly. By lending securities, the fund seeks to increase its net investment income through the receipt of interest and fees. Such income is reflected separately within the Statement of Operations. The value of loaned securities and related collateral outstanding at period end, if any, are shown on a gross basis within the Schedule of Investments and Statement of Assets and Liabilities.
3. Fees and Transactions with Related Parties
Certain officers and directors of the corporation are also officers and/or directors of American Century Companies, Inc. (ACC). The corporation’s investment advisor, ACIM, the corporation's distributor, American Century Investment Services, Inc. (ACIS), and the corporation’s transfer agent, American Century Services, LLC, are wholly owned, directly or indirectly, by ACC.
Management Fees — The corporation has entered into a management agreement with ACIM, under which ACIM provides the fund with investment advisory and management services in exchange for a single, unified management fee (the fee) per class. The agreement provides that all expenses of managing and operating the fund, except distribution fees, brokerage expenses, taxes, interest, fees and expenses of the independent directors (including legal counsel fees), and extraordinary expenses, will be paid by ACIM. The fee is computed and accrued daily based on each class's daily net assets and paid monthly in arrears. The difference in the fee among the classes is a result of their separate arrangements for non-Rule 12b-1 shareholder services. It is not the result of any difference in advisory or custodial fees or other expenses related to the management of the fund’s assets, which do not vary by class. The rate of the fee is determined by applying a fee rate calculation formula. This formula takes into account the fund’s assets as well as certain assets, if any, of other clients of the investment advisor outside the American Century Investments family of funds (such as subadvised funds and separate accounts) that use very similar investment teams and strategies (strategy assets). From January 1, 2019 through July 31, 2019, the investment advisor agreed to waive 0.11% of the fund's management fee. Effective August 1, 2019, the investment advisor agreed to waive 0.13% of the fund's management fee. The investment advisor expects this waiver to continue until July 31, 2020 and cannot terminate it prior to such date without the approval of the Board of Directors.
The management fee schedule range and the effective annual management fee before and after waiver for each class for the period ended December 31, 2019 are as follows:
|
| | | |
| | | Effective Annual Management Fee |
| | Management Fee Schedule Range | Before Waiver | After Waiver |
| Class I | 0.90% to 1.00% | 1.00% | 0.88% |
| Class II | 0.80% to 0.90% | 0.90% | 0.78% |
| Class Y | 0.55% to 0.65% | 0.65% | 0.53% |
Distribution Fees — The Board of Directors has adopted the Master Distribution Plan (the plan) for Class II, pursuant to Rule 12b-1 of the 1940 Act. The plan provides that Class II will pay ACIS an annual distribution fee equal to 0.25%. The fee is computed and accrued daily based on the Class II daily net assets and paid monthly in arrears. The distribution fee provides compensation for expenses incurred in connection with distributing shares of Class II including, but not limited to, payments to brokers, dealers, and financial institutions that have entered into sales agreements with respect to shares of the fund. Fees incurred under the plan during the period ended December 31, 2019 are detailed in the Statement of Operations.
Directors' Fees and Expenses — The Board of Directors is responsible for overseeing the investment advisor’s management and operations of the fund. The directors receive detailed information about the fund and its investment advisor regularly throughout the year, and meet at least quarterly with management of the investment advisor to review reports about fund operations. The fund’s officers do not receive compensation from the fund.
Interfund Transactions — The fund may enter into security transactions with other American Century Investments funds and other client accounts of the investment advisor, in accordance with the 1940 Act rules and procedures adopted by the Board of Directors. The rules and procedures require, among other things, that these transactions be effected at the independent current market price of the security. During the period, the interfund purchases and sales were $5,617,057 and $3,506,114, respectively. The effect of interfund transactions on the Statement of Operations was $(86,237) in net realized gain (loss) on investment transactions.
4. Investment Transactions
Purchases and sales of investment securities, excluding short-term investments and in kind transactions, for the period ended December 31, 2019 were $469,442,657 and $481,955,857, respectively.
For the period ended December 31, 2019, the fund incurred net realized gains of $16,748,565 from redemptions in kind. A redemption in kind occurs when a fund delivers securities from its portfolio in lieu of cash as payment to a redeeming shareholder.
5. Capital Share Transactions
Transactions in shares of the fund were as follows:
|
| | | | | | | | | | |
| | Year ended December 31, 2019 | Year ended December 31, 2018 |
| | Shares | Amount | Shares | Amount |
| Class I/Shares Authorized | 195,000,000 |
| | 195,000,000 |
| |
| Sold | 899,482 |
| $ | 13,800,061 |
| 1,345,643 |
| $ | 21,021,536 |
|
| Issued in reinvestment of distributions | 2,034,381 |
| 28,318,582 |
| 56,683 |
| 861,013 |
|
| Redeemed | (7,544,209 | ) | (112,758,519 | ) | (1,610,001 | ) | (25,231,872 | ) |
| | (4,610,346 | ) | (70,639,876 | ) | (207,675 | ) | (3,349,323 | ) |
| Class II/Shares Authorized | 25,000,000 |
| | 25,000,000 |
| |
| Sold | 21,128 |
| 318,866 |
| 23,679 |
| 370,474 |
|
| Issued in reinvestment of distributions | 15,202 |
| 209,486 |
| 623 |
| 9,408 |
|
| Redeemed | (21,836 | ) | (326,509 | ) | (62,943 | ) | (971,590 | ) |
| | 14,494 |
| 201,843 |
| (38,641 | ) | (591,708 | ) |
| Class Y/Shares Authorized | 180,000,000 |
| | 180,000,000 |
| |
| Sold | 1,902,101 |
| 28,892,064 |
| 638,162 |
| 10,070,108 |
|
| Issued in reinvestment of distributions | 4,535,400 |
| 63,495,599 |
| 132,056 |
| 2,009,887 |
|
| Redeemed | (2,298,536 | ) | (35,016,141 | ) | (2,751,988 | ) | (42,729,689 | ) |
| | 4,138,965 |
| 57,371,522 |
| (1,981,770 | ) | (30,649,694 | ) |
| Net increase (decrease) | (456,887 | ) | $ | (13,066,511 | ) | (2,228,086 | ) | $ | (34,590,725 | ) |
6. Fair Value Measurements
The fund’s investments valuation process is based on several considerations and may use multiple inputs to determine the fair value of the investments held by the fund. In conformity with accounting principles generally accepted in the United States of America, the inputs used to determine a valuation are classified into three broad levels.
| |
| • | Level 1 valuation inputs consist of unadjusted quoted prices in an active market for identical investments. |
| |
| • | Level 2 valuation inputs consist of direct or indirect observable market data (including quoted prices for comparable investments, evaluations of subsequent market events, interest rates, prepayment speeds, credit risk, etc.). These inputs also consist of quoted prices for identical investments initially expressed in local currencies that are adjusted through translation into U.S. dollars. |
| |
| • | Level 3 valuation inputs consist of unobservable data (including a fund’s own assumptions). |
The level classification is based on the lowest level input that is significant to the fair valuation measurement. The valuation inputs are not necessarily an indication of the risks associated with investing in these securities or other financial instruments.
The following is a summary of the level classifications as of period end. The Schedule of Investments provides additional information on the fund’s portfolio holdings.
|
| | | | | | | | |
| | Level 1 | Level 2 | Level 3 |
| Assets | | | |
| Investment Securities | | | |
| Common Stocks | $ | 506,857,150 |
| $ | 4,333,165 |
| — |
|
| Exchange-Traded Funds | 4,586,661 |
| — |
| — |
|
| Temporary Cash Investments | 46,900 |
| 4,011,208 |
| — |
|
| | $ | 511,490,711 |
| $ | 8,344,373 |
| — |
|
| | | | |
| Liabilities | | | |
| Other Financial Instruments | | | |
| Forward Foreign Currency Exchange Contracts | — |
| $ | 23,475 |
| — |
|
7. Derivative Instruments
Foreign Currency Risk — The fund is subject to foreign currency exchange rate risk in the normal course of pursuing its investment objectives. The value of foreign investments held by a fund may be significantly affected by changes in foreign currency exchange rates. The dollar value of a foreign security generally decreases when the value of the dollar rises against the foreign currency in which the security is denominated and tends to increase when the value of the dollar declines against such foreign currency. A fund may enter into forward foreign currency exchange contracts to reduce a fund's exposure to foreign currency exchange rate fluctuations. The net U.S. dollar value of foreign currency underlying all contractual commitments held by a fund and the resulting unrealized appreciation or depreciation are determined daily. Realized gain or loss is recorded upon the termination of the contract. Net realized and unrealized gains or losses occurring during the holding period of forward foreign currency exchange contracts are a component of net realized gain (loss) on forward foreign currency exchange contract transactions and change in net unrealized appreciation (depreciation) on forward foreign currency exchange contracts, respectively. A fund bears the risk of an unfavorable change in the foreign currency exchange rate underlying the forward contract. Additionally, losses, up to the fair value, may arise if the counterparties do not perform under the contract terms. The fund's average U.S. dollar exposure to foreign currency risk derivative instruments held during the period was $2,573,720.
The value of foreign currency risk derivative instruments as of December 31, 2019, is disclosed on the Statement of Assets and Liabilities as a liability of $23,475 in unrealized depreciation on forward foreign currency exchange contracts. For the year ended December 31, 2019, the effect of foreign currency risk derivative instruments on the Statement of Operations was $129,763 in net realized gain (loss) on forward foreign currency exchange contract transactions and $(39,015) in change in net unrealized appreciation (depreciation) on forward foreign currency exchange contracts.
8. Risk Factors
The fund invests in common stocks of small companies. Because of this, the fund may be subject to greater risk and market fluctuations than a fund investing in larger, more established companies.
9. Federal Tax Information
The tax character of distributions paid during the years ended December 31, 2019 and December 31, 2018 were as follows:
|
| | | | | | |
| | 2019 | 2018 |
| Distributions Paid From | | |
| Ordinary income | $ | 8,017,905 |
| $ | 516,891 |
|
| Long-term capital gains | $ | 84,005,762 |
| $ | 2,363,417 |
|
The book-basis character of distributions made during the year from net investment income or net realized gains may differ from their ultimate characterization for federal income tax purposes. These differences reflect the differing character of certain income items and net realized gains and losses for financial statement and tax purposes, and may result in reclassification among certain capital accounts on the financial statements.
The reclassifications, which are primarily due to redemptions in kind, were made to capital $16,279,470 and distributable earnings $(16,279,470).
As of period end, the federal tax cost of investments and the components of distributable earnings on a tax-basis were as follows:
|
| | | |
| Federal tax cost of investments | $ | 418,533,974 |
|
| Gross tax appreciation of investments | $ | 110,502,992 |
|
| Gross tax depreciation of investments | (9,201,882 | ) |
| Net tax appreciation (depreciation) of investments | 101,301,110 |
|
Net tax appreciation (depreciation) on derivatives and translation of assets and liabilities in foreign currencies
| 128 |
|
| Net tax appreciation (depreciation) | $ | 101,301,238 |
|
| Undistributed ordinary income | $ | 537,764 |
|
Accumulated long-term gains
| $ | 56,281,393 |
|
The difference between book-basis and tax-basis unrealized appreciation (depreciation) is attributable primarily to the tax deferral of losses on wash sales.
|
| | | | | | | | | | | | | | | | | |
| For a Share Outstanding Throughout the Years Ended December 31 (except as noted) | | | | | | | |
| Per-Share Data | | | | | | | Ratios and Supplemental Data |
| | | Income From Investment Operations: | Distributions From: | | | Ratio to Average Net Assets of: | | |
| | Net Asset Value, Beginning of Period | Net Investment Income (Loss)(1) | Net Realized and Unrealized Gain (Loss) | Total From Investment Operations | Net
Investment
Income | Net Realized Gains | Total
Distributions | Net Asset Value, End of Period | Total Return(2) | Operating Expenses | Operating
Expenses
(before
expense
waiver) | Net
Investment
Income
(Loss) | Net
Investment
Income (Loss) (before expense waiver) | Portfolio Turnover Rate | Net Assets, End of Period (in thousands) |
| Class I |
| 2019 | $14.17 | (0.03) | 4.65 | 4.62 | — | (2.83) | (2.83) | $15.96 | 35.56% | 0.88% | 1.00% | (0.18)% | (0.30)% | 94% |
| $90,134 |
|
| 2018 | $15.03 | (0.05) | (0.73) | (0.78) | — | (0.08) | (0.08) | $14.17 | (5.20)% | 0.93% | 1.00% | (0.29)% | (0.36)% | 103% |
| $145,373 |
|
| 2017 | $13.98 | (0.02) | 2.97 | 2.95 | — | (1.90) | (1.90) | $15.03 | 21.79% | 0.99% | 1.01% | (0.15)% | (0.17)% | 58% |
| $157,356 |
|
| 2016 | $15.02 | (0.02) | 0.40 | 0.38 | — | (1.42) | (1.42) | $13.98 | 3.23% | 0.99% | 1.00% | (0.14)% | (0.15)% | 68% |
| $459,443 |
|
| 2015 | $15.72 | (0.06) | 0.42 | 0.36 | — | (1.06) | (1.06) | $15.02 | 1.93% | 1.00% | 1.00% | (0.38)% | (0.38)% | 72% |
| $465,851 |
|
| Class II |
| 2019 | $14.06 | (0.05) | 4.60 | 4.55 | — | (2.83) | (2.83) | $15.78 | 35.32% | 1.03% | 1.15% | (0.33)% | (0.45)% | 94% |
| $1,411 |
|
| 2018 | $14.94 | (0.07) | (0.73) | (0.80) | — | (0.08) | (0.08) | $14.06 | (5.36)% | 1.08% | 1.15% | (0.44)% | (0.51)% | 103% |
| $1,053 |
|
| 2017 | $13.92 | (0.04) | 2.96 | 2.92 | — | (1.90) | (1.90) | $14.94 | 21.67% | 1.14% | 1.16% | (0.30)% | (0.32)% | 58% |
| $1,697 |
|
| 2016 | $14.98 | (0.04) | 0.40 | 0.36 | — | (1.42) | (1.42) | $13.92 | 3.08% | 1.14% | 1.15% | (0.29)% | (0.30)% | 68% |
| $1,350 |
|
| 2015 | $15.71 | (0.08) | 0.41 | 0.33 | — | (1.06) | (1.06) | $14.98 | 1.73% | 1.15% | 1.15% | (0.53)% | (0.53)% | 72% |
| $942 |
|
| Class Y |
| 2019 | $14.23 | 0.03 | 4.67 | 4.70 | (0.01) | (2.83) | (2.84) | $16.09 | 36.02% | 0.53% | 0.65% | 0.17% | 0.05% | 94% |
| $427,083 |
|
| 2018 | $15.05 | 0.01 | (0.75) | (0.74) | — | (0.08) | (0.08) | $14.23 | (4.92)% | 0.58% | 0.65% | 0.06% | (0.01)% | 103% |
| $318,830 |
|
2017(3) | $15.19 | 0.01 | 1.03 | 1.04 | — | (1.18) | (1.18) | $15.05 | 6.78% | 0.62%(4) | 0.66%(4) | 0.25%(4) | 0.21%(4) | 58%(5) |
| $366,900 |
|
|
|
| Notes to Financial Highlights |
| |
| (1) | Computed using average shares outstanding throughout the period. |
| |
| (2) | Total returns are calculated based on the net asset value of the last business day. Total returns for periods less than one year are not annualized. The total returns presented do not include the fees and charges assessed with investments in variable insurance products, those charges are disclosed in the separate account prospectus. The inclusion of such fees and charges would lower total return. |
| |
| (3) | September 22, 2017 (commencement of sale) through December 31, 2017. |
| |
| (5) | Portfolio turnover is calculated at the fund level. Percentage indicated was calculated for the year ended December 31, 2017. |
See Notes to Financial Statements.
|
|
| Report of Independent Registered Public Accounting Firm |
To the Shareholders and the Board of Directors of American Century Variable Portfolios, Inc.:
Opinion on the Financial Statements and Financial Highlights
We have audited the accompanying statement of assets and liabilities, including the schedule of investments, of VP Capital Appreciation Fund, one of the funds constituting the American Century Variable Portfolios, Inc. (the "Fund"), as of December 31, 2019, the related statement of operations for the year then ended, the statements of changes in net assets for each of the two years in the period then ended, the financial highlights for each of the five years in the period then ended, and the related notes. In our opinion, the financial statements and financial highlights present fairly, in all material respects, the financial position of VP Capital Appreciation Fund of the American Century Variable Portfolios, Inc. as of December 31, 2019, the results of its operations for the year then ended, the changes in its net assets for each of the two years in the period then ended, and the financial highlights for each of the five years in the period then ended, in conformity with accounting principles generally accepted in the United States of America.
Basis for Opinion
These financial statements and financial highlights are the responsibility of the Fund's management. Our responsibility is to express an opinion on the Fund’s financial statements and financial highlights based on our audits. We are a public accounting firm registered with the Public Company Accounting Oversight Board (United States) (PCAOB) and are required to be independent with respect to the Fund in accordance with the U.S. federal securities laws and the applicable rules and regulations of the Securities and Exchange Commission and the PCAOB.
We conducted our audits in accordance with the standards of the PCAOB. Those standards require that we plan and perform the audit to obtain reasonable assurance about whether the financial statements and financial highlights are free of material misstatement, whether due to error or fraud. The Fund is not required to have, nor were we engaged to perform, an audit of its internal control over financial reporting. As part of our audits we are required to obtain an understanding of internal control over financial reporting but not for the purpose of expressing an opinion on the effectiveness of the Fund’s internal control over financial reporting. Accordingly, we express no such opinion.
Our audits included performing procedures to assess the risks of material misstatement of the financial statements and financial highlights, whether due to error or fraud, and performing procedures that respond to those risks. Such procedures included examining, on a test basis, evidence regarding the amounts and disclosures in the financial statements and financial highlights. Our audits also included evaluating the accounting principles used and significant estimates made by management, as well as evaluating the overall presentation of the financial statements and financial highlights. Our procedures included confirmation of securities owned as of December 31, 2019, by correspondence with the custodian and brokers; when replies were not received from brokers, we performed other auditing procedures. We believe that our audits provide a reasonable basis for our opinion.
DELOITTE & TOUCHE LLP
Kansas City, Missouri
February 13, 2020
We have served as the auditor of one or more American Century investment companies since 1997.
The Board of Directors
The individuals listed below serve as directors of the funds. Each director will continue to serve in this capacity until death, retirement, resignation or removal from office. The board has adopted a mandatory retirement age for directors who are not “interested persons,” as that term is defined in the Investment Company Act (independent directors). Independent directors shall retire by December 31 of the year in which they reach their 75th birthday.
Mr. Thomas is an “interested person” because he currently serves as President and Chief Executive Officer of American Century Companies, Inc. (ACC), the parent company of American Century Investment Management, Inc. (ACIM or the advisor). The other directors (more than three-fourths of the total number) are independent. They are not employees, directors or officers of, and have no financial interest in, ACC or any of its wholly owned, direct or indirect, subsidiaries, including ACIM, American Century Investment Services, Inc. (ACIS) and American Century Services, LLC (ACS), and they do not have any other affiliations, positions or relationships that would cause them to be considered “interested persons” under the Investment Company Act. The directors serve in this capacity for seven (in the case of Jonathan S. Thomas, 16; and Stephen E. Yates, 8) registered investment companies in the American Century Investments family of funds.
The following table presents additional information about the directors. The mailing address for each director is 4500 Main Street, Kansas City, Missouri 64111.
|
| | | | | |
Name
(Year of Birth) | Position(s) Held with Funds | Length of Time Served | Principal Occupation(s) During Past 5 Years | Number of American Century Portfolios Overseen by Director | Other Directorships Held During Past 5 Years |
| Independent Directors |
|
|
| Thomas W. Bunn (1953) | Director | Since 2017 | Retired | 64 | SquareTwo Financial; Barings (formerly Babson Capital Funds Trust) (2013 to 2016) |
Chris H. Cheesman
(1962)
| Director | Since 2019
| Retired. Senior Vice President & Chief Audit Executive, AllianceBernstein (1999 to 2018)
| 64 | None |
Barry Fink
(1955) | Director | Since 2012 (independent since 2016) | Retired | 64 | None |
Rajesh K. Gupta
(1960)
| Director | Since 2019
| Partner Emeritus, SeaCrest Investment Management and SeaCrest Wealth Management (2019 to Present); Chief Executive Officer and Chief Investment Officer, SeaCrest Investment Management (2006 to 2019); Chief Executive Officer and Chief Investment Officer, SeaCrest Wealth Management (2008 to 2019)
| 64 | None |
|
| | | | | |
Name
(Year of Birth) | Position(s) Held with Funds | Length of Time Served | Principal Occupation(s) During Past 5 Years | Number of American Century Portfolios Overseen by Director | Other Directorships Held During Past 5 Years |
| Independent Directors |
|
|
Lynn Jenkins
(1963)
| Director | Since 2019
| Consultant, LJ Strategies (2019 to present); United States Representative, U.S. House of Representatives (2009 to 2018) | 64 | MGP Ingredients, Inc. |
Jan M. Lewis
(1957) | Director | Since 2011 | Retired | 64 | None |
John R. Whitten
(1946) | Director | Since 2008 | Retired | 64 | Onto Innovation Inc.; Rudolph Technologies, Inc. (2006 to 2019) |
Stephen E. Yates
(1948) | Director and Chairman of the Board | Since 2012 (Chairman since 2018) | Retired | 79 | None |
| Interested Director |
|
Jonathan S. Thomas
(1963) | Director | Since 2007 | President and Chief Executive Officer, ACC (2007 to present). Also serves as Chief Executive Officer, ACS; Executive Vice President, ACIM; Director, ACC, ACIM and other ACC subsidiaries | 120 | None |
The Statement of Additional Information has additional information about the fund's directors and is available without charge, upon request, by calling 1-800-378-9878.
Officers
The following table presents certain information about the executive officers of the funds. Each officer serves as an officer for 16 (in the case of Robert J. Leach, 15) investment companies in the American Century family of funds. No officer is compensated for his or her service as an officer of the funds. The listed officers are interested persons of the funds and are appointed or re-appointed on an annual basis. The mailing address for each officer listed below is 4500 Main Street, Kansas City, Missouri 64111.
|
| | |
Name
(Year of Birth) | Offices with the Funds | Principal Occupation(s) During the Past Five Years |
Patrick Bannigan
(1965) | President since 2019 | Executive Vice President and Director, ACC (2012 to present); Chief Financial Officer, Chief Accounting Officer and Treasurer, ACC (2015 to present); Chief Operating Officer, ACC (2012-2015). Also serves as President, ACS; Vice President, ACIM; Chief Financial Officer, Chief Accounting Officer and/or Director, ACIM, ACS and other ACC subsidiaries |
R. Wes Campbell
(1974) | Chief Financial Officer and Treasurer since 2018 | Investment Operations and Investment Accounting, ACS (2000 to present) |
Amy D. Shelton
(1964) | Chief Compliance Officer and Vice President since 2014 | Chief Compliance Officer, American Century funds, (2014 to present); Chief Compliance Officer, ACIM (2014 to present); Chief Compliance Officer, ACIS (2009 to present). Also serves as Vice President, ACIS |
Charles A. Etherington
(1957) | General Counsel since 2007 and Senior Vice President since 2006 | Attorney, ACC (1994 to present); Vice President, ACC (2005 to present); General Counsel, ACC (2007 to present). Also serves as General Counsel, ACIM, ACS, ACIS and other ACC subsidiaries; and Senior Vice President, ACIM and ACS |
C. Jean Wade
(1964) | Vice President since 2012 | Senior Vice President, ACS (2017 to present); Vice President, ACS (2000 to 2017)
|
Robert J. Leach
(1966) | Vice President since 2006 | Vice President, ACS (2000 to present) |
David H. Reinmiller
(1963) | Vice President since 2000 | Attorney, ACC (1994 to present). Also serves as Vice President, ACIM and ACS |
Ward D. Stauffer
(1960) | Secretary since 2005 | Attorney, ACC (2003 to present) |
Proxy Voting Policies
A description of the policies that the fund's investment advisor uses in exercising the voting rights associated with the securities purchased and/or held by the fund is available without charge, upon request, by calling 1-800-378-9878. It is also available on American Century Investments’ website at americancentury.com/proxy and on the Securities and Exchange Commission’s website at sec.gov. Information regarding how the investment advisor voted proxies relating to portfolio securities during the most recent 12-month period ended June 30 is available on americancentury.com/proxy. It is also available at sec.gov.
Quarterly Portfolio Disclosure
The fund files its complete schedule of portfolio holdings with the Securities and Exchange Commission (SEC) for the first and third quarters of each fiscal year on Form N-Q or as an exhibit to its reports on Form N-PORT. The fund’s Forms N-Q and Form N-PORT reports are available on the SEC’s website at sec.gov. The fund also makes its complete schedule of portfolio holdings for the most recent quarter of its fiscal year available on its website at ipro.americancentury.com (for Investment Professionals) and, upon request, by calling 1-800-378-9878.
Other Tax Information
The following information is provided pursuant to provisions of the Internal Revenue Code.
For corporate taxpayers, the fund hereby designates $2,903,254, or up to the maximum amount
allowable, of ordinary income distributions paid during the fiscal year ended December 31, 2019 as
qualified for the corporate dividends received deduction.
The fund hereby designates $84,005,762, or up to the maximum amount allowable, as long-term
capital gain distributions (20% rate gain distributions) for the fiscal year ended December 31, 2019.
The fund hereby designates $7,856,018 as qualified short-term capital gain distributions for
purposes of Internal Revenue Code Section 871 for the fiscal year ended December 31, 2019.
|
| | |
| |
| | | |
| Contact Us | americancentury.com | |
| Automated Information Line | 1-800-345-8765 | |
| Investment Professional Service Representatives | 1-800-345-6488 | |
| Telecommunications Relay Service for the Deaf | 711 | |
| | | |
| American Century Variable Portfolios, Inc. | |
| | | |
Investment Advisor: American Century Investment Management, Inc. Kansas City, Missouri | |
| | | |
| This report and the statements it contains are submitted for the general information of our shareholders. The report is not authorized for distribution to prospective investors unless preceded or accompanied by an effective prospectus. | |
| | | |
©2020 American Century Proprietary Holdings, Inc. All rights reserved.
CL-ANN-91442 2002 | |
|
| |
| | |
| | Annual Report |
| | |
| | December 31, 2019 |
| | |
| | VP Growth Fund |
| | Class I (AWRIX) |
| | Class II (AWREX) |
Beginning on January 1, 2021, as permitted by regulations adopted by the Securities and Exchange Commission, paper copies of the fund’s shareholder reports like this one will no longer be sent by mail from the insurance company that offers your contract, unless you specifically request paper copies of the reports from the insurance company or from your financial intermediary. Instead, the reports will be made available on a website, and you will be notified by mail each time a report is posted and provided with a website link to access the report.
If you already elected to receive shareholder reports electronically, you will not be affected by this change and you need not take any action. You may elect to receive shareholder reports and other communications from the insurance company or your financial intermediary electronically by contacting the insurance company.
You may elect to receive all future reports in paper free of charge. You can inform the insurance company or your financial intermediary that you wish to continue receiving paper copies of your shareholder reports by contacting the insurance company. Your election to receive reports in paper will apply to all variable portfolios available under your contract.
|
| |
| Performance | |
| Portfolio Commentary | |
| Fund Characteristics | |
| Shareholder Fee Example | |
| Schedule of Investments | |
| Statement of Assets and Liabilities | |
| Statement of Operations | |
| Statement of Changes in Net Assets | |
| Notes to Financial Statements | |
| Financial Highlights | |
| Report of Independent Registered Public Accounting Firm | |
| Management | |
| Additional Information | |
Any opinions expressed in this report reflect those of the author as of the date of the report, and do not necessarily represent the opinions of American Century Investments® or any other person in the American Century Investments organization. Any such opinions are subject to change at any time based upon market or other conditions and American Century Investments disclaims any responsibility to update such opinions. These opinions may not be relied upon as investment advice and, because investment decisions made by American Century Investments funds are based on numerous factors, may not be relied upon as an indication of trading intent on behalf of any American Century Investments fund. Security examples are used for representational purposes only and are not intended as recommendations to purchase or sell securities. Performance information for comparative indices and securities is provided to American Century Investments by third party vendors. To the best of American Century Investments’ knowledge, such information is accurate at the time of printing.
|
| | | | | |
| Total Returns as of December 31, 2019 |
| | | | Average Annual Returns | |
| | Ticker Symbol | 1 year | 5 years | Since Inception | Inception Date |
| Class I | AWRIX | 35.48% | 13.73% | 12.82% | 5/2/11 |
| Russell 1000 Growth Index | — | 36.39% | 14.62% | 14.48% | — |
| Class II | AWREX | 35.33% | 13.56% | 12.65% | 5/2/11 |
Fund returns would have been lower if a portion of the fees had not been waived. Extraordinary performance is attributable in part to unusually favorable market conditions and may not be repeated or consistently achieved in the future.
The performance information presented does not include the fees and charges assessed with investments in variable insurance products, those charges are disclosed in the separate account prospectus. The inclusion of such fees and charges would lower performance.
Data presented reflect past performance. Past performance is no guarantee of future results. Current performance may be higher or lower than the performance shown. Total returns for periods less than one year are not annualized. Investment return and principal value will fluctuate, and redemption value may be more or less than original cost. Data assumes reinvestment of dividends and capital gains, and none of the charts reflect the deduction of taxes that a shareholder would pay on fund distributions or the redemption of fund shares. To obtain performance data current to the most recent month end, please call 1-800-345-6488 or visit ipro.americancentury.com (for Investment Professionals). For additional information about the fund, please consult the prospectus.
|
|
| Growth of $10,000 Over Life of Class |
| $10,000 investment made May 2, 2011 |
| Performance for other share classes will vary due to differences in fee structure. |
|
| |
| Value on December 31, 2019 |
| | Class I — $28,463 |
| |
| | Russell 1000 Growth Index — $32,313 |
| |
Ending value of Class I would have been lower if a portion of the fees had not been waived.
|
| |
| Total Annual Fund Operating Expenses |
| Class I | Class II |
| 1.01% | 1.16% |
The total annual fund operating expenses shown is as stated in the fund’s prospectus current as of the date of this report. The prospectus may vary from the expense ratio shown elsewhere in this report because it is based on a different time period, includes acquired fund fees and expenses, and, if applicable, does not include fee waivers or expense reimbursements.
Data presented reflect past performance. Past performance is no guarantee of future results. Current performance may be higher or lower than the performance shown. Total returns for periods less than one year are not annualized. Investment return and principal value will fluctuate, and redemption value may be more or less than original cost. Data assumes reinvestment of dividends and capital gains, and none of the charts reflect the deduction of taxes that a shareholder would pay on fund distributions or the redemption of fund shares. To obtain performance data current to the most recent month end, please call 1-800-345-6488 or visit ipro.americancentury.com (for Investment Professionals). For additional information about the fund, please consult the prospectus.
Portfolio Managers: Gregory Woodhams and Justin Brown
Performance Summary
VP Growth returned 35.33%* for the 12 months ended December 31, 2019, lagging the 36.39% return of the portfolio’s benchmark, the Russell 1000 Growth Index.
U.S. stocks posted solid returns during the reporting period. Growth stocks outperformed value stocks by a wide margin. Within the Russell 1000 Growth Index, all sectors posted gains, led by information technology, communication services and financials.
Positioning in the information technology sector detracted from performance relative to the benchmark. Stock selection in financials also weighed on relative performance. Stock choices in industrials and consumer staples benefited performance.
Information Technology Led Detractors
Positioning in information technology meant the sector detracted most from performance relative to the benchmark. Our underweight to Apple was a significant detractor. The stock outperformed as the company reported better-than-expected results and introduced new products, which have been greeted with good demand. The expected launch of 5G iPhones in 2020 is also providing a tailwind for the stock. Arista Networks was another detractor in the sector. The stock price of this computer networking company fell sharply even though it reported strong earnings. Arista provided significantly weaker-than-expected guidance for 2020 based on reduced spending by one of its largest customers. We eliminated the holding.
Other significant detractors included Concho Resources. We eliminated this oil and gas production company after it reported disappointing production. We also eliminated our position in Tapestry, a luxury goods holding company that reported disappointing results and provided weak guidance. Tapestry’s acquisition of Kate Spade has not worked out as management had anticipated. Another notable detractor was Biogen, whose stock endured a difficult, up-and-down year. The stock initially declined after the biotechnology company halted trials of its Alzheimer’s drug, aducanumab. While this was disappointing, we continued to hold the stock because the company has other drugs in the pipeline, and the findings from that trial would be applied to the others in development. But in October, Biogen announced that the drug appeared to be effective after all, causing the stock to rebound sharply. Of course, the drug still must meet regulatory approval, which is uncertain. Nevertheless, if proven safe and effective, the drug could improve the lives of millions of Alzheimer’s patients and address a major unmet medical need.
Industrials Holdings Aided Performance
Aerospace and defense stocks helped relative performance in the industrials sector. Lockheed Martin was a top contributor. The defense contractor posted revenue and earnings above expectations and raised guidance. Lockheed also benefited from being a less-cyclical industrials stock during a period in the first half of 2019 when cyclical stocks lost favor due to a weakening global economic outlook. Underweighting The Boeing Co. relative to the benchmark aided
*All fund returns referenced in this commentary are for Class II shares. Fund returns would have been lower if a portion of the fees had not been waived. Performance for other share classes will vary due to differences in fee structure; when Class II performance exceeds that of the fund’s benchmark, other share classes may not. See page 2 for returns for all share classes.
performance as the airplane manufacturer struggled in the wake of safety and regulatory concerns with its 737 MAX plane.
Among other major contributors, semiconductor equipment company ASML Holding outperformed on strong new orders as it expands its market opportunity set into memory chip manufacturers. The
Netherlands-based company’s technology allows for production of smaller and more efficient
semiconductors. Semiconductor equipment company Applied Materials also outperformed after reporting solid results. Microsoft's stock rose as the company continued to report strong earnings, aided by growth in its cloud service, Azure.
Outlook
We believe stock selection—rather than sector allocation or market timing via the use of cash—is the most efficient means of generating superior risk-adjusted returns. As a result of this approach, the portfolio’s sector and industry selection, as well as capitalization range allocations, are primarily due to identifying what we believe to be superior individual securities.
At period-end, our largest sector allocation relative to the benchmark was communication services. Our weighting in the sector is dominated by a few large positions, including Alphabet, Facebook and The Walt Disney Co. The portfolio is overweight in the consumer discretionary sector. We believe that structurally better business models and brands will have better long-term fundamental results and stock performance than others in the sector. In particular, we think companies with strong competitive positions and that are investing behind their businesses and have strong management teams will continue to separate themselves from the pack.
We ended the period significantly underweight in the information technology sector. The sector remains the portfolio’s largest absolute weighting, and we especially see upside in semiconductor capital equipment providers, given favorable secular growth and attractive valuations.
|
| |
| DECEMBER 31, 2019 |
| Top Ten Holdings | % of net assets |
| Microsoft Corp. | 9.3% |
| Alphabet, Inc., Class A | 7.9% |
| Apple, Inc. | 6.6% |
| Amazon.com, Inc. | 5.9% |
| Visa, Inc., Class A | 5.2% |
| Facebook, Inc., Class A | 3.2% |
| PayPal Holdings, Inc. | 2.7% |
| UnitedHealth Group, Inc. | 2.6% |
| Union Pacific Corp. | 2.5% |
| iShares Russell 1000 Growth ETF | 2.4% |
| | |
| Top Five Industries | % of net assets |
| Software | 12.4% |
| Interactive Media and Services | 11.6% |
| IT Services | 8.5% |
| Semiconductors and Semiconductor Equipment | 6.6% |
| Technology Hardware, Storage and Peripherals | 6.6% |
| | |
| Types of Investments in Portfolio | % of net assets |
| Common Stocks | 97.3% |
| Exchange-Traded Funds | 2.4% |
| Total Equity Exposure | 99.7% |
| Temporary Cash Investments | 0.2% |
| Temporary Cash Investments - Securities Lending Collateral | 0.7% |
| Other Assets and Liabilities | (0.6)% |
Fund shareholders may incur two types of costs: (1) transaction costs, including sales charges (loads) on purchase payments and redemption/exchange fees; and (2) ongoing costs, including management fees; distribution and service (12b-1) fees; and other fund expenses. This example is intended to help you understand your ongoing costs (in dollars) of investing in your fund and to compare these costs with the ongoing cost of investing in other mutual funds.
The example is based on an investment of $1,000 made at the beginning of the period and held for the entire period from July 1, 2019 to December 31, 2019.
Actual Expenses
The table provides information about actual account values and actual expenses for each class. You may use the information, together with the amount you invested, to estimate the expenses that you paid over the period. First, identify the share class you own. Then simply divide your account value by $1,000 (for example, an $8,600 account value divided by $1,000 = 8.6), then multiply the result by the number under the heading “Expenses Paid During Period” to estimate the expenses you paid on your account during this period.
Hypothetical Example for Comparison Purposes
The table also provides information about hypothetical account values and hypothetical expenses based on the actual expense ratio of each class of your fund and an assumed rate of return of 5% per year before expenses, which is not the actual return of a fund’s share class. The hypothetical account values and expenses may not be used to estimate the actual ending account balance or expenses you paid for the period. You may use this information to compare the ongoing costs of investing in your fund and other funds. To do so, compare this 5% hypothetical example with the 5% hypothetical examples that appear in the shareholder reports of the other funds.
Please note that the expenses shown in the table are meant to highlight your ongoing costs only and do not reflect any transactional costs, such as sales charges (loads) or redemption/exchange fees. Therefore, the table is useful in comparing ongoing costs only, and will not help you determine the relative total costs of owning different funds. In addition, if these transactional costs were included, your costs would have been higher.
|
| | | | |
| | Beginning
Account Value
7/1/19 | Ending
Account Value
12/31/19 | Expenses Paid
During Period(1)
7/1/19 - 12/31/19 | Annualized
Expense Ratio(1) |
| Actual | | | | |
| Class I | $1,000 | $1,109.30 | $4.31 | 0.81% |
| Class II | $1,000 | $1,108.80 | $5.10 | 0.96% |
| Hypothetical | | | | |
| Class I | $1,000 | $1,021.12 | $4.13 | 0.81% |
| Class II | $1,000 | $1,020.37 | $4.89 | 0.96% |
| |
| (1) | Expenses are equal to the class's annualized expense ratio listed in the table above, multiplied by the average account value over the period, multiplied by 184, the number of days in the most recent fiscal half-year, divided by 365, to reflect the one-half year period. Annualized expense ratio reflects actual expenses, including any applicable fee waivers or expense reimbursements and excluding any acquired fund fees and expenses. |
DECEMBER 31, 2019
|
| | | | |
| | Shares | Value |
| COMMON STOCKS — 97.3% | | |
| Aerospace and Defense — 2.6% | | |
| Boeing Co. (The) | 101 | $ | 32,902 |
|
| Lockheed Martin Corp. | 289 | 112,531 |
|
| | | 145,433 |
|
| Airlines — 0.6% | | |
| Delta Air Lines, Inc. | 592 | 34,620 |
|
| Auto Components — 0.3% | | |
| Aptiv plc | 207 | 19,659 |
|
| Biotechnology — 1.7% | | |
Biogen, Inc.(1) | 111 | 32,937 |
|
Vertex Pharmaceuticals, Inc.(1) | 286 | 62,620 |
|
| | | 95,557 |
|
| Capital Markets — 1.2% | | |
| Charles Schwab Corp. (The) | 1,408 | 66,964 |
|
| Chemicals — 1.4% | | |
| Dow, Inc. | 1,426 | 78,045 |
|
| Consumer Finance — 0.6% | | |
| American Express Co. | 256 | 31,869 |
|
| Electrical Equipment — 0.4% | | |
| Rockwell Automation, Inc. | 112 | 22,699 |
|
| Electronic Equipment, Instruments and Components — 1.1% | | |
| CDW Corp. | 442 | 63,135 |
|
| Entertainment — 2.5% | | |
Liberty Media Corp.-Liberty Formula One, Class C(1) | 397 | 18,248 |
|
Take-Two Interactive Software, Inc.(1) | 303 | 37,097 |
|
| Walt Disney Co. (The) | 594 | 85,910 |
|
| | | 141,255 |
|
| Equity Real Estate Investment Trusts (REITs) — 3.0% | | |
| Equity Residential | 635 | 51,384 |
|
| SBA Communications Corp. | 483 | 116,398 |
|
| | | 167,782 |
|
| Food and Staples Retailing — 0.9% | | |
| Walmart, Inc. | 403 | 47,893 |
|
| Food Products — 1.0% | | |
Beyond Meat, Inc.(1)(2) | 123 | 9,299 |
|
| Mondelez International, Inc., Class A | 843 | 46,432 |
|
| | | 55,731 |
|
| Health Care Equipment and Supplies — 4.5% | | |
| Baxter International, Inc. | 1,130 | 94,491 |
|
Boston Scientific Corp.(1) | 1,582 | 71,538 |
|
Edwards Lifesciences Corp.(1) | 149 | 34,760 |
|
IDEXX Laboratories, Inc.(1) | 36 | 9,401 |
|
|
| | | | |
| | Shares | Value |
Intuitive Surgical, Inc.(1) | 68 | $ | 40,198 |
|
| | | 250,388 |
|
| Health Care Providers and Services — 2.9% | | |
| Quest Diagnostics, Inc. | 151 | 16,125 |
|
| UnitedHealth Group, Inc. | 498 | 146,402 |
|
| | | 162,527 |
|
| Hotels, Restaurants and Leisure — 4.5% | | |
Chipotle Mexican Grill, Inc.(1) | 38 | 31,810 |
|
| Darden Restaurants, Inc. | 428 | 46,656 |
|
| Domino's Pizza, Inc. | 187 | 54,937 |
|
| Las Vegas Sands Corp. | 547 | 37,765 |
|
| Royal Caribbean Cruises Ltd. | 595 | 79,439 |
|
| | | 250,607 |
|
| Household Products — 1.4% | | |
| Church & Dwight Co., Inc. | 283 | 19,906 |
|
| Procter & Gamble Co. (The) | 456 | 56,955 |
|
| | | 76,861 |
|
| Insurance — 0.6% | | |
| Progressive Corp. (The) | 458 | 33,155 |
|
| Interactive Media and Services — 11.6% | | |
Alphabet, Inc., Class A(1) | 331 | 443,338 |
|
Facebook, Inc., Class A(1) | 865 | 177,541 |
|
Twitter, Inc.(1) | 783 | 25,095 |
|
| | | 645,974 |
|
| Internet and Direct Marketing Retail — 5.9% | | |
Amazon.com, Inc.(1) | 179 | 330,763 |
|
| IT Services — 8.5% | | |
Fastly, Inc., Class A(1)(2) | 502 | 10,075 |
|
PayPal Holdings, Inc.(1) | 1,378 | 149,058 |
|
VeriSign, Inc.(1) | 131 | 25,241 |
|
| Visa, Inc., Class A | 1,533 | 288,051 |
|
| | | 472,425 |
|
| Life Sciences Tools and Services — 0.8% | | |
| Agilent Technologies, Inc. | 155 | 13,223 |
|
Illumina, Inc.(1) | 97 | 32,179 |
|
| | | 45,402 |
|
| Machinery — 1.6% | | |
| Cummins, Inc. | 490 | 87,690 |
|
| Multiline Retail — 0.6% | | |
| Target Corp. | 261 | 33,463 |
|
| Personal Products — 0.7% | | |
| Estee Lauder Cos., Inc. (The), Class A | 177 | 36,558 |
|
| Pharmaceuticals — 4.0% | | |
| Merck & Co., Inc. | 1,322 | 120,236 |
|
| Novo Nordisk A/S, B Shares | 1,246 | 72,268 |
|
| Zoetis, Inc. | 229 | 30,308 |
|
| | | 222,812 |
|
|
| | | | |
| | Shares | Value |
| Road and Rail — 2.8% | | |
Lyft, Inc., Class A(1) | 427 | $ | 18,370 |
|
| Union Pacific Corp. | 780 | 141,016 |
|
| | | 159,386 |
|
| Semiconductors and Semiconductor Equipment — 6.6% | | |
| Analog Devices, Inc. | 446 | 53,003 |
|
| Applied Materials, Inc. | 833 | 50,846 |
|
| ASML Holding NV | 259 | 77,133 |
|
| Broadcom, Inc. | 369 | 116,611 |
|
| NVIDIA Corp. | 311 | 73,178 |
|
| | | 370,771 |
|
| Software — 12.4% | | |
Datadog, Inc., Class A(1)(2) | 258 | 9,747 |
|
| Microsoft Corp. | 3,313 | 522,460 |
|
PagerDuty, Inc.(1)(2) | 788 | 18,431 |
|
Palo Alto Networks, Inc.(1) | 52 | 12,025 |
|
salesforce.com, Inc.(1) | 504 | 81,971 |
|
Zendesk, Inc.(1) | 532 | 40,767 |
|
Zoom Video Communications, Inc., Class A(1)(2) | 101 | 6,872 |
|
| | | 692,273 |
|
| Specialty Retail — 1.8% | | |
| TJX Cos., Inc. (The) | 1,635 | 99,833 |
|
| Technology Hardware, Storage and Peripherals — 6.6% | | |
| Apple, Inc. | 1,251 | 367,356 |
|
| Textiles, Apparel and Luxury Goods — 2.2% | | |
| NIKE, Inc., Class B | 1,225 | 124,105 |
|
TOTAL COMMON STOCKS
(Cost $3,116,208) | | 5,432,991 |
|
| EXCHANGE-TRADED FUNDS — 2.4% | | |
iShares Russell 1000 Growth ETF
(Cost $119,841) | 770 | 135,459 |
|
| TEMPORARY CASH INVESTMENTS — 0.2% | | |
| Repurchase Agreement, BMO Capital Markets Corp., (collateralized by various U.S. Treasury obligations, 2.75% - 3.75%, 9/15/21 - 11/15/43, valued at $11,865), in a joint trading account at 1.35%, dated 12/31/19, due 1/2/20 (Delivery value $11,615) | | 11,614 |
|
| State Street Institutional U.S. Government Money Market Fund, Premier Class | 2,592 | 2,592 |
|
TOTAL TEMPORARY CASH INVESTMENTS
(Cost $14,206) | | 14,206 |
|
TEMPORARY CASH INVESTMENTS - SECURITIES LENDING COLLATERAL(3) — 0.7% |
State Street Navigator Securities Lending Government Money Market Portfolio
(Cost $38,705) | 38,705 | 38,705 |
|
TOTAL INVESTMENT SECURITIES — 100.6%
(Cost $3,288,960) | | 5,621,361 |
|
| OTHER ASSETS AND LIABILITIES — (0.6)% | | (33,461 | ) |
| TOTAL NET ASSETS — 100.0% | | $ | 5,587,900 |
|
|
| | | | | | | | | | |
| FORWARD FOREIGN CURRENCY EXCHANGE CONTRACTS | | |
| Currency Purchased | Currency Sold | Counterparty | Settlement Date | Unrealized Appreciation
(Depreciation) |
| USD | 64,222 |
| EUR | 57,206 |
| Credit Suisse AG | 3/31/20 | $ | (301 | ) |
| USD | 1,608 |
| EUR | 1,442 |
| Credit Suisse AG | 3/31/20 | (18 | ) |
| | | | | | | $ | (319 | ) |
|
| | |
| NOTES TO SCHEDULE OF INVESTMENTS |
| EUR | - | Euro |
| USD | - | United States Dollar |
| |
| (2) | Security, or a portion thereof, is on loan. At the period end, the aggregate value of securities on loan was $54,425. The amount of securities on loan indicated may not correspond with the securities on loan identified because securities with pending sales are in the process of recall from the brokers. |
| |
| (3) | Investment of cash collateral from securities on loan. At the period end, the aggregate market value of the collateral held by the fund was $55,528, which includes securities collateral of $16,823. |
See Notes to Financial Statements.
|
|
| Statement of Assets and Liabilities |
|
| | | |
| DECEMBER 31, 2019 | |
| Assets |
| Investment securities, at value (cost of $3,250,255) — including $54,425 of securities on loan | $ | 5,582,656 |
|
Investment made with cash collateral received for securities on loan, at value
(cost of $38,705) | 38,705 |
|
| Total investment securities, at value (cost of $3,288,960) | 5,621,361 |
|
| Receivable for investments sold | 7,059 |
|
| Dividends and interest receivable | 3,187 |
|
| Securities lending receivable | 33 |
|
| | 5,631,640 |
|
| | |
| Liabilities | |
| Payable for collateral received for securities on loan | 38,705 |
|
| Payable for capital shares redeemed | 218 |
|
| Unrealized depreciation on forward foreign currency exchange contracts | 319 |
|
| Accrued management fees | 3,316 |
|
| Distribution fees payable | 1,182 |
|
| | 43,740 |
|
| | |
| Net Assets | $ | 5,587,900 |
|
| | |
| Net Assets Consist of: | |
| Capital (par value and paid-in surplus) | $ | 2,904,672 |
|
| Distributable earnings | 2,683,228 |
|
| | $ | 5,587,900 |
|
|
| | | | | | |
| | Net Assets | Shares Outstanding | Net Asset Value Per Share |
| Class I, $0.01 Par Value |
| $8,032 |
| 471 |
| $17.05 |
| Class II, $0.01 Par Value |
| $5,579,868 |
| 327,853 |
| $17.02 |
See Notes to Financial Statements.
|
| | | |
| YEAR ENDED DECEMBER 31, 2019 |
| Investment Income (Loss) |
| Income: | |
| Dividends (net of foreign taxes withheld of $581) | $ | 61,048 |
|
| Securities lending, net | 2,697 |
|
| Interest | 858 |
|
| | 64,603 |
|
| | |
| Expenses: | |
| Management fees | 46,951 |
|
| Distribution fees - Class II | 13,022 |
|
| Directors' fees and expenses | 165 |
|
| | 60,138 |
|
Fees waived(1) | (9,838 | ) |
| | 50,300 |
|
| | |
| Net investment income (loss) | 14,303 |
|
| | |
| Realized and Unrealized Gain (Loss) | |
| Net realized gain (loss) on: | |
| Investment transactions | 370,682 |
|
| Forward foreign currency exchange contract transactions | 3,210 |
|
| Foreign currency translation transactions | (10 | ) |
| | 373,882 |
|
| | |
| Change in net unrealized appreciation (depreciation) on: | |
| Investments | 1,186,748 |
|
| Forward foreign currency exchange contracts | (173 | ) |
| Translation of assets and liabilities in foreign currencies | 2 |
|
| | 1,186,577 |
|
| | |
| Net realized and unrealized gain (loss) | 1,560,459 |
|
| | |
| Net Increase (Decrease) in Net Assets Resulting from Operations | $ | 1,574,762 |
|
| |
| (1) | Amount consists of $13 and $9,825 for Class I and Class II, respectively. |
See Notes to Financial Statements.
|
|
| Statement of Changes in Net Assets |
|
| | | | | | |
| YEARS ENDED DECEMBER 31, 2019 AND DECEMBER 31, 2018 |
| Increase (Decrease) in Net Assets | December 31, 2019 | December 31, 2018 |
| Operations |
| Net investment income (loss) | $ | 14,303 |
| $ | 6,981 |
|
| Net realized gain (loss) | 373,882 |
| 605,430 |
|
| Change in net unrealized appreciation (depreciation) | 1,186,577 |
| (616,481 | ) |
| Net increase (decrease) in net assets resulting from operations | 1,574,762 |
| (4,070 | ) |
| | | |
| Distributions to Shareholders |
| From earnings: | | |
| Class I | (834 | ) | (3,395 | ) |
| Class II | (621,750 | ) | (107,667 | ) |
| Decrease in net assets from distributions | (622,584 | ) | (111,062 | ) |
| | | |
| Capital Share Transactions |
| Net increase (decrease) in net assets from capital share transactions (Note 5) | (57,842 | ) | (704,569 | ) |
| | | |
| Net increase (decrease) in net assets | 894,336 |
| (819,701 | ) |
| | | |
| Net Assets |
| Beginning of period | 4,693,564 |
| 5,513,265 |
|
| End of period | $ | 5,587,900 |
| $ | 4,693,564 |
|
See Notes to Financial Statements.
|
|
| Notes to Financial Statements |
DECEMBER 31, 2019
1. Organization
American Century Variable Portfolios, Inc. (the corporation) is registered under the Investment Company Act of 1940, as amended (the 1940 Act), as an open-end management investment company and is organized as a Maryland corporation. VP Growth Fund (the fund) is one fund in a series issued by the corporation. The fund’s investment objective is to seek long-term capital growth. The fund offers Class I and Class II.
2. Significant Accounting Policies
The following is a summary of significant accounting policies consistently followed by the fund in preparation of its financial statements. The fund is an investment company and follows accounting and reporting guidance in accordance with accounting principles generally accepted in the United States of America. This may require management to make certain estimates and assumptions at the date of the financial statements. Actual results could differ from these estimates. Management evaluated the impact of events or transactions occurring through the date the financial statements were issued that would merit recognition or disclosure.
Investment Valuations — The fund determines the fair value of its investments and computes its net asset value per share at the close of regular trading (usually 4 p.m. Eastern time) on the New York Stock Exchange (NYSE) on each day the NYSE is open. The Board of Directors has adopted valuation policies and procedures to guide the investment advisor in the fund’s investment valuation process and to provide methodologies for the oversight of the fund’s pricing function.
Equity securities that are listed or traded on a domestic securities exchange are valued at the last reported sales price or at the official closing price as provided by the exchange. Equity securities traded on foreign securities exchanges are generally valued at the closing price of such securities on the exchange where primarily traded or at the close of the NYSE, if that is earlier. If no last sales price is reported, or if local convention or regulation so provides, the mean of the latest bid and asked prices may be used. Securities traded over-the-counter are valued at the mean of the latest bid and asked prices, the last sales price, or the official closing price. Equity securities initially expressed in local currencies are translated into U.S. dollars at the mean of the appropriate currency exchange rate at the close of the NYSE as provided by an independent pricing service.
Open-end management investment companies are valued at the reported net asset value per share. Repurchase agreements are valued at cost, which approximates fair value. Forward foreign currency exchange contracts are valued at the mean of the appropriate forward exchange rate at the close of the NYSE as provided by an independent pricing service.
If the fund determines that the market price for an investment is not readily available or the valuation methods mentioned above do not reflect an investment’s fair value, such investment is valued as determined in good faith by the Board of Directors or its delegate, in accordance with policies and procedures adopted by the Board of Directors. In its determination of fair value, the fund may review several factors including, but not limited to, market information regarding the specific investment or comparable investments and correlation with other investment types, futures indices or general market indicators. Circumstances that may cause the fund to use these procedures to value an investment include, but are not limited to: an investment has been declared in default or is distressed; trading in a security has been suspended during the trading day or a security is not actively trading on its principal exchange; prices received from a regular pricing source are deemed unreliable; or there is a foreign market holiday and no trading occurred.
The fund monitors for significant events occurring after the close of an investment’s primary exchange but before the fund’s net asset value per share is determined. Significant events may include, but are not limited to: corporate announcements and transactions; governmental action and political unrest that could impact a specific investment or an investment sector; or armed conflicts, natural disasters and similar events that could affect investments in a specific country or region. The fund also monitors for significant fluctuations between domestic and foreign markets, as evidenced by the U.S. market or such other indicators that the Board of Directors, or its delegate, deems appropriate. The fund may apply a model-derived factor to the closing price of equity securities traded on foreign securities exchanges. The factor is based on observable market data as provided by an independent pricing service.
Security Transactions — Security transactions are accounted for as of the trade date. Net realized gains and losses are determined on the identified cost basis, which is also used for federal income tax purposes.
Investment Income — Dividend income less foreign taxes withheld, if any, is recorded as of the ex-dividend date. Distributions received on securities that represent a return of capital or long-term capital gain are recorded as a reduction of cost of investments and/or as a realized gain. The fund may estimate the components of distributions received that may be considered nontaxable distributions or long-term capital gain distributions for income tax purposes. Interest income is recorded on the accrual basis and includes accretion of discounts and amortization of premiums. Securities lending income is net of fees and rebates earned by the lending agent for its services.
Foreign Currency Translations — All assets and liabilities initially expressed in foreign currencies are translated into U.S. dollars at prevailing exchange rates at period end. The fund may enter into spot foreign currency exchange contracts to facilitate transactions denominated in a foreign currency. Purchases and sales of investment securities, dividend and interest income, spot foreign currency exchange contracts, and expenses are translated at the rates of exchange prevailing on the respective dates of such transactions. Net realized and unrealized foreign currency exchange gains or losses related to investment securities are a component of net realized gain (loss) on investment transactions and change in net unrealized appreciation (depreciation) on investments, respectively.
Repurchase Agreements — The fund may enter into repurchase agreements with institutions that American Century Investment Management, Inc. (ACIM) (the investment advisor) has determined are creditworthy pursuant to criteria adopted by the Board of Directors. The fund requires that the collateral, represented by securities, received in a repurchase transaction be transferred to the custodian in a manner sufficient to enable the fund to obtain those securities in the event of a default under the repurchase agreement. ACIM monitors, on a daily basis, the securities transferred to ensure the value, including accrued interest, of the securities under each repurchase agreement is equal to or greater than amounts owed to the fund under each repurchase agreement.
Joint Trading Account — Pursuant to an Exemptive Order issued by the Securities and Exchange Commission, the fund, along with certain other funds in the American Century Investments family of funds, may transfer uninvested cash balances into a joint trading account. These balances are invested in one or more repurchase agreements that are collateralized by U.S. Treasury or Agency obligations.
Segregated Assets — In accordance with the 1940 Act, the fund segregates assets on its books and records to cover certain types of investment securities and other financial instruments. ACIM monitors, on a daily basis, the securities segregated to ensure the fund designates a sufficient amount of liquid assets, marked-to-market daily. The fund may also receive assets or be required to pledge assets at the custodian bank or with a broker for collateral requirements.
Income Tax Status — It is the fund’s policy to distribute substantially all net investment income and net realized gains to shareholders and to otherwise qualify as a regulated investment company under provisions of the Internal Revenue Code. Accordingly, no provision has been made for income taxes. The fund files U.S. federal, state, local and non-U.S. tax returns as applicable. The fund's tax returns are subject to examination by the relevant taxing authority until expiration of the applicable statute of limitations, which is generally three years from the date of filing but can be longer in certain jurisdictions. At this time, management believes there are no uncertain tax positions which, based on their technical merit, would not be sustained upon examination and for which it is reasonably possible that the total amounts of unrecognized tax benefits will significantly change in the next twelve months.
Multiple Class — All shares of the fund represent an equal pro rata interest in the net assets of the class to which such shares belong, and have identical voting, dividend, liquidation and other rights and the same terms and conditions, except for class specific expenses and exclusive rights to vote on matters affecting only individual classes. Income, non-class specific expenses, and realized and unrealized capital gains and losses of the fund are allocated to each class of shares based on their relative net assets.
Distributions to Shareholders — Distributions from net investment income and net realized gains, if any, are generally declared and paid annually.
Indemnifications — Under the corporation’s organizational documents, its officers and directors are indemnified against certain liabilities arising out of the performance of their duties to the fund. In addition, in the normal course of business, the fund enters into contracts that provide general indemnifications. The maximum exposure under these arrangements is unknown as this would involve future claims that may be made against a fund. The risk of material loss from such claims is considered by management to be remote.
Securities Lending — Securities are lent to qualified financial institutions and brokers. State Street Bank & Trust Co. serves as securities lending agent to the fund pursuant to a Securities Lending Agreement. The lending of securities exposes the fund to risks such as: the borrowers may fail to return the loaned securities, the borrowers may not be able to provide additional collateral, the fund may experience delays in recovery of the loaned securities or delays in access to collateral, or the fund may experience losses related to the investment collateral. To minimize certain risks, loan counterparties pledge collateral in the form of cash and/or securities. The lending agent has agreed to indemnify the fund in the case of default of any securities borrowed. Cash collateral received is invested in the State Street Navigator Securities Lending Government Money Market Portfolio, a money market mutual fund registered under the 1940 Act. The loans may also be secured by U.S. government securities in an amount at least equal to the market value of the securities loaned, plus accrued interest and dividends, determined on a daily basis and adjusted accordingly. By lending securities, the fund seeks to increase its net investment income through the receipt of interest and fees. Such income is reflected separately within the Statement of Operations. The value of loaned securities and related collateral outstanding at period end, if any, are shown on a gross basis within the Schedule of Investments and Statement of Assets and Liabilities.
The following table reflects a breakdown of transactions accounted for as secured borrowings, the gross obligation by the type of collateral pledged, and the remaining contractual maturity of those transactions as of December 31, 2019.
|
| | | | | | | | | | | | |
| Remaining Contractual Maturity of Agreements |
| | Overnight and
Continuous | <30 days | Between
30 & 90 days | >90 days | Total |
Securities Lending Transactions(1) |
| Common Stocks | $ | 38,705 |
| — |
| — |
| — |
| $ | 38,705 |
|
| Gross amount of recognized liabilities for securities lending transactions | $ | 38,705 |
|
| |
| (1) | Amount represents the payable for cash collateral received for securities on loan. This will generally be in the Overnight and Continuous column as the securities are typically callable on demand. |
3. Fees and Transactions with Related Parties
Certain officers and directors of the corporation are also officers and/or directors of American Century Companies, Inc. (ACC). The corporation’s investment advisor, ACIM, the corporation's distributor, American Century Investment Services, Inc. (ACIS), and the corporation’s transfer agent, American Century Services, LLC, are wholly owned, directly or indirectly, by ACC.
Management Fees — The corporation has entered into a management agreement with ACIM, under which ACIM provides the fund with investment advisory and management services in exchange for a single, unified management fee (the fee) per class. The agreement provides that all expenses of managing and operating the fund, except distribution fees, brokerage expenses, taxes, interest, fees and expenses of the independent directors (including legal counsel fees), and extraordinary expenses, will be paid by ACIM. The fee is computed and accrued daily based on each class's daily net assets and paid monthly in arrears. The difference in the fee among the classes is a result of their separate arrangements for non-Rule 12b-1 shareholder services. It is not the result of any difference in advisory or custodial fees or other expenses related to the management of the fund’s assets, which do not vary by class. From January 1, 2019 through July 31, 2019, the investment advisor agreed to waive 0.18% of the fund's management fee. Effective August 1, 2019, the investment advisor agreed to waive 0.20% of the fund's management fee. The investment advisor expects this waiver to continue until July 31, 2020 and cannot terminate it prior to such date without the approval of the Board of Directors.
The annual management fee and the effective annual management fee after waiver for each class for the period ended December 31, 2019 are as follows:
|
| | |
| | Annual Management Fee | Effective Annual Management Fee After Waiver |
| Class I | 1.00% | 0.81% |
| Class II | 0.90% | 0.71% |
Distribution Fees — The Board of Directors has adopted the Master Distribution Plan (the plan) for Class II, pursuant to Rule 12b-1 of the 1940 Act. The plan provides that Class II will pay ACIS an annual distribution fee equal to 0.25%. The fee is computed and accrued daily based on the Class II daily net assets and paid monthly in arrears. The distribution fee provides compensation for expenses incurred in connection with distributing shares of Class II including, but not limited to, payments to brokers, dealers, and financial institutions that have entered into sales agreements with respect to shares of the fund. Fees incurred under the plan during the period ended December 31, 2019 are detailed in the Statement of Operations.
Directors' Fees and Expenses — The Board of Directors is responsible for overseeing the investment advisor’s management and operations of the fund. The directors receive detailed information about the fund and its investment advisor regularly throughout the year, and meet at least quarterly with management of the investment advisor to review reports about fund operations. The fund’s officers do not receive compensation from the fund.
Interfund Transactions — The fund may enter into security transactions with other American Century Investments funds and other client accounts of the investment advisor, in accordance with the 1940 Act rules and procedures adopted by the Board of Directors. The rules and procedures require, among other things, that these transactions be effected at the independent current market price of the security. During the period, the interfund purchases and sales were $188,763 and $193,166, respectively. The effect of interfund transactions on the Statement of Operations was $(429) in net realized gain (loss) on investment transactions.
4. Investment Transactions
Purchases and sales of investment securities, excluding short-term investments, for the period ended December 31, 2019 were $2,661,541 and $3,284,878, respectively.
5. Capital Share Transactions
Transactions in shares of the fund were as follows:
|
| | | | | | | | | | |
| | Year ended December 31, 2019 | Year ended December 31, 2018 |
| | Shares | Amount | Shares | Amount |
| Class I/Shares Authorized | 50,000,000 |
| | 50,000,000 |
| |
| Issued in reinvestment of distributions | 58 |
| $ | 834 |
| 230 |
| $ | 3,395 |
|
| Redeemed | — |
| — |
| (9,888 | ) | (154,091 | ) |
| | 58 |
| 834 |
| (9,658 | ) | (150,696 | ) |
| Class II/Shares Authorized | 50,000,000 |
| | 50,000,000 |
| |
| Sold | 30,112 |
| 456,905 |
| 32,408 |
| 496,753 |
|
| Issued in reinvestment of distributions | 42,998 |
| 621,750 |
| 7,290 |
| 107,667 |
|
| Redeemed | (72,812 | ) | (1,137,331 | ) | (73,426 | ) | (1,158,293 | ) |
| | 298 |
| (58,676 | ) | (33,728 | ) | (553,873 | ) |
| Net increase (decrease) | 356 |
| $ | (57,842 | ) | (43,386 | ) | $ | (704,569 | ) |
6. Fair Value Measurements
The fund’s investments valuation process is based on several considerations and may use multiple inputs to determine the fair value of the investments held by the fund. In conformity with accounting principles generally accepted in the United States of America, the inputs used to determine a valuation are classified into three broad levels.
| |
| • | Level 1 valuation inputs consist of unadjusted quoted prices in an active market for identical investments. |
| |
| • | Level 2 valuation inputs consist of direct or indirect observable market data (including quoted prices for comparable investments, evaluations of subsequent market events, interest rates, prepayment speeds, credit risk, etc.). These inputs also consist of quoted prices for identical investments initially expressed in local currencies that are adjusted through translation into U.S. dollars. |
| |
| • | Level 3 valuation inputs consist of unobservable data (including a fund’s own assumptions). |
The level classification is based on the lowest level input that is significant to the fair valuation measurement. The valuation inputs are not necessarily an indication of the risks associated with investing in these securities or other financial instruments.
The following is a summary of the level classifications as of period end. The Schedule of Investments provides additional information on the fund’s portfolio holdings.
|
| | | | | | | | |
| | Level 1 | Level 2 | Level 3 |
| Assets | | | |
| Investment Securities | | | |
| Common Stocks | $ | 5,283,590 |
| $ | 149,401 |
| — |
|
| Exchange-Traded Funds | 135,459 |
| — |
| — |
|
| Temporary Cash Investments | 2,592 |
| 11,614 |
| — |
|
| Temporary Cash Investments - Securities Lending Collateral | 38,705 |
| — |
| — |
|
| | $ | 5,460,346 |
| $ | 161,015 |
| — |
|
| | | | |
| Liabilities | | | |
| Other Financial Instruments | | | |
| Forward Foreign Currency Exchange Contracts | — |
| $ | 319 |
| — |
|
7. Derivative Instruments
Foreign Currency Risk — The fund is subject to foreign currency exchange rate risk in the normal course of pursuing its investment objectives. The value of foreign investments held by a fund may be significantly affected by changes in foreign currency exchange rates. The dollar value of a foreign security generally decreases when the value of the dollar rises against the foreign currency in which the security is denominated and tends to increase when the value of the dollar declines against such foreign currency. A fund may enter into forward foreign currency exchange contracts to reduce a fund's exposure to foreign currency exchange rate fluctuations. The net U.S. dollar value of foreign currency underlying all contractual commitments held by a fund and the resulting unrealized appreciation or depreciation are determined daily. Realized gain or loss is recorded upon the termination of the contract. Net realized and unrealized gains or losses occurring during the holding period of forward foreign currency exchange contracts are a component of net realized gain (loss) on forward foreign currency exchange contract transactions and change in net unrealized appreciation (depreciation) on forward foreign currency exchange contracts, respectively. A fund bears the risk of an unfavorable change in the foreign currency exchange rate underlying the forward contract. Additionally, losses, up to the fair value, may arise if the counterparties do not perform under the contract terms. The fund's average U.S. dollar exposure to foreign currency risk derivative instruments held during the period was $77,011.
The value of foreign currency risk derivative instruments as of December 31, 2019, is disclosed on the Statement of Assets and Liabilities as a liability of $319 in unrealized depreciation on forward foreign currency exchange contracts. For the year ended December 31, 2019, the effect of foreign currency risk derivative instruments on the Statement of Operations was $3,210 in net realized gain (loss) on forward foreign currency exchange contract transactions and $(173) in change in net unrealized appreciation (depreciation) on forward foreign currency exchange contracts.
8. Federal Tax Information
The tax character of distributions paid during the years ended December 31, 2019 and December 31, 2018 were as follows:
|
| | | | | | |
| | 2019 | 2018 |
| Distributions Paid From | | |
| Ordinary income | $ | 55,415 |
| $ | 20,747 |
|
| Long-term capital gains | $ | 567,169 |
| $ | 90,315 |
|
The book-basis character of distributions made during the year from net investment income or net realized gains may differ from their ultimate characterization for federal income tax purposes. These differences reflect the differing character of certain income items and net realized gains and losses for financial statement and tax purposes, and may result in reclassification among certain capital accounts on the financial statements.
As of period end, the federal tax cost of investments and the components of distributable earnings on a tax-basis were as follows:
|
| | | |
| Federal tax cost of investments | $ | 3,316,645 |
|
| Gross tax appreciation of investments | $ | 2,327,600 |
|
| Gross tax depreciation of investments | (22,884 | ) |
| Net tax appreciation (depreciation) of investments | $ | 2,304,716 |
|
| Undistributed ordinary income | $ | 36,580 |
|
Accumulated long-term gains
| $ | 341,932 |
|
The difference between book-basis and tax-basis unrealized appreciation (depreciation) is attributable primarily to the tax deferral of losses on wash sales.
|
| | | | | | | | | | | | | | | | | |
| For a Share Outstanding Throughout the Years Ended December 31 (except as noted) | | | |
| Per-Share Data | | | Ratios and Supplemental Data |
| | | Income From Investment Operations: | Distributions From: | | | Ratio to Average Net Assets of: | | |
| | Net Asset
Value,
Beginning
of Period | Net
Investment
Income
(Loss)(1) | Net
Realized
and
Unrealized
Gain (Loss) | Total From
Investment
Operations | Net
Investment
Income | Net
Realized
Gains | Total
Distributions | Net Asset
Value,
End
of Period | Total
Return(2) | Operating
Expenses | Operating
Expenses
(before
expense
waiver) | Net
Investment
Income
(Loss) | Net
Investment
Income
(Loss)
(before
expense
waiver) | Portfolio
Turnover
Rate | Net
Assets,
End of
Period
(in thousands) |
| Class I |
| 2019 | $14.34 | 0.07 | 4.66 | 4.73 | (0.06) | (1.96) | (2.02) | $17.05 | 35.48% | 0.81% | 1.00% | 0.43% | 0.24% | 52% |
| $8 |
|
| 2018 | $14.87 | 0.05 | (0.24) | (0.19) | (0.04) | (0.30) | (0.34) | $14.34 | (1.36)% | 0.82% | 1.00% | 0.28% | 0.10% | 63% |
| $6 |
|
| 2017 | $13.27 | 0.05 | 3.84 | 3.89 | (0.12) | (2.17) | (2.29) | $14.87 | 30.38% | 0.84% | 1.01% | 0.35% | 0.18% | 60% |
| $150 |
|
| 2016 | $12.76 | 0.09 | 0.46 | 0.55 | — | (0.04) | (0.04) | $13.27 | 4.35% | 0.85% | 1.01% | 0.76% | 0.60% | 69% |
| $191 |
|
| 2015 | $13.00 | 0.05 | 0.56 | 0.61 | (0.06) | (0.79) | (0.85) | $12.76 | 4.71% | 0.85% | 1.00% | 0.44% | 0.29% | 69% |
| $183 |
|
| Class II |
| 2019 | $14.31 | 0.04 | 4.67 | 4.71 | (0.04) | (1.96) | (2.00) | $17.02 | 35.33% | 0.96% | 1.15% | 0.28% | 0.09% | 52% |
| $5,580 |
|
| 2018 | $14.85 | 0.02 | (0.24) | (0.22) | (0.02) | (0.30) | (0.32) | $14.31 | (1.59)% | 0.97% | 1.15% | 0.13% | (0.05)% | 63% |
| $4,688 |
|
| 2017 | $13.25 | 0.03 | 3.84 | 3.87 | (0.10) | (2.17) | (2.27) | $14.85 | 30.22% | 0.99% | 1.16% | 0.20% | 0.03% | 60% |
| $5,363 |
|
| 2016 | $12.76 | 0.08 | 0.45 | 0.53 | — | (0.04) | (0.04) | $13.25 | 4.20% | 1.00% | 1.16% | 0.61% | 0.45% | 69% |
| $5,018 |
|
| 2015 | $13.00 | 0.04 | 0.55 | 0.59 | (0.04) | (0.79) | (0.83) | $12.76 | 4.55% | 1.00% | 1.15% | 0.29% | 0.14% | 69% |
| $5,276 |
|
|
| | | | |
| Notes to Financial Highlights | | |
| |
| (1) | Computed using average shares outstanding throughout the period. |
| |
| (2) | Total returns are calculated based on the net asset value of the last business day. Total returns for periods less than one year are not annualized. The total returns presented do not include the fees and charges assessed with investments in variable insurance products, those charges are disclosed in the separate account prospectus. The inclusion of such fees and charges would lower total return. |
See Notes to Financial Statements.
|
|
| Report of Independent Registered Public Accounting Firm |
To the Shareholders and the Board of Directors of American Century Variable Portfolios, Inc.:
Opinion on the Financial Statements and Financial Highlights
We have audited the accompanying statement of assets and liabilities, including the schedule of investments, of VP Growth Fund, one of the funds constituting the American Century Variable Portfolios, Inc. (the "Fund"), as of December 31, 2019, the related statement of operations for the year then ended, the statements of changes in net assets for each of the two years in the period then ended, the financial highlights for each of the five years in the period then ended, and the related notes. In our opinion, the financial statements and financial highlights present fairly, in all material respects, the financial position of VP Growth Fund of the American Century Variable Portfolios, Inc. as of December 31, 2019, the results of its operations for the year then ended, the changes in its net assets for each of the two years in the period then ended, and the financial highlights for each of the five years in the period then ended, in conformity with accounting principles generally accepted in the United States of America.
Basis for Opinion
These financial statements and financial highlights are the responsibility of the Fund's management. Our responsibility is to express an opinion on the Fund’s financial statements and financial highlights based on our audits. We are a public accounting firm registered with the Public Company Accounting Oversight Board (United States) (PCAOB) and are required to be independent with respect to the Fund in accordance with the U.S. federal securities laws and the applicable rules and regulations of the Securities and Exchange Commission and the PCAOB.
We conducted our audits in accordance with the standards of the PCAOB. Those standards require that we plan and perform the audit to obtain reasonable assurance about whether the financial statements and financial highlights are free of material misstatement, whether due to error or fraud. The Fund is not required to have, nor were we engaged to perform, an audit of its internal control over financial reporting. As part of our audits we are required to obtain an understanding of internal control over financial reporting but not for the purpose of expressing an opinion on the effectiveness of the Fund’s internal control over financial reporting. Accordingly, we express no such opinion.
Our audits included performing procedures to assess the risks of material misstatement of the financial statements and financial highlights, whether due to error or fraud, and performing procedures that respond to those risks. Such procedures included examining, on a test basis, evidence regarding the amounts and disclosures in the financial statements and financial highlights. Our audits also included evaluating the accounting principles used and significant estimates made by management, as well as evaluating the overall presentation of the financial statements and financial highlights. Our procedures included confirmation of securities owned as of December 31, 2019, by correspondence with the custodian and brokers. We believe that our audits provide a reasonable basis for our opinion.
DELOITTE & TOUCHE LLP
Kansas City, Missouri
February 13, 2020
We have served as the auditor of one or more American Century investment companies since 1997.
The Board of Directors
The individuals listed below serve as directors of the funds. Each director will continue to serve in this capacity until death, retirement, resignation or removal from office. The board has adopted a mandatory retirement age for directors who are not “interested persons,” as that term is defined in the Investment Company Act (independent directors). Independent directors shall retire by December 31 of the year in which they reach their 75th birthday.
Mr. Thomas is an “interested person” because he currently serves as President and Chief Executive Officer of American Century Companies, Inc. (ACC), the parent company of American Century Investment Management, Inc. (ACIM or the advisor). The other directors (more than three-fourths of the total number) are independent. They are not employees, directors or officers of, and have no financial interest in, ACC or any of its wholly owned, direct or indirect, subsidiaries, including ACIM, American Century Investment Services, Inc. (ACIS) and American Century Services, LLC (ACS), and they do not have any other affiliations, positions or relationships that would cause them to be considered “interested persons” under the Investment Company Act. The directors serve in this capacity for seven (in the case of Jonathan S. Thomas, 16; and Stephen E. Yates, 8) registered investment companies in the American Century Investments family of funds.
The following table presents additional information about the directors. The mailing address for each director is 4500 Main Street, Kansas City, Missouri 64111.
|
| | | | | |
Name
(Year of Birth) | Position(s) Held with Funds | Length of Time Served | Principal Occupation(s) During Past 5 Years | Number of American Century Portfolios Overseen by Director | Other Directorships Held During Past 5 Years |
| Independent Directors |
|
|
| Thomas W. Bunn (1953) | Director | Since 2017 | Retired | 64 | SquareTwo Financial; Barings (formerly Babson Capital Funds Trust) (2013 to 2016) |
Chris H. Cheesman
(1962)
| Director | Since 2019
| Retired. Senior Vice President & Chief Audit Executive, AllianceBernstein (1999 to 2018)
| 64 | None |
Barry Fink
(1955) | Director | Since 2012 (independent since 2016) | Retired | 64 | None |
Rajesh K. Gupta
(1960)
| Director | Since 2019
| Partner Emeritus, SeaCrest Investment Management and SeaCrest Wealth Management (2019 to Present); Chief Executive Officer and Chief Investment Officer, SeaCrest Investment Management (2006 to 2019); Chief Executive Officer and Chief Investment Officer, SeaCrest Wealth Management (2008 to 2019)
| 64 | None |
|
| | | | | |
Name
(Year of Birth) | Position(s) Held with Funds | Length of Time Served | Principal Occupation(s) During Past 5 Years | Number of American Century Portfolios Overseen by Director | Other Directorships Held During Past 5 Years |
| Independent Directors |
|
|
Lynn Jenkins
(1963)
| Director | Since 2019
| Consultant, LJ Strategies (2019 to present); United States Representative, U.S. House of Representatives (2009 to 2018) | 64 | MGP Ingredients, Inc. |
Jan M. Lewis
(1957) | Director | Since 2011 | Retired | 64 | None |
John R. Whitten
(1946) | Director | Since 2008 | Retired | 64 | Onto Innovation Inc.; Rudolph Technologies, Inc. (2006 to 2019) |
Stephen E. Yates
(1948) | Director and Chairman of the Board | Since 2012 (Chairman since 2018) | Retired | 79 | None |
| Interested Director |
|
Jonathan S. Thomas
(1963) | Director | Since 2007 | President and Chief Executive Officer, ACC (2007 to present). Also serves as Chief Executive Officer, ACS; Executive Vice President, ACIM; Director, ACC, ACIM and other ACC subsidiaries | 120 | None |
The Statement of Additional Information has additional information about the fund's directors and is available without charge, upon request, by calling 1-800-378-9878.
Officers
The following table presents certain information about the executive officers of the funds. Each officer serves as an officer for 16 (in the case of Robert J. Leach, 15) investment companies in the American Century family of funds. No officer is compensated for his or her service as an officer of the funds. The listed officers are interested persons of the funds and are appointed or re-appointed on an annual basis. The mailing address for each officer listed below is 4500 Main Street, Kansas City, Missouri 64111.
|
| | |
Name
(Year of Birth) | Offices with the Funds | Principal Occupation(s) During the Past Five Years |
Patrick Bannigan
(1965) | President since 2019 | Executive Vice President and Director, ACC (2012 to present); Chief Financial Officer, Chief Accounting Officer and Treasurer, ACC (2015 to present); Chief Operating Officer, ACC (2012-2015). Also serves as President, ACS; Vice President, ACIM; Chief Financial Officer, Chief Accounting Officer and/or Director, ACIM, ACS and other ACC subsidiaries |
R. Wes Campbell
(1974) | Chief Financial Officer and Treasurer since 2018 | Investment Operations and Investment Accounting, ACS (2000 to present) |
Amy D. Shelton
(1964) | Chief Compliance Officer and Vice President since 2014 | Chief Compliance Officer, American Century funds, (2014 to present); Chief Compliance Officer, ACIM (2014 to present); Chief Compliance Officer, ACIS (2009 to present). Also serves as Vice President, ACIS |
Charles A. Etherington
(1957) | General Counsel since 2007 and Senior Vice President since 2006 | Attorney, ACC (1994 to present); Vice President, ACC (2005 to present); General Counsel, ACC (2007 to present). Also serves as General Counsel, ACIM, ACS, ACIS and other ACC subsidiaries; and Senior Vice President, ACIM and ACS |
C. Jean Wade
(1964) | Vice President since 2012 | Senior Vice President, ACS (2017 to present); Vice President, ACS (2000 to 2017)
|
Robert J. Leach
(1966) | Vice President since 2006 | Vice President, ACS (2000 to present) |
David H. Reinmiller
(1963) | Vice President since 2000 | Attorney, ACC (1994 to present). Also serves as Vice President, ACIM and ACS |
Ward D. Stauffer
(1960) | Secretary since 2005 | Attorney, ACC (2003 to present) |
Proxy Voting Policies
A description of the policies that the fund's investment advisor uses in exercising the voting rights associated with the securities purchased and/or held by the fund is available without charge, upon request, by calling 1-800-378-9878. It is also available on American Century Investments’ website at americancentury.com/proxy and on the Securities and Exchange Commission’s website at sec.gov. Information regarding how the investment advisor voted proxies relating to portfolio securities during the most recent 12-month period ended June 30 is available on americancentury.com/proxy. It is also available at sec.gov.
Quarterly Portfolio Disclosure
The fund files its complete schedule of portfolio holdings with the Securities and Exchange Commission (SEC) for the first and third quarters of each fiscal year on Form N-Q or as an exhibit to its reports on Form N-PORT. The fund’s Forms N-Q and Form N-PORT reports are available on the SEC’s website at sec.gov. The fund also makes its complete schedule of portfolio holdings for the most recent quarter of its fiscal year available on its website at ipro.americancentury.com (for Investment Professionals) and, upon request, by calling 1-800-378-9878.
Other Tax Information
The following information is provided pursuant to provisions of the Internal Revenue Code.
For corporate taxpayers, the fund hereby designates $51,623, or up to the maximum amount
allowable, of ordinary income distributions paid during the fiscal year ended December 31, 2019 as
qualified for the corporate dividends received deduction.
The fund hereby designates $567,169, or up to the maximum amount allowable, as long-term
capital gain distributions (20% rate gain distributions) for the fiscal year ended December 31, 2019.
The fund hereby designates $43,818 as qualified short-term capital gain distributions for purposes of Internal Revenue Code Section 871 for the fiscal year ended December 31, 2019.
|
| | |
| |
| | | |
| Contact Us | americancentury.com | |
| Automated Information Line | 1-800-345-8765 | |
| Investment Professional Service Representatives | 1-800-345-6488 | |
| Telecommunications Relay Service for the Deaf | 711 | |
| | | |
| American Century Variable Portfolios, Inc. | |
| | | |
Investment Advisor: American Century Investment Management, Inc. Kansas City, Missouri | |
| | | |
| This report and the statements it contains are submitted for the general information of our shareholders. The report is not authorized for distribution to prospective investors unless preceded or accompanied by an effective prospectus. | |
| | | |
©2020 American Century Proprietary Holdings, Inc. All rights reserved.
CL-ANN-91447 2002 | |
|
| |
| | |
| | Annual Report |
| | |
| | December 31, 2019 |
| | |
| | VP Income & Growth Fund |
| | Class I (AVGIX) |
| | Class II (AVPGX) |
Beginning on January 1, 2021, as permitted by regulations adopted by the Securities and Exchange Commission, paper copies of the fund’s shareholder reports like this one will no longer be sent by mail from the insurance company that offers your contract, unless you specifically request paper copies of the reports from the insurance company or from your financial intermediary. Instead, the reports will be made available on a website, and you will be notified by mail each time a report is posted and provided with a website link to access the report.
If you already elected to receive shareholder reports electronically, you will not be affected by this change and you need not take any action. You may elect to receive shareholder reports and other communications from the insurance company or your financial intermediary electronically by contacting the insurance company.
You may elect to receive all future reports in paper free of charge. You can inform the insurance company or your financial intermediary that you wish to continue receiving paper copies of your shareholder reports by contacting the insurance company. Your election to receive reports in paper will apply to all variable portfolios available under your contract.
|
| |
| Performance | |
| Portfolio Commentary | |
| Fund Characteristics | |
| Shareholder Fee Example | |
| Schedule of Investments | |
| Statement of Assets and Liabilities | |
| Statement of Operations | |
| Statement of Changes in Net Assets | |
| Notes to Financial Statements | |
| Financial Highlights | |
| Report of Independent Registered Public Accounting Firm | |
| Management | |
| Additional Information | |
Any opinions expressed in this report reflect those of the author as of the date of the report, and do not necessarily represent the opinions of American Century Investments® or any other person in the American Century Investments organization. Any such opinions are subject to change at any time based upon market or other conditions and American Century Investments disclaims any responsibility to update such opinions. These opinions may not be relied upon as investment advice and, because investment decisions made by American Century Investments funds are based on numerous factors, may not be relied upon as an indication of trading intent on behalf of any American Century Investments fund. Security examples are used for representational purposes only and are not intended as recommendations to purchase or sell securities. Performance information for comparative indices and securities is provided to American Century Investments by third party vendors. To the best of American Century Investments’ knowledge, such information is accurate at the time of printing.
|
| | | | | |
| Total Returns as of December 31, 2019 |
| | | | Average Annual Returns | |
| | Ticker Symbol | 1 year | 5 years | 10 years | Inception Date |
| Class I | AVGIX | 23.95% | 8.29% | 11.88% | 10/30/97 |
| S&P 500 Index | — | 31.49% | 11.69% | 13.55% | — |
| Class II | AVPGX | 23.75% | 8.02% | 11.61% | 5/1/02 |
The performance information presented does not include the fees and charges assessed with investments in variable insurance products, those charges are disclosed in the separate account prospectus. The inclusion of such fees and charges would lower performance.
|
|
| Growth of $10,000 Over 10 Years |
| $10,000 investment made December 31, 2009 |
| Performance for other share classes will vary due to differences in fee structure. |
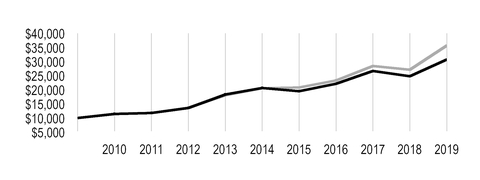
|
| |
| Value on December 31, 2019 |
| | Class I — $30,741 |
| |
| | S&P 500 Index — $35,666 |
| |
|
| |
| Total Annual Fund Operating Expenses |
| Class I | Class II |
| 0.70% | 0.95% |
The total annual fund operating expenses shown is as stated in the fund’s prospectus current as of the date of this report. The prospectus may vary from the expense ratio shown elsewhere in this report because it is based on a different time period, includes acquired fund fees and expenses, and, if applicable, does not include fee waivers or expense reimbursements.
Data presented reflect past performance. Past performance is no guarantee of future results. Current performance may be higher or lower than the performance shown. Total returns for periods less than one year are not annualized. Investment return and principal value will fluctuate, and redemption value may be more or less than original cost. Data assumes reinvestment of dividends and capital gains, and none of the charts reflect the deduction of taxes that a shareholder would pay on fund distributions or the redemption of fund shares. To obtain performance data current to the most recent month end, please call 1-800-345-6488 or visit ipro.americancentury.com (for Investment Professionals). For additional information about the fund, please consult the prospectus.
Portfolio Managers: Brian Garbe and Claudia Musat
Performance Summary
VP Income & Growth returned 23.95%* for the year ended December 31, 2019, compared with the 31.49% return of its benchmark, the S&P 500 Index.
VP Income & Growth’s stock selection process incorporates factors of valuation, quality, growth and sentiment, while striving to minimize unintended risks along industries and other risk characteristics. The fund’s returns were hindered during the period by stock selection decisions within the consumer discretionary, health care and information technology sectors. However, certain security decisions bolstered results. In particular, overweight positions to QUALCOMM, Applied Materials and The Hershey Co. benefited returns, as did reduced exposure to Berkshire Hathaway and Boeing.
Stock Selection in Consumer Discretionary Hurt Returns
Stock selection in the consumer discretionary sector, especially textiles, apparel and luxury goods and, to a lesser extent, in the multiline and specialty retail industries, detracted from relative returns. Within textiles, apparel and luxury goods, an overweight to accessories manufacturer Tapestry was a leading detractor from relative results. The stock fell due in part to disappointing sales. We have closed this position. In the multiline retail industry, an overweight to Kohl’s was among the top individual detractors. The department store chain has struggled with decreased foot traffic and falling sales. We have since exited the stock. American Eagle Outfitters was also a leading detractor within the specialty retail industry. This position has since been closed.
In health care, security choices within the biotechnology industry were the leading cause of underperformance. An overweight to AbbVie was among the top individual detractors. The stock fell precipitously in January and June. An overweight to pharmaceuticals company Pfizer was also among the leading detractors. The stock fell after the company’s announcement to carve out the business unit responsible for established, older blockbuster drugs and sell it to generic drugmaker Mylan.
Within information technology, stock selections within electronic equipment, instruments and components detracted. In particular, a position in National Instruments was among the leading individual detractors from relative results. Allocation decisions within communications equipment and IT services also constrained results. Elsewhere in the markets, other notable detractors for the period included Occidental Petroleum, which suffered after announcement of its deal to purchase Anadarko Petroleum, and Tanger Factory Outlet Centers, which has seen reduced foot traffic in its shopping centers. We have since exited our position in Occidental.
A Number of Stock Choices Benefited Returns
Several stocks across varying sectors made meaningful contributions to portfolio results. Semiconductor producer QUALCOMM was among the top-contributing positions for the year. The company received a favorable ruling in its ongoing legal dispute with Apple and saw increased demand for its products, due in part to the rollout of 5G technology.
*All fund returns referenced in this commentary are for Class I shares. Performance for other share classes will vary due to differences in fee structure; when Class I performance exceeds that of the fund’s benchmark, other share classes may not. See page 2 for returns for all share classes.
Fellow semiconductor company Applied Materials also saw its price rise throughout the period. The chipmaker boasted strong earnings the latter half of the period and also benefited from the demand for 5G-compatible product components. Food product manufacturer The Hershey Co. also benefited results. The company’s stock rose on the back of increased dividend payouts and higher candy prices. Overweight positions in all of these securities helped portfolio results relative to the benchmark.
The decision to not invest heavily in some stocks was also beneficial. Underweight positions in Berkshire Hathaway and Boeing were also among the top contributors to relative performance during the year. Diversified financial company Berkshire experienced high volatility in its stock price during the period. Aerospace and defense company Boeing also suffered volatility and a generally decreasing stock price. The company faced regulatory and safety scrutiny in the wake of two fatal crashes of its newest airliner. The events led to investigations, changes in leadership at the company and reduced demand for its planes. We have since exited the position.
The use of hedging instruments or derivatives had no material impact on performance during the period.
A Look Ahead
Our systematic investment strategy is designed to take advantage of opportunities at the individual company level. We believe this approach is the most powerful way to capitalize on market inefficiencies that lead to the mispricing of individual stocks. Our strategy is designed to provide broad U.S. equity market exposure with strong current income and exceptional risk management.
As of December 31, 2019, our largest overweight position was in real estate, reflecting attractive dividend yields consistent with the portfolio’s income mandate. We are also finding many opportunities across the consumer staples sector, which is another of our largest active positions. We also see opportunities in information technology, as many stocks within the sector continue to offer compelling earnings growth, healthy balance sheets and positive sentiment. At the other end of the spectrum, the fund’s leading underweights at period-end include health care, industrials and utilities. These underweights reflect the fact that these stocks generally do not score well at present on the dimensions we evaluate.
|
| |
| DECEMBER 31, 2019 |
| Top Ten Holdings | % of net assets |
| Microsoft Corp. | 5.0% |
| Apple, Inc. | 4.3% |
| Alphabet, Inc., Class A | 3.7% |
| Amazon.com, Inc. | 3.1% |
| Johnson & Johnson | 1.9% |
| Verizon Communications, Inc. | 1.8% |
| AT&T, Inc. | 1.8% |
| Chevron Corp. | 1.8% |
| JPMorgan Chase & Co. | 1.6% |
| Home Depot, Inc. (The) | 1.6% |
| | |
| Top Five Industries | % of net assets |
| Banks | 7.5% |
| Software | 7.0% |
| Technology Hardware, Storage and Peripherals | 6.2% |
| Equity Real Estate Investment Trusts (REITs) | 6.0% |
| Semiconductors and Semiconductor Equipment | 5.4% |
| | |
| Types of Investments in Portfolio | % of net assets |
| Common Stocks | 96.8% |
| Temporary Cash Investments | 3.1% |
| Other Assets and Liabilities | 0.1% |
Fund shareholders may incur two types of costs: (1) transaction costs, including sales charges (loads) on purchase payments and redemption/exchange fees; and (2) ongoing costs, including management fees; distribution and service (12b-1) fees; and other fund expenses. This example is intended to help you understand your ongoing costs (in dollars) of investing in your fund and to compare these costs with the ongoing cost of investing in other mutual funds.
The example is based on an investment of $1,000 made at the beginning of the period and held for the entire period from July 1, 2019 to December 31, 2019.
Actual Expenses
The table provides information about actual account values and actual expenses for each class. You may use the information, together with the amount you invested, to estimate the expenses that you paid over the period. First, identify the share class you own. Then simply divide your account value by $1,000 (for example, an $8,600 account value divided by $1,000 = 8.6), then multiply the result by the number under the heading “Expenses Paid During Period” to estimate the expenses you paid on your account during this period.
Hypothetical Example for Comparison Purposes
The table also provides information about hypothetical account values and hypothetical expenses based on the actual expense ratio of each class of your fund and an assumed rate of return of 5% per year before expenses, which is not the actual return of a fund’s share class. The hypothetical account values and expenses may not be used to estimate the actual ending account balance or expenses you paid for the period. You may use this information to compare the ongoing costs of investing in your fund and other funds. To do so, compare this 5% hypothetical example with the 5% hypothetical examples that appear in the shareholder reports of the other funds.
Please note that the expenses shown in the table are meant to highlight your ongoing costs only and do not reflect any transactional costs, such as sales charges (loads) or redemption/exchange fees. Therefore, the table is useful in comparing ongoing costs only, and will not help you determine the relative total costs of owning different funds. In addition, if these transactional costs were included, your costs would have been higher.
|
| | | | |
| | Beginning
Account Value
7/1/19 | Ending
Account Value
12/31/19 | Expenses Paid
During Period(1)
7/1/19 - 12/31/19 |
Annualized
Expense Ratio(1) |
| Actual |
| Class I | $1,000 | $1,087.90 | $3.68 | 0.70% |
| Class II | $1,000 | $1,087.50 | $5.00 | 0.95% |
| Hypothetical |
| Class I | $1,000 | $1,021.68 | $3.57 | 0.70% |
| Class II | $1,000 | $1,020.42 | $4.84 | 0.95% |
| |
| (1) | Expenses are equal to the class's annualized expense ratio listed in the table above, multiplied by the average account value over the period, multiplied by 184, the number of days in the most recent fiscal half-year, divided by 365, to reflect the one-half year period. Annualized expense ratio reflects actual expenses, including any applicable fee waivers or expense reimbursements and excluding any acquired fund fees and expenses. |
DECEMBER 31, 2019
|
| | | | |
| | Shares | Value |
| COMMON STOCKS — 96.8% | | |
| Aerospace and Defense — 0.1% | | |
| Lockheed Martin Corp. | 1,152 | $ | 448,566 |
|
| Air Freight and Logistics — 1.3% | | |
| CH Robinson Worldwide, Inc. | 6,868 | 537,078 |
|
| United Parcel Service, Inc., Class B | 38,834 | 4,545,908 |
|
| | | 5,082,986 |
|
| Airlines — 0.5% | | |
| Delta Air Lines, Inc. | 29,897 | 1,748,377 |
|
| Automobiles — 0.3% | | |
| Ford Motor Co. | 141,803 | 1,318,768 |
|
| Banks — 7.5% | | |
| Bank of America Corp. | 69,714 | 2,455,327 |
|
| Comerica, Inc. | 26,297 | 1,886,810 |
|
| Fifth Third Bancorp | 65,025 | 1,998,868 |
|
| JPMorgan Chase & Co. | 45,334 | 6,319,560 |
|
| KeyCorp | 104,395 | 2,112,955 |
|
| PNC Financial Services Group, Inc. (The) | 14,431 | 2,303,621 |
|
| Regions Financial Corp. | 117,987 | 2,024,657 |
|
| Truist Financial Corp. | 43,018 | 2,422,774 |
|
| U.S. Bancorp | 36,169 | 2,144,460 |
|
| Umpqua Holdings Corp. | 12,572 | 222,524 |
|
| Wells Fargo & Co. | 90,864 | 4,888,483 |
|
| | | 28,780,039 |
|
| Beverages — 2.8% | | |
| Coca-Cola Co. (The) | 65,236 | 3,610,812 |
|
| Molson Coors Brewing Co., Class B | 28,804 | 1,552,536 |
|
| PepsiCo, Inc. | 40,386 | 5,519,555 |
|
| | | 10,682,903 |
|
| Biotechnology — 3.4% | | |
| AbbVie, Inc. | 38,772 | 3,432,873 |
|
| Amgen, Inc. | 11,379 | 2,743,135 |
|
Biogen, Inc.(1) | 9,411 | 2,792,526 |
|
| Gilead Sciences, Inc. | 63,155 | 4,103,812 |
|
| | | 13,072,346 |
|
| Building Products — 0.3% | | |
| Johnson Controls International plc | 26,552 | 1,080,932 |
|
| Capital Markets — 1.5% | | |
| Ameriprise Financial, Inc. | 11,466 | 1,910,006 |
|
| Cohen & Steers, Inc. | 9,971 | 625,780 |
|
| Janus Henderson Group plc | 64,978 | 1,588,712 |
|
| Northern Trust Corp. | 16,262 | 1,727,675 |
|
| | | 5,852,173 |
|
|
| | | | |
| | Shares | Value |
| Chemicals — 0.8% | | |
Dow, Inc.(1) | 25,975 | $ | 1,421,612 |
|
| LyondellBasell Industries NV, Class A | 18,643 | 1,761,390 |
|
| | | 3,183,002 |
|
| Commercial Services and Supplies — 0.9% | | |
| Republic Services, Inc. | 22,533 | 2,019,633 |
|
| Waste Management, Inc. | 13,473 | 1,535,383 |
|
| | | 3,555,016 |
|
| Communications Equipment — 1.3% | | |
| Cisco Systems, Inc. | 71,666 | 3,437,101 |
|
| Juniper Networks, Inc. | 62,328 | 1,535,139 |
|
| | | 4,972,240 |
|
| Consumer Finance — 0.9% | | |
| Discover Financial Services | 19,284 | 1,635,669 |
|
| Synchrony Financial | 55,026 | 1,981,486 |
|
| | | 3,617,155 |
|
| Containers and Packaging — 1.0% | | |
Amcor plc(1) | 197,237 | 2,138,049 |
|
| International Paper Co. | 38,662 | 1,780,385 |
|
| | | 3,918,434 |
|
| Diversified Financial Services — 0.8% | | |
Berkshire Hathaway, Inc., Class B(1) | 13,167 | 2,982,326 |
|
| Diversified Telecommunication Services — 3.6% | | |
| AT&T, Inc. | 173,573 | 6,783,233 |
|
| Verizon Communications, Inc. | 116,546 | 7,155,924 |
|
| | | 13,939,157 |
|
| Electric Utilities — 0.9% | | |
| IDACORP, Inc. | 12,106 | 1,292,921 |
|
| NextEra Energy, Inc. | 9,224 | 2,233,684 |
|
| | | 3,526,605 |
|
| Electronic Equipment, Instruments and Components — 0.4% | | |
| National Instruments Corp. | 37,077 | 1,569,840 |
|
| Entertainment — 0.3% | | |
Take-Two Interactive Software, Inc.(1) | 5,308 | 649,858 |
|
| Walt Disney Co. (The) | 4,111 | 594,574 |
|
| | | 1,244,432 |
|
| Equity Real Estate Investment Trusts (REITs) — 6.0% | | |
| Apple Hospitality REIT, Inc. | 27,226 | 442,422 |
|
| Brandywine Realty Trust | 109,069 | 1,717,837 |
|
| Corporate Office Properties Trust | 42,352 | 1,244,302 |
|
| Digital Realty Trust, Inc. | 7,591 | 908,946 |
|
| EPR Properties | 20,498 | 1,447,979 |
|
| Extra Space Storage, Inc. | 14,169 | 1,496,530 |
|
| Healthcare Trust of America, Inc., Class A | 12,547 | 379,923 |
|
| Highwoods Properties, Inc. | 23,481 | 1,148,456 |
|
| Industrial Logistics Properties Trust | 34,342 | 769,948 |
|
| Lamar Advertising Co., Class A | 22,591 | 2,016,473 |
|
| Life Storage, Inc. | 5,245 | 567,929 |
|
|
| | | | |
| | Shares | Value |
| Mid-America Apartment Communities, Inc. | 5,133 | $ | 676,837 |
|
| Realty Income Corp. | 23,533 | 1,732,735 |
|
| Retail Properties of America, Inc., Class A | 112,429 | 1,506,549 |
|
| Simon Property Group, Inc. | 4,218 | 628,313 |
|
| Tanger Factory Outlet Centers, Inc. | 68,347 | 1,006,751 |
|
| VICI Properties, Inc. | 71,276 | 1,821,102 |
|
| Weingarten Realty Investors | 55,956 | 1,748,065 |
|
| WP Carey, Inc. | 21,283 | 1,703,491 |
|
| | | 22,964,588 |
|
| Food Products — 2.9% | | |
| Campbell Soup Co. | 70,026 | 3,460,685 |
|
| General Mills, Inc. | 61,170 | 3,276,265 |
|
| Hershey Co. (The) | 15,747 | 2,314,494 |
|
| Kellogg Co. | 30,088 | 2,080,886 |
|
| | | 11,132,330 |
|
| Health Care Equipment and Supplies — 0.6% | | |
| Stryker Corp. | 9,948 | 2,088,483 |
|
| Health Care Providers and Services — 0.6% | | |
| Cardinal Health, Inc. | 27,481 | 1,389,989 |
|
| Chemed Corp. | 1,072 | 470,887 |
|
| UnitedHealth Group, Inc. | 1,602 | 470,956 |
|
| | | 2,331,832 |
|
| Health Care Technology — 0.4% | | |
Veeva Systems, Inc., Class A(1) | 9,484 | 1,334,019 |
|
| Hotels, Restaurants and Leisure — 2.7% | | |
| Darden Restaurants, Inc. | 15,589 | 1,699,357 |
|
| Las Vegas Sands Corp. | 37,707 | 2,603,291 |
|
| McDonald's Corp. | 8,939 | 1,766,436 |
|
| Starbucks Corp. | 28,503 | 2,505,984 |
|
| Vail Resorts, Inc. | 6,892 | 1,652,908 |
|
| | | 10,227,976 |
|
| Household Durables — 0.3% | | |
| Garmin Ltd. | 11,206 | 1,093,257 |
|
| Household Products — 3.2% | | |
| Clorox Co. (The) | 7,923 | 1,216,498 |
|
| Colgate-Palmolive Co. | 38,767 | 2,668,720 |
|
| Kimberly-Clark Corp. | 24,718 | 3,399,961 |
|
| Procter & Gamble Co. (The) | 38,218 | 4,773,428 |
|
| | | 12,058,607 |
|
| Insurance — 2.2% | | |
| Fidelity National Financial, Inc. | 34,845 | 1,580,221 |
|
| First American Financial Corp. | 25,337 | 1,477,654 |
|
| MetLife, Inc. | 41,585 | 2,119,587 |
|
| Prudential Financial, Inc. | 19,420 | 1,820,431 |
|
| Unum Group | 50,904 | 1,484,361 |
|
| | | 8,482,254 |
|
| Interactive Media and Services — 5.3% | | |
Alphabet, Inc., Class A(1) | 10,710 | 14,344,867 |
|
|
| | | | |
| | Shares | Value |
Facebook, Inc., Class A(1) | 28,706 | $ | 5,891,906 |
|
| | | 20,236,773 |
|
| Internet and Direct Marketing Retail — 3.7% | | |
Amazon.com, Inc.(1) | 6,413 | 11,850,198 |
|
| eBay, Inc. | 64,991 | 2,346,825 |
|
| | | 14,197,023 |
|
| IT Services — 3.7% | | |
| Amdocs Ltd. | 25,701 | 1,855,355 |
|
| International Business Machines Corp. | 35,643 | 4,777,588 |
|
| Mastercard, Inc., Class A | 1,453 | 433,851 |
|
| MAXIMUS, Inc. | 7,115 | 529,285 |
|
| Paychex, Inc. | 20,615 | 1,753,512 |
|
PayPal Holdings, Inc.(1) | 4,576 | 494,986 |
|
| Visa, Inc., Class A | 10,974 | 2,062,014 |
|
| Western Union Co. (The) | 77,791 | 2,083,243 |
|
| | | 13,989,834 |
|
| Machinery — 1.7% | | |
| Cummins, Inc. | 19,203 | 3,436,569 |
|
| Snap-on, Inc. | 18,810 | 3,186,414 |
|
| | | 6,622,983 |
|
| Media — 1.5% | | |
| Comcast Corp., Class A | 2,308 | 103,791 |
|
| Interpublic Group of Cos., Inc. (The) | 135,813 | 3,137,280 |
|
| Omnicom Group, Inc. | 31,414 | 2,545,162 |
|
| | | 5,786,233 |
|
| Metals and Mining — 0.2% | | |
| Steel Dynamics, Inc. | 27,411 | 933,070 |
|
| Multiline Retail — 0.7% | | |
| Target Corp. | 21,920 | 2,810,363 |
|
| Oil, Gas and Consumable Fuels — 5.2% | | |
| Chevron Corp. | 55,788 | 6,723,012 |
|
| Exxon Mobil Corp. | 61,324 | 4,279,189 |
|
| HollyFrontier Corp. | 43,101 | 2,185,652 |
|
| Kinder Morgan, Inc. | 107,232 | 2,270,101 |
|
| Phillips 66 | 20,858 | 2,323,790 |
|
| Valero Energy Corp. | 21,734 | 2,035,389 |
|
| | | 19,817,133 |
|
| Paper and Forest Products — 0.4% | | |
| Domtar Corp. | 34,731 | 1,328,113 |
|
| Pharmaceuticals — 4.7% | | |
| Bristol-Myers Squibb Co. | 40,831 | 2,620,942 |
|
| Eli Lilly & Co. | 3,048 | 400,599 |
|
| Johnson & Johnson | 49,422 | 7,209,187 |
|
| Merck & Co., Inc. | 43,081 | 3,918,217 |
|
| Pfizer, Inc. | 102,405 | 4,012,228 |
|
| | | 18,161,173 |
|
| Semiconductors and Semiconductor Equipment — 5.4% | | |
| Applied Materials, Inc. | 45,471 | 2,775,550 |
|
|
| | | | |
| | Shares | Value |
| Broadcom, Inc. | 17,144 | $ | 5,417,847 |
|
| Intel Corp. | 70,947 | 4,246,178 |
|
| Maxim Integrated Products, Inc. | 25,748 | 1,583,759 |
|
| QUALCOMM, Inc. | 26,090 | 2,301,921 |
|
| Texas Instruments, Inc. | 35,464 | 4,549,676 |
|
| | | 20,874,931 |
|
| Software — 7.0% | | |
Adobe, Inc.(1) | 3,935 | 1,297,802 |
|
| LogMeIn, Inc. | 22,385 | 1,919,290 |
|
| Microsoft Corp. | 120,426 | 18,991,180 |
|
| Oracle Corp. (New York) | 57,366 | 3,039,251 |
|
salesforce.com, Inc.(1) | 7,407 | 1,204,675 |
|
Zscaler, Inc.(1) | 5,964 | 277,326 |
|
| | | 26,729,524 |
|
| Specialty Retail — 2.0% | | |
AutoZone, Inc.(1) | 1,243 | 1,480,799 |
|
| Home Depot, Inc. (The) | 27,806 | 6,072,274 |
|
| | | 7,553,073 |
|
| Technology Hardware, Storage and Peripherals — 6.2% | | |
| Apple, Inc. | 55,525 | 16,304,916 |
|
| HP, Inc. | 138,455 | 2,845,250 |
|
| NetApp, Inc. | 24,444 | 1,521,639 |
|
| Seagate Technology plc | 53,013 | 3,154,274 |
|
| | | 23,826,079 |
|
| Tobacco — 1.2% | | |
| Altria Group, Inc. | 29,030 | 1,448,887 |
|
| Philip Morris International, Inc. | 35,218 | 2,996,700 |
|
| | | 4,445,587 |
|
| Trading Companies and Distributors — 0.4% | | |
| Fastenal Co. | 44,153 | 1,631,453 |
|
TOTAL COMMON STOCKS
(Cost $277,183,241) | | 371,231,988 |
|
| TEMPORARY CASH INVESTMENTS — 3.1% | | |
| Repurchase Agreement, BMO Capital Markets Corp., (collateralized by various U.S. Treasury obligations, 2.75% - 3.75%, 9/15/21 - 11/15/43, valued at $9,784,034), in a joint trading account at 1.35%, dated 12/31/19, due 1/2/20 (Delivery value $9,578,413) | | 9,577,695 |
|
| Repurchase Agreement, Fixed Income Clearing Corp., (collateralized by various U.S. Treasury obligations, 1.625%, 12/15/22, valued at $2,178,221), at 0.65%, dated 12/31/19, due 1/2/20 (Delivery value $2,131,076) | | 2,131,000 |
|
| State Street Institutional U.S. Government Money Market Fund, Premier Class | 63,860 | 63,860 |
|
TOTAL TEMPORARY CASH INVESTMENTS
(Cost $11,772,555) | | 11,772,555 |
|
TOTAL INVESTMENT SECURITIES — 99.9%
(Cost $288,955,796) | | 383,004,543 |
|
| OTHER ASSETS AND LIABILITIES — 0.1% | | 401,335 |
|
| TOTAL NET ASSETS — 100.0% | | $ | 383,405,878 |
|
|
| | | | | | | | | | | |
| FUTURES CONTRACTS PURCHASED |
| Reference Entity | Contracts | Expiration Date | Notional
Amount | Underlying
Contract
Value | Unrealized Appreciation
(Depreciation) |
| S&P 500 E-Mini | 56 | March 2020 | $ | 2,800 |
| $ | 9,047,080 |
| $ | 168,331 |
|
|
| | |
| NOTES TO SCHEDULE OF INVESTMENTS |
See Notes to Financial Statements.
|
|
| Statement of Assets and Liabilities |
|
| | | |
| DECEMBER 31, 2019 | |
| Assets |
| Investment securities, at value (cost of $288,955,796) | $ | 383,004,543 |
|
| Deposits with broker for futures contracts | 352,800 |
|
| Receivable for capital shares sold | 16,192 |
|
| Receivable for variation margin on futures contracts | 21,560 |
|
| Dividends and interest receivable | 478,744 |
|
| | 383,873,839 |
|
| | |
| Liabilities |
| Payable for capital shares redeemed | 235,030 |
|
| Accrued management fees | 226,272 |
|
| Distribution fees payable | 6,659 |
|
| | 467,961 |
|
| | |
| Net Assets | $ | 383,405,878 |
|
| | |
| Net Assets Consist of: |
| Capital (par value and paid-in surplus) | $ | 273,095,263 |
|
| Distributable earnings | 110,310,615 |
|
| | $ | 383,405,878 |
|
|
| | | | | | |
| | Net Assets | Shares Outstanding | Net Asset Value Per Share |
| Class I, $0.01 Par Value |
| $351,773,529 |
| 35,092,824 |
| $10.02 |
| Class II, $0.01 Par Value |
| $31,632,349 |
| 3,153,919 |
| $10.03 |
See Notes to Financial Statements.
|
| | | |
| YEAR ENDED DECEMBER 31, 2019 |
| Investment Income (Loss) |
| Income: | |
| Dividends | $ | 10,166,831 |
|
| Interest | 97,314 |
|
| | 10,264,145 |
|
| | |
| Expenses: | |
| Management fees | 2,591,041 |
|
| Distribution fees - Class II | 75,178 |
|
| Directors' fees and expenses | 11,671 |
|
| Other expenses | 1,120 |
|
| | 2,679,010 |
|
| | |
| Net investment income (loss) | 7,585,135 |
|
| | |
| Realized and Unrealized Gain (Loss) | |
| Net realized gain (loss) on: | |
| Investment transactions | 15,848,459 |
|
| Futures contract transactions | 585,201 |
|
| | 16,433,660 |
|
| | |
| Change in net unrealized appreciation (depreciation) on: | |
| Investments | 54,509,104 |
|
| Futures contracts | 168,331 |
|
| | 54,677,435 |
|
| | |
| Net realized and unrealized gain (loss) | 71,111,095 |
|
| | |
| Net Increase (Decrease) in Net Assets Resulting from Operations | $ | 78,696,230 |
|
See Notes to Financial Statements.
|
|
| Statement of Changes in Net Assets |
|
| | | | | | |
| YEARS ENDED DECEMBER 31, 2019 AND DECEMBER 31, 2018 |
| Increase (Decrease) in Net Assets | December 31, 2019 | December 31, 2018 |
| Operations |
| Net investment income (loss) | $ | 7,585,135 |
| $ | 8,245,471 |
|
| Net realized gain (loss) | 16,433,660 |
| 31,484,294 |
|
| Change in net unrealized appreciation (depreciation) | 54,677,435 |
| (64,272,459 | ) |
| Net increase (decrease) in net assets resulting from operations | 78,696,230 |
| (24,542,694 | ) |
| | | |
| Distributions to Shareholders |
| From earnings: | | |
| Class I | (36,148,821 | ) | (34,870,866 | ) |
| Class II | (3,103,497 | ) | (2,587,170 | ) |
| Decrease in net assets from distributions | (39,252,318 | ) | (37,458,036 | ) |
| | | |
| Capital Share Transactions |
| Net increase (decrease) in net assets from capital share transactions (Note 5) | 1,982,369 |
| (1,147,473 | ) |
| | | |
| Net increase (decrease) in net assets | 41,426,281 |
| (63,148,203 | ) |
| | | |
| Net Assets |
| Beginning of period | 341,979,597 |
| 405,127,800 |
|
| End of period | $ | 383,405,878 |
| $ | 341,979,597 |
|
See Notes to Financial Statements.
|
|
| Notes to Financial Statements |
DECEMBER 31, 2019
1. Organization
American Century Variable Portfolios, Inc. (the corporation) is registered under the Investment Company Act of 1940, as amended (the 1940 Act), as an open-end management investment company and is organized as a Maryland corporation. VP Income & Growth Fund (the fund) is one fund in a series issued by the corporation. The fund’s investment objective is to seek capital growth by investing in common stocks. Income is a secondary objective. The fund offers Class I and Class II.
2. Significant Accounting Policies
The following is a summary of significant accounting policies consistently followed by the fund in preparation of its financial statements. The fund is an investment company and follows accounting and reporting guidance in accordance with accounting principles generally accepted in the United States of America. This may require management to make certain estimates and assumptions at the date of the financial statements. Actual results could differ from these estimates. Management evaluated the impact of events or transactions occurring through the date the financial statements were issued that would merit recognition or disclosure.
Investment Valuations — The fund determines the fair value of its investments and computes its net asset value per share at the close of regular trading (usually 4 p.m. Eastern time) on the New York Stock Exchange (NYSE) on each day the NYSE is open. The Board of Directors has adopted valuation policies and procedures to guide the investment advisor in the fund’s investment valuation process and to provide methodologies for the oversight of the fund’s pricing function.
Equity securities that are listed or traded on a domestic securities exchange are valued at the last reported sales price or at the official closing price as provided by the exchange. Equity securities traded on foreign securities exchanges are generally valued at the closing price of such securities on the exchange where primarily traded or at the close of the NYSE, if that is earlier. If no last sales price is reported, or if local convention or regulation so provides, the mean of the latest bid and asked prices may be used. Securities traded over-the-counter are valued at the mean of the latest bid and asked prices, the last sales price, or the official closing price.
Open-end management investment companies are valued at the reported net asset value per share. Repurchase agreements are valued at cost, which approximates fair value. Exchange-traded futures contracts are valued at the settlement price as provided by the appropriate exchange.
If the fund determines that the market price for an investment is not readily available or the valuation methods mentioned above do not reflect an investment’s fair value, such investment is valued as determined in good faith by the Board of Directors or its delegate, in accordance with policies and procedures adopted by the Board of Directors. In its determination of fair value, the fund may review several factors including, but not limited to, market information regarding the specific investment or comparable investments and correlation with other investment types, futures indices or general market indicators. Circumstances that may cause the fund to use these procedures to value an investment include, but are not limited to: an investment has been declared in default or is distressed; trading in a security has been suspended during the trading day or a security is not actively trading on its principal exchange; prices received from a regular pricing source are deemed unreliable; or there is a foreign market holiday and no trading occurred.
The fund monitors for significant events occurring after the close of an investment’s primary exchange but before the fund’s net asset value per share is determined. Significant events may include, but are not limited to: corporate announcements and transactions; governmental action and political unrest that could impact a specific investment or an investment sector; or armed conflicts, natural disasters and similar events that could affect investments in a specific country or region. The fund also monitors for significant fluctuations between domestic and foreign markets, as evidenced by the U.S. market or such other indicators that the Board of Directors, or its delegate, deems appropriate. The fund may apply a model-derived factor to the closing price of equity securities traded on foreign securities exchanges. The factor is based on observable market data as provided by an independent pricing service.
Security Transactions — Security transactions are accounted for as of the trade date. Net realized gains and losses are determined on the identified cost basis, which is also used for federal income tax purposes.
Investment Income — Dividend income less foreign taxes withheld, if any, is recorded as of the ex-dividend date. Distributions received on securities that represent a return of capital or long-term capital gain are recorded as a reduction of cost of investments and/or as a realized gain. The fund may estimate the components of distributions received that may be considered nontaxable distributions or long-term capital gain distributions for income tax purposes. Interest income is recorded on the accrual basis and includes accretion of discounts and amortization of premiums.
Repurchase Agreements — The fund may enter into repurchase agreements with institutions that American Century Investment Management, Inc. (ACIM) (the investment advisor) has determined are creditworthy pursuant to criteria adopted by the Board of Directors. The fund requires that the collateral, represented by securities, received in a repurchase transaction be transferred to the custodian in a manner sufficient to enable the fund to obtain those securities in the event of a default under the repurchase agreement. ACIM monitors, on a daily basis, the securities transferred to ensure the value, including accrued interest, of the securities under each repurchase agreement is equal to or greater than amounts owed to the fund under each repurchase agreement.
Joint Trading Account — Pursuant to an Exemptive Order issued by the Securities and Exchange Commission, the fund, along with certain other funds in the American Century Investments family of funds, may transfer uninvested cash balances into a joint trading account. These balances are invested in one or more repurchase agreements that are collateralized by U.S. Treasury or Agency obligations.
Segregated Assets — In accordance with the 1940 Act, the fund segregates assets on its books and records to cover certain types of investment securities and other financial instruments. American Century Investment Management, Inc. (ACIM) (the investment advisor) monitors, on a daily basis, the securities segregated to ensure the fund designates a sufficient amount of liquid assets, marked-to-market daily. The fund may also receive assets or be required to pledge assets at the custodian bank or with a broker for collateral requirements.
Income Tax Status — It is the fund’s policy to distribute substantially all net investment income and net realized gains to shareholders and to otherwise qualify as a regulated investment company under provisions of the Internal Revenue Code. Accordingly, no provision has been made for income taxes. The fund files U.S. federal, state, local and non-U.S. tax returns as applicable. The fund's tax returns are subject to examination by the relevant taxing authority until expiration of the applicable statute of limitations, which is generally three years from the date of filing but can be longer in certain jurisdictions. At this time, management believes there are no uncertain tax positions which, based on their technical merit, would not be sustained upon examination and for which it is reasonably possible that the total amounts of unrecognized tax benefits will significantly change in the next twelve months.
Multiple Class — All shares of the fund represent an equal pro rata interest in the net assets of the class to which such shares belong, and have identical voting, dividend, liquidation and other rights and the same terms and conditions, except for class specific expenses and exclusive rights to vote on matters affecting only individual classes. Income, non-class specific expenses, and realized and unrealized capital gains and losses of the fund are allocated to each class of shares based on their relative net assets.
Distributions to Shareholders — Distributions from net investment income, if any, are generally declared and paid quarterly. Distributions from net realized gains, if any, are generally declared and paid annually.
Indemnifications — Under the corporation’s organizational documents, its officers and directors are indemnified against certain liabilities arising out of the performance of their duties to the fund. In addition, in the normal course of business, the fund enters into contracts that provide general indemnifications. The maximum exposure under these arrangements is unknown as this would involve future claims that may be made against a fund. The risk of material loss from such claims is considered by management to be remote.
3. Fees and Transactions with Related Parties
Certain officers and directors of the corporation are also officers and/or directors of American Century Companies, Inc. (ACC). The corporation’s investment advisor, ACIM, the corporation's distributor, American Century Investment Services, Inc. (ACIS), and the corporation’s transfer agent, American Century Services, LLC, are wholly owned, directly or indirectly, by ACC.
Management Fees — The corporation has entered into a management agreement with ACIM, under which ACIM provides the fund with investment advisory and management services in exchange for a single, unified management fee (the fee) per class. The agreement provides that all expenses of managing and operating the fund, except distribution fees, brokerage expenses, taxes, interest, fees and expenses of the independent directors (including legal counsel fees), and extraordinary expenses, will be paid by ACIM. The fee is computed and accrued daily based on each class’s daily net assets and paid monthly in arrears. The rate of the fee is determined by applying a fee rate calculation formula. This formula takes into account the fund’s assets as well as certain assets, if any, of other clients of the investment advisor outside the American Century Investments family of funds (such as subadvised funds and separate accounts) that use very similar investment teams and strategies (strategy assets). The management fee schedule ranges from 0.65% to 0.70% for each class. The effective annual management fee for each class for the period ended December 31, 2019 was 0.70%.
Distribution Fees — The Board of Directors has adopted the Master Distribution Plan (the plan) for Class II, pursuant to Rule 12b-1 of the 1940 Act. The plan provides that Class II will pay ACIS an annual distribution fee equal to 0.25%. The fee is computed and accrued daily based on the Class II daily net assets and paid monthly in arrears. The distribution fee provides compensation for expenses incurred in connection with distributing shares of Class II including, but not limited to, payments to brokers, dealers, and financial institutions that have entered into sales agreements with respect to shares of the fund. Fees incurred under the plan during the period ended December 31, 2019 are detailed in the Statement of Operations.
Directors' Fees and Expenses — The Board of Directors is responsible for overseeing the investment advisor’s management and operations of the fund. The directors receive detailed information about the fund and its investment advisor regularly throughout the year, and meet at least quarterly with management of the investment advisor to review reports about fund operations. The fund’s officers do not receive compensation from the fund.
Interfund Transactions — The fund may enter into security transactions with other American Century Investments funds and other client accounts of the investment advisor, in accordance with the 1940 Act rules and procedures adopted by the Board of Directors. The rules and procedures require, among other things, that these transactions be effected at the independent current market price of the security. During the period, the interfund purchases and sales were $3,433,110 and $2,081,707, respectively. The effect of interfund transactions on the Statement of Operations was $(212,013) in net realized gain (loss) on investment transactions.
4. Investment Transactions
Purchases and sales of investment securities, excluding short-term investments, for the period ended December 31, 2019 were $299,435,759 and $336,881,106, respectively.
5. Capital Share Transactions
Transactions in shares of the fund were as follows:
|
| | | | | | | | | | |
| | Year ended December 31, 2019 | Year ended December 31, 2018 |
| | Shares | Amount | Shares | Amount |
| Class I/Shares Authorized | 300,000,000 |
| | 300,000,000 |
| |
| Sold | 1,844,686 |
| $ | 17,486,140 |
| 1,819,424 |
| $ | 18,757,567 |
|
| Issued in reinvestment of distributions | 3,920,520 |
| 36,148,821 |
| 3,605,271 |
| 34,870,866 |
|
| Redeemed | (5,604,004 | ) | (53,148,318 | ) | (5,802,041 | ) | (59,738,092 | ) |
| | 161,202 |
| 486,643 |
| (377,346 | ) | (6,109,659 | ) |
| Class II/Shares Authorized | 50,000,000 |
| | 50,000,000 |
| |
| Sold | 458,780 |
| 4,347,858 |
| 850,519 |
| 8,863,064 |
|
| Issued in reinvestment of distributions | 336,386 |
| 3,103,497 |
| 267,303 |
| 2,587,170 |
|
| Redeemed | (626,843 | ) | (5,955,629 | ) | (635,856 | ) | (6,488,048 | ) |
| | 168,323 |
| 1,495,726 |
| 481,966 |
| 4,962,186 |
|
| Net increase (decrease) | 329,525 |
| $ | 1,982,369 |
| 104,620 |
| $ | (1,147,473 | ) |
6. Fair Value Measurements
The fund’s investments valuation process is based on several considerations and may use multiple inputs to determine the fair value of the investments held by the fund. In conformity with accounting principles generally accepted in the United States of America, the inputs used to determine a valuation are classified into three broad levels.
| |
| • | Level 1 valuation inputs consist of unadjusted quoted prices in an active market for identical investments. |
| |
| • | Level 2 valuation inputs consist of direct or indirect observable market data (including quoted prices for comparable investments, evaluations of subsequent market events, interest rates, prepayment speeds, credit risk, etc.). These inputs also consist of quoted prices for identical investments initially expressed in local currencies that are adjusted through translation into U.S. dollars. |
| |
| • | Level 3 valuation inputs consist of unobservable data (including a fund’s own assumptions). |
The level classification is based on the lowest level input that is significant to the fair valuation measurement. The valuation inputs are not necessarily an indication of the risks associated with investing in these securities or other financial instruments.
The following is a summary of the level classifications as of period end. The Schedule of Investments provides additional information on the fund’s portfolio holdings.
|
| | | | | | | | |
| | Level 1 | Level 2 | Level 3 |
| Assets | | | |
| Investment Securities | | | |
| Common Stocks | $ | 371,231,988 |
| — |
| — |
|
| Temporary Cash Investments | 63,860 |
| $ | 11,708,695 |
| — |
|
| | $ | 371,295,848 |
| $ | 11,708,695 |
| — |
|
| Other Financial Instruments | | | |
| Futures Contracts | $ | 168,331 |
| — |
| — |
|
7. Derivative Instruments
Equity Price Risk — The fund is subject to equity price risk in the normal course of pursuing its investment objectives. A fund may enter into futures contracts based on an equity index in order to manage its exposure to changes in market conditions. A fund may purchase futures contracts to gain exposure to increases in market value or sell futures contracts to protect against a decline in market value. Upon entering into a futures contract, a fund is required to deposit either cash or securities in an amount equal to a certain percentage of the contract value (initial margin). Subsequent payments (variation margin) are made or received daily, in cash, by a fund. The variation margin is equal to the daily change in the contract value and is recorded as unrealized gains and losses. A fund recognizes a realized gain or loss when the contract is closed or expires. Net realized and unrealized gains or losses occurring during the holding period of futures contracts are a component of net realized gain (loss) on futures contract transactions and change in net unrealized appreciation (depreciation) on futures contracts, respectively. One of the risks of entering into futures contracts is the possibility that the change in value of the contract may not correlate with the changes in value of the underlying securities. The fund's average notional exposure to equity price risk derivative instruments held during the period was $2,208 futures contracts purchased.
The value of equity price risk derivative instruments as of December 31, 2019, is disclosed on the Statement of Assets and Liabilities as an asset of $21,560 in receivable for variation margin on futures contracts*. For the year ended December 31, 2019, the effect of equity price risk derivative instruments on the Statement of Operations was $585,201 in net realized gain (loss) on futures contract transactions and $168,331 in change in net unrealized appreciation (depreciation) on futures contracts.
* Included in the unrealized appreciation (depreciation) on futures contracts as reported in the Schedule of Investments.
8. Federal Tax Information
The tax character of distributions paid during the years ended December 31, 2019 and December 31, 2018 were as follows:
|
| | | | | | |
| | 2019 | 2018 |
| Distributions Paid From | | |
| Ordinary income | $ | 11,269,049 |
| $ | 16,494,776 |
|
| Long-term capital gains | $ | 27,983,269 |
| $ | 20,963,260 |
|
The book-basis character of distributions made during the year from net investment income or net realized gains may differ from their ultimate characterization for federal income tax purposes. These differences reflect the differing character of certain income items and net realized gains and losses for financial statement and tax purposes, and may result in reclassification among certain capital accounts on the financial statements.
As of period end, the federal tax cost of investments and the components of distributable earnings on a tax-basis were as follows:
|
| | | |
| Federal tax cost of investments | $ | 290,525,466 |
|
| Gross tax appreciation of investments | $ | 95,310,416 |
|
| Gross tax depreciation of investments | (2,831,339 | ) |
| Net tax appreciation (depreciation) of investments | $ | 92,479,077 |
|
| Undistributed ordinary income | $ | 283,674 |
|
Accumulated long-term gains
| $ | 17,547,864 |
|
The difference between book-basis and tax-basis unrealized appreciation (depreciation) is attributable primarily to the tax deferral of losses on wash sales.
|
| | | | | | | | | | | | | | | |
| For a Share Outstanding Throughout the Years Ended December 31 (except as noted) |
| Per-Share Data | Ratios and Supplemental Data |
| | | Income From Investment Operations: | Distributions From: | | | Ratio to Average Net Assets of: | | |
| | Net Asset Value, Beginning of Period | Net Investment Income (Loss)(1) | Net Realized and Unrealized Gain (Loss) | Total From Investment Operations | Net
Investment
Income | Net
Realized
Gains | Total
Distributions | Net Asset Value, End of Period | Total Return(2) | Operating Expenses | Net Investment Income (Loss) | Portfolio Turnover Rate | Net Assets, End of Period (in thousands) |
| Class I |
| 2019 | $9.02 | 0.20 | 1.85 | 2.05 | (0.20) | (0.85) | (1.05) | $10.02 | 23.95% | 0.70% | 2.07% | 83% |
| $351,774 |
|
| 2018 | $10.71 | 0.22 | (0.90) | (0.68) | (0.20) | (0.81) | (1.01) | $9.02 | (6.87)% | 0.70% | 2.11% | 70% |
| $315,041 |
|
| 2017 | $9.32 | 0.24 | 1.62 | 1.86 | (0.24) | (0.23) | (0.47) | $10.71 | 20.49% | 0.71% | 2.47% | 76% |
| $378,295 |
|
| 2016 | $8.57 | 0.21 | 0.91 | 1.12 | (0.21) | (0.16) | (0.37) | $9.32 | 13.48% | 0.70% | 2.38% | 78% |
| $358,600 |
|
| 2015 | $10.11 | 0.19 | (0.71) | (0.52) | (0.19) | (0.83) | (1.02) | $8.57 | (5.62)% | 0.70% | 2.14% | 88% |
| $349,147 |
|
| Class II |
| 2019 | $9.02 | 0.17 | 1.87 | 2.04 | (0.18) | (0.85) | (1.03) | $10.03 | 23.75% | 0.95% | 1.82% | 83% |
| $31,632 |
|
| 2018 | $10.72 | 0.19 | (0.91) | (0.72) | (0.17) | (0.81) | (0.98) | $9.02 | (7.19)% | 0.95% | 1.86% | 70% |
| $26,938 |
|
| 2017 | $9.32 | 0.22 | 1.62 | 1.84 | (0.21) | (0.23) | (0.44) | $10.72 | 20.30% | 0.96% | 2.22% | 76% |
| $26,833 |
|
| 2016 | $8.57 | 0.18 | 0.92 | 1.10 | (0.19) | (0.16) | (0.35) | $9.32 | 13.20% | 0.95% | 2.13% | 78% |
| $23,511 |
|
| 2015 | $10.11 | 0.17 | (0.71) | (0.54) | (0.17) | (0.83) | (1.00) | $8.57 | (5.95)% | 0.95% | 1.89% | 88% |
| $17,417 |
|
|
| | | | |
| Notes to Financial Highlights | | |
| |
| (1) | Computed using average shares outstanding throughout the period. |
| |
| (2) | Total returns are calculated based on the net asset value of the last business day. Total returns for periods less than one year are not annualized. The total returns presented do not include the fees and charges assessed with investments in variable insurance products, those charges are disclosed in the separate account prospectus. The inclusion of such fees and charges would lower total return. |
See Notes to Financial Statements.
|
|
| Report of Independent Registered Public Accounting Firm |
To the Shareholders and the Board of Directors of American Century Variable Portfolios, Inc.:
Opinion on the Financial Statements and Financial Highlights
We have audited the accompanying statement of assets and liabilities, including the schedule of investments, of VP Income & Growth Fund, one of the funds constituting the American Century Variable Portfolios, Inc. (the "Fund"), as of December 31, 2019, the related statement of operations for the year then ended, the statements of changes in net assets for each of the two years in the period then ended, the financial highlights for each of the five years in the period then ended, and the related notes. In our opinion, the financial statements and financial highlights present fairly, in all material respects, the financial position of VP Income & Growth Fund of the American Century Variable Portfolios, Inc. as of December 31, 2019, the results of its operations for the year then ended, the changes in its net assets for each of the two years in the period then ended, and the financial highlights for each of the five years in the period then ended, in conformity with accounting principles generally accepted in the United States of America.
Basis for Opinion
These financial statements and financial highlights are the responsibility of the Fund's management. Our responsibility is to express an opinion on the Fund’s financial statements and financial highlights based on our audits. We are a public accounting firm registered with the Public Company Accounting Oversight Board (United States) (PCAOB) and are required to be independent with respect to the Fund in accordance with the U.S. federal securities laws and the applicable rules and regulations of the Securities and Exchange Commission and the PCAOB.
We conducted our audits in accordance with the standards of the PCAOB. Those standards require that we plan and perform the audit to obtain reasonable assurance about whether the financial statements and financial highlights are free of material misstatement, whether due to error or fraud. The Fund is not required to have, nor were we engaged to perform, an audit of its internal control over financial reporting. As part of our audits we are required to obtain an understanding of internal control over financial reporting but not for the purpose of expressing an opinion on the effectiveness of the Fund’s internal control over financial reporting. Accordingly, we express no such opinion.
Our audits included performing procedures to assess the risks of material misstatement of the financial statements and financial highlights, whether due to error or fraud, and performing procedures that respond to those risks. Such procedures included examining, on a test basis, evidence regarding the amounts and disclosures in the financial statements and financial highlights. Our audits also included evaluating the accounting principles used and significant estimates made by management, as well as evaluating the overall presentation of the financial statements and financial highlights. Our procedures included confirmation of securities owned as of December 31, 2019, by correspondence with the custodian and brokers. We believe that our audits provide a reasonable basis for our opinion.
DELOITTE & TOUCHE LLP
Kansas City, Missouri
February 13, 2020
We have served as the auditor of one or more American Century investment companies since 1997.
The Board of Directors
The individuals listed below serve as directors of the funds. Each director will continue to serve in this capacity until death, retirement, resignation or removal from office. The board has adopted a mandatory retirement age for directors who are not “interested persons,” as that term is defined in the Investment Company Act (independent directors). Independent directors shall retire by December 31 of the year in which they reach their 75th birthday.
Mr. Thomas is an “interested person” because he currently serves as President and Chief Executive Officer of American Century Companies, Inc. (ACC), the parent company of American Century Investment Management, Inc. (ACIM or the advisor). The other directors (more than three-fourths of the total number) are independent. They are not employees, directors or officers of, and have no financial interest in, ACC or any of its wholly owned, direct or indirect, subsidiaries, including ACIM, American Century Investment Services, Inc. (ACIS) and American Century Services, LLC (ACS), and they do not have any other affiliations, positions or relationships that would cause them to be considered “interested persons” under the Investment Company Act. The directors serve in this capacity for seven (in the case of Jonathan S. Thomas, 16; and Stephen E. Yates, 8) registered investment companies in the American Century Investments family of funds.
The following table presents additional information about the directors. The mailing address for each director is 4500 Main Street, Kansas City, Missouri 64111.
|
| | | | | |
Name
(Year of Birth) | Position(s) Held with Funds | Length of Time Served | Principal Occupation(s) During Past 5 Years | Number of American Century Portfolios Overseen by Director | Other Directorships Held During Past 5 Years |
| Independent Directors |
|
|
| Thomas W. Bunn (1953) | Director | Since 2017 | Retired | 64 | SquareTwo Financial; Barings (formerly Babson Capital Funds Trust) (2013 to 2016) |
Chris H. Cheesman
(1962)
| Director | Since 2019
| Retired. Senior Vice President & Chief Audit Executive, AllianceBernstein (1999 to 2018)
| 64 | None |
Barry Fink
(1955) | Director | Since 2012 (independent since 2016) | Retired | 64 | None |
Rajesh K. Gupta
(1960)
| Director | Since 2019
| Partner Emeritus, SeaCrest Investment Management and SeaCrest Wealth Management (2019 to Present); Chief Executive Officer and Chief Investment Officer, SeaCrest Investment Management (2006 to 2019); Chief Executive Officer and Chief Investment Officer, SeaCrest Wealth Management (2008 to 2019)
| 64 | None |
|
| | | | | |
Name
(Year of Birth) | Position(s) Held with Funds | Length of Time Served | Principal Occupation(s) During Past 5 Years | Number of American Century Portfolios Overseen by Director | Other Directorships Held During Past 5 Years |
| Independent Directors |
|
|
Lynn Jenkins
(1963)
| Director | Since 2019
| Consultant, LJ Strategies (2019 to present); United States Representative, U.S. House of Representatives (2009 to 2018) | 64 | MGP Ingredients, Inc. |
Jan M. Lewis
(1957) | Director | Since 2011 | Retired | 64 | None |
John R. Whitten
(1946) | Director | Since 2008 | Retired | 64 | Onto Innovation Inc.; Rudolph Technologies, Inc. (2006 to 2019) |
Stephen E. Yates
(1948) | Director and Chairman of the Board | Since 2012 (Chairman since 2018) | Retired | 79 | None |
| Interested Director |
|
Jonathan S. Thomas
(1963) | Director | Since 2007 | President and Chief Executive Officer, ACC (2007 to present). Also serves as Chief Executive Officer, ACS; Executive Vice President, ACIM; Director, ACC, ACIM and other ACC subsidiaries | 120 | None |
The Statement of Additional Information has additional information about the fund's directors and is available without charge, upon request, by calling 1-800-378-9878.
Officers
The following table presents certain information about the executive officers of the funds. Each officer serves as an officer for 16 (in the case of Robert J. Leach, 15) investment companies in the American Century family of funds. No officer is compensated for his or her service as an officer of the funds. The listed officers are interested persons of the funds and are appointed or re-appointed on an annual basis. The mailing address for each officer listed below is 4500 Main Street, Kansas City, Missouri 64111.
|
| | |
Name
(Year of Birth) | Offices with the Funds | Principal Occupation(s) During the Past Five Years |
Patrick Bannigan
(1965) | President since 2019 | Executive Vice President and Director, ACC (2012 to present); Chief Financial Officer, Chief Accounting Officer and Treasurer, ACC (2015 to present); Chief Operating Officer, ACC (2012-2015). Also serves as President, ACS; Vice President, ACIM; Chief Financial Officer, Chief Accounting Officer and/or Director, ACIM, ACS and other ACC subsidiaries |
R. Wes Campbell
(1974) | Chief Financial Officer and Treasurer since 2018 | Investment Operations and Investment Accounting, ACS (2000 to present) |
Amy D. Shelton
(1964) | Chief Compliance Officer and Vice President since 2014 | Chief Compliance Officer, American Century funds, (2014 to present); Chief Compliance Officer, ACIM (2014 to present); Chief Compliance Officer, ACIS (2009 to present). Also serves as Vice President, ACIS |
Charles A. Etherington
(1957) | General Counsel since 2007 and Senior Vice President since 2006 | Attorney, ACC (1994 to present); Vice President, ACC (2005 to present); General Counsel, ACC (2007 to present). Also serves as General Counsel, ACIM, ACS, ACIS and other ACC subsidiaries; and Senior Vice President, ACIM and ACS |
C. Jean Wade
(1964) | Vice President since 2012 | Senior Vice President, ACS (2017 to present); Vice President, ACS (2000 to 2017)
|
Robert J. Leach
(1966) | Vice President since 2006 | Vice President, ACS (2000 to present) |
David H. Reinmiller
(1963) | Vice President since 2000 | Attorney, ACC (1994 to present). Also serves as Vice President, ACIM and ACS |
Ward D. Stauffer
(1960) | Secretary since 2005 | Attorney, ACC (2003 to present) |
Proxy Voting Policies
A description of the policies that the fund's investment advisor uses in exercising the voting rights associated with the securities purchased and/or held by the fund is available without charge, upon request, by calling 1-800-378-9878. It is also available on American Century Investments’ website at americancentury.com/proxy and on the Securities and Exchange Commission’s website at sec.gov. Information regarding how the investment advisor voted proxies relating to portfolio securities during the most recent 12-month period ended June 30 is available on americancentury.com/proxy. It is also available at sec.gov.
Quarterly Portfolio Disclosure
The fund files its complete schedule of portfolio holdings with the Securities and Exchange Commission (SEC) for the first and third quarters of each fiscal year on Form N-Q or as an exhibit to its reports on Form N-PORT. The fund’s Forms N-Q and Form N-PORT reports are available on the SEC’s website at sec.gov. The fund also makes its complete schedule of portfolio holdings for the most recent quarter of its fiscal year available on its website at ipro.americancentury.com (for Investment Professionals) and, upon request, by calling 1-800-378-9878.
Other Tax Information
The following information is provided pursuant to provisions of the Internal Revenue Code.
For corporate taxpayers, the fund hereby designates $8,503,076, or up to the maximum amount allowable, of ordinary income distributions paid during the fiscal year ended December 31, 2019 as qualified for the corporate dividends received deduction.
The fund hereby designates $27,983,269, or up to the maximum amount allowable, as long-term capital gain distributions (20% rate gain distributions) for the fiscal year ended December 31, 2019.
The fund hereby designates $3,679,179 as qualified short-term capital gain distributions for purposes of Internal Revenue Code Section 871 for the fiscal year ended December 31, 2019.
|
| | |
| |
| | | |
| Contact Us | americancentury.com | |
| Automated Information Line | 1-800-345-8765 | |
| Investment Professional Service Representatives | 1-800-345-6488 | |
| Telecommunications Relay Service for the Deaf | 711 | |
| | | |
| American Century Variable Portfolios, Inc. | |
| | | |
Investment Advisor: American Century Investment Management, Inc. Kansas City, Missouri | |
| | | |
| This report and the statements it contains are submitted for the general information of our shareholders. The report is not authorized for distribution to prospective investors unless preceded or accompanied by an effective prospectus. | |
| | | |
©2020 American Century Proprietary Holdings, Inc. All rights reserved.
CL-ANN-91438 2002 | |
|
| |
| | |
| | Annual Report |
| | |
| | December 31, 2019 |
| | |
| | VP International Fund |
| | Class I (AVIIX) |
| | Class II (ANVPX) |
Beginning on January 1, 2021, as permitted by regulations adopted by the Securities and Exchange Commission, paper copies of the fund’s shareholder reports like this one will no longer be sent by mail from the insurance company that offers your contract, unless you specifically request paper copies of the reports from the insurance company or from your financial intermediary. Instead, the reports will be made available on a website, and you will be notified by mail each time a report is posted and provided with a website link to access the report.
If you already elected to receive shareholder reports electronically, you will not be affected by this change and you need not take any action. You may elect to receive shareholder reports and other communications from the insurance company or your financial intermediary electronically by contacting the insurance company.
You may elect to receive all future reports in paper free of charge. You can inform the insurance company or your financial intermediary that you wish to continue receiving paper copies of your shareholder reports by contacting the insurance company. Your election to receive reports in paper will apply to all variable portfolios available under your contract.
|
| |
| Performance | |
| Portfolio Commentary | |
| Fund Characteristics | |
| Shareholder Fee Example | |
| Schedule of Investments | |
| Statement of Assets and Liabilities | |
| Statement of Operations | |
| Statement of Changes in Net Assets | |
| Notes to Financial Statements | |
| Financial Highlights | |
| Report of Independent Registered Public Accounting Firm | |
| Management | |
| Additional Information | |
Any opinions expressed in this report reflect those of the author as of the date of the report, and do not necessarily represent the opinions of American Century Investments® or any other person in the American Century Investments organization. Any such opinions are subject to change at any time based upon market or other conditions and American Century Investments disclaims any responsibility to update such opinions. These opinions may not be relied upon as investment advice and, because investment decisions made by American Century Investments funds are based on numerous factors, may not be relied upon as an indication of trading intent on behalf of any American Century Investments fund. Security examples are used for representational purposes only and are not intended as recommendations to purchase or sell securities. Performance information for comparative indices and securities is provided to American Century Investments by third party vendors. To the best of American Century Investments’ knowledge, such information is accurate at the time of printing.
|
| | | | | |
| Total Returns as of December 31, 2019 | |
| | | | Average Annual Returns | |
| | Ticker Symbol | 1 year | 5 years | 10 years | Inception Date |
| Class I | AVIIX | 28.42% | 6.34% | 6.62% | 5/1/94 |
| MSCI EAFE Index | — | 22.01% | 5.67% | 5.50% | — |
| MSCI EAFE Growth Index | — | 27.90% | 7.71% | 6.94% | — |
| Class II | ANVPX | 28.14% | 6.17% | 6.46% | 8/15/01 |
Fund returns would have been lower if a portion of the fees had not been waived.
The performance information presented does not include the fees and charges assessed with investments in variable insurance products, those charges are disclosed in the separate account prospectus. The inclusion of such fees and charges would lower performance.
Data presented reflect past performance. Past performance is no guarantee of future results. Current performance may be higher or lower than the performance shown. Total returns for periods less than one year are not annualized. Investment return and principal value will fluctuate, and redemption value may be more or less than original cost. Data assumes reinvestment of dividends and capital gains, and none of the charts reflect the deduction of taxes that a shareholder would pay on fund distributions or the redemption of fund shares. To obtain performance data current to the most recent month end, please call 1-800-345-6488 or visit ipro.americancentury.com (for Investment Professionals). For additional information about the fund, please consult the prospectus.
|
|
| Growth of $10,000 Over 10 Years |
| $10,000 investment made December 31, 2009 |
| Performance for other share classes will vary due to differences in fee structure. |
|
| |
| Value on December 31, 2019 |
| | Class I — $18,996 |
| |
| | MSCI EAFE Index — $17,085 |
| |
| | MSCI EAFE Growth Index — $19,577 |
| |
Ending value of Class I would have been lower if a portion of the fees had not been waived.
|
| |
| Total Annual Fund Operating Expenses |
| Class I | Class II |
| 1.37% | 1.52% |
The total annual fund operating expenses shown is as stated in the fund’s prospectus current as of the date of this report. The prospectus may vary from the expense ratio shown elsewhere in this report because it is based on a different time period, includes acquired fund fees and expenses, and, if applicable, does not include fee waivers or expense reimbursements.
Data presented reflect past performance. Past performance is no guarantee of future results. Current performance may be higher or lower than the performance shown. Total returns for periods less than one year are not annualized. Investment return and principal value will fluctuate, and redemption value may be more or less than original cost. Data assumes reinvestment of dividends and capital gains, and none of the charts reflect the deduction of taxes that a shareholder would pay on fund distributions or the redemption of fund shares. To obtain performance data current to the most recent month end, please call 1-800-345-6488 or visit ipro.americancentury.com (for Investment Professionals). For additional information about the fund, please consult the prospectus.
Portfolio Managers: Raj Gandhi and Jim Zhao
Performance Summary
VP International gained 28.42%* for the 12 months ended December 31, 2019. The fund outperformed its benchmark, the MSCI EAFE Index, which increased 22.01% for the same period.
Non-U.S. equity markets delivered strong returns for the period despite significant volatility amid global economic uncertainty and U.S.-China trade tensions. Global stocks staged several rallies in the first half of 2019 as U.S. interest rate hikes paused and corporate earnings reports exceeded lowered expectations. Markets struggled to maintain the gains midyear, as signs of slowing economic growth and escalation of trade disputes dampened investor appetite for risk. Stocks rebounded decisively in the fourth quarter on encouraging earnings reports, anticipation of a U.S.-China trade deal and improved prospects for an orderly Brexit.
Strong stock selection across multiple sectors was a significant factor as global earnings growth became scarce. Our process identified companies exhibiting sustainable growth driven by idiosyncratic or secular growth drivers, which generally outperformed those dependent on cyclical growth.
Stock Choices Drove Outperformance
Selection among health care stocks contributed significantly to outperformance, as company-specific drivers propelled stocks such as blood plasma company CSL. The firm’s leading position within the immunoglobulin market supported growth in a year that saw competitors suffer from shortages and disruptions. CSL has invested heavily in its plasma collection centers, which should help it to maintain its market share gains. Investors drove the stock higher as management reiterated the firm’s strong growth prospects for 2020. Pharmaceuticals and biologics contract manufacturer Lonza Group and optical products specialist Hoya also ranked among the top individual contributors to the portfolio’s performance.
Among financials, London Stock Exchange Group’s (LSEG’s) strong performance was driven by strength in the company’s security clearing and data businesses, which have benefited from demand for clearing of new security classes, increased use of quantitative investment approaches and demand for market data from its Russell division. LSEG’s stock also benefited from news of the company’s proposed acquisition of financial data and technology firm Refinitiv. We believe the acquisition will enhance LSEG’s offerings for two of the strongest trends in financial markets: electronification of trading and demand for data.
Cellnex Telecom was another strong individual contributor. The European tower company gained significant market share in the past year, which drove better-than-expected earnings and propelled the stock higher. Announcement of an acquisition that should advance the company’s consolidation plans also boosted the stock. Cellnex continued to benefit from the increased use of data in Europe, the sale and leaseback of towers to cellular operators and the expansion of existing sites by adding more tenants.
*All fund returns referenced in this commentary are for Class I shares. Fund returns would have been lower if a portion of the fees had not been waived. Performance for other share classes will vary due to differences in fee structure; when Class I performance exceeds that of the fund’s benchmark, other share classes may not. See page 2 for returns for all share classes.
Consumer Staples Names Detracted
Holdings in the consumer staples sector such as Nestle weighed on returns. We did not hold stock of Nestle in the first quarter, and as it performed well during that period, it had a slightly negative effect on the portfolio’s relative performance. We subsequently purchased the stock as its earnings growth outlook improved, but the stock weakened with the general underperformance of consumer staples stocks as investors rotated out of perceived defensive stocks. Stock of the apparel manufacturer and retailer Canada Goose Holdings also declined as the market reacted to what we believe are transitory issues, which caused volatility in short-term earnings results. We believe the long-term story remains intact as Canada Goose retains a strong brand presence, is migrating its model away from wholesale toward higher-margin retail and online business and is entering new markets with its own stores.
Outlook
We remain focused on our disciplined, bottom-up fundamental process of identifying opportunities with accelerating, sustainable growth. There are signs of stabilization in fundamental data and aggregate growth trends. While we continue to focus on companies exhibiting accelerating growth through company-specific, idiosyncratic growth drivers, we have added to cyclical exposure, where we see a bottoming in trends.
Information technology remains the portfolio’s largest sector exposure. Our holdings include companies benefiting from multiple secular industry trends such as the shift to digitalization, the 5G network rollout, cloud computing, growth of the data center market and increased demand for factory and process automation.
Our consumer staples exposure declined during the reporting period. We eliminated our position in spirits and beverage distributor Diageo. Our investment thesis for the company had played out, and we expect growth to moderate going forward. We also sold Associated British Foods as our investment thesis was no longer intact, particularly with respect to the Primark business, which disappointed. The sector’s stocks generally underperformed for the period, which further lowered our consumer staples weight.
The portfolio remains underweight in financials due to an underweight in banks. However, we continue to invest in nonbank financials such as London Stock Exchange Group and insurance company AIA Group.
As a result of our process, our largest regional position continues to be Europe, where we are invested in multiple companies with idiosyncratic drivers. Toward the end of the year, we added to names that we believe are positioned to benefit from economic recovery following a period of slow growth relative to other markets. We believe Europe is poised to be an outperforming region with the lifting of trade uncertainties.
|
| |
| DECEMBER 31, 2019 | |
| Top Ten Holdings | % of net assets |
| Nestle SA | 3.4% |
| AIA Group Ltd. | 3.0% |
| CSL Ltd. | 2.8% |
| AstraZeneca plc | 2.5% |
| Keyence Corp. | 2.0% |
| Cellnex Telecom SA | 1.9% |
| Novartis AG | 1.8% |
| ASML Holding NV | 1.8% |
| London Stock Exchange Group plc | 1.8% |
| Schneider Electric SE | 1.8% |
| | |
| Types of Investments in Portfolio | % of net assets |
| Common Stocks | 99.5% |
| Temporary Cash Investments | 0.6% |
| Temporary Cash Investments - Securities Lending Collateral | 0.2% |
| Other Assets and Liabilities | (0.3)% |
| | |
| Investments by Country | % of net assets |
| Japan | 16.8% |
| Switzerland | 12.3% |
| United Kingdom | 10.0% |
| France | 9.8% |
| Germany | 5.7% |
| Australia | 5.1% |
| Sweden | 4.9% |
| China | 4.8% |
| Netherlands | 4.5% |
| Canada | 4.2% |
| Spain | 3.3% |
| Denmark | 3.1% |
| Hong Kong | 3.0% |
| Ireland | 2.8% |
| Other Countries | 9.2% |
| Cash and Equivalents* | 0.5% |
*Includes temporary cash investments, temporary cash investments - securities lending collateral and other assets and liabilities.
Fund shareholders may incur two types of costs: (1) transaction costs, including sales charges (loads) on purchase payments and redemption/exchange fees; and (2) ongoing costs, including management fees; distribution and service (12b-1) fees; and other fund expenses. This example is intended to help you understand your ongoing costs (in dollars) of investing in your fund and to compare these costs with the ongoing cost of investing in other mutual funds.
The example is based on an investment of $1,000 made at the beginning of the period and held for the entire period from July 1, 2019 to December 31, 2019.
Actual Expenses
The table provides information about actual account values and actual expenses for each class. You may use the information, together with the amount you invested, to estimate the expenses that you paid over the period. First, identify the share class you own. Then simply divide your account value by $1,000 (for example, an $8,600 account value divided by $1,000 = 8.6), then multiply the result by the number under the heading “Expenses Paid During Period” to estimate the expenses you paid on your account during this period.
Hypothetical Example for Comparison Purposes
The table also provides information about hypothetical account values and hypothetical expenses based on the actual expense ratio of each class of your fund and an assumed rate of return of 5% per year before expenses, which is not the actual return of a fund’s share class. The hypothetical account values and expenses may not be used to estimate the actual ending account balance or expenses you paid for the period. You may use this information to compare the ongoing costs of investing in your fund and other funds. To do so, compare this 5% hypothetical example with the 5% hypothetical examples that appear in the shareholder reports of the other funds.
Please note that the expenses shown in the table are meant to highlight your ongoing costs only and do not reflect any transactional costs, such as sales charges (loads) or redemption/exchange fees. Therefore, the table is useful in comparing ongoing costs only, and will not help you determine the relative total costs of owning different funds. In addition, if these transactional costs were included, your costs would have been higher.
|
| | | | |
| | Beginning
Account Value
7/1/19 | Ending
Account Value
12/31/19 | Expenses Paid
During Period(1)
7/1/19 - 12/31/19 | Annualized
Expense Ratio(1) |
| Actual | | | | |
| Class I | $1,000 | $1,089.00 | $5.27 | 1.00% |
| Class II | $1,000 | $1,088.20 | $6.05 | 1.15% |
| Hypothetical | | | | |
| Class I | $1,000 | $1,020.16 | $5.09 | 1.00% |
| Class II | $1,000 | $1,019.41 | $5.85 | 1.15% |
| |
| (1) | Expenses are equal to the class's annualized expense ratio listed in the table above, multiplied by the average account value over the period, multiplied by 184, the number of days in the most recent fiscal half-year, divided by 365, to reflect the one-half year period. Annualized expense ratio reflects actual expenses, including any applicable fee waivers or expense reimbursements and excluding any acquired fund fees and expenses. |
DECEMBER 31, 2019
|
| | | | |
| | Shares | Value |
| COMMON STOCKS — 99.5% | | |
| Australia — 5.1% | | |
| Aristocrat Leisure Ltd. | 59,130 | $ | 1,402,359 |
|
Atlassian Corp. plc, Class A(1) | 5,970 | 718,430 |
|
| CSL Ltd. | 26,460 | 5,135,121 |
|
| Treasury Wine Estates Ltd. | 184,240 | 2,105,440 |
|
| | | 9,361,350 |
|
| Austria — 0.9% | | |
Erste Group Bank AG(1) | 45,583 | 1,714,469 |
|
| Belgium — 1.3% | | |
| KBC Group NV | 32,360 | 2,440,122 |
|
| Brazil — 1.2% | | |
| Localiza Rent a Car SA | 88,240 | 1,042,008 |
|
| Magazine Luiza SA | 105,312 | 1,251,626 |
|
| | | 2,293,634 |
|
| Canada — 4.2% | | |
| Alimentation Couche-Tard, Inc., B Shares | 59,690 | 1,894,286 |
|
Canada Goose Holdings, Inc.(1)(2) | 42,760 | 1,549,622 |
|
Canadian Pacific Railway Ltd.(2) | 5,680 | 1,447,961 |
|
| First Quantum Minerals Ltd. | 77,850 | 789,561 |
|
| Intact Financial Corp. | 18,210 | 1,969,157 |
|
| | | 7,650,587 |
|
| China — 4.8% | | |
Alibaba Group Holding Ltd. ADR(1) | 13,370 | 2,835,777 |
|
| ANTA Sports Products Ltd. | 114,000 | 1,020,931 |
|
GDS Holdings Ltd. ADR(1) | 38,370 | 1,979,125 |
|
TAL Education Group ADR(1) | 26,280 | 1,266,696 |
|
| Tencent Holdings Ltd. | 35,700 | 1,722,116 |
|
| | | 8,824,645 |
|
| Denmark — 3.1% | | |
| Carlsberg A/S, B Shares | 12,030 | 1,794,585 |
|
| DSV Panalpina A/S | 17,767 | 2,056,682 |
|
| Novo Nordisk A/S, B Shares | 31,010 | 1,798,570 |
|
| | | 5,649,837 |
|
| Finland — 1.4% | | |
| Neste Oyj | 73,390 | 2,553,681 |
|
| France — 9.8% | | |
| Airbus SE | 9,090 | 1,333,664 |
|
| ArcelorMittal SA | 41,290 | 729,361 |
|
| Danone SA | 16,650 | 1,382,010 |
|
| Dassault Systemes SE | 9,410 | 1,552,136 |
|
| Edenred | 25,927 | 1,341,591 |
|
| LVMH Moet Hennessy Louis Vuitton SE | 4,950 | 2,305,369 |
|
| Peugeot SA | 40,720 | 975,217 |
|
|
| | | | |
| | Shares | Value |
| Schneider Electric SE | 31,770 | $ | 3,268,120 |
|
| Teleperformance | 6,080 | 1,485,553 |
|
| TOTAL SA | 33,780 | 1,866,759 |
|
| Valeo SA | 49,420 | 1,749,829 |
|
| | | 17,989,609 |
|
| Germany — 5.7% | | |
| adidas AG | 6,380 | 2,073,544 |
|
| Infineon Technologies AG | 105,930 | 2,429,174 |
|
| Puma SE | 15,620 | 1,197,651 |
|
| SAP SE | 17,610 | 2,373,296 |
|
| Symrise AG | 22,600 | 2,377,605 |
|
| | | 10,451,270 |
|
| Hong Kong — 3.0% | | |
| AIA Group Ltd. | 529,400 | 5,570,164 |
|
| Hungary — 0.5% | | |
| OTP Bank Nyrt. | 17,930 | 938,398 |
|
| India — 0.7% | | |
| HDFC Bank Ltd. | 68,590 | 1,222,405 |
|
| Indonesia — 0.7% | | |
| Bank Central Asia Tbk PT | 531,300 | 1,276,380 |
|
| Ireland — 2.8% | | |
CRH plc(1) | 50,599 | 2,029,628 |
|
ICON plc(1) | 6,890 | 1,186,665 |
|
| Kerry Group plc, A Shares | 15,530 | 1,933,502 |
|
| | | 5,149,795 |
|
| Italy — 1.2% | | |
Nexi SpA(1) | 72,364 | 1,005,148 |
|
| Prysmian SpA | 50,830 | 1,224,872 |
|
| | | 2,230,020 |
|
| Japan — 16.8% | | |
| Daikin Industries Ltd. | 8,900 | 1,251,613 |
|
| Fast Retailing Co. Ltd. | 2,700 | 1,600,393 |
|
| GMO Payment Gateway, Inc. | 13,900 | 956,270 |
|
| Hoya Corp. | 30,900 | 2,950,336 |
|
| Keyence Corp. | 10,400 | 3,681,113 |
|
| MonotaRO Co. Ltd. | 68,800 | 1,844,179 |
|
| Murata Manufacturing Co. Ltd. | 49,700 | 3,072,701 |
|
| Nidec Corp. | 12,900 | 1,762,193 |
|
| Obic Co. Ltd. | 10,100 | 1,364,333 |
|
| Pan Pacific International Holdings Corp. | 142,000 | 2,356,904 |
|
| Recruit Holdings Co. Ltd. | 84,900 | 3,194,815 |
|
| Shimadzu Corp. | 53,200 | 1,663,851 |
|
| Shiseido Co. Ltd. | 21,800 | 1,558,795 |
|
| Sysmex Corp. | 21,900 | 1,488,573 |
|
| Terumo Corp. | 64,900 | 2,292,889 |
|
| | | 31,038,958 |
|
| Netherlands — 4.5% | | |
Adyen NV(1) | 2,458 | 2,022,573 |
|
|
| | | | |
| | Shares | Value |
| ASML Holding NV | 11,110 | $ | 3,308,671 |
|
| Koninklijke DSM NV | 22,980 | 2,999,727 |
|
| | | 8,330,971 |
|
| Spain — 3.3% | | |
| Cellnex Telecom SA | 79,456 | 3,424,503 |
|
| Iberdrola SA | 262,500 | 2,703,498 |
|
| | | 6,128,001 |
|
| Sweden — 4.9% | | |
| Atlas Copco AB, A Shares | 40,660 | 1,620,813 |
|
| Hexagon AB, B Shares | 44,710 | 2,505,037 |
|
| Lundin Petroleum AB | 47,940 | 1,629,247 |
|
| Swedish Match AB | 22,980 | 1,184,706 |
|
| Telefonaktiebolaget LM Ericsson, B Shares | 245,360 | 2,149,921 |
|
| | | 9,089,724 |
|
| Switzerland — 12.3% | | |
Lonza Group AG(1) | 8,360 | 3,049,017 |
|
| Nestle SA | 57,060 | 6,181,683 |
|
| Novartis AG | 35,620 | 3,374,723 |
|
| Partners Group Holding AG | 2,330 | 2,135,371 |
|
| Sika AG | 10,738 | 2,022,170 |
|
| Straumann Holding AG | 1,620 | 1,590,106 |
|
Temenos AG(1) | 11,170 | 1,765,998 |
|
| Zurich Insurance Group AG | 6,090 | 2,497,753 |
|
| | | 22,616,821 |
|
| Taiwan — 1.3% | | |
| Taiwan Semiconductor Manufacturing Co. Ltd. | 221,000 | 2,447,458 |
|
| United Kingdom — 10.0% | | |
ASOS plc(1) | 20,770 | 931,754 |
|
| AstraZeneca plc | 46,830 | 4,685,276 |
|
| B&M European Value Retail SA | 330,487 | 1,801,546 |
|
| Burberry Group plc | 75,070 | 2,196,976 |
|
| Ferguson plc | 17,070 | 1,550,922 |
|
| Fevertree Drinks plc | 38,050 | 1,058,199 |
|
| London Stock Exchange Group plc | 32,020 | 3,307,414 |
|
| Melrose Industries plc | 936,150 | 2,992,276 |
|
| | | 18,524,363 |
|
TOTAL COMMON STOCKS
(Cost $138,515,304) | | 183,492,662 |
|
| TEMPORARY CASH INVESTMENTS — 0.6% | | |
| Repurchase Agreement, BMO Capital Markets Corp., (collateralized by various U.S. Treasury obligations, 2.75% - 3.75%, 9/15/21 - 11/15/43, valued at $948,237), in a joint trading account at 1.35%, dated 12/31/19, due 1/2/20 (Delivery value $928,309) | | 928,240 |
|
| Repurchase Agreement, Fixed Income Clearing Corp., (collateralized by various U.S. Treasury obligations, 1.625%, 12/15/22, valued at $210,311), at 0.65%, dated 12/31/19, due 1/2/20 (Delivery value $206,007) | | 206,000 |
|
| State Street Institutional U.S. Government Money Market Fund, Premier Class | 1,146 | 1,146 |
|
TOTAL TEMPORARY CASH INVESTMENTS
(Cost $1,135,386) | | 1,135,386 |
|
|
| | | | |
| | Shares | Value |
TEMPORARY CASH INVESTMENTS - SECURITIES LENDING COLLATERAL(3) — 0.2% |
State Street Navigator Securities Lending Government Money Market Portfolio
(Cost $300,440) | 300,440 | $ | 300,440 |
|
TOTAL INVESTMENT SECURITIES — 100.3%
(Cost $139,951,130) | | 184,928,488 |
|
| OTHER ASSETS AND LIABILITIES — (0.3)% | | (607,392 | ) |
| TOTAL NET ASSETS — 100.0% | | $ | 184,321,096 |
|
|
| | |
| MARKET SECTOR DIVERSIFICATION | |
| (as a % of net assets) | |
| Information Technology | 18.9 | % |
| Health Care | 14.8 | % |
| Industrials | 14.8 | % |
| Consumer Discretionary | 14.7 | % |
| Financials | 12.6 | % |
| Consumer Staples | 10.3 | % |
| Materials | 5.9 | % |
| Energy | 3.3 | % |
| Communication Services | 2.7 | % |
| Utilities | 1.5 | % |
| Cash and Equivalents* | 0.5 | % |
*Includes temporary cash investments, temporary cash investments - securities lending collateral and other assets and liabilities.
|
| | |
| NOTES TO SCHEDULE OF INVESTMENTS |
| ADR | - | American Depositary Receipt |
| |
| (2) | Security, or a portion thereof, is on loan. At the period end, the aggregate value of securities on loan was $2,968,523. The amount of securities on loan indicated may not correspond with the securities on loan identified because securities with pending sales are in the process of recall from the brokers. |
| |
| (3) | Investment of cash collateral from securities on loan. At the period end, the aggregate market value of the collateral held by the fund was $3,048,188, which includes securities collateral of $2,747,748. |
See Notes to Financial Statements.
|
|
| Statement of Assets and Liabilities |
|
| | | |
| DECEMBER 31, 2019 | |
| Assets | |
| Investment securities, at value (cost of $139,650,690) — including $2,968,523 of securities on loan | $ | 184,628,048 |
|
Investment made with cash collateral received for securities on loan, at value
(cost of $300,440) | 300,440 |
|
| Total investment securities, at value (cost of $139,951,130) | 184,928,488 |
|
| Foreign currency holdings, at value (cost of $62,263) | 62,706 |
|
| Receivable for capital shares sold | 22,226 |
|
| Dividends and interest receivable | 254,103 |
|
| Securities lending receivable | 995 |
|
| Other assets | 11,334 |
|
| | 185,279,852 |
|
| | |
| Liabilities | |
| Payable for collateral received for securities on loan | 300,440 |
|
| Payable for capital shares redeemed | 475,510 |
|
| Accrued management fees | 147,653 |
|
| Distribution fees payable | 8,635 |
|
| Accrued foreign taxes | 26,518 |
|
| | 958,756 |
|
| | |
| Net Assets | $ | 184,321,096 |
|
| | |
| Net Assets Consist of: | |
| Capital (par value and paid-in surplus) | $ | 136,074,640 |
|
| Distributable earnings | 48,246,456 |
|
| | $ | 184,321,096 |
|
|
| | | | | | |
| | Net Assets | Shares Outstanding | Net Asset Value Per Share |
| Class I, $0.01 Par Value |
| $143,094,122 |
| 12,441,650 |
| $11.50 |
| Class II, $0.01 Par Value |
| $41,226,974 |
| 3,590,265 |
| $11.48 |
See Notes to Financial Statements.
|
| | | |
| YEAR ENDED DECEMBER 31, 2019 | |
| Investment Income (Loss) | |
| Income: | |
| Dividends (net of foreign taxes withheld of $275,014) | $ | 2,640,940 |
|
| Interest | 38,169 |
|
| Securities lending, net | 5,100 |
|
| | 2,684,209 |
|
| | |
| Expenses: | |
| Management fees | 2,317,472 |
|
| Distribution fees - Class II | 99,390 |
|
| Directors' fees and expenses | 5,430 |
|
| Other expenses | 8,537 |
|
| | 2,430,829 |
|
Fees waived(1) | (588,717 | ) |
| | 1,842,112 |
|
| | |
| Net investment income (loss) | 842,097 |
|
| | |
| Realized and Unrealized Gain (Loss) | |
| Net realized gain (loss) on: | |
| Investment transactions | 2,596,218 |
|
| Foreign currency translation transactions | (26,129 | ) |
| | 2,570,089 |
|
| | |
| Change in net unrealized appreciation (depreciation) on: | |
| Investments (includes (increase) decrease in accrued foreign taxes of $(20,817)) | 39,001,187 |
|
| Translation of assets and liabilities in foreign currencies | 1,414 |
|
| | 39,002,601 |
|
| | |
| Net realized and unrealized gain (loss) | 41,572,690 |
|
| | |
| Net Increase (Decrease) in Net Assets Resulting from Operations | $ | 42,414,787 |
|
| |
| (1) | Amount consists of $453,235 and $135,482 for Class I and Class II, respectively. |
See Notes to Financial Statements.
|
|
| Statement of Changes in Net Assets |
|
| | | | | | |
| YEARS ENDED DECEMBER 31, 2019 AND DECEMBER 31, 2018 |
| Increase (Decrease) in Net Assets | December 31, 2019 | December 31, 2018 |
| Operations | | |
| Net investment income (loss) | $ | 842,097 |
| $ | 1,409,498 |
|
| Net realized gain (loss) | 2,570,089 |
| 9,745,159 |
|
| Change in net unrealized appreciation (depreciation) | 39,002,601 |
| (38,816,365 | ) |
| Net increase (decrease) in net assets resulting from operations | 42,414,787 |
| (27,661,708 | ) |
| | | |
| Distributions to Shareholders | | |
| From earnings: | | |
| Class I | (7,985,011 | ) | (11,622,034 | ) |
| Class II | (2,409,637 | ) | (3,459,625 | ) |
| Decrease in net assets from distributions | (10,394,648 | ) | (15,081,659 | ) |
| | | |
| Capital Share Transactions | | |
| Net increase (decrease) in net assets from capital share transactions (Note 5) | (2,002,123 | ) | (2,299,400 | ) |
| | | |
| Net increase (decrease) in net assets | 30,018,016 |
| (45,042,767 | ) |
| | | |
| Net Assets | | |
| Beginning of period | 154,303,080 |
| 199,345,847 |
|
| End of period | $ | 184,321,096 |
| $ | 154,303,080 |
|
See Notes to Financial Statements.
|
|
| Notes to Financial Statements |
DECEMBER 31, 2019
1. Organization
American Century Variable Portfolios, Inc. (the corporation) is registered under the Investment Company Act of 1940, as amended (the 1940 Act), as an open-end management investment company and is organized as a Maryland corporation. VP International Fund (the fund) is one fund in a series issued by the corporation. The fund’s investment objective is to seek capital growth. The fund offers Class I and Class II.
2. Significant Accounting Policies
The following is a summary of significant accounting policies consistently followed by the fund in preparation of its financial statements. The fund is an investment company and follows accounting and reporting guidance in accordance with accounting principles generally accepted in the United States of America. This may require management to make certain estimates and assumptions at the date of the financial statements. Actual results could differ from these estimates. Management evaluated the impact of events or transactions occurring through the date the financial statements were issued that would merit recognition or disclosure.
Investment Valuations — The fund determines the fair value of its investments and computes its net asset value per share at the close of regular trading (usually 4 p.m. Eastern time) on the New York Stock Exchange (NYSE) on each day the NYSE is open. The Board of Directors has adopted valuation policies and procedures to guide the investment advisor in the fund’s investment valuation process and to provide methodologies for the oversight of the fund’s pricing function.
Equity securities that are listed or traded on a domestic securities exchange are valued at the last reported sales price or at the official closing price as provided by the exchange. Equity securities traded on foreign securities exchanges are generally valued at the closing price of such securities on the exchange where primarily traded or at the close of the NYSE, if that is earlier. If no last sales price is reported, or if local convention or regulation so provides, the mean of the latest bid and asked prices may be used. Securities traded over-the-counter are valued at the mean of the latest bid and asked prices, the last sales price, or the official closing price. Equity securities initially expressed in local currencies are translated into U.S. dollars at the mean of the appropriate currency exchange rate at the close of the NYSE as provided by an independent pricing service.
Open-end management investment companies are valued at the reported net asset value per share. Repurchase agreements are valued at cost, which approximates fair value.
If the fund determines that the market price for an investment is not readily available or the valuation methods mentioned above do not reflect an investment’s fair value, such investment is valued as determined in good faith by the Board of Directors or its delegate, in accordance with policies and procedures adopted by the Board of Directors. In its determination of fair value, the fund may review several factors including, but not limited to, market information regarding the specific investment or comparable investments and correlation with other investment types, futures indices or general market indicators. Circumstances that may cause the fund to use these procedures to value an investment include, but are not limited to: an investment has been declared in default or is distressed; trading in a security has been suspended during the trading day or a security is not actively trading on its principal exchange; prices received from a regular pricing source are deemed unreliable; or there is a foreign market holiday and no trading occurred.
The fund monitors for significant events occurring after the close of an investment’s primary exchange but before the fund’s net asset value per share is determined. Significant events may include, but are not limited to: corporate announcements and transactions; governmental action and political unrest that could impact a specific investment or an investment sector; or armed conflicts, natural disasters and similar events that could affect investments in a specific country or region. The fund also monitors for significant fluctuations between domestic and foreign markets, as evidenced by the U.S. market or such other indicators that the Board of Directors, or its delegate, deems appropriate. The fund may apply a model-derived factor to the closing price of equity securities traded on foreign securities exchanges. The factor is based on observable market data as provided by an independent pricing service.
Security Transactions — Security transactions are accounted for as of the trade date. Net realized gains and losses are determined on the identified cost basis, which is also used for federal income tax purposes. Certain countries impose taxes on realized gains on the sale of securities registered in their country. The fund records the foreign tax expense, if any, on an accrual basis. The foreign tax expense on realized gains and unrealized appreciation reduces the net realized gain (loss) on investment transactions and net unrealized appreciation (depreciation) on investments, respectively.
Investment Income — Dividend income less foreign taxes withheld, if any, is recorded as of the ex-dividend date. Distributions received on securities that represent a return of capital or long-term capital gain are recorded as a reduction of cost of investments and/or as a realized gain. The fund may estimate the components of distributions received that may be considered nontaxable distributions or long-term capital gain distributions for income tax purposes. Interest income is recorded on the accrual basis and includes accretion of discounts and amortization of premiums. Securities lending income is net of fees and rebates earned by the lending agent for its services.
Foreign Currency Translations — All assets and liabilities initially expressed in foreign currencies are translated into U.S. dollars at prevailing exchange rates at period end. The fund may enter into spot foreign currency exchange contracts to facilitate transactions denominated in a foreign currency. Purchases and sales of investment securities, dividend and interest income, spot foreign currency exchange contracts, and expenses are translated at the rates of exchange prevailing on the respective dates of such transactions. Net realized and unrealized foreign currency exchange gains or losses related to investment securities are a component of net realized gain (loss) on investment transactions and change in net unrealized appreciation (depreciation) on investments, respectively.
Repurchase Agreements — The fund may enter into repurchase agreements with institutions that American Century Investment Management, Inc. (ACIM) (the investment advisor) has determined are creditworthy pursuant to criteria adopted by the Board of Directors. The fund requires that the collateral, represented by securities, received in a repurchase transaction be transferred to the custodian in a manner sufficient to enable the fund to obtain those securities in the event of a default under the repurchase agreement. ACIM monitors, on a daily basis, the securities transferred to ensure the value, including accrued interest, of the securities under each repurchase agreement is equal to or greater than amounts owed to the fund under each repurchase agreement.
Joint Trading Account — Pursuant to an Exemptive Order issued by the Securities and Exchange Commission, the fund, along with certain other funds in the American Century Investments family of funds, may transfer uninvested cash balances into a joint trading account. These balances are invested in one or more repurchase agreements that are collateralized by U.S. Treasury or Agency obligations.
Segregated Assets — In accordance with the 1940 Act, the fund segregates assets on its books and records to cover certain types of investment securities and other financial instruments. ACIM monitors, on a daily basis, the securities segregated to ensure the fund designates a sufficient amount of liquid assets, marked-to-market daily. The fund may also receive assets or be required to pledge assets at the custodian bank or with a broker for collateral requirements.
Income Tax Status — It is the fund’s policy to distribute substantially all net investment income and net realized gains to shareholders and to otherwise qualify as a regulated investment company under provisions of the Internal Revenue Code. Accordingly, no provision has been made for income taxes. The fund files U.S. federal, state, local and non-U.S. tax returns as applicable. The fund's tax returns are subject to examination by the relevant taxing authority until expiration of the applicable statute of limitations, which is generally three years from the date of filing but can be longer in certain jurisdictions. At this time, management believes there are no uncertain tax positions which, based on their technical merit, would not be sustained upon examination and for which it is reasonably possible that the total amounts of unrecognized tax benefits will significantly change in the next twelve months.
Multiple Class — All shares of the fund represent an equal pro rata interest in the net assets of the class to which such shares belong, and have identical voting, dividend, liquidation and other rights and the same terms and conditions, except for class specific expenses and exclusive rights to vote on matters affecting only individual classes. Income, non-class specific expenses, and realized and unrealized capital gains and losses of the fund are allocated to each class of shares based on their relative net assets.
Distributions to Shareholders — Distributions from net investment income and net realized gains, if any, are generally declared and paid annually.
Indemnifications — Under the corporation’s organizational documents, its officers and directors are indemnified against certain liabilities arising out of the performance of their duties to the fund. In addition, in the normal course of business, the fund enters into contracts that provide general indemnifications. The maximum exposure under these arrangements is unknown as this would involve future claims that may be made against a fund. The risk of material loss from such claims is considered by management to be remote.
Securities Lending — Securities are lent to qualified financial institutions and brokers. State Street Bank & Trust Co. serves as securities lending agent to the fund pursuant to a Securities Lending Agreement. The lending of securities exposes the fund to risks such as: the borrowers may fail to return the loaned securities, the borrowers may not be able to provide additional collateral, the fund may experience delays in recovery of the loaned securities or delays in access to collateral, or the fund may experience losses related to the investment collateral. To minimize certain risks, loan counterparties pledge collateral in the form of cash and/or securities. The lending agent has agreed to indemnify the fund in the case of default of any securities borrowed. Cash collateral received is invested in the State Street Navigator Securities Lending Government Money Market Portfolio, a money market mutual fund registered under the 1940 Act. The loans may also be secured by U.S. government securities in an amount at least equal to the market value of the securities loaned, plus accrued interest and dividends, determined on a daily basis and adjusted accordingly. By lending securities, the fund seeks to increase its net investment income through the receipt of interest and fees. Such income is reflected separately within the Statement of Operations. The value of loaned securities and related collateral outstanding at period end, if any, are shown on a gross basis within the Schedule of Investments and Statement of Assets and Liabilities.
The following table reflects a breakdown of transactions accounted for as secured borrowings, the gross obligation by the type of collateral pledged, and the remaining contractual maturity of those transactions as of December 31, 2019.
|
| | | | | | | | | | | | |
| Remaining Contractual Maturity of Agreements |
| | Overnight and
Continuous | <30 days | Between
30 & 90 days | >90 days | Total |
Securities Lending Transactions(1) | | | | |
| Common Stocks | $ | 300,440 |
| — |
| — |
| — |
| $ | 300,440 |
|
| Gross amount of recognized liabilities for securities lending transactions | $ | 300,440 |
|
| |
| (1) | Amount represents the payable for cash collateral received for securities on loan. This will generally be in the Overnight and Continuous column as the securities are typically callable on demand. |
3. Fees and Transactions with Related Parties
Certain officers and directors of the corporation are also officers and/or directors of American Century Companies, Inc. (ACC). The corporation’s investment advisor, ACIM, the corporation's distributor, American Century Investment Services, Inc. (ACIS), and the corporation’s transfer agent, American Century Services, LLC, are wholly owned, directly or indirectly, by ACC.
Management Fees — The corporation has entered into a management agreement with ACIM, under which ACIM provides the fund with investment advisory and management services in exchange for a single, unified management fee (the fee) per class. The agreement provides that all expenses of managing and operating the fund, except distribution fees, brokerage expenses, taxes, interest, fees and expenses of the independent directors (including legal counsel fees), and extraordinary expenses, will be paid by ACIM. The fee is computed and accrued daily based on each class's daily net assets and paid monthly in arrears. The difference in the fee among the classes is a result of their separate arrangements for non-Rule 12b-1 shareholder services. It is not the result of any difference in advisory or custodial fees or other expenses related to the management of the fund's assets, which do not vary by class. The rate of the fee is determined by applying a fee rate calculation formula. This formula takes into account the fund's assets as well as certain assets, if any, of other clients of the investment advisor outside the American Century Investments family of funds (such as subadvised funds and separate accounts) that use very similar investment teams and strategies (strategy assets). From January 1, 2019 through July 31, 2019, the investment advisor agreed to waive 0.32% of the fund’s management fee. Effective August 1, 2019, the investment advisor agreed to waive 0.37% of the fund's management fee. The investment advisor expects this waiver to continue until July 31, 2020 and cannot terminate it prior to such date without the approval of the Board of Directors.
The management fee schedule range and the effective annual management fee before and after waiver for each class for the period ended December 31, 2019 are as follows:
|
| | | |
| | | Effective Annual Management Fee |
| | Management Fee Schedule Range | Before Waiver | After Waiver |
| Class I | 1.00% to 1.50% | 1.36% | 1.02% |
| Class II | 0.90% to 1.40% | 1.26% | 0.92% |
Distribution Fees — The Board of Directors has adopted the Master Distribution Plan (the plan) for Class II, pursuant to Rule 12b-1 of the 1940 Act. The plan provides that Class II will pay ACIS an annual distribution fee equal to 0.25%. The fee is computed and accrued daily based on the Class II daily net assets and paid monthly in arrears. The distribution fee provides compensation for expenses incurred in connection with distributing shares of Class II including, but not limited to, payments to brokers, dealers, and financial institutions that have entered into sales agreements with respect to shares of the fund. Fees incurred under the plan during the period ended December 31, 2019 are detailed in the Statement of Operations.
Directors' Fees and Expenses — The Board of Directors is responsible for overseeing the investment advisor’s management and operations of the fund. The directors receive detailed information about the fund and its investment advisor regularly throughout the year, and meet at least quarterly with management of the investment advisor to review reports about fund operations. The fund’s officers do not receive compensation from the fund.
Interfund Transactions — The fund may enter into security transactions with other American Century Investments funds and other client accounts of the investment advisor, in accordance with the 1940 Act rules and procedures adopted by the Board of Directors. The rules and procedures require, among other things, that these transactions be effected at the independent current market price of the security. During the period, the interfund purchases were $241,570 and there were no interfund sales.
4. Investment Transactions
Purchases and sales of investment securities, excluding short-term investments, for the period ended December 31, 2019 were $111,009,616 and $121,206,052, respectively.
5. Capital Share Transactions
Transactions in shares of the fund were as follows:
|
| | | | | | | | | | |
| | Year ended December 31, 2019 | Year ended December 31, 2018 |
| | Shares | Amount | Shares | Amount |
| Class I/Shares Authorized | 200,000,000 |
| | 200,000,000 |
| |
| Sold | 1,616,656 |
| $ | 16,877,871 |
| 1,020,615 |
| $ | 11,792,553 |
|
| Issued in reinvestment of distributions | 793,739 |
| 7,985,011 |
| 1,015,025 |
| 11,622,034 |
|
| Redeemed | (2,269,126 | ) | (23,793,001 | ) | (2,304,587 | ) | (26,624,727 | ) |
| | 141,269 |
| 1,069,881 |
| (268,947 | ) | (3,210,140 | ) |
| Class II/Shares Authorized | 100,000,000 |
| | 100,000,000 |
| |
| Sold | 258,214 |
| 2,723,015 |
| 298,515 |
| 3,461,525 |
|
| Issued in reinvestment of distributions | 239,527 |
| 2,409,637 |
| 302,415 |
| 3,459,625 |
|
| Redeemed | (782,139 | ) | (8,204,656 | ) | (526,336 | ) | (6,010,410 | ) |
| | (284,398 | ) | (3,072,004 | ) | 74,594 |
| 910,740 |
|
| Net increase (decrease) | (143,129 | ) | $ | (2,002,123 | ) | (194,353 | ) | $ | (2,299,400 | ) |
6. Fair Value Measurements
The fund’s investments valuation process is based on several considerations and may use multiple inputs to determine the fair value of the investments held by the fund. In conformity with accounting principles generally accepted in the United States of America, the inputs used to determine a valuation are classified into three broad levels.
| |
| • | Level 1 valuation inputs consist of unadjusted quoted prices in an active market for identical investments. |
| |
| • | Level 2 valuation inputs consist of direct or indirect observable market data (including quoted prices for comparable investments, evaluations of subsequent market events, interest rates, prepayment speeds, credit risk, etc.). These inputs also consist of quoted prices for identical investments initially expressed in local currencies that are adjusted through translation into U.S. dollars. |
| |
| • | Level 3 valuation inputs consist of unobservable data (including a fund’s own assumptions). |
The level classification is based on the lowest level input that is significant to the fair valuation measurement. The valuation inputs are not necessarily an indication of the risks associated with investing in these securities or other financial instruments.
The following is a summary of the level classifications as of period end. The Schedule of Investments provides additional information on the fund’s portfolio holdings.
|
| | | | | | | | |
| | Level 1 | Level 2 | Level 3 |
| Assets | | | |
| Investment Securities | | | |
| Common Stocks | | | |
| Australia | $ | 718,430 |
| $ | 8,642,920 |
| — |
|
| Canada | 1,549,622 |
| 6,100,965 |
| — |
|
| China | 6,081,598 |
| 2,743,047 |
| — |
|
| Ireland | 1,186,665 |
| 3,963,130 |
| — |
|
| Other Countries | — |
| 152,506,285 |
| — |
|
| Temporary Cash Investments | 1,146 |
| 1,134,240 |
| — |
|
| Temporary Cash Investments - Securities Lending Collateral | 300,440 |
| — |
| — |
|
| | $ | 9,837,901 |
| $ | 175,090,587 |
| — |
|
7. Risk Factors
There are certain risks involved in investing in foreign securities. These risks include those resulting from political events (such as civil unrest, national elections and imposition of exchange controls), social and economic events (such as labor strikes and rising inflation), and natural disasters. Securities of foreign issuers may be less liquid and more volatile. Investing in emerging markets or a significant portion of assets in one country or region may accentuate these risks.
8. Federal Tax Information
The tax character of distributions paid during the years ended December 31, 2019 and December 31, 2018 were as follows:
|
| | | | | | |
| | 2019 | 2018 |
| Distributions Paid From | | |
| Ordinary income | $ | 1,432,048 |
| $ | 2,384,883 |
|
| Long-term capital gains | $ | 8,962,600 |
| $ | 12,696,776 |
|
The book-basis character of distributions made during the year from net investment income or net realized gains may differ from their ultimate characterization for federal income tax purposes. These differences reflect the differing character of certain income items and net realized gains and losses for financial statement and tax purposes, and may result in reclassification among certain capital accounts on the financial statements.
As of period end, the federal tax cost of investments and the components of distributable earnings on a tax-basis were as follows:
|
| | | |
| Federal tax cost of investments | $ | 140,055,522 |
|
| Gross tax appreciation of investments | $ | 45,669,538 |
|
| Gross tax depreciation of investments | (796,572 | ) |
| Net tax appreciation (depreciation) of investments | 44,872,966 |
|
| Net tax appreciation (depreciation) on translation of assets and liabilities in foreign currencies | (32,822 | ) |
| Net tax appreciation (depreciation) | $ | 44,840,144 |
|
| Undistributed ordinary income | $ | 815,565 |
|
Accumulated long-term gains
| $ | 2,590,747 |
|
The difference between book-basis and tax-basis unrealized appreciation (depreciation) is attributable primarily to the tax deferral of losses on wash sales.
|
| | | | | | | | | | | | | | | | | |
| For a Share Outstanding Throughout the Years Ended December 31 (except as noted) |
| Per-Share Data | | | | | | Ratios and Supplemental Data | |
| | | Income From Investment Operations: | Distributions From: | | | Ratio to Average Net Assets of: | |
| | Net Asset
Value,
Beginning
of Period | Net
Investment
Income
(Loss)(1) | Net
Realized
and
Unrealized
Gain (Loss) | Total From
Investment
Operations | Net
Investment
Income | Net
Realized
Gains | Total
Distributions | Net Asset
Value,
End
of Period | Total
Return(2) | Operating
Expenses | Operating
Expenses
(before
expense
waiver) | Net
Investment
Income
(Loss) | Net
Investment
Income
(Loss)
(before
expense
waiver) | Portfolio
Turnover
Rate | Net
Assets,
End of
Period
(in thousands) |
| Class I | | | | | | | | | | | | | | | |
| 2019 | $9.54 | 0.05 | 2.56 | 2.61 | (0.09) | (0.56) | (0.65) | $11.50 | 28.42% | 1.03% | 1.37% | 0.52% | 0.18% | 65% |
| $143,094 |
|
| 2018 | $12.18 | 0.09 | (1.79) | (1.70) | (0.15) | (0.79) | (0.94) | $9.54 | (15.22)% | 1.04% | 1.37% | 0.78% | 0.45% | 66% |
| $117,384 |
|
| 2017 | $9.37 | 0.09 | 2.81 | 2.90 | (0.09) | — | (0.09) | $12.18 | 31.21% | 1.09% | 1.35% | 0.81% | 0.55% | 58% |
| $153,123 |
|
| 2016 | $10.02 | 0.08 | (0.63) | (0.55) | (0.10) | — | (0.10) | $9.37 | (5.50)% | 1.10% | 1.37% | 0.87% | 0.60% | 71% |
| $160,668 |
|
| 2015 | $9.98 | 0.08 | —(3) | 0.08 | (0.04) | — | (0.04) | $10.02 | 0.76% | 1.03% | 1.33% | 0.79% | 0.49% | 59% |
| $183,648 |
|
| Class II | | | | | | | | | | | | | | | |
| 2019 | $9.53 | 0.04 | 2.55 | 2.59 | (0.08) | (0.56) | (0.64) | $11.48 | 28.14% | 1.18% | 1.52% | 0.37% | 0.03% | 65% |
| $41,227 |
|
| 2018 | $12.16 | 0.07 | (1.78) | (1.71) | (0.13) | (0.79) | (0.92) | $9.53 | (15.29)% | 1.19% | 1.52% | 0.63% | 0.30% | 66% |
| $36,919 |
|
| 2017 | $9.36 | 0.06 | 2.82 | 2.88 | (0.08) | — | (0.08) | $12.16 | 30.93% | 1.24% | 1.50% | 0.66% | 0.40% | 58% |
| $46,223 |
|
| 2016 | $10.00 | 0.07 | (0.62) | (0.55) | (0.09) | — | (0.09) | $9.36 | (5.55)% | 1.25% | 1.52% | 0.72% | 0.45% | 71% |
| $38,746 |
|
| 2015 | $9.97 | 0.07 | (0.02) | 0.05 | (0.02) | — | (0.02) | $10.00 | 0.51% | 1.18% | 1.48% | 0.64% | 0.34% | 59% |
| $47,756 |
|
|
|
| Notes to Financial Highlights |
| |
| (1) | Computed using average shares outstanding throughout the period. |
| |
| (2) | Total returns are calculated based on the net asset value of the last business day. Total returns for periods less than one year are not annualized. The total returns presented do not include the fees and charges assessed with investments in variable insurance products, those charges are disclosed in the separate account prospectus. The inclusion of such fees and charges would lower total return. |
| |
| (3) | Per-share amount was less than $0.005. |
See Notes to Financial Statements.
|
|
| Report of Independent Registered Public Accounting Firm |
To the Shareholders and the Board of Directors of American Century Variable Portfolios, Inc.:
Opinion on the Financial Statements and Financial Highlights
We have audited the accompanying statement of assets and liabilities, including the schedule of investments, of VP International Fund, one of the funds constituting the American Century Variable Portfolios, Inc. (the "Fund"), as of December 31, 2019, the related statement of operations for the year then ended, the statements of changes in net assets for each of the two years in the period then ended, the financial highlights for each of the five years in the period then ended, and the related notes. In our opinion, the financial statements and financial highlights present fairly, in all material respects, the financial position of VP International Fund of the American Century Variable Portfolios, Inc. as of December 31, 2019, the results of its operations for the year then ended, the changes in its net assets for each of the two years in the period then ended, and the financial highlights for each of the five years in the period then ended, in conformity with accounting principles generally accepted in the United States of America.
Basis for Opinion
These financial statements and financial highlights are the responsibility of the Fund's management. Our responsibility is to express an opinion on the Fund’s financial statements and financial highlights based on our audits. We are a public accounting firm registered with the Public Company Accounting Oversight Board (United States) (PCAOB) and are required to be independent with respect to the Fund in accordance with the U.S. federal securities laws and the applicable rules and regulations of the Securities and Exchange Commission and the PCAOB.
We conducted our audits in accordance with the standards of the PCAOB. Those standards require that we plan and perform the audit to obtain reasonable assurance about whether the financial statements and financial highlights are free of material misstatement, whether due to error or fraud. The Fund is not required to have, nor were we engaged to perform, an audit of its internal control over financial reporting. As part of our audits we are required to obtain an understanding of internal control over financial reporting but not for the purpose of expressing an opinion on the effectiveness of the Fund’s internal control over financial reporting. Accordingly, we express no such opinion.
Our audits included performing procedures to assess the risks of material misstatement of the financial statements and financial highlights, whether due to error or fraud, and performing procedures that respond to those risks. Such procedures included examining, on a test basis, evidence regarding the amounts and disclosures in the financial statements and financial highlights. Our audits also included evaluating the accounting principles used and significant estimates made by management, as well as evaluating the overall presentation of the financial statements and financial highlights. Our procedures included confirmation of securities owned as of December 31, 2019, by correspondence with the custodian and brokers. We believe that our audits provide a reasonable basis for our opinion.
DELOITTE & TOUCHE LLP
Kansas City, Missouri
February 13, 2020
We have served as the auditor of one or more American Century investment companies since 1997.
The Board of Directors
The individuals listed below serve as directors of the funds. Each director will continue to serve in this capacity until death, retirement, resignation or removal from office. The board has adopted a mandatory retirement age for directors who are not “interested persons,” as that term is defined in the Investment Company Act (independent directors). Independent directors shall retire by December 31 of the year in which they reach their 75th birthday.
Mr. Thomas is an “interested person” because he currently serves as President and Chief Executive Officer of American Century Companies, Inc. (ACC), the parent company of American Century Investment Management, Inc. (ACIM or the advisor). The other directors (more than three-fourths of the total number) are independent. They are not employees, directors or officers of, and have no financial interest in, ACC or any of its wholly owned, direct or indirect, subsidiaries, including ACIM, American Century Investment Services, Inc. (ACIS) and American Century Services, LLC (ACS), and they do not have any other affiliations, positions or relationships that would cause them to be considered “interested persons” under the Investment Company Act. The directors serve in this capacity for seven (in the case of Jonathan S. Thomas, 16; and Stephen E. Yates, 8) registered investment companies in the American Century Investments family of funds.
The following table presents additional information about the directors. The mailing address for each director is 4500 Main Street, Kansas City, Missouri 64111.
|
| | | | | |
Name
(Year of Birth) | Position(s) Held with Funds | Length of Time Served | Principal Occupation(s) During Past 5 Years | Number of American Century Portfolios Overseen by Director | Other Directorships Held During Past 5 Years |
| Independent Directors |
|
|
| Thomas W. Bunn (1953) | Director | Since 2017 | Retired | 64 | SquareTwo Financial; Barings (formerly Babson Capital Funds Trust) (2013 to 2016) |
Chris H. Cheesman
(1962)
| Director | Since 2019
| Retired. Senior Vice President & Chief Audit Executive, AllianceBernstein (1999 to 2018)
| 64 | None |
Barry Fink
(1955) | Director | Since 2012 (independent since 2016) | Retired | 64 | None |
Rajesh K. Gupta
(1960)
| Director | Since 2019
| Partner Emeritus, SeaCrest Investment Management and SeaCrest Wealth Management (2019 to Present); Chief Executive Officer and Chief Investment Officer, SeaCrest Investment Management (2006 to 2019); Chief Executive Officer and Chief Investment Officer, SeaCrest Wealth Management (2008 to 2019)
| 64 | None |
|
| | | | | |
Name
(Year of Birth) | Position(s) Held with Funds | Length of Time Served | Principal Occupation(s) During Past 5 Years | Number of American Century Portfolios Overseen by Director | Other Directorships Held During Past 5 Years |
| Independent Directors |
|
|
Lynn Jenkins
(1963)
| Director | Since 2019
| Consultant, LJ Strategies (2019 to present); United States Representative, U.S. House of Representatives (2009 to 2018) | 64 | MGP Ingredients, Inc. |
Jan M. Lewis
(1957) | Director | Since 2011 | Retired | 64 | None |
John R. Whitten
(1946) | Director | Since 2008 | Retired | 64 | Onto Innovation Inc.; Rudolph Technologies, Inc. (2006 to 2019) |
Stephen E. Yates
(1948) | Director and Chairman of the Board | Since 2012 (Chairman since 2018) | Retired | 79 | None |
| Interested Director |
|
Jonathan S. Thomas
(1963) | Director | Since 2007 | President and Chief Executive Officer, ACC (2007 to present). Also serves as Chief Executive Officer, ACS; Executive Vice President, ACIM; Director, ACC, ACIM and other ACC subsidiaries | 120 | None |
The Statement of Additional Information has additional information about the fund's directors and is available without charge, upon request, by calling 1-800-378-9878.
Officers
The following table presents certain information about the executive officers of the funds. Each officer serves as an officer for 16 (in the case of Robert J. Leach, 15) investment companies in the American Century family of funds. No officer is compensated for his or her service as an officer of the funds. The listed officers are interested persons of the funds and are appointed or re-appointed on an annual basis. The mailing address for each officer listed below is 4500 Main Street, Kansas City, Missouri 64111.
|
| | |
Name
(Year of Birth) | Offices with the Funds | Principal Occupation(s) During the Past Five Years |
Patrick Bannigan
(1965) | President since 2019 | Executive Vice President and Director, ACC (2012 to present); Chief Financial Officer, Chief Accounting Officer and Treasurer, ACC (2015 to present); Chief Operating Officer, ACC (2012-2015). Also serves as President, ACS; Vice President, ACIM; Chief Financial Officer, Chief Accounting Officer and/or Director, ACIM, ACS and other ACC subsidiaries |
R. Wes Campbell
(1974) | Chief Financial Officer and Treasurer since 2018 | Investment Operations and Investment Accounting, ACS (2000 to present) |
Amy D. Shelton
(1964) | Chief Compliance Officer and Vice President since 2014 | Chief Compliance Officer, American Century funds, (2014 to present); Chief Compliance Officer, ACIM (2014 to present); Chief Compliance Officer, ACIS (2009 to present). Also serves as Vice President, ACIS |
Charles A. Etherington
(1957) | General Counsel since 2007 and Senior Vice President since 2006 | Attorney, ACC (1994 to present); Vice President, ACC (2005 to present); General Counsel, ACC (2007 to present). Also serves as General Counsel, ACIM, ACS, ACIS and other ACC subsidiaries; and Senior Vice President, ACIM and ACS |
C. Jean Wade
(1964) | Vice President since 2012 | Senior Vice President, ACS (2017 to present); Vice President, ACS (2000 to 2017)
|
Robert J. Leach
(1966) | Vice President since 2006 | Vice President, ACS (2000 to present) |
David H. Reinmiller
(1963) | Vice President since 2000 | Attorney, ACC (1994 to present). Also serves as Vice President, ACIM and ACS |
Ward D. Stauffer
(1960) | Secretary since 2005 | Attorney, ACC (2003 to present) |
Proxy Voting Policies
A description of the policies that the fund's investment advisor uses in exercising the voting rights associated with the securities purchased and/or held by the fund is available without charge, upon request, by calling 1-800-378-9878. It is also available on American Century Investments’ website at americancentury.com/proxy and on the Securities and Exchange Commission’s website at sec.gov. Information regarding how the investment advisor voted proxies relating to portfolio securities during the most recent 12-month period ended June 30 is available on americancentury.com/proxy. It is also available at sec.gov.
Quarterly Portfolio Disclosure
The fund files its complete schedule of portfolio holdings with the Securities and Exchange Commission (SEC) for the first and third quarters of each fiscal year on Form N-Q or as an exhibit to its reports on Form N-PORT. The fund’s Forms N-Q and Form N-PORT reports are available on the SEC’s website at sec.gov. The fund also makes its complete schedule of portfolio holdings for the most recent quarter of its fiscal year available on its website at ipro.americancentury.com (for Investment Professionals) and, upon request, by calling 1-800-378-9878.
Other Tax Information
The following information is provided pursuant to provisions of the Internal Revenue Code.
The fund hereby designates $8,962,600, or up to the maximum amount allowable, as long-term capital gain distributions (20% rate gain distributions) for the fiscal year ended December 31, 2019.
For the fiscal year ended December 31, 2019, the fund intends to pass through to shareholders foreign source income of $2,915,954 and foreign taxes paid of $265,568, or up to the maximum amount allowable, as a foreign tax credit. Foreign source income and foreign tax expense per outstanding share on December 31, 2019 are $0.1819 and $0.0166, respectively.
|
| | |
| |
| | | |
| Contact Us | americancentury.com | |
| Automated Information Line | 1-800-345-8765 | |
| Investment Professional Service Representatives | 1-800-345-6488 | |
| Telecommunications Relay Service for the Deaf | 711 | |
| | | |
| American Century Variable Portfolios, Inc. | |
| | | |
Investment Advisor: American Century Investment Management, Inc. Kansas City, Missouri | |
| | | |
| This report and the statements it contains are submitted for the general information of our shareholders. The report is not authorized for distribution to prospective investors unless preceded or accompanied by an effective prospectus. | |
| | | |
©2020 American Century Proprietary Holdings, Inc. All rights reserved.
CL-ANN-91441 2002 | |
|
| |
| | |
| | Annual Report |
| | |
| | December 31, 2019 |
| | |
| | VP Large Company Value Fund |
| | Class I (AVVIX) |
| | Class II (AVVTX) |
Beginning on January 1, 2021, as permitted by regulations adopted by the Securities and Exchange Commission, paper copies of the fund’s shareholder reports like this one will no longer be sent by mail from the insurance company that offers your contract, unless you specifically request paper copies of the reports from the insurance company or from your financial intermediary. Instead, the reports will be made available on a website, and you will be notified by mail each time a report is posted and provided with a website link to access the report.
If you already elected to receive shareholder reports electronically, you will not be affected by this change and you need not take any action. You may elect to receive shareholder reports and other communications from the insurance company or your financial intermediary electronically by contacting the insurance company.
You may elect to receive all future reports in paper free of charge. You can inform the insurance company or your financial intermediary that you wish to continue receiving paper copies of your shareholder reports by contacting the insurance company. Your election to receive reports in paper will apply to all variable portfolios available under your contract.
|
| |
| Performance | |
| Portfolio Commentary | |
| Fund Characteristics | |
| Shareholder Fee Example | |
| Schedule of Investments | |
| Statement of Assets and Liabilities | |
| Statement of Operations | |
| Statement of Changes in Net Assets | |
| Notes to Financial Statements | |
| Financial Highlights | |
| Report of Independent Registered Public Accounting Firm | |
| Management | |
| Additional Information | |
Any opinions expressed in this report reflect those of the author as of the date of the report, and do not necessarily represent the opinions of American Century Investments® or any other person in the American Century Investments organization. Any such opinions are subject to change at any time based upon market or other conditions and American Century Investments disclaims any responsibility to update such opinions. These opinions may not be relied upon as investment advice and, because investment decisions made by American Century Investments funds are based on numerous factors, may not be relied upon as an indication of trading intent on behalf of any American Century Investments fund. Security examples are used for representational purposes only and are not intended as recommendations to purchase or sell securities. Performance information for comparative indices and securities is provided to American Century Investments by third party vendors. To the best of American Century Investments’ knowledge, such information is accurate at the time of printing.
|
| | | | | |
| Total Returns as of December 31, 2019 |
| | | | Average Annual Returns | |
| | Ticker Symbol | 1 year | 5 years | 10 years | Inception Date |
| Class I | AVVIX | 27.48% | 7.59% | 10.81% | 12/1/04 |
| Russell 1000 Value Index | — | 26.54% | 8.28% | 11.79% | — |
| S&P 500 Index | — | 31.49% | 11.69% | 13.55% | — |
| Class II | AVVTX | 27.31% | 7.43% | 10.64% | 10/29/04 |
Fund returns would have been lower if a portion of the fees had not been waived.
The performance information presented does not include the fees and charges assessed with investments in variable insurance products, those charges are disclosed in the separate account prospectus. The inclusion of such fees and charges would lower performance.
Data presented reflect past performance. Past performance is no guarantee of future results. Current performance may be higher or lower than the performance shown. Total returns for periods less than one year are not annualized. Investment return and principal value will fluctuate, and redemption value may be more or less than original cost. Data assumes reinvestment of dividends and capital gains, and none of the charts reflect the deduction of taxes that a shareholder would pay on fund distributions or the redemption of fund shares. To obtain performance data current to the most recent month end, please call 1-800-345-6488 or visit ipro.americancentury.com (for Investment Professionals). For additional information about the fund, please consult the prospectus.
|
|
| Growth of $10,000 Over 10 Years |
| $10,000 investment made December 31, 2009 |
| Performance for other share classes will vary due to differences in fee structure. |
|
| |
| Value on December 31, 2019 |
| | Class I — $27,923 |
| |
| | Russell 1000 Value Index — $30,505 |
| |
| | S&P 500 Index — $35,666 |
| |
Ending value of Class I would have been lower if a portion of the fees had not been waived.
|
| |
| Total Annual Fund Operating Expenses |
| Class I | Class II |
| 0.91% | 1.06% |
The total annual fund operating expenses shown is as stated in the fund’s prospectus current as of the date of this report. The prospectus may vary from the expense ratio shown elsewhere in this report because it is based on a different time period, includes acquired fund fees and expenses, and, if applicable, does not include fee waivers or expense reimbursements.
Data presented reflect past performance. Past performance is no guarantee of future results. Current performance may be higher or lower than the performance shown. Total returns for periods less than one year are not annualized. Investment return and principal value will fluctuate, and redemption value may be more or less than original cost. Data assumes reinvestment of dividends and capital gains, and none of the charts reflect the deduction of taxes that a shareholder would pay on fund distributions or the redemption of fund shares. To obtain performance data current to the most recent month end, please call 1-800-345-6488 or visit ipro.americancentury.com (for Investment Professionals). For additional information about the fund, please consult the prospectus.
Portfolio Managers: Brian Woglom, Phil Davidson and Phil Sundell
In April 2019, portfolio manager Phil Sundell joined the fund’s management team.
Performance Summary
VP Large Company Value returned 27.31%* for the 12 months ended December 31, 2019. The fund’s benchmark, the Russell 1000 Value Index, returned 26.54% for the same time period. The fund’s return reflects operating expenses, while the index’s return does not.
Stock selection in the energy, health care and consumer staples sectors were key drivers of the portfolio’s relative performance. Conversely, stock selection in the communication services, materials and consumer discretionary sectors detracted from performance.
Energy, Health Care and Consumer Staples Contributed
Security selection in the energy sector positively impacted relative performance. Throughout the year, we did not hold Exxon Mobil because we identified other energy stocks with more attractive risk/reward profiles. The lack of exposure to Exxon was beneficial as the company continued to struggle with execution. The portfolio’s position in Anadarko Petroleum was a key contributor. The stock of this global exploration and production company rose after Chevron agreed to acquire Anadarko at a premium. The stock appreciated further after Occidental Petroleum made two higher offers to acquire Anadarko. We exited Anadarko on strength in the stock price.
Health care was another area of strength. Within the sector, Zimmer Biomet Holdings was a top contributor. This medical device company was supported by solid financial results. Zimmer also reported positive updates on its early ROSA robot placements and improvements in FDA-related supply constraints. Our analysis points to upside potential from 2019 product launches, final remediation of FDA issues and potential for market share recapture starting in 2020.
Within the consumer staples sector, Mondelez International, a snack food company, positively impacted performance. The stock outperformed due to strong revenue growth. We trimmed the position due to its valuation becoming less attractive.
Applied Materials, a holding in the information technology sector, was another top individual contributor. Although the macroenvironment remains uncertain, this semiconductor equipment company outperformed after reporting solid financial results. We believe the company remains well positioned, supported by greenfield investments and share gains from its new tool offerings.
Communication Services Detracted
The portfolio’s lack of exposure to several stocks in the communication services sector weighed on returns. More specifically, not owning AT&T detracted. The stock of the communications giant outperformed when Elliott Management, an activist shareholder firm, took a position in the company. Elliott encouraged AT&T to sell noncore assets and accelerate cost-cutting/expense reduction. We avoided AT&T and instead held a position in Verizon Communications, as our analysis showed Verizon offered stability and a superior balance sheet relative to AT&T.
*All fund returns referenced in this commentary are for Class II shares. Returns would have been lower if a portion of the fees had not been waived. Performance for other share classes will vary due to differences in fee structure; when Class II performance exceeds that of the fund’s benchmark, other share classes may not. See page 2 for returns for all share classes.
Holdings in the materials and consumer discretionary sectors also detracted from performance, including Advance Auto Parts. During the fourth quarter of 2019, this retailer of aftermarket replacement parts reported quarterly earnings ahead of expectations due to cost-cutting, but sales
and gross profit margins came in slightly behind expectations. The stock underperformed on worries around the pace of the company’s margin improvement progress for 2020.
While the portfolio’s energy holdings added to performance overall, TOTAL was a top individual detractor. The stock of this large integrated energy company declined as lower oil and gas prices hurt TOTAL’s potential generation of free cash flow and return on invested capital. Additionally, TOTAL lowered its near-term free cash flow guidance.
Not owning Citigroup, the multinational investment banking and financial services corporation, also weighed on performance. During 2019, Citigroup benefited from improved revenues in its consumer and institutional businesses, low credit costs, better expense management and increased share repurchases. The portfolio’s position in The Bank of New York Mellon, a global financial firm, was another key detractor. The company faced greater-than-expected headwinds to net interest revenue due to the lower interest rate environment and a shift in client deposits from noninterest-bearing to interest-bearing accounts. Also, the abrupt departure of the CEO, who left to lead a turnaround at Wells Fargo & Co., generated uncertainty in the company’s strategy and outlook.
During the period, the portfolio owned forward foreign currency exchange contracts to offset the inherent currency risks of holding foreign securities. Exposure to these instruments did not have a material effect on performance.
Portfolio Positioning
The portfolio seeks to invest in companies where we believe the valuation does not reflect the quality and normal earnings power of the company. Our process is based on individual security selection, but broad themes have emerged.
We finished the year with a notable overweight position in the health care sector. According to our analysis, the portfolio’s health care holdings offer compelling valuations and risk/reward profiles, particularly in the health care equipment and supplies and pharmaceuticals industries.
On the other hand, we have found limited opportunities in communication services, leading to an underweight position in the sector. As of December 31, 2019, Verizon Communications was our only communication services holding. We believe Verizon offers relative stability and balance sheet strength. Our analysis shows that many other stocks in the sector have volatile business models, higher levels of leverage and extended valuations.
|
| |
| DECEMBER 31, 2019 |
| Top Ten Holdings | % of net assets |
| Johnson & Johnson | 4.2% |
| Medtronic plc | 4.1% |
| Berkshire Hathaway, Inc., Class B | 3.8% |
| PNC Financial Services Group, Inc. (The) | 3.4% |
| Verizon Communications, Inc. | 3.4% |
| Pfizer, Inc. | 3.3% |
| Zimmer Biomet Holdings, Inc. | 3.2% |
| TOTAL SA ADR | 2.5% |
| JPMorgan Chase & Co. | 2.5% |
| Chubb Ltd. | 2.3% |
| | |
| Top Five Industries | % of net assets |
| Banks | 13.1% |
| Health Care Equipment and Supplies | 8.8% |
| Pharmaceuticals | 7.5% |
| Oil, Gas and Consumable Fuels | 5.7% |
| Electric Utilities | 5.6% |
| | |
| Types of Investments in Portfolio | % of net assets |
| Domestic Common Stocks | 88.6% |
| Foreign Common Stocks* | 6.8% |
| Exchange-Traded Funds | 2.2% |
| Total Equity Exposure | 97.6% |
| Temporary Cash Investments | 2.2% |
| Other Assets and Liabilities | 0.2% |
*Includes depositary shares, dual listed securities and foreign ordinary shares.
Fund shareholders may incur two types of costs: (1) transaction costs, including sales charges (loads) on purchase payments and redemption/exchange fees; and (2) ongoing costs, including management fees; distribution and service (12b-1) fees; and other fund expenses. This example is intended to help you understand your ongoing costs (in dollars) of investing in your fund and to compare these costs with the ongoing cost of investing in other mutual funds.
The example is based on an investment of $1,000 made at the beginning of the period and held for the entire period from July 1, 2019 to December 31, 2019.
Actual Expenses
The table provides information about actual account values and actual expenses for each class. You may use the information, together with the amount you invested, to estimate the expenses that you paid over the period. First, identify the share class you own. Then simply divide your account value by $1,000 (for example, an $8,600 account value divided by $1,000 = 8.6), then multiply the result by the number under the heading “Expenses Paid During Period” to estimate the expenses you paid on your account during this period.
Hypothetical Example for Comparison Purposes
The table also provides information about hypothetical account values and hypothetical expenses based on the actual expense ratio of each class of your fund and an assumed rate of return of 5% per year before expenses, which is not the actual return of a fund’s share class. The hypothetical account values and expenses may not be used to estimate the actual ending account balance or expenses you paid for the period. You may use this information to compare the ongoing costs of investing in your fund and other funds. To do so, compare this 5% hypothetical example with the 5% hypothetical examples that appear in the shareholder reports of the other funds.
Please note that the expenses shown in the table are meant to highlight your ongoing costs only and do not reflect any transactional costs, such as sales charges (loads) or redemption/exchange fees. Therefore, the table is useful in comparing ongoing costs only, and will not help you determine the relative total costs of owning different funds. In addition, if these transactional costs were included, your costs would have been higher.
|
| | | | |
| | Beginning
Account Value
7/1/19 | Ending
Account Value
12/31/19 | Expenses Paid
During Period(1)
7/1/19 - 12/31/19 |
Annualized
Expense Ratio(1) |
| Actual | | | | |
| Class I | $1,000 | $1,096.50 | $4.02 | 0.76% |
| Class II | $1,000 | $1,095.40 | $4.81 | 0.91% |
| Hypothetical | | | | |
| Class I | $1,000 | $1,021.37 | $3.87 | 0.76% |
| Class II | $1,000 | $1,020.62 | $4.63 | 0.91% |
| |
| (1) | Expenses are equal to the class's annualized expense ratio listed in the table above, multiplied by the average account value over the period, multiplied by 184, the number of days in the most recent fiscal half-year, divided by 365, to reflect the one-half year period. Annualized expense ratio reflects actual expenses, including any applicable fee waivers or expense reimbursements and excluding any acquired fund fees and expenses. |
DECEMBER 31, 2019
|
| | | | |
| | Shares | Value |
| COMMON STOCKS — 95.4% | | |
| Aerospace and Defense — 0.7% | | |
| Textron, Inc. | 9,960 | $ | 444,216 |
|
| Air Freight and Logistics — 1.0% | | |
| United Parcel Service, Inc., Class B | 5,070 | 593,494 |
|
| Airlines — 1.5% | | |
| Southwest Airlines Co. | 16,960 | 915,501 |
|
| Automobiles — 0.9% | | |
| Honda Motor Co. Ltd. ADR | 18,910 | 535,342 |
|
| Banks — 13.1% | | |
| Bank of America Corp. | 16,270 | 573,029 |
|
| JPMorgan Chase & Co. | 10,900 | 1,519,460 |
|
| PNC Financial Services Group, Inc. (The) | 13,030 | 2,079,979 |
|
| Truist Financial Corp. | 22,460 | 1,264,947 |
|
| U.S. Bancorp | 22,030 | 1,306,159 |
|
| Wells Fargo & Co. | 21,100 | 1,135,180 |
|
| | | 7,878,754 |
|
| Beverages — 1.6% | | |
| PepsiCo, Inc. | 7,110 | 971,724 |
|
| Biotechnology — 0.7% | | |
| Gilead Sciences, Inc. | 6,660 | 432,767 |
|
| Building Products — 1.0% | | |
| Johnson Controls International plc | 14,720 | 599,251 |
|
| Capital Markets — 3.5% | | |
| Ameriprise Financial, Inc. | 5,030 | 837,897 |
|
| Bank of New York Mellon Corp. (The) | 25,250 | 1,270,833 |
|
| | | 2,108,730 |
|
| Chemicals — 0.6% | | |
| DuPont de Nemours, Inc. | 5,930 | 380,706 |
|
| Communications Equipment — 1.5% | | |
| Cisco Systems, Inc. | 18,210 | 873,352 |
|
| Diversified Financial Services — 3.8% | | |
Berkshire Hathaway, Inc., Class B(1) | 10,220 | 2,314,830 |
|
| Diversified Telecommunication Services — 3.4% | | |
| Verizon Communications, Inc. | 33,040 | 2,028,656 |
|
| Electric Utilities — 5.6% | | |
| Eversource Energy | 12,420 | 1,056,569 |
|
| Pinnacle West Capital Corp. | 12,630 | 1,135,816 |
|
| Xcel Energy, Inc. | 18,280 | 1,160,597 |
|
| | | 3,352,982 |
|
| Electrical Equipment — 2.9% | | |
| Eaton Corp. plc | 5,400 | 511,488 |
|
| Emerson Electric Co. | 16,370 | 1,248,376 |
|
| | | 1,759,864 |
|
|
| | | | |
| | Shares | Value |
| Electronic Equipment, Instruments and Components — 1.1% | | |
| TE Connectivity Ltd. | 7,000 | $ | 670,880 |
|
| Energy Equipment and Services — 2.5% | | |
| Baker Hughes Co. | 16,860 | 432,122 |
|
| Schlumberger Ltd. | 26,320 | 1,058,064 |
|
| | | 1,490,186 |
|
| Equity Real Estate Investment Trusts (REITs) — 3.0% | | |
| Welltower, Inc. | 11,700 | 956,826 |
|
| Weyerhaeuser Co. | 28,840 | 870,968 |
|
| | | 1,827,794 |
|
| Food and Staples Retailing — 1.9% | | |
| Koninklijke Ahold Delhaize NV | 22,230 | 557,125 |
|
| Walmart, Inc. | 5,040 | 598,954 |
|
| | | 1,156,079 |
|
| Food Products — 1.7% | | |
| Conagra Brands, Inc. | 7,800 | 267,072 |
|
| Mondelez International, Inc., Class A | 14,220 | 783,238 |
|
| | | 1,050,310 |
|
| Health Care Equipment and Supplies — 8.8% | | |
Hologic, Inc.(1) | 17,430 | 910,020 |
|
| Medtronic plc | 21,650 | 2,456,193 |
|
| Zimmer Biomet Holdings, Inc. | 13,030 | 1,950,330 |
|
| | | 5,316,543 |
|
| Health Care Providers and Services — 1.4% | | |
| Quest Diagnostics, Inc. | 7,610 | 812,672 |
|
| Health Care Technology — 1.5% | | |
| Cerner Corp. | 12,630 | 926,916 |
|
| Hotels, Restaurants and Leisure — 0.8% | | |
| Carnival Corp. | 8,880 | 451,370 |
|
| Household Durables — 0.5% | | |
| PulteGroup, Inc. | 8,350 | 323,980 |
|
| Household Products — 5.1% | | |
| Colgate-Palmolive Co. | 18,330 | 1,261,837 |
|
| Kimberly-Clark Corp. | 5,630 | 774,407 |
|
| Procter & Gamble Co. (The) | 8,520 | 1,064,148 |
|
| | | 3,100,392 |
|
| Industrial Conglomerates — 1.5% | | |
| Siemens AG | 6,940 | 907,196 |
|
| Insurance — 3.1% | | |
| Aflac, Inc. | 9,180 | 485,622 |
|
| Chubb Ltd. | 8,980 | 1,397,827 |
|
| | | 1,883,449 |
|
| Machinery — 0.7% | | |
| Cummins, Inc. | 2,490 | 445,610 |
|
| Oil, Gas and Consumable Fuels — 5.7% | | |
| Chevron Corp. | 10,060 | 1,212,330 |
|
| ConocoPhillips | 10,820 | 703,625 |
|
|
| | | | |
| | Shares | Value |
| TOTAL SA ADR | 27,570 | $ | 1,524,621 |
|
| | | 3,440,576 |
|
| Paper and Forest Products — 1.0% | | |
| Mondi plc | 26,260 | 619,908 |
|
| Pharmaceuticals — 7.5% | | |
| Johnson & Johnson | 17,520 | 2,555,642 |
|
| Pfizer, Inc. | 50,250 | 1,968,795 |
|
| | | 4,524,437 |
|
| Semiconductors and Semiconductor Equipment — 3.5% | | |
| Applied Materials, Inc. | 4,890 | 298,486 |
|
| Intel Corp. | 12,510 | 748,723 |
|
| Maxim Integrated Products, Inc. | 6,650 | 409,042 |
|
| Texas Instruments, Inc. | 5,290 | 678,654 |
|
| | | 2,134,905 |
|
| Software — 1.0% | | |
| Oracle Corp. (New York) | 11,300 | 598,674 |
|
| Specialty Retail — 1.3% | | |
| Advance Auto Parts, Inc. | 4,860 | 778,378 |
|
TOTAL COMMON STOCKS
(Cost $48,256,855) | | 57,650,424 |
|
| EXCHANGE-TRADED FUNDS — 2.2% | | |
iShares Russell 1000 Value ETF
(Cost $1,177,210) | 9,650 | 1,317,032 |
|
| TEMPORARY CASH INVESTMENTS — 2.2% | | |
| Repurchase Agreement, BMO Capital Markets Corp., (collateralized by various U.S. Treasury obligations, 2.75% - 3.75%, 9/15/21 - 11/15/43, valued at $1,080,491), in a joint trading account at 1.35%, dated 12/31/19, due 1/2/20 (Delivery value $1,057,783) | | 1,057,704 |
|
| Repurchase Agreement, Fixed Income Clearing Corp., (collateralized by various U.S. Treasury obligations, 1.625%, 12/15/22, valued at $240,355), at 0.65%, dated 12/31/19, due 1/2/20 (Delivery value $235,008) | | 235,000 |
|
| State Street Institutional U.S. Government Money Market Fund, Premier Class | 1,037 | 1,037 |
|
TOTAL TEMPORARY CASH INVESTMENTS
(Cost $1,293,741) | | 1,293,741 |
|
TOTAL INVESTMENT SECURITIES — 99.8%
(Cost $50,727,806) | | 60,261,197 |
|
| OTHER ASSETS AND LIABILITIES — 0.2% | | 132,097 |
|
| TOTAL NET ASSETS — 100.0% | | $ | 60,393,294 |
|
|
| | | | | | | | |
| FORWARD FOREIGN CURRENCY EXCHANGE CONTRACTS |
| Currency Purchased | Currency Sold | Counterparty | Settlement Date | Unrealized Appreciation
(Depreciation) |
| USD | 2,508,357 | EUR | 2,234,337 | Credit Suisse AG | 3/31/20 | $ | (11,743 | ) |
| GBP | 12,093 | USD | 15,793 | JPMorgan Chase Bank N.A. | 3/31/20 | 263 |
|
| USD | 14,401 | GBP | 10,937 | JPMorgan Chase Bank N.A. | 3/31/20 | (122 | ) |
| USD | 526,361 | GBP | 399,585 | JPMorgan Chase Bank N.A. | 3/31/20 | (4,205 | ) |
| JPY | 1,901,345 | USD | 17,579 | Bank of America N.A. | 3/31/20 | 3 |
|
| USD | 472,051 | JPY | 51,353,463 | Bank of America N.A. | 3/31/20 | (2,823 | ) |
| | | | | | | $ | (18,627 | ) |
|
| | |
| NOTES TO SCHEDULE OF INVESTMENTS |
| ADR | - | American Depositary Receipt |
| EUR | - | Euro |
| GBP | - | British Pound |
| JPY | - | Japanese Yen |
| USD | - | United States Dollar |
See Notes to Financial Statements.
|
|
| Statement of Assets and Liabilities |
|
| | | |
| DECEMBER 31, 2019 | |
| Assets | |
| Investment securities, at value (cost of $50,727,806) | $ | 60,261,197 |
|
| Receivable for investments sold | 43,582 |
|
| Receivable for capital shares sold | 74,866 |
|
| Unrealized appreciation on forward foreign currency exchange contracts | 266 |
|
| Dividends and interest receivable | 85,765 |
|
| | 60,465,676 |
|
| | |
| Liabilities | |
| Payable for capital shares redeemed | 9,369 |
|
| Unrealized depreciation on forward foreign currency exchange contracts | 18,893 |
|
| Accrued management fees | 33,858 |
|
| Distribution fees payable | 10,262 |
|
| | 72,382 |
|
| | |
| Net Assets | $ | 60,393,294 |
|
| | |
| Net Assets Consist of: | |
| Capital (par value and paid-in surplus) | $ | 51,227,621 |
|
| Distributable earnings | 9,165,673 |
|
| | $ | 60,393,294 |
|
|
| | | | | | |
| | Net Assets | Shares Outstanding | Net Asset Value Per Share |
| Class I, $0.01 Par Value |
| $11,514,499 |
| 706,845 |
| $16.29 |
| Class II, $0.01 Par Value |
| $48,878,795 |
| 2,951,937 |
| $16.56 |
See Notes to Financial Statements.
|
| | | |
| YEAR ENDED DECEMBER 31, 2019 |
| Investment Income (Loss) |
| Income: | |
| Dividends (net of foreign taxes withheld of $13,918) | $ | 1,186,183 |
|
| Interest | 26,010 |
|
| | 1,212,193 |
|
| | |
| Expenses: | |
| Management fees | 385,658 |
|
| Distribution fees - Class II | 93,410 |
|
| Directors' fees and expenses | 1,466 |
|
| Other expenses | 331 |
|
| | 480,865 |
|
Fees waived(1) | (68,130 | ) |
| | 412,735 |
|
| | |
| Net investment income (loss) | 799,458 |
|
| | |
| Realized and Unrealized Gain (Loss) | |
| Net realized gain (loss) on: | |
| Investment transactions | (112,621 | ) |
| Forward foreign currency exchange contract transactions | 91,897 |
|
| Foreign currency translation transactions | (1,669 | ) |
| | (22,393 | ) |
| | |
| Change in net unrealized appreciation (depreciation) on: | |
| Investments | 9,878,762 |
|
| Forward foreign currency exchange contracts | 4,088 |
|
| Translation of assets and liabilities in foreign currencies | (5 | ) |
| | 9,882,845 |
|
| | |
| Net realized and unrealized gain (loss) | 9,860,452 |
|
| | |
| Net Increase (Decrease) in Net Assets Resulting from Operations | $ | 10,659,910 |
|
| |
| (1) | Amount consists of $13,933 and $54,197 for Class I and Class II, respectively. |
See Notes to Financial Statements.
|
|
| Statement of Changes in Net Assets |
|
| | | | | | |
| YEARS ENDED DECEMBER 31, 2019 AND DECEMBER 31, 2018 |
| Increase (Decrease) in Net Assets | December 31, 2019 | December 31, 2018 |
| Operations | | |
| Net investment income (loss) | $ | 799,458 |
| $ | 487,849 |
|
| Net realized gain (loss) | (22,393 | ) | 1,020,285 |
|
| Change in net unrealized appreciation (depreciation) | 9,882,845 |
| (4,206,549 | ) |
| Net increase (decrease) in net assets resulting from operations | 10,659,910 |
| (2,698,415 | ) |
| | | |
| Distributions to Shareholders | | |
| From earnings: | | |
| Class I | (438,373 | ) | (611,555 | ) |
| Class II | (1,470,151 | ) | (1,297,485 | ) |
| Decrease in net assets from distributions | (1,908,524 | ) | (1,909,040 | ) |
| | | |
| Capital Share Transactions | | |
| Net increase (decrease) in net assets from capital share transactions (Note 5) | 20,853,859 |
| 13,341,476 |
|
| | | |
| Net increase (decrease) in net assets | 29,605,245 |
| 8,734,021 |
|
| | | |
| Net Assets | | |
| Beginning of period | 30,788,049 |
| 22,054,028 |
|
| End of period | $ | 60,393,294 |
| $ | 30,788,049 |
|
See Notes to Financial Statements.
|
|
| Notes to Financial Statements |
DECEMBER 31, 2019
1. Organization
American Century Variable Portfolios, Inc. (the corporation) is registered under the Investment Company Act of 1940, as amended (the 1940 Act), as an open-end management investment company and is organized as a Maryland corporation. VP Large Company Value Fund (the fund) is one fund in a series issued by the corporation. The fund’s investment objective is to seek long-term capital growth. Income is a secondary objective. The fund offers Class I and Class II.
2. Significant Accounting Policies
The following is a summary of significant accounting policies consistently followed by the fund in preparation of its financial statements. The fund is an investment company and follows accounting and reporting guidance in accordance with accounting principles generally accepted in the United States of America. This may require management to make certain estimates and assumptions at the date of the financial statements. Actual results could differ from these estimates. Management evaluated the impact of events or transactions occurring through the date the financial statements were issued that would merit recognition or disclosure.
Investment Valuations — The fund determines the fair value of its investments and computes its net asset value per share at the close of regular trading (usually 4 p.m. Eastern time) on the New York Stock Exchange (NYSE) on each day the NYSE is open. The Board of Directors has adopted valuation policies and procedures to guide the investment advisor in the fund’s investment valuation process and to provide methodologies for the oversight of the fund’s pricing function.
Equity securities that are listed or traded on a domestic securities exchange are valued at the last reported sales price or at the official closing price as provided by the exchange. Equity securities traded on foreign securities exchanges are generally valued at the closing price of such securities on the exchange where primarily traded or at the close of the NYSE, if that is earlier. If no last sales price is reported, or if local convention or regulation so provides, the mean of the latest bid and asked prices may be used. Securities traded over-the-counter are valued at the mean of the latest bid and asked prices, the last sales price, or the official closing price. Equity securities initially expressed in local currencies are translated into U.S. dollars at the mean of the appropriate currency exchange rate at the close of the NYSE as provided by an independent pricing service.
Open-end management investment companies are valued at the reported net asset value per share. Repurchase agreements are valued at cost, which approximates fair value. Forward foreign currency exchange contracts are valued at the mean of the appropriate forward exchange rate at the close of the NYSE as provided by an independent pricing service.
If the fund determines that the market price for an investment is not readily available or the valuation methods mentioned above do not reflect an investment’s fair value, such investment is valued as determined in good faith by the Board of Directors or its delegate, in accordance with policies and procedures adopted by the Board of Directors. In its determination of fair value, the fund may review several factors including, but not limited to, market information regarding the specific investment or comparable investments and correlation with other investment types, futures indices or general market indicators. Circumstances that may cause the fund to use these procedures to value an investment include, but are not limited to: an investment has been declared in default or is distressed; trading in a security has been suspended during the trading day or a security is not actively trading on its principal exchange; prices received from a regular pricing source are deemed unreliable; or there is a foreign market holiday and no trading occurred.
The fund monitors for significant events occurring after the close of an investment’s primary exchange but before the fund’s net asset value per share is determined. Significant events may include, but are not limited to: corporate announcements and transactions; governmental action and political unrest that could impact a specific investment or an investment sector; or armed conflicts, natural disasters and similar events that could affect investments in a specific country or region. The fund also monitors for significant fluctuations between domestic and foreign markets, as evidenced by the U.S. market or such other indicators that the Board of Directors, or its delegate, deems appropriate. The fund may apply a model-derived factor to the closing price of equity securities traded on foreign securities exchanges. The factor is based on observable market data as provided by an independent pricing service.
Security Transactions — Security transactions are accounted for as of the trade date. Net realized gains and losses are determined on the identified cost basis, which is also used for federal income tax purposes.
Investment Income — Dividend income less foreign taxes withheld, if any, is recorded as of the ex-dividend date. Distributions received on securities that represent a return of capital or long-term capital gain are recorded as a reduction of cost of investments and/or as a realized gain. The fund may estimate the components of distributions received that may be considered nontaxable distributions or long-term capital gain distributions for income tax purposes. Interest income is recorded on the accrual basis and includes accretion of discounts and amortization of premiums.
Foreign Currency Translations — All assets and liabilities initially expressed in foreign currencies are translated into U.S. dollars at prevailing exchange rates at period end. The fund may enter into spot foreign currency exchange contracts to facilitate transactions denominated in a foreign currency. Purchases and sales of investment securities, dividend and interest income, spot foreign currency exchange contracts, and expenses are translated at the rates of exchange prevailing on the respective dates of such transactions. Net realized and unrealized foreign currency exchange gains or losses related to investment securities are a component of net realized gain (loss) on investment transactions and change in net unrealized appreciation (depreciation) on investments, respectively.
Repurchase Agreements — The fund may enter into repurchase agreements with institutions that American Century Investment Management, Inc. (ACIM) (the investment advisor) has determined are creditworthy pursuant to criteria adopted by the Board of Directors. The fund requires that the collateral, represented by securities, received in a repurchase transaction be transferred to the custodian in a manner sufficient to enable the fund to obtain those securities in the event of a default under the repurchase agreement. ACIM monitors, on a daily basis, the securities transferred to ensure the value, including accrued interest, of the securities under each repurchase agreement is equal to or greater than amounts owed to the fund under each repurchase agreement.
Joint Trading Account — Pursuant to an Exemptive Order issued by the Securities and Exchange Commission, the fund, along with certain other funds in the American Century Investments family of funds, may transfer uninvested cash balances into a joint trading account. These balances are invested in one or more repurchase agreements that are collateralized by U.S. Treasury or Agency obligations.
Income Tax Status — It is the fund’s policy to distribute substantially all net investment income and net realized gains to shareholders and to otherwise qualify as a regulated investment company under provisions of the Internal Revenue Code. Accordingly, no provision has been made for income taxes. The fund files U.S. federal, state, local and non-U.S. tax returns as applicable. The fund's tax returns are subject to examination by the relevant taxing authority until expiration of the applicable statute of limitations, which is generally three years from the date of filing but can be longer in certain jurisdictions. At this time, management believes there are no uncertain tax positions which, based on their technical merit, would not be sustained upon examination and for which it is reasonably possible that the total amounts of unrecognized tax benefits will significantly change in the next twelve months.
Multiple Class — All shares of the fund represent an equal pro rata interest in the net assets of the class to which such shares belong, and have identical voting, dividend, liquidation and other rights and the same terms and conditions, except for class specific expenses and exclusive rights to vote on matters affecting only individual classes. Income, non-class specific expenses, and realized and unrealized capital gains and losses of the fund are allocated to each class of shares based on their relative net assets.
Distributions to Shareholders — Distributions from net investment income, if any, are generally declared and paid quarterly. Distributions from net realized gains, if any, are generally declared and paid annually.
Indemnifications — Under the corporation’s organizational documents, its officers and directors are indemnified against certain liabilities arising out of the performance of their duties to the fund. In addition, in the normal course of business, the fund enters into contracts that provide general indemnifications. The maximum exposure under these arrangements is unknown as this would involve future claims that may be made against a fund. The risk of material loss from such claims is considered by management to be remote.
3. Fees and Transactions with Related Parties
Certain officers and directors of the corporation are also officers and/or directors of American Century Companies, Inc. (ACC). The corporation’s investment advisor, ACIM, the corporation's distributor, American Century Investment Services, Inc. (ACIS), and the corporation’s transfer agent, American Century Services, LLC, are wholly owned, directly or indirectly, by ACC.
Management Fees — The corporation has entered into a management agreement with ACIM, under which ACIM provides the fund with investment advisory and management services in exchange for a single, unified management fee (the fee) per class. The agreement provides that all expenses of managing and operating the fund, except distribution fees, brokerage expenses, taxes, interest, fees and expenses of the independent directors (including legal counsel fees), and extraordinary expenses, will be paid by ACIM. The fee is computed and accrued daily based on each class’s daily net assets and paid monthly in arrears. The difference in the fee among the classes is a result of their separate arrangements for non-Rule 12b-1 shareholder services. It is not the result of any difference in advisory or custodial fees or other expenses related to the management of the fund’s assets, which do not vary by class. The rate of the fee is determined by applying a fee rate calculation formula. This formula takes into account the fund’s assets as well as certain assets, if any, of other clients of the investment advisor outside the American Century Investments family of funds (such as subadvised funds and separate accounts) that use very similar investment teams and strategies (strategy assets). From January 1, 2019 through July 31, 2019, the investment advisor agreed to waive 0.14% of the fund's management fee. Effective August 1, 2019, the investment advisor agreed to waive 0.15% of the fund's management fee. The investment advisor expects this waiver to continue until July 31, 2020 and cannot terminate it prior to such date without the approval of the Board of Directors.
The management fee schedule range and the effective annual management fee before and after waiver for each class for the period ended December 31, 2019 are as follows:
|
| | | |
| | | Effective Annual Management Fee |
| | Management Fee Schedule Range | Before Waiver | After Waiver |
| Class I | 0.70% to 0.90% | 0.90% | 0.76% |
| Class II | 0.60% to 0.80% | 0.80% | 0.66% |
Distribution Fees — The Board of Directors has adopted the Master Distribution Plan (the plan) for Class II, pursuant to Rule 12b-1 of the 1940 Act. The plan provides that Class II will pay ACIS an annual distribution fee equal to 0.25%. The fee is computed and accrued daily based on the Class II daily net assets and paid monthly in arrears. The distribution fee provides compensation for expenses incurred in connection with distributing shares of Class II including, but not limited to, payments to brokers, dealers, and financial institutions that have entered into sales agreements with respect to shares of the fund. Fees incurred under the plan during the period ended December 31, 2019 are detailed in the Statement of Operations.
Directors' Fees and Expenses — The Board of Directors is responsible for overseeing the investment advisor’s management and operations of the fund. The directors receive detailed information about the fund and its investment advisor regularly throughout the year, and meet at least quarterly with management of the investment advisor to review reports about fund operations. The fund’s officers do not receive compensation from the fund.
Interfund Transactions — The fund may enter into security transactions with other American Century Investments funds and other client accounts of the investment advisor, in accordance with the 1940 Act rules and procedures adopted by the Board of Directors. The rules and procedures require, among other things, that these transactions be effected at the independent current market price of the security. During the period, the interfund purchases and sales were $687,571 and $200,714, respectively. The effect of interfund transactions on the Statement of Operations was $9,616 in net realized gain (loss) on investment transactions.
4. Investment Transactions
Purchases and sales of investment securities, excluding short-term investments, for the period ended December 31, 2019 were $46,507,876 and $27,107,869, respectively.
5. Capital Share Transactions
Transactions in shares of the fund were as follows:
|
| | | | | | | | | | |
| | Year ended December 31, 2019 | Year ended December 31, 2018 |
| | Shares | Amount | Shares | Amount |
| Class I/Shares Authorized | 50,000,000 |
| | 50,000,000 |
| |
| Sold | 283,347 |
| $ | 4,233,276 |
| 130,411 |
| $ | 1,958,878 |
|
| Issued in reinvestment of distributions | 29,858 |
| 438,373 |
| 43,222 |
| 611,555 |
|
| Redeemed | (103,047) |
| (1,562,138) |
| (189,626) |
| (2,879,480) |
|
| | 210,158 |
| 3,109,511 |
| (15,993) |
| (309,047) |
|
| Class II/Shares Authorized | 50,000,000 |
| | 50,000,000 |
| |
| Sold | 1,682,057 |
| 25,630,217 |
| 987,913 |
| 14,992,115 |
|
| Issued in reinvestment of distributions | 98,290 |
| 1,470,151 |
| 90,302 |
| 1,297,485 |
|
| Redeemed | (605,496) |
| (9,356,020) |
| (174,538) |
| (2,639,077) |
|
| | 1,174,851 |
| 17,744,348 |
| 903,677 |
| 13,650,523 |
|
| Net increase (decrease) | 1,385,009 |
| $ | 20,853,859 |
| 887,684 |
| $ | 13,341,476 |
|
6. Fair Value Measurements
The fund’s investments valuation process is based on several considerations and may use multiple inputs to determine the fair value of the investments held by the fund. In conformity with accounting principles generally accepted in the United States of America, the inputs used to determine a valuation are classified into three broad levels.
| |
| • | Level 1 valuation inputs consist of unadjusted quoted prices in an active market for identical investments. |
| |
| • | Level 2 valuation inputs consist of direct or indirect observable market data (including quoted prices for comparable investments, evaluations of subsequent market events, interest rates, prepayment speeds, credit risk, etc.). These inputs also consist of quoted prices for identical investments initially expressed in local currencies that are adjusted through translation into U.S. dollars. |
| |
| • | Level 3 valuation inputs consist of unobservable data (including a fund’s own assumptions). |
The level classification is based on the lowest level input that is significant to the fair valuation measurement. The valuation inputs are not necessarily an indication of the risks associated with investing in these securities or other financial instruments.
The following is a summary of the level classifications as of period end. The Schedule of Investments provides additional information on the fund’s portfolio holdings.
|
| | | | | | | | |
| | Level 1 | Level 2 | Level 3 |
| Assets | | | |
| Investment Securities | | | |
| Common Stocks | $ | 55,566,195 |
| $ | 2,084,229 |
| — |
|
| Exchange-Traded Funds | 1,317,032 |
| — |
| — |
|
| Temporary Cash Investments | 1,037 |
| 1,292,704 |
| — |
|
| | $ | 56,884,264 |
| $ | 3,376,933 |
| — |
|
| Other Financial Instruments | | | |
| Forward Foreign Currency Exchange Contracts | — |
| $ | 266 |
| — |
|
| | | | |
| Liabilities | | | |
| Other Financial Instruments | | | |
| Forward Foreign Currency Exchange Contracts | — |
| $ | 18,893 |
| — |
|
7. Derivative Instruments
Foreign Currency Risk — The fund is subject to foreign currency exchange rate risk in the normal course of pursuing its investment objectives. The value of foreign investments held by a fund may be significantly affected by changes in foreign currency exchange rates. The dollar value of a foreign security generally decreases when the value of the dollar rises against the foreign currency in which the security is denominated and tends to increase when the value of the dollar declines against such foreign currency. A fund may enter into forward foreign currency exchange contracts to reduce a fund's exposure to foreign currency exchange rate fluctuations. The net U.S. dollar value of foreign currency underlying all contractual commitments held by a fund and the resulting unrealized appreciation or depreciation are determined daily. Realized gain or loss is recorded upon the termination of the contract. Net realized and unrealized gains or losses occurring during the holding period of forward foreign currency exchange contracts are a component of net realized gain (loss) on forward foreign currency exchange contract transactions and change in net unrealized appreciation (depreciation) on forward foreign currency exchange contracts, respectively. A fund bears the risk of an unfavorable change in the foreign currency exchange rate underlying the forward contract. Additionally, losses, up to the fair value, may arise if the counterparties do not perform under the contract terms. The fund's average U.S. dollar exposure to foreign currency risk derivative instruments held during the period was $4,015,717.
The value of foreign currency risk derivative instruments as of December 31, 2019, is disclosed on the Statement of Assets and Liabilities as an asset of $266 in unrealized appreciation on forward foreign currency exchange contracts and a liability of $18,893 in unrealized depreciation on forward foreign currency exchange contracts. For the year ended December 31, 2019, the effect of foreign currency risk derivative instruments on the Statement of Operations was $91,897 in net realized gain (loss) on forward foreign currency exchange contract transactions and $4,088 in change in net unrealized appreciation (depreciation) on forward foreign currency exchange contracts.
8. Risk Factors
There are certain risks involved in investing in foreign securities. These risks include those resulting from political events (such as civil unrest, national elections and imposition of exchange controls), social and economic events (such as labor strikes and rising inflation), and natural disasters. Securities of foreign issuers may be less liquid and more volatile. Investing a significant portion of assets in one country or region may accentuate these risks.
9. Federal Tax Information
The tax character of distributions paid during the years ended December 31, 2019 and December 31, 2018 were as follows:
|
| | | | | | |
| | 2019 | 2018 |
| Distributions Paid From | | |
| Ordinary income | $ | 1,140,750 |
| $ | 617,828 |
|
| Long-term capital gains | $ | 767,774 |
| $ | 1,291,212 |
|
The book-basis character of distributions made during the year from net investment income or net realized gains may differ from their ultimate characterization for federal income tax purposes. These differences reflect the differing character of certain income items and net realized gains and losses for financial statement and tax purposes, and may result in reclassification among certain capital accounts on the financial statements.
As of period end, the federal tax cost of investments and the components of distributable earnings on a tax-basis were as follows:
|
| | | |
| Federal tax cost of investments | $ | 51,640,800 |
|
| Gross tax appreciation of investments | $ | 8,689,956 |
|
| Gross tax depreciation of investments | (69,559 | ) |
| Net tax appreciation (depreciation) of investments | 8,620,397 |
|
| Net tax appreciation (depreciation) on translation of assets and liabilities in foreign currencies | (65 | ) |
| Net tax appreciation (depreciation) | $ | 8,620,332 |
|
| Undistributed ordinary income | $ | 91,881 |
|
Accumulated long-term gains
| $ | 453,460 |
|
The difference between book-basis and tax-basis unrealized appreciation (depreciation) is attributable primarily to the tax deferral of losses on wash sales.
|
| | | | | | | | | | | | | | | | | |
| For a Share Outstanding Throughout the Years Ended December 31 (except as noted) | |
| Per-Share Data | | | | | | Ratios and Supplemental Data | |
| | | Income From Investment Operations: | Distributions From: | | | Ratio to Average Net Assets of: | |
| | Net Asset
Value,
Beginning
of Period | Net
Investment
Income
(Loss)(1) | Net
Realized
and
Unrealized
Gain (Loss) | Total From
Investment
Operations | Net
Investment
Income | Net
Realized
Gains | Total
Distributions | Net Asset
Value,
End
of Period | Total
Return(2) | Operating
Expenses | Operating
Expenses
(before
expense
waiver) | Net
Investment
Income
(Loss) | Net Investment
Income (Loss)
(before expense waiver) | Portfolio
Turnover
Rate | Net
Assets,
End of
Period
(in thousands) |
| Class I | | | | | | | | | | | | | | |
| 2019 | $13.38 | 0.28 | 3.31 | 3.59 | (0.31) | (0.37) | (0.68) | $16.29 | 27.48% | 0.76% | 0.90% | 1.82% | 1.68% | 59% |
| $11,514 |
|
| 2018 | $15.77 | 0.28 | (1.49) | (1.21) | (0.27) | (0.91) | (1.18) | $13.38 | (8.04)% | 0.78% | 0.90% | 1.86% | 1.74% | 51% |
| $6,644 |
|
| 2017 | $15.25 | 0.31 | 1.31 | 1.62 | (0.27) | (0.83) | (1.10) | $15.77 | 11.07% | 0.80% | 0.91% | 2.02% | 1.91% | 64% |
| $8,083 |
|
| 2016 | $14.39 | 0.29 | 1.75 | 2.04 | (0.31) | (0.87) | (1.18) | $15.25 | 15.25% | 0.79% | 0.90% | 2.03% | 1.92% | 77% |
| $9,984 |
|
| 2015 | $15.23 | 0.22 | (0.81) | (0.59) | (0.23) | (0.02) | (0.25) | $14.39 | (3.89)% | 0.80% | 0.91% | 1.43% | 1.32% | 63% |
| $8,693 |
|
| Class II | | | | | | | | | | | | | | |
| 2019 | $13.59 | 0.25 | 3.38 | 3.63 | (0.29) | (0.37) | (0.66) | $16.56 | 27.31% | 0.91% | 1.05% | 1.67% | 1.53% | 59% |
| $48,879 |
|
| 2018 | $16.00 | 0.26 | (1.51) | (1.25) | (0.25) | (0.91) | (1.16) | $13.59 | (8.19)% | 0.93% | 1.05% | 1.71% | 1.59% | 51% |
| $24,144 |
|
| 2017 | $15.45 | 0.29 | 1.33 | 1.62 | (0.24) | (0.83) | (1.07) | $16.00 | 10.96% | 0.95% | 1.06% | 1.87% | 1.76% | 64% |
| $13,971 |
|
| 2016 | $14.57 | 0.27 | 1.77 | 2.04 | (0.29) | (0.87) | (1.16) | $15.45 | 15.02% | 0.94% | 1.05% | 1.88% | 1.77% | 77% |
| $9,676 |
|
| 2015 | $15.42 | 0.19 | (0.81) | (0.62) | (0.21) | (0.02) | (0.23) | $14.57 | (4.05)% | 0.95% | 1.06% | 1.28% | 1.17% | 63% |
| $8,816 |
|
|
| | | | |
| Notes to Financial Highlights | | |
| |
| (1) | Computed using average shares outstanding throughout the period. |
| |
| (2) | Total returns are calculated based on the net asset value of the last business day. Total returns for periods less than one year are not annualized. The total returns presented do not include the fees and charges assessed with investments in variable insurance products, those charges are disclosed in the separate account prospectus. The inclusion of such fees and charges would lower total return. |
See Notes to Financial Statements.
|
|
| Report of Independent Registered Public Accounting Firm |
To the Shareholders and the Board of Directors of American Century Variable Portfolios, Inc.:
Opinion on the Financial Statements and Financial Highlights
We have audited the accompanying statement of assets and liabilities, including the schedule of investments, of VP Large Company Value Fund, one of the funds constituting the American Century Variable Portfolios, Inc. (the "Fund"), as of December 31, 2019, the related statement of operations for the year then ended, the statements of changes in net assets for each of the two years in the period then ended, the financial highlights for each of the five years in the period then ended, and the related notes. In our opinion, the financial statements and financial highlights present fairly, in all material respects, the financial position of VP Large Company Value Fund of the American Century Variable Portfolios, Inc. as of December 31, 2019, the results of its operations for the year then ended, the changes in its net assets for each of the two years in the period then ended, and the financial highlights for each of the five years in the period then ended, in conformity with accounting principles generally accepted in the United States of America.
Basis for Opinion
These financial statements and financial highlights are the responsibility of the Fund's management. Our responsibility is to express an opinion on the Fund’s financial statements and financial highlights based on our audits. We are a public accounting firm registered with the Public Company Accounting Oversight Board (United States) (PCAOB) and are required to be independent with respect to the Fund in accordance with the U.S. federal securities laws and the applicable rules and regulations of the Securities and Exchange Commission and the PCAOB.
We conducted our audits in accordance with the standards of the PCAOB. Those standards require that we plan and perform the audit to obtain reasonable assurance about whether the financial statements and financial highlights are free of material misstatement, whether due to error or fraud. The Fund is not required to have, nor were we engaged to perform, an audit of its internal control over financial reporting. As part of our audits we are required to obtain an understanding of internal control over financial reporting but not for the purpose of expressing an opinion on the effectiveness of the Fund’s internal control over financial reporting. Accordingly, we express no such opinion.
Our audits included performing procedures to assess the risks of material misstatement of the financial statements and financial highlights, whether due to error or fraud, and performing procedures that respond to those risks. Such procedures included examining, on a test basis, evidence regarding the amounts and disclosures in the financial statements and financial highlights. Our audits also included evaluating the accounting principles used and significant estimates made by management, as well as evaluating the overall presentation of the financial statements and financial highlights. Our procedures included confirmation of securities owned as of December 31, 2019, by correspondence with the custodian and brokers. We believe that our audits provide a reasonable basis for our opinion.
DELOITTE & TOUCHE LLP
Kansas City, Missouri
February 13, 2020
We have served as the auditor of one or more American Century investment companies since 1997.
The Board of Directors
The individuals listed below serve as directors of the funds. Each director will continue to serve in this capacity until death, retirement, resignation or removal from office. The board has adopted a mandatory retirement age for directors who are not “interested persons,” as that term is defined in the Investment Company Act (independent directors). Independent directors shall retire by December 31 of the year in which they reach their 75th birthday.
Mr. Thomas is an “interested person” because he currently serves as President and Chief Executive Officer of American Century Companies, Inc. (ACC), the parent company of American Century Investment Management, Inc. (ACIM or the advisor). The other directors (more than three-fourths of the total number) are independent. They are not employees, directors or officers of, and have no financial interest in, ACC or any of its wholly owned, direct or indirect, subsidiaries, including ACIM, American Century Investment Services, Inc. (ACIS) and American Century Services, LLC (ACS), and they do not have any other affiliations, positions or relationships that would cause them to be considered “interested persons” under the Investment Company Act. The directors serve in this capacity for seven (in the case of Jonathan S. Thomas, 16; and Stephen E. Yates, 8) registered investment companies in the American Century Investments family of funds.
The following table presents additional information about the directors. The mailing address for each director is 4500 Main Street, Kansas City, Missouri 64111.
|
| | | | | |
Name
(Year of Birth) | Position(s) Held with Funds | Length of Time Served | Principal Occupation(s) During Past 5 Years | Number of American Century Portfolios Overseen by Director | Other Directorships Held During Past 5 Years |
| Independent Directors |
|
|
| Thomas W. Bunn (1953) | Director | Since 2017 | Retired | 64 | SquareTwo Financial; Barings (formerly Babson Capital Funds Trust) (2013 to 2016) |
Chris H. Cheesman
(1962)
| Director | Since 2019
| Retired. Senior Vice President & Chief Audit Executive, AllianceBernstein (1999 to 2018)
| 64 | None |
Barry Fink
(1955) | Director | Since 2012 (independent since 2016) | Retired | 64 | None |
Rajesh K. Gupta
(1960)
| Director | Since 2019
| Partner Emeritus, SeaCrest Investment Management and SeaCrest Wealth Management (2019 to Present); Chief Executive Officer and Chief Investment Officer, SeaCrest Investment Management (2006 to 2019); Chief Executive Officer and Chief Investment Officer, SeaCrest Wealth Management (2008 to 2019)
| 64 | None |
|
| | | | | |
Name
(Year of Birth) | Position(s) Held with Funds | Length of Time Served | Principal Occupation(s) During Past 5 Years | Number of American Century Portfolios Overseen by Director | Other Directorships Held During Past 5 Years |
| Independent Directors |
|
|
Lynn Jenkins
(1963)
| Director | Since 2019
| Consultant, LJ Strategies (2019 to present); United States Representative, U.S. House of Representatives (2009 to 2018) | 64 | MGP Ingredients, Inc. |
Jan M. Lewis
(1957) | Director | Since 2011 | Retired | 64 | None |
John R. Whitten
(1946) | Director | Since 2008 | Retired | 64 | Onto Innovation Inc.; Rudolph Technologies, Inc. (2006 to 2019) |
Stephen E. Yates
(1948) | Director and Chairman of the Board | Since 2012 (Chairman since 2018) | Retired | 79 | None |
| Interested Director |
|
Jonathan S. Thomas
(1963) | Director | Since 2007 | President and Chief Executive Officer, ACC (2007 to present). Also serves as Chief Executive Officer, ACS; Executive Vice President, ACIM; Director, ACC, ACIM and other ACC subsidiaries | 120 | None |
The Statement of Additional Information has additional information about the fund's directors and is available without charge, upon request, by calling 1-800-378-9878.
Officers
The following table presents certain information about the executive officers of the funds. Each officer serves as an officer for 16 (in the case of Robert J. Leach, 15) investment companies in the American Century family of funds. No officer is compensated for his or her service as an officer of the funds. The listed officers are interested persons of the funds and are appointed or re-appointed on an annual basis. The mailing address for each officer listed below is 4500 Main Street, Kansas City, Missouri 64111.
|
| | |
Name
(Year of Birth) | Offices with the Funds | Principal Occupation(s) During the Past Five Years |
Patrick Bannigan
(1965) | President since 2019 | Executive Vice President and Director, ACC (2012 to present); Chief Financial Officer, Chief Accounting Officer and Treasurer, ACC (2015 to present); Chief Operating Officer, ACC (2012-2015). Also serves as President, ACS; Vice President, ACIM; Chief Financial Officer, Chief Accounting Officer and/or Director, ACIM, ACS and other ACC subsidiaries |
R. Wes Campbell
(1974) | Chief Financial Officer and Treasurer since 2018 | Investment Operations and Investment Accounting, ACS (2000 to present) |
Amy D. Shelton
(1964) | Chief Compliance Officer and Vice President since 2014 | Chief Compliance Officer, American Century funds, (2014 to present); Chief Compliance Officer, ACIM (2014 to present); Chief Compliance Officer, ACIS (2009 to present). Also serves as Vice President, ACIS |
Charles A. Etherington
(1957) | General Counsel since 2007 and Senior Vice President since 2006 | Attorney, ACC (1994 to present); Vice President, ACC (2005 to present); General Counsel, ACC (2007 to present). Also serves as General Counsel, ACIM, ACS, ACIS and other ACC subsidiaries; and Senior Vice President, ACIM and ACS |
C. Jean Wade
(1964) | Vice President since 2012 | Senior Vice President, ACS (2017 to present); Vice President, ACS (2000 to 2017)
|
Robert J. Leach
(1966) | Vice President since 2006 | Vice President, ACS (2000 to present) |
David H. Reinmiller
(1963) | Vice President since 2000 | Attorney, ACC (1994 to present). Also serves as Vice President, ACIM and ACS |
Ward D. Stauffer
(1960) | Secretary since 2005 | Attorney, ACC (2003 to present) |
Proxy Voting Policies
A description of the policies that the fund's investment advisor uses in exercising the voting rights associated with the securities purchased and/or held by the fund is available without charge, upon request, by calling 1-800-378-9878. It is also available on American Century Investments’ website at americancentury.com/proxy and on the Securities and Exchange Commission’s website at sec.gov. Information regarding how the investment advisor voted proxies relating to portfolio securities during the most recent 12-month period ended June 30 is available on americancentury.com/proxy. It is also available at sec.gov.
Quarterly Portfolio Disclosure
The fund files its complete schedule of portfolio holdings with the Securities and Exchange Commission (SEC) for the first and third quarters of each fiscal year on Form N-Q or as an exhibit to its reports on Form N-PORT. The fund’s Forms N-Q and Form N-PORT reports are available on the SEC’s website at sec.gov. The fund also makes its complete schedule of portfolio holdings for the most recent quarter of its fiscal year available on its website at ipro.americancentury.com (for Investment Professionals) and, upon request, by calling 1-800-378-9878.
Other Tax Information
The following information is provided pursuant to provisions of the Internal Revenue Code.
For corporate taxpayers, the fund hereby designates $844,299, or up to the maximum amount allowable, of ordinary income distributions paid during the fiscal year ended December 31, 2019 as qualified for the corporate dividends received deduction.
The fund hereby designates $218,055 as qualified short-term capital gain distributions for purposes of Internal Revenue Code Section 871 for the fiscal year ended December 31, 2019.
The fund hereby designates $767,774, or up to the maximum amount allowable, as long-term capital gain distributions (20% rate gain distributions) for the fiscal year ended December 31, 2019.
|
| | |
| |
| | | |
| Contact Us | americancentury.com | |
| Automated Information Line | 1-800-345-8765 | |
| Investment Professional Service Representatives | 1-800-345-6488 | |
| Telecommunications Relay Service for the Deaf | 711 | |
| | | |
| American Century Variable Portfolios, Inc. | |
| | | |
Investment Advisor: American Century Investment Management, Inc. Kansas City, Missouri | |
| | | |
| This report and the statements it contains are submitted for the general information of our shareholders. The report is not authorized for distribution to prospective investors unless preceded or accompanied by an effective prospectus. | |
| | | |
©2020 American Century Proprietary Holdings, Inc. All rights reserved.
CL-ANN-91445 2002 | |
|
| |
| | |
| | Annual Report |
| | |
| | December 31, 2019 |
| | |
| | VP Mid Cap Value Fund |
| | Class I (AVIPX) |
| | Class II (AVMTX) |
Beginning on January 1, 2021, as permitted by regulations adopted by the Securities and Exchange Commission, paper copies of the fund’s shareholder reports like this one will no longer be sent by mail from the insurance company that offers your contract, unless you specifically request paper copies of the reports from the insurance company or from your financial intermediary. Instead, the reports will be made available on a website, and you will be notified by mail each time a report is posted and provided with a website link to access the report.
If you already elected to receive shareholder reports electronically, you will not be affected by this change and you need not take any action. You may elect to receive shareholder reports and other communications from the insurance company or your financial intermediary electronically by contacting the insurance company.
You may elect to receive all future reports in paper free of charge. You can inform the insurance company or your financial intermediary that you wish to continue receiving paper copies of your shareholder reports by contacting the insurance company. Your election to receive reports in paper will apply to all variable portfolios available under your contract.
|
| |
| Performance | |
| Portfolio Commentary | |
| Fund Characteristics | |
| Shareholder Fee Example | |
| Schedule of Investments | |
| Statement of Assets and Liabilities | |
| Statement of Operations | |
| Statement of Changes in Net Assets | |
| Notes to Financial Statements | |
| Financial Highlights | |
| Report of Independent Registered Public Accounting Firm | |
| Management | |
| Additional Information | |
Any opinions expressed in this report reflect those of the author as of the date of the report, and do not necessarily represent the opinions of American Century Investments® or any other person in the American Century Investments organization. Any such opinions are subject to change at any time based upon market or other conditions and American Century Investments disclaims any responsibility to update such opinions. These opinions may not be relied upon as investment advice and, because investment decisions made by American Century Investments funds are based on numerous factors, may not be relied upon as an indication of trading intent on behalf of any American Century Investments fund. Security examples are used for representational purposes only and are not intended as recommendations to purchase or sell securities. Performance information for comparative indices and securities is provided to American Century Investments by third party vendors. To the best of American Century Investments’ knowledge, such information is accurate at the time of printing.
|
| | | | | |
| Total Returns as of December 31, 2019 |
| | | | Average Annual Returns | |
| | Ticker Symbol | 1 year | 5 years | 10 years | Inception Date |
| Class I | AVIPX | 29.15% | 8.77% | 12.25% | 12/1/04 |
| Russell Midcap Value Index | — | 27.06% | 7.61% | 12.41% | — |
| Class II | AVMTX | 28.99% | 8.61% | 12.08% | 10/29/04 |
Fund returns would have been lower if a portion of the fees had not been waived.
The performance information presented does not include the fees and charges assessed with investments in variable insurance products, those charges are disclosed in the separate account prospectus. The inclusion of such fees and charges would lower performance.
Data presented reflect past performance. Past performance is no guarantee of future results. Current performance may be higher or lower than the performance shown. Total returns for periods less than one year are not annualized. Investment return and principal value will fluctuate, and redemption value may be more or less than original cost. Data assumes reinvestment of dividends and capital gains, and none of the charts reflect the deduction of taxes that a shareholder would pay on fund distributions or the redemption of fund shares. To obtain performance data current to the most recent month end, please call 1-800-345-6488 or visit ipro.americancentury.com (for Investment Professionals). For additional information about the fund, please consult the prospectus.
|
|
| Growth of $10,000 Over 10 Years |
| $10,000 investment made December 31, 2009 |
| Performance for other share classes will vary due to differences in fee structure. |
|
| |
| Value on December 31, 2019 |
| | Class I — $31,775 |
| |
| | Russell Midcap Value Index — $32,226 |
| |
Ending value of Class I would have been lower if a portion of the fees had not been waived.
|
| |
| Total Annual Fund Operating Expenses |
| Class I | Class II |
| 1.01% | 1.16% |
The total annual fund operating expenses shown is as stated in the fund’s prospectus current as of the date of this report. The prospectus may vary from the expense ratio shown elsewhere in this report because it is based on a different time period, includes acquired fund fees and expenses, and, if applicable, does not include fee waivers or expense reimbursements.
Data presented reflect past performance. Past performance is no guarantee of future results. Current performance may be higher or lower than the performance shown. Total returns for periods less than one year are not annualized. Investment return and principal value will fluctuate, and redemption value may be more or less than original cost. Data assumes reinvestment of dividends and capital gains, and none of the charts reflect the deduction of taxes that a shareholder would pay on fund distributions or the redemption of fund shares. To obtain performance data current to the most recent month end, please call 1-800-345-6488 or visit ipro.americancentury.com (for Investment Professionals). For additional information about the fund, please consult the prospectus.
Portfolio Managers: Michael Liss, Kevin Toney, Phil Davidson and Brian Woglom
Performance Summary
VP Mid Cap Value returned 28.99%* for the 12 months ended December 31, 2019. The fund’s benchmark, the Russell Midcap Value Index, returned 27.06%. The fund’s return reflects operating expenses, while the index’s return does not.
Stock selection in the health care and consumer staples sectors contributed positively to relative performance. Selection and a relative underweight in the materials sector also aided the fund’s return. On the other hand, stock selection in the financials sector detracted.
Health Care and Consumer Staples Sectors Add to Relative Performance
Stock selection drove relative outperformance in health care, where Zimmer Biomet Holdings was a top contributor. This medical device company reported better-than-expected revenues, margins and earnings. It also reported positive updates on its early ROSA robot placements and improvements in FDA-related supply constraints.
Stock selection in the consumer staples sector lifted relative performance, with strong contribution coming from stock selection among food products companies. In the materials sector, stock selection contributed to relative results. Our underweight in the sector was also additive; avoiding names in the chemicals industry was particularly beneficial.
Elsewhere in the portfolio, Applied Materials was a strong contributor. This semiconductor company was a strong performer, as it delivered solid financial results despite an uncertain global economic environment. We believe this company remains well positioned, supported by greenfield investments and share gain from its new tool offerings.
Financials Sector Detracts from Relative Results
Stock selection in financials, and especially in the insurance industry, detracted from relative performance. The stock of insurer ProAssurance underperformed as the company reported increased expected loss costs driven by higher jury rewards in medical malpractice litigation. ProAssurance has yet to see the impact specifically to its underwriting book, but it is being conservative by adjusting its estimates for the potential impact.
Outside the financials sector, weak gas prices hurt the stock of natural gas producer EQT. If gas prices remain at depressed levels, we believe the company’s free cash flow could be significantly impaired. We exited our position in EQT in the third quarter as we identified more attractive investment opportunities elsewhere.
*All fund returns referenced in this commentary are for Class II shares. Returns would have been lower if a portion of the fees had not been waived. Performance for other share classes will vary due to differences in fee structure; when Class II performance exceeds that of the fund’s benchmark, other share classes may not. See page 2 for returns for all share classes.
MSC Industrial Direct was also a detractor. The stock fell in the second quarter after the company reported disappointing organic growth and guidance as demand for its industrial products continued to decelerate. We held onto the stock due in part to its strong balance sheet, but we reduced our position in the fourth quarter after revisiting our assumptions on the industrial distributor’s normalized earnings power. We determined the risk/reward profile was slightly less favorable, though still very attractive, than we had originally thought. During the period, the portfolio owned forward foreign currency exchange contracts to offset the inherent currency risks of holding foreign securities. Exposure to these instruments did not have a material effect on performance.
Portfolio Positioning
As of December 31, 2019, the portfolio’s largest sector overweight is in industrials. We have identified select opportunities in the industrials sector as companies have underperformed due to concerns such as tariffs, input cost pressure and operational execution. While we are overweight industrials, we have avoided names in the sector that we believe are lower quality. The portfolio also has a notable overweight in health care. We have found attractive opportunities in the sector due to increased political rhetoric as well as company-specific issues. The vast majority of our holdings in this sector are in two industries: 1) health care providers and services and 2) health care equipment and supplies.
According to our metrics, real estate stocks remain expensive relative to their historical valuation and to other areas of the equity market. Therefore, we hold a limited number of higher-quality real estate stocks that offer compelling valuations. Our metrics also show that valuations throughout the communication services sector are unattractive. Additionally, many stocks in the sector have volatile business models, leading to a wider range of potential outcomes.
|
| |
| DECEMBER 31, 2019 |
| Top Ten Holdings | % of net assets |
| iShares Russell Mid-Cap Value ETF | 3.1% |
| Zimmer Biomet Holdings, Inc. | 2.9% |
| Truist Financial Corp. | 2.5% |
| Northern Trust Corp. | 2.5% |
| Xcel Energy, Inc. | 1.9% |
| Weyerhaeuser Co. | 1.9% |
| Emerson Electric Co. | 1.9% |
| Hubbell, Inc. | 1.6% |
| Comerica, Inc. | 1.6% |
| Quest Diagnostics, Inc. | 1.6% |
| | |
| Top Five Industries | % of net assets |
| Banks | 9.6% |
| Electrical Equipment | 6.3% |
| Insurance | 5.9% |
| Equity Real Estate Investment Trusts (REITs) | 5.8% |
| Health Care Providers and Services | 5.8% |
| | |
| Types of Investments in Portfolio | % of net assets |
| Domestic Common Stocks | 85.9% |
| Foreign Common Stocks* | 9.1% |
| Exchange-Traded Funds | 3.1% |
| Total Equity Exposure | 98.1% |
| Temporary Cash Investments | 1.8% |
| Other Assets and Liabilities | 0.1% |
Fund shareholders may incur two types of costs: (1) transaction costs, including sales charges (loads) on purchase payments and redemption/exchange fees; and (2) ongoing costs, including management fees; distribution and service (12b-1) fees; and other fund expenses. This example is intended to help you understand your ongoing costs (in dollars) of investing in your fund and to compare these costs with the ongoing cost of investing in other mutual funds.
The example is based on an investment of $1,000 made at the beginning of the period and held for the entire period from July 1, 2019 to December 31, 2019.
Actual Expenses
The table provides information about actual account values and actual expenses for each class. You may use the information, together with the amount you invested, to estimate the expenses that you paid over the period. First, identify the share class you own. Then simply divide your account value by $1,000 (for example, an $8,600 account value divided by $1,000 = 8.6), then multiply the result by the number under the heading “Expenses Paid During Period” to estimate the expenses you paid on your account during this period.
Hypothetical Example for Comparison Purposes
The table also provides information about hypothetical account values and hypothetical expenses based on the actual expense ratio of each class of your fund and an assumed rate of return of 5% per year before expenses, which is not the actual return of a fund’s share class. The hypothetical account values and expenses may not be used to estimate the actual ending account balance or expenses you paid for the period. You may use this information to compare the ongoing costs of investing in your fund and other funds. To do so, compare this 5% hypothetical example with the 5% hypothetical examples that appear in the shareholder reports of the other funds.
Please note that the expenses shown in the table are meant to highlight your ongoing costs only and do not reflect any transactional costs, such as sales charges (loads) or redemption/exchange fees. Therefore, the table is useful in comparing ongoing costs only, and will not help you determine the relative total costs of owning different funds. In addition, if these transactional costs were included, your costs would have been higher.
|
| | | | |
| | Beginning
Account Value
7/1/19 | Ending
Account Value
12/31/19 | Expenses Paid
During Period(1)
7/1/19 - 12/31/19 | Annualized
Expense Ratio(1) |
| Actual | | | | |
| Class I | $1,000 | $1,101.90 | $4.56 | 0.86% |
| Class II | $1,000 | $1,100.90 | $5.35 | 1.01% |
| Hypothetical | | | | |
| Class I | $1,000 | $1,020.87 | $4.38 | 0.86% |
| Class II | $1,000 | $1,020.11 | $5.14 | 1.01% |
| |
| (1) | Expenses are equal to the class's annualized expense ratio listed in the table above, multiplied by the average account value over the period, multiplied by 184, the number of days in the most recent fiscal half-year, divided by 365, to reflect the one-half year period. Annualized expense ratio reflects actual expenses, including any applicable fee waivers or expense reimbursements and excluding any acquired fund fees and expenses. |
DECEMBER 31, 2019
|
| | | | |
| | Shares | Value |
| COMMON STOCKS — 95.0% | | |
| Aerospace and Defense — 1.5% | | |
| BAE Systems plc | 690,771 | $ | 5,175,664 |
|
| Textron, Inc. | 111,771 | 4,984,987 |
|
| | | 10,160,651 |
|
| Airlines — 1.5% | | |
| Southwest Airlines Co. | 187,999 | 10,148,186 |
|
| Auto Components — 1.3% | | |
| Aptiv plc | 33,000 | 3,134,010 |
|
| BorgWarner, Inc. | 129,126 | 5,601,486 |
|
| | | 8,735,496 |
|
| Automobiles — 1.6% | | |
| Honda Motor Co. Ltd. ADR | 221,910 | 6,282,272 |
|
| Thor Industries, Inc. | 58,762 | 4,365,429 |
|
| | | 10,647,701 |
|
| Banks — 9.6% | | |
| Comerica, Inc. | 147,134 | 10,556,864 |
|
| Commerce Bancshares, Inc. | 118,356 | 8,041,107 |
|
| First Hawaiian, Inc. | 304,167 | 8,775,218 |
|
| M&T Bank Corp. | 49,499 | 8,402,455 |
|
| Prosperity Bancshares, Inc. | 46,926 | 3,373,510 |
|
| Truist Financial Corp. | 294,994 | 16,614,062 |
|
| UMB Financial Corp. | 66,003 | 4,530,446 |
|
| Westamerica Bancorporation | 58,793 | 3,984,402 |
|
| | | 64,278,064 |
|
| Building Products — 1.4% | | |
| Johnson Controls International plc | 237,840 | 9,682,466 |
|
| Capital Markets — 5.0% | | |
| Ameriprise Financial, Inc. | 62,229 | 10,366,107 |
|
| Northern Trust Corp. | 154,895 | 16,456,045 |
|
| State Street Corp. | 86,735 | 6,860,738 |
|
| | | 33,682,890 |
|
| Commercial Services and Supplies — 0.8% | | |
| Republic Services, Inc. | 63,095 | 5,655,205 |
|
| Containers and Packaging — 2.6% | | |
| Graphic Packaging Holding Co. | 203,212 | 3,383,480 |
|
| Packaging Corp. of America | 47,840 | 5,357,602 |
|
| Sonoco Products Co. | 76,826 | 4,741,701 |
|
| WestRock Co. | 86,049 | 3,692,362 |
|
| | | 17,175,145 |
|
| Distributors — 1.2% | | |
| Genuine Parts Co. | 75,447 | 8,014,735 |
|
| Electric Utilities — 5.4% | | |
| Edison International | 125,052 | 9,430,171 |
|
|
| | | | |
| | Shares | Value |
| Eversource Energy | 61,625 | $ | 5,242,439 |
|
| Pinnacle West Capital Corp. | 95,926 | 8,626,625 |
|
| Xcel Energy, Inc. | 205,229 | 13,029,989 |
|
| | | 36,329,224 |
|
| Electrical Equipment — 6.3% | | |
| Eaton Corp. plc | 54,178 | 5,131,740 |
|
| Emerson Electric Co. | 163,127 | 12,440,065 |
|
| Hubbell, Inc. | 74,398 | 10,997,512 |
|
| nVent Electric plc | 388,923 | 9,948,650 |
|
| Schneider Electric SE | 35,961 | 3,699,241 |
|
| | | 42,217,208 |
|
| Electronic Equipment, Instruments and Components — 1.0% | | |
| TE Connectivity Ltd. | 69,433 | 6,654,459 |
|
| Energy Equipment and Services — 2.0% | | |
| Baker Hughes Co. | 265,839 | 6,813,454 |
|
| Schlumberger Ltd. | 168,345 | 6,767,469 |
|
| | | 13,580,923 |
|
| Equity Real Estate Investment Trusts (REITs) — 5.8% | | |
| Empire State Realty Trust, Inc., Class A | 320,375 | 4,472,435 |
|
| MGM Growth Properties LLC, Class A | 237,213 | 7,346,487 |
|
| Piedmont Office Realty Trust, Inc., Class A | 272,914 | 6,069,607 |
|
| Welltower, Inc. | 104,442 | 8,541,267 |
|
| Weyerhaeuser Co. | 414,451 | 12,516,420 |
|
| | | 38,946,216 |
|
| Food and Staples Retailing — 1.9% | | |
| Koninklijke Ahold Delhaize NV | 285,302 | 7,150,201 |
|
| Sysco Corp. | 67,408 | 5,766,080 |
|
| | | 12,916,281 |
|
| Food Products — 4.0% | | |
| Conagra Brands, Inc. | 222,757 | 7,627,200 |
|
| J.M. Smucker Co. (The) | 44,505 | 4,634,305 |
|
| Kellogg Co. | 54,319 | 3,756,702 |
|
| Mondelez International, Inc., Class A | 67,414 | 3,713,163 |
|
| Orkla ASA | 699,527 | 7,089,652 |
|
| | | 26,821,022 |
|
| Gas Utilities — 1.9% | | |
| Atmos Energy Corp. | 53,185 | 5,949,274 |
|
| Spire, Inc. | 82,223 | 6,849,998 |
|
| | | 12,799,272 |
|
| Health Care Equipment and Supplies — 4.4% | | |
Hologic, Inc.(1) | 105,792 | 5,523,400 |
|
| Siemens Healthineers AG | 95,094 | 4,566,332 |
|
| Zimmer Biomet Holdings, Inc. | 130,134 | 19,478,457 |
|
| | | 29,568,189 |
|
| Health Care Providers and Services — 5.8% | | |
| Cardinal Health, Inc. | 161,999 | 8,193,909 |
|
Henry Schein, Inc.(1) | 87,745 | 5,854,346 |
|
|
| | | | |
| | Shares | Value |
| McKesson Corp. | 53,777 | $ | 7,438,435 |
|
| Quest Diagnostics, Inc. | 97,430 | 10,404,550 |
|
| Universal Health Services, Inc., Class B | 48,433 | 6,948,198 |
|
| | | 38,839,438 |
|
| Health Care Technology — 1.1% | | |
| Cerner Corp. | 100,728 | 7,392,428 |
|
| Hotels, Restaurants and Leisure — 1.9% | | |
| Carnival Corp. | 130,252 | 6,620,709 |
|
| Sodexo SA | 51,739 | 6,136,487 |
|
| | | 12,757,196 |
|
| Household Durables — 0.8% | | |
| PulteGroup, Inc. | 141,857 | 5,504,052 |
|
| Household Products — 0.9% | | |
| Kimberly-Clark Corp. | 43,310 | 5,957,291 |
|
| Insurance — 5.9% | | |
| Aflac, Inc. | 100,954 | 5,340,467 |
|
| Arthur J. Gallagher & Co. | 19,473 | 1,854,414 |
|
| Brown & Brown, Inc. | 79,690 | 3,146,161 |
|
| Chubb Ltd. | 65,956 | 10,266,711 |
|
| Globe Life, Inc. | 25,283 | 2,661,036 |
|
| ProAssurance Corp. | 170,095 | 6,147,233 |
|
| Reinsurance Group of America, Inc. | 49,264 | 8,032,988 |
|
| Travelers Cos., Inc. (The) | 16,438 | 2,251,184 |
|
| | | 39,700,194 |
|
| Machinery — 2.9% | | |
| Cummins, Inc. | 39,932 | 7,146,231 |
|
| IMI plc | 408,642 | 6,394,475 |
|
| PACCAR, Inc. | 78,160 | 6,182,456 |
|
| | | 19,723,162 |
|
| Multi-Utilities — 2.6% | | |
| Ameren Corp. | 83,804 | 6,436,147 |
|
| NorthWestern Corp. | 98,498 | 7,059,352 |
|
| WEC Energy Group, Inc. | 42,110 | 3,883,805 |
|
| | | 17,379,304 |
|
| Multiline Retail — 0.8% | | |
| Target Corp. | 39,229 | 5,029,550 |
|
| Oil, Gas and Consumable Fuels — 2.8% | | |
| ConocoPhillips | 144,134 | 9,373,034 |
|
| Imperial Oil Ltd. | 141,975 | 3,755,605 |
|
| Noble Energy, Inc. | 237,131 | 5,890,334 |
|
| | | 19,018,973 |
|
| Paper and Forest Products — 1.0% | | |
| Mondi plc | 288,215 | 6,803,765 |
|
| Road and Rail — 1.0% | | |
| Heartland Express, Inc. | 302,382 | 6,365,141 |
|
| Semiconductors and Semiconductor Equipment — 3.5% | | |
| Applied Materials, Inc. | 148,244 | 9,048,814 |
|
|
| | | | |
| | Shares | Value |
| Maxim Integrated Products, Inc. | 139,155 | $ | 8,559,424 |
|
| Microchip Technology, Inc. | 55,813 | 5,844,737 |
|
| | | 23,452,975 |
|
| Specialty Retail — 1.4% | | |
| Advance Auto Parts, Inc. | 57,279 | 9,173,805 |
|
| Technology Hardware, Storage and Peripherals — 0.8% | | |
| HP, Inc. | 243,017 | 4,993,999 |
|
| Thrifts and Mortgage Finance — 0.9% | | |
| Capitol Federal Financial, Inc. | 415,191 | 5,700,572 |
|
| Trading Companies and Distributors — 1.0% | | |
| MSC Industrial Direct Co., Inc., Class A | 86,153 | 6,760,426 |
|
| Wireless Telecommunication Services — 0.7% | | |
| Rogers Communications, Inc., Class B | 89,685 | 4,453,343 |
|
TOTAL COMMON STOCKS
(Cost $507,244,580) | | 637,018,947 |
|
| EXCHANGE-TRADED FUNDS — 3.1% | | |
iShares Russell Mid-Cap Value ETF
(Cost $18,532,310) | 219,544 | 20,806,185 |
|
| TEMPORARY CASH INVESTMENTS — 1.8% | | |
| Repurchase Agreement, BMO Capital Markets Corp., (collateralized by various U.S. Treasury obligations, 2.75% - 3.75%, 9/15/21 - 11/15/43, valued at $10,257,059), in a joint trading account at 1.35%, dated 12/31/19, due 1/2/20 (Delivery value $10,041,498) | | 10,040,745 |
|
| Repurchase Agreement, Fixed Income Clearing Corp., (collateralized by various U.S. Treasury obligations, 1.625%, 12/15/22, valued at $2,283,377), at 0.65%, dated 12/31/19, due 1/2/20 (Delivery value $2,234,081) | | 2,234,000 |
|
| State Street Institutional U.S. Government Money Market Fund, Premier Class | 6,693 | 6,693 |
|
TOTAL TEMPORARY CASH INVESTMENTS
(Cost $12,281,438) | | 12,281,438 |
|
TOTAL INVESTMENT SECURITIES — 99.9%
(Cost $538,058,328) | | 670,106,570 |
|
| OTHER ASSETS AND LIABILITIES — 0.1% | | 922,786 |
|
| TOTAL NET ASSETS — 100.0% | | $ | 671,029,356 |
|
|
| | | | | | | | | | |
| FORWARD FOREIGN CURRENCY EXCHANGE CONTRACTS |
| Currency Purchased | Currency Sold | Counterparty | Settlement Date | Unrealized Appreciation
(Depreciation) |
| USD | 6,765,415 |
| CAD | 8,897,846 |
| Morgan Stanley | 3/31/20 | $ | (88,799 | ) |
| USD | 174,556 |
| CAD | 229,559 |
| Morgan Stanley | 3/31/20 | (2,278 | ) |
| EUR | 470,450 |
| USD | 525,378 |
| Credit Suisse AG | 3/31/20 | 5,241 |
|
| USD | 19,055,320 |
| EUR | 16,973,669 |
| Credit Suisse AG | 3/31/20 | (89,209 | ) |
| USD | 15,405,247 |
| GBP | 11,694,837 |
| JPMorgan Chase Bank N.A. | 3/31/20 | (123,080 | ) |
| JPY | 15,749,933 |
| USD | 145,615 |
| Bank of America N.A. | 3/31/20 | 27 |
|
| USD | 3,910,271 |
| JPY | 425,390,126 |
| Bank of America N.A. | 3/31/20 | (23,384 | ) |
| NOK | 1,326,621 |
| USD | 150,782 |
| Goldman Sachs & Co. | 3/31/20 | 362 |
|
| USD | 5,944,536 |
| NOK | 53,590,589 |
| Goldman Sachs & Co. | 3/31/20 | (161,123 | ) |
| USD | 147,145 |
| NOK | 1,314,211 |
| Goldman Sachs & Co. | 3/31/20 | (2,585 | ) |
| | | | | | | $ | (484,828 | ) |
|
| | |
| NOTES TO SCHEDULE OF INVESTMENTS |
| ADR | - | American Depositary Receipt |
| CAD | - | Canadian Dollar |
| EUR | - | Euro |
| GBP | - | British Pound |
| JPY | - | Japanese Yen |
| NOK | - | Norwegian Krone |
| USD | - | United States Dollar |
See Notes to Financial Statements.
|
|
| Statement of Assets and Liabilities |
|
| | | |
| DECEMBER 31, 2019 | |
| Assets |
| Investment securities, at value (cost of $538,058,328) | $ | 670,106,570 |
|
| Receivable for investments sold | 2,176,260 |
|
| Receivable for capital shares sold | 284,101 |
|
| Unrealized appreciation on forward foreign currency exchange contracts | 5,630 |
|
| Dividends and interest receivable | 1,711,248 |
|
| | 674,283,809 |
|
| | |
| Liabilities |
| Payable for investments purchased | 1,022,130 |
|
| Payable for capital shares redeemed | 1,194,435 |
|
| Unrealized depreciation on forward foreign currency exchange contracts | 490,458 |
|
| Accrued management fees | 442,879 |
|
| Distribution fees payable | 104,551 |
|
| | 3,254,453 |
|
| | |
| Net Assets | $ | 671,029,356 |
|
| | |
| Net Assets Consist of: | |
| Capital (par value and paid-in surplus) | $ | 554,493,393 |
|
| Distributable earnings | 116,535,963 |
|
| | $ | 671,029,356 |
|
|
| | | | | | |
| | Net Assets | Shares Outstanding | Net Asset Value Per Share |
| Class I, $0.01 Par Value |
| $173,105,289 |
| 8,372,365 |
| $20.68 |
| Class II, $0.01 Par Value |
| $497,924,067 |
| 24,055,835 |
| $20.70 |
See Notes to Financial Statements.
|
| | | |
| YEAR ENDED DECEMBER 31, 2019 |
| Investment Income (Loss) |
| Income: | |
| Dividends (net of foreign taxes withheld of $290,673) | $ | 18,096,046 |
|
| Interest | 306,641 |
|
| | 18,402,687 |
|
| | |
| Expenses: | |
| Management fees | 6,851,862 |
|
| Distribution fees - Class II | 1,172,399 |
|
| Directors' fees and expenses | 23,578 |
|
| Other expenses | 517 |
|
| | 8,048,356 |
|
Fees waived(1) | (1,121,375 | ) |
| | 6,926,981 |
|
| | |
| Net investment income (loss) | 11,475,706 |
|
| | |
| Realized and Unrealized Gain (Loss) |
| Net realized gain (loss) on: | |
| Investment transactions (Note 4) | 37,411,035 |
|
| Forward foreign currency exchange contract transactions | 1,259,870 |
|
| Foreign currency translation transactions | (11,036 | ) |
| | 38,659,869 |
|
| | |
| Change in net unrealized appreciation (depreciation) on: | |
| Investments | 161,722,597 |
|
| Forward foreign currency exchange contracts | (86,226 | ) |
| Translation of assets and liabilities in foreign currencies | 3,070 |
|
| | 161,639,441 |
|
| | |
| Net realized and unrealized gain (loss) | 200,299,310 |
|
| | |
| Net Increase (Decrease) in Net Assets Resulting from Operations | $ | 211,775,016 |
|
| |
| (1) | Amount consists of $410,649 and $710,726 for Class I and Class II, respectively. |
See Notes to Financial Statements.
|
|
| Statement of Changes in Net Assets |
|
| | | | | | |
| YEARS ENDED DECEMBER 31, 2019 AND DECEMBER 31, 2018 |
| Increase (Decrease) in Net Assets | December 31, 2019 | December 31, 2018 |
| Operations |
| Net investment income (loss) | $ | 11,475,706 |
| $ | 14,849,137 |
|
| Net realized gain (loss) | 38,659,869 |
| 118,119,590 |
|
| Change in net unrealized appreciation (depreciation) | 161,639,441 |
| (269,757,913 | ) |
| Net increase (decrease) in net assets resulting from operations | 211,775,016 |
| (136,789,186 | ) |
| | | |
| Distributions to Shareholders |
| From earnings: | | |
| Class I | (57,029,480 | ) | (34,627,446 | ) |
| Class II | (58,653,201 | ) | (65,471,586 | ) |
| Decrease in net assets from distributions | (115,682,681 | ) | (100,099,032 | ) |
| | | |
| Capital Share Transactions |
| Net increase (decrease) in net assets from capital share transactions (Note 5) | (273,515,703 | ) | (294,500,589 | ) |
| | | |
| Net increase (decrease) in net assets | (177,423,368 | ) | (531,388,807 | ) |
| | | |
| Net Assets |
| Beginning of period | 848,452,724 |
| 1,379,841,531 |
|
| End of period | $ | 671,029,356 |
| $ | 848,452,724 |
|
See Notes to Financial Statements.
|
|
| Notes to Financial Statements |
DECEMBER 31, 2019
1. Organization
American Century Variable Portfolios, Inc. (the corporation) is registered under the Investment Company Act of 1940, as amended (the 1940 Act), as an open-end management investment company and is organized as a Maryland corporation. VP Mid Cap Value Fund (the fund) is one fund in a series issued by the corporation. The fund’s investment objective is to seek long-term capital growth. Income is a secondary objective. The fund offers Class I and Class II.
2. Significant Accounting Policies
The following is a summary of significant accounting policies consistently followed by the fund in preparation of its financial statements. The fund is an investment company and follows accounting and reporting guidance in accordance with accounting principles generally accepted in the United States of America. This may require management to make certain estimates and assumptions at the date of the financial statements. Actual results could differ from these estimates. Management evaluated the impact of events or transactions occurring through the date the financial statements were issued that would merit recognition or disclosure.
Investment Valuations — The fund determines the fair value of its investments and computes its net asset value per share at the close of regular trading (usually 4 p.m. Eastern time) on the New York Stock Exchange (NYSE) on each day the NYSE is open. The Board of Directors has adopted valuation policies and procedures to guide the investment advisor in the fund’s investment valuation process and to provide methodologies for the oversight of the fund’s pricing function.
Equity securities that are listed or traded on a domestic securities exchange are valued at the last reported sales price or at the official closing price as provided by the exchange. Equity securities traded on foreign securities exchanges are generally valued at the closing price of such securities on the exchange where primarily traded or at the close of the NYSE, if that is earlier. If no last sales price is reported, or if local convention or regulation so provides, the mean of the latest bid and asked prices may be used. Securities traded over-the-counter are valued at the mean of the latest bid and asked prices, the last sales price, or the official closing price. Equity securities initially expressed in local currencies are translated into U.S. dollars at the mean of the appropriate currency exchange rate at the close of the NYSE as provided by an independent pricing service.
Open-end management investment companies are valued at the reported net asset value per share. Repurchase agreements are valued at cost, which approximates fair value. Forward foreign currency exchange contracts are valued at the mean of the appropriate forward exchange rate at the close of the NYSE as provided by an independent pricing service.
If the fund determines that the market price for an investment is not readily available or the valuation methods mentioned above do not reflect an investment’s fair value, such investment is valued as determined in good faith by the Board of Directors or its delegate, in accordance with policies and procedures adopted by the Board of Directors. In its determination of fair value, the fund may review several factors including, but not limited to, market information regarding the specific investment or comparable investments and correlation with other investment types, futures indices or general market indicators. Circumstances that may cause the fund to use these procedures to value an investment include, but are not limited to: an investment has been declared in default or is distressed; trading in a security has been suspended during the trading day or a security is not actively trading on its principal exchange; prices received from a regular pricing source are deemed unreliable; or there is a foreign market holiday and no trading occurred.
The fund monitors for significant events occurring after the close of an investment’s primary exchange but before the fund’s net asset value per share is determined. Significant events may include, but are not limited to: corporate announcements and transactions; governmental action and political unrest that could impact a specific investment or an investment sector; or armed conflicts, natural disasters and similar events that could affect investments in a specific country or region. The fund also monitors for significant fluctuations between domestic and foreign markets, as evidenced by the U.S. market or such other indicators that the Board of Directors, or its delegate, deems appropriate. The fund may apply a model-derived factor to the closing price of equity securities traded on foreign securities exchanges. The factor is based on observable market data as provided by an independent pricing service.
Security Transactions — Security transactions are accounted for as of the trade date. Net realized gains and losses are determined on the identified cost basis, which is also used for federal income tax purposes.
Investment Income — Dividend income less foreign taxes withheld, if any, is recorded as of the ex-dividend date. Distributions received on securities that represent a return of capital or long-term capital gain are recorded as a reduction of cost of investments and/or as a realized gain. The fund may estimate the components of distributions received that may be considered nontaxable distributions or long-term capital gain distributions for income tax purposes. Interest income is recorded on the accrual basis and includes accretion of discounts and amortization of premiums.
Foreign Currency Translations — All assets and liabilities initially expressed in foreign currencies are translated into U.S. dollars at prevailing exchange rates at period end. The fund may enter into spot foreign currency exchange contracts to facilitate transactions denominated in a foreign currency. Purchases and sales of investment securities, dividend and interest income, spot foreign currency exchange contracts, and expenses are translated at the rates of exchange prevailing on the respective dates of such transactions. Net realized and unrealized foreign currency exchange gains or losses related to investment securities are a component of net realized gain (loss) on investment transactions and change in net unrealized appreciation (depreciation) on investments, respectively.
Repurchase Agreements — The fund may enter into repurchase agreements with institutions that American Century Investment Management, Inc. (ACIM) (the investment advisor) has determined are creditworthy pursuant to criteria adopted by the Board of Directors. The fund requires that the collateral, represented by securities, received in a repurchase transaction be transferred to the custodian in a manner sufficient to enable the fund to obtain those securities in the event of a default under the repurchase agreement. ACIM monitors, on a daily basis, the securities transferred to ensure the value, including accrued interest, of the securities under each repurchase agreement is equal to or greater than amounts owed to the fund under each repurchase agreement.
Joint Trading Account — Pursuant to an Exemptive Order issued by the Securities and Exchange Commission, the fund, along with certain other funds in the American Century Investments family of funds, may transfer uninvested cash balances into a joint trading account. These balances are invested in one or more repurchase agreements that are collateralized by U.S. Treasury or Agency obligations.
Income Tax Status — It is the fund’s policy to distribute substantially all net investment income and net realized gains to shareholders and to otherwise qualify as a regulated investment company under provisions of the Internal Revenue Code. Accordingly, no provision has been made for income taxes. The fund files U.S. federal, state, local and non-U.S. tax returns as applicable. The fund's tax returns are subject to examination by the relevant taxing authority until expiration of the applicable statute of limitations, which is generally three years from the date of filing but can be longer in certain jurisdictions. At this time, management believes there are no uncertain tax positions which, based on their technical merit, would not be sustained upon examination and for which it is reasonably possible that the total amounts of unrecognized tax benefits will significantly change in the next twelve months.
Multiple Class — All shares of the fund represent an equal pro rata interest in the net assets of the class to which such shares belong, and have identical voting, dividend, liquidation and other rights and the same terms and conditions, except for class specific expenses and exclusive rights to vote on matters affecting only individual classes. Income, non-class specific expenses, and realized and unrealized capital gains and losses of the fund are allocated to each class of shares based on their relative net assets.
Distributions to Shareholders — Distributions from net investment income, if any, are generally declared and paid quarterly. Distributions from net realized gains, if any, are generally declared and paid annually.
Indemnifications — Under the corporation’s organizational documents, its officers and directors are indemnified against certain liabilities arising out of the performance of their duties to the fund. In addition, in the normal course of business, the fund enters into contracts that provide general indemnifications. The maximum exposure under these arrangements is unknown as this would involve future claims that may be made against a fund. The risk of material loss from such claims is considered by management to be remote.
3. Fees and Transactions with Related Parties
Certain officers and directors of the corporation are also officers and/or directors of American Century Companies, Inc. (ACC). The corporation’s investment advisor, ACIM, the corporation's distributor, American Century Investment Services, Inc. (ACIS), and the corporation’s transfer agent, American Century Services, LLC, are wholly owned, directly or indirectly, by ACC.
Management Fees —The corporation has entered into a management agreement with ACIM, under which ACIM provides the fund with investment advisory and management services in exchange for a single, unified management fee (the fee) per class. The agreement provides that all expenses of managing and operating the fund, except distribution fees, brokerage expenses, taxes, interest, fees and expenses of the independent directors (including legal counsel fees), and extraordinary expenses, will be paid by ACIM. The fee is computed and accrued daily based on each class's daily net assets and paid monthly in arrears. The difference in the fee among the classes is a result of their separate arrangements for non-Rule 12b-1 shareholder services. It is not the result of any difference in advisory or custodial fees or other expenses related to the management of the fund’s assets, which do not vary by class. From January 1, 2019 through July 31, 2019, the investment advisor agreed to waive 0.16% of the fund's management fee. Effective August 1, 2019, the investment advisor agreed to waive 0.14% of the fund's management fee. The investment advisor expects this waiver to continue until July 31, 2020 and cannot terminate it prior to such date without the approval of the Board of Directors.
The annual management fee and the effective annual management fee after waiver for each class for the period ended December 31, 2019 are as follows:
|
| | |
| | Annual Management Fee | Effective Annual Management Fee After Waiver |
| Class I | 1.00% | 0.85% |
| Class II | 0.90% | 0.75% |
Distribution Fees — The Board of Directors has adopted the Master Distribution Plan (the plan) for Class II, pursuant to Rule 12b-1 of the 1940 Act. The plan provides that Class II will pay ACIS an annual distribution fee equal to 0.25%. The fee is computed and accrued daily based on the Class II daily net assets and paid monthly in arrears. The distribution fee provides compensation for expenses incurred in connection with distributing shares of Class II including, but not limited to, payments to brokers, dealers, and financial institutions that have entered into sales agreements with respect to shares of the fund. Fees incurred under the plan during the period ended December 31, 2019 are detailed in the Statement of Operations.
Directors' Fees and Expenses — The Board of Directors is responsible for overseeing the investment advisor’s management and operations of the fund. The directors receive detailed information about the fund and its investment advisor regularly throughout the year, and meet at least quarterly with management of the investment advisor to review reports about fund operations. The fund’s officers do not receive compensation from the fund.
Interfund Transactions — The fund may enter into security transactions with other American Century Investments funds and other client accounts of the investment advisor, in accordance with the 1940 Act rules and procedures adopted by the Board of Directors. The rules and procedures require, among other things, that these transactions be effected at the independent current market price of the security. During the period, the interfund purchases and sales were $3,746,082 and $1,602,774, respectively. The effect of interfund transactions on the Statement of Operations was $(55,352) in net realized gain (loss) on investment transactions.
4. Investment Transactions
Purchases and sales of investment securities, excluding short-term investments and in kind transactions, for the period ended December 31, 2019 were $289,829,612 and $324,137,549, respectively.
For the period ended December 31, 2019, the fund incurred net realized gains of $43,860,135 from redemptions in kind. A redemption in kind occurs when a fund delivers securities from its portfolio in lieu of cash as payment to a redeeming shareholder.
5. Capital Share Transactions
Transactions in shares of the fund were as follows:
|
| | | | | | | | | | |
| | Year ended December 31, 2019 | Year ended December 31, 2018 |
| | Shares | Amount | Shares | Amount |
| Class I/Shares Authorized | 130,000,000 |
| | 130,000,000 |
| |
| Sold | 1,975,766 |
| $ | 38,869,791 |
| 3,793,569 |
| $ | 80,215,117 |
|
| Issued in reinvestment of distributions | 3,088,013 |
| 56,351,833 |
| 1,668,183 |
| 34,204,938 |
|
| Redeemed | (19,865,193 | ) | (383,263,303 | ) | (2,383,507 | ) | (51,260,214 | ) |
| | (14,801,414 | ) | (288,041,679 | ) | 3,078,245 |
| 63,159,841 |
|
| Class II/Shares Authorized | 225,000,000 |
| | 225,000,000 |
| |
| Sold | 2,075,238 |
| 40,262,504 |
| 3,758,748 |
| 80,183,595 |
|
| Issued in reinvestment of distributions | 3,199,984 |
| 58,653,201 |
| 3,184,339 |
| 65,471,586 |
|
| Redeemed | (4,370,229 | ) | (84,389,729 | ) | (24,326,784 | ) | (503,315,611 | ) |
| | 904,993 |
| 14,525,976 |
| (17,383,697 | ) | (357,660,430 | ) |
| Net increase (decrease) | (13,896,421 | ) | $ | (273,515,703 | ) | (14,305,452 | ) | $ | (294,500,589 | ) |
6. Fair Value Measurements
The fund’s investments valuation process is based on several considerations and may use multiple inputs to determine the fair value of the investments held by the fund. In conformity with accounting principles generally accepted in the United States of America, the inputs used to determine a valuation are classified into three broad levels.
| |
| • | Level 1 valuation inputs consist of unadjusted quoted prices in an active market for identical investments. |
| |
| • | Level 2 valuation inputs consist of direct or indirect observable market data (including quoted prices for comparable investments, evaluations of subsequent market events, interest rates, prepayment speeds, credit risk, etc.). These inputs also consist of quoted prices for identical investments initially expressed in local currencies that are adjusted through translation into U.S. dollars. |
| |
| • | Level 3 valuation inputs consist of unobservable data (including a fund’s own assumptions). |
The level classification is based on the lowest level input that is significant to the fair valuation measurement. The valuation inputs are not necessarily an indication of the risks associated with investing in these securities or other financial instruments.
The following is a summary of the level classifications as of period end. The Schedule of Investments provides additional information on the fund’s portfolio holdings.
|
| | | | | | | | |
| | Level 1 | Level 2 | Level 3 |
| Assets | | | |
| Investment Securities | | | |
| Common Stocks | | | |
| Aerospace and Defense | $ | 4,984,987 |
| $ | 5,175,664 |
| — |
|
| Electrical Equipment | 38,517,967 |
| 3,699,241 |
| — |
|
| Food and Staples Retailing | 5,766,080 |
| 7,150,201 |
| — |
|
| Food Products | 19,731,370 |
| 7,089,652 |
| — |
|
| Health Care Equipment and Supplies | 25,001,857 |
| 4,566,332 |
| — |
|
| Hotels, Restaurants and Leisure | 6,620,709 |
| 6,136,487 |
| — |
|
| Machinery | 13,328,687 |
| 6,394,475 |
| — |
|
| Oil, Gas and Consumable Fuels | 15,263,368 |
| 3,755,605 |
| — |
|
| Paper and Forest Products | — |
| 6,803,765 |
| — |
|
| Wireless Telecommunication Services | — |
| 4,453,343 |
| — |
|
| Other Industries | 452,579,157 |
| — |
| — |
|
| Exchange-Traded Funds | 20,806,185 |
| — |
| — |
|
| Temporary Cash Investments | 6,693 |
| 12,274,745 |
| — |
|
| | $ | 602,607,060 |
| $ | 67,499,510 |
| — |
|
| Other Financial Instruments | | | |
| Forward Foreign Currency Exchange Contracts | — |
| $ | 5,630 |
| — |
|
| | | | |
| Liabilities | | | |
| Other Financial Instruments | | | |
| Forward Foreign Currency Exchange Contracts | — |
| $ | 490,458 |
| — |
|
7. Derivative Instruments
Foreign Currency Risk — The fund is subject to foreign currency exchange rate risk in the normal course of pursuing its investment objectives. The value of foreign investments held by a fund may be significantly affected by changes in foreign currency exchange rates. The dollar value of a foreign security generally decreases when the value of the dollar rises against the foreign currency in which the security is denominated and tends to increase when the value of the dollar declines against such foreign currency. A fund may enter into forward foreign currency exchange contracts to reduce a fund's exposure to foreign currency exchange rate fluctuations. The net U.S. dollar value of foreign currency underlying all contractual commitments held by a fund and the resulting unrealized appreciation or depreciation are determined daily. Realized gain or loss is recorded upon the termination of the contract. Net realized and unrealized gains or losses occurring during the holding period of forward foreign currency exchange contracts are a component of net realized gain (loss) on forward foreign currency exchange contract transactions and change in net unrealized appreciation (depreciation) on forward foreign currency exchange contracts, respectively. A fund bears the risk of an unfavorable change in the foreign currency exchange rate underlying the forward contract. Additionally, losses, up to the fair value, may arise if the counterparties do not perform under the contract terms. The fund's average U.S. dollar exposure to foreign currency risk derivative instruments held during the period was $60,035,516.
The value of foreign currency risk derivative instruments as of December 31, 2019, is disclosed on the Statement of Assets and Liabilities as an asset of $5,630 in unrealized appreciation on forward foreign currency exchange contracts and a liability of $490,458 in unrealized depreciation on forward foreign currency exchange contracts. For the year ended December 31, 2019, the effect of foreign currency risk derivative instruments on the Statement of Operations was $1,259,870 in net realized gain (loss) on forward foreign currency exchange contract transactions and $(86,226) in change in net unrealized appreciation (depreciation) on forward foreign currency exchange contracts.
8. Risk Factors
There are certain risks involved in investing in foreign securities. These risks include those resulting from political events (such as civil unrest, national elections and imposition of exchange controls), social and economic events (such as labor strikes and rising inflation), and natural disasters. Securities of foreign issuers may be less liquid and more volatile. Investing a significant portion of assets in one country or region may accentuate these risks.
9. Federal Tax Information
The tax character of distributions paid during the years ended December 31, 2019 and December 31, 2018 were as follows:
|
| | | | | | |
| | 2019 | 2018 |
| Distributions Paid From | | |
| Ordinary income | $ | 22,458,792 |
| $ | 20,220,628 |
|
| Long-term capital gains | $ | 93,223,889 |
| $ | 79,878,404 |
|
The book-basis character of distributions made during the year from net investment income or net realized gains may differ from their ultimate characterization for federal income tax purposes. These differences reflect the differing character of certain income items and net realized gains and losses for financial statement and tax purposes, and may result in reclassification among certain capital accounts on the financial statements.
The reclassifications, which are primarily due to redemptions in kind, were made to capital $37,291,616 and distributable earnings $(37,291,616).
As of period end, the federal tax cost of investments and the components of distributable earnings on a tax-basis were as follows:
|
| | | |
| Federal tax cost of investments | $ | 546,308,535 |
|
| Gross tax appreciation of investments | $ | 128,531,923 |
|
| Gross tax depreciation of investments | (4,733,888 | ) |
| Net tax appreciation (depreciation) of investments | 123,798,035 |
|
| Net tax appreciation (depreciation) on derivatives and translation of assets and liabilities in foreign currencies | 1,721 |
|
| Net tax appreciation (depreciation) | $ | 123,799,756 |
|
| Undistributed ordinary income | $ | 1,118,055 |
|
Accumulated short-term capital losses
| $ | (3,360,669 | ) |
Accumulated long-term capital losses
| $ | (5,021,179 | ) |
The difference between book-basis and tax-basis unrealized appreciation (depreciation) is attributable primarily to the tax deferral of losses on wash sales.
Accumulated capital losses represent net capital loss carryovers that may be used to offset future realized
capital gains for federal income tax purposes. The capital loss carryovers may be carried forward for an
unlimited period. Future capital loss carryover utilization in any given year may be subject to Internal Revenue
Code limitations.
|
| | | | | | | | | | | | | | | |
| For a Share Outstanding Throughout the Years Ended December 31 (except as noted) | | | | | | | | |
| Per-Share Data | Ratios and Supplemental Data | | | |
| | | Income From Investment Operations: | Distributions From: | | | Ratio to Average Net Assets of: | | |
| | Net Asset Value, Beginning of Period | Net Investment Income (Loss)(1) | Net Realized and Unrealized Gain (Loss) | Total From Investment Operations | Net Investment Income | Net Realized Gains | Total Distributions | Net Asset Value, End of Period | Total Return(2) | Operating Expenses | Operating
Expenses
(before
expense
waiver) | Net
Investment
Income
(Loss) | Net Investment Income (Loss) (before expense waiver) | Portfolio Turnover Rate | Net Assets, End of Period (in thousands) |
| Class I | | | | | | | | | | | | | | |
| 2019 | $18.31 | 0.35 | 4.62 | 4.97 | (0.41) | (2.19) | (2.60) | $20.68 | 29.15% | 0.85% | 1.00% | 1.66% | 1.51% | 41% | $173,105 |
| 2018 | $22.75 | 0.29 | (3.04) | (2.75) | (0.31) | (1.38) | (1.69) | $18.31 | (12.84)% | 0.84% | 1.00% | 1.31% | 1.15% | 72% | $424,234 |
| 2017 | $21.12 | 0.37 | 2.03 | 2.40 | (0.34) | (0.43) | (0.77) | $22.75 | 11.69% | 0.86% | 1.01% | 1.68% | 1.53% | 45% | $457,104 |
| 2016 | $18.39 | 0.30 | 3.71 | 4.01 | (0.33) | (0.95) | (1.28) | $21.12 | 22.85% | 0.87% | 1.00% | 1.59% | 1.46% | 49% | $359,606 |
| 2015 | $19.84 | 0.24 | (0.49) | (0.25) | (0.32) | (0.88) | (1.20) | $18.39 | (1.43)% | 0.88% | 1.00% | 1.29% | 1.17% | 65% | $268,866 |
| Class II | | | | | | | | | | | | | | |
| 2019 | $18.32 | 0.30 | 4.65 | 4.95 | (0.38) | (2.19) | (2.57) | $20.70 | 28.99% | 1.00% | 1.15% | 1.51% | 1.36% | 41% | $497,924 |
| 2018 | $22.76 | 0.24 | (3.03) | (2.79) | (0.27) | (1.38) | (1.65) | $18.32 | (12.96)% | 0.99% | 1.15% | 1.16% | 1.00% | 72% | $424,219 |
| 2017 | $21.13 | 0.33 | 2.03 | 2.36 | (0.30) | (0.43) | (0.73) | $22.76 | 11.47% | 1.01% | 1.16% | 1.53% | 1.38% | 45% | $922,737 |
| 2016 | $18.40 | 0.28 | 3.70 | 3.98 | (0.30) | (0.95) | (1.25) | $21.13 | 22.72% | 1.02% | 1.15% | 1.44% | 1.31% | 49% | $841,525 |
| 2015 | $19.85 | 0.21 | (0.49) | (0.28) | (0.29) | (0.88) | (1.17) | $18.40 | (1.58)% | 1.03% | 1.15% | 1.14% | 1.02% | 65% | $552,552 |
|
|
| Notes to Financial Highlights |
| |
| (1) | Computed using average shares outstanding throughout the period. |
| |
| (2) | Total returns are calculated based on the net asset value of the last business day. Total returns for periods less than one year are not annualized. The total returns presented do not include the fees and charges assessed with investments in variable insurance products, those charges are disclosed in the separate account prospectus. The inclusion of such fees and charges would lower total return. |
See Notes to Financial Statements.
|
|
| Report of Independent Registered Public Accounting Firm |
To the Shareholders and the Board of Directors of American Century Variable Portfolios, Inc.:
Opinion on the Financial Statements and Financial Highlights
We have audited the accompanying statement of assets and liabilities, including the schedule of investments, of VP Mid Cap Value Fund, one of the funds constituting the American Century Variable Portfolios, Inc. (the "Fund"), as of December 31, 2019, the related statement of operations for the year then ended, the statements of changes in net assets for each of the two years in the period then ended, the financial highlights for each of the five years in the period then ended, and the related notes. In our opinion, the financial statements and financial highlights present fairly, in all material respects, the financial position of VP Mid Cap Value Fund of the American Century Variable Portfolios, Inc. as of December 31, 2019, the results of its operations for the year then ended, the changes in its net assets for each of the two years in the period then ended, and the financial highlights for each of the five years in the period then ended, in conformity with accounting principles generally accepted in the United States of America.
Basis for Opinion
These financial statements and financial highlights are the responsibility of the Fund's management. Our responsibility is to express an opinion on the Fund’s financial statements and financial highlights based on our audits. We are a public accounting firm registered with the Public Company Accounting Oversight Board (United States) (PCAOB) and are required to be independent with respect to the Fund in accordance with the U.S. federal securities laws and the applicable rules and regulations of the Securities and Exchange Commission and the PCAOB.
We conducted our audits in accordance with the standards of the PCAOB. Those standards require that we plan and perform the audit to obtain reasonable assurance about whether the financial statements and financial highlights are free of material misstatement, whether due to error or fraud. The Fund is not required to have, nor were we engaged to perform, an audit of its internal control over financial reporting. As part of our audits we are required to obtain an understanding of internal control over financial reporting but not for the purpose of expressing an opinion on the effectiveness of the Fund’s internal control over financial reporting. Accordingly, we express no such opinion.
Our audits included performing procedures to assess the risks of material misstatement of the financial statements and financial highlights, whether due to error or fraud, and performing procedures that respond to those risks. Such procedures included examining, on a test basis, evidence regarding the amounts and disclosures in the financial statements and financial highlights. Our audits also included evaluating the accounting principles used and significant estimates made by management, as well as evaluating the overall presentation of the financial statements and financial highlights. Our procedures included confirmation of securities owned as of December 31, 2019, by correspondence with the custodian and brokers; when replies were not received from brokers, we performed other auditing procedures. We believe that our audits provide a reasonable basis for our opinion.
DELOITTE & TOUCHE LLP
Kansas City, Missouri
February 13, 2020
We have served as the auditor of one or more American Century investment companies since 1997.
The Board of Directors
The individuals listed below serve as directors of the funds. Each director will continue to serve in this capacity until death, retirement, resignation or removal from office. The board has adopted a mandatory retirement age for directors who are not “interested persons,” as that term is defined in the Investment Company Act (independent directors). Independent directors shall retire by December 31 of the year in which they reach their 75th birthday.
Mr. Thomas is an “interested person” because he currently serves as President and Chief Executive Officer of American Century Companies, Inc. (ACC), the parent company of American Century Investment Management, Inc. (ACIM or the advisor). The other directors (more than three-fourths of the total number) are independent. They are not employees, directors or officers of, and have no financial interest in, ACC or any of its wholly owned, direct or indirect, subsidiaries, including ACIM, American Century Investment Services, Inc. (ACIS) and American Century Services, LLC (ACS), and they do not have any other affiliations, positions or relationships that would cause them to be considered “interested persons” under the Investment Company Act. The directors serve in this capacity for seven (in the case of Jonathan S. Thomas, 16; and Stephen E. Yates, 8) registered investment companies in the American Century Investments family of funds.
The following table presents additional information about the directors. The mailing address for each director is 4500 Main Street, Kansas City, Missouri 64111.
|
| | | | | |
Name
(Year of Birth) | Position(s) Held with Funds | Length of Time Served | Principal Occupation(s) During Past 5 Years | Number of American Century Portfolios Overseen by Director | Other Directorships Held During Past 5 Years |
| Independent Directors |
|
|
| Thomas W. Bunn (1953) | Director | Since 2017 | Retired | 64 | SquareTwo Financial; Barings (formerly Babson Capital Funds Trust) (2013 to 2016) |
Chris H. Cheesman
(1962)
| Director | Since 2019
| Retired. Senior Vice President & Chief Audit Executive, AllianceBernstein (1999 to 2018)
| 64 | None |
Barry Fink
(1955) | Director | Since 2012 (independent since 2016) | Retired | 64 | None |
Rajesh K. Gupta
(1960)
| Director | Since 2019
| Partner Emeritus, SeaCrest Investment Management and SeaCrest Wealth Management (2019 to Present); Chief Executive Officer and Chief Investment Officer, SeaCrest Investment Management (2006 to 2019); Chief Executive Officer and Chief Investment Officer, SeaCrest Wealth Management (2008 to 2019)
| 64 | None |
|
| | | | | |
Name
(Year of Birth) | Position(s) Held with Funds | Length of Time Served | Principal Occupation(s) During Past 5 Years | Number of American Century Portfolios Overseen by Director | Other Directorships Held During Past 5 Years |
| Independent Directors |
|
|
Lynn Jenkins
(1963)
| Director | Since 2019
| Consultant, LJ Strategies (2019 to present); United States Representative, U.S. House of Representatives (2009 to 2018) | 64 | MGP Ingredients, Inc. |
Jan M. Lewis
(1957) | Director | Since 2011 | Retired | 64 | None |
John R. Whitten
(1946) | Director | Since 2008 | Retired | 64 | Onto Innovation Inc.; Rudolph Technologies, Inc. (2006 to 2019) |
Stephen E. Yates
(1948) | Director and Chairman of the Board | Since 2012 (Chairman since 2018) | Retired | 79 | None |
| Interested Director |
|
Jonathan S. Thomas
(1963) | Director | Since 2007 | President and Chief Executive Officer, ACC (2007 to present). Also serves as Chief Executive Officer, ACS; Executive Vice President, ACIM; Director, ACC, ACIM and other ACC subsidiaries | 120 | None |
The Statement of Additional Information has additional information about the fund's directors and is available without charge, upon request, by calling 1-800-378-9878.
Officers
The following table presents certain information about the executive officers of the funds. Each officer serves as an officer for 16 (in the case of Robert J. Leach, 15) investment companies in the American Century family of funds. No officer is compensated for his or her service as an officer of the funds. The listed officers are interested persons of the funds and are appointed or re-appointed on an annual basis. The mailing address for each officer listed below is 4500 Main Street, Kansas City, Missouri 64111.
|
| | |
Name
(Year of Birth) | Offices with the Funds | Principal Occupation(s) During the Past Five Years |
Patrick Bannigan
(1965) | President since 2019 | Executive Vice President and Director, ACC (2012 to present); Chief Financial Officer, Chief Accounting Officer and Treasurer, ACC (2015 to present); Chief Operating Officer, ACC (2012-2015). Also serves as President, ACS; Vice President, ACIM; Chief Financial Officer, Chief Accounting Officer and/or Director, ACIM, ACS and other ACC subsidiaries |
R. Wes Campbell
(1974) | Chief Financial Officer and Treasurer since 2018 | Investment Operations and Investment Accounting, ACS (2000 to present) |
Amy D. Shelton
(1964) | Chief Compliance Officer and Vice President since 2014 | Chief Compliance Officer, American Century funds, (2014 to present); Chief Compliance Officer, ACIM (2014 to present); Chief Compliance Officer, ACIS (2009 to present). Also serves as Vice President, ACIS |
Charles A. Etherington
(1957) | General Counsel since 2007 and Senior Vice President since 2006 | Attorney, ACC (1994 to present); Vice President, ACC (2005 to present); General Counsel, ACC (2007 to present). Also serves as General Counsel, ACIM, ACS, ACIS and other ACC subsidiaries; and Senior Vice President, ACIM and ACS |
C. Jean Wade
(1964) | Vice President since 2012 | Senior Vice President, ACS (2017 to present); Vice President, ACS (2000 to 2017)
|
Robert J. Leach
(1966) | Vice President since 2006 | Vice President, ACS (2000 to present) |
David H. Reinmiller
(1963) | Vice President since 2000 | Attorney, ACC (1994 to present). Also serves as Vice President, ACIM and ACS |
Ward D. Stauffer
(1960) | Secretary since 2005 | Attorney, ACC (2003 to present) |
Proxy Voting Policies
A description of the policies that the fund's investment advisor uses in exercising the voting rights associated with the securities purchased and/or held by the fund is available without charge, upon request, by calling 1-800-378-9878. It is also available on American Century Investments’ website at americancentury.com/proxy and on the Securities and Exchange Commission’s website at sec.gov. Information regarding how the investment advisor voted proxies relating to portfolio securities during the most recent 12-month period ended June 30 is available on americancentury.com/proxy. It is also available at sec.gov.
Quarterly Portfolio Disclosure
The fund files its complete schedule of portfolio holdings with the Securities and Exchange Commission (SEC) for the first and third quarters of each fiscal year on Form N-Q or as an exhibit to its reports on Form N-PORT. The fund’s Forms N-Q and Form N-PORT reports are available on the SEC’s website at sec.gov. The fund also makes its complete schedule of portfolio holdings for the most recent quarter of its fiscal year available on its website at ipro.americancentury.com (for Investment Professionals) and, upon request, by calling 1-800-378-9878.
Other Tax Information
The following information is provided pursuant to provisions of the Internal Revenue Code.
For corporate taxpayers, the fund hereby designates $17,504,625, or up to the maximum amount
allowable, of ordinary income distributions paid during the fiscal year ended December 31, 2019 as
qualified for the corporate dividends received deduction.
The fund hereby designates $93,223,889, or up to the maximum amount allowable, as long-term
capital gain distributions (20% rate gain distributions) for the fiscal year ended December 31, 2019.
The fund hereby designates $7,734,825 as qualified short-term capital gain distributions for purposes of Internal Revenue Code Section 871 for the fiscal year ended December 31, 2019.
|
| | |
| |
| | | |
| Contact Us | americancentury.com | |
| Automated Information Line | 1-800-345-8765 | |
| Investment Professional Service Representatives | 1-800-345-6488 | |
| Telecommunications Relay Service for the Deaf | 711 | |
| | | |
| American Century Variable Portfolios, Inc. | |
| | | |
Investment Advisor: American Century Investment Management, Inc. Kansas City, Missouri | |
| | | |
| This report and the statements it contains are submitted for the general information of our shareholders. The report is not authorized for distribution to prospective investors unless preceded or accompanied by an effective prospectus. | |
| | | |
©2020 American Century Proprietary Holdings, Inc. All rights reserved.
CL-ANN-91446 2002 | |
|
| |
| | |
| | Annual Report |
| | |
| | December 31, 2019 |
| | |
| | VP Ultra® Fund |
| | Class I (AVPUX) |
| | Class II (AVPSX) |
Beginning on January 1, 2021, as permitted by regulations adopted by the Securities and Exchange Commission, paper copies of the fund’s shareholder reports like this one will no longer be sent by mail from the insurance company that offers your contract, unless you specifically request paper copies of the reports from the insurance company or from your financial intermediary. Instead, the reports will be made available on a website, and you will be notified by mail each time a report is posted and provided with a website link to access the report.
If you already elected to receive shareholder reports electronically, you will not be affected by this change and you need not take any action. You may elect to receive shareholder reports and other communications from the insurance company or your financial intermediary electronically by contacting the insurance company.
You may elect to receive all future reports in paper free of charge. You can inform the insurance company or your financial intermediary that you wish to continue receiving paper copies of your shareholder reports by contacting the insurance company. Your election to receive reports in paper will apply to all variable portfolios available under your contract.
|
| |
| Performance | |
| Portfolio Commentary | |
| Fund Characteristics | |
| Shareholder Fee Example | |
| Schedule of Investments | |
| Statement of Assets and Liabilities | |
| Statement of Operations | |
| Statement of Changes in Net Assets | |
| Notes to Financial Statements | |
| Financial Highlights | |
| Report of Independent Registered Public Accounting Firm | |
| Management | |
| Additional Information | |
Any opinions expressed in this report reflect those of the author as of the date of the report, and do not necessarily represent the opinions of American Century Investments® or any other person in the American Century Investments organization. Any such opinions are subject to change at any time based upon market or other conditions and American Century Investments disclaims any responsibility to update such opinions. These opinions may not be relied upon as investment advice and, because investment decisions made by American Century Investments funds are based on numerous factors, may not be relied upon as an indication of trading intent on behalf of any American Century Investments fund. Security examples are used for representational purposes only and are not intended as recommendations to purchase or sell securities. Performance information for comparative indices and securities is provided to American Century Investments by third party vendors. To the best of American Century Investments’ knowledge, such information is accurate at the time of printing.
|
| | | | | |
| Total Returns as of December 31, 2019 | |
| | | | Average Annual Returns | |
| | Ticker Symbol | 1 year | 5 years | 10 years | Inception Date |
| Class I | AVPUX | 34.58% | 14.75% | 14.89% | 5/1/01 |
| Russell 1000 Growth Index | — | 36.39% | 14.62% | 15.21% | — |
| S&P 500 Index | — | 31.49% | 11.69% | 13.55% | — |
| Class II | AVPSX | 34.46% | 14.58% | 14.72% | 5/1/02 |
Fund returns would have been lower if a portion of the fees had not been waived. Extraordinary performance is attributable in part to unusually favorable market conditions and may not be repeated or consistently achieved in the future.
The performance information presented does not include the fees and charges assessed with investments in variable insurance products, those charges are disclosed in the separate account prospectus. The inclusion of such fees and charges would lower performance.
Data presented reflect past performance. Past performance is no guarantee of future results. Current performance may be higher or lower than the performance shown. Total returns for periods less than one year are not annualized. Investment return and principal value will fluctuate, and redemption value may be more or less than original cost. Data assumes reinvestment of dividends and capital gains, and none of the charts reflect the deduction of taxes that a shareholder would pay on fund distributions or the redemption of fund shares. To obtain performance data current to the most recent month end, please call 1-800-345-6488 or visit ipro.americancentury.com (for Investment Professionals). For additional information about the fund, please consult the prospectus.
|
|
| Growth of $10,000 Over 10 Years |
| $10,000 investment made December 31, 2009 |
| Performance for other share classes will vary due to differences in fee structure. |
|
| |
| Value on December 31, 2019 |
| | Class I — $40,105 |
| |
| | Russell 1000 Growth Index — $41,234 |
| |
| | S&P 500 Index — $35,666 |
| |
Ending value of Class I would have been lower if a portion of the fees had not been waived.
|
| |
| Total Annual Fund Operating Expenses |
| Class I | Class II |
| 1.01% | 1.16% |
The total annual fund operating expenses shown is as stated in the fund’s prospectus current as of the date of this report. The prospectus may vary from the expense ratio shown elsewhere in this report because it is based on a different time period, includes acquired fund fees and expenses, and, if applicable, does not include fee waivers or expense reimbursements.
Data presented reflect past performance. Past performance is no guarantee of future results. Current performance may be higher or lower than the performance shown. Total returns for periods less than one year are not annualized. Investment return and principal value will fluctuate, and redemption value may be more or less than original cost. Data assumes reinvestment of dividends and capital gains, and none of the charts reflect the deduction of taxes that a shareholder would pay on fund distributions or the redemption of fund shares. To obtain performance data current to the most recent month end, please call 1-800-345-6488 or visit ipro.americancentury.com (for Investment Professionals). For additional information about the fund, please consult the prospectus.
Portfolio Managers: Keith Lee, Michael Li and Jeff Bourke
Performance Summary
VP Ultra returned 34.46%* for the 12 months ended December 31, 2019, lagging the 36.39% return of the portfolio’s benchmark, the Russell 1000 Growth Index.
U.S. stocks posted strong returns during the reporting period. Growth stocks outperformed value stocks by a wide margin. Within the Russell 1000 Growth Index, all sectors posted gains, led by information technology, communication services and financials.
Positioning in the energy and health care sectors detracted from performance relative to the benchmark. Stock selection in the health care sector also hampered performance. Stock selection in the consumer discretionary and consumer staples sectors benefited relative performance.
Energy Stocks Were Key Detractors
Stock selection in energy and an overweight allocation to the sector hurt performance relative to the benchmark. The stock price of EOG Resources, an oil and gas exploration and production company, fell as the price of crude oil declined. Oil and gas production company Concho Resources also fell after it reported disappointing quarterly production. The energy environment faced headwinds for much of the year on concerns about the potential for weaker demand in a slowing global economy. We eliminated our holding of Concho.
Stock choices in the health care equipment and supplies and biotechnology industries contributed to underperformance in the health care sector. Key detractors in the sector included Regeneron Pharmaceuticals and UnitedHealth Group. Regeneron uses its genetic database, one of the world’s most comprehensive, to develop therapies in areas such as infectious diseases, immunology and cancer. The stock suffered from the larger macro and political concerns affecting drug company stocks generally. In addition, Regeneron reported earnings below analysts’ estimates, in part because of higher spending on research and development. Managed health care firm UnitedHealth underperformed as presidential election rhetoric elevated market anxiety about regulatory and pricing risk. We believe the company’s use of data analytics and technology positions it well to drive efficiency gains across the health care sector, reducing costs and improving patient outcomes.
Having an underweight position in Microsoft detracted. We hold a sizable stake in Microsoft but own less than the benchmark. Being underrepresented hurt performance as the software company continued to execute at a high level. Azure, Microsoft’s cloud computing offering, grew at a greater-than-expected pace, and the company’s Office 365 service and Windows platform performed well.
Consumer Discretionary Stocks Were Top Contributors
Stock selection in the hotels, restaurants and leisure industry benefited relative performance in the consumer discretionary sector. Chipotle Mexican Grill was a top contributor. The restaurant chain’s new management team has improved operations and enthusiasm for the brand. Through
*All fund returns referenced in this commentary are for Class II shares. Fund returns would have been lower if a portion of the fees had not been waived. Performance for other share classes will vary due to differences in fee structure; when Class II performance exceeds that of the fund’s benchmark, other share classes may not. See page 2 for returns for all share classes.
enhanced marketing campaigns, digital ordering technology and a recently launched loyalty program, the company has achieved increased guest frequency and improved sales trends.
Stock selection in the consumer staples sector was beneficial. The Estee Lauder Cos. was a top contributor. The cosmetics firm outperformed due to better-than-expected quarterly earnings driven by strong sales in China, in the travel retail channel and for its skin care products that led to results that exceeded analysts’ expectations.
Other top contributors included payment services company Mastercard. Its stock price increased after reporting consistently strong earnings growth that exceeded expectations. Our holding of Apple outperformed. The company reported better-than-expected results as new products have experienced good demand. The expected launch of 5G iPhones next year also provided a tailwind for the stock. DocuSign was a significant contributor. Its stock price rose after the company reported revenue that beat expectations and offered strong guidance for the fiscal year. The company is a licensing and subscription-based software-as-a-service company focused on simplifying the process of signing and preparing legal documents.
Outlook
We remain confident in our belief that high-quality companies with the capacity for sustained long-term growth will outperform in the long term. Our portfolio positioning reflects opportunities we are seeing as a result of the application of that philosophy and process.
As of December 31, 2019, this process pointed the portfolio toward overweight positions relative to the Russell 1000 Growth Index in the consumer discretionary and communication services sectors. The consumer discretionary overweight reflects our belief that our portfolio companies offer enduring growth, particularly those with dominant global brands and those leveraging technology to drive expansion. Communication services includes large portfolio holdings in Facebook and Alphabet, the parent company of Google.
The industrials and health care sectors represented the largest underweights. The industrials sector underweight reflects a lack of exposure to the air freight and logistics and trading companies and distributors industries, where we have found no companies offering the attractive, sustainable, long-term growth potential that we seek. While we continue to believe that many segments of the health care sector are primed for a golden age of innovation and positive social impact, we remain cautious on some segments due to ongoing political and headline risk.
|
| |
| DECEMBER 31, 2019 |
| Top Ten Holdings | % of net assets |
| Apple, Inc. | 10.0% |
| Alphabet, Inc.* | 6.6% |
| Amazon.com, Inc. | 6.0% |
| Mastercard, Inc., Class A | 5.4% |
| Microsoft Corp. | 5.3% |
| Visa, Inc., Class A | 5.1% |
| Facebook, Inc., Class A | 4.2% |
| UnitedHealth Group, Inc. | 3.9% |
| salesforce.com, Inc. | 3.3% |
| Intuitive Surgical, Inc. | 2.7% |
| *Includes all classes of the issuer held by the fund. | |
| | |
| Top Five Industries | % of net assets |
| IT Services | 14.1% |
| Interactive Media and Services | 11.6% |
| Software | 10.8% |
| Technology Hardware, Storage and Peripherals | 10.0% |
| Internet and Direct Marketing Retail | 6.0% |
| | |
| Types of Investments in Portfolio | % of net assets |
| Common Stocks | 100.1% |
| Exchange-Traded Funds | 0.2% |
| Total Equity Exposure | 100.3% |
| Temporary Cash Investments | 0.4% |
| Other Assets and Liabilities | (0.7)% |
Fund shareholders may incur two types of costs: (1) transaction costs, including sales charges (loads) on purchase payments and redemption/exchange fees; and (2) ongoing costs, including management fees; distribution and service (12b-1) fees; and other fund expenses. This example is intended to help you understand your ongoing costs (in dollars) of investing in your fund and to compare these costs with the ongoing cost of investing in other mutual funds.
The example is based on an investment of $1,000 made at the beginning of the period and held for the entire period from July 1, 2019 to December 31, 2019.
Actual Expenses
The table provides information about actual account values and actual expenses for each class. You may use the information, together with the amount you invested, to estimate the expenses that you paid over the period. First, identify the share class you own. Then simply divide your account value by $1,000 (for example, an $8,600 account value divided by $1,000 = 8.6), then multiply the result by the number under the heading “Expenses Paid During Period” to estimate the expenses you paid on your account during this period.
Hypothetical Example for Comparison Purposes
The table also provides information about hypothetical account values and hypothetical expenses based on the actual expense ratio of each class of your fund and an assumed rate of return of 5% per year before expenses, which is not the actual return of a fund’s share class. The hypothetical account values and expenses may not be used to estimate the actual ending account balance or expenses you paid for the period. You may use this information to compare the ongoing costs of investing in your fund and other funds. To do so, compare this 5% hypothetical example with the 5% hypothetical examples that appear in the shareholder reports of the other funds.
Please note that the expenses shown in the table are meant to highlight your ongoing costs only and do not reflect any transactional costs, such as sales charges (loads) or redemption/exchange fees. Therefore, the table is useful in comparing ongoing costs only, and will not help you determine the relative total costs of owning different funds. In addition, if these transactional costs were included, your costs would have been higher.
|
| | | | |
| | Beginning
Account Value
7/1/19 | Ending
Account Value
12/31/19 | Expenses Paid
During Period(1)
7/1/19 - 12/31/19 |
Annualized
Expense Ratio(1) |
| Actual | | | | |
| Class I | $1,000 | $1,115.70 | $4.32 | 0.81% |
| Class II | $1,000 | $1,114.90 | $5.12 | 0.96% |
| Hypothetical | | | | |
| Class I | $1,000 | $1,021.12 | $4.13 | 0.81% |
| Class II | $1,000 | $1,020.37 | $4.89 | 0.96% |
| |
| (1) | Expenses are equal to the class's annualized expense ratio listed in the table above, multiplied by the average account value over the period, multiplied by 184, the number of days in the most recent fiscal half-year, divided by 365, to reflect the one-half year period. Annualized expense ratio reflects actual expenses, including any applicable fee waivers or expense reimbursements and excluding any acquired fund fees and expenses. |
DECEMBER 31, 2019
|
| | | | |
| | Shares | Value |
| COMMON STOCKS — 100.1% | | |
| Aerospace and Defense — 1.5% | | |
| Boeing Co. (The) | 9,790 | $ | 3,189,190 |
|
| Automobiles — 2.0% | | |
Tesla, Inc.(1) | 10,390 | 4,346,449 |
|
| Banks — 2.1% | | |
| JPMorgan Chase & Co. | 17,090 | 2,382,346 |
|
| U.S. Bancorp | 37,190 | 2,204,995 |
|
| | | 4,587,341 |
|
| Beverages — 1.4% | | |
| Constellation Brands, Inc., Class A | 15,480 | 2,937,330 |
|
| Biotechnology — 3.3% | | |
Biogen, Inc.(1) | 6,350 | 1,884,235 |
|
Bluebird Bio, Inc.(1) | 4,670 | 409,793 |
|
Ionis Pharmaceuticals, Inc.(1) | 13,260 | 801,037 |
|
Regeneron Pharmaceuticals, Inc.(1) | 9,060 | 3,401,849 |
|
Sage Therapeutics, Inc.(1) | 7,250 | 523,377 |
|
| | | 7,020,291 |
|
| Capital Markets — 1.0% | | |
| MSCI, Inc. | 8,380 | 2,163,548 |
|
| Chemicals — 1.1% | | |
| Ecolab, Inc. | 12,340 | 2,381,497 |
|
| Electrical Equipment — 1.2% | | |
| Acuity Brands, Inc. | 18,610 | 2,568,180 |
|
| Electronic Equipment, Instruments and Components — 0.7% | | |
| Cognex Corp. | 13,830 | 775,033 |
|
| Keyence Corp. | 2,000 | 707,907 |
|
| | | 1,482,940 |
|
| Entertainment — 3.7% | | |
Netflix, Inc.(1) | 8,880 | 2,873,302 |
|
| Walt Disney Co. (The) | 34,800 | 5,033,124 |
|
| | | 7,906,426 |
|
| Food and Staples Retailing — 1.8% | | |
| Costco Wholesale Corp. | 13,280 | 3,903,258 |
|
| Health Care Equipment and Supplies — 4.7% | | |
ABIOMED, Inc.(1) | 3,460 | 590,241 |
|
Edwards Lifesciences Corp.(1) | 9,120 | 2,127,605 |
|
IDEXX Laboratories, Inc.(1) | 5,020 | 1,310,872 |
|
Intuitive Surgical, Inc.(1) | 9,880 | 5,840,562 |
|
Tandem Diabetes Care, Inc.(1) | 6,360 | 379,120 |
|
| | | 10,248,400 |
|
| Health Care Providers and Services — 3.9% | | |
| UnitedHealth Group, Inc. | 28,670 | 8,428,407 |
|
|
| | | | |
| | Shares | Value |
| Hotels, Restaurants and Leisure — 3.4% | | |
Chipotle Mexican Grill, Inc.(1) | 4,240 | $ | 3,549,346 |
|
| Starbucks Corp. | 38,700 | 3,402,504 |
|
| Wingstop, Inc. | 5,500 | 474,265 |
|
| | | 7,426,115 |
|
| Household Products — 0.9% | | |
| Colgate-Palmolive Co. | 28,450 | 1,958,498 |
|
| Interactive Media and Services — 11.6% | | |
Alphabet, Inc., Class A(1) | 4,770 | 6,388,890 |
|
Alphabet, Inc., Class C(1) | 5,810 | 7,768,086 |
|
Facebook, Inc., Class A(1) | 44,370 | 9,106,943 |
|
| Tencent Holdings Ltd. | 37,300 | 1,799,298 |
|
| | | 25,063,217 |
|
| Internet and Direct Marketing Retail — 6.0% | | |
Amazon.com, Inc.(1) | 6,980 | 12,897,923 |
|
| IT Services — 14.1% | | |
| Mastercard, Inc., Class A | 38,820 | 11,591,264 |
|
PayPal Holdings, Inc.(1) | 41,890 | 4,531,241 |
|
Shopify, Inc., Class A(1) | 3,360 | 1,335,869 |
|
Square, Inc., Class A(1) | 29,210 | 1,827,378 |
|
| Visa, Inc., Class A | 59,080 | 11,101,132 |
|
| | | 30,386,884 |
|
| Machinery — 2.6% | | |
| Cummins, Inc. | 5,640 | 1,009,334 |
|
| Donaldson Co., Inc. | 11,040 | 636,125 |
|
| Nordson Corp. | 5,330 | 867,937 |
|
| Westinghouse Air Brake Technologies Corp. | 22,920 | 1,783,176 |
|
| Yaskawa Electric Corp. | 32,300 | 1,218,824 |
|
| | | 5,515,396 |
|
| Oil, Gas and Consumable Fuels — 0.7% | | |
| EOG Resources, Inc. | 18,580 | 1,556,261 |
|
| Personal Products — 1.7% | | |
| Estee Lauder Cos., Inc. (The), Class A | 18,250 | 3,769,355 |
|
| Road and Rail — 1.1% | | |
| J.B. Hunt Transport Services, Inc. | 20,910 | 2,441,870 |
|
| Semiconductors and Semiconductor Equipment — 2.6% | | |
| Analog Devices, Inc. | 19,900 | 2,364,916 |
|
| Applied Materials, Inc. | 25,900 | 1,580,936 |
|
| Maxim Integrated Products, Inc. | 2,100 | 129,171 |
|
| Xilinx, Inc. | 16,020 | 1,566,275 |
|
| | | 5,641,298 |
|
| Software — 10.8% | | |
DocuSign, Inc.(1) | 34,420 | 2,550,866 |
|
| Microsoft Corp. | 72,250 | 11,393,825 |
|
Paycom Software, Inc.(1) | 4,880 | 1,292,029 |
|
salesforce.com, Inc.(1) | 44,130 | 7,177,303 |
|
Splunk, Inc.(1) | 6,560 | 982,491 |
|
| | | 23,396,514 |
|
|
| | | | |
| | Shares | Value |
| Specialty Retail — 3.6% | | |
| Ross Stores, Inc. | 23,600 | $ | 2,747,512 |
|
| TJX Cos., Inc. (The) | 82,650 | 5,046,609 |
|
| | | 7,794,121 |
|
| Technology Hardware, Storage and Peripherals — 10.0% | | |
| Apple, Inc. | 73,800 | 21,671,370 |
|
| Textiles, Apparel and Luxury Goods — 2.6% | | |
| NIKE, Inc., Class B | 39,990 | 4,051,387 |
|
Under Armour, Inc., Class C(1) | 77,930 | 1,494,697 |
|
| | | 5,546,084 |
|
TOTAL COMMON STOCKS
(Cost $71,176,028) | | 216,228,163 |
|
| EXCHANGE-TRADED FUNDS — 0.2% | | |
iShares Russell 1000 Growth ETF
(Cost $361,198) | 2,270 | 399,338 |
|
| TEMPORARY CASH INVESTMENTS — 0.4% | | |
| Repurchase Agreement, BMO Capital Markets Corp., (collateralized by various U.S. Treasury obligations, 2.75% - 3.75%, 9/15/21 - 11/15/43, valued at $766,745), in a joint trading account at 1.35%, dated 12/31/19, due 1/2/20 (Delivery value $750,631) | | 750,575 |
|
| Repurchase Agreement, Fixed Income Clearing Corp., (collateralized by various U.S. Treasury obligations, 1.625%, 12/15/22, valued at $175,259), at 0.65%, dated 12/31/19, due 1/2/20 (Delivery value $167,006) | | 167,000 |
|
| State Street Institutional U.S. Government Money Market Fund, Premier Class | 498 | 498 |
|
TOTAL TEMPORARY CASH INVESTMENTS
(Cost $918,073) | | 918,073 |
|
TOTAL INVESTMENT SECURITIES — 100.7%
(Cost $72,455,299) | | 217,545,574 |
|
| OTHER ASSETS AND LIABILITIES — (0.7)% | | (1,430,587 | ) |
| TOTAL NET ASSETS — 100.0% | | $ | 216,114,987 |
|
|
| | | | | | | | |
| FORWARD FOREIGN CURRENCY EXCHANGE CONTRACTS |
| Currency Purchased | Currency Sold | Counterparty | Settlement Date | Unrealized Appreciation
(Depreciation) |
| USD | 705,589 | JPY | 76,759,550 | Bank of America N.A. | 3/31/20 | $ | (4,220 | ) |
|
| | |
| NOTES TO SCHEDULE OF INVESTMENTS |
| JPY | - | Japanese Yen |
| USD | - | United States Dollar |
See Notes to Financial Statements.
|
|
| Statement of Assets and Liabilities |
|
| | | |
| DECEMBER 31, 2019 | |
| Assets | |
| Investment securities, at value (cost of $72,455,299) | $ | 217,545,574 |
|
| Receivable for investments sold | 130,015 |
|
| Receivable for capital shares sold | 41,567 |
|
| Dividends and interest receivable | 65,333 |
|
| | 217,782,489 |
|
| | |
| Liabilities | |
| Payable for capital shares redeemed | 1,497,800 |
|
| Unrealized depreciation on forward foreign currency exchange contracts | 4,220 |
|
| Accrued management fees | 132,355 |
|
| Distribution fees payable | 33,127 |
|
| | 1,667,502 |
|
| | |
| Net Assets | $ | 216,114,987 |
|
| | |
| Net Assets Consist of: | |
| Capital (par value and paid-in surplus) | $ | 50,081,845 |
|
| Distributable earnings | 166,033,142 |
|
| | $ | 216,114,987 |
|
|
| | | | | | |
| | Net Assets | Shares Outstanding | Net Asset Value Per Share |
| Class I, $0.01 Par Value |
| $59,427,313 |
| 2,838,713 |
| $20.93 |
| Class II, $0.01 Par Value |
| $156,687,674 |
| 7,650,991 |
| $20.48 |
See Notes to Financial Statements.
|
| | | |
| YEAR ENDED DECEMBER 31, 2019 | |
| Investment Income (Loss) | |
| Income: | |
| Dividends (net of foreign taxes withheld of $1,887) | $ | 1,621,127 |
|
| Interest | 49,806 |
|
| | 1,670,933 |
|
| | |
| Expenses: | |
| Management fees | 1,909,513 |
|
| Distribution fees - Class II | 385,334 |
|
| Directors' fees and expenses | 6,493 |
|
| Other expenses | 3,621 |
|
| | 2,304,961 |
|
Fees waived(1) | (376,718 | ) |
| | 1,928,243 |
|
| | |
| Net investment income (loss) | (257,310 | ) |
| | |
| Realized and Unrealized Gain (Loss) | |
| Net realized gain (loss) on: | |
| Investment transactions | 22,093,100 |
|
| Forward foreign currency exchange contract transactions | 2,585 |
|
| Foreign currency translation transactions | (508 | ) |
| | 22,095,177 |
|
| | |
| Change in net unrealized appreciation (depreciation) on: | |
| Investments | 38,699,495 |
|
| Forward foreign currency exchange contracts | 9,467 |
|
| | 38,708,962 |
|
| | |
| Net realized and unrealized gain (loss) | 60,804,139 |
|
| | |
| Net Increase (Decrease) in Net Assets Resulting from Operations | $ | 60,546,829 |
|
| |
| (1) | Amount consists of $95,644 and $281,074 for Class I and Class II, respectively. |
See Notes to Financial Statements.
|
|
| Statement of Changes in Net Assets |
|
| | | | | | |
| YEARS ENDED DECEMBER 31, 2019 AND DECEMBER 31, 2018 |
| Increase (Decrease) in Net Assets | December 31, 2019 | December 31, 2018 |
| Operations | | |
| Net investment income (loss) | $ | (257,310 | ) | $ | (226,600 | ) |
| Net realized gain (loss) | 22,095,177 |
| 22,712,281 |
|
| Change in net unrealized appreciation (depreciation) | 38,708,962 |
| (19,383,542 | ) |
| Net increase (decrease) in net assets resulting from operations | 60,546,829 |
| 3,102,139 |
|
| | | |
| Distributions to Shareholders | | |
| From earnings: | | |
| Class I | (5,458,501 | ) | (4,898,293 | ) |
| Class II | (17,568,597 | ) | (17,309,527 | ) |
| Decrease in net assets from distributions | (23,027,098 | ) | (22,207,820 | ) |
| | | |
| Capital Share Transactions | | |
| Net increase (decrease) in net assets from capital share transactions (Note 5) | (6,734,932 | ) | (1,135,768 | ) |
| | | |
| Net increase (decrease) in net assets | 30,784,799 |
| (20,241,449 | ) |
| | | |
| Net Assets | | |
| Beginning of period | 185,330,188 |
| 205,571,637 |
|
| End of period | $ | 216,114,987 |
| $ | 185,330,188 |
|
See Notes to Financial Statements.
|
|
| Notes to Financial Statements |
DECEMBER 31, 2019
1. Organization
American Century Variable Portfolios, Inc. (the corporation) is registered under the Investment Company Act of 1940, as amended (the 1940 Act), as an open-end management investment company and is organized as a Maryland corporation. VP Ultra Fund (the fund) is one fund in a series issued by the corporation. The fund’s investment objective is to seek long-term capital growth. The fund offers Class I and Class II.
2. Significant Accounting Policies
The following is a summary of significant accounting policies consistently followed by the fund in preparation of its financial statements. The fund is an investment company and follows accounting and reporting guidance in accordance with accounting principles generally accepted in the United States of America. This may require management to make certain estimates and assumptions at the date of the financial statements. Actual results could differ from these estimates. Management evaluated the impact of events or transactions occurring through the date the financial statements were issued that would merit recognition or disclosure.
Investment Valuations — The fund determines the fair value of its investments and computes its net asset value per share at the close of regular trading (usually 4 p.m. Eastern time) on the New York Stock Exchange (NYSE) on each day the NYSE is open. The Board of Directors has adopted valuation policies and procedures to guide the investment advisor in the fund’s investment valuation process and to provide methodologies for the oversight of the fund’s pricing function.
Equity securities that are listed or traded on a domestic securities exchange are valued at the last reported sales price or at the official closing price as provided by the exchange. Equity securities traded on foreign securities exchanges are generally valued at the closing price of such securities on the exchange where primarily traded or at the close of the NYSE, if that is earlier. If no last sales price is reported, or if local convention or regulation so provides, the mean of the latest bid and asked prices may be used. Securities traded over-the-counter are valued at the mean of the latest bid and asked prices, the last sales price, or the official closing price. Equity securities initially expressed in local currencies are translated into U.S. dollars at the mean of the appropriate currency exchange rate at the close of the NYSE as provided by an independent pricing service.
Open-end management investment companies are valued at the reported net asset value per share. Repurchase agreements are valued at cost, which approximates fair value. Forward foreign currency exchange contracts are valued at the mean of the appropriate forward exchange rate at the close of the NYSE as provided by an independent pricing service.
If the fund determines that the market price for an investment is not readily available or the valuation methods mentioned above do not reflect an investment’s fair value, such investment is valued as determined in good faith by the Board of Directors or its delegate, in accordance with policies and procedures adopted by the Board of Directors. In its determination of fair value, the fund may review several factors including, but not limited to, market information regarding the specific investment or comparable investments and correlation with other investment types, futures indices or general market indicators. Circumstances that may cause the fund to use these procedures to value an investment include, but are not limited to: an investment has been declared in default or is distressed; trading in a security has been suspended during the trading day or a security is not actively trading on its principal exchange; prices received from a regular pricing source are deemed unreliable; or there is a foreign market holiday and no trading occurred.
The fund monitors for significant events occurring after the close of an investment’s primary exchange but before the fund’s net asset value per share is determined. Significant events may include, but are not limited to: corporate announcements and transactions; governmental action and political unrest that could impact a specific investment or an investment sector; or armed conflicts, natural disasters and similar events that could affect investments in a specific country or region. The fund also monitors for significant fluctuations between domestic and foreign markets, as evidenced by the U.S. market or such other indicators that the Board of Directors, or its delegate, deems appropriate. The fund may apply a model-derived factor to the closing price of equity securities traded on foreign securities exchanges. The factor is based on observable market data as provided by an independent pricing service.
Security Transactions — Security transactions are accounted for as of the trade date. Net realized gains and losses are determined on the identified cost basis, which is also used for federal income tax purposes.
Investment Income — Dividend income less foreign taxes withheld, if any, is recorded as of the ex-dividend date. Distributions received on securities that represent a return of capital or long-term capital gain are recorded as a reduction of cost of investments and/or as a realized gain. The fund may estimate the components of distributions received that may be considered nontaxable distributions or long-term capital gain distributions for income tax purposes. Interest income is recorded on the accrual basis and includes accretion of discounts and amortization of premiums.
Foreign Currency Translations — All assets and liabilities initially expressed in foreign currencies are translated into U.S. dollars at prevailing exchange rates at period end. The fund may enter into spot foreign currency exchange contracts to facilitate transactions denominated in a foreign currency. Purchases and sales of investment securities, dividend and interest income, spot foreign currency exchange contracts, and expenses are translated at the rates of exchange prevailing on the respective dates of such transactions. Net realized and unrealized foreign currency exchange gains or losses related to investment securities are a component of net realized gain (loss) on investment transactions and change in net unrealized appreciation (depreciation) on investments, respectively.
Repurchase Agreements — The fund may enter into repurchase agreements with institutions that American Century Investment Management, Inc. (ACIM) (the investment advisor) has determined are creditworthy pursuant to criteria adopted by the Board of Directors. The fund requires that the collateral, represented by securities, received in a repurchase transaction be transferred to the custodian in a manner sufficient to enable the fund to obtain those securities in the event of a default under the repurchase agreement. ACIM monitors, on a daily basis, the securities transferred to ensure the value, including accrued interest, of the securities under each repurchase agreement is equal to or greater than amounts owed to the fund under each repurchase agreement.
Joint Trading Account — Pursuant to an Exemptive Order issued by the Securities and Exchange Commission, the fund, along with certain other funds in the American Century Investments family of funds, may transfer uninvested cash balances into a joint trading account. These balances are invested in one or more repurchase agreements that are collateralized by U.S. Treasury or Agency obligations.
Income Tax Status — It is the fund’s policy to distribute substantially all net investment income and net realized gains to shareholders and to otherwise qualify as a regulated investment company under provisions of the Internal Revenue Code. Accordingly, no provision has been made for income taxes. The fund files U.S. federal, state, local and non-U.S. tax returns as applicable. The fund's tax returns are subject to examination by the relevant taxing authority until expiration of the applicable statute of limitations, which is generally three years from the date of filing but can be longer in certain jurisdictions. At this time, management believes there are no uncertain tax positions which, based on their technical merit, would not be sustained upon examination and for which it is reasonably possible that the total amounts of unrecognized tax benefits will significantly change in the next twelve months.
Multiple Class — All shares of the fund represent an equal pro rata interest in the net assets of the class to which such shares belong, and have identical voting, dividend, liquidation and other rights and the same terms and conditions, except for class specific expenses and exclusive rights to vote on matters affecting only individual classes. Income, non-class specific expenses, and realized and unrealized capital gains and losses of the fund are allocated to each class of shares based on their relative net assets.
Distributions to Shareholders — Distributions from net investment income and net realized gains, if any, are generally declared and paid annually.
Indemnifications — Under the corporation’s organizational documents, its officers and directors are indemnified against certain liabilities arising out of the performance of their duties to the fund. In addition, in the normal course of business, the fund enters into contracts that provide general indemnifications. The maximum exposure under these arrangements is unknown as this would involve future claims that may be made against a fund. The risk of material loss from such claims is considered by management to be remote.
3. Fees and Transactions with Related Parties
Certain officers and directors of the corporation are also officers and/or directors of American Century Companies, Inc. (ACC). The corporation’s investment advisor, ACIM, the corporation's distributor, American Century Investment Services, Inc. (ACIS), and the corporation’s transfer agent, American Century Services, LLC, are wholly owned, directly or indirectly, by ACC.
Management Fees — The corporation has entered into a management agreement with ACIM, under which ACIM provides the fund with investment advisory and management services in exchange for a single, unified management fee (the fee) per class. The agreement provides that all expenses of managing and operating the fund, except distribution fees, brokerage expenses, taxes, interest, fees and expenses of the independent directors (including legal counsel fees), and extraordinary expenses, will be paid by ACIM. The fee is computed and accrued daily based on each class’s daily net assets and paid monthly in arrears. The difference in the fee among the classes is a result of their separate arrangements for non-Rule 12b-1 shareholder services. It is not the result of any difference in advisory or custodial fees or other expenses related to the management of the fund’s assets, which do not vary by class. The rate of the fee is determined by applying a fee rate calculation formula. This formula takes into account the fund’s assets as well as certain assets, if any, of other clients of the investment advisor outside the American Century Investments family of funds (such as subadvised funds and separate accounts) that use very similar investment teams and strategies (strategy assets). From January 1, 2019 through July 31, 2019, the investment advisor agreed to waive 0.17% of the fund's management fee. Effective August 1, 2019, the investment advisor agreed to waive 0.20% of the fund's management fee. The investment advisor expects this waiver to continue until July 31, 2020 and cannot terminate it prior to such date without the approval of the Board of Directors.
The management fee schedule range and the effective annual management fee before and after waiver for each class for the period ended December 31, 2019 are as follows:
|
| | | |
| | | Effective Annual Management Fee |
| | Management Fee Schedule Range | Before Waiver | After Waiver |
| Class I | 0.90% to 1.00% | 1.00% | 0.82% |
| Class II | 0.80% to 0.90% | 0.90% | 0.72% |
Distribution Fees — The Board of Directors has adopted the Master Distribution Plan (the plan) for Class II, pursuant to Rule 12b-1 of the 1940 Act. The plan provides that Class II will pay ACIS an annual distribution fee equal to 0.25%. The fee is computed and accrued daily based on the Class II daily net assets and paid monthly in arrears. The distribution fee provides compensation for expenses incurred in connection with distributing shares of Class II including, but not limited to, payments to brokers, dealers, and financial institutions that have entered into sales agreements with respect to shares of the fund. Fees incurred under the plan during the period ended December 31, 2019 are detailed in the Statement of Operations.
Directors' Fees and Expenses — The Board of Directors is responsible for overseeing the investment advisor’s management and operations of the fund. The directors receive detailed information about the fund and its investment advisor regularly throughout the year, and meet at least quarterly with management of the investment advisor to review reports about fund operations. The fund’s officers do not receive compensation from the fund.
Interfund Transactions — The fund may enter into security transactions with other American Century Investments funds and other client accounts of the investment advisor, in accordance with the 1940 Act rules and procedures adopted by the Board of Directors. The rules and procedures require, among other things, that these transactions be effected at the independent current market price of the security. During the period, the interfund purchases and sales were $496,762 and $333,291, respectively. The effect of interfund transactions on the Statement of Operations was $27,241 in net realized gain (loss) on investment transactions.
4. Investment Transactions
Purchases and sales of investment securities, excluding short-term investments, for the period ended December 31, 2019 were $46,874,170 and $73,846,564, respectively.
5. Capital Share Transactions
Transactions in shares of the fund were as follows:
|
| | | | | | | | | | |
| | Year ended December 31, 2019 | Year ended December 31, 2018 |
| | Shares | Amount | Shares | Amount |
| Class I/Shares Authorized | 100,000,000 |
| | 100,000,000 |
| |
| Sold | 1,078,082 |
| $ | 20,622,955 |
| 1,139,662 |
| $ | 22,572,044 |
|
| Issued in reinvestment of distributions | 302,578 |
| 5,458,501 |
| 277,681 |
| 4,898,293 |
|
| Redeemed | (960,536 | ) | (18,205,590 | ) | (1,305,755 | ) | (24,707,516 | ) |
| | 420,124 |
| 7,875,866 |
| 111,588 |
| 2,762,821 |
|
| Class II/Shares Authorized | 120,000,000 |
| | 120,000,000 |
| |
| Sold | 779,806 |
| 14,501,173 |
| 1,371,192 |
| 26,010,194 |
|
| Issued in reinvestment of distributions | 994,824 |
| 17,568,597 |
| 998,243 |
| 17,309,527 |
|
| Redeemed | (2,508,186 | ) | (46,680,568 | ) | (2,447,644 | ) | (47,218,310 | ) |
| | (733,556 | ) | (14,610,798 | ) | (78,209 | ) | (3,898,589 | ) |
| Net increase (decrease) | (313,432 | ) | $ | (6,734,932 | ) | 33,379 |
| $ | (1,135,768 | ) |
6. Fair Value Measurements
The fund’s investments valuation process is based on several considerations and may use multiple inputs to determine the fair value of the investments held by the fund. In conformity with accounting principles generally accepted in the United States of America, the inputs used to determine a valuation are classified into three broad levels.
| |
| • | Level 1 valuation inputs consist of unadjusted quoted prices in an active market for identical investments. |
| |
| • | Level 2 valuation inputs consist of direct or indirect observable market data (including quoted prices for comparable investments, evaluations of subsequent market events, interest rates, prepayment speeds, credit risk, etc.). These inputs also consist of quoted prices for identical investments initially expressed in local currencies that are adjusted through translation into U.S. dollars. |
| |
| • | Level 3 valuation inputs consist of unobservable data (including a fund’s own assumptions). |
The level classification is based on the lowest level input that is significant to the fair valuation measurement. The valuation inputs are not necessarily an indication of the risks associated with investing in these securities or other financial instruments.
The following is a summary of the level classifications as of period end. The Schedule of Investments provides additional information on the fund’s portfolio holdings.
|
| | | | | | | | |
| | Level 1 | Level 2 | Level 3 |
| Assets | | | |
| Investment Securities |
| Common Stocks | $ | 212,502,134 |
| $ | 3,726,029 |
| — |
|
| Exchange-Traded Funds | 399,338 |
| — |
| — |
|
| Temporary Cash Investments | 498 |
| 917,575 |
| — |
|
| | $ | 212,901,970 |
| $ | 4,643,604 |
| — |
|
| | | | |
| Liabilities | | | |
| Other Financial Instruments |
| Forward Foreign Currency Exchange Contracts | — |
| $ | 4,220 |
| — |
|
7. Derivative Instruments
Foreign Currency Risk — The fund is subject to foreign currency exchange rate risk in the normal course of pursuing its investment objectives. The value of foreign investments held by a fund may be significantly affected by changes in foreign currency exchange rates. The dollar value of a foreign security generally decreases when the value of the dollar rises against the foreign currency in which the security is denominated and tends to increase when the value of the dollar declines against such foreign currency. A fund may enter into forward foreign currency exchange contracts to reduce a fund's exposure to foreign currency exchange rate fluctuations. The net U.S. dollar value of foreign currency underlying all contractual commitments held by a fund and the resulting unrealized appreciation or depreciation are determined daily. Realized gain or loss is recorded upon the termination of the contract. Net realized and unrealized gains or losses occurring during the holding period of forward foreign currency exchange contracts are a component of net realized gain (loss) on forward foreign currency exchange contract transactions and change in net unrealized appreciation (depreciation) on forward foreign currency exchange contracts, respectively. A fund bears the risk of an unfavorable change in the foreign currency exchange rate underlying the forward contract. Additionally, losses, up to the fair value, may arise if the counterparties do not perform under the contract terms. The fund's average U.S. dollar exposure to foreign currency risk derivative instruments held during the period was $853,767.
The value of foreign currency risk derivative instruments as of December 31, 2019, is disclosed on the Statement of Assets and Liabilities as a liability of $4,220 in unrealized depreciation on forward foreign currency exchange contracts. For the year ended December 31, 2019, the effect of foreign currency risk derivative instruments on the Statement of Operations was $2,585 in net realized gain (loss) on forward foreign currency exchange contract transactions and $9,467 in change in net unrealized appreciation (depreciation) on forward foreign currency exchange contracts.
8. Federal Tax Information
The tax character of distributions paid during the years ended December 31, 2019 and December 31, 2018 were as follows:
|
| | | | | | |
| | 2019 | 2018 |
| Distributions Paid From | | |
| Ordinary income | — |
| $ | 1,282,696 |
|
| Long-term capital gains | $ | 23,027,098 |
| $ | 20,925,124 |
|
The book-basis character of distributions made during the year from net investment income or net realized gains may differ from their ultimate characterization for federal income tax purposes. These differences reflect the differing character of certain income items and net realized gains and losses for financial statement and tax purposes, and may result in reclassification among certain capital accounts on the financial statements.
As of period end, the federal tax cost of investments and the components of distributable earnings on a tax-basis were as follows:
|
| | | |
| Federal tax cost of investments | $ | 73,085,799 |
|
| Gross tax appreciation of investments | $ | 145,266,450 |
|
| Gross tax depreciation of investments | (806,675 | ) |
| Net tax appreciation (depreciation) of investments | $ | 144,459,775 |
|
| Undistributed ordinary income | — |
|
Accumulated long-term gains
| $ | 21,573,367 |
|
The difference between book-basis and tax-basis unrealized appreciation (depreciation) is attributable primarily to the tax deferral of losses on wash sales.
|
| | | | | | | | | | | | | | | | | |
| For a Share Outstanding Throughout the Years Ended December 31 (except as noted) | |
| Per-Share Data | | | | | | Ratios and Supplemental Data | |
| | | Income From Investment Operations: | Distributions From: | | | Ratio to Average Net Assets of: | |
| | Net Asset
Value,
Beginning
of Period | Net
Investment
Income
(Loss)(1) | Net
Realized
and
Unrealized
Gain (Loss) | Total From
Investment
Operations | Net
Investment
Income | Net
Realized
Gains | Total
Distributions | Net Asset
Value,
End
of Period | Total
Return(2) | Operating
Expenses | Operating
Expenses
(before
expense
waiver) | Net
Investment
Income
(Loss) | Net
Investment
Income
(Loss)
(before
expense
waiver) | Portfolio
Turnover
Rate | Net
Assets,
End of
Period
(in thousands) |
| Class I | | | | | | | | | | | | | | | |
| 2019 | $17.40 | —(3) | 5.67 | 5.67 | — | (2.14) | (2.14) | $20.93 | 34.58% | 0.82% | 1.00% | (0.01)% | (0.19)% | 23% |
| $59,427 |
|
| 2018 | $19.34 | —(3) | 0.17 | 0.17 | (0.05) | (2.06) | (2.11) | $17.40 | 0.76% | 0.83% | 1.00% | 0.01% | (0.16)% | 29% |
| $42,081 |
|
| 2017 | $15.46 | 0.05 | 4.73 | 4.78 | (0.07) | (0.83) | (0.90) | $19.34 | 32.22% | 0.84% | 1.00% | 0.26% | 0.10% | 22% |
| $44,607 |
|
| 2016 | $15.47 | 0.05 | 0.60 | 0.65 | (0.05) | (0.61) | (0.66) | $15.46 | 4.45% | 0.85% | 1.00% | 0.34% | 0.19% | 30% |
| $38,701 |
|
| 2015 | $16.13 | 0.05 | 0.95 | 1.00 | (0.07) | (1.59) | (1.66) | $15.47 | 6.27% | 0.85% | 1.01% | 0.32% | 0.16% | 35% |
| $41,490 |
|
| Class II | | | | | | | | | | | | | | |
| 2019 | $17.08 | (0.03) | 5.57 | 5.54 | — | (2.14) | (2.14) | $20.48 | 34.46% | 0.97% | 1.15% | (0.16)% | (0.34)% | 23% |
| $156,688 |
|
| 2018 | $19.02 | (0.03) | 0.17 | 0.14 | (0.02) | (2.06) | (2.08) | $17.08 | 0.60% | 0.98% | 1.15% | (0.14)% | (0.31)% | 29% |
| $143,249 |
|
| 2017 | $15.22 | 0.02 | 4.65 | 4.67 | (0.04) | (0.83) | (0.87) | $19.02 | 32.00% | 0.99% | 1.15% | 0.11% | (0.05)% | 22% |
| $160,964 |
|
| 2016 | $15.24 | 0.03 | 0.59 | 0.62 | (0.03) | (0.61) | (0.64) | $15.22 | 4.35% | 1.00% | 1.15% | 0.19% | 0.04% | 30% |
| $138,411 |
|
| 2015 | $15.91 | 0.03 | 0.94 | 0.97 | (0.05) | (1.59) | (1.64) | $15.24 | 6.05% | 1.00% | 1.16% | 0.17% | 0.01% | 35% |
| $150,493 |
|
|
|
| Notes to Financial Highlights |
| |
| (1) | Computed using average shares outstanding throughout the period. |
| |
| (2) | Total returns are calculated based on the net asset value of the last business day. Total returns for periods less than one year are not annualized. The total returns presented do not include the fees and charges assessed with investments in variable insurance products, those charges are disclosed in the separate account prospectus. The inclusion of such fees and charges would lower total return. |
| |
| (3) | Per-share amount was less than $0.005. |
See Notes to Financial Statements.
|
|
| Report of Independent Registered Public Accounting Firm |
To the Shareholders and the Board of Directors of American Century Variable Portfolios, Inc.:
Opinion on the Financial Statements and Financial Highlights
We have audited the accompanying statement of assets and liabilities, including the schedule of investments, of VP Ultra® Fund, one of the funds constituting the American Century Variable Portfolios, Inc. (the "Fund"), as of December 31, 2019, the related statement of operations for the year then ended, the statements of changes in net assets for each of the two years in the period then ended, the financial highlights for each of the five years in the period then ended, and the related notes. In our opinion, the financial statements and financial highlights present fairly, in all material respects, the financial position of VP Ultra® Fund of the American Century Variable Portfolios, Inc. as of December 31, 2019, the results of its operations for the year then ended, the changes in its net assets for each of the two years in the period then ended, and the financial highlights for each of the five years in the period then ended, in conformity with accounting principles generally accepted in the United States of America.
Basis for Opinion
These financial statements and financial highlights are the responsibility of the Fund's management. Our responsibility is to express an opinion on the Fund’s financial statements and financial highlights based on our audits. We are a public accounting firm registered with the Public Company Accounting Oversight Board (United States) (PCAOB) and are required to be independent with respect to the Fund in accordance with the U.S. federal securities laws and the applicable rules and regulations of the Securities and Exchange Commission and the PCAOB.
We conducted our audits in accordance with the standards of the PCAOB. Those standards require that we plan and perform the audit to obtain reasonable assurance about whether the financial statements and financial highlights are free of material misstatement, whether due to error or fraud. The Fund is not required to have, nor were we engaged to perform, an audit of its internal control over financial reporting. As part of our audits we are required to obtain an understanding of internal control over financial reporting but not for the purpose of expressing an opinion on the effectiveness of the Fund’s internal control over financial reporting. Accordingly, we express no such opinion.
Our audits included performing procedures to assess the risks of material misstatement of the financial statements and financial highlights, whether due to error or fraud, and performing procedures that respond to those risks. Such procedures included examining, on a test basis, evidence regarding the amounts and disclosures in the financial statements and financial highlights. Our audits also included evaluating the accounting principles used and significant estimates made by management, as well as evaluating the overall presentation of the financial statements and financial highlights. Our procedures included confirmation of securities owned as of December 31, 2019, by correspondence with the custodian and brokers. We believe that our audits provide a reasonable basis for our opinion.
DELOITTE & TOUCHE LLP
Kansas City, Missouri
February 13, 2020
We have served as the auditor of one or more American Century investment companies since 1997.
The Board of Directors
The individuals listed below serve as directors of the funds. Each director will continue to serve in this capacity until death, retirement, resignation or removal from office. The board has adopted a mandatory retirement age for directors who are not “interested persons,” as that term is defined in the Investment Company Act (independent directors). Independent directors shall retire by December 31 of the year in which they reach their 75th birthday.
Mr. Thomas is an “interested person” because he currently serves as President and Chief Executive Officer of American Century Companies, Inc. (ACC), the parent company of American Century Investment Management, Inc. (ACIM or the advisor). The other directors (more than three-fourths of the total number) are independent. They are not employees, directors or officers of, and have no financial interest in, ACC or any of its wholly owned, direct or indirect, subsidiaries, including ACIM, American Century Investment Services, Inc. (ACIS) and American Century Services, LLC (ACS), and they do not have any other affiliations, positions or relationships that would cause them to be considered “interested persons” under the Investment Company Act. The directors serve in this capacity for seven (in the case of Jonathan S. Thomas, 16; and Stephen E. Yates, 8) registered investment companies in the American Century Investments family of funds.
The following table presents additional information about the directors. The mailing address for each director is 4500 Main Street, Kansas City, Missouri 64111.
|
| | | | | |
Name
(Year of Birth) | Position(s) Held with Funds | Length of Time Served | Principal Occupation(s) During Past 5 Years | Number of American Century Portfolios Overseen by Director | Other Directorships Held During Past 5 Years |
| Independent Directors |
|
|
| Thomas W. Bunn (1953) | Director | Since 2017 | Retired | 64 | SquareTwo Financial; Barings (formerly Babson Capital Funds Trust) (2013 to 2016) |
Chris H. Cheesman
(1962)
| Director | Since 2019
| Retired. Senior Vice President & Chief Audit Executive, AllianceBernstein (1999 to 2018)
| 64 | None |
Barry Fink
(1955) | Director | Since 2012 (independent since 2016) | Retired | 64 | None |
Rajesh K. Gupta
(1960)
| Director | Since 2019
| Partner Emeritus, SeaCrest Investment Management and SeaCrest Wealth Management (2019 to Present); Chief Executive Officer and Chief Investment Officer, SeaCrest Investment Management (2006 to 2019); Chief Executive Officer and Chief Investment Officer, SeaCrest Wealth Management (2008 to 2019)
| 64 | None |
|
| | | | | |
Name
(Year of Birth) | Position(s) Held with Funds | Length of Time Served | Principal Occupation(s) During Past 5 Years | Number of American Century Portfolios Overseen by Director | Other Directorships Held During Past 5 Years |
| Independent Directors |
|
|
Lynn Jenkins
(1963)
| Director | Since 2019
| Consultant, LJ Strategies (2019 to present); United States Representative, U.S. House of Representatives (2009 to 2018) | 64 | MGP Ingredients, Inc. |
Jan M. Lewis
(1957) | Director | Since 2011 | Retired | 64 | None |
John R. Whitten
(1946) | Director | Since 2008 | Retired | 64 | Onto Innovation Inc.; Rudolph Technologies, Inc. (2006 to 2019) |
Stephen E. Yates
(1948) | Director and Chairman of the Board | Since 2012 (Chairman since 2018) | Retired | 79 | None |
| Interested Director |
|
Jonathan S. Thomas
(1963) | Director | Since 2007 | President and Chief Executive Officer, ACC (2007 to present). Also serves as Chief Executive Officer, ACS; Executive Vice President, ACIM; Director, ACC, ACIM and other ACC subsidiaries | 120 | None |
The Statement of Additional Information has additional information about the fund's directors and is available without charge, upon request, by calling 1-800-378-9878.
Officers
The following table presents certain information about the executive officers of the funds. Each officer serves as an officer for 16 (in the case of Robert J. Leach, 15) investment companies in the American Century family of funds. No officer is compensated for his or her service as an officer of the funds. The listed officers are interested persons of the funds and are appointed or re-appointed on an annual basis. The mailing address for each officer listed below is 4500 Main Street, Kansas City, Missouri 64111.
|
| | |
Name
(Year of Birth) | Offices with the Funds | Principal Occupation(s) During the Past Five Years |
Patrick Bannigan
(1965) | President since 2019 | Executive Vice President and Director, ACC (2012 to present); Chief Financial Officer, Chief Accounting Officer and Treasurer, ACC (2015 to present); Chief Operating Officer, ACC (2012-2015). Also serves as President, ACS; Vice President, ACIM; Chief Financial Officer, Chief Accounting Officer and/or Director, ACIM, ACS and other ACC subsidiaries |
R. Wes Campbell
(1974) | Chief Financial Officer and Treasurer since 2018 | Investment Operations and Investment Accounting, ACS (2000 to present) |
Amy D. Shelton
(1964) | Chief Compliance Officer and Vice President since 2014 | Chief Compliance Officer, American Century funds, (2014 to present); Chief Compliance Officer, ACIM (2014 to present); Chief Compliance Officer, ACIS (2009 to present). Also serves as Vice President, ACIS |
Charles A. Etherington
(1957) | General Counsel since 2007 and Senior Vice President since 2006 | Attorney, ACC (1994 to present); Vice President, ACC (2005 to present); General Counsel, ACC (2007 to present). Also serves as General Counsel, ACIM, ACS, ACIS and other ACC subsidiaries; and Senior Vice President, ACIM and ACS |
C. Jean Wade
(1964) | Vice President since 2012 | Senior Vice President, ACS (2017 to present); Vice President, ACS (2000 to 2017)
|
Robert J. Leach
(1966) | Vice President since 2006 | Vice President, ACS (2000 to present) |
David H. Reinmiller
(1963) | Vice President since 2000 | Attorney, ACC (1994 to present). Also serves as Vice President, ACIM and ACS |
Ward D. Stauffer
(1960) | Secretary since 2005 | Attorney, ACC (2003 to present) |
Proxy Voting Policies
A description of the policies that the fund's investment advisor uses in exercising the voting rights associated with the securities purchased and/or held by the fund is available without charge, upon request, by calling 1-800-378-9878. It is also available on American Century Investments’ website at americancentury.com/proxy and on the Securities and Exchange Commission’s website at sec.gov. Information regarding how the investment advisor voted proxies relating to portfolio securities during the most recent 12-month period ended June 30 is available on americancentury.com/proxy. It is also available at sec.gov.
Quarterly Portfolio Disclosure
The fund files its complete schedule of portfolio holdings with the Securities and Exchange Commission (SEC) for the first and third quarters of each fiscal year on Form N-Q or as an exhibit to its reports on Form N-PORT. The fund’s Forms N-Q and Form N-PORT reports are available on the SEC’s website at sec.gov. The fund also makes its complete schedule of portfolio holdings for the most recent quarter of its fiscal year available on its website at ipro.americancentury.com (for Investment Professionals) and, upon request, by calling 1-800-378-9878.
Other Tax Information
The following information is provided pursuant to provisions of the Internal Revenue Code.
The fund hereby designates $23,027,098, or up to the maximum amount allowable, as long-term capital gain distributions (20% rate gain distributions) for the fiscal year ended December 31, 2019.
|
| | |
| |
| | | |
| Contact Us | americancentury.com | |
| Automated Information Line | 1-800-345-8765 | |
| Investment Professional Service Representatives | 1-800-345-6488 | |
| Telecommunications Relay Service for the Deaf | 711 | |
| | | |
| American Century Variable Portfolios, Inc. | |
| | | |
Investment Advisor: American Century Investment Management, Inc. Kansas City, Missouri | |
| | | |
| This report and the statements it contains are submitted for the general information of our shareholders. The report is not authorized for distribution to prospective investors unless preceded or accompanied by an effective prospectus. | |
| | | |
©2020 American Century Proprietary Holdings, Inc. All rights reserved.
CL-ANN-91443 2002 | |
|
| |
| | |
| | Annual Report |
| | |
| | December 31, 2019 |
| | |
| | VP Value Fund |
| | Class I (AVPIX) |
| | Class II (AVPVX) |
Beginning on January 1, 2021, as permitted by regulations adopted by the Securities and Exchange Commission, paper copies of the fund’s shareholder reports like this one will no longer be sent by mail from the insurance company that offers your contract, unless you specifically request paper copies of the reports from the insurance company or from your financial intermediary. Instead, the reports will be made available on a website, and you will be notified by mail each time a report is posted and provided with a website link to access the report.
If you already elected to receive shareholder reports electronically, you will not be affected by this change and you need not take any action. You may elect to receive shareholder reports and other communications from the insurance company or your financial intermediary electronically by contacting the insurance company.
You may elect to receive all future reports in paper free of charge. You can inform the insurance company or your financial intermediary that you wish to continue receiving paper copies of your shareholder reports by contacting the insurance company. Your election to receive reports in paper will apply to all variable portfolios available under your contract.
|
| |
| Performance | |
| Portfolio Commentary | |
| Fund Characteristics | |
| Shareholder Fee Example | |
| Schedule of Investments | |
| Statement of Assets and Liabilities | |
| Statement of Operations | |
| Statement of Changes in Net Assets | |
| Notes to Financial Statements | |
| Financial Highlights | |
| Report of Independent Registered Public Accounting Firm | |
| Management | |
| Additional Information | |
Any opinions expressed in this report reflect those of the author as of the date of the report, and do not necessarily represent the opinions of American Century Investments® or any other person in the American Century Investments organization. Any such opinions are subject to change at any time based upon market or other conditions and American Century Investments disclaims any responsibility to update such opinions. These opinions may not be relied upon as investment advice and, because investment decisions made by American Century Investments funds are based on numerous factors, may not be relied upon as an indication of trading intent on behalf of any American Century Investments fund. Security examples are used for representational purposes only and are not intended as recommendations to purchase or sell securities. Performance information for comparative indices and securities is provided to American Century Investments by third party vendors. To the best of American Century Investments’ knowledge, such information is accurate at the time of printing.
|
| | | | | |
| Total Returns as of December 31, 2019 | | | |
| | | | Average Annual Returns | |
| | Ticker Symbol | 1 year | 5 years | 10 years | Inception Date |
| Class I | AVPIX | 27.03% | 7.76% | 11.00% | 5/1/96 |
| Russell 1000 Value Index | — | 26.54% | 8.28% | 11.79% | — |
| S&P 500 Index | — | 31.49% | 11.69% | 13.55% | — |
| Class II | AVPVX | 26.92% | 7.61% | 10.83% | 8/14/01 |
Fund returns would have been lower if a portion of the fees had not been waived.
The performance information presented does not include the fees and charges assessed with investments in variable insurance products, those charges are disclosed in the separate account prospectus. The inclusion of such fees and charges would lower performance.
Data presented reflect past performance. Past performance is no guarantee of future results. Current performance may be higher or lower than the performance shown. Total returns for periods less than one year are not annualized. Investment return and principal value will fluctuate, and redemption value may be more or less than original cost. Data assumes reinvestment of dividends and capital gains, and none of the charts reflect the deduction of taxes that a shareholder would pay on fund distributions or the redemption of fund shares. To obtain performance data current to the most recent month end, please call 1-800-345-6488 or visit ipro.americancentury.com (for Investment Professionals). For additional information about the fund, please consult the prospectus.
|
|
| Growth of $10,000 Over 10 Years |
| $10,000 investment made December 31, 2009 |
| Performance for other share classes will vary due to differences in fee structure. |
|
| |
| Value on December 31, 2019 |
| | Class I — $28,418 |
| |
| | Russell 1000 Value Index — $30,505 |
| |
| | S&P 500 Index — $35,666 |
| |
Ending value of Class I would have been lower if a portion of the fees had not been waived.
|
| |
| Total Annual Fund Operating Expenses |
| Class I | Class II |
| 0.97% | 1.12% |
The total annual fund operating expenses shown is as stated in the fund’s prospectus current as of the date of this report. The prospectus may vary from the expense ratio shown elsewhere in this report because it is based on a different time period, includes acquired fund fees and expenses, and, if applicable, does not include fee waivers or expense reimbursements.
Data presented reflect past performance. Past performance is no guarantee of future results. Current performance may be higher or lower than the performance shown. Total returns for periods less than one year are not annualized. Investment return and principal value will fluctuate, and redemption value may be more or less than original cost. Data assumes reinvestment of dividends and capital gains, and none of the charts reflect the deduction of taxes that a shareholder would pay on fund distributions or the redemption of fund shares. To obtain performance data current to the most recent month end, please call 1-800-345-6488 or visit ipro.americancentury.com (for Investment Professionals). For additional information about the fund, please consult the prospectus.
Portfolio Managers: Michael Liss, Kevin Toney, Phil Davidson, Brian Woglom and Phil Sundell
In April 2019, Dan Gruemmer left the fund's management team.
Performance Summary
VP Value returned 27.03%* for the 12 months ended December 31, 2019, compared with the 26.54% return of its benchmark, the Russell 1000 Value Index.
Stock selection in the consumer staples sector was a key driver of relative outperformance. Stock decisions in industrials and an overweight allocation to the sector also were positive. On the other hand, consumer discretionary was a key detractor. Stock selection in the sector, especially in the textiles, apparel and luxury goods industry, hampered performance. Stock choices in the utilities sector also detracted.
Consumer Staples and Industrials Contribute
Stock selection in the consumer staples sector was beneficial to relative results, especially among food products companies. Within this industry, Mondelez International, a snack food company, positively impacted performance. The stock outperformed due to strong revenue growth.
In the industrials sector, stock selection and an overweight allocation contributed as well. In particular, the stock of General Electric (GE) reflected improved sentiment on GE’s management credibility and turnaround plan. We remained invested given the higher-quality assets in aviation and health care and our belief that the new chief executive officer can lead a faster-than-expected turnaround.
Elsewhere, the portfolio’s position in Anadarko Petroleum was a key contributor. The stock of this global exploration and production company rose after Chevron agreed to acquire Anadarko at a premium. The stock appreciated further after Occidental Petroleum made two higher offers to acquire Anadarko. We exited Anadarko on strength in the stock price.
Consumer Discretionary and Utilities Detract
Stock selection in the consumer discretionary sector had a negative impact on relative results, especially in the textiles, apparel and luxury goods industry, where Tapestry was a major detractor. Selection in utilities, particularly electric utilities, had a small detrimental effect on relative performance. Elsewhere, weak gas prices hurt the stock of natural gas producer EQT, one of the top individual detractors, while opioid litigation fears and worries about a potential drug price-fixing scandal weighed on the stock of Teva Pharmaceutical Industries. Teva settled an opioid case, agreeing to pay the state of Oklahoma $85 million.
During the period, the portfolio owned forward foreign currency exchange contracts to offset the inherent currency risks of holding foreign securities. Exposure to these instruments did not have a material effect on performance.
*All fund returns referenced in this commentary are for Class I shares. Fund returns would have been lower if a portion of the fees had not been waived. Performance for other share classes will vary due to differences in fee structure; when Class I performance exceeds that of the fund’s benchmark, other share classes may not. See page 2 for returns for all share classes.
Portfolio Positioning
Energy is a top relative overweight sector in the portfolio. Our metrics show that our energy holdings offer some of the most compelling valuations across sectors. The portfolio is also overweight in the health care sector. Our bottom-up research has led us to health care stocks with attractive risk/reward profiles, particularly in the pharmaceuticals and health care equipment and supplies industries. We continue to hold a considerable overweight in the financials sector, especially in the banking industry. According to our analysis, our bank holdings remain attractive as valuations have been pressured by low interest rates and a relatively flat interest rate curve. The portfolio is underweight in utilities and real estate. Despite the underperformance of these sectors during the fourth quarter, we believe many utilities and real estate stocks remain richly valued. We own only one holding in each of these sectors: Edison International, an electric utility, and Weyerhaeuser, a timber real estate investment trust.
|
| |
| DECEMBER 31, 2019 |
| Top Ten Holdings | % of net assets |
| JPMorgan Chase & Co. | 3.5% |
| Johnson & Johnson | 3.1% |
| Pfizer, Inc. | 3.0% |
| AT&T, Inc. | 2.9% |
| U.S. Bancorp | 2.8% |
| Berkshire Hathaway, Inc.* | 2.8% |
| Wells Fargo & Co. | 2.7% |
| Verizon Communications, Inc. | 2.6% |
| General Electric Co. | 2.5% |
| Bank of America Corp. | 2.4% |
| *Includes all classes of the issuer held by the fund. |
| | |
| Top Five Industries | % of net assets |
| Banks | 15.7% |
| Oil, Gas and Consumable Fuels | 9.3% |
| Pharmaceuticals | 8.5% |
| Diversified Telecommunication Services | 5.5% |
| Capital Markets | 5.2% |
| | |
| Types of Investments in Portfolio | % of net assets |
| Domestic Common Stocks | 88.4% |
| Foreign Common Stocks* | 8.2% |
| Exchange-Traded Funds | 0.4% |
| Total Equity Exposure | 97.0% |
| Temporary Cash Investments | 2.9% |
| Temporary Cash Investments - Securities Lending Collateral | 0.1% |
| Other Assets and Liabilities | —** |
*Includes depositary shares, dual listed securities and foreign ordinary shares.
**Category is less than 0.05% of total net assets.
Fund shareholders may incur two types of costs: (1) transaction costs, including sales charges (loads) on purchase payments and redemption/exchange fees; and (2) ongoing costs, including management fees; distribution and service (12b-1) fees; and other fund expenses. This example is intended to help you understand your ongoing costs (in dollars) of investing in your fund and to compare these costs with the ongoing cost of investing in other mutual funds.
The example is based on an investment of $1,000 made at the beginning of the period and held for the entire period from July 1, 2019 to December 31, 2019.
Actual Expenses
The table provides information about actual account values and actual expenses for each class. You may use the information, together with the amount you invested, to estimate the expenses that you paid over the period. First, identify the share class you own. Then simply divide your account value by $1,000 (for example, an $8,600 account value divided by $1,000 = 8.6), then multiply the result by the number under the heading “Expenses Paid During Period” to estimate the expenses you paid on your account during this period.
Hypothetical Example for Comparison Purposes
The table also provides information about hypothetical account values and hypothetical expenses based on the actual expense ratio of each class of your fund and an assumed rate of return of 5% per year before expenses, which is not the actual return of a fund’s share class. The hypothetical account values and expenses may not be used to estimate the actual ending account balance or expenses you paid for the period. You may use this information to compare the ongoing costs of investing in your fund and other funds. To do so, compare this 5% hypothetical example with the 5% hypothetical examples that appear in the shareholder reports of the other funds.
Please note that the expenses shown in the table are meant to highlight your ongoing costs only and do not reflect any transactional costs, such as sales charges (loads) or redemption/exchange fees. Therefore, the table is useful in comparing ongoing costs only, and will not help you determine the relative total costs of owning different funds. In addition, if these transactional costs were included, your costs would have been higher.
|
| | | | |
| | Beginning
Account Value
7/1/19 | Ending
Account Value
12/31/19 | Expenses Paid
During Period(1)
7/1/19 - 12/31/19 |
Annualized
Expense Ratio(1) |
| Actual | | | | |
| Class I | $1,000 | $1,104.30 | $4.03 | 0.76% |
| Class II | $1,000 | $1,104.20 | $4.83 | 0.91% |
| Hypothetical | | | | |
| Class I | $1,000 | $1,021.37 | $3.87 | 0.76% |
| Class II | $1,000 | $1,020.62 | $4.63 | 0.91% |
| |
| (1) | Expenses are equal to the class's annualized expense ratio listed in the table above, multiplied by the average account value over the period, multiplied by 184, the number of days in the most recent fiscal half-year, divided by 365, to reflect the one-half year period. Annualized expense ratio reflects actual expenses, including any applicable fee waivers or expense reimbursements and excluding any acquired fund fees and expenses. |
DECEMBER 31, 2019
|
| | | | |
| | Shares | Value |
| COMMON STOCKS — 96.6% | | |
| Airlines — 0.6% | | |
| Southwest Airlines Co. | 99,180 | $ | 5,353,736 |
|
| Auto Components — 1.0% | | |
| BorgWarner, Inc. | 108,190 | 4,693,282 |
|
Delphi Technologies plc(1) | 292,445 | 3,752,070 |
|
| | | 8,445,352 |
|
| Automobiles — 1.3% | | |
| General Motors Co. | 198,894 | 7,279,520 |
|
| Honda Motor Co. Ltd. | 155,100 | 4,374,935 |
|
| | | 11,654,455 |
|
| Banks — 15.7% | | |
| Bank of America Corp. | 608,440 | 21,429,257 |
|
| BOK Financial Corp. | 23,350 | 2,040,790 |
|
| Comerica, Inc. | 73,052 | 5,241,481 |
|
| JPMorgan Chase & Co. | 224,529 | 31,299,342 |
|
| M&T Bank Corp. | 28,524 | 4,841,949 |
|
| PNC Financial Services Group, Inc. (The) | 71,832 | 11,466,542 |
|
| Truist Financial Corp. | 181,310 | 10,211,379 |
|
| U.S. Bancorp | 422,082 | 25,025,242 |
|
| UMB Financial Corp. | 64,817 | 4,449,039 |
|
| Wells Fargo & Co. | 443,272 | 23,848,034 |
|
| | | 139,853,055 |
|
| Biotechnology — 0.9% | | |
| Gilead Sciences, Inc. | 116,620 | 7,577,968 |
|
| Building Products — 0.4% | | |
| Johnson Controls International plc | 91,721 | 3,733,962 |
|
| Capital Markets — 5.2% | | |
| Ameriprise Financial, Inc. | 33,423 | 5,567,603 |
|
| Bank of New York Mellon Corp. (The) | 169,420 | 8,526,909 |
|
| BlackRock, Inc. | 17,060 | 8,576,062 |
|
| Franklin Resources, Inc. | 137,723 | 3,578,043 |
|
| Invesco Ltd. | 366,986 | 6,598,408 |
|
| Northern Trust Corp. | 65,307 | 6,938,216 |
|
| State Street Corp. | 81,760 | 6,467,216 |
|
| | | 46,252,457 |
|
| Communications Equipment — 1.2% | | |
| Cisco Systems, Inc. | 215,953 | 10,357,106 |
|
| Containers and Packaging — 0.7% | | |
| Sonoco Products Co. | 38,971 | 2,405,290 |
|
| WestRock Co. | 86,720 | 3,721,155 |
|
| | | 6,126,445 |
|
|
| | | | |
| | Shares | Value |
| Diversified Financial Services — 2.8% | | |
Berkshire Hathaway, Inc., Class A(1) | 50 | $ | 16,979,500 |
|
Berkshire Hathaway, Inc., Class B(1) | 33,334 | 7,550,151 |
|
| | | 24,529,651 |
|
| Diversified Telecommunication Services — 5.5% | | |
| AT&T, Inc. | 659,124 | 25,758,566 |
|
| Verizon Communications, Inc. | 370,060 | 22,721,684 |
|
| | | 48,480,250 |
|
| Electric Utilities — 0.2% | | |
| Edison International | 22,387 | 1,688,204 |
|
| Electrical Equipment — 2.9% | | |
| Emerson Electric Co. | 114,599 | 8,739,320 |
|
| Hubbell, Inc. | 59,802 | 8,839,931 |
|
| nVent Electric plc | 335,708 | 8,587,411 |
|
| | | 26,166,662 |
|
| Electronic Equipment, Instruments and Components — 1.0% | | |
| TE Connectivity Ltd. | 96,300 | 9,229,392 |
|
| Energy Equipment and Services — 4.1% | | |
| Baker Hughes Co. | 364,186 | 9,334,087 |
|
| Halliburton Co. | 324,410 | 7,938,313 |
|
| National Oilwell Varco, Inc. | 165,892 | 4,155,595 |
|
| Schlumberger Ltd. | 381,230 | 15,325,446 |
|
| | | 36,753,441 |
|
| Equity Real Estate Investment Trusts (REITs) — 0.7% | | |
| Weyerhaeuser Co. | 217,850 | 6,579,070 |
|
| Food and Staples Retailing — 2.1% | | |
| Koninklijke Ahold Delhaize NV | 218,260 | 5,470,003 |
|
| Walmart, Inc. | 107,988 | 12,833,294 |
|
| | | 18,303,297 |
|
| Food Products — 3.4% | | |
| Conagra Brands, Inc. | 115,320 | 3,948,557 |
|
| Kellogg Co. | 116,127 | 8,031,343 |
|
| Mondelez International, Inc., Class A | 212,726 | 11,716,948 |
|
| Orkla ASA | 668,220 | 6,772,358 |
|
| | | 30,469,206 |
|
| Health Care Equipment and Supplies — 3.9% | | |
| Medtronic plc | 146,347 | 16,603,067 |
|
| Siemens Healthineers AG | 129,862 | 6,235,861 |
|
| Zimmer Biomet Holdings, Inc. | 80,463 | 12,043,702 |
|
| | | 34,882,630 |
|
| Health Care Providers and Services — 3.1% | | |
| Cardinal Health, Inc. | 246,030 | 12,444,198 |
|
| Cigna Corp. | 20,510 | 4,194,090 |
|
| McKesson Corp. | 81,010 | 11,205,303 |
|
| | | 27,843,591 |
|
| Hotels, Restaurants and Leisure — 0.6% | | |
| Carnival Corp. | 105,554 | 5,365,310 |
|
|
| | | | |
| | Shares | Value |
| Household Products — 2.3% | | |
| Procter & Gamble Co. (The) | 160,266 | $ | 20,017,223 |
|
| Industrial Conglomerates — 3.4% | | |
| General Electric Co. | 2,010,504 | 22,437,225 |
|
| Siemens AG | 58,530 | 7,651,036 |
|
| | | 30,088,261 |
|
| Insurance — 3.1% | | |
| Chubb Ltd. | 82,749 | 12,880,709 |
|
| MetLife, Inc. | 117,679 | 5,998,099 |
|
| Reinsurance Group of America, Inc. | 40,266 | 6,565,774 |
|
| Unum Group | 56,820 | 1,656,871 |
|
| | | 27,101,453 |
|
| Leisure Products — 0.4% | | |
Mattel, Inc.(1)(2) | 287,759 | 3,899,134 |
|
| Machinery — 1.4% | | |
| Cummins, Inc. | 19,330 | 3,459,297 |
|
| IMI plc | 601,450 | 9,411,555 |
|
| | | 12,870,852 |
|
| Metals and Mining — 0.5% | | |
| BHP Group Ltd. | 161,360 | 4,419,717 |
|
| Multiline Retail — 0.5% | | |
| Target Corp. | 37,387 | 4,793,387 |
|
| Oil, Gas and Consumable Fuels — 9.3% | | |
| Apache Corp. | 87,378 | 2,236,003 |
|
| Chevron Corp. | 162,720 | 19,609,387 |
|
| Cimarex Energy Co. | 127,421 | 6,688,328 |
|
| ConocoPhillips | 129,724 | 8,435,952 |
|
| Devon Energy Corp. | 371,427 | 9,645,959 |
|
| EQT Corp. | 451,551 | 4,921,906 |
|
| Noble Energy, Inc. | 481,525 | 11,961,081 |
|
| Royal Dutch Shell plc, B Shares | 275,260 | 8,202,081 |
|
| TOTAL SA | 190,159 | 10,508,615 |
|
| | | 82,209,312 |
|
| Paper and Forest Products — 0.5% | | |
| Mondi plc | 185,590 | 4,381,141 |
|
| Pharmaceuticals — 8.5% | | |
| Allergan plc | 44,470 | 8,501,330 |
|
| Johnson & Johnson | 185,742 | 27,094,186 |
|
| Merck & Co., Inc. | 89,802 | 8,167,492 |
|
| Pfizer, Inc. | 677,919 | 26,560,866 |
|
Teva Pharmaceutical Industries Ltd. ADR(1) | 512,086 | 5,018,443 |
|
| | | 75,342,317 |
|
| Road and Rail — 1.1% | | |
| Heartland Express, Inc. | 466,969 | 9,829,697 |
|
| Semiconductors and Semiconductor Equipment — 3.1% | | |
| Applied Materials, Inc. | 50,634 | 3,090,699 |
|
| Intel Corp. | 299,837 | 17,945,245 |
|
|
| | | | |
| | Shares | Value |
| QUALCOMM, Inc. | 69,890 | $ | 6,166,395 |
|
| | | 27,202,339 |
|
| Software — 1.1% | | |
| Oracle Corp. (New York) | 178,243 | 9,443,314 |
|
| Specialty Retail — 1.0% | | |
| Advance Auto Parts, Inc. | 55,991 | 8,967,519 |
|
| Technology Hardware, Storage and Peripherals — 0.5% | | |
| HP, Inc. | 237,557 | 4,881,796 |
|
| Textiles, Apparel and Luxury Goods — 1.4% | | |
| Ralph Lauren Corp. | 39,710 | 4,654,806 |
|
| Tapestry, Inc. | 282,164 | 7,609,963 |
|
| | | 12,264,769 |
|
| Trading Companies and Distributors — 1.2% | | |
| MSC Industrial Direct Co., Inc., Class A | 137,762 | 10,810,184 |
|
TOTAL COMMON STOCKS
(Cost $646,328,134) | | 858,167,655 |
|
| EXCHANGE-TRADED FUNDS — 0.4% | | |
iShares Russell 1000 Value ETF
(Cost $3,099,344) | 22,720 | 3,100,826 |
|
| TEMPORARY CASH INVESTMENTS — 2.9% | | |
| Repurchase Agreement, BMO Capital Markets Corp., (collateralized by various U.S. Treasury obligations, 2.75% - 3.75%, 9/15/21 - 11/15/43, valued at $21,171,308), in a joint trading account at 1.35%, dated 12/31/19, due 1/2/20 (Delivery value $20,726,374) | | 20,724,820 |
|
| Repurchase Agreement, Fixed Income Clearing Corp., (collateralized by various U.S. Treasury obligations, 1.625%, 12/15/22, valued at $4,706,961), at 0.65%, dated 12/31/19, due 1/2/20 (Delivery value $4,612,167) | | 4,612,000 |
|
| State Street Institutional U.S. Government Money Market Fund, Premier Class | 12,951 | 12,951 |
|
TOTAL TEMPORARY CASH INVESTMENTS
(Cost $25,349,771) | | 25,349,771 |
|
TEMPORARY CASH INVESTMENTS - SECURITIES LENDING COLLATERAL(3) — 0.1% |
State Street Navigator Securities Lending Government Money Market Portfolio
(Cost $1,253,196) | 1,253,196 | 1,253,196 |
|
TOTAL INVESTMENT SECURITIES — 100.0%
(Cost $676,030,445) | | 887,871,448 |
|
OTHER ASSETS AND LIABILITIES† | | 94,370 |
|
| TOTAL NET ASSETS — 100.0% | | $ | 887,965,818 |
|
|
| | | | | | | | |
| FORWARD FOREIGN CURRENCY EXCHANGE CONTRACTS |
| Currency Purchased | Currency Sold | Counterparty | Settlement Date | Unrealized Appreciation
(Depreciation) |
| USD | 3,270,055 | AUD | 4,762,137 | Bank of America N.A. | 3/31/20 | $ | (79,049 | ) |
| USD | 22,059,632 | EUR | 19,649,783 | Credit Suisse AG | 3/31/20 | (103,274 | ) |
| USD | 15,982,071 | GBP | 12,132,731 | JPMorgan Chase Bank N.A. | 3/31/20 | (127,688 | ) |
| USD | 500,014 | GBP | 384,871 | JPMorgan Chase Bank N.A. | 3/31/20 | (11,015 | ) |
| JPY | 10,818,225 | USD | 99,348 | Bank of America N.A. | 3/31/20 | 690 |
|
| USD | 3,444,159 | JPY | 374,682,825 | Bank of America N.A. | 3/31/20 | (20,597 | ) |
| USD | 4,896,520 | NOK | 44,142,613 | Goldman Sachs & Co. | 3/31/20 | (132,717 | ) |
| | | | | | | $ | (473,650 | ) |
|
| | |
| NOTES TO SCHEDULE OF INVESTMENTS |
| ADR | - | American Depositary Receipt |
| AUD | - | Australian Dollar |
| EUR | - | Euro |
| GBP | - | British Pound |
| JPY | - | Japanese Yen |
| NOK | - | Norwegian Krone |
| USD | - | United States Dollar |
| |
| † | Category is less than 0.05% of total net assets. |
| |
| (2) | Security, or a portion thereof, is on loan. At the period end, the aggregate value of securities on loan was $3,899,134. The amount of securities on loan indicated may not correspond with the securities on loan identified because securities with pending sales are in the process of recall from the brokers. |
| |
| (3) | Investment of cash collateral from securities on loan. At the period end, the aggregate market value of the collateral held by the fund was $4,044,046, which includes securities collateral of $2,790,850. |
See Notes to Financial Statements.
|
|
| Statement of Assets and Liabilities |
|
| | | |
| DECEMBER 31, 2019 | |
| Assets |
| Investment securities, at value (cost of $674,777,249) — including $3,899,134 of securities on loan | $ | 886,618,252 |
|
Investment made with cash collateral received for securities on loan, at value
(cost of $1,253,196) | 1,253,196 |
|
| Total investment securities, at value (cost of $676,030,445) | 887,871,448 |
|
| Foreign currency holdings, at value (cost of $178) | 180 |
|
| Receivable for investments sold | 2,234,085 |
|
| Receivable for capital shares sold | 333,618 |
|
| Unrealized appreciation on forward foreign currency exchange contracts | 690 |
|
| Dividends and interest receivable | 1,367,980 |
|
| Securities lending receivable | 749 |
|
| | 891,808,750 |
|
| | |
| Liabilities | |
| Payable for collateral received for securities on loan | 1,253,196 |
|
| Payable for investments purchased | 969,628 |
|
| Payable for capital shares redeemed | 525,436 |
|
| Unrealized depreciation on forward foreign currency exchange contracts | 474,340 |
|
| Accrued management fees | 524,677 |
|
| Distribution fees payable | 95,655 |
|
| | 3,842,932 |
|
| | |
| Net Assets | $ | 887,965,818 |
|
| | |
| Net Assets Consist of: | |
| Capital (par value and paid-in surplus) | $ | 712,355,289 |
|
| Distributable earnings | 175,610,529 |
|
| | $ | 887,965,818 |
|
|
| | | | | | |
| | Net Assets | Shares Outstanding | Net Asset Value Per Share |
| Class I, $0.01 Par Value |
| $432,638,545 |
| 36,904,472 |
| $11.72 |
| Class II, $0.01 Par Value |
| $455,327,273 |
| 38,796,086 |
| $11.74 |
See Notes to Financial Statements.
|
| | | |
| YEAR ENDED DECEMBER 31, 2019 |
| Investment Income (Loss) |
| Income: | |
| Dividends (net of foreign taxes withheld of $208,665) | $ | 23,911,507 |
|
| Interest | 433,643 |
|
| Securities lending, net | 5,341 |
|
| | 24,350,491 |
|
| | |
| Expenses: | |
| Management fees | 7,796,892 |
|
| Distribution fees - Class II | 1,102,088 |
|
| Directors' fees and expenses | 26,629 |
|
| Other expenses | 9,466 |
|
| | 8,935,075 |
|
Fees waived(1) | (1,763,916 | ) |
| | 7,171,159 |
|
| | |
| Net investment income (loss) | 17,179,332 |
|
| | |
| Realized and Unrealized Gain (Loss) | |
| Net realized gain (loss) on: | |
| Investment transactions | (12,487,426 | ) |
| Forward foreign currency exchange contract transactions | 1,314,123 |
|
| Foreign currency translation transactions | 9,218 |
|
| | (11,164,085 | ) |
| | |
| Change in net unrealized appreciation (depreciation) on: | |
| Investments | 195,154,464 |
|
| Forward foreign currency exchange contracts | (218,343 | ) |
| Translation of assets and liabilities in foreign currencies | (305 | ) |
| | 194,935,816 |
|
| | |
| Net realized and unrealized gain (loss) | 183,771,731 |
|
| �� | |
| Net Increase (Decrease) in Net Assets Resulting from Operations | $ | 200,951,063 |
|
| |
| (1) | Amount consists of $845,350 and $918,566 for Class I and Class II, respectively. |
See Notes to Financial Statements.
|
|
| Statement of Changes in Net Assets |
|
| | | | | | |
| YEARS ENDED DECEMBER 31, 2019 AND DECEMBER 31, 2018 |
| Increase (Decrease) in Net Assets | December 31, 2019 | December 31, 2018 |
| Operations | | |
| Net investment income (loss) | $ | 17,179,332 |
| $ | 14,630,610 |
|
| Net realized gain (loss) | (11,164,085 | ) | 33,067,757 |
|
| Change in net unrealized appreciation (depreciation) | 194,935,816 |
| (124,776,338 | ) |
| Net increase (decrease) in net assets resulting from operations | 200,951,063 |
| (77,077,971 | ) |
| | | |
| Distributions to Shareholders | | |
| From earnings: | | |
| Class I | (32,302,930 | ) | (7,272,710 | ) |
| Class II | (34,385,367 | ) | (6,903,898 | ) |
| Decrease in net assets from distributions | (66,688,297 | ) | (14,176,608 | ) |
| | | |
| Capital Share Transactions | | |
| Net increase (decrease) in net assets from capital share transactions (Note 5) | (25,024,577 | ) | (77,965,717 | ) |
| | | |
| Net increase (decrease) in net assets | 109,238,189 |
| (169,220,296 | ) |
| | | |
| Net Assets | | |
| Beginning of period | 778,727,629 |
| 947,947,925 |
|
| End of period | $ | 887,965,818 |
| $ | 778,727,629 |
|
See Notes to Financial Statements.
|
|
| Notes to Financial Statements |
DECEMBER 31, 2019
1. Organization
American Century Variable Portfolios, Inc. (the corporation) is registered under the Investment Company Act of 1940, as amended (the 1940 Act), as an open-end management investment company and is organized as a Maryland corporation. VP Value Fund (the fund) is one fund in a series issued by the corporation. The fund's investment objective is to seek long-term capital growth. Income is a secondary objective. The fund offers Class I and Class II.
2. Significant Accounting Policies
The following is a summary of significant accounting policies consistently followed by the fund in preparation of its financial statements. The fund is an investment company and follows accounting and reporting guidance in accordance with accounting principles generally accepted in the United States of America. This may require management to make certain estimates and assumptions at the date of the financial statements. Actual results could differ from these estimates. Management evaluated the impact of events or transactions occurring through the date the financial statements were issued that would merit recognition or disclosure.
Investment Valuations — The fund determines the fair value of its investments and computes its net asset value per share at the close of regular trading (usually 4 p.m. Eastern time) on the New York Stock Exchange (NYSE) on each day the NYSE is open. The Board of Directors has adopted valuation policies and procedures to guide the investment advisor in the fund’s investment valuation process and to provide methodologies for the oversight of the fund’s pricing function.
Equity securities that are listed or traded on a domestic securities exchange are valued at the last reported sales price or at the official closing price as provided by the exchange. Equity securities traded on foreign securities exchanges are generally valued at the closing price of such securities on the exchange where primarily traded or at the close of the NYSE, if that is earlier. If no last sales price is reported, or if local convention or regulation so provides, the mean of the latest bid and asked prices may be used. Securities traded over-the-counter are valued at the mean of the latest bid and asked prices, the last sales price, or the official closing price. Equity securities initially expressed in local currencies are translated into U.S. dollars at the mean of the appropriate currency exchange rate at the close of the NYSE as provided by an independent pricing service.
Open-end management investment companies are valued at the reported net asset value per share. Repurchase agreements are valued at cost, which approximates fair value. Forward foreign currency exchange contracts are valued at the mean of the appropriate forward exchange rate at the close of the NYSE as provided by an independent pricing service.
If the fund determines that the market price for an investment is not readily available or the valuation methods mentioned above do not reflect an investment’s fair value, such investment is valued as determined in good faith by the Board of Directors or its delegate, in accordance with policies and procedures adopted by the Board of Directors. In its determination of fair value, the fund may review several factors including, but not limited to, market information regarding the specific investment or comparable investments and correlation with other investment types, futures indices or general market indicators. Circumstances that may cause the fund to use these procedures to value an investment include, but are not limited to: an investment has been declared in default or is distressed; trading in a security has been suspended during the trading day or a security is not actively trading on its principal exchange; prices received from a regular pricing source are deemed unreliable; or there is a foreign market holiday and no trading occurred.
The fund monitors for significant events occurring after the close of an investment’s primary exchange but before the fund’s net asset value per share is determined. Significant events may include, but are not limited to: corporate announcements and transactions; governmental action and political unrest that could impact a specific investment or an investment sector; or armed conflicts, natural disasters and similar events that could affect investments in a specific country or region. The fund also monitors for significant fluctuations between domestic and foreign markets, as evidenced by the U.S. market or such other indicators that the Board of Directors, or its delegate, deems appropriate. The fund may apply a model-derived factor to the closing price of equity securities traded on foreign securities exchanges. The factor is based on observable market data as provided by an independent pricing service.
Security Transactions — Security transactions are accounted for as of the trade date. Net realized gains and losses are determined on the identified cost basis, which is also used for federal income tax purposes.
Investment Income — Dividend income less foreign taxes withheld, if any, is recorded as of the ex-dividend date. Distributions received on securities that represent a return of capital or long-term capital gain are recorded as a reduction of cost of investments and/or as a realized gain. The fund may estimate the components of distributions received that may be considered nontaxable distributions or long-term capital gain distributions for income tax purposes. Interest income is recorded on the accrual basis and includes accretion of discounts and amortization of premiums. Securities lending income is net of fees and rebates earned by the lending agent for its services.
Foreign Currency Translations — All assets and liabilities initially expressed in foreign currencies are translated into U.S. dollars at prevailing exchange rates at period end. The fund may enter into spot foreign currency exchange contracts to facilitate transactions denominated in a foreign currency. Purchases and sales of investment securities, dividend and interest income, spot foreign currency exchange contracts, and expenses are translated at the rates of exchange prevailing on the respective dates of such transactions. Net realized and unrealized foreign currency exchange gains or losses related to investment securities are a component of net realized gain (loss) on investment transactions and change in net unrealized appreciation (depreciation) on investments, respectively.
Repurchase Agreements — The fund may enter into repurchase agreements with institutions that American Century Investment Management, Inc. (ACIM) (the investment advisor) has determined are creditworthy pursuant to criteria adopted by the Board of Directors. The fund requires that the collateral, represented by securities, received in a repurchase transaction be transferred to the custodian in a manner sufficient to enable the fund to obtain those securities in the event of a default under the repurchase agreement. ACIM monitors, on a daily basis, the securities transferred to ensure the value, including accrued interest, of the securities under each repurchase agreement is equal to or greater than amounts owed to the fund under each repurchase agreement.
Joint Trading Account — Pursuant to an Exemptive Order issued by the Securities and Exchange Commission, the fund, along with certain other funds in the American Century Investments family of funds, may transfer uninvested cash balances into a joint trading account. These balances are invested in one or more repurchase agreements that are collateralized by U.S. Treasury or Agency obligations.
Segregated Assets — In accordance with the 1940 Act, the fund segregates assets on its books and records to cover certain types of investment securities and other financial instruments. ACIM monitors, on a daily basis, the securities segregated to ensure the fund designates a sufficient amount of liquid assets, marked-to-market daily. The fund may also receive assets or be required to pledge assets at the custodian bank or with a broker for collateral requirements.
Income Tax Status — It is the fund’s policy to distribute substantially all net investment income and net realized gains to shareholders and to otherwise qualify as a regulated investment company under provisions of the Internal Revenue Code. Accordingly, no provision has been made for income taxes. The fund files U.S. federal, state, local and non-U.S. tax returns as applicable. The fund's tax returns are subject to examination by the relevant taxing authority until expiration of the applicable statute of limitations, which is generally three years from the date of filing but can be longer in certain jurisdictions. At this time, management believes there are no uncertain tax positions which, based on their technical merit, would not be sustained upon examination and for which it is reasonably possible that the total amounts of unrecognized tax benefits will significantly change in the next twelve months.
Multiple Class — All shares of the fund represent an equal pro rata interest in the net assets of the class to which such shares belong, and have identical voting, dividend, liquidation and other rights and the same terms and conditions, except for class specific expenses and exclusive rights to vote on matters affecting only individual classes. Income, non-class specific expenses, and realized and unrealized capital gains and losses of the fund are allocated to each class of shares based on their relative net assets.
Distributions to Shareholders — Distributions from net investment income, if any, are generally declared and paid quarterly. Distributions from net realized gains, if any, are generally declared and paid annually.
Indemnifications — Under the corporation’s organizational documents, its officers and directors are indemnified against certain liabilities arising out of the performance of their duties to the fund. In addition, in the normal course of business, the fund enters into contracts that provide general indemnifications. The maximum exposure under these arrangements is unknown as this would involve future claims that may be made against a fund. The risk of material loss from such claims is considered by management to be remote.
Securities Lending — Securities are lent to qualified financial institutions and brokers. State Street Bank & Trust Co. serves as securities lending agent to the fund pursuant to a Securities Lending Agreement. The lending of securities exposes the fund to risks such as: the borrowers may fail to return the loaned securities, the borrowers may not be able to provide additional collateral, the fund may experience delays in recovery of the loaned securities or delays in access to collateral, or the fund may experience losses related to the investment collateral. To minimize certain risks, loan counterparties pledge collateral in the form of cash and/or securities. The lending agent has agreed to indemnify the fund in the case of default of any securities borrowed. Cash collateral received is invested in the State Street Navigator Securities Lending Government Money Market Portfolio, a money market mutual fund registered under the 1940 Act. The loans may also be secured by U.S. government securities in an amount at least equal to the market value of the securities loaned, plus accrued interest and dividends, determined on a daily basis and adjusted accordingly. By lending securities, the fund seeks to increase its net investment income through the receipt of interest and fees. Such income is reflected separately within the Statement of Operations. The value of loaned securities and related collateral outstanding at period end, if any, are shown on a gross basis within the Schedule of Investments and Statement of Assets and Liabilities.
The following table reflects a breakdown of transactions accounted for as secured borrowings, the gross obligation by the type of collateral pledged, and the remaining contractual maturity of those transactions as of December 31, 2019.
|
| | | | | | | | | | | | |
| Remaining Contractual Maturity of Agreements |
| | Overnight and
Continuous | <30 days | Between
30 & 90 days | >90 days | Total |
Securities Lending Transactions(1) |
| Common Stocks | $ | 1,253,196 |
| — |
| — |
| — |
| $ | 1,253,196 |
|
| Gross amount of recognized liabilities for securities lending transactions | $ | 1,253,196 |
|
| |
| (1) | Amount represents the payable for cash collateral received for securities on loan. This will generally be in the Overnight and Continuous column as the securities are typically callable on demand. |
3. Fees and Transactions with Related Parties
Certain officers and directors of the corporation are also officers and/or directors of American Century Companies, Inc. (ACC). The corporation’s investment advisor, ACIM, the corporation's distributor, American Century Investment Services, Inc. (ACIS), and the corporation’s transfer agent, American Century Services, LLC, are wholly owned, directly or indirectly, by ACC.
Management Fees — The corporation has entered into a management agreement with ACIM, under which ACIM provides the fund with investment advisory and management services in exchange for a single, unified management fee (the fee) per class. The agreement provides that all expenses of managing and operating the fund, except distribution fees, brokerage expenses, taxes, interest, fees and expenses of the independent directors (including legal counsel fees), and extraordinary expenses, will be paid by ACIM. The fee is computed and accrued daily based on each class's daily net assets and paid monthly in arrears. The difference in the fee among the classes is a result of their separate arrangements for non-Rule 12b-1 shareholder services. It is not the result of any difference in advisory or custodial fees or other expenses related to the management of the fund’s assets, which do not vary by class. The rate of the fee is determined by applying a fee rate calculation formula. This formula takes into account the fund’s assets as well as certain assets, if any, of other clients of the investment advisor outside the American Century Investments family of funds (such as subadvised funds and separate accounts) that use very similar investment teams and strategies (strategy assets). From January 1, 2019 through July 31, 2019 the investment advisor agreed to waive 0.20% of the fund's management fee. Effective August 1, 2019, the investment advisor agreed to waive 0.22% of the fund's management fee. The investment advisor expects this waiver to continue until July 31, 2020 and cannot terminate it prior to such date without the approval of the Board of Directors.
The management fee schedule range and the effective annual management fee before and after waiver for each class for the period ended December 31, 2019 are as follows:
|
| | | |
| | | Effective Annual Management Fee |
| | Management Fee Schedule Range | Before Waiver | After Waiver |
| Class I | 0.90% to 1.00% | 0.97% | 0.76% |
| Class II | 0.80% to 0.90% | 0.87% | 0.66% |
Distribution Fees — The Board of Directors has adopted the Master Distribution Plan (the plan) for Class II, pursuant to Rule 12b-1 of the 1940 Act. The plan provides that Class II will pay ACIS an annual distribution fee equal to 0.25%. The fee is computed and accrued daily based on the Class II daily net assets and paid monthly in arrears. The distribution fee provides compensation for expenses incurred in connection with distributing shares of Class II including, but not limited to, payments to brokers, dealers, and financial institutions that have entered into sales agreements with respect to shares of the fund. Fees incurred under the plan during the period ended December 31, 2019 are detailed in the Statement of Operations.
Directors' Fees and Expenses — The Board of Directors is responsible for overseeing the investment advisor’s management and operations of the fund. The directors receive detailed information about the fund and its investment advisor regularly throughout the year, and meet at least quarterly with management of the investment advisor to review reports about fund operations. The fund’s officers do not receive compensation from the fund.
Interfund Transactions — The fund may enter into security transactions with other American Century Investments funds and other client accounts of the investment advisor, in accordance with the 1940 Act rules and procedures adopted by the Board of Directors. The rules and procedures require, among other things, that these transactions be effected at the independent current market price of the security. During the period, the interfund purchases and sales were $4,508,769 and $10,795,226, respectively. The effect of interfund transactions on the Statement of Operations was $775,150 in net realized gain (loss) on investment transactions.
4. Investment Transactions
Purchases and sales of investment securities, excluding short-term investments, for the period ended December 31, 2019 were $371,351,471 and $448,778,706, respectively.
5. Capital Share Transactions
Transactions in shares of the fund were as follows:
|
| | | | | | | | | | |
| | Year ended December 31, 2019 | Year ended December 31, 2018 |
| | Shares | Amount | Shares | Amount |
| Class I/Shares Authorized | 600,000,000 |
| | 600,000,000 |
| |
| Sold | 2,513,589 |
| $ | 26,977,393 |
| 3,689,053 |
| $ | 41,439,244 |
|
| Issued in reinvestment of distributions | 3,012,027 |
| 31,542,121 |
| 654,963 |
| 7,107,654 |
|
| Redeemed | (6,038,295 | ) | (65,176,821 | ) | (8,223,640 | ) | (92,362,060 | ) |
| | (512,679 | ) | (6,657,307 | ) | (3,879,624 | ) | (43,815,162 | ) |
| Class II/Shares Authorized | 350,000,000 |
| | 350,000,000 |
| |
| Sold | 2,363,882 |
| 25,395,711 |
| 4,792,619 |
| 53,358,191 |
|
| Issued in reinvestment of distributions | 3,282,949 |
| 34,385,367 |
| 636,465 |
| 6,903,898 |
|
| Redeemed | (7,192,474 | ) | (78,148,348 | ) | (8,330,934 | ) | (94,412,644 | ) |
| | (1,545,643 | ) | (18,367,270 | ) | (2,901,850 | ) | (34,150,555 | ) |
| Net increase (decrease) | (2,058,322 | ) | $ | (25,024,577 | ) | (6,781,474 | ) | $ | (77,965,717 | ) |
6. Fair Value Measurements
The fund’s investments valuation process is based on several considerations and may use multiple inputs to determine the fair value of the investments held by the fund. In conformity with accounting principles generally accepted in the United States of America, the inputs used to determine a valuation are classified into three broad levels.
| |
| • | Level 1 valuation inputs consist of unadjusted quoted prices in an active market for identical investments. |
| |
| • | Level 2 valuation inputs consist of direct or indirect observable market data (including quoted prices for comparable investments, evaluations of subsequent market events, interest rates, prepayment speeds, credit risk, etc.). These inputs also consist of quoted prices for identical investments initially expressed in local currencies that are adjusted through translation into U.S. dollars. |
| |
| • | Level 3 valuation inputs consist of unobservable data (including a fund’s own assumptions). |
The level classification is based on the lowest level input that is significant to the fair valuation measurement. The valuation inputs are not necessarily an indication of the risks associated with investing in these securities or other financial instruments.
The following is a summary of the level classifications as of period end. The Schedule of Investments provides additional information on the fund’s portfolio holdings. |
| | | | | | | | |
| | Level 1 | Level 2 | Level 3 |
| Assets | | | |
| Investment Securities | | | |
| Common Stocks | | | |
| Automobiles | $ | 7,279,520 |
| $ | 4,374,935 |
| — |
|
| Food and Staples Retailing | 12,833,294 |
| 5,470,003 |
| — |
|
| Food Products | 23,696,848 |
| 6,772,358 |
| — |
|
| Health Care Equipment and Supplies | 28,646,769 |
| 6,235,861 |
| — |
|
| Industrial Conglomerates | 22,437,225 |
| 7,651,036 |
| — |
|
| Machinery | 3,459,297 |
| 9,411,555 |
| — |
|
| Metals and Mining | — |
| 4,419,717 |
| — |
|
| Oil, Gas and Consumable Fuels | 63,498,616 |
| 18,710,696 |
| — |
|
| Paper and Forest Products | — |
| 4,381,141 |
| — |
|
| Other Industries | 628,888,784 |
| — |
| — |
|
| Exchange-Traded Funds | 3,100,826 |
| — |
| — |
|
| Temporary Cash Investments | 12,951 |
| 25,336,820 |
| — |
|
| Temporary Cash Investments - Securities Lending Collateral | 1,253,196 |
| — |
| — |
|
| | $ | 795,107,326 |
| $ | 92,764,122 |
| — |
|
| Other Financial Instruments | | | |
| Forward Foreign Currency Exchange Contracts | — |
| $ | 690 |
| — |
|
| | | | |
| Liabilities | | | |
| Other Financial Instruments | | | |
| Forward Foreign Currency Exchange Contracts | — |
| $ | 474,340 |
| — |
|
7. Derivative Instruments
Foreign Currency Risk — The fund is subject to foreign currency exchange rate risk in the normal course of pursuing its investment objectives. The value of foreign investments held by a fund may be significantly affected by changes in foreign currency exchange rates. The dollar value of a foreign security generally decreases when the value of the dollar rises against the foreign currency in which the security is denominated and tends to increase when the value of the dollar declines against such foreign currency. A fund may enter into forward foreign currency exchange contracts to reduce a fund's exposure to foreign currency exchange rate fluctuations. The net U.S. dollar value of foreign currency underlying all contractual commitments held by a fund and the resulting unrealized appreciation or depreciation are determined daily. Realized gain or loss is recorded upon the termination of the contract. Net realized and unrealized gains or losses occurring during the holding period of forward foreign currency exchange contracts are a component of net realized gain (loss) on forward foreign currency exchange contract transactions and change in net unrealized appreciation (depreciation) on forward foreign currency exchange contracts, respectively. A fund bears the risk of an unfavorable change in the foreign currency exchange rate underlying the forward contract. Additionally, losses, up to the fair value, may arise if the counterparties do not perform under the contract terms. The fund's average U.S. dollar exposure to foreign currency risk derivative instruments held during the period was $52,913,272.
The value of foreign currency risk derivative instruments as of December 31, 2019, is disclosed on the Statement of Assets and Liabilities as an asset of $690 in unrealized appreciation on forward foreign currency exchange contracts and a liability of $474,340 in unrealized depreciation on forward foreign currency exchange contracts. For the year ended December 31, 2019, the effect of foreign currency risk derivative instruments on the Statement of Operations was $1,314,123 in net realized gain (loss) on forward foreign currency exchange contract transactions and $(218,343) in change in net unrealized appreciation (depreciation) on forward foreign currency exchange contracts.
8. Risk Factors
There are certain risks involved in investing in foreign securities. These risks include those resulting from political events (such as civil unrest, national elections and imposition of exchange controls), social and economic events (such as labor strikes and rising inflation), and natural disasters. Securities of foreign issuers may be less liquid and more volatile. Investing a significant portion of assets in one country or region may accentuate these risks.
9. Federal Tax Information
The tax character of distributions paid during the years ended December 31, 2019 and December 31, 2018 were as follows:
|
| | | | | | |
| | 2019 | 2018 |
| Distributions Paid From | | |
| Ordinary income | $ | 27,413,041 |
| $ | 14,119,625 |
|
| Long-term capital gains | $ | 39,275,256 |
| $ | 56,983 |
|
The book-basis character of distributions made during the year from net investment income or net realized gains may differ from their ultimate characterization for federal income tax purposes. These differences reflect the differing character of certain income items and net realized gains and losses for financial statement and tax purposes, and may result in reclassification among certain capital accounts on the financial statements.
As of period end, the federal tax cost of investments and the components of distributable earnings on a tax-basis were as follows:
|
| | | |
| Federal tax cost of investments | $ | 732,034,473 |
|
| Gross tax appreciation of investments | $ | 165,192,781 |
|
| Gross tax depreciation of investments | (9,355,806 | ) |
| Net tax appreciation (depreciation) of investments | 155,836,975 |
|
| Net tax appreciation (depreciation) on derivatives and translation of assets and liabilities in foreign currencies | (906 | ) |
| Net tax appreciation (depreciation) | $ | 155,836,069 |
|
| Undistributed ordinary income | $ | 6,958,724 |
|
Accumulated long-term gains
| $ | 12,815,736 |
|
The difference between book-basis and tax-basis unrealized appreciation (depreciation) is attributable primarily to the tax deferral of losses on wash sales.
|
| | | | | | | | | | | | | | | | | |
| For a Share Outstanding Throughout the Years Ended December 31 (except as noted) |
| Per-Share Data | | | | | Ratios and Supplemental Data |
| | | Income From Investment Operations: | Distributions From: | | | Ratio to Average Net Assets of: | | |
| | Net Asset Value, Beginning of Period | Net Investment Income (Loss)(1) | Net Realized and Unrealized Gain (Loss) | Total From Investment Operations | Net
Investment
Income | Net
Realized
Gains | Total
Distributions | Net Asset Value, End of Period | Total Return(2) | Operating Expenses | Operating Expenses (before expense waiver) | Net Investment Income (Loss) | Net Investment Income (Loss) (before expense waiver) | Portfolio Turnover Rate | Net Assets, End of Period (in thousands) |
| Class I | | | | | | | | | | | | |
| 2019 | $10.01 | 0.23 | 2.36 | 2.59 | (0.23) | (0.65) | (0.88) | $11.72 | 27.03% | 0.77% | 0.98% | 2.11% | 1.90% | 45% |
| $432,639 |
|
| 2018 | $11.21 | 0.19 | (1.20) | (1.01) | (0.19) | —(3) | (0.19) | $10.01 | (9.15)% | 0.78% | 0.97% | 1.70% | 1.51% | 51% |
| $374,518 |
|
| 2017 | $10.48 | 0.18 | 0.73 | 0.91 | (0.18) | — | (0.18) | $11.21 | 8.75% | 0.80% | 0.97% | 1.71% | 1.54% | 30% |
| $462,812 |
|
| 2016 | $8.85 | 0.17 | 1.62 | 1.79 | (0.16) | — | (0.16) | $10.48 | 20.48% | 0.81% | 0.98% | 1.77% | 1.60% | 46% |
| $461,586 |
|
| 2015 | $9.41 | 0.18 | (0.54) | (0.36) | (0.20) | — | (0.20) | $8.85 | (3.88)% | 0.80% | 0.97% | 1.96% | 1.79% | 47% |
| $407,398 |
|
| Class II | | | | | | | | | | | | |
| 2019 | $10.02 | 0.21 | 2.37 | 2.58 | (0.21) | (0.65) | (0.86) | $11.74 | 26.92% | 0.92% | 1.13% | 1.96% | 1.75% | 45% |
| $455,327 |
|
| 2018 | $11.22 | 0.18 | (1.21) | (1.03) | (0.17) | —(3) | (0.17) | $10.02 | (9.28)% | 0.93% | 1.12% | 1.55% | 1.36% | 51% |
| $404,210 |
|
| 2017 | $10.49 | 0.17 | 0.72 | 0.89 | (0.16) | — | (0.16) | $11.22 | 8.58% | 0.95% | 1.12% | 1.56% | 1.39% | 30% |
| $485,136 |
|
| 2016 | $8.86 | 0.15 | 1.63 | 1.78 | (0.15) | — | (0.15) | $10.49 | 20.28% | 0.96% | 1.13% | 1.62% | 1.45% | 46% |
| $489,026 |
|
| 2015 | $9.42 | 0.17 | (0.55) | (0.38) | (0.18) | — | (0.18) | $8.86 | (4.02)% | 0.95% | 1.12% | 1.81% | 1.64% | 47% |
| $410,920 |
|
|
|
| Notes to Financial Highlights |
| |
| (1) | Computed using average shares outstanding throughout the period. |
| |
| (2) | Total returns are calculated based on the net asset value of the last business day. Total returns for periods less than one year are not annualized. The total returns presented do not include the fees and charges assessed with investments in variable insurance products, those charges are disclosed in the separate account prospectus. The inclusion of such fees and charges would lower total return. |
| |
| (3) | Per-share amount was less than $0.005. |
See Notes to Financial Statements.
|
|
| Report of Independent Registered Public Accounting Firm |
To the Shareholders and the Board of Directors of American Century Variable Portfolios, Inc.:
Opinion on the Financial Statements and Financial Highlights
We have audited the accompanying statement of assets and liabilities, including the schedule of investments, of VP Value Fund, one of the funds constituting the American Century Variable Portfolios, Inc. (the "Fund"), as of December 31, 2019, the related statement of operations for the year then ended, the statements of changes in net assets for each of the two years in the period then ended, the financial highlights for each of the five years in the period then ended, and the related notes. In our opinion, the financial statements and financial highlights present fairly, in all material respects, the financial position of VP Value Fund of the American Century Variable Portfolios, Inc. as of December 31, 2019, the results of its operations for the year then ended, the changes in its net assets for each of the two years in the period then ended, and the financial highlights for each of the five years in the period then ended, in conformity with accounting principles generally accepted in the United States of America.
Basis for Opinion
These financial statements and financial highlights are the responsibility of the Fund's management. Our responsibility is to express an opinion on the Fund’s financial statements and financial highlights based on our audits. We are a public accounting firm registered with the Public Company Accounting Oversight Board (United States) (PCAOB) and are required to be independent with respect to the Fund in accordance with the U.S. federal securities laws and the applicable rules and regulations of the Securities and Exchange Commission and the PCAOB.
We conducted our audits in accordance with the standards of the PCAOB. Those standards require that we plan and perform the audit to obtain reasonable assurance about whether the financial statements and financial highlights are free of material misstatement, whether due to error or fraud. The Fund is not required to have, nor were we engaged to perform, an audit of its internal control over financial reporting. As part of our audits we are required to obtain an understanding of internal control over financial reporting but not for the purpose of expressing an opinion on the effectiveness of the Fund’s internal control over financial reporting. Accordingly, we express no such opinion.
Our audits included performing procedures to assess the risks of material misstatement of the financial statements and financial highlights, whether due to error or fraud, and performing procedures that respond to those risks. Such procedures included examining, on a test basis, evidence regarding the amounts and disclosures in the financial statements and financial highlights. Our audits also included evaluating the accounting principles used and significant estimates made by management, as well as evaluating the overall presentation of the financial statements and financial highlights. Our procedures included confirmation of securities owned as of December 31, 2019, by correspondence with the custodian and brokers; when replies were not received from brokers, we performed other auditing procedures. We believe that our audits provide a reasonable basis for our opinion.
DELOITTE & TOUCHE LLP
Kansas City, Missouri
February 13, 2020
We have served as the auditor of one or more American Century investment companies since 1997.
The Board of Directors
The individuals listed below serve as directors of the funds. Each director will continue to serve in this capacity until death, retirement, resignation or removal from office. The board has adopted a mandatory retirement age for directors who are not “interested persons,” as that term is defined in the Investment Company Act (independent directors). Independent directors shall retire by December 31 of the year in which they reach their 75th birthday.
Mr. Thomas is an “interested person” because he currently serves as President and Chief Executive Officer of American Century Companies, Inc. (ACC), the parent company of American Century Investment Management, Inc. (ACIM or the advisor). The other directors (more than three-fourths of the total number) are independent. They are not employees, directors or officers of, and have no financial interest in, ACC or any of its wholly owned, direct or indirect, subsidiaries, including ACIM, American Century Investment Services, Inc. (ACIS) and American Century Services, LLC (ACS), and they do not have any other affiliations, positions or relationships that would cause them to be considered “interested persons” under the Investment Company Act. The directors serve in this capacity for seven (in the case of Jonathan S. Thomas, 16; and Stephen E. Yates, 8) registered investment companies in the American Century Investments family of funds.
The following table presents additional information about the directors. The mailing address for each director is 4500 Main Street, Kansas City, Missouri 64111.
|
| | | | | |
Name
(Year of Birth) | Position(s) Held with Funds | Length of Time Served | Principal Occupation(s) During Past 5 Years | Number of American Century Portfolios Overseen by Director | Other Directorships Held During Past 5 Years |
| Independent Directors |
|
|
| Thomas W. Bunn (1953) | Director | Since 2017 | Retired | 64 | SquareTwo Financial; Barings (formerly Babson Capital Funds Trust) (2013 to 2016) |
Chris H. Cheesman
(1962)
| Director | Since 2019
| Retired. Senior Vice President & Chief Audit Executive, AllianceBernstein (1999 to 2018)
| 64 | None |
Barry Fink
(1955) | Director | Since 2012 (independent since 2016) | Retired | 64 | None |
Rajesh K. Gupta
(1960)
| Director | Since 2019
| Partner Emeritus, SeaCrest Investment Management and SeaCrest Wealth Management (2019 to Present); Chief Executive Officer and Chief Investment Officer, SeaCrest Investment Management (2006 to 2019); Chief Executive Officer and Chief Investment Officer, SeaCrest Wealth Management (2008 to 2019)
| 64 | None |
|
| | | | | |
Name
(Year of Birth) | Position(s) Held with Funds | Length of Time Served | Principal Occupation(s) During Past 5 Years | Number of American Century Portfolios Overseen by Director | Other Directorships Held During Past 5 Years |
| Independent Directors |
|
|
Lynn Jenkins
(1963)
| Director | Since 2019
| Consultant, LJ Strategies (2019 to present); United States Representative, U.S. House of Representatives (2009 to 2018) | 64 | MGP Ingredients, Inc. |
Jan M. Lewis
(1957) | Director | Since 2011 | Retired | 64 | None |
John R. Whitten
(1946) | Director | Since 2008 | Retired | 64 | Onto Innovation Inc.; Rudolph Technologies, Inc. (2006 to 2019) |
Stephen E. Yates
(1948) | Director and Chairman of the Board | Since 2012 (Chairman since 2018) | Retired | 79 | None |
| Interested Director |
|
Jonathan S. Thomas
(1963) | Director | Since 2007 | President and Chief Executive Officer, ACC (2007 to present). Also serves as Chief Executive Officer, ACS; Executive Vice President, ACIM; Director, ACC, ACIM and other ACC subsidiaries | 120 | None |
The Statement of Additional Information has additional information about the fund's directors and is available without charge, upon request, by calling 1-800-378-9878.
Officers
The following table presents certain information about the executive officers of the funds. Each officer serves as an officer for 16 (in the case of Robert J. Leach, 15) investment companies in the American Century family of funds. No officer is compensated for his or her service as an officer of the funds. The listed officers are interested persons of the funds and are appointed or re-appointed on an annual basis. The mailing address for each officer listed below is 4500 Main Street, Kansas City, Missouri 64111.
|
| | |
Name
(Year of Birth) | Offices with the Funds | Principal Occupation(s) During the Past Five Years |
Patrick Bannigan
(1965) | President since 2019 | Executive Vice President and Director, ACC (2012 to present); Chief Financial Officer, Chief Accounting Officer and Treasurer, ACC (2015 to present); Chief Operating Officer, ACC (2012-2015). Also serves as President, ACS; Vice President, ACIM; Chief Financial Officer, Chief Accounting Officer and/or Director, ACIM, ACS and other ACC subsidiaries |
R. Wes Campbell
(1974) | Chief Financial Officer and Treasurer since 2018 | Investment Operations and Investment Accounting, ACS (2000 to present) |
Amy D. Shelton
(1964) | Chief Compliance Officer and Vice President since 2014 | Chief Compliance Officer, American Century funds, (2014 to present); Chief Compliance Officer, ACIM (2014 to present); Chief Compliance Officer, ACIS (2009 to present). Also serves as Vice President, ACIS |
Charles A. Etherington
(1957) | General Counsel since 2007 and Senior Vice President since 2006 | Attorney, ACC (1994 to present); Vice President, ACC (2005 to present); General Counsel, ACC (2007 to present). Also serves as General Counsel, ACIM, ACS, ACIS and other ACC subsidiaries; and Senior Vice President, ACIM and ACS |
C. Jean Wade
(1964) | Vice President since 2012 | Senior Vice President, ACS (2017 to present); Vice President, ACS (2000 to 2017)
|
Robert J. Leach
(1966) | Vice President since 2006 | Vice President, ACS (2000 to present) |
David H. Reinmiller
(1963) | Vice President since 2000 | Attorney, ACC (1994 to present). Also serves as Vice President, ACIM and ACS |
Ward D. Stauffer
(1960) | Secretary since 2005 | Attorney, ACC (2003 to present) |
Proxy Voting Policies
A description of the policies that the fund's investment advisor uses in exercising the voting rights associated with the securities purchased and/or held by the fund is available without charge, upon request, by calling 1-800-378-9878. It is also available on American Century Investments’ website at americancentury.com/proxy and on the Securities and Exchange Commission’s website at sec.gov. Information regarding how the investment advisor voted proxies relating to portfolio securities during the most recent 12-month period ended June 30 is available on americancentury.com/proxy. It is also available at sec.gov.
Quarterly Portfolio Disclosure
The fund files its complete schedule of portfolio holdings with the Securities and Exchange Commission (SEC) for the first and third quarters of each fiscal year on Form N-Q or as an exhibit to its reports on Form N-PORT. The fund’s Forms N-Q and Form N-PORT reports are available on the SEC’s website at sec.gov. The fund also makes its complete schedule of portfolio holdings for the most recent quarter of its fiscal year available on its website at ipro.americancentury.com (for Investment Professionals) and, upon request, by calling 1-800-378-9878.
Other Tax Information
The following information is provided pursuant to provisions of the Internal Revenue Code.
For corporate taxpayers, the fund hereby designates $20,743,668, or up to the maximum amount
allowable, of ordinary income distributions paid during the fiscal year ended December 31, 2019 as
qualified for the corporate dividends received deduction.
The fund hereby designates $39,275,256, or up to the maximum amount allowable, as long-term
capital gain distributions (20% rate gain distributions) for the fiscal year ended December 31, 2019.
The fund hereby designates $10,202,555 as qualified short-term capital gain distributions for purposes of Internal Revenue Code Section 871 for the fiscal year ended December 31, 2019.
|
| | |
| |
| | | |
| Contact Us | americancentury.com | |
| Automated Information Line | 1-800-345-8765 | |
| Investment Professional Service Representatives | 1-800-345-6488 | |
| Telecommunications Relay Service for the Deaf | 711 | |
| | | |
| American Century Variable Portfolios, Inc. | |
| | | |
Investment Advisor: American Century Investment Management, Inc. Kansas City, Missouri | |
| | | |
| This report and the statements it contains are submitted for the general information of our shareholders. The report is not authorized for distribution to prospective investors unless preceded or accompanied by an effective prospectus. | |
| | | |
©2020 American Century Proprietary Holdings, Inc. All rights reserved.
CL-ANN-91440 2002 | |
ITEM 2. CODE OF ETHICS.
| |
| (a) | The registrant has adopted a Code of Ethics for Senior Financial Officers that applies to the registrant’s principal executive officer, principal financial officer, principal accounting officer, and persons performing similar functions. |
| |
| (f) | The registrant’s Code of Ethics for Senior Financial Officers was filed as Exhibit 12 (a)(1) to American Century Asset Allocation Portfolios, Inc.’s Annual Certified Shareholder Report on Form N-CSR, File No. 811-21591, on September 29, 2005, and is incorporated herein by reference. |
ITEM 3. AUDIT COMMITTEE FINANCIAL EXPERT.
| |
| (a)(1) | The registrant’s board has determined that the registrant has at least one audit committee financial expert serving on its audit committee. |
| |
| (a)(2) | John R. Whitten, Chris H. Cheesman and Lynn M. Jenkins are the registrant’s designated audit committee financial experts. They are “independent” as defined in Item 3 of Form N-CSR. |
ITEM 4. PRINCIPAL ACCOUNTANT FEES AND SERVICES.
The aggregate fees billed for each of the last two fiscal years for professional services rendered by the principal accountant for the audit of the registrant’s annual financial statements or services that are normally provided by the accountant in connection with statutory and regulatory filings or engagements for those fiscal years were as follows:
FY 2018: $200,110
FY 2019: $200,120
The aggregate fees billed in each of the last two fiscal years for assurance and related services by the principal accountant that are reasonably related to the performance of the audit of the registrant’s financial statements and are not reported under paragraph (a) of this Item were as follows:
For services rendered to the registrant:
Fees required to be approved pursuant to paragraph (c)(7)(ii) of Rule 2-01 of Regulation S-X (relating to certain engagements for non-audit services with the registrant’s investment adviser and its affiliates):
The aggregate fees billed in each of the last two fiscal years for professional services rendered by the principal accountant for tax compliance, tax advice, and tax planning were as follows:
For services rendered to the registrant:
FY 2018: $0
FY 2019: $0
Fees required to be approved pursuant to paragraph (c)(7)(ii) of Rule 2-01 of Regulation S-X (relating to certain engagements for non-audit services with the registrant’s investment adviser and its affiliates):
FY 2018: $0
FY 2019: $0
(d) All Other Fees.
The aggregate fees billed in each of the last two fiscal years for products and services provided by the principal accountant, other than the services reported in paragraphs (a) through (c) of this Item were as follows:
For services rendered to the registrant:
Fees required to be approved pursuant to paragraph (c)(7)(ii) of Rule 2-01 of Regulation S-X (relating to certain engagements for non-audit services with the registrant’s investment adviser and its affiliates):
| |
| (e)(1) | In accordance with paragraph (c)(7)(i)(A) of Rule 2-01 of Regulation S-X, before the accountant is engaged by the registrant to render audit or non-audit services, the engagement is approved by the registrant’s audit committee. Pursuant to paragraph (c)(7)(ii) of Rule 2-01 of Regulation S-X, the registrant’s audit committee also pre-approves its accountant’s engagements for non-audit services with the registrant’s investment adviser, its parent company, and any entity controlled by, or under common control with the investment adviser that provides ongoing services to the registrant, if the engagement relates directly to the operations and financial reporting of the registrant. |
| |
| (e)(2) | All services described in each of paragraphs (b) through (d) of this Item were pre-approved before the engagement by the registrant’s audit committee pursuant to paragraph (c)(7)(i)(A) of Rule 2-01 of Regulation S-X. Consequently, none of such services were required to be approved by the audit committee pursuant to paragraph (c)(7)(i)(C). |
| |
| (f) | The percentage of hours expended on the principal accountant’s engagement to audit the registrant’s financial statements for the most recent fiscal year that were attributed to work performed by persons other than the principal accountant’s full-time, permanent employees was less than 50%. |
| |
| (g) | The aggregate non-audit fees billed by the registrant’s accountant for services rendered to the registrant, and rendered to the registrant’s investment adviser (not including any sub-adviser whose role is primarily portfolio management and is subcontracted with or overseen by another investment adviser), and any entity controlling, controlled by, or under common control with the adviser that provides ongoing services to the registrant for each of the last two fiscal years of the registrant were as follows: |
FY 2018: $115,750
FY 2019: $119,500
| |
| (h) | The registrant’s investment adviser and accountant have notified the registrant’s audit committee of all non-audit services that were rendered by the registrant’s accountant to the registrant’s investment adviser, its parent company, and any entity controlled by, or under common control with the investment adviser that provides services to the registrant, which services were not required to be pre-approved pursuant to paragraph (c)(7)(ii) of Rule 2-01 of Regulation S-X. The notification provided to the registrant’s audit committee included sufficient details regarding such services to allow the registrant’s audit committee to consider the continuing independence of its principal accountant. |
ITEM 5. AUDIT COMMITTEE OF LISTED REGISTRANTS.
Not applicable.
ITEM 6. INVESTMENTS.
| |
| (a) | The schedule of investments is included as part of the report to stockholders filed under Item 1 of this Form. |
ITEM 7. DISCLOSURE OF PROXY VOTING POLICIES AND PROCEDURES FOR CLOSED-END MANAGEMENT INVESTMENT COMPANIES.
Not applicable.
ITEM 8. PORTFOLIO MANAGERS OF CLOSED-END MANAGEMENT INVESTMENT COMPANIES.
Not applicable.
ITEM 9. PURCHASES OF EQUITY SECURITIES BY CLOSED-END MANAGEMENT INVESTMENT COMPANY AND AFFILIATED PURCHASERS.
Not applicable.
ITEM 10. SUBMISSION OF MATTERS TO A VOTE OF SECURITY HOLDERS.
During the reporting period, there were no material changes to the procedures by which shareholders may recommend nominees to the registrant’s board.
ITEM 11. CONTROLS AND PROCEDURES.
| |
| (a) | The registrant's principal executive officer and principal financial officer have concluded that the registrant's disclosure controls and procedures (as defined in Rule 30a-3(c) under the Investment Company Act of 1940) are effective based on their evaluation of these controls and procedures as of a date within 90 days of the filing date of this report. |
| |
| (b) | There were no changes in the registrant's internal control over financial reporting (as defined in Rule 30a-3(d) under the Investment Company Act of 1940) that occurred during the period covered by this report that have materially affected, or are reasonably likely to materially affect, the registrant's internal control over financial reporting. |
ITEM 12. DISCLOSURE OF SECURITIES LENDING ACTIVITIES FOR CLOSED-END MANAGEMENT INVESTMENT COMPANIES.
Not applicable.
ITEM 13. EXHIBITS.
| |
| (a)(1) | Registrant’s Code of Ethics for Senior Financial Officers, which is the subject of the disclosure required by Item 2 of Form N-CSR, was filed as Exhibit 12(a)(1) to American Century Asset Allocation Portfolios, Inc.’s Certified Shareholder Report on Form N-CSR, File No. 811-21591, on September 29, 2005. |
| |
| (a)(2) | Separate certifications by the registrant’s principal executive officer and principal financial officer, pursuant to Section 302 of the Sarbanes-Oxley Act of 2002 and Rule 30a-2(a) under the Investment Company Act of 1940, are filed and attached hereto as EX-99.CERT. |
| |
| (b) | A certification by the registrant’s chief executive officer and chief financial officer, pursuant to Section 906 of the Sarbanes-Oxley Act of 2002, is furnished and attached hereto as EX-99.906CERT. |
SIGNATURES
Pursuant to the requirements of the Securities Exchange Act of 1934 and the Investment Company Act of 1940, the registrant has duly caused this report to be signed on its behalf by the undersigned, thereunto duly authorized.
|
| | | | |
| Registrant: | American Century Variable Portfolios, Inc. | |
| | | | |
| By: | /s/ Patrick Bannigan | |
| | Name: | Patrick Bannigan | |
| | Title: | President | |
| | | | |
| Date: | February 25, 2020 | |
Pursuant to the requirements of the Securities Exchange Act of 1934 and the Investment Company Act of 1940, this report has been signed below by the following persons on behalf of the registrant and in the capacities and on the dates indicated.
|
| | | |
| By: | /s/ Patrick Bannigan | |
| | Name: | Patrick Bannigan | |
| | Title: | President | |
| | | (principal executive officer) | |
| | | | |
| Date: | February 25, 2020 | |
|
| | | |
| By: | /s/ R. Wes Campbell | |
| | Name: | R. Wes Campbell | |
| | Title: | Treasurer and | |
| | | Chief Financial Officer | |
| | | (principal financial officer) | |
| | | | |
| Date: | February 25, 2020 | |